Attached files
| file | filename |
|---|---|
| EX-99.1 - EXHIBIT 99.1 - Allegiance Bancshares, Inc. | earningsrelease-3312017.htm |
| 8-K - 8-K EARNINGS RELEASE - Allegiance Bancshares, Inc. | a8-kearningsrelease3312017.htm |

First Quarter 2017
Earnings Presentation
2
Safe Harbor Statement
“Safe Harbor” Statement under the Private Securities Litigation Reform Act of 1995: This presentation may contain
forward-looking statements within the meaning of the securities laws that are based on various facts and derived utilizing
important assumptions, present expectations, estimates and projections about Allegiance and its subsidiaries. These
statements preceded by, followed by or that otherwise include the words “believes,” “expects,” “anticipates,” “intends,”
“projects,” “estimates,” “plans” and similar expressions or future or conditional verbs such as “will,” “should,” “would,”
“may” and “could” are generally forward-looking in nature and not historical facts, although not all forward looking
statements include the foregoing. Forward-looking statements include information concerning Allegiance’s future
financial performance, business and growth strategy, projected plans and objectives, as well as projections of
macroeconomic and industry trends, which are inherently unreliable due to the multiple factors that impact economic
trends, and any such variations may be material. Such forward-looking statements are not guarantees of future
performance and are subject to risks and uncertainties, many of which are outside of Allegiance’s control, which may
cause actual results to differ materially from those expressed or implied by the forward-looking statements. These risks
and uncertainties include but are not limited to whether Allegiance can: continue to develop and maintain new and
existing customer and community relationships; successfully implement its growth strategy, including identifying
suitable acquisition targets and integrating the businesses of acquired companies and banks; continue to sustain its
current internal growth rate; provide quality and competitive products and services that appeal to its customers; continue
to have access to debt and equity capital markets; and achieve its performance objectives. These and various other factors
are discussed in Allegiance's Annual Report on Form 10-K for the fiscal year ended December 31, 2016 and in other
reports and statements Allegiance has filed with the Securities and Exchange Commission. Copies of such filings are
available for download free of charge from the Investor Relations section of Allegiance's website at
www.allegiancebank.com, under Financial Information, SEC Filings. Any forward-looking statement made by
Allegiance in this presentation speaks only as of the date on which it is made. Factors or events that could cause
Allegiance’s actual results to differ may emerge from time to time, and it is not possible for Allegiance to predict all of
them. Allegiance undertakes no obligation to publicly update any forward-looking statement, whether as a result of new
information, future developments or otherwise, except as may be required by law.
3
Allegiance Overview
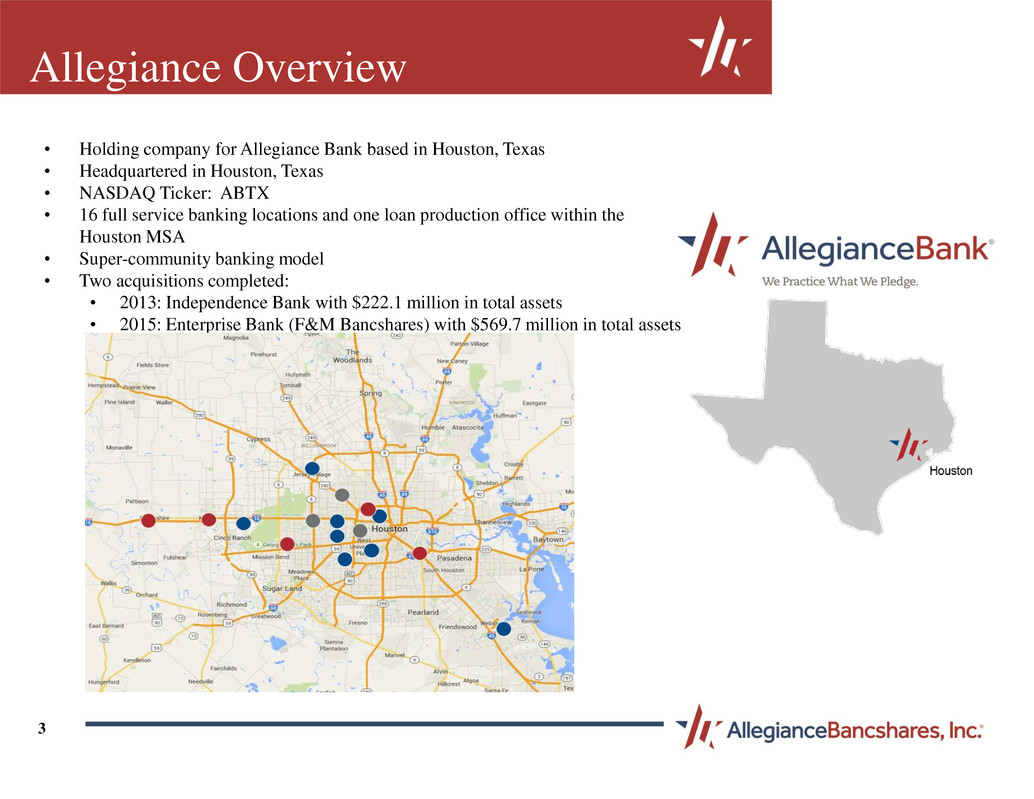
• Holding company for Allegiance Bank based in Houston, Texas
• Headquartered in Houston, Texas
• NASDAQ Ticker: ABTX
• 16 full service banking locations and one loan production office within the
Houston MSA
• Super-community banking model
• Two acquisitions completed:
• 2013: Independence Bank with $222.1 million in total assets
• 2015: Enterprise Bank (F&M Bancshares) with $569.7 million in total assets
4
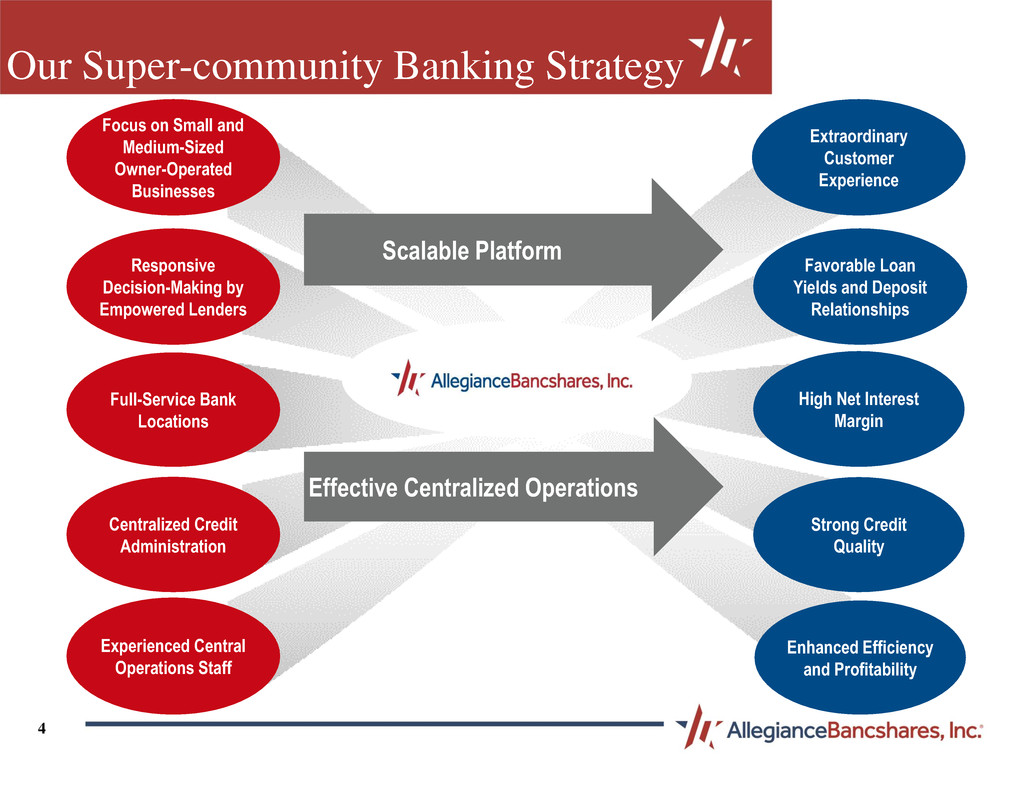
Our Super-community Banking Strategy
Focus on Small and
Medium-Sized
Owner-Operated
Businesses
Responsive
Decision-Making by
Empowered Lenders
Full-Service Bank
Locations
Centralized Credit
Administration
Experienced Central
Operations Staff
Scalable Platform
Effective Centralized Operations
Extraordinary
Customer
Experience
Favorable Loan
Yields and Deposit
Relationships
High Net Interest
Margin
Strong Credit
Quality
Enhanced Efficiency
and Profitability

5
Highlights - 2017
• Record core loan growth of $291.0 million, or 17.8%, to $1.92 billion for the first quarter 2017 compared to $1.63 billion for the first quarter 2016 and increased $97.7 million, or 5.4%, from $1.82 billion for the fourth quarter 2016.
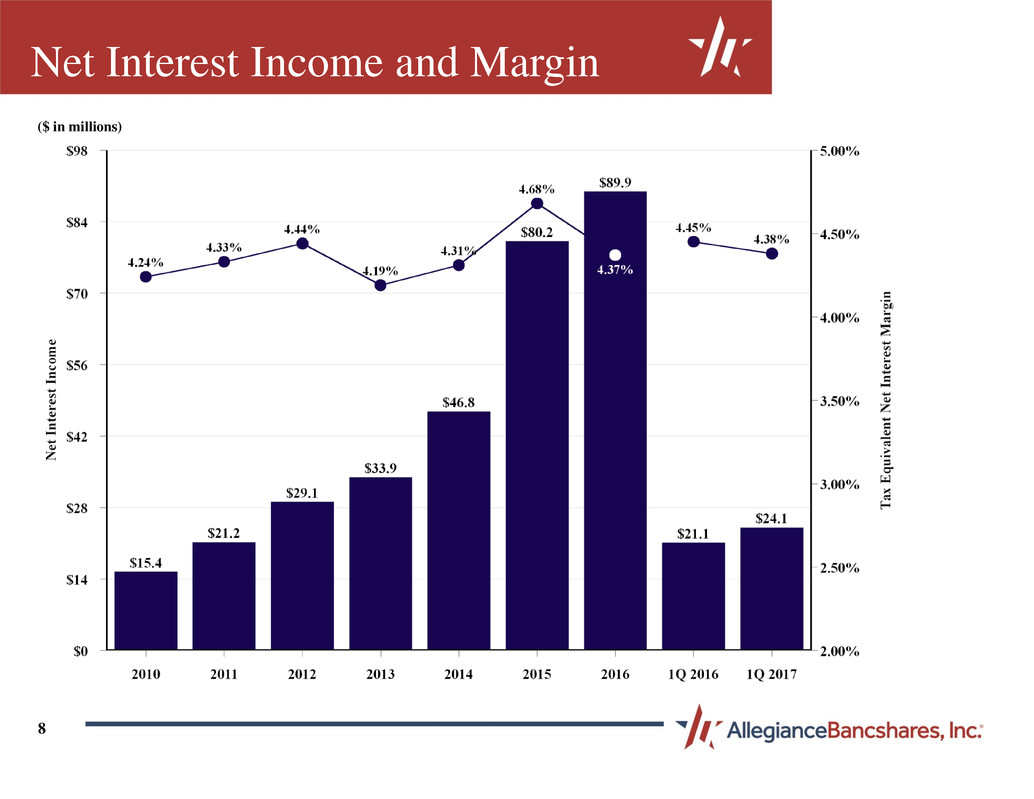
• Net interest income increased 14.4% year over year and 3.0% for the first quarter 2017 compared to the linked quarter.
• Net interest margin on a tax equivalent basis increased six basis points to 4.38% for the first quarter 2017 compared to
4.32% for the linked quarter.
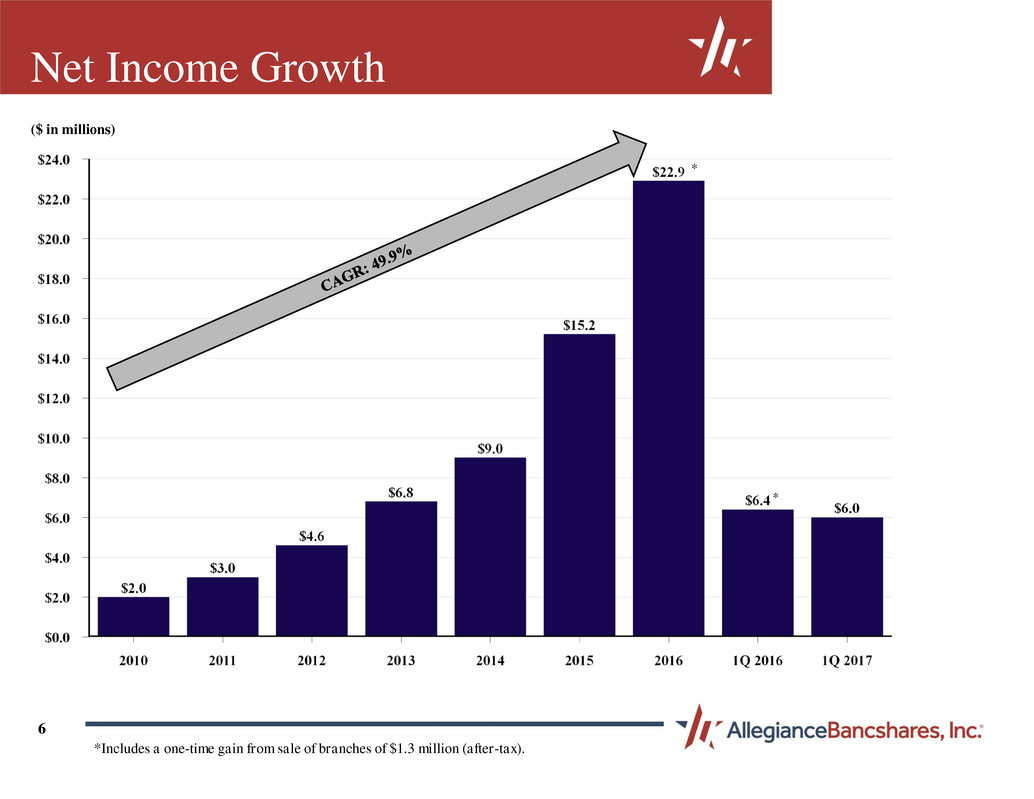
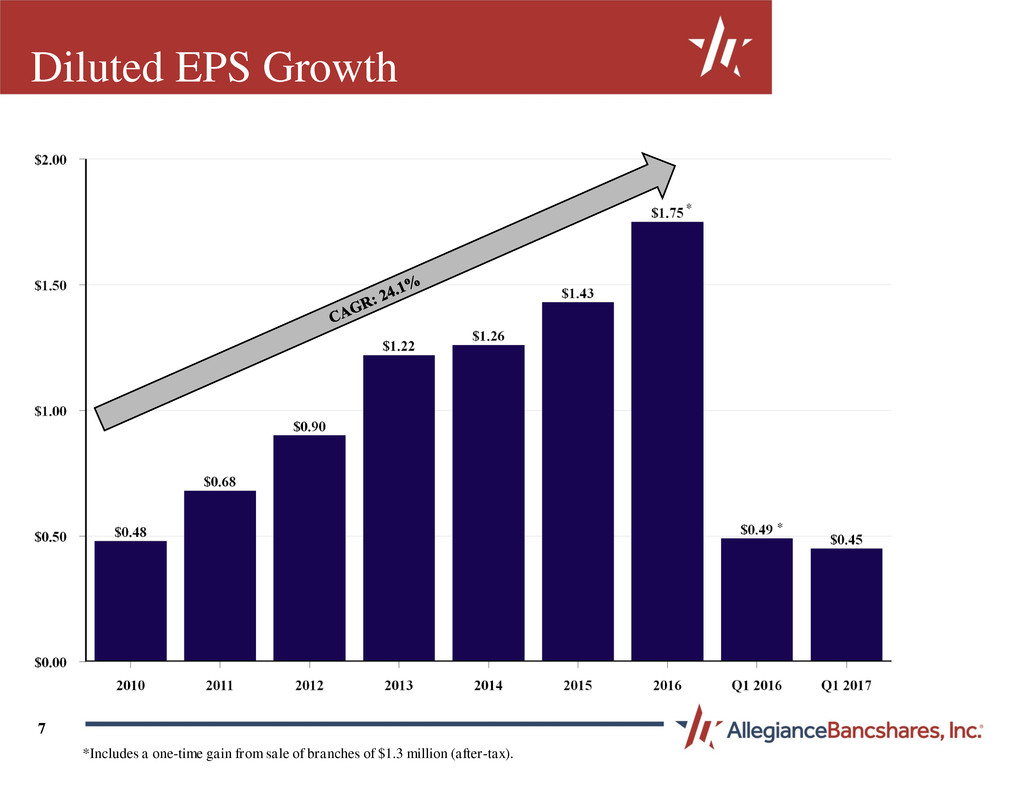
• Net income of $6.0 million and diluted earnings per share of $0.45 in the first quarter 2017 compared to $6.4 million and
$0.49 in the first quarter 2016, which included a $1.3 million after-tax gain on the sale of two Central Texas branch
locations. Net income for the first quarter 2017 increased 4.8% from $5.8 million in the fourth quarter 2016.
• Pre-tax, pre-provision adjusted net income of $8.9 million in the first quarter 2017 compared to $10.1 million in the first
quarter 2016 ($8.8 million excluding the $1.3 million after-tax gain on the sale of two Central Texas branch locations) and
$8.7 million in the fourth quarter 2016.
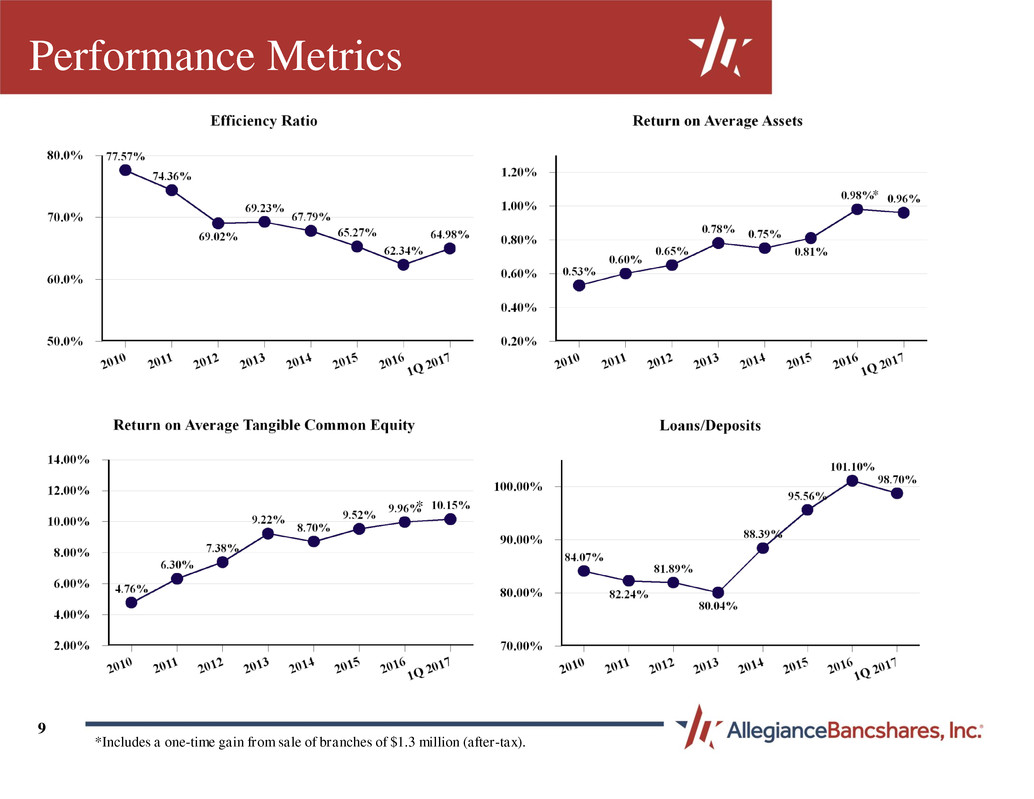
• Annualized ROATCE of 10.15% and ROA of 0.96% for the first quarter 2017 compared to ROATCE of 9.22% and ROA of
0.94% for the first quarter 2016 (excluding the gain on the sale of the branches).
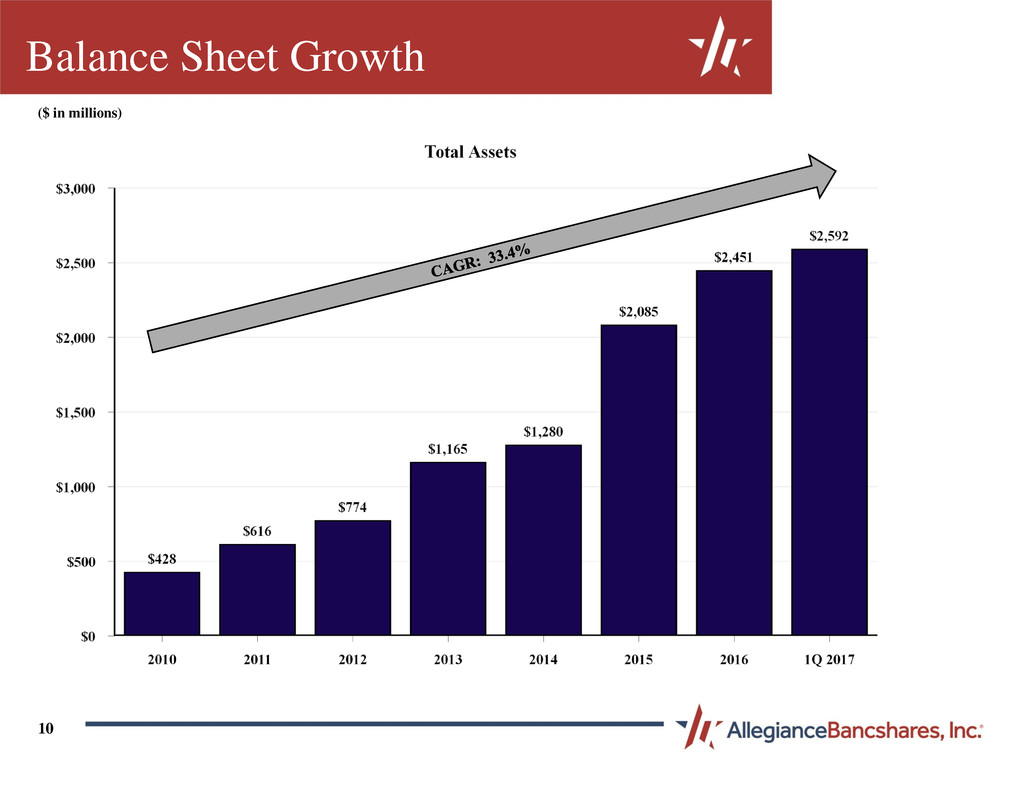
• Assets of $2.59 billion, loans of $1.99 billion, deposits of $2.01 billion and shareholder's equity of $289.1 million at March
31, 2017.
• Hired another lender during the first quarter of 2017 which adds to the 12 strong lenders in 2016 to further enhance our
infrastructure as we strengthen internal processes and systems to support our ambitious growth plans.
• Recognized as a 2016 Top Workplace by the Houston Chronicle
• Houston Business Journal 2016 Best Places to Work recipient
• Named one of the Best Banks to Work For in 2016 by the American Banker Magazine
6
Net Income Growth
($ in millions)
*Includes a one-time gain from sale of branches of $1.3 million (after-tax).
*
*
7
Diluted EPS Growth
*Includes a one-time gain from sale of branches of $1.3 million (after-tax).
*
*
8
Net Interest Income and Margin
($ in millions)
9
Performance Metrics
*
*Includes a one-time gain from sale of branches of $1.3 million (after-tax).
*
10
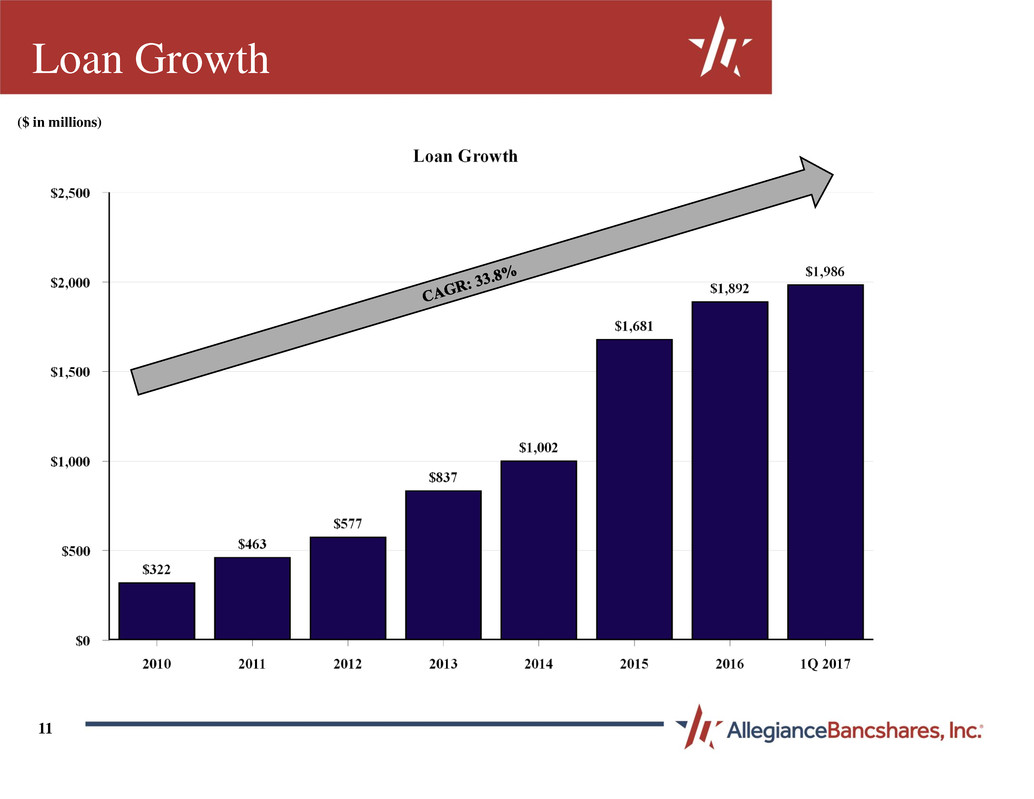
Balance Sheet Growth
($ in millions)
11
Loan Growth
($ in millions)
12
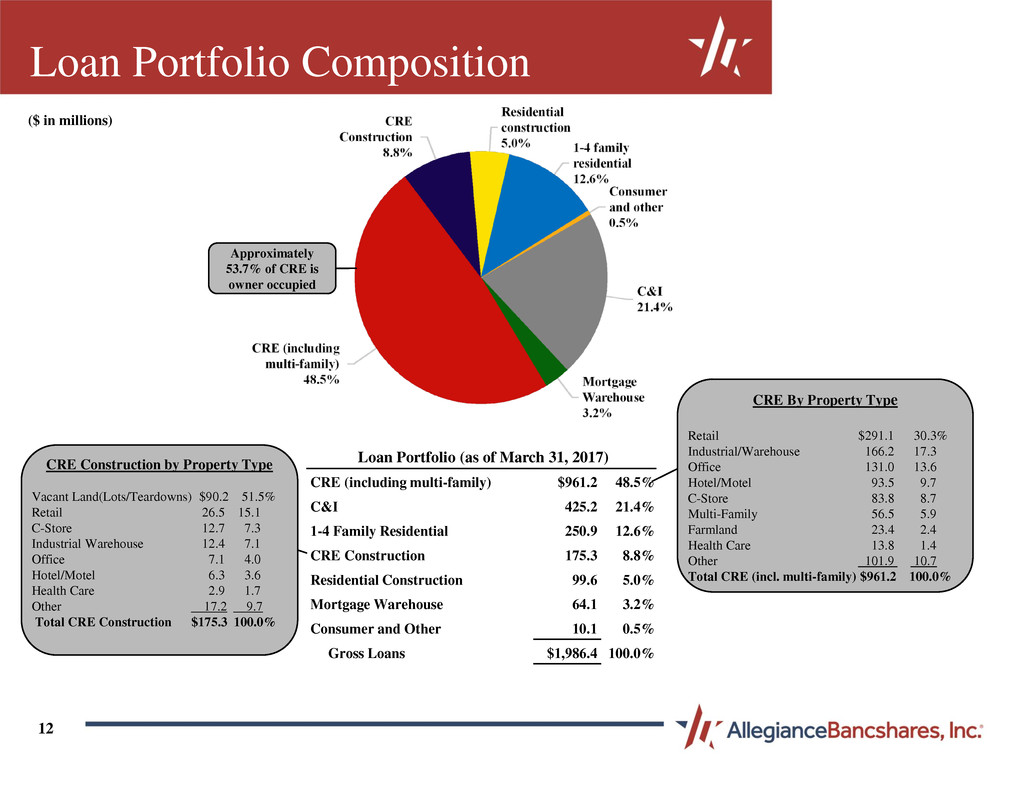
Loan Portfolio Composition
Loan Portfolio (as of March 31, 2017)
CRE (including multi-family) $961.2 48.5 %
C&I 425.2 21.4 %
1-4 Family Residential 250.9 12.6 %
CRE Construction 175.3 8.8 %
Residential Construction 99.6 5.0 %
Mortgage Warehouse 64.1 3.2 %
Consumer and Other 10.1 0.5 %
Gross Loans $1,986.4 100.0 %
Approximately
53.7% of CRE is
owner occupied
CRE By Property Type
Retail $291.1 30.3%
Industrial/Warehouse 166.2 17.3
Office 131.0 13.6
Hotel/Motel 93.5 9.7
C-Store 83.8 8.7
Multi-Family 56.5 5.9
Farmland 23.4 2.4
Health Care 13.8 1.4
Other 101.9 10.7
Total CRE (incl. multi-family) $961.2 100.0%
($ in millions)
CRE Construction by Property Type
Vacant Land(Lots/Teardowns) $90.2 51.5%
Retail 26.5 15.1
C-Store 12.7 7.3
Industrial Warehouse 12.4 7.1
Office 7.1 4.0
Hotel/Motel 6.3 3.6
Health Care 2.9 1.7
Other 17.2 9.7
Total CRE Construction $175.3 100.0%
13
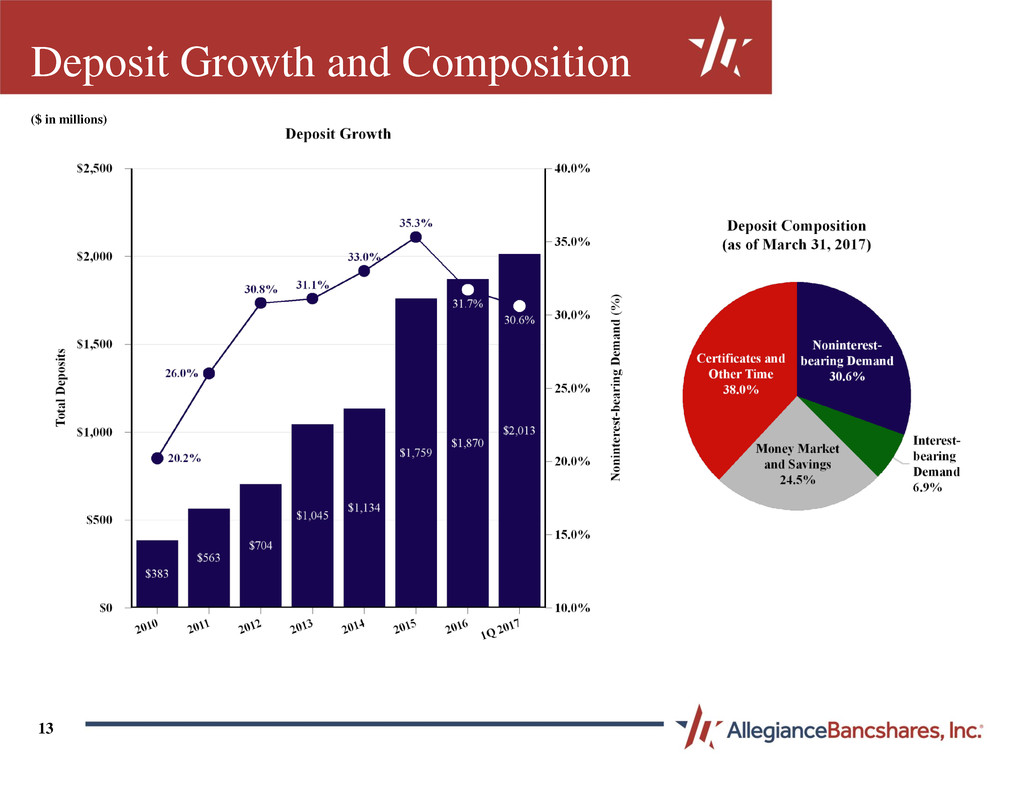
Deposit Growth and Composition
($ in millions)
14
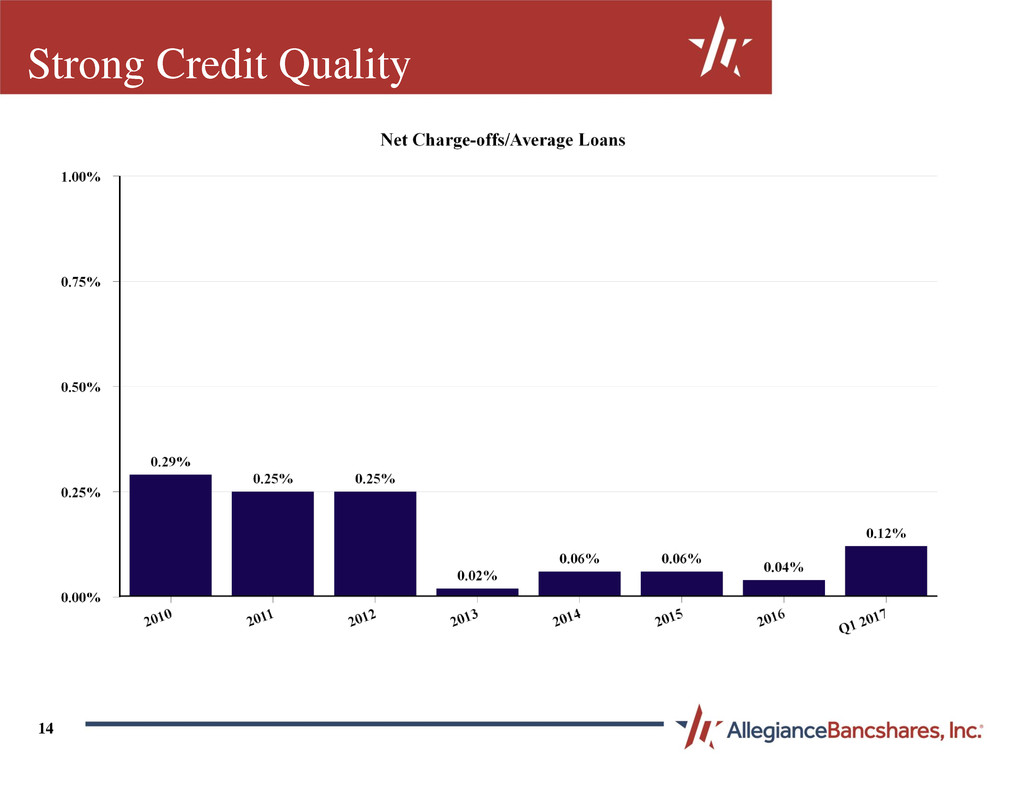
Strong Credit Quality
Corporate Office
8847 West Sam Houston Parkway North, Suite 200
Houston, Texas 77040
Investor Relations I ir@allegiancebank.com
