Attached files
| file | filename |
|---|---|
| 8-K - HANCOCK WHITNEY CORP | hbhc1q178-k.htm |
| EX-99.1 - HANCOCK WHITNEY CORP | hbhc1q17ex991.htm |

4/19/2017 First Quarter 2017Earnings Conference Call
1
Important Cautionary Statement About Forward-Looking Statements This presentation contains forward-looking statements within the meaning of section 27A of the Securities Act of 1933, as amended, and section 21E of the Securities Exchange Act of 1934, as amended. Forward looking statements that we may make include statements regarding balance sheet and revenue growth, the provision for loans losses, loan growth expectations, management’s predictions about charge-offs for loans, including energy-related credits, the impact of changes in oil and gas prices on our energy portfolio, and the downstream impact on businesses that support the energy sector, especially in the Gulf Coast region, the impact of the First NBC transaction on our performance and financial condition, including our ability to successfully integrate the business, deposit trends, credit quality trends, net interest margin trends, future expense levels, success of revenue-generating initiatives, projected tax rates, future profitability, improvements in expense to revenue (efficiency) ratio, purchase accounting impacts such as accretion levels, and the financial impact of regulatory requirements. Also, any statement that does not describe historical or current facts is a forward-looking statement. These statements often include the words “believes,” “expects,” “anticipates,” “estimates,” “intends,” “plans,” “forecast,” “goals,” “targets,” “initiatives,” “focus,” “potentially,” “probably,” “projects,” “outlook” or similar expressions or future conditional verbs such as “may,” “will,” “should,” “would,” and “could.” Forward-looking statements are based upon the current beliefs and expectations of management and on information currently available to management. Our statements speak as of the date hereof, and we do not assume any obligation to update these statements or to update the reasons why actual results could differ from those contained in such statements in light of new information or future events. Forward-looking statements are subject to significant risks and uncertainties. Investors are cautioned against placing undue reliance on such statements. Actual results may differ materially from those set forth in the forward looking statements. Additional factors that could cause actual results to differ materially from those described in the forward-looking statements can be found in Part I, “Item 1A. Risk Factors” in our Annual Report on Form 10-K for the year ended December 31, 2016 and in other periodic reports that we file with the SEC.
2
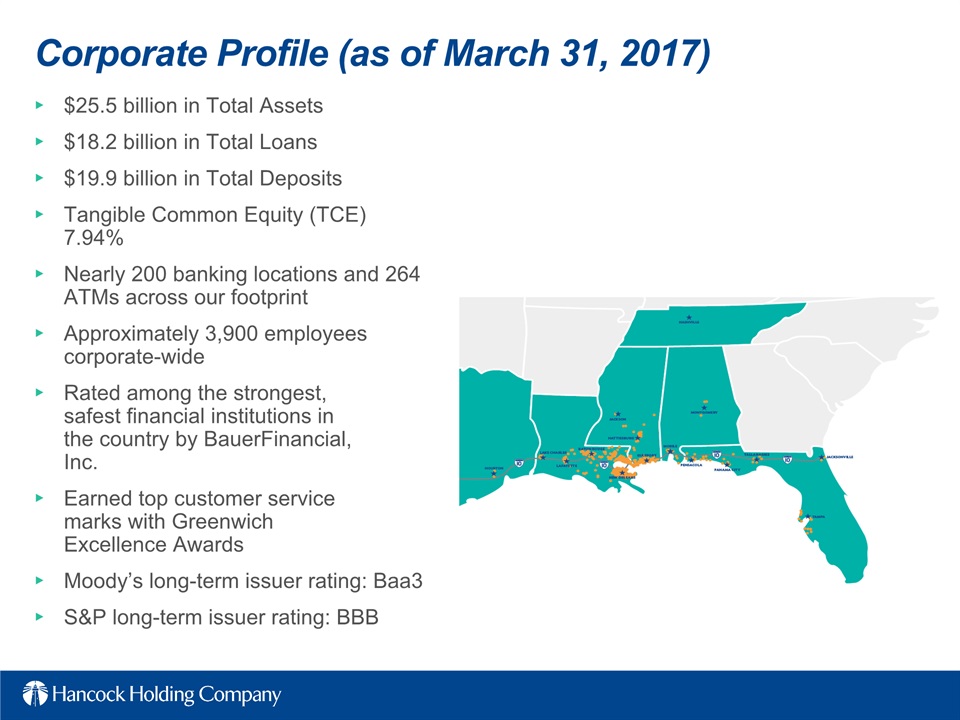
Corporate Profile (as of March 31, 2017) $25.5 billion in Total Assets$18.2 billion in Total Loans$19.9 billion in Total DepositsTangible Common Equity (TCE) 7.94%Nearly 200 banking locations and 264 ATMs across our footprintApproximately 3,900 employees corporate-wideRated among the strongest,safest financial institutions in the country by BauerFinancial,Inc.Earned top customer servicemarks with Greenwich Excellence AwardsMoody’s long-term issuer rating: Baa3S&P long-term issuer rating: BBB
Corporate Profile (as of March 31, 2017) $25.5 billion in Total Assets$18.2 billion in Total Loans$19.9 billion in Total DepositsTangible Common Equity (TCE) 7.94%Nearly 200 banking locations and 264 ATMs across our footprintApproximately 3,900 employees corporate-wideRated among the strongest,safest financial institutions in the country by BauerFinancial,Inc.Earned top customer servicemarks with Greenwich Excellence AwardsMoody’s long-term issuer rating: Baa3S&P long-term issuer rating:
3
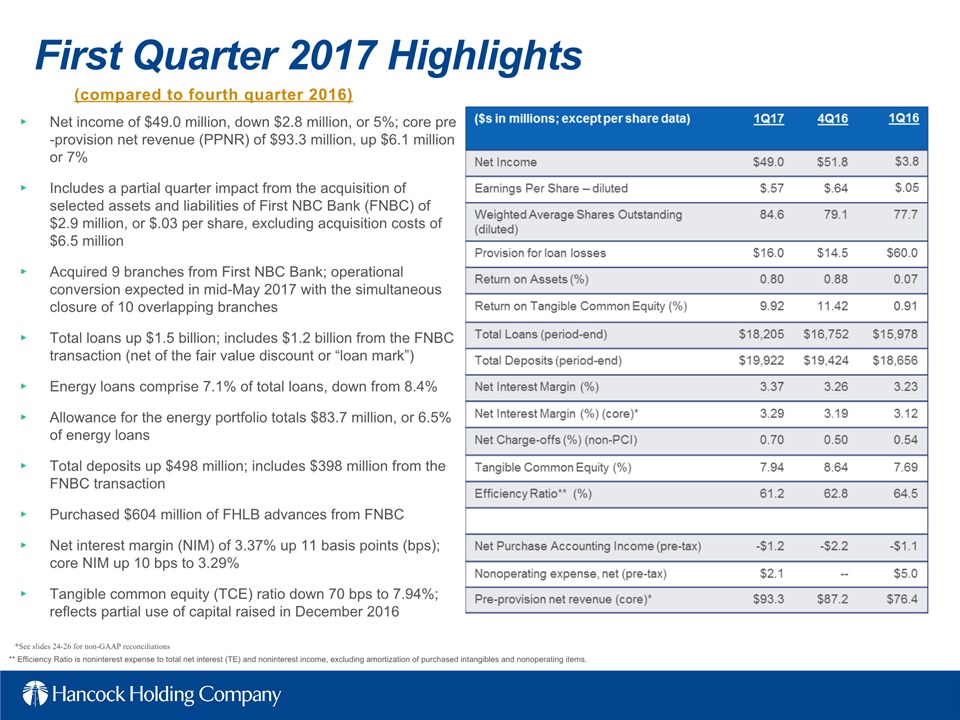
(compared to fourth quarter 2016) First Quarter 2017 Highlights Net income of $49.0 million, down $2.8 million, or 5%; core pre-provision net revenue (PPNR) of $93.3 million, up $6.1 million or 7% Includes a partial quarter impact from the acquisition of selected assets and liabilities of First NBC Bank (FNBC) of $2.9 million, or $.03 per share, excluding acquisition costs of $6.5 millionAcquired 9 branches from First NBC Bank; operational conversion expected in mid-May 2017 with the simultaneous closure of 10 overlapping branchesTotal loans up $1.5 billion; includes $1.2 billion from the FNBC transaction (net of the fair value discount or “loan mark”)Energy loans comprise 7.1% of total loans, down from 8.4%Allowance for the energy portfolio totals $83.7 million, or 6.5% of energy loans Total deposits up $498 million; includes $398 million from the FNBC transactionPurchased $604 million of FHLB advances from FNBCNet interest margin (NIM) of 3.37% up 11 basis points (bps); core NIM up 10 bps to 3.29%Tangible common equity (TCE) ratio down 70 bps to 7.94%; reflects partial use of capital raised in December 2016 ** Efficiency Ratio is noninterest expense to total net interest (TE) and noninterest income, excluding amortization of purchased intangibles and nonoperating items. *See slides 24-26 for non-GAAP reconciliations
4
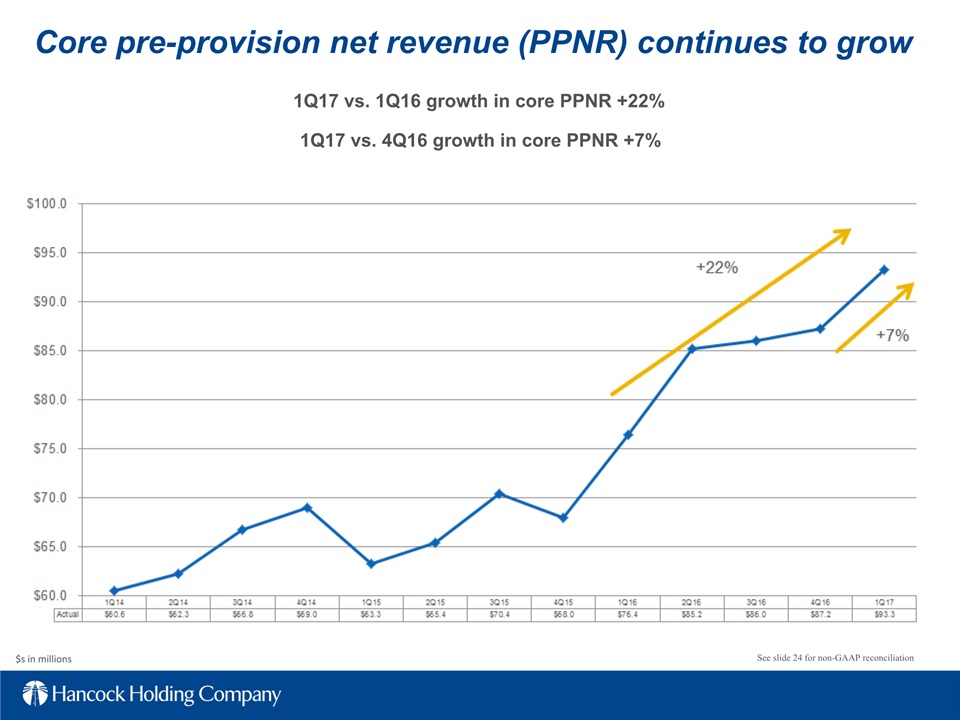
1Q17 vs. 1Q16 growth in core PPNR +22% $s in millions Core pre-provision net revenue (PPNR) continues to grow See slide 24 for non-GAAP reconciliation 1Q17 vs. 4Q16 growth in core PPNR +7%
1Q17 vs. 1Q16 growth in core PPNR +22% $s in millions Core pre-provision net revenue (PPNR) continues to grow See slide 24 for non-GAAP reconciliation 1Q17 vs. 4Q16 growth in core PPNR +
5

Well-Diversified Loan Portfolio Loans totaled $18.2 billion at quarter-end, an increase of $1.5 billion, or 9%, linked-quarterBalance reflects approximately $1.2 billion in loans acquired from First NBC transaction (net of loan mark)Net loan growth during the quarter was diversified across the footprint and also in areas identified as part of the company’s revenue-generating initiatives (mortgage, equipment finance)Reflects $123 million net decrease in energy-related loans $s in millions
6
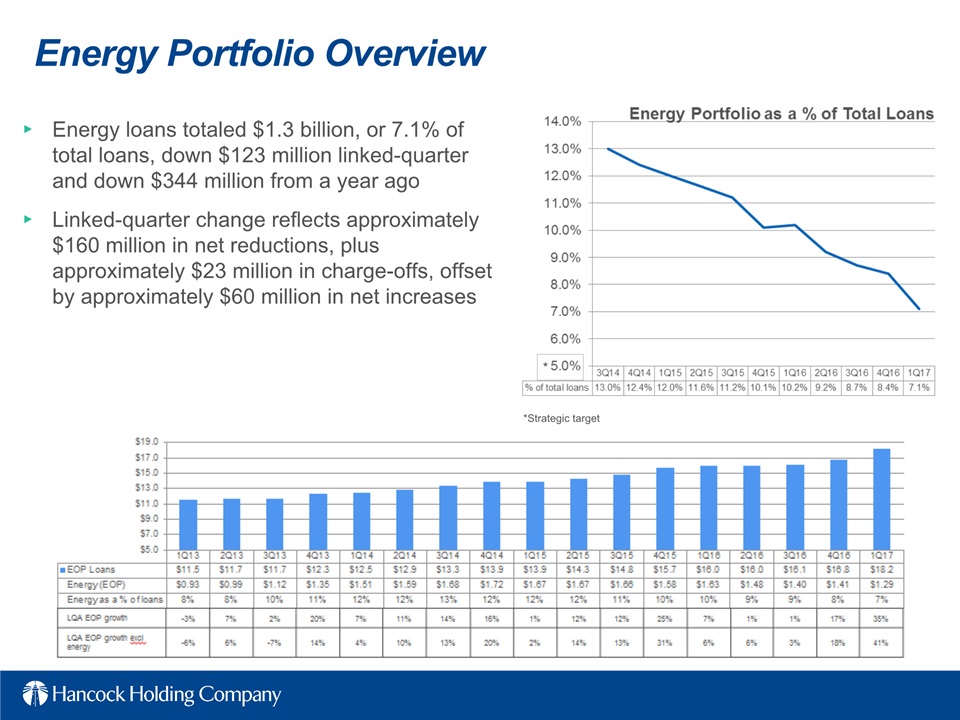
Energy Portfolio Overview Energy loans totaled $1.3 billion, or 7.1% of total loans, down $123 million linked-quarter and down $344 million from a year agoLinked-quarter change reflects approximately $160 million in net reductions, plus approximately $23 million in charge-offs, offset by approximately $60 million in net increases * *Strategic target
7

Energy Portfolio Overview (cont’d) Net decrease in outstandings of $123 million linked-quarter and a $115 million decrease in total commitments$57 million linked-quarter decrease in upstream outstandings and a $43 million decrease in total commitments $4 million linked-quarter increase in midstream sector outstandings and a $5 million increase in total commitments$70 million linked-quarter decrease in support sector outstandings and a $77 million reduction in total commitmentsReduction in nonaccrual energy loans of $55 million, or 27% *Includes accrual and nonaccrual loans
8
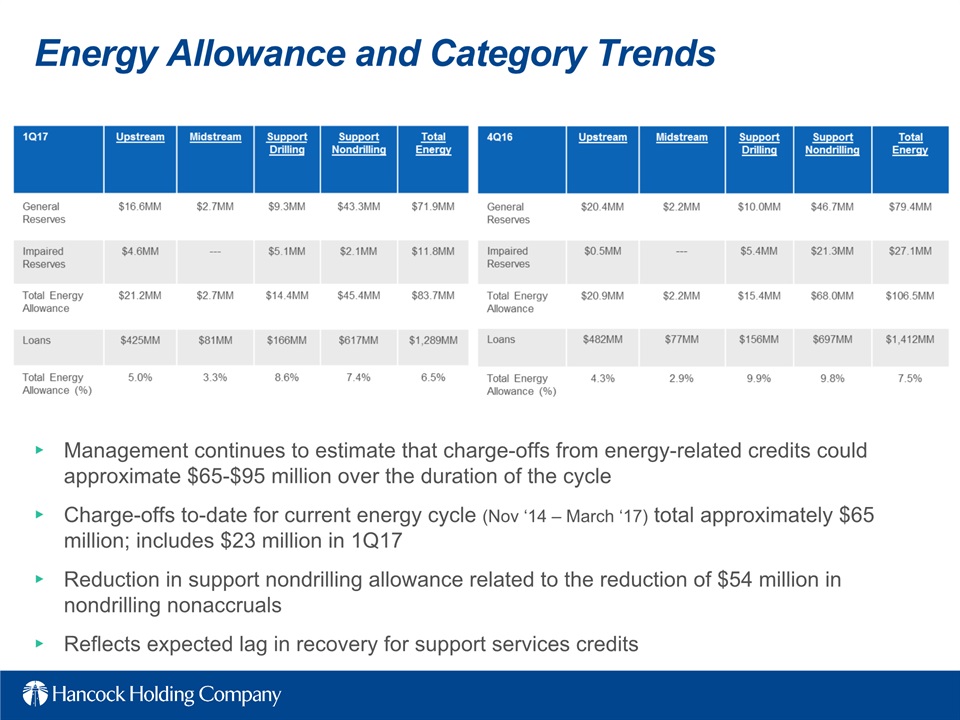
Energy Allowance and Category Trends Management continues to estimate that charge-offs from energy-related credits could approximate $65-$95 million over the duration of the cycleCharge-offs to-date for current energy cycle (Nov ‘14 – March ‘17) total approximately $65 million; includes $23 million in 1Q17Reduction in support nondrilling allowance related to the reduction of $54 million in nondrilling nonaccrualsReflects expected lag in recovery for support services credits
9
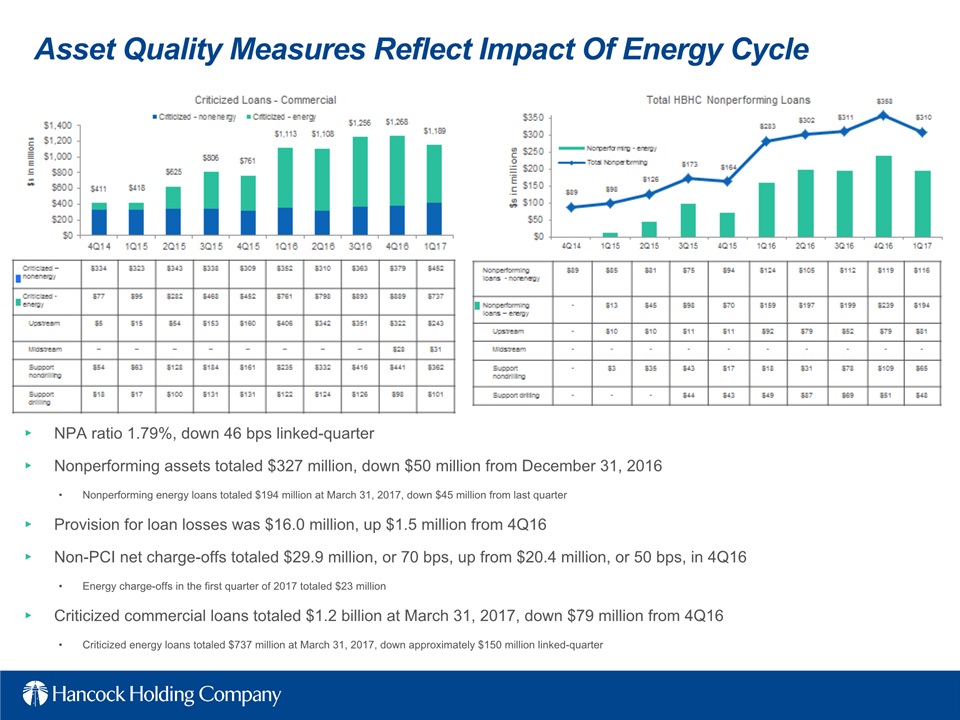
Asset Quality Measures Reflect Impact Of Energy Cycle NPA ratio 1.79%, down 46 bps linked-quarter Nonperforming assets totaled $327 million, down $50 million from December 31, 2016Nonperforming energy loans totaled $194 million at March 31, 2017, down $45 million from last quarterProvision for loan losses was $16.0 million, up $1.5 million from 4Q16Non-PCI net charge-offs totaled $29.9 million, or 70 bps, up from $20.4 million, or 50 bps, in 4Q16Energy charge-offs in the first quarter of 2017 totaled $23 millionCriticized commercial loans totaled $1.2 billion at March 31, 2017, down $79 million from 4Q16Criticized energy loans totaled $737 million at March 31, 2017, down approximately $150 million linked-quarter
10
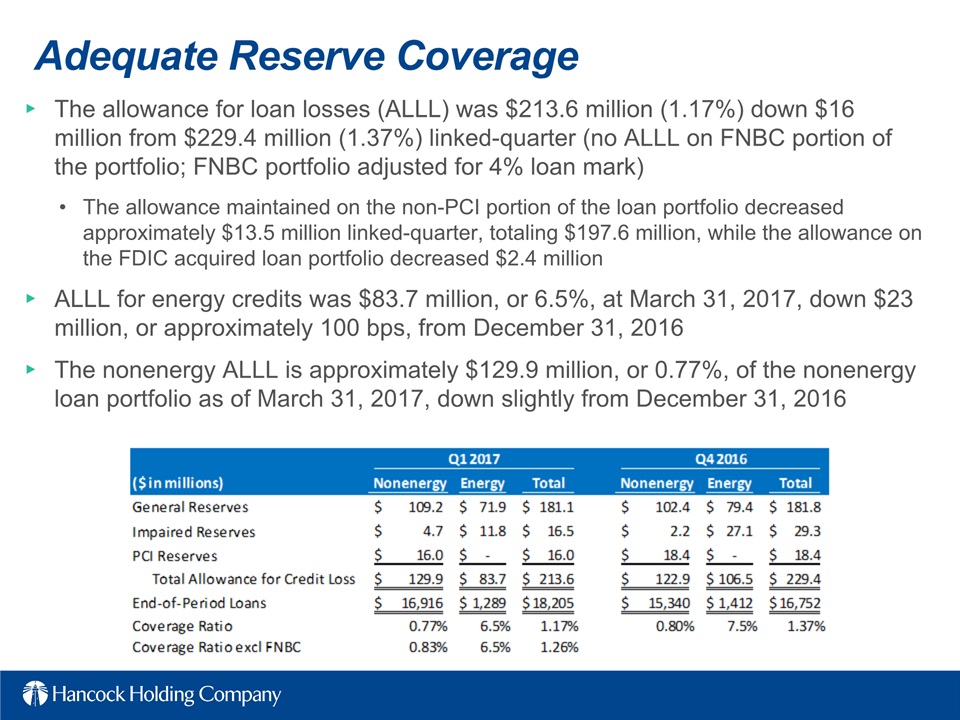
Adequate Reserve Coverage The allowance for loan losses (ALLL) was $213.6 million (1.17%) down $16 million from $229.4 million (1.37%) linked-quarter (no ALLL on FNBC portion of the portfolio; FNBC portfolio adjusted for 4% loan mark)The allowance maintained on the non-PCI portion of the loan portfolio decreased approximately $13.5 million linked-quarter, totaling $197.6 million, while the allowance on the FDIC acquired loan portfolio decreased $2.4 millionALLL for energy credits was $83.7 million, or 6.5%, at March 31, 2017, down $23 million, or approximately 100 bps, from December 31, 2016 The nonenergy ALLL is approximately $129.9 million, or 0.77%, of the nonenergy loan portfolio as of March 31, 2017, down slightly from December 31, 2016
11

Securities Portfolio Portfolio totaled $5.0 billion, down slightly linked-quarter Yield 2.52%, up 14 bps linked-quarterUnrealized net loss of $42.8 million on AFS50% HTM, 50% AFSDuration 5.00 years compared to 5.07 years at 12-31-16Premium amortization down $0.9 million linked-quarterBalance sheet is asset sensitive over a 2 year period to rising interest rates under various shock scenariosIRR modeling is based on conservative assumptionsFlat balance sheetLoan portfolio 52% variable56% of variable loans are LIBOR-based 92% of the LIBOR loans are tied to 1mo L7% of the LIBOR loans are tied to 3mo LApproximately 1/3 tied to Wall Street Journal PrimeModeled lag in deposit rate increasesConservative % DDA attrition for certain increases in ratesNo energy-related securities in the portfolio
12
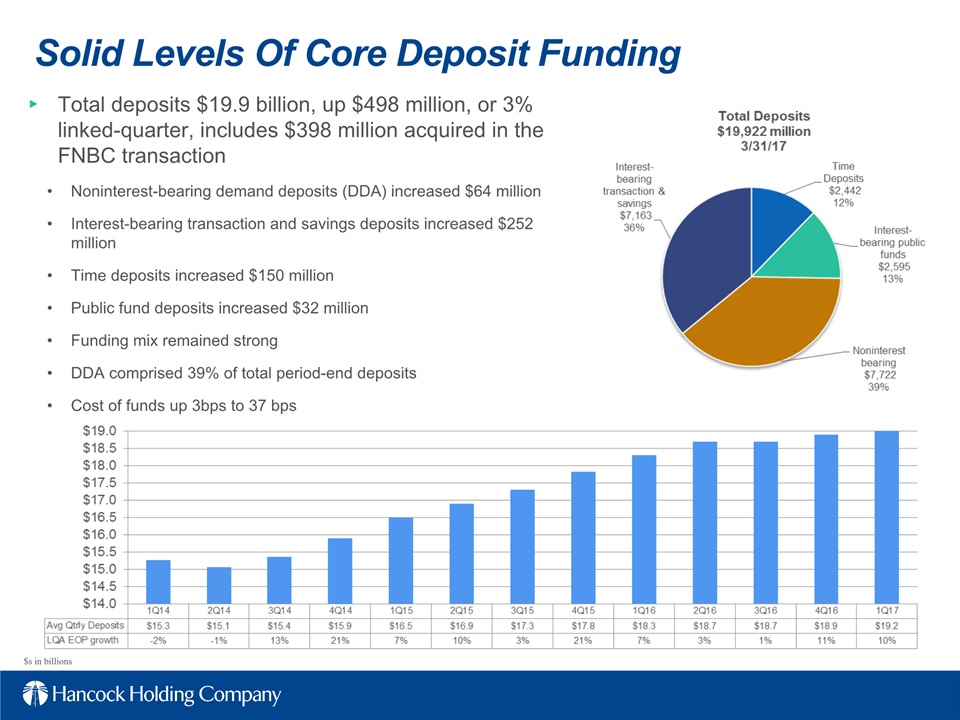
Solid Levels Of Core Deposit Funding Total deposits $19.9 billion, up $498 million, or 3% linked-quarter, includes $398 million acquired in the FNBC transactionNoninterest-bearing demand deposits (DDA) increased $64 millionInterest-bearing transaction and savings deposits increased $252 millionTime deposits increased $150 million Public fund deposits increased $32 millionFunding mix remained strongDDA comprised 39% of total period-end depositsCost of funds up 3bps to 37 bps $s in billions
13
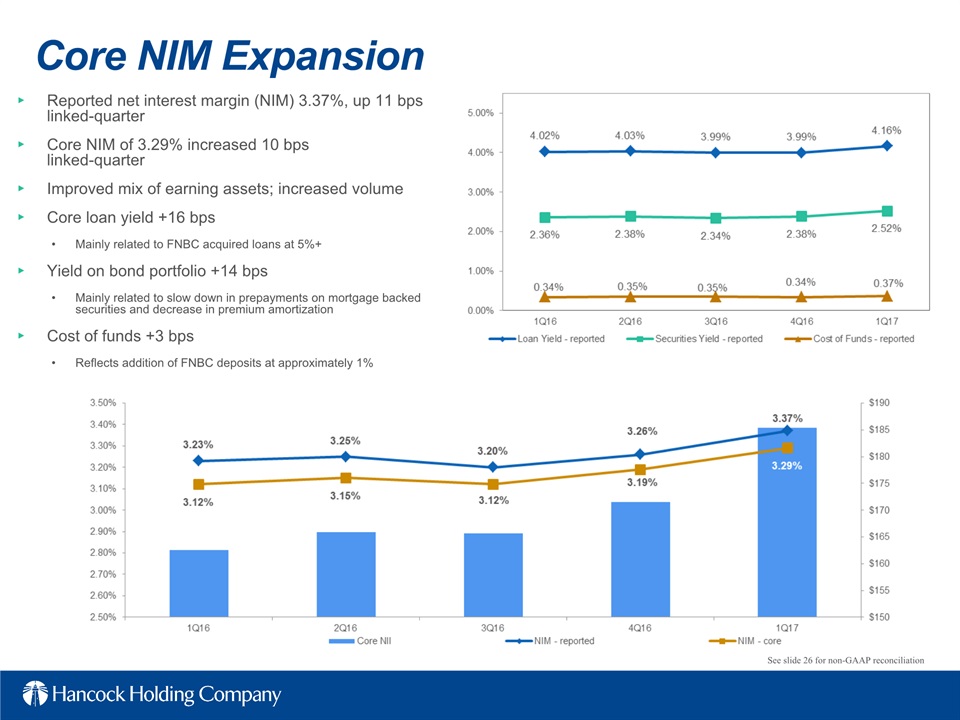
Core NIM Expansion See slide 26 for non-GAAP reconciliation Reported net interest margin (NIM) 3.37%, up 11 bps linked-quarter Core NIM of 3.29% increased 10 bps linked-quarterImproved mix of earning assets; increased volumeCore loan yield +16 bpsMainly related to FNBC acquired loans at 5%+ Yield on bond portfolio +14 bps Mainly related to slow down in prepayments on mortgage backed securities and decrease in premium amortizationCost of funds +3 bpsReflects addition of FNBC deposits at approximately 1%
14
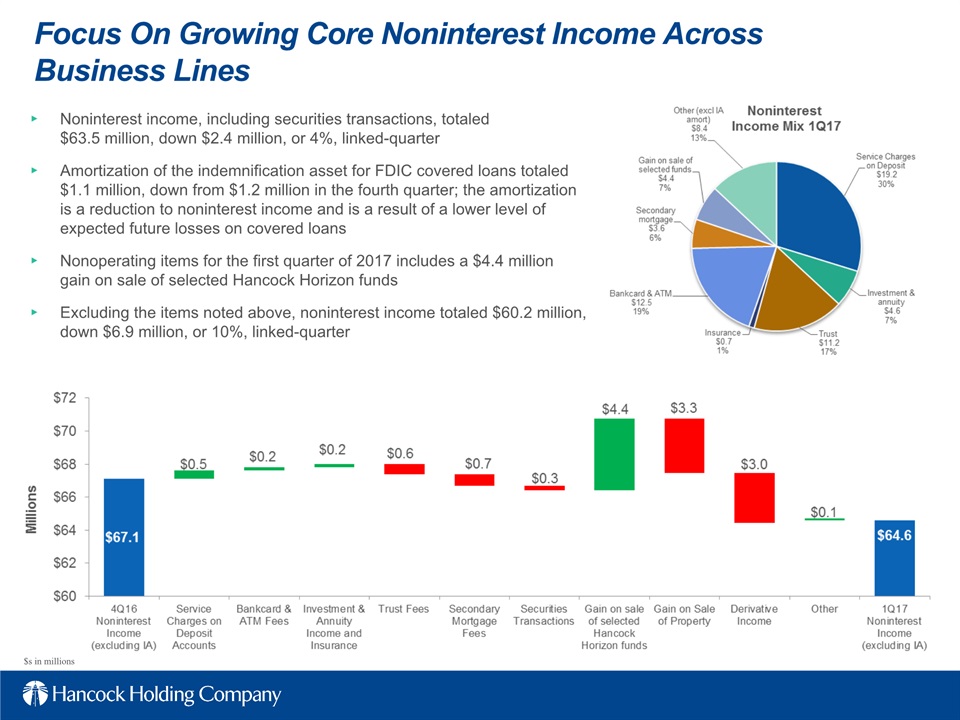
Focus On Growing Core Noninterest Income Across Business Lines Noninterest income, including securities transactions, totaled $63.5 million, down $2.4 million, or 4%, linked-quarterAmortization of the indemnification asset for FDIC covered loans totaled $1.1 million, down from $1.2 million in the fourth quarter; the amortization is a reduction to noninterest income and is a result of a lower level of expected future losses on covered loansNonoperating items for the first quarter of 2017 includes a $4.4 million gain on sale of selected Hancock Horizon funds Excluding the items noted above, noninterest income totaled $60.2 million, down $6.9 million, or 10%, linked-quarter $s in millions
15

Remain Focused On Expense Control Noninterest expenses totaled $163.5 million in 1Q17, up $7.3 million, or 5%, linked quarter; includes $6.5 million of acquisition costsNoninterest expense excluding acquisition costs (operating expense) totaled $157.1 million, up $0.8 million or less than 1%Personnel expense totaled $89.0 million, up $1.5 million, or 2%, linked-quarterOccupancy and equipment totaled $14.5 million, up $0.5 million, or 4% linked-quarterNet gains on ORE dispositions exceeded ORE expense by $13 thousand compared to $0.6 million of net expense in 4Q16; management does not expect this level of ORE expense to be sustainable in future quartersOther operating expense (excluding ORE) totaled $48.9 million in the first quarter of 2017, down $0.5 million, or 1%, from the fourth quarter of 2016 $s in millions
16

TCE ratio 7.94%, down 70 bps linked-quarterTangible asset growth (including FNBC asset acquisition) -48 bpsIntangibles -43 bpsTangible net retained earnings +14 bpsOCI +1 bpOption exercises +6 bpsWill continue to manage capital in the best interests of the Company and our shareholders Managing Our Capital… (e) estimated
17
…With Financially Compelling Return on Investment Signed an agreement on December 30, 2016 to purchase certain assets and liabilities, including 9 branches, from First NBC Bank; the transaction closed on March 10, 2017Transaction was between Hancock Holding Company’s banking subsidiary Whitney Bank (“Whitney”) and First NBC Bank Holding Company’s banking subsidiary First NBC Bank (“First NBC”)Purchased select loans, 9 First NBC branches, including associated transaction and savings deposits and PP&E, and FHLB borrowings:Approximately $1.2 billion diversified and performing loan portfolio with a 5.28% average yield9 branches in the Greater New Orleans region, including 7 in the New Orleans MSAConsolidating 10 overlapping branchesApproximately $400 million in deposits at average cost of 0.95%Approximately $600 million in FHLB borrowings at average cost of 1.11%Paid a premium of just under $42 million to First NBCTransferred approximately $320 million in cash Premium is related to the earnings stream acquired
18
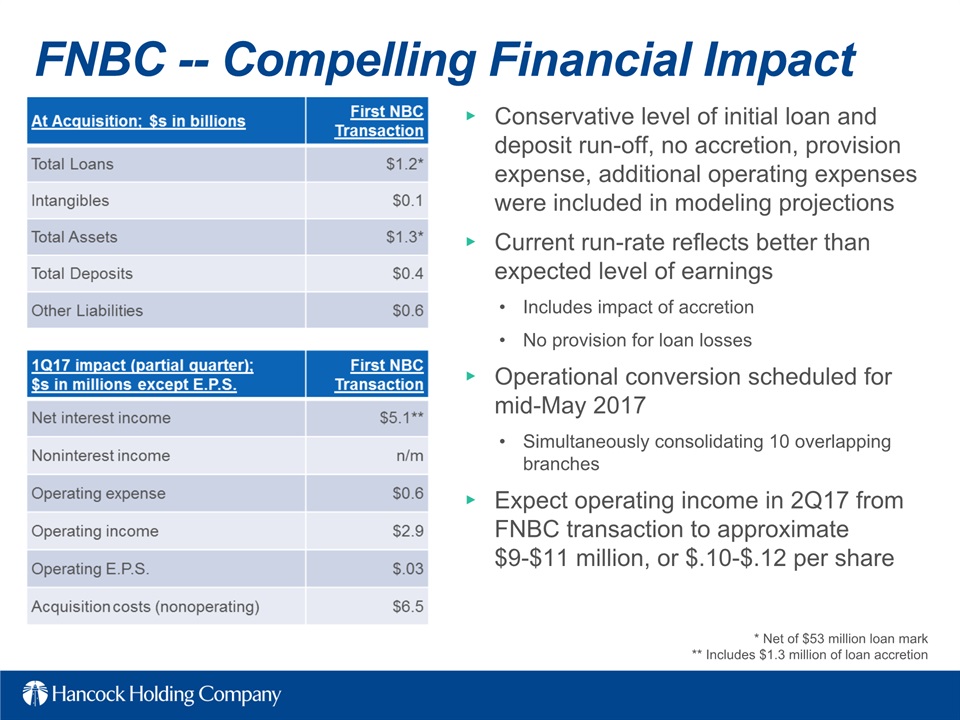
FNBC -- Compelling Financial Impact Conservative level of initial loan and deposit run-off, no accretion, provision expense, additional operating expenses were included in modeling projectionsCurrent run-rate reflects better than expected level of earnings Includes impact of accretionNo provision for loan lossesOperational conversion scheduled for mid-May 2017Simultaneously consolidating 10 overlapping branches Expect operating income in 2Q17 from FNBC transaction to approximate $9-$11 million, or $.10-$.12 per share * Net of $53 million loan mark** Includes $1.3 million of loan accretion
19

Near-Term Outlook See slides 24-26 for non-GAAP reconciliations
20

2017 Strategic Objectives (includes FNBC) Loan growth 15-17% (EOP)Includes $1.2B of loans acquired from FNBC in 1Q17 (net of loan mark)Fund loan growth primarily with depositsRevenue growth 11-13% (includes only the March 2017 interest rate hike for 2017)Expense growth 4-5%Core PPNR growth 20-22%PLLL $50-$65mm2017/18 Corporate Strategic Objectives (CSOs)
21
Appendix/Non-GAAP Reconciliations
22
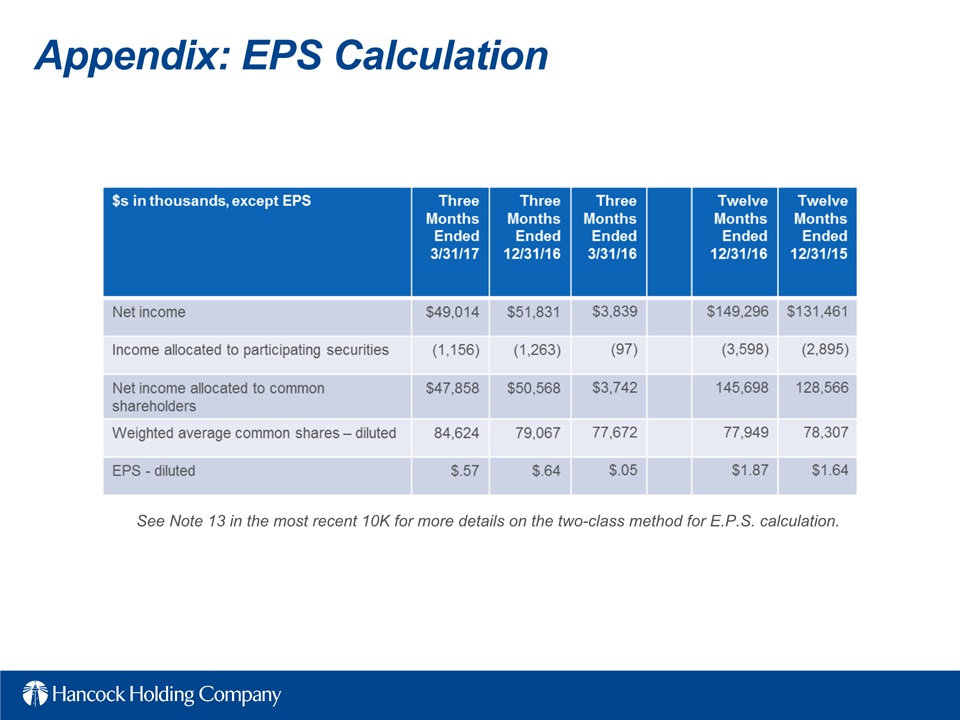
Appendix: EPS Calculation See Note 13 in the most recent 10K for more details on the two-class method for E.P.S. calculation.
23

Appendix: Core PPNR Reconciliation
24
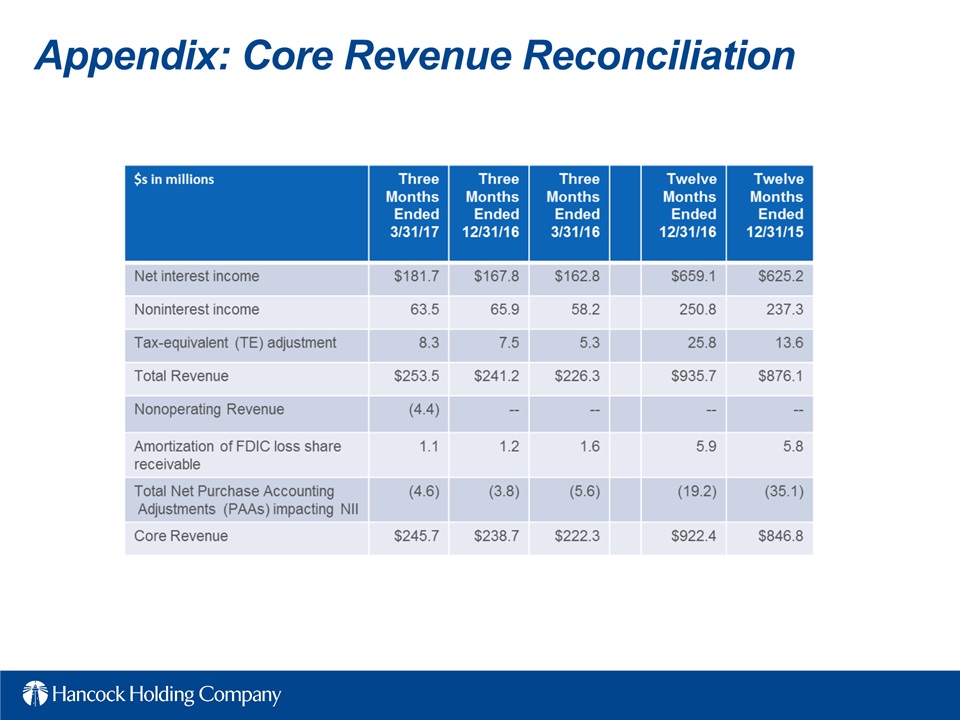
Appendix: Core Revenue Reconciliation
25
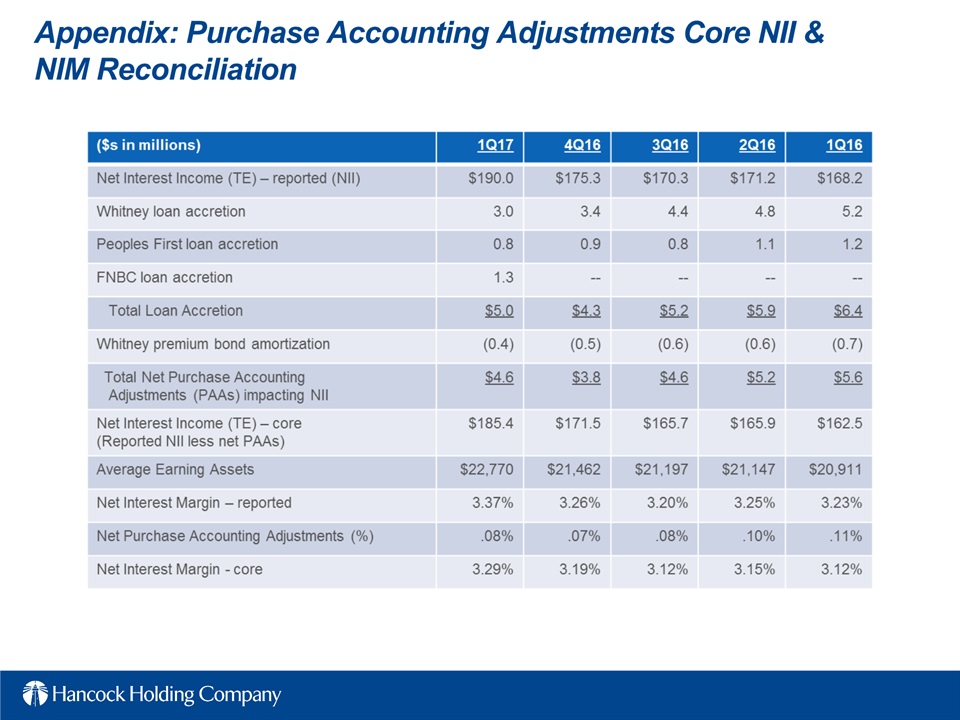
Appendix: Purchase Accounting Adjustments Core NII & NIM Reconciliation
26

Appendix: Core Revenue
27

Revenue Generating Initiatives - Fees $s in thousands *Includes Hancock Horizon Funds sale
28

Appendix: Operating Expense (excl nonoperating items)
29
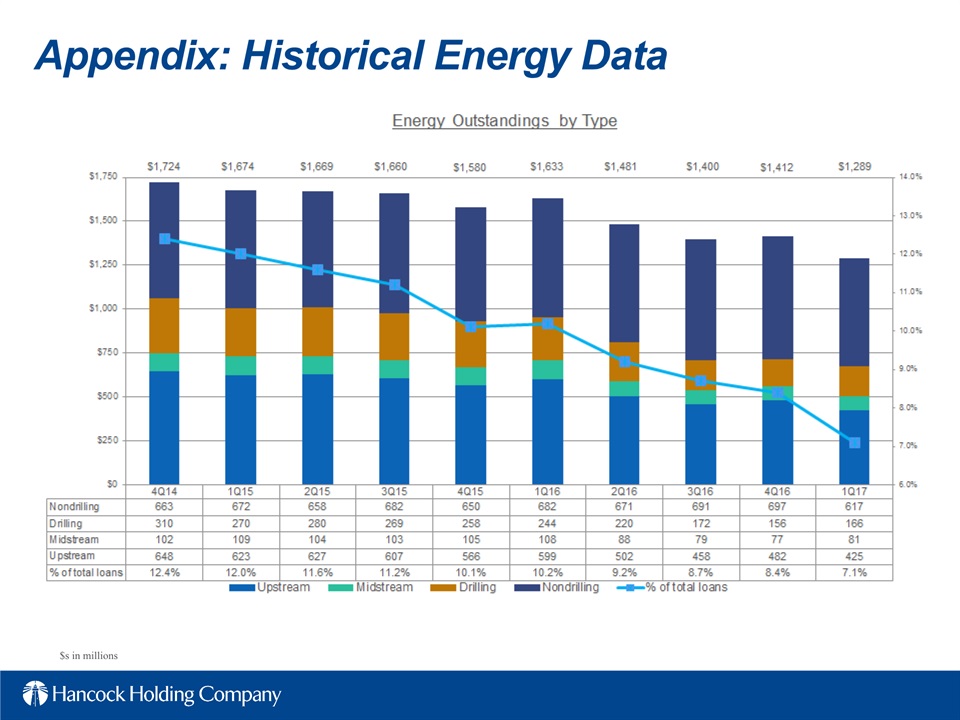
Appendix: Historical Energy Data $s in millions
30
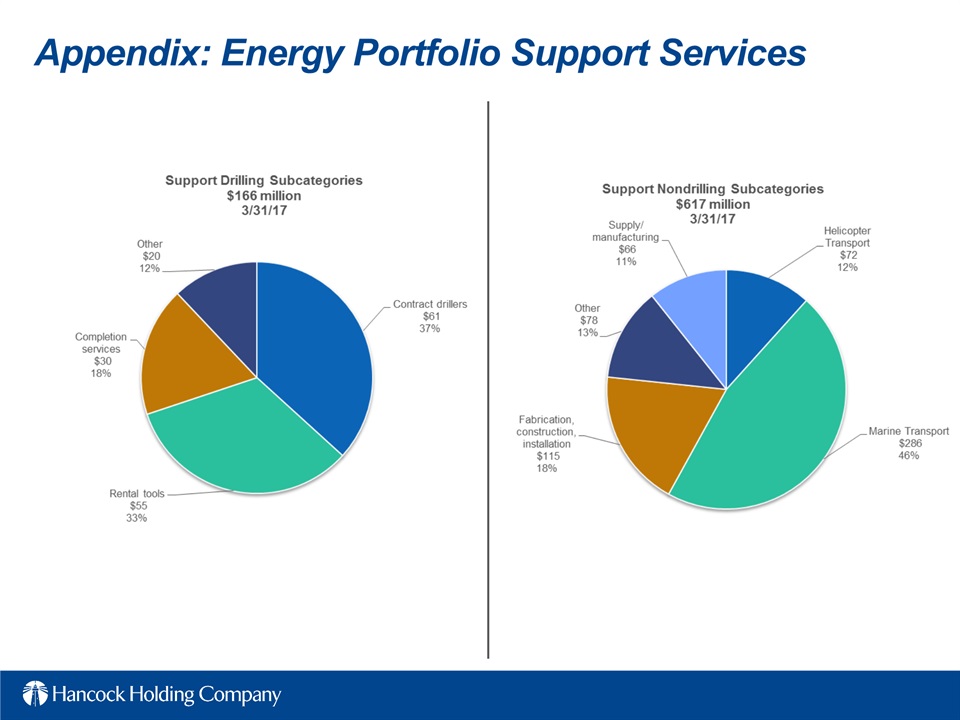
Appendix: Energy Portfolio Support Services
31

Impact of Purchase Accounting Adjustments(projections will be updated quarterly; subject to change) Appendix: Purchase Accounting Impact/Trend *Projected revenue includes loan accretion from Whitney, Peoples First and FNBC, offset by amortization of the Whitney bond portfolio premium and amortization of the Peoples First indemnification asset. $s in millions
Impact of Purchase Accounting Adjustments(projections will be updated quarterly; subject to change) Appendix: Purchase Accounting Impact/Trend *Projected revenue includes loan accretion from Whitney, Peoples First and FNBC, offset by amortization of the Whitney bond portfolio premium and amortization of the Peoples First indemnification asset. $s in millions
Impact of Purchase Accounting Adjustments(projections will be updated quarterly; subject to change) Appendix: Purchase Accounting Impact/Trend *Projected revenue includes loan accretion from Whitney, Peoples First and FNBC, offset by amortization of the Whitney bond portfolio premium and amortization of the Peoples First indemnification asset. $s in million
32
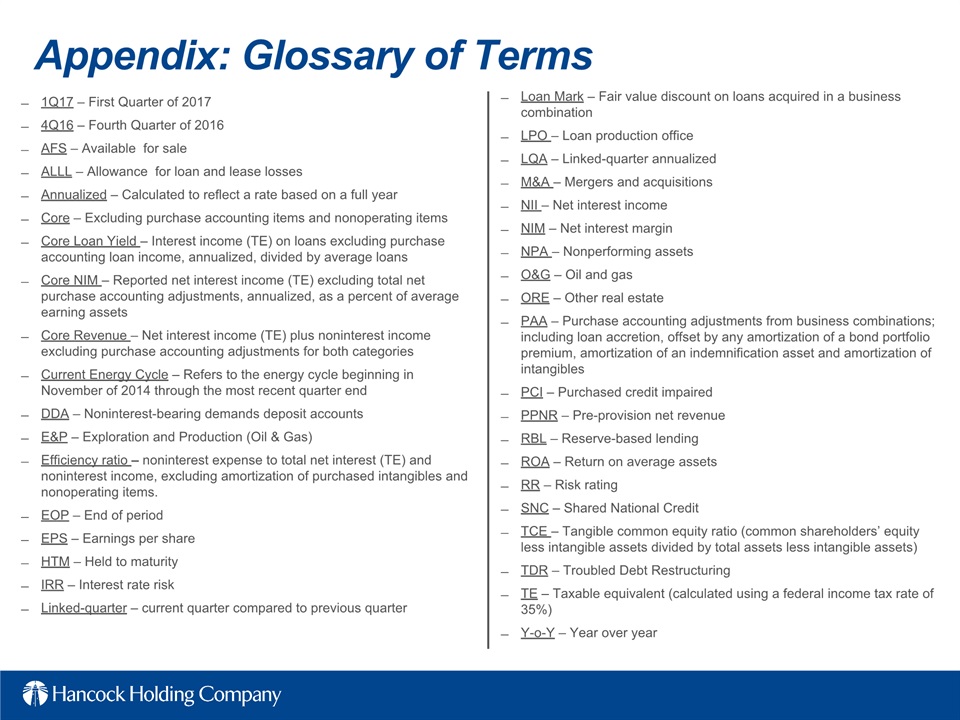
Appendix: Glossary of Terms Loan Mark – Fair value discount on loans acquired in a business combinationLPO – Loan production officeLQA – Linked-quarter annualizedM&A – Mergers and acquisitionsNII – Net interest income NIM – Net interest marginNPA – Nonperforming assetsO&G – Oil and gasORE – Other real estatePAA – Purchase accounting adjustments from business combinations; including loan accretion, offset by any amortization of a bond portfolio premium, amortization of an indemnification asset and amortization of intangiblesPCI – Purchased credit impairedPPNR – Pre-provision net revenueRBL – Reserve-based lendingROA – Return on average assetsRR – Risk ratingSNC – Shared National CreditTCE – Tangible common equity ratio (common shareholders’ equity less intangible assets divided by total assets less intangible assets)TDR – Troubled Debt Restructuring TE – Taxable equivalent (calculated using a federal income tax rate of 35%)Y-o-Y – Year over year 1Q17 – First Quarter of 20174Q16 – Fourth Quarter of 2016AFS – Available for saleALLL – Allowance for loan and lease lossesAnnualized – Calculated to reflect a rate based on a full yearCore – Excluding purchase accounting items and nonoperating itemsCore Loan Yield – Interest income (TE) on loans excluding purchase accounting loan income, annualized, divided by average loansCore NIM – Reported net interest income (TE) excluding total net purchase accounting adjustments, annualized, as a percent of average earning assetsCore Revenue – Net interest income (TE) plus noninterest income excluding purchase accounting adjustments for both categoriesCurrent Energy Cycle – Refers to the energy cycle beginning in November of 2014 through the most recent quarter endDDA – Noninterest-bearing demands deposit accountsE&P – Exploration and Production (Oil & Gas)Efficiency ratio – noninterest expense to total net interest (TE) and noninterest income, excluding amortization of purchased intangibles and nonoperating items.EOP – End of periodEPS – Earnings per shareHTM – Held to maturityIRR – Interest rate riskLinked-quarter – current quarter compared to previous quarter
33
4/19/2017 First Quarter 2017Earnings Conference Call
34