Attached files
| file | filename |
|---|---|
| EX-32 - CERTIFICATION UNDER USC 1350 - COMMUNICATIONS SYSTEMS INC | csi170730_ex32.htm |
| EX-31.2 - CERTIFICATION OF CFO - COMMUNICATIONS SYSTEMS INC | csi170730_ex31-2.htm |
| EX-31.1 - CERTIFICATION OF CEO - COMMUNICATIONS SYSTEMS INC | csi170730_ex31-1.htm |
| EX-23 - CONSENT OF INDEPENDENT REGISTERED PUBLIC ACCOUNTING FIRM - COMMUNICATIONS SYSTEMS INC | csi170730_ex23.htm |
| EX-21 - SUBSIDIARIES OF COMMUNICATIONS SYSTEMS, INC. - COMMUNICATIONS SYSTEMS INC | csi170730_ex21.htm |
UNITED STATES
SECURITIES AND EXCHANGE COMMISSION
Washington, D.C. 20549
FORM 10-K
(Mark One)
| ☒ | ANNUAL REPORT PURSUANT TO SECTION 13 OR 15(d) OF THE SECURITIES EXCHANGE ACT OF 1934 |
For the fiscal year ended December 31, 2016
Commission File Number: 001-31588
COMMUNICATIONS SYSTEMS, INC.
(Exact name of registrant as specified in its charter)
| Minnesota | 41-0957999 | |
| (State or other jurisdiction | (Federal Employer | |
| of incorporation or organization) | Identification No.) |
10900 Red Circle Drive, Minnetonka, MN 55343
(Address of principal executive offices and zip code)
Registrant’s telephone number, including area code: (952) 996-1674
Securities registered pursuant to Section 12(b) of the Act:
| Title of each class | Name of each exchange on which registered | |
| Common Stock, $.05 par value | NASDAQ | |
| Preferred Stock Purchase Rights |
Securities registered pursuant to Section 12(g) of the Act: None
Indicate by check mark if the registrant is a well-known seasoned issuer, as defined in Rule 405 of the Securities Act. YES ☐ NO ☒
Indicate by check mark if the registrant is not required to file reports pursuant to Section 13 or 15(d) of the Act. YES ☐ NO ☒
Indicate by check mark whether the registrant (1) has filed all reports required to be filed by Section 13 or 15(d) of the Securities Exchange Act of 1934 during the preceding 12 months (or for such shorter period that the registrant was required to file such reports), and (2) has been subject to such filing requirements for the past 90 days. YES ☒ NO ☐
Indicate by check mark whether the registrant has submitted electronically and posted on its corporate Web site, if any, every Interactive Data File required to be submitted and posted pursuant to Rule 405 of Regulation S-T during the preceding 12 months (or for such shorter period that the registrant was required to submit and post such files). YES ☒ NO ☐
Indicate by check mark if disclosure of delinquent filers pursuant to Item 405 of Regulation S-K is not contained herein, and will not be contained, to the best of registrant’s knowledge, in definitive proxy or information statements incorporated by reference in Part III of this Form 10-K or any amendment to this Form 10-K. ☒
Indicate by check mark whether the registrant is a large accelerated filer, an accelerated filer, a non-accelerated filer or a smaller reporting company.
See definition of “accelerated filer,” “large accelerated filer” and “smaller reporting company” in Rule 12b-2 of the Act.
| Large Accelerated Filer ☐ | Accelerated Filer ☐ | Non-Accelerated Filer ☐ | Smaller Reporting Company ☒ |
Indicate by check mark whether the registrant is a shell company (as defined in Rule 12b-2 of the Act). YES ☐ NO ☒
The aggregate market value of the voting and non-voting common equity held by non-affiliates of the Registrant was approximately $48,934,000 based upon the closing sale price of the Company’s common stock on the NASDAQ on June 30, 2016.
As of March 1, 2017 there were outstanding 8,883,535 shares of the Registrant’s common stock.
| Documents Incorporated by Reference: | Portions of the Company’s Proxy Statement for its Annual Meeting of Shareholders to be held on May 24, 2017 are incorporated by reference into Part III of this Form10-K. |
PART I
| ITEM 1. | BUSINESS |
(a) GENERAL DEVELOPMENT OF BUSINESS
Communications Systems, Inc. (herein collectively referred to as “CSI,” “our,” “we” or the “Company”) is a Minnesota corporation organized in 1969 that operates directly and through its subsidiaries located in the United States (U.S.), Costa Rica, and the United Kingdom (U.K.). CSI is principally engaged through its Suttle, Inc. (“Suttle”) subsidiary and business unit in the manufacture and sale of connectivity infrastructure products for broadband and voice communications, and through its Transition Networks, Inc. (“Transition Networks” or “Transition”) subsidiary and business unit in the manufacture and sale of core media conversion products, Ethernet switches, and other connectivity and data transmission products. Through its JDL Technologies, Inc. (“JDL Technologies” or “JDL”) business unit, CSI provides technology solutions including virtualization, managed services, wired and wireless network design and implementation, HIPAA-compliant IT services, and converged infrastructure configuration and deployment. Through its Net2Edge Limited (“Net2Edge”) UK-based business unit, the Company develops, manufactures and sells products that enable telecommunications carriers to connect legacy networks to high-speed services.
The Company maintains a website at www.commsystems.com. Our annual reports on Form 10-K, our quarterly reports on Form 10-Q and our periodic reports on Form 8-K (and any amendments to these reports) are available free of charge by linking from our website to the Securities and Exchange Commission website.
(b) FINANCIAL INFORMATION ABOUT INDUSTRY SEGMENTS
The Company classifies its businesses into four segments:
| ● | Suttle, which manufactures connectivity infrastructure products for broadband and voice communications; |
| ● | Transition Networks, which designs and markets media conversion products, Ethernet switches, and other connectivity and data transmission products; |
| ● | JDL Technologies, which is an IT managed services provider and value-added reseller; and |
| ● | Net2Edge, which develops, manufactures and sells products to connect legacy networks to high-speed services. |
Non-allocated general and administrative expenses are separately accounted for as “Other” in the Company’s segment reporting. Intersegment revenues are eliminated upon consolidation. Further information regarding these segments, including customer and industry concentration, is set forth in Item 7, “Management’s Discussion and Analysis of Financial Condition and Results of Operations” and in Note 12 of the Notes to Consolidated Financial Statements under Item 8.
(c) NARRATIVE DESCRIPTION OF BUSINESS
(1) Information Regarding Business Segments
(i) Suttle, Inc.
Suttle, based in Minnetonka, Minnesota, manufactures and markets a broad range of products that support broadband and telephone service under the Suttle brand name in the United States and internationally. Products are deployed from the last mile of the carrier network into the premise/enterprise to meet the unique needs of hybrid/fiber/copper networks. The Company’s customer-oriented approach provides right-sized solutions that leverage existing infrastructure and protect investments as markets and technologies grow and change. With over 100 years of knowledge and experience, Suttle is a reliable partner, delivering innovative, flexible, easy-to-use solutions, lower cost of ownership, and solid customer support. The Company manufactures 71% of its products at its plants in Hector, Minnesota (Suttle, Inc.) and San Jose, Costa Rica (Suttle Costa Rica, S.A.). The other 29% are purchased from offshore contract manufacturers. Segment sales were $42,076,000 in 2016 and $50,082,000 in 2015. On January 24, 2017, the Company announced it was closing its Suttle Costa Rica production facility and consolidating production into its Minnesota facilities.
2
Products
Suttle’s products include Structured Cabling Products (enclosure systems to support premise distribution of broadband and other connectivity networks); FTTx Products (fiber optic management and connectivity solutions for access and premise networks); Modular Connecting Products (connecting products for copper telecommunications networks) and DSL Products (products that support broadband connectivity to copper networks).
Products for the Edge of the Network:
Suttle’s solutions for the last mile of the carrier’s network, i.e. the “Edge,” are designed to operate in challenging environments yet be easily accessible, extend the life of the existing network, enhance data speeds, and prevent loss of bandwidth at the point of use.
Suttle products are designed to work indoor and outdoor and feature flexibility and scalability in real world applications for both copper and fiber networks. Suttle’s FutureLinkTM solutions offer a range of products including terminals, patch-and-splice and splitter enclosures.
Products for the Connected Home/Business:
Suttle provides service distribution products for cost-effective solutions using existing and new structured wiring. These products reduce installation time and labor costs, and increase the provider’s return on investment. In addition to reducing a service provider’s up-front costs, Suttle’s high throughput solutions help eliminate potential bottlenecks to “future-proof” the installation, reducing future costs.
The MediaMAXTM brand provides for reliable brownfield and greenfield premise connectivity to meet the increasing demand for wired and wireless high-speed service throughout the home and business. Designed to optimize installation cost while maximizing coverage and bandwidth at the point of use for multiple deployment topologies, this brand includes a premise connectivity and distribution system, featuring plastic modular enclosures and tool-less, snap-in modules to minimize wireless interference. MediaMAXTM brand product replaces Suttle’s SOHOTM brand products, which have been Suttle’s primary premise distribution products for approximately the last 10 years.
Another key feature of MediaMAX is installation cost and time saving tool-less technology available in jacks and modules. Rounding out the inside the premise/enterprise offering are faceplates and wall plates that accommodate hybrid/fiber, copper and coax connections for higher speed, tool-less connectivity and lower cost of ownership.
Markets and Marketing
Suttle markets its outside plant and premise distribution products globally to telecommunications companies, service providers, residential builders, and low-voltage installers through distributors and the Company’ sales staff. Suttle has a solid history of offering long-term solutions to some of the largest global providers by understanding customers’ needs and providing innovative solutions coupled with strong customer support. Suttle reaches its targeted customers through a variety of marketing media including trade shows, associations, advertising, social media, and the Suttle website.
Suttle recently changed its domain name for electronic communications to SuttleSolutions.com to emphasize our focus on end-to-end customer oriented solutions for communication service providers.
Customers
Suttle’s customers include telephone, CATV, internet service providers and enterprise networks. The Company’s major telephone company customers include AT&T, CenturyLink and Verizon. Suttle serves these major telephone companies directly by Suttle’s sales staff and through a select group of distributors. Sales (including DSL) to the major telephone companies, as a group, both directly and through distribution, represented 90% of Suttle’s sales in 2016 and 79% in 2015.
Other customers include smaller telephone companies, electrical/low-voltage contractors, home builders, and a nationwide network of distributors. Suttle serves these customers primarily through distributors, but also directly through its sales staff. Sales to cable customers and original equipment manufacturers (OEMs) are made through Suttle’ nationwide network of distributors and through the Suttle sales staff. Sales to OEMs and other distributors were 6% of Suttle’s sales in 2016 and 6% in 2015. Sales to international customers and other customers represented 4% of Suttle’s sales in 2016 and 15% in 2015.
3
Competition
Suttle encounters strong competition in all its product lines and competes primarily on the basis of the broad lines of products offered, product performance, quality, price, delivery, and customer support. In addition, distributors of Suttle’s products also market products for one or more of its competitors.
Order Book
Suttle manufactures its products both on a make-to-order basis and on the basis of customer forecasts. Outstanding customer orders at March 1, 2017 were approximately $3,604,000 compared to approximately $3,828,000 at March 1, 2016. New orders are generally filled within 60 days. Suttle does not believe its order book is a significant indicator of longer term future results.
Manufacturing and Sources of Supply
Suttle manufactures its products using plastic or metal parts, wire sub-assemblies, fasteners, brackets, electronic circuit boards, and other components, most of which are fabricated by Suttle. There are multiple sources of supply for the materials and components and the Company is not dependent upon any single supplier, except that Suttle’s corrosion-resistant products use a moisture-resistant gel-filled fig available only from Tyco Electronics Connectivity. Although Suttle has not generally experienced significant problems in obtaining its required supplies, from time to time it experiences spot shortages and longer order lead times are required from its offshore suppliers.
New Product Development; Patents and Intellectual Property
Suttle continually seeks to understand the needs of its customers and both develops new products for evolving customer requirements and enhances existing products to improve its existing product line. For competitive reasons, including duplication of its designs by foreign apparatus manufacturers, Suttle has adopted a policy to seek patent protection on innovative new products. Suttle applied for five patents in 2015, five patents in 2016 and expects to file two patent applications in 2017.
Research and development consists primarily of designing, prototyping, and testing of equipment and supplies associated with developing new products and enhancing existing products. Research and development costs are expensed when incurred and were $2,596,000 in 2016 compared to $4,959,000 in 2015.
Suttle and Suttle Solutions are important trademarks for its business. Suttle regularly supports these brand names by trade advertising and believes they are well known in the marketplace. Other important trademarks include FutureLinkTM brand for the last mile and MDU solutions; MediaMAXTM panels, modules, jacks and wall plates; SpeedStarTM for passive premise connectivity; and CorroShield® brand gel that prevents network corrosion.
(ii) Transition Networks, Inc.
Transition Networks, Inc., based in Minnetonka, Minnesota, designs, assembles and markets media converters, NIDs, network interface cards (NICs), Ethernet switches, Small Form Factor Pluggable modules (SFP), and other connectivity products under the Transition Networks brand names. Transition sells its products through distributors, resellers, integrators, and OEMs. These media converters, NIDs, and Ethernet Switch products allow network operators to transmit voice and data across networks and between copper-wired and fiber-optic equipment. Sales by Transition Networks were $41,093,000 in 2016 compared to $41,469,000 in 2015. International sales accounted for 20% of Transition’s sales, or $8,406,000 in 2016, compared to $10,617,000, or 26% of Transition’s sales in 2015.
Products
Transition Networks designs, assembles and sells media converter devices, NIDs, Ethernet switches and other connectivity products that make it possible to transmit telecommunications signals across networks and between systems using different types of media (for example, between copper and fiber optic networks). These products assist in resolving challenges in the areas of bandwidth constraints, security risks, and distance limitations as networks extend from local area to wide area networks and adapt to ever increasing end-user demands. As enterprise networks are seemingly always in transition, our solutions enable customers to integrate fiber optics into their existing infrastructure as their networks grow, and extend advanced data services to customers at remote locations, including support of wireless networks and its backhaul requirements. Many of our products incorporate features for performing advanced levels of fault management and other benefits to aid in troubleshooting fiber optic and copper network infrastructure. Our growing Power-over-Ethernet (PoE) products provide support of remote devices such as cameras and wireless access points by passing electrical power along with data on Ethernet cabling, eliminating the need for local power in hard to reach locations.
4
Transition Networks products support a wide variety of protocols, including: 10 Gigabit Ethernet, Gigabit Ethernet, Fast Ethernet, Ethernet, T1/E1, DS3, Circuit Emulation Services (TDM or ISDN over Ethernet or IP), RS232, RS485, OC3, OC12, among others. Transition Networks develops product hardware and software internally, and expenses the related costs as they are incurred. In connection with the sale of its hardware products, Transition Networks provides its customers with a variety of software management options including Element Management System (EMS) software for providing superior service provisioning and monitoring of next-generation Carrier Ethernet 2.0 Services. The Company has been developing and marketing Ethernet-based networking products for approximately 30 years. Transition Networks continues to develop products that address the enterprise, service provider, industrial, government, and security markets.
Manufacturing and Sources of Supply
Transition Networks uses contract manufacturers to manufacture its products in different geographical locations. In 2016, 62% of the total value of its products was manufactured in Asia while the remaining 38% was manufactured in the US. Offshore sources of supply are subject to certain risks, including political risk. The Company has alternate sources of supply for its products in different geographical locations and to date has not had problems obtaining necessary product.
Markets and Marketing
Transition Networks’ products are used in a broad array of markets including the federal government, enterprise, service provider, industrial, and surveillance markets. Transition Networks has a broad customer base and its products are used in a variety of applications.
The media conversion product line is used in several applications. The ION and Point System™ chassis-based modular systems are used primarily in telecommunications closets for high-density applications and when multiple protocols need to be supported. Stand-alone media converters are used typically at a workstation or for lower density applications. The line of Ethernet switches is used in last mile access, backhaul, central closet and at the end-user stations. The Carrier Ethernet NID line of products addresses the high quality access requirements for both business services and wireless backhaul data communications and telecommunications applications.
Marketing primarily consists of direct marketing using a sales force, tradeshows, trade magazine advertising, on-line advertising, website, email, social media and public relations activities. Transition Networks also provides and participates in advertising and cooperative marketing campaigns with distribution partners.
The Company’s “Transition Networks” brand name is important to its business and regularly supports this name with trade advertising and believes it to be well known in the marketplace.
Research and Development
Transition Networks develops products for the federal government, enterprise, service provider, security and industrial markets. This includes developing converters for emerging protocols and existing protocols in new markets, as well as new industry standards. Some of these products include remote management devices built on the IEEE® 802.3AH, 802.3AG, ITU-T Y.1731 standards, Metro Ethernet Forum (MEF)® and MEF 2.0 standards, and Power Over Ethernet devices based on the IEEE® 802.3AF and IEEE® 802.3AT standards. Some design efforts are paced by the development of critical components such as integrated circuits and optical transceivers.
Research and development consists primarily of designing, prototyping, and testing of equipment and supplies associated with developing new products and enhancing existing products. Research and development costs are expensed when incurred and were $2,770,000 in 2016 compared to $2,798,000 in 2015.
5
Transition Networks’ conducts its research and development operations in the United States, at its Minnetonka, Minnesota headquarters location. While this US location has primary engineering and product development responsibility, it will occasionally use third party design services and Original Design Manufacturers (“ODM”) to support specific product design requirements.
Competition
Transition Networks faces strong competition across its entire product line. A large number of competitors exist for high volume products in the Fast Ethernet and Gigabit Ethernet families, as well as the NIDs. Low-cost competitors from China and Taiwan are strongest in (i) Asian, (ii) European, Middle Eastern, and African (“EMEA”) and (iii) South American markets, with limited success in the North American market for the media converter products. Transition Networks also faces new competitors as it enters new markets for industrial products, security market, and higher performance devices for the service provider market.
Order Book
Outstanding customer orders for Transition Networks products were approximately $1,656,000 at March 1, 2017 and $4,485,000 at March 1, 2016. Transition Networks orders are fulfilled on a relatively short-term basis and therefore the Company does not consider the order book as a significant indicator of longer term future results.
(iii) JDL Technologies, Inc.
JDL Technologies, Inc., based in Fort Lauderdale, Florida, is a managed service provider and value-added reseller supplying information technology (“IT”) solutions focused on IT service and support management; network design, deployment and integration; cloud, hosted and virtualized services; and network operations center management. JDL’s 2016 sales were $15,464,000 compared to 2015 sales of $15,672,000. Project revenue totaled $11,854,000 in 2016 or 77% of JDL sales compared to $12,176,000 in 2015 or 78% of JDL sales. Managed service revenues grew to $3,610,000 in 2016 from $3,496,000 in 2015.
Competitive Strategy
The Florida technology market includes a number of managed service providers (“MSPs”) and value-added resellers (“VARs”), and is a microcosm of the burgeoning managed services industry in the U.S. JDL continues to differentiate itself in strategic ways and in early response to market shifts, and is well qualified to help clients optimize their technologies and IT resources in order to meet business objectives and regulatory requirements.
JDL partners with clients to provide complete support for their information technology environments, from servers to applications, to the network, down to the desktop level. Under a typical managed services agreement, JDL maintains corporate IT, resolves issues, supports the client’s user community, and adds new value to the client’s business. JDL’s key avenues for delivering on this commitment—and its competitive advantages—include JDL’s on-premise managed services operations center and secure, state-of-the-art hosted datacenter. The managed services operations center leverages the best available tools, applications, practices and resources to deliver a consistent, quality customer experience. JDL Technologies was named to the 2016 Elite 150 Managed Service Providers in North America, part of The Channel Company’s 2016 MSP 500 list. JDL also holds the MSP Trustmark credential from CompTIA and is a member of the MSP Alliance. JDL’s president and general manager presented a paper at the 2016 MSPWorld Conference hosted by the MSP Alliance.
JDL’s portfolio of technology solutions reflects the regular introduction of new technologies and delivery methodologies and the increasing demand among businesses for innovative solutions to strengthen their competitive edge and address prevailing IT challenges. With its team of professionally certified engineers, more than 475 years of technical experience, and talented leadership, JDL Technologies develops best-of-breed IT solutions that effectively meet these demands. As an example, in 2016 the company’s flagship service for healthcare, HIPAA FastTrack, earned an Information Security award for Innovation in Compliance. To sustain its leading-edge position, JDL also maintains robust partnerships with strategic manufacturers and is a 3CX VoIP Gold Partner, HP Enterprise Gold Partner, Microsoft Gold Partner, eMDs Solution Provider and Citrix Solutions Service Provider.
6
Targeted Vertical Markets
In 2016, JDL Technologies aggressively targeted its primary vertical markets, healthcare and commercial business, through its JDL HealthTechTM and JDL TechWatchTM brands.
Healthcare:
Under the JDL HealthTech brand, JDL continues to penetrate the $1.3 billion healthcare market in Florida, offering an array of services that address HIPAA Security Rule and Privacy Rule compliance requirements, including its flagship cloud-based service, HIPAA FastTrack. JDL’s robust and growing managed services practice supports clients ranging from single-office providers, to multi-location regional specialists, to their regulated suppliers and business associates. A sampling includes:
| - | A national provider of healthcare staffing services and software with locations across the U.S. |
| - | A thriving medical and therapeutic services provider with 15 locations in the Atlanta area |
| - | A pharmaceutical manufacturing and biotesting firm with 900 employees in the U.S. |
Commercial:
JDL Technologies continues to build a solid roster of diverse commercial clients under its JDL TechWatch brand, delivering substantial growth in 2016 in recurring revenues from managed services as well as incremental revenues from additional project work. A sampling of these clients includes:
| - | The largest private international bank in South America |
| - | Several of the largest private investment firms in Florida |
| - | A 60-year-old, well-funded non-profit organization with 19 locations in the continental U.S. |
| - | A Florida personal injury law firm that has won more than $45 million in settlements |
| - | A large family-owned tobacco corporation headquartered in Florida since 1962 |
Education:
JDL Technologies continues to support a multi-year project to provide wireless network services and datacenter upgrades for several hundred public K-12 schools in Florida. The education vertical remains an important element of JDL’s overall market strategy.
Technology Solutions
As a managed service provider and value-added reseller, JDL Technologies specializes in delivering technology solutions that free organizations to focus on the strategic business activities that are critical to their financial success. JDL’s technology solutions encompass an extensive range of networking, virtualization, cloud and infrastructure services, most of which are available under JDL managed services contracts. As technology continues its move to the cloud, JDL aggressively markets its portfolio of cloud-based service offerings to healthcare and commercial business. Its HIPAA FastTrack and Security FastTrack services, provided in the JDL Cloud powered by Citrix, have won awards for product innovation, just as JDL Technologies has been recognized in the industry as a leading Managed Service Provider. JDL engineers are trained and certified in the newest cloud and other technology solutions.
Managed Services:
JDL Technologies continues to expand in breadth and depth as a managed service provider, significantly growing its recurring revenues each year since establishing the program in early 2013. JDL serves a diverse base of clients with locations throughout the United States, offering managed service programs designed specifically for the healthcare and commercial markets. These robust programs meet HIPAA compliance standards and, while the majority of clients are supported remotely, independent of geographic borders, JDL is also able to provide on-site network management and help desk support for key enterprise clients in South Florida. JDL’s managed services include network management, availability assurance, event alerting and incident management services; server, workstation, mobile device and other asset management services; security services including software patching, firewall, antivirus, antimalware and intrusion detection and prevention services; help desk support for client users; SIP trunking, voice over IP and office management services; migration, conversion and vendor management; and technical consulting services and training.
7
Cloud Solutions:
After building its portfolio of cloud service offerings in 2015, JDL has aggressively marketed these services in the healthcare and commercial verticals. Wireless as a service, infrastructure as a service, and Citrix as a service (sold as JDL FastTrack) are among the most popular cloud offerings, with others including backup, storage, voice over IP, firewall and email as cloud or hosted services. The benefits to clients are numerous and include vertical and horizontal scalability, internal bandwidth conservation, and simplification of IT management within client organizations, while JDL benefits from substantial economies of scale and standardization. All JDL cloud offerings are billable as monthly recurring revenue under its managed service model, and JDL is committed to bringing the benefits of cloud services to all clients.
Network Services:
JDL’s roots are in network services, and these services remain central to its role as a managed service provider and value-added reseller. The JDL team has extensive experience and professional certifications in assessing, designing and implementing wired and wireless networks as well as entire technology infrastructures. Networking services also include MPLS, private line and IP communications, network and endpoint security, network tuning and cabling/wiring services. Two large clients are actively leveraging JDL wireless services. The most recent, a pharmaceutical manufacturing and biotesting firm, has deployed wireless as a service in 18 locations across the U.S.
Virtualization:
Using virtualization across an organization’s IT environment delivers greater agility, mobility and efficiency. JDL’s virtualization engineers assess, design, deploy, and manage virtualization programs that ensure user access to any workload, anytime, anywhere, on any device. JDL’s virtualization services encompass desktops, servers, applications, storage, and any combination thereof, including connectivity and software licensing. As JDL clients continue to adopt virtualization, they experience the economies of scale, reduced capital requirements, enhanced security, and disaster recovery protections that are inherent in virtualized environments.
Order Book
Outstanding customer orders and contracts for JDL products and services were approximately $4,132,000 at March 1, 2017 and $6,009,000 at March 1, 2016. The Company does not consider current outstanding orders and contracts as a significant indicator of longer term future results.
(iv) Net2Edge
Net2Edge Limited, based in Basingstoke, Hampshire, United Kingdom, designs, manufactures and markets Carrier Ethernet based Network Access Devices and software under the Liberator™ brand name. Net2Edge™ operates a direct touch sales model and also Markets its products through approved partners and integrators. Net2Edge’s physical products allow network operators to transmit packetized voice and data across networks and between copper-wired and fiber-optic equipment. Software based products currently being developed will launch Net2Edge in to the Software Defined Networking (“SDN”) area and associated Network Function Virtualization (“NFV”) markets. Sales by Net2Edge were $1,873,000 in 2016 and $1,353,000 in 2015.
Products
Net2Edge designs, assembles and sells Ethernet based switches based around the international MEF standards. Those products range from legacy over packet interfaces such as Serial, TDM or ISDN and Native Ethernet from 1G to 10G and beyond. The products are targeted at the telecommunications service providers as Network Interface Devices. By design, the products transmit data from the subscriber enterprise to the provider edge, usually a router. The products are sophisticated, carrying multiple services with definable quality of service metrics over fiber optic paths. These products assist in resolving challenges in the areas of bandwidth constraints, security risks, and distance limitations as networks extend from local area to wide area networks and adapt to ever increasing end user demands. As enterprise networks are seemingly always in transition, our solutions enable customers to integrate multiple services into their existing infrastructure. All Net2Edge products incorporate features for performing advanced levels of fault management and automated provisioning minimizing the administrative burden of the operator.
8
The physical products are further enhanced by software development that will break down the relationship between specialized hardware and the variety of services that can be delivered. This initiative will allow the virtualization of services such as routing and firewalls, providing the operator with freedom of service offered without the need to visit the subscriber’s premise.
Net2Edge products support a wide variety of protocols, including: 10 Gigabit Ethernet, Gigabit Ethernet, Fast Ethernet, Ethernet, T1/E1, DS3, Circuit Emulation Services (TDM or ISDN over Ethernet or IP), RS232, RS485, OC3, OC12, and more. Net2Edge develops product hardware and software internally, and expenses the related costs as they are incurred. In connection with the sale of its hardware products, Net2Edge provides its customers with a variety of software management options including Element Management System (“EMS”) software for providing superior service provisioning and monitoring of next-generation Carrier Ethernet 2.0 Services.
Manufacturing and Sources of Supply
Net2Edge uses contract manufacturers to manufacture its products in the UK. Because some of Net2Edge’s offshore sources of supply are subject to risks, including political, communication and logistic risk, when possible, Net2Edge takes steps to ensure it has multiple suppliers to ensure business continuity.
Markets and Marketing
Net2Edge products are used in a broad array of market sectors including the Government, Enterprise, Utility, Industrial, and Surveillance markets, but as service subscribers to a service provider. Net2Edge has a growing international customer base outside the United Kingdom and customers use its products in a variety of applications.
Net2Edge’s marketing primarily consists of direct marketing using a sales force, tradeshows, trade magazine advertising, on-line advertising, website, email, social media and public relations activities. Net2Edge also provides and participates in advertising and cooperative marketing campaigns with its partners.
The Company’s “Net2Edge” brand name is important to its business. The Company regularly supports this brand name by trade advertising and intends for it to become well known in the marketplace.
Research and Development
Net2Edge develops products for the service provider market including products for emerging protocols and existing protocols in new markets, as well as new industry standards. These products include remote management devices built on the IEEE® 802.3AH, 802.3AG, ITU-T Y.1731 standards, Metro Ethernet Forum (“MEF”)® and MEF 2.0 standards. Some design efforts are paced by the development of critical components such as integrated circuits, System On Chip (“SOC”) silicon and optical transceivers.
Research and development consists primarily of designing, prototyping, testing equipment and supplies associated with enhancing existing products and developing new products. Research and development costs are expensed when incurred and were $621,000 in 2016 and $588,000 in 2015.
Net2Edge conducts its research and development operations out of its Basingstoke, United Kingdom headquarters location. While this UK location has primary engineering and product development responsibility, Net2Edge will occasionally use third party design services and Original Design Manufacturers (“ODM”) to support specific product design requirements.
Competition
Net2Edge faces strong competition across its entire product line. A large number of competitors exist for high volume products. There are low cost competitors from China and Taiwan and established competitors from the USA and Canada. Net2Edge competently competes from a portfolio and specialized development perspective.
9
(2) Employment Levels
As of March 1, 2017 the Company employed 398 people. Of this number, 227 were employed by Suttle (including 71 in Minnesota and 156 in Costa Rica), 93 by Transition Networks, Inc., 19 by Net2Edge in the U.K., 38 by JDL Technologies, Inc., and 21 corporate general and administrative positions. As noted above, in January 2017, the Company announced it was closing the Suttle Costa Rica production facility and consolidating production into its Minnesota facilities.
(3) Executive Officers of Registrant
The executive officers of the Company and their ages at March 1, 2017 are set forth below. See Item 9B of this Form 10-K for additional information on the Company’s management.
| Name | Age | Position1 | ||||
| Roger H.D. Lacey | 66 | Vice-Chairman of the Board and Chief Executive Officer [2014]2 | ||||
| Mark D. Fandrich | 55 | Vice President, Treasurer and Chief Financial Officer [2016]3 | ||||
| Bruce Blackwood | 54 | General Manager, Suttle, Inc. [2007]4 | ||||
| Scott Otis | 55 | General Manager, Transition Networks, Inc. [2013]5 | ||||
| Scott Fluegge | 47 | President and General Manager, JDL Technologies, Inc [2011]6 | ||||
| Kristin A. Hlavka | 35 | Corporate Controller [2011]8 | ||||
| 1 | Dates in brackets indicate year in which officers began serving in such capacity. Executive officers serve at the pleasure of the Board of Directors. |
| 2 | Mr. Lacey has been a director of the Company since 2008, was appointed Vice Chair in September 2013, and was appointed Interim Chief Executive Officer in June 2014. On February 27, 2015 he was appointed as the Company’s Chief Executive Officer. Mr. Lacey was Senior Vice President of Strategy and Corporate Development for 3M Corporation from 2009 until his retirement in 2013. In addition, from 2000 until his retirement, he was 3M Corporation’s Chief Strategy Officer and head of mergers and acquisitions. |
| 3 | Mr. Fandrich was appointed Chief Financial Officer in August 2016. From July 2015 to August 2016, he served as Vice President of Finance of Suttle, Inc.. From April 2004 to July 2015, he was Corporate Controller for The Bergquist Company, a global supplier of thermal interface material. |
| 4 | Mr. Blackwood has served as General Manager of Suttle since December 2007. From July 2001 to November 2007 he served as Suttle’s Vice President of Sales. |
| 5 | Mr. Otis was appointed General Manager of Transition Networks in September 2013. From December 2010 to June 2011 he served as Vice President, Operations - Professional Services for TE Connectivity, Inc. Prior to December 2010, he was the Vice President, Marketing and Business Development – ADC Professional Services. |
| 6 | Mr. Fluegge was appointed Vice President and General Manager of JDL Technologies in December 2011, and was named President and General Manager in September 2013. Prior to this, he was the Vice President of Workload Automation at GSS AMERICA / GSS INFOTECH / INFOSPECTRUM CONSULTING. |
10
| 7 | Ms. Hlavka was appointed Corporate Controller in May 2011. From July 2008 to April 2011, she served as the Assistant Corporate Controller. Prior to July 2008, she was an auditor for Deloitte and Touche LLP. |
(d) FINANCIAL INFORMATION ABOUT FOREIGN AND DOMESTIC OPERATIONS AND EXPORT SALES
Financial information about domestic and foreign operations and export sales may be obtained by reference to Note 12 of the “Notes to Consolidated Financial Statements” under Item 8 herein.
| ITEM 1A. | RISK FACTORS |
Forward Looking Statements
Certain statements contained in this Annual Report on Form 10-K are “forward-looking” statements within the meaning of and in reliance on the Private Securities Litigation Reform Act of 1995, which provides a “safe harbor” for forward-looking statements. Actual events and results may differ materially from those expressed or forecasted in forward-looking statements due to a number of factors. The principal important risk factors that could cause our actual performance and future events and actions to differ materially from these forward-looking statements include, but are not limited to, the risk factors discussed below.
Risks Related to Our Business
The primary markets we serve are highly competitive, and our ability to compete requires continual focus on delivering high-quality, competitively priced products and services and the regular introduction of new products and services that meet evolving customer requirements.
Competition in the markets for voice and data communications products is intense. Our ability to compete with other manufacturers of these products depends primarily on our engineering, manufacturing and marketing skills; the price, quality and reliability of our products; our delivery and service capabilities; and our control of operating expenses. Our JDL subsidiary also experiences intense competition from other providers of IT products and services. We have experienced, and anticipate continuing to experience, pricing pressures from our customers as well as our competitors. The markets we serve are characterized by rapid technological advances and evolving industry standards. These markets can be significantly affected by new product introductions and marketing activities of industry participants. Some of our competitors and potential competitors have greater financial, technological, manufacturing, marketing, and personnel resources than we. Present and future competitors may be able to identify new markets and develop new products that are superior to those developed by us. They may also adapt new technologies faster, devote greater resources to research and development, promote products more aggressively, and price products more competitively than we. We cannot ensure that competition will not intensify or that we will be able to compete effectively in the markets in which we compete.
Our gross margins have declined in recent years, and we face many challenges in maintaining acceptable margins.
Gross margins among our products and services vary and are subject to fluctuation from quarter to quarter. The factors that may affect our gross margins adversely are numerous and include:
| ● | Changes in customer, geographic, or product mix; |
| ● | Our ability to reduce product costs |
| ● | Increases in material or labor costs |
| ● | Expediting costs incurred to meet customer delivery requirements |
| ● | Excess inventory and inventory carrying charges |
11
| ● | Obsolescence charges |
| ● | Changes in shipment volume |
| ● | Changes in component pricing |
| ● | Increased price competition |
| ● | Changes in distribution channels |
| ● | Lower margins on competitive-bid contracts |
| ● | Increased warranty cost and |
| ● | Our ability to manage the impact of foreign currency exchange rate fluctuations. |
Consolidation among our customers has occurred and further consolidation may occur, resulting in the loss of some customers and reducing revenue during the pendency of business combinations and related integration activities.
We believe future consolidation may occur among our customers as they attempt to increase market share and achieve greater economies of scale. Consolidation has affected our business as our customers focus on completing business combinations and integrating their operations. In some instances, customers integrating large-scale acquisitions have reduced their purchases of our products as they integrate.
The business impact to us of significant customer mergers is likely to be unclear until sometime after these transactions are completed. After a consolidation occurs, a customer may choose to reduce the number of vendors from which it purchases equipment and may choose one of our competitors as its preferred vendor. We cannot ensure that we will continue to supply equipment to the surviving communications service provider after a business combination is completed.
Our financial results could be adversely affected if one or more of our key customers substantially reduces orders for our products.
Traditionally, we have derived a large portion of our revenues from a relatively small number of customers, with our top ten customers accounting for 68%, 67% and 72% of net sales for 2016, 2015 and 2014, respectively. In fiscal 2016, 2015, and 2014, one Suttle customer accounted for approximately 12%, 16% and 33% of consolidated sales, respectively. In fiscal 2016 and 2015, a JDL customer accounted for 11% and 11% of our consolidated sales, respectively. The loss of or a substantial reduction in purchases by any one or more of our top customers could have a material adverse effect on our business, financial position and results of operations.
Our market is subject to rapid technological change and, to compete effectively, we must continually introduce new products that achieve market acceptance.
The communications equipment industry is characterized by rapid technological changes, evolving industry standards, changing market conditions, short product life cycles, rapidly changing customer requirements, and frequent new product and service introductions and enhancements. The introduction of products using new technologies or the adoption of new industry standards can make our existing products, or products under development, obsolete or unmarketable. Our future success will depend on our ability to enhance our existing products, to introduce new products to meet changing customer requirements and emerging technologies, and to demonstrate the performance advantages and cost-effectiveness of our products over competing products. Our failure to modify our products to support new alternative technologies or failure to achieve widespread customer acceptance of these modified products could cause us to lose market share and cause our revenues to decline.
We may not predict technological trends or the success of new products in the communications equipment market accurately. New product development often requires forecasting of market trends, development and implementation of new technologies and processes and substantial capital commitments. We do not know whether other new products we develop will gain market acceptance or result in profitable sales.
Some competitors have greater engineering and product development resources. Although we expect to continue to invest significant resources in product development activities, our efforts to achieve and maintain profitability will require us to be selective and focused with our research and development expenditures. If we fail to anticipate or respond in a cost-effective and timely manner to technological developments, changes in industry standards or customer requirements, or if we experience any significant delays in product development or introduction, our business, operating results and financial condition could be affected adversely.
12
We may experience delays in developing and marketing product enhancements or new products that respond to technological change, evolving industry standards and changing customer requirements. We cannot ensure that we will not experience difficulties that could delay or prevent the successful development, introduction, and marketing of these products or product enhancements, or that our new products and product enhancements will adequately meet the requirements of the marketplace and achieve any significant or sustainable degree of market acceptance in existing or additional markets. In addition, the future introductions or announcements of products by us or one of our competitors embodying new technologies or changes in industry standards or customer requirements could render our then-existing products obsolete or unmarketable. We cannot ensure that the introduction or announcement of new product offerings by us or one or more of our competitors will not cause customers to defer their purchase of our existing products, which could cause our revenues to decline.
Our business units are dependent upon federal government spending.
Our JDL Technologies and Transition Networks business units are involved in projects that receive much of their funding from the United States federal government. To the extent that federal government spending is delayed or curtailed by government actions, our revenues and operating results may be adversely affected.
We evaluate and frequently pursue acquisitions, but we may not successfully close these acquisitions and, if these acquisitions are completed, we may have difficulty integrating the acquired businesses with our existing operations.
We regularly consider the acquisition of complementary companies and product lines. We cannot, however, ensure that we will be able to find appropriate candidates for acquisitions, reach agreement to acquire them, or obtain any required shareholder or regulatory approvals needed to close strategic acquisitions, despite the effort and management attention invested.
The impact of future acquisitions on our business, operating results and financial condition is uncertain. In the case of businesses we may acquire in the future, we may have difficulty assimilating these businesses and their products, services, technologies and personnel into our operations. These difficulties could disrupt our ongoing business, distract our management and workforce, increase our expenses and materially adversely affect our operating results and financial condition. Also, we may not be able to retain key management and other critical employees after an acquisition. We may also acquire unanticipated liabilities. In addition to these risks, we may not realize all of the anticipated benefits of these acquisitions.
Our operating results fluctuate from quarter to quarter.
Our operating results are difficult to predict and may fluctuate significantly from quarter to quarter. Fluctuations in our quarterly operating results may be caused by many factors, including the following:
| ● | the volume of customer orders and our ability to fulfill those orders in a timely manner |
| ● | the overall level of capital expenditures by our customers |
| ● | work stoppages and other developments affecting the operations of our customers |
| ● | the timing of and our ability to obtain new customer contracts |
| ● | the timing of revenue recognition |
| ● | the timing of new product and service introductions |
| ● | the availability of products and services |
| ● | market acceptance of new and enhanced versions of our products and services |
| ● | variations in the mix of products and services we sell |
13
| ● | the timing of federal and state government funding of projects |
| ● | the location and utilization of our production capacity and employees and |
| ● | the availability and cost of key components of our products. |
Our expense levels are based in part on expectations of future revenues. If revenue levels in a particular quarter are lower than expected, our operating results will be affected adversely.
We depend on manufacturing relationships and on limited-source suppliers and any disruptions in these relationships may cause damage to our customer relationships.
We procure all parts and certain services involved in the production of our products from, and subcontract much of our product manufacturing to outside firms that specialize in these services. Although most of the components of our products are available from multiple vendors, we have several single-source supplier relationships, either because alternative sources are not available or because the relationship is advantageous to us. We cannot ensure that our suppliers will be able to meet our future requirements for products and components in a timely fashion. In addition, the availability of many of these components to us is dependent in part on our ability to provide our suppliers with accurate forecasts of our future requirements. Delays or lost sales could be caused by other factors beyond our control, including defects in the quality of components or products supplied by others.
We are dependent upon our senior management and other critical employees.
Like all companies, our success is dependent on the efforts and abilities of our senior management personnel and other critical employees, including those in sales, marketing and product development functions. Our ability to attract, retain and motivate these employees is critical to our success. In addition, because we may acquire one or more businesses in the future, our success may depend, in part, upon our ability to retain and integrate our own personnel with personnel from acquired entities that are necessary to the continued success or the successful integration of the acquired businesses.
Managing our inventory is complex and may include write-downs of excess or obsolete inventory.
Managing our inventory of components and finished products is complicated by a number of factors, including the need to maintain a significant inventory of finished goods for orders we anticipate but may not be received. These issues may cause us to purchase and maintain significant amounts of inventory. If this inventory is not used as expected based on anticipated requirements, it may become excess or obsolete. The existence of excess or obsolete inventory can result in sales price reductions or inventory write-downs, which could adversely affect our business and results of operations.
We face risks associated with expanding our sales outside of the United States.
We believe that our future growth depends in part upon our ability to increase sales in international markets. These sales are subject to a variety of risks, including fluctuations in currency exchange rates, tariffs, import restrictions and other trade barriers, unexpected changes in regulatory requirements, longer accounts receivable payment cycles, potentially adverse tax consequences, and export license requirements. In addition, we are subject to the risks inherent in conducting business internationally, including political and economic instability and unexpected changes in diplomatic and trade relationships. We cannot ensure that one or more of these factors will not have a material adverse effect on our business strategy and financial condition.
Goodwill impairment could adversely affect our net income and shareholders’ equity
We are required to test goodwill for impairment annually and between annual tests if events or circumstances indicate that it is more likely than not that the fair value of a reporting unit is less than its carrying amount. We perform our annual impairment test as of April 1 each year. Various risks may cause the fair value of a reporting unit to fall below its carrying amount; these risks could lead to the measurement and recognition of a goodwill impairment. At December 31, 2016, we had recorded goodwill of $1.46 million from our JDL Technologies’ acquisition of Twisted Technologies in June 2015. If JDL Technologies fails to achieve the future revenue and gross margin levels that we expect, we may be forced to recognize a non-cash impairment with respect to the carrying value of this goodwill.
14
Our failure to achieve and maintain effective internal controls could limit our ability to detect and prevent fraud and thereby adversely affect our business and stock price.
We have incurred, and expect to continue to incur, significant continuing costs, including accounting fees and staffing costs, to maintain compliance with the internal control requirements of the Sarbanes-Oxley Act of 2002. Expansion of our business, particularly internationally, would require ongoing changes to our internal control systems, processes and information systems. In addition, if we complete future acquisitions, our ability to integrate operations of the acquired company could affect our continued compliance with the internal control requirements of the Sarbanes-Oxley Act.
We maintain effective internal controls to generate reliable financial reports. All internal control systems, no matter how well designed, have inherent limitations. Even those systems determined to be effective can provide only reasonable assurance with respect to the consolidated financial system preparation and presentation. Our inability to maintain an effective control environment may cause investors to lose confidence in our reported financial information, which could in turn have a material adverse effect on our stock price. While reviewing our internal controls over financial reporting for the year ended December 31, 2016, we determined we had a material weakness as in internal controls related to segregation of duty conflicts. In conducting this review, we also determined that these same segregation of duty conflicts were substantially present at December 31, 2015. Therefore, we have concluded that a material weakness in our internal controls over financial reporting also existed at December 31, 2015. We also determined we had a material weakness in internal controls over financial reporting due to our failure to review, in sufficient detail, our analysis and the basis for our conclusion that our goodwill was not impaired. See Item 9A for further details.
Product defects or the failure of our products to meet specifications could cause us to lose customers and revenue or to incur unexpected expenses.
If our products do not meet our customers’ performance requirements, our customer relationships may suffer. Also, our products may contain defects or fail to meet product specifications. Any failure or poor performance of our products could result in:
| ● | delayed market acceptance of our products |
| ● | delayed product shipments |
| ● | unexpected expenses and diversion of resources to replace defective products or identify and correct the source of errors |
| ● | damage to our reputation and our customer relationships |
| ● | delayed recognition of sales or reduced sales, and |
| ● | product liability claims or other claims for damages that may be caused by any product defects or performance failures. |
Our sales and operations may continue to be impacted adversely by current global economic conditions.
Over the past several years, financial markets globally have experienced periods of extreme disruption. These have included, among other things, extreme volatility in securities prices, severely diminished liquidity and credit availability, ratings downgrades of some investments and declining valuations of others. The frequency, severity and duration of these disruptions in the financial markets and the global economy are unknown. We cannot ensure that there will not be a further deterioration in financial markets and in business conditions generally. These economic developments have adversely affected our business in a number of ways and will likely continue to adversely affect our business during the foreseeable future.
Risks Related to Our Common Stock
Our stock price has been volatile historically and the price of our common stock may fluctuate significantly in the future.
The trading price of our common stock has been and may continue to be subject to wide fluctuations. Our stock price may fluctuate in response to a number of events and factors, such as quarterly variations in operating results, announcements of technological innovations or new products by us or our competitors, the operating and stock price performance of other companies that investors may deem comparable to us, and new reports relating to trends in our markets or general economic conditions.
15
In addition, the stock market in general, and prices for companies in our industry in particular, have experienced extreme volatility that often has been unrelated to the operating performance of these companies. These broad market and industry fluctuations may adversely affect the price of our common stock, regardless of our operating performance.
Anti-takeover provisions in our charter documents, our shareholder rights agreement and Minnesota law could prevent or delay a change in control of our company.
Provisions of our articles of incorporation and bylaws, our shareholder rights agreement (also known as a “poison pill”) and Minnesota law may discourage, delay or prevent a merger or acquisition that a shareholder may consider favorable, and could limit the price that investors are willing to pay for our common stock. These provisions include the following:
| ● | advance notice requirements for shareholder proposals |
| ● | authorization for our Board of Directors to issue preferred stock without shareholder approval |
| ● | authorization for our Board of Directors to issue preferred stock purchase rights upon a third party’s acquisition of 16.5% or more of our outstanding shares of common stock; |
| ● | limitations on business combinations with interested shareholders and |
| ● | a super majority vote by shareholders is required to approve certain corporate actions, including merger transactions. |
Some of these provisions may discourage a future acquisition of our company even though our shareholders would receive an attractive value for their shares, or a significant number of our shareholders believe such a proposed transaction would be in their best interest.
The payment and amount of future dividends is subject to Board of Director discretion and to various risks and uncertainties.
The payment and amount of future quarterly dividends is within the discretion of the Board of Directors and will depend on factors the Board deems relevant at the time declaration of a dividend is considered. These factors include, but are not limited to: available cash; management’s expectations regarding future performance and free cash flow; alternative uses of cash to fund R&D expenditures and capital expenditures required to fund future growth; and, the effect of various risks and uncertainties described in this “Risk Factors” section.
| ITEM 1B. | UNRESOLVED STAFF COMMENTS |
None.
| ITEM 2. | PROPERTIES |
CSI conducts administrative, manufacturing and engineering functions at the following facilities:
| - | In Minnetonka, Minnesota, the Company owns a 105,000 square foot building where its executive and administrative offices are located. In addition, Transition Networks uses this facility for its warehouse, assembly, engineering and administrative operations, JDL Technologies. uses this facility for some administrative operations, and Suttle uses this facility for its sales, marketing and product development. |
| - | Suttle’s manufacturing is conducted at two locations. At Hector, Minnesota, the Company owns three buildings totaling 109,000 square feet of manufacturing space. The Company leases 40,000 square feet of manufacturing space in San Jose, Costa Rica. |
| - | Net2Edge leases 5,500 square feet of office space in the U.K. for its Transition Networks, EMEA operations. |
16
CSI believes these facilities will be adequate to accommodate its administrative, manufacturing and distribution needs for the foreseeable future.
| ITEM 3. | LEGAL PROCEEDINGS |
The Company is subject to claims and lawsuits that have been filed in the ordinary course of business. From time to time, the Company brings suit against others to enforce contract rights or property rights, or to collect debts in the ordinary course of business. Management believes that the resolution or settlement of any pending litigation will not have a material adverse effect on the results of operations or liquidity of the Company.
| ITEM 4. | MINE SAFETY DISCLOSURES |
Not applicable.
PART II
| ITEM 5. | MARKET FOR REGISTRANT’S COMMON EQUITY AND RELATED STOCKHOLDER MATTERS AND ISSUER PURCHASE OF EQUITY SECURITIES |
(a) MARKET INFORMATION
The Company’s common stock trades on the NASDAQ under the trading symbol JCS.
The table below presents the price range of high and low trades of the Company’s common stock for each quarterly period indicated as reported by NASDAQ for 2016 and 2015.
| 2016 | 2015 | ||||||||||||||||
| High | Low | High | Low | ||||||||||||||
| First | $ | 8.16 | $ | 5.56 | $ | 12.40 | $ | 10.08 | |||||||||
| Second | 7.49 | 6.06 | 11.78 | 10.40 | |||||||||||||
| Third | 7.42 | 4.63 | 10.86 | 8.13 | |||||||||||||
| Fourth | 5.40 | 3.41 | 9.22 | 7.25 | |||||||||||||
(b) HOLDERS
At March 1, 2017 there were approximately 562 registered holders of record of Communications Systems, Inc. common stock.
(c) DIVIDENDS
Communications Systems, Inc. paid regular quarterly dividends to its shareholders on the dates and at the rates indicated below:
| Payment Date | Dividend per Share | |||
| January 1, 2017 | $ | .04 | ||
| October 1, 2016 | .04 | |||
| July 1, 2016 | .16 | |||
| April 1, 2016 | .16 | |||
| January 1, 2016 | .16 | |||
| October 1, 2015 | .16 | |||
| July 1, 2015 | .16 | |||
| April 1, 2015 | .16 | |||
| January 1, 2015 | .16 | |||
17
The payment of future dividends will be determined at the discretion of the Board of Directors.
(d) INFORMATION REGARDING EQUITY COMPENSATION PLANS
The following table presents information about the Company’s equity compensation plans, under which equity securities of the Company are authorized for issuance, as of December 31, 2016:
Securities Authorized for Issuance Under Equity Compensation Plans
| Number of shares | Number of shares of | |||||||||
| of common stock | common stock remaining | |||||||||
| to be issued upon | available for future | |||||||||
| exercise of | Weighted-average | issuance under equity | ||||||||
| outstanding | exercise price of | compensation plans | ||||||||
| options, warrants | outstanding options | (excluding shares in | ||||||||
| Plan Category (1) | and rights | warrants and rights | column (a)) | |||||||
| Equity compensation plans approved by security holders: | ||||||||||
| 1992 Stock Plan-Employee Plan | 10,230 | $ | 14.15 | — | ||||||
| 1992 Stock Plan-Nonemployee Director Plan | 63,000 | $ | 10.82 | — | ||||||
| 1990 Employee Stock Purchase Plan | 6,156 | $ | 3.94 | 76,865 | ||||||
| 2011 Executive Incentive Compensation Plan | 1,026,094 | $ | 9.87 | 836,323 | ||||||
| Equity compensation plans not approved by security holders: | ||||||||||
| None | ||||||||||
| (1) | The Company does not have individual compensation arrangements involving the grant of options, warrants and rights. |
| (e) | FIVE YEAR PERFORMANCE GRAPH |
The following graph presents, at the end of each of the Company’s last five fiscal years, the cumulative total return on the common stock of the Company as compared to the cumulative total return reported for the NASDAQ (U.S.), and the NASDAQ Telecommunications Index. Company information and each index assume the investment of $100 on the last business day before January 1, 2011 and the reinvestment of all dividends.
18
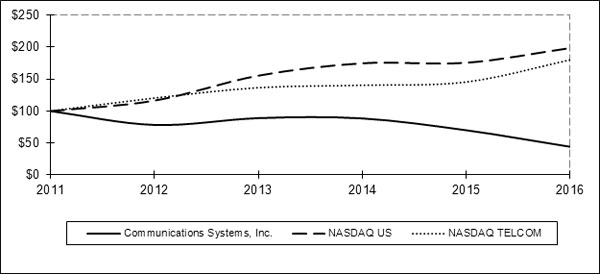
Comparison of Five-Year Cumulative Total Return
| Company or Index | 2011 | 2012 | 2013 | 2014 | 2015 | 2016 | ||||||||||||||||||
| Communications Systems, Inc. | $ | 100.000 | $ | 78.335 | $ | 88.999 | $ | 88.544 | $ | 70.022 | $ | 44.305 | ||||||||||||
| NASDAQ US | 100.000 | 100.312 | 116.793 | 155.899 | 175.326 | 176.169 | ||||||||||||||||||
| NASDAQ TELCOM | 100.000 | 105.626 | 127.317 | 144.379 | 148.323 | 153.652 | ||||||||||||||||||
(f) RECENT SALES OF UNREGISTERED SECURITIES
Not applicable.
(g) PURCHASES OF EQUITY SECURITIES BY THE ISSUER AND AFFILIATED PURCHASERS
During the three months ended December 31, 2016 the Company repurchased shares of stock as follows:
ISSUER PURCHASES OF EQUITY SECURITIES
| Period | Total Number of Shares (or Units) Purchased (1) | Average Price Paid per Share (or Unit) | Total Number of Shares (or Units) Purchased as Part of Publicly Announced Plans or Programs | Maximum Number (or Approximate Dollar Value) of Shares (or Units) that May Yet Be Purchased Under the Plans or Programs (2) | ||||||||||||
| October 2016 | — | $ | — | — | 411,910 | |||||||||||
| November 2016 | 281 | 4.28 | — | 411,910 | ||||||||||||
| December 2016 | — | — | — | 411,910 | ||||||||||||
| Total | 281 | $ | 4.28 | — | 411,910 | |||||||||||
| (1) | The shares in this column represent shares that were surrendered to us by plan participants to satisfy withholding tax obligations related to share-based compensation. |
| (2) | Shares represent remaining amount of a 500,000 share repurchase authorization approved by the Company’s Board in October 2008 and publicly announced in November 2008. |
19
| ITEM 6. | SELECTED FINANCIAL DATA |
The following selected financial data has been derived from our consolidated financial statements and should be read in conjunction with the Consolidated Financial Statements and related notes thereto set forth in Item 8 and with “Management’s Discussion and Analysis of Financial Condition and Results of Operations” included in Item 7 of this Annual Report on Form 10-K.
COMMUNICATIONS SYSTEMS, INC. AND SUBSIDIARIES
SELECTED FINANCIAL INFORMATION
(in thousands, except per share amounts)
| Year Ended December 31 | ||||||||||||||||||||
| 2016 | 2015 | 2014 | 2013 | 2012 | ||||||||||||||||
| Selected Income Statement Data | ||||||||||||||||||||
| Sales | $ | 99,353 | $ | 107,670 | $ | 119,071 | $ | 131,320 | $ | 104,250 | ||||||||||
| Costs and Expenses: | ||||||||||||||||||||
| Cost of sales | 72,771 | 76,123 | 76,913 | 86,421 | 62,753 | |||||||||||||||
| Selling, general and administrative expenses | 35,186 | 40,830 | 38,628 | 36,743 | 38,101 | |||||||||||||||
| Additional minimum pension liability adjustments1 | (4,148 | ) | — | — | — | — | ||||||||||||||
| Pension settlement costs | — | 1,222 | — | — | — | |||||||||||||||
| Impairment loss | — | — | — | 5,850 | — | |||||||||||||||
| Restructuring expense | — | — | 238 | 1,149 | — | |||||||||||||||
| Total Costs and Expenses | 103,809 | 118,175 | 115,779 | 130,163 | 100,854 | |||||||||||||||
| Operating (Loss) Income | (4,456 | ) | (10,505 | ) | 3,292 | 1,157 | 3,396 | |||||||||||||
| Other (Expense) Income, Net1 | (3,400 | ) | 104 | (112 | ) | (53 | ) | 2 | ||||||||||||
| (Loss) Income Before Income Taxes | (7,856 | ) | (10,401 | ) | 3,180 | 1,104 | 3,398 | |||||||||||||
| Income Tax (Benefit) Expense | 257 | (753 | ) | 1,219 | 2,061 | 1,160 | ||||||||||||||
| Net (Loss) Income | $ | (8,113 | ) | $ | (9,648 | ) | $ | 1,961 | $ | (957 | ) | $ | 2,238 | |||||||
| Basic Net (Loss) Income Per Share | $ | (0.92 | ) | $ | (1.11 | ) | $ | 0.23 | $ | (0.11 | ) | $ | 0.26 | |||||||
| Diluted Net (Loss) Income Per Share | $ | (0.92 | ) | $ | (1.11 | ) | $ | 0.23 | $ | (0.11 | ) | $ | 0.26 | |||||||
| Cash Dividends Declared Per Share | $ | 0.40 | $ | 0.64 | $ | 0.64 | $ | 0.64 | $ | 0.64 | ||||||||||
| Average Diluted Shares Outstanding | 8,832 | 8,720 | 8,640 | 8,531 | 8,519 | |||||||||||||||
| Selected Balance Sheet Data | ||||||||||||||||||||
| Total Assets | $ | 73,177 | $ | 87,916 | $ | 100,286 | $ | 103,533 | $ | 112,535 | ||||||||||
| Property, Plant and Equipment, Net | 15,719 | 17,468 | 18,153 | 14,941 | 14,475 | |||||||||||||||
| Long-term Liabilities | 176 | 290 | 1,271 | 1,838 | 3,298 | |||||||||||||||
| Stockholders’ Equity | 61,633 | 72,185 | 86,020 | 88,622 | 93,995 | |||||||||||||||
1 As part of the settlement of our pension plan, the Company recorded $4.1 million in pension liability gains previously recorded in accumulated other comprehensive income within operating expenses during 2016. Additionally, the Company recognized $4.2 million in foreign currency translation losses within Other (Expense) Income due to the substantial liquidation of our Austin Taylor subsidiary in the U.K.
20
| ITEM 7. | MANAGEMENT’S DISCUSSION AND ANALYSIS OF FINANCIAL CONDITION AND RESULTS OF OPERATIONS |
Overview
Communications Systems, Inc. provides physical connectivity infrastructure products and services for global deployments of broadband networks through the following business units:
Suttle
Founded in 1910, Suttle provides network solutions that meet service providers’ needs at the edge of the network and inside the home/business. Suttle’s product portfolio incorporates technology, leveraging existing infrastructure, and laying the foundation for future growth. Products are designed to comply with the most stringent industry standards. Quality management systems are ISO 9001 and TL9000 certified. Suttle’s newest brands are FutureLinkTM and MediaMAX™. FutureLinkTM provides high-speed connectivity solutions in the last mile of a network. The FutureLinkTM Stackable Fiber Interface Terminal (SFIT)—among other platforms that feature grow-as-you-go capability—is part of Suttle’s FTTx solution. MediaMAX™ is designed for gigabit services for the connected home/business. MediaMAX™ optimizes installation cost while maximizing coverage and high-bandwidth.
Transition Networks
With over 30 years of growth and expertise in hardware and software development, Transition Networks offers customers the ability to affordably integrate the benefits of fiber optics into any data network, in any application, and in any environment. Offering support for multiple protocols, any interface, and a multitude of hardware platforms, Transition Networks’ portfolio gives customers the power to deliver and manage network traffic reliably over fiber. Transition Networks distributes hardware-based connectivity solutions exclusively through a network of resellers in over 90 countries.
JDL Technologies
JDL Technologies provides technology services and infrastructure to the commercial, healthcare and education market segments. The company’s portfolio of technology solutions includes managed services, virtualization and cloud solutions, wired and wireless network design and implementation services, and converged infrastructure configuration and deployment. JDL has provided many of these technology services to the School Board of Broward County, Florida, the sixth largest public school district in the U.S., for more than a decade, and also provides these services to a number of commercial and healthcare clients.
Net2Edge
Net2Edge has been created to focus on the service provider/communications markets. Designing, manufacturing and marketing Carrier Ethernet based Network Access Devices and software that will revolutionize the near future evolution to the next wave of network modernization. Carrier Ethernet is the standard universal service provider delivery system based on the internationally recognized MEF service standards. Net2Edge has created significant market differentiation by enabling legacy services over Carrier Ethernet Access Devices. Service providers all over the world still have vast old networks which are expensive to operate, maintain and manage yet have millions of subscribers. Net2Edge helps resolve that challenge by bringing these legacy services in to the 21st century network.
Key 2016 Developments
| ● | The Company’s 2016 sales were $99.4 million, a 8% decrease from 2015 sales of $107.7 million. |
| ● | The Company’s 2016 net loss was $8.1 million, or ($0.92) per diluted share, compared to net loss of $9.6 million or ($1.11) per diluted share in fiscal 2015. |
| ● | At 2016 year end, the Company had cash, cash equivalents and investments of $16.2 million and positive working capital of $44.0 million compared to cash, cash equivalents and investments of $21.3 million and working capital of $46.4 million at December 31, 2015. |
| ● | Suttle sales decreased 16% to $42.1 million in 2016 from $50.1 million in 2015, primarily due to a decrease in international sales and in sales to its largest telecommunications customer. Suttle had an operating loss of $8.6 million in 2016 compared to an operating loss of $6.4 million in 2015. |
| ● | Transition Networks sales decreased 1% to $41.1 million in 2016 from $41.4 million in 2015. Transition had operating income of $0.3 million in 2016 compared to an operating loss of $1.2 million in 2015. |
21
| ● | Sales by JDL Technologies decreased 1% to $15.5 million in 2016 from $15.7 million in 2015. JDL had operating income of $1.9 million in 2016 compared to operating income of $1.2 million in 2015. |
| ● | Sales from Net2Edge increased 38% to $1.9 million in 2016 from $1.4 million in 2015. Net2Edge had an operating loss of $2.2 million compared to an operating loss of $2.8 million in 2015. |
| ● | The Company’s R&D investment in 2016 was $5.4 million, or 5.4% of consolidated sales, compared to $8.3 million, or 7.7% of consolidated sales in 2015. |
Forward Looking Statements
In this report and from time to time, in reports filed with the Securities and Exchange Commission, in press releases, and in other communications to shareholders or the investing public, we may make “forward looking statements” within the meaning of the Private Securities Litigation Reform Act of 1995. We may make these forward looking statements concerning possible or anticipated future financial performance, business activities, plans, pending claims, investigations or litigation, which are typically preceded by the words “believes,” “expects,” “anticipates,” “intends” or similar expressions. For these forward-looking statements, the Company claims the protection of the safe harbor for forward-looking statements contained in federal securities laws. Shareholders and the investing public should understand that these forward looking statements are subject to risks and uncertainties that could cause actual performance, activities, anticipated results, outcomes or plans to differ significantly from those indicated in the forward-looking statements. For a detailed discussion of a number of such risk factors, please see Item 1A above.
Critical Accounting Policies
Inventory Valuation: We value inventories at the lower of cost or market. Reserves for excess and obsolescence are estimated and recorded to reduce the carrying value to estimated net realizable value. The amount of the reserve is determined based on historical usage, projected sales information, plans for discontinued products and other factors. Though management considers these reserves adequate and proper, changes in sales volumes due to unexpected economic or competitive conditions are among the factors that could materially affect the adequacy of this reserve.
Income Taxes: In the preparation of the Company’s consolidated financial statements, management calculates income taxes. This includes estimating the Company’s current tax liability as well as assessing temporary differences resulting from different treatment of items for tax and book accounting purposes. These differences result in deferred tax assets and liabilities, which are recorded on the balance sheet. These assets and liabilities are analyzed regularly and management assesses the likelihood it will realize these deferred assets from future taxable income. We determine the valuation allowance for deferred income tax benefits based upon the expectation of whether the benefits are more likely than not to be realized. The Company records interest and penalties related to income taxes as income tax expense in the Consolidated Statements of Income.
Revenue Recognition: The Company recognizes revenue when the earnings process is complete, evidenced by persuasive evidence of an agreement, delivery has occurred or services have been rendered, the price is fixed or determinable, and collectability is reasonably assured. In the Suttle, Transition Networks and Net2Edge segments, the earning process completion is evidenced through the shipment of goods, based on the sales terms of these segments, the risk of loss is transferred upon shipment or delivery to customers and there are no significant obligations subsequent to that point. There are no significant estimates related to revenue recognition for these segments.
JDL Technologies records revenue on hardware, software and related equipment sales and installation contracts when the revenue recognition criteria are met and the products are installed and accepted by the customer. JDL records revenue on service contracts on a straight-line basis over the contract period, unless evidence suggests that the revenue is earned in a different pattern. Each contract is individually reviewed to determine when the earnings process is complete.
22
Results of Operations
2016 Compared to 2015
Consolidated sales were $99,353,000 in 2016, an 8% decrease from sales of $107,670,000 in 2015. Net loss in 2016 was $8,114,000, or ($0.92) per share compared to net loss of $9,648,000 or ($1.11) per share in 2015.
Suttle Results
Suttle sales decreased 16% to $42,076,000 in 2016 compared to $50,082,000 in 2015. Sales by product groups in 2016 and 2015 were:
| Suttle Sales by Product Group | ||||||||
| 2016 | 2015 | |||||||
| Structured cabling and connecting system products | $ | 38,196,000 | $ | 42,552,000 | ||||
| DSL and other products | 3,880,000 | 7,530,000 | ||||||
| $ | 42,076,000 | $ | 50,082,000 | |||||
Suttle’s sales by customer groups in 2016 and 2015 were:
| Suttle Sales by Customer Group | ||||||||
| 2016 | 2015 | |||||||
| Telecommunication customers | $ | 37,796,000 | $ | 39,809,000 | ||||
| Distributors | 2,724,000 | 2,986,000 | ||||||
| International | 1,556,000 | 7,287,000 | ||||||
| $ | 42,076,000 | $ | 50,082,000 | |||||
The decrease in sales is due primarily to lower volume of legacy products in the international market and a disrupted order cycle and pricing pressures with a major domestic customer. Sales to the telecommunication customers decreased 5% to $37,796,000 in 2016 compared to $39,809,000 in 2015. Sales to these customers accounted for 90% of Suttle’s sales in 2016 compared to 79% of sales in 2015. Sales to distributors decreased 9% and accounted for 6% of sales in 2016 compared to 6% in 2015. International sales accounted for 4% of Suttle’s 2016 sales and decreased 79% compared to 2015 due to the ordering cycle of DSL products by a large customer.
Sales of structured cabling and connecting system products decreased 10% primarily due to price pressures on legacy products and the ordering cycle for new products within a major customer. Sales of DSL and other products decreased 48% due to the ordering cycle of DSL products by a large customer.
Suttle’s gross margin decreased 56% to $3,883,000 in 2016 compared to $8,850,000 in 2015. The gross margin percentage decreased to 9% in 2016 as compared to 18% in 2015 due to reduced productivity in the manufacturing process related to several new product introductions, lower contract pricing with a large telecommunications company for legacy products, and increased reserves for excess and obsolete inventory as the Company began the process to rationalize some legacy product lines.
Selling, general and administrative expenses decreased $2,760,000, or 18% to $12,525,000, or 30% of sales, in 2016 compared to $15,285,000 in 2015, or 31% of sales, due reductions in research and development spending and other expense control measures. Suttle incurred $2,596,000 and $4,959,000 in research and development expenses in 2016 and 2015, respectively. While Suttle continues to enhance and develop new products, it has completed its investment in several new products and introduced these products to the market in 2016.
Suttle had an operating loss of $8,642,000 in 2016 compared to an operating loss of $6,435,000 in 2015.
Transition Networks
Transition Networks develops, markets, and sells active networking hardware devices. Characteristics of the business include a rapid pace of change in technologies and alternative solutions to our products. Transition Networks derives the majority of its revenues from customer network upgrade projects, which tend not to recur. The core markets for these products are enterprise, service providers, government, and industrial users. Roughly 80% of Transition Networks revenue comes from North America, but we continue to see opportunity for long-term growth outside of North America and we will invest resources in sales, marketing, and infrastructure to grow that business.
23
Transition Networks sales decreased 1% to $41,093,000 in 2016 compared to $41,469,000 in 2015. Transition Networks organizes its sales force by vertical markets and segments its customers geographically. Sales by customer groups in 2016 and 2015 were:
| Transition Networks Sales by Region | ||||||||
| 2016 | 2015 | |||||||
| North America | $ | 32,687,000 | $ | 30,852,000 | ||||
| EMEA | 2,819,000 | 3,568,000 | ||||||
| Rest of world | 5,587,000 | 7,049,000 | ||||||
| $ | 41,093,000 | $ | 41,469,000 | |||||
The following table summarizes Transition Networks’ 2016 and 2015 sales by product group:
| Transition Networks Sales by Product Group | ||||||||
| 2016 | 2015 | |||||||
| Media converters | $ | 25,473,000 | $ | 25,806,000 | ||||
| Ethernet switches and adapters | 7,827,000 | 9,141,000 | ||||||
| Other products | 7,793,000 | 6,522,000 | ||||||
| $ | 41,093,000 | $ | 41,469,000 | |||||
Sales in North America increased 6% or $1,835,000 compared to 2015 due primarily to increased activity at a service provider and the federal government. International sales decreased $2,211,000, or 21%, due to continued weak conditions as a result of currency and other factors in Europe and Asia. Sales of media converters decreased 1% or $333,000 due primarily to international market conditions. Ethernet switches and adapters decreased 14% or $1,314,000 due to project timing and weakness in our industrial sector.
Gross margin decreased 2% to $17,486,000 in 2016 compared to $17,767,000 in 2015. Gross margin as a percentage of sales remained stable at 43% in both 2016 and 2015.
Selling, general and administrative expenses decreased 10% to $17,180,000, or 42% of sales, in 2016 from $19,005,000 in 2015, or 46% of sales due to a continued focus on reducing operational costs. Operating income was $306,000 in 2016 compared to an operating loss of $1,238,000 in 2015.
Transition Networks continues to develop products based on market needs as well as by following industry standards set by such organizations as the Institute of Electrical and Electronics Engineers (IEEE) and the Metro Ethernet Forum (MEF). It also continues to invest in sales and marketing to grow revenues in our target markets and expand sales outside of North America.
JDL Technologies, Inc.
Sales by JDL Technologies decreased 1% to $15,464,000 in 2016 compared to $15,672,000 in 2015. The following table summarizes JDL’s revenues by customer group in 2016 and 2015:
| JDL Revenue by Customer Group | ||||||||
| 2016 | 2015 | |||||||
| Education | $ | 11,269,000 | $ | 11,691,000 | ||||
| Healthcare and commercial clients | 4,195,000 | 3,981,000 | ||||||
| $ | 15,464,000 | $ | 15,672,000 | |||||
Revenues earned from the education sector decreased $422,000 or 4% in 2016 due to a decrease in the number of network related projects completed during the year. Federal and local funding for public school district investments in IT infrastructure and services varies substantially from year to year, and JDL Technologies expects to continue to experience notable swings in quarterly and annual revenues as a result.
24
Revenue from JDL Technologies’ sales to small and medium-sized commercial businesses (SMBs) increased by 5% or $215,000 primarily due to sales of managed services to new clients and aggressive selling into the healthcare space.
JDL gross margin increased 9% to $5,219,000 in 2016 compared to $4,806,000 in 2015. Gross margin as a percentage of sales increased to 34% in 2016 from 31% in 2015 due to changes in sales mix. This reflects, in part, JDL’s success in providing more profitable commercial services and its continuing evolution away from typically narrow margin E-Rate funded projects for smaller or rural school districts.
Selling, general and administrative expenses decreased 9% in 2016 to $3,296,000, or 21% of sales, compared to $3,635,000 in 2015, or 23% of sales as JDL made operational changes to improve its efficiency in response to market directions and business unit performance. JDL reported operating income of $1,923,000 in 2016 compared to operating income of $1,171,000 in 2015.
JDL Technologies continues to aggressively leverage opportunities to provide managed services, cloud migration and virtualization services, HIPAA-compliant technology services, and other network and infrastructure services to the commercial and healthcare markets. This strategic, multiyear plan to reduce the impact of volatile government funding is beginning to produce results.
Net2Edge
Net2Edge’s sales increased 38% to $1,873,000 in 2016 compared to $1,353,000 in 2015 due to increased sales of its new LiberatorTM product line. Gross margin increased 36% to $969,000 in 2016 compared to $715,000 in 2015. Gross margin as a percentage of sales decreased to 52% in 2016 from 53% in 2015 due to product mix from legacy products to new product lines. Selling, general and administrative expenses decreased 10% in 2016 to $3,141,000 compared to $3,490,000 in 2015 due to an effort to control expenses and the decrease in the exchange rate. Net2Edge reported an operating loss of $2,172,000 in 2016 compared to a loss of $2,775,000 in 2015.
Other
The Company’s loss before income taxes was $7,857,000 in 2016 compared to a loss before income taxes of $10,402,000 in 2015 due to an overall decrease in sales and lower margins, offset by lower selling, general and administrative expenses and the recognition of pension liability gains of $4,148,000. Additionally, the Company recognized a net gain of $808,000, primarily due to the sale of the Austin Taylor facility and a foreign currency translation loss of $4,238,000, due to the substantial liquidation of Austin Taylor within other expenses during the first quarter of 2016. The Company’s effective income tax rate was -3% in 2016 compared to 7% in 2015. The 2016 and 2015 effective rates differed from the standard rate of 35% due to state income taxes, foreign tax rate differences, foreign losses not deductible for U.S. income tax purposes, provisions for interest charges for uncertain income tax positions, and changes in valuation allowances related to deferred tax assets as explained in Note 11 to the consolidated financial statements.
2015 Compared to 2014
Consolidated sales were $107,670,000 in 2015, a 10% decrease from sales of $119,071,000 in 2014. Consolidated operating loss was $10,506,000 in 2015 as compared to income of $3,293,000 in 2014. Net loss in 2015 was $9,648,000, or ($1.11) per share compared to net income of $1,962,000 or $0.23 per share in 2014.
Suttle Results
Suttle sales decreased 26% to $50,082,000 in 2015 compared to $67,331,000 in 2014. Sales by product groups in 2015 and 2014 were:
| Suttle Sales by Product Group | ||||||||
| 2015 | 2014 | |||||||
| Structured cabling and connecting system products | $ | 42,552,000 | $ | 61,004,000 | ||||
| DSL and other products | 7,530,000 | 6,327,000 | ||||||
| $ | 50,082,000 | $ | 67,331,000 | |||||
25
Suttle’s sales by customer groups in 2015 and 2014 were:
| Suttle Sales by Customer Group | ||||||||
| 2015 | 2014 | |||||||
| Telecommunication customers | $ | 39,809,000 | $ | 56,882,000 | ||||
| Distributors | 2,986,000 | 5,903,000 | ||||||
| International | 7,287,000 | 4,546,000 | ||||||
| $ | 50,082,000 | $ | 67,331,000 | |||||
The decrease in sales is due primarily to increase pricing pressure and volume declines in Suttle’s legacy product lines. Sales to the telecommunication customers decreased 30% to $39,809,000 in 2015 compared to $56,882,000 in 2014 due to a disrupted order cycle at a major customer that significantly curtailed its 2015 purchasing, and overall decline in legacy product lines. Sales to these customers accounted for 79% of Suttle’s sales in 2015 compared to 84% of sales in 2014. Sales to distributors decreased 49% and accounted for 6% of sales in 2015 compared to 9% in 2014. International sales accounted for 15% of Suttle’s 2015 sales and increased 60% compared to 2014 due to the ordering cycle of DSL products and introduction of new products used in FTTx deployments for a major customer.
Sales of structured cabling and connecting system products decreased 30% primarily due to reduced demand from major customers and shifts in technology. Sales of DSL and other products increased 19% due to increased orders from a major international customer.
Suttle’s gross margin decreased 58% to $8,850,000 in 2015 compared to $20,992,000 in 2014. The gross margin percentage decreased to 18% in 2015 as compared to 31% in 2014 due to increased pricing pressure at a major customer and high production variances due to decreased demand, as well as continued investment into production capabilities to support new FTTx product platforms.
Selling, general and administrative expenses increased $896,000, or 6% to $15,285,000, or 31% of sales, in 2015 compared to $14,389,000 in 2014, or 21 % of sales, due to investment into fiber and active capabilities to support new product platforms.
Suttle had an operating loss of $6,435,000 in 2015 compared to income of $6,603,000 in 2014.
Transition Networks
Transition Networks sales decreased 1% to $41,469,000 in 2015 compared to $41,945,000 in 2014. Transition Networks organizes its sales force by vertical markets and segments its customers geographically. Sales by customer groups in 2015 and 2014 were:
| Transition Networks Sales by Region | ||||||||
| 2015 | 2014 | |||||||
| North America | $ | 30,852,000 | $ | 31,480,000 | ||||
| EMEA | 3,568,000 | 3,207,000 | ||||||
| Rest of world | 7,049,000 | 7,258,000 | ||||||
| $ | 41,469,000 | $ | 41,945,000 | |||||
The following table summarizes Transition Networks’ 2015 and 2014 sales by product group:
| Transition Networks Sales by Product Group | ||||||||
| 2015 | 2014 | |||||||
| Media converters | $ | 25,806,000 | $ | 27,133,000 | ||||
| Ethernet switches and adapters | 9,141,000 | 8,666,000 | ||||||
| Other products | 6,522,000 | 6,146,000 | ||||||
| $ | 41,469,000 | $ | 41,945,000 | |||||
26
Sales in North America decreased 2% or $628,000 compared to 2014 due primarily to delays in federal government purchases. International sales increased $152,000, or 1%, due to gains in EMEA.
Gross margin decreased 3% to $17,767,000 in 2015 compared to $18,406,000 in 2014. Gross margin as a percentage of sales decreased to 43% in 2015 compared to 44% in 2014 due to unfavorable product mix.
Selling, general and administrative expenses increased 2% to $19,005,000, or 46% of sales, in 2015 from $18,645,000 in 2014, or 44% of sales due to increased selling and engineering expenses. Operating loss was $1,238,000 in 2015 compared to an operating loss of $477,000 in 2014.
JDL Technologies, Inc.
Sales by JDL Technologies, Inc. increased 83% to $15,672,000 in 2015 compared to $8,567,000 in 2014. The following table summarizes JDL’s revenues by customer group in 2015 and 2014:
| JDL Revenue by Customer Group | ||||||||
| 2015 | 2014 | |||||||
| Broward County FL schools | $ | 11,691,000 | $ | 6,504,000 | ||||
| Miami-Dade County FL schools | 0 | 119,000 | ||||||
| Healthcare and commercial customers | 3,981,000 | 1,944,000 | ||||||
| $ | 15,672,000 | $ | 8,567,000 | |||||
Revenues earned in Broward County FL schools increased $5,187,000 or 80% in 2015 as work began on a new multimillion dollar contract to deliver enhanced technology, modern IT infrastructure and expanded wireless coverage to the district.
JDL recognized no revenues from Miami-Dade County Public Schools due to completion of that district’s wireless classroom initiative, which had been funded under the E-Rate program.
Revenue from JDL Technologies’ sales to small and medium sized commercial businesses (SMBs) increased by 105% or $2,037,000 primarily due to continued robust sales of the company’s managed services as well as the revenue generated through the acquisition of Twisted Technologies in June of 2015.
JDL gross margin increased 144% to $4,806,000 in 2015 compared to $1,968,000 in 2014. Gross margin as a percentage of sales increased to 31% in 2015 from 23% in 2014. This reflects, in part, JDL’s success in providing more profitable services for the commercial sector and its continuing evolution away from typically narrow margin E-Rate funded projects for smaller or rural school districts.
Selling, general and administrative expenses increased 28% in 2015 to $3,635,000, or 23% of sales, compared to $2,846,000 in 2014, or 33% of sales, due to strategic investments in staff, systems and product development to support growth and client retention. JDL reported operating income of $1,171,000 in 2015 compared to an operating loss of $878,000 in 2014.
Net2Edge
Net2Edge’s sales decreased 16% to $1,353,000 in 2015 compared to $1,619,000 in 2014. Gross margin decreased 10% to $715,000 in 2015 compared to $793,000 in 2014. Gross margin as a percentage of sales increased to 53% in 2015 from 49% in 2014. Selling, general and administrative expenses increased 27% in 2015 to $3,490,000 compared to $2,748,000 in 2014. Net2Edge reported an operating loss of $2,775,000 in 2015 compared to a loss of $1,955,000 in 2014.
Other
The Company’s loss before income taxes was $10,402,000 in 2015 compared to income before income taxes of $3,181,000 in 2014. The Company’s effective income tax rate was 7% in 2015 compared to 38% in 2014. The 2015 effective rate differs from the standard rate of 35% due to state income taxes, foreign losses not deductible for U.S. income tax purposes, the effect of operations conducted in lower foreign tax rate jurisdictions, federal research and development credits, and an increase in our valuation allowance. The 2014 effective rate was higher than the standard rate of 35% due to state income taxes, foreign losses not deductible for U.S. income tax purposes, and the effect of operations conducted in lower foreign tax rate jurisdictions.
27
Acquisitions and Dispositions
The Company is a growth-oriented manufacturer of telecommunications connecting and networking devices. The Company continually searches for acquisition candidates with products that would enable the Company to better serve its target markets.
Effects of Inflation
Inflation has not had a significant effect on operations in recent years. The Company does not have long-term production or procurement contracts and has historically been able to adjust pricing and purchasing decisions to respond to inflationary pressures.
Liquidity and Capital Resources
As of December 31, 2016, the Company had approximately $16,249,000 in cash, cash equivalents and investments. Of this amount, $3,851,000 was invested in short-term money market funds that are not considered to be bank deposits and are not insured or guaranteed by the FDIC or other government agency. These money market funds seek to preserve the value of the investment at $1.00 per share; however, it is possible to lose money investing in these funds. The remainder in cash and cash equivalents is operating cash and certificates of deposit, which are fully insured through the FDIC. The Company also had $5,805,000 in investments consisting of certificates of deposit and corporate notes and bonds that are traded on the open market and are classified as available-for-sale at December 31, 2016.
The Company had working capital of $44,005,000, consisting of current assets of approximately $55,373,000 and current liabilities of $11,368,000 at December 31, 2016 compared to working capital of $46,449,000, consisting of current assets of $61,890,000 and current liabilities of $15,441,000 at the end of 2015. The Company’s working capital at December 31, 2015 decreased from the prior year-end as the Company decreased its inventory as part of a concerted effort to more efficiently manage its inventory and begin to phase out specific legacy products.
Cash flow provided by operating activities was approximately $1,300,000 in 2016 compared to $840,000 provided by operations in 2015. Significant working capital changes from 2015 to 2016 included a decrease in inventories of $2.7 million due to a concerted effort to reduce excess inventory and a decrease in receivables of $3.2 million.
Cash provided by investing activities was $4,414,000 of cash in 2016 compared to cash provided of $1,395,000 in 2015, due to proceeds from the sale of investments and proceeds on the sale of assets, specifically the land and building of our Austin Taylor facility in the U.K. during the first quarter of 2016.
Net cash used by financing activities was $4,963,000 in 2016 compared to $6,006,000 in 2015. Cash dividends paid on common stock decreased to $4,628,000 in 2016 ($0.40 per common share) from $5,622,000 in 2015 ($0.64 per common share). Proceeds from common stock issuances, principally shares sold to the Company’s Employee Stock Ownership Plan and under the Company’s Employee Stock Purchase Plan, totaled approximately $159,000 in 2016 and $146,000 in 2015 net of acquisitions of Company stock from employees in order to satisfy withholding tax obligations related to share-based compensation, pursuant to terms of Board and shareholder-approved compensation plans. The Company did not repurchase any shares in 2016 or 2015 under the Board authorized program. At December 31, 2016, Board of Director authority to purchase approximately 411,910 additional shares remained in effect.
The Company has a $15,000,000 line of credit from Wells Fargo Bank. The Company had no outstanding obligations under its line of credit at December 31, 2016 and 2015. The total amount available for borrowings under our credit facility at December 31, 2016 was $10,901,000, based on the borrowing base calculation. Interest on borrowings on the credit line is at LIBOR plus 2.0% (2.8% at December 31, 2016). The credit agreement expires August 12, 2021 and is secured by assets of the Company. In the opinion of management, based on the Company’s current financial and operating position and projected future expenditures, sufficient funds are available to meet the Company’s anticipated operating and capital expenditure needs.
28
Contractual Obligation Summary
The following table summarizes our contractual obligations at December 31, 2016 and the effect these obligations are expected to have on our liquidity and cash flow in future periods:
| Less than One Year | 1 – 3 Years | 3 – 5 Years | More Than 5 Years | |||||||||||||
| Operating leases | $ | 283,000 | $ | 369,000 | $ | 204,000 | $ | |||||||||
| Total | $ | 283,000 | $ | 369,000 | $ | 204,000 | $ | — | ||||||||
As of December 31, 2016, the Company had no other material commitments (either cancelable or non-cancelable) for capital expenditures, short or long term debt, capital leases or other purchase commitments related to ongoing operations.
New Accounting Pronouncements
See Note 1 of the “Notes to the Consolidated Financial Statements” under Item 8 herein for a discussion of new accounting standards.
Off Balance Sheet Arrangements
None.
| ITEM 7A. | QUANTITATIVE AND QUALITATIVE DISCLOSURES ABOUT MARKET RISK |
The Company has no freestanding or embedded derivatives. The Company’s policy is to not use freestanding derivatives and to not enter into contracts with terms that cannot be designated as normal purchases or sales.
The vast majority of our transactions are denominated in U.S. dollars; as such, fluctuations in foreign currency exchange rates have historically not been material to the Company. At December 31, 2016 our bank line of credit carried a LIBOR rate plus 2.0%. The Company’s investments are money market, certificates of deposit, commercial paper, and corporate notes and bonds types of investments that earn interest at prevailing market rates and as such do not have material risk exposure.
Based on the Company’s operations, in the opinion of management, the Company is not exposed to material future losses due to market risk.
The Company uses the U.S. dollar as its functional currency in Costa Rica. Accordingly, the Company believes its risk of material loss due to fluctuations in foreign currency markets to be small.
29
| ITEM 8. | FINANCIAL STATEMENTS AND SUPPLEMENTARY DATA |
(a) FINANCIAL STATEMENTS
REPORT OF MANAGEMENT
The management of Communications Systems, Inc. and its subsidiary companies is responsible for the integrity and objectivity of the financial statements and other financial information contained in the annual report. The financial statements and related information were prepared in accordance with accounting principles generally accepted in the United States of America and include amounts that are based on management’s informed judgments and estimates.
In fulfilling its responsibilities for the integrity of financial information, management maintains accounting systems and related controls. These controls provide reasonable assurance, at appropriate costs, that assets are safeguarded against losses and that financial records are reliable for use in preparing financial statements. Management recognizes its responsibility for conducting the Company’s affairs according to the highest standards of personal and corporate conduct.
The Audit Committee of the Board of Directors, comprised solely of outside directors, meets with the independent auditors and management periodically to review accounting, auditing, financial reporting and internal control matters. The independent auditors have free access to this committee, without management present, to discuss the results of their audit work and their opinion on the adequacy of internal financial controls and the quality of financial reporting.
| /s/ Roger H.D. Lacey | /s/ Mark D. Fandrich | ||
| Roger H.D. Lacey | Mark D. Fandrich | ||
| Chief Executive Officer | Chief Financial Officer |
30
REPORT OF INDEPENDENT REGISTERED PUBLIC ACCOUNTING FIRM
To the Board of Directors and Shareholders of
Communications Systems, Inc.:
We have audited the accompanying consolidated balance sheets of Communications Systems, Inc., and subsidiaries (the “Company”) as of December 31, 2016 and 2015, and the related consolidated statements of (loss) income and comprehensive (loss) income, changes in stockholders’ equity, and cash flows for each of the three years in the period ended December 31, 2016. Our audits also included the financial statement schedule listed in the Index at Item 15. These financial statements and financial statement schedule are the responsibility of the Company’s management. Our responsibility is to express an opinion on the financial statements and financial statement schedule based on our audits.
We conducted our audits in accordance with the standards of the Public Company Accounting Oversight Board (United States). Those standards require that we plan and perform the audit to obtain reasonable assurance about whether the financial statements are free of material misstatement. The Company is not required to have, nor were we engaged to perform, an audit of its internal control over financial reporting. Our audits included consideration of internal control over financial reporting as a basis for designing audit procedures that are appropriate in the circumstances, but not for the purpose of expressing an opinion on the effectiveness of the Company’s internal control over financial reporting. Accordingly, we express no such opinion. An audit also includes examining, on a test basis, evidence supporting the amounts and disclosures in the financial statements, assessing the accounting principles used and significant estimates made by management, as well as evaluating the overall financial statement presentation. We believe that our audits provide a reasonable basis for our opinion.
In our opinion, such consolidated financial statements present fairly, in all material respects, the financial position of Communications Systems, Inc. and subsidiaries at December 31, 2016 and 2015, and the results of their operations and their cash flows for each of the three years in the period ended December 31, 2016, in conformity with accounting principles generally accepted in the United States of America. Also, in our opinion, such financial statement schedule, when considered in relation to the basic consolidated financial statements taken as a whole, present fairly, in all material respects, the information set forth therein.
| /s/ Deloitte & Touche LLP |
Minneapolis, Minnesota
March 31, 2017
31
COMMUNICATIONS SYSTEMS, INC. AND SUBSIDIARIES
CONSOLIDATED BALANCE SHEETS
| December 31 | December 31 | |||||||
| 2016 | 2015 | |||||||
| ASSETS | ||||||||
| CURRENT ASSETS: | ||||||||
| Cash and cash equivalents | $ | 10,443,274 | $ | 9,812,737 | ||||
| Investments | 5,805,276 | 5,228,668 | ||||||
| Trade accounts receivable, less allowance for doubtful accounts of $77,000 and $123,000, respectively | 14,552,191 | 17,849,207 | ||||||
| Inventories | 22,204,902 | 24,985,560 | ||||||
| Prepaid income taxes | 1,400,118 | 2,972,271 | ||||||
| Other current assets | 967,332 | 1,041,303 | ||||||
| TOTAL CURRENT ASSETS | 55,373,093 | 61,889,746 | ||||||
| PROPERTY, PLANT AND EQUIPMENT, net | 15,719,403 | 17,468,420 | ||||||
| OTHER ASSETS: | ||||||||
| Investments | — | 6,293,505 | ||||||
| Goodwill | 1,462,503 | 1,462,503 | ||||||
| Other assets | 622,017 | 802,056 | ||||||
| TOTAL OTHER ASSETS | 2,084,520 | 8,558,064 | ||||||
| TOTAL ASSETS | $ | 73,177,016 | $ | 87,916,230 | ||||
| LIABILITIES AND STOCKHOLDERS’ EQUITY | ||||||||
| CURRENT LIABILITIES: | ||||||||
| Current portion of long-term debt | $ | — | $ | 103,603 | ||||
| Accounts payable | 6,953,710 | 8,373,292 | ||||||
| Accrued compensation and benefits | 2,149,973 | 3,050,822 | ||||||
| Accrued consideration | — | 442,234 | ||||||
| Other accrued liabilities | 1,851,938 | 1,996,609 | ||||||
| Dividends payable | 412,542 | 1,474,892 | ||||||
| TOTAL CURRENT LIABILITIES | 11,368,163 | 15,441,452 | ||||||
| LONG TERM LIABILITIES: | ||||||||
| Long-term compensation plans | 16,299 | — | ||||||
| Uncertain tax positions | 106,864 | 102,633 | ||||||
| Deferred income taxes | 52,998 | 61,453 | ||||||
| Pension liabilities | — | 126,001 | ||||||
| TOTAL LONG-TERM LIABILITIES | 176,161 | 290,087 | ||||||
| COMMITMENTS AND CONTINGENCIES (Footnote 8) | ||||||||
| STOCKHOLDERS’ EQUITY | ||||||||
| Preferred stock, par value $1.00 per share; 3,000,000 shares authorized; none issued Common stock, par value $.05 per share; 30,000,000 shares authorized; 8,877,379 and 8,754,550 shares issued and outstanding, respectively | 443,869 | 437,727 | ||||||
| Additional paid-in capital | 41,279,281 | 40,129,285 | ||||||
| Retained earnings | 20,596,203 | 32,284,061 | ||||||
| Accumulated other comprehensive loss | (686,661 | ) | (666,382 | ) | ||||
| TOTAL STOCKHOLDERS’ EQUITY | 61,632,692 | 72,184,691 | ||||||
| TOTAL LIABILITIES AND STOCKHOLDERS’ EQUITY | $ | 73,177,016 | $ | 87,916,230 | ||||
The accompanying notes are an integral part of the consolidated financial statements.
32
COMMUNICATIONS SYSTEMS, INC. AND SUBSIDIARIES
CONSOLIDATED STATEMENTS OF (LOSS) INCOME AND COMPREHENSIVE (LOSS) INCOME
| Year Ended December 31 | ||||||||||||
| 2016 | 2015 | 2014 | ||||||||||
| Sales | $ | 99,352,934 | $ | 107,669,524 | $ | 119,071,439 | ||||||
| Costs and expenses: | ||||||||||||
| Cost of sales | 72,771,393 | 76,123,362 | 76,912,881 | |||||||||
| Selling, general and administrative expenses | 35,185,924 | 40,829,755 | 38,627,801 | |||||||||
| Additional minimum pension liability adjustments | (4,147,836 | ) | — | — | ||||||||
| Pension settlement costs | — | 1,222,276 | — | |||||||||
| Restructuring expense | — | — | 237,838 | |||||||||
| Total costs and expenses | 103,809,481 | 118,175,393 | 115,778,520 | |||||||||
| Operating (loss) income | (4,456,547 | ) | (10,505,869 | ) | 3,292,919 | |||||||
| Other (expenses) and income: | ||||||||||||
| Investment and other income | 208,564 | 216,491 | 80,392 | |||||||||
| Gain (loss) on sale of assets | 749,509 | 8,090 | (112,242 | ) | ||||||||
| Interest and other expense | (119,627 | ) | (120,435 | ) | (79,841 | ) | ||||||
| Foreign currency translation loss | (4,238,497 | ) | — | — | ||||||||
| Other (expense) income, net | (3,400,051 | ) | 104,146 | (111,691 | ) | |||||||
| (Loss) income from operations before income taxes | (7,856,598 | ) | (10,401,723 | ) | 3,181,228 | |||||||
| Income tax expense (benefit) | 256,950 | (753,415 | ) | 1,219,355 | ||||||||
| Net (loss) income | (8,113,548 | ) | (9,648,308 | ) | 1,961,873 | |||||||
| Other comprehensive (loss) income, net of tax: | ||||||||||||
| Additional minimum pension liability adjustments | (4,147,836 | ) | 2,197,000 | 155,000 | ||||||||
| Unrealized gains/(losses) on available-for-sale securities | 29,736 | 28,161 | (42,666 | ) | ||||||||
| Foreign currency translation adjustment | 4,097,821 | (2,196,385 | ) | (567,480 | ) | |||||||
| Total other comprehensive (loss) income | (20,279 | ) | 28,776 | (455,146 | ) | |||||||
| Comprehensive (loss) income | $ | (8,133,827 | ) | $ | (9,619,532 | ) | $ | 1,506,727 | ||||
| Basic net (loss) income per share: | $ | (0.92 | ) | $ | (1.11 | ) | $ | 0.23 | ||||
| Diluted net (loss) income per share: | $ | (0.92 | ) | $ | (1.11 | ) | $ | 0.23 | ||||
| Weighted Average Basic Shares Outstanding | 8,831,782 | 8,720,225 | 8,622,032 | |||||||||
| Weighted Average Dilutive Shares Outstanding | 8,831,782 | 8,720,225 | 8,640,416 | |||||||||
The accompanying notes are an integral part of the consolidated financial statements.
33
COMMUNICATIONS SYSTEMS, INC. AND SUBSIDIARIES
CONSOLIDATED STATEMENTS OF CHANGES IN STOCKHOLDERS’ EQUITY
| Accumulated | ||||||||||||||||||||||||
| Additional | Other | |||||||||||||||||||||||
| Common Stock | Paid-in | Retained | Comprehensive | |||||||||||||||||||||
| Shares | Amount | Capital | Earnings | Income (Loss) | Total | |||||||||||||||||||
| BALANCE AT DECEMBER 31, 2013 | 8,553,320 | $ | 427,666 | $ | 37,110,671 | $ | 51,323,718 | $ | (240,012 | ) | $ | 88,622,043 | ||||||||||||
| Net income | 1,961,873 | 1,961,873 | ||||||||||||||||||||||
| Issuance of common stock under Employee Stock Purchase Plan | 14,104 | 705 | 166,637 | 167,342 | ||||||||||||||||||||
| Issuance of common stock to Employee Stock Ownership Plan | 32,520 | 1,626 | 360,647 | 362,273 | ||||||||||||||||||||
| Issuance of common stock under Employee Stock Option Plan | 12,000 | 600 | 98,760 | 99,360 | ||||||||||||||||||||
| Issuance of common stock under Executive Stock Plan | 44,769 | 2,239 | 0 | 2,239 | ||||||||||||||||||||
| Tax benefit from non-qualified employee stock options | 80,402 | 80,402 | ||||||||||||||||||||||
| Share based compensation | 784,785 | 784,785 | ||||||||||||||||||||||
| Purchase of common stock | (1,957 | ) | (98 | ) | (8,672 | ) | (14,052 | ) | (22,822 | ) | ||||||||||||||
| Shareholder dividends ($0.64 per share) | (5,581,851 | ) | (5,581,851 | ) | ||||||||||||||||||||
| Other comprehensive loss | (455,146 | ) | (455,146 | ) | ||||||||||||||||||||
| BALANCE AT DECEMBER 31, 2014 | 8,654,756 | 432,738 | 38,593,230 | 47,689,688 | (695,158 | ) | 86,020,498 | |||||||||||||||||
| Net loss | (9,648,308 | ) | (9,648,308 | ) | ||||||||||||||||||||
| Issuance of common stock under Employee Stock Purchase Plan | 20,243 | 1,012 | 201,552 | 202,564 | ||||||||||||||||||||
| Issuance of common stock to Employee Stock Ownership Plan | 37,640 | 1,882 | 393,338 | 395,220 | ||||||||||||||||||||
| Issuance of common stock under Non-Employee Stock Option Plan | 12,000 | 600 | 121,920 | 122,520 | ||||||||||||||||||||
| Issuance of common stock under Executive Stock Plan | 46,254 | 2,313 | 0 | 2,313 | ||||||||||||||||||||
| Tax benefit from non-qualified stock options | (5,712 | ) | (5,712 | ) | ||||||||||||||||||||
| Share based compensation | 898,760 | 898,760 | ||||||||||||||||||||||
| Other share retirements | (16,343 | ) | (818 | ) | (73,803 | ) | (107,260 | ) | (181,881 | ) | ||||||||||||||
| Shareholder dividends ($0.64 per share) | (5,650,059 | ) | (5,650,059 | ) | ||||||||||||||||||||
| Other comprehensive income | 28,776 | 28,776 | ||||||||||||||||||||||
| BALANCE AT DECEMBER 31, 2015 | 8,754,550 | 437,727 | 40,129,285 | 32,284,061 | (666,382 | ) | 72,184,691 | |||||||||||||||||
| Net loss | (8,113,548 | ) | (8,113,548 | ) | ||||||||||||||||||||
| Issuance of common stock under Employee Stock Purchase Plan | 24,375 | 1,219 | 156,153 | 157,372 | ||||||||||||||||||||
| Issuance of common stock to Employee Stock Ownership Plan | 60,278 | 3,014 | 465,346 | 468,360 | ||||||||||||||||||||
| Issuance of common stock under Executive Stock Plan | 42,118 | 2,106 | 0 | 2,106 | ||||||||||||||||||||
| Tax benefit from non-qualified stock options | (85,102 | ) | (85,102 | ) | ||||||||||||||||||||
| Share based compensation | 631,875 | 631,875 | ||||||||||||||||||||||
| Other share retirements | (3,942 | ) | (197 | ) | (18,276 | ) | (8,258 | ) | (26,731 | ) | ||||||||||||||
| Shareholder dividends ($0.40 per share) | (3,566,052 | ) | (3,566,052 | ) | ||||||||||||||||||||
| Other comprehensive loss | (20,279 | ) | (20,279 | ) | ||||||||||||||||||||
| BALANCE AT DECEMBER 31, 2016 | 8,877,379 | $ | 443,869 | $ | 41,279,281 | $ | 20,596,203 | $ | (686,661 | ) | $ | 61,632,692 | ||||||||||||
The accompanying notes are an integral part of the consolidated financial statements.
34
COMMUNICATIONS SYSTEMS, INC. AND SUBSIDIARIES
CONSOLIDATED STATEMENTS OF CASH FLOWS
| Year Ended December 31 | ||||||||||||
| 2016 | 2015 | 2014 | ||||||||||
| CASH FLOWS FROM OPERATING ACTIVITIES: | ||||||||||||
| Net (loss) income | $ | (8,113,548 | ) | $ | (9,648,308 | ) | $ | 1,961,873 | ||||
| Adjustments to reconcile net (loss) income to net cash provided by operating activities: | ||||||||||||
| Depreciation and amortization | 3,683,009 | 3,312,587 | 2,482,300 | |||||||||
| Share based compensation | 631,875 | 898,760 | 784,785 | |||||||||
| Deferred taxes | (8,456 | ) | 2,220,623 | 790,402 | ||||||||
| Change in fair value of acquisition-related contingent consideration | (142,234 | ) | (20,636 | ) | — | |||||||
| (Gain)/loss on sale of assets | (749,509 | ) | (8,090 | ) | 112,242 | |||||||
| Excess tax benefit from share based payments | — | 5,712 | (80,402 | ) | ||||||||
| Changes in assets and liabilities: | ||||||||||||
| Trade receivables | 3,249,449 | (3,979,435 | ) | 9,057,078 | ||||||||
| Inventories | 2,682,835 | 6,097,476 | (2,039,599 | ) | ||||||||
| Prepaid income taxes | 1,567,676 | (654,583 | ) | (936,186 | ) | |||||||
| Other assets | 126,031 | (393,105 | ) | (282,456 | ) | |||||||
| Accounts payable | (1,178,120 | ) | 2,941,322 | 105,602 | ||||||||
| Accrued compensation and benefits | (406,608 | ) | (246,464 | ) | 139,698 | |||||||
| Other accrued liabilities | (107,726 | ) | (191,676 | ) | 405,424 | |||||||
| Income taxes payable | (80,871 | ) | 19,642 | (243,165 | ) | |||||||
| Other | 61,558 | 486,467 | (85,519 | ) | ||||||||
| Net cash provided by operating activities | 1,215,361 | 840,292 | 12,172,077 | |||||||||
| CASH FLOWS FROM INVESTING ACTIVITIES: | ||||||||||||
| Capital expenditures | (2,286,027 | ) | (2,394,261 | ) | (5,577,039 | ) | ||||||
| Purchases of investments | — | — | (12,682,351 | ) | ||||||||
| Acquisition of business | — | (917,363 | ) | — | ||||||||
| Proceeds from the sale of fixed assets | 974,860 | 57,924 | 51,073 | |||||||||
| Proceeds from the sale of investments | 5,746,633 | 4,648,965 | 6,160,000 | |||||||||
| Net cash provided by (used in) investing activities | 4,435,466 | 1,395,265 | (12,048,317 | ) | ||||||||
| CASH FLOWS FROM FINANCING ACTIVITIES: | ||||||||||||
| Borrowing against line of credit | 4,894,046 | 3,900,000 | — | |||||||||
| Payments against line of credit | (4,894,046 | ) | (3,900,000 | ) | — | |||||||
| Cash dividends paid | (4,628,402 | ) | (5,621,665 | ) | (5,571,672 | ) | ||||||
| Mortgage principal payments | (103,603 | ) | (524,220 | ) | (489,706 | ) | ||||||
| Proceeds from issuance of common stock, net of shares withheld | 132,747 | 145,516 | 246,119 | |||||||||
| Excess tax benefit from stock based payments | — | (5,712 | ) | 80,402 | ||||||||
| Payment of contingent consideration related to acquisition | (300,000 | ) | — | (565,647 | ) | |||||||
| Net cash used in financing activities | (4,899,258 | ) | (6,006,081 | ) | (6,300,504 | ) | ||||||
| EFFECT OF FOREIGN EXCHANGE RATE CHANGES ON CASH | (121,032 | ) | (153,596 | ) | (145,519 | ) | ||||||
| NET INCREASE (DECREASE) IN CASH AND CASH EQUIVALENTS | 630,537 | (3,924,120 | ) | (6,322,263 | ) | |||||||
| CASH AND CASH EQUIVALENTS AT BEGINNING OF YEAR | 9,812,737 | 13,736,857 | 20,059,120 | |||||||||
| CASH AND CASH EQUIVALENTS AT END OF YEAR | $ | 10,443,274 | $ | 9,812,737 | $ | 13,736,857 | ||||||
| SUPPLEMENTAL DISCLOSURES OF CASH FLOW INFORMATION: | ||||||||||||
| Income taxes (refunded) paid | $ | (1,232,979 | ) | $ | (2,364,994 | ) | $ | 1,591,257 | ||||
| Interest paid | 43,630 | 77,801 | 73,860 | |||||||||
| Dividends declared not paid | 412,542 | 1,474,892 | 1,446,498 | |||||||||
| Capital expenditures in accounts payable | 6,621 | 190,888 | 188,564 | |||||||||
| Acquisition costs in accrued liabilities | — | 442,234 | — | |||||||||
The accompanying notes are an integral part of the consolidated financial statements.
35
COMMUNICATIONS SYSTEMS, INC. AND SUBSIDIARIES
NOTES TO CONSOLIDATED FINANCIAL STATEMENTS
Years Ended December 31, 2016, 2015 and 2014
NOTE 1 - SUMMARY OF SIGNIFICANT ACCOUNTING POLICIES
Description of business: Communications Systems, Inc. (herein collectively called “CSI,” “our” or the “Company”) is a Minnesota corporation organized in 1969 that operates directly and through its subsidiaries located in the United States, Costa Rica, and the United Kingdom. CSI is principally engaged through its Suttle business unit in the manufacture and sale of connectivity infrastructure products for broadband and voice communications and through its Transition Networks business unit in the manufacture of core media conversion products, Ethernet switches, and other connectivity and data transmission products. Through its JDL Technologies business unit the Company provides technology solutions including virtualization, managed services, wired and wireless network design and implementation, HIPAA-compliant IT services, and converged infrastructure configuration and deployment. Through its Net2Edge business unit, the Company enables telecommunications carriers to connect legacy networks to high-speed services.
The Company classifies its businesses into four segments: Suttle, which manufactures connectivity infrastructure products for broadband and voice communications; Transition Networks, which designs and markets media conversion products, Ethernet switches, and other connectivity and data transmission products; JDL Technologies, which is an IT managed services provider and value-added reseller; and Net2Edge, which develops products to connect legacy networks to high-speed services. Non-allocated general and administrative expenses are separately accounted for as “Other” in the Company’s segment reporting. Intersegment revenues are eliminated upon consolidation.
Principles of consolidation: The consolidated financial statements include the accounts of the Company and its subsidiaries. All intercompany transactions and accounts have been eliminated.
Use of estimates: The presentation of financial statements in conformity with accounting principles generally accepted in the United States of America requires management to make estimates and assumptions that affect the reported amounts of assets and liabilities and disclosure of contingent assets and liabilities at the date of the financial statements and the reported amounts of revenues and expenses during the reporting period. The Company uses estimates based on the best information available in recording transactions and balances resulting from operations. Actual results could differ from those estimates. The Company’s estimates consist principally of reserves for doubtful accounts, sales returns, warranty costs, asset impairment evaluations, accruals for compensation plans, self-insured medical and dental accruals, lower of cost or market inventory adjustments, provisions for income taxes and deferred taxes and depreciable lives of fixed assets.
Cash equivalents: For purposes of the consolidated statements of cash flows, the Company considers all highly liquid investments with a maturity of three months or less at the time of purchase to be cash equivalents. As of December 31, 2016, the Company had $10,443,000 in cash and cash equivalents. Of this amount, $3,851,000 was invested in short-term money market funds that are not considered to be bank deposits and are not insured or guaranteed by the federal deposit insurance company (FDIC) or other government agency. These money market funds seek to preserve the value of the investment at $1.00 per share; however, it is possible to lose money investing in these funds. The remainder is operating cash and certificates of deposit which are fully insured through the FDIC.
Investments: Investments consist of certificates of deposit and corporate notes and bonds that are traded on the open market and are classified as available-for-sale at December 31, 2016. Available-for-sale investments are reported at fair value with unrealized gains and losses excluded from operations and reported as a separate component of stockholders’ equity, net of tax (see Accumulated other comprehensive loss below).
Inventories: Inventories are stated at the lower of cost or market. Cost is determined by the first-in, first-out method. Provision to reduce inventories to the lower of cost or market is made based on a review of excess and obsolete inventories, estimates of future sales, examination of historical consumption rates and the related value of component parts.
36
Property, plant and equipment: Property, plant and equipment are recorded at cost. Depreciation is computed using the straight-line method. Depreciation included in cost of sales and selling, general and administrative expenses for continuing operations was $3,609,000, $3,212,000 and $2,375,000 for 2016, 2015 and 2014, respectively. Maintenance and repairs are charged to operations and additions or improvements are capitalized. Items of property sold, retired or otherwise disposed of are removed from the asset and accumulated depreciation accounts and any gains or losses on disposal are reflected in operations.
Intangible Assets: Intangible assets with indefinite useful lives are not amortized, but are tested at least annually for impairment.
Recoverability of long-lived assets: The Company reviews its long-lived assets periodically when impairment indicators exist as required under generally accepted accounting principles. Potential impairment is determined by comparing the carrying value of the assets with expected net cash flows expected to be provided by operating activities of the business or related products. If the sum of the expected future net cash flows is less than the carrying value, an impairment loss would be measured by comparing the amount by which the carrying value exceeds the fair value of the asset.
Warranty: The Company reserves for the estimated cost of product warranties at the time revenue is recognized. We estimate the costs of our warranty obligations based on our warranty policy or applicable contractual warranty, historical experience of known product failure rates, and use of materials and service delivery costs incurred in correcting product failures. Management reviews the estimated warranty liability on a quarterly basis to determine its adequacy.
The following table presents the changes in the Company’s warranty liability for the years ended December 31, 2016 and 2015, which relate to normal product warranties and a five-year obligation to provide for potential future liabilities for certain network equipment sales:
| Year Ended December 31 | ||||||||
| 2016 | 2015 | |||||||
| Beginning balance | $ | 554,000 | $ | 434,000 | ||||
| Amounts charged to expense | 147,000 | 231,000 | ||||||
| Actual warranty costs paid | (101,000 | ) | (111,000 | ) | ||||
| Ending balance | $ | 600,000 | $ | 554,000 | ||||
Accumulated other comprehensive loss: The components of accumulated other comprehensive loss are as follows:
| Foreign Currency Translation | Unrealized (loss)/gain on securities | Pension liability adjustment | Accumulated Other Comprehensive Loss | |||||||||||||
| December 31, 2015 | $ | (4,801,000 | ) | $ | (13,000 | ) | $ | 4,148,000 | $ | (666,000 | ) | |||||
| Net current period change | (141,000 | ) | 30,000 | (111,000 | ) | |||||||||||
| Reclassification adjustments into income | 4,238,000 | (4,148,000 | ) | 90,000 | ||||||||||||
| December 31, 2016 | $ | (704,000 | ) | $ | 17,000 | $ | — | $ | (687,000 | ) | ||||||
The Company recognized $4,238,000 in foreign currency translation losses within the income statement during the first quarter due to the substantial liquidation of our Austin Taylor subsidiary in the U.K. Refer to Note 7 for further information regarding the pension liability adjustment recognized in income in the first quarter of 2016. The functional currency of Austin Taylor and Net2Edge is the British pound. Assets and liabilities denominated in this foreign currency were translated into U.S. dollars at year-end exchange rates. Revenue and expense transactions were translated using average exchange rates. Suttle Costa Rica uses the U.S. dollar as their functional currency.
37
Revenue recognition: The Company’s manufacturing operations (Suttle, Transition Networks and Net2Edge) recognize revenue when the earnings process is complete, evidenced by persuasive evidence of an agreement, delivery has occurred or services have been rendered, the price is fixed or determinable, and collectability is reasonably assured. Revenue is recognized for domestic and international sales at the shipping point or delivery to customers, based on the related shipping terms. Risk of loss transfers at the point of shipment or delivery to customers, and the Company has no further obligation after such time. Sales are made directly to customers and through distributors. Payment terms for distributors are consistent with the terms of the Company’s direct customers. The Company records a provision for sales returns, sales incentives and warranty costs at the time of the sale based on historical experience and current trends.
JDL generally records revenue on hardware, software and related equipment sales and installation contracts when the revenue recognition criteria are met and products are installed and accepted by the customer. JDL records revenue on service contracts on a straight-line basis over the contract period, unless evidence suggests the revenue is earned in a different pattern. Each contract is individually reviewed to determine when the earnings process is complete.
Research and development: Research and development costs consist of outside testing services, equipment and supplies associated with enhancing existing products and developing new products. Research and development costs are expensed when incurred and totaled $5,366,000 in 2016, $8,291,000 in 2015 and $7,835,000 in 2014.
Net income per share: Basic net income per common share is based on the weighted average number of common shares outstanding during each year. Diluted net income per common share adjusts for the dilutive effect of potential common shares outstanding. The Company’s only potential common shares outstanding are stock options and shares associated with the long-term incentive compensation plans, which resulted in no dilutive effect for 2016 and 2015 and a dilutive effect of 18,384 shares in 2014. The Company calculates the dilutive effect of outstanding options and unvested shares using the treasury stock method. Due to the net loss in 2016 and 2015, there was no dilutive impact from outstanding stock options or unvested shares. The number of shares not included in the computation of diluted earnings per share because the options’ exercise price was greater than the average market price of common stock during the year for 2014 was 243,427. Options totaling 902,930 would have been excluded from the calculation of diluted earnings per share for year ended December 31, 2016, because the exercise price was greater than the average market price of common stock during the period and deferred stock awards totaling 133,982 shares would not have been included because of unmet performance conditions. Options totaling 691,924 would have been excluded from the calculation of diluted earnings per share for year ended December 31, 2015, because the exercise price was greater than the average market price of common stock during the period and deferred stock awards totaling 95,668 shares would not have been included because of unmet performance conditions.
Share based compensation: The Company accounts for share based compensation awards on a fair value basis. The estimated grant date fair value of each stock-based award is recognized in income over the requisite service period (generally the vesting period). The estimated fair value of each option is calculated using the Black-Scholes option-pricing model.
Accounting standards issued:
In May 2014, the Financial Accounting Standards Board (FASB) issued a new accounting standard update on revenue recognition from contracts with customers. The new guidance will replace all current U.S. GAAP guidance on this topic and eliminate all industry-specific guidance. According to the new guidance, revenue is recognized when promised goods or services are transferred to customers in an amount that reflects the consideration the Company expects to receive in exchange for those goods or services. As a result of the FASB’s July 2015 deferral of the standard’s required implementation date, the guidance is effective for interim and annual reporting periods beginning after December 15, 2017. The guidance permits companies to either apply the requirements retrospectively to all prior periods presented, or apply the requirements in the year of adoption, through a cumulative adjustment. We plan to adopt the modified retrospective approach. We are still evaluating the impact of this adoption and anticipate that the most significant impact will be within our JDL Technologies segment.
In July 2015, the FASB issued an accounting standard on inventory, which simplifies the subsequent measurement of inventory by requiring entities to measure inventory at the lower of cost or net realizable value, except for inventory measured using the last-in, first-out (LIFO) or the retail inventory methods. This standard requires entities to compare the cost of inventory to one measure – net realizable value. Net realizable value is the estimated selling price in the ordinary course of business, less reasonably predictable costs of completion, disposal and transportation. The standard is effective for the annual period beginning after December 15, 2016 and interim periods within those annual periods, with early adoption permitted, and is to be applied prospectively. The Company does not expect the adoption of this standard to have a material impact on its consolidated financial statements.
38
In November 2015, the FASB issued an accounting standard on deferred taxes, which removes the requirement to present deferred tax assets and liabilities as current and noncurrent on the balance sheet based on the classification of the related asset or liability, and instead requires classification of all deferred tax assets and liabilities as noncurrent. This guidance will be effective for interim and annual reporting periods beginning after December 15, 2016, and early adoption is permitted. Other than the prescribed classification of all deferred tax assets and liabilities as noncurrent, the Company does not expect the implementation of this standard to have a material impact on its consolidated financial statements.
In February 2016, the FASB issued new accounting requirements regarding accounting for leases, which requires an entity to recognize both assets and liabilities arising from financing and operating leases, along with additional qualitative and quantitative disclosures. The new standard is effective for fiscal years beginning after December 15, 2018, including interim periods within that reporting period, and early adoption is permitted. The Company does not expect the adoption of this standard to have a material impact on its consolidated financial statements.
In March 2016, the FASB issued a new accounting standard that will change certain aspects of accounting for share-based payments to employees, including the accounting for income taxes, forfeitures and statutory withholding requirements, as well as classification in the statement of cash flows. The new standard is effective for annual and interim periods beginning after December 15, 2016. The Company does not expect the adoption of this standard to have a material impact on its consolidated financial statements.
In August 2016, the FASB issued new accounting guidance regarding the classification of cash receipts and payments in the Statement of Cash Flows. This guidance is intended to reduce diversity in practice in how certain cash receipts and cash payments are presented and classified in the Consolidated Statement of Cash Flows by providing guidance on eight specific cash flow issues. The new standard is effective retrospectively on January 1, 2018, with early adoption permitted. We have not yet determined the impact this standard will have on our financial condition or results of operations.
Accounting standards adopted:
In April 2015, the FASB issued accounting guidance that changes the presentation of debt issuance costs. The core principle of this revised accounting guidance is that debt issuance costs are not assets, but adjustments to the carrying cost of debt. The Company adopted this guidance in the first quarter of 2016 with no material impact on its consolidated financial statements.
In August 2014, the FASB issued accounting guidance that amended the existing requirements for disclosing information about an entity’s ability to continue as a going concern and explicitly requires management to assess an entity’s ability to continue as a going concern and to provide related footnote disclosure in certain circumstances. This guidance was effective for annual periods ending after December 15, 2016, and annual and interim periods thereafter. The Company adopted this guidance in 2016 and management does not believe there is substantial doubt about the entity’s ability to continue as a going concern.
NOTE 2 –CASH EQUIVALENTS AND INVESTMENTS
The following tables show the Company’s cash equivalents and available-for-sale securities’ amortized cost, gross unrealized gains, gross unrealized losses and fair value by significant investment category recorded as cash equivalents or short and long term investments as of December 31, 2016 and December 31, 2015:
| December 31, 2016 | ||||||||||||||||||||||||||||
| Amortized Cost | Gross Unrealized Gains | Gross Unrealized Losses | Fair Value | Cash Equivalents | Short-Term Investments | Long-Term Investments | ||||||||||||||||||||||
| Cash equivalents: | ||||||||||||||||||||||||||||
| Money Market funds | $ | 3,851,000 | $ | — | $ | — | $ | 3,851,000 | $ | 3,851,000 | $ | $ | ||||||||||||||||
| Subtotal | 3,851,000 | — | — | 3,851,000 | 3,851,000 | — | — | |||||||||||||||||||||
| Investments: | ||||||||||||||||||||||||||||
| Certificates of deposit | 4,291,000 | 4,000 | (1,000 | ) | 4,294,000 | — | 4,294,000 | — | ||||||||||||||||||||
| Corporate Notes/Bonds | 1,511,000 | — | — | 1,511,000 | — | 1,511,000 | — | |||||||||||||||||||||
| Subtotal | 5,802,000 | 4,000 | (1,000 | ) | 5,805,000 | — | 5,805,000 | — | ||||||||||||||||||||
| Total | $ | 9,653,000 | $ | 4,000 | $ | (1,000 | ) | $ | 9,656,000 | $ | 3,851,000 | $ | 5,805,000 | $ | — | |||||||||||||
39
| December 31, 2015 | ||||||||||||||||||||||||||||
| Amortized Cost | Gross Unrealized Gains | Gross Unrealized Losses | Fair Value | Cash Equivalents | Short-Term Investments | Long-Term Investments | ||||||||||||||||||||||
| Cash equivalents: | ||||||||||||||||||||||||||||
| Money Market funds | $ | 1,944,000 | $ | — | $ | — | $ | 1,944,000 | $ | 1,944,000 | $ | $ | ||||||||||||||||
| Subtotal | 1,944,000 | — | — | 1,944,000 | 1,944,000 | — | — | |||||||||||||||||||||
| Investments: | ||||||||||||||||||||||||||||
| Certificates of deposit | 5,493,000 | 3,000 | (8,000 | ) | 5,488,000 | — | 1,202,000 | 4,286,000 | ||||||||||||||||||||
| Corporate Notes/Bonds | 6,056,000 | — | (22,000 | ) | 6,034,000 | — | 4,027,000 | 2,007,000 | ||||||||||||||||||||
| Subtotal | 11,549,000 | 3,000 | (30,000 | ) | 11,522,000 | — | 5,229,000 | 6,293,000 | ||||||||||||||||||||
| Total | $ | 13,493,000 | $ | 3,000 | $ | (30,000 | ) | $ | 13,466,000 | $ | 1,944,000 | $ | 5,229,000 | $ | 6,293,000 | |||||||||||||
The Company tests for other than temporary losses on a quarterly basis and has considered the unrealized losses indicated above to be temporary in nature. The Company intends to hold the investments until it can recover the full principal amount and has the ability to do so based on other sources of liquidity. The Company expects such recoveries to occur prior to the contractual maturities. All unrealized losses as of December 31, 2016 were in a continuous unrealized loss position for less than twelve months and are not deemed to be other than temporarily impaired as of December 31, 2016.
The following table summarizes the estimated fair value of our investments, designated as available-for-sale and classified by the contractual maturity date of the securities as of December 31, 2016:
| Amortized Cost | Estimated Market Value | |||||||
| Due within one year | $ | 5,802,000 | $ | 5,805,000 | ||||
| Due after one year through five years | 0 | 0 | ||||||
| $ | 5,802,000 | $ | 5,805,000 | |||||
The Company did not recognize any gross realized gains or gross realized losses during the years ending December 31, 2016 and 2015, respectively. If the Company had realized gains or losses, they would be included within investment and other income in the accompanying consolidated statements of income.
NOTE 3 - INVENTORIES
Inventories consist of:
| December 31 | ||||||||
| 2016 | 2015 | |||||||
| Finished goods | $ | 12,083,000 | $ | 14,112,000 | ||||
| Raw and processed materials | 10,122,000 | 10,874,000 | ||||||
| $ | 22,205,000 | $ | 24,986,000 | |||||
40
NOTE 4 - PROPERTY, PLANT AND EQUIPMENT
Property, plant and equipment and the estimated useful lives are as follows:
| Estimated | December 31 | |||||||||
| useful life | 2016 | 2015 | ||||||||
| Land | $ | 2,951,000 | $ | 3,099,000 | ||||||
| Buildings and improvements | 7-40 years | 9,112,000 | 9,422,000 | |||||||
| Machinery and equipment | 3-15 years | 31,394,000 | 28,985,000 | |||||||
| Furniture and fixtures | 5-10 years | 4,811,000 | 5,225,000 | |||||||
| Construction in progress | 259,000 | 1,166,000 | ||||||||
| 48,527,000 | 47,897,000 | |||||||||
| Less accumulated depreciation | (32,807,000 | ) | (30,429,000 | ) | ||||||
| $ | 15,720,000 | $ | 17,468,000 | |||||||
NOTE 5 – ACQUISITION
On June 1, 2015, the Company acquired all of the shares of Twisted Technologies, Inc. (“Twisted Technologies”). The purchase price was $1,463,000, with cash acquired totaling $83,000. The purchase price included initial consideration of $1,000,000, deferred consideration of $300,000 paid out on March 31, 2016, and $163,000 in estimated contingent consideration. The Company has agreed to pay consideration contingent upon the Twisted Technologies business meeting revenue targets over a three-year period, with the consideration to be paid after each annual period has lapsed. The Company has recognized $163,000 as the estimated fair value of the contingent consideration at the date of acquisition. The maximum payout is not limited. At December 31, 2016 and 2015, the Company had estimated liabilities of $0 and $442,000, respectively, related to these outstanding deferred and contingent consideration payments.
The assets and liabilities of Twisted Technologies were recorded in the consolidated balance sheet within the JDL Technologies segment at December 31, 2016. The purchase price allocation was based on estimates of the fair value of assets acquired and liabilities assumed and included total assets of $1,591,000, including goodwill of $1,463,000, and total liabilities of $128,000. The entire goodwill balance is deductible for tax purposes. The pro forma impact of Twisted Technologies was not significant to the Company’s results for the year ended December 31, 2015.
NOTE 6 –GOODWILL AND INTANGIBLE ASSETS
The changes in the carrying amount of goodwill for the year ended December 31, 2016 by segment are as follows:
| JDL | ||||
| January 1, 2016 | $ | 1,463,000 | ||
| Goodwill acquired | — | |||
| December 31, 2016 | $ | 1,463,000 | ||
| Gross goodwill | 1,463,000 | |||
| Accumulated impairment loss | — | |||
| Balance at December 31, 2016 | $ | 1,463,000 | ||
41
The Company’s identifiable intangible assets with finite lives are being amortized over their estimated useful lives and are included within other assets in the consolidated balance sheets and were as follows:
| December 31, 2016 | ||||||||||||||||
| Gross
Carrying Amount | Accumulated Amortization | Foreign Currency Translation | Net | |||||||||||||
| Trademarks | $ | 91,000 | $ | (50,000 | ) | $ | (20,000 | ) | $ | 21,000 | ||||||
| Customer relationships | 491,000 | (200,000 | ) | (122,000 | ) | 169,000 | ||||||||||
| Technology | 229,000 | (172,000 | ) | (57,000 | ) | — | ||||||||||
| $ | 811,000 | $ | (422,000 | ) | $ | (199,000 | ) | $ | 190,000 | |||||||
| December 31, 2015 | ||||||||||||||||
| Gross
Carrying Amount | Accumulated Amortization | Foreign Currency Translation | Net | |||||||||||||
| Trademarks | $ | 91,000 | $ | (48,000 | ) | $ | (8,000 | ) | $ | 35,000 | ||||||
| Customer relationships | 491,000 | (197,000 | ) | (46,000 | ) | 248,000 | ||||||||||
| Technology | 229,000 | (183,000 | ) | (22,000 | ) | 24,000 | ||||||||||
| $ | 811,000 | $ | (428,000 | ) | $ | (76,000 | ) | $ | 307,000 | |||||||
Amortization expense on these identifiable intangible assets was $74,000, $101,000, and $107,000 in 2016, 2015, and 2014 respectively. The amortization expense is included in selling, general and administrative expenses. The estimated future amortization expense for identifiable intangible assets during the next five fiscal years is as follows:
| Year Ending December 31: | ||||||
| 2017 | $ | 47,000 | ||||
| 2018 | 43,000 | |||||
| 2019 | 38,000 | |||||
| 2020 | 38,000 | |||||
| 2021 | 22,000 | |||||
NOTE 7 - EMPLOYEE RETIREMENT BENEFITS
The Company has an Employee Savings Plan (401(k)) and matches a percentage of employee contributions up to six percent of compensation. Contributions to the plan in 2016, 2015 and 2014 were $554,000, $591,000, and $528,000, respectively.
The Company’s U.K.-based subsidiary Austin Taylor maintained a defined benefit pension plan for its employees through March 31, 2016. The Company does not provide any other post-retirement benefits to its employees. Components of the Company’s net periodic pension (benefit) cost are:
| 2016 | 2015 | 2014 | ||||||||||
| Service cost | $ | — | $ | 50,000 | $ | 8,000 | ||||||
| Interest cost | 26,000 | 122,000 | 143,000 | |||||||||
| Expected return on assets | (24,000 | ) | (162,000 | ) | (188,000 | ) | ||||||
| Plan settlement costs | (43,000 | ) | 1,720,000 | — | ||||||||
| Amortization of prior service cost | — | — | — | |||||||||
| Net periodic pension (benefit) cost | $ | (41,000 | ) | $ | 1,730,000 | $ | (37,000 | ) | ||||
42
The Company settled all its obligations under the Austin Taylor pension plan in the first quarter of 2016. The Company had contributed $650,000 toward the settlement of the pension into annuities in 2015, which resulted in the recognition of $1,222,000 of pension settlement costs in the income statement in the fourth quarter of 2015. The Company contributed an additional $68,000 toward the settlement in the first quarter of 2016, which resulted in a benefit of $43,000 recorded within operating expenses. As a result of the final settlement of all of its pension obligations, in the first quarter of 2016, the Company recorded $4,148,000 in pension liability adjustment gains previously recorded in accumulated other comprehensive income within operating expenses in the consolidated statement of income.
NOTE 8 – COMMITMENTS AND CONTINGENCIES
Operating leases: The Company leases land, buildings and equipment under operating leases with original terms from 1 to 5 years. Total rent expense was $620,000, $517,000 and $546,000 in 2016, 2015 and 2014 respectively. At December 31, 2016, the Company was obligated under non-cancelable operating leases to make minimum annual future lease payments as follows:
| Year Ending December 31: | ||||||
| 2017 | $ | 253,000 | ||||
| 2018 | 205,000 | |||||
| 2019 | 125,000 | |||||
| 2020 | 83,000 | |||||
| 2021 | 83,000 | |||||
| Thereafter | 447,000 | |||||
| $ | 1,196,000 | |||||
Long-term debt: The mortgage on the Company’s headquarters building was payable in monthly installments and carried an interest rate of 6.83%. The mortgage matured on March 1, 2016 and the Company made payments totaling $104,000 in the first quarter of 2016 to fully settle the liability. The mortgage was secured by the building.
Line of credit: The Company has a $15,000,000 line of credit from Wells Fargo Bank. The Company had no outstanding borrowings against the line of credit at December 31, 2016 and 2015. Due to the revolving nature of loans under our credit facility, additional borrowings and periodic repayments and re-borrowings may be made until the maturity date. The total amount available for borrowings under our credit facility at December 31, 2016 was $10,901,000, based on the borrowing base calculation. Interest on borrowings on the credit line is at LIBOR plus 2.0% (2.8% at December 31, 2016). The credit agreement expires August 12, 2021 and is secured by assets of the Company. Our credit agreement contains financial covenants including a minimum liquidity balance of $10,000,000. Liquidity is calculated as the sum of unrestricted cash, marketable securities and the availability on the line of credit.
As of December 31, 2016, the Company had no other material commitments (either cancelable or non-cancelable) for capital expenditures or other purchase commitments related to ongoing operations.
Long-term compensation plans: The Company has a long term incentive plan. The plan provides long-term competitive compensation to enable the Company to attract and retain qualified executive talent and to reward employees for achieving goals and improving company performance. The plan provides grants of “performance units” made at the beginning of performance periods and paid at the end of the period if performance goals are met. Awards were previously made every other year and are paid following the end of the cycle with annual vesting. Payment in the case of retirement, disability or death will be on a pro rata basis. The Company recognized expense of $16,000, $0 and $0 in 2016, 2015 and 2014, respectively. Accrual balances for long-term compensation plans at December 31, 2016 and 2015 were $16,000 and $0, respectively. Awards paid were $0 in 2016, $0 in 2015 and $199,000 in 2014. Awards for the 2012 to 2014 cycles were paid out 25% in cash and 75% in stock. Awards for the 2013 to 2015 cycles, 2014 to 2016 cycles, and 2015 to 2017 cycles will be paid out 100% in stock. Awards under the 2016 to 2018 plan will be paid out 50% in cash and 50% in stock. The stock portion of these awards are treated as equity plans and included within the Stock Compensation footnote within the Deferred Stock Outstanding section below.
43
Other contingencies: In the ordinary course of business, the Company is exposed to legal actions and claims and incurs costs to defend against such actions and claims. Company management is not aware of any outstanding or pending legal actions or claims that would materially affect the Company’s financial position, results of operations, or cash flows.
NOTE 9 – STOCK COMPENSATION
2011 Executive Incentive Compensation Plan
On March 28, 2011 the Board adopted and on May 19, 2011 the Company’s shareholders approved the Company’s 2011 Executive Incentive Compensation Plan (“2011 Incentive Plan”). The 2011 Incentive Plan authorizes incentive awards to officers, key employees and non-employee directors in the form of options (incentive and non-qualified), stock appreciation rights, restricted stock, restricted stock units, performance stock units (“deferred stock”), performance cash units, and other awards in stock, cash, or a combination of stock and cash. On May 21, 2015, the Company’s shareholders approved an amendment to the 2011 Incentive Plan to increase the authorized shares by 1,000,000 to 2,000,000. As a result, up to 2,000,000 shares of our common stock may be issued pursuant to awards under the 2011 Incentive Plan, as amended.
During 2016, stock options covering 325,968 shares were awarded to key executive employees and non-employee directors, which options expire seven years from the date of award and vest 25% each year beginning one year after the date of award. The Company also granted deferred stock awards of 93,828 shares to key employees during 2016 under the Company’s long-term incentive plan for the 2016 to 2018 period. The actual number of shares of deferred stock, if any, that are ultimately earned by the respective employees will be determined based on achievement against performance goals for each of the three years ending December 31, 2018 and the shares earned will be issued in the first quarter of 2019 to those key employees still with the Company at that time.
At December 31, 2016, 137,583 shares have been issued under the 2011 Incentive Plan, 1,026,094 shares are subject to currently outstanding options, deferred stock awards, and unvested restricted stock units, and 836,323 shares remained available for future issuance under the 2011 Incentive Plan.
Stock Option Plan for Directors
Shares of common stock are reserved for issuance to non-employee directors under options granted by the Company prior to 2011 under its Stock Option Plan for Non-Employee Directors (the “Director Plan”). Under the Director Plan nonqualified stock options to acquire 3,000 shares of common stock were automatically granted to each non-employee director concurrent with annual meetings of shareholders in 2010 and earlier years and vested immediately. The exercise price of options granted was the fair market value of the common stock on the date of the respective shareholder meetings. Options granted under the Director Plan expire 10 years from date of grant.
The Director Plan was suspended as of May 19, 2011 to prohibit automatic option grants in 2011 in connection with seeking and receiving shareholder approval of the 2011 Incentive Plan, at the 2011 Annual Meeting of Shareholders. As shareholder approval was received, the Board amended the Director Plan to prohibit any future option awards under that plan on August 11, 2011. As of December 31, 2016, there were 63,000 shares subject to outstanding options under the Director Plan.
1992 Stock Plan
Under the Company’s 1992 Stock Plan (“the Stock Plan”), shares of common stock may be issued pursuant to stock options, restricted stock or deferred stock grants to officers and key employees. Exercise prices of stock options under the Stock Plan cannot be less than fair market value of the stock on the date of grant. Rules and conditions governing awards of stock options, restricted stock and deferred stock are determined by the Compensation Committee of the Board of Directors, subject to certain limitations in the Stock Plan. When seeking approval of the 2011 Incentive Plan at the 2011 Annual Meeting of Shareholders, the Company committed to amending the Stock Plan to prohibit the issuance of future equity awards if such approval was given. Effective August 11, 2011, the amendment to prohibit future stock options or other equity awards was approved by the Board.
At December 31, 2016 after reserving for stock options and deferred stock awards described in the two preceding paragraphs and adjusting for forfeitures and issuances during the year, there were 10,230 shares reserved for issuance under the Stock Plan. The Company has not awarded stock options or deferred stock under the Stock Plan since 2011.
44
Stock Options Outstanding
The following table summarizes changes in the number of outstanding stock options under the Director Plan, Stock Plan and the 2011 Incentive Plan during the three years ended December 31, 2016.
| Weighted average | Weighted average | |||||||||
| exercise price | remaining | |||||||||
| Options | per share | contractual term | ||||||||
| Outstanding – December 31, 2013 | 309,439 | $ | 11.66 | 4.13 years | ||||||
| Awarded | 317,722 | 12.30 | ||||||||
| Exercised | (12,000 | ) | 8.28 | |||||||
| Forfeited | (74,757 | ) | 13.20 | |||||||
| Outstanding – December 31, 2014 | 540,404 | $ | 11.90 | 5.13 years | ||||||
| Awarded | 248,258 | 11.31 | ||||||||
| Exercised | (12,000 | ) | 10.21 | |||||||
| Forfeited | (54,738 | ) | 12.21 | |||||||
| Outstanding – December 31, 2015 | 721,924 | $ | 11.70 | 4.89 years | ||||||
| Awarded | 325,968 | 6.66 | ||||||||
| Exercised | — | — | ||||||||
| Forfeited | (124,962 | ) | 10.39 | |||||||
| Outstanding – December 31, 2016 | 922,930 | 10.10 | 4.9 years | |||||||
| Exercisable at December 31, 2016 | 501,599 | $ | 11.30 | 4.18 years | ||||||
| Expected to vest December 31, 2016 | 922,930 | 10.10 | 4.9 years | |||||||
The fair value of awards issued under the Company’s stock option plan is estimated at grant date using the Black-Scholes option-pricing model. The following table displays the assumptions used in the model.
| Year Ended December 31 | ||||||||||||
| 2016 | 2015 | 2014 | ||||||||||
| Expected volatility | 29.5 | % | 30.7 | % | 31.4 | % | ||||||
| Risk free interest rate | 1.5 | % | 1.6 | % | 2.7 | % | ||||||
| Expected holding period | 6 years | 6 years | 6 years | |||||||||
| Dividend yield | 9.1 | % | 5.7 | % | 5.2 | % | ||||||
Total unrecognized compensation expense was $168,000 as of December 31, 2016, which is expected to be recognized over the next 2.1 years. The aggregate intrinsic value of all outstanding options, exercisable options, and options expected to vest (the amount by which the market price of the stock on the last day of the period exceeded the market price of the stock on the date of grant) was $0 based on the Company’s stock price at December 31, 2016. The intrinsic value of options exercised during the year was $0, $10,000 and $40,000 in 2016, 2015 and 2014, respectively. Net cash proceeds from the exercise of all stock options were $0, $0 and $99,000 for 2016, 2015 and 2014, respectively. The following table summarizes the status of stock options outstanding at December 31, 2016:
| Weighted Average | Weighted | |||||||||||
| Remaining | Average | |||||||||||
| Range of Exercise Prices | Shares | Option Life | Exercise Price | |||||||||
| $5.50 to $7.99 | 289,200 | 6.3 years | 6.61 | |||||||||
| $8.00 to $9.99 | 18,000 | 2.4 years | 9.73 | |||||||||
| $10.00 to $12.00 | 466,824 | 4.5 years | 11.32 | |||||||||
| $12.01 to $14.50 | 148,906 | 3.7 years | 13.07 | |||||||||
The Company receives an income tax benefit related to the gains received by officers and key employees who make disqualifying dispositions of stock received on exercise of qualified incentive stock options and on non-qualified options. The amount of tax benefit received by the Company was $0, $4,000 and $14,000 in 2016, 2015 and 2014 respectively. The tax benefit amounts have been credited to additional paid-in capital.
45
Deferred Stock Outstanding
The following table summarizes the changes in the number of deferred stock shares under the Stock Plan and 2011 Incentive Plan over the period December 31, 2013 to December 31, 2016:
| Weighted Average | |||||||||
| Grant Date | |||||||||
| Shares | Fair Value | ||||||||
| Outstanding – December 31, 2013 | 200,140 | $ | 11.47 | ||||||
| Granted | 48,824 | 12.52 | |||||||
| Vested | (16,754 | ) | 13.81 | ||||||
| Forfeited | (70,896 | ) | 13.02 | ||||||
| Outstanding – December 31, 2014 | 161,314 | 10.87 | |||||||
| Granted | 103,017 | 11.52 | |||||||
| Vested | (18,940 | ) | 12.37 | ||||||
| Forfeited | (118,964 | ) | 10.27 | ||||||
| Outstanding – December 31, 2015 | 126,427 | 11.73 | |||||||
| Granted | 102,161 | 7.28 | |||||||
| Vested | (23,095 | ) | 11.36 | ||||||
| Forfeited | (56,233 | ) | 9.60 | ||||||
| Outstanding – December 31, 2016 | 149,260 | 9.55 | |||||||
The grant date fair value is calculated based on the Company’s closing stock price as of the grant date. As of December 31, 2016, the total unrecognized compensation expense related to the deferred stock shares was $171,000 and is expected to be recognized over a weighted-average period of 1.2 years.
Restricted Stock Units Outstanding
The following table summarizes the changes in the number of restricted stock units under the 2011 Incentive Plan over the period December 31, 2013 to December 31, 2016:
| Weighted Average | |||||||||
| Grant Date | |||||||||
| Shares | Fair Value | ||||||||
| Outstanding – December 31, 2013 | 53,193 | $ | 10.44 | ||||||
| Granted | 13,973 | 11.98 | |||||||
| Vested | (28,015 | ) | 10.89 | ||||||
| Forfeited | — | — | |||||||
| Outstanding – December 31, 2014 | 39,151 | 10.67 | |||||||
| Granted | 20,979 | 11.06 | |||||||
| Vested | (27,314 | ) | 10.08 | ||||||
| Forfeited | — | — | |||||||
| Outstanding – December 31, 2015 | 32,816 | 11.41 | |||||||
| Granted | 13,793 | 6.33 | |||||||
| Vested | (19,023 | ) | 10.90 | ||||||
| Forfeited | (452 | ) | 11.05 | ||||||
| Outstanding – December 31, 2016 | 27,134 | 8.65 | |||||||
The grant date fair value is calculated based on the Company’s closing stock price as of the grant date. As of December 31, 2016, the total unrecognized compensation expense related to the restricted stock units was $33,000 and is expected to be recognized over a weighted-average period of 0.4 years.
46
Compensation Expense
Share-based compensation expense is recognized based on the fair value of awards granted over the vesting period of the award. Share-based compensation expense recognized for 2016, 2015 and 2014 was $632,000, $899,000 and $785,000 before income taxes and $411,000, $584,000 and $510,000 after income taxes, respectively. Share-based compensation expense is recorded as a part of selling, general and administrative expenses.
Employee Stock Purchase Plan
Under the Company’s Employee Stock Purchase Plan (“ESPP”) employees are able to acquire shares of common stock at 85% of the price at the end of each current quarterly plan term. The most recent term ended December 31, 2016. The ESPP is considered compensatory under current rules. At December 31, 2016, after giving effect to the shares issued as of that date, 76,865 shares remain available for purchase under the ESPP.
Employee Stock Ownership Plan (ESOP)
All eligible employees of the Company participate in the ESOP after completing one year of service. Contributions are allocated to each participant based on compensation and vest 20% after two years of service and incrementally thereafter, with full vesting after six years. At December 31, 2016, the ESOP held 595,959 shares of the Company’s common stock, all of which have been allocated to the accounts of eligible employees. Contributions to the plan are determined by the Board of Directors and can be made in cash or shares of the Company’s stock. The 2016 ESOP contribution was $218,758 for which the Company will issue 47,248 shares in March 2016. The 2015 ESOP contribution was $467,731 for which the Company issued 60,197 shares in 2016. The Company’s 2014 ESOP contribution was $395,220 for which the Company issued 37,640 shares of common stock to the ESOP in 2015.
NOTE 10 – COMMON STOCK
PURCHASES OF COMMUNICATIONS SYSTEMS, INC. COMMON STOCK
In October 2008, the Company’s Board of Directors authorized the repurchase of shares of the Company’s stock pursuant to Exchange Act Rule 10b-18 on the open market, in block trades or in private transactions. At December 31, 2016, 411,910 additional shares could be repurchased under outstanding Board authorizations.
SHAREHOLDER RIGHTS PLAN
On December 23, 2009 the Board of Directors adopted a shareholders’ rights plan. Under this plan, the Board of Directors declared a distribution of one right per share of common stock. Each right entitles the holder to purchase 1/100th of a share of a new series of Junior Participating Preferred Stock of the Company at an initial exercise price of $41. The rights expire on December 23, 2019. The rights will become exercisable only following the acquisition by a person or group, without the prior consent of the Board of Directors, of 16.5% or more of the Company’s voting stock, or following the announcement of a tender offer or exchange offer to acquire an interest of 16.5% or more. If the rights become exercisable, each rightholder will be entitled to purchase, at the exercise price, common stock with a market value equal to twice the exercise price. Should the Company be acquired, each right would entitle the holder to purchase, at the exercise price, common stock of the acquiring company with a market value equal to twice the exercise price. Any rights owned by the acquiring person or group would become void.
NOTE 11 - INCOME TAXES
Income tax expense from continuing operations consists of the following:
| Year Ended December 31 | ||||||||||||
| 2016 | 2015 | 2014 | ||||||||||
| Current year income taxes: | ||||||||||||
| Federal | $ | 27,000 | $ | (3,142,000 | ) | $ | 328,000 | |||||
| State | (20,000 | ) | (85,000 | ) | (12,000 | ) | ||||||
| Foreign | 258,000 | 254,000 | 113,000 | |||||||||
| 265,000 | (2,973,000 | ) | $ | 429,000 | ||||||||
| Deferred income taxes (benefit): | ||||||||||||
| Federal | $ | 48,000 | $ | 2,191,000 | $ | 761,000 | ||||||
| State | 5,000 | 38,000 | 40,000 | |||||||||
| Foreign | (61,000 | ) | (9,000 | ) | (11,000 | ) | ||||||
| (8,000 | ) | 2,220,000 | 790,000 | |||||||||
| $ | 257,000 | $ | (753,000 | ) | $ | 1,219,000 | ||||||
47
Austin Taylor Communications, Ltd. operates in the United Kingdom (U.K.) and is subject to U.K. rather than U.S. income taxes. Austin Taylor had pretax income of $615,000 in 2016 and pretax losses of $1,742,000 and $389,000 in 2015 and 2014 respectively. At the end of 2016, Austin Taylor’s net operating loss carry-forward was $7,462,000. The Company remains uncertain that it will be able to generate the future income needed to realize the tax benefit of the carry-forward. Accordingly, the Company has continued to maintain its deferred tax valuation allowance against any potential carry-forward benefit from Austin Taylor.
Net2Edge, formally known as Transition Networks EMEA, Ltd., operates in the U.K. and is subject to U.K. rather than U.S. income taxes. Transition Networks EMEA, Ltd. had pretax losses of $2,114,000 and $54,000 in 2016 and 2014, respectively and pretax losses of $558,000 in 2015. Austin Taylor’s net operating loss provided group relief to Transition Networks EMEA, Ltd. during 2015. At the end of 2016, Transition Networks EMEA, Ltd.’s net operating loss carry-forward was $2,040,000.
In 2007, Transition Networks China began operations in China and is subject to Chinese taxes rather than U.S. income taxes. Transition Networks China had pretax loss of $0 and $29,000 in 2016 and 2015, respectively, and pretax income of $345,000 in 2014. At the end of 2016, Transition Networks China’s net operating loss carry-forward was $374,000. Due to the history of losses in China the Company remains uncertain that it will be able to generate the future income needed to realize the tax benefit of the carry-forward. Accordingly, the Company has continued to maintain its deferred tax valuation reserve against the potential carry-forward benefit. Transition Networks China ceased operations in 2014 and incurred minor non-operating expenditures in 2015 to close the operations. As of 2016, Transition Networks China no longer has any operational activity.
Suttle Costa Rica operates in Costa Rica and is subject to Costa Rica income taxes. In 2005, the Board of Directors of Suttle Costa Rica declared a dividend in the amount of $3,500,000 payable to the Company. The dividend and related “dividend reinvestment plan” qualify under Internal Revenue Code Sec. 965, which allows the Company to receive an 85% dividend-received deduction if the amount of the dividend is reinvested in the United States pursuant to a domestic reinvestment plan. The Company made the required qualified capital expenditures in 2006. It is the Company’s intention to maintain the remaining undistributed earnings in its Costa Rica subsidiary to support continued operations there. No deferred taxes have been provided for the undistributed earnings. As of December 31, 2016, the amount of unremitted earnings outside of the United States was not significant to the Company’s liquidity and was available to fund investments abroad.
Suttle Costa Rica had pretax income of $463,000, $446,000 and $321,000 in 2016, 2015 and 2014 respectively.
In April 2016, we received notification from the Internal Revenue Service that they would be performing an examination of our 2012 and 2013 federal consolidated income tax returns. As of December 31, 2016, the examination was still in progress. We do not expect that any settlement or payment that may result from the examination will have a material effect on our results of operations.
The provision for income taxes for continuing operations varied from the federal statutory tax rate as follows:
| Year Ended December 31 | ||||||||||||
| 2016 | 2015 | 2014 | ||||||||||
| Tax at U.S. statutory rate | 35.0 | % | 35.0 | % | 35.0 | % | ||||||
| Surtax exemption | (0.6 | ) | (1.1 | ) | (0.7 | ) | ||||||
| State income taxes, net of federal benefit | 0.2 | 0.6 | 1.0 | |||||||||
| Foreign income taxes, net of foreign tax credits | (7.2 | ) | (3.6 | ) | 7.8 | |||||||
| Other nondeductible items | (0.9 | ) | 0.0 | 3.1 | ||||||||
| Effect of (decrease) increase in uncertain tax positions | 0.0 | (1.4 | ) | (10.2 | ) | |||||||
| Federal credits | — | 15.1 | — | |||||||||
| Change in valuation allowance | (30.1 | ) | (35.2 | ) | — | |||||||
| Other | 0.3 | (2.2 | ) | 2.3 | ||||||||
| Effective tax rate | -3.3 | % | 7.2 | % | 38.3 | % | ||||||
48
Deferred tax assets and liabilities as of December 31 related to the following:
| 2016 | 2015 | |||||||
| Deferred tax assets: | ||||||||
| Allowance for doubtful accounts | $ | 26,000 | $ | 41,000 | ||||
| Inventory | 2,381,000 | 2,016,000 | ||||||
| Accrued and prepaid expenses | 449,000 | 440,000 | ||||||
| Domestic net operating loss carry-forward | 2,784,000 | 1,208,000 | ||||||
| Long-term compensation plans | 344,000 | 351,000 | ||||||
| Nonemployee director stock compensation | 663,000 | 554,000 | ||||||
| Other stock compensation | 210,000 | 195,000 | ||||||
| Foreign net operating loss carry-forwards and credits | 2,129,000 | 2,008,000 | ||||||
| Federal and state credits | 926,000 | 927,000 | ||||||
| Other | 38,000 | 30,000 | ||||||
| Gross deferred tax assets | 9,950,000 | 7,770,000 | ||||||
| Valuation allowance | (8,117,000 | ) | (5,668,000 | ) | ||||
| Net deferred tax assets | 1,833,000 | 2,102,000 | ||||||
| Deferred tax liabilities | ||||||||
| Depreciation | (1,817,000 | ) | (2,141,000 | ) | ||||
| Intangible assets | (69,000 | ) | (22,000 | ) | ||||
| Net deferred tax liability | (1,886,000 | ) | (2,163,000 | ) | ||||
| Total net deferred tax (liability) asset | $ | (53,000 | ) | $ | (61,000 | ) | ||
The Company assesses the available positive and negative evidence to estimate if sufficient future taxable income will be generated to use the existing deferred tax assets. A significant piece of objective negative evidence evaluated was the cumulative loss incurred over the three-year period ending December 31, 2016. Such objective evidence limits the ability to consider other subjective evidence such as the projections for future growth. On the basis of this evaluation, as of December 31, 2016, a valuation allowance of $8,117,000 has been recorded to reflect the portion of the deferred tax asset that is more likely than not to be realized. The amount of deferred tax asset considered realizable, however, could be adjusted if estimates of future taxable income during the carryforward period are reduced or increased or if objective negative evidence in the form of cumulative losses is no longer present and additional weight may be given to subjective evidence such as the Company’s projections for growth.
At December 31, 2016, the Company has a federal net operating loss carryforward from 2016 activity of approximately $8,432,000 that is available to offset future taxable income and begins to expire in 2035. Included in the federal net operating loss amount is approximately $203,000 of deductions relating from the exercise of stock options.
During 2015, the Company engaged in a research and development tax credit study for the tax years 2011 to 2014. As a result of this study, the Company claimed $1,554,000 of federal and $1,024,000 of state research and development credits. The Company amended prior year tax returns to claim these credits and offset prior year taxes paid. Credits not utilized to reduce taxes are available to be carried forward. At December 31, 2016, the Company has an estimated federal research and development credit carryforward of approximately $496,000 and a state research and development credit carryforward of approximately $594,000.
49
The Company assesses uncertain tax positions in accordance with ASC 740. Under this method, the Company must recognize the tax benefit from an uncertain tax position only if it is more likely than not that the tax position will be sustained on examination by the taxing authorities, based on the technical merits of the position. The tax benefits recognized in the financial statements from such uncertain tax positions are measured based on the largest benefit that has a greater than fifty percent likelihood of being realized upon ultimate resolution. The Company’s practice is to recognize interest and penalties related to income tax matters in income tax expense.
Changes in the Company’s uncertain tax positions are summarized as follows:
| 2016 | 2015 | 2014 | ||||||||||
| Uncertain tax positions – January 1 | $ | 217,000 | $ | 75,000 | $ | 240,000 | ||||||
| Gross increases - tax positions in prior period | 0 | 142,000 | 0 | |||||||||
| Gross decreases - tax positions in prior period | 0 | 0 | (73,000 | ) | ||||||||
| Settlements | 0 | 0 | (85,000 | ) | ||||||||
| Expiration of statute of limitations | (10,000 | ) | 0 | (7,000 | ) | |||||||
| Uncertain tax positions – December 31, 2016 | $ | 207,000 | $ | 217,000 | $ | 75,000 | ||||||
Included in the balance of uncertain tax positions at December 31, 2016 are $219,000 of tax benefits that if recognized would affect the tax rate. There are no expected significant changes in the Company’s uncertain tax positions in the next twelve months. The Company’s income tax liability accounts included accruals for interest and penalties of $19,000 at December 31, 2016. The Company’s 2016 income tax expense decreased by $15,000 due to net decreases for accrued interest and penalties.
The Company’s federal and state tax returns and tax returns it has filed in Costa Rica and the United Kingdom are open for review going back to the 2012 tax year.
NOTE 12- INFORMATION CONCERNING INDUSTRY SEGMENTS AND MAJOR CUSTOMERS
Effective January 1, 2016, the Company realigned its business operations. As a result of the realignment, the Company has segregated its Transition Networks subsidiary TN EMEA (now renamed Net2Edge) as a separate operating segment because Net2Edge’s business has a distinct product offering, requires different management and addresses a different market opportunity. Following this realignment, the Company classifies its businesses into four segments as follows:
| ● | Suttle manufactures and markets connectivity infrastructure products for broadband and voice communications; |
| ● | Transition Networks manufactures media converters, NIDs, NICs, Ethernet switches and other connectivity products that offer the ability to affordably integrate the benefits of fiber optics into any data network; |
| ● | JDL Technologies provides technology solutions that address prevalent IT challenges, including virtualization and cloud solutions, managed services, wired and wireless network design and implementation, and converged infrastructure configuration and deployment; and |
| ● | Net2Edge develops, manufactures and sells products that enable telecommunications carriers to connect legacy networks to high-speed services. |
Management has chosen to organize the enterprise and disclose reportable segments based on products and services. Intersegment revenues are eliminated upon consolidation. To conform to the 2016 presentation, the Company has reclassified 2015 and 2014 segment information to present the Net2Edge business unit as a separate segment.
Suttle products are sold principally to U.S. customers. Suttle operates manufacturing facilities in the U.S. and Costa Rica. Net long-lived assets held in foreign countries were approximately $2,914,000 and $2,932,000 at December 31, 2016 and 2015, respectively. Transition Networks manufactures its products in the United States and makes sales in both the U.S. and international markets. JDL Technologies operates in the U.S. and makes sales in the U.S. Net2Edge operates in the U.K. and primarily makes sales in the international markets. Consolidated sales to U.S. customers were approximately 85%, 81% and 86% of sales from continuing operations in 2016, 2015 and 2014 respectively. In 2016, sales to one of Suttle’s customers accounted for 12.0% of consolidated sales and one of JDL’s customers accounted for 11.3% of consolidated sales. In 2015, sales to one of Suttle’s customers accounted for 16.2% of consolidated sales and one of JDL’s customers accounted for 10.9% of consolidated sales. In 2014, sales to one of Suttle’s customers accounted for 33.6% of consolidated sales. At December 31, 2016, Suttle had one customer that made up 25% of consolidated accounts receivables and Transition Networks had one customer that made up 17% of consolidated accounts receivable. At December 31, 2015, Suttle had one customer that made up 29% of consolidated accounts receivable and Transition Networks had one customer that made up 15% of consolidated accounts receivable.
50
Information concerning the Company’s operations in the various segments for the twelve-month periods ended December 31, 2016, 2015 and 2014 is as follows:
| Transition | JDL | Intersegment | ||||||||||||||||||||||||||
| Suttle | Networks | Technologies | Net2Edge | Other | Eliminations | Total | ||||||||||||||||||||||
| 2016 | ||||||||||||||||||||||||||||
| Sales | $ | 42,076,000 | $ | 41,093,000 | $ | 15,464,000 | $ | 1,873,000 | $ | — | $ | (1,153,000 | ) | $ | 99,353,000 | |||||||||||||
| Cost of sales | 38,193,000 | 23,607,000 | 10,245,000 | 904,000 | — | (177,000 | ) | 72,772,000 | ||||||||||||||||||||
| Gross profit | 3,883,000 | 17,486,000 | 5,219,000 | 969,000 | — | (976,000 | ) | 26,581,000 | ||||||||||||||||||||
| Selling, general and administrative expenses | 12,525,000 | 17,180,000 | 3,296,000 | 3,141,000 | — | (956,000 | ) | 35,186,000 | ||||||||||||||||||||
| Pension liability adjustments | — | — | — | — | (4,148,000 | ) | — | (4,148,000 | ) | |||||||||||||||||||
| Operating (loss) income | $ | (8,642,000 | ) | $ | 306,000 | $ | 1,923,000 | $ | (2,172,000 | ) | $ | 4,148,000 | $ | (20,000 | ) | $ | (4,457,000 | ) | ||||||||||
| Depreciation and amortization | $ | 2,461,000 | $ | 852,000 | $ | 267,000 | $ | 103,000 | $ | — | $ | — | $ | 3,683,000 | ||||||||||||||
| Capital expenditures | $ | 1,625,000 | $ | 188,000 | $ | 232,000 | $ | 18,000 | $ | 244,000 | $ | (20,000 | ) | $ | 2,287,000 | |||||||||||||
| Assets | $ | 33,555,000 | $ | 17,518,000 | $ | 4,767,000 | $ | 1,464,000 | $ | 15,900,000 | $ | (27,000 | ) | $ | 73,177,000 | |||||||||||||
| Transition | JDL | Intersegment | ||||||||||||||||||||||||||
| Suttle | Networks | Technologies | Net2Edge | Other | Eliminations | Total | ||||||||||||||||||||||
| 2015 | ||||||||||||||||||||||||||||
| Sales | $ | 50,082,000 | $ | 41,469,000 | $ | 15,672,000 | $ | 1,353,000 | $ | — | $ | (906,000 | ) | $ | 107,670,000 | |||||||||||||
| Cost of sales | 41,232,000 | 23,702,000 | 10,866,000 | 638,000 | — | (314,000 | ) | 76,124,000 | ||||||||||||||||||||
| Gross profit | 8,850,000 | 17,767,000 | 4,806,000 | 715,000 | — | (592,000 | ) | 31,546,000 | ||||||||||||||||||||
| Selling, general and administrative expenses | 15,285,000 | 19,005,000 | 3,635,000 | 3,490,000 | — | (585,000 | ) | 40,830,000 | ||||||||||||||||||||
| Pension settlement costs | — | — | — | — | 1,222,000 | — | 1,222,000 | |||||||||||||||||||||
| Operating income (loss) | $ | (6,435,000 | ) | $ | (1,238,000 | ) | $ | 1,171,000 | $ | (2,775,000 | ) | $ | (1,222,000 | ) | $ | (7,000 | ) | $ | (10,506,000 | ) | ||||||||
| Depreciation and amortization | $ | 2,125,000 | $ | 897,000 | $ | 150,000 | $ | 141,000 | $ | — | $ | — | $ | 3,313,000 | ||||||||||||||
| Capital expenditures | $ | 1,710,000 | $ | 288,000 | $ | 263,000 | $ | 25,000 | $ | 115,000 | $ | (7,000 | ) | $ | 2,394,000 | |||||||||||||
| Assets | $ | 38,163,000 | $ | 21,729,000 | $ | 5,964,000 | $ | 1,783,000 | $ | 20,284,000 | $ | (7,000 | ) | $ | 87,916,000 | |||||||||||||
| Transition | JDL | Intersegment | ||||||||||||||||||||||||||
| Suttle | Networks | Technologies | Net2Edge | Other | Eliminations | Total | ||||||||||||||||||||||
| 2014 | ||||||||||||||||||||||||||||
| Sales | $ | 67,331,000 | $ | 41,945,000 | $ | 8,567,000 | $ | 1,619,000 | $ | — | $ | (390,000 | ) | $ | 119,072,000 | |||||||||||||
| Cost of sales | 46,339,000 | 23,539,000 | 6,599,000 | 826,000 | — | (390,000 | ) | 76,913,000 | ||||||||||||||||||||
| Gross profit | 20,992,000 | 18,406,000 | 1,968,000 | 793,000 | — | — | 42,159,000 | |||||||||||||||||||||
| Selling, general and administrative expenses | 14,389,000 | 18,645,000 | 2,846,000 | 2,748,000 | — | — | 38,628,000 | |||||||||||||||||||||
| Restructuring expense | — | 238,000 | — | — | — | 238,000 | ||||||||||||||||||||||
| Operating income (loss) | $ | 6,603,000 | $ | (477,000 | ) | $ | (878,000 | ) | $ | (1,955,000 | ) | $ | — | $ | — | $ | 3,293,000 | |||||||||||
| Depreciation and amortization | $ | 1,386,000 | $ | 797,000 | $ | 152,000 | $ | 147,000 | $ | — | $ | — | $ | 2,482,000 | ||||||||||||||
| Capital expenditures | $ | 4,471,000 | $ | 563,000 | $ | 43,000 | $ | 26,000 | $ | 474,000 | $ | — | $ | 5,577,000 | ||||||||||||||
| Assets | $ | 38,083,000 | $ | 24,123,000 | $ | 3,816,000 | $ | 2,385,000 | $ | 31,879,000 | $ | — | $ | 100,286,000 | ||||||||||||||
51
NOTE 13 – FAIR VALUE MEASUREMENTS
Fair value is defined as the price that would be received to sell an asset or paid to transfer a liability in an orderly transaction between market participants at the measurement date. Assets and liabilities measured at fair value are classified using the following hierarchy, which is based upon the transparency of inputs to the valuation as of the measurement date:
Level 1 – Observable inputs that reflect unadjusted quoted prices for identical assets or liabilities in active markets that the Company has the ability to access at the measurement date.
Level 2 – Observable inputs such as quoted prices for similar instruments and quoted prices in markets that are not active, and inputs that are directly observable or can be corroborated by observable market data. The types of assets and liabilities included in Level 2 are typically either comparable to actively traded securities or contracts, such as treasury securities with pricing interpolated from recent trades of similar securities, or priced with models using highly observable inputs, such as commodity options priced using observable forward prices and volatilities.
Level 3 – Significant inputs to pricing that have little or no observability as of the reporting date. The types of assets and liabilities included in Level 3 are those with inputs requiring significant management judgment or estimation, such as the complex and subjective models and forecasts used to determine the fair value of financial instruments.
Financial assets and liabilities measured at fair value as of December 31, 2016 and December 31, 2015, are summarized below:
| December 31, 2016 | ||||||||||||||||
| Level 1 | Level 2 | Level 3 | Total Fair Value | |||||||||||||
| Cash equivalents: | ||||||||||||||||
| Money Market funds | $ | 3,851,000 | $ | — | $ | — | $ | 3,851,000 | ||||||||
| Subtotal | 3,851,000 | — | — | 3,851,000 | ||||||||||||
| Short-term investments: | ||||||||||||||||
| Certificates of deposit | — | 4,294,000 | — | 4,294,000 | ||||||||||||
| Corporate Notes/Bonds | — | 1,511,000 | — | 1,511,000 | ||||||||||||
| Subtotal | — | 5,805,000 | — | 5,805,000 | ||||||||||||
| Long-term investments: | ||||||||||||||||
| Certificates of deposit | — | — | — | — | ||||||||||||
| Corporate Notes/Bonds | — | — | — | — | ||||||||||||
| Subtotal | — | — | — | — | ||||||||||||
| Current Liabilities: | — | |||||||||||||||
| Accrued Consideration | — | — | — | — | ||||||||||||
| Subtotal | — | — | — | — | ||||||||||||
| Total | $ | 3,851,000 | $ | 5,805,000 | $ | — | $ | 9,656,000 | ||||||||
52
| December 31, 2015 | ||||||||||||||||
| Level 1 | Level 2 | Level 3 | Total Fair Value | |||||||||||||
| Cash equivalents: | ||||||||||||||||
| Money Market funds | $ | 1,944,000 | $ | — | $ | — | $ | 1,944,000 | ||||||||
| Subtotal | 1,944,000 | — | — | 1,944,000 | ||||||||||||
| Short-term investments: | ||||||||||||||||
| Certificates of deposit | — | 1,202,000 | — | 1,202,000 | ||||||||||||
| Corporate Notes/Bonds | 4,027,000 | 4,027,000 | ||||||||||||||
| Subtotal | — | 5,229,000 | — | 5,229,000 | ||||||||||||
| Long-term investments: | ||||||||||||||||
| Certificates of deposit | — | 4,286,000 | — | 4,286,000 | ||||||||||||
| Corporate Notes/Bonds | 2,007,000 | 2,007,000 | ||||||||||||||
| Subtotal | — | 6,293,000 | — | 6,293,000 | ||||||||||||
| Total | $ | 1,944,000 | $ | 11,522,000 | $ | (142,000 | ) | $ | 13,324,000 | |||||||
The estimated fair value of contingent consideration as of December 31, 2015 and 2016 was $142,000 and $0, respectively, as noted above. The estimated fair value is considered a level 3 measurement because the probability weighted discounted cash flow methodology used to estimate fair value includes the use of significant unobservable inputs, primarily the contractual contingent consideration revenue targets and assumed probabilities. The change in the estimated contingent consideration during the year ended December 31, 2016 resulted in a gain of $142,000 included in operating income. The gains were the result of a change in future assumptions related to the contingent consideration.
We record transfers between levels of the fair value hierarchy, if necessary, at the end of the reporting period. There were no transfers between levels during 2016 and 2015.
NOTE 14 – RESTRUCTURING CHARGES
During the year ended December 31, 2014, the Company recorded $238,000 in restructuring expense. This consisted of severance and related benefits costs due to the restructuring within the Transition Networks business segment, including ongoing costs related to the closure of the China facility. The facility was completely closed in the second quarter of 2014. The Company had no restructuring expenses for the years ended December 31, 2015 and 2016.
In January 2017, the Company announced that it will be closing its Costa Rica facility in 2017.
NOTE 15 – SUBSEQUENT EVENTS
The Company has evaluated subsequent events through the date of this filing. We do not believe there are any material subsequent events which would require further disclosure.
53
|
(b) | SUPPLEMENTAL FINANCIAL INFORMATION |
Quarterly Operating Results
(in thousands except per share amounts)
Unaudited
| Quarter Ended | ||||||||||||||||
| March 31 | June 30 | Sep 30 | Dec 31 | |||||||||||||
| 2016 | ||||||||||||||||
| Sales | $ | 24,666 | $ | 26,311 | $ | 25,617 | $ | 22,759 | ||||||||
| Operating income (loss)1 | 1,280 | (2,671 | ) | (1,175 | ) | (1,891 | ) | |||||||||
| Net loss | (2,467 | ) | (2,544 | ) | (1,264 | ) | (1,839 | ) | ||||||||
| Basic net loss per share | $ | (0.28 | ) | $ | (0.29 | ) | $ | (0.14 | ) | $ | (0.21 | ) | ||||
| Diluted net loss per share | $ | (0.28 | ) | $ | (0.29 | ) | $ | (0.14 | ) | $ | (0.21 | ) | ||||
| 2015 | ||||||||||||||||
| Sales | $ | 19,545 | $ | 28,198 | $ | 32,246 | $ | 27,681 | ||||||||
| Operating (loss) income | (5,691 | ) | (1,718 | ) | 431 | (3,528 | ) | |||||||||
| Net (loss) income | (4,163 | ) | (1,028 | ) | 1,284 | (5,741 | ) | |||||||||
| Basic net (loss) income per share | $ | (0.48 | ) | $ | (0.12 | ) | $ | 0.15 | $ | (0.66 | ) | |||||
| Diluted net (loss) income per share | $ | (0.48 | ) | $ | (0.12 | ) | $ | 0.15 | $ | (0.66 | ) | |||||
1 As part of the settlement of our pension plan, the Company recorded $4.1 million in pension liability gains previously recorded in accumulated other comprehensive income within operating expenses during 2016. Additionally, the Company recognized $4.2 million in foreign currency translation losses within Other (Expense) Income due to the substantial liquidation of our Austin Taylor subsidiary in the U.K.
| ITEM 9. | CHANGES IN AND DISAGREEMENTS WITH ACCOUNTANTS ON ACCOUNTING AND FINANCIAL DISCLOSURE |
None.
| ITEM 9A: | CONTROLS AND PROCEDURES |
| (a) | Evaluation of Disclosure Controls and Procedures |
In connection with the filing of this Form 10-K, under the supervision and with the participation of our management, including our Chief Executive Officer (“CEO”) and Chief Financial Officer (“CFO”), we evaluated the effectiveness of the design and operation of our disclosure controls and procedures (as defined in Rule 13a-15(e) and 15d-15(e) under the Securities Exchange Act of 1934 (the “Exchange Act”)) as of December 31, 2016. As noted below, management identified two material weaknesses in our internal control over financial reporting. As a result of these material weaknesses, management concluded that our disclosure controls and procedures were not effective.
| (b) | Management Report on Internal Control over Financial Reporting |
The Company’s management is responsible for establishing and maintaining adequate internal control over financial reporting, as that term is defined in Rule 13a-15(f) and 15d-15(f) of the Securities Exchange Act. Under the supervision and with the participation of the Company’s management, including the CEO and CFO, the Company conducted an evaluation of the effectiveness of our internal control over financial reporting as of December 31, 2016, based on Internal Control – Integrated Framework (2013) issued by the Committee of Sponsoring Organizations of the Treadway Commission (the “Framework”).
54
Financial Management/Enterprise Resource Planning Systems. Based on management’s testing and evaluation, we identified a material weakness in our internal controls surrounding segregation of duty conflicts in our financial management/enterprise resource planning (“ERP”) systems. We did not design and maintain processes to (i) restrict access to appropriate users and (ii) to evaluate whether appropriate segregation of duties was maintained throughout the year. Several individuals had access to programs and data, or had approval authority, beyond what they needed to perform their individual job responsibilities, and the Company did not maintain adequate independent monitoring of these individuals. In addition, we did not track or verify changes made to our vendor master file data were appropriate. These failures would have allowed individual users to override other internal controls by setting up a vendor and approving payments to that vendor.
In analyzing these processes, we determined that these same segregation of duty conflicts were substantially present at December 31, 2015. Accordingly, we have concluded that a material weakness in our internal controls over financial reporting also existed at December 31, 2015.
Goodwill Impairment Testing. Based on management’s testing and evaluation, we determined that we did not design and maintain effective internal control over our step one goodwill impairment testing that we performed in accordance with ASC 350, Intangibles – Goodwill and Other as of December 31, 2016. Specifically, the Company’s review control did not operate at a sufficient level of precision to identify the improper assumptions used in our step one goodwill impairment test for our JDL reporting unit. We concluded that this lack of detailed analysis was a material weakness in our internal controls.
We have performed incremental procedures and concluded that neither (i) the segregation of duty conflicts nor (ii) our failure to adequately review our impairment analysis in sufficient detail, resulted in misstatements within the Company’s consolidated financial statements. We concluded, however, that there was a reasonable possibility that a material misstatement in the Company’s consolidated financial statements may not have been prevented or detected on a timely basis.
Remediation Plan for Material Weaknesses in Internal Control over Financial Reporting
We have begun to implement the following remediation plan to address the material weaknesses described above:
| ● | Change ERP user access so an individual with security rights (i) to enter or approve vendor invoices or (ii) to approve purchase orders will not also have access to vendor master file maintenance. Similarly, an individual with access to vendor master file maintenance will not also have the right to enter or approve vendor invoices or approve purchase orders. |
| ● | Change individual approval limits to conform to specific dollar amounts in Company policies. |
| ● | Implement a system capability of vendor change tracking; institute a control to verify all vendor master file changes for new vendor creation, change of address, change of payment terms, and change of payment method were approved by appropriate, independent individuals. |
| ● | Implement a control that any changes to system access will require approval by a senior member of our management team who is responsible for validating access changes do not result in a segregation of duty conflict. |
| ● | Perform a detailed segregation of duties analysis; from this modify and restrict individuals’ access to systems needed for their specific job duties. If, as a result of the size of our financial staff, segregation of duty conflicts remain for individuals to perform their job duties, we will implement compensating controls designed to operate at a detailed and precise enough level that will enable detection of errors in the financial statements that could rise to a material level. |
| ● | Design and document review controls with enhanced precision related to the review of the fair value modeling of the step one goodwill impairment assessment. |
| ● | Provide additional training for relevant personnel to enable effective operation and documentation of internal controls over the step one goodwill impairment assessment. |
55
| (c) | Inherent Limitations on Control Systems |
Because of the inherent limitations in all control systems, no evaluation of controls can provide absolute assurance that all control issues and instances of fraud, if any, will be or have been detected. These inherent limitations include the realities that judgments in decision making can by faulty, and that breakdowns can occur because of simple error or mistake. Additionally, controls can be circumvented by the individual acts of some persons, by collusion of two or more people, or by management override of the control. The design of any system of controls also is based in part upon certain assumptions about the likelihood of future events and there can be no assurance that any design will succeed in achieving its stated goals under all potential future conditions. Over time, controls may become inadequate because of changes in conditions, or the degree of compliance with the policies or procedures may deteriorate.
| (d) | Changes in Internal Control |
Except as noted above, there was no other changes in the Company’s internal control over financial reporting that occurred during the Company’s most recently completed fiscal quarter that has materially affected, or is reasonably likely to materially affect, the Company’s internal control over financial reporting. The Company is taking steps to ensure that it remediates the material weaknesses by (i) implementing enhanced control procedures over vendor setup, vendor invoice entry, and vendor invoice and purchase order approval and (ii) providing additional training for relevant personnel to enable effective operation and documentation of internal controls over the step one goodwill impairment assessment, both as noted above.
This annual report does not include an attestation report of the Company’s independent registered public accounting firm regarding internal control over financial reporting. Management’s report was not subject to attestation by the Company’s registered public accounting firm pursuant to rules of the Securities and Exchange Commission that permit the Company to provide only management’s report in this annual report.
ITEM 9B. OTHER INFORMATION
2017 Executive Compensation
2017 Executive Officer Base Salaries
The Compensation Committee and the Board of Directors of Communications Systems, Inc. (the “Company”) approved adjustments to annual base salaries for the following executive officers (who are expected to be among the Company’s five highest paid executives in 2017) in the amounts respectively indicated effective January 1, 2017:
| Executive Officer and Title | 2017 Base Salary | % increase over 2016 | ||
Roger H. D. Lacey Vice Chairman and CEO |
$300,000 | 9% | ||
Mark D. Fandrich Chief Financial Officer |
$212,000 | 6% | ||
Scott Otis General Manager, Transition Networks, Inc. |
$221,225 | 5% | ||
Scott Fluegge President & General Manager, JDL Technologies, Inc. |
$212,426 | 3% |
Grant of 2017 Awards Under the Annual Bonus Plan
On March 3, 2017, pursuant to the Company’s Annual Bonus Plan (“Bonus Plan”), the Compensation Committee determined, and the Company’s Board ratified and approved, awards to the following executive officers: Roger H. D. Lacey, Mark D. Fandrich, Bruce Blackwood, Scott Otis, and Scott Fluegge (the “Named Executives”) that represented the opportunity to earn cash bonuses based on 2017 financial performance. Under the Bonus Plan, the Compensation Committee has set “minimum,” “target” and “maximum” performance goals for the Company’s four business units for 2017. Performance measures for the four business units are specific to each, but generally include one or more of the following performance measures: revenues, new product revenue and operating income, with primary weight given to achieving operating income targets. The three Named Executives indicated in the table below that lead business units earn 50% of their bonus based on achievement in comparison goals determined for their respective business unit, and 50% based on achievement compared to goals for CSI’ Consolidated results. The CEO and CFO will earn their bonus based on achievement in comparison goals determined for CSI’s consolidated results. Bonuses for quarterly and six month goals during the first nine months of the fiscal year are paid approximately 45 days after the period measured and bonuses earned based on achievement in comparison in the last six months or fourth quarter and over the full year are paid out approximately 75 days after fiscal year end. Payments of bonuses generally begin at achievement exceeding 50% or more of target performance goals. The target and maximum bonus each Named Executive may potentially earn under the Annual Bonus Plan is based upon a percentage of their base salary. Under the Bonus Plan, in general, the maximum bonus that may be paid to any Named Executive may not exceed approximately 150% the bonus opportunity at target even if financial performance exceeds the maximum goal. Further, no bonus amounts will be earned by any Named Executive under the Bonus Plan for a quarter or the year if the minimum goals for that period are not achieved. The Compensation Committee must approve bonuses paid to the Named Executives before payment.
56
The following table shows potential bonus amounts as a percentage of salary that may be earned by the Named Executives for 2017 performance under the Plan upon achievement of their respective performance goals at target and maximum levels of performance. Under the 2017 Bonus Plan achievement in relation to performance goals below the target level results in a decreasing bonus, and if achievement fails to meet the minimum performance goals the Named Executive is not entitled to any bonus.
| Executive Officer Name & Title | Cash
Bonus Payable if Target Goals Achieved |
Cash
Bonus Payable if Maximum Goals Achieved | ||
Roger H. D. Lacey Vice Chairman and CEO |
$210,000 | $315,000 | ||
Mark D. Fandrich Chief Financial Officer |
$116,600 | $174,900 | ||
Bruce Blackwood General Manager, Suttle, Inc. |
$90,000 | $135,000 | ||
Scott Otis General Manager, Transition Networks, Inc. |
$88,490 | $132,735 | ||
Scott Fluegge President & General Manager, JDL Technologies, Inc. |
$84,970 | $127,456 |
PART III
ITEM 10. DIRECTORS, EXECUTIVE OFFICERS AND CORPORATE GOVERNANCE
The information required by Item 401 under Regulation S-K, to the extent applicable to the Company’s directors, will be set forth under the caption “Election of Directors” in the Company’s definitive proxy material for its May 24, 2017 Annual Meeting of Shareholders (“2017 Proxy Materials”) and is incorporated herein by reference. The information required with respect to the Company’s officers by paragraph (b) of Item 401 is set forth under Item 1(c) (3) of this Form 10-K.
The information required by Item 405 regarding compliance with Section 16 (a) will be set forth under the caption “Section 16(a) Beneficial Ownership Reporting Compliance” in the Company’s 2017 Proxy Materials, and is incorporated herein by reference.
Code of Ethics
The Company has adopted a Code of Ethics applicable to all officers of the Company as well as certain other key accounting personnel. A copy of the Code of Ethics can be obtained free of charge upon written request directed to the Company’s Assistant Secretary at the executive offices of the Company.
57
The information required called for by Item 407 regarding corporate governance will be set forth under the caption “Corporate Governance and Board Matters” in the 2017 Proxy Materials and is incorporated herein by reference.
ITEM 11. EXECUTIVE COMPENSATION
The information called for by Item 402 under Regulation S-K, will be set forth under the caption “Executive Compensation” in the Company’s 2017 Proxy Materials, and is expressly incorporated herein by reference.
ITEM 12. SECURITY OWNERSHIP OF CERTAIN BENEFICIAL OWNERS AND MANAGEMENT AND RELATED STOCKHOLDER MATTERS
The information called for by Item 403 under Regulation S-K will be set forth under the captions “Security Ownership of Certain Beneficial Owners and Management” and “Election of Directors” in the Company’s 2017 Proxy Materials, and is incorporated herein by reference.
ITEM 13. CERTAIN RELATIONSHIPS AND RELATED TRANSACTIONS, AND DIRECTOR INDEPENDENCE
The information required by Item 404 under Regulation S-K will be set forth under the caption “Certain Relationship and Related Transaction” in the Company’s 2017 Proxy Materials, and is incorporated herein by reference.
The information required by Item 407(a) will be set forth in the Company’s 2017 Proxy Materials caption “Corporate Governance and Board Matters” and is incorporated herein by reference.
ITEM 14. PRINCIPAL ACCOUNTING FEES AND SERVICES
The information required by Item 14 of Form 10K and 9(e) of Schedule 14A will be set forth under the caption “Principal Accountant Fees and Services” in the Company’s 2017 Proxy Materials, and is incorporated herein by reference.
PART IV
ITEM 15. EXHIBITS AND FINANCIAL STATEMENT SCHEDULES
| (a) | (1) | Consolidated Financial Statements |
The following Consolidated Financial Statements of Communications Systems, Inc. and subsidiaries appear at pages 32 to 53 herein:
| ● | Report of Independent Registered Public Accounting Firm |
| ● | Consolidated Balance Sheets as of December 31, 2016 and 2015 |
| ● | Consolidated Statements of Income (Loss) and Comprehensive Income (Loss) for the years ended December 31, 2016, 2015 and 2014 |
| ● | Consolidated Statements of Changes in Stockholders’ Equity for the years ended December 31, 2016, 2015 and 2014 |
| ● | Consolidated Statements of Cash Flows for the years ended December 31, 2016, 2015 and 2014 |
| ● | Notes to Consolidated Financial Statements |
| (a) | (2) | Consolidated Financial Statement Schedule |
The following financial statement schedule is being filed as part of this Form 10-K Report:
Schedule II - Valuation and Qualifying Accounts and Reserves
All other schedules are omitted as the required information is inapplicable or the information is presented in the consolidated financial statements or related notes.
58
| (a) | (3) | Exhibits |
The exhibits which accompany or are incorporated by reference in this report, including all exhibits required to be filed with this report pursuant to Item 601 of Regulation S-K, including each management or compensatory plan or arrangement are described on the Exhibit Index, which is at pages 61 through 63 of this report.
59
SIGNATURES
Pursuant to the requirements of Section 13 or 15(d) of the Securities Exchange Act of 1934, the Registrant has duly caused this report to be signed on its behalf by the undersigned, thereunto duly authorized.
| COMMUNICATIONS SYSTEMS, INC. | ||
| Dated: March 31, 2017 | /s/ Roger H.D. Lacey | |
| Roger H.D. Lacey, Chief Executive Officer | ||
| and Director |
Pursuant to the requirements of the Securities Exchange Act of 1934, this report has been signed below by the following persons on behalf of the Registrant in the capacities and on the dates indicated:
Each person whose signature appears below constitutes and appoints ROGER H.D. LACEY and MARK D. FANDRICH as his true and lawful attorneys-in-fact and agents, each acting alone, with full power of substitution and resubstitution, for him and in his name, place and stead, in any and all capacities, to sign any or all amendments to this Annual Report on Form 10-K and to file the same, with all exhibits thereto, and other documents in connection therewith, with the Securities and Exchange Commission, granting unto said attorneys-in-fact and agents, each acting alone, full power and authority to do and perform each and every act and thing requisite and necessary to be done in and about the premises, as fully to all intents and purposes as he might or could do in person, hereby ratifying and confirming all said attorneys-in-fact and agents, each acting alone, or his substitute or substitutes, may lawfully do or cause to be done by virtue thereof.
| Signature | Title | Date | ||||||||
| /s/Roger H.D. Lacey | Chief Executive Officer | March 31, 2017 | ||||||||
| Roger H.D. Lacey | and Director | |||||||||
| /s/Mark D. Fandrich | Vice President and | March 31, 2017 | ||||||||
| Mark D. Fandrich | Chief Financial Officer (Principal | |||||||||
| Financial Officer) | ||||||||||
| /s/Kristin A. Hlavka | Corporate Controller (Principal | March 31, 2017 | ||||||||
| Kristin A. Hlavka | Accounting Officer) | |||||||||
| /s/Curtis A. Sampson | Chairman of the Board of Directors | March 31, 2017 | ||||||||
| Curtis A. Sampson | and Director | |||||||||
| /s/Randall D. Sampson | Director | March 31, 2017 | ||||||||
| Randall D. Sampson | ||||||||||
| /s/Luella G. Goldberg | Director | March 31, 2017 | ||||||||
| Luella Gross Goldberg | ||||||||||
| /s/Gerald D. Pint | Director | March 31, 2017 | ||||||||
| Gerald D. Pint | ||||||||||
| /s/Richard A. Primuth | Director | March 31, 2017 | ||||||||
| Richard A. Primuth | ||||||||||
60
SECURITIES AND EXCHANGE COMMISSION
Washington, D.C. 20549
FORM 10-K
ANNUAL REPORT PURSUANT TO SECTION 13 or 15(d)
OF THE SECURITIES EXCHANGE ACT OF 1934
OF
COMMUNICATIONS SYSTEMS, INC.
FOR
YEAR ENDED DECEMBER 31, 2016
FINANCIAL STATEMENT SCHEDULE
61
COMMUNICATIONS SYSTEMS, INC. AND SUBSIDIARIES
Schedule II - Valuation and Qualifying Accounts and Reserves
(in thousands)
| Additions | |||||||||||
| Balance at | Charged to | Deductions | Balance | ||||||||
| Beginning of | Cost and | from | at End | ||||||||
| Description | Period | Expenses | Reserves | of Period | |||||||
| Income Tax Valuation Allowance | |||||||||||
| Year ended: | |||||||||||
| December 31, 2016 | $ | 5,668 | $ | 2,449 | $ | — | $ | 8,117 | |||
| December 31, 2015 | $ | 1,734 | $ | 3,934 | $ | — | $ | 5,668 | |||
| December 31, 2014 | $ | 1,618 | $ | 116 | $ | — | $ | 1,734 | |||
62
SECURITIES AND EXCHANGE COMMISSION
Washington, D.C. 20549
FORM 10-K
ANNUAL REPORT PURSUANT TO SECTION 13 or 15(d)
OF THE SECURITIES EXCHANGE ACT OF 1934
OF
COMMUNICATIONS SYSTEMS, INC.
FOR
YEAR ENDED DECEMBER 31, 2016
EXHIBITS
63
COMMUNICATIONS SYSTEMS, INC. AND SUBSIDIARIES
Exhibit Index to
Form 10-K for the Year Ended December 31, 2016
| Regulation S-K | Location in Consecutive Numbering | ||||
| Exhibit Table | System as Filed With the Securities | ||||
| Reference | Title of Document | and Exchange Commission | |||
| 3.1 | Articles of Incorporation, as amended | Filed as Exhibit 3.1 to the Form 10-Q for the quarter ended June 30, 2014 and incorporated herein by reference. | |||
| 3.2 | Bylaws, as amended | Filed as Exhibit 3.2 to the Form 10-Q for the quarter ended June 30, 2014 and incorporated herein by reference. | |||
| 3.3 | Amended and Restated Certificate of Designation, Preferences and Rights of Series A Junior Participating Preferred Stock | Filed as Exhibit 4(a) to Form 8-A dated December 28, 2009 and incorporated herein by reference. | |||
| 10.1 | Amended and Restated Credit Agreement dated August 12, 2016 by and among Communications Systems, Inc., JDL Technologies, Inc., Transition Networks, Inc., Suttle, Inc. and Wells Fargo Bank, National Association | Filed as Exhibit 10.1 to the Form 8-K dated August 12, 2016 and incorporated herein by reference. | |||
| 10.1.1 | First Amendment dated September 30, 2016 to Amended and Restated Credit Agreement dated August 12, 2016 by And among Communications Systems, Inc., JDL Technologies, Inc., Transition Networks, Inc., Suttle, Inc. and Wells Fargo Bank, National Association | Filed as Exhibit 10.1 to the Form 10-Q for the quarter ended September 30, 2017 and incorporated herein by reference. | |||
| 10.2 | Amended and Restated Security Agreement dated August 12, 2016 by and among Communications Systems, Inc., JDL Technologies, Inc., Transition Networks, Inc., Suttle, Inc. and Wells Fargo Bank, National Association | Filed as Exhibit 10.2 to the Form 8-K dated August 12, 2016 and incorporated herein by reference. | |||
| 10.3 | Amended and Restated Note dated August 12, 2016 by and among Communications Systems, Inc., JDL Technologies, Inc., Transition Networks, Inc., Suttle, Inc. to Wells Fargo National Bank, National Association | Filed as Exhibit 10.3 to the Form 8-K dated August 12, 2016 and incorporated herein by reference. | |||
| 10.4 | * | Employee Stock Ownership Plan and Trust, effective as of January 1, 2009 | Filed as Exhibit 10.3 to the Form 10-K for the year ended December 31, 2011 (2011 Form 10-K) and incorporated herein by reference. | ||
| 10.4.1 | * | First Amendment, dated October 21, 2011, to the Communications Systems, Inc. Employee Stock Ownership Plan and Trust. | Filed as Exhibit 10.3.1 to the 2011 Form 10-K and incorporated herein by reference. | ||
| 10.4.2 | * | Third Amendment, dated December 14, 2012 to the Communications Systems, Inc. Employee Stock Ownership Plan and Trust. | Filed as Exhibit 10.1 to the Form 8-K dated December 14, 2012 and incorporated herein by reference. | ||
64
| 10.4.3 | * | Fourth Amendment, dated January 1, 2015 to the Communications Systems, Inc. Employee Stock Ownership Plan and Trust | Filed as Exhibit 10.3.3 to the Form10-K for the year ended December 31, 2014 and incorporated herein by reference. | ||
| 10.5 | * | 1990 Employee Stock Purchase Plan, as amended May 21, 2015 | Filed as Appendix B to the Proxy Statement dated April 10, 2015 for the 2015 Annual Meeting of Shareholders and incorporated herein by reference. | ||
| 10.6 | * | 1990 Stock Option Plan for Nonemployee Directors, as amended May 19, 2011 | Filed as Exhibit 10.4 to the Form 10-Q for the quarter ended September 30, 2011 and incorporated herein by reference. | ||
| 10.7 | * | 1992 Stock Plan, as amended August 11, 2011 | Filed as Exhibit 10.3 to the Form 10-Q for the quarter ended September 30, 2011 and incorporated herein by reference. | ||
| 10.8 | * | Supplemental Executive Retirement Plan | Filed as Exhibit 10.8 to the 1993 Form 10-K and incorporated herein by reference. | ||
| 10.9 | * | Communications Systems Inc. Long Term Incentive Plan, as amended through March 1, 2012 | Filed as Exhibit 99.2 to the Company’s Form 8-K dated March 9, 2012 and incorporated herein by reference. | ||
| 10.10 | * | Communications Systems Inc. 2011 Executive Incentive Compensation Plan, as amended May 21, 2015 | Filed as Appendix A to the Proxy Statement dated April 10, 2015 for the 2015 Annual Meeting of Shareholders and incorporated herein by reference. | ||
| 10.11 | * | Communications Systems Inc. Annual Bonus Plan | Filed as Exhibit 99.1 to the Company’s Form 8-K dated March 9, 2012 and incorporated herein by reference. | ||
| 10.12 | Form of Rights Agreement, dated as of December 23, 2009 between Communications Systems, Inc. and Wells Fargo Bank National Association | Filed as Exhibit 4(b) to Form 8-A on December 28, 2009 and incorporated herein by reference. | |||
| 10.13 | Form of Communications Systems, Inc. Change of Control Agreement for Executives | Filed herewith. |
* Indicates compensatory plans
65
COMMUNICATIONS SYSTEMS, INC. AND SUBSIDIARIES
Exhibit Index To
Form 10-K for the Year Ended December 31, 2016
| Regulation S-K | Location in Consecutive Numbering | |||
| Exhibit Table | System as Filed With the Securities | |||
| Reference | Title of Document | and Exchange Commission | ||
| 21 | Subsidiaries of the Registrant | Filed herewith. | ||
| 23 | Consent of Independent Registered Public Accounting Firm | Filed herewith. | ||
| 24 | Power of Attorney | Included in signatures at page 58. | ||
| 31.1 | Certification of Chief Executive Officer | Filed herewith. | ||
| 31.2 | Certification of Chief Financial Officer | Filed herewith. | ||
| 32 | Certification under USC § 1350 | Filed herewith. |
The exhibits referred to in this Exhibit Index will be supplied to a shareholder at a charge of $0.25 per page upon written request directed to CSI’s Assistant Secretary at the executive offices of the Company.
66