Attached files
| file | filename |
|---|---|
| EX-32.2 - EX-32.2 - Acushnet Holdings Corp. | golf-20161231ex322668f31.htm |
| EX-32.1 - EX-32.1 - Acushnet Holdings Corp. | golf-20161231ex32103e932.htm |
| EX-31.2 - EX-31.2 - Acushnet Holdings Corp. | golf-20161231ex3124952c6.htm |
| EX-31.1 - EX-31.1 - Acushnet Holdings Corp. | golf-20161231ex3116d0057.htm |
| EX-24.1 - EX-24.1 - Acushnet Holdings Corp. | golf-20161231ex241199151.htm |
| EX-23.1 - EX-23.1 - Acushnet Holdings Corp. | golf-20161231ex23138c82a.htm |
| EX-21.1 - EX-21.1 - Acushnet Holdings Corp. | golf-20161231ex21193b9c9.htm |
UNITED STATES
SECURITIES AND EXCHANGE COMMISSION
WASHINGTON, D.C. 20549
FORM 10-K
☑ANNUAL REPORT PURSUANT TO SECTION 13 OR 15(d) OF THE SECURITIES EXCHANGE ACT OF 1934
For the fiscal year ended December 31, 2016
OR
◻TRANSITION REPORT PURSUANT TO SECTION 13 OR 15(d) OF THE SECURITIES EXCHANGE ACT OF
1934 for the transition period from to
Commission File Number: 001-37935
Acushnet Holdings Corp.
(Exact name of registrant as specified in its charter)
|
Delaware |
|
45-5644353 |
|
(State or other jurisdiction of |
|
|
|
incorporation or organization) |
|
(I.R.S. Employer Identification No.) |
333 Bridge Street
Fairhaven, Massachusetts 02719
(Address of principal executive offices)
(800) 225-8500
(Registrant’s telephone number, including area code)
Securities registered pursuant to Section 12(b) of the Act:
|
Title of each class |
|
Name of each exchange on which registered |
|
Common Stock, par value $0.001 per share |
|
New York Stock Exchange |
Securities registered pursuant to Section 12(g) of the Act:
None
Indicate by check mark if the registrant is a well-known seasoned issuer, as defined in Rule 405 of the Securities Act. Yes ◻ No ☑
Indicate by check mark if the registrant is not required to file reports pursuant to Section 13 or Section 15(d) of the Securities Exchange Act of 1934. Yes ◻ No ☑
Indicate by check mark whether the registrant (1) has filed all reports required to be filed by Section 13 or 15(d) of the Securities Exchange Act of 1934 during the preceding 12 months (or for such shorter period that the registrant was required to file such reports), and (2) has been subject to such filing requirements for the past 90 days. Yes ☑ No ◻
Indicate by check mark whether the registrant has submitted electronically and posted on its corporate Web site, if any, every Interactive Data File required to be submitted and posted pursuant to Rule 405 of Regulation S-T (§232.405 of this chapter) during the preceding 12 months (or for such shorter period that the registrant was required to submit and post such files). Yes ☑ No ◻
Indicate by check mark if disclosure of delinquent filers pursuant to Item 405 of Regulation S-K (§229.405 of this chapter) is not contained herein, and will not be contained, to the best of registrant’s knowledge, in definitive proxy or information statements incorporated by reference in Part III of this Form 10-K or any amendment to this Form 10-K. ☑
Indicate by check mark whether the registrant is a large accelerated filer, an accelerated filer, a non-accelerated filer, or a smaller reporting company. See the definitions of “large accelerated filer,” “accelerated filer” and “smaller reporting company” in Rule 12b-2 of the Exchange Act.
|
Large accelerated filer ◻ |
|
Accelerated filer ◻ |
|
Non-accelerated filer ☑ |
|
Smaller reporting company ◻ |
|
|
|
|
|
(Do not check if a smaller reporting company) |
|
|
Indicate by check mark whether the registrant is a shell company (as defined in Rule 12b-2 of the Act). Yes No ☑
As of June 30, 2016, the last day of the registrant’s most recently completed second quarter, the registrant’s common stock was not publicly traded. The registrant's common stock, $0.001 par value per share, began trading on the New York Stock Exchange on October 28, 2016. As of March 24, 2017, the aggregate market value of the registrant’s common stock held by non-affiliates of the registrant was approximately $623.5 million (based upon the closing sale price of the common stock on that date on the New York Stock Exchange).
The number of shares the Registrant's common stock outstanding on March 24, 2017 was 74,451,977.
DOCUMENTS INCORPORATED BY REFERENCE
Portions of the definitive proxy statement to be filed with the Securities and Exchange Commission pursuant to Regulation 14A relating to the Registrant’s Annual General Meeting of Shareholders, to be held on June 12, 2017, will be incorporated by reference in this Form 10-K in response to Items 10, 11, 12, 13 and 14 of Part III. The definitive proxy statement will be filed with the SEC not later than 120 days after the registrant’s fiscal year ended December 31, 2016.
In this Annual Report on Form 10‑K, the terms “Acushnet,” “we,” “us,” “our” and the “Company” refer to Acushnet Holdings Corp. and its consolidated subsidiaries.
i
FORWARD-LOOKING STATEMENTS
This Annual Report on Form 10‑K contains “forward-looking statements” within the meaning of Section 21E of the Securities Exchange Act of 1934, as amended (the “Exchange Act”), which are subject to the “safe harbor” created by that section. These forward-looking statements are included throughout this report, including in the sections entitled “Risk Factors” and “Management’s Discussion and Analysis of Financial Condition and Results of Operations,” and relate to matters such as our industry, business strategy, goals and expectations concerning our market position, future operations, margins, profitability, capital expenditures, liquidity and capital resources and other financial and operating information. We have used the words “anticipate,” “assume,” “believe,” “continue,” “could,” “estimate,” “expect,” “intend,” “may,” “plan,” “potential,” “predict,” “project,” “future,” “will,” “seek,” “foreseeable” and similar terms and phrases to identify forward-looking statements in this report.
The forward-looking statements contained in this report are based on management’s current expectations and are subject to uncertainty and changes in circumstances. We cannot assure you that future developments affecting us will be those that we have anticipated. Actual results may differ materially from these expectations due to changes in global, regional or local economic, business, competitive, market, regulatory and other factors, many of which are beyond our control. We believe that these factors include, but are not limited to:
|
· |
a reduction in the number of rounds of golf played or in the number of golf participants; |
|
· |
unfavorable weather conditions may impact the number of playable days and rounds played in a given year; |
|
· |
macroeconomic factors may affect the number of rounds of golf played and related spending on golf products; |
|
· |
demographic factors may affect the number of golf participants and related spending on our products; |
|
· |
a significant disruption in the operations of our manufacturing, assembly or distribution facilities; |
|
· |
our ability to procure raw materials or components of our products; |
|
· |
a disruption in the operations of our suppliers; |
|
· |
cost of raw materials and components; |
|
· |
currency transaction and translation risk; |
|
· |
our ability to successfully manage the frequent introduction of new products; |
|
· |
our reliance on technical innovation and high-quality products; |
|
· |
changes of the Rules of Golf with respect to equipment; |
|
· |
our ability to adequately enforce and protect our intellectual property rights; |
|
· |
involvement in lawsuits to protect, defend or enforce our intellectual property rights; |
|
· |
our ability to prevent infringement of intellectual property rights by others; |
|
· |
recent changes to U.S. patent laws and proposed changes to the rules of the U.S. Patent and Trademark Office; |
|
· |
intense competition and our ability to maintain a competitive advantage in each of our markets; |
ii
|
· |
limited opportunities for future growth in sales of golf balls, golf shoes and golf gloves; |
|
· |
our customers’ financial condition, their levels of business activity and their ability to pay trade obligations; |
|
· |
a decrease in corporate spending on our custom logo golf balls; |
|
· |
our ability to maintain and further develop our sales channels; |
|
· |
consolidation of retailers or concentration of retail market share; |
|
· |
our ability to maintain and enhance our brands; |
|
· |
seasonal fluctuations of our business; |
|
· |
fluctuations of our business based on the timing of new product introductions; |
|
· |
risks associated with doing business globally; |
|
· |
compliance with laws, regulations and policies, including the U.S. Foreign Corrupt Practices Act (the “FCPA”) or other applicable anti-corruption legislation; |
|
· |
our ability to secure professional golfers to endorse or use our products; |
|
· |
negative publicity relating to us or the golfers who use our products or the golf industry in general; |
|
· |
our ability to accurately forecast demand for our products; |
|
· |
a disruption in the service or increase in cost, of our primary delivery and shipping services or a significant disruption at shipping ports; |
|
· |
our ability to maintain our information systems to adequately perform their functions; |
|
· |
cybersecurity risks; |
|
· |
the ability of our eCommerce systems to function effectively; |
|
· |
occurrence of natural disasters or pandemic diseases; |
|
· |
impairment of goodwill and identifiable intangible assets; |
|
· |
our ability to attract and/or retain management and other key employees and hire qualified management, technical and manufacturing personnel; |
|
· |
our ability to prohibit sales of our products by unauthorized retailers or distributors; |
|
· |
terrorist activities and international political instability; |
|
· |
our ability to grow our presence in existing international markets and expand into additional international markets; |
|
· |
tax uncertainties, including potential changes in tax laws, unanticipated tax liabilities and limitations on utilization of tax attributes after any change of control; |
|
· |
adequate levels of coverage of our insurance policies; |
iii
|
· |
product liability, warranty and recall claims; |
|
· |
litigation and other regulatory proceedings; |
|
· |
compliance with environmental, health and safety laws and regulations; |
|
· |
our ability to secure additional capital on terms acceptable to us and potential dilution of holders of our common stock; |
|
· |
our estimates or judgments relating to our critical accounting policies; |
|
· |
our substantial leverage, ability to service our indebtedness, ability to incur more indebtedness and restrictions in the agreements governing our indebtedness; |
|
· |
a sale, foreclosure, liquidation or other transfer of the shares of our common stock owned by Magnus Holdings Co., Ltd. (“Magnus”) as a result of the term loan agreement entered into by Magnus to finance the purchase of shares of our common stock by Magnus in connection with our initial public offering; |
|
· |
the ability of our controlling stockholder to control significant corporate activities, and our controlling stockholder’s interests may conflict with yours; |
|
· |
the pledge by Fila Korea Co., Ltd. (“Fila Korea”) of the common stock of Magnus and any future pledges by Fila Korea of the common stock of Magnus; |
|
· |
the insolvency laws of Korea are different from U.S. bankruptcy laws; |
|
· |
our status as a controlled company; |
|
· |
increased costs and regulatory requirements of operating as a public company; |
|
· |
our ability to maintain effective internal controls over financial reporting; |
|
· |
our ability to pay dividends; |
|
· |
dilution from future issuances or sales of our common stock; |
|
· |
anti-takeover provisions in our organizational documents; and |
|
· |
reports from securities analysts. |
These factors should not be construed as exhaustive and should be read in conjunction with the other cautionary statements that are included in this report. Should one or more of these risks or uncertainties materialize, or should any of our assumptions prove incorrect, our actual results may vary in material respects from those projected in these forward-looking statements.
Any forward-looking statement made by us in this report speaks only as of the date of this report. Factors or events that could cause our actual results to differ may emerge from time to time, and it is not possible for us to predict all of them. We may not actually achieve the plans, intentions or expectations disclosed in our forward-looking statements and you should not place undue reliance on our forward-looking statements. Our forward-looking statements do not reflect the potential impact of any future acquisitions, mergers, dispositions, joint ventures, investments or other strategic transactions we may make. We undertake no obligation to publicly update or review any forward-looking statement, whether as a result of new information, future developments or otherwise, except as may be required by any applicable securities laws.
iv
INDUSTRY AND MARKET DATA
Within this annual report on Form 10‑K, we reference information and statistics regarding the golf industry and the golf equipment, wear and gear markets. We have obtained certain of this information and statistics from various independent third-party sources, including independent industry publications, reports by market research firms and other independent sources for the most recent available date. We believe that these external sources and estimates are reliable, but have not independently verified them. Certain of this information and statistics are based on our good faith, reasonable estimates, which are derived from our review of internal surveys and independent sources. In addition, projections, assumptions and estimates of the future performance of the golf industry and our future performance are necessarily subject to uncertainty and risk due to a variety of factors, including those described in “Risk Factors” and “Forward-Looking Statements.” These and other factors could cause results to differ materially from those expressed in the estimates made by the independent parties and by us.
WEBSITE DISCLOSURE
We use our website (www.acushnetholdingscorp.com) as a channel of distribution of company information. The information we post through this channel may be deemed material. Accordingly, investors should monitor this channel, in addition to following our press releases, SEC filings and public conference calls and webcasts. In addition, you may automatically receive e-mail alerts and other information about Acushnet Holdings Corp. when you enroll your e-mail address by visiting the “Resources” section of our website at https://www.acushnetholdingscorp.com. The contents of our website are not, however, a part of this report.
TRADEMARKS, TRADE NAMES AND SERVICE MARKS
This Annual Report on Form 10‑K includes trademarks, trade names and service marks that we either own or license, such as “Titleist,” “FootJoy,” “Pro V1,” “Pro V1x,” “FJ,” “Pinnacle,” “Scotty Cameron,” and “Vokey Design” which are protected under applicable intellectual property laws. Solely for convenience, trademarks, trade names and service marks referred to in this report may appear without the ®, TM or SM symbols, but such references are not intended to indicate, in any way, that we will not assert, to the fullest extent under applicable law, our rights or the right of the applicable licensor to these trademarks, trade names and service marks. This report may also contain trademarks, trade names and service marks of other parties, and we do not intend our use or display of other parties’ trademarks, trade names or service marks to imply, and such use or display should not be construed to imply, a relationship with, or endorsement or sponsorship of us by, these other parties.
v
Overview
We are the global leader in the design, development, manufacture and distribution of performance‑driven golf products, which are widely recognized for their quality excellence. Driven by our focus on dedicated and discerning golfers and the golf shops that serve them, we believe we are the most authentic and enduring company in the golf industry. Our mission—to be the performance and quality leader in every golf product category in which we compete—has remained consistent since we entered the golf ball business in 1932. Today, we are the steward of two of the most revered brands in golf—Titleist, one of golf’s leading performance equipment brands, and FootJoy, one of golf’s leading performance wear brands. Titleist has been the #1 ball in professional golf for 68 years and FootJoy has been the #1 shoe on the PGA Tour for over six decades.
Our target market is dedicated golfers, who are the cornerstone of the worldwide golf industry. These dedicated golfers are avid and skill‑biased, prioritize performance and commit the time, effort and money to improve their game. We believe our focus on innovation and process excellence yields golf products that represent superior performance and consistent product quality, which are the key attributes sought after by dedicated golfers. Many of the game’s professional players, who represent the most dedicated golfers, prefer our products thereby validating our performance and quality promise, while driving brand awareness. We leverage a pyramid of influence product and promotion strategy, whereby our products are the most played by the best players, creating aspirational appeal for a broad range of golfers who want to emulate the performance of the game’s best players.
Dedicated golfers view premium golf shops, such as on‑course golf shops and golf specialty retailers, as preferred retail channels for golf products of superior performance and product quality. As a result, we have committed to being one of the preferred and trusted partners to premium golf shops worldwide. This commitment provides us a retail environment where our product performance and quality advantage can most effectively be communicated to dedicated golfers. In addition, we also service other qualified retailers that sell golf products to consumers worldwide.
Our vision is to consistently be regarded by industry participants, from dedicated golfers to the golf shops that serve them, as the best golf company in the world. We have established leadership positions across all major golf equipment and golf wear categories under our globally recognized brands.
|
|
#1 ball in golf Golf’s Symbol of Excellence A leading global golf equipment brand |
|
|
#1 shoe in golf #1 glove in golf A leading global golf wear brand |
|
|
#1 wedge on the PGA Tour |
|
|
#1 putter on the PGA Tour |


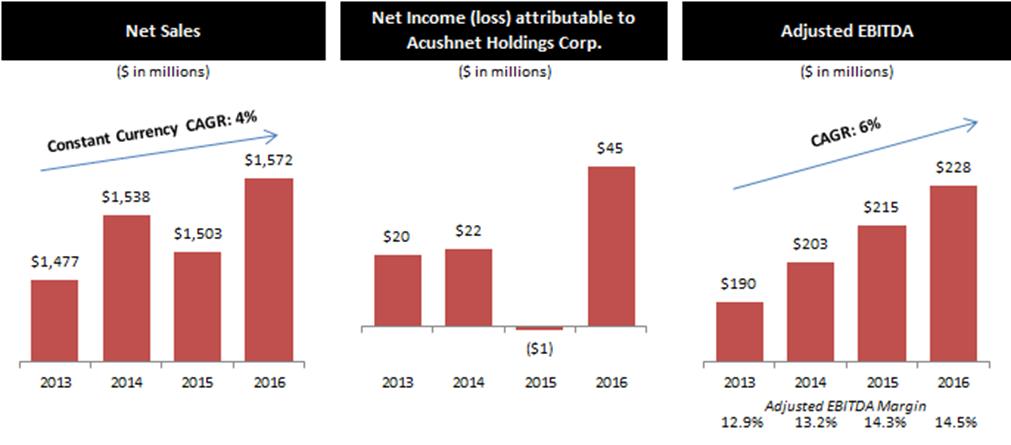
For the year ended December 31, 2016, we recorded net sales of $1,572.3 million, net income attributable to Acushnet Holdings Corp. of $45.0 million and Adjusted EBITDA of $228.4 million. See “Item 6. – Selected Consolidated Financial Data” for a reconciliation of Adjusted EBITDA to net income attributable to Acushnet Holdings Corp., the most directly comparable GAAP financial measure.
6
Our History and Evolution
Founded in Acushnet, Massachusetts by Phil “Skipper” Young in 1910 and incorporated as the Acushnet Process Company, we manufactured rubber‑based products including water bottles, gas masks and bathing caps. Our golf business was established in 1932 when Young, a dedicated golfer himself, missed a critical putt in a golf match. Believing the putt to be well struck, Young took the ball to be x‑rayed, where it was discovered that the ball’s core was off‑center. Following this seminal discovery that many commercially available golf balls frequently had manufacturing inconsistencies, Young set out with Massachusetts Institute of Technology classmate Fred Bommer to develop a superior golf ball. After three years of development, the Titleist golf ball was introduced.
The objective from the very beginning was to produce a golf ball that would set the standard in performance, quality and consistency, and become the preferred choice of dedicated golfers and the preferred trade partners who would serve them. In the early years, many of these preferred trade partners were also some of the first touring golf professionals. Soon the Titleist golf ball was the golf ball of choice wherever competitive golf was played. The core values of serving the game’s dedicated golfer with a superior product, in terms of both performance and quality, and having that superior product validated by the game’s most dedicated golfers and premium golf retailers, have endured for the past eight decades.
In 1976, Acushnet Company was acquired by American Brands, Inc. (the predecessor company of Beam Suntory, Inc. (“Beam”)). We acquired FootJoy in 1985. On July 29, 2011, Acushnet Holdings Corp. (at the time known as Alexandria Holdings Corp.), an entity owned by Fila Korea and certain financial investors, acquired Acushnet Company from Beam. We completed an initial public offering of our common stock in November 2016. See “Notes to Consolidated Financial Statements– Note 2– Summary of Significant Accounting Policies,” for disclosures related to our initial public offering and other related transactions.
Our Core Focus
Dedicated Golfers
Our target market is dedicated golfers, who are avid and skill‑biased, prioritize performance and commit the time, effort and money to improve their game. We believe that dedicated golfers are the most consistent purchasers of golf products and estimate that while they represented only approximately 15% of all United States golfers, they accounted for more than 40% of total rounds played and approximately 70% of all golf equipment and gear spending in the United States during 2016. We also believe dedicated golfers account for an outsize share of golf equipment and gear spending outside the United States and purchase a significant portion of golf wear products worldwide.
Product Platform
Leveraging the success of our golf ball and golf shoe businesses, while maintaining the core values of the Titleist and FootJoy brands, we have strategically entered into product categories such as golf clubs, wedges, putters, golf gloves, golf gear and golf wear with an objective of being the performance and quality leader.
Since the dedicated golfer views each performance product category on its own merits, we have approached each category on its own terms by committing the necessary resources to become the performance and quality leader in each product category where we participate. As a result, we have built an industry leading platform across all performance product categories, driving a market‑differentiating mix of consumable products, which we consider to be golf balls and golf gloves, which collectively represented 40% of our net sales in 2016, and more durable products, which we consider to be golf clubs, golf shoes, golf apparel and golf gear, which collectively represented 60% of our net sales in 2016.
We operate under the following four reportable segments. Financial information for our segments, including sales by geographic area, is included in “Item 7. – Management’s Discussion and Analysis of Financial Condition and Results of Operations” and in “Notes to Consolidated Financial Statements – Note 20 – Segment Information.”
7
Titleist Golf Balls (33% of 2016 net sales)
Titleist is the #1 ball in golf. The Titleist golf ball was founded with a purpose of designing and manufacturing a performance oriented, high quality golf ball that was superior to all other products available in the market. We believe the golf ball is the most important piece of equipment in the game, as it is the only piece of equipment used by every player for every shot. The golf ball is also the most important category for us as it generates the largest portion of our sales and profits. Since its introduction in 2000, the Titleist Pro V1 has been the best‑selling golf ball globally and continues to set the bar in terms of product design, quality and performance. We also design, manufacture and sell other golf balls under the Titleist brand, such as NXT Tour, Velocity and DT TruSoft, as well as under the Pinnacle brand. We have continually improved our golf balls through innovation in materials, construction and manufacturing processes, which has enabled us to build the #1 golf ball franchise in the world.
Titleist Golf Clubs (27% of 2016 net sales)
We design, assemble and sell golf clubs (drivers, fairways, hybrids and irons) under the Titleist brand, wedges under the Vokey Design brand and putters under the Scotty Cameron brand. The mission of our golf club business is to design and develop the best performing golf clubs in the world for dedicated golfers. We believe dedicated golfers do not buy brands across categories but seek out best‑in‑class products in each category. This is the reason we have partnered with dedicated engineers and craftsmen such as Bob Vokey and Scotty Cameron, who understand the nuances, subtleties and impact mechanics of their respective golf club categories. Titleist golf clubs, Vokey Design wedges and Scotty Cameron putters are widely used by professional and competitive amateur players, which validates the products’ performance and quality excellence. We are also committed to a leading club fitting and trial platform to maximize dedicated golfers’ performance experience.
Titleist Golf Gear (9% of 2016 net sales)
We offer a diversified portfolio of Titleist‑branded performance golf gear across the golf bags, headwear, gloves, travel gear, head covers and other golf gear categories. Our golf gear is focused on superior performance and quality excellence, which is the mission of any product bearing the Titleist brand name.
FootJoy Golf Wear (28% of 2016 net sales)
We design, manufacture and sell golf shoes and gloves, and we design and sell performance outerwear, apparel and socks under the FootJoy brand. By offering products with premium materials, superior comfort and fit and authentic designs, FootJoy has become the #1 shoe and #1 glove in golf and a leader in the global performance golf outerwear and the U.S. golf apparel markets. We believe FootJoy is seen by golfers around the world as an authentic and definitive golf brand with a consistent, differentiated focus on performance and quality.
Pyramid of Influence
The game of golf is learned by observation and imitation, and golfers improve their own performance by attempting to emulate highly skilled golfers. Golfers are influenced not only by how other golfers swing but also by what they swing with and what they swing at. This is the essence of golf’s pyramid of influence, which is deeply ingrained in the mindset of the dedicated golfer. At the top of the pyramid is the most dedicated golfer, who attempts to make a living playing the game professionally. Adoption by most of the best golfers, whose professional success depends on their performance, validates the quality, features and benefits of using the best performing products. This, in turn, creates aspirational appeal for golfers who want to emulate the performance of the best players. By virtue of the performance and quality excellence of our products, we believe we are best‑positioned to leverage the pyramid of influence since most of the best players trust and use Titleist and FootJoy products. Our primary marketing strategy is for our products to be the most played by the best players, including both professional and amateur golfers. This strategy has proven to be enduring and effective in the long‑term and is not dependent on the transient success of a few elite players at any given point in time.
Innovation Leadership
We believe innovation is critical to dedicated golfers as they depend on the ability of new and innovative products to drive improved performance. Since we entered the golf ball business in 1932, we believe we have been the
8
design and technology leader in the golf industry with a strategy to develop, implement and protect product and process improvements. We currently employ an R&D team of over 180 scientists, chemists, engineers and technicians. We also introduce new product innovations at a cadence that best aligns with the typical dedicated golfer’s replacement cycle within each product category. We spent $48.8 million, $46.0 million and $44.2 million in 2016, 2015 and 2014, respectively, on R&D.
Operational Excellence
The requirements of the game lead the dedicated golfer to seek out products of maximum performance and consistency. We own or control the design, sourcing, manufacturing, packaging and distribution of our products. In doing so, we are able to exercise control over every step of the manufacturing process and supply chain operations, thereby setting the standard for quality and consistency. Our operational excellence also allows us to continually develop innovative new products, bring those products to market more efficiently and ensure high levels of quality control. We have developed and refined distinct and independently managed supply chains for each of our product categories. Our manufacturing facilities include:
|
· |
three golf ball manufacturing facilities that collectively produce over one million balls per production day; |
|
· |
six golf club assembly facilities; |
|
· |
a joint venture facility to manufacture our golf shoes; and |
|
· |
a facility to manufacture our golf gloves. |
Route to Market Leadership
As one of the preferred partners to premium golf shops, we ensure that the performance benefits derived from using our products are showcased and our products are properly merchandised. We have over 340 sales representatives directly servicing nearly 31,000 accounts in 47 countries and we service over 90 countries in total, directly or through distributors. With an average of almost 20 years of experience, we believe the Titleist U.S. sales team is the largest and most experienced in the industry. Similarly, we believe FootJoy has built the most experienced, highly qualified team in the U.S. golf wear category. As we see our retail partners as a critical connection to dedicated golfers, we place great emphasis on building strong relationships and trust with them. This is the reason our sales associates are expected not simply to be salespeople, but to function as golf experts and enthusiasts in their respective territories, who advise and assist our retail partners to better serve their customers. We help generate golfer demand and sell‑through via in‑shop merchandising, promotions and advertising, and also provide product education to club professionals, coaches and instructors. Lastly, we place a strong focus on consumer engagement, starting with fitting and trial initiatives across our balls, clubs and shoes categories. We offer custom products across categories that we believe are better aligned with golfers’ personal styles, skill levels and preferences.
Market Overview and Opportunity
Market Overview
We estimate that the sport of golf gives rise to a global commercial opportunity of more than $85 billion annually, which captures all spending related to golf. There are over 50 million golfers worldwide playing over 800 million rounds annually on over 32,000 golf courses. Our addressable market comprised of golf equipment, golf wear and golf gear represents approximately $12 billion in retail sales and approximately $8 billion in wholesale sales. The United States accounted for over 40% of our addressable market, followed by Japan and Korea collectively accounting for over 30% of our addressable market, each in 2016.
According to Golf Datatech, LLC, the number of rounds of golf played in the United States has shown modest improvements in both 2015 and 2016. We believe the number of rounds of golf played by our target market of dedicated golfers has remained stable over the past few years.
We view emerging economies, such as the markets in Southeast Asia, as attractive long‑term opportunities based on our assessment through the lens of the five collectively necessary and sufficient conditions for a country to
9
embrace golf: (1) sizeable middle‑class population; (2) educational infrastructure; (3) places to play and practice; (4) professional success that inspires the local golfers; and (5) corporate support.
We believe the golf industry is mainly driven by golfer demographics, dedicated golfers and weather and economic conditions.
Golfer Demographics. Golf is a recreational activity that requires time and money. The golf industry has been principally driven by the age cohort of 30 and above, currently “gen‑x” (age 30 to 49) and “baby boomers” (age 50 to 69), who have the time and money to engage in the sport. In the United States, there are approximately 8.7 million gen‑x golfers and approximately 6.6 million baby boomer golfers, representing approximately 63% of total golfers in the United States. Households headed by gen‑x and baby boomers also claim an approximately 80% share of the total income dollars in the United States. Since a significant number of baby boomers have yet to retire, we anticipate growth in spending from this demographic as it has been demonstrated that rounds of play increase significantly as those in this cohort reach retirement. On average, golfers in the age range of 18 to 34 play 15 rounds per year, whereas those in the age range of 50 to 64 and 65 and above play 29 rounds and 51 rounds per year, respectively. While golf has historically consisted of mostly male players, women accounted for approximately 24% of golfers in the United States in 2015, up from approximately 20% in 2011. Because nearly 40% of beginner golfers in the United States in 2015 were women, we believe that the percentage of women golfers will continue to grow. Beyond the gen‑x and baby boomer generation, another promising development in golf has been the generational shift with millennial golfers making their marks at both professional and amateur levels. Golfers under the age of 30 represented 36% of the World Rank Top 50 and 78% of Rolex World Rank Top 50 Women as of December 31, 2016. The largest single age group of beginners in the United States in 2015 was millennials (age 18 to 29). Further, the number of junior golfers (age 6 to 17) in the United States has grown from approximately 2.5 million golfers in 2010 to approximately 3.0 million golfers in 2015.
Dedicated Golfers. Dedicated golfers are largely gen‑x and baby boomers who have demonstrated the propensity to pay a premium for products that help them perform better. We believe dedicated golfers, who comprise our target market, will continue to be a key driver for the global golf industry. The National Golf Foundation estimates that there were 6.2 million, 6.5 million and 6.4 million “avid” golfers in the United States in 2015, 2014 and 2013, respectively, with “avid” golfers defined as those who play 25 rounds or more per year. We estimate that approximately 60% of these avid golfers in the United States are dedicated golfers.
Weather Conditions. Weather conditions determine the number of playable days in a year and thus influence the amount of time people spend on golf. Weather conditions in most parts of the world, including our primary geographic markets, generally restrict golf from being played year‑round, with many of our on‑course customers closed during the cold weather months. Therefore, favorable weather conditions generally result in more playable days in a given year and thus more golf rounds played, which generally results in increased demand for all golf products.
Economic Conditions. The state of the economy influences the amount of money people spend on golf. Golf equipment, including clubs, balls and accessories, is recreational in nature and is therefore a discretionary purchase for consumers. Consumers are generally more willing to make discretionary purchases of golf products when economic conditions are favorable and when consumers are feeling confident and prosperous.
Our Opportunity
We have demonstrated sustained, resilient and stable revenue and Adjusted EBITDA growth over the past four years, despite challenges related to demographic, macroeconomic and weather related conditions. Our differentiated focus on performance and quality excellence, enduring connections with dedicated golfers and favorable and market‑differentiating mix of consumable and durable products have been the key drivers of our strong performance. We believe this focus positions us to continue to generate industry‑leading performance.
10
Strong Financial Performance
Since 2013, we have driven strong financial performance across our product portfolio in the aggregate and in each of our reportable segments of Titleist golf balls, Titleist golf clubs, Titleist golf gear and FootJoy golf wear. From 2013 to 2016:
|
· |
our net sales increased from $1,477 million to $1,572 million, representing a compound annual growth rate, or CAGR, of 2%, or 4% on a constant currency basis; |
|
· |
our net income attributable to Acushnet Holdings Corp. was $19.6 million in 2013 and $45.0 million in 2016; |
|
· |
our Adjusted EBITDA increased from $190.4 million to $228.4 million, representing a CAGR of 6%; |
|
· |
we achieved 160 basis points of Adjusted EBITDA margin expansion; and |
|
· |
our cash flows provided by operating activities increased from $78.8 million to $105.2 million. |
See “Item 6. – Selected Consolidated Financial Data” for a reconciliation of Adjusted EBITDA to net income (loss) attributable to Acushnet Holdings Corp., the most directly comparable GAAP financial measure. See “Item 7. –Management’s Discussion and Analysis of Financial Condition and Results of Operations—Overview—Key Performance Measures” for a description of how we calculate constant currency information.
Our Competitive Strengths
Steward of Golf’s Most Revered Brands. We have long been the trusted steward of two of golf’s most revered and recognized brands, and have enjoyed the longest running record of market leadership in the golf category. We believe the Titleist and FootJoy brands deliver superior performance and quality excellence in their respective product categories and are widely regarded as the strongest and most identifiable brands among premium golf equipment and golf wear manufacturers. Titleist has been the #1 ball in professional golf for 68 years while FootJoy has been the leading brand on the PGA Tour in golf shoes for over six decades and golf gloves for over three decades. The performance and quality of our brands are validated by the widespread adoption of our products by the world’s best professional and amateur golfers, which generates exceptional brand loyalty among our core customers and drives repeat purchases.
Market‑Leading Portfolio of Products Designed for Dedicated Golfers. The Titleist Pro V1 golf ball was launched in 2000 and in four months became the #1 selling ball on the market, a position it still holds, and is the #1 golf
11
ball played at every level of competitive golf today. We estimate that we held nearly one‑half of the 2015 global top grade wholesale golf ball market, which we estimate was approximately $1.0 billion, including over two‑thirds of the premium performance market segment. Pro V1 models are the longest running #1 of any golf equipment since Golf Datatech began tracking this metric in 1997. It is rare when a brand’s highest priced product in a particular category is also the industry volume leader. In 2016, the number of Titleist balls played on professional tours was more than five times the number of balls of our nearest competitor. Titleist records even higher ball counts at most amateur championships than on the worldwide professional tours, a further testament to the performance and quality of Titleist. Since amateurs are not allowed to receive compensation for the use or endorsement of any brand’s equipment, they freely choose what golf ball they believe will help them shoot their lowest scores. Faithful to the brand promise of the Titleist ball, we believe our golf clubs are also best‑in‑class in terms of performance and quality. Our Vokey Design wedges and Scotty Cameron putters are recognized worldwide as leaders in their respective categories. Our Vokey Design wedges are the most widely used on the PGA Tour. Under our FootJoy brand, we are the #1 shoe in golf, with the leading usage on all of the world’s major professional golf tours and twice as many stock keeping units, or SKUs, as our nearest competitors. FootJoy gloves also have the leading market share, enjoy the #1 position on all the world’s major professional golf tours, and offer the largest selection of golf gloves in the industry. FootJoy is also a global leader in golf outerwear and has a rapidly growing presence in golf apparel.
Favorable Consumable / Durable Mix. We have developed a product portfolio with a favorable mix of consumables and durables, which we believe differentiates us from other pure golf equipment manufacturers. Consumable purchases are largely driven by the number of rounds played, while durable purchases are subject to technology replacement cycles. We believe our favorable product mix is less economically cyclical and more working capital efficient than that of our peers. Our sales reflect a favorable and market‑differentiating mix of consumable products, which we consider to be golf balls and golf gloves, which collectively represented 40% of our net sales in 2016, and more durable products, which we consider to be golf clubs, golf shoes, golf apparel and golf gear, which collectively represented 60% of our net sales in 2016.
Best‑in‑Class Design Innovation. Driven by our commitment to perpetual innovation, we believe we are the innovation leader in the golf industry. Golf’s most regulated and technically‑driven categories are golf balls and golf clubs, and therefore require strong intellectual property to create differentiated products with superior performance and quality. We hold the largest patent portfolio in the golf industry, with over 1,250 active U.S. utility patents in golf balls, close to 350 active U.S. utility patents in golf clubs, wedges and putters and 296 active patents (including ex‑U.S. and design patents) in golf shoes and gloves. As of December 31, 2016, we had 37% and 15% market shares of active golf ball and club patents, respectively. Over 90% of our current products incorporate technologies or designs developed in the last five years. The Titleist Pro V1 franchise is an example of our innovation leadership. We have sold over 130 million dozen Pro V1 and Pro V1x golf balls, generating over $4.5 billion of revenue, since the introduction of the Pro V1 in 2000. We believe our ability to develop and implement innovation drives superior product performance and our patent portfolio allows us to protect our product and process improvements in an industry where success is driven by product performance and quality improvements.
Operational Excellence. Our differentiated manufacturing processes and connectivity between our manufacturing and R&D teams foster integration throughout the design and manufacturing process. This allows us to continually develop innovative new products that we can bring to market efficiently while ensuring consistency and high levels of quality control. Unlike many other golf companies, we own or control the design, sourcing, manufacturing, packaging and distribution of our products. Our vertically integrated approach delivers a consistent product quality and results in very high customer satisfaction. There are over 90 quality checks for Titleist Pro V1 and 120 quality checks that go into Titleist Pro V1x to ensure every ball is worthy of bearing the Titleist brand name. An example of this is our product quality return percentage—for every 10 million Titleist Pro V1 golf balls produced, only one is returned on average. By controlling key aspects of the design and manufacturing processes, we are better able to protect our intellectual property as well as offer customization capabilities and efficient turn times. Furthermore, we are able to provide custom fitted products to individuals in a short timeframe and facilitate regional market customization.
Unparalleled Route to Market Leadership. The foundation of our go‑to‑market strategy is to continue to be the preferred partner for premium golf shops worldwide and to provide customization and fitting that optimize our customers’ post‑purchase experiences. In doing so, we ensure that the performance benefits derived from using our products are showcased and our products are properly merchandised, while deepening our customers’ connections with the Titleist and FootJoy brands. We believe these initiatives, in turn, increase sales and profitability for our retail partners, leading to a mutually beneficial economic relationship. Today, we deploy over 20,000 displays that are
12
designed and adapted to local needs, and there are over 3,500 premium golf shops that exclusively stock or display Titleist balls. By virtue of our strong relationship with retail partners, we are able to build the strong connections with and gain deep understanding of dedicated golfers. We are able to closely track the replacement cycles of our customers’ equipment and effectively market our new products in a timely manner.
Deep Stewardship Culture and Experienced Management Team. Behind our exceptional products and organizational infrastructure lies an authentic and enduring organizational culture validated by the longevity of our management team, sales force and associates. Our management team members, many of whom have dedicated their entire careers to our company, average over 19 years of employment with us. They are supported by a deep and talented team of associates across product categories, functions, markets and geographies, who serve as strong brand and cultural ambassadors. Approximately 50% of our U.S. associates have over ten years of employment with us, highlighting the depth of our talent and future leaders. We are the stewards of our brands, and we are committed to maintaining the culture of excellence that defines us and our products.
Our Growth Strategies
We plan to continue to pursue organic growth initiatives across all product categories, brands, geographies and marketing channels.
Introduce New Products and Extend Market Share Leadership in Equipment Categories. We expect to sustain our strong performance in our core categories of golf balls and golf clubs through several targeted strategies:
|
· |
Titleist Golf Balls. To ensure sustained long‑term market leadership, we are continuously investing in design innovation and refining our sell‑in and sell‑through route to market capabilities and effectiveness in the golf ball product category. We are currently focused on improving our sales team training in product, merchandising, local promotion and selling skills, as well as enhancing trade partnerships in those channels where dedicated golfers shop. To grow our custom golf ball business, we have in place several new initiatives designed to develop strategic partnerships with corporations heavily invested in golf and to drive growth with a particular focus on the areas of corporate, country club, tournament and personalized sales. The 2016 launch of the “My Pro V1 Shop” online golf shop allows golfers to create and purchase their own unique Titleist Pro V1 / Pro V1x golf balls with special play numbers, logos or personalization. We believe the website will increase the likelihood of repeat purchases, thereby strengthening the link with golfers and loyalty to Titleist golf balls. |
|
· |
Titleist Clubs, Wedges and Putters. We intend to continue to launch innovative, performance golf clubs by further leveraging Titleist clubs’ leading R&D platform. We believe concept and specialty products and premium quality digital content will further drive customer awareness and market share gains across all premium club categories. To enhance trial and fitting, we plan to continue our leading consumer connection initiatives, grow our fitting network in opportunistic markets and further promote the utilization of our distinctive fitting operations. We are also executing several initiatives to further elevate Vokey Design wedges and Scotty Cameron putters as golf’s leaders in short‑game performance, technology, craftsmanship, and selection. |
Increase Penetration in Golf Gear and Wear Categories. We intend to build on the brand loyalty that the dedicated golfer has developed for our Titleist ball and club categories and FootJoy shoe and glove categories in order to increase our penetration in the adjacent categories of golf gear and golf wear. We expect to continue to drive growth across these categories by employing the following initiatives:
|
· |
Titleist Golf Gear. We are committed to providing dedicated golfers with golf gear—including golf bags, headwear, gloves, travel gear, head covers and other accessories—of performance and quality excellence that is faithful to the Titleist brand promise. We are making significant investments in design and engineering resources and are leveraging dedicated player research methodologies and insights to drive innovation in this product category. We also plan to expand custom and limited edition product offerings. |
|
· |
FootJoy Women’s Apparel Initiative. We are currently building out a focused, performance‑based FootJoy women’s apparel line consistent with the brand’s successful positioning in men’s apparel. The women’s apparel line, which launched in early 2016, pairs sophisticated performance fabrics and design with |
13
layering technology pioneered by FootJoy to create maximum comfort and protection. By leveraging our existing FootJoy sales force in an adjacent category, we believe we can offer a compelling and authentic solution to female golfers and capitalize on the trend of casual, athletic styling that is driving success in the broader women’s apparel space. |
|
· |
FootJoy eCommerce Launch. We launched a U.S. eCommerce website for FootJoy in 2016. Over 6,000 SKUs are offered across all FootJoy categories, including shoes, gloves and apparel. The eCommerce initiative is expected to yield incremental sales and profitability, enriched data on preferences and trends as well as foster a deeper and more real time connection with the dedicated golfer. |
Strategically Pursue Global Growth. The Titleist and FootJoy brands are both global brands that are well positioned where golf’s growth is anticipated. While we believe that a majority of the near‑term growth will be driven by the developed economies, emerging economies, such as the markets in Southeast Asia, represent longer‑term growth opportunities. To meet future demand, we are ensuring that local capabilities and expertise in sales, customer service, merchandising, online presence, golf education and fitting initiatives are in place to support our operations. We continue to hire local talent across all functions in order to better position the products of Titleist and FootJoy in those markets where participation and popularity of the sport are expected to increase.
Our Products
We design, manufacture and market a broad range of products under the Titleist and FootJoy brands. Both brands are recognized as industry leaders in performance, quality, innovation and design. Our products include golf balls, golf clubs, wedges and putters, golf shoes, golf gloves, golf gear and golf outerwear and apparel.
|
|
||
|
Titleist Golf Balls |
Titleist Golf Clubs, |
Titleist Golf Gear |
|
|
|
|
|
Pro V1 |
Drivers |
Golf bags |
|
Pro V1x |
Fairways |
Headwear |
|
NXT Tour |
Hybrids |
Golf gloves |
|
Velocity |
Irons |
Travel gear |
|
DT TruSoft |
Vokey Design wedges |
Head covers |
|
Pinnacle |
Scotty Cameron putters |
Other golf gear |
|
|
||
|
FootJoy Shoes |
FootJoy Gloves |
FootJoy Outerwear and Apparel |
|
|
|
|
|
Traditional |
Leather construction |
Performance outerwear |
|
Spikeless |
Synthetic |
Performance golf apparel |
|
Athletic |
Leather/synthetic combination |
Golfleisure women’s apparel |
|
Casual |
Specialty |
|


Titleist
We design, manufacture and sell golf balls, golf clubs, wedges and putters and golf gear under the Titleist brand. Net sales of Titleist products for the years ended December 31, 2016, 2015 and 2014 were $1,139.2 million, $1,084.1 million, and $1,116.0 million, respectively, in each case approximately 72% of our total net sales.
Titleist Golf Balls
Titleist is the #1 ball in golf. The 2016 Titleist golf ball product line consisted of six major models, each designed to deliver different performance characteristics, such as distance, flight, short game control, feel and durability.
14
Pro V1 and Pro V1x are designed to be the highest performing and quality golf balls for golfers at every level of the game and best demonstrate Titleist’s design, innovation and technology leadership. The first Pro V1 golf ball was introduced on the PGA Tour in October 2000 and launched to the market in December 2000. It represented the coalescence of three of Titleist’s industry leading technologies: large solid core; multi‑component construction; and high performance, thermoset cast urethane elastomer covers. In its first four months, the Pro V1 golf ball became the best‑selling golf ball and holds that position to this day. During this time, we also set out to create a ball that produced lower driver spin and higher launch characteristics than the Pro V1 while retaining its high performance scoring spin. With its four‑piece, dual core design, the Pro V1x golf ball was introduced in 2003. In 2017, we launched new versions of the Pro V1 and Pro V1x. The New Pro V1 is designed to offer significantly longer distance from faster ball speed and lower long game spin. Advancements in aerodynamics for both Pro V1 and Pro V1x are designed to produce even more consistent flight. We believe these improvements, along with benefits such as our renowned Drop-and-Stop control, soft feel and long lasting durability, make Pro V1 golf balls the best performance choice for all golfers.
We also provide best‑in‑class performance with the NXT Tour, NXT Tour S, Velocity and DT TruSoft models.
By competing at a lower price point, Pinnacle completes a full product offering for us. With two major models, Rush and Soft, Pinnacle golf balls are also available in different optic colors and play numbers. Our Pinnacle Brand competes in the price market segment, which allows the Titleist brand to focus on the premium performance and performance market segments and reduces the need to extend the Titleist brand to the price market segment. This also helps to support the thousands of golf shops that choose to exclusively stock Titleist and Pinnacle golf balls, allowing them to offer golf balls in each market segment which market segments we discussed and defined below.
Titleist and Pinnacle golf balls accounted for $513.9 million, or 33%, $535.5 million, or 36%, and $543.8 million, or 35%, of our total net sales for the years ended December 31, 2016, 2015 and 2014, respectively.
We estimate that we held nearly one‑half of the 2015 global top grade wholesale golf ball market, which we estimate was approximately $1.0 billion, and held leadership positions across the most profitable market segments. The top grade wholesale golf ball market consists of all golf balls sold in the wholesale market excluding range golf balls, practice golf balls or downgraded or repurposed golf balls.
|
· |
The premium performance market segment (which we estimate was approximately $490 million of the 2015 global top grade wholesale golf ball market), which we consider to be golf balls that are designed to maximize total performance across all product attributes, including distance, short game spin and control, feel and durability. Titleist Pro V1 and Pro V1x golf balls led the premium performance segment with over two‑thirds of this market segment. |
|
· |
The performance market segment (which we estimate was approximately $380 million of the 2015 global top grade wholesale golf ball market), which we consider to be golf balls that are designed to prioritize distance, good short game spin and control, feel and durability, while maintaining a lower price point than balls that compete in the premium performance market segment. Titleist NXT Tour, Velocity and DT golf balls led the performance segment with approximately one‑third of this market segment. |
|
· |
The price market segment (which we estimate was approximately $180 million of the 2015 global top grade wholesale golf ball market), which we consider to be golf balls that are designed to prioritize distance, feel and durability, while targeting a more affordable price point than balls that compete in the premium performance and performance market segments. We are a leader in the price market segment. |
15
The table below shows the percentage of golfers that used Titleist golf balls as compared to its nearest competitor for specific professional tours and representative amateur championships in 2016.
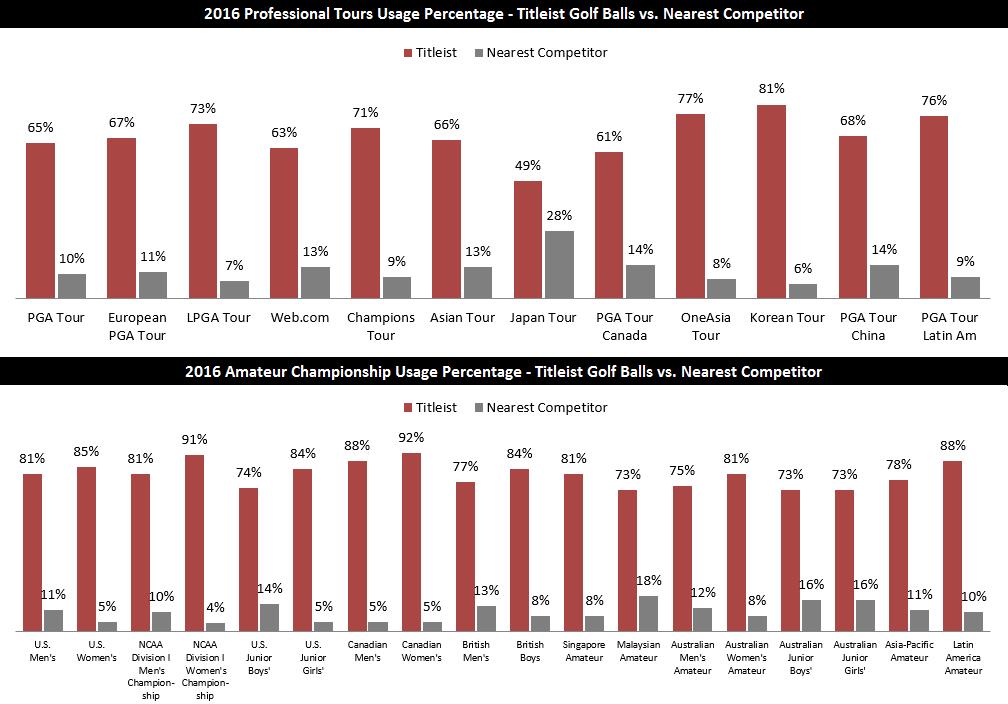
As shown in the table above, at most amateur championships, Titleist records even higher ball counts than on the worldwide professional tours. Under The Rules of Golf established by the game’s governing bodies, the USGA and R&A, amateurs are not allowed to receive compensation for the use or endorsement of any brand’s equipment. Amateurs freely choose what golf ball they believe will help them shoot their lowest scores. We believe their choice of the Titleist golf ball further validates the superior performance and superior quality of Titleist.
We are also a leader in custom imprinted golf balls. This includes printing high quality reproductions of corporate logos, tournament logos, country club or resort logos, and personalization on Titleist and Pinnacle golf balls. Our service includes design capabilities, special packaging options and fast turnaround times. Custom imprinted golf balls represented over 30% of our global net golf ball sales for the year ended December 31, 2016. The majority of custom imprinting is done for corporate logos as there has long been a strong connection between the business community and golf.
Titleist Golf Clubs, Wedges and Putters
We view and operate the Titleist golf club business in three distinct categories: clubs (which includes drivers, fairways, hybrids and irons), wedges and putters. Our products are generally priced at or above the premium price points in the marketplace, driven by higher‑end technologies (including design, materials and processes) we employ to generate superior quality and performance. We have different models within each category to address the distinct performance needs of our dedicated golfer target audience. Titleist golf clubs, wedges and putters accounted for $431.0 million, or 27%, $388.3 million, or 26%, and $422.4 million, or 27%, of our total net sales for the years ended December 31, 2016, 2015 and 2014, respectively.
16
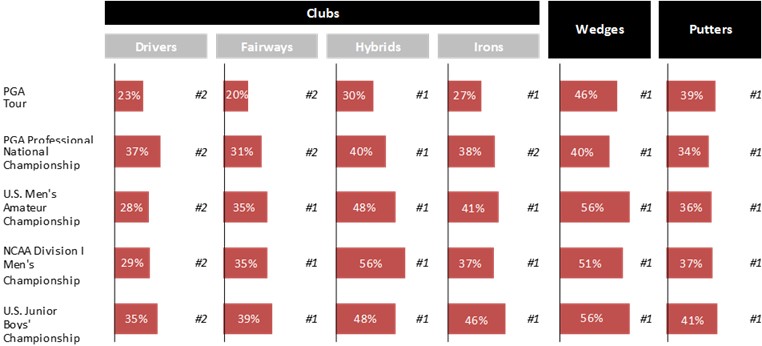
The table below shows the usage percentages and ranks of Titleist golf clubs, wedges and putters on the 2016 PGA Tour and representative 2016 championships in the United States.
Titleist Clubs
Our current global club line consists of the 917 product line of drivers and fairways, the 816 product line of hybrids and the 716 product line of irons. Every product in our club line features premium, tour‑proven stock shafts and grips, complemented by a broad range of custom options.
Titleist 917 drivers and fairways are designed to deliver superior performance through tour‑proven technologies that increase ball speed, decrease spin, and optimize flight without sacrificing forgiveness. We design our drivers and fairways to deliver complete performance with tour‑preferred looks, sound and feel, and we offer the ability to precisely fit individual golfers’ needs.
Titleist 816 hybrids generate long game performance through advanced technology. The advanced features of our hybrids aim to facilitate precision fitting and generate high ball speed, low spin and high launch for increased distance and forgiveness.
Titleist 716 irons are innovative, technologically advanced products designed to deliver distance, forgiveness, proper shot control and feel. While we offer stock set configurations for our iron sets, approximately 56% of our worldwide iron sales are custom fit to help deliver a better fit and performance.
We also sell our VG3 line of clubs, which consist of men’s and women’s drivers, fairways, hybrids and irons offered in Japan only. These products feature design and construction specifically targeted to dedicated golfers in Japan.
Vokey Design Wedges
Bob Vokey champions the Titleist wedge effort by creating high performance wedges to meet the demands of dedicated golfers and the best players in the world. The Vokey Design wedge product offering is a compilation of the most popular wedges resulting from Bob Vokey’s hands‑on work with golf’s best players to develop shapes and soles that address varying techniques and course conditions. In total, we offer 21 unique loft, sole grind and bounce combinations and three unique finishes to create golf’s most complete wedge product performance range. In addition, Vokey’s online Wedgeworks program promotes limited edition models and allows golfers to customize and personalize their wedges. Vokey Design wedges are the most played wedges by tour professionals. In 2016, they accounted for over 46% of all wedges in play on the PGA Tour, where they have been #1 every year since 2004.
17
Scotty Cameron Putters
Scotty Cameron Fine Milled Putters are developed through a specialized and iterative process that blends art and science to create high performance putters. Scotty’s design inspiration begins with studying the best players in the world and working with them to identify the consistent strengths and attributes of their putting. Scotty Cameron encourages a selection process that identifies the putter length, toe flow and appearance to deliver proper balance, shaft flex and feel to golfers and to encourage proper technique. Scotty Cameron putters consist of a range of products for each of these key selection criteria. In 2016, over one‑third of the putters played on the PGA Tour were Scotty Cameron putters, and over the past 21 years, Scotty Cameron putters have helped players win over 1,200 tournaments on the worldwide professional tours.
Using the scottycameron.com website as an information and services hub, we offer loyal brand fans the opportunity to connect more closely with the Scotty Cameron brand. Golfers can customize and personalize their putter(s) in the online Scotty Cameron Custom Shop. Through the popular “Club Cameron” loyalty program and Scotty’s online “Studio Store,” brand fans can purchase unique Scotty Cameron accessories. In 2014, we also opened the Scotty Cameron Gallery in Encinitas, California, and in 2016, we entered into a license agreement whereby a third party opened and operates a similar facility in Tokyo, Japan. Each of these facilities is a premium retail boutique which offers consumers the ability to experience the tour fitting process as well as purchase unique accessory items.
Titleist Golf Gear
Titleist golf gear products are designed and engineered using premium materials, paying particular attention to superior performance, function and style. We focus on the design and development of golf bags, headwear, gloves, travel gear, head covers and other golf gear. We provide personalization and customization within each category of Titleist golf gear, as well as certain licensed products, in order to meet the needs of the dedicated golfer and as part of our service to our accounts. We believe the golf gear business represents a sizable but highly fragmented opportunity with numerous competitors in each product category and geographical market. Titleist golf gear accounted for $136.2 million, or 9%, $129.4 million, or 9%, and $127.9 million, or 8%, of our net sales for the years ended December 31, 2016, 2015 and 2014, respectively.
Titleist golf gear includes:
|
· |
Golf Bags. Our golf bags are designed and engineered with a variety of models possessing distinct features and benefits, including our Tour Staff, Cart and Carry models. The Titleist Tour Staff, Cart and Carry golf bags are leading products sold at premium prices throughout our worldwide distribution network. According to Golf Datatech, our share of U.S. net sales of golf bags from on‑course golf shops and golf specialty retailers was approximately 19% for the year ended December 31, 2016, and our principal competitors in this category include Sun Mountain, Ping and Callaway. |
|
· |
Headwear. Titleist headwear is designed and developed with advanced fabrications and construction to provide performance benefits as well as desirable styling for the dedicated golfer. Our headwear seeks to deliver benefits such as moisture management, UV protections, a secure fit and durability. We offer many unique product models within our headwear lines that include fitted headwear, adjustable headwear, visors and weather protection, including waterproof and cold weather styles. |
|
· |
Golf Gloves. Our Titleist golf glove product portfolio is led by the Players Glove, which is the choice of many leading professionals around the globe and a top model with accounts. We offer a select group of models in most markets that includes the Players Glove, the Players‑Flex Glove and the Perma‑Soft Glove as well as the Players Custom Glove and the Q‑Mark Custom Glove, which are customizable models. The Titleist glove business is strategically aligned with the FootJoy glove business to ensure a comprehensive product portfolio for our accounts and complementary benefit to us. |
|
· |
Travel Gear. Titleist travel gear is offered to serve the business and lifestyle needs of our dedicated golfer audience. Meticulously constructed with premium materials, our different models of travel gear are thoughtfully designed with advanced fabrications and construction to provide functionality, quality and durability. We offer a range of models including golf club travel bags, cabin bags, backpacks, duffel bags and wheeled roller bags, as well as messenger bags and briefcases. |
18
|
· |
Head Covers and Other Golf Gear. Titleist serves the lifestyle and performance needs of our dedicated golfer audience with a variety of other products including head covers, umbrellas, towels, bag covers, shag bags, valuable pouches and cold weather gear. |
FootJoy Golf Wear
FootJoy is one of golf’s leading performance wear brands, which consists collectively of golf shoes, gloves and apparel. FootJoy products accounted for $433.1 million, or 28%, $418.9 million, or 28%, and $421.6 million, or 27%, of our total net sales for the years ended December 31, 2016, 2015 and 2014, respectively.
FootJoy Golf Shoes
FootJoy is the #1 shoe in golf and has been the #1 shoe on the PGA Tour for over six decades. With an exclusive focus on golf, FootJoy shoes are designed, developed and manufactured for all golfers in all golf shoe categories, including traditional, casual, athletic and spikeless. We are the global leader in golf shoes with approximately one‑third of the 2016 global wholesale golf shoe market, which we estimate was approximately $575 million.
The golf shoe category is one of the most demanding of all wearables as golf shoes must perform in all weather conditions, including extreme temperature and moisture exposure; be resistant to pesticides and fungicides; withstand frequent usage and extensive rounds of play; and provide consistent comfort, support and protection to the golfer in an average of over five miles in a walked round. Hence, golf shoes require extensive knowledge and expertise in foot morphology, walking and swing biomechanics, material science and application and sophisticated manufacturing and construction techniques.
Golf shoes are also a style and fashion driven category. FootJoy offers a large assortment of styles to suit the needs and tastes of all golfers. Although it has products that cater to all segments of the value chain, 90% of its 118 styles in the United States golf shoe offering as of December 31, 2015 were in the super premium (greater than $150 MSRP) or premium (greater than $100 MSRP) revenue categories. The breadth and scope of the FootJoy product line is commensurate with its leading sales position. To maintain and grow this leadership position in the category, new product launches and new styles comprise over 60% of its offerings each year in all significant markets around the world.
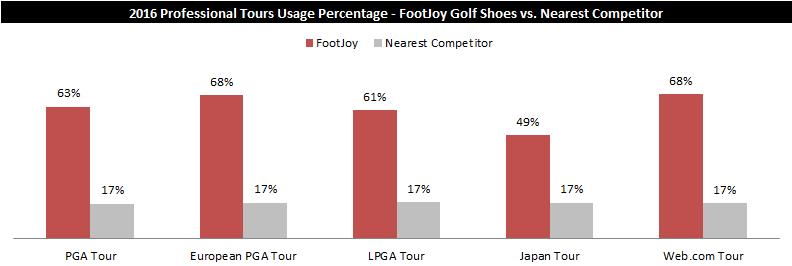
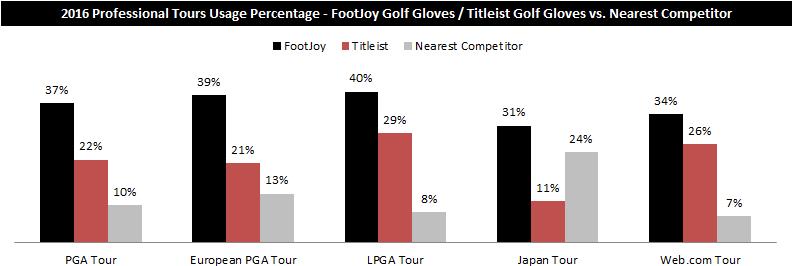
Although FootJoy seeks the greatest use at all levels of the game, it enjoys the leading usage by the most of the best players. The table below shows the percentage of professional golfers that used FootJoy shoes as compared to its nearest competitor for representative professional tours in 2016.
In addition to its stock offerings, FootJoy is a leader in the customization of golf shoe styles and designs. FootJoy’s MyJoys custom golf shoe portal provides individual choices for style, color, personal IDs and team logos that are produced to order for golfers around the world. We believe it is the largest choice offering in the golf shoe category and provides a service and personal expression capability that creates brand loyalty and repeat purchases.
19
FootJoy Gloves
FootJoy is the #1 glove in golf. We are the global leader in golf gloves with approximately one‑third of the 2015 global wholesale golf glove market, which we estimate was approximately $230 million. FootJoy is over three times larger than Titleist in the category, which is the #2 brand worldwide in sales. FootJoy is the leader in sales for all sub‑categories of the glove business, including leather construction, synthetic, leather/synthetic combinations and all specialty gloves including rain and winter specific offerings.
As in the golf shoe category, FootJoy has a long standing leadership position in the glove business that is the result of a deep understanding of golfer needs and expectations for performance, fit, comfort and quality. FootJoy offers the largest variety of glove designs and specifications to meet the needs of all golfers, including high quality, thin leather construction, advanced synthetics and leather/synthetic combinations, and specialty applications such as the world’s leading rain and winter golf gloves. FootJoy has enjoyed leadership of the category since the mid‑1980s and is the market leader in every significant golf market around the world. The table below shows the percentage of professional golfers that used FootJoy and Titleist gloves as compared to their nearest competitor for representative professional tours in 2016.
FootJoy Outerwear and Apparel
FootJoy’s most recent brand extensions have been the entry into the golf outerwear and golf apparel markets. FootJoy’s goal for outerwear is to “make every day playable” and extend the golf season by providing products for rain, wind and cold conditions. FootJoy entered the outerwear category in 1996 with innovative designs and materials and became the leader in net sales in the United States by 2005 and still holds this position today. According to Golf Datatech, our share of U.S. net sales of golf outerwear from on‑course golf shops and golf specialty retailers was approximately 27% for the year ended December 31, 2016, and our principal competitors in this category include Nike, Zero Restriction and Adidas. The brand’s longer term goal is to establish itself as the #1 golf outerwear product worldwide.
The FootJoy outerwear line is predicated on the FootJoy Layering System with three layers: base layer for moisture management, mid layer for temperature control and an outer layer for weather protection. The layer system allows for easy adjustment on the course with maximum comfort and protection. As in its successful golf shoe and glove categories, FootJoy outerwear built its leadership position in the United States by utilizing premium materials and design know‑how to build a complete offering of specialized products to meet the unique needs of the golfer in all weather extremes.
FootJoy fully entered the adjacent category of general golf apparel in 2012 with a tightly focused offering for men in the U.S. market. The line was extended to markets in Europe and Asia in the following years and now enjoys wide appeal and a growing share in most markets around the world. We believe it is one of the fastest growing brands in the men’s general golf apparel market. According to Golf Datatech, our share of U.S. net sales of men’s general golf apparel and outerwear from on‑course golf shops and golf specialty retailers was approximately 11% for the year ended December 31, 2016. The general golf apparel market represents a sizable but highly fragmented opportunity with numerous competitors in each geographical market, including Nike, Adidas and Under Armour.
20
FootJoy more broadly entered the U.S. women’s golf apparel market in early 2016 under the trademark Golfleisure. The styling is appropriate for golf and inspired by the current athleisure segment of women’s apparel in other categories and uses. According to Golf Datatech our share of U.S. net sales of women’s golf apparel and outerwear from on‑course golf shops and golf specialty retailers was approximately 3% for the year ended December 31, 2016, and our principal competitors in this category include Nike, EP Pro and Adidas. Plans include expansion of distribution to other markets in Europe and Asia during 2017.
Product Launch Cycles
We maintain differentiated and disciplined product launch cycles across our portfolio, which has contributed to stable and resilient growth over the long‑run. This approach gives our R&D teams a period of time we believe is necessary to develop superior performing products versus the prior generation models. As a result, we are able to manage our product transitions and inventory from one generation to the next more efficiently and effectively, both internally and with our trade partners.
Product introductions generally stimulate net sales as the golf retail channel takes on inventory of new products. Reorders of these new products then depend on the rate of sell‑through. Announcements of new products can often cause our customers to defer purchasing additional golf equipment until our new products are available. The varying product introduction cycles described below may cause our results of operations to fluctuate as each product line has different volumes, prices and margins.
Titleist Golf Balls Segment
We launch new Titleist golf ball models on a two‑year cycle, with new product launches of Pro V1 and Pro V1x, our premium performance models, generally occurring in the first quarter of odd‑numbered years and new product launches of NXT Tour, Velocity and DT, our performance models, generally occurring in the first quarter of even‑numbered years. For new golf ball models, sales occur at a higher rate in the year of the initial launch than in the second year. Given the Pro V1 franchise is our highest volume and our highest priced product, we typically have higher net sales in our Titleist golf ball segment in odd‑numbered years.
Titleist Golf Clubs Segment
We generally launch new Titleist golf club models on a two‑year cycle. Since the fall of 2014, we have generally used the following product launch cycle, and at present we anticipate continuing to use this product launch cycle going forward because we believe it aligns our launches with the purchase habits of dedicated golfers. In general, we launch:
|
· |
drivers and fairways in the fourth quarter of even‑numbered years, which typically results in an increase in sales of drivers and fairways during such quarter because retailers take on initial supplies of these products as stock inventory, with increased sales generated by such new products continuing the following spring or summer of odd‑numbered years; |
|
· |
irons and hybrids in the fourth quarter of odd‑numbered years, with the majority of sales generated by such new products occurring in the following spring or summer of even‑numbered years because a higher percentage of our new irons and hybrids as compared to our drivers and fairways are sold through on a custom fit basis and the spring or summer is when golfers tend to make such custom fit purchases; |
|
· |
Vokey Design wedges in the first quarter of even‑numbered years, with the majority of sales generated by such new products occurring in the spring or summer of such even‑numbered years; |
|
· |
Scotty Cameron putters in the first quarter, with the Select models launched in even‑numbered years and the Futura models launched in odd‑numbered years, with the majority of sales generated by such new products occurring in the spring or summer of the year in which they are launched; and |
|
· |
Japan‑specific VG3 drivers, fairways, hybrids and irons in the first quarter of even‑numbered years, with the majority of sales generated by such new products occurring in the spring and summer of such even‑numbered years. |
21
As a result of this product launch cycle, we generally expect to have higher net sales in our Titleist golf club segment in even‑numbered years due to the following factors:
|
· |
the majority of sales generated by new irons and hybrids launched in the fourth quarter of odd‑numbered years is expected to occur in the spring and summer of the following even‑numbered years; |
|
· |
the majority of sales generated by new Vokey Design wedges launched in the first quarter of even‑numbered years is expected to occur in such even‑numbered years; |
|
· |
the majority of sales generated by new Scotty Cameron Select line of putters launched in the first quarter of even‑numbered years is expected to occur in such even‑numbered years; |
|
· |
the majority of sales generated by new Japan‑specific VG3 drivers, fairways, hybrids and irons launched in the first quarter of even‑numbered years is expected to occur in such even‑numbered years; and |
|
· |
the increase in sales of new drivers and fairways launched in the fourth quarter of even‑numbered years due to the initial sell‑in of these products during such quarter. |
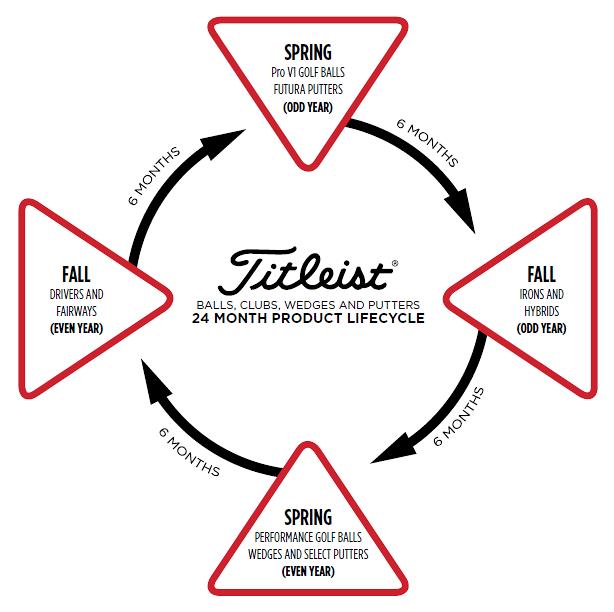
Titleist Golf Gear and FootJoy Golf Wear Segments
Our FootJoy golf wear and Titleist golf gear businesses are not subject to the same degree of cyclical fluctuation as our golf ball and golf club businesses as new product offerings and styles are generally introduced each year and at different times during the year.
22
Manufacturing Excellence
Our manufacturing processes and management of supply chain operations ensure consistency of product performance and quality. We own or control the design, sourcing, manufacturing, packaging and distribution of our products.
Manufacturing Network
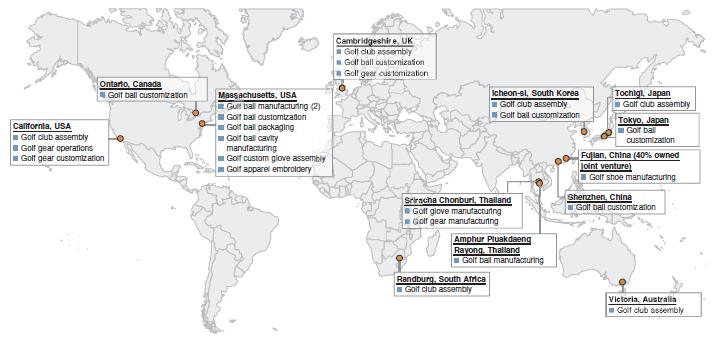
Our manufacturing network is comprised of our owned facilities and select partners around the globe. Our scale and global reach enable us to maximize cost efficiency, reduce lead time, provide regional customization and gain insights into local markets.
We are the largest scope and scale golf ball manufacturer in the world with three company‑owned and operated manufacturing facilities, two located in the United States and one in Thailand, encompassing 600,000 total square feet with sufficient production capacity to meet anticipated growth. We also have local custom golf ball imprinting operations in the United States, Japan, Canada, the U.K. (servicing the U.K., Ireland and continental Europe), Korea and China to deliver superior reproduction quality and service. We utilize qualified local vendors for imprinting capabilities in other geographic markets.
We assemble clubs at six strategic global locations, allowing us to provide custom fitted golf clubs with regional customization with efficient turnaround times. Each of our six custom manufacturing locations is responsible for supply chain execution for golf clubs and wedges, from forecast generation to component procurement to club assembly and distribution, allowing each region to respond to market specific needs or trends. Scotty Cameron putters are assembled solely at our Carlsbad, California manufacturing facility.
We own and operate the largest golf glove manufacturing operation in the world in Chonburi, Thailand which employs nearly 1,500 workers, where we manufacture both FootJoy and Titleist golf gloves. The factory produces over 10 million FootJoy and Titleist gloves annually.
All of our FootJoy golf shoes are manufactured in a 525,000 square foot facility in Fuzhou, China, owned by a joint venture in which we have a 40% interest with the remaining 60% owned by our long‑standing Taiwan supply partners. In our consolidated financial statements, we consolidate the accounts of our FootJoy golf shoe joint venture, which is a variable interest entity, or VIE. The joint venture was established in 1995 and has been in its current facility since 2000. The sole purpose of the joint venture is to manufacture our golf shoes and as such we are deemed to be the primary beneficiary of the VIE as defined by ASC 810. The multi‑floor/multi‑building complex owned by the joint
23
venture is devoted exclusively to FootJoy golf shoes, has production capacity of nearly five million pairs per annum and is staffed by over 2,700 workers. See “Item 7. – Management’s Discussion and Analysis of Financial Condition and Results of Operations—Components of our Results of Operations—Noncontrolling Interests” for a discussion of our FootJoy golf shoe joint venture and the material terms of the agreement which governs such joint venture arrangement.
Vertical Integration
Our vertically integrated approach to manufacturing is at the core of our consistent product quality and resulting high customer satisfaction. Our golf balls, golf gloves and golf shoes operations enjoy significant vertical integration, whereby we design each product, source the raw materials, and then manufacture, finish and package at our owned facilities. We design our golf clubs, golf wear and golf gear products internally and source the components or finished goods from select vendors that develop and manufacture our designs. We structure our manufacturing and sourcing operations based on the availability of best‑in‑class manufacturers and vendors. We choose to maintain a vertically integrated approach in those product categories where we believe there are no third‑party vendors who meet our high standards and where we are able to achieve economies of scale.
The golf ball supply chain is our most vertically integrated and our golf ball operations team works closely with our R&D teams and key raw material suppliers. We design every Titleist and Pinnacle golf ball, source the raw materials, and then manufacture, finish and package over one million golf balls per production day.
FootJoy has a long standing history of successful vertically integrated manufacturing in its shoe and glove businesses. We design all facets of the shoe, including upper patterns, insoles, outsoles and traction elements. Raw materials for the uppers and insoles and component parts for the outsoles and traction elements are sourced around the world through independent third party suppliers. All of our golf shoes are then manufactured in our joint venture facility in Fuzhou, China. In our golf glove business, we design each product, source all raw materials and then manufacture substantially all of the finished products.
Our Titleist golf club operations team works closely with our R&D teams and key component suppliers to design and produce technologically advanced and high quality clubs, wedges and putters. Their collective efforts continue to identify and employ new materials, new processes and new machinery that are used to improve performance and quality, as well as to reduce lead times and product costs. Lastly, each product is inspected prior to shipment at point of origin by the supplier, and in the case of heads, also by our own quality personnel, and all products are audited at the receiving facility.
A coordinated internal team designs and sources the finished goods for all FootJoy outerwear and apparel products. Over the last twenty years, we have created long‑standing relationships with several independent supply groups that have expertise and quality capabilities consistent with FootJoy’s high standards and specifications. No one source of supply provides more than 50% of our annual needs in these categories.
Raw Materials, Product Components and Finished Goods Supply and Sourcing
We have aligned with a select few industry leaders capable of meeting our quality standards and performance requirements with respect to the supply of our raw materials, product components and finished goods.
For our golf balls business, we carefully select our raw materials as well as our sources based on quality, cost efficiency and risk management. Our highest raw material consumption for golf balls, in order, is polybutadiene, ionomers, zinc diacrylate (ZDA), urethane, and coatings. To mitigate risk of supply disruption of polybutadiene or ionomers, we manage inventory levels and store additional inventory during the traditional hurricane season in the United States because certain significant suppliers have in the past and may in the future be impacted by hurricanes. For polybutadiene, ZDA, urethane and coatings, we use either multiple suppliers or multiple production facilities, some with geographic separation, to reduce the risk of raw material shortages. Additionally, we utilize a cloud‑based global supplier risk monitoring tool which provides alerts in our supply chain in areas such as financial/credit, geographic/climactic, political, organizational changes, transportation and labor/wages.
We source the raw materials for our golf glove and golf shoe businesses, and certain of the components for our golf shoe business, from a select group of third‑party suppliers.
24
We have excellent long term relationships with our Titleist golf club supplier partners, and they supply the majority of our more than 4,000 component SKUs. These key partnerships have allowed us to reduce lead times by an average of 60% over the past five years, while also reducing component and finished goods inventory, ensuring on‑hand availability, increasing our responsiveness to customer demand and improving supply chain continuity. In addition, the Titleist golf club team employs nine on-site auditors at our Asian suppliers’ production facilities to ensure consistent product quality.
For our golf gear businesses, we source the finished products from select third‑party vendors that have the necessary quality capabilities.
FootJoy operates an apparel and accessory commercial office in Hong Kong that is staffed with eight associates. These individuals are highly trained in all aspects of apparel design and development, production, and quality control functions, directing all commercial sourcing activities among contract factories throughout the region. In addition to the eight associates in Hong Kong, FootJoy also employs two quality control inspectors in China and one in Vietnam for careful monitoring of all FootJoy apparel production.
Sales and Distribution
Our accounts consist of premium golf shops, which include on‑course golf shops and golf specialty retailers, as well as other qualified retailers that sell golf products to consumers worldwide. We have a selective sales and distribution strategy, differentiated by product line and geography, which focuses on effectively serving those accounts that provide best access to our dedicated golfer target market in each geographic market.
We operate, and have our own field sales representation, in those countries that represent the substantial majority of golf equipment and wearable sales, including the United States, Japan, Korea, the United Kingdom, Canada, Germany, Sweden, France, Greater China, Australia, New Zealand, Thailand, Singapore and Malaysia. In other countries in which we sell our products, we rely on select distributors in order to deepen our reach into those markets. Each country administers its own in‑country channel of distribution strategy given the unique characteristics of each market.
As we see our retail partners as a critical connection to dedicated golfers, we place great emphasis on building strong relationships and trust with them. As a result, our sales and distribution takes a “category management” approach that encompasses all aspects of customer service and fulfillment, including product selection; space and display planning; sales staff training; and inventory control and replenishment. Each sales representative is seen as a trusted partner and skilled consultant, including on topics such as shop layout, merchandise display techniques and effective use of signage and product information and methods of improving inventory turns and sales conversions through merchandising. Our sales force has been recognized worldwide for its professionalism and service excellence.
We employ over 340 sales representatives worldwide, who are compensated through a combination of salary and a performance bonus. In the United States, members of our Titleist and FootJoy sales team average almost 20 years of experience. We currently service nearly 31,000 direct accounts worldwide. In both our direct sales and distributor markets, our trade partners are subject to our redistribution policy.
Titleist has developed a global distribution network in which most of the major golf regions have local distribution operations that maintain inventories for exceptional service and fulfillment of stock products. Local custom operations, for both golf balls and golf clubs, provide efficient turnaround time on custom imprinted or custom fitted products. In addition, Titleist promotes its partners as the equipment and fitting experts and encourages golfers to seek their expertise and advice. Together, Titleist and its partners enrich the golfer experience with better products, education, equipment fitting and service.
FootJoy’s trade partners in every region are provided with regular educational seminars in product features and benefits; inventory control methods; proper merchandising and display techniques; and even training in shoe and glove fitting. The seminars are supplemented by online training modules that extend the content to a much wider audience of floor sales associates in all accounts.
Supplementing our core field sales partnerships are certain Internet‑based initiatives. In the U.S. in 2016, we launched an eCommerce website for FootJoy and the MyProV1.com online golf shop.
25
Marketing
Throughout our history, a commitment to marketing has helped further elevate our brands and strengthen our reputation for product performance and quality, with a particular focus on the perception of dedicated golfers. Our strategy begins with delivering equipment that is superior in performance and quality, validated by the pyramid of influence. It is best‑in‑class performance and quality products that earn and maintain dedicated golfers’ loyalty and trust. Our marketing strategy, developed and refined over many years, helps reinforce this loyalty and trust, driving connectivity with our brands.
The key cornerstones to build and strengthen golfer connections with our brands are: pyramid of influence validation; merchandising; advertising; and education and fitting. We believe that a more educated golfer is more likely to be a Titleist and FootJoy golfer. Our efforts contribute to consistent, responsive and rapid sell‑through of Titleist equipment and FootJoy wear for our trade partners.
Pyramid of Influence Validation
Broad usage and acceptance by the game’s best players, including tour players, club professionals and competitive amateurs, is fundamental to our mission and purpose. We have a global leadership team dedicated to servicing and supporting these golfers throughout the pyramid of influence. At professional and amateur events, the leadership team provides technical fitting expertise, product support and service to effectively represent, exhibit, recommend and communicate our premium performance and quality story. Our associates are trained product experts, many of whom are product category‑specific, whose goal is to arm players with the equipment that will enable them to perform at their highest level.
Communicating the strength and depth of Titleist’s and FootJoy’s pyramid of influence usage to the dedicated golfer is another essential part of our leadership strategy. Within our advertising, merchandising, websites and other digital media content, we share the equipment counts, specific products and specifications and the results of our players. Our products enjoy broad usage and acceptance throughout the pyramid of influence. Dedicated golfers are interested in what products most of the world’s best players trust.
Merchandising
Excellence in merchandising, the retail format in which our products are presented to the consumer, is another sell‑through competency. The role of merchandising varies by product category. We believe Titleist is the golf ball leader in its in‑shop merchandising, and that Titleist golf balls make the first impression, best impression and longest lasting impression in premium golf shops. We also believe that these premium golf shops are where our dedicated golfer target audience is most likely to shop for their golf equipment needs. We have placed over 20,000 golf ball displays globally in order to effectively merchandise Titleist and Pinnacle golf balls.
Titleist golf clubs, wedges and putters also maintain a premium merchandising presence in golf shops. Given that our core strategy is focused on selling custom fit golf clubs and wedges, we utilize displays to promote the product offering and offer demo trial sets, in many cases not in an attempt to generate an immediate sale but rather with the ultimate goal of encouraging golfers to schedule a fitting session.
We are committed to ensuring that Titleist golf gear is prominently merchandised. We continue to invest in both displays and training for each of the golf bag, headwear, glove, travel and head cover product categories.
FootJoy devotes considerable resources to the appearance of its products and displays at point of sale. This includes an extensive offering of fixed and temporary product displays, brand and product signing and graphics and a wide variety of visual tools to create a “shop in shop” environment that conveys the brand’s market leadership image.
Advertising
We drive brand and product awareness with a communication strategy that targets dedicated golfers in all forms of media, including television, print, and a wide variety of digital and social media forums. Our advertising strategy is focused on communicating the launch of new products to generate awareness and highlight our product performance and
26
quality competitive advantage. Our advertising serves as another educational tool to convey the technology and innovation behind our products and the resulting performance benefits for golfers.
We have developed strong relationships with our media partners in order to secure prominent and effective positioning. We use broader reach golf media vehicles for golf ball, golf shoe and golf glove advertising and a more targeted approach for golf clubs, wedges and putters and apparel.
Titleist.com and FootJoy.com are vital parts of our communication strategy with rich product, technology and fitting content. Our sites also provide locators for golf shops, advanced fitting centers and certified custom club fitters. We develop a significant amount of digital educational content, featuring tour players, club professionals and our R&D associates, that is distributed to dedicated golfers via our social media platforms. Over the last several years we have cultivated a large and growing following on social media platforms including Facebook, Twitter and Instagram as a result of this content. In 2016, Titleist launched the MyProV1.com online golf shop in the United States to develop a stronger link with dedicated Titleist brand fans with plans to expand into additional markets in the future. This microsite allows golfers to create and purchase their own unique, custom imprinted Pro V1 or Pro V1x golf balls with special play numbers, logos or personalization. We believe this tool will increase the likelihood of repurchase and loyalty to Titleist golf balls.
Team Titleist is a growing online community of avid golfers and Titleist fans that has been instrumental in establishing the direct communication link between us and our most loyal customers. Members of Team Titleist are given exclusive access to interact with Titleist associates as well as other Team Titleist members both in person and online. Team Titleist also provides us the platform for directly communicating new product information, tour news, custom fitting education and referrals and event schedules.
The FJ Community is an online group of avid golfers who share a passion for the game of golf and FootJoy golf wear. What began 10 years ago as a method of reaching golfers on a direct basis has evolved into an open community of 50,000 committed golfers who connect with the brand and one another. As engagement levels increase, members earn access to new product introductions and opportunities to participate in unique promotions and events.
Education and Fitting
One of our core strategies and competencies is golf ball and golf club education and fitting. We also have in place several golf shoe fitting initiatives aimed at educating golfers on the importance of proper shoe fitting. We are committed to educating our trade partners and dedicated golfers on our product performance and technology. Playing with properly fit equipment helps golfers shoot lower scores. When golfers play better, they want to play more.
Golf Ball Education and Fitting
We believe performance and quality differences between golf ball brands and models are game changing. In order for golfers to shoot their lowest scores, it is important that they find the best ball suited to their game, as it is the only piece of equipment that they will use on every shot. As the golf ball category leader and a global leader in golf ball fitting and education, we are committed to help golfers understand and appreciate the differentiating and defining characteristics of Titleist golf balls, as well as the differences between the various Titleist golf ball products.
Titleist golf ball education and fitting is performance‑based and focuses on improving scores. Our methodology is green‑to‑tee with an emphasis not on shots hit off of the tee but rather on shots hit into the green as that is where the vast majority of shots per round are made. Prioritizing short game spin performance helps golfers hit more shots closer to the pin to enable them to convert more putts. Our education program also reinforces the importance of golf ball to golf ball consistency. Golfers trust that a Titleist golf ball will perform exactly the way they expect it to if they hit their shot properly.
Our approach to golf ball education and fitting is holistic and includes broad communication messaging in Titleist golf ball advertising, in‑shop merchandising, website and other digital media, trade partner golf ball certification and in‑field golfer education. In‑field golfer education is conducted by dedicated mobile golf ball fitting teams or Titleist tech reps, supplemented by the Titleist sales team. For example, in 2016, we provided over 100,000 golf ball recommendations by connecting in person with golfers at golf courses and golf shops. Over 500,000 additional golfers viewed our ball fitting and education materials through Titleist digital channels.
27
Custom Club Fitting and Trial
We believe that fundamental to achieving maximum performance from any golf club is the need to custom fit the club to the player’s individual needs and preferences. Augmenting excellent design and construction with customized specifications and components such as lie angle, shaft type, length and flex, as well as grip type and size, provides the player with the ability to maximize the performance potential of the club.
To this end, providing golfers with the ability to try and be expertly fit for their clubs is a core go‑to‑market strategy for Titleist clubs. Over the past 20 years we have developed and improved our comprehensive fitting system and we deploy that system through a global “Good, Better, Best” network of carefully selected, trained, outfitted and certified custom club fitters.
The global Titleist club fitting network includes over 4,000 trade partners. Each is outfitted with a SureFit interchangeable matrix of clubs in popular shaft types, lengths and flexes, along with a broad selection of Vokey Design wedges, thus providing them with the necessary tools to conduct high level fittings. Combined with annual training and certification, these partners are skilled and equipped to custom fit dedicated golfers.
For golfers who want a higher level fitting experience, we have also developed a global network of approximately 185 advanced fitting partners. These fitting specialists are outfitted with a larger matrix of fitting tools. They receive priority referrals when golfers conduct an online search for a Titleist fitting location or contact us directly for referrals. In addition to our global network of fitting partners, we also deploy a global associate team of approximately 220 Titleist fitting technicians who conduct advanced level fittings directly with golfers at fitting and trial events. Collectively, our global network of fitting partners conducted approximately 230,000 fittings, over 100,000 of which were at over 10,000 Titleist fitting events.
Finally, at the peak of the Titleist fitting services network, is the Titleist Performance Institute in Oceanside, California. The mission of the Titleist Performance Institute is to be the world’s most comprehensive and advanced golf performance center. Built in 1997, this approximately 30 acre property comprises three fairways with tour quality greens and bunkers, a state of the art fitness facility and a 3‑dimensional motion capture studio. The facility serves as headquarters for our tour fitting efforts, conducted by a team of elite fitters, and is also our primary club developmental testing site. Golf consumers who want the ultimate, tour‑level custom fitting experience can visit the Titleist Performance Institute for a fee and by appointment only.
Golf Shoe Fitting
We believe that a properly fit golf shoe is the most important element to optimizing comfort and product durability. As a global leader in golf shoe fitting, we hold events and seminars in key markets throughout North America, Europe and Asia. Golfer education is handled by dedicated fitting specialists and members of the FootJoy sales team.
While a shoe that fits a golfer’s foot is essential for comfort, we believe that finding a shoe that fits a golfer’s swing can lead to increased performance and we believe there is a correlation between individual swing biomechanics and golfer performance. We deployed the FootJoy Performance Fitting System in the first quarter of 2017. The FootJoy Performance Fitting System is designed to capture the center‑of‑pressure movement during a golfer’s swing and help recommend the proper shoe construction type that can deliver additional club head speed. The FootJoy Performance Fitting System aims to eliminate the need for visual, anecdotal evidence to determine whether or not a golfer would benefit from a shoe constructed with more flexibility versus more rigidity or structure and instead relies upon a scientific solution. It is expected to be available in every major golf market as a performance supplement to shoe fitting for size and width.
Seasonality
Weather conditions in most parts of the world, including our primary geographic markets, generally restrict golf from being played year‑round, with many of our on‑course customers closed during the cold weather months. In general, during the first quarter, we begin selling our products into the golf retail channel for the new golf season. This initial sell‑in generally continues into the second quarter. Our second‑quarter sales are significantly affected by the amount of sell‑through, in particular the amount of higher value discretionary purchases made by customers, which drives the level
28
of reorders of the products sold during the first quarter. Our third‑quarter sales are generally dependent on reorder business, and are generally lower than the second quarter as many retailers begin decreasing their inventory levels in anticipation of the end of the golf season. Our fourth‑quarter sales are generally less than the other quarters due to the end of the golf season in many of our key markets, but can also be affected by key product launches, particularly golf clubs. This seasonality, and therefore quarter to quarter fluctuations, can be affected by many factors, including the timing of new product introductions as discussed above under “—Our Products—Product Launch Cycles,” as well as weather conditions. This seasonality affects sales in each of our reportable segments differently. In general, however, because of this seasonality, a majority of our sales and most of our profitability generally occurs during the first half of the year.
Research and Product Development
Innovating within a highly regulated environment presents unique challenges and opportunities that require a significant investment in people, facilities and financial resources. We have six R&D facilities and/or test centers supported by over 180 scientists, chemists, engineers and technicians in aggregate. We are committed to continuous improvement and each R&D team is tasked to develop technology that will deliver better quality and performance products in each generation.
For the years ended December 31, 2016, 2015 and 2014 we invested $48.8 million, $46.0 million and $44.2 million, respectively, in R&D.
We have separate dedicated R&D teams for each product category.
Titleist Golf Balls
Titleist golf ball R&D has a disciplined product development process. The R&D team consists of over 70 scientists, chemists, engineers and technicians. Their role is to innovate in all areas of golf ball design, materials and constructions by incorporating new technologies to widen our performance and quality competitive advantage. A dedicated team also works specifically on new process technologies for our golf ball manufacturing operations. They work closely with raw material suppliers to create standards and specifications. They establish quality systems, protocols and analysis and support Titleist ball operations in new product implementation.
The golf ball R&D team is responsible for:
|
player research |
data analytics |
|
product and process research |
product development and implementation |
|
aerodynamics |
analytical and competitive research |
|
testing |
intellectual property |
|
test equipment |
central quality |
Titleist has three golf ball dedicated research facilities in the greater New Bedford, Massachusetts area that design, test, implement and support new product development and implementation:
|
· |
the Titleist golf ball R&D team is based in our Fairhaven, Massachusetts headquarters facility; |
|
· |
Titleist Engineering and Technology Center in North Dartmouth, Massachusetts houses our advanced engineering associates as well as precision golf ball cavity manufacturing; and |
|
· |
Titleist Manchester Lane in Acushnet, Massachusetts is a state‑of‑the‑art testing facility for R&D to conduct extensive robot and player testing. |
In addition, we conduct additional golf ball product testing at our Oceanside, California test facility. We have dedicated R&D associates who work closely throughout the pyramid of influence, from PGA Tour players all the way to amateur Team Titleist members, to gather feedback on product performance expectations, conduct prototype testing and validate new products prior to market launch. This is a continuous iterative and collaborative process that impacts next generation golf balls as well as long‑term research and product direction.
29
Titleist Golf Clubs, Wedges and Putters
Our golf club R&D team and processes are structured in a manner that aims to create products which are innovative in design and superior in performance. The performance and quality of our products are a direct result of the commitment to golf clubs, wedges and putters R&D. Significant investment in R&D has led to a team size which has more than doubled since 2007. The department’s technical disciplines include computer‑aided design engineers, industrial designers, product development engineers, research engineers, lab technicians and testing staff. We have 65 associates dedicated to clubs and wedges R&D.
We have distinct teams working on the concept creation and development for drivers, fairways, hybrids, irons, wedges and putters. These products are initially tested and validated at our state‑of‑the‑art testing facility in Oceanside, California.
Scotty Cameron works from the Putter Studio in San Marcos, California which allows him to maximize his creativity and develop designs which are rich in craftsmanship as well as performance. This structure is necessary given there are unique expertise and performance requirements for each of the product categories.
The product category teams all work with the following support teams: advanced research, shaft development, industrial design, lab analysis and mechanical testing, player testing and an Asia‑based support team working with our key suppliers.
FootJoy
We have approximately 10 product designers and development engineers in the golf shoe team located in Brockton, Massachusetts, with an additional four product development specialists located in our Taichung, Taiwan office. We have four golf apparel designers located in Fairhaven, Massachusetts and an additional 11 product development specialists in Hong Kong, China and Korea.
Patents, Trademarks and Licenses
We consider our patents and trademarks to be among our most valuable assets. We are dedicated to protecting the innovations created by our R&D teams by developing broad and deep patent and trademark portfolios across all product categories.
As a result, we have strong patent positions across our product categories and innovation spaces that we operate in, and have become the leader in obtaining golf ball and golf club patents worldwide. In addition, we believe we have more combined golf shoe and golf glove utility patents than all competitors combined. We have over 1,250 active U.S. utility patents in golf balls, nearly 350 active U.S. utility patents in golf clubs, wedges and putters and 296 active patents (including ex‑U.S. and design patents) in golf shoes and gloves.
30
The following charts show our percentage of golf ball and golf club patents obtained in the last five years compared to our peers.
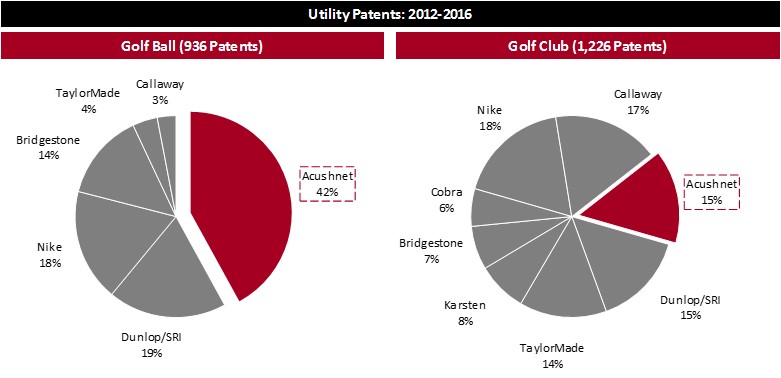
We own or license a large portfolio of trademarks, including for Titleist, Pro V1, Pro V1x, Pinnacle, AP1, AP2, Vokey Design, Scotty Cameron, FootJoy, FJ, DryJoys, StaSof and ProDry. We protect our trademarks by obtaining registrations where appropriate and opposing or cancelling material infringements. We also have rights in several common law marks.
Competition
There are unique aspects to the competitive dynamic in each of our product categories.
The golf ball business is highly competitive. There are a number of well‑established and well‑financed competitors, including Callaway, SRI Sports Limited (Dunlop and Srixon brands) and Bridgestone (Bridgestone and Precept brands).
The golf club, wedge and putters markets in which we compete are also highly competitive and are served by a number of well‑established and well‑financed companies with recognized brand names, including Callaway, TaylorMade and Ping.
For golf balls and golf clubs, wedges and putters, we generally compete on the basis of technology, quality, performance and customer service.
In the golf gear market, there are numerous competitors in each product category and geographical market. Titleist golf gear generally competes on the basis of quality, performance, styling and customer service.
FootJoy’s significant worldwide competitors in golf shoes include Nike, Adidas and Ecco. FootJoy’s primary worldwide competitors in golf gloves include Callaway, Nike and TaylorMade/Adidas and a significant number of smaller companies with regional offerings and specialized golf glove products. In the golf apparel category, FootJoy has numerous competitors in each geographical market, including Nike, Adidas and Under Armour. FootJoy products generally compete on the basis of quality, performance, styling and price.
Environmental Matters
Our operations are subject to federal, state and local environmental laws and regulations that impose limitations on the discharge of pollutants into the environment and establish standards for the handling, generation, emission,
31
release, discharge, treatment, storage and disposal of certain materials, substances and wastes and the remediation of environmental contaminants. In the ordinary course of our manufacturing processes, we use paints, chemical solvents and other materials, and generate waste by‑products that are subject to these environmental laws.
We estimate incurring future costs for past and current environmental issues relating to ongoing closure activities at the following sites: (i) our former Titleist Ball Plant 1 in Acushnet, Massachusetts, which is subject to ongoing remediation of past contamination under the oversight of the federal Environmental Protection Agency and the Massachusetts Department of Environmental Protection; (ii) our Ball Plant C in New Bedford, Massachusetts, which is subject to an ongoing investigation related to contamination that is evidently migrating from an adjacent third‑party facility; and (iii) investigations and cleanups at four third‑party disposal facilities. We do not expect that any of the future anticipated expenditures at these sites will have a material adverse effect on our business.
We have also incurred expenses in connection with environmental compliance. Historically, the costs of environmental compliance have not had a material adverse effect upon our business. We believe that our operations are in substantial compliance with all applicable environmental laws.
Regulation
The Rules of Golf
The Rules of Golf set forth the rules of play and the rules for equipment used in the game of golf. The first documented rules of golf date to 1744 and the modern Rules of Golf have been in place for over 100 years. Dedicated golfers respect the traditions of the game and play by the Rules of Golf. As a result, premium‑positioned products are designed and manufactured to conform to the Rules of Golf.
The United States Golf Association, or the USGA, is the governing body for golf in the United States and Mexico. The USGA, in conjunction with the Royal and Ancient, or R&A, in St. Andrews, Scotland, writes, interprets and maintains the Rules of Golf. The R&A is the governing body for golf in all jurisdictions outside of the United States and Mexico. The R&A jointly writes, interprets and maintains the Rules of Golf with the USGA.
In addition to their role as rule makers, both the USGA and R&A conduct national championships and are involved in other efforts to maintain the history of golf and promote the health of the game.
The Rules of Golf set the standards and establish limitations for the design and performance of all balls and clubs. Many new regulations on golf balls and golf clubs have been introduced in the past 10 to 15 years, which we believe was one of the most active periods for golf equipment regulation in the history of golf.
Golf Balls
Historically, the USGA and R&A have regulated the size, weight, spherical symmetry, initial velocity and overall distance performance of golf balls. The overall distance standard was then revised in 2004.
Golf Clubs
The USGA and R&A have also focused on golf club regulations. In 1998, a limitation was placed on the spring‑like effect of driver faces. In 2003, limits were placed on club head dimensions and volume, as well as shaft length. In 2007, club head moment of inertia was limited. A rule change to allow greater adjustability in golf clubs went into effect January 1, 2008. In August 2008, the USGA and R&A adopted a rule change further restricting golf club grooves by reducing the groove volume and limiting the groove edge angle allowable on irons and wedges. This rule change will not apply to most golfers until January 1, 2024. It was implemented on professional tours beginning in 2010 and was implemented in elite amateur competitions beginning in 2014. All products manufactured after December 31, 2010 must comply with the new groove specifications.
Our Position
In response to this regulatory dynamic, our senior management and R&D teams spend significant time and effort in developing and maintaining relationships with the USGA and R&A. We are an active participant in discussions
32
with the ruling bodies regarding potential new rules and the rule making process. More importantly, our R&D teams are driven to innovate and continuously improve product technology and performance within the Rules of Golf. The development and protection of these innovations through aggressive patenting are essential to competing in the current market. As a long‑time industry participant and market leader, we are well‑positioned to continue to outperform the market in a rules constrained environment.
Employees
As of December 31, 2016, we employed 5,208 associates worldwide (5,171 full time and 37 part time). The geographic concentration of associates is as follows: 2,453 in the Americas, 438 in EMEA, and 2,317 employed in Asia Pacific. Associates with over ten years of employment with us account for approximately 50% of our total associate count in the United States. The employment of all associates is at will and none of our associates are represented by a union. We believe that relations with our associates are positive.
You should carefully consider each of the following risk factors, as well as the other information in this report, including our consolidated financial statements and the related notes and “Item 7. – Management’s Discussion and Analysis of Financial Condition and Results of Operations.” If any of the following risks actually occurs, our business, financial condition and results of operations could be materially adversely affected. In that event, the market price of our common stock could decline significantly and you could lose all or part of your investment. The risks described below are not the only risks we face. Additional risks we are not presently aware of or that we currently believe are immaterial could also materially adversely affect our business, financial condition and results of operations.
Risks Related to Our Business and Industry
A reduction in the number of rounds of golf played or in the number of golf participants could materially adversely affect our business, financial condition and results of operations.
We generate substantially all of our sales from the sale of golf‑related products, including golf balls, golf clubs, golf shoes, golf gloves, golf gear and golf apparel. The demand for golf‑related products in general, and golf balls in particular, is directly related to the number of golf participants and the number of rounds of golf being played by these participants. The number of rounds of golf played in the United States declined from 2006 to 2014. If golf participation or the number of rounds of golf played continues to decline, sales of our products may be adversely impacted, which could materially adversely affect our business, financial condition and results of operations.
Unfavorable weather conditions may impact the number of playable days and rounds played in a given year.
Weather conditions in most parts of the world, including our primary geographic markets, generally restrict golf from being played year‑round, with many of our on‑course customers closed during the cold weather months and, to a lesser extent, during the hot weather months. Unfavorable weather conditions in our major markets, such as a particularly long winter, a cold and wet spring, or an extremely hot summer, would impact the number of playable days and rounds played in a given year, which would result in a decrease in the amount spent by golfers and golf retailers on our products, particularly with respect to consumable products such as golf balls and golf gloves, which could materially adversely affect our business, financial condition and results of operations. Our results in 2013 and 2014 were negatively impacted by unfavorable weather conditions in our major markets. Unusual or severe weather conditions throughout the year, such as storms or droughts or other water shortages, can negatively affect golf rounds played both during the events and afterward, as weather damaged golf courses are repaired and golfers focus on repairing the damage to their homes, businesses and communities. Consequently, sustained adverse weather conditions, especially during the warm weather months, could impact our sales, which could materially adversely affect our business, financial condition and results of operations. Adverse weather conditions may have a greater impact on us than other golf equipment companies as we have a large percentage of consumable products in our product portfolio, and the purchase of consumable products is generally more dependent on the number of rounds played in a given year.
33
Consumer spending habits and macroeconomic factors may affect the number of rounds of golf played and related spending on golf products.
Our products are recreational in nature and are therefore discretionary purchases for consumers. Consumers are generally more willing to spend their time and money to play golf and make discretionary purchases of golf products when economic conditions are favorable and when consumers are feeling confident and prosperous. Discretionary spending on golf and the golf products we sell is affected by consumer spending habits as well as by many macroeconomic factors, including general business conditions, stock market prices and volatility, corporate spending, housing prices, interest rates, the availability of consumer credit, taxes and consumer confidence in future economic conditions. Consumers may reduce or postpone purchases of our products as a result of shifts in consumer spending habits as well as during periods when economic uncertainty increases, disposable income is lower, or during periods of actual or perceived unfavorable economic conditions. For example, the recession related to the U.S. financial crisis beginning in 2007 led to slower economic activity, decreased stock prices and increased volatility, depressed housing prices, increased unemployment, concerns about inflation and energy costs, decreased business and consumer confidence, and adverse business conditions (including reduced corporate profits and capital spending), which adversely affected our business, financial condition and results of operations. The effects of the recession are still being felt today in the golf industry as we believe consumers have become more cautious with their discretionary purchases and this trend may continue. For example, corporate spending on golf equipment has remained at lower levels since the financial crisis as evidenced by the lower volume of balls in our custom logo business being sold to companies as compared to before the crisis. The continuation of these negative macroeconomic conditions or a future significant or prolonged decline in general economic conditions or uncertainties regarding future economic prospects that adversely affects consumer discretionary spending, whether in the United States or in our international markets, could result in reduced sales of our products, which could materially adversely affect our business, financial condition and results of operations.
Demographic factors may affect the number of golf participants and related spending on our products.
Golf is a recreational activity that requires time and money and different generations and socioeconomic and ethnic groups use their leisure time and discretionary funds in different ways. Golf participation among younger generations and certain socioeconomic and ethnic groups may not prove to be as popular as it is among the current “gen‑x” (age 30 – 49) and “baby boomer” (age 50 – 69) generations. The number of rounds of golf being played in the United States declined from 2006 to 2014. If golf participation or the number of rounds of golf played continues to decrease, due to factors such as demographic changes in the United States and our international markets or lack of interest in the sport among young people or certain socioeconomic and ethnic groups, sales of our products could be negatively impacted, which could materially adversely affect our business, financial condition and results of operations.
A significant disruption in the operations of our manufacturing, assembly or distribution facilities could materially adversely affect our business, financial condition and results of operations.
We rely on our manufacturing facilities in the United States, Thailand and China and assembly and distribution facilities in many of our major markets, certain of which constitute our sole manufacturing facility for a particular product category, including our joint venture facility in China where substantially all of our golf shoes are manufactured and our facility in Thailand where we manufacture the majority of our golf gloves. Because substantially all of our products are manufactured and assembled in and distributed from a few locations, our operations could be interrupted by events beyond our control, including:
|
· |
power loss or network connectivity or telecommunications failure or downtime; |
|
· |
equipment failure; |
|
· |
human error or accidents; |
|
· |
sabotage or vandalism; |
|
· |
physical or electronic security breaches; |
|
· |
floods, fires, earthquakes, hurricanes, tornadoes, tsunamis or other natural disasters; |
34
|
· |
political unrest; |
|
· |
labor difficulties, including work stoppages or slowdowns; |
|
· |
water damage or water shortage; |
|
· |
government orders and regulations; |
|
· |
pandemics and other health and safety issues; and |
|
· |
terrorism. |
Our manufacturing, assembly and distribution capacity is also dependent on the performance of services by third parties, including vendors, landlords and transportation providers. If we encounter problems with our manufacturing, assembly and distribution facilities, our ability to meet customer expectations, manage inventory, complete sales and achieve objectives for operating efficiencies could be harmed, which could materially adversely affect our business, financial condition and results of operations. We maintain business interruption insurance, but it may not adequately protect us from the adverse effects that could result from significant disruptions to our manufacturing, assembly and distribution facilities, such as the long‑term loss of customers or an erosion of our brand image.
Our manufacturing, assembly and distribution networks include computer processes, software and automated equipment that may be subject to a number of risks related to security or computer viruses, the proper operation of software and hardware, electronic or power interruptions or other system failures.
Many of our raw materials or components of our products are provided by a sole or limited number of third‑party suppliers and manufacturers.
We rely on a sole or limited number of third‑party suppliers and manufacturers for many of our raw materials and the components in our golf balls, golf clubs, golf gloves and certain of our other products. We also use specialized sources for certain of the raw materials used to make our golf gloves and other products, and these sources are limited to certain geographical locations. Furthermore, many of these materials are customized for us and some of our products require specially developed manufacturing techniques and processes which make it difficult to identify and utilize alternative suppliers quickly. If we were to experience any delay or interruption in such supplies, we may not be able to find adequate alternative suppliers at a reasonable cost or without significant disruption to our business which could materially adversely affect our business, financial condition and results of operations.
A disruption in the operations of our suppliers could materially adversely affect our business, financial condition and results of operations.
Our ability to continue to select reliable suppliers who provide timely deliveries of quality materials and components will impact our success in meeting customer demand for timely delivery of quality products. If we experience significantly increased demand, or if, for any reason, we need to replace an existing manufacturer or supplier, there can be no assurance that additional supplies of raw materials or additional manufacturing capacity will be available when required on terms that are acceptable to us, or at all, or that any new supplier or manufacturer would allocate sufficient capacity to us in order to meet our requirements. In addition, should we decide to transition existing manufacturing between third‑party manufacturers or should we decide to transition existing in‑house manufacturing to third‑party manufacturers, the risk of such a problem could increase. Even if we are able to expand existing or find new manufacturing sources, we may encounter delays in production and added costs as a result of the time it takes to train our suppliers and manufacturers in our methods, products and quality control standards. Any material delays, interruption or increased costs in the supply of raw materials or components of our products could impact our ability to meet customer demand for our products, which could materially adversely affect our business, financial condition and results of operations.
In addition, there can be no assurance that our suppliers and manufacturers will continue to provide raw materials and components that are consistent with our standards and that comply with all applicable laws and regulations. We have occasionally received, and may in the future receive, shipments of supplies or components that fail
35
to conform to our quality control standards. In that event, unless we are able to obtain replacement supplies or components in a timely manner, we risk the loss of sales resulting from the inability to manufacture our products and could incur related increased administrative and shipping costs, and there also could be a negative impact to our brands, any of which could materially adversely affect our business, financial condition and results of operations.
While we do not control our suppliers or their labor practices, negative publicity regarding the management of facilities, production methods of or materials used by any of our suppliers could adversely affect our reputation, which could materially adversely affect our business, financial condition and results of operations and may force us to locate alternative suppliers. In addition, our suppliers may not be well capitalized and they may not be able to fulfill their obligations to us or go out of business. Furthermore, the ability of third‑party suppliers to timely deliver raw materials or components may be affected by events beyond their control, such as work stoppages or slowdowns, transportation issues, changes in trade or tariff laws, or significant weather and health conditions.
The cost of raw materials and components could affect our operating results.
The materials and components used by us, our suppliers and our manufacturers involve raw materials, including polybutadiene, urethane and Surlyn for the manufacturing of our golf balls, titanium and steel for the assembly of our golf clubs, leather and synthetic fabrics for the manufacturing of our golf shoes, golf gloves, golf gear and golf apparel, and resin and other petroleum‑based materials for a number of our products. Significant price fluctuations or shortages in such raw materials or components, including the costs to transport such materials or components of our products, the uncertainty of currency fluctuations against the U.S. dollar, increases in labor rates, trade duties or tariffs, and/or the introduction of new and expensive raw materials, could materially adversely affect our business, financial condition and results of operations.
Our operations are conducted worldwide and our results of operations are subject to currency transaction risk and currency translation risk that could materially adversely affect our business, financial condition and results of operations.
For the year ended December 31, 2016, $767.8 million of our net sales were generated outside of the United States by our non‑U.S. subsidiaries. Sales by geographic area are included in “Item 7. – Management’s Discussion and Analysis of Financial Condition and Results of Operations” and in “Notes to Consolidated Financial Statements –Note 20 – Segment Information.” Substantially all of these net sales generated outside of the United States were generated in the applicable local currency, which include, but are not limited to, the Japanese yen, the Korean won, the British pound sterling, the euro and the Canadian dollar. In contrast, substantially all of the purchases of inventory, raw materials or components by our non‑U.S. subsidiaries are made in U.S. dollars. For the year ended December 31, 2016, approximately 86% of our cost of goods sold incurred by our non‑U.S. subsidiaries were denominated in U.S. dollars. Because our non‑U.S. subsidiaries incur substantially all of their cost of goods sold in currencies that are different from the currencies in which they generate substantially all of their sales, we are exposed to transaction risk attributable to fluctuations in such exchange rates, which can impact the gross profit of our non‑U.S. subsidiaries. If the U.S. dollar strengthens against the applicable local currency, more local currency will be needed to purchase the same amount of cost of goods sold denominated in U.S. dollars, which could materially adversely affect our business, financial condition and results of operations.
We have entered and expect to continue to enter into various foreign currency exchange contracts in an effort to protect against adverse changes in foreign exchange rates and attempt to minimize foreign currency transaction risk. Our hedging activities can reduce, but will not eliminate, the effects of foreign currency transaction risk on our financial results. The extent to which our hedging activities mitigate foreign currency transaction risks varies based upon many factors, including the amount of transactions being hedged. Other factors that could affect the effectiveness of our hedging activities include accuracy of sales forecasts, volatility of currency markets, the availability of hedging instruments and limitations on the duration of such hedging instruments. Since the hedging activities are designed to reduce volatility, they not only reduce the negative impact of a stronger U.S. dollar but could also reduce the positive impact of a weaker U.S. dollar. We are also exposed to credit risk from the counterparties to our hedging activities and market conditions could cause such counterparties to experience financial difficulties. As a result, our efforts to hedge these exposures could prove unsuccessful and, furthermore, our ability to engage in additional hedging activities may decrease or become more costly.
36
Because our consolidated accounts are reported in U.S. dollars, we are also exposed to currency translation risk when we translate the financial results of our consolidated non‑U.S. subsidiaries from their local currency into U.S. dollars. For the year ended December 31, 2016, 49% of our sales were denominated in foreign currencies. In addition, for the year ended December 31, 2016, 30% of our operating expenses were denominated in foreign currencies (which amounts represent substantially all of the operating expenses incurred by our non‑U.S. subsidiaries). Fluctuations in foreign currency exchange rates may positively or negatively affect our reported financial results and can significantly affect period‑over‑period comparisons. A strengthening of the U.S. dollar relative to our foreign currencies could materially adversely affect our business, financial condition and results of operations. For example, our reported net sales for the 2015 fiscal year were negatively effected by a strengthening U.S. dollar in 2015.
We may not successfully manage the frequent introduction of new products that satisfy changing consumer preferences, quality and regulatory standards.
The golf equipment and golf wear industries are subject to constantly and rapidly changing consumer demands based, in large part, on performance benefits. Our golf ball and golf club products generally have launch cycles of two years, and our sales in a particular year are affected by when we launch such products. We generally introduce new product offerings and styles in our golf wear and gear businesses each year and at different times during the year. Factors driving these short product launch cycles include the rapid introduction of competitive products and consumer demands for the latest technology, style or fashion. In this marketplace, a substantial portion of our annual sales are generated each year by new products.
These marketplace conditions raise a number of issues that we must successfully manage. For example, we must properly anticipate consumer preferences and design products that meet those preferences, while also complying with significant restrictions imposed by the Rules of Golf (see further discussion of the Rules of Golf below under “—Changes to the Rules of Golf with respect to equipment could materially adversely affect our business, financial condition and results of operations”), or our new products will not achieve sufficient market success to compensate for the usual decline in sales experienced by products already in the market. Second, our R&D and supply chain groups face constant pressures to design, develop, source and supply new products—many of which incorporate new or otherwise untested technology, suppliers or inputs—that perform better than their predecessors while maintaining quality control and the authenticity of our brands. Third, for new products to generate equivalent or greater sales than their predecessors, they must either maintain the same or higher sales levels with the same or higher pricing, or exceed the performance of their predecessors in one or both of those areas. Fourth, the relatively short window of opportunity for launching and selling new products requires great precision in forecasting demand and assuring that supplies are ready and delivered during the critical selling periods. Finally, the rapid changeover in products creates a need to monitor and manage the closeout of older products both at retail and in our own inventory. Should we not successfully manage the frequent introduction of new products that satisfy consumer demand, it could adversely affect our business, financial condition and results of operations.
We rely on technical innovation and high‑quality products to compete in the market for our products.
Technical innovation and quality control in the design and manufacturing process of our products is essential to our commercial success. R&D plays a key role in technical innovation. We rely upon experts in various fields to develop and test cutting edge performance products. While we strive to produce products that help to enhance performance and maximize comfort, if we fail to introduce technical innovation in our products, consumer demand for our products could decline, and if we experience problems with the quality of our products, we may incur substantial expense to remedy the problems, any of which could materially adversely affect our business, financial condition and results of operations.
Changes to the Rules of Golf with respect to equipment could materially adversely affect our business, financial condition and results of operations.
Golf’s most regulated categories are golf balls and golf clubs. We seek to have our new golf ball and golf club products conform with the Rules of Golf published by the United States Golf Association, or the USGA, and The Royal and Ancient Golf Club of St. Andrews, or The R&A, because these rules are generally followed by golfers, both professional and amateur, within their respective jurisdictions. The USGA publishes rules that are generally followed in the United States and Mexico, and The R&A publishes rules that are generally followed in most other countries throughout the world. However, the Rules of Golf as published by The R&A and the USGA are virtually the same and
37
are intended to be so pursuant to a Joint Statement of Principles issued in 2001. The Rules of Golf set the guidelines and establish limitations for the design and performance of all golf balls and golf clubs.
Many new regulations on golf balls and golf clubs have been introduced in the past 10 to 15 years, which we believe was one of the most active periods for golf equipment regulation in the history of golf. The USGA and R&A have historically regulated the size, weight, and initial velocity of golf balls. More recently, the USGA and R&A have specifically focused on regulating the overall distance of a golf ball. The USGA and R&A have also focused on golf club regulations, including limiting the size and spring‑like effect of driver faces and club head moment of inertia. In the future, existing USGA and/or R&A rules may be altered in ways that adversely affect the sales of our current or future products. If a change in rules was adopted and caused one or more of our current or future products to be nonconforming, sales of such products would be impacted and we may not be able to adapt our products promptly to such rule change, which could materially adversely affect our business, financial condition and results of operations. In addition, changes in the Rules of Golf may result in an increase in the costs of materials that would need to be used to develop new products as well as an increase in the costs to design new products that conform to such rules.
Failure to adequately enforce and protect our intellectual property rights could materially adversely affect our business, financial condition and results of operations.
We own numerous patents, trademarks, trade secrets, copyrights and other intellectual property and hold licenses to intellectual property owned by others, which in the aggregate are important to our business. We rely on a combination of patent, trademark, copyright and trade secret laws in our core geographic markets and other jurisdictions, to protect the innovations, brands, proprietary trade secrets and know‑how related to certain aspects of our business. Certain of our intellectual property rights, such as patents, are time‑limited, and the technology underlying our patents can be used by any third party, including competitors, once the applicable patent terms expire.
We seek to protect our confidential proprietary information, in part, by entering into confidentiality and invention assignment agreements with our employees, consultants, contractors, suppliers and others. While these agreements are designed to protect our proprietary information, we cannot be certain that such agreements have been entered into with all relevant parties, and we cannot be certain that our trade secrets and other confidential proprietary information will not be disclosed or that competitors will not otherwise gain access to our trade secrets or independently develop substantially equivalent information and techniques. We also seek to preserve the integrity and confidentiality of our proprietary information by maintaining physical security of our premises and physical and electronic security of our information technology systems, but it is possible that these security measures could be breached. If we are unable to prevent disclosure to third parties of our material proprietary and confidential know‑how and trade secrets, our ability to establish or maintain a competitive advantage in our markets may be adversely affected.
We selectively and strategically pursue patent and trademark protection in our core geographic markets, but our strategy has been to not perfect certain patent and trademark rights in some countries. For example, we focus primarily on securing patent protection in those countries where the majority of our golf ball and golf club industry production takes place. Accordingly, we may not be able to prevent others, including competitors, from practicing our patented inventions, including by manufacturing and selling competing products, in those countries where we have not obtained patent protection. Further, the laws of some foreign countries do not protect proprietary rights to the same extent or in the same manner as the laws of the United States. As a result, we may encounter significant problems in protecting, enforcing and defending our intellectual property outside of the United States. In some foreign countries, where intellectual property laws or law enforcement practices do not protect our intellectual property rights as fully as in the United States, third‑party manufacturers may be able to manufacture and sell imitation products and diminish the value of our brands as well as infringe our rights, despite our efforts to prevent such activity.
The golf ball and golf club industries, in particular, have been characterized by widespread imitation of popular ball and club designs. We have an active program of monitoring, investigating and enforcing our proprietary rights against companies and individuals who market or manufacture counterfeits and “knockoff” products. We assert our rights against infringers of our patents, trademarks, trade dress and copyrights. However, these efforts may be expensive, time‑consuming, divert management’s attention, and ultimately may not be successful in reducing sales of golf products by these infringers. The failure to prevent or limit such infringers or imitators could adversely affect our reputation and sales. Additionally, other golf ball and golf club manufacturers may be able to produce successful golf balls or golf clubs which imitate our designs without infringing any of our patents, trademarks, trade dress or copyrights, which could limit our ability to maintain a competitive advantage in our marketplace.
38
If we fail to obtain enforceable patents, trademarks and trade secrets, fail to maintain our existing patent, trademark and trade secret rights, or fail to prevent substantial unauthorized use of our patents, trademarks and trade secrets, we risk the loss of our intellectual property rights and competitive advantages we have developed, which may result in lost sales. Accordingly, we devote substantial resources to the establishment and protection of our trademarks, patents and trade secrets or know‑how, and we continuously evaluate the utility of our existing intellectual property and the new registration of additional trademarks and patents, as appropriate. However, we cannot guarantee that we will have adequate resources to continue to effectively establish, maintain and enforce our intellectual property rights. We also cannot guarantee that any of our pending applications will be approved by the applicable governmental authorities. Moreover, even if the applications will be registered during the registration process, third parties may seek to oppose, limit, or otherwise challenge these applications or registrations.
We may be involved in lawsuits to protect, defend or enforce our intellectual property rights, which could be expensive, time consuming and unsuccessful.
Our success depends in part on our ability to protect our trademarks, patents and trade secrets from unauthorized use by others. To counter infringement or unauthorized use, we may be required to file infringement or misappropriation claims, which can be expensive and time‑consuming and could materially adversely affect our business, financial condition and results of operations, even if successful. Any claims that we assert against perceived infringers could also provoke these parties to assert counterclaims against us alleging that we infringe or misappropriate their intellectual property rights or that we have engaged in anti‑competitive conduct. Moreover, our involvement in litigation against third parties asserting infringement of our intellectual property rights presents some risk that our intellectual property rights could be challenged and invalidated. In addition, in an infringement proceeding, whether initiated by us or another party, a court may refuse to stop the other party in such infringement proceeding from using the technology or mark at issue on the grounds that our patents do not cover the technology in question or misuse our trade secrets or know‑how. An adverse result in any litigation or defense proceedings, including proceedings at the patent and trademark offices, could put one or more of our patents or trademarks at risk of being invalidated, held unenforceable or interpreted narrowly, and could put any of our patent or trademark applications at risk of not being issued as a registered patent or trademark, any of which could materially adversely affect our business, financial condition and results of operations.
Furthermore, because of the substantial amount of discovery required in connection with intellectual property litigation, there is a risk that some of our confidential proprietary information could be compromised by disclosure during this type of litigation. In addition, there could be public announcements of the results of hearings, motions or other interim proceedings or developments. If securities analysts or investors perceive these results to be negative, it could materially adversely affect the price of our common stock.
Our products may infringe the intellectual property rights of others, which may cause us to incur unexpected costs or prevent us from selling our products.
From time to time, third parties have challenged our patents, trademark rights and branding practices, or asserted intellectual property rights that relate to our products and product features. We cannot assure you that our actions taken to establish and protect our technology and brands will be adequate to prevent others from seeking to block sales of our products or to obtain monetary damages, based on alleged violation of their patents, trademarks or other proprietary rights. We may be required to defend such claims in the future, which, whether or not meritorious, could result in substantial costs and diversion of resources and could materially adversely affect our business, financial condition and results of operations.
If we are found to infringe a third party’s intellectual property rights, we could be forced, including by court order, to cease developing, manufacturing or commercializing the infringing product. Alternatively, we may be required to obtain a license from such a third party in order to use the infringing technology and continue developing, manufacturing or marketing such technology. In such a case, license agreements may require us to pay royalties and other fees that could be significant, or we may not be able to obtain any required license on commercially reasonable terms or at all. Even if we were able to obtain a license, it could be non‑exclusive, thereby giving our competitors access to the same technologies licensed to us. A finding of infringement could prevent us from commercializing our products or force us to cease some of our business operations, or to redesign or rename some of our products to avoid future infringement liability. In addition, we could be found liable for monetary damages, including treble damages and attorneys’ fees if we are found to have willfully infringed a patent. Claims that we have misappropriated the confidential
39
information or trade secrets of third parties could also materially adversely affect our business, financial condition and results of operations. See also “—We may be involved in lawsuits to protect, defend or enforce our intellectual property rights, which could be expensive, time consuming and unsuccessful.” Any of the foregoing could cause us to incur significant costs and prevent us from manufacturing or selling certain of our products.
Recent changes to U.S. patent laws and proposed changes to the rules of the U.S. Patent and Trademark Office could adversely affect our ability to protect our intellectual property.
The Leahy‑Smith America Invents Act, or the Leahy‑Smith Act, which was adopted in September 2011, includes a number of significant changes to the U.S. patent laws, such as, among other things, changing from a “first to invent” to a “first inventor to file” system, establishing new procedures for challenging patents and establishing different methods for invalidating patents. The U.S. Patent and Trademark Office has recently implemented regulations relating to these changes, and the courts have yet to address many of the new provisions of the Leahy‑Smith Act. Some of these changes or potential changes may not be advantageous to us, and it may become more difficult to obtain adequate patent protection or to enforce our patents against third parties. While we cannot predict the impact of the Leahy‑Smith Act at this time, these changes or potential changes could increase the costs and uncertainties surrounding the prosecution of our patent applications and adversely affect our ability to protect our intellectual property which could materially adversely affect our business, financial condition and results of operations.
We face intense competition in each of our markets and if we are unable to maintain a competitive advantage, loss of market share, sales or profitability may result.
The markets for golf balls, clubs, gear and wear are highly competitive and there may be low barriers to entry in many of our markets. Pricing pressures, reduced profit margins or loss of market share or failure to grow in any of our markets, due to competition or otherwise, could materially adversely affect our business, financial condition and results of operations.
We compete against large‑scale global sports equipment and apparel players, Japanese industrials, as well as more specialized golf equipment and golf wear players, including Callaway, TaylorMade, Ping, Bridgestone, Nike, Adidas and Under Armour. Many of our competitors have significant competitive strengths, including long operating histories, a large and broad consumer base, established relationships with a broad set of suppliers and customers, an established regional or local presence, strong brand recognition and greater financial, R&D, marketing, distribution and other resources than we do. There are unique aspects to the competitive dynamic in each of our product categories and markets. We are not the market leader with respect to certain categories or in certain markets.
Golf Balls. The golf ball business is highly competitive. There are a number of well‑established and well‑financed competitors. We and our competitors continue to incur significant costs in the areas of R&D, advertising, marketing, tour and other promotional support to be competitive.
Golf Clubs. The golf club markets in which we compete are also highly competitive and are served by a number of well‑established and well‑financed companies with recognized brand names. New product introductions, price reductions, consignment sales, extended payment terms, “closeouts,” including closeouts of products that were recently commercially successful, and significant tour and advertising spending by competitors continue to generate intense market competition and create market disruptions. Our competitors in the golf club market have in the past and may continue to introduce their products on an accelerated cycle which could lead to market disruption and impact sales of our products.
Golf Gear. The golf gear market is fragmented and served by a number of well‑established and well‑financed competitors as well as a number of smaller competitors. We face significant competition in every region with respect to each of our golf gear product categories.
Golf Wear. In the golf wear markets, we compete with a number of well‑established and well‑financed companies with recognized brand names. These competitors may have a large and broad consumer base, established relationships with a broad set of suppliers and customers, strong brand recognition and significant financial, R&D, marketing, distribution and other resources which may exceed our own.
40
Our competitors may be able to create and maintain brand awareness and market share more quickly and effectively than we can. Our competitors may also be able to increase sales in new and existing markets faster than we do by emphasizing different distribution channels or through other methods, and many of our competitors have substantial resources to devote towards increasing sales. If we are unable to grow or maintain our competitive position in any of our product categories, it could materially adversely affect our business, financial condition and results of operations.
We may have limited opportunities for future growth in sales of golf balls, golf shoes and golf gloves.
We already have a significant share of worldwide sales of golf balls, golf shoes and golf gloves and the golf industry is very competitive. As such, gaining incremental market share quickly or at all may be limited given the competitive nature of the golf industry and other challenges to the golf industry. In the future, the overall dollar volume of worldwide sales of golf equipment, wear and gear may not grow or may decline which could materially adversely affect our business, financial condition and results of operations.
A severe or prolonged economic downturn could adversely affect our customers’ financial condition, their levels of business activity and their ability to pay trade obligations.
We primarily sell our products to golf equipment retailers, such as on‑course golf shops, golf specialty stores and other qualified retailers, directly and to foreign distributors. We perform ongoing credit evaluations of our customers’ financial condition and generally require no collateral from these customers. However, a severe or prolonged downturn in the general economy could adversely affect the retail golf equipment market which in turn would negatively impact the liquidity and cash flows of our customers, including the ability of such customers to obtain credit to finance purchases of our products and to pay their trade obligations. This could result in increased delinquent or uncollectible accounts for our customers as well as a decrease in orders for our products by such customers. A failure by our customers to pay on a timely basis a significant portion of outstanding accounts receivable balances or a decrease in orders from such customers could materially adversely affect our business, financial condition and results of operations.
A decrease in corporate spending on our custom logo golf balls could materially adversely affect our business, financial condition and results of operations.
Custom imprinted golf balls, a majority of which are purchased by corporate customers, represented over 30% of our global net golf ball sales for the year ended December 31, 2016. There has long been a strong connection between the business community and golf but corporate spending on custom logoed balls has remained at lower levels since the financial crisis. If such corporate spending decreases further, it could impact the sales of our custom imprinted golf balls.
We depend on retailers and distributors to market and sell our products, and our failure to maintain and further develop our sales channels could materially adversely affect our business, financial condition and results of operations.
We primarily sell our products through retailers and distributors and depend on these third parties to market and sell our products to consumers. Any changes to our current mix of retailers and distributors could adversely affect our sales and could negatively affect both our brand image and our reputation. Our sales depend, in part, on retailers adequately displaying our products, including providing attractive space and merchandise displays in their stores, and training their sales personnel to sell our products. If our retailers and distributors are not successful in selling our products, our sales would decrease. Our retailers frequently offer products and services of our competitors in their stores. In addition, our success in growing our presence in existing and expanding into new international markets will depend on our ability to establish relationships with new retailers and distributors. If we do not maintain our relationship with existing retailers and distributors or develop relationships with new retailers and distributors our ability to sell our products would be negatively impacted.
On a consolidated basis, no one customer that sells or distributes our products accounted for more than 10% of our consolidated net sales in the year ended December 31, 2016. However, our top ten customers accounted 21% of our consolidated net sales in the year ended December 31, 2016. Accordingly, the loss of a small number of our large customers, or the reduction in business with one or more of these customers, could materially adversely affect our business, financial condition and results of operations. We do not currently have minimum purchase agreements with these large customers.
41
On September 14, 2016, Golfsmith International Holdings LP, a specialty golf retailer and one of our largest customers in recent years announced that (i) its U.S.‑based business, Golfsmith International Holdings, Inc., or Golfsmith, which reportedly operated 109 stores in the United States at that time, commenced a Chapter 11 case under Title 11 of the United States Code in the United States Bankruptcy Court for the District of Delaware, or the Chapter 11 proceedings, and (ii) its Canada‑based business, Golf Town Canada Inc., or Golf Town, which reportedly operated 55 stores in Canada at that time, commenced creditor protection proceedings under the Companies’ Creditors Arrangement Act in the Ontario Superior Court of Justice (Commercial List).
In connection with the Chapter 11 proceedings, Golfsmith sold substantially all of its US assets to two groups of purchasers: (i) Dick’s Sporting Goods, Inc. and (ii) a joint venture consisting of Hilco Merchant Resources, LLC; Tiger Capital Group, LLC; and Gordon Brothers Retail Partners, LLC, or the Joint Venture Purchaser. Golfsmith’s U.S. sale transaction was approved by the Bankruptcy Court on or about October 31, 2016. Dick’s Sporting Goods, Inc. continues to operate fewer than 40 Golfsmith locations and the Joint Venture Purchaser has liquidated, or is liquidating, the remaining locations. Accordingly, the number of U.S. Golfsmith locations to which we formerly sold our product has been substantially reduced.
Golfsmith International Holdings LP also announced that, in addition to commencing creditor protection proceedings in Canada, it entered into a definitive asset purchase agreement for the sale of its Golf Town business to an entity controlled by a purchaser group led by Fairfax Financial Holdings Limited and certain investment funds managed by Signature Global Asset Management, a division of CI Investments Inc., which sale was approved by the Ontario Superior Court of Justice (Commercial List) on or about September 30, 2016. Forty-eight of Golf Town’s locations remain operating after the sale.
We grant credit, generally without collateral, to our retailers and distributors, formerly including Golfsmith and Golf Town. As a result of the Golfsmith and Golf Town insolvency proceedings, the receivables we had outstanding with Golfsmith International Holdings LP, which totaled $7.2 million as of the date of the bankruptcy filings, were compromised and, at least with regard to the Golfsmith U.S. bankruptcy case, more likely than not will result in no payment at all. As such, our outstanding receivable of $7.2 million at the time of the bankruptcy filing has either been written off or reserved for in full. In addition, we may be the subject of avoidance actions with respect to payments received from Golfsmith International Holdings LP within a statutory period prior to the bankruptcy petition date; however, the terms of the sale to Dick’s Sporting Goods, Inc. have made such avoidance actions, at least as they pertain to the U.S. Golfsmith proceeding, less likely. No such avoidance action has been filed to date, and may never be filed. We would vigorously defend any such avoidance actions, although the outcome of any such actions would be uncertain.
The Golfsmith bankruptcy resulted in a significant disruption to our business in the third and fourth quarters of 2016, with the reorganization activities and store closures resulting in less product sell-in to retail. In addition, we anticipate that 2017 sales will also be impacted as a result of liquidation activities still underway and lower retail sell-in resulting from the reduced store count.
We cannot predict the impact that the foregoing will have on us or the golf industry in general, and these matters may materially adversely affect our business, financial condition and results of operations, particularly during calendar year 2017.
Consolidation of retailers or concentration of retail market share among a few retailers may increase and concentrate our credit risk, put pressure on our margins and impair our ability to sell products.
The sporting goods and off‑course golf equipment retail markets in some countries, including the United States, are dominated by a few large retailers. Certain of these retailers have in the past increased their market share and may continue to do so in the future by expanding through acquisitions and construction of additional stores. Industry consolidation and correction has occurred in recent years and additional consolidation and correction is possible. These situations may result in a concentration of our credit risk with respect to our sales to such retailers, and, if any of these retailers were to experience a shortage of liquidity or other financial difficulties, or file for bankruptcy or receivership protection, it would increase the risk that their outstanding payables to us may not be paid. This consolidation may also result in larger retailers gaining increased leverage which may impact our margins. In addition, increasing market share concentration among one or a few retailers in a particular country or region increases the risk that if any one of them substantially reduces their purchases of our products, we may be unable to find a sufficient number of other retail outlets
42
for our products to sustain the same level of sales. Any reduction in sales by our retailers could materially adversely affect our business, financial condition and results of operations.
Our business depends on strong brands, and if we are not able to maintain and enhance our brands we may be unable to sell our products.
Our brands have worldwide recognition and our success depends on our ability to maintain and enhance our brand image and reputation. In particular, we believe that maintaining and enhancing the Titleist and FootJoy brands is critical to maintaining and expanding our customer base. Maintaining, promoting and enhancing our brands may require us to make substantial investments in areas such as product innovation, product quality, intellectual property protection, marketing and employee training, and these investments may not have the desired impact on our brand image and reputation. Our business could be adversely impacted if we fail to achieve any of these objectives or if the reputation or image of any of our brands is tarnished or receives negative publicity. In addition, adverse publicity about regulatory or legal action against us could damage our reputation and brand image, undermine consumer confidence in us and reduce long‑term demand for our products, even if the regulatory or legal action is unfounded or not material to our operations. Also, as we seek to grow our presence in existing, and expand into new, geographic or product markets, consumers in these markets may not accept our brand image and may not be willing to pay a premium to purchase our products as compared to other brands. We anticipate that as our business continues to grow our presence in existing, and expand into new, markets maintaining and enhancing our brands may become increasingly difficult and expensive. If we are unable to maintain or enhance the image of our brands, it could materially adversely affect our business, financial condition and results of operations.
Our business and results of operations are subject to seasonal fluctuations, which could result in fluctuations in our operating results and stock price.
Our business is subject to seasonal fluctuations because golf is played primarily on a seasonal basis in most of the regions where we do business. In general, during the first quarter, we begin selling our products into the golf retail channel for the new golf season. This initial sell‑in generally continues into the second quarter. Our second‑quarter sales are significantly affected by the amount of sell‑through, in particular the amount of higher value discretionary purchases made by customers, which drives the level of reorders of our products sold‑in during the first quarter. Our third‑quarter sales are generally dependent on reorder business, and are generally less than the second quarter as many retailers begin decreasing their inventory levels in anticipation of the end of the golf season. Our fourth‑quarter sales are generally less than the other quarters due to the end of the golf season in many of our key markets, but can also be affected by key product launches, particularly golf clubs. Accordingly, our results of operations are likely to fluctuate significantly from period to period. This seasonality affects sales in each of our reportable segments differently. In general, however, because of this seasonality, a majority of our sales and most of our profitability generally occurs during the first half of the year. Results of operations in any period should not be considered indicative of the results to be expected for any future period. The seasonality of our business could be exacerbated by the adverse effects of unusual or severe weather conditions as well as by severe weather conditions caused or exacerbated by climate change.
Our business and results of operations are also subject to fluctuations based on the timing of new product introductions.
Our sales can also be affected by the launch timing of new products. Product introductions generally stimulate sales as the golf retail channel takes on inventory of new products. Reorders of these new products then depend on the rate of sell‑through. Announcements of new products can often cause our customers to defer purchasing additional golf equipment until our new products are available. Our varying product introduction cycles, which are described under “Item 7. – Management’s Discussion and Analysis of Financial Condition and Results of Operations—Key Factors Affecting Our Results of Operations—Cyclicality,” may cause our results of operations to fluctuate as each product line has different volumes, prices and margins.
We have significant international operations and are exposed to risks associated with doing business globally.
We sell and distribute our products directly in many key international markets in Europe, Asia, North America and elsewhere around the world. These activities have resulted and will continue to result in investments in inventory, accounts receivable, employees, corporate infrastructure and facilities. In addition, in the United States there are a limited number of suppliers of certain raw materials and components for our products as well as finished goods that we
43
sell, and we have increasingly become more reliant on suppliers and vendors located outside of the United States. The operation of foreign distribution in our international markets, as well as the management of relationships with international suppliers and vendors, will continue to require the dedication of management and other resources. We also manufacture certain of our products outside of the United States, including some of our golf balls and substantially all of our golf gloves in Thailand and substantially all of our golf shoes through our joint venture in China.
The new U.S. administration has publicly supported certain potential tax and trade proposals, modifications to international trade policy and other changes which may affect U.S. trade relations with other countries. In addition, economic and political uncertainty arose out of the June 23, 2016 vote in the United Kingdom that resulted in the decision to leave the European Union. It is possible that these or other changes, if enacted, may impact or require us to modify our current business practices. At the present time, it is unclear as to the ultimate impact of these changes, policies or proposals and, as such, we are unable to determine the effect, if any, that such changes, policies or proposals would have on our business.
As a result of the aforementioned international business, we are exposed to increased risks inherent in conducting business outside of the United States. In addition to the uncertainty and the foreign currency risks discussed above under “—Our operations are conducted worldwide and our results of operations are subject to currency transaction risk and currency translation risk that could materially adversely affect our business, financial condition and results of operations,” these risks include:
|
· |
increased difficulty in protecting our intellectual property rights and trade secrets; |
|
· |
unexpected government action or changes in legal, trade, tax or regulatory requirements; |
|
· |
social, economic or political instability; |
|
· |
the effects of any anti‑American sentiments on our brands or sales of our products; |
|
· |
increased difficulty in ensuring compliance by employees, agents and contractors with our policies as well as with the laws of multiple jurisdictions, including but not limited to the U.S. Foreign Corrupt Practices Act, or the FCPA, and similar anti‑bribery and anti‑corruption laws, local and international environmental, health and safety laws, and increasingly complex regulations relating to the conduct of international commerce; |
|
· |
increased difficulty in controlling and monitoring foreign operations from the United States, including increased difficulty in identifying and recruiting qualified personnel for its foreign operations; and |
|
· |
increased exposure to interruptions in air carrier or ship services. |
Any violation of our policies or any applicable laws and regulations by our suppliers or manufacturers could interrupt or otherwise disrupt our sourcing, adversely affect our reputation or damage our brand image. While we do not control these suppliers or manufacturers or their labor practices, negative publicity regarding the management of facilities by, production methods of or materials used by any of our suppliers or manufacturers could adversely affect our reputation and sales and force us to locate alternative suppliers or manufacturing sources, which could materially adversely affect our business, financial condition and results of operations.
Failure to comply with laws, regulations and policies, including the FCPA or other applicable anti‑corruption legislation, could result in fines, criminal penalties and materially adversely affect our business, financial condition and results of operations.
A significant risk resulting from our global operations is compliance with a wide variety of U.S. federal and state and non‑U.S. laws, regulations and policies, including laws related to anti‑corruption, export and import compliance, anti‑trust and money laundering. The FCPA, the U.K. Bribery Act of 2010 and similar anti‑bribery laws in other jurisdictions generally prohibit companies and their intermediaries from making improper payments to government officials or other persons. There has been an increase in anti‑bribery law enforcement activity in recent years, with more frequent and aggressive investigations and enforcement proceedings by both the U.S. Department of Justice and the
44
SEC, increased enforcement activity by non‑U.S. regulators, and increases in criminal and civil proceedings brought against companies and individuals. We operate in parts of the world that are recognized as having governmental and commercial corruption and in certain circumstances, strict compliance with anti‑bribery laws may conflict with local customs and practices. We cannot assure you that our internal control policies and procedures have protected or will always protect us from improper conduct of our employees or business partners. To the extent that we learn that any of our employees do not adhere to our internal control policies, we are committed to taking appropriate remedial action. In the event that we believe or have reason to believe that our employees or agents have or may have violated applicable laws, including anti‑corruption laws, we may be required to investigate or have outside counsel investigate the relevant facts and circumstances, and detecting, investigating and resolving actual or alleged violations can be expensive and require significant time and attention from senior management. Any violation of U.S. federal and state and non‑U.S. laws, regulations and policies could result in substantial fines, sanctions, civil and/or criminal penalties, and curtailment of operations in the U.S. or other applicable jurisdictions. In addition, actual or alleged violations could damage our reputation and ability to do business. Any of the foregoing could materially adversely affect our business, financial condition and results of operations.
Our business, financial condition and results of operations could be materially adversely affected if professional golfers do not endorse or use our products.
We establish relationships with professional golfers in order to use, validate and promote Titleist and FootJoy branded products. We have entered into endorsement arrangements with members of the various professional tours, including the PGA Tour, the Champions Tour, the LPGA Tour, the European PGA Tour, the Japan Tour and the Korean Tour. We believe that professional usage of our products validates the performance and quality of our products and contributes to retail sales. We therefore spend a significant amount of money to secure professional usage of our products. Many other companies, however, also aggressively seek the patronage of these professionals and offer many inducements, including significant cash incentives and specially designed products. There is a great deal of competition to secure the representation of tour professionals. As a result, it is expensive to attract and retain such tour professionals and we may lose the endorsement of these individuals, even prior to the expiration of the applicable contract term. The inducements offered by other companies could result in a decrease in usage of our products by professional golfers or limit our ability to attract other tour professionals. A decline in the level of professional usage of our products, or a significant increase in the cost to attract or retain endorsers, could materially adversely affect our business, financial condition and results of operations.
The value of our brands and sales of our products could be diminished if we, the golfers who use our products or the golf industry in general are associated with negative publicity.
We sponsor a variety of golfers and feature those golfers in our advertising and marketing materials. We establish these relationships to develop, evaluate and promote our products, as well as establish product authenticity with consumers. Actions taken by golfers or tours associated with our products that harm the reputations of those golfers could also harm our brand image and impact our sales. We may also select golfers who may not perform at expected levels or who are not sufficiently marketable. If we are unable in the future to secure prominent golfers and arrange golfer endorsements of our products on terms we deem to be reasonable, we may be required to modify our marketing platform and to rely more heavily on other forms of marketing and promotion, which may not prove to be as effective or may result in additional costs.
If we inaccurately forecast demand for our products, we may manufacture insufficient quantities, which could materially adversely affect our business, financial condition and results of operations.
To reduce purchasing costs and ensure supply, we place orders with our suppliers in advance of the time period we expect to deliver our products. In addition, we plan our manufacturing capacity based upon the forecasted demand for our products. Forecasting the demand for our products is very difficult given the number of SKUs we offer and the amount of specification involved in each of our product categories. For example, in our golf shoe business, we offer a large variety of models as well as different styles and sizes for each model, including over 2,400 SKUs available for men in the United States alone. The nature of our business makes it difficult to adjust quickly our manufacturing capacity if actual demand for our products exceeds or is less than forecasted demand. Factors that could affect our ability to accurately forecast demand for our products include, among others:
|
· |
changes in consumer demand for our products or the products of our competitors; |
45
|
· |
new product introductions by us or our competitors; |
|
· |
failure to accurately forecast consumer acceptance of our products; |
|
· |
failure to anticipate consumer acceptance of new technologies; |
|
· |
inability to realize revenues from booking orders; |
|
· |
negative publicity associated with tours or golfers we endorse; |
|
· |
unanticipated changes in general market conditions or other factors, which may result in cancellations of advance orders or a reduction or increase in the rate of reorders placed by retailers; |
|
· |
weakening of economic conditions or consumer confidence in future economic conditions, which could reduce demand for discretionary items, such as our products; |
|
· |
terrorism or acts of war, or the threat thereof, which could adversely affect consumer confidence and spending or interrupt production and distribution of products and raw materials; |
|
· |
abnormal weather pattern or extreme weather conditions including hurricanes, floods and droughts, among others, which may disrupt economic activity; and |
|
· |
general economic conditions. |
If actual demand for our products exceeds the forecasted demand, we may not be able to produce sufficient quantities of new products in time to fulfill actual demand, which could limit our sales.
Any inventory levels in excess of consumer demand may result in inventory write‑downs and/or the sale of excess inventory at discounted prices.
We may experience a disruption in the service, or a significant increase in the cost, of our primary delivery and shipping services for our products and component parts or a significant disruption at shipping ports.
We use FedEx Corporation, or FedEx, for substantially all ground shipments of products to our U.S. customers. We use ocean shipping services and air carriers for most of our international shipments of products. Furthermore, many of the components we use to manufacture and assemble our products are shipped to us via ocean shipping and air carrier. If there are changes in trade or tariff laws which result in customs processing delays or any significant interruption in service by such providers or at shipping ports or airports, we may be unable to engage alternative suppliers or to receive or ship goods through alternate sites in order to deliver our products or components in a timely and cost‑efficient manner. As a result, we could experience manufacturing delays, increased manufacturing and shipping costs, and lost sales as a result of missed delivery deadlines and product introduction and demand cycles. Any significant interruption in FedEx services, ship services, at shipping ports or air carrier services could materially adversely affect our business, financial condition and results of operations. Furthermore, if the cost of delivery or shipping services were to increase significantly and the additional costs could not be covered by product pricing it could materially adversely affect our business, financial condition and results of operations.
We rely on complex information systems for management of our manufacturing, distribution, sales and other functions. If our information systems fail to perform these functions adequately or if we experience an interruption in our operations, including a breach in cybersecurity, our business, financial condition and results of operations could be materially adversely affected.
All of our major operations, including manufacturing, distribution, sales and accounting, are dependent upon our complex information systems. Our information systems are vulnerable to damage or interruption from:
|
· |
earthquake, fire, flood, hurricane and other natural disasters; |
46
|
· |
power loss, computer systems failure, Internet and telecommunications or data network failure; and |
|
· |
hackers, computer viruses, unauthorized access, software bugs or glitches. |
Any damage or significant disruption in the operation of such systems or the failure of our information systems to perform as expected would disrupt our business, which may result in decreased sales, increased overhead costs, excess inventory or product shortages which could materially adversely affect our business, financial condition and results of operations.
Cybersecurity risks could disrupt our operations and negatively impact our reputation.
There is growing concern over the security of personal and corporate information transmitted over the Internet, consumer identity theft and user privacy due to increasingly diverse and sophisticated threats to network, systems and data security. While we have implemented security measures, our computer systems may be susceptible to electronic or physical computer break‑ins, viruses and other disruptions and security breaches. Any perceived or actual unauthorized or inadvertent disclosure of personally‑identifiable information regarding visitors to our websites or otherwise or other breach or theft of the information we control, whether through a breach of our network by an unauthorized party, employee theft, misuse or error or otherwise, could harm our reputation, impair our ability to attract website visitors, or subject us to claims or litigation and require us to repair damages suffered by consumers, and materially adversely affect our business, financial condition and results of operations.
If the technology‑based systems that give consumers the ability to shop with us online do not function effectively, our ability to grow our eCommerce business globally could be adversely affected.
We are increasingly using websites and social media to interact with consumers and as a means to enhance their experience with our products, including through Vokey.com and ScottyCameron.com. In addition, we launched our FootJoy eCommerce initiative in the first quarter of 2016. In our eCommerce services, we process, store and transmit customer data. We also collect consumer data through certain marketing activities. Failure to prevent or mitigate data loss or other security breaches, including breaches of our vendors’ technology and systems, could expose us or consumers to a risk of loss or misuse of such information, result in litigation or potential liability for us and otherwise materially adversely affect our business, financial condition and results of operations. Further, our eCommerce business is subject to general business regulations and laws, as well as regulations and laws specifically governing the Internet, eCommerce and electronic devices. Existing and future laws and regulations, or new interpretations of these laws, may adversely affect our ability to conduct our eCommerce business.
Any failure on our part to provide private, secure, attractive, effective, reliable, user‑friendly eCommerce platforms that offer a wide assortment of merchandise with rapid delivery options and that continually meet the changing expectations of online shoppers could place us at a competitive disadvantage, result in the loss of eCommerce and other sales, harm our reputation with consumers, have an adverse impact on the growth of our eCommerce business globally and could materially adversely affect our business, financial condition and results of operations.
Risks specific to our eCommerce business also include diversion of sales from our trade partners’ brick and mortar stores, difficulty in recreating the in‑store experience through direct channels and liability for online content. Our failure to successfully respond to these risks might adversely affect sales in our eCommerce business, as well as damage our reputation and brands.
Our business could be harmed by the occurrence of natural disasters or pandemic diseases.
The occurrence of a natural disaster, such as an earthquake, tsunami, fire, flood or hurricane, or the outbreak of a pandemic disease, could materially adversely affect our business, financial condition and results of operations. A natural disaster or a pandemic disease could adversely affect both the demand for our products as well as the supply of the raw materials or components used to make our products. Demand for golf products also could be negatively affected if consumers in the affected regions restrict their recreational activities and discretionary spending and as tourism to those areas declines. If our suppliers experience a significant disruption in their business as a result of a natural disaster or pandemic disease, our ability to obtain the necessary raw materials or components to make products could be materially adversely affected. In addition, the occurrence of a natural disaster or the outbreak of a pandemic disease
47
generally restricts travel to and from the affected areas, making it more difficult in general to manage our global operations.
Goodwill and identifiable intangible assets represent a significant portion of our total assets and any impairment of these assets could negatively impact our results of operations and shareholders’ equity.
Our goodwill and identifiable intangible assets, which consist of goodwill from acquisitions, trademarks, patents, completed technology, customer relationships, licensing fees, and other intangible assets, represented 38.5% of our total assets as of December 31, 2016.
Accounting rules require the evaluation of our goodwill and intangible assets with indefinite lives for impairment at least annually or whenever events or changes in circumstances indicate that the carrying value of such assets may not be recoverable. Such indicators include a significant adverse change in customer demand or business climate that could affect the value of an asset; general economic conditions, such as increasing Treasury rates or unexpected changes in gross domestic product growth; a change in our market shares; budget‑to‑actual performance and consistency of operations margins and capital expenditures; a product recall or an adverse action or assessment by a regulator; or changes in management or key personnel.
To test goodwill for impairment, we perform a two‑step test. The first step is a comparison of each reporting unit’s fair value to its carrying value. We estimate the reporting unit’s fair value by estimating the future cash flows of the reporting units to which the goodwill relates, and then discount the future cash flows at a market‑participant‑derived weighted average cost of capital. The estimates of fair value of reporting units are based on the best information available as of the date of the assessment. If the carrying value of a reporting unit exceeds its estimated fair value in the first step, a second step is performed, which requires us to allocate the fair value of the reporting unit derived in the first step to the fair value of the reporting unit’s net assets, with any fair value in excess of amounts allocated to such net assets representing the implied fair value of goodwill for that reporting unit. If the implied fair value of the goodwill is less than the book value, goodwill is impaired and is written down to the implied fair value amount.
To test our other indefinite‑lived assets for impairment, which consist of our trade names, we determine the fair value of our trade names using the relief‑from‑royalty method, which estimates the present value of royalty income that could be hypothetically earned by licensing the brand name to a third party over the remaining useful life. If in conducting an impairment evaluation we determine that the carrying value of an asset exceeded its fair value, we would be required to record a non‑cash impairment charge for the difference between the carrying value and the fair value of the asset. If a significant amount of our goodwill and identifiable intangible assets were deemed to be impaired, our business, financial condition and results of operations could be materially adversely affected.
Our current senior management team and other key employees are critical to our success and if we are unable to attract and/or retain key employees and hire qualified management, technical and manufacturing personnel, our ability to compete could be harmed.
Our ability to maintain our competitive position is dependent to a large degree on the efforts and skills of our senior management team, which averages over 20 years with us, and our other key employees. Our executives are experienced and highly qualified with strong reputations and relationships in the golf industry, and we believe that our management team enables us to pursue our strategic goals. Our other key sales, marketing, R&D, manufacturing, intellectual property protection and support personnel are also critical to the success of our business. The loss of the services of any of our senior management team or other key employees could disrupt our operations and delay the development and introduction of our products which could materially adversely affect our business, financial condition and results of operations. We do not have employment agreements with any of the members of our senior management team. In addition, we do not have “key person” life insurance policies covering any of our officers or other key employees.
Our former President of Titleist Golf Balls retired effective February 29, 2016. This role has been assumed by a new President of Titleist Golf Balls who has worked at Acushnet Company since 1987. Our former President of Titleist Golf Clubs retired effective April 30, 2016. This role has been assumed by a new President of Titleist Golf Clubs who has worked at Acushnet Company since 1993. Our former President of FootJoy retired effective December 31, 2016. This role was assumed by a new President of FootJoy beginning on August 1, 2016. See “Executive Officers of the Registrant.”
48
Our future success depends upon our ability to attract and retain our executive officers and other key sales, marketing, R&D, manufacturing, intellectual property protection and support personnel and any failure to do so could materially adversely affect our business, financial condition and results of operations.
Additionally, we compete with many mature and prosperous companies that have far greater financial resources than we do and thus can offer current or perspective employees more lucrative compensation packages than we can.
Sales of our products by unauthorized retailers or distributors could adversely affect our authorized distribution channels and harm our reputation.
Some of our products find their way to unauthorized outlets or distribution channels. This “gray market” for our products can undermine authorized retailers and foreign wholesale distributors who promote and support our products, and can injure the image of our company in the minds of our customers and consumers. While we have taken some lawful steps to limit commerce of our products in the “gray market” in both the United States and abroad, we have not been successful in halting such commerce.
Terrorist activities and international political instability may decrease demand for our products and disrupt our business.
Terrorist activities and armed conflicts could have an adverse effect upon the United States or worldwide economy and could cause decreased demand for our products. If such events disrupt domestic or international air, ground or sea shipments, or the operation of our suppliers or our manufacturing facilities, our ability to obtain the materials necessary to manufacture products and to deliver customer orders would be harmed, which could materially adversely affect our business, financial condition and results of operations. Such events can negatively impact tourism, which could adversely affect our sales to retailers at resorts and other vacation destinations. In addition, the occurrence of political instability and/or terrorist activities generally restricts travel to and from the affected areas, making it more difficult in general to manage our global operations.
We may not be successful in our efforts to grow our presence in existing international markets and expand into additional international markets.
We intend to grow our presence in and continue to expand into select international markets where there are the necessary and sufficient conditions in place to support such expansion. These growth and expansion plans will require significant management attention and resources and may be unsuccessful. In addition, to achieve satisfactory performance in international locations, it may be necessary to locate physical facilities, such as regional offices, in the foreign market and to hire employees who are familiar with such foreign markets while also being qualified to market our products. We may not be successful in growing our presence in or expanding into any such international markets or in generating sales from such foreign operations.
We have historically grown our business by expanding into additional international markets, but such growth does not always work out as anticipated and there is no assurance that we will be successful in the existing international markets where we are currently seeking to grow our presence, including China, or the new international markets we plan to enter. Our business, financial condition and results of operations could be materially adversely affected if we do not achieve the international growth that we are anticipating.
We are exposed to a number of different tax uncertainties, including potential changes in tax laws, unanticipated tax liabilities and limitations on utilization of tax attributes after any change of control, which could materially adversely affect our business, financial condition and results of operations.
We earn a substantial portion of our net sales in foreign countries, and are subject to the tax laws of those jurisdictions as well as U.S. tax laws. Tax laws affecting international operations are complex and current economic and political conditions make tax rules in any jurisdiction, including the U.S., subject to significant change. The new U.S. administration and leaders in Congress have indicated their desire to pursue comprehensive tax reform and there are currently various proposals for U.S. tax reform being contemplated, as well as changes to, and introductions of, new tax laws in various foreign countries in which we do business. Any of these proposals, changes or new tax laws could significantly impact how we are taxed on both U.S. and foreign earnings. Although we cannot predict whether or in what form these proposals, changes or new tax laws will pass and ultimately be enacted into law, such changes could have an
49
adverse impact on our income tax expense and cash flows. Transactions that we have arranged in light of current tax rules could have adverse consequences if those tax rules change, and the imposition of any new or increased tariffs, duties and taxes could materially adversely affect our business, financial condition and results of operations.
Our effective income tax rate in the future could be adversely affected by a number of factors, including changes in the mix of earnings in countries with differing statutory tax rates, changes in the valuation of deferred tax assets and liabilities, changes in tax laws, the outcome of income tax audits in various jurisdictions around the world and any repatriation of non‑U.S. earnings for which we have not previously provided for U.S. taxes.
Under Sections 382 and 383 of the Internal Revenue Code of 1986, as amended, or the Code, if a corporation undergoes an “ownership change,” the corporation’s ability to use its pre‑change net operating loss carryforwards and other pre‑change tax attributes, such as foreign tax credits and research tax credits, to offset its post‑change income and taxes may be limited. In general, an “ownership change” generally occurs if there is a cumulative change in the Company’s ownership by “5‑percent shareholders” that exceeds 50 percentage points over a rolling three‑year period. Similar rules may apply under state tax laws. We may experience an ownership change from future transactions in our stock, some of which may be outside our control. As a result, if we earn net taxable income, our ability to use pre‑change net operating loss carryforwards or other pre‑change tax attributes to offset U.S. federal and state taxable income and taxes may be subject to limitations.
We are engaged in a number of intercompany transactions across multiple tax jurisdictions. Although we believe that these transactions reflect the accurate economic allocation of profit and that the proper transfer pricing documentation is in place, the profit allocation and transfer pricing terms and conditions may be scrutinized by local tax authorities during an audit and any resulting changes may impact our mix of earnings in countries with differing statutory tax rates.
We are also subject to the audit or examination of our tax returns by the Internal Revenue Service and other tax authorities whereby tax authorities could impose additional tariffs, duties, taxes, penalties and interest on us. The determination of our worldwide provision for income taxes and other tax liabilities requires significant judgment, and there are many transactions and calculations where the ultimate tax determination is uncertain. Although we believe our estimates are reasonable and our tax provisions are adequate, the final determination of tax audits and any related disputes could be materially different from our historical income tax provisions and accruals. The results of audits or related disputes could have an adverse effect on our financial statements and our financial results for the period or periods for which the applicable final determinations are made.
Portions of our operations are subject to a reduced tax rate or are free of tax under various tax holidays and rulings that expire in whole or in part from time to time. These tax holidays and rulings may be extended when certain conditions are met, or terminated if certain conditions are not met. If the tax holidays and rulings are not extended, or if we fail to satisfy the conditions of the reduced tax rate, then our effective tax rate would increase in the future.
Changes to the overall international tax environment, as well as changes to some of the tax laws of the foreign jurisdictions in which we operate, are expected as a result of the Base Erosion and Profit Shifting project, or BEPS, being undertaken by the Organisation for Economic Co‑operation and Development, or OECD. The OECD, which represents a coalition of member countries that encompass many of the jurisdictions in which we operate, has promulgated recommended changes to numerous long standing international tax principles through its BEPS project. It is expected that jurisdictions in which we do business will react to the BEPS initiative by enacting tax legislation, and our business could be materially impacted. It is also expected that our existing transfer pricing arrangements need to be reviewed and possibly adjusted to reflect the principles enumerated in the BEPS project.
Our insurance policies may not provide adequate levels of coverage against all claims and we may incur losses that are not covered by our insurance.
We maintain insurance of the type and in amounts that we believe is commercially reasonable and that is available to businesses in our industry. We carry various types of insurance, including general liability, auto liability, workers’ compensation and excess umbrella, from highly rated insurance carriers on all of our properties. We believe that the policy specifications and insured limits are adequate for foreseeable losses with terms and conditions that are reasonable and customary for similar businesses and are within industry standards. Nevertheless, market forces beyond our control could limit the scope of the insurance coverage that we can obtain in the future or restrict our ability to buy
50
insurance coverage at reasonable rates. We cannot predict the level of the premiums that we may be required to pay for subsequent insurance coverage, the level of any deductible and/or self‑insurance retention applicable thereto, the level of aggregate coverage available or the availability of coverage for specific risks.
In the event of a substantial loss, the insurance coverage that we carry may not be sufficient to compensate us for the losses we incur or any costs we are responsible for. In addition, there are types of losses we may incur that cannot be insured against or that we believe are not commercially reasonable to insure. For example, we maintain business interruption insurance, but there can be no assurance that the coverage for a severe or prolonged business interruption would be adequate and the deductibles for such insurance may be high. These losses, if they occur, could materially adversely affect our business, financial condition and results of operations.
We are subject to product liability, warranty and recall claims, and our insurance coverage may not cover such claims.
Our products expose us to warranty claims and product liability claims in the event that products manufactured, sold or designed by us actually or allegedly fail to perform as expected, or the use of those products results, or is alleged to result, in personal injury, death or property damage. Further, we or one or more of our suppliers might not adhere to product safety requirements or quality control standards, and products may be shipped to retail partners before the issue is identified. In the event that this occurs, we may have to recall our products to address performance, compliance, or other safety related issues. The financial costs we may incur in connection with these recalls typically would include the cost of the product being replaced or repaired and associated labor and administrative costs and, if applicable, governmental fines and/or penalties.
Product recalls can harm our reputation and cause us to lose customers, particularly if those recalls cause consumers to question the performance, quality, safety or reliability of our products. Substantial costs incurred or lost sales caused by future product recalls could materially adversely affect our business, financial condition and results of operations. Conversely, not issuing a recall or not issuing a recall on a timely basis can harm our reputation and cause us to lose customers for the same reasons as expressed above. Product recalls, withdrawals, repairs or replacements may also increase the amount of competition that we face.
We vigorously defend or attempt to settle all product liability cases brought against us. However, there is no assurance that we can successfully defend or settle all such cases. We believe that we are not currently subject to any material product liability claims not covered by insurance or vendor indemnity, although the ultimate outcome of these and future claims cannot presently be determined. Because product liability claims are part of the ordinary course of our business, we maintain product liability insurance which we currently believe is adequate. Our insurance policies provide coverage against claims resulting from alleged injuries arising from our products sustained during the respective policy periods, subject to policy terms and conditions. We believe the insurance will be renewed on substantially similar terms upon its expiry but there can be no assurance that this coverage will be renewed or otherwise remain available in the future, that our insurers will be financially viable when payment of a claim is required, that the cost of such insurance will not increase, or that this insurance will ultimately prove to be adequate under our various policies. Furthermore, future rate increases might make insurance uneconomical for us to maintain. These potential insurance problems or any adverse outcome in any liability suit could create increased expenses which could harm our business. We are unable to predict the nature of product liability claims that may be made against us in the future with respect to injuries, diseases or other illnesses resulting from the use of our products or the materials incorporated in our products.
With regard to warranty claims, our actual product warranty obligations could materially differ from historical rates which would oblige us to revise our estimated warranty liability accordingly. Adverse determinations of material product liability and warranty claims made against us could materially adversely affect our business, financial condition and results of operations and could harm the reputation of our brands.
We may be subject to litigation and other regulatory proceedings which may result in the expense of time and resources and could materially adversely affect our business, financial condition and results of operations.
We may be involved in lawsuits and regulatory actions relating to our business, including those relating to intellectual property, antitrust, commercial and employment matters. Due to the inherent uncertainties of litigation and regulatory proceedings, we cannot accurately predict the likelihood of such lawsuits or regulatory proceedings occurring or the ultimate outcome of any such proceedings. An unfavorable outcome could materially adversely affect our
51
business, financial condition and results of operations. In addition, any such proceeding, regardless of its merits, could divert management’s attention from our operations and result in substantial legal fees.
We are subject to environmental, health and safety laws and regulations, which could subject us to liabilities, increase our costs or restrict our operations in the future.
Our properties and operations are subject to a number of environmental, health and safety laws and regulations in each of the jurisdictions in which we operate. These laws and regulations govern, among other things, air emissions, water discharges, handling and disposal of solid and hazardous substances and wastes, soil and groundwater contamination and employee health and safety. Our failure to comply with such environmental, health and safety laws and regulations could result in substantial civil or criminal fines or penalties or enforcement actions, including regulatory or judicial orders enjoining or curtailing operations or requiring remedial or corrective measures, installation of pollution control equipment or other actions.
We may also be subject to liability for environmental investigations and cleanups, including at properties that we currently or previously owned or operated, even if such contamination was not caused by us, and we may face claims alleging harm to health or property or natural resource damages arising out of contamination or exposure to hazardous substances. We may also be subject to similar liabilities and claims in connection with locations at which hazardous substances or wastes we have generated have been stored, treated, otherwise managed, or disposed.
We use certain substances and generate certain wastes that may be deemed hazardous or toxic under environmental laws, and we from time to time have incurred, and in the future may incur, costs related to cleaning up contamination resulting from historic uses of certain of our current or former properties or our treatment, storage or disposal of wastes at facilities owned by others. The costs of investigation, remediation or removal of such materials may be substantial, and the presence of those substances, or the failure to remediate a property properly, may impair our ability to use, transfer or obtain financing regarding our property. Liability in many situations may be imposed not only without regard to fault, but may also be joint and several, so that we may be held responsible for more than our share of the contamination or other damages, or even for the entire amount.
Environmental conditions at or related to our current or former properties or operations, and/or the costs of complying with current or future environmental, health and safety requirements (which have become more stringent and complex over time) could materially adversely affect our business, financial condition and results of operations.
We may require additional capital in the future and we cannot give any assurance that such capital will be available at all or available on terms acceptable to us and, if it is available, additional capital raised by us may dilute holders of our common stock.
We may need to raise additional funds through public or private debt or equity financings in order to:
|
· |
fund ongoing operations; |
|
· |
take advantage of opportunities, including expansion of our business or the acquisition of complementary products, technologies or businesses; |
|
· |
develop new products; or |
|
· |
respond to competitive pressures. |
Any additional capital raised through the sale of equity or securities convertible into equity will dilute the percentage ownership of holders of our common stock. Capital raised through debt financing would require us to make periodic interest payments and may impose restrictive covenants on the conduct of our business. Furthermore, additional financings may not be available on terms favorable to us, or at all, especially during periods of adverse economic conditions, which could make it more difficult or impossible for us to obtain funding for the operation of our business, for making additional investments in product development and for repaying outstanding indebtedness. Our failure to obtain additional funding could prevent us from making expenditures that may be required to grow our business or maintain our operations.
52
If our estimates or judgments relating to our critical accounting policies prove to be incorrect, our financial condition and results of operations could be adversely affected.
The preparation of financial statements in conformity with U.S. GAAP requires management to make estimates and assumptions that affect the amounts reported in the consolidated financial statements and accompanying notes. We base our estimates on historical experience and on various other assumptions that we believe to be reasonable under the circumstances, as discussed under “Item 7. – Management’s Discussion and Analysis of Financial Condition and Results of Operations,” included elsewhere in this report and in our consolidated financial statements included herein. The results of these estimates form the basis for making judgments about the carrying values of assets, liabilities and equity, and the amount of revenue and expenses that are not readily apparent from other sources. Significant assumptions and estimates used in preparing our consolidated financial statements include those related to revenue recognition, allowance for doubtful accounts, inventory reserves, impairment of goodwill, indefinite‑lived and long‑lived assets, pension and other post‑retirement benefits, product warranty, valuation allowances for deferred tax assets, valuation of common stock warrants, and share‑based compensation. Our financial condition and results of operations may be adversely affected if our assumptions change or if actual circumstances differ from those in our assumptions, which could cause our results of operations to fall below the expectations of securities analysts and investors, resulting in a decline in the price of our common stock.
Risks Related to Our Indebtedness
Our substantial leverage could adversely affect our ability to raise additional capital to fund our operations, limit our ability to react to changes in the economy or in our industry, expose us to interest rate risk to the extent of our variable rate debt, and prevent us from meeting our obligations under our indebtedness.
As of December 31, 2016, we had $412.8 million of indebtedness. In addition, as of December 31, 2016, we had $224.9 million of availability under our revolving credit facility after giving effect to $7.6 million of outstanding letters of credit and we had $60.2 million available under our local credit facilities. During the first quarter of 2017, we borrowed under our delayed draw term loan A facility and under our revolving credit facility to make payments in connection with the final payout of the outstanding EARs under the EAR Plan. Our high degree of leverage could have important consequences for us, including:
|
· |
requiring us to utilize a substantial portion of our cash flows from operations to make payments on our indebtedness, reducing the availability of our cash flows to fund working capital, capital expenditures, product development, acquisitions, general corporate and other purposes; |
|
· |
increasing our vulnerability to adverse economic, industry, or competitive developments; |
|
· |
exposing us to the risk of increased interest rates because substantially all of our borrowings are at variable rates of interest; |
|
· |
making it more difficult for us to satisfy our obligations with respect to our indebtedness, and any failure to comply with the obligations of any of our debt instruments, including financial maintenance covenants and restrictive covenants, could result in an event of default under the agreements governing our indebtedness; |
|
· |
restricting us from making strategic acquisitions or causing us to make non‑strategic divestitures; |
|
· |
limiting our ability to obtain additional financing for working capital, capital expenditures, product development, debt service requirements, acquisitions, and general corporate or other purposes; and |
|
· |
limiting our flexibility in planning for, or reacting to, changes in our business or market conditions and placing us at a competitive disadvantage compared to our competitors who are less highly leveraged and who, therefore, may be able to take advantage of opportunities that our leverage prevents us from exploiting. |
53
Our total interest expense, net was $49.9 million, $60.3 million and $63.5 million for the years ended December 31, 2016 and 2015 and 2014, respectively. Substantially all of our indebtedness is floating rate debt therefore our interest expense would increase along with rising interest rates.
Servicing our indebtedness will require a significant amount of cash. Our ability to generate sufficient cash depends on many factors, some of which are not within our control.
Our ability to make payments on our indebtedness and to fund planned capital expenditures will depend on our ability to generate cash in the future. To a certain extent, this is subject to general economic, financial, competitive, legislative, regulatory, and other factors that are beyond our control. If we are unable to generate sufficient cash flows to service our debt and meet our other commitments, we may need to restructure or refinance all or a portion of our debt, sell material assets or operations, or raise additional debt or equity capital. We may not be able to affect any of these actions on a timely basis, on commercially reasonable terms, or at all, and these actions may not be sufficient to meet our capital requirements. In addition, any refinancing of our indebtedness could be at a higher interest rate, and the terms of our existing or future debt arrangements may restrict us from affecting any of these alternatives. Our failure to make the required interest and principal payments on our indebtedness would result in an event of default under the agreement governing such indebtedness, which may result in the acceleration of some or all of our outstanding indebtedness.
Despite our high indebtedness level, we and our subsidiaries will still be able to incur significant additional amounts of debt, which could further exacerbate the risks associated with our substantial indebtedness.
We and our subsidiaries may be able to incur substantial additional indebtedness in the future. Although the agreements governing our indebtedness contain restrictions on the incurrence of additional indebtedness, these restrictions are subject to a number of significant qualifications and exceptions and, under certain circumstances, the amount of indebtedness that could be incurred in compliance with these restrictions could be substantial.
Our credit agreements contain restrictions that limit our flexibility in operating our business.
The agreements governing our outstanding indebtedness contain various covenants that limit our ability to engage in specified types of transactions. These covenants limit the ability of our subsidiaries to, among other things:
|
· |
incur, assume, or permit to exist additional indebtedness or guarantees; |
|
· |
incur liens; |
|
· |
make investments and loans; |
|
· |
pay dividends, make payments, or redeem or repurchase capital stock; |
|
· |
engage in mergers, liquidations, dissolutions, asset sales, and other dispositions (including sale leaseback transactions); |
|
· |
amend or otherwise alter terms of certain indebtedness or certain other agreements; |
|
· |
enter into agreements limiting subsidiary distributions or containing negative pledge clauses; |
|
· |
engage in certain transactions with affiliates; |
|
· |
alter the nature of the business that we conduct; |
|
· |
change our fiscal year or accounting practices; or |
|
· |
enter into a transaction or series of transactions that constitutes a change of control. |
The covenants contained in the credit agreement governing our senior secured credit facilities (which we refer to in this report as “our credit agreement”) also restrict the ability of Acushnet Holdings Corp. to engage in certain
54
mergers or consolidations or engage in any activities other than permitted activities. A breach of any of these covenants, among others, could result in a default under one or more of these agreements, including as a result of cross default provisions, and, in the case of our secured credit facility, following any applicable cure period, would permit the lenders thereunder to, among other things, declare the principal, accrued interest and other obligations thereunder to be immediately due and payable and declare the commitment of each lender thereunder to make loans and issue letters of credit to be terminated.
We may utilize derivative financial instruments to reduce our exposure to market risks from changes in interest rates on our variable rate indebtedness and we will be exposed to risks related to counterparty credit worthiness or non‑performance of these instruments.
We may enter into pay‑fixed interest rate swaps to limit our exposure to changes in variable interest rates. Such instruments may result in economic losses should interest rates decline to a point lower than our fixed rate commitments. We will be exposed to credit‑related losses, which could impact the results of operations in the event of fluctuations in the fair value of the interest rate swaps due to a change in the credit worthiness or non‑performance by the counterparties to the interest rate swaps.
Risks Related to the Magnus Term Loan
Fila KoreaCo., Ltd. (“Fila Korea”) and its wholly-owned subsidiary, Magnus Holdings Co., Ltd. (“Magnus”) have obligations under the Magnus Term Loan, and Fila Korea and/or Magnus may have obligations under any equity or debt used to refinance the Magnus Term Loan, that may be satisfied by a sale, foreclosure, liquidation or other transfer of our common stock, which could materially decrease the market value of our common stock and may result in a change of control of our company.
On October 28, 2016, Magnus purchased 14,818,720 shares of our common stock from certain other pre-IPO shareholders, which purchase was financed by Magnus entering into a term loan (the “Magnus Term Loan”) with certain Korean financial institutions (the “Magnus Lenders”) for Korean Won 309.1 billion (equivalent to approximately $256.9 million, using the exchange rate of $1.00 = Korean Won 1,203.08 as of December 31, 2016). Shares of our common stock are the only assets owned by Magnus. Unless refinanced on or prior to maturity, the Magnus Term Loan will mature on October 28, 2017. There are currently no arrangements or agreements in place with respect to any potential financing that may be necessary in connection with the payment of amounts due on the Magnus Term Loan at maturity. The Magnus Term Loan is secured by a pledge on all of our common stock owned by Magnus, except for 5% of our outstanding common stock owned by Magnus that is subject to a negative pledge under Fila Korea’s credit facility, which equals 48.1% of our outstanding common stock. Following the repayment of the Magnus Term Loan, Magnus may pledge all or a portion of our common stock that Magnus owns to secure any debt incurred in connection with the refinancing of the Magnus Term Loan or otherwise. If Fila Korea or Magnus are unable to raise the funds to pay the amounts due on the Magnus Term Loan at maturity (or an earlier date if subject to acceleration) on acceptable terms or at all, or if Fila Korea or Magnus are unable to meet their obligations under any debt used to refinance the Magnus Term Loan, the Magnus Lenders, or lenders of such debt, can foreclose on the pledged shares of our common stock.
In addition, it is expected that a portion of the interest payments on the Magnus Term Loan, and potential future dividend or interest obligations under any equity or debt used to refinance the Magnus Term Loan, will be funded using proceeds from dividends, if any, received on our common stock. See “Item 5. – Market for Registrant’s Common Equity, Related Stockholder Matters and Issuer Purchases of Equity Securities – Dividend Policy.” There can be no assurance that we will be able to make such dividend payments on our common stock. See “Item 1A. – Risk Factors – Risks Related to Ownership of Our Common Stock—We cannot assure you that we will pay dividends on our common stock, and our indebtedness and other factors could limit our ability to pay dividends on our common stock.” There can be no assurance that Magnus will be able to make the interest payments on the Magnus Term Loan, or any potential future dividend or interest obligations under any equity or debt used to refinance the Magnus Term Loan. If Magnus is unable to pay interest on the Magnus Term Loan on an interest payment date, the principal and accrued interest on the Magnus Term Loan becomes automatically due and payable. At maturity (or an earlier date if subject to acceleration), Magnus will be required to raise additional funds to pay the additional amounts of interest incurred, which it may be unable to do. There may be similar obligations under any financing used to refinance the Magnus Term Loan.
If Fila Korea or Magnus are unable to raise the funds necessary to pay the amount owed on the Magnus Term Loan at maturity (or an earlier date if subject to acceleration) and the Magnus Lenders foreclose on the pledged shares of
55
our common stock pursuant to the terms of the Magnus Term Loan, any such foreclosure may be undertaken in accordance with Korean law and may result, under certain circumstances, in the sale or other transfer of 48.1% of our common stock, which equals all of the shares pledged by Magnus to the Magnus Lenders. See “—The creditor and insolvency laws of Korea are different from U.S. laws and the outcome of any foreclosure, liquidation, bankruptcy or other restructuring proceeding may be unpredictable.” Any such sale could have a significant impact on our shareholding structure and our corporate governance and could materially decrease the market price of shares of our common stock. In addition, the perception that such a sale could occur could materially depress the market price of shares of our common stock. See “Item 1A. – Risk Factors – Risks Related to Ownership of Our Common Stock—Future sales, or the perception of future sales, by us or our existing shareholders in the public market could cause the market price for our common stock to decline.” Any such sale would be subject to certain lock‑up restrictions. There may be similar obligations under any financing used to refinance the Magnus Term Loan and failure to satisfy such obligations could result in the same consequences as discussed above.
In addition, prior to any foreclosure, Fila Korea may decide to sell or otherwise transfer all, or a significant portion, of our common stock owned by Magnus in order to meet the obligations of Magnus under the Magnus Term Loan or any future financing. Any such sale, or the perception that such a sale could occur, could have a significant impact on our shareholding structure and our corporate governance and could materially decrease the market price of shares of our common stock. In connection with our initial public offering, we entered into a registration rights agreement with Magnus and the Financial Investors. The Magnus Lenders will assume Magnus’ rights under the registration rights agreement in the event of a foreclosure or other transfer of the pledged shares of our common stock pursuant to the Magnus Term Loan.
Any of the potential sales, foreclosures, liquidations or other transfers of our common stock discussed above may result in a change of control under certain outstanding agreements, including as a result of the acquisition of a significant portion of our common stock by any individual, entity or group, which could result in a default under such agreements. Under the credit agreement, it is a change of control if any person (other than certain permitted parties, including Fila) becomes the beneficial owner of 35% or more of our outstanding common stock. In the event of a foreclosure on the pledged shares of our common stock under the Magnus Term Loan, if, in the reasonable opinion of the Magnus Lenders, foreclosure of 35% of our outstanding common stock less one share of our common stock, or the Foreclosure Threshold Amount, will be sufficient to fully satisfy the principal and interest of the Magnus Loan, only the Foreclosure Threshold Amount will be permitted for such foreclosure. If the Foreclosure Threshold Amount is insufficient to fully satisfy the principal and interest of the Magnus Loan, there will be no limitation on the amount of our pledged shares of common stock that may be foreclosed. As a result, if the Magnus Lenders or a third party were to acquire beneficial ownership of 35% or more of our outstanding common stock pursuant to an event of default under the Magnus Term Loan, it would result in a change of control under the credit agreement, which is an event of default that could result in the acceleration of all outstanding indebtedness and the termination of all commitments under the credit agreement and would allow the lenders under the credit agreement to enforce their rights with respect to the collateral granted by us, including the stock of our subsidiary, Acushnet Company. Upon the exercise of such rights, it is uncertain whether we and our subsidiary, Acushnet Company, would be able to refinance the indebtedness and replace the commitments under the credit agreement on comparable terms or at all. If we are unable to refinance the credit agreement, we may need to dispose of assets or operations or issue equity to obtain necessary funds to repay the outstanding indebtedness under the credit agreement. The resulting impairment of our liquidity position could also materially depress our stock price. In addition, a change of control under our outstanding equity award agreements and other employment arrangements may result in the vesting of outstanding equity awards and the acceleration of benefits or other payments under certain employment arrangements. A change of control may also result in a default or other negative consequence under our other outstanding agreements or instruments. See “Item 7. – Management’s Discussion and Analysis of Financial Condition and Results of Operations—Liquidity and Capital Resources— Indebtedness.”
Magnus’ ability to pay the amount owed on, or to refinance, the Magnus Term Loan prior to maturity may be affected by general economic, financial, competitive, legislative, regulatory, business and other factors beyond its control. We cannot assure you that future borrowings or equity financing will be available for the payment or refinancing of the Magnus Term Loan by Magnus. If Magnus is unable to pay the amount owed on, or to refinance, the Magnus Term Loan prior to maturity, it could have a material adverse effect on our business, financial condition, results of operations and the market price of our common stock. In addition, any inability by Magnus to take affirmative steps to refinance the Magnus Term Loan as the maturity date nears could also have a material adverse effect on our business, financial condition, results of operations and the market price of our common stock.
56
Magnus, which is wholly‑owned by Fila Korea, owns a majority of the equity interests in us, and the interests of the Magnus Lenders, may conflict with yours in the future.
Magnus, which is wholly‑owned by Fila Korea, beneficially owns approximately 53.1% of our common stock. Fila Korea will be able to control the election and removal of our directors and thereby determine, among other things, the payment of dividends, our corporate and management policies, including potential mergers or acquisitions or asset sales, amendment of our amended and restated certificate of incorporation or amended and restated bylaws, and other significant corporate transactions for so long as Magnus retains significant ownership of us. So long as Magnus continues to own a significant amount of our voting power, even if such amount is less than 50%, Fila Korea will continue to be able to strongly influence or effectively control our decisions. The interests of Fila Korea may not coincide with the interests of other holders of our common stock.
By controlling the election and removal of our directors, Fila Korea will also be able to determine the payment of dividends on our common stock. In light of its interest obligations under the Magnus Term Loan, and potential future dividend or interest obligations under any equity or debt used to refinance the Magnus Term Loan, Magnus may cause us to pay dividends on our common stock at times or in amounts that may not be in the best interest of us or other holders of our common stock. See “Item 1A. – Risk Factors – Risks Related to Ownership of our Common Stock—We cannot assure you that we will pay dividends on our common stock, and our indebtedness and other factors could limit our ability to pay dividends on our common stock.”
In the ordinary course of its business activities, Fila Korea and its affiliates may engage in activities where their interests conflict with our interests or those of our shareholders. Except as may be limited by applicable law, Fila Korea and its affiliates will not have any duty to refrain from competing directly with us or engaging, directly or indirectly, in the same business activities or similar business activities or lines of business in which we operate. Fila Korea and its affiliates also may pursue acquisition opportunities that may be complementary to our business and, as a result, those acquisition opportunities may not be available to us. In addition, Fila Korea and its affiliates may have an interest in us pursuing acquisitions, divestitures and other transactions that, in its judgment, could enhance its investment, even though such transactions might involve risks to you.
In addition, the concentration of our ownership held by Magnus may delay, deter or prevent possible changes in control of the company or a change in the composition of our board of directors and could preclude any unsolicited acquisition of us, which may reduce the value of an investment in our common stock.
Furthermore, the Magnus Lenders, as lenders under the Magnus Term Loan, and any potential future lenders of debt used to refinance the Magnus Term Loan, may also become direct owners of our common stock as a result of their exercise of remedies or otherwise. The interests of the Magnus Lenders, or such potential future lenders, may not coincide with the interests of other holders of our common stock.
We and our board of directors will have no power to direct or influence the affairs of Magnus. In particular, we will have no power with respect to the disposition of shares of our common stock by Fila Korea, Magnus or the Magnus Lenders (whether in connection with any exercise of remedies by the Magnus Lenders or otherwise).
Fila Korea has pledged the common stock of Magnus to the lenders under its credit facility. In addition, Fila Korea may pledge or borrow against additional shares of the common stock of Magnus. It is also possible that our other shareholders may in the future pledge shares of our common stock.
In the past, in order to fund the operations of or otherwise provide financing for its own business, Fila Korea and its affiliates pledged all of its interest in our common stock. Currently, Fila Korea has granted a security interest in 14.4% of the common stock of Magnus to the lenders under its credit facility. The shares of our common stock owned by Magnus are Magnus’ only assets. If Fila Korea defaults under its credit facility and the lenders foreclose on the pledged shares of Magnus common stock, they may seek to sell the pledged shares of Magnus common stock, or seek to acquire and to sell a portion of our common stock owned by Magnus. Any such sale, or the perception that such a sale could occur, could alter the voting power of Magnus directly and of us indirectly, and/or decrease the market price of shares of our common stock. The interests of the secured parties who exercise foreclosure may differ from those of other holders of our common stock.
57
In addition, it is possible that Fila Korea may in the future pledge additional shares of the common stock of Magnus, whether to help raise the proceeds necessary to pay amounts due on the Magnus Term Loan at maturity (or an earlier date if subject to acceleration) or for other purposes. Any such additional pledge could exacerbate the risks discussed above.
Certain of our other pre-IPO shareholders have in the past pledged, hypothecated or granted security interests in shares of our common stock that are issuable thereunder, as collateral for foreign currency hedges. Although these security interests were released prior to the closing of our initial public offering, it is possible that our pre-IPO shareholders may in the future pledge shares of our common stock. Any such pledge may relate to a significant amount of our common stock and if the secured party forecloses on such pledged shares, they may seek to sell the pledged shares. Any such sale, or the perception that such a sale could occur, could decrease the market price of shares of our common stock.
The creditor and insolvency laws of Korea are different from U.S. bankruptcy laws and the outcome of any foreclosure, liquidation, bankruptcy or other restructuring proceeding may be unpredictable.
Fila Korea and Magnus are organized under the laws of Korea. The creditor, bankruptcy, insolvency and other relevant laws of Korea are materially different from those of the United States. Any foreclosure, liquidation, bankruptcy or other restructuring proceeding involving Fila Korea or Magnus may be unpredictable and would not involve the same timing or procedures, and may not result in the same outcome, as a proceeding under U.S. law.
We are a “controlled company” within the meaning of the rules of the NYSE. As a result, we will qualify for exemptions from certain corporate governance requirements that would otherwise provide protection to shareholders of other companies.
Under the corporate governance standards of the NYSE rules, a company of which more than 50% of the voting power is held by an individual, group, or another company is a “controlled company” and may elect not to comply with certain corporate governance requirements, including:
|
· |
the requirement that a majority of our board of directors consist of “independent directors” as defined under the rules of the NYSE; |
|
· |
the requirement that we have a compensation committee that is composed entirely of independent directors with a written charter addressing the committee’s purpose and responsibilities; |
|
· |
the requirement that we have a nominating and corporate governance committee that is composed entirely of independent directors with a written charter addressing the committee’s purpose and responsibilities; and |
|
· |
the requirement for an annual performance evaluation of the compensation and nominating and corporate governance committees. |
Magnus, which is wholly‑owned by Fila Korea, controls 39,345,151 shares, or approximately 52.8%, of our common stock. As a result, we qualify as a “controlled company” within the meaning of the corporate governance standards of the NYSE. Although we do not currently avail ourselves of exemptions available to controlled companies and do not currently expect to avail ourselves of these exemptions, we may utilize one or more of these exemptions in the future. As a result, we may not have a majority of independent directors, our nominating/corporate governance committee and compensation committee may not consist entirely of independent directors, and such committees will not be subject to annual performance evaluations. Accordingly, you may not have the same protections afforded to shareholders of companies that are subject to all of the corporate governance requirements of the NYSE.
In addition, the NYSE adopted listing standards, which were approved by the SEC in 2013, that impose additional requirements pertaining to compensation committee independence and the role and disclosure of compensation consultants and other advisers to the compensation committee that require, among other things, that:
|
· |
a compensation committee be composed of fully independent directors, as determined pursuant to new independence requirements; |
58
|
· |
a compensation committee be explicitly charged with hiring and overseeing compensation consultants, legal counsel, and other committee advisors; and |
|
· |
a compensation committee be required to consider, when engaging compensation consultants, legal counsel, or other advisors, certain independence factors, including factors that examine the relationship between the consultant or advisor’s employer and us. |
Although we do not currently avail ourselves of the exemptions from these compensation committee requirements or intend to do so, as a “controlled company,” we are not subject to these compensation committee independence requirements.
Risks Related to Ownership of Our Common Stock
We have incurred and will continue to incur increased costs as a result of operating as a public company, and our management is required to devote substantial time to new compliance matters, which could lower our profits or make it more difficult to run our business.
As a newly public company, we have and will continue to incur significant legal, accounting and other expenses that we have not incurred as a private company, including costs associated with public company reporting requirements and costs of recruiting and retaining non‑executive directors. We also have incurred and will incur costs associated with the Sarbanes‑Oxley Act and related rules implemented by the SEC and the NYSE. The expenses incurred by public companies generally for reporting and corporate governance purposes have been increasing. We expect these rules and regulations to increase our legal and financial compliance costs and to make some activities more time‑consuming and costly, although we are currently unable to estimate these costs with any degree of certainty. Our management will need to devote a substantial amount of time to ensure that we comply with all of these requirements. These laws and regulations also could make it more difficult or costly for us to obtain certain types of insurance, including director and officer liability insurance, and we may be forced to accept reduced policy limits and coverage or incur substantially higher costs to obtain the same or similar coverage. These laws and regulations could also make it more difficult for us to attract and retain qualified persons to serve on our board of directors, our board committees or as our executive officers. Furthermore, if we are unable to satisfy our obligations as a public company, we could be subject to delisting of our common stock, fines, sanctions and other regulatory action and potentially civil litigation.
The market price of shares of our common stock may be volatile, which could cause the value of your investment to decline.
The market price of our common stock may be highly volatile and could be subject to wide fluctuations. Securities markets worldwide experience significant price and volume fluctuations. This market volatility, as well as general economic, market or political conditions, could reduce the market price of shares of our common stock in spite of our operating performance. In addition, our results of operations could be below the expectations of public market analysts and investors due to a number of potential factors, including variations in our quarterly results of operations, additions or departures of key management personnel, failure to meet analysts’ earnings estimates, publication of research reports about our industry, litigation and government investigations, changes or proposed changes in laws or regulations or differing interpretations or enforcement thereof affecting our business or the golf industry, adverse market reaction to any indebtedness we may incur or securities we may issue in the future, changes in market valuations of similar companies or speculation in the press or investment community, announcements by our competitors of significant contracts, acquisitions, dispositions, strategic partnerships, joint ventures or capital commitments, adverse publicity about our industry in or individual scandals, and in response the market price of shares of our common stock could decrease significantly.
In the past few years, stock markets have experienced significant price and volume fluctuations. In the past, following periods of volatility in the overall market and the market price of a company’s securities, securities class action litigation has often been instituted against these companies. This litigation, if instituted against us, could result in substantial costs and a diversion of our management’s attention and resources.
59
We have identified material weaknesses in our internal control over financial reporting, and if we are unable to maintain effective internal controls, we may not be able to produce timely and accurate financial statements, which could have a material adverse effect on our business and stock price.
In connection with the audit of our consolidated financial statements for the years ended December 31, 2016, 2015 and 2014, we and our independent registered public accounting firm identified material weaknesses in our internal control over financial reporting. A material weakness is a deficiency, or a combination of deficiencies, in internal control over financial reporting, such that there is a reasonable possibility that a material misstatement of the company’s annual or interim consolidated financial statements will not be prevented or detected on a timely basis. We did not have in place an effective control environment with a sufficient number of accounting personnel with the appropriate technical training in, and experience with, GAAP to allow for a detailed review of complex accounting transactions that would identify errors in a timely manner. Further, we did not design effective control activities relating to formally documented and implemented accounting processes and procedures across business cycles, including income taxes, derivatives, certain compensation and benefits, certain revenue transactions, and functional currency, and internal communication protocols related to matters impacting income tax and benefit accounts. We also did not maintain effective segregation of duties in our internal controls over financial reporting. The lack of adequate accounting personnel and formal processes and procedures resulted in several audit adjustments to our consolidated financial statements for the years ended December 31, 2016, 2015 and 2014 and the interim periods in 2016.
We are currently in the process of remediating these material weaknesses and are taking steps that we believe will address the underlying causes of the material weaknesses. We have enlisted the help of external advisors to provide assistance in the areas of financial accounting and tax accounting in the short term, and are evaluating the longer term resource needs of our various financial functions. In addition, we have engaged an accounting firm to evaluate and document the design and operating effectiveness of our internal controls and assist with the remediation and implementation of our internal controls as required. These remediation measures may be time consuming, costly, and might place significant demands on our financial and operational resources.
In addition, we have begun performing system and process evaluations and testing of our internal control over financial reporting to allow management and our independent registered public accounting firm to report on the effectiveness of our internal control over financial reporting, as required by Section 404 of the Sarbanes‑Oxley Act, with auditor attestation of the effectiveness of our internal controls, beginning with our annual report on Form 10‑K for the year ended December 31, 2017. Our testing, or the subsequent testing by our independent registered public accounting firm, may reveal deficiencies in our internal controls over financial reporting that are deemed to be additional material weaknesses, in addition to the material weaknesses described above. Each of the material weaknesses described above or any newly identified material weakness could result in a misstatement of our consolidated financial statements or disclosures that would result in a material misstatement of our annual or quarterly consolidated financial statements that would not be prevented or detected.
If (i) we fail to effectively remediate deficiencies in internal control over financial reporting, (ii) we identify additional material weaknesses in our internal control over financial reporting, (iii) we are unable to comply with the requirements of Section 404 in a timely manner or assert that our internal control over financial reporting is effective, or (iv) our independent registered public accounting firm is unable to express an opinion as to the effectiveness of our internal control over financial reporting or expresses an opinion that is qualified or adverse, investors may lose confidence in the accuracy and completeness of our financial statements which could cause the market price of our common stock to decline, and we could become subject to sanctions or investigations by the stock exchange upon which our common stock is listed, the SEC or other regulatory authorities, and we could be delayed in delivering financial statements, which could result in a default under the agreements governing our indebtedness.
We cannot assure you that we will pay dividends on our common stock, and our indebtedness and other factors could limit our ability to pay dividends on our common stock.
We intend to pay cash dividends on our common stock, subject to the discretion of our board of directors and our compliance with applicable law, and depending on, among other things, our results of operations, capital requirements, financial condition, contractual restrictions, restrictions in our debt agreements and in any equity securities, business prospects and other factors that our board of directors may deem relevant. Because we are a holding company and have no direct operations, we expect to pay dividends, if any, only from funds we receive from our subsidiaries, which may further restrict our ability to pay dividends as a result of the laws of their jurisdiction of
60
organization, agreements of our subsidiaries or covenants under any existing and future outstanding indebtedness we or our subsidiaries incur. Certain of our existing agreements governing indebtedness, including our credit agreement, restrict our ability to pay dividends on our common stock. We expect that any future agreements governing indebtedness will contain similar restrictions. For more information, see “Item 5. – Market for Registrant’s Common Equity, Related Stockholder Matters and Issuer Purchases of Equity Securities – Dividend Policy.”
Our dividend policy entails certain risks and limitations, particularly with respect to our liquidity. By paying cash dividends rather than investing that cash in our business or repaying debt, we risk, among other things, slowing the pace of our growth and having insufficient cash to fund our operations or unanticipated capital expenditures or limiting our ability to incur additional borrowings.
Although we expect to pay dividends according to our dividend policy, we may not pay dividends according to our policy, or at all, if, among other things, we do not have the cash necessary to pay our intended dividends.
The declaration and payment of dividends will be determined at the discretion of our board of directors, acting in compliance with applicable law and contractual restrictions. However, our board of directors is determined by Magnus, which is wholly‑owned by Fila Korea, which controls a majority of the voting power of all outstanding shares of our common stock. Accordingly, the decision to declare and pay dividends on our common stock in the future, as well as the amount of each such dividend payment, may also depend on the amounts Magnus needs to fund the interest payments on the Magnus Term Loan, other amounts due in connection with the Magnus Term Loan or any potential future dividend or interest obligations under any equity or debt used to refinance the Magnus Term Loan.
Acushnet Holdings Corp. is a holding company with no operations of its own and, as such, it depends on its subsidiaries for cash to fund all of its operations and expenses, including future dividend payments, if any.
Our operations are conducted almost entirely through our subsidiaries and our ability to generate cash to make future dividend payments, if any, is highly dependent on the earnings and the receipt of funds from our subsidiaries via dividends or intercompany loans, which may be restricted as a result of the laws of the jurisdiction of organization of our subsidiaries, agreements of our subsidiaries or covenants under any existing and future outstanding indebtedness we or our subsidiaries incur.
You may be diluted by the future issuance of additional common stock in connection with our incentive plans, acquisitions or otherwise.
As of December 31, 2016, we had 425,906,402 shares of common stock authorized but unissued. Our amended and restated certificate of incorporation authorizes us to issue these shares of common stock and securities convertible into, exchangeable for, or exercisable into our common stock for the consideration and on the terms and conditions established by our board of directors in its sole discretion, whether in connection with acquisitions or otherwise. We have reserved 8,190,000 shares for issuance under our 2015 Incentive Plan. Any shares of common stock that we issue, including to settle our EARs or under our 2015 Incentive Plan or other equity incentive plans that we may adopt in the future, would dilute the percentage ownership held by our existing shareholders.
Future sales, or the perception of future sales, by us or our existing shareholders in the public market could cause the market price for our common stock to decline.
The sale of substantial amounts of shares of our common stock in the public market, or the perception that such sales could occur, including sales by our existing shareholders, could harm the prevailing market price of shares of our common stock. These sales, or the possibility that these sales may occur, also might make it more difficult for us to sell equity securities in the future at a time and at a price that we deem appropriate. As of December 31, 2016, a total of 74,093,598 shares of our common stock were outstanding. Of the outstanding shares, 22,233,332 shares of common stock are tradable without restriction or further registration under the Securities Act, except that any shares held by our affiliates, as that term is defined under Rule 144 of the Securities Act, may be sold only in compliance with the applicable limitations under the federal securities laws.
The remaining outstanding 51,860,266 shares of common stock held by certain shareholders are subject to certain restrictions on resale. We, our executive officers, directors, and all of our pre-IPO shareholders have signed lock‑up agreements with the underwriters in connection with our initial public offering that, subject to certain customary
61
exceptions, restrict the sale of the shares of our common stock and certain other securities held by them for 180 days following October 27, 2016.
Upon the expiration of the lock‑up agreements described above, all of such 51,860,266 shares of common stock will be eligible for resale in a public market, subject, in the case of shares held by our affiliates, to volume, manner of sale and other limitations under Rule 144.
We have filed an effective registration statement on Form S‑8 under the Securities Act to register shares of our common stock or securities convertible into or exchangeable for shares of our common stock issued pursuant to our 2015 Incentive Plan. Accordingly, shares registered under such registration statement will be available for sale in the open market. Our current registration statement on Form S‑8 covers 8,190,000 shares of our common stock issuable pursuant to our 2015 Incentive Plan.
As restrictions on resale end, the market price of our shares of common stock could drop significantly if the holders of these restricted shares sell them or are perceived by the market as intending to sell them. These factors could also make it more difficult for us to raise additional funds through future offerings of our shares of common stock or other securities.
Anti‑takeover provisions in our organizational documents and Delaware law might discourage or delay acquisition attempts for us that you might consider favorable.
Our amended and restated certificate of incorporation and amended and restated bylaws contain provisions that may make the merger or acquisition of the Company more difficult without the approval of our board of directors. Among other things:
|
· |
although we do not have a stockholder rights plan, these provisions would allow us to authorize the issuance of undesignated preferred stock in connection with a stockholder rights plan or otherwise, the terms of which may be established and the shares of which may be issued without stockholder approval, and which may include super voting, special approval, dividend, or other rights or preferences superior to the rights of the holders of common stock; |
|
· |
these provisions provide for a classified Board of Directors with staggered three‑year terms; |
|
· |
these provisions require advance notice for nominations of directors by stockholders and for stockholders to include matters to be considered at our annual meetings; |
|
· |
these provisions prohibit stockholder action by written consent; |
|
· |
these provisions provide for the removal of directors only for cause and only upon affirmative vote of holders of at least 66⅔% of the shares of common stock entitled to vote generally in the election of directors if Magnus and its affiliates hold less than 50% of our outstanding shares of common stock; and |
|
· |
these provisions require the amendment of certain provisions only by the affirmative vote of at least 66⅔% of the shares of common stock entitled to vote generally in the election of directors if Magnus and its affiliates hold less than 50% of our outstanding shares of common stock. |
Further, as a Delaware corporation, we are also subject to provisions of Delaware law, which may impair a takeover attempt that our shareholders may find beneficial. These anti‑takeover provisions and other provisions under Delaware law could discourage, delay or prevent a transaction involving a change in control of the Company, including actions that our shareholders may deem advantageous, or negatively affect the trading price of our common stock. These provisions could also discourage proxy contests and make it more difficult for you and other shareholders to elect directors of your choosing and to cause us to take other corporate actions you desire.
62
If securities analysts do not publish research or reports about our business or if they downgrade our stock or our sector, our stock price and trading volume could decline.
The trading market for our common stock relies in part on the research and reports that industry or financial analysts publish about us or our business or industry. We do not control these analysts. Furthermore, if one or more of the analysts who do cover us downgrade our stock or our industry, or the stock of any of our competitors, or publish inaccurate or unfavorable research about our business or industry, the price of our stock could decline. If one or more of these analysts ceases coverage of us or fails to publish reports on us regularly, we could lose visibility in the market, which in turn could cause our stock price or trading volume to decline.
ITEM 1B. UNRESOLVED STAFF COMMENTS
None
63
Our facilities are located worldwide as shown in the table below.
|
Location |
|
Type |
|
Facility Size(1) |
|
Leased/Owned |
|
Fairhaven, Massachusetts |
|
Headquarters and Golf Ball R&D |
|
222,720 |
|
Owned |
|
Golf Balls |
|
|
|
|
|
|
|
North Dartmouth, Massachusetts |
|
Golf ball manufacturing |
|
179,602 |
|
Owned |
|
New Bedford, Massachusetts |
|
Golf ball manufacturing |
|
244,091 |
|
Owned |
|
Amphur Pluakdaeng Rayong, Thailand |
|
Golf ball manufacturing |
|
230,003 |
|
Owned |
|
New Bedford, Massachusetts |
|
Golf ball customization and distribution center |
|
438,007 |
|
Owned |
|
Fairhaven, Massachusetts |
|
Golf ball packaging |
|
49,580 |
|
Owned |
|
New Bedford, Massachusetts |
|
Golf ball advanced engineering and ball cavity manufacturing |
|
34,000 |
|
Leased |
|
Golf Clubs, Wedges and Putters |
|
|
|
|
||
|
Carlsbad, California |
|
Golf club assembly and R&D |
|
161,310 |
|
Leased |
|
San Marcos, California |
|
Putter research |
|
19,200 |
|
Leased |
|
Encinitas, California |
|
Putter fitting and sales |
|
3,754 |
|
Leased |
|
Tochigi, Japan |
|
Golf club assembly |
|
20,376 |
|
Leased |
|
FootJoy |
|
|
|
|
|
|
|
Fujian, China (40% owned joint venture) |
|
Golf shoe manufacturing and distribution center |
|
525,031 |
|
Building Owned/Land Leased |
|
Brockton, Massachusetts |
|
Golf shoe R&D, custom glove assembly, apparel embroidery and distribution center |
|
146,000 |
|
Owned |
|
Sriracha Chonburi, Thailand |
|
Golf glove manufacturing |
|
112,847 |
|
Building Owned/Land Leased |
|
Sales Offices and Distribution Centers (used by multiple reportable segments) |
|
|
||||
|
Fairhaven, Massachusetts |
|
East Coast distribution center |
|
185,370 |
|
Owned |
|
Vista, California |
|
West Coast distribution center and golf bag embroidery |
|
102,319 |
|
Leased |
|
Cambridgeshire, United Kingdom |
|
Sales office and distribution center, as well as golf club assembly and golf ball customization |
|
156,326 |
|
Owned |
|
Helmond, The Netherlands |
|
Sales office and distribution center |
|
69,965 |
|
Leased |
|
Victoria, Australia |
|
Sales office and distribution center, as well as golf club assembly |
|
37,027 |
|
Leased |
|
Ontario, Canada |
|
Sales office and distribution center, as well as golf ball customization |
|
102,057 |
|
Leased |
|
Shenzhen, China |
|
Distribution center and golf ball customization |
|
73,194 |
|
Leased |
|
Randburg, South Africa |
|
Sales office and distribution center, as well as golf club assembly |
|
25,060 |
|
Leased |
64
|
Location |
|
Type |
|
Facility Size(1) |
|
Leased/Owned |
|
Icheon-si, Korea |
|
Distribution center, golf ball customization and golf club assembly |
|
155,151 |
|
Leased |
|
Product Testing and Fitting Centers (Golf Balls and Golf Clubs) |
|
|
||||
|
Acushnet, Massachusetts |
|
East Coast product testing and fitting for golf balls and golf clubs |
|
22 acres |
|
Owned |
|
|
|
|
|
|
|
|
|
Oceanside, California |
|
West Coast product testing and fitting for golf balls and golf clubs |
|
30 acres |
|
Owned |
|
|
|
|
|
|
|
|
|
(1) |
Facility size represents square footage of the building, unless otherwise noted. |
We have additional sales offices and facilities in Hawaii, New Zealand, Malaysia, Singapore, Hong Kong, Taiwan, Japan, Korea, Thailand, Sweden, France, Germany and Switzerland. In the opinion of the Company’s management, the Company’s properties are adequate and suitable for its business as presently conducted and are adequately maintained.
We are defendants in lawsuits associated with the normal conduct of our businesses and operations. It is not possible to predict the outcome of the pending actions, and, as with any litigation, it is possible that some of these actions could be decided unfavorably. We believe that there are meritorious defenses to these actions and that these actions will not have a material adverse effect upon our results of operations, cash flows, or financial condition. These actions are being vigorously contested.
ITEM 4. MINE SAFETY DISCLOSURES
Not applicable.
EXECUTIVE OFFICERS OF THE REGISTRANT
Executive Officers
Set forth below is information concerning the Company’s executive officers as of March 30, 2017.
|
Name |
|
Age |
|
Position |
|
|
Walter (Wally) Uihlein |
|
67 |
|
President and Chief Executive Officer and Director Nominee |
|
|
David Maher |
|
49 |
|
Chief Operating Officer |
|
|
Mary Lou Bohn |
|
56 |
|
President, Titleist Golf Balls |
|
|
Steven Pelisek |
|
56 |
|
President, Titleist Golf Clubs |
|
|
John (Jay) Duke, Jr. |
|
48 |
|
President, Titleist Golf Gear |
|
|
Christopher Lindner |
|
48 |
|
President, FootJoy |
|
|
William Burke |
|
58 |
|
Executive Vice President, Chief Financial Officer and Treasurer |
|
|
Dennis Doherty |
|
59 |
|
Executive Vice President, Chief Human Resources Officer |
|
|
Joseph Nauman |
|
64 |
|
Executive Vice President, Chief Legal and Administrative Officer |
|
Walter (Wally) Uihlein, 67, joined the company in 1976 and was appointed President and Chief Executive Officer of Acushnet Company in 1995 and was appointed President and Chief Executive Officer of Acushnet Holdings Corp. in May 2016. Mr. Uihlein has served as a member of the board of directors of Acushnet Company, our operating subsidiary, since 1984, and has been a member of our Board of Directors from the date of our initial public offering. In 2005, Mr. Uihlein received the PGA of America’s Distinguished Service Award, the organization’s highest honor. Mr. Uihlein was selected to serve as a director because he is our President and Chief Executive Officer and has extensive
65
experience as an executive in the golf industry, as well as due to his experience as a director of Acushnet Company since 2011.
David Maher, 49, joined the company in 1991 and was appointed Chief Operating Officer in June 2016. Prior to that, Mr. Maher was Senior Vice President, Titleist Worldwide Sales and Global Operations from February 2016 to June 2016 and Vice President, Titleist U.S. Sales from 2001 to January 2016.
Mary Lou Bohn, 56, joined the company in 1987 and was appointed President, Titleist Golf Balls in June 2016. Prior to that, Ms. Bohn was Executive Vice President, Titleist Golf Balls and Titleist Communications from February 2016 to June 2016, Vice President, Golf Ball Marketing and Titleist Communications from 2010 to January 2016 and Vice President, Advertising and Communications from 2000 to 2010.
Steven Pelisek, 56, joined the company in 1993 and was appointed President, Titleist Golf Clubs in March 2016. From 2008 to March 2016, he was General Manager, Titleist Golf Clubs. Prior to that, Mr. Pelisek served as Vice President, Club Sales for both the Titleist and Cobra Club brands.
John (Jay) Duke, Jr., 48, joined the company in 2014 and was appointed President, Titleist Golf Gear in 2014. Prior to that, Mr. Duke worked at Hasbro, Inc., a multinational toy and board game company, from 2012 to 2014 where he was Vice President and Global Franchise Leader for Transformers Global Brand. Prior to Hasbro, Mr. Duke was President of Karhu Holdings BV from 2008 to 2012 and prior to that he held various general management positions with Converse Inc. (a subsidiary of NIKE, Inc.). Mr. Duke also spent time earlier in his career working for Morgan Stanley and Reebok.
Christopher Lindner, 48, joined the company in August 2016 as President of FootJoy. Prior to that, Mr. Lindner worked at Wolverine World Wide Inc., an American footwear manufacturer, from 2010 to August 2016 where he was President of Keds from 2014 to August 2016, Chief Marketing Officer and Senior Vice President of Business Development for Sperry in 2014 and Chief Marketing Officer and Senior Vice President of North America Sales for Saucony from 2010 to 2014. Prior to 2010, Mr. Lindner held various positions with NIKE, including as Vice President of Global Marketing for Converse and Vice President of Global Marketing for Bauer Hockey (both NIKE subsidiaries), and leadership roles with 800.com, Electronic Arts and Rollerblade.
William Burke, 58, joined the company in 1997 and was appointed Executive Vice President, Chief Financial Officer and Treasurer in April 2016 after serving as Senior Vice President and Chief Financial Officer of Acushnet Company since 2003. Prior to that, he served as Vice President and Controller of Acushnet Company. Before joining the company, Mr. Burke held various finance positions at predecessor parent companies Fortune Brands Inc. and American Brands Inc.
Dennis Doherty, 59, joined the company in 1994 and was appointed Executive Vice President, Chief Human Resources Officer in June 2016 after serving as Senior Vice President, Human Resources since 2000. Before joining Acushnet Company, Mr. Doherty held human resource positions at American Brands Inc. and Revlon Health Care Group.
Joseph Nauman, 64, joined the company in 2000 and was appointed Executive Vice President, Chief Legal and Administrative Officer in June 2016. Prior to that, Mr. Nauman was Executive Vice President, Corporate and Legal from 2005 to June 2016. Prior to 2000, Mr. Nauman held legal positions at Fortune Brands Inc. and Chadbourne & Parke LLP.
66
ITEM 5. MARKET FOR REGISTRANT’S COMMON EQUITY, RELATED STOCKHOLDER MATTERS AND ISSUER PURCHASES OF EQUITY SECURITIES
Market Information
Our common stock has been listed on the New York Stock Exchange (the “NYSE”) under the symbol “GOLF” since October 28, 2016. Prior to that date, there was no public trading market for our common stock. Our initial public offering was priced at $17.00 per share on October 27, 2016.
The following table sets forth for the periods indicated the high and low sales prices of our common stock as reported on the NYSE:
|
|
|
Sales Price |
||||
|
|
|
High |
|
Low |
||
|
Fiscal Year Ending December 31, 2016: |
|
|
|
|
|
|
|
Fourth Quarter (from October 28, 2016) |
|
$ |
22.31 |
|
$ |
16.90 |
On March 24, 2017, the last reported sales price of our common stock on the NYSE was $17.76 per share and there were approximately nine record holders of our common stock.
Performance Graph
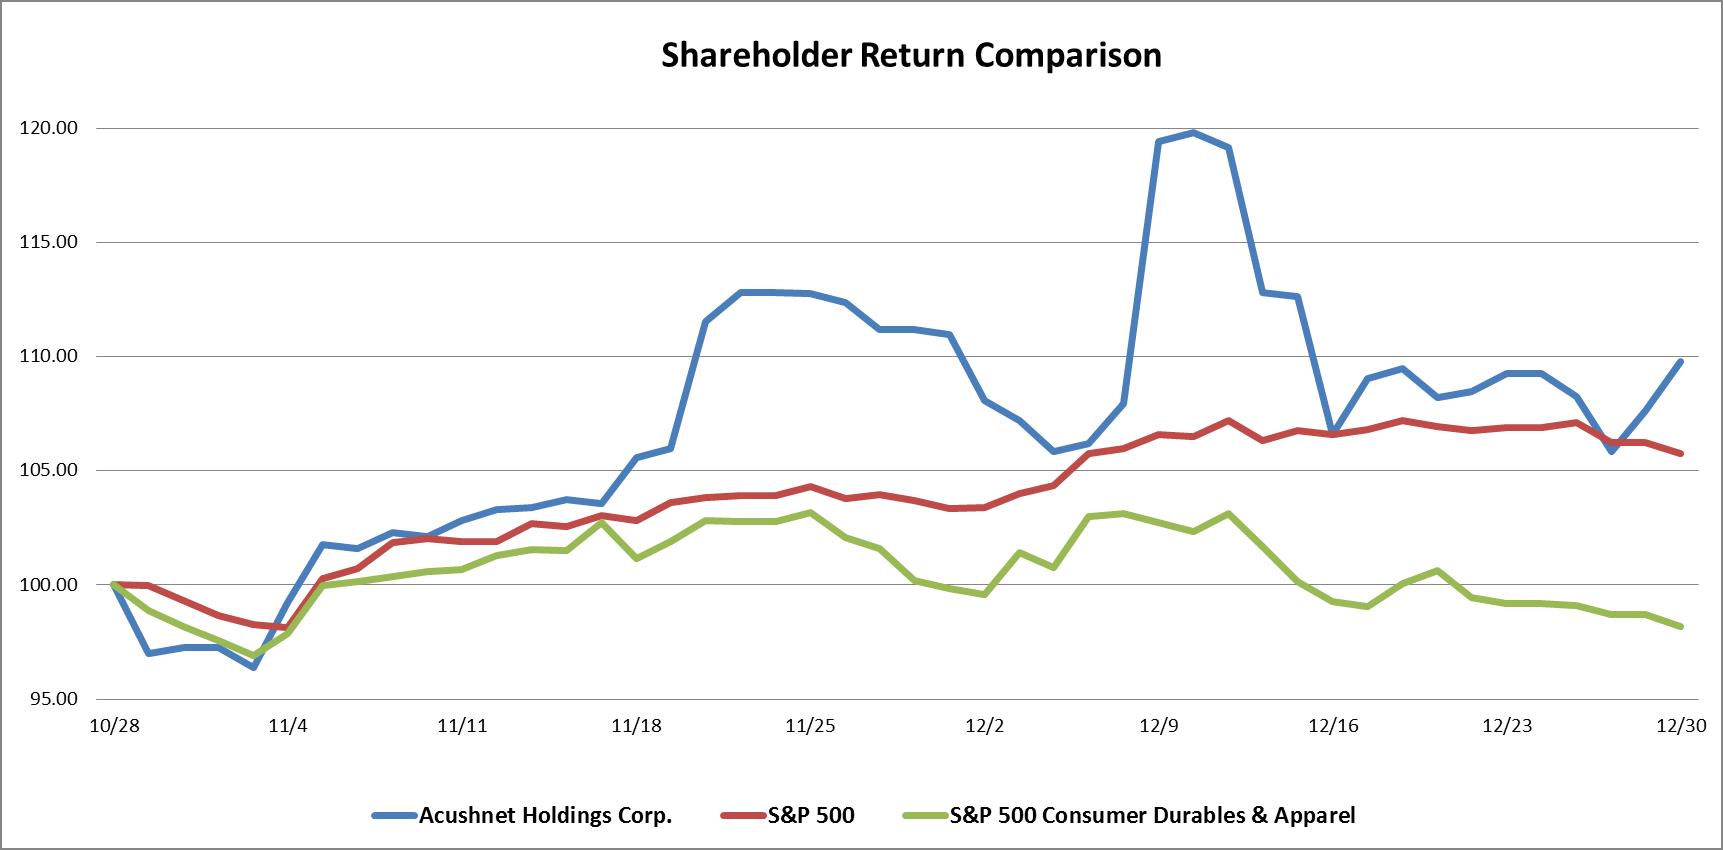
Recent Sales of Unregistered Securities
None.
Dividend Policy
We declared our first quarterly dividend of $0.12 per share in March 2017 with both dividend record and payment dates in April 2017. We expect to pay future quarterly cash dividends on our common stock, subject to the discretion of our board of directors and our compliance with applicable law, and depending on, among other things, our results of operations, capital requirements, financial condition, contractual restrictions, restrictions in our debt agreements and in any equity securities, business prospects and other factors that our board of directors may deem relevant. Our dividend policy may be changed or terminated in the future at any time without advance notice.
67
We are a holding company and substantially all of our operations are carried out by our operating subsidiary, Acushnet Company, and its subsidiaries. Because we are a holding company, our ability to pay dividends depends on our receipt of cash dividends from our operating subsidiary, Acushnet Company, and its subsidiaries, which may further restrict our ability to pay dividends as a result of the laws of their jurisdiction of organization, agreements of our subsidiaries or covenants under any existing and future outstanding indebtedness we or our subsidiaries incur.
Certain of our agreements governing indebtedness, including our credit agreement, restrict our ability to pay dividends on our common stock. We expect that any future agreements governing indebtedness will contain similar restrictions. See “See Item 7. — Management’s Discussion and Analysis of Financial Condition and Results of Operations—Liquidity and Capital Resources” and “– Indebtedness.”
Our dividend policy entails certain risks and limitations, particularly with respect to our liquidity. By paying cash dividends rather than investing that cash or repaying debt, we risk, among other things, slowing the pace of our growth and having insufficient cash to fund our operations or unanticipated capital expenditures or limiting our ability to incur additional borrowings.
Although we expect to pay dividends according to our dividend policy, we may not pay dividends according to our policy, or at all, if, among other things, we do not have the cash necessary to pay our intended dividends.
The declaration and payment of dividends will be determined at the discretion of our board of directors, acting in compliance with applicable law and contractual restrictions. However, our board of directors is determined by Magnus, which is wholly‑owned by Fila Korea, which controls a majority of the voting power of all outstanding shares of our common stock. Accordingly, the decision to declare and pay dividends on our common stock in the future, as well as the amount of each such dividend payment, may also depend on the amounts Magnus needs to fund the interest payments on the Magnus Term Loan, other amounts due in connection with the Magnus Term Loan or any potential future dividend or interest obligations under any equity or debt used to refinance the Magnus Term Loan.
We did not declare or pay any dividends on our common stock in 2016, 2015 or 2014.
Issuer Purchases of Equity Securities
None.
68
ITEM 6. SELECTED CONSOLIDATED FINANCIAL DATA
You should read the selected consolidated financial data below together with the consolidated financial statements and related notes thereto appearing elsewhere in this report, as well as “Item 7. – Management’s Discussion and Analysis of Financial Condition and Results of Operations” and the other financial information included elsewhere in this report.
We have derived the consolidated statement of operations data for the years ended December 31, 2016, 2015 and 2014 and the consolidated balance sheet data as of December 31, 2016 and 2015 presented below from our audited consolidated financial statements included elsewhere in this report. We have derived the consolidated statement of operations data for the years ended December 31, 2013 and 2012 and our consolidated balance sheet data as of December 31, 2014, 2013 and 2012 presented below from our audited consolidated financial statements which are not included in this report. Our historical audited results are not necessarily indicative of the results that should be expected in any future period.
|
|
|
Year ended December 31, |
|||||||||||||
|
|
|
2016 |
|
2015 |
|
2014 |
|
2013 |
|
2012 |
|||||
|
|
|
(in thousands, except share and per share data) |
|||||||||||||
|
Consolidated Statements of Operations Data: |
|
|
|
|
|
|
|
|
|
|
|
|
|
|
|
|
Net sales |
|
$ |
1,572,275 |
|
$ |
1,502,958 |
|
$ |
1,537,610 |
|
$ |
1,477,219 |
|
$ |
1,451,058 |
|
Cost of goods sold |
|
|
773,550 |
|
|
727,120 |
|
|
779,678 |
|
|
744,090 |
|
|
753,096 |
|
Gross profit |
|
|
798,725 |
|
|
775,838 |
|
|
757,932 |
|
|
733,129 |
|
|
697,962 |
|
Operating expenses: |
|
|
|
|
|
|
|
|
|
|
|
|
|
|
|
|
Selling, general and administrative |
|
|
600,804 |
|
|
604,018 |
|
|
602,755 |
|
|
568,421 |
|
|
566,999 |
|
Research and development |
|
|
48,804 |
|
|
45,977 |
|
|
44,243 |
|
|
42,152 |
|
|
41,598 |
|
Intangible amortization |
|
|
6,608 |
|
|
6,617 |
|
|
6,687 |
|
|
6,704 |
|
|
6,733 |
|
Restructuring and other charges |
|
|
1,673 |
|
|
1,643 |
|
|
— |
|
|
955 |
|
|
2,477 |
|
Income from operations |
|
|
140,836 |
|
|
117,583 |
|
|
104,247 |
|
|
114,897 |
|
|
80,155 |
|
Interest expense, net |
|
|
49,908 |
|
|
60,294 |
|
|
63,529 |
|
|
68,149 |
|
|
69,185 |
|
Other (income) expense, net |
|
|
1,706 |
|
|
25,139 |
|
|
(1,348) |
|
|
5,285 |
|
|
(14,729) |
|
Income before income taxes |
|
|
89,222 |
|
|
32,150 |
|
|
42,066 |
|
|
41,463 |
|
|
25,699 |
|
Income tax expense |
|
|
39,707 |
|
|
27,994 |
|
|
16,700 |
|
|
17,150 |
|
|
7,555 |
|
Net income |
|
|
49,515 |
|
|
4,156 |
|
|
25,366 |
|
|
24,313 |
|
|
18,144 |
|
Less: Net income (loss) attributable to noncontrolling interests |
|
|
(4,503) |
|
|
(5,122) |
|
|
(3,809) |
|
|
(4,677) |
|
|
(4,271) |
|
Net income (loss) attributable to Acushnet Holdings Corp. |
|
$ |
45,012 |
|
$ |
(966) |
|
$ |
21,557 |
|
$ |
19,636 |
|
$ |
13,873 |
|
Dividends earned by preferred shareholders |
|
|
(11,576) |
|
|
(13,785) |
|
|
(13,785) |
|
|
(13,785) |
|
|
(13,786) |
|
Allocation of undistributed earnings to preferred shareholders |
|
|
(10,247) |
|
|
— |
|
|
(3,866) |
|
|
(3,225) |
|
|
(53) |
|
Net income (loss) attributable to common shareholders—basic |
|
|
23,189 |
|
|
(14,751) |
|
|
3,906 |
|
|
2,626 |
|
|
34 |
|
Net income (loss) attributable to common shareholders—diluted(1) |
|
$ |
23,189 |
|
$ |
(14,751) |
|
$ |
3,906 |
|
$ |
2,626 |
|
$ |
34 |
|
Per Share Data: |
|
|
|
|
|
|
|
|
|
|
|
|
|
|
|
|
Net income (loss) per common share attributable to Acushnet Holdings Corp.—basic(2) |
|
$ |
0.74 |
|
$ |
(0.74) |
|
$ |
0.23 |
|
$ |
0.19 |
|
$ |
— |
|
Net income (loss) per common share attributable to Acushnet Holdings Corp.—diluted(3) |
|
|
0.62 |
|
|
(0.74) |
|
|
0.23 |
|
|
0.19 |
|
|
— |
|
Weighted average number of common shares—basic(2) |
|
|
31,247,643 |
|
|
19,939,293 |
|
|
16,716,825 |
|
|
13,471,308 |
|
|
10,322,055 |
|
Weighted average number of common shares—diluted(3) |
|
|
64,323,742 |
|
|
19,939,293 |
|
|
16,716,825 |
|
|
13,471,308 |
|
|
10,322,055 |
69
|
(1) |
Reflects the impact to net income (loss) attributable to common shareholders of dilutive securities. Diluted net income (loss) attributable to common shareholders for each of the years ended December 31, 2015, 2014, 2013 and 2012 does not include the effects of (i) the conversion of our Series A 7.5% redeemable convertible preferred stock (the “Convertible Preferred Stock”) to common shares, which Convertible Preferred Stock automatically converted into an aggregate of 16,542,243 shares of our common stock prior to the closing of our initial public offering, (ii) the conversion of our 7.5% convertible notes due 2021 (the “Convertible Notes”) to common shares, which Convertible Notes automatically converted into an aggregate of 32,624,820 shares of our common stock prior to the closing of our initial public offering, (iii) the exercise by Fila Korea of our common stock warrants into an aggregate of 3,105,279 shares of our common stock which occurred in July 2016 or (iv) the exercise of then outstanding stock options, as the inclusion of these instruments would have been anti‑dilutive for each of the years ended December 31, 2015, 2014, 2013 and 2012. |
|
(2) |
Basic net income (loss) per common share attributable to Acushnet Holdings Corp. is computed by dividing (A) net income (loss) attributable to Acushnet Holdings Corp. after adjusting for (i) dividends paid and accrued and (ii) allocations of undistributed earnings to preferred shareholders, by (B) basic weighted average common shares outstanding. |
|
(3) |
Diluted net income (loss) per common share attributable to Acushnet Holdings Corp. is computed by dividing (A) net income (loss) attributable to Acushnet Holdings Corp. after adjusting for (i) dividends paid and accrued, (ii) allocations of undistributed earnings to preferred shareholders and (iii) the impacts to net income (loss) of any potentially dilutive securities, by (B) the diluted weighted average common shares outstanding, which has been adjusted to include any potentially dilutive securities. Diluted net income (loss) per common share attributable to Acushnet Holdings Corp. for the year ended December 31, 2016 includes the potential dilutive securities associated with the Company’s RSUs and PSUs. Diluted net income (loss) per common share attributable to Acushnet Holdings Corp. for each of the years ended December 31, 2015, 2014, 2013 and 2012 does not include the effects of (i) the conversion of the Convertible Preferred Stock to common shares, (ii) the conversion of the Convertible Notes to common shares, (iii) the exercise of our then outstanding common stock warrants or (iv) the exercise of then outstanding stock options, as the inclusion of these instruments would have been anti‑dilutive for each of the years ended December 31, 2015, 2014, 2013 and 2012. |
|
|
|
As of December 31, |
|||||||||||||
|
|
|
2016 |
|
2015 |
|
2014 |
|
2013 |
|
2012 |
|||||
|
|
|
(in thousands) |
|||||||||||||
|
Balance Sheet Data: |
|
|
|
|
|
|
|
|
|
|
|
|
|
|
|
|
Cash(1) |
|
$ |
76,058 |
|
$ |
54,409 |
|
$ |
47,667 |
|
$ |
49,257 |
|
$ |
45,607 |
|
Current assets less current liabilities, excluding the current portion of our long term debt and EAR Plan liability |
|
|
372,684 |
|
|
345,114 |
|
|
339,301 |
|
|
319,445 |
|
|
321,701 |
|
Total assets |
|
|
1,736,171 |
|
|
1,758,973 |
|
|
1,762,703 |
|
|
1,745,038 |
|
|
1,742,670 |
|
Common stock warrant liability |
|
|
— |
|
|
22,884 |
|
|
1,818 |
|
|
3,705 |
|
|
4,417 |
|
Long term debt, net of discount, including current portion, and capital lease obligations(2) |
|
|
367,098 |
|
|
797,151 |
|
|
873,542 |
|
|
929,590 |
|
|
985,211 |
|
EAR Plan liability, including current portion(3) |
|
|
151,511 |
|
|
169,566 |
|
|
122,013 |
|
|
69,927 |
|
|
41,056 |
|
Total liabilities |
|
|
967,348 |
|
|
1,434,431 |
|
|
1,442,747 |
|
|
1,438,708 |
|
|
1,494,149 |
|
Convertible Preferred Stock |
|
|
— |
|
|
131,036 |
|
|
131,036 |
|
|
131,036 |
|
|
131,036 |
|
Total equity attributable to Acushnet Holdings Corp. |
|
|
735,865 |
|
|
160,251 |
|
|
156,587 |
|
|
143,171 |
|
|
85,838 |
|
Total equity |
|
|
768,823 |
|
|
193,506 |
|
|
188,920 |
|
|
175,295 |
|
|
117,485 |
|
(1) |
Does not include restricted cash of $3.1 million, $4.7 million, $6.1 million, $6.6 million and $6.9 million as of December 31, 2016, 2015, 2014, 2013 and 2012, respectively. Restricted cash is primarily related to a standby letter of credit used for insurance purposes. Includes cash of $13.0 million, $10.0 million, $7.7 million, $5.7 million and $4.0 million as of December 31, 2016, 2015, 2014, 2013 and 2012, respectively, related to our FootJoy golf shoe joint venture. See “Notes to Consolidated Financial Statemenst – Note 2 – Summary of Significant Accounting Policies” for further details on our FootJoy golf shoe joint venture. |
70
|
(2) |
Long‑term debt, net of discount, including current portion, and capital lease obligations consists of (i) long‑term debt and capital lease obligations and (ii) the portion of any long‑term debt that is classified as a current liability on our balance sheet, in each case net of any unamortized discount on such outstanding amounts. |
The following table shows how long‑term debt, net of discount, including current portion, and capital lease obligations was calculated for the relevant periods:
|
|
|
As of December 31, |
|||||||||||||
|
|
|
2016 |
|
2015 |
|
2014 |
|
2013 |
|
2012 |
|||||
|
|
|
(in thousands) |
|||||||||||||
|
Short-term debt |
|
$ |
61,245 |
|
$ |
441,704 |
|
$ |
81,162 |
|
$ |
76,159 |
|
$ |
61,010 |
|
Long-term debt and capital lease obligations |
|
|
348,348 |
|
|
394,511 |
|
|
824,179 |
|
|
879,590 |
|
|
935,211 |
|
Total debt |
|
|
409,593 |
|
|
836,215 |
|
|
905,341 |
|
|
955,749 |
|
|
996,221 |
|
Less: short-term financing arrangements(a) |
|
|
(42,495) |
|
|
(39,064) |
|
|
(31,799) |
|
|
(26,159) |
|
|
(11,010) |
|
Long-term debt, net of discount, including current portion, and capital lease obligations |
|
$ |
367,098 |
|
$ |
797,151 |
|
$ |
873,542 |
|
$ |
929,590 |
|
$ |
985,211 |
(a) Excludes any long‑term debt that is classified as a current liability on our balance sheet and consists of amounts outstanding under (i) revolving credit facilities and (ii) term loan facilities and other financing arrangements that mature within one year of original issuance.
(3) The EARs as structured do not qualify for equity accounting treatment. As such, the liability was re‑measured at each reporting period based on our then‑current projection of our CSE value. See “Item 7. – Management’s Discussion and Analysis of Financial Condition and Results of Operations—Critical Accounting Policies and Estimates—Share‑Based Compensation.” The EAR Plan expired on December 31, 2016 and the outstanding EAR liability of $151.5 million was settled in full by a cash payment to participants during the first quarter of 2017.
|
|
|
Year ended December 31, |
|||||||||||||
|
|
|
2016 |
|
2015 |
|
2014 |
|
2013 |
|
2012 |
|||||
|
|
|
(in thousands) |
|||||||||||||
|
Consolidated Statements of Cash Flows Data: |
|
|
|
|
|
|
|
|
|
|
|
|
|
|
|
|
Cash flows provided by (used in): |
|
|
|
|
|
|
|
|
|
|
|
|
|
|
|
|
Operating activities |
|
$ |
105,188 |
|
$ |
91,830 |
|
$ |
54,113 |
|
$ |
78,795 |
|
$ |
55,506 |
|
Investing activities |
|
|
(20,094) |
|
|
(23,201) |
|
|
(23,527) |
|
|
(46,360) |
|
|
(19,864) |
|
Financing activities |
|
|
(62,663) |
|
|
(60,057) |
|
|
(30,154) |
|
|
(28,179) |
|
|
(61,444) |
|
|
|
Year ended December 31, |
|||||||||||||
|
|
|
2016 |
|
2015 |
|
2014 |
|
2013 |
|
2012 |
|||||
|
|
|
(in thousands) |
|||||||||||||
|
Other Financial Data: |
|
|
|
|
|
|
|
|
|
|
|
|
|
|
|
|
Adjusted EBITDA(1) |
|
$ |
228,374 |
|
$ |
214,721 |
|
$ |
202,593 |
|
$ |
190,407 |
|
$ |
164,597 |
|
Free Cash Flow(2) |
|
|
86,013 |
|
|
68,629 |
|
|
30,586 |
|
|
32,336 |
|
|
28,297 |
|
(1) |
Adjusted EBITDA represents net income (loss) attributable to Acushnet Holdings Corp. plus income tax expense, interest expense, depreciation and amortization, the expenses relating to our EAR Plan, share‑based compensation expense, a one‑time executive bonus, restructuring charges, Predecessor compensation expenses, plant start‑up costs, certain transaction fees, indemnification expense (income) from our former owner Beam, (gains) losses on the fair value of our common stock warrants, certain other non‑cash gains, net and the net income (loss) relating to noncontrolling interests in our FootJoy golf shoe joint venture. We define Adjusted EBITDA in a manner consistent with the term “Consolidated EBITDA” as it is defined in our credit agreement. Consolidated EBITDA is used in our credit agreement at the Acushnet Company level for purposes of certain material terms, including (i) determining the applicable margin used to determine the interest rate per annum of outstanding borrowings and commitment fees for revolving commitments, (ii) calculating certain financial ratios used in financial maintenance covenants that require compliance on a quarterly basis, (iii) determining our ability to incur additional term loans or increases to our revolving credit facility and (iv) determining the availability of certain baskets and the ability to enter into certain transactions. See “Item 7. – Management’s Discussion and Analysis of Financial Condition and Results of |
71
Operations—Liquidity and Capital Resources,” and “– Indebtedness” for further discussion of how Consolidated EBITDA is used in certain material terms of our credit agreement. |
We present Adjusted EBITDA as a supplemental measure because it excludes the impact of certain items that (i) we do not consider indicative of our ongoing operating performance, (ii) that relate to the acquisition of our operating subsidiary, Acushnet Company, by Acushnet Holdings Corp., at the time an entity owned by Fila Korea and a consortium of financial investors, on July 29, 2011 (the “Acquisition”) or (iii) that relate to our historical capital structure that is no longer relevant after our initial public offering. Management uses Adjusted EBITDA to evaluate the effectiveness of our business strategies, assess our consolidated operating performance and make decisions regarding pricing of our products, go to market execution and costs to incur across our business. Adjusted EBITDA is also used as a financial performance measure for purposes of determining the vesting of equity awards that were granted under our 2015 Incentive Plan.
We also believe Adjusted EBITDA provides useful information to investors regarding (i) our consolidated operating performance, (ii) our capacity to service debt, (iii) the applicable margin used to determine the interest rate per annum of outstanding borrowings and commitment fees for revolving commitments and (iv) our capacity to incur additional debt and utilize certain baskets and enter into transactions that may otherwise be restricted by our new credit agreement. By presenting Adjusted EBITDA, we provide a basis for comparison of our business operations between different periods by excluding items that we do not believe are indicative of our core operating performance. Adjusted EBITDA is not a measurement of financial performance under GAAP. It should not be considered an alternative to net income (loss) attributable to Acushnet Holdings Corp. as a measure of our operating performance or any other measure of performance derived in accordance with GAAP. In addition, Adjusted EBITDA should not be construed as an inference that our future results will be unaffected by unusual or non‑recurring items, or affected by similar non‑recurring items. Adjusted EBITDA has limitations as an analytical tool, and you should not consider such measure either in isolation or as a substitute for analyzing our results as reported under GAAP. Our definition and calculation of Adjusted EBITDA is not necessarily comparable to other similarly titled measures used by other companies due to different methods of calculation.
The following table provides a reconciliation of net income (loss) attributable to Acushnet Holdings Corp. to Adjusted EBITDA:
|
|
|
Year ended December 31, |
|||||||||||||
|
|
|
2016 |
|
2015 |
|
2014 |
|
2013 |
|
2012 |
|||||
|
|
|
(in thousands) |
|||||||||||||
|
Net income (loss) attributable to Acushnet Holdings Corp. |
|
$ |
45,012 |
|
$ |
(966) |
|
$ |
21,557 |
|
$ |
19,636 |
|
$ |
13,873 |
|
Income tax expense |
|
|
39,707 |
|
|
27,994 |
|
|
16,700 |
|
|
17,150 |
|
|
7,555 |
|
Interest expense, net |
|
|
49,908 |
|
|
60,294 |
|
|
63,529 |
|
|
68,149 |
|
|
69,185 |
|
Depreciation and amortization |
|
|
40,834 |
|
|
41,702 |
|
|
43,159 |
|
|
39,423 |
|
|
38,837 |
|
EAR Plan(a) |
|
|
6,047 |
|
|
45,814 |
|
|
50,713 |
|
|
28,258 |
|
|
41,056 |
|
Share-based compensation(b) |
|
|
14,494 |
|
|
5,789 |
|
|
1,977 |
|
|
3,461 |
|
|
— |
|
One-time executive bonus(c) |
|
|
7,500 |
|
|
— |
|
|
— |
|
|
— |
|
|
— |
|
Restructuring charges(d) |
|
|
1,673 |
|
|
1,643 |
|
|
— |
|
|
955 |
|
|
— |
|
Predecessor compensation expenses(e) |
|
|
— |
|
|
— |
|
|
— |
|
|
— |
|
|
2,477 |
|
Thailand golf ball manufacturing plant start-up costs(f) |
|
|
— |
|
|
— |
|
|
788 |
|
|
2,927 |
|
|
1,617 |
|
Transaction fees(g) |
|
|
16,817 |
|
|
2,141 |
|
|
1,490 |
|
|
551 |
|
|
845 |
|
Beam indemnification expense (income)(h) |
|
|
(2,174) |
|
|
(3,007) |
|
|
1,386 |
|
|
6,345 |
|
|
(2,872) |
|
Losses (gains) on the fair value of our common stock warrants(i) |
|
|
6,112 |
|
|
28,364 |
|
|
(1,887) |
|
|
(976) |
|
|
(12,224) |
|
Other non-cash gains, net |
|
|
(592) |
|
|
(169) |
|
|
(628) |
|
|
(149) |
|
|
(23) |
|
Nonrecurring expense (income)(j) |
|
|
(1,467) |
|
|
— |
|
|
— |
|
|
— |
|
|
— |
|
Net income (loss) attributable to noncontrolling interests(k) |
|
|
4,503 |
|
|
5,122 |
|
|
3,809 |
|
|
4,677 |
|
|
4,271 |
|
Adjusted EBITDA |
|
$ |
228,374 |
|
$ |
214,721 |
|
$ |
202,593 |
|
$ |
190,407 |
|
$ |
164,597 |
72
|
(a) |
Reflects expenses related to the anticipated full vesting of EARs granted under our EAR Plan and the remeasurement of the liability at each reporting period based on the then‑current projection of our CSE value. See “Item 7. – Management’s Discussion and Analysis of Financial Condition and Results of Operations—Critical Accounting Policies and Estimates—Share‑Based Compensation.” All outstanding EARs under the EAR Plan vested as of December 31, 2015. The EAR Plan expired on December 31, 2016 and the outstanding EAR liability of $151.5 million was settled in full by a cash payment to participants during the first quarter of 2017. |
|
(b) |
For the year ended December 31, 2016, reflects compensation expenses with respect to equity‑based grants under the 2015 Incentive Plan which were made in 2016. For the years ended December 31, 2015, 2014 and 2013, reflects compensation expense associated with the exercise of substitute stock options by an executive, which were granted in connection with the Acquisition. All such stock options have been exercised. |
|
(c) |
In the first quarter of 2016, our President and Chief Executive Officer was awarded a cash bonus in the amount of $7.5 million as consideration for past performance. |
|
(d) |
Reflects restructuring charges incurred in connection with the reorganization of certain of our operations in 2016, 2015 and 2013. |
|
(e) |
Primarily reflects incentive compensation charges in 2012 related to the Acquisition. |
|
(f) |
Reflects expenses incurred in connection with the construction and production ramp‑up of our golf ball manufacturing plant in Thailand. |
|
(g) |
Reflects certain fees and expenses we incurred in 2016 and 2015 in connection with our initial public offering and legal fees incurred in all years presented relating to a dispute arising from the indemnification obligations owed to us by Beam in connection with the Acquisition. |
|
(h) |
Reflects the non‑cash charges related to the indemnification obligations owed to us by Beam that are included when calculating net income (loss) attributable to Acushnet Holdings Corp. |
|
(i) |
Fila Korea exercised all of our then outstanding common stock warrants in July 2016 and we used the proceeds from such exercise to redeem all of our outstanding 7.5% bonds due 2021. |
|
(j) |
Reflects legal judgment in favor of us associated with the Beam value‑added tax dispute recorded in other (income) expense. |
|
(k) |
Reflects the net income attributable to the interest that we do not own in our FootJoy golf shoe joint venture. |
(2) Free Cash Flow represents cash flows provided by (used in) operating activities less capital expenditures. We believe Free Cash Flow is useful to investors because it represents the cash that our operating business generates after taking into account capital expenditures. Free Cash Flow is not a measurement of liquidity under GAAP. It should not be considered as an alternative to cash flows provided by (used in) operating activities as a measure of our liquidity or any other measure of liquidity derived in accordance with GAAP. Free Cash Flow has limitations as an analytical tool, and you should not consider such measure either in isolation or as a substitute for analyzing our results as reported under GAAP. Our definition and calculation of Free Cash Flow is not necessarily comparable to other similarly titled measures used by other companies due to different methods of calculation.
73
The following table provides a reconciliation of cash flows provided by (used in) operating activities to Free Cash Flow:
|
|
|
Year ended December 31, |
|||||||||||||
|
|
|
2016 |
|
2015 |
|
2014 |
|
2013 |
|
2012 |
|||||
|
|
|
(in thousands) |
|||||||||||||
|
Cash flows provided by operating activities |
|
$ |
105,188 |
|
$ |
91,830 |
|
$ |
54,113 |
|
$ |
78,795 |
|
$ |
55,506 |
|
Capital expenditures |
|
|
(19,175) |
|
|
(23,201) |
|
|
(23,527) |
|
|
(46,459) |
|
|
(27,209) |
|
Free Cash Flow(a) |
|
$ |
86,013 |
|
$ |
68,629 |
|
$ |
30,586 |
|
$ |
32,336 |
|
$ |
28,297 |
|
(a) |
In connection with the Acquisition, we issued (i) an aggregate principal amount of $362.5 million of our Convertible Notes and (ii) an aggregate principal amount of $172.5 million of 7.5% bonds due 2021. All of our outstanding Convertible Preferred Stock and all of our outstanding Convertible Notes were converted into shares of our common stock prior upon the closing of our initial public offering and Fila Korea exercised all of our outstanding common stock warrants in July 2016 and we used the proceeds from such exercise to redeem all our outstanding 7.5% bonds due 2021. Free Cash Flow has not been adjusted to exclude any historical impact from the interest expense on our Convertible Notes and our 7.5% bonds due 2021, which interest expense totaled $28.1 million, $35.4 million, $38.0 million, $40.3 million and $42.7 million for the years ended December 31, 2016, 2015, 2014, 2016 and 2012, respectively. |
ITEM 7. MANAGEMENT’S DISCUSSION AND ANALYSIS OF FINANCIAL CONDITION AND RESULTS OF OPERATIONS
The following discussion contains management’s discussion and analysis of our financial condition and results of operations and should be read together with “Item 1A – Risk Factors”; “Item 6 – Selected Consolidated Financial Data” and our audited consolidated financial statements and the notes thereto included elsewhere in this Annual Report. This discussion contains forward‑looking statements that reflect our plans, estimates and beliefs and involve numerous risks and uncertainties, including but not limited to those described in the “Risk Factors” section of this report. Actual results may differ materially from those contained in any forward‑looking statements. You should carefully read “Forward‑Looking Statements” following the Table of Contents.
Overview
We are the global leader in the design, development, manufacture and distribution of performance‑driven golf products, which are widely recognized for their quality excellence. Today, we are the steward of two of the most revered brands in golf—Titleist, one of golf’s leading performance equipment brands, and FootJoy, one of golf’s leading performance wear brands. We own or control the design, sourcing, manufacturing, packaging and distribution of our products. In doing so, we are able to exercise control over every step of the manufacturing process.
Our target market is dedicated golfers, who are avid and skill‑biased, prioritize performance and commit the time, effort and money to improve their game. We believe that dedicated golfers are the most consistent purchasers of golf products and estimate that while they represented only approximately 15% of all United States golfers, they accounted for more than 40% of total rounds played and approximately 70% of all golf equipment and gear spending in the United States during 2016. We also believe dedicated golfers account for an outsize share of golf equipment and gear spending outside the United States and purchase a significant portion of the golf wear products worldwide.
We have demonstrated sustained, resilient and stable revenue and Adjusted EBITDA growth over the past three years, despite challenges related to demographic, macroeconomic and weather related conditions. Our differentiated focus on performance and quality excellence, enduring connections with dedicated golfers, and favorable and market‑differentiating mix of consumable and durable products have been the key drivers of our strong financial performance. We increased our net sales to $1,572.3 million in 2016 from $1,477.2 million in 2013, representing a CAGR of 2%. See “Item 6. – Selected Consolidated Financial Data.” On a constant currency basis, net sales grew at a CAGR of 4% over this same period. See “—Key Performance Measures” for a discussion of how we calculate constant currency information.
74
We have the following reportable segments: Titleist golf balls; Titleist golf clubs; Titleist golf gear; and FootJoy golf wear.
Our net sales are diversified by both product category and mix as well as geography:
|
· |
Titleist golf balls, Titleist golf clubs, Titleist golf gear, and FootJoy golf wear accounted for 33%, 27%, 9% and 28%, respectively, of net sales for the year ended December 31, 2016. |
|
· |
Consumable products, which we consider to be golf balls and golf gloves, collectively represented 40% of our net sales for the year ended December 31, 2016, and more durable products, which we consider to be golf clubs, golf shoes, golf apparel and golf gear, collectively represented 60% of our net sales for the year ended December 31, 2016. |
|
· |
The United States, Europe, the Middle East and Africa, or EMEA, Japan, Korea, and the rest of the world accounted for 51%,14%,14%,11% and 10%, respectively, of net sales for the year ended December 31, 2016. |
Our top ten customers accounted for 21% of our net sales for the year ended December 31, 2016 with no one customer accounting for more than 10% of our net sales in such period. For the year ended December 31, 2016, 86% of our net sales were generated in five countries: the United States, Japan, Korea, the United Kingdom and Canada.
Gross margin for the year ended December 31, 2016 was 50.8%. Operating margin for the year ended December 31, 2016 was 9.0%.
Net income attributable to Acushnet Holdings Corp. was $45.0 million for the year ended December 31, 2016.
We increased our Adjusted EBITDA to $228.4 million for the year ended December 31, 2016 from $190.4 million for the year ended December 31, 2013, representing a CAGR of 6.2%. Our Adjusted EBITDA margin, which we define as Adjusted EBITDA divided by net sales, improved each year during such four‑year period, increasing to 14.5% in 2016 from 12.9% in 2013. For a reconciliation of Adjusted EBITDA to net income (loss) attributable to Acushnet Holdings Corp., see “Item 6. – Selected Consolidated Financial Data.”
We were incorporated in Delaware on May 9, 2011 as Alexandria Holdings Corp., an entity owned by Fila Korea Co., Ltd. (“Fila Korea”), a leading sport and leisure apparel and footwear company which is a public company listed on the Korea Exchange, and a consortium of investors (the “Financial Investors”) led by Mirae Asset Global Investments, a global investment management firm. We acquired Acushnet Company, our operating subsidiary, from Beam Suntory, Inc. (at the time known as Fortune Brands, Inc.) (“Beam”) on July 29, 2011 (the “Acquisition”).
In connection with the Acquisition, Acushnet Holdings Corp. issued the following securities: (i) an aggregate of 9,000,000 shares of our common stock for an issue price of $100.0 million, (ii) an aggregate of 1,838,027 shares of our Series A redeemable convertible preferred stock (“Convertible Preferred Stock”) for an issue price of $183.8 million, (iii) an aggregate principal amount of $362.5 million of our 7.5% convertible notes due 2021 (our “Convertible Notes”) and (iv) an aggregate principal amount of $172.5 million of 7.5% bonds due 2021 with related warrants to purchase our common stock. All of our outstanding Convertible Preferred Stock and all of our outstanding Convertible Notes were converted into shares of our common stock prior to the closing of our initial public offering. Fila Korea exercised all of our outstanding common stock warrants in July 2016 and we used the proceeds from such exercise to redeem all of our outstanding 7.5% bonds due 2021.
Also in connection with the Acquisition, we issued secured floating rate notes in an aggregate principal amount of $500.0 million and entered into a senior revolving credit facility and a senior term loan credit facility. On April 27, 2016, we entered into a new credit agreement, which provides for (i) a $275.0 million multi‑currency revolving credit facility, (ii) a $375.0 million term loan A facility and (iii) a $100.0 million delayed draw term loan A facility. On July 28, 2016, we used the proceeds of the $375.0 million term loan A facility, borrowings of C$4.0 million (equivalent to approximately $3.0 million) under the revolving credit facility and cash on hand of $23.6 million to (i) repay all amounts outstanding under, and terminate, the secured floating rate notes and certain of our other working credit facilities, (ii) terminate our former senior revolving credit facility and (iii) pay fees and expenses related to the foregoing. We refer to the entering into of the new credit agreement and the use of $375.0 million of borrowings under
75
the term loan A facility, borrowings of C$4.0 million (equivalent to approximately $3.0 million) under the revolving credit facility and cash on hand of $23.6 million to (i) repay all amounts outstanding under, and terminate, the secured floating rate notes and certain of our other working credit facilities, (ii) terminate the senior revolving credit facility referred to above and (iii) pay fees and expenses related to the foregoing, as the Refinancing. In addition, on June 30, 2016, we used cash on hand and borrowings under the senior revolving credit facility referred to above to repay all amounts outstanding under, and terminate, the senior term loan facility referred to above.
We completed an initial public offering of our common stock in November 2016. See “Notes to Consolidated Financial Statements – Note 2– Summary of Significant Accounting Policies” for disclosures related to our initial public offering and other related transactions.
Following the pricing of our initial public offering, Magnus Holdings Co., Ltd. (“Magnus”), a wholly-owned subsidiary of Fila Korea, purchased from the Financial Investors on a pro rata basis 14,818,720 shares of our common stock, resulting in Magnus holding a controlling ownership interest of 53.1% of our outstanding common stock. The 14,818,720 shares of our common stock sold by the Financial Investors were received upon the automatic conversion of certain of our outstanding Convertible Notes and Preferred Stock. The remaining outstanding Convertible Notes and Series A preferred stock automatically converted into shares of our common stock prior to the closing of the initial public offering. See “Notes to Consolidated Financial Statements – Note 9 – Debt and Financing Arrangements – Convertible Notes” for more information concerning the Convertible Notes and “Notes to Consolidated Financial Statements – Note 15 –Redeemable Convertible Preferred Stock” for more information concerning the Series A Preferred stock.
Key Factors Affecting Our Results of Operations
Rounds of Play
We generate substantially all of our sales from the sale of golf‑related products, including golf balls, golf clubs, golf shoes, golf gloves, golf gear and golf apparel. The demand for golf‑related products in general, and golf balls in particular, is directly related to the number of golf participants and the number of rounds of golf being played by these participants.
Weather Conditions
Weather conditions in most parts of the world, including our primary geographic markets, generally restrict golf from being played year‑round, with many of our on‑course customers closed during the cold weather months and, to a lesser extent, during the hot weather months. Unfavorable weather conditions in our major markets, such as a particularly long winter, a cold and wet spring, or an extremely hot summer, would reduce the number of playable days and rounds played in a given year, which would result in a decrease in the amount spent by golfers and golf retailers on our products, particularly with respect to consumable products such as golf balls and golf gloves. Our results in 2014 were negatively impacted by unfavorable weather conditions in our major markets. Unusual or severe weather conditions throughout the year, such as storms or droughts or other water shortages, can negatively affect golf rounds played both during the events and afterward, as weather damaged golf courses are repaired and golfers focus on repairing the damage to their homes, businesses and communities. Consequently, sustained adverse weather conditions, especially during the warm weather months, could impact our sales. Adverse weather conditions may have a greater impact on us than other golf equipment companies as we have a large percentage of consumable products in our product portfolio, and the purchase of consumable products are more dependent on the number of rounds played in a given year.
Economic Conditions
Our products are recreational in nature and are therefore discretionary purchases for consumers. Consumers are generally more willing to spend their time and money to play golf and make discretionary purchases of golf products when economic conditions are favorable and when consumers are feeling confident and prosperous. Discretionary spending on golf and the golf products we sell is affected by consumer spending habits as well as by many macroeconomic factors, including general business conditions, stock market prices and volatility, corporate spending, housing prices, interest rates, the availability of consumer credit, taxes and consumer confidence in future economic conditions. Consumers may reduce or postpone purchases of our products as a result of shifts in consumer spending habits as well as during periods when economic uncertainty increases, disposable income is lower, or during periods of
76
actual or perceived unfavorable economic conditions. For example, the recession related to the U.S. financial crisis beginning in 2007 led to slower economic activity, decreased stock prices and increased volatility, depressed housing prices, increased unemployment, concerns about inflation and energy costs, decreased business and consumer confidence, and adverse business conditions (including reduced corporate profits and capital spending), which adversely affected our business, financial condition and results of operations. The effects of the recession are still being felt today in the golf industry as we believe consumers have become more cautious with their discretionary purchases and this trend may continue. For example, corporate spending on golf equipment has remained at lower levels since the financial crisis as evidenced by the lower volume of balls in our custom logo business being sold to companies as compared to before the crisis.
Demographic Factors
Golf is a recreational activity that requires time and money and different generations and socioeconomic and ethnic groups use their leisure time and discretionary funds in different ways. The golf industry has been principally driven by the age cohort of 30 and above, currently “gen‑x” (age 30‑49) and “baby boomers” (age 50‑69), who have the time and money to engage in the sport. In the United States, there are approximately 8.7 million gen‑x golfers and approximately 6.6 million baby boomer golfers, representing in aggregate approximately 63% of total golfers in the United States. Since a significant number of baby boomers have yet to retire, we anticipate growth in spending from this demographic as it has been demonstrated that rounds of play increase significantly as those in this cohort reach retirement.
Golf participation among younger generations and certain socioeconomic and ethnic groups may not prove to be as popular as it is among the current gen‑x and baby boomer generations. In such case, sales of our products could be negatively impacted.
Seasonality
Weather conditions in most parts of the world, including our primary geographic markets, generally restrict golf from being played year‑round, with many of our on‑course customers closed during the cold weather months. In general, during the first quarter, we begin selling our products into the golf retail channel for the new golf season. This initial sell‑in generally continues into the second quarter. Our second‑quarter sales are significantly affected by the amount of sell‑through, in particular the amount of higher value discretionary purchases made by customers, which drives the level of reorders of our products sold‑in during the first quarter. Our third‑quarter sales are generally dependent on reorder business, and are generally less than the second quarter as many retailers begin decreasing their inventory levels in anticipation of the end of the golf season. Our fourth‑quarter sales are generally less than the other quarters due to the end of the golf season in many of our key markets, but can also be affected by key product launches, particularly golf clubs. This seasonality, and therefore quarter to quarter fluctuations, can be affected by many factors, including weather conditions as discussed above under “—Weather Conditions” and the timing of new product introductions as discussed below under “—Cyclicality.” This seasonality affects sales in each of our reportable segments differently. In general, however, because of this seasonality, a majority of our sales and most of our profitability generally occurs during the first half of the year.
Cyclicality
Our sales can also be affected by the launch timing of new products. Product introductions generally stimulate sales as the golf retail channel takes on inventory of new products. Reorders of these new products then depend on the rate of sell‑through. Announcements of new products can often cause our customers to defer purchasing additional golf equipment until our new products are available. The varying product introduction cycles described below may cause our results of operations to fluctuate as each product line has different volumes, prices and margins.
Titleist Golf Balls Segment
We launch new Titleist golf ball models on a two‑year cycle, with new product launches of Pro V1 and Pro V1x, our premium performance models, generally occurring in the first quarter of odd‑numbered years and new product launches of NXT Tour, Velocity and DT, our performance models, generally occurring in the first quarter of even‑numbered years. For new golf ball models, sales occur at a higher rate in the year of the initial launch than in the
77
second year. Given the Pro V1 franchise is our highest volume and our highest priced product in this product category, we typically have higher net sales in our Titleist golf ball segment in odd‑numbered years.
Titleist Golf Clubs Segment
We generally launch new Titleist golf club models on a two‑year cycle. Since the fall of 2014, we have generally used the following product launch cycle, and at present we anticipate continuing to use this product launch cycle going forward because we believe it aligns our launches with the purchase habits of dedicated golfers. In general, we launch:
|
· |
drivers and fairways in the fourth quarter of even‑numbered years, which typically results in an increase in sales of drivers and fairways during such quarter because retailers take on initial supplies of these products as stock inventory, with increased sales generated by such new products continuing the following spring and summer of odd‑numbered years; |
|
· |
irons and hybrids in the fourth quarter of odd‑numbered years, with the majority of sales generated by such new products occurring in the following spring and summer of even‑numbered years because a higher percentage of our new irons and hybrids as compared to our drivers and fairways are sold through on a custom fit basis and the spring and summer is when golfers tend to make such custom fit purchases; |
|
· |
Vokey Design wedges in the first quarter of even‑numbered years, with the majority of sales generated by such new products occurring in the spring and summer of such even‑numbered years; |
|
· |
Scotty Cameron putters in the first quarter, with the Select models launched in even‑numbered years and the Futura models launched in odd‑numbered years, with the majority of sales generated by such new products occurring in the spring and summer of the year in which they are launched; and |
|
· |
Japan‑specific VG3 drivers, fairways, hybrids and irons in the spring of even‑numbered years, with the majority of sales generated by such new products occurring in the spring and summer of such even‑numbered years. |
As a result of this product launch cycle, we generally expect to have higher net sales in our Titleist golf clubs segment in even‑numbered years due to the following factors:
|
· |
the majority of sales generated by new irons and hybrids launched in the fourth quarter of odd‑numbered years is expected to occur in the spring and summer of the following even‑numbered years; |
|
· |
the majority of sales generated by new Vokey Design wedges launched in the first quarter of even‑numbered years is expected to occur in such even‑numbered years; |
|
· |
the majority of sales generated by new Scotty Cameron Select line of putters launched in the first quarter of even‑numbered years is expected to occur in such even‑numbered years; |
|
· |
the majority of sales generated by new Japan‑specific VG3 drivers, fairways, hybrids and irons launched in the spring of even‑numbered years is expected to occur in such even‑numbered years; and |
|
· |
the increase in sales of new drivers and fairways launched in the fourth quarter of even‑numbered years due to the initial sell‑in of these products during such quarter. |
78
Titleist Golf Gear and FootJoy Golf Wear Segments
Our FootJoy golf wear and Titleist golf gear businesses are not subject to the same degree of cyclical fluctuation as our golf ball and golf club businesses as new product offerings and styles are generally introduced each year and at different times during the year.
Foreign Currency
For the years ended December 31, 2016, 2015 and 2014, 49%, 46% and 48% of our net sales were generated outside of the United States by our non‑U.S. subsidiaries. Substantially all of these net sales generated outside of the United States were generated in the applicable local currency, which include, but are not limited to, the Japanese yen, the Korean won, the British pound sterling, the euro and the Canadian dollar. In contrast, substantially all of the purchases of inventory, raw materials or components by our non‑U.S. subsidiaries are made in U.S. dollars. For the year ended December 31, 2016, approximately 86% of our cost of goods sold incurred by our non‑U.S. subsidiaries were denominated in U.S. dollars. Because our non‑U.S. subsidiaries incur substantially all of their cost of goods sold in currencies that are different from the currencies in which they generate substantially all of their sales, we are exposed to transaction risk attributable to fluctuations in such exchange rates, which can impact the gross profit of our non‑U.S. subsidiaries.
In an effort to protect against adverse changes in foreign exchange rates and minimize foreign currency transaction risk, we take an active approach to currency hedging, which includes among other things, entering into various foreign currency exchange contracts, with the primary goal of providing earnings and cash flow stability. As a result of our active approach to currency hedging, we are able to take a longer term view and more flexible approach towards pricing our products and making cost‑related decisions. In taking this active approach, we coordinate with the management teams of our key non‑U.S. subsidiaries on an ongoing basis to share our views on anticipated currency
79
movements and make decisions on securing foreign currency exchange contract positions that are incorporated into our business planning and forecasting processes. Because our hedging activities are designed to reduce volatility, they reduce not only the negative impact of a stronger U.S. dollar but could also reduce the positive impact of a weaker U.S. dollar.
Because our consolidated accounts are reported in U.S. dollars, we are also exposed to currency translation risk when we translate the financial results of our consolidated non‑U.S. subsidiaries from their local currency into U.S. dollars. For the year ended December 31, 2016, 49% of our sales were denominated in foreign currencies. In addition, for the year ended December 31, 2016, 30% of our total operating expenses were denominated in foreign currencies (which amounts represent substantially all of the operating expenses incurred by our non‑U.S. subsidiaries). Fluctuations in foreign currency exchange rates may positively or negatively affect our reported financial results and can significantly affect period‑over‑period comparisons. A strengthening of the U.S. dollar relative to our foreign currencies could materially adversely affect our business, financial condition and results of operations.
2016 Customer Event
On September 14, 2016, Golfsmith International Holdings LP, a specialty golf retailer and one of our largest customers in each of the years ended December 31, 2016, 2015, and 2014, announced that (i) its U.S.‑based business, Golfsmith International Holdings, Inc., or Golfsmith, which reportedly operated 109 stores in the United States at that time, commenced a Chapter 11 case, or the Chapter 11 proceedings, under Title 11 of the United States Code in the United States Bankruptcy Court for the District of Delaware, and (ii) its Canada‑based business, Golf Town Canada Inc., or Golf Town, which reportedly operated 55 stores in Canada at that time, commenced creditor protection proceedings under the Companies’ Creditors Arrangement Act in the Ontario Superior Court of Justice (Commercial List).
In connection with the Chapter 11 proceedings, Golfsmith sold substantially all of its US assets to two groups of purchasers: (i) Dick’s Sporting Goods, Inc. and (ii) a joint consisting of Hilco Merchant Resources, LLC; Tiger Capital Group, LLC; and Gordon Brothers Retail Partners, LLC, or the Joint Venture Purchaser. Golfsmith’s US sale transaction was approved by the Bankruptcy Court on or about October 31, 2016. Dick’s Sporting Goods, Inc. continues to operate fewer than 40 Golfsmith locations and the Joint Venture Purchaser has liquidated, or is liquidating, the remaining locations. Accordingly, the number of US Golfsmith locations to which we formerly sold our product has been substantially reduced.
Golfsmith International Holdings LP also announced that, in addition to commencing creditor protection proceedings in Canada, it entered into a definitive asset purchase agreement for the sale of its Golf Town business to an entity controlled by a purchaser group led by Fairfax Financial Holdings Limited and certain investment funds managed by Signature Global Asset Management, a division of CI Investments Inc., which sale was approved by the Ontario Superior Court of Justice (Commercial List) on or about September 30, 2016. Forty-eight of Golf Town’s locations remain operating after the sale.
We grant credit, generally without collateral, to our retailers and distributors, formerly including Golfsmith. As a result of the Golfsmith and Golf Town insolvency proceedings, the receivables we had outstanding with Golfsmith International Holdings LP, which totaled $7.2 million as of the date of the bankruptcy filings, were compromised and, at least with regard to the Golfsmith US bankruptcy case, more likely than not will result in no payment at all. As such, our outstanding receivable of $7.2 million at the time of the bankruptcy filing has either been written off or reserved for in full. In addition, we may be the subject of avoidance actions with respect to payments received from Golfsmith International Holdings LP within a statutory period prior to the bankruptcy petition date; however, the terms of the sale to Dick’s Sporting Goods, Inc. have made such avoidance actions, at least as they pertain to the US Golfsmith proceeding, less likely. No such avoidance action has been filed to date, and may never be filed. We would vigorously defend any such avoidance actions, although the outcome of any such actions would be uncertain.
The Golfsmith bankruptcy resulted in a significant disruption to our business in the third and fourth quarters of 2016, with the reorganization activities and store closures resulting in less product sell-in to retail. In addition, we anticipate that 2017 sales will also be impacted as a result of liquidation activities still underway and lower retail sell-in resulting from the reduced store count.
80
Key Performance Measures
We use various financial metrics to measure and evaluate our business, including, among others: (i) net sales on a constant currency basis, (ii) Adjusted EBITDA on a consolidated basis, (iii) Adjusted EBITDA margin and (iv) segment operating income.
Since a significant percentage of our net sales are generated outside of the United States (49%, 46% and 48% for the years ended December 31, 2016, 2015 and 2014, respectively), we use net sales on a constant currency basis to evaluate the sales performance of our business in period over period comparisons and for forecasting our business going forward. Constant currency information allows us to estimate what our sales performance would have been without changes in foreign currency exchange rates. This information is calculated by taking the current period local currency sales and translating them into U.S. dollars based upon the foreign currency exchange rates for the applicable comparable prior period. This constant currency information should not be considered in isolation or as a substitute for any measure derived in accordance with GAAP. Our presentation of constant currency information may not be consistent with the manner in which similar measures are derived or used by other companies.
We primarily use Adjusted EBITDA on a consolidated basis to evaluate the effectiveness of our business strategies, assess our consolidated operating performance and make decisions regarding pricing of our products, go to market execution and costs to incur across our business. We define Adjusted EBITDA in a manner consistent with the term “Consolidated EBITDA” as it is defined in our credit agreement. Adjusted EBITDA represents net income (loss) attributable to Acushnet Holdings Corp. plus income tax expense, interest expense, depreciation and amortization, the expenses relating to the Acushnet Company Equity Appreciation Rights Plan, as amended (the “EAR Plan”), share-based compensation expense, a one-time executive bonus, restructuring charges, certain transaction fees, indemnification expense (income) from Beam, (gains) losses on the fair value of our common stock warrants, certain other non-cash (gains) losses, net and the net income relating to noncontrolling interests in our FootJoy golf shoe joint venture. Adjusted EBITDA is not a measurement of financial performance under GAAP. It should not be considered an alternative to net income (loss) attributable to Acushnet Holdings Corp. as a measure of our operating performance or any other measure of performance derived in accordance with GAAP. In addition, Adjusted EBITDA should not be construed as an inference that our future results will be unaffected by unusual or non‑recurring items, or affected by similar non‑recurring items. Adjusted EBITDA has limitations as an analytical tool, and you should not consider such measure either in isolation or as a substitute for analyzing our results as reported under GAAP. Our definition and calculation of Adjusted EBITDA is not necessarily comparable to other similarly titled measures used by other companies due to different methods of calculation. For a reconciliation of Adjusted EBITDA to net income (loss) attributable to Acushnet Holdings Corp., see “—Results of Operations.”
We also use Adjusted EBITDA margin, which measures our Adjusted EBITDA as a percentage of net sales, because our management uses it to evaluate the effectiveness of our business strategies, assess our consolidated operating performance and make decisions regarding pricing of our products, go to market execution and costs to incur across our business. We present Adjusted EBITDA margin as a supplemental measure of our operating performance because it excludes the impact of certain items that we do not consider indicative of our ongoing operating performance. By presenting Adjusted EBITDA margin, we provide a basis for comparison of our business operations between different periods by excluding items that we do not believe are indicative of our core operating performance. Adjusted EBITDA margin is not a measurement of financial performance under GAAP. It should not be considered an alternative to any measure of performance derived in accordance with GAAP. In addition, Adjusted EBITDA margin should not be construed as an inference that our future results will be unaffected by unusual or non‑recurring items, or affected by similar non‑recurring items. Adjusted EBITDA margin has limitations as an analytical tool, and you should not consider such measure either in isolation or as a substitute for analyzing our results as reported under GAAP. Our definition and calculation of Adjusted EBITDA margin is not necessarily comparable to other similarly titled measures used by other companies due to different methods of calculation.
Lastly, we use segment operating income to evaluate and assess the performance of each of our reportable segments and to make budgeting decisions.
81
Components of Results of Operations
Net Sales
Sales are recognized in accordance with Accounting Standards Codification, or ASC, 605, “Revenue Recognition” upon shipment or upon receipt by the customer depending on the country of the sale and the agreement with the customer, and include the amounts billed to customers for shipping and handling, net of an allowance for discounts, sales returns, customer sales incentives (which include sales‑based rebates, off‑invoice discounts and in‑store price reduction programs) and cooperative advertising.
Our business is seasonal and cyclical. See “—Overview—Key Factors Affecting Our Results of Operations.” As a result, our net sales fluctuate depending on the quarter, which often affects the comparability of our interim results sequentially. Net sales are historically higher in the first half of the year.
Cost of Goods Sold; Gross Profit and Gross Margin
Cost of goods sold includes all material, labor and packaging costs, inbound freight and duty costs, manufacturing overhead, including electricity, utilities and depreciation expenses associated with assets used in the production of products that we manufacture. Cost of goods sold also includes gains and losses on foreign currency exchange contracts, reserves for estimated warranty expenses, and the write‑down of inventory deemed to be obsolete or below net realizable value.
Amounts billed to customers for shipping and handling are included in net sales as discussed above and outbound shipping and handling costs associated with preparing goods to ship to customers are included in selling, general and administrative expenses as discussed below. As a result, our gross profit may not be comparable to that of other companies that include outbound shipping and handling costs in their cost of goods sold. Shipping and handling costs included in selling, general and administrative expenses were $32.4 million, $32.6 million and $30.5 million for the years ended December 31, 2016, 2015 and 2014, respectively.
Gross profit is equal to our net sales less cost of goods sold. Gross margin measures our gross profit as a percentage of sales.
On a consolidated basis for the year ended December 31, 2016, approximately 86% of our total cost of goods sold was variable in nature and was comprised of materials and components, direct labor and elements of variable overhead. Of this amount, nearly 81% was material or component costs. Specific to the products that we manufacture, variable costs comprise a substantial portion of the total cost of our golf clubs, golf shoes and golf gloves while variable costs constitute a smaller percentage, though still more than a majority, of the total cost of our golf ball business, with the remainder related to fixed overhead. As such, increases or decreases in actual production volume can have a greater effect on the cost of golf balls produced through higher or lower absorption of fixed overhead. Our Titleist golf gear and FootJoy apparel products are wholly‑sourced from third‑party suppliers.
For products that we manufacture, we purchase raw materials from both domestic and international suppliers. Raw materials include polybutadiene and ionomers for the manufacturing of golf balls, titanium and steel for the manufacturing of golf clubs, leather and synthetic fabrics for the manufacturing of golf shoes and golf gloves, and resin and other petroleum‑based materials for a number of our products. Certain of our materials are subject to supply and demand fluctuations in the commodity market and, as such, these fluctuations can have an impact on our cost of goods sold.
While our non‑U.S. subsidiaries generate substantially all of their net sales in the applicable local currency, including, but not limited to, the Japanese yen, the Korean won, the British pound sterling, the euro and the Canadian dollar, such subsidiaries purchase substantially all of their inventory, raw materials or components in U.S. dollars. For example, for the year ended December 31, 2016, approximately 86% of our non‑U.S. cost of goods sold were denominated in U.S. dollars. If the U.S. dollar strengthens against the applicable local currency, more local currency will be needed to purchase the same amount of cost of goods sold denominated in U.S. dollars which can have a significant impact on our consolidated cost of goods sold, gross profit and gross profit margin. In an effort to protect against adverse changes in foreign exchange rates and minimize foreign currency transaction risk, we take an active approach to currency hedging, which includes among other things, entering into various foreign currency exchange contracts, with
82
the primary goal of providing earnings stability. As a result of our active approach to currency hedging, we are able to take a longer term view and more flexible approach towards pricing our products and making cost‑related decisions. See “—Key Factors Affecting Our Results of Operations—Foreign Currency” for further discussion of the impact of foreign currency fluctuations on our cost of goods sold, gross profit and gross profit margin and the actions we take to mitigate such impact.
Gross margin can be impacted by changes in average selling prices (which is driven by changes in the mix of products sold, price increases and closeouts) and increases and decreases in material, labor and overhead costs as well as the effects of foreign currency fluctuations.
Operating Expenses
Our operating expenses consist of selling, general and administrative expenses, R&D expenses, intangible amortization and restructuring charges.
Selling, General and Administrative Expenses
Our selling, general and administrative expenses primarily consist of selling expenses, advertising and promotion expenses and corporate services expenses. All three categories of selling, general and administrative expenses include personnel costs, such as salaries, benefits, share‑based compensation and incentives related to our employees.
Because 32.4%, 30.0%, 31.2% of our selling, general and administrative expenses for the years ended December 31, 2016, 2015 and 2014, respectively, were incurred by our non‑U.S. subsidiaries in local currencies, these expenses may be affected by changes in foreign currency exchange rates. We calculate the impact of changes in foreign currency exchange rates on operating expenses to allow us to estimate what operating expenses would have been without changes in foreign currency exchange rates.
Selling expenses include marketing and sales administration compensation and costs, distribution expenses and field sales compensation. Distribution expenses also include outbound shipping and handling costs associated with preparing goods to ship to customers and costs to operate our distribution facilities. For the years ended December 31, 2016, 2015 and 2014, selling expenses were $261.5 million, $252.1 million, and $248.1 million, respectively. Excluding expenses associated with the EAR Plan, for the years ended December 31, 2016, 2015 and 2014, selling expenses were $259.7 million, $238.5 million, and $233.2 million, respectively.
Advertising and promotion expenses include product endorsement arrangements with members of the various professional golf tours, media placement and production costs (television, print and internet), tour support expenses and point‑of‑sale materials. For the years ended December 31, 2016, 2015 and 2014, advertising and promotion expenses were $196.0 million, $203.3 million, and $201.6 million, respectively. Excluding expenses associated with the EAR Plan, for the years ended December 31, 2016, 2015 and 2014, advertising and promotion expenses were $196.0 million, $202.7 million, and $200.8 million, respectively.
Corporate services expenses consist of expenses related to company‑wide administrative expenses, including finance, information technology, legal and professional fees, human resources and the cost of corporate headquarters. For the years ended December 31, 2016, 2015 and 2014, corporate services expenses were $143.3 million, $148.6 million and $153.0 million, respectively. Excluding expenses associated with the EAR Plan, for the years ended December 31, 2016, 2015 and 2014, corporate services expenses were $139.5 million, $120.3 million and $121.1 million, respectively. During 2016 and 2015, corporate services expenses also included expenses incurred in connection with our initial public offering and during 2016, 2015 and 2014 included legal fees relating to a dispute arising from the indemnification obligations owed to us by Beam in connection with the 2011 Acquisition. For the years ended December 2016, 2015 and 2014, these expenses totaled $16.8 million, $2.1 million, and $1.5 million, respectively. In 2016, corporate services expenses included the one-time bonus paid to our President and Chief Executive Officer of $7.5 million. We expect to incur additional on-going corporate services expenses as a result of becoming a newly public company. These costs include expenses related to legal fees, certain audit and quarterly financial reviews, compliance with Section 404 of the Sarbanes Oxley Act of 2002, or the Sarbanes Oxley Act, board of director recruitment, and advisory accounting and other costs to ensure that our financial statements comply with applicable SEC rules.
83
Share‑based compensation related to our employees includes the expense associated with equity compensation for key management employees such as our EARs. Pursuant to the EAR Plan, we granted cash‑settled EARs to designated employees. The EARs vest over a four year period based on passage of time, Adjusted EBITDA performance and an internal rate of return as defined by the EAR Plan. All outstanding EARs under the EAR Plan vested as of December 31, 2015. Payment is equal to the common stock equivalent (as defined in the EAR Plan) (“CSE”), value less grant date value multiplied by the number of vested CSEs. The EARs are liability‑classified awards and are remeasured at each reporting period based on the then‑current projection of our CSE value. See “—Critical Accounting Policies and Estimates—Share‑Based Compensation.” The final remeasurement of the CSE value at December 31, 2016 resulted in additional EAR expense in the fourth quarter of 2016. For the years ended December 31, 2016, 2015 and 2014 expenses associated with the EARs were $6.0 million, $45.8 million and $50.7 million, respectively, of which $5.6 million, $42.6 million and $47.7 million, respectively, was included in selling, general and administrative expenses. The EAR Plan expired on December 31, 2016 and the outstanding EAR liability of $151.5 million was settled in full by a cash payout to participants during the first quarter of 2017, which payments were funded from borrowings under our delayed draw term loan A facility and borrowings under our revolving credit facility. In addition, for the year ended December 31, 2016, we incurred expenses of $14.5 million associated with RSUs and PSUs granted to designated employees in 2016 under the Acushnet Holdings Corp. 2015 Omnibus Incentive Plan (“2015 Plan”), of which $13.0 million was included in selling, general and administrative expenses. We expect to incur additional selling, general and administrative expenses with respect to such 2015 Plan equity‑based grants, and any additional equity‑based grants, in future periods. See “—Critical Accounting Policies and Estimates—Share‑Based Compensation.”
Our selling, general and administrative expenses reported on a consolidated basis can also be impacted by fluctuations in foreign currency rates. We expect our selling, general and administrative expenses will increase in future periods due to additional staffing, legal fees, and reporting and compliance costs associated with being a public company, including compliance with the Sarbanes‑Oxley Act.
Selling, general and administrative expenses in the aggregate as a percentage of net sales were 38.2%, 40.2%, 39.2% for the years ended December 31, 2016, 2015 and 2014, respectively. Excluding the expense associated with the EAR Plan and transaction fees discussed above, selling, general and administrative expenses as a percentage of net sales would have been 36.8%, 37.2% and 36.0% for the same respective periods.
Research and Development
R&D expenses include product development, product improvement, product engineering, and process improvement costs and are expensed as incurred. R&D expenses as a percentage of net sales have been generally consistent for the years ended December 31, 2016, 2015 and 2014, at 3.1%, 3.1% and 2.9%, respectively, reflecting our continuing commitment to investment in product innovation. Excluding the expense associated with EAR Plan discussed above, R&D expenses as a percentage of net sales would have been 3.1%, 2.9% and 2.7% for the same respective periods. For the year ended December 31, 2016, we incurred expenses associated with RSUs and PSUs granted under the 2015 Plan to designated employees in the second quarter of 2016, of which $1.1 million was included in R&D expenses. We expect to incur additional R&D expenses with respect to such equity‑based grants, and any additional equity‑based grants, in future periods. See “—Critical Accounting Policies and Estimates—Share‑Based Compensation.”
Intangible Amortization
Intangible assets other than goodwill are amortized over their useful lives in accordance with ASC 350, unless those lives are determined to be indefinite. Intangible amortization expense is primarily related to our completed technology and customer relationships, which arose through purchase accounting related to the Acquisition. The weighted average amortization period is 13 years for completed technology and 20 years for customer relationships.
Restructuring Charges
Restructuring charges represent costs incurred as a result of our reorganization initiatives and include employee severance costs and related benefits.
84
Interest Expense, Net
Interest expense, net, consists primarily of interest on borrowings under our Convertible Notes, bonds with common stock warrants, secured floating rate notes, credit facilities and our capital lease obligations, partially offset by interest earned on our cash and cash equivalents. Our interest income has not been significant due to low interest earned on invested balances.
After giving effect to the conversion of all of our Convertible Notes prior to the closing of our initial public offering, the exercise by Fila Korea of all of our outstanding warrants and related redemption of our outstanding 7.5% bonds due 2021, which occurred in July 2016, and the Refinancing, we expect our annual interest expense to be significantly lower than it was prior to such transactions.
Other (Income) Expense, Net
Other (income) expense, net primarily consists of the non‑cash change in the fair value of our common stock warrants and any change in the value of the indemnification asset related to the Acquisition. Our common stock warrants were issued in connection with our 7.5% bonds due 2021 in connection with the Acquisition. We classified these warrants to purchase common stock as a liability on our consolidated balance sheet as the warrants were free‑standing financial instruments that may result in the issuance of a variable number of our common shares. The common stock warrants were re‑measured to fair value at each reporting date and changes in the fair value of the common stock warrants were recognized as other (income) expense, net on our consolidated statement of operations. The fair value of the common stock warrants was determined using the contingent claims methodology and was impacted by a number of variables including the business enterprise value of the Company, volatility and the risk‑free rate. An increase in the fair value of the common stock warrants resulted in an increase in the corresponding liability and as such, was recorded as a loss in other (income) expense, net on our consolidated statement of operations. A decrease in the fair value of the common stock warrants resulted in a decrease in the corresponding liability and as such, was recorded as a gain in other (income) expense, net on our consolidated statement of operations. The common stock warrants no longer have an impact on our net income as the remaining warrants were exercised by Fila Korea in July 2016.
In connection with the Acquisition, Beam agreed to indemnify us for certain tax obligations that relate to periods during which Beam owned Acushnet Company. These tax obligations are recorded in accrued taxes and other noncurrent liabilities, and the related indemnification receivable is recorded in other current and noncurrent assets on the consolidated balance sheet. Any changes in the value of these tax obligations are recorded in income tax expense and the related change in the indemnification asset is recorded in other (income) expense, net on the consolidated statement of income.
Income Tax Expense
We are subject to income taxes in the United States and foreign jurisdictions in which we do business. These foreign jurisdictions have statutory tax rates that are lower than the United States, although U.S. tax is provided on certain of our foreign earnings. Our effective tax rate (“ETR”), will vary depending upon the relative proportion of foreign to U.S. earnings, changes in the value and realizability of our deferred tax assets and liabilities, changes in indemnified taxes, changes to tax laws and rulings in the jurisdictions in which we do business, as well as changes to well established international tax principles. For fiscal years during which common stock warrants were outstanding, our ETR varied due to the recording of non‑cash fair value gains and losses related to the common stock warrants which are not tax effected. The common stock warrants will no longer have an impact on our ETR as the remaining warrants were exercised by FILA Korea in July 2016.
Noncontrolling Interests
In 1995, we entered into an agreement with our Taiwan supply partners to form a joint venture in China for the purpose of manufacturing our FootJoy golf shoes. The joint venture was formed under the laws of the Cayman Islands and owns an entity organized under the laws of China that is responsible for manufacturing and an entity organized under the laws of Hong Kong that is responsible for facilitating exports and imports in connection with the joint venture. We also maintain a representative office in Taiwan that acts as a liaison between us and our joint venture.
85
We own 40% of the joint venture while our partners own the other 60%. We are entitled to appoint two of the five directors of the joint venture and certain enumerated matters require the consent of a majority of the directors appointed by us and certain other enumerated matters, including an amendment to the joint venture’s organizational documents, require a special resolution passed by 75% of the outstanding shares, which means we must consent to such matters.
The joint venture is obligated under the terms of the joint venture agreement to manufacture shoes solely for us. The joint venture cannot exist without this activity and orders made by us. The joint venture is a variable interest entity, or VIE. As a result of our ability to direct the activities that most significantly impact the joint venture’s economic performance and because the sole purpose of the joint venture is to manufacture our golf shoes, we are deemed the primary beneficiary of the VIE under Accounting Standards Codification 810 and we consolidate the accounts of the joint venture in our consolidated financial statements. The noncontrolling interests represent the 60% interest in the joint venture that we do not own.
Results of Operations
The following table sets forth, for the periods indicated, our results of operations.
|
|
|
Year ended December 31, |
|
|||||||
|
|
|
2016 |
|
2015 |
|
2014 |
|
|||
|
|
|
(in thousands) |
|
|||||||
|
Net sales |
|
$ |
1,572,275 |
|
$ |
1,502,958 |
|
$ |
1,537,610 |
|
|
Cost of goods sold |
|
|
773,550 |
|
|
727,120 |
|
|
779,678 |
|
|
Gross profit |
|
|
798,725 |
|
|
775,838 |
|
|
757,932 |
|
|
Operating expenses: |
|
|
|
|
|
|
|
|
|
|
|
Selling, general and administrative |
|
|
600,804 |
|
|
604,018 |
|
|
602,755 |
|
|
Research and development |
|
|
48,804 |
|
|
45,977 |
|
|
44,243 |
|
|
Intangible amortization |
|
|
6,608 |
|
|
6,617 |
|
|
6,687 |
|
|
Restructuring charges |
|
|
1,673 |
|
|
1,643 |
|
|
— |
|
|
Income from operations |
|
|
140,836 |
|
|
117,583 |
|
|
104,247 |
|
|
Interest expense, net |
|
|
49,908 |
|
|
60,294 |
|
|
63,529 |
|
|
Other (income) expense, net |
|
|
1,706 |
|
|
25,139 |
|
|
(1,348) |
|
|
Income before income taxes |
|
|
89,222 |
|
|
32,150 |
|
|
42,066 |
|
|
Income tax expense |
|
|
39,707 |
|
|
27,994 |
|
|
16,700 |
|
|
Net income |
|
|
49,515 |
|
|
4,156 |
|
|
25,366 |
|
|
Less: Net income attributable to noncontrolling interests |
|
|
(4,503) |
|
|
(5,122) |
|
|
(3,809) |
|
|
Net income (loss) attributable to Acushnet Holdings Corp. |
|
$ |
45,012 |
|
$ |
(966) |
|
$ |
21,557 |
|
|
|
|
|
|
|
|
|
|
|
|
|
|
Adjusted EBITDA: |
|
|
|
|
|
|
|
|
|
|
|
Net income (loss) attributable to Acushnet Holdings Corp. |
|
$ |
45,012 |
|
$ |
(966) |
|
$ |
21,557 |
|
|
Income tax expense |
|
|
39,707 |
|
|
27,994 |
|
|
16,700 |
|
|
Interest expense, net |
|
|
49,908 |
|
|
60,294 |
|
|
63,529 |
|
|
Depreciation and amortization |
|
|
40,834 |
|
|
41,702 |
|
|
43,159 |
|
|
EAR Plan(a) |
|
|
6,047 |
|
|
45,814 |
|
|
50,713 |
|
|
Shared based compensation(b) |
|
|
14,494 |
|
|
5,789 |
|
|
1,977 |
|
|
One time executive bonus(c) |
|
|
7,500 |
|
|
— |
|
|
— |
|
|
Restructuring charges(d) |
|
|
1,673 |
|
|
1,643 |
|
|
— |
|
|
Thailand golf ball manufacturing plant start-up costs(e) |
|
|
— |
|
|
— |
|
|
788 |
|
|
Transaction fees(f) |
|
|
16,817 |
|
|
2,141 |
|
|
1,490 |
|
|
Beam indemnification expense (income)(g) |
|
|
(2,174) |
|
|
(3,007) |
|
|
1,386 |
|
|
(Gains) losses on the fair value of our common stock warrants(h) |
|
|
6,112 |
|
|
28,364 |
|
|
(1,887) |
|
|
Other non-cash (gains) losses, net |
|
|
(592) |
|
|
(169) |
|
|
(628) |
|
|
Nonrecurring expense (income)(i) |
|
|
(1,467) |
|
|
— |
|
|
— |
|
|
Net income attributable to noncontrolling interests(j) |
|
|
4,503 |
|
|
5,122 |
|
|
3,809 |
|
|
Adjusted EBITDA |
|
$ |
228,374 |
|
$ |
214,721 |
|
$ |
202,593 |
|
|
Adjusted EBITDA margin |
|
|
14.5% |
% |
|
14.3 |
% |
|
13.2 |
% |
|
(a) |
Reflects expenses related to the anticipated full vesting of EARs granted under our EAR Plan and remeasurement of the liability at each reporting period based on the then‑current projection of our CSE value. See “—Critical |
86
Accounting Policies and Estimates—Share‑Based Compensation.” All outstanding EARs under the EAR Plan vested as of December 31, 2015. The EAR Plan expired on December 31, 2016 and the outstanding EAR liability of $151.5 million was settled in full by a cash payout to participants during the first quarter of 2017. |
|
(b) |
For the year ended December 31, 2016, reflects compensation expenses with respect to equity‑based grants under the 2015 Incentive Plan which were made in 2016. For the years ended December 31, 2014 and 2015, reflects compensation expense associated with the exercise of substitute stock options by an executive, which were granted in connection with the Acquisition. All such stock options have been exercised. |
|
(c) |
In the first quarter of 2016, our President and Chief Executive Officer was awarded a cash bonus in the amount of $7.5 million as consideration for past performance. |
|
(d) |
Reflects restructuring charges incurred in connection with the reorganization of certain of our operations in 2016 and 2015. |
|
(e) |
Reflects expenses incurred in connection with the construction and production ramp‑up of our golf ball manufacturing plant in Thailand. |
|
(f) |
Reflects certain fees and expenses we incurred in 2016 and 2015 in connection with our initial public offering and legal fees incurred in all years presented relating to a dispute arising from the indemnification obligations owed to us by Beam in connection with the Acquisition. |
|
(g) |
Reflects the non‑cash charges related to the indemnification obligations owed to us by Beam that are included when calculating net income (loss) attributable to Acushnet Holdings Corp. |
|
(h) |
Fila Korea exercised all of our outstanding common stock warrants in July 2016 and we used the proceeds from such exercise to redeem all of our outstanding 7.5% bonds due 2021. |
|
(i) |
Reflects legal judgment in favor of us associated with the Beam value‑added tax dispute recorded in other (income) expense. |
|
(j) |
Reflects the net income attributable to the interest that we do not own in our FootJoy golf shoe joint venture. |
Year Ended December 31, 2016 Compared to the Year Ended December 31, 2015
Net Sales
Net sales increased by $69.3 million, or 4.6%, to $1,572.3 million for the year ended December 31, 2016 compared to $1,503.0 million for the year ended December 31, 2015. On a constant currency basis, net sales would have increased by $67.2 million, or 4.5%, to $1,570.2 million. This constant currency increase was primarily due to an increase of $38.1 million in net sales of Titleist golf clubs driven by increases in average selling prices and sales volume increases associated with our 2016 new product launches, an increase of $15.1 million in net sales of FootJoy golf wear driven by sales volume increases in FootJoy apparel and FootJoy glove categories, and an increase of $7.1 million in net sales of Titleist golf gear driven by sales volume growth in travel gear and Titleist gloves categories. These net sales increases were offset partially by a decrease of $20.0 million in net sales of Titleist golf balls largely driven by off course retail channel disruption in the United States. The remaining increase in net sales was attributable to an accounting adjustment related to the commissions paid on certain retail sales in Korea as discussed in “Notes to Consolidated Financial Statements – Note 22 – Unaudited Quarterly Financial Data” and to sales volume growth, in each case with respect to products that are sold in regions outside the United States and that are not allocated to one of our four reportable segments.
87
Net sales by reportable segment is summarized as follows:
|
|
|
Year ended |
|
|
|
|
|
|
Constant Currency |
|
|||||||
|
|
|
December 31, |
|
Increase/(Decrease) |
|
Increase/(Decrease) |
|
||||||||||
|
|
|
2016 |
|
2015 |
|
$ change |
|
% change |
|
$ change |
|
% change |
|
||||
|
|
|
(in thousands) |
|
||||||||||||||
|
Titleist golf balls |
|
$ |
513,899 |
|
$ |
535,465 |
|
$ |
(21,566) |
|
(4.0) |
% |
$ |
(19,956) |
|
(3.7) |
% |
|
Titleist golf clubs |
|
|
430,966 |
|
|
388,304 |
|
|
42,662 |
|
11.0 |
% |
|
38,082 |
|
9.8 |
% |
|
Titleist golf gear |
|
|
136,208 |
|
|
129,408 |
|
|
6,800 |
|
5.3 |
% |
|
7,055 |
|
5.5 |
% |
|
FootJoy golf wear |
|
|
433,061 |
|
|
418,852 |
|
|
14,209 |
|
3.4 |
% |
|
15,112 |
|
3.6 |
% |
For further discussion of each reportable segment’s results, see “—Segment Results—Titleist Golf Balls Segment,” “—Segment Results—Titleist Golf Clubs Segment,” “—Segment Results—Titleist Golf Gear Segment” and “—Segment Results—FootJoy Golf Wear Segment” results below.
Net sales information by region is summarized as follows:
|
|
|
Year ended |
|
|
|
|
|
|
Constant Currency |
|
|||||||
|
|
|
December 31, |
|
Increase/(Decrease) |
|
Increase/(Decrease) |
|
||||||||||
|
|
|
2016 |
|
2015 |
|
$ change |
|
% change |
|
$ change |
|
% change |
|
||||
|
|
|
(in thousands) |
|
||||||||||||||
|
United States |
|
$ |
804,516 |
|
$ |
805,470 |
|
$ |
(954) |
|
(0.1) |
% |
$ |
(954) |
|
(0.1) |
% |
|
EMEA |
|
|
210,088 |
|
|
201,106 |
|
|
8,982 |
|
4.5 |
% |
|
19,940 |
|
9.9 |
% |
|
Japan |
|
|
219,021 |
|
|
182,163 |
|
|
36,858 |
|
20.2 |
% |
|
13,833 |
|
7.6 |
% |
|
Korea |
|
|
175,956 |
|
|
144,956 |
|
|
31,000 |
|
21.4 |
% |
|
35,426 |
|
24.4 |
% |
|
Rest of world |
|
|
162,694 |
|
|
169,263 |
|
|
(6,569) |
|
(3.9) |
% |
|
(1,017) |
|
(0.6) |
% |
|
Total sales |
|
$ |
1,572,275 |
|
$ |
1,502,958 |
|
$ |
69,317 |
|
4.6 |
% |
$ |
67,228 |
|
4.5 |
% |
Net sales in the United States decreased by $1.0 million, or 0.1%, to $804.5 million for the year ended December 31, 2016 compared to $805.5 million for the year ended December 31, 2015. This was due to a decrease of $15.3 million in net sales of Titleist golf balls, partially offset by an increase of $16.2 million in net sales of Titleist golf club sales and slight increases in net sales of Titleist golf gear and FootJoy golf wear. Net sales in the United States were impacted by retail channel disruption caused by the bankruptcy of The Sports Authority, Inc. and the reorganization efforts and ultimate bankruptcy of Golfsmith International Holdings LP.
Our sales in regions outside of the United States increased by $70.3 million, or 10.1%, to $767.8 million for the year ended December 31, 2016 compared to $697.5 million for the year ended December 31, 2015. On a constant currency basis, net sales in such regions would have increased by $68.2 million, or 9.8%, to $765.7 million, driven by an increase of $21.9 million in net sales of Titleist golf clubs, an increase of $15.3 million in net sales of FootJoy golf wear, and an increase of $8.7 million in net sales of Titleist golf gear, offset partially by a decrease of $4.7 million in net sales of Titleist golf balls. The remaining increase in net sales for regions outside the United States was attributable to an accounting adjustment related to the commissions paid on certain retail sales in Korea as discussed in “Notes to Consolidated Financial Statements – Note 22 – Unaudited Quarterly Financial Data” and to sales volume growth, in each case with respect to products that are not allocated to one of our four reportable segments.
More information on our net sales by reportable segment and by region can be found in “Notes to Consolidated Financial Statements – Note 20—Segment Information.”
Gross Profit
Gross profit increased by $22.9 million to $798.7 million for the year ended December 31, 2016 from $775.8 million for the year ended December 31, 2015. Gross margin decreased to 50.8% for the year ended December 31, 2016 compared to 51.6% for the year ended December 31, 2015. The increase in gross profit was driven by a $23.1 million increase in gross profit in Titleist golf clubs due to increases in average selling prices and higher golf club sales volumes and an increase in gross profit from our products not allocated to one of our four reportable segments primarily as a result of an accounting adjustment related to the commissions paid on certain retail sales in Korea as discussed in “Notes to Consolidated Financial Statements – Note 22 – Unaudited Quarterly Financial Data.” These increases in gross profit were offset in part by a $23.4 million decrease in gross profit in Titleist golf balls as a result of
88
lower sales volume. The decrease in gross margin was primarily due to lower gains on foreign currency exchange contracts compared to the year ended December 31, 2015, partially offset by the accounting adjustment discussed above.
Selling, General and Administrative Expenses
Selling, general and administrative expenses decreased by $3.2 million to $600.8 million for the year ended December 31, 2016 from $604.0 million for the year ended December 31, 2015. Excluding the expense associated with our EAR plan, selling, general and administrative expenses would have increased by $33.8 million to $595.2 million for the year ended December 31, 2016 from $561.4 million for the year ended December 31, 2015. This increase was due to a $35.3 million aggregate increase primarily attributable to an accounting adjustment related to the commissions paid on certain retail sales in Korea as discussed in “Notes to Consolidated Financial Statements – Note 22 – Unaudited Quarterly Financial Data,” an increase of $14.7 million in transaction costs related to our initial public offering, a $7.5 million one-time executive bonus, a $7.2 million increase in share based compensation and a $1.7 million increase in bad debt expense primarily related to a large off-course retail account as well as additional marketing and promotional costs related to our FootJoy eCommerce and women’s golf apparel initiatives and new golf club product launches. This was partially offset by a decrease of $7.8 million in associate incentive compensation accruals, and a $6.0 million decrease in professional tour costs as well as lower golf ball marketing and promotional costs. Changes in foreign currency exchange rates had a favorable impact of $1.5 million.
Research and Development
R&D expenses increased by $2.8 million to $48.8 million for the year ended December 31, 2016 from $46.0 million for the year ended December 31, 2015. Excluding the expense associated with our EAR Plan, R&D expenses would have increased by $5.1 million to $48.5 million for the year ended December 31, 2016 from $43.4 million for the year ended December 31, 2015. This increase was mainly attributable to employee related costs, including share based compensation, and additional experimental costs to support new product introductions. As a percentage of consolidated net sales, R&D expenses excluding expenses associated with our EAR Plan were 3.1% in 2016, up from 2.9% in 2015.
Intangible Amortization
Intangible amortization expenses were $6.6 million for the year ended December 31, 2016 and $6.6 million for the year ended December 31, 2015.
Restructuring Charges
Restructuring charges were $1.7 million for the year ended December 31, 2016 compared to $1.6 million for the year ended December 31, 2015.
Interest Expense, net
Interest expense decreased by $10.4 million to $49.9 million for the year ended December 31, 2016 compared to $60.3 million for the year ended December 31, 2015. This decrease was primarily due to lower average outstanding borrowings during the year ended December 31, 2016 as a result of the redemption of $34.5 million of the principal of our outstanding 7.5% bonds due 2021 using the proceeds of the exercise of a portion of our outstanding common stock warrants in July 2015, as well as a scheduled repayment of $50.0 million of the principal on our secured floating rate notes in October 2015. In addition, the average interest rate on outstanding borrowings was lower during the year ended December 31, 2016 as a result of the Refinancing which was completed in July 2016.
Other (Income) Expense, net
Other expense decreased by $23.4 million to $1.7 million for the year ended December 31, 2016 compared to other expense of $25.1 million for the year ended December 31, 2015. This change was primarily due to a decrease in the recognition of a loss of $6.1 million in 2016 on the fair value measurement of the common stock warrants compared to the recognition of a loss of $28.4 million on the fair value measurement of the common stock warrants in 2015. The loss on the fair value measurement of the common stock warrants in 2015 was due to a significant increase in our business enterprise value during such year that was primarily driven by a decrease in our weighted average cost of
89
capital and an increase in our long‑term growth expectation, which reflected a more favorable long‑term market outlook, and increases in the valuations realized by a number of the publicly‑traded companies within our peer group. The business enterprise value is a key input in the contingent claims analysis which is the methodology utilized to measure the fair value of the common stock warrants. In addition, income of $1.5 million was recorded in 2016 to recognize the legal judgment in favor of us associated with the Beam value-added tax dispute.
Income Tax Expense
Income tax expense increased by $11.7 million, or 41.8%, to $39.7 million for the year ended December 31, 2016, compared to $28.0 million for the year ended December 31, 2015. Our ETR was 44.5% for the year ended December 31, 2016, compared to 87.1% for the year ended December 31, 2015. The decrease in ETR was primarily driven by the reduction in non-cash fair value losses on the common stock warrants, which are not tax effected, offset by an increase in non-deductible transaction costs.
Net Income (Loss) Attributable to Acushnet Holdings Corp.
Net income (loss) attributable to Acushnet Holdings Corp. increased by $46.0 million to net income attributable to Acushnet Holdings Corp. of $45.0 million for the year ended December 31, 2016 compared to a net loss attributable to Acushnet Holdings Corp. of $1.0 million for the year ended December 31, 2015. This change was primarily a result of lower other expense, higher income from operations and lower interest expense, which were offset in part by higher income tax expense, all of which are described above.
Adjusted EBITDA
Adjusted EBITDA increased by $13.7 million to $228.4 million for the year ended December 31, 2016 compared to $214.7 million for the year ended December 31, 2015. Adjusted EBITDA margin increased to 14.5% in 2016 from 14.3% in 2015.
Segment Results
Net sales by reportable segment is summarized as follows:
|
|
|
Year ended |
|
|
|
|
|
|
Constant Currency |
|
|||||||
|
|
|
December 31, |
|
Increase/(Decrease) |
|
Increase/(Decrease) |
|
||||||||||
|
|
|
2016 |
|
2015 |
|
$ change |
|
% change |
|
$ change |
|
% change |
|
||||
|
|
|
(in thousands) |
|
||||||||||||||
|
Titleist golf balls |
|
$ |
513,899 |
|
$ |
535,465 |
|
$ |
(21,566) |
|
(4.0) |
% |
$ |
(19,956) |
|
(3.7) |
% |
|
Titleist golf clubs |
|
|
430,966 |
|
|
388,304 |
|
|
42,662 |
|
11.0 |
% |
|
38,082 |
|
9.8 |
% |
|
Titleist golf gear |
|
|
136,208 |
|
|
129,408 |
|
|
6,800 |
|
5.3 |
% |
|
7,055 |
|
5.5 |
% |
|
FootJoy golf wear |
|
|
433,061 |
|
|
418,852 |
|
|
14,209 |
|
3.4 |
% |
|
15,112 |
|
3.6 |
% |
Segment operating income by reportable segment is summarized as follows:
|
|
|
Year |
|
|
|
|
|
|
||||
|
|
|
ended December 31, |
|
Increase/(Decrease) |
|
|||||||
|
|
|
2016 |
|
2015 |
|
$ change |
|
% change |
|
|||
|
|
|
(in thousands) |
|
|||||||||
|
Segment operating income(1) |
|
|
|
|
|
|
|
|
|
|
|
|
|
Titleist golf balls |
|
$ |
76,236 |
|
$ |
92,507 |
|
$ |
(16,271) |
|
(17.6) |
% |
|
Titleist golf clubs |
|
|
50,500 |
|
|
33,593 |
|
|
16,907 |
|
50.3 |
% |
|
Titleist golf gear |
|
|
12,119 |
|
|
12,170 |
|
|
(51) |
|
(0.4) |
% |
|
FootJoy golf wear |
|
|
18,979 |
|
|
26,056 |
|
|
(7,077) |
|
(27.2) |
% |
|
(1) |
Expenses relating to the EAR Plan, transaction fees and restructuring charges and other non-operating gains and losses, to the extent incurred in the applicable period, are not reflected in segment operating income. |
More information on our net sales by reportable segment and segment operating income can be found in “Notes to Consolidated Financial Statements – Note 20—Segment Information.”
90
Titleist Golf Balls Segment
Net sales in our Titleist golf balls segment decreased by $21.6 million, or 4.0%, to $513.9 million for the year ended December 31, 2016 compared to $535.5 million for the year ended December 31, 2015. On a constant currency basis, net sales in our Titleist golf balls segment would have decreased by $20.0 million, or 3.7%, to $515.5 million. This was driven by the U.S. retail channel disruption caused by the bankruptcy of The Sports Authority, Inc. and the reorganization efforts and ultimate bankruptcy of Golfsmith International Holdings LP which contributed to a sales volume decline of our 2015 model Pro V1 and Pro V1x golf balls, which were in their second model year, as well as a sales volume decline in our Pinnacle models. The decrease was offset slightly by a sales volume increase of our newly introduced performance golf ball models, which performance golf ball models have a lower average selling price than our Pro V1 franchise.
Titleist golf balls segment operating income decreased by $16.3 million, or 17.6%, to $76.2 million for the year ended December 31, 2016 compared to $92.5 million for the year ended December 31, 2015, primarily due to a decrease in gross profit of $23.4 million which was partially offset by lower operating expenses. The decrease in gross profit was due to a decline in sales volumes as discussed above, unfavorable manufacturing overhead absorption due to lower golf ball production volume, and lower gains on foreign currency exchange contracts compared to the year ended December 31, 2015. Lower operating expenses were primarily due to decreases of $5.8 million in golf ball marketing, promotion and selling costs, $4.0 million in professional tour costs and $1.6 million in incentive and share based compensation accruals, and were offset in part by a $2.9 million segment allocation of the one-time executive bonus and an increase of $1.2 million bad debt expense.
Titleist Golf Clubs Segment
Net sales in our Titleist golf clubs segment increased by $42.7 million, or 11.0%, to $431.0 million for the year ended December 31, 2016 compared to $388.3 million for the year ended December 31, 2015. On a constant currency basis, net sales in our Titleist golf clubs segment would have increased by $38.1 million, or 9.8%, to $426.4 million. The increase in net sales was primarily due to an increase in average selling prices on wedges, irons and putters and higher sales volumes of our new Vokey Design wedges launched in the first quarter of 2016, our new drivers and fairways launched during 2016, and our new Scotty Cameron Select putters launched in the first quarter of 2016. This increase was partially offset by lower sales volumes of our hybrids.
Titleist golf clubs segment operating income increased by $16.9 million, or 50.3%, to $50.5 million for the year ended December 31, 2016 compared to $33.6 million for the year ended December 31, 2015, primarily due to an increase in gross profit of $23.1 million which was offset in part by higher operating expenses. The increase in gross profit was primarily due to an increase in average selling prices on irons, wedges and putters and the increased sales volumes as discussed above and was partially offset by lower gains on foreign currency exchange contracts compared to the twelve months ended December 31, 2015. Operating expenses increased primarily due to an increase of $5.1 million in marketing, promotional and research and development costs related to our new product launches and a $1.8 million expense related to the segment allocation of the one‑time executive bonus.
Titleist Golf Gear Segment
Net sales in our Titleist golf gear segment increased by $6.8 million, or 5.3%, to $136.2 million for the year ended December 31, 2016 compared to $129.4 million for the year ended December 31, 2015. On a constant currency basis, net sales in our Titleist golf gear segment would have increased by $7.1 million, or 5.5%, to $136.5 million. The constant currency increase was primarily due to sales volume growth in travel gear and both volume growth and increased average selling prices in Titleist gloves.
Titleist golf gear segment operating income declined slightly by $0.1 million, or 0.4%, to $12.1 million for the year ended December 31, 2016 compared to $12.2 million for the year ended December 31, 2015. Gross profit increased by $1.7 million on the increased sales discussed above. Gross margin was unfavorably impacted by lower gains on foreign currency exchange contracts compared to the year ended December 31, 2015. Offsetting the increase in gross profit were higher R&D and selling expenses in support of our golf gear initiatives.
91
FootJoy Golf Wear Segment
Net sales in our FootJoy golf wear segment increased by $14.2 million, or 3.4%, to $433.1 million for the year ended December 31, 2016 compared to $418.9 million for the year ended December 31, 2015. On a constant currency basis, net sales in our FootJoy golf wear segment would have increased by $15.1 million, or 3.6%, to $434.0 million. This increase was due to sales volume growth in our apparel and glove categories.
FootJoy golf wear segment operating income decreased by $7.1 million, or 27.2 %, to $19.0 million for the year ended December 31, 2016 compared to $26.1 million for the year ended December 31, 2015. Gross profit increased by $1.1 million on the increased sales discussed above. Gross margin was lower primarily due to a decrease in gains on foreign currency exchange contracts compared to the year ended December 31, 2015 and unfavorable manufacturing overhead absorption due to lower footwear production volume. Operating expenses increased primarily due to an increase of $4.3 million in costs related to our FootJoy eCommerce and women’s golf apparel initiatives, a $2.1 million expense related to the segment allocation of the one‑time executive bonus, and an increase of $1.2 million in incentive and share based compensation accruals.
Year Ended December 31, 2015 Compared to the Year Ended December 31, 2014
Net Sales
Net sales decreased by $34.7 million, or 2.3%, to $1,503.0 million for the year ended December 31, 2015 compared to $1,537.6 million for the year ended December 31, 2014. Net sales were significantly affected by the impact of a strong U.S. dollar on our net sales outside the United States. On a constant currency basis, net sales would have increased by $54.1 million, or 3.5%, to $1,591.7 million. This constant currency increase was driven by an increase of $24.4 million in net sales of FootJoy golf wear driven by sales volume growth across all major categories, an increase of $17.3 million in net sales of Titleist golf balls as a result of the introduction of the latest generation of Pro V1 and Pro V1x golf balls in the first quarter of 2015 and an increase of $9.4 million in net sales of Titleist golf gear driven by sales volume growth in all categories, which was offset in part by a decrease of $8.8 million in net sales of Titleist golf clubs. The remaining increase in net sales was due to sales volume growth of products that are sold in regions outside of the United States and that are not allocated to one of our four reportable segments.
Net sales by reportable segment is summarized as follows:
|
|
|
Year ended |
|
|
|
|
|
|
Constant Currency |
|
|||||||
|
|
|
December 31, |
|
Increase/(Decrease) |
|
Increase/(Decrease) |
|
||||||||||
|
|
|
2015 |
|
2014 |
|
$ change |
|
% change |
|
$ change |
|
% change |
|
||||
|
|
|
(in thousands) |
|
||||||||||||||
|
Titleist golf balls |
|
$ |
535,465 |
|
$ |
543,843 |
|
$ |
(8,378) |
|
(1.5) |
% |
$ |
17,321 |
|
3.2 |
% |
|
Titleist golf clubs |
|
|
388,304 |
|
|
422,383 |
|
|
(34,079) |
|
(8.1) |
% |
|
(8,815) |
|
(2.1) |
% |
|
Titleist golf gear |
|
|
129,408 |
|
|
127,875 |
|
|
1,533 |
|
1.2 |
% |
|
9,374 |
|
7.3 |
% |
|
FootJoy golf wear |
|
|
418,852 |
|
|
421,632 |
|
|
(2,780) |
|
(0.7) |
% |
|
24,446 |
|
5.8 |
% |
For further discussion of each reportable segment’s results, see “—Segment Results—Titleist Golf Balls Segment,” “—Segment Results—Titleist Golf Clubs Segment,” “—Segment Results—Titleist Golf Gear Segment” and “—Segment Results—FootJoy Golf Wear Segment” results below.
92
Net sales information by region is summarized as follows:
|
|
|
Year ended |
|
|
|
|
|
|
Constant Currency |
|
|||||||
|
|
|
December 31, |
|
Increase/(Decrease) |
|
Increase/(Decrease) |
|
||||||||||
|
|
|
2015 |
|
2014 |
|
$ change |
|
% change |
|
$ change |
|
% change |
|
||||
|
|
|
(in thousands) |
|
||||||||||||||
|
United States |
|
$ |
805,470 |
|
$ |
793,328 |
|
$ |
12,142 |
|
1.5 |
% |
$ |
12,142 |
|
1.5 |
% |
|
EMEA |
|
|
201,106 |
|
|
216,531 |
|
|
(15,425) |
|
(7.1) |
% |
|
16,280 |
|
7.5 |
% |
|
Japan |
|
|
182,163 |
|
|
195,762 |
|
|
(13,599) |
|
(6.9) |
% |
|
13,566 |
|
6.9 |
% |
|
Korea |
|
|
144,956 |
|
|
141,168 |
|
|
3,788 |
|
2.7 |
% |
|
14,585 |
|
10.3 |
% |
|
Rest of world |
|
|
169,263 |
|
|
190,821 |
|
|
(21,558) |
|
(11.3) |
% |
|
(2,458) |
|
(1.3) |
% |
|
Total sales |
|
$ |
1,502,958 |
|
$ |
1,537,610 |
|
$ |
(34,652) |
|
(2.3) |
% |
$ |
54,115 |
|
3.5 |
% |
Net sales in the United States increased by $12.1 million, or 1.5%, to $805.5 million for the year ended December 31, 2015 compared to $793.3 million for the year ended December 31, 2014. This increase in net sales in the United States was due to an increase of $8.5 million in net sales of Titleist golf ball sales and an increase of $6.4 million in net sales of FootJoy golf wear, offset in part by a decrease of $3.4 million in net sales of Titleist golf clubs.
Our sales in regions outside of the United States decreased by $46.8 million, or 6.2%, to $697.5 million for the year ended December 31, 2015 compared to $744.3 million for the year ended December 31, 2014. This decrease in net sales in regions outside of the United States was largely due to the impact of unfavorable foreign currency translation. On a constant currency basis, net sales in such regions would have increased by $42.0 million, or 5.6%, to $786.3 million, driven by an increase of $18.0 million in net sales of FootJoy golf wear, an increase of $8.8 million in net sales of Titleist golf gear, and an increase of $8.8 million in net sales of Titleist golf balls, offset partially by a decrease of $5.5 million in net sales of Titleist golf clubs.
More information on our net sales by reportable segment and by region can be found in “Notes to Consolidated Financial Statements – Note 20—Segment Information.”
Gross Profit
Gross profit increased by $17.9 million to $775.8 million for the year ended December 31, 2015 from $757.9 million for the year ended December 31, 2014. Gross margin increased to 51.6% for the year ended December 31, 2015 compared to 49.3% for the year ended December 31, 2014. This increase in gross margin was primarily due to the introduction of the latest generation of Pro V1 and Pro V1x golf balls in the first quarter of 2015 which led to a favorable golf ball mix shift to the Pro V1 franchise. This was coupled with overhead absorption and savings associated with operations at our golf ball manufacturing plant in Thailand achieved as a result of production ramp‑up, as well as lower ball raw material cost.
Selling, General and Administrative Expenses
Selling, general and administrative expenses increased by $1.2 million to $604.0 million for the year ended December 31, 2015 from $602.8 million for the year ended December 31, 2014. Excluding the expense associated with our EAR plan, selling, general and administrative expenses would have increased by $6.3 million to $561.4 million for the year ended December 31, 2015 from $555.1 million for the year ended December 31, 2014. This increase was due to a $27.3 million aggregate increase primarily attributable to an increase of $7.3 million in outbound shipping and handling costs on increased sales volume, an increase of $5.4 million in tour endorsement costs, an increase of $4.9 million in staffing and related expenses which include investments in our FootJoy eCommerce and Titleist golf gear initiatives, an increase of $3.8 million in share‑based compensation expense, and an increase of $2.7 million in spending on point‑of‑sale materials. This increase was largely offset by a $21.0 million favorable impact of changes in foreign currency exchange rates.
Research and Development
R&D expenses increased by $1.8 million, or 3.9%, to $46.0 million for the year ended December 31, 2015 from $44.2 million for the year ended December 31, 2014. Excluding expenses associated with our EAR Plan, R&D expenses would have increased by $1.5 million to $43.4 million for the year ended December 31, 2015 from $41.9 million for
93
the year ended December 31, 2014. This increase was mainly attributable to increased staffing related to golf club R&D in support of future product launches. As a percentage of consolidated net sales, R&D expenses excluding expenses associated with our EAR Plan were 2.9% in 2015, up slightly from 2.7% in 2014.
Intangible Amortization
Intangible amortization expenses were $6.6 million for the year ended December 31, 2015 and $6.7 million for the year ended December 31, 2014.
Restructuring Charges
Restructuring charges were $1.6 million for the year ended December 31, 2015 compared to no restructuring charges for the year ended December 31, 2014.
Interest Expense, net
Interest expense decreased by $3.2 million to $60.3 million for the year ended December 31, 2015 compared to $63.5 million for the year ended December 31, 2014. This decrease was primarily due to lower average outstanding borrowings in 2015 as a result of the redemptions of $34.5 million and $34.5 million of the principal of our outstanding 7.5% bonds due 2021 using the proceeds of the exercise of a portion of our outstanding common stock warrants in July 2015 and July 2014, respectively, as well as scheduled repayments of $50.0 million and $50.0 million of the principal on our secured floating rate notes in October 2015 and October 2014, respectively.
Other (Income) Expense, net
Other expense increased by $26.4 million to $25.1 million for the year ended December 31, 2015 compared to other income of $1.3 million for the year ended December 31, 2014. This change was primarily due to the recognition of a loss of $28.4 million on the fair value measurement of the common stock warrants during the year ended December 31, 2015 compared to a gain of $1.9 million during the year ended December 31, 2014. The loss on the fair value measurement of the common stock warrants for the year ended December 31, 2015 was due to a significant increase in our business enterprise value during such year that was primarily driven by a decrease in our weighted average cost of capital and an increase in our long‑term growth expectation, which reflects a more favorable long‑term market outlook, and increases in the valuations realized by a number of the publicly‑traded companies within our peer group. The business enterprise value is a key input in the contingent claims analysis which is the methodology utilized to measure the fair value of the common stock warrants. This increase in other expenses was offset in part by an indemnification gain of $3.0 million recorded in 2015 related to the adjustment of indemnified tax obligations for tax periods prior to the Acquisition.
Income Tax Expense
Income tax expense increased $11.3 million, or 67.7%, to $28.0 million for the year ended December 31, 2015, compared to $16.7 million for the year ended December 31, 2014. Our ETR was 87.1% for the year ended December 31, 2015, compared to 39.7% for the year ended December 31, 2014. The increase in ETR was primarily driven by an increase in non‑cash fair value losses on the common stock warrants which are not tax effected, as well as an increase to indemnified tax obligations for tax periods prior to the Acquisition, and changes to the geographic mix of earnings.
Net Income (Loss) Attributable to Acushnet Holdings Corp.
Net income (loss) attributable to Acushnet Holdings Corp. decreased by $22.6 million to a net loss attributable to Acushnet Holdings Corp. of $1.0 million for the year ended December 31, 2015 compared to net income attributable to Acushnet Holdings Corp. of $21.6 million for the year ended December 31, 2014. This change was primarily a result of an increase in other expense of $26.4 million and income tax expense of $11.3 million, which was offset by an increase of $13.3 million in income from operations and lower interest expense of $3.2 million, as discussed in more detail above.
94
Adjusted EBITDA
Adjusted EBITDA increased by $12.1 million to $214.7 million for the year ended December 31, 2015 compared to $202.6 million for the year ended December 31, 2014. Adjusted EBITDA margin increased to 14.3% in 2015 from 13.2% in 2014.
Segment Results
Net sales by reportable segment is summarized as follows:
|
|
|
Year ended |
|
|
|
|
|
|
Constant Currency |
|
|||||||
|
|
|
December 31, |
|
Increase/(Decrease) |
|
Increase/(Decrease) |
|
||||||||||
|
|
|
2015 |
|
2014 |
|
$ change |
|
% change |
|
$ change |
|
% change |
|
||||
|
|
|
(in thousands) |
|
||||||||||||||
|
Titleist golf balls |
|
$ |
535,465 |
|
$ |
543,843 |
|
$ |
(8,378) |
|
(1.5) |
% |
$ |
17,321 |
|
3.2 |
% |
|
Titleist golf clubs |
|
|
388,304 |
|
|
422,383 |
|
|
(34,079) |
|
(8.1) |
% |
|
(8,815) |
|
(2.1) |
% |
|
Titleist golf gear |
|
|
129,408 |
|
|
127,875 |
|
|
1,533 |
|
1.2 |
% |
|
9,374 |
|
7.3 |
% |
|
FootJoy golf wear |
|
|
418,852 |
|
|
421,632 |
|
|
(2,780) |
|
(0.7) |
% |
|
24,446 |
|
5.8 |
% |
Segment operating income by reportable segment is summarized as follows:
|
|
|
Year ended |
|
|
|
|
|
|
||||
|
|
|
December 31, |
|
Increase/(Decrease) |
|
|||||||
|
|
|
2015 |
|
2014 |
|
$ change |
|
% change |
|
|||
|
|
|
(in thousands) |
|
|||||||||
|
Segment operating income(1) |
|
|
|
|
|
|
|
|
|
|
|
|
|
Titleist golf balls |
|
$ |
92,507 |
|
$ |
68,489 |
|
$ |
24,018 |
|
35.1 |
% |
|
Titleist golf clubs |
|
|
33,593 |
|
|
45,845 |
|
|
(12,252) |
|
(26.7) |
% |
|
Titleist golf gear |
|
|
12,170 |
|
|
16,485 |
|
|
(4,315) |
|
(26.2) |
% |
|
FootJoy golf wear |
|
|
26,056 |
|
|
28,639 |
|
|
(2,583) |
|
(9.0) |
% |
|
(1) |
Expenses relating to the EAR Plan, transaction fees and restructuring charges, to the extent incurred in the applicable period, are not reflected in segment operating income. |
More information on our net sales by reportable segment and segment operating income can be found in “Notes to Consolidated Finanical Statements – Note 20—Segment Information.”
Titleist Golf Balls Segment
Net sales in our Titleist golf balls segment decreased by $8.4 million, or 1.5%, to $535.5 million for the year ended December 31, 2015 compared to $543.8 million for the year ended December 31, 2014. The decrease in net sales was due to unfavorable foreign currency translation. On a constant currency basis, net sales in our Titleist golf balls segment would have increased by $17.3 million, or 3.2%, to $561.2 million. This increase in 2015 was driven by a sales volume shift due to the introduction of the latest generation of Pro V1 and Pro V1x golf balls in the first quarter of 2015, which have a higher average selling price than our performance models, which experienced a sales volume decline as a result of being in their second model year.
Titleist golf balls segment operating income increased by $24.0 million, or 35.1%, to $92.5 million for the year ended December 31, 2015 compared to $68.5 million for the year ended December 31, 2014 reflecting a $24.1 million increase in gross profit due to a golf ball mix shift to the Pro V1 and Pro V1x franchise, coupled with overhead absorption and savings associated with operations at our golf ball manufacturing plant in Thailand achieved as a result of production ramp‑up, as well as lower ball raw material cost. Operating expenses were down slightly in 2015 compared to 2014 as increases of $3.3 million in professional tour endorsement costs and point‑of‑sale materials and $2.5 million in outbound shipping and handling costs were more than offset by a $6.2 million favorable impact of changes in foreign currency exchange rates on our operating expenses.
95
Titleist Golf Clubs Segment
Net sales in our Titleist golf clubs segment decreased by $34.1 million, or 8.1%, to $388.3 million for the year ended December 31, 2015 compared to $422.4 million for the year ended December 31, 2014. A significant portion of the decrease in net sales was due to unfavorable foreign currency translation. On a constant currency basis, net sales in our Titleist golf clubs segment would have decreased by $8.8 million, or 2.1%, to $413.6 million. The decrease in net sales was primarily due to lower sales volumes of our clubs across all product categories, with the exception of hybrids, a category in which we introduced a new model in the fall of 2014. We believe the sales volume decrease in this segment was caused in part by high levels of inventory sold into retail channels by other golf equipment manufacturers, which led to an increase in promotional discounting of such products that, to a certain extent, adversely impacted sales volumes of premium priced products in the market in general. The resulting volume decrease in our drivers and fairways, however, was partially offset by an increase in average selling prices.
Titleist golf clubs segment operating income decreased by $12.2 million, or 26.7%, to $33.6 million for the year ended December 31, 2015 compared to $45.8 million for the year ended December 31, 2014. This decrease was primarily driven by a $14.4 million decrease in gross profit primarily due to the sales decline discussed above, offset partially by higher gross margin. The increase in gross margin was driven by increases in average selling prices of drivers and fairways.
Titleist Golf Gear Segment
Net sales in our Titleist golf gear segment increased by $1.5 million, or 1.2%, to $129.4 million for the year ended December 31, 2015 compared to $127.9 million for the year ended December 31, 2014. On a constant currency basis, net sales in our Titleist golf gear segment would have increased by $9.4 million, or 7.3%, to $137.3 million. The constant currency increase was due to sales volume growth in all categories of the gear business.
Titleist golf gear segment operating income decreased by $4.3 million, or 26.2%, to $12.2 million for the year ended December 31, 2015 compared to $16.5 million for the year ended December 31, 2014. This decrease was primarily attributable to higher operating expenses as a result of increases of $4.8 million in distribution expenses and $1.5 million in staffing and related expenses as a result of investments to support future growth in this segment. Distribution expenses increased due to higher utilization by the Titleist golf gear segment of our West Coast distribution facility, coupled with increased transportation carrier rates that affected this category. This increase in operating expenses was partially offset by a $1.6 million favorable impact of changes in foreign currency exchange rates on our operating expenses.
FootJoy Golf Wear Segment
Net sales in our FootJoy golf wear segment decreased by $2.8 million, or 0.7%, to $418.8 million for the year ended December 31, 2015 compared to $421.6 million for the year ended December 31, 2014. The decrease in net sales was due to unfavorable foreign currency translation. On a constant currency basis, net sales in our FootJoy golf wear segment would have increased by $24.4 million, or 5.8%, to $446.0 million. This increase was due to higher average selling prices in our golf shoes and gloves categories and an increase in sales volumes in our apparel category.
FootJoy golf wear segment operating income decreased by $2.5 million, or 9.0%, to $26.1 million for the year ended December 31, 2015 compared to $28.6 million for the year ended December 31, 2014. This decrease was primarily attributable to higher operating expenses, which were primarily due to increases of $3.3 million in staffing and related expenses which include investments in our FootJoy eCommerce and shoe fitting initiatives, $1.8 million in professional tour endorsement costs, $1.7 million in distribution expenses, as well as $1.1 million in marketing and promotional spending primarily for point‑of‑sale materials. This decrease was largely offset by a $6.6 million favorable impact of changes in foreign currency exchange rates on our operating expenses.
Seasonality, Cyclicality and Quarterly Results
Our business is seasonal and cyclical due to product factors such as weather and product launch cycles. See “—Overview—Key Factors Affecting Our Results of Operations.”
96
The following charts and tables set forth our historical quarterly results of operation for each of our most recent three years. This unaudited quarterly information has been prepared on the same basis as our annual audited consolidated financial statements appearing elsewhere in this report, and in the opinion of management, reflects all adjustments necessary for a fair statement of the consolidated results of operations for these periods. This unaudited quarterly information should be read in conjunction with our audited consolidated financial statements and the related notes appearing elsewhere in this report. More information on our unaudited quarterly financial data can be found in “Notes to Consolidated Financial Statements – Note 22 – Unaudited Quarterly Financial Data.”
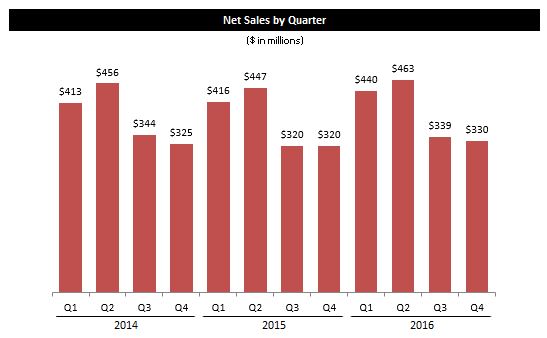
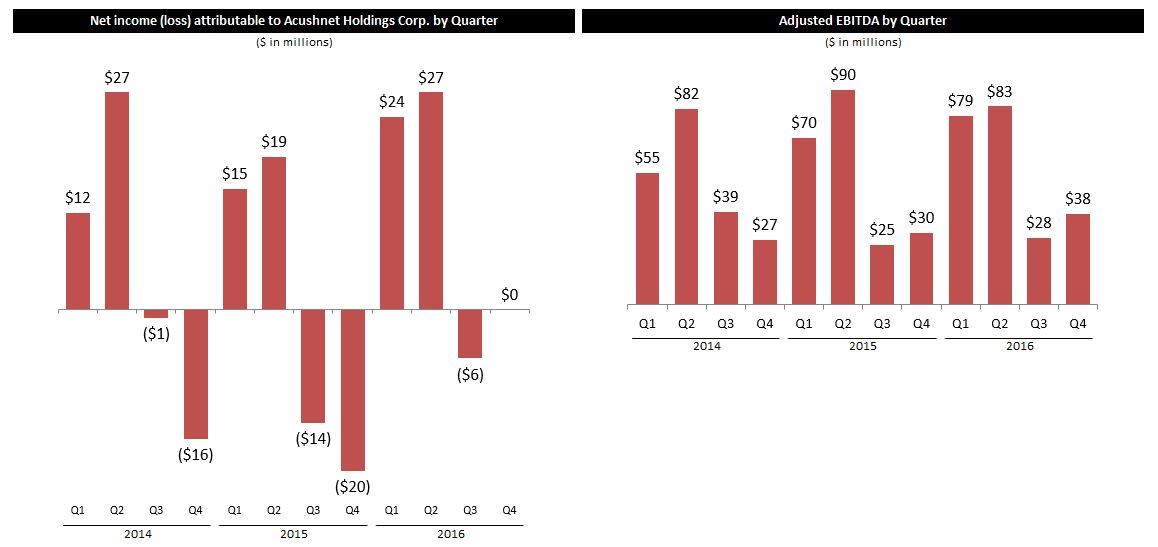
97
|
|
|
Quarter ended |
||||||||||
|
|
|
March 31, |
|
June 30, |
|
September 30, |
|
December 31, |
||||
|
|
|
2016 |
|
2016 |
|
2016 |
|
2016 |
||||
|
|
|
(in thousands) |
||||||||||
|
Net sales |
|
$ |
439,935 |
|
$ |
463,261 |
|
|
339,318 |
|
|
329,761 |
|
Gross profit |
|
|
225,869 |
|
|
237,960 |
|
|
166,902 |
|
|
167,994 |
|
Operating expenses: |
|
|
|
|
|
|
|
|
|
|
|
|
|
Selling, general and administrative |
|
|
155,318 |
|
|
158,121 |
|
|
142,995 |
|
|
144,370 |
|
Research and development |
|
|
11,130 |
|
|
11,693 |
|
|
12,473 |
|
|
13,508 |
|
Income from operations |
|
|
57,185 |
|
|
66,437 |
|
|
9,606 |
|
|
7,608 |
|
Net income (loss) attributable to Acushnet Holdings Corp. |
|
|
23,662 |
|
|
27,055 |
|
|
(5,526) |
|
|
(179) |
|
|
|
|
|
|
|
|
|
|
|
|
|
|
|
Adjusted EBITDA |
|
|
|
|
|
|
|
|
|
|
|
|
|
Net income (loss) attributable to Acushnet Holdings Corp. |
|
|
23,662 |
|
|
27,055 |
|
|
(5,526) |
|
|
(179) |
|
Income tax expense (benefit) |
|
|
16,769 |
|
|
21,941 |
|
|
785 |
|
|
213 |
|
Interest expense, net |
|
|
13,841 |
|
|
14,563 |
|
|
15,672 |
|
|
5,832 |
|
Depreciation and amortization |
|
|
10,270 |
|
|
10,282 |
|
|
10,003 |
|
|
10,279 |
|
EAR Plan(a) |
|
|
— |
|
|
— |
|
|
(940) |
|
|
6,987 |
|
Share-based compensation(b) |
|
|
— |
|
|
964 |
|
|
6,159 |
|
|
7,371 |
|
One-time executive bonus(c) |
|
|
7,500 |
|
|
— |
|
|
— |
|
|
— |
|
Restructuring charges(d) |
|
|
587 |
|
|
55 |
|
|
174 |
|
|
857 |
|
Thailand golf ball manufacturing plant start-up costs(e) |
|
|
— |
|
|
— |
|
|
— |
|
|
— |
|
Transaction fees(f) |
|
|
3,701 |
|
|
5,264 |
|
|
2,947 |
|
|
4,905 |
|
Beam indemnification expense (income)(g) |
|
|
(494) |
|
|
9 |
|
|
(2,156) |
|
|
467 |
|
(Gains) losses on the fair value of our common stock warrants(h) |
|
|
1,879 |
|
|
4,233 |
|
|
— |
|
|
— |
|
Other non-cash gains, net |
|
|
(2) |
|
|
(293) |
|
|
(236) |
|
|
(61) |
|
Nonrecurring expense (income)(i) |
|
|
— |
|
|
(1,467) |
|
|
— |
|
|
— |
|
Net income attributable to noncontrolling interests(j) |
|
|
1,530 |
|
|
423 |
|
|
1,124 |
|
|
1,426 |
|
Adjusted EBITDA |
|
$ |
79,243 |
|
$ |
83,029 |
|
$ |
28,006 |
|
$ |
38,097 |
98
|
|
|
Quarter ended |
||||||||||
|
|
|
March 31, |
|
June 30, |
|
September 30, |
|
December 31, |
||||
|
|
|
2015 |
|
2015 |
|
2015 |
|
2015 |
||||
|
|
|
(in thousands) |
||||||||||
|
Net sales |
|
$ |
416,298 |
|
$ |
446,576 |
|
$ |
319,868 |
|
$ |
320,216 |
|
Gross profit |
|
|
215,258 |
|
|
237,687 |
|
|
157,340 |
|
|
165,553 |
|
Operating expenses: |
|
|
|
|
|
|
|
|
|
|
|
|
|
Selling, general and administrative |
|
|
153,727 |
|
|
159,280 |
|
|
144,246 |
|
|
146,766 |
|
Research and development |
|
|
11,014 |
|
|
11,614 |
|
|
11,395 |
|
|
11,954 |
|
Income from operations |
|
|
48,856 |
|
|
65,141 |
|
|
46 |
|
|
3,539 |
|
Net income (loss) attributable to Acushnet Holdings Corp. |
|
|
14,802 |
|
|
18,654 |
|
|
(13,986) |
|
|
(20,436) |
|
Adjusted EBITDA |
|
|
|
|
|
|
|
|
|
|
|
|
|
Net income (loss) attributable to Acushnet Holdings Corp. |
|
|
14,802 |
|
|
18,654 |
|
|
(13,986) |
|
|
(20,436) |
|
Income tax expense (benefit) |
|
|
18,962 |
|
|
17,957 |
|
|
(4,273) |
|
|
(4,652) |
|
Interest expense, net |
|
|
15,331 |
|
|
15,199 |
|
|
17,563 |
|
|
12,201 |
|
Depreciation and amortization |
|
|
10,609 |
|
|
10,661 |
|
|
10,297 |
|
|
10,135 |
|
EAR Plan(a) |
|
|
10,200 |
|
|
12,465 |
|
|
10,423 |
|
|
12,726 |
|
Share-based compensation(b) |
|
|
433 |
|
|
1,481 |
|
|
3,875 |
|
|
— |
|
One-time executive bonus(c) |
|
|
— |
|
|
— |
|
|
— |
|
|
— |
|
Restructuring charges(d) |
|
|
— |
|
|
— |
|
|
— |
|
|
1,643 |
|
Thailand golf ball manufacturing plant start-up costs(e) |
|
|
— |
|
|
— |
|
|
— |
|
|
— |
|
Transaction fees(f) |
|
|
286 |
|
|
252 |
|
|
127 |
|
|
1,476 |
|
Beam indemnification expense (income)(g) |
|
|
(5,539) |
|
|
821 |
|
|
272 |
|
|
1,438 |
|
(Gains) losses on the fair value of our common stock warrants(h) |
|
|
3,770 |
|
|
11,008 |
|
|
(243) |
|
|
13,829 |
|
Other non-cash gains, net |
|
|
(57) |
|
|
(64) |
|
|
34 |
|
|
(82) |
|
Nonrecurring expense (income)(i) |
|
|
— |
|
|
— |
|
|
— |
|
|
— |
|
Net income attributable to noncontrolling interests(j) |
|
|
1,585 |
|
|
1,573 |
|
|
689 |
|
|
1,275 |
|
Adjusted EBITDA |
|
$ |
70,382 |
|
$ |
90,007 |
|
$ |
24,778 |
|
$ |
29,553 |
99
|
|
|
Quarter ended |
||||||||||
|
|
|
March 31, |
|
June 30, |
|
September 30, |
|
December 31, |
||||
|
|
|
2014 |
|
2014 |
|
2014 |
|
2014 |
||||
|
|
|
(in thousands) |
||||||||||
|
Net sales |
|
$ |
412,984 |
|
$ |
455,721 |
|
$ |
344,202 |
|
$ |
324,703 |
|
Gross profit |
|
|
204,812 |
|
|
228,191 |
|
|
170,131 |
|
|
154,798 |
|
Operating expenses: |
|
|
|
|
|
|
|
|
|
|
|
|
|
Selling, general and administrative |
|
|
157,628 |
|
|
157,165 |
|
|
139,365 |
|
|
148,598 |
|
Research and development |
|
|
10,978 |
|
|
10,142 |
|
|
10,413 |
|
|
12,710 |
|
Income (loss) from operations |
|
|
34,534 |
|
|
59,211 |
|
|
18,678 |
|
|
(8,176) |
|
Net income (loss) attributable to Acushnet Holdings Corp. |
|
|
11,766 |
|
|
27,368 |
|
|
(1,142) |
|
|
(16,435) |
|
Adjusted EBITDA |
|
|
|
|
|
|
|
|
|
|
|
|
|
Net income (loss) attributable to Acushnet Holdings Corp. |
|
|
11,766 |
|
|
27,368 |
|
|
(1,142) |
|
|
(16,435) |
|
Income tax expense (benefit) |
|
|
7,193 |
|
|
15,907 |
|
|
1,378 |
|
|
(7,778) |
|
Interest expense, net |
|
|
15,458 |
|
|
16,231 |
|
|
18,175 |
|
|
13,665 |
|
Depreciation and amortization |
|
|
11,078 |
|
|
11,256 |
|
|
9,300 |
|
|
11,525 |
|
EAR Plan(a) |
|
|
8,776 |
|
|
10,144 |
|
|
8,982 |
|
|
22,811 |
|
Share-based compensation(b) |
|
|
— |
|
|
— |
|
|
1,977 |
|
|
— |
|
One-time executive bonus(c) |
|
|
— |
|
|
— |
|
|
— |
|
|
— |
|
Restructuring charges(d) |
|
|
— |
|
|
— |
|
|
— |
|
|
— |
|
Thailand golf ball manufacturing plant start-up costs(e) |
|
|
370 |
|
|
146 |
|
|
105 |
|
|
167 |
|
Transaction fees(f) |
|
|
381 |
|
|
715 |
|
|
164 |
|
|
230 |
|
Beam indemnification expense (income)(g) |
|
|
(35) |
|
|
57 |
|
|
(45) |
|
|
1,409 |
|
(Gains) losses on the fair value of our common stock warrants(h) |
|
|
(301) |
|
|
(862) |
|
|
(384) |
|
|
(340) |
|
Other non-cash gains, net |
|
|
(531) |
|
|
(23) |
|
|
(41) |
|
|
(33) |
|
Nonrecurring expense (income)(i) |
|
|
— |
|
|
— |
|
|
— |
|
|
— |
|
Net income attributable to noncontrolling interests(j) |
|
|
1,002 |
|
|
704 |
|
|
745 |
|
|
1,358 |
|
Adjusted EBITDA |
|
$ |
55,157 |
|
$ |
81,643 |
|
$ |
39,214 |
|
$ |
26,579 |
|
(a) |
Reflects expenses related to the anticipated full vesting of EARs granted under our EAR Plan and the remeasurement of the liability at each reporting period based on the then‑current projection of our CSE value. See “—Critical Accounting Policies and Estimates—Share‑Based Compensation.” All outstanding EARs under the EAR Plan vested as of December 31, 2015. The EAR Plan expired on December 31, 2016 and the outstanding EAR liability of $151.5 million was settled in full by a cash payout to participants during the first quarter of 2017. |
|
(b) |
Reflects compensation expenses in 2016 with respect to equity‑based grants under the 2015 Incentive Plan which were made in 2016. Reflects compensation expense in 2015 and 2014 associated with the exercise of substitute stock options by an executive, which were granted in connection with the Acquisition. All such stock options have been exercised. |
|
(c) |
In the first quarter of 2016, our President and Chief Executive Officer was awarded a cash bonus in the amount of $7.5 million as consideration for past performance. |
|
(d) |
Reflects restructuring charges incurred in connection with the reorganization of certain of our operations in 2016 and 2015. |
|
(e) |
Reflects expenses incurred in connection with the construction and production ramp‑up of our golf ball manufacturing plant in Thailand. |
|
(f) |
Reflects certain fees and expenses we incurred in 2016 and 2015 in connection with our initial public offering and legal fees incurred in all years presented relating to a dispute arising from the indemnification obligations owed to us by Beam in connection with the Acquisition. |
|
(g) |
Reflects the non‑cash charges related to the indemnification obligations owed to us by Beam that are included when calculating net income (loss) attributable to Acushnet Holdings Corp. |
100
|
(h) |
Fila Korea exercised all of our outstanding common stock warrants in July 2016 and we used the proceeds from such exercise to redeem all of our outstanding 7.5% bonds due 2021. |
|
(i) |
Reflects legal judgment in favor of us associated with the Beam value‑added tax dispute recorded in other (income) expense. |
|
(j) |
Reflects the net income attributable to the interest that we do not own in our FootJoy golf shoe joint venture. |
Liquidity and Capital Resources
Historically, our primary cash needs have been working capital, capital expenditures, servicing of our debt, interest payments on our Convertible Notes and 7.5% bonds due 2021, dividends on our Convertible Preferred Stock, and pension contributions and, in the year ended December 31, 2016, certain payments related to outstanding EARs under our EAR Plan. We have relied on cash flows from operations and borrowings under our former credit facilities and other credit facilities as our primary sources of liquidity. Our remaining 7.5% bonds were redeemed in July 2016 and our Convertible Notes and our Convertible Preferred Stock automatically converted into our common stock prior to the closing of our initial public offering.
We made $19.2 million of capital expenditures in the year ended December 31, 2016. Capital expenditures for fiscal 2017 are expected to be approximately $26.0 million, although the actual amount may vary depending upon a variety of factors, including the timing of implementation of certain capital projects. We expect the majority of these capital expenditures in fiscal 2017 will be for maintenance projects.
We made $26.6 million of payments related to outstanding EARs under our EAR Plan in the year ended December 31, 2016 and made approximately $151.5 million of payments related to outstanding EARs under our EAR Plan in the first quarter of 2017, which we funded from borrowings under our delayed draw term loan A facility and borrowings under our revolving credit facilities.
We expect our primary cash needs to continue to be working capital, capital expenditures, servicing of our debt, and pension contributions. See “—Results of Operations—Selling, General and Administrative Expenses”, “—Liquidity and Capital Resources” and “—Contractual Obligations.” We expect to rely on cash flows from operations and borrowings under our revolving credit facility and local credit facilities as our primary sources of liquidity.
Our liquidity is cyclical as a result of the general seasonality of our business. Our accounts receivable balance is generally at its highest starting at the end of the first quarter and continuing through the second quarter, and declines during the third and fourth quarters as a result of both an increase in cash collections and lower sales. Our inventory balance also fluctuates as a result of the seasonality of our business. Generally, our buildup of inventory starts during the fourth quarter and continues through the first quarter and into the beginning of the second quarter in order to meet demand for our initial sell‑in in the first quarter and reorders in the second quarter. Both accounts receivable and inventory balances are impacted by the timing of new product launches.
We believe that cash expected to be provided by operating activities, together with our cash on hand and the availability of borrowings under our revolving credit facility and our delayed draw facility will be sufficient to meet our liquidity requirements for at least the next 12 months, subject to customary borrowing conditions. Our ability to generate sufficient cash flows from operations is, however, subject to many risks and uncertainties, including future economic trends and conditions, demand for our products, foreign currency exchange rates and other risks and uncertainties applicable to our business, as described under “Item 1A. – Risk Factors.”
As of December 31, 2016, we had $76.1 million of unrestricted cash (including $13.0 million attributable to our FootJoy golf shoe joint venture). As of December 31, 2016, 95.7% of our total unrestricted cash was held at our non‑U.S. subsidiaries. We manage our worldwide cash requirements by monitoring the funds available among our subsidiaries and determining the extent to which we can access those funds on a cost effective basis. We are not aware of any restrictions on repatriation of these funds and, subject to the cash payment of additional U.S. income taxes or foreign withholding taxes, those funds could be repatriated, if necessary. At present, any additional taxes could be offset, in whole or in part, by available foreign tax credits. The amount of any taxes required to be paid and the application of tax credits would be determined based on income tax laws in effect at the time of such repatriation. We do not expect any such repatriation to result in additional tax expenses as taxes have been provided for our undistributed foreign earnings
101
that we do not consider permanently reinvested. We have repatriated, and intend to repatriate, funds to the United States from time to time to satisfy domestic liquidity needs arising in the ordinary course of business, including liquidity needs related to debt service requirements.
Cash Flows
The following table presents the major components of net cash flows used in and provided by operating, investing and financing activities for the periods indicated:
|
|
|
Year ended December 31, |
|||||||
|
|
|
2016 |
|
2015 |
|
2014 |
|||
|
|
|
(in thousands) |
|||||||
|
Cash flows provided by (used in): |
|
|
|
|
|
|
|
|
|
|
Operating activities |
|
$ |
105,188 |
|
$ |
91,830 |
|
$ |
54,113 |
|
Investing activities |
|
|
(20,094) |
|
|
(23,201) |
|
|
(23,527) |
|
Financing activities |
|
|
(62,663) |
|
|
(60,057) |
|
|
(30,154) |
|
Effect of foreign exchange rate changes on cash |
|
|
(2,425) |
|
|
(3,205) |
|
|
(2,522) |
|
Net increase (decrease) in cash |
|
$ |
20,006 |
|
$ |
5,367 |
|
$ |
(2,090) |
Cash Flows From Operating Activities
Cash flows from operating activities consist primarily of net income (loss) adjusted for certain non‑cash items, including depreciation and amortization, deferred income taxes, gain or loss on the fair value measurement of the common stock warrants, and the effect of changes in operating assets and liabilities. Cash provided by changes in operating assets and liabilities primarily relates to changes in accounts receivable, inventories and accounts payable and accrued expenses.
Net cash provided by operating activities was $105.2 million for the year ended December 31, 2016, compared to $91.8 million for the year ended December 31, 2015, an increase of $13.4 million. The increase in cash provided by operating activities was primarily due to an increase in net income after adjustments for non‑cash items, lower income taxes paid and an increase related to change in our working capital, which were offset by increases in cash payments related to our EAR Plan, our supplemental executive retirement plan and the payment of a one‑time executive bonus.
Net cash provided by operating activities was $91.8 million for the year ended December 31, 2015, compared to $54.1 million for the year ended December 31, 2014, an increase of $37.7 million. The increase in net cash from operating activities was primarily due to an increase of $26.4 million in net income after adjustments for non‑cash items. Net cash provided by operating assets and liabilities increased $11.3 million in 2015 compared to 2014. Inventory increased year‑over‑year to support our first quarter 2016 launches, and was offset by increases in accrued liabilities and other noncurrent liabilities.
Cash Flows From Investing Activities
Cash flows from investing activities relate almost entirely to capital expenditures.
Net cash used in investing activities was $20.1 million for the year ended December 31, 2016, compared to $23.2 million for the year ended December 31, 2015, a decrease of $3.1 million. This decrease was driven by the initiation of more capital projects towards the later half of the year for which actual spending had not yet been incurred.
Net cash used in investing activities was $23.2 million in the year ended December 31, 2015 compared to $23.5 million in the year ended December 31, 2014, a decrease of $0.3 million. The decrease in cash used in investing activities was driven by lower spending on our enterprise resource planning system implementation, offset in part by higher capital spending on golf ball and golf club manufacturing maintenance and production efficiency projects.
Cash Flows From Financing Activities
Cash flows from financing activities consist primarily of principal payments on our former senior term loan facility, dividends paid on our Convertible Preferred Stock, net borrowing under our former senior revolving credit
102
facility and other credit facilities as well as the offsetting effects of cash received from the exercise of common stock warrants and our use of the proceeds from such exercise to redeem a corresponding amount of outstanding 7.5% bonds due 2021.
Net cash used in financing activities was $62.7 million for the year ended December 31, 2016, compared to $60.1 million for the year ended December 31, 2015, an increase of $2.6 million. The increase in cash used in financing activities was primarily due to the $30 million repayment of the senior term loan facility, the $6.6 million payment of debt issuance costs related to the credit facility, an increase of $3.6 million in dividends paid on our Convertible Preferred Stock, a net decrease in aggregate borrowings under our revolving credit facilities and other short‑term borrowings, offset by the repayment of $50 million of secured floating rate notes in 2015.
Net cash used in financing activities was $60.1 million in the year ended December 31, 2015 compared to $30.2 million in the year ended December 31, 2014, an increase of $29.9 million. The increase in net cash used in financing activities was driven by $30.0 million in lower borrowings on our former senior term loan facility in 2015 compared to 2014.
Indebtedness
On April 27, 2016, Acushnet Holdings Corp., Acushnet Company (“the U.S. Borrower”), Acushnet Canada Inc. (“the Canadian Borrower”), and Acushnet Europe Limited (“the UK Borrower”), entered into a credit agreement with Wells Fargo Bank, National Association, as the administrative agent, L/C issuer and swing line lender and each lender from time to time party thereto, which provides for (i) a $275.0 million multi‑currency revolving credit facility, including a $20.0 million letter of credit sub‑facility, a swing line sublimit of $25.0 million, a C$25.0 million sub‑facility for borrowings by the Canadian Borrower, a £20.0 million sub‑facility for borrowings by the UK Borrower and an alternative currency sublimit of $100.0 million for borrowings in Canadian dollars, euros, pounds sterling and Japanese yen, (ii) a $375.0 million term loan A facility and (iii) a $100.0 million delayed draw term loan A facility, each of which matures on July 28, 2021.
The credit agreement was signed and became effective on April 27, 2016 and the initial funding under the new credit agreement occurred on July 28, 2016. On July 28, 2016, we used the proceeds of the $375.0 million term loan A facility, borrowings of C$4.0 million (equivalent to approximately $3.0 million) under the revolving credit facility and cash on hand of $23.6 million to (i) repay all amounts outstanding under, and terminate, our secured floating rate notes and certain of our former working credit facilities, (ii) terminate our former senior revolving credit facility and (iii) pay fees and expenses related to the foregoing. During the first quarter of 2017, we borrowed under our delayed draw term loan A facility and under our revolving credit facility to make payments in connection with the final payout of the outstanding EARs under the EAR Plan.
In addition, on June 30, 2016, we used cash on hand and borrowings under our former senior revolving credit facility to repay all amounts outstanding under, and terminate, our former senior term loan facility.
In addition, the credit agreement allows for the incurrence of additional term loans or increases to our revolving credit facility in an aggregate principal amount not to exceed (i) $200.0 million, plus (ii) an unlimited amount so long as the Net Average Secured Leverage ratio (defined as the ratio of average Consolidated Secured Funded Debt (as defined in the credit agreement) to Adjusted EBITDA for the applicable test period in the credit agreement) does not exceed 2.00:1.00 on a pro forma basis and, subject, in each case, to certain conditions and receipt of commitments by existing or additional financial institutions or institutional lenders.
Borrowings (other than swing line loans) under the credit agreement bear interest at a rate per annum equal to an applicable margin (which is determined based on the Net Average Secured Leverage Ratio) plus, at our option, either (1) solely for borrowings in U.S. dollars, a base rate determined by reference to the highest of (a) the Federal Funds rate plus 0.50%, (b) the prime rate of Wells Fargo Bank, National Association and (c) the Eurodollar rate determined by reference to the cost of funds for U.S. dollar deposits for an interest period of one month adjusted for certain additional costs, plus 1.00% or (2) a Eurodollar rate determined by reference to the costs of funds for deposits in the currency of the applicable borrowing for the interest period relevant to such borrowing adjusted for certain additional costs. Swing line loans bear interest at the base rate plus the applicable margin. The applicable margin for Eurodollar borrowings under the new credit agreement is initially 1.75% and ranges from 1.25% to 2.00%, and is initially 0.75% and ranges from 0.25% to 1.00% for base‑rate borrowings, and in each case varies based upon a leverage‑based pricing grid.
103
Interest on borrowings under the credit agreement is payable (1) on the last day of any interest period with respect to Eurodollar borrowings with an applicable interest period of three months or less, (2) every three months with respect to Eurodollar borrowings with an interest period of greater than three months or (3) on the last business day of each March, June, September and December with respect to base rate borrowings and swing line borrowings. In addition, beginning with the date of the initial funding under the credit agreement, we are required to pay a commitment fee on any unutilized commitments under the revolving credit facility and the new delayed draw term loan A facility. The initial commitment fee rate is 0.30% per annum and ranges from 0.20% to 0.35% based upon a leverage‑based pricing grid. We are also required to pay customary letter of credit fees.
The credit agreement requires us to prepay outstanding term loans, subject to certain exceptions, with:
|
· |
100% of the net cash proceeds of all non‑ordinary course asset sales or other dispositions of property by the U.S. Borrower and its restricted subsidiaries (including insurance and condemnation proceeds, subject to de minimis thresholds), (1) if we do not reinvest those net cash proceeds in assets to be used in our business or to make certain other permitted investments, within 12 months of the receipt of such net cash proceeds or (2) if we commit to reinvest such net cash proceeds within 12 months of the receipt thereof, but do not reinvest such net cash proceeds within 18 months of the receipt thereof; and |
|
· |
100% of the net proceeds of any issuance or incurrence of debt by the U.S. Borrower or any of its restricted subsidiaries, other than debt permitted under the credit agreement. |
The foregoing mandatory prepayments are used to reduce the installments of principal in such order: first, to prepay outstanding loans under the term loan A facility, the delayed draw term loan A facility and any incremental term loans on a pro rata basis in direct order of maturity and second, to prepay outstanding loans under the revolving credit facility.
We may voluntarily repay outstanding loans under the credit agreement at any time without premium or penalty, other than customary “breakage” costs with respect to Eurodollar loans. Any optional prepayment of term loans will be applied as directed by the U.S. Borrower.
We will be required to make principal payments on the loans under the term loan facilities in quarterly installments in aggregate annual amounts equal to (i) 5.00% of the original principal amount for the first and second year after July 28, 2016, (ii) 7.50% of the original principal amount for the third and fourth year after July 28, 2016 and (iii) 10.0% of the original principal amount for the fifth year after July 28, 2016. The remaining outstanding amount is payable on July 28, 2021, the maturity date for the term loan facilities. Principal amounts outstanding under the revolving credit facility will be due and payable in full on July 28, 2021, the maturity date for the revolving credit facility.
The credit agreement contains a number of covenants that, among other things, restrict the ability of the U.S. Borrower and its restricted subsidiaries to (subject to certain exceptions), incur, assume, or permit to exist additional indebtedness or guarantees; incur liens; make investments and loans; pay dividends, make payments, or redeem or repurchase capital stock or make prepayments, repurchases or redemptions of certain indebtedness; engage in mergers, liquidations, dissolutions, asset sales, and other dispositions (including sale leaseback transactions); amend or otherwise alter terms of certain indebtedness or certain other agreements; enter into agreements limiting subsidiary distributions or containing negative pledge clauses; engage in certain transactions with affiliates; alter the nature of the business that we conduct or change our fiscal year or accounting practices. Certain exceptions to these covenants are determined based on ratios that are calculated in part using the calculation of Adjusted EBITDA.
The credit agreement covenants also restrict the ability of Acushnet Holdings Corp. to engage in certain mergers or consolidations or engage in any activities other than permitted activities. The credit agreement also contains certain customary affirmative covenants and events of default (including change of control). If an event of default occurs and is continuing, the administrative agent, on behalf of the lenders, may accelerate the amounts and terminate all commitments outstanding under the new credit agreement and may exercise remedies in respect of the collateral. In addition, the credit agreement includes maintenance covenants that on and after July 28, 2016 require compliance by Acushnet Company with certain ratios. These maintenance covenants include the requirement to maintain (i) a Consolidated Interest Coverage Ratio (defined as the ratio of Adjusted EBITDA to Consolidated Interest Expense (as defined in the credit agreement) for the applicable period) of 4.00:1.00 or greater as of the end of each fiscal quarter and
104
(ii) a Net Average Total Leverage Ratio (defined as the ratio of Consolidated Funded Debt (as defined in the credit agreement) to Adjusted EBITDA for the applicable period) of 3.50:1.00 or less as of the end of the fiscal quarters ended March 31, 2017 and June 30, 2017 and 3.25:1.00 or less as of the end of each other fiscal quarter. The availability of certain baskets and the ability to enter into certain transactions (including the ability of the U.S. Borrower to pay dividends to Acushnet Holdings Corp.) may also be subject to the absence of a default and/or compliance with financial leverage ratios.
Contractual Obligations
The following table summarizes our outstanding contractual obligations as of December 31, 2016:
|
|
|
|
|
|
Payments Due by Period |
||||||||||
|
|
|
|
|
|
Less than |
|
1-3 |
|
4-5 |
|
After |
||||
|
|
|
Total |
|
1 Year |
|
Years |
|
Years |
|
5 Years |
|||||
|
|
|
(in thousands) |
|||||||||||||
|
Debt obligations(1) |
|
$ |
370,313 |
|
$ |
18,750 |
|
$ |
49,219 |
|
$ |
302,344 |
|
$ |
— |
|
Interest payments related to debt obligations(2) |
|
|
38,653 |
|
|
9,528 |
|
|
17,302 |
|
|
11,824 |
|
|
— |
|
Capital lease obligations |
|
|
1,389 |
|
|
898 |
|
|
491 |
|
|
— |
|
|
— |
|
Pension and other postretirement benefit obligations |
|
|
230,319 |
|
|
23,480 |
|
|
51,707 |
|
|
45,718 |
|
|
109,414 |
|
Equity appreciation rights obligations(3) |
|
|
151,511 |
|
|
151,511 |
|
|
— |
|
|
— |
|
|
— |
|
Purchase obligations(4) |
|
|
174,789 |
|
|
146,308 |
|
|
21,105 |
|
|
4,050 |
|
|
3,326 |
|
Operating lease obligations(5) |
|
|
39,376 |
|
|
13,047 |
|
|
18,575 |
|
|
6,288 |
|
|
1,466 |
|
Total |
|
$ |
1,006,350 |
|
$ |
363,522 |
|
$ |
158,399 |
|
$ |
370,224 |
|
$ |
114,206 |
|
(1) |
Long‑term debt obligations consisted of the outstanding principal of the term loan A facility. |
|
(2) |
Future interest payments are calculated based on the assumption all debt remains outstanding until maturity. Interest on credit facility assumes the interest rate in effect at December 31, 2016 and includes unused commitment fee. |
|
(3) |
Certain payouts of outstanding EARs under the EAR Plan were made in 2016 and the final payout of the outstanding EARs under the EAR Plan was paid in the first quarter of 2017. |
|
(4) |
During the normal course of our business, we enter into agreements to purchase goods and services, including purchase commitments for production materials, finished goods inventory, capital expenditures and endorsement arrangements with professional golfers. The amounts reported in the table above exclude those liabilities included in accounts payable or accrued liabilities on the consolidated balance sheet as of December 31, 2016. |
|
(5) |
We lease certain warehouses, distribution and office facilities, vehicles and office equipment under operating leases. Most lease arrangements provide us with the option to renew leases at defined terms. The future operating lease obligations would change if we were to exercise these options or if we were to enter into additional operating leases. |
Off‑Balance Sheet Arrangements
We do not have any off‑balance sheet arrangements.
Critical Accounting Policies and Estimates
Our discussion and analysis of results of operations, financial condition and liquidity are based upon our consolidated financial statements, which have been prepared in accordance with accounting principles generally accepted in the United States. The preparation of these consolidated financial statements requires us to make estimates and judgments that affect the reported amounts of assets, liabilities, shareholders’ equity, net sales and expenses, and the disclosure of contingent assets and liabilities in our consolidated financial statements. We base our estimates on historical experience, known trends and events, and various other factors that we believe are reasonable under the circumstances, the results of which form the basis for making judgments about the carrying values of assets and liabilities that are not readily apparent from other sources.
105
Management evaluated the development and selection of its critical accounting policies and estimates and believes that the following involve a higher degree of judgment or complexity and are most significant to reporting our results of operations and financial position, and are therefore discussed as critical. The following critical accounting policies reflect the significant estimates and judgments used in the preparation of our consolidated financial statements. With respect to critical accounting policies, even a relatively minor variance between actual and expected experience can potentially have a materially favorable or unfavorable impact on subsequent results of operations. However, our historical results for the periods presented in our consolidated financial statements have not been materially impacted by such variances. More information on all of our significant accounting policies can be found in “Notes to Consolidated Financial Statements – Note 2—Summary of Significant Accounting Policies.”
Revenue Recognition
We recognize revenue in accordance with ASC 605, “Revenue Recognition.” Revenue is recognized upon shipment or upon receipt by the customer, depending on the country of sale and the agreement with the customer, net of an allowance for discounts, sales returns, customer sales incentives and cooperative advertising. The criteria for recognition of revenue is met when persuasive evidence that an arrangement exists, both title and risk of loss have passed to the customer, the price is fixed or determinable and collectability is reasonably assured. In circumstances where either title or risk of loss pass upon receipt by the customer, we defer revenue until such event occurs based on our estimate of the shipping time from our distribution centers to the customer using historical and expected delivery times by geographic location. Delivery times vary by geographic location, but generally range from the same day to four days. We review these estimates periodically to test their reasonableness as compared to actual transactions. Historically, our actual shipping times have not been materially different from our estimates. Amounts billed to customers for shipping and handling are included in net sales. Sales tax collected is not recognized as revenue as it is ultimately remitted to governmental authorities.
We record an allowance for anticipated sales returns through a reduction of sales and cost of goods sold in the period that the related sales are recorded. Sales returns are estimated based upon historical rates of product returns, current economic trends and changes in customer demands as well as specific identification of outstanding returns. We do not believe there is a reasonable likelihood that there will be a material change in the assumptions used to calculate the allowance for sales returns. However, if the actual cost of sales returns are significantly different than the estimated allowance, our results of operations could be materially affected.
We offer sales‑based incentive programs to certain customers in exchange for certain benefits, including prominent product placement and exclusive stocking by participating retailers. These programs typically provide qualifying customers with rebates for achieving certain purchase goals. The rebates are accounted for as a reduction in sales over the period in which the rebate is earned. Our estimate of the reduction of revenue requires the use of assumptions related to the percentage of customers who will achieve qualifying purchase goals and the level of achievement. These assumptions are based on historical experience, current year program design, current marketplace conditions and sales forecasts, including considerations of our product life cycles. We do not believe there is a reasonable likelihood that there will be a material change in the assumptions used to calculate our estimate of the reduction of revenue.
Allowance for Doubtful Accounts
We make estimates related to our ability to collect our accounts receivable and maintain an allowance for estimated losses resulting from the inability or unwillingness of our customers to make required payments. The allowance includes amounts for certain customers where a risk of default has been specifically identified as well as a provision for customer defaults on a formula basis when it is determined the risk of some default is probable and estimable, but cannot yet be associated with specific customers. The assessment of the likelihood of customer defaults is based on various factors, including credit risk assessments, length of time the receivables are past due, historical experience, customer specific information available to us and existing economic conditions, all of which are subject to change. We do not believe there is reasonable likelihood that there will be a material change in the assumptions used to calculate the allowance for doubtful accounts. However, if the actual uncollected amounts significantly exceed the estimated allowance, our results of operations could be materially affected.
106
Inventories
Inventories are valued at the lower of cost and net realizable value. Cost is determined using the first‑in, first‑out inventory method. The inventory balance, which includes material, labor and manufacturing overhead costs, is recorded net of an allowance for obsolete or slow moving inventory. The calculation of our allowance for obsolete or slow moving inventory requires management to make assumptions and to apply judgment regarding the future demand and marketability of products, the impact of new product introductions, inventory turn, product spoilage and specific identification of items, such as product discontinuance, engineering/material changes, or regulatory‑related changes. We do not believe there is a reasonable likelihood that there will be a material change in the assumptions used to calculate the allowance for obsolete or slow moving inventory. However, if estimates regarding consumer demand are inaccurate or changes in technology affect demand for certain products in an unforeseen manner, we may need to adjust our allowance for obsolete or slow moving inventory, which could have a material effect on our results of operations.
Impairment of Goodwill, Indefinite‑Lived and Long‑Lived Assets
Goodwill
We evaluate goodwill annually to determine whether it is impaired. Goodwill is also tested more frequently if an event occurs or circumstances change that would indicate that the fair value of a reporting unit is less than its carrying amount. Conditions that may indicate impairment include, but are not limited to, a significant adverse change in customer demand or business climate that could affect the value of an asset; general economic conditions, such as increasing Treasury rates or unexpected changes in gross domestic product growth; a change in our market shares; budget‑to‑actual performance and consistency of operating margins and capital expenditures; a product recall or an adverse action or assessment by a regulator; or changes in management or key personnel. If an impairment indicator exists, we test goodwill for recoverability. We have identified five reporting units and selected the fourth fiscal quarter to perform our annual goodwill impairment testing.
We may assess qualitative factors to determine if it is more likely than not (i.e., a likelihood of more than 50%) that the fair value of a reporting unit is less than its carrying amount, including goodwill. The assessment of qualitative factors is optional and at our discretion. We may bypass the qualitative assessment for any reporting unit in any period and perform a quantitative goodwill impairment test. We may resume performing the qualitative assessment in any subsequent period. If we determine based on the qualitative factors that it is not more likely than not that the fair value of a reporting unit is less than its carrying amount, no further testing is necessary. If, however, we determine that it is more likely than not that the fair value of a reporting unit is less than its carrying amount, we perform the first step of a two-step quantitative goodwill impairment test. In the first step, we compare the fair value of the reporting unit to its carrying value. If the fair value of the reporting unit exceeds the carrying value of the net assets assigned to that unit, goodwill is considered not impaired and we are not required to perform further testing. If the carrying value of the net assets assigned to the reporting unit exceeds the fair value of the reporting unit, then we must perform the second step of the impairment test in order to determine the implied fair value of the reporting unit’s goodwill. If the carrying value of a reporting unit’s goodwill exceeds its implied fair value, then we would record an impairment loss equal to the difference.
The fair value of our reporting units are determined using the income approach. The income approach uses a discounted cash flow analysis, which involves applying appropriate discount rates to estimated future cash flows based on forecasts of sales, costs and capital requirements. The most significant estimates and assumptions inherent in this approach are the enterprise value based on the estimated present value of future net cash flows the business is expected to generate over a forecasted period and an estimate of the present value of cash flows beyond that period, which is referred to as the terminal value. The estimated present value is calculated using a discount rate known as the weighted‑average cost of capital, which accounts for the time value of money and the appropriate degree of risks inherent in the business. We estimate future sales growth using a number of critical factors, including among others, our nature and our history, financial and economic conditions affecting us, our industry and the general company, past results and our current operations and future prospects. Forecasts of future operations are based, in part, on operating results and our expectations as to future market conditions. We deem the discount rate used in our analysis to be commensurate with the underlying uncertainties associated with achieving the estimated cash flows we project. This analysis contains uncertainties because it requires us to make assumptions and to apply judgments to estimate industry economic factors and the profitability of future business strategies. If actual results are not consistent with our estimates and assumptions, we may be exposed to future impairment losses that could be material.
107
Our tests for impairment of goodwill resulted in a determination that the fair value of each reporting unit exceeded the carrying value of our net assets for the years ended December 31, 2016, 2015 and 2014, respectively. We do not anticipate any material impairment charges in the near term.
Indefinite‑Lived Intangible Assets
Our trademarks have been assigned an indefinite life as we currently anticipate that these trademarks will contribute cash flows to us indefinitely. We evaluate whether the trademarks continue to have an indefinite life on an annual basis. Trademarks are reviewed for impairment annually in the fourth fiscal quarter and may be reviewed more frequently if indicators of impairment are present. Conditions that may indicate impairment include, but are not limited to, a significant adverse change in customer demand or business climate that could affect the value of an asset, a product recall or an adverse action or assessment by a regulator.
Impairment losses are recorded to the extent that the carrying value of the indefinite‑lived intangible asset exceeds its fair value. We measure the fair value of our trademarks using the relief‑from‑royalty method, which estimates the present value of the royalty income that could be hypothetically earned by licensing the brand name to a third party over the remaining useful life. The most significant estimates and assumptions inherent in this approach are the growth rate of sales from the businesses that use the subject trademark, the net royalty saving rate and the discount rate. Our tests for impairment of trademarks resulted in a determination that the fair value of the Pinnacle trademark was less than its carrying value of $3.7 million for the year ended December 31, 2014 and resulted in an impairment charge of $0.8 million. No impairment charges for our trademarks were recorded for the years ended December 31, 2016 and 2015.
Long‑Lived Assets
A long‑lived asset (including amortizable identifiable intangible assets) or asset group is tested for recoverability whenever events or changes in circumstances indicate that its carrying amount may not be recoverable. Conditions that may indicate impairment include, but are not limited to, a significant adverse change in customer demand or business climate that could affect the value of an asset, a product recall or an adverse action or assessment by a regulator. When such events occur, we compare the sum of the undiscounted cash flows expected to result from the use and eventual disposition of the asset or asset group to the carrying amount of the long‑lived asset or asset group. The cash flows are based on the best estimate of future cash flows derived from the most recent business projections. If this comparison indicates that there is impairment, the amount of the impairment is calculated based on the excess of the asset’s or the asset group’s carrying value over its fair value. Fair value is estimated primarily using discounted expected future cash flows on a market‑participant basis. No impairment charges for our long‑lived assets were recorded for the years ended December 31, 2016, 2015 and 2014.
Pension and Other Postretirement Benefit Plans
We provide U.S. and foreign defined benefit and defined contribution plans to our eligible employees and postretirement benefits to certain retirees, including pensions, postretirement healthcare benefits and other postretirement benefits.
Plan assets and obligations are measured using various actuarial assumptions, such as discount rates, rate of compensation increase, mortality rates, turnover rates and health care cost trend rates, as determined at each year end measurement date. The measurement of net periodic benefit cost is based on various actuarial assumptions, including discount rates, expected return on plan assets and rate of compensation increase, which are determined as of the prior year measurement date. Our actuarial assumptions are reviewed on an annual basis and modified when appropriate.
Approximately 81.1% of our employees are covered by defined benefit pension plans and approximately 27.1% of our employees are covered by other postretirement benefit plans, in each case as of December 31, 2016. Pension plans provide benefits based on plan‑specific benefit formulas as defined by the applicable plan documents. Postretirement benefit plans generally provide for the continuation of medical benefits for all eligible employees. Contributions to our postretirement benefit plan are determined based upon amounts needed to cover postretirement benefits paid during the period, net of contributions made by eligible employees. In general, our policy is to fund our pension benefit obligation based on legal requirements, tax and liquidity considerations and local practices.
108
Our projected benefit obligations related to our pension and other postretirement benefit plans are valued using a weighted‑average discount rate of 4.17% and 4.08%, respectively, for the year ended December 31, 2016. The determination of the discount rate is generally based on an index created from a hypothetical bond portfolio consisting of high‑quality fixed income securities with durations that match the timing of expected benefit payments. Changes in the selected discount rate could have a material impact on our projected benefit obligations and the unfunded status of our pension and other postretirement benefit plans. Decreasing the discount rate by 100 basis points would have increased the projected benefit obligations of our pension and other postretirement benefit plans by approximately $26.3 million and $2.2 million, respectively, for the year ended December 31, 2016.
Our net periodic pension benefit and other postretirement benefit cost is calculated using a variety of assumptions, including a weighted average discount rate and expected return on plan assets. The expected return on plan assets is determined based on several factors, including adjusted historical returns, historical risk premiums for various asset classes and target asset allocations within the portfolio. Adjustments made to the historical returns are based on recent return experience in the equity and fixed income markets and the belief that deviations from historical returns are likely over the relevant investment horizon. Actual cost is also dependent on various other factors related to the employees covered by these plans. Adjustments to our actuarial assumptions could have a material adverse impact on our operating results. Decreasing the discount rate by 100 basis points would increase net periodic pension and other postretirement benefit cost by approximately $2.8 million and $0.4 million, respectively, for the year ended December 31, 2016. Decreasing the expected return on plan assets by 100 basis points would increase net periodic pension benefit cost by approximately $1.6 million for the year ended December 31, 2016.
Product Warranty
Certain of our products have defined warranties ranging from one to two years. Products covered by our defined warranty policies include all Titleist golf products, FootJoy golf shoes, and FootJoy golf outerwear. Our product warranties generally obligate us to pay for the cost of replacement products, including the cost of shipping replacement products to our customers. Our policy is to accrue the estimated cost of satisfying future warranty claims at the time the sale is recorded. In estimating our future warranty obligations, we consider various factors, including our warranty policies and practices, the historical frequency of claims, and the cost to replace or repair products under warranty.
We estimate our warranty cost based on historical warranty claims experience and available product quality data. In cases where there is little or no historical claims experience, we estimate our warranty obligation based upon long‑term historical warranty rates of similar products until sufficient data is available. We update our estimates as actual model‑specific rates become available to ensure that our expected warranty cost continues to be within the range of likely outcomes. We do not believe there is a reasonable likelihood that there will be a material change in the assumptions used to calculate our warranty obligation. However, if the number of actual warranty claims or the cost of satisfying warranty claims were to significantly exceed the estimated warranty reserve, our results of operations could be materially affected.
Income Taxes
Current income tax expense or benefit is the amount of income taxes expected to be payable or receivable for the current year. Deferred income tax assets and liabilities represent the temporary differences between the tax basis and financial reporting basis of our assets and liabilities and are determined using the tax rates and laws in effect for the periods in which the differences are expected to reverse. We may record valuation allowances for deferred tax assets to reduce our net deferred tax assets to the amount that is more‑likely‑than‑not to be realized.
The determination of whether a deferred tax asset will be realized is made on both a jurisdictional basis and the use of our estimate of the recoverability of the deferred tax asset. In evaluating whether a valuation allowance is required under such rules, we consider all available positive and negative evidence, including our prior operating results, the nature and reason for any losses, our forecast of future taxable income in each respective tax jurisdiction and the dates on which any deferred tax assets are expected to expire. These assumptions require a significant amount of judgment, including estimates of future taxable income. We determined that we would not be able to fully realize the benefits of all our state deferred tax assets. As of December 31, 2016 and 2015, a cumulative valuation allowance of $21.7 million and $20.8 million, respectively, was recorded.
109
Valuation of Common Stock Warrants
Prior to our initial public offering, we had warrants to purchase shares of our common stock outstanding. We classified the warrants as a liability on our consolidated balance sheet as these warrants were free‑standing financial instruments that could have resulted in the issuance of a variable number of our common shares. The warrants were initially recorded at fair value on the date of grant, and were subsequently re‑measured to fair value at each reporting date.
To arrive at a fair value of the warrants to purchase common stock, we performed a two‑step process. We first estimated the aggregate fair value of the Company (our “Business Enterprise Value,” or “BEV”) and then allocated this aggregate value to each element of our capital structure under the contingent claims methodology. In determining the fair value of our BEV, we used a combination of the income approach and the market approach to estimate our aggregate BEV at each reporting date. Under the income approach, fair value is estimated based on the discounted present value of the cash flows that the business can be expected to generate in the future. The most significant estimates and assumptions inherent in this approach were the enterprise value based on the estimated present value of future net cash flows the business was expected to generate over a forecasted period and an estimate of the present value of cash flows beyond that period, which is referred to as the terminal value. The estimated present value was calculated using a discount rate known as the weighted‑average cost of capital, which accounts for the time value of money and the appropriate degree of risks inherent in the business. We also employed a market approach, which is based on the guideline public company method. The guideline public company method uses the fair value of a peer group of publicly‑traded companies and considers multiples of financial metrics to derive a range of indicated values. Determination of the peer group is based on factors including, but not limited to, the similarity of their industry, growth rate and stage of development, business model and financial risk. These types of analyses contain uncertainties because they require us to make assumptions and to apply judgment to estimate industry economic factors and the profitability of future business strategies.
Based on our BEV at each reporting date, our estimated aggregate fair value was then allocated to shares of common stock, shares of redeemable convertible preferred stock, convertible notes, bonds, employee stock options and warrants to purchase common stock using the contingent claims methodology. Under this model, each component of our capital structure was treated as a call option with unique claim on our assets as determined by the characteristics of each security’s class. The resulting option claims were then valued using an option pricing model. This model defines the fair value of each class of security based on the current aggregate fair value of the company along with assumptions based on the rights and preferences of each class of security. The rights and preferences of each class of security are based upon an assumed liquidity event, such as an anticipated timing of an initial public offering. The anticipated timing of a liquidity event utilized in these valuations was based on then current plans and estimates of our board of directors and management regarding an initial public offering.
Key assumptions used to value the warrants under the option pricing model were as follows as of July 31, 2016, the date of the final warrant exercise, and December 31, 2015:
|
|
|
July 31, |
|
December 31, |
|
||
|
|
|
2016 |
|
2015 |
|
||
|
Exercise Price |
|
$ |
11.11 |
|
$ |
11.11 |
|
|
Volatility |
|
|
35 |
% |
|
30 |
% |
|
Risk‑free rate |
|
|
0.26 |
% |
|
0.53 |
% |
|
Dividend yield |
|
|
— |
% |
|
— |
% |
We historically have been a private company and lack company‑specific historical and implied volatility information of our stock. Therefore, we estimated our expected volatility based on the historical volatility of a set of publicly‑traded peer companies for a term equal to the remaining contractual term of the warrants. The risk‑free interest rate was determined by reference to the U.S. Treasury yield curve for time periods which were approximately equal to the remaining time to purchase for each of the tranches of warrants.
All remaining warrants were exercised during the year ended December 31, 2016 and there are no warrants outstanding as of December 31, 2016.
110
Share‑Based Compensation
We account for share-based compensation in accordance with accounting guidance that requires all share-based compensation awards granted to employees and directors to be measured at fair value and recognized as an expense in the financial statements.
In January 2016, our board of directors approved the 2015 Incentive Plan, which allows grants of stock options, stock appreciation rights, restricted shares of common stock, restricted stock units, and other stock‑based and cash‑based awards to our directors, officers, employees, consultants and advisors. We issue stock‑based awards to employees with (i) service‑based vesting conditions or (ii) service‑based and performance‑based vesting conditions. We measure stock‑based awards based on the deemed fair value on the date of grant for accounting purposes, and recognize the corresponding compensation expense of those awards, net of estimated forfeitures, over the requisite service period, which is generally the vesting period of the respective award. For awards with only service‑based vesting conditions, compensation expense is recorded using the straight‑line method. For awards with service‑based and performance‑based vesting conditions, compensation expense is recorded using the straight‑line method once we have determined that the likelihood of meeting the performance conditions is probable, which requires management judgment.
During 2016, our board of directors approved grants under our 2015 Incentive Plan of multi‑year restricted stock units (which we refer to as RSUs) and performance stock units (which we refer to as PSUs) to certain key members of management. The grants were made 50% in RSUs and 50% in PSUs. One‑third of the RSUs vest on each of January 1 of 2017, 2018 and 2019. The PSUs cliff‑vest on December 31, 2018, subject to the employee’s continued employment and our level of achievement of the applicable cumulative Adjusted EBITDA performance metrics (as defined in the applicable award agreements) measured over the three‑year performance period. The expense recorded during the year ended December 31, 2016 related to the PSUs was based on management’s best estimate of the three-year cumulative adjusted EBITDA forecast as of December 31, 2016.
The assumptions used in calculating the fair value of share-based compensation awards represent management’s best estimates, but the estimates involve inherent uncertainties and the application of management judgment. In addition, compensation expense for performance-based awards is recorded over the related service period when achievement of the performance targets are deemed probable, which requires management judgment. For example, the expense recorded during the year ended December 31, 2016 related to the performance-based stock units granted in 2016 was based on management’s best estimate of the three-year cumulative adjusted EBITDA forecast as of December 31, 2016. As a result, if factors change and we use different assumptions, our share-based compensation expense could be materially different in the future. Refer to “Notes to Consolidated Financial Statements – Note 17 – Equity Incentive Plans” for a further discussion on share-based compensation.
As of December 31, 2016, we had $31.5 million of unrecognized compensation expense expected to be recognized over a weighted average period of two years. This unrecognized compensation expense reflects expense related to the performance-based stock units based on the performance target multiplier deemed probable as of December 31, 2016.
For the years ended December 31, 2015 and 2014, we accounted for compensation expense related to our share‑based compensation awards, including EARs under our EAR Plan and stock options granted in connection with the Acquisition, using the intrinsic value method, as permitted by ASC 718 for nonpublic entities, with changes to the value of the share‑based compensation awards recognized as compensation expense at each reporting date. Compensation expense for the EAR Plan was based on CSE value as defined in the EAR Plan documents, which was the highest of (1) an amount calculated by using a formula based on certain financial metrics of Acushnet Company as of and for the year ended December 31, 2015, (2) an amount calculated by using a formula based on certain financial metrics of Acushnet Company as of and for the year ending December 31, 2016 and (3) if an IPO has occurred, an amount calculated based on the average per share closing price of the publicly traded common stock for the first three full trading days following the pricing of common stock in the IPO. Based on the plan definition, the CSE value as of December 31, 2016 was based on the amount calculated by using a formula based on certain financial metrics of Acushnet Company as of and for the year ending December 31, 2016. We had the option to settle up to 50% of our outstanding EARs using our common stock. However, we settled the entire amount due under the EARs in cash during the first quarter of 2017, which payments were funded from borrowings under our delayed draw term loan A facility and borrowings under our revolving credit facility.
111
Prior to our initial public offering, as there was no market for our common stock, the fair value of our common stock was determined by our board of directors as of the date of each stock‑award grant based on our most recently available third‑party valuation of common stock. Since Acquisition in 2011, we have had a third‑party valuation prepared at the end of each quarter in connection with a valuation of the warrants to purchase our common stock needed for the preparation of our consolidated financial statements. The third‑party valuations used for the grants described below were prepared using a combination of an income approach, which utilized a discounted cash flow model, and market approach, which utilized a comparative market multiple model. The results from each of the models were then weighted and combined into a single estimate of common stock fair value.
Following our initial public offering, the fair value of our common stock has been determined based on the quoted market price of our common stock.
Recently Issued Accounting Pronouncements
We have reviewed all recently issued standards and have determined that, other than as disclosed in “Notes to Consolidated Financial Statements – Note 2 – Summary of Significant Accounting Policies” and included elsewhere in this report, such standards will not have a significant impact on our consolidated financial statements or do not otherwise apply to our operations.
ITEM 7A. QUANTITATIVE AND QUALITATIVE DISCLOSURES ABOUT MARKET RISK
We are exposed to various market risks, which may result in potential losses arising from adverse changes in market rates, such as interest rates, foreign exchange rates and commodity prices. We do not enter into derivatives or other financial instruments for trading or speculative purposes and do not believe we are exposed to material market risk with respect to our cash and cash equivalents.
Interest Rate Risk
We are exposed to interest rate risk under our various credit facilities which accrue interest at variable rates, as described above under “—Liquidity and Capital Resources” and “—Indebtedness” and in “Notes to Consolidated Financial Statements – Note 9 - Debt and Financing Arrangements.” We currently do not engage in any interest rate hedging activity but may enter into interest rate swaps or pursue other interest rate hedging strategies in the future.
As of December 31, 2016, we had $412.8 million of outstanding indebtedness, all of which was at variable interest rates. A 1.00% increase in the interest rate applied to these borrowings would have resulted in an increase of $4.6 million in our annual pre‑tax interest expense.
Interest rate risk is highly sensitive due to many factors, including U.S. monetary and tax policies, U.S. and international economic factors and other factors beyond our control. We are exposed to changes in the level of interest rates and to changes in the relationship or spread between interest rates for our floating rate debt. Our floating rate debt requires payments based on a variable interest rate index such as LIBOR. Therefore, increases in interest rates may reduce our net income by increasing the cost of our debt.
Foreign Exchange Risk
In the normal course of business, we are exposed to gains and losses resulting from fluctuations in foreign currency exchange rates relating to transactions outside the United States denominated in foreign currencies, which include, but are not limited to, the Japanese yen, the Korean won, the British pound sterling, the euro and the Canadian dollar. In addition, we are exposed to gains and losses resulting from the translation of the operating results of our non‑U.S. subsidiaries into U.S. dollars for financial reporting purposes.
We use financial instruments to reduce the impact of changes in foreign currency exchange rates. The principal financial instruments we enter into on a routine basis are foreign exchange forward contracts. The primary foreign exchange forward contracts pertain to the Japanese yen, the Korean won, the British pound sterling, the euro and the Canadian dollar. Foreign exchange forward contracts are primarily used to hedge purchases denominated in select foreign currencies. The periods of the foreign exchange forward contracts correspond to the periods of the forecasted
112
transactions, which do not exceed 24 months subsequent to the latest balance sheet date. We do not enter into foreign exchange forward contracts for trading or speculative purposes.
The gross U.S. dollar equivalent notional amount of all foreign currency hedges outstanding at December 31, 2016 was $371.2 million, representing a net settlement asset of $15.5 million. Gains and losses on the foreign exchange forward contracts that we account for as hedges offset losses and gains on these foreign currency purchases and reduce the earnings and shareholders’ equity volatility relating to foreign exchange.
We performed a sensitivity analysis to assess potential changes in the fair value of our foreign exchange forward contracts relating to a hypothetical movement in foreign currency exchange rates. The sensitivity analysis of changes in the fair value of our foreign exchange forward contracts outstanding at December 31, 2016, while not predictive in nature, indicated that if the U.S. dollar uniformly weakened by 10% against all currencies covered by our contracts, the net settlement asset of $15.5 million would decrease by $33.2 million resulting in a net settlement liability of $17.7 million.
The sensitivity analysis described above recalculates the fair value of the foreign exchange forward contracts outstanding at December 31, 2016 by replacing the actual foreign currency exchange rates at December 31, 2016 with foreign currency exchange rates that are 10% weaker rates for each applicable foreign currency. All other factors are held constant. The sensitivity analysis disregards the possibility that currency exchange rates can move in opposite directions and that gains from one currency may or may not be offset by losses from another currency. The analysis also disregards the offsetting change in value of the underlying hedged transactions and balances.
The financial markets and currency volatility may limit our ability to cost‑effectively hedge these exposures. The counterparties to derivative contracts are major financial institutions. We assess credit risk of the counterparties on an ongoing basis.
Commodity Price Risk
We are exposed to commodity price risk with respect to certain materials and components used by us, our suppliers and our manufacturers, including polybutadiene, urethane and Surlyn for the manufacturing of our golf balls, titanium and steel for the assembly of our golf clubs, leather and synthetic fabrics for our golf shoes, golf gloves, golf gear and golf apparel, and resin and other petroleum‑based materials for a number of our products.
Impact of Inflation
Our results of operations and financial condition are presented based on historical cost. While it is difficult to accurately measure the impact of inflation due to the imprecise nature of the estimates required, we believe the effects of inflation, if any, on our results of operations and financial condition have been immaterial.
ITEM 8. FINANCIAL STATEMENTS AND SUPPLEMENTARY DATA
See the Index to Consolidated Financial Statements and financial statements commencing on page F‑1, which are incorporated herein by reference.
ITEM 9. CHANGES IN AND DISAGREEMENTS WITH ACCOUNTANTS ON ACCOUNTING AND FINANCIAL DISCLOSURES
There were no changes in or disagreements with our accountants on accounting and financial disclosure matters.
ITEM 9A. CONTROLS AND PROCEDURES
Evaluation of Disclosure Controls and Procedures
We maintain disclosure controls and procedures that are designed to ensure that information required to be disclosed in our reports filed or submitted under the Securities Exchange Act of 1934, as amended (the “Exchange Act”), is recorded, processed, summarized and reported within the time periods specified in the SEC’s rules and forms, and that
113
such information is accumulated and communicated to our management, including our Chief Executive Officer (“CEO”) and our Chief Financial Officer (“CFO”), as appropriate, to allow timely decisions regarding required disclosures. Any controls and procedures, no matter how well designed and operated, can provide only reasonable assurance of achieving the desired control objectives.
Our management, with the participation of our CEO and our CFO, evaluated the effectiveness of our disclosure controls and procedures (as defined in Rules 13a‑15(e) and 15d‑15(e) of the Exchange Act) as of the end of the period covered by this Annual Report on Form 10‑K. Based on their evaluation, our CEO and CFO concluded that our disclosure controls and procedures were not effective as of December 31, 2016, the end of the period covered by this Annual Report on Form 10‑K because of the material weaknesses in our internal control over financial reporting as described below. Our remediation efforts are described below.
Internal Control Over Financial Reporting
This annual report does not include a report of management’s assessment regarding internal control over financial reporting or an attestation report of the company’s registered public accounting firm due to a transition period established by the rules of the Securities and Exchange Commission for newly public companies.
Material Weaknesses and Status of Material Weaknesses Remediation
A material weakness is a deficiency, or a combination of deficiencies, in internal control over financial reporting, such that there is a reasonable possibility that a material misstatement of a company’s annual or interim financial statements will not be prevented or detected on a timely basis. The material weaknesses for the year ended December 31, 2016 are as follows. We did not have in place an effective control environment with a sufficient number of accounting personnel with the appropriate technical training in, and experience with, GAAP to allow for a detailed review of complex accounting transactions that would identify errors in a timely manner. Further, we did not design effective control activities relating to formally documented and implemented accounting processes and procedures across business cycles, including income taxes, derivatives, certain compensation and benefits, certain revenue transactions, and functional currency, and internal communication protocols related to matters impacting income tax and benefit accounts. We also did not maintain effective segregation of duties in our internal controls over financial reporting.
The lack of adequate accounting personnel and formal processes and procedures resulted in several audit adjustments to our consolidated financial statements for the years ended December, 2014, 2015 and 2016 and the interim periods within 2016. While these errors were determined not to be material to the consolidated financial statements, these control deficiencies could result in a misstatement to the financial statements or disclosures that would result in a material misstatement to the annual or interim consolidated financial statements that would not be prevented or detected. Accordingly, our management has determined that these control deficiencies constitute material weaknesses.
During the period covered by this Annual Report on Form 10‑K, we have continued the process of remediating the above material weaknesses, which has included numerous steps to enhance our internal control over financial reporting and address the underlying causes of the above material weaknesses. As part of this remediation process, we have enlisted the help of external advisors to provide assistance in the areas of financial accounting and tax accounting in the short term and are actively recruiting additional financial reporting personnel with technical accounting and financial reporting experience, are formalizing our accounting policies and procedures, and enhancing our internal review procedures during the financial statement close process. In addition, we have engaged an accounting firm to evaluate and document the design and operating effectiveness of our internal controls and assist with the remediation and implementation of our internal controls as required. We are committed to maintaining a strong internal control environment, and we expect to continue our efforts to ensure the material weaknesses described above are remediated. However, the material weaknesses cannot be considered remediated until the applicable remedial controls operate for a sufficient period of time and management has concluded, through testing, that these controls are operating effectively.
Changes in Internal Control Over Financial Reporting
As disclosed above under “– Material Weakness and Status of Material Weakness Remediation,” we have continued the process of remediating the above material weaknesses. There have been no changes in our internal control over financial reporting (as defined in Rules 13a‑15(f) and 15d‑15(f) under the Exchange Act) that occurred during the
114
quarter ended December 31, 2016 that have materially affected, or are reasonably likely to materially affect, our internal control over financial reporting.
None.
115
ITEM 10. DIRECTORS, EXECUTIVE OFFICERS AND CORPORATE GOVERNANCE
The Information about our executive officers is contained in the discussion entitled “Executive Officers of the Registrant” in Part I of this Form 10‑K. The remaining information required by this Item will be included in our Proxy Statement and is incorporated herein by reference.
ITEM 11. EXECUTIVE COMPENSATION
The information required by this Item will be included in our Proxy Statement and is incorporated herein by reference.
ITEM 12. SECURITY OWNERSHIP OF CERTAIN BENEFICIAL OWNERS AND MANAGEMENT AND RELATED STOCKHOLDER MATTERS
Securities Authorized for Issuance under Equity Compensation Plans
The following table sets forth, as of December 31, 2016, certain information related to our compensation plans under which shares of the Company’s common stock may be issued.
|
Plan Category |
|
Number of |
|
Weighted- |
|
Number of |
|
Equity compensation plans approved by shareholders: |
|
|
|
|
|
|
|
Acushnet Holdings Corp. 2015 Incentive Plan |
|
3,688,743 |
(1) |
|
|
4,501,257 |
|
Equity compensation plans not approved by shareholders |
|
— |
|
N/A |
|
— |
|
Total |
|
3,688,743 |
|
|
|
4,501,257 |
|
(1) |
Consists of 3,688,743 restricted stock units and performance stock units. |
The remaining information required by this Item will be included in our Proxy Statement and is incorporated herein by reference.
ITEM 13. CERTAIN RELATIONSHIPS AND RELATED TRANSACTIONS, AND DIRECTOR
INDEPENDENCE
The information required by this Item will be included in our Proxy Statement and is incorporated herein by reference.
ITEM 14. PRINCIPAL ACCOUNTANT FEES AND SERVICES
The information required by this Item will be included in our Proxy Statement and is incorporated herein by reference.
ITEM 15. EXHIBITS AND FINANCIAL STATEMENT SCHEDULES
|
(a) |
The following documents are filed as a part of this report |
116
|
(1) |
Financial Statements. See Index to Consolidated Financial Statements on page F-1 hereof. |
|
(2) |
Exhibits Index: |
|
Exhibit |
|
Description |
|
| 3.1 |
|
Amended and Restated Certificate of Incorporation of Acushnet Holdings Corp. (incorporated by reference to Exhibit 3.1 to the Registrant’s Current Report on Form 8‑K filed on November 2, 2016 (No. 001‑37935)). |
|
| 3.2 |
|
Amended and Restated Bylaws of Acushnet Holdings Corp. (incorporated by reference to Exhibit 3.2 to the Registrant’s Current Report on Form 8‑K filed on November 2, 2016 (No. 001‑37935)). |
|
|
10.1† |
|
Acushnet Company Equity Appreciation Rights Plan dated as of August 30, 2011, as amended November 24, 2014, June 9, 2015 and May 18, 2016 (incorporated by reference to Exhibit 10.1 to the Registrant’s Registration Statement on Form S‑1 (No. 333‑212116)). |
|
|
10.2† |
|
Form of Equity Appreciation Rights Award Agreement, as amended (incorporated by reference to Exhibit 10.2 to the Registrant’s Registration Statement on Form S‑1 (No. 333‑212116)). |
|
|
10.3† |
|
Equity Appreciation Rights Award Agreement between Acushnet Company and Yoon Soo (Gene) Yoon, dated as of August 30, 2011, as amended (incorporated by reference to Exhibit 10.3 to the Registrant’s Registration Statement on Form S‑1 (No. 333‑212116)). |
|
|
10.4† |
|
Equity Appreciation Rights Award Agreement between Acushnet Company and Walter R. Uihlein, dated as of August 30, 2011, as amended (incorporated by reference to Exhibit 10.4 to the Registrant’s Registration Statement on Form S‑1 (No. 333‑212116)). |
|
|
10.5† |
|
Acushnet Company Long‑Term Incentive Plan (effective January 1, 2009) (incorporated by reference to Exhibit 10.5 to the Registrant’s Registration Statement on Form S‑1 (No. 333‑212116)). |
|
|
10.6† |
|
Acushnet Holdings Corp. 2015 Omnibus Incentive Plan (incorporated by reference to Exhibit 10.6 to the Registrant’s Registration Statement on Form S‑1 (No. 333‑212116)). |
|
|
10.7† |
|
Form of Restricted Stock Unit Grant Notice and Restricted Stock Unit Agreement under the Acushnet Holdings Corp. 2015 Omnibus Incentive Plan (incorporated by reference to Exhibit 10.7 to the Registrant’s Registration Statement on Form S‑1 (No. 333‑212116)). |
|
|
10.8† |
|
Form of Performance Stock Unit Grant Notice and Performance Stock Unit Agreement under the Acushnet Holdings Corp. 2015 Omnibus Incentive Plan (incorporated by reference to Exhibit 10.8 to the Registrant’s Registration Statement on Form S‑1 (No. 333‑212116)). |
|
|
10.9† |
|
Acushnet Executive Severance Plan (as amended and restated effective April 29, 2016) (incorporated by reference to Exhibit 10.9 to the Registrant’s Registration Statement on Form S‑1 (No. 333‑212116)). |
|
|
10.10† |
|
Acushnet Company Supplemental Retirement Plan (as amended and restated effective December 31, 2015) (incorporated by reference to Exhibit 10.10 to the Registrant’s Registration Statement on Form S‑1 (No. 333‑212116)). |
|
|
10.11† |
|
Acushnet Company Amended and Restated Trust Agreement, dated as of August 31, 2016 (incorporated by reference to Exhibit 10.11 to the Registrant’s Registration Statement on Form S‑1 (No. 333‑212116)). |
|
|
10.12† |
|
Amended and Restated Change in Control Agreement between Acushnet Company and Walter R. Uihlein, dated as of July 19, 2013, as amended April 29, 2016 (incorporated by reference to Exhibit 10.12 to the Registrant’s Registration Statement on Form S‑1 (No. 333‑212116)). |
|
|
10.13† |
|
Amended and Restated Severance Agreement between Acushnet Company and Walter R. Uihlein, dated as of July 19, 2013, as amended April 29, 2016 (incorporated by reference to Exhibit 10.13 to the Registrant’s Registration Statement on Form S‑1 (No. 333‑212116)). |
|
|
10.14† |
|
Acushnet Company Walter R. Uihlein Trust Agreement dated as of January 1, 2003 (incorporated by reference to Exhibit 10.14 to the Registrant’s Registration Statement on Form S‑1 (No. 333‑212116)). |
|
|
10.15† |
|
Cash Bonus Agreement between Acushnet Company and Walter R. Uihlein, dated as of February 25, 2016 (incorporated by reference to Exhibit 10.15 to the Registrant’s Registration Statement on Form S‑1 (No. 333‑212116)). |
|
117
101.INS
|
10.16† |
|
Amended and Restated Acushnet Company Excess Deferral Plan II (effective July 29, 2011) (incorporated by reference to Exhibit 10.16 to the Registrant’s Registration Statement on Form S‑1 (No. 333‑212116)). |
|
| 10.17 |
|
Senior Secured Credit Agreement, dated as of April 27, 2016 among Acushnet Holdings Corp., Acushnet Company, Acushnet Canada Inc., Acushnet Europe Limited, certain other subsidiaries party thereto, Wells Fargo Bank, National Association as the administrative agent, swingline lender and issuing bank, Wells Fargo Securities, LLC and PNC Capital Markets LLC as joint lead arrangers and joint bookrunners, PNC Capital Markets LLC as syndication agent, and the lenders from time to time party thereto (incorporated by reference to Exhibit 10.17 to the Registrant’s Registration Statement on Form S‑1 (No. 333‑212116)). |
|
| 10.18 |
|
Joint Venture Agreement between Acushnet Cayman Limited and Myre Overseas Corporation, dated as of June 1, 1995 (incorporated by reference to Exhibit 10.18 to the Registrant’s Registration Statement on Form S‑1 (No. 333‑212116)). |
|
| 10.19 |
|
Registration Rights Agreement, dated October 26, 2016, among the Company and the Holders (as defined therein) (incorporated by reference to Exhibit 10.1 to the Registrant’s Current Report on Form 8‑K filed on November 1, 2016 (No. 001‑37935)). |
|
|
10.20† |
|
Form of Restricted Stock Unit Grant Notice and Restricted Stock Unit Agreement for Directors under the Acushnet Holdings Corp. 2015 Omnibus Incentive Plan (incorporated by reference to Exhibit 10.20 to the Registrant’s Registration Statement on Form S‑1 (No. 333‑212116)). |
|
|
10.21† |
|
Acushnet Holdings Corp. Independent Directors Deferral Plan (incorporated by reference to Exhibit 10.21 to the Registrant’s Registration Statement on Form S‑1 (No. 333‑212116)). |
|
|
10.22† |
|
Acushnet Holdings Corp. 2015 Omnibus Incentive Plan (incorporated by reference to Exhibit 4.3 to the Registrant’s Registration Statement on Form S-8 filed on October 27, 2016 (No. 001-37935)). |
|
| 21.1 |
|
List of Subsidiaries (filed herewith). |
|
| 23.1 |
|
Consent of PricewaterhouseCoopers LLP (filed herewith). |
|
| 24.1 |
|
Power of Attorney (filed herewith). |
|
| 31.1 |
|
Certification of Periodic Report by Chief Executive Officer Pursuant to Rule 13a–14(a) or 15d–14(a) of the Securities Exchange Act of 1934, as Adopted Pursuant to Section 302 of the Sarbanes-Oxley Act of 2002 (filed herewith). |
|
| 31.2 |
|
Certification of Periodic Report by Chief Financial Officer Pursuant to Rule 13a–14(a) or 15d–14(a) of the Securities Exchange Act of 1934, as Adopted Pursuant to Section 302 of the Sarbanes-Oxley Act of 2002 (filed herewith). |
|
| 32.1 |
|
Certification of Chief Executive Officer Pursuant to 18 U.S.C. Section 1350, as Adopted Pursuant to Section 906 of the Sarbanes-Oxley Act of 2002 (filed herewith). |
|
| 32.2 |
|
Certification of Chief Financial Officer Pursuant to 18 U.S.C. Section 1350, as Adopted Pursuant to Section 906 of the Sarbanes-Oxley Act of 2002 (filed herewith). |
|
|
101.INS |
|
XBRL Instance Document (filed herewith). |
|
|
101.SCH |
|
XBRL Taxonomy Extension Schema (filed herewith). |
|
|
101.CAL |
|
XBRL Taxonomy Extension Calculation Linkbase (filed herewith). |
|
|
101.DEF |
|
XBRL Taxonomy Extension Definition Linkbase (filed herewith). |
|
|
101.LAB |
|
XBRL Taxonomy Extension Label Linkbase (filed herewith). |
|
|
101.PRE |
|
XBRL Taxonomy Extension Presentation Linkbase (filed herewith). |
|
†Identifies exhibits that consist of a management contract or compensatory plan or arrangement.
None.
118
SIGNATURES
Pursuant to the requirements of Section 13 or 15(d) of the Securities Exchange Act of 1934, as amended, the registrant has duly caused this report to be signed on its behalf by the undersigned, thereunto duly authorized.
|
|
ACUSHNET HOLDINGS CORP. |
||
|
|
|
||
|
|
By: |
/s/ Walter Uihlein |
|
|
|
|
Name: |
Walter Uihlein |
|
Date: March 30, 2017 |
|
Title: |
President and Chief Executive Officer |
Pursuant to the requirements of the Securities Exchange Act of 1934, this report has been signed below by the following persons on behalf of the registrant and in the capacities and on the dates indicated.
|
Signature |
|
Capacity |
|
Date |
|
|
|
|
|
|
|
/s/ Walter Uihlein |
|
President and Chief Executive Officer (Principal Executive Officer) |
|
March 30, 2017 |
|
Walter Uihlein |
|
|
||
|
|
|
|
|
|
|
/s/ William Burke |
|
Executive Vice President, Chief Financial Officer and Treasurer (Principal Financial Officer and Principal Accounting Officer) |
|
March 30, 2017 |
|
William Burke |
|
|
||
|
|
|
|
|
|
|
* |
|
Chairman |
|
March 30, 2017 |
|
Yoon Soo (Gene) Yoon |
|
|
||
|
|
|
|
|
|
|
* |
|
Director |
|
March 30, 2017 |
|
Jennifer Estabrook |
|
|
||
|
|
|
|
|
|
|
* |
|
Director |
|
March 30, 2017 |
|
Gregory Hewett |
|
|
||
|
|
|
|
|
|
|
* |
|
Director |
|
March 30, 2017 |
|
Christopher Metz |
|
|
||
|
|
|
|
|
|
|
* |
|
Director |
|
March 30, 2017 |
|
Sean Sullivan |
|
|
||
|
|
|
|
|
|
|
* |
|
Director |
|
March 30, 2017 |
|
Steven Tishman |
|
|
||
|
|
|
|
|
|
|
* |
|
Director |
|
March 30, 2017 |
|
David Valcourt |
|
|
|
|
|
|
|
|
|
|
|
* |
Director |
March 30, 2017 |
||
|
Norman Wesley |
|
|
|
|
|
*By: |
/s/ Roland Giroux |
|
|
|
|
|
Name: |
Roland Giroux |
|
|
|
|
Title: |
Attorney In Fact |
|
|
119
INDEX TO CONSOLIDATED FINANCIAL STATEMENTS
|
|
Page(s) |
|
Audited Consolidated Financial Statements |
|
|
|
|
|
|
|
|
F‑2 |
|
|
|
|
|
F‑3 |
|
|
|
|
|
F‑4 |
|
|
|
|
|
F‑5 |
|
|
|
|
|
F‑6 |
|
|
|
|
|
Consolidated Statements of Redeemable Convertible Preferred Stock and Equity |
F‑7 |
|
|
|
|
F‑8 |
Report of Independent Registered Public Accounting Firm
To The Board of Directors and Stockholders of Acushnet Holdings Corp.:
In our opinion, the accompanying consolidated balance sheets and the related consolidated statements of operations, of comprehensive income (loss), of redeemable convertible preferred stock and equity, and of cash flows present fairly, in all material respects, the financial position of Acushnet Holdings Corp. and its subsidiaries as of December 31, 2016, and December 31, 2015, and the results of their operations and their cash flows for each of the three years in the period ended December 31, 2016 in conformity with accounting principles generally accepted in the United States of America. These financial statements are the responsibility of the Company’s management. Our responsibility is to express an opinion on these financial statements based on our audits. We conducted our audits of these financial statements in accordance with the standards of the Public Company Accounting Oversight Board (United States). Those standards require that we plan and perform the audit to obtain reasonable assurance about whether the financial statements are free of material misstatement. An audit includes examining, on a test basis, evidence supporting the amounts and disclosures in the financial statements, assessing the accounting principles used and significant estimates made by management, and evaluating the overall financial statement presentation. We believe that our audits provide a reasonable basis for our opinion.
/s/ PricewaterhouseCoopers LLP
Boston, Massachusetts
March 30, 2017
F-2
ACUSHNET HOLDINGS CORP.
|
|
|
December 31, |
|
December 31, |
|
||
|
(in thousands, except share and per share amounts) |
|
2016 |
|
2015 |
|
||
|
|
|
|
|
|
|
|
|
|
Assets |
|
|
|
|
|
|
|
|
Current assets |
|
|
|
|
|
|
|
|
Cash ($12,958 and $10,029 attributable to the variable interest entity ("VIE")) |
|
$ |
76,058 |
|
$ |
54,409 |
|
|
Restricted cash |
|
|
3,082 |
|
|
4,725 |
|
|
Accounts receivable, net |
|
|
177,506 |
|
|
192,384 |
|
|
Inventories ($14,633 and $15,755 attributable to the VIE) |
|
|
323,289 |
|
|
326,359 |
|
|
Other assets |
|
|
84,596 |
|
|
93,646 |
|
|
Total current assets |
|
|
664,531 |
|
|
671,523 |
|
|
Property, plant and equipment, net ($10,709 and $11,147 attributable to the VIE) |
|
|
239,748 |
|
|
254,894 |
|
|
Goodwill ($32,312 and $32,312 attributable to the VIE) |
|
|
179,241 |
|
|
181,179 |
|
|
Identifiable intangible assets, net |
|
|
489,988 |
|
|
499,494 |
|
|
Deferred income taxes |
|
|
130,416 |
|
|
132,265 |
|
|
Other assets ($2,642 and $2,738 attributable to the VIE) |
|
|
32,247 |
|
|
19,618 |
|
|
Total assets |
|
$ |
1,736,171 |
|
$ |
1,758,973 |
|
|
Liabilities and Equity |
|
|
|
|
|
|
|
|
Current liabilities |
|
|
|
|
|
|
|
|
Short-term debt |
|
$ |
42,495 |
|
$ |
39,064 |
|
|
Current portion of long-term debt |
|
|
18,750 |
|
|
402,640 |
|
|
Accounts payable ($10,397 and $10,250 attributable to the VIE) |
|
|
87,608 |
|
|
89,869 |
|
|
Payables to related parties |
|
|
— |
|
|
12,570 |
|
|
Accrued taxes |
|
|
41,962 |
|
|
29,432 |
|
|
Accrued compensation and benefits ($780 and $1,035 attributable to the VIE) |
|
|
224,230 |
|
|
111,390 |
|
|
Accrued expenses and other liabilities ($4,121 and $4,516 attributable to the VIE) |
|
|
47,063 |
|
|
70,626 |
|
|
Total current liabilities |
|
|
462,108 |
|
|
755,591 |
|
|
Long-term debt and capital lease obligations |
|
|
348,348 |
|
|
394,511 |
|
|
Deferred income taxes |
|
|
7,452 |
|
|
7,112 |
|
|
Accrued pension and other postretirement benefits ($1,946 and $2,303 attributable to the VIE) |
|
|
135,339 |
|
|
119,549 |
|
|
Accrued equity appreciation rights |
|
|
— |
|
|
145,384 |
|
|
Other noncurrent liabilities ($3,368 and $2,841 attributable to the VIE) |
|
|
14,101 |
|
|
12,284 |
|
|
Total liabilities |
|
|
967,348 |
|
|
1,434,431 |
|
|
Commitments and contingencies (Note 21) |
|
|
|
|
|
|
|
|
Series A redeemable convertible preferred stock, $.001 par value, no shares authorized at December 31, 2016 and 1,838,027 shares authorized at December 31, 2015; no shares issued and outstanding at December 31, 2016 and 1,838,027 shares issued and outstanding at December 31, 2015 |
|
|
— |
|
|
131,036 |
|
|
Equity |
|
|
|
|
|
|
|
|
Common stock, $.001 par value, 500,000,000 shares authorized at December 31, 2016 and 78,193,494 shares authorized at December 31, 2015; 74,093,598 shares issued and outstanding at December 31, 2016 and 21,821,256 shares issued and outstanding at December 31, 2015 |
|
|
74 |
|
|
22 |
|
|
Additional paid-in capital |
|
|
880,576 |
|
|
309,110 |
|
|
Accumulated other comprehensive loss, net of tax |
|
|
(90,834) |
|
|
(67,234) |
|
|
Retained deficit |
|
|
(53,951) |
|
|
(81,647) |
|
|
Total equity attributable to Acushnet Holdings Corp. |
|
|
735,865 |
|
|
160,251 |
|
|
Noncontrolling interests |
|
|
32,958 |
|
|
33,255 |
|
|
Total equity |
|
|
768,823 |
|
|
193,506 |
|
|
Total liabilities and equity |
|
$ |
1,736,171 |
|
$ |
1,758,973 |
|
The accompanying notes are an integral part of these consolidated financial statements.
F-3
ACUSHNET HOLDINGS CORP.
CONSOLIDATED STATEMENTS OF OPERATIONS
|
|
|
|
Year ended December 31, |
|
|||||||
|
(in thousands, except share and per share amounts) |
|
|
2016 |
|
2015 |
|
2014 |
|
|||
|
|
|
|
|
|
|
|
|
|
|
|
|
|
Net sales |
|
|
$ |
1,572,275 |
|
$ |
1,502,958 |
|
$ |
1,537,610 |
|
|
Cost of goods sold |
|
|
|
773,550 |
|
|
727,120 |
|
|
779,678 |
|
|
Gross profit |
|
|
|
798,725 |
|
|
775,838 |
|
|
757,932 |
|
|
Operating expenses |
|
|
|
|
|
|
|
|
|
|
|
|
Selling, general and administrative |
|
|
|
600,804 |
|
|
604,018 |
|
|
602,755 |
|
|
Research and development |
|
|
|
48,804 |
|
|
45,977 |
|
|
44,243 |
|
|
Intangible amortization |
|
|
|
6,608 |
|
|
6,617 |
|
|
6,687 |
|
|
Restructuring charges |
|
|
|
1,673 |
|
|
1,643 |
|
|
- |
|
|
Income from operations |
|
|
|
140,836 |
|
|
117,583 |
|
|
104,247 |
|
|
Interest expense, net |
|
|
|
49,908 |
|
|
60,294 |
|
|
63,529 |
|
|
Other (income) expense, net |
|
|
|
1,706 |
|
|
25,139 |
|
|
(1,348) |
|
|
Income before income taxes |
|
|
|
89,222 |
|
|
32,150 |
|
|
42,066 |
|
|
Income tax expense |
|
|
|
39,707 |
|
|
27,994 |
|
|
16,700 |
|
|
Net income |
|
|
|
49,515 |
|
|
4,156 |
|
|
25,366 |
|
|
Less: Net income attributable to noncontrolling interests |
|
|
|
(4,503) |
|
|
(5,122) |
|
|
(3,809) |
|
|
Net income (loss) attributable to Acushnet Holdings Corp. |
|
|
|
45,012 |
|
|
(966) |
|
|
21,557 |
|
|
Dividends earned by preferred shareholders |
|
|
|
(11,576) |
|
|
(13,785) |
|
|
(13,785) |
|
|
Allocation of undistributed earnings to preferred shareholders |
|
|
|
(10,247) |
|
|
- |
|
|
(3,866) |
|
|
Net income (loss) attributable to common shareholders - basic |
|
|
|
23,189 |
|
|
(14,751) |
|
|
3,906 |
|
|
Adjustments to net income for dilutive securities |
|
|
|
16,475 |
|
|
- |
|
|
- |
|
|
Net income (loss) attributable to common shareholders - diluted |
|
|
$ |
39,664 |
|
$ |
(14,751) |
|
$ |
3,906 |
|
|
|
|
|
|
|
|
|
|
|
|
|
|
|
Net income (loss) per common share attributable to Acushnet Holdings Corp.: |
|
|
|
|
|
|
|
|
|
|
|
|
Basic |
|
|
|
$ 0.74
|
|
|
$ (0.74)
|
|
|
$ 0.23
|
|
|
Diluted |
|
|
|
$ 0.62
|
|
|
$ (0.74)
|
|
|
$ 0.23
|
|
|
Weighted average number of common shares: |
|
|
|
|
|
|
|
|
|
|
|
|
Basic |
|
|
|
31,247,643 |
|
|
19,939,293 |
|
|
16,716,825 |
|
|
Diluted |
|
|
|
64,323,742 |
|
|
19,939,293 |
|
|
16,716,825 |
|
|
|
|
|
|
|
|
|
|
|
|
|
|
The accompanying notes are an integral part of these consolidated financial statements.
F-4
ACUSHNET HOLDINGS CORP.
CONSOLIDATED STATEMENTS OF COMPREHENSIVE INCOME (LOSS)
|
|
|
Year ended December 31, |
|
|||||||
|
(in thousands) |
|
2016 |
|
2015 |
|
2014 |
|
|||
|
|
|
|
|
|
|
|
|
|
|
|
|
Net income |
|
$ |
49,515 |
|
$ |
4,156 |
|
$ |
25,366 |
|
|
Other comprehensive income (loss) |
|
|
|
|
|
|
|
|
|
|
|
Foreign currency translation adjustments |
|
|
(14,656) |
|
|
(19,042) |
|
|
(23,106) |
|
|
Foreign exchange derivative instruments |
|
|
|
|
|
|
|
|
|
|
|
Unrealized holding gains arising during period |
|
|
7,014 |
|
|
14,964 |
|
|
20,619 |
|
|
Reclassification adjustments included in net income |
|
|
(5,194) |
|
|
(26,805) |
|
|
(9,916) |
|
|
Tax benefit (expense) |
|
|
(451) |
|
|
3,836 |
|
|
(1,610) |
|
|
Foreign exchange derivative instruments, net |
|
|
1,369 |
|
|
(8,005) |
|
|
9,093 |
|
|
Available-for-sale securities |
|
|
|
|
|
|
|
|
|
|
|
Unrealized holding gains (losses) arising during period |
|
|
51 |
|
|
(673) |
|
|
703 |
|
|
Tax benefit (expense) |
|
|
(19) |
|
|
160 |
|
|
(248) |
|
|
Available-for-sale securities, net |
|
|
32 |
|
|
(513) |
|
|
455 |
|
|
Pension and other postretirement benefits adjustments |
|
|
|
|
|
|
|
|
|
|
|
Net gain (loss) arising during period |
|
|
(16,072) |
|
|
3,068 |
|
|
(23,769) |
|
|
Tax benefit (expense) |
|
|
5,727 |
|
|
(1,684) |
|
|
7,583 |
|
|
Pension and other postretirement benefits adjustments, net |
|
|
(10,345) |
|
|
1,384 |
|
|
(16,186) |
|
|
|
|
|
|
|
|
|
|
|
|
|
|
Total other comprehensive loss |
|
|
(23,600) |
|
|
(26,176) |
|
|
(29,744) |
|
|
|
|
|
|
|
|
|
|
|
|
|
|
Comprehensive income (loss) |
|
|
25,915 |
|
|
(22,020) |
|
|
(4,378) |
|
|
Less: Comprehensive income attributable to noncontrolling interests |
|
|
(4,563) |
|
|
(5,017) |
|
|
(3,774) |
|
|
Comprehensive income (loss) attributable to Acushnet Holdings Corp. |
|
$ |
21,352 |
|
$ |
(27,037) |
|
$ |
(8,152) |
|
The accompanying notes are an integral part of these consolidated financial statements.
F-5
ACUSHNET HOLDINGS CORP.
CONSOLIDATED STATEMENTS OF CASH FLOWS
|
|
Year ended December 31, |
|
||||||||
|
(in thousands) |
|
2016 |
|
2015 |
|
2014 |
|
|||
|
Cash flows from operating activities |
|
|
|
|
|
|
|
|
|
|
|
Net income |
|
$ |
49,515 |
|
$ |
4,156 |
|
$ |
25,366 |
|
|
Adjustments to reconcile net income to cash provided by operating activities |
|
|
|
|
|
|
|
|
|
|
|
Depreciation and amortization |
|
|
40,834 |
|
|
41,702 |
|
|
43,159 |
|
|
Unrealized foreign exchange gain (loss) |
|
|
(2,347) |
|
|
2,933 |
|
|
133 |
|
|
Amortization of debt issuance costs |
|
|
3,378 |
|
|
5,157 |
|
|
3,752 |
|
|
Amortization of discount on bonds payable |
|
|
3,963 |
|
|
4,142 |
|
|
4,093 |
|
|
Change in fair value of common stock warrants |
|
|
6,112 |
|
|
28,364 |
|
|
(1,887) |
|
|
Share-based compensation |
|
|
14,494 |
|
|
2,033 |
|
|
632 |
|
|
Loss on disposals of property, plant and equipment |
|
|
170 |
|
|
401 |
|
|
690 |
|
|
Deferred income taxes |
|
|
7,849 |
|
|
2,188 |
|
|
(11,293) |
|
|
Changes in operating assets and liabilities |
|
|
|
|
|
|
|
|
|
|
|
Accounts receivable |
|
|
12,630 |
|
|
(174) |
|
|
(35,594) |
|
|
Inventories |
|
|
(2,377) |
|
|
(45,415) |
|
|
(16,192) |
|
|
Accounts payable |
|
|
1,968 |
|
|
(1,998) |
|
|
(2,585) |
|
|
Accrued taxes |
|
|
14,666 |
|
|
540 |
|
|
(881) |
|
|
Accrued expenses and other liabilities |
|
|
113,042 |
|
|
35,364 |
|
|
3,442 |
|
|
Other assets |
|
|
(6,041) |
|
|
1,165 |
|
|
(11,376) |
|
|
Other noncurrent liabilities |
|
|
(140,098) |
|
|
12,278 |
|
|
53,739 |
|
|
Interest due to related parties |
|
|
(12,570) |
|
|
(1,006) |
|
|
(1,085) |
|
|
Cash flows provided by operating activities |
|
|
105,188 |
|
|
91,830 |
|
|
54,113 |
|
|
Cash flows from investing activities |
|
|
|
|
|
|
|
|
|
|
|
Additions to property, plant and equipment |
|
|
(19,175) |
|
|
(23,201) |
|
|
(23,527) |
|
|
Receivables from related parties |
|
|
(919) |
|
|
— |
|
|
— |
|
|
Cash flows used in investing activities |
|
|
(20,094) |
|
|
(23,201) |
|
|
(23,527) |
|
|
Cash flows from financing activities |
|
|
|
|
|
|
|
|
|
|
|
Increase (decrease) in short-term borrowings, net |
|
|
(3,941) |
|
|
7,890 |
|
|
8,177 |
|
|
Repayment of senior term loan facility |
|
|
(30,000) |
|
|
— |
|
|
— |
|
|
Proceeds from senior term loan facility |
|
|
— |
|
|
— |
|
|
30,000 |
|
|
Proceeds from term loan facility |
|
|
375,000 |
|
|
— |
|
|
— |
|
|
Repayment of secured floating rate notes |
|
|
(375,000) |
|
|
(50,000) |
|
|
(50,000) |
|
|
Proceeds from exercise of stock options |
|
|
— |
|
|
— |
|
|
100 |
|
|
Proceeds from exercise of common stock warrants |
|
|
34,503 |
|
|
34,503 |
|
|
34,503 |
|
|
Repayment of bonds |
|
|
(34,503) |
|
|
(34,503) |
|
|
(34,503) |
|
|
Debt issuance costs |
|
|
(6,606) |
|
|
— |
|
|
(1,045) |
|
|
Dividends paid on Series A redeemable convertible preferred stock |
|
|
(17,316) |
|
|
(13,747) |
|
|
(13,786) |
|
|
Dividends paid to noncontrolling interests |
|
|
(4,800) |
|
|
(4,200) |
|
|
(3,600) |
|
|
Cash flows used in financing activities |
|
|
(62,663) |
|
|
(60,057) |
|
|
(30,154) |
|
|
Effect of foreign exchange rate changes on cash |
|
|
(2,425) |
|
|
(3,205) |
|
|
(2,522) |
|
|
Net increase (decrease) in cash |
|
|
20,006 |
|
|
5,367 |
|
|
(2,090) |
|
|
Cash, cash equivalents, restricted cash and restricted cash equivalents, beginning of year |
|
|
59,134 |
|
|
53,767 |
|
|
55,857 |
|
|
Cash, cash equivalents, restricted cash and restricted cash equivalents, end of year |
|
$ |
79,140 |
|
$ |
59,134 |
|
$ |
53,767 |
|
|
Supplemental information |
|
|
|
|
|
|
|
|
|
|
|
Cash paid for interest to related parties |
|
$ |
36,753 |
|
$ |
32,274 |
|
$ |
34,951 |
|
|
Cash paid for interest to third parties |
|
|
27,165 |
|
|
20,571 |
|
|
21,656 |
|
|
Cash paid for income taxes |
|
|
16,589 |
|
|
19,724 |
|
|
27,987 |
|
|
Non-cash additions to property, plant and equipment |
|
|
1,170 |
|
|
1,913 |
|
|
2,577 |
|
|
Non-cash conversion of Series A redeemable convertible preferred stock |
|
|
131,036 |
|
|
— |
|
|
— |
|
|
Non-cash conversion of convertible notes |
|
|
362,489 |
|
|
— |
|
|
— |
|
|
Non-cash conversion of common stock warrants |
|
|
28,996 |
|
|
7,298 |
|
|
— |
|
|
Non-cash exercise of stock options |
|
|
— |
|
|
2,752 |
|
|
793 |
|
The accompanying notes are an integral part of these consolidated financial statements.
F-6
ACUSHNET HOLDINGS CORP.
CONSOLIDATED STATEMENTS OF REDEEMABLE CONVERTIBLE PREFERRED STOCK AND EQUITY
|
|
|
|
|
|
|
|
|
|
|
|
|
|
|
|
|
|
|
|
|
|
|
|
|
|
|
|
|
|
|
|
|
|
|
|
|
|
|
|
Total |
|
|
|
|
|
|
|
|
|
|
|
|
|
|
|
|
|
|
|
|
|
|
Stockholders' |
|
|
|
|
|
|
|
Redeemable |
|
|
|
|
|
|
|
|
Accumulated |
|
|
|
Equity |
|
|
|
|
|
||
|
|
Convertible |
|
|
|
|
|
|
Additional |
|
Other |
|
|
|
Attributable |
|
|
|
|
|
||
|
|
Preferred Stock |
|
|
Common Stock |
|
Paid-in |
|
Comprehensive |
|
Retained |
|
to Acushnet |
|
Noncontrolling |
|
Total |
|
||||
|
(in thousands) |
Shares |
|
Amount |
|
|
Shares |
|
Amount |
|
Capital |
|
Loss |
|
Deficit |
|
Holdings Corp. |
|
Interest |
|
Equity |
|
|
Balances at December 31, 2013 |
1,838 |
|
$ 131,036
|
|
|
15,360 |
|
$ 15
|
|
$ 229,168
|
|
$ (11,314)
|
|
$ (74,705)
|
|
$ 143,164
|
|
$ 32,124
|
|
$ 175,288
|
|
|
Net income |
- |
|
- |
|
|
- |
|
- |
|
- |
|
- |
|
21,557 |
|
21,557 |
|
3,809 |
|
25,366 |
|
|
Other comprehensive loss |
- |
|
- |
|
|
- |
|
- |
|
- |
|
(29,744) |
|
- |
|
(29,744) |
|
- |
|
(29,744) |
|
|
Issuance of common stock |
- |
|
- |
|
|
3,105 |
|
3 |
|
34,500 |
|
- |
|
- |
|
34,503 |
|
- |
|
34,503 |
|
|
Exercise of common stock |
- |
|
- |
|
|
87 |
|
- |
|
893 |
|
- |
|
- |
|
893 |
|
- |
|
893 |
|
|
Dividends paid on Series A redeemable convertible preferred stock |
- |
|
- |
|
|
- |
|
- |
|
- |
|
- |
|
(13,786) |
|
(13,786) |
|
- |
|
(13,786) |
|
|
Dividends paid to noncontrolling interests |
- |
|
- |
|
|
- |
|
- |
|
- |
|
- |
|
- |
|
- |
|
(3,600) |
|
(3,600) |
|
|
Balances at December 31, 2014 |
1,838 |
|
131,036 |
|
|
18,552 |
|
18 |
|
264,561 |
|
(41,058) |
|
(66,934) |
|
156,587 |
|
32,333 |
|
188,920 |
|
|
Net income (loss) |
- |
|
- |
|
|
- |
|
- |
|
- |
|
- |
|
(966) |
|
(966) |
|
5,122 |
|
4,156 |
|
|
Other comprehensive loss |
- |
|
- |
|
|
- |
|
- |
|
- |
|
(26,176) |
|
- |
|
(26,176) |
|
- |
|
(26,176) |
|
|
Issuance of common stock |
- |
|
- |
|
|
3,105 |
|
3 |
|
41,798 |
|
- |
|
- |
|
41,801 |
|
- |
|
41,801 |
|
|
Exercise of common stock |
- |
|
- |
|
|
164 |
|
1 |
|
2,751 |
|
- |
|
- |
|
2,752 |
|
- |
|
2,752 |
|
|
Dividends paid on Series A redeemable convertible preferred stock |
- |
|
- |
|
|
- |
|
- |
|
- |
|
- |
|
(13,747) |
|
(13,747) |
|
- |
|
(13,747) |
|
|
Dividends paid to noncontrolling interests |
- |
|
- |
|
|
- |
|
- |
|
- |
|
- |
|
- |
|
- |
|
(4,200) |
|
(4,200) |
|
|
Balances at December 31, 2015 |
1,838 |
|
131,036 |
|
|
21,821 |
|
22 |
|
309,110 |
|
(67,234) |
|
(81,647) |
|
160,251 |
|
33,255 |
|
193,506 |
|
|
Net income |
- |
|
- |
|
|
- |
|
- |
|
- |
|
- |
|
45,012 |
|
45,012 |
|
4,503 |
|
49,515 |
|
|
Other comprehensive loss |
- |
|
- |
|
|
- |
|
- |
|
- |
|
(23,600) |
|
- |
|
(23,600) |
|
- |
|
(23,600) |
|
|
Stock-based compensation expense |
- |
|
- |
|
|
- |
|
- |
|
14,494 |
|
- |
|
- |
|
14,494 |
|
- |
|
14,494 |
|
|
Issuance of common stock |
- |
|
- |
|
|
3,105 |
|
3 |
|
63,496 |
|
- |
|
- |
|
63,499 |
|
- |
|
63,499 |
|
|
Conversion of redeemable convertible preferred stock |
(1,838) |
|
(131,036) |
|
|
16,542 |
|
16 |
|
131,020 |
|
- |
|
- |
|
131,036 |
|
- |
|
131,036 |
|
|
Conversion of convertible notes |
- |
|
- |
|
|
32,626 |
|
33 |
|
362,456 |
|
- |
|
- |
|
362,489 |
|
- |
|
362,489 |
|
|
Dividends paid on Series A redeemable convertible preferred stock |
- |
|
- |
|
|
- |
|
- |
|
- |
|
- |
|
(17,316) |
|
(17,316) |
|
- |
|
(17,316) |
|
|
Dividends paid to noncontrolling interests |
- |
|
- |
|
|
- |
|
- |
|
- |
|
- |
|
- |
|
- |
|
(4,800) |
|
(4,800) |
|
|
Balances at December 31, 2016 |
- |
|
$ - |
|
|
74,094 |
|
$ 74
|
|
$ 880,576
|
|
$ (90,834)
|
|
$ (53,951)
|
|
$ 735,865
|
|
$ 32,958
|
|
$ 768,823
|
|
The accompanying notes are an integral part of these consolidated financial statements.
F-7
ACUSHNET HOLDINGS CORP.
NOTES TO CONSOLIDATED FINANCIAL STATEMENTS
1. Description of Business
Acushnet Holdings Corp. (the “Company”), headquartered in Fairhaven, Massachusetts, is the global leader in the design, development, manufacture and distribution of performance-driven golf products. The Company has established positions across all major golf equipment and golf wear categories under its globally recognized brands of Titleist, FootJoy, Scotty Cameron and Vokey Design wedges. Acushnet products are sold primarily to on-course golf pro shops and selected off-course golf specialty stores, sporting goods stores and other qualified retailers. The Company sells products primarily in the United States, Europe (primarily the United Kingdom, Germany, France and Sweden), Asia (primarily Japan, Korea, China and Singapore), Canada and Australia. Acushnet manufactures and sources its products principally in the United States, China, Thailand, the United Kingdom, and Japan.
2. Summary of Significant Accounting Policies
Basis of Presentation
The accompanying consolidated financial statements have been prepared in conformity with accounting principles generally accepted in the United States (“U.S. GAAP”) and include the accounts of the Company, its wholly- owned subsidiaries and a VIE in which the Company is the primary beneficiary. All intercompany balances and transactions have been eliminated in consolidation.
Acquisition
Acushnet Holdings Corp. was incorporated in Delaware on May 9, 2011 as Alexandria Holdings Corp., an entity owned by Fila Korea Co., Ltd. (“Fila Korea”), a leading sport and leisure apparel and footwear company which is a public company listed on the Korea Exchange, and a consortium of investors (the “Financial Investors”) led by Mirae Asset Global Investments, a global investment management firm. Acushnet Holdings Corp. acquired Acushnet Company, our operating subsidiary, from Beam Suntory, Inc. (at the time known as Fortune Brands, Inc.) (“Beam”) on July 29, 2011 (the “Acquisition”).
Stock Split
On October 14, 2016, the Company effected a nine-for-one stock split of its issued and outstanding shares of common stock and a proportional adjustment to the existing conversion ratios for its 7.5% convertible notes due 2021 (“convertible notes”), Series A redeemable convertible preferred stock (“Series A preferred stock”), and the exercise price for the common stock warrants and the strike price of stock-based compensation. Accordingly, all share and per share amounts for all periods presented in the accompanying financial statements and notes thereto have been adjusted retroactively, where applicable, to reflect this stock split and adjustment of the common stock warrant exercise price, and convertible notes and redeemable convertible preferred stock conversion ratios.
Initial Public Offering
On November 2, 2016, the Company completed an initial public offering of 19,333,333 shares of its common stock sold by selling stockholders at a public offering price of $17.00 per share. Upon the closing of the Company’s initial public offering, all remaining outstanding shares of the Company’s Series A preferred stock were automatically converted into 11,556,495 shares of the Company’s common stock and the Company’s convertible notes were automatically converted into 22,791,852 shares of the Company’s common stock. The underwriters of the Company’s initial public offering exercised their over-allotment option to purchase an additional 2,899,999 shares of common stock from the selling stockholders at the initial public offering price of $17.00 per share.
Automatic Conversion
Following the pricing of the initial public offering, Magnus Holdings Co., Ltd. (“Magnus”), a wholly-owned subsidiary of Fila Korea, purchased from the Financial Investors on a pro rata basis 14,818,720 shares of the Company’s
F-8
common stock, resulting in Magnus holding a controlling ownership interest of 53.1% of the Company’s outstanding common stock. The 14,818,720 shares of the Company’s common stock sold by the Financial Investors were received upon the automatic conversion of certain of the Company’s outstanding convertible notes (Note 9) and Series A preferred stock (Note 15). The remaining outstanding convertible notes and Series A preferred stock automatically converted into shares of the Company’s common stock prior to the closing of the initial public offering.
Use of Estimates
The preparation of the Company’s consolidated financial statements in accordance with U.S. GAAP requires management to make estimates and judgments that affect reported amounts of assets, liabilities, stockholders’ equity, net sales and expenses, and the disclosure of contingent assets and liabilities in its consolidated financial statements. Actual results could differ from those estimates.
Variable Interest Entities
VIEs are entities that, by design, either (i) lack sufficient equity to permit the entity to finance its activities independently, or (ii) have equity holders that do not have the power to direct the activities of the entity that most significantly impact its economic performance, the obligation to absorb the entity’s expected losses, or the right to receive the entity’s expected residual returns. The Company consolidates a VIE when it is the primary beneficiary, which is the party that has both (i) the power to direct the activities that most significantly impact the VIE’s economic performance and (ii) through its interests in the VIE, the obligation to absorb expected losses or the right to receive expected benefits from the VIE that could potentially be significant to the VIE.
The Company consolidates the accounts of Acushnet Lionscore Limited, a VIE which is 40% owned by the Company. The sole purpose of the VIE is to manufacture the Company’s golf footwear and as such, the Company is deemed to be the primary beneficiary as defined by Accounting Standards Codification (“ASC”) 810. The Company has presented separately on its consolidated balance sheets, to the extent material, the assets of its consolidated VIE that can only be used to settle specific obligations of its consolidated VIE and the liabilities of its consolidated VIE for which creditors do not have recourse to its general credit. The general creditors of the VIE do not have recourse to the Company. Certain directors of the noncontrolling entities have guaranteed the credit lines of the VIE, for which there were no outstanding borrowings as of December 31, 2016 and 2015. In addition, pursuant to the terms of the agreement governing the VIE, the Company is not required to provide financial support to the VIE.
Cash and Restricted Cash
Cash held in Company checking accounts is included in cash. Book overdrafts not subject to offset with other accounts with the same financial institution are classified as accounts payable. As of December 31, 2016 and 2015, book overdrafts in the amount of $3.6 million and $1.7 million, respectively, were recorded in accounts payable. The Company classifies as restricted certain cash that is not available for use in its operations. Restricted cash is primarily related to a standby letter of credit used for insurance purposes.
Accounts Receivable
Accounts receivable are presented net of an allowance for doubtful accounts. The allowance for doubtful accounts is assessed each reporting period by the Company for estimated losses resulting from the inability or unwillingness of its customers to make required payments. The allowance is based on various factors, including credit risk assessments, length of time the receivables are past due, historical experience, customer specific information available to the Company and existing economic conditions.
Allowance for Sales Returns
A sales returns allowance is recorded for anticipated returns through a reduction of sales and cost of goods sold in the period that the related sales are recorded. Sales returns are estimated based upon historical rates of product returns, current economic trends and changes in customer demands as well as specific identification of outstanding returns. In accordance with this policy, the allowance for sales returns was $9.8 million and $5.2 million as of December 31, 2016 and 2015, respectively.
F-9
Concentration of Credit Risk and of Significant Customers
Financial instruments that potentially expose the Company to concentration of credit risk are cash and accounts receivable. Substantially all of the Company's cash deposits are maintained at large, creditworthy financial institutions. The Company's deposits, at times, may exceed federally insured limits. The Company does not believe that it is subject to unusual credit risk beyond the normal credit risk associated with commercial banking relationships. As part of its ongoing procedures, the Company monitors its concentration of deposits with various financial institutions in order to avoid any undue exposure. As of December 31, 2016 and 2015, the Company had $75.6 million and $54.1 million, respectively, in banks located outside the United States. The risk with respect to the Company's accounts receivable is managed by the Company through its policy of monitoring the creditworthiness of its customers to which it grants credit terms in the normal course of business.
Inventories
Inventories are valued at the lower of cost and net realizable value. Cost is determined using the first-in, first-out inventory method. The inventory balance, which includes material, labor and manufacturing overhead costs, is recorded net of an allowance for obsolete or slow moving inventory. The Company's allowance for obsolete or slow moving inventory contains estimates regarding uncertainties. Such estimates are updated each reporting period and require the Company to make assumptions and to apply judgment regarding a number of factors, including market conditions, selling environment, historical results and current inventory trends.
Property, Plant and Equipment
Property, plant and equipment are recorded at cost less accumulated depreciation and amortization. Depreciation is provided on a straight-line basis over the estimated useful lives of the assets. Gains or losses resulting from disposals are included in income from operations. Betterments and renewals, which improve and extend the life of an asset, are capitalized. Maintenance and repair costs are expensed as incurred.
Estimated useful lives of property, plant and equipment asset categories were as follows:
|
Buildings and improvements |
|
15 |
– |
40 years |
|
|
Machinery and equipment |
|
3 |
– |
10 years |
|
|
Furniture, fixtures and computer hardware |
|
3 |
– |
10 years |
|
|
Computer software |
|
3 |
– |
10 years |
|
Leasehold and tenant improvements are amortized over the shorter of the lease term or the estimated useful lives of the assets.
Certain costs incurred in connection with the development of the Company's internal-use software are capitalized. Software development costs are primarily related to the Company's enterprise resource planning system. Costs incurred in the preliminary stages of development are expensed as incurred. Internal and external costs incurred in the application development phase, if direct and incremental, are capitalized until the software is substantially complete and ready for its intended use. Capitalization ceases upon completion of all substantial testing performed to ensure the product is ready for its intended use. Costs such as maintenance and training are expensed as incurred. The capitalized internal-use software costs are included in property, plant and equipment and once the software is placed into service are amortized over the estimated useful life which ranges from three to ten years.
Long-Lived Assets
A long-lived asset (including amortizable identifiable intangible assets) or asset group is tested for recoverability whenever events or changes in circumstances indicate that its carrying amount may not be recoverable. When such events occur, the Company compares the sum of the undiscounted cash flows expected to result from the use and eventual disposition of the asset or asset group to the carrying amount of the long-lived asset or asset group. The cash flows are based on the best estimate of future cash flows derived from the most recent business projections. If the carrying value exceeds the sum of the undiscounted cash flows, an impairment loss is recognized based on the excess of the asset's or asset group's carrying value over its fair value. Fair value is determined based on discounted expected
F-10
future cash flows on a market participant basis. Any impairment charge would be recognized within operating expenses as a selling, general and administrative expense.
Goodwill and Indefinite-Lived Intangible Assets
Goodwill and indefinite-lived intangible assets are not amortized but instead are measured for impairment at least annually, or more frequently when events or changes in circumstances indicate that the carrying amount of the asset may be impaired.
Goodwill is assigned to reporting units for purposes of impairment testing. A reporting unit may be the same as an operating segment or one level below an operating segment. For purposes of assessing potential impairment, the Company may assess qualitative factors to determine if it is more likely than not (i.e., a likelihood of more than 50%) that the fair value of a reporting unit is less than its carrying amount, including goodwill. If the Company determines based on the qualitative factors that it is not more likely than not that the fair value of a reporting unit is less than its carrying amount, no further testing is necessary. If, however, the Company determines that it is more likely than not that the fair value of a reporting unit is less than its carrying amount, the Company performs the first step of a two-step quantitative goodwill impairment test. In the first step, the Company compares the fair value of the reporting unit to its carrying value. If the fair value of the reporting unit exceeds the carrying value of the net assets assigned to that unit, goodwill is considered not impaired and the Company is not required to perform further testing. If the carrying value of the net assets assigned to the reporting unit exceeds the fair value of the reporting unit, then the Company must perform the second step of the impairment test in order to determine the implied fair value of the reporting unit's goodwill. If the carrying value of a reporting unit's goodwill exceeds its implied fair value, then the Company would record an impairment loss equal to the difference. The fair value of the reporting units is determined using the income approach. The income approach uses a discounted cash flow analysis which involves applying appropriate discount rates to estimated future cash flows based on forecasts of sales, costs and capital requirements.
The Company performs its annual impairment tests in the fourth quarter of each fiscal year. As of December 31, 2016, no impairment of goodwill was identified and the fair value of each reporting unit substantially exceeded its carrying value.
Purchased intangible assets other than goodwill are amortized over their useful lives unless those lives are determined to be indefinite. The Company's trademarks have been assigned an indefinite life as the Company currently anticipates that these trademarks will contribute to its cash flows indefinitely. Trademarks are reviewed for impairment annually and may be reviewed more frequently if indicators of impairment are present. Impairment losses are recorded to the extent that the carrying value of the indefinite-lived intangible asset exceeds its fair value. The Company measures the fair value of its trademarks using the relief-from-royalty method, which estimates the present value of royalty income that could be hypothetically earned by licensing the brand name to a third party over the remaining useful life.
The Company continually evaluates whether events and circumstances have occurred that indicate the remaining estimated useful life of long-lived assets may warrant revision or that the remaining balance may not be recoverable. These factors may include a significant deterioration of operating results, changes in business plans, or changes in anticipated cash flows. When factors indicate that an asset should be evaluated for possible impairment, the Company reviews long-lived assets to assess recoverability from future operations using undiscounted cash flows. If future undiscounted cash flows are less than the carrying value, an impairment is recognized in earnings to the extent that the carrying value exceeds fair value.
Deferred Financing Costs
The Company defers costs directly associated with acquiring third-party financing. These deferred costs are amortized as interest expense over the term of the related indebtedness. Deferred financing costs associated with the revolving credit facilities are included in other current and noncurrent asset and deferred financing costs associated with all other indebtedness are netted against debt on the consolidated balance sheets.
Fair Value Measurements
Certain assets and liabilities are carried at fair value under U.S. GAAP. Fair value is defined as the exchange price that would be received for an asset or paid to transfer a liability (an exit price) in the principal or most
F-11
advantageous market for the asset or liability in an orderly transaction between market participants on the measurement date. Valuation techniques used to measure fair value must maximize the use of observable inputs and minimize the use of unobservable inputs. Financial assets and liabilities carried at fair value are to be classified and disclosed in one of the following three levels of the fair value hierarchy, of which the first two are considered observable and the last is considered unobservable:
|
· |
Level 1—Quoted prices in active markets for identical assets or liabilities. |
|
· |
Level 2—Observable inputs (other than Level 1 quoted prices), such as quoted prices in active markets for similar assets or liabilities, quoted prices in markets that are not active for identical or similar assets or liabilities, or other inputs that are observable or can be corroborated by observable market data. |
|
· |
Level 3—Unobservable inputs that are supported by little or no market activity and that are significant to determining the fair value of the assets or liabilities, including pricing models, discounted cash flow methodologies and similar techniques. |
Prior to the final exercise of the Company's outstanding warrants to purchase the Company’s common stock, the common stock warrants liability was carried at fair value. The Company’s foreign exchange derivative assets and liabilities are carried at fair value determined according to the fair value hierarchy described above (Note 11). The carrying value of accounts receivable, accounts payable and accrued expenses approximates fair value due to the short-term nature of these assets and liabilities. As permitted under ASC 820, the Company adopted the fair value measurement disclosures for nonfinancial assets and liabilities, such as goodwill and indefinite-lived intangible assets.
In some instances where a market price is available, but the instrument is in an inactive or over-the-counter market, the Company consistently applies the dealer (market maker) pricing estimate and uses a midpoint approach on bid and ask prices from financial institutions to determine the reasonableness of these estimates. Assets and liabilities subject to this fair value valuation approach are typically classified as Level 2.
Pension and Other Postretirement Benefit Plans
The Company provides U.S. and foreign defined benefit and defined contribution plans to eligible employees and postretirement benefits to certain retirees, including pensions, postretirement healthcare benefits and other postretirement benefits.
Plan assets and obligations are measured using various actuarial assumptions, such as discount rates, rate of compensation increase, mortality rates, turnover rates and health care cost trend rates, as determined at each year end measurement date. The measurement of net periodic benefit cost is based on various actuarial assumptions, including discount rates, expected return on plan assets and rate of compensation increase, which are determined as of the prior year measurement date. The determination of the discount rate is generally based on an index created from a hypothetical bond portfolio consisting of high-quality fixed income securities with durations that match the timing of expected benefit payments. The expected return on plan assets is determined based on several factors, including adjusted historical returns, historical risk premiums for various asset classes and target asset allocations within the portfolio. Adjustments made to the historical returns are based on recent return experience in the equity and fixed income markets and the belief that deviations from historical returns are likely over the relevant investment horizon. Actual cost is also dependent on various other factors related to the employees covered by these plans. The effects of actuarial deviations from assumptions are generally accumulated and, if over a specified corridor, amortized over the remaining service period of the employees. The cost or benefit of plan changes, such as increasing or decreasing benefits for prior employee service (prior service cost), is deferred and included in expense on a straight-line basis over the average remaining service period of the related employees. The Company's actuarial assumptions are reviewed on an annual basis and modified when appropriate.
To calculate the U.S. pension and postretirement benefit plan expense in 2017, the Company will apply the individual spot rates along the yield curve that correspond with the timing of each future cash outflow for the benefit payments in order to calculate interest cost and service cost. Prior to 2017, the service cost and interest cost components were determined using a single weighted-average discount rate. The change does not affect the measurement of the total benefit plan obligations, as the change in the service cost and interest cost offsets in the actuarial gains and losses recorded in other comprehensive income. The Company changed to the new method to provide a more precise measure
F-12
of service and interest cost by improving the correlation between the projected benefit cash flows and the discrete spot yield curve rates. The Company accounted for this change as a change in estimate prospectively beginning in 2017.
Income Taxes
The Company accounts for income taxes using the asset and liability method, which requires the recognition of deferred tax assets and liabilities for the expected future tax consequences of temporary differences between consolidated financial statement carrying amount and tax basis and using enacted tax rates expected to be in effect when the temporary differences reverse. A valuation allowance is recorded to reduce deferred income tax assets when it is more-likely-than-not that such assets will not be realized. Potential for recovery of deferred tax assets is evaluated by estimating the future taxable profits expected and considering prudent and feasible tax planning strategies.
The Company provides deferred income taxes on undistributed earnings of foreign subsidiaries that it does not expect to permanently reinvest.
The Company records liabilities for uncertain income tax positions based on the two step process. The first step is recognition, where an individual tax position is evaluated as to whether it has a likelihood of greater than 50% of being sustained upon examination based on the technical merits of the position, including resolution of any related appeals or litigation processes. For tax positions that are currently estimated to have a less than 50% likelihood of being sustained, no tax benefit is recorded. For tax positions that have met the recognition threshold in the first step, the Company performs the second step of measuring the benefit to be recorded. The amount of the benefit that may be recognized is the largest amount that has a greater than 50% likelihood of being realized on ultimate settlement. The actual benefits ultimately realized may differ from the estimates. In future periods, changes in facts, circumstances, and new information may require the Company to change the recognition and measurement estimates with regard to individual tax positions. Changes in recognition and measurement estimates are recorded in income tax expense and liability in the period in which such changes occur. The Company recognizes accrued interest and penalties related to unrecognized tax benefits in the provision for income taxes on the consolidated statements of income.
Beam has indemnified certain tax obligations that relate to periods during which Fortune Brands, Inc. owned Acushnet Company (Note 13). These estimated tax obligations are recorded in accrued taxes and other noncurrent liabilities, and the related indemnification receivable is recorded in other current and noncurrent assets on the consolidated balance sheet. Any changes in the value of these specifically identified tax obligations are recorded in the period identified in income tax expense and the related change in the indemnification asset is recorded in other (income) expense, net on the consolidated statement of operations.
Revenue Recognition
Revenue is recognized upon shipment or upon receipt by the customer depending on the country of the sale and the agreement with the customer, net of allowances for discounts, sales returns, customer sales incentives and cooperative advertising. The criteria for recognition of revenue is met when persuasive evidence that an arrangement exists, both title and risk of loss have passed to the customer, the price is fixed or determinable and collectability is reasonably assured. In circumstances where either title or risk of loss pass upon receipt by the customer, revenue is deferred until such event occurs based on an estimate of the shipping time from the Company's distribution centers to the customer using historical and expected delivery times by geographic location. Amounts billed to customers for shipping and handling are included in net sales.
Customer Sales Incentives
The Company offers customer sales incentives, including off-invoice discounts and sales-based rebate programs, to its customers which are accounted for as a reduction in sales at the time the revenue is recognized. Sales-based rebates are estimated using assumptions related to the percentage of customers who will achieve qualifying purchase goals and the level of achievement. These assumptions are based on historical experience, current year program design, current marketplace conditions and sales forecasts, including considerations of product life cycles.
F-13
Cost of Goods Sold
Cost of goods sold includes all costs to make products saleable, such as inbound freight, purchasing and receiving costs, inspection costs and transfer costs. In addition, all depreciation expense associated with assets used to manufacture products and make them saleable is included in cost of goods sold.
Product Warranty
The Company has defined warranties ranging from one to two years. Products covered by the defined warranty policies include all Titleist golf products, FootJoy golf shoes, and FootJoy golf outerwear. These product warranties generally obligate the Company to pay for the cost of replacement products, including the cost of shipping replacement products to its customers. The estimated cost of satisfying future warranty claims is accrued at the time the sale is recorded. In estimating future warranty obligations, the Company considers various factors, including its warranty policies and practices, the historical frequency of claims, and the cost to replace or repair products under warranty.
Advertising and Promotion
Advertising and promotional costs are included in selling, general and administrative expense on the consolidated statement of operations and include product endorsement arrangements with members of the various professional golf tours, media placement and production costs (television, print and internet), tour support expenses and point-of-sale materials. Advertising production costs are expensed as incurred. Media placement costs are expensed in the month the advertising appears. Product endorsement arrangements are expensed based upon the specific provisions of player contracts. Advertising and promotional expense was $196.0 million, $203.3 million and $201.6 million for the years ended December 31, 2016, 2015 and 2014, respectively.
Selling
Selling expenses including field sales, sales administration and shipping and handling costs are included in selling, general and administrative expense on the consolidated statement of operations. Shipping and handling costs included in selling expenses were $32.4 million, $32.6 million and $30.5 million for the years ended December 31, 2016, 2015 and 2014, respectively.
Research and Development
Research and development expenses include product development, product improvement, product engineering, and process improvement costs and are expensed as incurred.
Foreign Currency Translation and Transactions
Assets and liabilities denominated in foreign currency are translated into U.S. dollars at the actual rates of exchange at the balance sheet date. Revenues and expenses are translated at the average rates of exchange for the reporting period. The related translation adjustments are recorded as a component of accumulated other comprehensive income (loss). Transactions denominated in a currency other than the functional currency are re-measured into functional currency with resulting transaction gains or losses recorded as selling, general and administrative expense on the consolidated statement of operations. Transaction gain (loss) included in selling, general and administrative expense was a gain of $1.2 million, a loss of $4.7 million and a loss of $4.2 million for the years ended December 31, 2016, 2015 and 2014, respectively.
Derivative Financial Instruments
All derivatives are recognized as either assets or liabilities on the consolidated balance sheet and measurement of these instruments is at fair value. If the derivative is designated as a fair value hedge, the changes in the fair value of the derivative and of the hedged item attributable to the hedged risk are recognized in earnings in the same period. If the derivative is designated as a cash flow hedge, the effective portions of changes in the fair value of the derivative are recorded as a component of accumulated other comprehensive income (loss) and are recognized in the consolidated statement of operations when the hedged item affects earnings. Any portion of the change in fair value that is determined to be ineffective is immediately recognized in earnings as cost of goods sold.
F-14
Valuation of Common Stock Warrants
Prior to July 2016, the Company had outstanding warrants to purchase its common stock, which the Company classified as a liability on its consolidated balance sheet as the warrants were free-standing financial instruments that could result in the issuance of a variable number of the Company's common shares. The warrants were initially recorded at fair value on the date of grant, and were subsequently re-measured to fair value at each reporting date. The change in the fair value of the common stock warrants was recognized as a component of other (income) expense, net on the consolidated statement of operations.
The Company performed a two-step process to determine the fair value of the warrants to purchase common stock. The first step was to estimate the aggregate fair value of the Company (Business Enterprise Value, or BEV), which was then allocated to each element of the Company's capital structure under the contingent claims methodology. In determining the fair value of its BEV, the Company used a combination of the income approach and the market approach to estimate its aggregate BEV at each reporting date. The income approach uses a discounted cash flow analysis, which involves applying appropriate discount rates to estimated future cash flows based on forecasts of sales, costs and capital requirements. The market approach employs the guideline public company method, which uses the fair value of a peer group of publicly-traded companies. In the second step, the Company's estimated aggregate fair value was allocated to shares of common stock, shares of redeemable convertible preferred stock, convertible notes, bonds, employee stock options and warrants to purchase common stock using the contingent claims methodology. Under this model, each component of the Company's capital structure is treated as a call option with unique claim on the Company's assets as determined by the characteristics of each security's class. The resulting option claims are then valued using an option pricing model.
The Company historically had been a private company and lacked company-specific historical and implied volatility information of its stock. Therefore, it estimated its expected stock volatility based on the historical volatility of publicly-traded peer companies for a term equal to the remaining expected term of the warrants. The risk-free interest rate was determined by reference to the U.S. Treasury yield curve for time periods approximately equal to the remaining time to purchase for each of the tranches of warrants.
Share-based Compensation
The Company measures stock‑based awards granted to employees based on the fair value on the date of the grant and recognizes the corresponding compensation expense of those awards, net of estimated forfeitures, over the requisite service period, which is generally the vesting period of the respective award. The Company issues stock‑based awards to employees with service‑based vesting conditions and performance‑based vesting conditions. Compensation expense for awards with only service‑based vesting conditions is recorded using the straight‑line method. Compensation expense for awards with service‑based and performance‑based vesting conditions is recorded on a straight‑line method once the Company has determined that the likelihood of meeting the performance conditions is probable, which requires management judgment.
The Company recognizes compensation expense for only the portion of awards that are expected to vest. In developing a forfeiture rate estimate, the Company has considered its historical experience to estimate pre‑vesting forfeitures for service‑based and performance‑based awards. The impact of a forfeiture rate adjustment will be recognized in full in the period of adjustment, and if the actual forfeiture rate is materially different from the Company’s estimate, the Company may be required to record adjustments to stock‑based compensation expense in future periods.
Equity Appreciation Rights Plan
Awards granted under the Company's Equity Appreciation Rights (“EAR”) plan are accounted for as liability-classified awards because it is a cash settled plan. The Company elected the intrinsic value method to measure its liability-classified awards and amortizes share-based compensation expense for those awards expected to vest on a straight-line basis over the requisite service period. The Company re-measures the intrinsic value of the awards at the end of each reporting period.
F-15
Comprehensive Income (Loss)
Comprehensive income (loss) consists of net income and other comprehensive income (loss). Other comprehensive income (loss) consists of foreign currency translation adjustments, unrealized gains and losses from derivative instruments designated as cash flow hedges, unrealized gains and losses from available-for-sale securities and pension and other postretirement adjustments.
Net Income (Loss) Per Common Share
Prior to the conversion of the redeemable convertible preferred shares to common stock in connection with the Company’s initial public offering, the Company applied the two-class method to calculate its basic and diluted net income (loss) per common share attributable to Acushnet Holdings Corp., as its redeemable convertible preferred shares were participating securities. The two-class method is an earnings allocation formula that treats a participating security as having rights to earnings that otherwise would have been available to common stockholders. Net income (loss) per common share available to Acushnet Holdings Corp. was determined by allocating undistributed earnings between holders of common shares and redeemable convertible preferred shares, based on the participation rights of the preferred shares. Basic net income (loss) per share attributable to Acushnet Holdings Corp. was computed by dividing the net income (loss) available to Acushnet Holdings Corp. by the weighted-average number of common shares outstanding during the period. Diluted net income (loss) per common share attributable to Acushnet Holdings Corp. was computed by dividing the net income (loss) available to Acushnet Holdings Corp. after giving effect to the diluted securities by the weighted-average number of dilutive shares outstanding during the period.
Diluted net income (loss) per common share attributable to Acushnet Holdings Corp. for the year ended December 31, 2016 reflects the potential dilution that would occur if the restricted stock units were converted into common shares. The restricted stock units are included as potential dilutive securities to the extent they are dilutive under the treasury stock method for the applicable periods.
Diluted net income (loss) per common share attributable to Acushnet Holdings Corp. for the years ended December 31, 2015 and 2014 reflects the potential dilution that would occur if common stock warrants, convertible notes, redeemable convertible preferred stock, stock options or any other dilutive equity instruments were exercised or converted into common shares. The common stock warrants and stock options are included as potential dilutive securities to the extent they are dilutive under the treasury stock method for the applicable periods. The convertible notes and redeemable convertible preferred stock are included as potential dilutive securities to the extent they are dilutive under the if-converted method for the applicable periods.
Recently Adopted Accounting Standards
Statement of Cash Flows—Restricted Cash
In November 2016, the Financial Accounting Standards Board (FASB) issued Accounting Standards Update (ASU) 2016‑18, “Statement of Cash Flows: Restricted Cash.” ASU 2016‑18 requires that amounts generally described as restricted cash and restricted cash equivalents be included with cash and cash equivalents when reconciling the beginning-of-period and end-of-period total amounts shown on the statement of cash flows. ASU 2016‑18 is effective for annual periods beginning after December 15, 2017, and interim periods within those fiscal years. The Company adopted the provisions of this standard during the year ended December 31, 2016. The retrospective adoption of this standard did not have a significant impact on the consolidated financial statements.
Fair Value Measurement
In May 2015, the FASB issued ASU 2015‑07, “Fair Value Measurement: Disclosures for Investments in Certain Entities that Calculate Net Asset Value per Share (or Its Equivalent).” Under ASU 2015‑07 investments for which fair value is measured at net asset value per share (or its equivalent) using the practical expedient should not be categorized in the fair value hierarchy. ASU 2015‑07 is effective for fiscal years beginning after December 15, 2015, including interim periods within those fiscal years. The Company adopted the provisions of this standard during the year ended December 31, 2016. The retrospective adoption of this standard did not have a significant impact on the consolidated financial statements.
F-16
Intangibles—Goodwill and Other—Internal‑Use Software
In April 2015, the FASB issued ASU 2015‑05, “Intangibles—Goodwill and Other—Internal‑Use Software: Customer’s Accounting for Fees Paid in a Cloud Computing Arrangement.” ASU 2015‑05 provides guidance to customers about whether a cloud computing arrangement includes a software license. If a cloud computing arrangement includes a software license, then the customer should account for the software license element of the arrangement consistent with the acquisition of other software licenses. If a cloud computing arrangement does not include a software license, the customer should account for the arrangement as a service contract. ASU 2015‑05 is effective for annual periods beginning after December 15, 2015, including interim periods within those fiscal years. The Company prospectively adopted the provisions of this standard during the year ended December 31, 2016. The adoption of this standard did not have a significant impact on the consolidated financial statements.
Consolidation: Amendments to the Consolidation Analysis
In February 2015, the FASB issued ASU 2015‑02, “Consolidation: Amendments to Consolidation Analysis.” ASU 2015‑02 places more emphasis on risk of loss when determining controlling interest, reduces the frequency of the application of related‑party guidance when determining controlling financial interest in a VIE and changes consolidation conclusions for companies in several industries. ASU 2015‑02 is effective for reporting periods beginning after December 15, 2015, with early adoption permitted. The Company retrospectively adopted the provisions of this standard during the year ended December 31, 2016. The retrospective adoption of this standard did not have a significant impact on the consolidated financial statements.
Presentation of Financial Statements—Going Concern
In August 2014, the FASB issued ASU 2014‑15, “Presentation of Financial Statements—Going Concern: Disclosure of Uncertainties about an Entity’s Ability to Continue as a Going Concern.” ASU 2014‑15 requires management to evaluate whether there is substantial doubt about a company’s ability to continue as a going concern within one year from the date the financial statements are issued and to provide related footnote disclosures as appropriate. ASU 2014‑15 is effective for annual periods ending after December 15, 2016, and interim periods within annual periods beginning after December 15, 2016. Early application is permitted for annual or interim reporting periods for which the financial statements have not previously been issued. The adoption of this standard did not have an impact on the consolidated financial statements.
Recently Issued Accounting Standards
Intangibles—Goodwill and Other—Simplifying the Test for Goodwill Impairment
In January 2017, the FASB issued ASU 2017‑04, “Intangibles—Goodwill and Other: Simplifying the Test for Goodwill Impairment.” ASU 2017‑04 removes the second step of the goodwill impairment test. Instead an entity will perform a one-step quantitative test and record the amount of goodwill impairment as the excess of a reporting unit’s carrying amount over its fair value, not to exceed the total amount of goodwill allocated to the reporting unit. ASU 2017‑04 is effective for annual periods beginning after December 15, 2019, and interim periods within those fiscal years. Early adoption is permitted for interim or annual goodwill impairment tests performed on testing dates after January 1, 2017. The adoption of this standard is not expected to have a significant impact on the consolidated financial statements.
Business Combination—Clarifying the Definition of a Business
In January 2017, the FASB issued ASU 2017‑01, “Business Combinations: Clarifying the Definition of a Business.” ASU 2017‑01 clarifies the definition of a business with the objective of adding guidance to assist entities with evaluating whether transactions should be accounted for as acquisitions (or disposals) of businesses. ASU 2017‑01 is effective for annual periods beginning after December 15, 2017, and interim periods within those fiscal years. Early application is permitted for transactions for which the acquisition date occurs before the issuance date or effective date of the amendments, only when the transaction has not been reported in financial statements that have been issued or made available for issuance. The adoption of this standard is not expected to have a significant impact on the consolidated financial statements.
F-17
Consolidation—Interest Held Through Related Parties
In October 2016, the FASB issued ASU 2016‑17, “Consolidation: Interests Held through Related Parties that are under Common Control.” ASU 2016‑17 changes the evaluation of whether a reporting entity is the primary beneficiary of a VIE by changing how a reporting entity that is a single decision maker of a VIE treats indirect interests in the entity held through related parties that are under common control with the reporting entity. ASU 2016‑17 is effective for annual periods beginning after December 15, 2016, and interim periods within those fiscal years. Early application is permitted for annual or interim reporting periods for which the financial statements have not previously been issued. The adoption of this standard is not expected to have a significant impact on the consolidated financial statements.
Income Taxes
In October 2016, the FASB issued ASU 2016‑16, “Income Taxes: Intra-Entity Transfers of Assets other than Inventory.” ASU 2016-16 requires that entities recognize the income tax consequences of an intra-entity transfer of an asset other than inventory when the transfer occurs. The guidance is effective for financial statements issued for annual periods beginning after December 15, 2017, including interim periods within those fiscal years. The Company is currently evaluating this standard to determine the impact of its adoption on the consolidated financial statements.
Statement of Cash Flows
In August 2016, the FASB issued ASU 2016‑15, “Statement of Cash Flows: Classification of Certain Cash Receipts and Cash Payments” to address diversity in practice in how certain cash receipts and cash payments are presented and classified in the statement of cash flows. The guidance is effective for financial statements issued for annual periods beginning after December 15, 2017, including interim periods within those fiscal years. The Company is currently evaluating this standard to determine the impact of its adoption on the consolidated financial statements.
Revenue from Contracts with Customers
In May 2016, the FASB issued ASU 2016‑12, “Revenue from Contracts with Customers: Narrow‑Scope Improvements and Practical Expedients.” ASU 2016‑12 addresses narrow‑scope improvements to the guidance on collectability, noncash consideration and completed contracts at transition and provides a practical expedient for contract modifications and an accounting policy election related to the presentation of sales taxes and other similar taxes collected from customers. In March 2016, the FASB issued ASU 2016‑08, “Revenue from Contracts with Customers: Principal versus Agent Considerations” clarifying the implementation guidance on principal versus agent considerations. In August 2015, the FASB issued ASU 2015‑14, “Revenue from Contracts with Customers: Deferral of the Effective Date.” deferring the adoption of previously issued guidance published in May 2014, ASU 2014‑09, “Revenue from Contracts with Customers.” ASU 2014‑09 amends revenue recognition guidance and requires more detailed disclosures to enable users of financial statements to understand the nature, amount, timing and uncertainty of revenue and cash flows arising from contracts with customers. ASU 2016‑08 and 2015‑14 are effective for reporting periods beginning after December 15, 2017, including interim periods within those fiscal years. The new standard permits the use of either the retrospective or modified retrospective approach on adoption. The Company has contracted with an outside firm to assist in the evaluation of this standard to determine the impact of its adoption on the consolidated financial statements.
Compensation—Stock Compensation
In March 2016, the FASB issued ASU 2016‑09, “Compensation—Stock Compensation: Improvements to Employee Share‑Based Payment Accounting” to simplify accounting for employee share‑based payment transactions, including the income tax consequences, classification of awards as either equity or liabilities and classification on the statement of cash flows. The guidance is effective for financial statements issued for annual periods beginning after December 15, 2016, including interim periods within those fiscal years. The adoption of this standard is not expected to have a significant impact on the consolidated financial statements.
Leases
In February 2016, the FASB issued ASU 2016‑02, “Leases,” which will require lessees to recognize right‑of‑use assets and lease liabilities for leases which were formerly classified as operating leases. The guidance is
F-18
effective for financial statements issued for annual periods beginning after December 15, 2018, including interim periods within those fiscal years. While the Company is still in the process of completing its analysis on the complete impact this ASU will have on its consolidated financial statements and related disclosures, it does expect the ASU to have a material impact on its consolidated balance sheet for recognition of lease-related assets and liabilities.
3. Allowance for Doubtful Accounts
The change to the allowance for doubtful accounts was as follows:
|
(in thousands) |
|
|
2016 |
|
|
2015 |
|
|
2014 |
|
|
|
|
|
|
|
|
|
|
|
|
|
|
Balance at beginning of year |
|
$ |
12,363 |
|
$ |
8,528 |
|
$ |
8,876 |
|
|
Bad debt expense |
|
|
6,507 |
|
|
4,771 |
|
|
2,545 |
|
|
Amount of receivables written off |
|
|
(6,315) |
|
|
(634) |
|
|
(2,485) |
|
|
Foreign currency translation |
|
|
(300) |
|
|
(302) |
|
|
(408) |
|
|
Balance at end of year |
|
$ |
12,255 |
|
$ |
12,363 |
|
$ |
8,528 |
|
On September 14, 2016, Golfsmith International Holdings LP, one of the Company’s largest customers in the years ended December 31, 2016, 2015, and 2014, announced that its U.S.‑based business, Golfsmith International Holdings, Inc., (Golfsmith) commenced a Chapter 11 case under Title 11 of the United States Code in the United States Bankruptcy Court for the District of Delaware, and its Canada‑based business, Golf Town Canada Inc., (Golf Town) commenced creditor protection proceedings under the Companies’ Creditors Arrangement Act in the Ontario Superior Court of Justice (Commercial List). The Company’s outstanding receivable related to Golfsmith and Golf Town was reserved for in full by the time of the bankruptcy filing and as of December 31, 2016 the portion related to Golfsmith had been written off.
4. Inventories
The components of inventories were as follows:
|
(in thousands) |
|
December 31, |
|
December 31, |
|
||
|
|
|
2016 |
|
2015 |
|
||
|
|
|
|
|
|
|
|
|
|
Raw materials and supplies |
|
$ |
55,424 |
|
$ |
63,119 |
|
|
Work-in-process |
|
|
21,558 |
|
|
18,210 |
|
|
Finished goods |
|
|
246,307 |
|
|
245,030 |
|
|
Inventories |
|
$ |
323,289 |
|
$ |
326,359 |
|
The change to the inventory reserve was as follows:
|
(in thousands) |
|
2016 |
|
2015 |
|
2014 |
|
|||
|
|
|
|
|
|
|
|
|
|
|
|
|
Balance at beginning of year |
|
$ |
(9,470) |
|
$ |
(5,697) |
|
$ |
(7,112) |
|
|
Charged to costs and expenses |
|
|
(8,147) |
|
|
(7,468) |
|
|
(4,197) |
|
|
Deduction for reserved inventory disposed or sold |
|
|
3,542 |
|
|
3,153 |
|
|
4,860 |
|
|
Foreign currency translation |
|
|
603 |
|
|
542 |
|
|
752 |
|
|
Balance at end of year |
|
$ |
(13,472) |
|
$ |
(9,470) |
|
$ |
(5,697) |
|
The Company identified an immaterial error in the disclosure of the inventory reserve table as presented in the prior year financial statements. The error was limited to the presentation in the footnote and had no impact on the consolidated financial statements. The Company has revised prior period amounts to correct for these errors.The revision of the 2015 disclosure resulted in a decrease in the balance at end of year of $1.0 million made up of a decrease in the beginning reserve of $2.6 million, an increase in charged to cost and expenses of $2.2 million, an increase in deduction for reserved inventory disposed or sold of $0.4 million and an increase in foreign currency translation of $0.2 million. The revision of the 2014 disclosure resulted in a decrease in the balance at end of year of $2.6 million made up of a decrease in the beginning reserve of $1.9 million, a decrease in charged to cost and expenses of $2.5 million, a decrease
F-19
in deduction for reserved inventory disposed or sold of $2.3 million and an increase in foreign currency translation of $0.5 million.
5. Property, Plant and Equipment, Net
The components of property, plant and equipment, net were as follows:
|
|
|
December 31, |
|
December 31, |
|
||
|
(in thousands) |
|
2016 |
|
2015 |
|
||
|
|
|
|
|
|
|
|
|
|
Land |
|
$ |
14,500 |
|
$ |
14,804 |
|
|
Buildings and improvements |
|
|
133,844 |
|
|
131,231 |
|
|
Machinery and equipment |
|
|
143,784 |
|
|
140,042 |
|
|
Furniture, computers and equipment |
|
|
29,326 |
|
|
24,489 |
|
|
Computer software |
|
|
58,462 |
|
|
51,042 |
|
|
Construction in progress |
|
|
11,196 |
|
|
17,554 |
|
|
Property, plant and equipment, gross |
|
|
391,112 |
|
|
379,162 |
|
|
Accumulated depreciation and amortization |
|
|
(151,364) |
|
|
(124,268) |
|
|
Property, plant and equipment, net |
|
$ |
239,748 |
|
$ |
254,894 |
|
During the years ended December 31, 2016, 2015 and 2014, software development costs of $8.2 million, $43.0 million and $9.4 million were capitalized, consisting of software placed into service of $7.4 million, $40.6 million and $0.8 million and amounts recorded in construction in progress of $0.8 million, $2.4 million and $8.6 million, respectively. Amortization expense on capitalized software development costs was $5.8 million, $5.5 million and $2.8 million for the years ended December 31, 2016, 2015 and 2014, respectively.
Total depreciation and amortization expense related to property, plant and equipment was $31.5 million, $32.5 million and $33.2 million for the years ended December 31, 2016, 2015 and 2014, respectively.
6. Goodwill and Identifiable Intangible Assets, Net
The change in the net carrying value of goodwill was as follows:
|
(in thousands) |
|
|
2016 |
|
|
2015 |
|
|
|
|
|
|
|
|
|
|
|
|
|
Balances at beginning of year |
|
$ |
181,179 |
|
$ |
187,580 |
|
|
|
Foreign currency translation |
|
|
(1,938) |
|
|
(6,401) |
|
|
|
Balances at end of year |
|
$ |
179,241 |
|
$ |
181,179 |
|
|
Goodwill allocated to the Company's reportable segments and changes in the carrying amount of goodwill were as follows:
|
|
|
Titleist |
|
Titleist |
|
FootJoy |
|
Titleist |
|
|
|
|
|
|
|||||
|
(in thousands) |
|
Golf Balls |
|
Golf Clubs |
|
Golf Wear |
|
Golf Gear |
|
Other |
|
Total |
|
||||||
|
|
|
|
|
|
|
|
|
|
|
|
|
|
|
|
|
|
|
|
|
|
Balances at December 31,2014 |
|
$ |
109,921 |
|
$ |
54,319 |
|
$ |
1,760 |
|
$ |
13,168 |
|
$ |
8,412 |
|
$ |
187,580 |
|
|
Foreign currency translation |
|
|
(3,360) |
|
|
(2,566) |
|
|
543 |
|
|
(619) |
|
|
(399) |
|
|
(6,401) |
|
|
Balances at December 31,2015 |
|
|
106,561 |
|
|
51,753 |
|
|
2,303 |
|
|
12,549 |
|
|
8,013 |
|
|
181,179 |
|
|
Foreign currency translation |
|
|
(1,139) |
|
|
(554) |
|
|
(25) |
|
|
(134) |
|
|
(86) |
|
|
(1,938) |
|
|
Balances at December 31,2016 |
|
$ |
105,422 |
|
$ |
51,199 |
|
$ |
2,278 |
|
$ |
12,415 |
|
$ |
7,927 |
|
$ |
179,241 |
|
F-20
The net carrying value by class of identifiable intangible assets was as follows:
|
|
Weighted |
|
December 31,2016 |
|
December 31,2015 |
|||||||||||||||
|
|
Average |
|
|
|
|
|
|
|
|
|
|
|
|
|
|
|
|
|||
|
|
Useful |
|
|
|
|
Accumulated |
|
Net Book |
|
|
|
|
Accumulated |
|
Net Book |
|||||
|
(in thousands) |
Life (Years) |
|
Gross |
|
Amortization |
|
Value |
|
Gross |
|
Amortization |
|
Value |
|||||||
|
|
|
|
|
|
|
|
|
|
|
|
|
|
|
|
|
|
|
|
|
|
|
Indefinite-lived: |
|
|
|
|
|
|
|
|
|
|
|
|
|
|
|
|
|
|
|
|
|
Trademarks |
|
N/A |
|
$ |
428,100 |
|
$ |
- |
|
$ |
428,100 |
|
$ |
428,100 |
|
$ |
- |
|
$ |
428,100 |
|
Amortizing: |
|
|
|
|
|
|
|
|
|
|
|
|
|
|
|
|
|
|
|
|
|
Completed Technology |
|
13 |
|
|
73,900 |
|
|
(29,956) |
|
|
43,944 |
|
|
73,900 |
|
|
(24,426) |
|
|
49,474 |
|
Customer Relationships |
|
20 |
|
|
18,999 |
|
|
(5,146) |
|
|
13,853 |
|
|
19,253 |
|
|
(4,252) |
|
|
15,001 |
|
Licensing Fees and Other |
|
7 |
|
|
32,423 |
|
|
(28,332) |
|
|
4,091 |
|
|
32,352 |
|
|
(25,433) |
|
|
6,919 |
|
Total intangible assets |
|
|
|
$ |
553,422 |
|
$ |
(63,434) |
|
$ |
489,988 |
|
$ |
553,605 |
|
$ |
(54,111) |
|
$ |
499,494 |
During the years ended December 31, 2016 and 2015, no impairment charges were recorded to goodwill or indefinite-lived intangible assets. During the year ended December 31, 2014, the Company recorded an impairment charge of $0.8 million related to its Pinnacle trademarks. The Company did not record an impairment charge to goodwill during the year ended December 31, 2014.
Amortization expense on identifiable intangible assets was $9.3 million, $9.3 million and $9.4 million for the years ended December 31, 2016, 2015 and 2014, respectively, of which $2.7 million associated with certain licensing fees was included in cost of goods sold in each year.
Amortization expense related to intangible assets as of December 31, 2016 for each of the next five fiscal years and beyond is expected to be as follows:
|
(in thousands) |
|
|
|
|
|
|
|
|
|
|
|
Year ending December 31, |
|
|
|
|
|
2017 |
|
$ |
9,208 |
|
|
2018 |
|
|
7,844 |
|
|
2019 |
|
|
6,236 |
|
|
2020 |
|
|
5,893 |
|
|
2021 |
|
|
5,893 |
|
|
Thereafter |
|
|
26,814 |
|
|
Total |
|
$ |
61,888 |
|
7. Product Warranty
The activity related to the Company’s warranty obligation for accrued warranty expense was as follows:
|
(in thousands) |
|
2016 |
|
2015 |
|
2014 |
|
|||
|
|
|
|
|
|
|
|
|
|
|
|
|
Balance at beginning of year |
|
$ |
3,345 |
|
$ |
2,989 |
|
$ |
2,924 |
|
|
Provision |
|
|
6,200 |
|
|
5,399 |
|
|
4,959 |
|
|
Claims paid/costs incurred |
|
|
(5,940) |
|
|
(4,929) |
|
|
(4,700) |
|
|
Foreign currency translation |
|
|
(79) |
|
|
(114) |
|
|
(194) |
|
|
Balance at end of year |
|
$ |
3,526 |
|
$ |
3,345 |
|
$ |
2,989 |
|
|
|
|
|
|
|
|
|
|
|
|
|
8. Related Party Transactions
The Company has historically incurred interest expense payable to related parties on its outstanding convertible notes and bonds with common stock warrants (Note 9). Related party interest expense totaled $28.1 million, $35.4 million and $38.0 million for the years ended December 31, 2016, 2015 and 2014, respectively. In addition, other assets includes receivables from related parties of $0.9 million as of December 31, 2016.
F-21
9. Debt and Financing Arrangements
The Company’s debt and capital lease obligations were as follows:
|
|
|
December 31, |
|
December 31, |
|
||
|
(in thousands) |
|
2016 |
|
2015 |
|
||
|
|
|
|
|
|
|
|
|
|
Term loan |
|
$ |
366,607 |
|
$ |
- |
|
|
Secured floating rate notes |
|
|
- |
|
|
372,804 |
|
|
Convertible notes |
|
|
- |
|
|
362,490 |
|
|
Bonds with common stock warrants |
|
|
- |
|
|
30,540 |
|
|
Senior term loan facility |
|
|
- |
|
|
29,836 |
|
|
Revolving credit facility |
|
|
42,495 |
|
|
24,000 |
|
|
Other short-term borrowings |
|
|
- |
|
|
15,064 |
|
|
Capital lease obligations |
|
|
491 |
|
|
1,481 |
|
|
Total |
|
|
409,593 |
|
|
836,215 |
|
|
Less: Short-term debt |
|
|
61,245 |
|
|
441,704 |
|
|
Total long-term debt and capital lease obligations |
|
$ |
348,348 |
|
$ |
394,511 |
|
The term loan is net of debt issuance costs of $3.7 million as of December 31, 2016. The secured floating rate notes are net of debt issuance costs of $2.2 million as of December 31, 2015.
Senior Secured Credit Facility
On April 27, 2016, the Company entered into a senior secured credit facilities agreement arranged by Wells Fargo Bank, National Association which provides for (i) a $275.0 million multi‑currency revolving credit facility, including a $20.0 million letter of credit sublimit, a $25.0 million swing line sublimit, a C$25.0 million sublimit for Acushnet Canada, Inc., a £20.0 million sublimit for Acushnet Europe Limited and an alternative currency sublimit of $100.0 million for borrowings in Canadian dollars, euros, pounds sterling and Japanese yen (“revolving credit facility”), (ii) a $375.0 million term loan A facility and (iii) a $100.0 million delayed draw term loan A facility. The revolving and term loan facilities mature on July 28, 2021 and the delayed draw term loan A facility expires on July 28, 2017 if not drawn. The credit agreement allows for the incurrence of additional term loans or increases in the revolving credit facility in an aggregate principal amount not to exceed (i) $200.0 million plus (ii) an unlimited amount so long as the net average secured leverage ratio (as defined in the credit agreement) does not exceed 2.00:1.00 on a pro forma basis. The applicable interest rate for the Canadian borrowings under the senior secured credit facility is based on CDOR plus a margin ranging from 1.25% to 2.00% depending on the Net Average Total Leverage Ratio as defined in the credit agreement. The applicable interest for the swing line sublimit is the highest of (a) Federal Funds Rate plus 0.50%, (b) the Prime Rate and (c) the one month LIBOR rate plus 1.00% plus a margin ranging from 0.25% to 1.00% depending on the Net Average Total Leverage Ratio as defined in the credit agreement. The applicable interest rate for all remaining borrowings under the senior secured credit facilities is LIBOR plus a margin ranging from 1.25% to 2.00% depending on the Net Average Total Leverage Ratio as defined in the credit agreement or the highest of (a) Federal Funds Rate plus 0.50%, (b) the Prime Rate and (c) the one month LIBOR rate plus 1.00% plus a margin ranging from 0.25%.to 1.00% depending on the Net Average Total Leverage Ratio as defined in the credit agreement.
The credit agreement contains customary affirmative and restrictive covenants, including, among others, financial covenants based on the Company’s leverage and interest coverage ratios. The credit agreement includes customary events of default, the occurrence of which, following any applicable cure period, would permit the lenders to, among other things, declare the principal, accrued interest and other obligations to be immediately due and payable. A change of control is an event of default under the credit agreement which could result in the acceleration of all outstanding indebtedness and the termination of all commitments under the credit agreement and would allow the lenders under the credit agreement to enforce their rights with respect to the collateral granted. A change of control occurs if any person (other than certain permitted parties, including Fila Korea) becomes the beneficial owner of 35% or more of the outstanding common stock of the Company. On October 28, 2016, Magnus Holdings Co., Ltd. (“Magnus”), a wholly owned subsidiary of Fila Korea, entered into a one-year term loan which is secured by a pledge on all of the Company’s common stock owned by Magnus, except for 5% of the Company’s outstanding common stock owned by Magnus that is subject to a negative pledge under Fila Korea’s credit facility, which equals 48.1% of the Company’s
F-22
outstanding common stock. If Fila Korea or Magnus are unable to repay the amounts due on the term loan at maturity, the lenders of such debt can foreclose on the pledged shares of the Company’s common stock.
The credit agreement was signed and became effective on April 27, 2016 and initial funding under the credit agreement occurred on July 28, 2016. The proceeds of the $375.0 million term loan A facility, borrowings of C$4.0 million (equivalent to approximately $3.0 million) under the revolving credit facility and cash on hand of $23.6 million were used to repay all amounts outstanding under the secured floating rate notes and certain former working credit facilities. The secured floating rate notes, certain former working credit facilities and the former senior revolving credit facility were terminated. The Company recorded interest expense related to the term loan facility, including the amortization of debt issuance costs, of $4.5 million during the year ended December 31, 2016. The Company recorded interest expense related to the revolving credit facility of $0.9 million during the year ended December 31, 2016.
Convertible Notes
In 2011 and 2012, the Company issued convertible notes with an aggregate principal amount of $362.5 million to shareholders. The convertible notes bore interest at a rate of 7.5% per annum, which was payable in cash semi‑annually in arrears on February 1 and August 1. The notes matured upon the earlier of July 29, 2021 or the election of the holder upon a change in control, as defined in the securities purchase agreements governing the notes. Amounts due under the convertible notes could only be repaid upon maturity or upon a change in control.
On March 11, 2013, the Company received approval from the holders of the convertible notes to defer any interest payments due after August 1, 2013 and prior to February 1, 2016 pursuant to the covenants imposed by the secured floating rate notes and the senior revolving and term loan facilities.
The notes were convertible at the option of the holder at any time prior to maturity into a number of shares of the Company’s common stock determined by dividing the aggregate outstanding unpaid principal amount of the note by the conversion price of $11.11 per share. The conversion price was subject to adjustment if additional shares of common stock were sold subsequent to the issuance of the convertible notes at a price per common share that was lower than $11.11 per share or upon a subdivision of the outstanding shares of the Company’s common stock. Transfer of the notes to any party, including an affiliate of the noteholder, required prior written consent of the other noteholders and Fila Korea.
On May 6, 2016, the Company and each of the holders of the convertible notes entered into an agreement requiring the mandatory conversion of the convertible notes into fully paid and nonassessable shares of the Company’s common stock upon the closing of an initial public offering. This agreement was amended on September 5, 2016 to provide for the automatic conversion of a portion of the outstanding convertible notes in connection with the sale of shares of the Company’s common stock by the holders of the convertible notes to Magnus. The automatic conversion of all outstanding convertible notes occurred prior to the closing of the Company’s initial public offering. Upon conversion, all accrued but unpaid interest on the principal of the convertible notes was paid to each holder of the convertible notes.
The Company recorded interest expense related to the convertible notes of $22.6 million, $27.2 million and $27.2 million during the years ended December 31, 2016, 2015 and 2014 respectively.
Bonds with Common Stock Warrants
In 2011 and 2012, the Company issued bonds with an aggregate principal amount of $172.5 million to shareholders. The bonds bore interest at a rate of 7.5% per annum, which was payable in cash semi‑annually in arrears on February 1 and August 1. The bonds matured upon the earlier of July 29, 2021 or the election of the holder upon a change of control, as defined in the securities purchase agreement governing the bonds. Amounts due under the bonds could only be repaid upon maturity, a change of control, a holder electing to exercise common stock warrants by net settling their bonds or an exercise of common stock warrants by Fila Korea.
In connection with the issuance of these bonds, the Company issued common stock warrants for the purchase of 15,526,431 shares of the Company’s common stock, at an exercise price of $11.11 per share. The exercise price was subject to adjustment if additional shares of common stock were sold subsequent to the issuance of the bonds at a price per common share that was lower than $11.11 per share or upon a subdivision of the outstanding shares of the Company’s common stock. The common stock warrant exercise price could be settled with cash or through tender of an
F-23
aggregate outstanding principal amount of the bonds and accrued but unpaid interest equal to the exercise price of the common stock warrants.
The common stock warrants were detachable and transferrable by the holders only to Fila Korea or its designee at a price equal to the interest accrued on the underlying bonds at the rate of 4.0% per annum calculated on an annual compounded basis. The shareholders agreement provided Fila Korea with a call option to purchase all of the outstanding common stock warrants held by holders of the bonds in annual installments of 3,105,288 common stock warrants over a five year period beginning July 29, 2012. Fila Korea was required to exercise the common stock warrants within 10 days of the transfer. The exercise of the common stock warrants by Fila Korea triggered the Company to redeem a pro rata share of the bonds payable by using the proceeds received from the exercise of the common stock warrants by Fila Korea.
In July 2016, Fila Korea exercised its final annual call option to purchase 3,105,279 common stock warrants held by the holders of the bonds and exercised such warrants at the exercise price of $11.11 per share. This resulted in proceeds to the Company of $34.5 million which the Company used to repay the outstanding indebtedness under the bonds of $34.5 million.
A discount of $19.9 million relating to the issuance‑date fair value of the common stock warrants was recorded on the issuance date of the bonds and was accreted to interest expense until the maturity date of the bonds. The unamortized discount was $4.0 million as of December 31, 2015.
The Company recorded interest expense related to the bonds, including the amortization of the discount, of $5.5 million, $8.2 million and $10.8 million during the years ended December 31, 2016, 2015 and 2014, respectively.
Secured Floating Rate Notes
In October 2011, the Company issued secured floating rate notes with Korea Development Bank in an aggregate principal amount of $500.0 million, which matured on July 29, 2016. The notes bore interest at a rate equal to three‑month LIBOR plus a margin of 3.75%, which was required to be paid quarterly in arrears on January 31, April 30, July 31 and October 31. The notes were issued in separate classes with maturity dates ranging from October 2013 to July 2016. Pursuant to an amended and restated pledge and security agreement dated October 31, 2011, the secured floating rate notes were secured by certain assets, including inventory, accounts receivable, fixed assets and intangible assets of the Company, and a second priority security interest in the shares of certain Fila Korea entities, trademarks and bank accounts.
In October 2013, the Company issued secured floating rate notes with Korea Development Bank in an aggregate principal amount of $125.0 million, which matured on July 29, 2016. Proceeds from the issuance of the notes were used, along with existing cash on hand, to repay $150.0 million of the secured floating rate notes issued in October 2011. The notes bore interest at a rate equal to three‑month LIBOR plus a margin of 3.75%, which was required to be paid quarterly in arrears on January 31, April 30, July 31 and October 31.
The Company incurred $13.2 million of issuance costs in connection with the original issuance of $500.0 million secured floating rate notes. In addition, the Company incurred $3.3 million of issuance costs in connection with the issuance of $125.0 million secured floating rate notes during the year ended December 31, 2013. Of the $3.3 million, $1.0 million was immediately recorded as interest expense and $2.3 million was capitalized as debt issuance costs.
On July 28, 2016, the outstanding borrowings under the secured floating rate notes were repaid in full using the proceeds from the senior secured credit facility and the secured floating rate notes were terminated.
There were outstanding borrowings under the secured floating rate notes of $375.0 million as of December 31, 2015. As of December 31, 2015, the interest rate applicable to the outstanding borrowings under the secured floating rate notes was 4.07%. The Company recorded interest expense related to the secured floating rate notes, including the amortization of debt issuance costs, of $12.3 million, $20.8 million and $22.4 million during the years ended December 31, 2016, 2015 and 2014, respectively.
F-24
Senior Revolving and Term Loan Facilities
In July 2011, the Company entered into a senior revolving facilities agreement with Korea Development Bank (“Senior Facility Agreement”), which provided for borrowings under a revolving credit facility of up to $50.0 million to be used for general corporate purposes (“Senior Revolving Facility”). The applicable interest rate for borrowings under the Senior Revolving Facility was LIBOR plus a margin of 3.25%. The Senior Facility Agreement required a commitment fee of 0.3% based on the average daily unused portion of the facility. On February 12, 2014, the Company amended its Senior Facility Agreement and simultaneously executed a joinder agreement with Wells Fargo N.A. to increase the borrowing capacity under the Senior Revolving Facility to $75.0 million.
On December 24, 2014, the Company further amended the Senior Facility Agreement to increase the borrowing capacity under the Senior Revolving Facility to $95.0 million, which matured on July 29, 2016. This amendment also provided for borrowings under a senior term loan agreement with Korea Development Bank of $30.0 million (“Senior Term Loan”), which matured on July 29, 2016. The applicable interest rate for borrowings under the Senior Term Loan was three‑month LIBOR plus a margin of 2.63%, and was increased for any required withholding taxes. The Senior Facility Agreement required a commitment fee of 0.3% based on the average daily unused portion of the term loan. Upon entry into the amendment, the Company immediately borrowed the entire $30.0 million under the Senior Term Loan.
There were no outstanding borrowings under the Senior Revolving Facility as of December 31, 2015. The Company recorded interest expense related to the Senior Revolving Facility, including unused commitment fees, of $0.8 million, $0.8 million and $0.9 million during the years ended December 31, 2016, 2015 and 2014, respectively.
On June 30, 2016, the Company repaid all amounts outstanding under the Senior Term Loan facility and the facility was terminated. There were outstanding borrowings under the Senior Term Loan of $30.0 million as of December 31, 2015.
As of December 31, 2015, the interest rate applicable to the outstanding borrowings under the Senior Term Loan facility was 3.26%. The Company recorded interest expense related to the Senior Term Loan of $0.7 million, $1.3 million and less than $0.1 million during the years ended December 31, 2016, 2015 and 2014, respectively.
Line of Credit Facility
On February 5, 2016, the Company entered into a working capital facility agreement arranged by Wells Fargo Bank, National Association which provided for borrowings up to $30.0 million. The applicable interest rate for borrowings under the facility was daily one‑month LIBOR plus a margin of 2.50%. The facility required a commitment fee equal to 0.35% of the unused portion of the facility as of the preceding fiscal quarter.
The working capital facility had an original maturity date of May 31, 2016, but was amended on May 18, 2016 to extend the maturity date to July 29, 2016.
The Company recorded interest expense related to the line of credit facility of $0.3 million during the year ended December 31, 2016.
Working Credit Facility (Canada)
In February 2013, the Company entered into a working credit facility agreement arranged by Wells Fargo N.A., Canadian Branch, which provided for borrowings of up to the lesser of (a) C$25 million or (b) the sum of 80% of eligible accounts receivable and 60% of eligible inventory. The working credit facility, as amended, matured on July 29, 2016. The applicable interest rate for borrowings under the facility for Canadian dollar borrowings was CDOR plus a margin of 2.0% or Canadian Prime Rate and for U.S. dollar borrowings was LIBOR plus a margin of 2.0% or U.S. Prime Rate. The facility required a commitment fee equal to 0.25% of the uncancelled and unutilized portion of the facility as of the preceding fiscal quarter.
On July 28, 2016, the outstanding borrowings were repaid using the proceeds from the senior secured credit facility and cash on hand and the working credit facility (Canada) was terminated. There were no outstanding borrowings under the working credit facility (Canada) as of December 31, 2015.
F-25
The Company recorded interest expense related to the working credit facility (Canada), including unused commitment fees, of $0.2 million, $0.3 million and $0.3 million during the years ended December 31, 2016, 2015 and 2014, respectively.
Working Credit Facility (Europe)
In April 2012, the Company entered into a working credit facility agreement arranged by Wells Fargo Capital Finance (UK) Limited, which provided for borrowings of up to the lesser of (a) £30.0 million or (b) the sum of 85% of eligible accounts receivable and 65% of eligible inventory, of which £5.0 million can be used for letters of credit. The working credit facility had an original maturity date of April 4, 2017. The applicable interest rate for borrowings under the facility was LIBOR plus a margin of 3.0%. The facility included a commitment fee of 0.375% on the average daily unused portion of the facility. The working credit facility was secured by the accounts receivable, inventory and cash collections of Acushnet Europe Limited, a wholly-owned subsidiary of the Company.
On July 28, 2016, the outstanding borrowings were repaid using cash on hand and the working credit facility (Europe) was terminated. There were no outstanding borrowings under the working credit facility (Europe) as of December 31, 2015.
The Company recorded interest expense related to the working credit facility (Europe), including unused commitment fees, of $0.5 million, $0.6 million and $0.7 million during the years ended December 31, 2016, 2015 and 2014, respectively.
Letters of Credit
As of December 31, 2016 and 2015, there were outstanding letters of credit totaling $11.6 million and $14.4 million, respectively, of which $8.6 million and $4.0 million was secured, respectively, related to agreements which provided a maximum commitment for letters of credit of $24.0 million.
Available Borrowings
As of December 31, 2016, the Company had available borrowings under its revolving credit facilities, including the revolving credit facility, Senior Revolving Facility and Canadian and European working credit facilities, of $224.9 million after giving effect to $7.6 million of outstanding letters of credit.
Payments of Debt Obligations due by Period
As of December 31, 2016, principal payments on outstanding long-term debt obligations were as follows:
|
(in thousands) |
|
|
|
|
|
Year ending December 31, |
|
|
|
|
|
2017 |
|
$ |
18,750 |
|
|
2018 |
|
|
21,094 |
|
|
2019 |
|
|
28,125 |
|
|
2020 |
|
|
30,470 |
|
|
2021 |
|
|
271,874 |
|
|
Thereafter |
|
|
- |
|
|
Total |
|
$ |
370,313 |
|
10. Derivative Financial Instruments
Common Stock Warrants
Prior to the exercise of the final tranche of common stock warrants by Fila Korea during July 2016, the Company classified warrants to purchase common stock as a liability on its consolidated balance sheet as the warrants were free‑standing financial instruments that could result in the issuance of a variable number of the Company’s common shares. The warrants were initially recorded at fair value on grant date, and were subsequently re‑measured to fair value at each reporting date. Common stock warrants were recorded at fair value (Note 11) and included in accrued
F-26
expenses and other liabilities on the consolidated balance sheet as of December 31, 2015. Changes in the fair value of the common stock warrants were recognized as other (income) expense, net on the consolidated statement of operations.
On July 29, 2011, the Company issued bonds in the aggregate principal amount of $168.0 million and common stock warrants to purchase an aggregate of 15,120,000 shares of the Company’s common stock. On January 20, 2012, the Company issued $4.5 million of additional bonds and common stock warrants to purchase 406,431 shares of the Company’s common stock (Note 9).
In July 2016, Fila Korea exercised its final annual call option to purchase 3,105,279 common stock warrants held by the holders of the bonds and exercised such warrants at the exercise price of $11.11 per share, or $34.5 million in the aggregate. The Company used the proceeds received from Fila Korea’s exercise of the common stock warrants to redeem the outstanding bonds payable.
Foreign Exchange Derivative Instruments
The Company principally uses financial instruments to reduce the impact of changes in foreign currency exchange rates. The principal derivative financial instruments the Company enters into on a routine basis are foreign exchange forward contracts. The Company does not enter into foreign exchange forward contracts for trading or speculative purposes.
Foreign exchange contracts are primarily used to hedge purchases denominated in select foreign currencies, thereby limiting currency risk that would otherwise result from changes in exchange rates. The periods of the foreign exchange contracts correspond to the periods of the forecasted transactions, which do not exceed 24 months subsequent to the latest balance sheet date. The primary foreign currency hedge contracts pertain to the U.S. dollar, the Japanese yen, the British pound sterling, the Canadian dollar, the Korean won and the Euro. The gross U.S. dollar equivalent notional amount of all foreign currency derivative hedges outstanding as of December 31, 2016 was $371.2 million.
The counterparties to derivative contracts are major financial institutions. The Company assesses credit risk of the counterparties on an ongoing basis. The credit risk of counterparties does not have a significant impact on the valuation of the Company’s derivative instruments.
The fair values of foreign exchange derivative instruments on the consolidated balance sheets were as follows:
|
|
|
Balance Sheet |
|
December 31, |
|
December 31, |
|
||
|
(in thousands) |
|
Location |
|
2016 |
|
2015 |
|
||
|
|
|
|
|
|
|
|
|
|
|
|
Asset derivatives |
|
Other current assets |
|
$ |
11,357 |
|
$ |
13,824 |
|
|
|
|
Other noncurrent assets |
|
|
5,286 |
|
|
790 |
|
|
Liability derivatives |
|
Other current liabilities |
|
|
1,106 |
|
|
1,265 |
|
|
|
|
Other noncurrent liabilities |
|
|
32 |
|
|
331 |
|
The effect of foreign exchange derivative instruments on accumulated other comprehensive income (loss) and the consolidated statements of operations was as follows:
|
|
Gain (Loss) Recognized in OCI |
|||||||||
|
|
Year ended |
|||||||||
|
|
December 31, |
|||||||||
|
(in thousands) |
|
2016 |
|
2015 |
|
2014 |
|
|||
|
Type of hedge |
|
|
|
|
|
|
|
|
|
|
|
Cash flow |
|
$ |
7,014 |
|
$ |
14,964 |
|
$ |
20,619 |
|
|
|
|
$ |
7,014 |
|
$ |
14,964 |
|
$ |
20,619 |
|
F-27
|
|
|
Gain (Loss) Recognized in |
|||||||
|
|
|
Statement of Operations |
|||||||
|
|
|
Year ended |
|||||||
|
|
|
December 31, |
|||||||
|
(in thousands) |
|
2016 |
|
2015 |
|
2014 |
|||
|
|
|
|
|
|
|
|
|
|
|
|
Location of gain (loss) in statement of operations |
|
|
|
|
|
|
|
|
|
|
Cost of goods sold |
|
$ |
5,194 |
|
$ |
26,805 |
|
$ |
9,916 |
|
Selling, general and administrative expense |
|
|
(995) |
|
|
3,841 |
|
|
3,271 |
|
|
|
$ |
4,199 |
|
$ |
30,646 |
|
$ |
13,187 |
Based on the current valuation, the Company expects to reclassify a net gain of $9.3 million from accumulated other comprehensive income (loss) into cost of goods sold during the next 12 months.
11. Fair Value Measurements
Assets and liabilities measured at fair value on a recurring basis were as follows:
|
|
|
Fair Value Measurements as of |
|
|
|||||||
|
|
|
December 31, 2016 using: |
|
|
|||||||
|
(in thousands) |
|
Level 1 |
|
Level 2 |
|
Level 3 |
|
Balance Sheet Location |
|||
|
|
|
|
|
|
|
|
|
|
|
|
|
|
Assets |
|
|
|
|
|
|
|
|
|
|
|
|
Rabbi trust |
|
$ |
6,994 |
|
$ |
- |
|
$ |
- |
|
Other current assets |
|
Foreign exchange derivative instruments |
|
|
- |
|
|
11,357 |
|
|
- |
|
Other current assets |
|
Rabbi trust |
|
|
5,248 |
|
|
- |
|
|
- |
|
Other noncurrent assets |
|
Deferred compensation program assets |
|
|
1,846 |
|
|
- |
|
|
- |
|
Other noncurrent assets |
|
Foreign exchange derivative instruments |
|
|
- |
|
|
5,286 |
|
|
- |
|
Other noncurrent assets |
|
Total assets |
|
$ |
14,088 |
|
$ |
16,643 |
|
$ |
- |
|
|
|
Liabilities |
|
|
|
|
|
|
|
|
|
|
|
|
Foreign exchange derivative instruments |
|
$ |
- |
|
$ |
1,106 |
|
$ |
- |
|
Other current liabilities |
|
Deferred compensation program liabilities |
|
|
1,846 |
|
|
- |
|
|
- |
|
Other noncurrent liabilities |
|
Foreign exchange derivative instruments |
|
|
- |
|
|
32 |
|
|
- |
|
Other noncurrent liabilities |
|
Total liabilities |
|
$ |
1,846 |
|
$ |
1,138 |
|
$ |
- |
|
|
|
|
|
Fair Value Measurements as of |
|
|
|||||||
|
|
|
December 31, 2015 using: |
|
|
|||||||
|
(in thousands) |
|
Level 1 |
|
Level 2 |
|
Level 3 |
|
Balance Sheet Location |
|||
|
|
|
|
|
|
|
|
|
|
|
|
|
|
Assets |
|
|
|
|
|
|
|
|
|
|
|
|
Rabbi trust |
|
$ |
13,111 |
|
$ |
- |
|
$ |
- |
|
Other current assets |
|
Foreign exchange derivative instruments |
|
|
- |
|
|
13,824 |
|
|
- |
|
Other current assets |
|
Rabbi trust |
|
|
1,442 |
|
|
- |
|
|
- |
|
Other noncurrent assets |
|
Deferred compensation program assets |
|
|
2,129 |
|
|
- |
|
|
- |
|
Other noncurrent assets |
|
Foreign exchange derivative instruments |
|
|
- |
|
|
790 |
|
|
- |
|
Other noncurrent assets |
|
Total assets |
|
$ |
16,682 |
|
$ |
14,614 |
|
$ |
- |
|
|
|
Liabilities |
|
|
|
|
|
|
|
|
|
|
|
|
Foreign exchange derivative instruments |
|
$ |
- |
|
$ |
1,265 |
|
$ |
- |
|
Other current liabilities |
|
Common stock warrants |
|
|
- |
|
|
- |
|
|
22,884 |
|
Other current liabilities |
|
Deferred compensation program liabilities |
|
|
2,129 |
|
|
- |
|
|
- |
|
Other noncurrent liabilities |
|
Foreign exchange derivative instruments |
|
|
- |
|
|
331 |
|
|
- |
|
Other noncurrent liabilities |
|
Total liabilities |
|
$ |
2,129 |
|
$ |
1,596 |
|
$ |
22,884 |
|
|
During the years ended December 31, 2016 and 2015, there were no transfers between Level 1, Level 2 and Level 3.
Rabbi trust assets are used to fund certain retirement obligations of the Company. The assets underlying the Rabbi trust are equity and fixed income exchange‑traded funds.
F-28
Deferred compensation program assets and liabilities represent a program where select employees can defer compensation until termination of employment. Effective July 29, 2011, this program was amended to cease all employee compensation deferrals and provided for the distribution of all previously deferred employee compensation. The program remains in effect with respect to the value attributable to the employer match contributed prior to July 29, 2011.
Foreign exchange derivative instruments are forward contracts used to hedge currency fluctuations for transactions denominated in a foreign currency. The Company uses the mid‑price of foreign exchange forward rates as of the close of business on the valuation date to value each foreign exchange forward contract at each reporting period.
The Company categorized the common stock warrants derivative liability as Level 3 as there were significant unobservable inputs used in the underlying valuations. The common stock warrants were valued using the contingent claims methodology.
The change in Level 3 fair value measurements was as follows:
|
|
|
December 31, |
|
December 31, |
|
||
|
(in thousands) |
|
2016 |
|
2015 |
|
||
|
|
|
|
|
|
|
|
|
|
Balance at beginning of year |
|
$ |
22,884 |
|
$ |
1,818 |
|
|
Common stock warrant exercise |
|
|
(28,996) |
|
|
(7,298) |
|
|
Total losses included in earnings |
|
|
6,112 |
|
|
28,364 |
|
|
Balance at end of year |
|
$ |
- |
|
$ |
22,884 |
|
12. Pension and Other Postretirement Benefits
The Company has various pension and post-employment plans which provide for payment of retirement benefits, mainly commencing between the ages of 50 and 65, and for payment of certain disability benefits. After meeting certain qualifications, an employee acquires a vested right to future benefits. The benefits payable under the plans are generally determined on the basis of an employee's length of service and/or earnings. Employer contributions to the plans are made, as necessary, to ensure legal funding requirements are satisfied. The Company may make contributions in excess of the legal funding requirements.
The Company provides postretirement healthcare benefits to certain retirees. Many employees and retirees outside of the United States are covered by government sponsored healthcare programs.
On November 13, 2015, the Company amended the US pension plan and supplemental executive retirement plan (“SERP”) by closing the plans to newly-hired full-time employees who had not yet satisfied the one year service requirement as of January 1, 2016, freezing the accrual of additional benefits on participants who have not attained age 50 with at least 10 years of vesting service, or whose age plus vesting service is less than 70, and shifting benefits for participants who have continued to accrue benefits from the pension plan to the SERP once a cap of $150,000 has been reached. The plans were re-measured in accordance with ASC 715 resulting in a curtailment gain of $2.4 million during the year ended December 31, 2015.
F-29
The following tables present the change in benefit obligation, change in plan assets, and funded status for the Company's defined benefit and postretirement benefit plans for the years ended December 31, 2016 and 2015:
|
|
|
Pension |
|
Pension |
|
|
|
|
||
|
|
|
Benefits |
|
Benefits |
|
Postretirement |
|
|||
|
(in thousands) |
|
(Underfunded) |
|
(Overfunded) |
|
Benefits |
|
|||
|
Change in projected benefit obligation (PBO) |
|
|
|
|
|
|
|
|
|
|
|
Benefit obligation at December 31, 2015 |
|
$ |
271,462 |
|
$ |
38,287 |
|
$ |
20,079 |
|
|
Service cost |
|
|
9,787 |
|
|
(24) |
|
|
888 |
|
|
Interest cost |
|
|
11,077 |
|
|
1,279 |
|
|
779 |
|
|
Actuarial (gain) loss |
|
|
14,095 |
|
|
7,711 |
|
|
(572) |
|
|
Settlements |
|
|
(6,714) |
|
|
- |
|
|
- |
|
|
Plan amendments |
|
|
- |
|
|
- |
|
|
283 |
|
|
Participants’ contributions |
|
|
- |
|
|
- |
|
|
921 |
|
|
Benefit payments |
|
|
(15,515) |
|
|
(796) |
|
|
(2,114) |
|
|
Foreign currency translation |
|
|
122 |
|
|
(6,932) |
|
|
- |
|
|
Adjustment for movement from underfunded to overfunded |
|
|
(210) |
|
|
210 |
|
|
- |
|
|
Projected benefit obligation at December 31, 2016 |
|
|
284,104 |
|
|
39,735 |
|
|
20,264 |
|
|
Accumulated benefit obligation (ABO) at December 31, 2016 |
|
|
247,009 |
|
|
37,289 |
|
|
20,264 |
|
|
Change in plan assets |
|
|
|
|
|
|
|
|
|
|
|
Fair value of plan assets at December 31, 2015 |
|
|
157,729 |
|
|
43,768 |
|
|
- |
|
|
Return on plan assets |
|
|
7,203 |
|
|
8,280 |
|
|
- |
|
|
Employer contributions |
|
|
18,335 |
|
|
2,012 |
|
|
1,193 |
|
|
Participants’ contributions |
|
|
- |
|
|
- |
|
|
921 |
|
|
Settlements |
|
|
(6,714) |
|
|
- |
|
|
- |
|
|
Benefit payments |
|
|
(15,515) |
|
|
(796) |
|
|
(2,114) |
|
|
Foreign currency translation |
|
|
50 |
|
|
(7,922) |
|
|
- |
|
|
Fair value of plan assets at December 31, 2016 |
|
|
161,088 |
|
|
45,342 |
|
|
- |
|
|
Funded status (fair value of plan assets less PBO) |
|
$ |
(123,016) |
|
$ |
5,607 |
|
$ |
(20,264) |
|
|
|
|
Pension |
|
Pension |
|
|
|
|
||
|
|
|
Benefits |
|
Benefits |
|
Postretirement |
|
|||
|
(in thousands) |
|
(Underfunded) |
|
(Overfunded) |
|
Benefits |
|
|||
|
Change in projected benefit obligation (PBO) |
|
|
|
|
|
|
|
|
|
|
|
Benefit obligation at December 31, 2014 |
|
$ |
275,022 |
|
$ |
35,998 |
|
$ |
21,089 |
|
|
Service cost |
|
|
15,515 |
|
|
168 |
|
|
1,060 |
|
|
Interest cost |
|
|
10,962 |
|
|
1,376 |
|
|
787 |
|
|
Actuarial (gain) loss |
|
|
199 |
|
|
2,920 |
|
|
(2,228) |
|
|
Curtailments |
|
|
(21,567) |
|
|
- |
|
|
- |
|
|
Plan amendments |
|
|
1,331 |
|
|
- |
|
|
- |
|
|
Participants’ contributions |
|
|
- |
|
|
55 |
|
|
1,068 |
|
|
Benefit payments |
|
|
(9,203) |
|
|
(575) |
|
|
(1,697) |
|
|
Foreign currency translation |
|
|
(797) |
|
|
(1,655) |
|
|
- |
|
|
Projected benefit obligation at December 31, 2015 |
|
|
271,462 |
|
|
38,287 |
|
|
20,079 |
|
|
Accumulated benefit obligation (ABO) at December 31, 2015 |
|
|
228,830 |
|
|
36,004 |
|
|
20,079 |
|
|
Change in plan assets |
|
|
|
|
|
|
|
|
|
|
|
Fair value of plan assets at December 31, 2014 |
|
|
159,309 |
|
|
42,269 |
|
|
- |
|
|
Return on plan assets |
|
|
(5,182) |
|
|
1,838 |
|
|
- |
|
|
Employer contributions |
|
|
12,827 |
|
|
2,095 |
|
|
629 |
|
|
Participants’ contributions |
|
|
- |
|
|
55 |
|
|
1,068 |
|
|
Benefit payments |
|
|
(9,203) |
|
|
(575) |
|
|
(1,697) |
|
|
Foreign currency translation |
|
|
(22) |
|
|
(1,914) |
|
|
- |
|
|
Fair value of plan assets at December 31, 2015 |
|
|
157,729 |
|
|
43,768 |
|
|
- |
|
|
Funded status (fair value of plan assets less PBO) |
|
$ |
(113,733) |
|
$ |
5,481 |
|
$ |
(20,079) |
|
F-30
The amount of pension and postretirement assets and liabilities recognized on the consolidated balance sheets were as follows:
|
|
|
Pension Benefits |
|
Postretirement Benefits |
|
||||||||
|
(in thousands) |
|
2016 |
|
2015 |
|
2016 |
|
2015 |
|
||||
|
|
|
|
|
|
|
|
|
|
|
|
|
|
|
|
Other noncurrent assets |
|
$ |
5,607 |
|
$ |
5,481 |
|
$ |
- |
|
$ |
- |
|
|
Accrued compensation and benefits |
|
|
(7,149) |
|
|
(13,419) |
|
|
(784) |
|
|
(844) |
|
|
Accrued pension and postretirement benefits |
|
|
(115,867) |
|
|
(100,314) |
|
|
(19,480) |
|
|
(19,235) |
|
|
Net amount recognized |
|
$ |
(117,409) |
|
$ |
(108,252) |
|
$ |
(20,264) |
|
$ |
(20,079) |
|
The amounts in accumulated other comprehensive income (loss) on the consolidated balance sheets that have not yet been recognized as components of net periodic benefit cost were as follows:
|
|
|
Pension Benefits |
|
Postretirement Benefits |
|
||||||||||||||
|
|
|
Year ended December 31, |
|
Year ended December 31, |
|
||||||||||||||
|
(in thousands) |
|
2016 |
|
2015 |
|
2014 |
|
2016 |
|
2015 |
|
2014 |
|
||||||
|
|
|
|
|
|
|
|
|
|
|
|
|
|
|
|
|
|
|
|
|
|
Net actuarial (gain) loss at beginning of year |
|
$ |
18,374 |
|
$ |
19,878 |
|
$ |
(7,892) |
|
$ |
(8,840) |
|
$ |
(7,270) |
|
$ |
(3,269) |
|
|
Current year actuarial (gain) loss |
|
|
18,425 |
|
|
17,835 |
|
|
28,116 |
|
|
(573) |
|
|
(2,228) |
|
|
(2,484) |
|
|
Amortization of actuarial (gain) loss |
|
|
(485) |
|
|
(1,152) |
|
|
(34) |
|
|
912 |
|
|
490 |
|
|
195 |
|
|
Curtailment impact |
|
|
- |
|
|
(19,146) |
|
|
- |
|
|
- |
|
|
- |
|
|
- |
|
|
Settlement impact |
|
|
(1,124) |
|
|
- |
|
|
- |
|
|
- |
|
|
- |
|
|
- |
|
|
Prior service cost (credit) |
|
|
- |
|
|
1,331 |
|
|
- |
|
|
283 |
|
|
- |
|
|
(1,712) |
|
|
Amortization of prior service cost (credit) |
|
|
(175) |
|
|
(22) |
|
|
- |
|
|
163 |
|
|
168 |
|
|
- |
|
|
Foreign currency translation |
|
|
(1,279) |
|
|
(350) |
|
|
(312) |
|
|
- |
|
|
- |
|
|
- |
|
|
Net actuarial (gain) loss at end of year |
|
$ |
33,736 |
|
$ |
18,374 |
|
$ |
19,878 |
|
$ |
(8,055) |
|
$ |
(8,840) |
|
$ |
(7,270) |
|
The expected prior service cost (credit) that will be amortized from accumulated other comprehensive income (loss) into net periodic benefit cost in the next fiscal year is a cost of $0.2 million for the pension plans and a credit of $0.2 million for the postretirement plans. The expected actuarial (gain) loss that will be amortized from accumulated other comprehensive income (loss) into net periodic benefit cost in the next fiscal year is a loss of $0.2 million for the pension plans and a gain of $0.7 million for the postretirement plans.
Components of net periodic benefit cost were as follows:
|
|
|
Pension Benefits |
|
Postretirement Benefits |
|
||||||||
|
|
|
Year ended December 31, |
|
||||||||||
|
(in thousands) |
|
2016 |
|
2015 |
|
2016 |
|
2015 |
|
||||
|
|
|
|
|
|
|
|
|
|
|
|
|
|
|
|
Components of net periodic benefit cost |
|
|
|
|
|
|
|
|
|
|
|
|
|
|
Service cost |
|
$ |
9,763 |
|
$ |
15,683 |
|
$ |
888 |
|
$ |
1,060 |
|
|
Interest cost |
|
|
12,356 |
|
|
12,338 |
|
|
779 |
|
|
787 |
|
|
Expected return on plan assets |
|
|
(12,189) |
|
|
(11,372) |
|
|
- |
|
|
- |
|
|
Curtailment Expense (Income) |
|
|
- |
|
|
(2,421) |
|
|
- |
|
|
- |
|
|
Settlement Expense (Income) |
|
|
1,148 |
|
|
- |
|
|
- |
|
|
- |
|
|
Amortization of net (gain) loss |
|
|
471 |
|
|
1,152 |
|
|
(912) |
|
|
(490) |
|
|
Amortization of prior service cost (credit) |
|
|
175 |
|
|
22 |
|
|
(163) |
|
|
(168) |
|
|
Net periodic benefit cost |
|
$ |
11,724 |
|
$ |
15,402 |
|
$ |
592 |
|
$ |
1,189 |
|
The weighted average assumptions used to determine future benefit obligations benefit cost were as follows:
|
|
|
Pension Benefits |
|
Postretirement Benefits |
|
||||
|
|
|
2016 |
|
2015 |
|
2016 |
|
2015 |
|
|
Weighted-average assumptions used to determine benefit obligations at December 31 |
|
|
|
|
|
|
|
|
|
|
Discount rate |
|
4.17% |
|
4.16% |
|
4.08% |
|
4.30% |
|
|
Rate of compensation increase |
|
4.02% |
|
4.07% |
|
N/A |
|
N/A |
|
F-31
The weighted average assumptions used to determine net periodic benefit cost were as follows:
|
|
|
Pension Benefits |
|
Postretirement Benefits |
|
||||||||
|
|
|
2016 |
|
2015 |
|
2014 |
|
2016 |
|
2015 |
|
2014 |
|
|
Weighted-average assumptions used to determine net cost for years ended December 31 |
|
|
|
|
|
|
|
|
|
|
|
|
|
|
Discount rate |
|
4.16% |
|
3.92% |
|
4.73% |
|
4.30% |
|
3.90% |
|
4.80% |
|
|
Expected long-term rate of return on plan assets |
|
6.23% |
|
6.15% |
|
6.72% |
|
N/A |
|
N/A |
|
N/A |
|
|
Rate of compensation increase |
|
4.07% |
|
4.05% |
|
4.05% |
|
N/A |
|
N/A |
|
N/A |
|
The assumed healthcare cost trend rates used to determine benefit obligations as of December 31 and net cost for the year ended December 31 were as follows:
|
|
|
Postretirement Benefits |
|
||||
|
|
|
Medical and Prescription Drug |
|
||||
|
|
|
2016 |
|
2015 |
|
2014 |
|
|
|
|
|
|
|
|
|
|
|
Healthcare cost trend rate assumed for next year |
|
5.50%/9.00% |
|
5.75/10.00% |
|
8.00% |
|
|
Rate that the cost trend rate is assumed to decline |
|
4.50% |
|
4.50% |
|
5.00% |
|
|
Year that the rate reaches the ultimate trend rate |
|
2024 |
|
2024 |
|
2021 |
|
Assumed healthcare cost trend rates have a significant effect on the amounts reported for the healthcare plans. A one-percentage-point change in assumed healthcare cost trend rates would have the following effects:
|
|
|
2016 |
|
2015 |
|
||||||||
|
|
|
One-Percentage |
|
One-Percentage |
|
One-Percentage |
|
One-Percentage |
|
||||
|
(in thousands) |
|
Point Increase |
|
Point Decrease |
|
Point Increase |
|
Point Decrease |
|
||||
|
|
|
|
|
|
|
|
|
|
|
|
|
|
|
|
Effect on total of service and interest cost |
|
$ |
104 |
|
$ |
(91) |
|
$ |
125 |
|
$ |
(110) |
|
|
Effect on postretirement benefit obligation |
|
|
894 |
|
|
(796) |
|
|
1,054 |
|
|
(941) |
|
Plan Assets
Pension assets by major category of plan assets and the type of fair value measurement as of December 31, 2016 were as follows:
|
|
|
Pension Benefits – Plan Assets |
|
||||||||||
|
|
|
|
|
|
Quoted Prices in |
|
Significant |
|
Significant |
|
|||
|
|
|
|
|
|
Active Markets for |
|
Observable |
|
Unobservable |
|
|||
|
|
|
|
|
|
Identical Assets |
|
Inputs |
|
Inputs |
|
|||
|
(in thousands) |
|
Total |
|
(Level 1) |
|
(Level 2) |
|
(Level 3) |
|
||||
|
Asset category |
|
|
|
|
|
|
|
|
|
|
|
|
|
|
Individual securities |
|
|
|
|
|
|
|
|
|
|
|
|
|
|
Fixed income |
|
$ |
1,628 |
|
$ |
- |
|
$ |
1,628 |
|
$ |
- |
|
|
Commingled funds |
|
|
|
|
|
|
|
|
|
|
|
|
|
|
Measured at net asset value |
|
|
204,801 |
|
|
- |
|
|
- |
|
|
- |
|
|
|
|
$ |
206,429 |
|
$ |
- |
|
$ |
1,628 |
|
$ |
- |
|
Pension assets by major category of plan assets and the type of fair value measurement as of December 31, 2015 were as follows:
|
|
|
Pension Benefits – Plan Assets |
|
||||||||||
|
|
|
|
|
|
Quoted Prices in |
|
Significant |
|
Significant |
|
|||
|
|
|
|
|
|
Active Markets for |
|
Observable |
|
Unobservable |
|
|||
|
|
|
|
|
|
Identical Assets |
|
Inputs |
|
Inputs |
|
|||
|
(dollars in thousands) |
|
Total |
|
(Level 1) |
|
(Level 2) |
|
(Level 3) |
|
||||
|
|
|
|
|
|
|
|
|
|
|
|
|
|
|
|
Asset category |
|
|
|
|
|
|
|
|
|
|
|
|
|
|
Individual securities |
|
|
|
|
|
|
|
|
|
|
|
|
|
F-32
|
Fixed income |
|
$ |
1,520 |
|
$ |
- |
|
$ |
1,520 |
|
$ |
- |
|
|
Commingled funds |
|
|
|
|
|
- |
|
|
|
|
|
|
|
|
Measured at net asset value |
|
|
199,977 |
|
|
- |
|
|
- |
|
|
- |
|
|
|
|
$ |
201,497 |
|
$ |
- |
|
$ |
1,520 |
|
$ |
- |
|
Pension assets include fixed income securities and commingled funds. Fixed income securities are valued at daily closing prices or institutional mid-evaluation prices provided by independent industry-recognized pricing sources. Commingled funds are not traded in active markets with quoted prices and as a result, are valued using the net asset values provided by the administrator of the fund. The investments underlying the net asset values are based on quoted prices traded in active markets. In accordance with ASU 2015-07, "Fair Value Measurement: Disclosures for Investments in Certain Entities that Calculate Net Asset Value per Share (or Its Equivalent)", the Company has excluded these investments from the fair value hierarchy.
The Company's investment strategy is to optimize investment returns through a diversified portfolio of investments, taking into consideration underlying plan liabilities and asset volatility. Asset allocations are based on the underlying liability structure and local regulations. All retirement asset allocations are reviewed periodically to ensure the allocation meets the needs of the liability structure.
Master trusts were established to hold the assets of the Company's U.S. defined benefit plans. During the years ended December 31, 2016 and 2015, the U.S. defined benefit plan asset allocation of these trusts targeted a return-seeking investment allocation of 64% to 76% and a liability-hedging investment allocation of 24% to 36%. Return-seeking investments include equities, real estate, high yield bonds and other instruments. Liability-hedging investments include assets such as corporate and government fixed income securities.
The Company's future expected blended long-term rate of return on plan assets of 5.77% is determined based on long-term historical performance of plan assets, current asset allocation, and projected long-term rates of return.
Estimated Contributions
The Company expects to make pension contributions of approximately $20.0 million during 2017 based on current assumptions as of December 31, 2016.
Estimated Future Retirement Benefit Payments
The following retirement benefit payments, which reflect expected future service, are expected to be paid as follows:
|
|
|
Pension |
|
Postretirement |
|
||
|
(in thousands) |
|
Benefits |
|
Benefits |
|
||
|
Year ending December 31, |
|
|
|
|
|
|
|
|
2017 |
|
$ |
22,696 |
|
$ |
784 |
|
|
2018 |
|
|
30,294 |
|
|
990 |
|
|
2019 |
|
|
19,283 |
|
|
1,140 |
|
|
2020 |
|
|
19,594 |
|
|
1,317 |
|
|
2021 |
|
|
23,300 |
|
|
1,507 |
|
|
Thereafter |
|
|
100,017 |
|
|
9,397 |
|
|
|
|
$ |
215,184 |
|
$ |
15,135 |
|
The estimated future retirement benefit payments noted above are estimates and could change significantly based on differences between actuarial assumptions and actual events and decisions related to lump sum distribution options that are available to participants in certain plans.
International Plans
Pension coverage for employees of the Company's international subsidiaries is provided, to the extent deemed appropriate, through separate defined benefit plans. The international pension plans are included in the tables above. As of December 31, 2016 and 2015, the defined benefit plans had total projected benefit obligations of $54.4 million and
F-33
$53.5 million, respectively, and fair values of plan assets of $47.6 million and $45.4 million, respectively. The majority of the plan assets are invested in equity securities and corporate bonds. The pension expense related to these plans was $1.0 million, $0.9 million and $1.2 million for the years ended December 31, 2016, 2015 and 2014, respectively. The expected actuarial loss that will be amortized from accumulated other comprehensive income (loss) into net periodic benefit cost in the next fiscal year is $0.1 million.
Defined Contribution Plans
The Company sponsors a number of defined contribution plans. Contributions are determined under various formulas. Cash contributions related to these plans amounted to $13.0 million, $9.4 million and $8.8 million for the years ended December 31, 2016, 2015 and 2014, respectively.
13. Income Taxes
The components of income before income taxes were as follows:
|
|
|
Year ended December 31, |
|
|||||||
|
(in thousands) |
|
2016 |
|
2015 |
|
2014 |
|
|||
|
|
|
|
|
|
|
|
|
|
|
|
|
Domestic operations |
|
$ |
63,867 |
|
$ |
4,784 |
|
$ |
2,814 |
|
|
Foreign operations |
|
|
25,355 |
|
|
27,366 |
|
|
39,252 |
|
|
Income before income taxes |
|
$ |
89,222 |
|
$ |
32,150 |
|
$ |
42,066 |
|
The following table represents a reconciliation of income taxes at the 35% federal statutory income tax rate to income tax expense as reported:
|
|
|
Year ended December 31, |
|
|||||||
|
(in thousands) |
|
2016 |
|
2015 |
|
2014 |
|
|||
|
|
|
|
|
|
|
|
|
|
|
|
|
Income tax expense computed at federal statutory income tax rate |
|
$ |
31,229 |
|
$ |
11,252 |
|
$ |
14,723 |
|
|
Foreign taxes, net of credits |
|
|
(1,804) |
|
|
418 |
|
|
2,835 |
|
|
Net adjustments for uncertain tax positions |
|
|
706 |
|
|
4,731 |
|
|
525 |
|
|
State and local taxes |
|
|
(525) |
|
|
(1,108) |
|
|
(1,659) |
|
|
Equity appreciation rights |
|
|
372 |
|
|
693 |
|
|
- |
|
|
Transaction costs |
|
|
3,078 |
|
|
414 |
|
|
- |
|
|
Indemnified taxes |
|
|
1,594 |
|
|
(1,106) |
|
|
- |
|
|
Fair value adjustment for common stock warrants |
|
|
3,029 |
|
|
10,853 |
|
|
268 |
|
|
Valuation allowance |
|
|
955 |
|
|
7,872 |
|
|
2,476 |
|
|
Deferred charge |
|
|
1,009 |
|
|
807 |
|
|
(1,491) |
|
|
Tax credits |
|
|
(704) |
|
|
(7,003) |
|
|
(2,176) |
|
|
Miscellaneous other, net |
|
|
768 |
|
|
171 |
|
|
1,199 |
|
|
|
|
|
|
|
|
|
|
|
|
|
|
Income tax expense as reported |
|
$ |
39,707 |
|
$ |
27,994 |
|
$ |
16,700 |
|
|
Effective income tax rate |
|
|
44.5 |
% |
|
87.1 |
% |
|
39.7 |
% |
F-34
The Company's unrecognized tax benefits represent tax positions for which reserves have been established. The following table represents a reconciliation of the activity related to the unrecognized tax benefits, excluding accrued interest and penalties:
|
(in thousands) |
|
2016 |
|
2015 |
|
2014 |
|
|||
|
|
|
|
|
|
|
|
|
|
|
|
|
Unrecognized tax benefits at beginning of year |
|
$ |
13,120 |
|
$ |
8,845 |
|
$ |
4,451 |
|
|
Gross additions - prior year tax positions |
|
|
1,960 |
|
|
3,045 |
|
|
- |
|
|
Gross additions - current year tax positions |
|
|
747 |
|
|
1,605 |
|
|
4,798 |
|
|
Gross reductions - prior year tax positions |
|
|
(4,457) |
|
|
(333) |
|
|
(357) |
|
|
Impact of change in foreign exchange rates |
|
|
(23) |
|
|
(42) |
|
|
(47) |
|
|
Unrecognized tax benefits at end of year |
|
$ |
11,347 |
|
$ |
13,120 |
|
$ |
8,845 |
|
As of December 31, 2016, 2015 and 2014, the unrecognized tax benefits of $11.3 million, $13.1 million and $8.8 million, respectively, would affect the Company's future effective tax rate if recognized. The Company does not anticipate a material change in unrecognized tax benefits within the next 12 months.
As of December 31, 2016, 2015 and 2014, the Company had unrecognized tax benefits included in the amounts above of $5.9 million, $4.2 million and $3.7 million, respectively, related to periods prior to the Company's acquisition of Acushnet Company and as such, are indemnified by Beam.
As of December 31, 2016, 2015 and 2014, the Company recognized a liability of $2.3 million, $1.9 million and $1.5 million, respectively for interest and penalties, of which $1.8 million, $1.6 million and $1.4 million is indemnified by Beam.
Prior to the Company's acquisition of Acushnet Company, Acushnet Company or its subsidiaries filed certain combined tax returns with Beam. Those and other subsidiaries' income tax returns are periodically examined by various tax authorities. Beam is responsible for managing United States tax audits related to periods prior to July 29, 2011. Acushnet Company is obligated to support these audits and is responsible for managing all non-U.S. audits. As of December 31, 2016, the U.S. Internal Revenue Service’s examination of the 2010 and July 29, 2011 Acushnet Company federal income tax returns that were filed as part of the Beam consolidated federal income tax returns has concluded.
The Company and certain subsidiaries have tax years that remain open and are subject to examination by tax authorities in the following major taxing jurisdictions: United States for years after July 31, 2011, Canada for years after 2011, Japan for years after 2011, Korea for years after 2010, and the United Kingdom for years after 2014. The Company files income tax returns on a combined, unitary, or stand-alone basis in multiple state and local jurisdictions, which generally have statute of limitations from three to four years. Various states and local income tax returns are currently in the process of examination. These examinations are unlikely to result in any significant changes to the amounts of unrecognized tax benefits on the consolidated balance sheet as of December 31, 2016 within the next 12 months.
The Company's income tax expense includes tax expense of $2.2 million and $3.0 million for the years ended December 31, 2016 and 2015, respectively, and a tax benefit of $0.3 million for the year ended December 31, 2014 related to the tax obligations indemnified by Beam. There is an offsetting amount included in other (income) expense, net for the related adjustment to the Beam indemnification asset, resulting in no effect on net income.
F-35
Income tax expense was as follows:
|
|
|
Year ended December 31, |
|
|||||||
|
(in thousands) |
|
2016 |
|
2015 |
|
2014 |
|
|||
|
Current expense (benefit) |
|
|
|
|
|
|
|
|
|
|
|
United States |
|
$ |
3,702 |
|
$ |
5,455 |
|
$ |
(1,125) |
|
|
Foreign |
|
|
28,156 |
|
|
20,351 |
|
|
29,118 |
|
|
Current income tax expense (benefit) |
|
|
31,858 |
|
|
25,806 |
|
|
27,993 |
|
|
Deferred expense (benefit) |
|
|
|
|
|
|
|
|
|
|
|
United States |
|
|
9,489 |
|
|
(152) |
|
|
(10,425) |
|
|
Foreign |
|
|
(1,640) |
|
|
2,340 |
|
|
(868) |
|
|
Deferred income tax expense (benefit) |
|
|
7,849 |
|
|
2,188 |
|
|
(11,293) |
|
|
Total income tax expense |
|
$ |
39,707 |
|
$ |
27,994 |
|
$ |
16,700 |
|
The components of net deferred tax assets (liabilities) were as follows:
|
|
|
December 31, |
|
||||
|
(in thousands) |
|
2016 |
|
2015 |
|
||
|
Deferred tax assets |
|
|
|
|
|
|
|
|
Compensation and benefits |
|
$ |
22,053 |
|
$ |
24,736 |
|
|
Share-based compensation |
|
|
5,474 |
|
|
- |
|
|
Equity appreciation rights |
|
|
57,146 |
|
|
62,679 |
|
|
Pension and other postretirement benefits |
|
|
45,926 |
|
|
39,268 |
|
|
Inventories |
|
|
9,120 |
|
|
7,011 |
|
|
Accounts receivable |
|
|
2,942 |
|
|
3,790 |
|
|
Customer sales incentives |
|
|
3,254 |
|
|
2,761 |
|
|
Transaction costs |
|
|
3,157 |
|
|
3,601 |
|
|
Other reserves |
|
|
5,764 |
|
|
6,056 |
|
|
Interest |
|
|
2,260 |
|
|
5,852 |
|
|
Miscellaneous |
|
|
1,076 |
|
|
160 |
|
|
Net operating loss and other tax carryforwards |
|
|
55,936 |
|
|
47,557 |
|
|
Gross deferred tax assets |
|
|
214,108 |
|
|
203,471 |
|
|
Valuation allowance |
|
|
(21,726) |
|
|
(20,771) |
|
|
Total deferred tax assets |
|
|
192,382 |
|
|
182,700 |
|
|
Deferred tax liabilities |
|
|
|
|
|
|
|
|
Property, plant and equipment |
|
|
(17,496) |
|
|
(15,043) |
|
|
Identifiable intangible assets |
|
|
(46,701) |
|
|
(38,075) |
|
|
Foreign exchange derivative instruments |
|
|
(4,076) |
|
|
(3,600) |
|
|
Miscellaneous |
|
|
(1,145) |
|
|
(829) |
|
|
Total deferred tax liabilities |
|
|
(69,418) |
|
|
(57,547) |
|
|
Net deferred tax asset |
|
$ |
122,964 |
|
$ |
125,153 |
|
Under U.S. tax law and regulations, certain changes in the ownership of the Company’s shares can limit the annual utilization of tax attributes (tax loss and tax credit carryforwards) that were generated prior to such ownership changes. The annual limitation could affect the realizability of the Company’s deferred tax assets recorded in the financial statement for its tax credit carryforwards because the carryforward periods have a finite duration. The Initial Public Offering, and associated share transfers, resulted in significant changes in the composition of the ownership of the Company’s shares. Based on its analysis of the change of ownership tax rules in conjunction with the estimated amount and source of its future earnings and related tax profile, the Company believes its existing tax attributes will be utilized prior to their expiration.
As of December 31, 2016 and 2015, the Company had state net operating loss (“NOL”) carryforwards of $94.2 million and $103.0 million, respectively. These NOL carryforwards expire between 2017 and 2035. As of December 31, 2016 and 2015, the Company had foreign tax credit carryforwards of $46.0 million and $37.9 million, respectively. These foreign tax credits will begin to expire in 2022.
F-36
Changes in the valuation allowance for deferred tax assets were as follows:
|
|
|
Year ended December 31, |
|||||||
|
(in thousands) |
|
2016 |
|
2015 |
|
2014 |
|||
|
|
|
|
|
|
|
|
|
|
|
|
Valuation allowance at beginning of year |
|
$ |
20,771 |
|
$ |
13,850 |
|
$ |
10,510 |
|
Increases (decreases) recorded to income tax provision |
|
|
955 |
|
|
6,921 |
|
|
3,340 |
|
Valuation allowance at end of year |
|
$ |
21,726 |
|
$ |
20,771 |
|
$ |
13,850 |
|
|
|
|
|
|
|
|
|
|
|
The changes in the valuation allowance were related to the increase in the state deferred tax assets and deferred tax assets in the Company’s Hong Kong subsidiary that the Company has determined are not more-likely-than-not realizable. In determining the realizability of these assets, the Company considered numerous factors including historical profitability, the character and estimated future taxable income, prudent and feasible tax planning strategies, and the industry in which it operates. The utilization of the Company's net U.S. state and Hong Kong deferred tax assets is dependent on future taxable earnings, which cannot be projected with certainty at this time.
The Company has determined that its undistributed earnings for most of its foreign subsidiaries are not permanently reinvested and has provided deferred income taxes in connection with the anticipated repatriation.
14. Interest Expense and Other (Income) Expense, Net
The components of interest expense, net were as follows:
|
|
|
Year ended December 31, |
|
|||||||
|
(in thousands) |
|
2016 |
|
2015 |
|
2014 |
|
|||
|
|
|
|
|
|
|
|
|
|
|
|
|
Interest expense - related party |
|
$ |
28,146 |
|
$ |
35,420 |
|
$ |
37,960 |
|
|
Interest expense - third party |
|
|
23,113 |
|
|
26,567 |
|
|
26,493 |
|
|
Interest income -third party |
|
|
(1,351) |
|
|
(1,693) |
|
|
(924) |
|
|
Total interest expense, net |
|
$ |
49,908 |
|
$ |
60,294 |
|
$ |
63,529 |
|
The components of other (income) expense, net were as follows:
|
|
|
Year ended December 31, |
|
|||||||
|
(in thousands) |
|
2016 |
|
2015 |
|
2014 |
|
|||
|
|
|
|
|
|
|
|
|
|
|
|
|
(Gain) loss on fair value of common stock warrants |
|
$ |
6,112 |
|
$ |
28,364 |
|
$ |
(1,887) |
|
|
Indemnification (gains) losses |
|
|
(2,174) |
|
|
(3,007) |
|
|
1,386 |
|
|
Other gains |
|
|
(2,232) |
|
|
(218) |
|
|
(847) |
|
|
Total other (income) expense, net |
|
$ |
1,706 |
|
$ |
25,139 |
|
$ |
(1,348) |
|
15. Redeemable Convertible Preferred Stock
Prior to the initial public offering, the Company had outstanding 1,838,027 shares of $0.001 par value Series A preferred stock. Given that certain redemption features of the Series A preferred stock were not solely within the control of the Company, the Series A preferred stock was classified outside of stockholders' equity.
On May 6, 2016, the Company and each of the holders of the Series A preferred stock entered into an agreement requiring the mandatory conversion of the shares of the Series A preferred stock into fully paid and nonassessable shares of the Company’s common stock. This agreement was amended on September 5, 2016 to provide for the automatic conversion of a portion of the outstanding Series A preferred stock in connection with the sale of shares of the Company’s common stock by the holders of the Series A preferred stock to Magnus. This automatic conversion of all outstanding Series A preferred stock occurred prior to the closing of the Company’s initial public offering. Upon conversion, all accrued but unpaid dividends on the shares of the Series A preferred stock were paid to each holder of the shares of the Series A preferred stock.
Dividends
F-37
The holders of the Series A preferred stock were entitled to receive cumulative dividends at a rate of 7.5% per year of the Original Issue Price (as defined below) when, as and if declared by the board of directors. The dividends accrued on a daily basis and were payable semi-annually. The Original Issue Price is $100 per share of Series A preferred stock. The Company declared and paid dividends to the holders of the Series A preferred stock of $17.3 million, $13.7 million and $13.8 million during the years ended December 31, 2016, 2015 and 2014, respectively. Cumulative undeclared dividends as of December 31, 2015 were $5.8 million.
Reissuance
Shares of Series A preferred stock that are redeemed or converted were canceled and retired and cannot be reissued by the Company.
16. Common Stock
As of December 31, 2016 and 2015, the Company's certificate of incorporation, as amended and restated, authorized the Company to issue 500,000,000 shares of $0.001 par value common stock and 78,193,494 shares of $0.001 par value common stock, respectively. Each share of common stock entitles the holder to one vote on all matters submitted to a vote of the Company's shareholders. Common shareholders are entitled to receive dividends whenever funds are legally available and when declared by the board of directors, subject to the prior rights of holders of all classes of stock outstanding. During the first quarter of 2017, the board of directors declared a dividend of $0.12 per share to shareholders on record as of April 5, 2017 and payable on April 19, 2017.
As of December 31, 2016, the Company had reserved 6,525,000 shares of common stock for issuance under the Acushnet Holdings Corp. 2015 Omnibus Incentive Plan. As of December 31, 2015, the Company had reserved 28,827,531 shares of common stock for the conversion of outstanding shares of Series A preferred stock (Note 15), the exercise of outstanding stock options and number of shares remaining available for grant under the Company's 2011 Equity Incentive Plan (Note 17) and the exercise of common stock warrants (Note 9).
17. Equity Incentive Plans
Restricted Stock and Restricted Stock Units
On January 22, 2016, the Company’s board of directors adopted the Acushnet Holdings Corp. 2015
Omnibus Incentive Plan (“2015 Plan”) pursuant to which the Company may grant stock options, stock appreciation rights, restricted shares of common stock, restricted stock units, and other stock-based and cash-based awards to members of the board of directors, officers, employees, consultants and advisors of the Company. The 2015 Plan was initially administered by the Company’s board of directors and as of the Company’s initial public offering, is administered by the compensation committee (the board or compensation committee, as applicable) (the “Administrator”). The Administrator has the authority to establish the terms and conditions of any award issued or granted under the 2015 Plan. As of December 31, 2016, a total of 4,501,257 authorized shares of the Company’s common stock remain available for issuance under the 2015 Plan.
A summary of the Company’s restricted and performance stock units as of December 31, 2016 and changes during the year then ended is presented below:
|
|
|
|
|
Weighted- |
||
|
|
|
Number |
|
Average |
||
|
|
|
of |
|
Fair |
||
|
|
|
RSUs and PSUs |
|
Value |
||
|
|
|
|
|
|
|
|
|
Outstanding at December 31, 2015 |
|
|
- |
|
$ |
- |
|
Granted |
|
|
2,459,166 |
|
|
20.40 |
|
Outstanding at December 31, 2016 |
|
|
2,459,166 |
|
$ |
20.40 |
On June 15, 2016, the Company’s board of directors, in accordance with the 2015 Plan, approved a grant of multi‑year restricted stock units (“RSUs”) and performance stock units (“PSUs”) to certain key members of management. The initial fair value of the grant was estimated at $45.8 million.
F-38
On August 9, 2016, the Company’s board of directors approved an additional grant of multi-year RSUs and PSUs to certain key members of management. The initial fair value of the grants was estimated at $3.8 million.
On October 28, 2016, the Company’s board of directors approved an additional grant of multi-year RSUs and PSUs in connection with the IPO. The initial fair value of the grant was $0.6 million.
Each of the grants were made 50% in RSUs and 50% in PSUs. One‑third of the RSUs vest on January 1 of 2017, 2018 and 2019, subject to the employee’s continued employment with the Company, and the PSUs cliff‑vest on December 31, 2018, subject to the employee’s continued employment with the Company and the Company’s level of achievement of the applicable cumulative Adjusted EBITDA performance metrics (as defined in the applicable award agreements) measured over the three-year performance period. Each PSU reflects the right to receive between 0% and 200% of the target number of shares based on the actual three-year cumulative Adjusted EBITDA. The determination of the target value gave consideration to executive performance, potential future contributions and peer group analysis.
The RSUs and PSUs contain the right, but not the obligation, for the Company to repurchase up to 100% of the common stock that was issued in settlement of vested RSUs and PSUs, following the termination of the award holder. The repurchase right is at the sole discretion of the Company and can be exercised during the 60 day period following the first and second anniversary of any such termination of employment, provided that (i) no shares of common stock may be subject to repurchase unless they have been held by the award holder for at least six months and (ii) no repurchase right may be exercised upon or following the Company’s initial public offering.
To date, the Company has not repurchased any shares issued in respect of restricted stock units or performance stock units and no longer has the right to make any such repurchase. As of December 31, 2016, no RSUs or PSUs had vested. Remaining unrecognized compensation expense for non‑vested RSUs and non‑vested PSUs granted was $16.7 million and $14.8 million, respectively, as of December 31, 2016 and is expected to be recognized over the related weighted average period of 2.0 years.
The compensation expense recorded for the year ended December 31, 2016 related to the PSUs was based on the Company’s best estimate of the three-year cumulative Adjusted EBITDA forecast as of December 31, 2016. The Company will reassess the estimate of the three‑year cumulative Adjusted EBITDA forecast at the end of each reporting period. The Company recorded compensation expense for the RSUs and PSUs of $8.4 million and $6.1 million, respectively, during the year ended December 31, 2016.
Stock Options
Prior to 2013, the Company issued options to purchase 1,328,148 shares of common stock with a weighted-average exercise price of $9.90 per share to an executive officer as replacement awards in connection with a business combination. These awards were fully vested at the time of issuance.
The following table summarizes the Company's stock option activity since December 31, 2014:
|
|
|
|
|
Weighted- |
|
Weighted- |
|
|
||||
|
|
|
Number |
|
Average |
|
Average |
|
Aggregate |
||||
|
|
|
of |
|
Exercise |
|
Remaining |
|
Intrinsic |
||||
|
|
|
Shares |
|
Price |
|
Contractual Term |
|
Value |
||||
|
|
|
|
|
|
|
|
|
|
|
|
|
|
|
Outstanding at December 31, 2014 |
|
|
450,081 |
|
$ |
8.34 |
|
|
1.9 years |
|
$ |
(4) |
|
Exercised |
|
|
(450,081) |
|
|
8.34 |
|
|
|
|
|
2,301 |
|
Outstanding at December 31, 2015 |
|
|
- |
|
$ |
- |
|
|
|
|
$ |
- |
During the years ended December 31, 2016, 2015 and 2014 the Company did not grant any stock options. As a result of a modification of the stock options, the Company recorded share-based compensation expense of $5.8 million and $2.0 million related to outstanding stock options during the years ended December 31, 2015 and 2014, respectively.
Equity Appreciation Rights
Effective January 1, 2012, the Company's board of directors adopted the equity appreciation rights plan (“EAR Plan”) in order to compensate certain key employees. Awards under the plan vested, subject to continued service by the
F-39
award recipient, as follows: 40% of award based on the recipient's continued service with the Company through December 31, 2015, 30% of the award based on the Company's achievement of a specified adjusted EBITDA targets, and 30% of the award based on the Company's achievement of specified internal rates of return. Prior to the completion of a qualified public offering, vested awards under the EAR Plan were payable in cash upon the first to occur of (i) a qualifying termination, (ii) a sale of the Company or (iii) the expiration date of the award. In the event that the Company completed a qualified initial public offering, the Company could determine at its discretion to settle up to 50% of the amount payable under each award in shares of the Company's common stock.
During 2012, the Company granted an aggregate of 8,901,000 EARs with a weighted-average strike price of $11.12 to certain key employees. There was no intrinsic value at the date of grant. Each EAR vested over a four year period as follows: 40% of award based on the recipient's continued service with the Company through December 31, 2015, 30% of the award based on the Company's achievement of a specified adjusted EBITDA target and 30% of the award based on the Company's achievement of specified internal rates of return.
During 2015, the Company granted an aggregate of 279,000 EARs with a weighted-average strike price of $20.53 to certain key employees. There was no intrinsic value at the date of grant. Each EAR vested retroactively based on the effective date of January 1, 2012 and over the remaining term as follows: 40% of award based on the recipient's continued service with the Company through December 31, 2015, 30% of the award based on the Company's achievement of a specified adjusted EBITDA target and 30% of the award based on the Company's achievement of specified internal rates of return.
The following table summarizes the Company's EAR activity since December 31, 2014:
|
|
|
|
|
Weighted- |
|
Weighted- |
|
|
||||
|
|
|
Number |
|
Average |
|
Average |
|
Aggregate |
||||
|
|
|
of |
|
Exercise |
|
Remaining |
|
Intrinsic |
||||
|
|
|
Awards |
|
Price |
|
Contractual Term |
|
Value |
||||
|
|
|
|
|
|
|
|
|
|
|
|
|
|
|
Outstanding at December 31, 2014 |
|
|
8,901,000 |
|
$ |
11.12 |
|
|
2 years |
|
$ |
166,795 |
|
Granted |
|
|
279,000 |
|
|
20.53 |
|
|
|
|
|
- |
|
Outstanding at December 31, 2015 |
|
|
9,180,000 |
|
|
11.40 |
|
|
1 year |
|
|
171,712 |
|
Settled |
|
|
(1,566,000) |
|
|
11.12 |
|
|
|
|
|
- |
|
Outstanding at December 31, 2016 |
|
|
7,614,000 |
|
|
19.90 |
|
|
|
|
|
151,511 |
|
Vested at December 31, 2016 |
|
|
7,614,000 |
|
|
19.90 |
|
|
|
|
|
151,511 |
|
Awards exercisable at December 31, 2016 |
|
|
7,614,000 |
|
$ |
19.90 |
|
|
|
|
$ |
151,511 |
The EAR awards were re-measured using the intrinsic value method at each reporting period based on a projection of the Company's future common stock equivalent value. The common stock equivalent value was based on an estimate of the Company's EBITDA multiplied by a defined multiple, and divided by the expected number of common shares outstanding. The intrinsic value was the calculated common stock equivalent value per share compared to the per share exercise price. Effective October 17, 2014, the Company amended the EAR Plan such that (i) payments for vested awards resulting from a qualified termination of the award recipient are generally determined based on the Company's EBITDA for the fiscal year prior to such termination and (ii) payments for vested awards resulting from an expiration of the award are determined based on the greater of the Company's EBITDA for the year ended December 31, 2015, the Company's EBITDA for the year ending December 31, 2016, or the value of the Company's publicly-traded common stock for the three trading days following the initial public offering.
For the years ended December 31, 2016, 2015 and 2014, the Company recorded share-based compensation expense of $6.0 million, $45.8 million and $50.7 million, respectively, related to outstanding EARs. The liability related to the EAR Plan was $151.5 million as of December 31, 2016 and was recorded within accrued compensation and benefits on the consolidated balance sheet. The liability related to the EAR Plan was $169.6 million as of December 31, 2015, of which $24.2 million was recorded within accrued compensation and benefits and $145.4 million was recorded within other noncurrent liabilities on the consolidated balance sheet.
The allocation of share-based compensation expense attributed to RSUs, PSUs, EARs and stock options in the consolidated statement of operations was as follows:
|
|
|
Year ended December 31, |
|||||||
|
(in thousands) |
|
2016 |
|
2015 |
|
2014 |
|||
F-40
|
|
|
|
|
|
|
|
|
|
|
|
Cost of goods sold |
|
$ |
434 |
|
$ |
670 |
|
$ |
765 |
|
Selling, general and administrative expense |
|
|
18,622 |
|
|
48,377 |
|
|
49,631 |
|
Research and development |
|
|
1,485 |
|
|
2,556 |
|
|
2,294 |
|
Income before income taxes |
|
$ |
20,541 |
|
$ |
51,603 |
|
$ |
52,690 |
18. Accumulated Other Comprehensive Income (Loss), Net of Tax
Accumulated other comprehensive income (loss), net of tax consists of foreign currency translation adjustments, unrealized gains and losses from foreign exchange derivative instruments designated as cash flow hedges, unrealized gains and losses from available‑for‑sale securities and pension and other postretirement adjustments.
The components of and changes in accumulated other comprehensive income (loss), net of tax, were as follows:
|
|
|
Foreign |
|
Gains (Losses) on |
|
Gains (Losses) |
|
Pension and |
|
Accumulated |
|
|||||
|
|
|
Currency |
|
Foreign Exchange |
|
on Available- |
|
Other |
|
Other |
|
|||||
|
|
|
Translation |
|
Derivative |
|
for-Sale |
|
Postretirement |
|
Comprehensive |
|
|||||
|
(in thousands) |
|
Adjustments |
|
Instruments |
|
Securities |
|
Adjustments |
|
Loss |
|
|||||
|
|
|
|
|
|
|
|
|
|
|
|
|
|
|
|
|
|
|
Balances at December 31, 2014 |
|
$ |
(50,977) |
|
$ |
17,171 |
|
$ |
2,017 |
|
$ |
(9,269) |
|
$ |
(41,058) |
|
|
Other comprehensive income (loss) before reclassifications |
|
|
(19,042) |
|
|
18,800 |
|
|
(513) |
|
|
868 |
|
|
113 |
|
|
Amounts reclassified from accumulated other comprehensive loss |
|
|
- |
|
|
(26,805) |
|
|
- |
|
|
516 |
|
|
(26,289) |
|
|
Balances at December 31, 2015 |
|
$ |
(70,019) |
|
$ |
9,166 |
|
$ |
1,504 |
|
$ |
(7,885) |
|
$ |
(67,234) |
|
|
Other comprehensive income (loss) before reclassifications |
|
|
(14,656) |
|
|
6,563 |
|
|
32 |
|
|
(9,916) |
|
|
(17,977) |
|
|
Amounts reclassified from accumulated other comprehensive loss |
|
|
- |
|
|
(5,194) |
|
|
- |
|
|
(429) |
|
|
(5,623) |
|
|
Balances at December 31,2016 |
|
$ |
(84,675) |
|
$ |
10,535 |
|
$ |
1,536 |
|
$ |
(18,230) |
|
$ |
(90,834) |
|
19. Net Income per Common Share
The following is a computation of basic and diluted net income per common share attributable to Acushnet Holdings Corp. under the two‑class method:
|
|
|
Year ended |
|||||||
|
|
|
December 31, |
|||||||
|
(in thousands, except share and per share amounts) |
|
2016 |
|
2015 |
|
2014 |
|||
|
|
|
|
|
|
|
|
|
|
|
|
Net income (loss) attributable to Acushnet Holdings Corp. |
|
$ |
45,012 |
|
$ |
(966) |
|
$ |
21,557 |
|
Less: dividends earned by preferred shareholders |
|
|
(11,576) |
|
|
(13,785) |
|
|
(13,785) |
|
Less: allocation of undistributed earnings to preferred shareholders |
|
|
(10,247) |
|
|
- |
|
|
(3,866) |
|
Net income (loss) attributable to common stockholders - basic |
|
|
23,189 |
|
|
(14,751) |
|
|
3,906 |
|
Adjustments to net income for dilutive securities |
|
|
16,475 |
|
|
- |
|
|
- |
|
Net income (loss) attributable to common stockholders - diluted |
|
$ |
39,664 |
|
$ |
(14,751) |
|
$ |
3,906 |
|
|
|
|
|
|
|
|
|
|
|
|
Weighted average number of common shares: |
|
|
|
|
|
|
|
|
|
|
Basic |
|
|
31,247,643 |
|
|
19,939,293 |
|
|
16,716,825 |
|
Diluted |
|
|
64,323,742 |
|
|
19,939,293 |
|
|
16,716,825 |
|
Net income (loss) per common share attributable to Acushnet Holdings Corp.: |
|
|
|
|
|
|
|
|
|
|
Basic |
|
$ |
0.74 |
|
$ |
(0.74) |
|
$ |
0.23 |
|
Diluted |
|
$ |
0.62 |
|
$ |
(0.74) |
|
$ |
0.23 |
The Company’s potential dilutive securities for the year ended December 31, 2016 include RSUs and PSUs. For the years ended December 31, 2015 and 2014 the Company’s potential dilutive securities include Series A preferred stock, stock options, warrants to purchase common stock and convertible notes.
The following securities have been excluded from the calculation of diluted weighted‑average common shares outstanding as their impact was determined to be anti‑dilutive:
|
|
|
Year ended |
|||||||
|
|
|
December 31, |
|||||||
F-41
|
|
|
2016 |
|
2015 |
|
2014 |
|||
|
|
|
|
|
|
|
|
|
|
|
|
Series A preferred stock |
|
|
13,807,486 |
|
|
16,542,243 |
|
|
16,542,243 |
|
Stock options |
|
|
- |
|
|
1,089 |
|
|
- |
|
Warrants to purchase common stock |
|
|
1,807,171 |
|
|
4,891,887 |
|
|
- |
|
Convertible notes |
|
|
- |
|
|
32,624,820 |
|
|
32,624,820 |
20. Segment Information
The Company’s operating segments are based on how the Chief Operating Decision Maker (“CODM”) makes decisions about assessing performance and allocating resources. The Company has four reportable segments that are organized on the basis of product categories. These segments include Titleist golf balls, Titleist golf clubs, Titleist golf gear and FootJoy golf wear.
The CODM primarily evaluates performance using segment operating income. Segment operating income includes directly attributable expenses and certain shared costs of corporate administration that are allocated to the reportable segments, but excludes interest expense, net; EAR expense; gains and losses on the fair value of common stock warrants and other non‑operating gains and losses as the Company does not allocate these to the reportable segments. The CODM does not evaluate a measure of assets when assessing performance.
Results shown for the years ended December 31, 2016, 2015 and 2014 are not necessarily those which would be achieved if each segment was an unaffiliated business enterprise. There are no intersegment transactions.
Information by reportable segment and a reconciliation to reported amounts are as follows:
|
(in thousands) |
|
|
Year ended December 31, |
|||||||
|
|
|
|
2016 |
|
2015 |
|
2014 |
|||
|
Net sales |
|
|
|
|
|
|
|
|
|
|
|
Titleist golf balls |
|
|
$ |
513,899 |
|
$ |
535,465 |
|
$ |
543,843 |
|
Titleist golf clubs |
|
|
|
430,966 |
|
|
388,304 |
|
|
422,383 |
|
Titleist golf gear |
|
|
|
136,208 |
|
|
129,408 |
|
|
127,875 |
|
FootJoy golf wear |
|
|
|
433,061 |
|
|
418,852 |
|
|
421,632 |
|
Other |
|
|
|
58,141 |
|
|
30,929 |
|
|
21,877 |
|
Total net sales |
|
|
$ |
1,572,275 |
|
$ |
1,502,958 |
|
$ |
1,537,610 |
|
|
|
|
|
|
|
|
|
|
|
|
|
Segment operating income |
|
|
|
|
|
|
|
|
|
|
|
Titleist golf balls |
|
|
$ |
76,236 |
|
$ |
92,507 |
|
$ |
68,489 |
|
Titleist golf clubs |
|
|
|
50,500 |
|
|
33,593 |
|
|
45,845 |
|
Titleist golf gear |
|
|
|
12,119 |
|
|
12,170 |
|
|
16,485 |
|
FootJoy golf wear |
|
|
|
18,979 |
|
|
26,056 |
|
|
28,639 |
|
Other |
|
|
|
7,299 |
|
|
4,056 |
|
|
(1,759) |
|
Total segment operating income |
|
|
|
165,133 |
|
|
168,382 |
|
|
157,699 |
|
Reconciling items: |
|
|
|
|
|
|
|
|
|
|
|
Interest expense, net |
|
|
|
(49,908) |
|
|
(60,294) |
|
|
(63,529) |
|
EAR expense |
|
|
|
(6,047) |
|
|
(45,814) |
|
|
(50,713) |
|
Gain (loss) on fair value of common stock warrants |
|
|
|
(6,112) |
|
|
(28,364) |
|
|
1,887 |
|
Transaction fees |
|
|
|
(16,817) |
|
|
(2,141) |
|
|
(1,490) |
|
Other |
|
|
|
2,973 |
|
|
381 |
|
|
(1,788) |
|
Total income before income tax |
|
|
$ |
89,222 |
|
$ |
32,150 |
|
$ |
42,066 |
|
|
|
|
|
|
|
|
|
|
|
|
|
Depreciation and amortization |
|
|
|
|
|
|
|
|
|
|
|
Titleist golf balls |
|
|
$ |
26,104 |
|
$ |
26,962 |
|
$ |
27,726 |
|
Titleist golf clubs |
|
|
|
7,021 |
|
|
7,060 |
|
|
7,172 |
|
Titleist golf gear |
|
|
|
1,250 |
|
|
1,368 |
|
|
1,446 |
|
FootJoy golf wear |
|
|
|
5,759 |
|
|
5,540 |
|
|
5,948 |
|
Other |
|
|
|
700 |
|
|
772 |
|
|
867 |
|
Total depreciation and amortization |
|
|
$ |
40,834 |
|
$ |
41,702 |
|
$ |
43,159 |
F-42
Information as to the Company's operations in different geographical areas is presented below. Net sales are categorized based on the location in which the sale originates. Long-lived assets (property, plant and equipment) are categorized based on their location of domicile.
|
|
|
Year ended December 31, |
|||||||
|
(in thousands) |
|
2016 |
|
2015 |
|
2014 |
|||
|
Net sales |
|
|
|
|
|
|
|
|
|
|
United States |
|
$ |
804,516 |
|
$ |
805,470 |
|
$ |
793,328 |
|
EMEA (1) |
|
|
210,088 |
|
|
201,106 |
|
|
216,531 |
|
Japan |
|
|
219,021 |
|
|
182,163 |
|
|
195,762 |
|
Korea |
|
|
175,956 |
|
|
144,956 |
|
|
141,168 |
|
Rest of world |
|
|
162,694 |
|
|
169,263 |
|
|
190,821 |
|
Total net sales |
|
$ |
1,572,275 |
|
$ |
1,502,958 |
|
$ |
1,537,610 |
|
|
|
Year ended December 31, |
|||||||
|
(in thousands) |
|
2016 |
|
2015 |
|
2014 |
|||
|
Long-lived assets |
|
|
|
|
|
|
|
|
|
|
United States |
|
$ |
157,884 |
|
$ |
168,459 |
|
$ |
172,709 |
|
EMEA |
|
|
8,619 |
|
|
9,423 |
|
|
9,725 |
|
Japan |
|
|
628 |
|
|
767 |
|
|
1,143 |
|
Korea |
|
|
1,811 |
|
|
1,726 |
|
|
3,058 |
|
Rest of world (2) |
|
|
70,806 |
|
|
74,519 |
|
|
79,957 |
|
Total long-lived assets |
|
$ |
239,748 |
|
$ |
254,894 |
|
$ |
266,592 |
|
(1) |
Europe, the Middle East and Africa (“EMEA”) |
|
(2) |
Includes manufacturing facilities in Thailand with long lived assets of $57.8 million, $60.5 million and $64.6 million as of December 31, 2016, 2015 and 2014, respectively. |
21. Commitments and Contingencies
Purchase Obligations
During the normal course of its business, the Company enters into agreements to purchase goods and services, including purchase commitments for production materials, finished goods inventory, capital expenditures and endorsement arrangements with professional golfers. The reported amounts exclude those liabilities included in accounts payable or accrued liabilities on the consolidated balance sheet as of December 31, 2016.
Purchase obligations by the Company as of December 31, 2016 were as follows:
|
|
|
Payments Due by Period |
|
||||||||||||||||
|
|
|
|
|
|
|
|
|
|
|
|
|
|
|
|
|
|
|
|
|
|
(in thousands) |
|
2017 |
|
2018 |
|
2019 |
|
2020 |
|
2021 |
|
Thereafter |
|
||||||
|
|
|
|
|
|
|
|
|
|
|
|
|
|
|
|
|
|
|
|
|
|
Purchase obligations |
|
$ |
146,308 |
|
$ |
18,228 |
|
$ |
2,877 |
|
$ |
2,257 |
|
$ |
1,793 |
|
$ |
3,326 |
|
Lease Commitments
The Company leases certain warehouses, distribution and office facilities, vehicles and office equipment under operating leases.
The Company has an operating lease for certain vehicles that provides for a residual value guarantee. The lease has a noncancelable lease term of one year and may be renewed annually over the subsequent five years. The Company has the option to terminate the lease at the annual renewal date. Termination of the lease results in the sale of the vehicles and the determination of the residual value. The residual value is calculated by comparing the net proceeds of the vehicles sold to the depreciated value at the end of the renewal period. The Company is not responsible for any deficiency resulting from the net proceeds being less than 20% of the original cost in the first year and 20% of the
F-43
depreciated value for all subsequent years. The Company believes that this guarantee will not have a significant impact on the consolidated financial statements.
Future minimum rental payments under noncancelable operating leases as of December 31, 2016 were as follows:
|
(in thousands) |
|
|
|
|
|
|
|
|
|
|
|
Year ending December 31, |
|
|
|
|
|
2017 |
|
$ |
13,047 |
|
|
2018 |
|
|
11,665 |
|
|
2019 |
|
|
6,910 |
|
|
2020 |
|
|
4,005 |
|
|
2021 |
|
|
2,283 |
|
|
Thereafter |
|
|
1,466 |
|
|
Total minimum rental payments |
|
$ |
39,376 |
|
Total rental expense for all operating leases amounted to $16.5 million, $15.8 million and $16.1 million for the years ended December 31, 2016, 2015 and 2014, respectively.
Contingencies
In connection with the Company’s acquisition of Acushnet Company, Beam indemnified the Company for certain tax related obligations that relate to periods during which Fortune Brands, Inc. owned Acushnet Company. As of December 31, 2016, the Company’s estimate of its receivable for these indemnifications is $9.7 million, of which $1.4 million is recorded in other current assets and $8.3 million is recorded in other noncurrent assets on the consolidated balance sheet.
Litigation
Beam
A dispute has arisen between Acushnet Company and Beam with respect to approximately $16.6 million of value-added tax (“VAT”) trade receivables. These receivables were reflected on Acushnet Company’s consolidated balance sheet at the time of the Company’s acquisition of Acushnet Company. Acushnet Company believes that these VAT trade receivables are assets of the Company; Beam claims that these are tax credits or refunds from the period prior to the acquisition of Acushnet Company which are payable to Beam, pursuant to the terms of the Stock Purchase Agreement that covers the sale of the stock of Acushnet Company. Beam has withheld payments in this amount which the Company believes are payable to Acushnet Company in reimbursement of certain other tax liabilities which existed prior to the acquisition of Acushnet Company. On March 27, 2012, Acushnet Company filed a complaint seeking reimbursement of these funds in the Commonwealth of Massachusetts Superior Court Department, Business Litigation Section. Each party filed Motions for Summary Judgment, which motions were denied by the Court on July 29, 2015. Trial was conducted in early June, 2016. On June 21, 2016, the Court ruled that Beam had a contractual right to the VAT trade receivables actually collected from Acushnet Company's customers prior to the closing of the Company's acquisition of Acushnet Company, but that Beam should pay $972,288 plus pre-judgment interest of $494,859 to the Company to compensate for amounts Beam withheld, but which were not collected from Acushnet Company's customers. The Company recorded the total value as other (income) expense, net on the consolidated statement of operations for the year ended December 31, 2016. Acushnet believes that the Court erred in its ruling and filed a Notice of Appeal on July 20, 2016. Related briefing is expected to close on April 14, 2017.
Other Litigation
In addition to the lawsuit described above, the Company and its subsidiaries are defendants in lawsuits associated with the normal conduct of their businesses and operations. It is not possible to predict the outcome of the pending actions, and, as with any litigation, it is possible that some of these actions could be decided unfavorably. Consequently, the Company is unable to estimate the ultimate aggregate amount of monetary loss, amounts covered by insurance or the financial impact that will result from such matters and has not recorded a liability related to potential
F-44
losses. The Company believes that there are meritorious defenses to these actions and that these actions will not have a material adverse effect on the consolidated financial statements.
22. Unaudited Quarterly Financial Data
The tables below summarize quarterly results for fiscal 2016 and 2015:
|
|
|
Quarter ended (unaudited) |
|
Year ended |
|||||||||||
|
(in thousands) |
|
December 31, |
|
September 30, |
|
June 30, |
|
March 31, |
|
December 31, |
|||||
|
2016 |
|
|
|
|
|
|
|
|
|
|
|
|
|
|
|
|
Net sales |
|
$ |
329,761 |
|
$ |
339,318 |
|
$ |
463,261 |
|
$ |
439,935 |
|
$ |
1,572,275 |
|
Gross Profit |
|
|
167,994 |
|
|
166,902 |
|
|
237,960 |
|
|
225,869 |
|
|
798,725 |
|
Income from operations |
|
|
7,608 |
|
|
9,606 |
|
|
66,437 |
|
|
57,185 |
|
|
140,836 |
|
Net Income (loss) |
|
|
1,247 |
|
|
(4,402) |
|
|
27,478 |
|
|
25,192 |
|
|
49,515 |
|
Net income (loss) attributable to Acushnet Holdings Corp. |
|
|
(179) |
|
|
(5,526) |
|
|
27,055 |
|
|
23,662 |
|
|
45,012 |
|
|
|
|
|
|
|
|
|
|
|
|
|
|
|
|
|
|
Net income (loss) per common share attributable to Acushnet Holdings Corp.: |
|
|
|
|
|
|
|
|
|
|
|
|
|
|
|
|
Basic |
|
|
$ (0.02)
|
|
|
$ (0.38)
|
|
|
$ 0.62
|
|
|
$ 0.53
|
|
|
$ 0.74
|
|
Diluted |
|
|
$ (0.02)
|
|
|
$ (0.38)
|
|
|
$ 0.39
|
|
|
$ 0.35
|
|
|
$ 0.62
|
|
|
|
Quarter ended (unaudited) |
|
Year ended |
|||||||||||
|
(in thousands) |
|
December 31, |
|
September 30, |
|
June 30, |
|
March 31, |
|
December 31, |
|||||
|
2015 |
|
|
|
|
|
|
|
|
|
|
|
|
|
|
|
|
Net sales |
|
$ |
320,216 |
|
$ |
319,868 |
|
$ |
446,576 |
|
$ |
416,298 |
|
$ |
1,502,958 |
|
Gross Profit |
|
|
165,553 |
|
|
157,340 |
|
|
237,687 |
|
|
215,258 |
|
|
775,838 |
|
Income from operations |
|
|
3,539 |
|
|
46 |
|
|
65,141 |
|
|
48,856 |
|
|
117,583 |
|
Net Income (loss) |
|
|
(19,161) |
|
|
(13,298) |
|
|
20,228 |
|
|
16,387 |
|
|
4,156 |
|
Net income (loss) attributable to Acushnet Holdings Corp. |
|
|
(20,436) |
|
|
(13,986) |
|
|
18,654 |
|
|
14,802 |
|
|
(966) |
|
|
|
|
|
|
|
|
|
|
|
|
|
|
|
|
|
|
Net income (loss) per common share attributable to Acushnet Holdings Corp.: |
|
|
|
|
|
|
|
|
|
|
|
|
|
|
|
|
Basic |
|
|
$ (1.09)
|
|
|
$ (0.84)
|
|
|
$ 0.43
|
|
|
$ 0.32
|
|
|
$ (0.74)
|
|
Diluted |
|
|
$ (1.09)
|
|
|
$ (0.84)
|
|
|
$ 0.29
|
|
|
$ 0.23
|
|
|
$ (0.74)
|
Quarterly disclosed amounts may not sum to annual amounts due to rounding.
The Company has revised its previously issued first, second and third quarter of 2016 unaudited consolidated financial information to correct for immaterial adjustments related to the treatment of commissions paid on certain retail sales in Korea and the timing of revenue recognition on shipments of trial golf clubs.
The revision related to the treatment of commissions paid on certain retail sales in Korea resulted in an increase in net sales and a corresponding increase in selling, general and administrative expense of $2.0 million in the first quarter of 2016, an increase in net sales and a corresponding increase in selling, general and administrative expense of $4.7 million in the second quarter of 2016 and an increase in net sales and a corresponding increase in selling, general and administrative expense of $3.9 million in the third quarter of 2016.
The revision related to the timing of revenue recognition on shipments of trial golf clubs resulted in a decrease in net sales of $4.8 million, a decrease in cost of goods sold of $3.3 million, a decrease in gross profit of $1.5 million, a decrease in income tax expense of $0.5 million and a decrease in net income of $1.0 million in the first quarter of 2016; a decrease in net sales of $1.6 million, a decrease in cost of goods sold of $1.1 million, a decrease in gross profit of $0.5 million, a decrease in income tax expense of $0.2 million and a decrease in net income of $0.3 million in the second quarter of 2016; and an increase in net sales of $3.0 million, an increase in cost of goods sold of $2.0 million, an increase in gross profit of $1.0 million, an increase in income tax expense of $0.3 million and an increase in net income of $0.7 million in the third quarter of 2016.
In accordance with Staff Accounting Bulletin (SAB) No. 99, Materiality, and SAB No. 108, Considering the Effects of Prior Year Misstatements when Quantifying Misstatements in Current Year Financial Statements, the Company assessed the materiality of the adjustments and concluded these items were not material to any previously
F-45
issued annual or interim financial statements. However, to facilitate comparisons among periods, the Company has decided to revise its previously issued first, second and third quarter 2016 unaudited consolidated financial information presented within this footnote for the adjustments and those revisions will be reflected in the Company’s future filings.
23. Subsequent Events
Dividend Declaration
On March 22, 2017, the board of directors declared a dividend of $0.12 per share to shareholders on record as of April 5, 2017, payable on April 19, 2017.
EAR Payment
During the first quarter of 2017, the outstanding EAR liability of $151.5 million was settled in full by a cash payment to participants. The delayed draw term loan A facility was drawn upon during the first quarter of 2017 to partially fund the EAR payout.
F-46