Attached files
| file | filename |
|---|---|
| EX-32.1 - EXHIBIT 32.1 - Vera Bradley, Inc. | vra-2017x0128xex321.htm |
| EX-31.2 - EXHIBIT 31.2 - Vera Bradley, Inc. | vra-20170128xex312.htm |
| EX-31.1 - EXHIBIT 31.1 - Vera Bradley, Inc. | vra-20170128xex311.htm |
| EX-23.2 - EXHIBIT 23.2 - Vera Bradley, Inc. | vra-2017x0128xex232.htm |
| EX-23.1 - EXHIBIT 23.1 - Vera Bradley, Inc. | vra-2017x0128xex231.htm |
| EX-21.1 - EXHIBIT 21.1 - Vera Bradley, Inc. | vra-2017x0128xex211.htm |
UNITED STATES
SECURITIES AND EXCHANGE COMMISSION
Washington, D.C. 20549
_____________________________________________
FORM 10-K
_____________________________________________
x | ANNUAL REPORT PURSUANT TO SECTION 13 OR 15(d) OF THE SECURITIES EXCHANGE ACT OF 1934 |
For the Fiscal Year Ended January 28, 2017
OR
¨ | TRANSITION REPORT PURSUANT TO SECTION 13 OR 15(d) OF THE SECURITIES EXCHANGE ACT OF 1934 |
For the Transition Period From to
Commission File Number: 001-34918
_____________________________________________

VERA BRADLEY, INC.
(Exact name of registrant as specified in its charter)
_____________________________________________
Indiana | 27-2935063 | |
(State or other jurisdiction of incorporation or organization) | (I.R.S. Employer Identification No.) | |
12420 Stonebridge Road, Roanoke, Indiana | 46783 | |
(Address of principal executive offices) | (Zip Code) | |
(877) 708-8372
(Registrant’s telephone number, including area code)
_____________________________________________
Securities registered pursuant to Section 12(b) of the Act:
Title of each class | Name of each exchange on which registered | |
Common Stock | The NASDAQ Global Select Market | |
Securities registered pursuant to Section 12(g) of the Act:
None
_____________________________________________
Indicate by check mark if the registrant is a well-known seasoned issuer, as defined in Rule 405 of the Securities Act. Yes ¨ No x
Indicate by check mark if the registrant is not required to file reports pursuant to Section 13 or Section 15(d) of the Act. Yes ¨ No x
Indicate by check mark whether the registrant (1) has filed all reports required to be filed by Section 13 or 15(d) of the Securities Exchange Act of 1934 during the preceding 12 months (or for such shorter period that the registrant was required to file such reports), and (2) has been subject to such filing requirements for the past 90 days. Yes x No ¨
Indicate by check mark whether the registrant has submitted electronically and posted on its corporate Web site, if any, every Interactive Data File required to be submitted and posted pursuant to Rule 405 of Regulation S-T (§232.405 of this chapter) during the preceding 12 months (or for such shorter period that the registrant was required to submit and post such files). Yes x No ¨
Indicate by check mark if disclosure of delinquent filers pursuant to Item 405 of Regulation S-K (§ 229.405 of this chapter) is not contained herein, and will not be contained, to the best of registrant’s knowledge, in definitive proxy or information statements incorporated by reference in Part III of this Form 10-K or any amendment to this Form 10-K. x
Indicate by check mark whether the registrant is a large accelerated filer, an accelerated filer, a non-accelerated filer or a smaller reporting company. See the definitions of “large accelerated filer,” “accelerated filer” and “smaller reporting company” in Rule 12b-2 of the Exchange Act.
Large accelerated filer | ¨ | Accelerated filer | x | |||
Non-accelerated filer | ¨ (Do not check if a smaller reporting company) | Smaller reporting company | ¨ | |||
Indicate by check mark whether the registrant is a shell company (as defined in Rule 12b-2 of the Exchange Act). Yes ¨ No x
The aggregate market value of the registrant’s voting common stock held by non-affiliates of the registrant as of July 30, 2016 was $282,951,964.
The registrant had 36,180,581 shares of its common stock outstanding as of March 21, 2017.
_____________________________________________
DOCUMENT INCORPORATED BY REFERENCE:
Portions of the registrant’s definitive proxy statement for the 2017 Annual Meeting of Shareholders are incorporated by reference into Part III of this Annual Report on Form 10-K.
Forward-Looking Statements
This annual report contains forward-looking statements that are subject to risks and uncertainties. All statements other than statements of historical or current fact included in this report are forward-looking statements. Forward-looking statements refer to our current expectations and projections relating to our financial condition, results of operations, plans, objectives, strategies, future performance, and business. You can identify forward-looking statements by the fact that they do not relate strictly to historical or current facts. These statements may include words such as “anticipate,” “estimate,” “expect,” “project,” “plan,” “intend,” “believe,” “may,” “might,” “will,” “should,” “can have,” and “likely” and other words and terms of similar meaning in connection with any discussion of the timing or nature of future operating or financial performance or other events. For example, all statements we make relating to our estimated and projected earnings, revenues, costs, expenditures, cash flows, growth rates, and financial results, our plans and objectives for future operations, growth, initiatives, or strategies, or the expected outcome or impact of pending or threatened litigation are forward-looking statements. All forward-looking statements are subject to risks and uncertainties that may cause actual results to differ materially from those that we expected, including:
• | possible inability to successfully implement our long-term strategic plan; |
• | possible continued declines in our comparable sales; |
• | possible inability to maintain and enhance our brand; |
• | possible failure of our multi-channel distribution model; |
• | possible adverse changes in general economic conditions and their impact on consumer confidence and consumer spending; |
• | possible inability to predict and respond in a timely manner to changes in consumer demand; |
• | possible inability to successfully open new stores and/or operate current stores as planned; |
• | possible loss of key management or design associates or inability to attract and retain the talent required for our business; |
• | possible ramifications from the payment card incident disclosed in October 2016; and |
• | possible data security or privacy breaches or disruptions in our computer systems or website. |
We derive many of our forward-looking statements from our operating plans and forecasts, which are based upon detailed assumptions. While we believe that our assumptions are reasonable, we caution that it is difficult to predict the impact of known factors, and it is impossible for us to anticipate all factors that could affect our actual results.
For a discussion of these risks and other risks and uncertainties that could cause actual results to differ materially from those contained in our forward-looking statements, please refer to “Risk Factors” in Item 1A of this report.
We caution you that the risks and uncertainties identified by us may not be all of the factors that are important to you. Furthermore, the forward-looking statements included in this report are made only as of the date hereof. We undertake no obligation to publicly update or revise any forward-looking statement as a result of new information, future events, or otherwise, except as required by law.
2
TABLE OF CONTENTS
Item 1. | ||
Item 1A. | ||
Item 1B. | ||
Item 2. | ||
Item 3. | ||
Item 4. | ||
Item 5. | ||
Item 6. | ||
Item 7. | ||
Item 7A. | ||
Item 8. | ||
Item 9. | ||
Item 9A. | ||
Item 9B. | ||
Item 10. | ||
Item 11. | ||
Item 12. | ||
Item 13. | ||
Item 14. | ||
Item 15. | ||
Item 16. | ||
3
PART I
In this Form 10-K, references to “Vera Bradley,” “we,” “our,” “us” and the “Company” refer to Vera Bradley, Inc. and its subsidiaries, including Vera Bradley Designs, Inc. The Company utilizes a 52-53 week fiscal year ending on the Saturday closest to January 31. The fiscal years ended January 28, 2017 (“fiscal 2017”), January 30, 2016 (“fiscal 2016”) and January 31, 2015 (“fiscal 2015”) were each 52-week periods. The fiscal year ending February 3, 2018 (“fiscal 2018”) will be a 53-week period.
Item 1. Business
Our Company
Vera Bradley is a leading designer of women’s handbags, luggage and travel items, fashion and home accessories, and unique gifts. Founded in 1982 by friends Barbara Bradley Baekgaard and Patricia R. Miller, the brand’s innovative designs, iconic patterns, and brilliant colors continue to inspire and connect women.
Vera Bradley offers a unique, multi-channel sales model, as well as a focus on service and a high level of customer engagement. The Company sells its products through two reportable segments: Direct and Indirect. The Direct business consists of sales of Vera Bradley products through the Company’s full-line and factory outlet stores in the United States, verabradley.com, direct-to-consumer eBay sales, and the Company’s annual outlet sale in Fort Wayne, Indiana. As of January 28, 2017, the Company operated 113 full-line stores and 46 factory outlet stores. The Indirect business consists of sales of Vera Bradley products to approximately 2,600 specialty retail locations, substantially all of which are located in the United States, as well as department stores, national accounts, third party e-commerce sites, the Company's wholesale customer in Japan, and third-party inventory liquidators. For financial information about our reportable segments, refer to Note 16 of the Notes to Consolidated Financial Statements set forth in Part II, “Item 8. Financial Statements and Supplementary Data,” of this report.
Our History
Barbara Bradley Baekgaard and Patricia Miller founded the Company in 1982 in Fort Wayne, Indiana, after recognizing a lack of stylish travel accessories in the market. Within weeks, the friends created Vera Bradley, named after Ms. Bradley Baekgaard’s mother, and began manufacturing and marketing their distinctive products. The founders, together with past and present members of the executive management team, have been instrumental in our growth and success. The following timeline sets forth a summary of significant milestones in Vera Bradley’s history by calendar year:
1982 | – | Barbara Bradley Baekgaard and Patricia Miller launched Vera Bradley by introducing three products: the handbag, the sports bag, and the duffel bag. |
1987 | – | Ernst & Young honored our Co-Founders with an “Entrepreneur of the Year” award. |
1991 | – | To accommodate the increasing number of attendees, we relocated our annual outlet sale from a tent in our parking lot to its present location at the Allen County War Memorial Coliseum Exposition Center in Fort Wayne, Indiana. |
1998 | – | We founded our primary philanthropy, the Vera Bradley Foundation for Breast Cancer. |
1999 | – | Our products were sold in all 50 states through Indirect retailers. |
2005 | – | We launched the Vera Bradley Visual Merchandising Program, providing our retail partners a framework for presenting the brand and merchandising our products in a consistent manner. |
2006 | – | We launched our e-commerce business through our website, verabradley.com. |
2007 | – | We opened a state-of-the-art distribution facility in Roanoke, Indiana and also opened our first full-line store at the Natick Collection, in greater Boston. |
4
2009 | – | We opened our first outlet store at Chicago Premium Outlets in Aurora, Illinois. |
2010 | – | We completed our initial public offering. |
2011 | – | We opened the Vera Bradley Design Center in Roanoke, Indiana, and launched our products in Dillard's department stores. |
2012 | – | We completed a 200,000 square-foot expansion of our distribution facility in Roanoke, Indiana; increased our presence to all Dillard’s locations; and launched a relationship with Von Maur department stores. |
2013 | – | We migrated verabradley.com to a more responsive design, providing an enhanced shopping experience and improved product viewing regardless of the device being used to shop. |
2014 | – | We introduced laser-cut, leather, faux leather, and full coordinating collections; began our relationship with Macy's; and launched our first national ad campaign. |
2015 | – | We launched several new collections including Streeterville, Preppy Poly, and Collegiate; introduced line extensions such as our fragrance collection and the expansion of our jewelry collection; launched our “I AM” national ad campaign; increased our presence in Macy's; introduced our products in Belk and Bon-Ton department stores; and made further improvements to verabradley.com, including enhanced search. |
2016 | – | We opened our first flagship store in New York, New York in the SoHo neighborhood; introduced our Gallatin relaxed leather collection; launched our “It's Good to Be a Girl” national marketing campaign; and expanded our collegiate collection to over 70 schools. |
The passion for design and customer service established by our founders has driven our Company for over 30 years and remains the cornerstone of Vera Bradley today. Chief Creative Officer, Ms. Baekgaard, continues to provide guidance on our creative efforts, including product development and store design. Ms. Miller retired in October 2012 as our National Spokesperson, but continues to serve on the Board of Directors along with Ms. Baekgaard.
Growth Strategies
Our long-term vision is to build on the Company's rich heritage and establish Vera Bradley as a premium global lifestyle brand, expand our customer reach and grow our customer connections. Our long-term strategic plan is centered upon the three planks of product, distribution, and marketing.
We call our target aspirational customer the Day Maker. She is organized, thoughtful and, most of all, appreciates femininity and beauty - in color, print and thoughtful details. We are focused on creating “beautiful solutions” for the Day Maker and believe we have a great opportunity to attract more Day Makers to our brand through our product offerings, our distribution channels, and our marketing efforts.
Product. We have identified five key businesses where we can offer the Day Maker beautiful solutions that we believe will propel our future growth. We are optimizing our existing core product portfolio and expanding into relevant new categories. We will continue to use licenses and strategic partnerships as appropriate to expand our product categories.
• | Our Fashion Bag and Accessories business continues to be our largest opportunity and allows us to showcase our innovation, function, and fashion. |
• | Travel remains a core differentiator for Vera Bradley and allows us to both embrace our heritage and to showcase newness and functionality with products like Lighten Up and our unique collapsible luggage. |
• | Our Campus business has been successful, and we believe further expansion of our Collegiate Collection will help continue to propel our Campus authority forward. |
• | Wellness and Beauty is a growing category as our Day Maker is looking for experiential events and wants to find wellness and beauty products that enhance her holistically. Our home and body fragrance collection and our current line of multi-purpose sport bags play into this theme. |
5
• | We believe Home can continue to be a significant growth opportunity for Vera Bradley, with market attractiveness and a great brand fit. The Day Maker’s fashion statement is often her home. Licensing will play a key role in the home area. |
In each of these areas, fabric, pattern innovation, and newness remain critical in order to stay relevant.
Distribution Channels. Vera Bradley products are available wherever our consumer chooses to shop including full-line and factory outlet stores, online, and department and specialty retail stores. We continue to focus on tightly integrating our multi-channel business by strengthening our Direct distribution channel (including full-line stores, factory outlet stores, and e-commerce), further developing our department store and other Indirect channel relationships and right-sizing and working to strengthen the performance in our specialty retail channel.
In 2007 and 2009, we opened our first full-line and factory outlet stores, respectively. We believe there continue to be long-term opportunities for new stores throughout the United States. We opened four new full-line and six new factory outlet stores in fiscal 2017; however, we are continuing to slow our short-term plans for new store openings until we begin to produce comparable store sales growth.
We do not currently plan to open any new full-line stores in fiscal 2018. In fact, we expect to relocate or close up to 15 underperforming full-line stores over the next two years. In our full-line stores, we are continuing to work to drive traffic and sales through building a service and selling culture, nurturing more community outreach, and building more localized assortments. During fiscal 2017, we refreshed 14 full-line stores to reflect our new branding including updates to the storefront facade, logo, and interior. We also completed facade updates at 15 of our newest full-line stores to reflect our new logo. We are continuing our refresh program and expect that about half of our full-line stores will be updated by the end of fiscal 2018.
We plan to add six new factory outlet stores in fiscal 2018. At January 28, 2017, approximately 70% of the product in the outlet channel was made specifically for our factory outlet stores.
In 2006, we began selling directly to consumers through verabradley.com. In fiscal 2017, we had approximately 53 million visits to our website. Building our digital flagship remains a key part of our distribution strategy. The redesign and conversion of our website to a new platform was completed in February 2017. This new platform offers enhanced ease of shopping and incremental functionality including an upgraded mobile experience; additional navigation and search enhancements; improved product pages with enhanced imagery, product videos, and user-generated content; and new capabilities like eGift cards and order on line, pick up in store. The new platform also gives us capabilities to create deeper customer relationships and create value through more personalization and strategic customization.
Our department store relationships allow us to expose our brand to new customers and showcase our new product assortments. We are currently in over 730 department store locations, including Macy's, Dillard's, Belk, Bon-Ton, and Von Maur. In the department stores, we are continuing to work on enhancing our brand presentation and to expand our lifestyle brand offerings.
The specialty retail channel is the heritage of our business and remains very important to us. We continue to add select accounts while discontinuing unproductive accounts. While the specialty retail business is becoming a smaller percentage of our total revenue base, it is still an important piece of our business, and we are working to stabilize it by segmenting specific products to this channel and assisting retailers with assortment planning.
We have a small wholesale presence in Japan. We are exploring the possibility of expanding into other countries in the long-term but do not foresee any additional international country expansion in fiscal 2018.
Marketing. Marketing and brand positioning are both critical elements as we continue to engage new consumers and strengthen our bond with our existing customers. During fiscal 2017, our focus was to increase brand relevancy, desire for the brand, and purchase intent.
We activated our new branding and brand positioning in fiscal 2017, which included updating elements of our visual identity such as our logo and further evolving our marketing to speak more directly to the Day Maker. We believe that highlighting our new product and enhancing our brand creative to assure our customer that we understand her will give the Day Maker a new reason to look at Vera Bradley.
Well-timed and well-executed brand activation is critical to increasing our brand relevancy and increasing purchase intent. Through comprehensive consumer research, we have designed a media plan that we believe effectively targets our Day Maker customers and attracts both lapsed and new Day Maker consumers to our brand, reaching them where they already are looking and giving them content that showcases our beautiful solutions. Our media efforts include a fully-integrated mix of digital, social, experiential, and print, with our goal being to surround the Day Maker with our brand.
Competitive Strengths
We believe the following competitive strengths differentiate us within the marketplace:
6
Strong Brand Identity and Positioning. We believe the Vera Bradley brand is highly recognized for its distinctive and vibrant style. Vera Bradley is positioned in the market as a lifestyle brand that inspires consumers to express their femininity, individuality, and sense of style. We have also positioned our brand to highlight the high quality and functional attributes of our products. The Vera Bradley brand is more price accessible than many competing brands, which allows us to attract a wide range of consumers and increases our ability to achieve repeat purchases.
Customer Loyalty. We believe we have a segment of long-term consumers who act as loyal and enthusiastic brand advocates. We believe this enthusiasm for our brand by our loyal customers inspires repeat purchases. Our customers often purchase our products as gifts for family members and friends, who we strive to turn into brand enthusiasts.
Product Development Expertise. Our product development team combines an understanding of consumer preferences with a knowledge of color, fashion, and style trends to design our products. Our creative design associates utilize a disciplined product design process that seeks to maximize the productivity of our product releases and drive consumer demand.
Dynamic Multi-Channel Distribution Model. We offer our products through a diverse choice of shopping options across channels that are intimate, highly shop-able, fun, and characteristic of our brand. Whether they visit a Vera Bradley store, a specialty retail store, a department store, or verabradley.com, we believe consumers have an opportunity to find the brand in places that match their unique shopping interests. Our multi-channel distribution model enables us to maximize customer access to our products.
Established Network of Indirect Retailers. Our Indirect specialty retail business consists of an established and diverse network of approximately 2,600 locations. This channel, primarily located throughout the United States, includes some of the brand’s strongest advocates, and their passion has been instrumental in the development of our brand.
Unique Company Culture. We were founded in 1982 by two friends, Barbara Bradley Baekgaard and Patricia Miller, who built our business around their passion for design and commitment to customer service. We believe our founders created a unique culture that attracts passionate and motivated employees who are excited about our products and our brand. Our employees share our founders’ commitment to Vera Bradley customers. We believe that a fun, friendly, and welcoming work environment fosters creativity and collaboration and that, by empowering our employees to become personally involved in product design, testing, and marketing, they become passionate and devoted brand advocates.
Experienced Management Team. Our senior management team led by Robert Wallstrom, our Chief Executive Officer, has extensive experience across a diverse range of disciplines in product design, merchandising, marketing, store operations and development, supply chain management, and finance.
Our Product Release Strategy
We introduce new collections approximately ten times per year. Each launch typically consists of two or three signature cotton-quilted prints, as well as other fabrications including microfiber, leather, faux leather, and Preppy Poly and patterns in Streeterville and Lighten-Up, many of which are also available in solid colors. These collections of prints and solids are incorporated into the designs of a wide range of products, including bags, accessories, and travel items. These collections typically include classic styles, updates to existing designs, and new product introductions.
To keep our assortment current and fresh, and to focus our inventory investments on our best performers, we discontinue prints and fabrications as necessary. We sell our remaining inventory of retired products primarily through our website, factory outlet stores, our annual outlet sale, and third party liquidators.
7
Our Products
The following chart presents net revenues generated by each of our four product categories and other revenues as a percentage of our total net revenues for fiscal 2017, 2016, and 2015.
Fiscal Year Ended | |||||||||
January 28, 2017 | January 30, 2016 | January 31, 2015 | |||||||
Bags | 42.8 | % | 42.9 | % | 45.4 | % | |||
Travel | 24.5 | % | 24.9 | % | 21.4 | % | |||
Accessories | 21.9 | % | 22.3 | % | 22.8 | % | |||
Home | 5.7 | % | 4.5 | % | 3.5 | % | |||
Other (1) | 5.1 | % | 5.4 | % | 6.9 | % | |||
Total | 100.0 | % | 100.0 | % | 100.0 | % | |||
(1) | Includes primarily apparel/footwear, stationery, merchandising, freight, licensing revenue, and gift card breakage revenue. |
Bags. Bags are a core part of our product offerings and are the primary component of every seasonal assortment. The category consists of classic and new styles developed by our product development team to meet consumer demand. Our bag product category includes items such as totes, crossbodies, satchels, clutches, backpacks, baby bags, and lunch bags. Bags play a prominent role in our visual merchandising, and we focus on showcasing the different fabrications, patterns, colors, and features of each bag.
Accessories. Accessories include fashion accessories such as wallets, wristlets, eyeglass cases, jewelry, and scarves and various technology accessories. Our accessories are attractively priced and allow the consumer to include some color in her wardrobe, even if tucked into another bag. Our product development team consistently updates the accessories assortment based on consumer demand and fashion trends.
Travel. Our travel product category includes rolling luggage, cosmetics, travel and packing accessories, and travel bags which includes our iconic duffel and weekend bags. The first Vera Bradley product offering included duffel bags, which consistently have been a strong performer. We believe their popularity, as well as the appeal of our other travel items, results from our vibrant designs, functional styles, and lightweight fabrications.
Home. Our home category includes textiles, including throw blankets, beach towels, and comforters, wellness and beauty, as well as items such as mugs and tumblers.
Product Development
We have implemented a fully integrated and cross-functional product development process that aligns design, trend and market research, merchandising, planning, sales, marketing, and sourcing. Product development is a core capability that makes our products unique. Our designs and aesthetics set our products apart and drive customer loyalty. Our design and product development teams combine an understanding of the needs of our target Day Maker customers, with knowledge of upcoming color and fashion trends, to design new collections, as well as new product categories, that will resonate in the market.
We typically begin the development stage of our products in the Vera Bradley portfolio twelve to eighteen months in advance of their release. The development of each new pattern includes the design of a primary, secondary, and sometimes a tertiary print. To seek fresh perspectives, we often collaborate with independent designers to create unique patterns for each season and also maintain an internal print design team. We oversee the development and exercise the final approval of all patterns and designs. Once developed, we generally copyright our patterns as appropriate. We believe that great design is not only central to our product development efforts, but also is a fundamental part of our brand development and growth strategies.
Our product development team works to ensure that new collections contain an assortment of products and styles that are in line with both fashion trends and Day Maker customer needs and regularly updates classic styles to enhance functionality. In addition, we actively pursue opportunities to expand our product offerings through new line and brand extensions. Our product development team monitors fashion trends and customer needs by attending major trend shows in Europe and the United States, subscribing to trend monitoring services, and engaging in comparison-shopping.
8
Our product development team works closely with our marketing team to gather consumer insights through seasonal market research and in-store testing. We gather seasonal market research through a variety of methodologies, including scheduled interviews and online and in-person surveys conducted by our in-house team. The design and product development teams ensure that we offer products that are constructed to meet our standards of design, function, and quality in a cost-effective manner. We believe that with our cross-functional, collaborative approach, we are able to introduce and sell our merchandise in a way that clearly communicates the Vera Bradley brand.
In addition to products developed in-house, we also pursue brand extensions through strategic partnerships and licensing agreements. We currently have strategic partnerships in place for the development of our fragrance collection and licenses in place for our eyewear, collegiate, bedding, hosiery, swim, tech, stationery, and publishing collections. We will continue to look for the right strategic partners and licensees that can augment the brand and provide established distribution networks for certain categories of business.
Marketing
We believe that the growth of our brand and our business is influenced by our ability to introduce and sell our merchandise in a way that clearly conveys the Vera Bradley brand personality. We use marketing as a critical tool in our efforts to promote our brand.
Retention Advertising. Vera Bradley communicates with our established customers consistently throughout the year with regular e-mails and seasonal direct mail catalogs, brochures, and notifications. Our retention advertising is geared to keeping Vera Bradley top of mind with our customers, rewarding our customers, and providing them with news of our seasonal launches and new product introductions.
New Customer Acquisition Advertising. We primarily employ print and digital (i.e., display banner, mobile, geo-targeting, and pre-roll video) advertising to increase overall brand awareness and attract new customers. Our advertisements are placed in fashion, lifestyle, and family publications and websites that complement the wide breadth of appeal of our brand. Our ads have recently appeared in People StyleWatch, InStyle, Glamour, Cosmopolitan, Seventeen, and Teen Vogue.
Public Relations and Product Placement. Vera Bradley has received considerable editorial exposure in the press, with mentions in People StyleWatch, Redbook, Teen Vogue, Seventeen, O the Oprah Magazine, InStyle, and The Huffington Post. In addition, we have expanded our public relations efforts to reach popular online influencers and bloggers.
Product placement in feature-length films and on prime-time television shows remains strong with television placements in Modern Family, The Big Bang Theory, Scandal, and Fuller House. Movie placements include: La La Land, My Big Fat Greek Wedding 2, Ghostbusters, and Miracles from Heaven.
Partnerships. We work with high-profile partners to enhance our brand image and expand our customer reach. During fiscal 2017, we partnered with Madison Square Garden which, among other things, featured our new logo and video content. In fiscal 2018, we will participate in a new six-episode reality competition television show called Girl Starter which will air on TLC beginning in early April. The show will integrate our product and “It’s Good to be a Girl” marketing campaign clips. One episode will feature a challenge on which our co-founder, Barbara Bradley Baekgaard, will be a guest judge.
Social Media and Online Marketing. We use online marketing and social networking sites as tools to increase brand awareness and drive traffic to verabradley.com and to our stores. We have captured approximately 4.5 million customer e-mail addresses in our online customer file, with many of these customers providing age, occupation, and location data. This captured information provides us with deeper insight into the products and categories that are in the highest interest of our customers, and allows us to better target our customers with appropriate messages. As of January 28, 2017, we had approximately 1.7 million Facebook fans and approximately 83,000 Twitter followers. Our Instagram, which we launched in October 2012, has grown to approximately 277,000 followers and is our most highly engaged social medium. In addition, we often partner with brand-right bloggers to promote product.
Direct Mail. Seasonal Vera Bradley catalogs are a vehicle for promoting our brand and product portfolio. Each catalog is sent to a targeted customer mailing list. In addition to distributing the catalog, we produce and distribute a number of other marketing pieces, including postcards and mini-mailers. We believe our direct mail medium generates excitement and awareness about the brand and seasonal introductions and allows us to reach both new and loyal customers in their homes.
9
Seasonality
Because Vera Bradley products are frequently given as gifts, we have historically realized, and expect to continue to realize, higher sales and operating income in the fourth quarter of our fiscal year, which includes the holiday months of November and December. In addition, fluctuations in sales and operating income in any fiscal quarter are affected by the timing of seasonal wholesale shipments and other events affecting retail sales.
Channels of Distribution
We distribute our products through our Direct and Indirect segments. This multi-channel distribution model is designed to enable operational flexibility and maximizes the methods by which we can access potential customers.
Direct Segment
Full-Line Stores. We have developed a retail presence through our full-line stores, all located in the United States, which provides us with a format to showcase our brand and the full array of Vera Bradley products. As of January 28, 2017, we operated 113 full-line stores averaging approximately 1,900 square feet per store. In fiscal 2017, we opened our first flagship store in the SoHo neighborhood of New York which offers customers a unique store experience, as well as exclusive product. Our sales associates are passionate about our products and customer service, which, we believe, translates into a superior shopping experience.
Factory Outlet Stores. Our factory outlet stores are a vehicle for selling factory exclusive styles, as well as retired merchandise at discounted prices, while maintaining brand integrity. At the end of fiscal 2017, approximately 70% of the merchandise found in our factory outlet stores was factory exclusive styles. We believe our factory outlet stores are an integral part of our distribution strategy, as this format provides an additional channel of distribution for our products and enables us to better target value-oriented customers. Our factory outlet stores average approximately 3,200 square feet per store. As of January 28, 2017, we operated 46 factory outlet stores all located in the United States.
Store Location Selection Strategy. Our store location decisions for both full-line and factory outlet stores are made based upon our comprehensive retail strategy that includes actual and planned penetration in both Indirect and Direct segments, as well as existing e-commerce demand. At this time, we do not believe all geographical markets have been fully penetrated by our distribution channels. We believe that long-term expansion of our store base will increase brand awareness and reinforce our brand image. In addition to analyzing store economics, we pay particular attention to the location within the shopping center, the size and shape of the space, and desirable co-tenancies. Along with seeking co-tenants that we believe share our target customer, we seek a balanced mix of moderate and high-end retailers to encourage high levels of traffic. Our target full-line store size is approximately 1,800 square feet, but we are able to work with spaces as small as 1,000 square feet or, depending on our market strategy and relevant economic factors, spaces as large as 2,800 square feet. Our target factory outlet store size is approximately 3,000 square feet.
Store Operations. The focus of our store operations is providing consumers with a comfortable and memorable shopping experience. We strive to make the experience interactive through special store events, such as showcasing newly launched products or celebrating our namesake’s birthday. Our customer service philosophy emphasizes friendly service, merchandise knowledge, and passion for the brand. Consequently, an essential requirement for the success of our stores is our ability to attract, train, and retain talented, highly motivated district managers, store managers, and sales associates.
Store Economics. We expect our full-line stores to average approximately 1,800 square feet per store, and we expect to invest approximately $0.4 million per new store, consisting of inventory costs, pre-opening costs, and build-out costs, less tenant-improvement allowances.
We expect our factory outlet stores to average approximately 3,000 square feet per store, and we expect to invest approximately $0.4 million per new store, consisting of inventory costs, pre-opening costs, and build-out costs, less tenant-improvement allowances.
E-Commerce. In 2006, we began selling our products through the verabradley.com website. The objective of verabradley.com is to provide both a mechanism for marketing directly to consumers and a storefront where consumers can find the entire full-line Vera Bradley collection. Since fiscal 2013, we have continually invested in upgrades to our website allowing for a more user friendly homepage, enabling us to ship internationally, enhancing the checkout experience, adding product recommendations, enhancing product descriptions, adding silhouettes for product scale, generating cart and site abandonment emails, gathering and analyzing customer feedback, and enhancing our search capabilities. To continue to enhance our website engagement, we completed a redesign and conversion of our website to a new platform in February 2017. This new platform offers enhanced ease of shopping and incremental functionality including an upgraded mobile experience; additional navigation and search
10
enhancements; improved product pages with enhanced imagery, product videos, and user-generated content; and new capabilities like eGift cards and order on line, pick up in store. We had approximately 53 million visits to verabradley.com during fiscal 2017.
Annual Outlet Sale. Our annual outlet sale is held in the Allen County War Memorial Coliseum Exposition Center in Fort Wayne, Indiana. The annual outlet sale is an important tradition for Vera Bradley, has many loyal followers, and is an opportunity for us to sell our retired merchandise at discounted prices in a brand-right fashion. We attracted approximately 50,000 attendees to our 2016 annual outlet sale.
Indirect Segment
As of January 28, 2017, we sold our products in approximately 2,600 specialty retail locations, the majority of which we have had long-standing relationships, as well as department stores, national accounts, third party e-commerce sites, our wholesale customer in Japan and third-party inventory liquidators. In fiscal 2012, we launched our products in the department store channel. We are currently in over 730 department store locations, including approximately 350 Macy's locations, approximately 270 Dillard's, over 40 Belk, over 40 Bon-Ton, and approximately 30 Von Maur locations.
The top 30% of our specialty retailers account for approximately 70% of total specialty retailer revenue. No single Indirect retailer represented more than 10% of consolidated net revenues in fiscal 2017, with the top ten Indirect retailers representing in the aggregate approximately 40% of total Indirect net revenues. The majority of our Indirect retailers have been customers for over five years.
Indirect Sales Force
We believe that having an in-house field sales force results in more consistent brand presentation and messaging, enhanced support for our Indirect customers, and a more predictable, scalable, and cost-efficient business model. As of January 28, 2017, our sales team consisted of approximately 40 in-house, full-time sales consultants. The compensation structure for our sales consultants consists of a combination of fixed pay and sales-based incentives.
In addition to acquiring new and growing existing accounts, our sales consultants serve as a support center for our Indirect customers by assisting and educating them in areas such as merchandising and visual presentation, marketing the brand, product selection, and inventory management. Our visual merchandising program provides our sales consultants with a framework to guide our Indirect customers regarding optimal product placement and display that is intended to reinforce the message that our brand is distinct from those of our competitors.
Manufacturing and Supply Chain Model
Our multi-country manufacturing and supply chain model is designed to achieve efficient, timely, and accurate order fulfillment while maintaining appropriate levels of inventory.
Our manufacturing and sourcing strategy is part of the larger cross-functional product development process. The overall objective for our sourcing team is to build and sustain collaborative partnerships throughout our supply chain, with a focus on identifying appropriate countries and partners to manufacture our products. The sourcing team leverages its expertise in negotiation, relationship management, and change management to maintain a strong global supply chain.
We strive to maintain the appropriate balance of inventory to enable us to provide a high level of service to our customers, including prompt and accurate delivery of our products. We have an active and nimble sales and operations planning process that helps us balance the supply and demand issues that we encounter in our business, optimize our inventory levels, and anticipate inventory needs. We have also integrated our planning, forecasting, and segmentation processes under one function called Merchandise Planning and Allocation.
Approximately half of our products are cotton-based. Our other fabrics include nylon, polyester, microfiber, leather, and faux leather. We source our materials from various suppliers in Asia, with the majority coming from China and South Korea. Our global sourcing team works with select suppliers enabling us to optimize the mix of cost, lead time, quality, and reliability within our global supply network. All of our suppliers must comply with our quality standards, and we use only a limited number of pre-approved suppliers who have demonstrated a commitment to delivering the highest quality products. In April 2016, we opened an office in Hong Kong to lead the global supply chain in Asia, including the oversight of sourcing and procurement.
11
The majority of our finished goods, not sourced through licenses or strategic partners, are manufactured by a variety of global manufacturers located primarily in China, Vietnam and Cambodia. We are not dependent upon any single manufacturer for our products. When determining the size of orders placed with our manufacturers, we take into account forward-looking demand, lead times for specific products, current inventory levels, and minimum order quantity requirements. Overseas production has resulted in substantial cost savings and a reduction of capital investment. With the oversight of our office in Hong Kong and our independent contractors, we believe these financial benefits have been realized without sacrificing the level of quality inherent in our products or service to our customers.
Distribution Center
In 2007, we consolidated our warehousing and shipping functions into one distribution center, located in Roanoke, Indiana. In fiscal 2013 and fiscal 2015, we expanded the facility by 200,000 and 10,000 square-feet, respectively, which resulted in a total distribution center space of 428,500 square-feet. This automated, computerized facility allows Vera Bradley employees to receive information directly from the order-collection center and quickly identify the products and quantities necessary for a particular order. The expansion resulted in capacity gains in the areas of inbound receiving, inventory storage, order fulfillment, value-add processing, and shipping. The facility’s technology enables us to more accurately process and pack orders, as well as track shipments and inventory. We believe that our systems for the processing and shipment of orders from our distribution center have enabled us to improve our overall customer service through enhanced order accuracy and reduced turnaround time.
Our products are shipped primarily via third-party common carriers to our stores, our Indirect retailers, and department stores, and directly to our customers who purchase through our website. We believe we are positioned well to support the order fulfillment requirements of our business, including business generated through our website.
Management Information Systems
We believe that high levels of automation and technology are essential to maintain our competitive position. We maintain computer hardware, systems applications, and networks to enhance and accelerate the design process, to support the sale and distribution of our products to our customers, and to improve the integration and efficiency of our operations. Our management information systems are designed to provide, among other things, comprehensive order processing, production, accounting, and management information for the product development, retail, sales, marketing, distribution, finance, and human resources functions of our business. We use several systems, including MICROS-Retail, SAP, JDA, and SCALE for our information technology requirements.
Competition
We face strong competition in each of the product lines and markets in which we compete. We believe that all of our products are in similar competitive positions with respect to the number of competitors they face and the level of competition within each product line. Due to the number of different products we offer, it is not practicable for us to quantify the number of competitors we face. Our products compete with other branded products within their product categories and with private label products sold by retailers. In our Indirect business, we compete with numerous manufacturers, importers, and distributors of handbags, accessories, and other products for the limited space available for the display of such products to the consumer. Moreover, the general availability of contract manufacturing allows new entrants access to the markets in which we compete, which may increase the number of competitors and adversely affect our competitive position and our business. In our Direct business, we compete against other independent retailers, department stores, catalog retailers, gift retailers, and Internet businesses that engage in the retail sale of similar products.
The market for handbags, in particular, is highly competitive. Our competitors include not only established companies that are expanding their production and marketing of handbags, but also frequent new entrants to the market. We directly compete with wholesalers and direct sellers of branded handbags and accessories, such as Coach, Michael Kors, Nine West, Dooney & Bourke, Kate Spade, Fossil, Brahmin, and Tory Burch.
In varying degrees, depending on the product category involved, we compete on the basis of design (aesthetic appeal), quality (construction), function, price point, distribution, and brand positioning. We believe that our primary competitive advantages are consumer recognition of our brand, customer loyalty, product development expertise, and our widespread presence through our multi-channel distribution model. Some of our competitors have achieved significant recognition for their brand names or have substantially greater financial, distribution, marketing, and other resources than we do. Further, we may face new competitors and increased competition from existing competitors as we expand into new markets and increase our presence in existing markets.
12
Copyrights and Trademarks
The development of new patterns includes the design of primary and secondary prints. Once developed, we generally copyright our patterns as appropriate. We currently have approximately 820 copyrights.
We also own all of the material trademark rights used in connection with the production, marketing, and distribution of all of our products, both in the United States and in the other countries in which our products are principally sold. Our trademarks include “Vera Bradley.” We aggressively police our trademarks and copyrights and pursue infringers and counterfeiters both domestically and internationally. Our trademarks will remain in existence for as long as we continue to use and renew them in advance of their expiration dates. We have no material patents.
Employees
As of January 28, 2017, we had approximately 3,100 employees. Of the total, approximately 2,450 were engaged in retail selling positions, approximately 315 were engaged in distribution, sourcing and quality functions, approximately 35 were engaged in product design, and approximately 300 were engaged in corporate support and administrative functions. None of our employees are represented by a union. We believe that our relations with our employees are good, and we have never encountered a significant work stoppage.
Government Regulation
Many of our imported products are subject to existing or potential duties, tariffs, or quotas that may limit the quantity of products that we may import into the United States and other countries or impact the cost of such products. To date, we have not been restricted by quotas in the operation of our business, and customs duties have not comprised a material portion of the total cost of a majority of our products. In addition, we are subject to foreign governmental regulation and trade restrictions, including U.S. retaliation against prohibited foreign practices, with respect to our product sourcing and international sales operations.
We are subject to federal, state, local, and foreign laws and regulations governing environmental matters, including the handling, transportation, and disposal of our products and our non-hazardous and hazardous substances and wastes, as well as emissions and discharges into the environment, including discharges to air, surface water, and groundwater. Failure to comply with such laws and regulations could result in costs for corrective action, penalties, or the imposition of other liabilities. Compliance with environmental laws and regulations has not had a material effect upon our earnings or financial position. If we violate any laws or regulations, however, it could have a material adverse effect on our business or financial performance.
Executive Officers of the Company
The following table sets forth certain information concerning each of our executive officers:
Name | Age | Position(s) | ||
Robert Wallstrom | 51 | Chief Executive Officer, President and Director | ||
Barbara Bradley Baekgaard | 78 | Co-Founder, Chief Creative Officer, and Director | ||
Kevin J. Sierks | 44 | Executive Vice President – Chief Financial Officer | ||
Sue Fuller | 42 | Executive Vice President – Chief Merchandising Officer | ||
Kimberly F. Colby | 55 | Executive Vice President – Design | ||
Theresa Palermo | 41 | Executive Vice President – Chief Marketing Officer | ||
Mark C. Dely | 41 | Vice President – Chief Legal Officer and Corporate Secretary | ||
John Enwright | 44 | Vice President – Financial, Planning and Analysis and Interim Chief Financial Officer | ||
Robert Wallstrom has served as our Chief Executive Officer, President and Director since November 2013. Prior to joining Vera Bradley, Mr. Wallstrom served as President of Saks Fifth Avenue’s OFF 5TH division from 2007 until November 2013. Previously, he was Group Senior Vice President and General Manager of Saks’ flagship New York store from 2002 to 2007, where he articulated a vision to return the store to its luxury heritage and dramatically improve merchandising, service and the in-store experience.
Barbara Bradley Baekgaard co-founded Vera Bradley in 1982 and has served as a director since then. From 1982 through June 2010, she also served as Co-President. From the outset, Ms. Bradley Baekgaard has provided leadership and strategic direction in our brand’s development by providing creative vision to areas such as marketing, product design, assortment planning, and
13
the design and visual merchandising of our stores. In May 2010, she was appointed Chief Creative Officer. Ms. Bradley Baekgaard currently serves as a member of the Indiana University Simon Cancer Center Development Board and as a member of the board of directors of the Vera Bradley Foundation for Breast Cancer.
Kevin J. Sierks has served as our Executive Vice President – Chief Financial Officer since February 2014. Mr. Sierks joined the Company as the Vice President – Controller and Chief Accounting Officer in December 2011, and also served as the Interim Chief Financial Officer from January 2013 through January 2014. Prior to joining Vera Bradley, from 2007 to 2011 Mr. Sierks served as Vice President – Controller at Biomet, Inc., a large orthopedic medical device company. Mr. Sierks previously served as Director of Accounting and U.S. Shared Services at Boston Scientific Corporation from 2005 to 2007. From 2002 to 2005, Mr. Sierks served as Director of Financial Reporting and Business Development at Guidant Corporation, which was acquired by Boston Scientific Corporation in 2006. Mr. Sierks is a Certified Public Accountant. Mr. Sierks will be leaving the Company effective March 31, 2017; at that time, John Enwright will assume the Interim CFO position.
Sue Fuller has served as our Executive Vice President – Chief Merchandising Officer since January 2014. Prior to joining Vera Bradley, Ms. Fuller served as Senior Vice President, General Merchandise Manager of Carhartt, Inc. from July 2010 through November 2013. Between 2005 and July 2010, she served in various roles of increasing responsibility with Kohl’s Department Stores, including Director, Product Development for Juniors Private Label. Ms. Fuller gained prior experience with L.L. Bean, Lands’ End and Polo Ralph Lauren.
Kimberly F. Colby has served as our Executive Vice President – Design since 2005. From 2003 through 2005, she served as our Vice President of Design. From 1989 to 2003, Ms. Colby served as our Design Director responsible for Marketing and Product Development. Ms. Colby’s professional history includes retail advertising, public relations, direct mail creative direction and management, special event planning, and interior design.
Theresa Palermo has served as our Executive Vice President – Chief Marketing Officer since June 2015. Between 2013 and June 2015, Ms. Palermo served as Vice President, Global Marketing and Public Relations for Fossil Group, where she successfully created and executed innovative marketing strategies and campaigns for their extensive portfolio of luxury and fashion brands across North and Central America. Ms. Palermo joined Fossil in 2011 as Global Senior Director of Marketing. Prior to joining Fossil, Ms. Palermo held key marketing roles of increasing responsibility with several well-known retailers including global footwear company Collective Brands, The Timberland Company and the J. Jill Group.
Mark C. Dely joined the Company in August 2016 as our Vice President, Chief Legal Officer and Corporate Secretary. Between January 2013 and August 2016, Mr. Dely served as Senior Vice President, Chief Legal Officer, General Counsel and Secretary of Fred’s, Inc., a publicly-traded retailer and pharmacy with over 650 locations throughout the Southeast. From July 2007 to December 2012, Mr. Dely was Vice President and Divisional General Counsel of the Franchise Services Group for The ServiceMaster Company, where he managed the legal function for the Company's global franchise businesses. Mr. Dely’s additional experience includes being the first in-house counsel for NYSE-listed seed and agricultural-biotech company, Delta and Pine Land Company. Mr. Dely began his legal career at New York law firm Fried Frank, LLP. He earned his law degree from the New York University School of Law.
John Enwright joined the Company in May 2014 as our Senior Director of Financial, Planning and Analysis and was soon promoted to his current post as Vice President, Financial, Planning and Analysis. In addition, Mr. Enwright has been named Interim Chief Financial Officer upon the departure of Mr. Sierks effective March 31, 2017. Prior to joining Vera Bradley, Mr. Enwright spent 15 years with Tiffany & Co. in various financial roles of increasing responsibility, including his most recent position of Director of Financial, Planning and Analysis.
Available Information
Our Annual Reports on Form 10-K, Quarterly Reports on Form 10-Q, Current Reports on Form 8-K, and all amendments to these reports filed or furnished pursuant to Section 13(a) or 15(d) of the Securities Exchange Act of 1934 are available free of charge on our website, www.verabradley.com, as soon as reasonably practicable after they are filed with or furnished to the Securities and Exchange Commission (“SEC”). No information contained on our website is intended to be included as part of, or incorporated by reference into, this Annual Report on Form 10-K.
14
Item 1A. Risk Factors
You should carefully consider all of the information in this report, including the following factors, which could materially affect our business, financial condition, and results of operations in future periods. The risks described below are not the only risks that we face. Additional risks not currently known to us, or that we currently deem to be immaterial, also may materially adversely affect our business, financial condition, and results of operations in future periods.
Risks Related to Our Business
If we are unable to successfully implement our long-term strategic plan and growth strategies, our future operating results could suffer.
In fiscal 2015, we began to implement a long-term strategic plan focused on product, distribution, and marketing strategies intended to profitably grow our business. The success of our long-term strategic plan and these growth strategies, alone or collectively, will depend on various factors, including the appeal of our product designs, retail presentation to consumers, effectiveness of our marketing initiatives, competitive conditions, and economic conditions. There is no assurance that we will be able to successfully implement our strategic plan. If we are unsuccessful in implementing some or all of our strategies or initiatives, our future operating results could be adversely impacted.
Changes in general economic conditions, and their impact on consumer confidence and consumer spending, could adversely impact our results of operations.
Our performance is subject to general economic conditions and their impact on levels of consumer confidence and consumer spending. Consumer confidence and consumer spending may be influenced by fluctuating interest rates and credit availability, changing fuel and other energy costs, fluctuating commodity prices, levels of unemployment and consumer debt levels, changes in net worth based on market conditions, general uncertainty regarding the overall future economic environment, and weather and weather-related phenomena. Consumer purchases of discretionary items, including our merchandise, generally decline during periods when disposable income is adversely affected or there is economic uncertainty, and this could adversely impact our results of operations. In the event that the U.S. economy worsens, or if there is a decline in consumer-spending levels or other unfavorable conditions, including inflation, we could experience lower than expected net revenues, which could force us to delay or slow the implementation of our growth strategies and adversely impact our results of operations.
Our inability to predict and respond in a timely manner to changes in consumer demand could adversely affect our net revenues and results of operations.
Our success depends on our ability to gauge the fashion tastes of our customers and to provide merchandise that satisfies consumer demand in a timely manner. Our products must appeal to a broad range of consumers whose preferences cannot be predicted with certainty and are subject to rapid change. We cannot assure you that we will be able to develop appealing patterns and styles or meet changing consumer demands in the future. If we misjudge the market for our products, we may be faced with significant excess inventories for some products and missed opportunities for other products. In addition, changes to our product assortment and to our available fabrications, as well as the availability and breadth of pattern assortment may not gain consumer acceptance. Merchandise misjudgments could adversely impact our net revenues and results of operations.
We may continue to experience declines in comparable sales and there can be no guarantee that the strategic initiatives we are implementing to improve our results will be successful.
We may not be able to regain the levels of comparable sales that we have experienced in the past, and comparable sales may also further deteriorate. If our future comparable sales fail to meet market expectations, then the price of our common stock could decline. Also, the aggregate results of operations of our stores have fluctuated in the past and will fluctuate in the future. Numerous factors influence comparable sales, including fashion trends, competition, national and regional economic conditions, pricing, inflation, the timing of the release of new merchandise and promotional events, changes in our merchandise mix, marketing programs, changes in consumer shopping trends, site selection strategy, and weather conditions. These factors may cause our comparable sales results to be lower in the future than in recent periods or lower than expectations, either of which could result in a decline in the price of our common stock.
If our multi-channel distribution model is not successful, our business and results of operations may suffer.
We currently sell into two segments: Direct to consumers through our full-line and factory outlet stores in the United States, verabradley.com, direct-to-consumer eBay sales, and our annual outlet sale in Fort Wayne, Indiana; and through our Indirect wholesale business which consists of sales to approximately 2,600 specialty retail locations, substantially all of which are located in the United States, as well as department stores, national accounts, third party e-commerce sites, the Company's
15
wholesale customer in Japan, and third party inventory liquidators. These channels are sometimes in direct competition and sales through these channels may not be incremental to total sales.
We may not be able to successfully open new stores and/or operate new and current stores as planned, which could adversely impact our results of operations.
Our long-term future growth will depend on our ability to successfully open and operate new and current stores. We plan to open approximately six new stores during fiscal 2018, and additional new stores each year thereafter. Our ability to successfully open and operate stores depends on many factors, including our ability to:
• | identify suitable store locations, the availability of which may be uncertain; |
• | negotiate acceptable lease terms, including desired tenant improvement allowances; |
• | hire, train, and retain store personnel and management; |
• | assimilate new store personnel and management into our corporate culture; |
• | source and manufacture inventory; and |
• | successfully integrate new stores into our existing operations and information technology systems. |
The success of new store openings may also be affected by our ability to initiate marketing efforts in advance of opening our first store in a particular region. Additionally, we will incur pre-opening costs and we may encounter initial losses while new stores commence operations, which could strain our resources and adversely impact our results of operations.
Our business depends on a strong brand. If we are unable to execute our brand strategy, intended to enhance our brand, then revenues and our results of operations could be adversely impacted.
We believe that the brand image that we have developed has contributed significantly to the success of our business. We also believe that enhancing the Vera Bradley brand through our new brand strategy is critical to maintaining and expanding our customer base. Enhancing our brand and implementing our new brand strategy may require us to make substantial investments in areas such as product design, store operations, store design, community relations, and marketing. These investments might not succeed. If we are unable to successfully execute our brand strategy, our results of operations could be adversely impacted.
Our results of operations could suffer if we lose key management or design associates or are unable to attract and retain the talent required for our business.
Our performance depends largely on the efforts and abilities of our senior management and product development teams. These executives and design associates have substantial experience in our business and have made significant contributions to our growth and success. Although we have entered into an employment agreement with our Chief Executive Officer, we may not be able to retain his services or those of other key individuals in the future. The unexpected loss of services of key employees could have adverse impacts on our business and results of operations. As our business grows and we open new stores, we will need to attract and retain additional qualified employees and develop, train, and manage an increasing number of management-level, sales, and other employees. Competition for qualified employees is intense. We cannot assure you that we will be able to attract and retain employees as needed in the future.
Our results of operations are subject to quarterly fluctuations, which could adversely affect the market price of our common stock.
Our quarterly results of operations may fluctuate significantly as a result of a variety of factors, including, among other things:
• | timing of new store openings; |
• | net revenues and profits contributed by new stores; |
• | increases or decreases in store traffic and comparable sales; |
• | shifts in the timing of holidays, particularly in the United States and China; |
• | changes in our merchandise mix; |
• | timing of marketing campaigns or promotions; |
• | timing of sales to Indirect retailers; and |
• | timing of new pattern and collection releases and new product introductions. |
16
Any quarterly fluctuations that we report in the future may not match the expectations of market analysts and investors. This could cause the trading price of our common stock to fluctuate significantly.
A data security or privacy breach could damage our reputation and our relationships with our customers, expose us to litigation risk and adversely affect our business.
We are dependent on information technology systems and networks, including the Internet, for a significant portion of our sales, primarily through our e-commerce operations and credit card transaction authorization and processing. We are also responsible for storing data relating to our customers and employees and rely on third parties for the operation of our e-commerce websites and for the various social media tools and websites we use as part of our marketing strategy. As part of our normal course of business, we often collect, retain, and transmit certain sensitive and confidential customer information, including credit card information, over public networks. There is a significant concern by consumers and employees over the security of personal information transmitted over the Internet, consumer identity theft and user privacy. Despite the security measures we currently have in place, our facilities and systems and those of our third party service providers may be vulnerable to security breaches, acts of vandalism, computer viruses, misplaced or lost data, programming and/or human errors, or other similar events. Any electronic or physical security breach involving the misappropriation, loss or other unauthorized disclosure of confidential or personally identifiable information, including penetration of our network security, whether by us or by a third-party, could disrupt our business, severely damage our reputation and our relationships with our customers, expose us to risks of litigation and liability and adversely affect our business and results of operations. We do not control third-party service providers and cannot guarantee that electronic or physical computer break-ins and security breaches will not occur in the future. Any perceived or actual unauthorized disclosure of personally identifiable information regarding our customers or website visitors could harm our reputation and credibility, reduce our e-commerce net sales, impair our ability to attract website visitors and reduce our ability to attract and retain customers. We may also incur significant costs in complying with the various applicable state, federal and foreign laws regarding unauthorized disclosure of personal information.
Our business could suffer if our computer systems and websites are disrupted or cease to operate effectively.
We are dependent on our computer systems to record and process transactions and manage and operate our business, including in designing, marketing, manufacturing, importing, tracking and distributing our products, processing payments, and accounting for and reporting results. We also utilize an automated replenishment system to facilitate the processing of basic replenishment orders, the movement of goods through distribution channels, and the collection of information for planning and forecasting. In addition, we have an e-commerce website in the U.S. Given the complexity of our business and the significant number of transactions that we engage in on an annual basis, it is imperative that we maintain constant operation of our computer hardware and software systems. Despite our preventative efforts, our systems are vulnerable from time to time to damage or interruption from, among other things, security breaches, computer viruses or power outages. Any material disruptions in our information technology systems could have a material adverse effect on our business, financial condition and results of operations.
We are exposed to business risks as a result of our e-commerce operations.
We operate an e-commerce store at www.verabradley.com. Expanding our e-commerce business is one of the key objectives of our business strategy. Our e-commerce operations are subject to numerous risks, including unanticipated operating problems, reliance on third-party computer hardware and software providers, system failures and the need to invest in additional computer systems. Specific risks include: (i) diversion of sales from our stores; (ii) rapid technological change; (iii) liability for e-commerce content; and (iv) risks related to the failure of the computer systems that operate the websites and their related support systems, including from computer viruses, telecommunication failures and electronic break-ins and similar disruptions. Internet operations involve risks which may be beyond our control that could have a direct material adverse effect on our operating results, including: (i) price competition involving the items we intend to sell; (ii) the entry of our vendors into the Internet business in direct competition with us; (iii) the level of merchandise returns experienced by us; (iv) governmental regulation; (v) e-commerce security breaches involving unauthorized access to our and/or customer information; (vi) credit card fraud; and (vii) competition and general economic conditions specific to the Internet, e-commerce and the accessories industry. Our inability to effectively address these risks and any other risks that we face in connection with our Internet operations could materially adversely affect our business, financial condition, results of operations and/or cash flows.
Closing stores could result in significant costs to us.
Since December 2014, we have closed three underperforming stores and could, in the future, decide to close additional stores that are producing losses or that are not as profitable as we expect. If we decide to close any stores before the expiration of their lease terms, we may incur payments to landlords to terminate or “buy out” the remaining term of the lease. We also may incur costs related to the employees at such stores, whether or not we terminate the leases early. Upon any such closure, the closing
17
costs, including fixed assets and inventory write-downs, could adversely affect our results and could adversely affect our cash on hand.
Our Company's ability to attract customers to our stores depends heavily on the success of the shopping centers in which many of our stores are located.
Substantially all of our Direct stores are located in regional mall shopping centers, and many of our Indirect customers are also located in these shopping centers. Factors beyond our control impact mall traffic, such as general economic conditions and consumer spending levels. Consumer spending and mall traffic have been depressed in recent years. As a result, mall operators have been facing increasing operational and financial difficulties. The increasing inability of mall “anchor” tenants and other area attractions to generate consumer traffic around our stores, the increasing inability of mall operators to attract “anchor” tenants and maintain viable operations and the increasing departures of existing “anchor” and other mall tenants due to declines in the sales volume and in the popularity of certain malls as shopping destinations, have reduced and may continue to reduce our sales volume and, consequently, adversely affect our financial condition, results of operations and cash flows.
We are subject to risks associated with leasing substantial amounts of space, including future increases in occupancy costs.
We lease all of our store locations. We typically occupy our stores under operating leases with terms of ten years. We have been able to negotiate favorable rental rates in recent years due in part to the state of the economy and high vacancy rates within some shopping centers, but there is no assurance that we will be able to continue to negotiate such favorable terms. Some of our leases have early cancellation clauses, which permit the lease to be terminated by us or the landlord if certain sales levels are not met in specific periods or if the shopping center does not meet specified occupancy standards. In addition to requiring future minimum lease payments, some of our store leases provide for the payment of common area maintenance charges, real property insurance, and real estate taxes. Many of our lease agreements have escalating rent provisions over the initial term and any extensions. As we expand our store base, our lease expense and our cash outlays for rent under lease agreements will increase. Our substantial operating lease obligations could have significant negative consequences, including:
• | requiring that a substantial portion of our available cash be applied to pay our rental obligations, thus reducing cash available for other purposes; |
• | increasing our vulnerability to general adverse economic and industry conditions; |
• | limiting our flexibility in planning for or reacting to changes in our business or industry; and |
• | limiting our ability to obtain additional financing. |
Any of these consequences could place us at a disadvantage with respect to our competitors. We depend on cash flow from operating activities to pay our lease expenses and to fulfill our other cash needs. If our business does not generate sufficient cash flow from operating activities to fund these expenses and needs, we may not be able to service our lease expenses, grow our business, respond to competitive challenges, or fund our other liquidity and capital needs, which would harm our business.
Additional sites that we lease may be subject to long-term non-cancelable leases if we are unable to negotiate our current standard lease terms. If an existing or future store is not profitable, and we decide to close it, we may nonetheless be committed to perform our obligations under the applicable lease, including paying the base rent for the balance of the lease term. Moreover, even if a lease has an early cancellation clause, we may not satisfy the contractual requirements for early cancellation under the lease. Our inability to enter new leases or renew existing leases on acceptable terms or be released from our obligations under leases for stores that we close would, in any such case, affect us adversely.
Our failure to effectively compete with other retailers for sales could have a material adverse effect on our financial condition, results of operations and cash flows.
The market for bags, accessories, and travel items is increasingly competitive. Our competitive challenges include:
• | attracting customer traffic; |
• | sourcing and manufacturing merchandise efficiently; |
• | competitively pricing our products and achieving customer perception of value; |
• | maintaining favorable brand recognition and effectively marketing our products to consumers in diverse market segments; |
• | developing designs that appeal to a broad range of demographic and age segments; |
• | developing high-quality products; |
• | offering attractive promotional incentives while maintaining profit margins; and |
18
• | establishing and maintaining good working relationships with our Indirect retailers. |
In our Indirect business, we compete with numerous manufacturers, importers, and distributors of handbags, accessories, and other products for the limited space available for the display of such products to the consumer. In our Direct business, we compete against other gift and specialty retailers, department stores, catalog retailers, and Internet businesses that engage in the retail sale of similar products. Moreover, the general availability of contract manufacturing allows new entrants easy access to the markets in which we compete, which may increase the number of competitors and adversely affect our competitive position and our business.
In addition, in light of a continued difficult consumer environment, pricing is a significant driver of consumer choice in our industry and we regularly engage in price competition, particularly through our promotional programs. To the extent that we decrease our promotional activity, our ability to maintain sales levels may be impacted.
We rely on various contract manufacturers to produce all of our products and generally do not have long-term contracts with our manufacturers. Disruptions in our contract manufacturers’ systems, losses of manufacturing certifications, or other actions by these manufacturers could increase our cost of sales, adversely affect our net revenues, and injure our reputation and customer relationships, thereby harming our business.
Our various contract manufacturers produce all of our products. We generally do not enter into long-term formal written agreements with our manufacturers and instead transact business with each of them on an order-by-order basis. In the event of a disruption in our contract manufacturers’ systems, we may be unable to locate alternative manufacturers of comparable quality at an acceptable price, or at all. Identifying a suitable manufacturer is an involved process that requires us to become satisfied with the prospective manufacturer’s quality control, responsiveness and service, financial stability, labor practices and environmental compliance. Any delay, interruption, or increased cost in the manufactured products that might occur for any reason, such as the lack of long-term contracts or regulatory requirements and the loss of certifications, power interruptions, fires, hurricanes, war, or threats of terrorism, could affect our ability to meet customer demand for our products, adversely affect our net revenues, increase our cost of sales, and hurt our results of operations. In addition, manufacturing disruption could injure our reputation and customer relationships, thereby harming our business.
We rely on various suppliers to supply a significant majority of our raw materials. Disruption in the supply of raw materials could increase our cost of goods sold and if there are not sufficient raw materials available to meet product demand, our product revenue could decline.
We generally do not enter into long-term formal written agreements with our suppliers and typically transact business with each of them on an order-by-order basis. In the event of a significant disruption in the supply of fabrics or raw materials from our current sources, we may not be able to locate alternative suppliers of materials of comparable quality at an acceptable price, or at all. In such a case, we could have difficulty meeting consumer demand and net revenues could be adversely impacted.
We rely on a single distribution facility for all of the products we sell. Disruption to that facility could adversely impact our results of operations, and expansion of that facility could have unpredictable adverse effects.
Our distribution operations are currently concentrated in a single, company-owned distribution center in Fort Wayne, Indiana. Any significant disruption in the operation of the facility due to natural disaster or severe weather, or events such as fire, accidents, power outages, system failures, or other unforeseen causes, could devalue or damage a significant portion of our inventory and could adversely affect our product distribution and sales until such time as we could secure an alternative facility. If we encounter difficulties with our distribution facility or other problems or disasters arise, we cannot ensure that critical systems and operations will be restored in a timely manner or at all, and this would have a material adverse effect on our business. In addition, our growth could require us to further expand our current facility, which could affect us adversely in ways that we cannot predict.
The cost of raw materials could increase our cost of sales and cause our results of operations to suffer.
Fluctuations in the price, availability, and quality of fabrics or other raw materials used to manufacture our products, as well as the price for labor, marketing, and transportation, could have adverse impacts on our cost of sales and our ability to meet our customers’ demands. In particular, fluctuations in the price of cotton, our primary raw material, could have an adverse impact on our cost of sales. In addition, because a key component of our products is petroleum-based, the cost of oil affects the cost of our products. Upward movement in the price of oil in the global oil markets would also likely result in rising fuel and freight prices, which could increase our shipping costs. In the future, we may not be able to pass all or a portion of higher costs on to our customers.
19
Our business is subject to the risks inherent in global sourcing and manufacturing activities.
We source our fabrics primarily from manufacturers in China and South Korea and outsource the production of a significant majority of our products to companies in Asia. We are subject to the risks inherent in global sourcing and manufacturing, including, but not limited to:
• | exchange rate fluctuations and trends; |
• | availability of raw materials; |
• | compliance with labor laws and other foreign governmental regulations; |
• | compliance with U.S. import and export laws and regulations; |
• | disruption or delays in shipments; |
• | loss or impairment of key manufacturing sites; |
• | product quality issues; |
• | political unrest; and |
• | natural disasters, acts of war and terrorism, changing macroeconomic trends, and other external factors over which we have no control. |
Significant disruption of manufacturing for any of the above reasons could interrupt product supply and, if not remedied in a timely manner, could have an adverse impact on our results of operations. Additionally, we do not have complete oversight over our contract manufacturers. Violation of labor or other laws by those manufacturers, or the divergence of a contract manufacturer’s labor or other practices from those generally accepted as ethical in the United States or in other markets in which we may in the future do business, could also draw negative publicity for us and our brand, diminishing the value of our brand and reducing demand for our products.
Our ability to source our products at favorable prices, or at all, could be harmed, with adverse effects on our results of operations, if new trade restrictions are imposed or if existing trade restrictions become more burdensome.
A significant majority of our products are currently manufactured for us in Asia. The United States and the countries in which our products are produced have imposed and may impose additional quotas, duties, tariffs, or other restrictions or regulations or may adversely adjust prevailing quotas, duties, or tariffs. Countries impose, modify, and remove tariffs and other trade restrictions in response to a diverse array of factors, including global and national economic and political conditions, which make it impossible for us to predict future developments regarding tariffs and other trade restrictions. Trade restrictions, which include embargoes, safeguards, and customs restrictions, could increase the cost or reduce the supply of products available to us or could require us to modify our supply chain organization or other current business practices, any of which could harm our results of operations.
We may be subject to unionization, work stoppages, slowdowns or increased labor costs.
Currently, none of our employees are represented by a union. Nevertheless, our employees have the right at any time under the National Labor Relations Act to organize or affiliate with a union. If some or all of our workforce were to become unionized, our business would be exposed to work stoppages and slowdowns as a unionized business. If, in addition, the terms of the collective bargaining agreement were significantly more favorable to union workers than our current pay-and-benefits arrangements, our costs would increase and our results of operations would suffer.
We rely on independent transportation providers for substantially all of our product shipments.
We currently rely on independent transportation service providers for substantially all of our product shipments. Our utilization of these delivery services, or those of any other shipping companies that we may elect to use, is subject to risks, including increases in fuel prices, which would increase our shipping costs, employee strikes and inclement weather, which may impact the shipping company’s ability to provide delivery services sufficient to meet our shipping needs.
If for any reason we were to change shipping companies, we could face logistical difficulties that might adversely affect deliveries, and we would incur costs and expend resources in the course of making the change. Moreover, we might not be able to obtain terms as favorable as those received from the service providers that we currently use, which in turn would increase our costs. We also would face shipping and distribution risks and uncertainties associated with any expansion of our distribution facility and related systems.
20
Our inability or failure to protect our intellectual property or our infringement of other’s intellectual property could have a negative impact on our operating results.
We believe that our registered copyrights, registered and common law trademarks, and other proprietary rights have significant value and are critical to our ability to create and sustain demand for our products. Although we have not been inhibited from selling our products in connection with intellectual property disputes, we cannot assure you that obstacles will not arise as we expand our product line and extend our brand as well as the geographic scope of our sales and marketing. We also cannot assure you that the actions taken by us to establish and protect our proprietary rights will be adequate to prevent imitation of our products or infringement of our rights by others. The legal regimes of some foreign countries, particularly China, may not protect proprietary rights to the same extent as the laws of the United States, and it may be more difficult for us to successfully challenge the use of our proprietary rights by others in these countries. The loss of copyrights, trademarks, and other proprietary rights could adversely impact our results of operations. Any litigation regarding our proprietary rights could be time consuming and costly.
We are also subject to the risk that claims will be brought against us for infringement of the intellectual property rights of third parties, seeking to block the sale of our products considered to violate their intellectual property rights or payment of monetary amounts. In particular, we are subject to copyright infringement claims for which we may not be entitled to indemnification from our suppliers. In addition, in recent years, companies in the retail industry, including us, have been subject to patent infringement claims from non-practicing entities, or “patent trolls.” Any infringement or other intellectual property claim made against us, whether or not it has merit, could be time-consuming and result in costly litigation. As a result, any such claim, or the combination of multiple claims, could have a material adverse effect on our operating results. If we are required to stop using any of our registered or nonregistered trademarks, our sales could decline and, consequently, our business and results of operations could be adversely affected.
Fluctuations in our tax obligations and effective tax rate may result in volatility of our operating results and stock price.
We are subject to income taxes in many U.S. and certain foreign jurisdictions. We record tax expense based on our estimates of future payments, which includes reserves for uncertain tax positions in multiple tax jurisdictions. At any one time, many tax years are subject to audit by various taxing jurisdictions. Further, possible changes in federal, state, local, and non-U.S. tax laws bearing upon our revenues, income, property, or other aspects of our operations or business would, if enacted, affect our results of operations in ways and to a degree that we cannot currently predict.
The results of the November 2016 U.S. elections have introduced greater uncertainty with respect to tax and trade policies, tariffs and government regulations affecting trade between the U.S. and other countries. The majority of our finished goods products, not sourced through licenses or strategic partners, are manufactured by a variety of global manufacturers located primarily in China, Vietnam and Cambodia. Major developments in tax policy or trade relations, such as the disallowance of tax deductions for imported merchandise or the imposition of unilateral tariffs on imported products, could have a material adverse effect on our business, results of operations and liquidity.
We have recorded asset impairment charges in the past and we may record material asset impairment charges in the future.
Quarterly, we assess whether events or changes in circumstances have occurred that indicate the carrying value of long-lived assets may not be recoverable. If we determine that the carrying value of long-lived assets is not recoverable, we will be required to record impairment charges relating to those assets. For example, our assessments during fiscal 2017 indicated that operating losses or insufficient operating income existed at certain retail stores, with a projection that the operating losses or insufficient operating income for those locations would continue. As such, we recorded non-cash charges of $12.7 million during fiscal 2017 within selling, general, and administrative expenses in the consolidated statements of operations to write down the carrying values of these stores' long-lived assets to their estimated fair values.
Our quarterly evaluation of store assets includes consideration of current and historical performance and projections of future profitability. The profitability projections rely upon estimates made by us, including store-level sales, gross margins, and direct expenses, and, by their nature, include judgments about how current strategic initiatives will impact future performance. If we are not able to achieve the projected key financial metrics for any reason, including because any of the strategic initiatives being implemented do not result in significant improvements in our current financial performance trend, this would indicate that the value of our long-lived assets was not recoverable and we would incur additional impairment of assets in the future.
In the event we record additional impairment charges, this could have a material adverse effect on our results of operations and financial condition.
21
Our Indirect business could suffer as a result of decisions by our Indirect retailers to decrease or eliminate the amount of merchandise purchased from us.
We do not enter into long-term agreements with any of our Indirect retailers. Instead, we enter into a number of purchase order commitments with our customers for each of our lines every season. A decision by a significant number of Indirect retailers, whether motivated by competitive conditions, operational or financial difficulties, reduced access to capital, or otherwise, to decrease or eliminate the amount of merchandise purchased from us or to change their manner of doing business with us could adversely impact our results of operations. Although we recommend retail sale prices for our products to our Indirect retailers, we do not provide dealer allowances or other economic incentives to support those prices. Possible promotional pricing or discounting by Indirect retailers in response to softening retail demand could have a negative effect on our brand image and prestige, which might be difficult to counteract as the economy improves.
Bankruptcies or other operational or financial difficulties of our Indirect retailers could adversely impact our business.
We sell our Indirect merchandise primarily to specialty retail and department stores across the United States and extend trade credit based on an evaluation of each Indirect retailer’s financial condition, usually without requiring collateral. Perceived or actual financial difficulties of a customer could cause us to curtail or eliminate business with that customer or could decrease demand for our products by that customer. Pending the resolution of a relationship with a financially troubled Indirect retailer, we might assume credit risk that we would otherwise avoid relating to our receivables from that customer. Inability to collect on accounts receivable from our Indirect retailers would adversely impact our results of operations.
There are claims made against us from time to time that can result in litigation or regulatory proceedings, which could distract management from our business activities and result in significant liability or damage to our brand image.
As a growing company with expanding operations, we increasingly face the risk of litigation and other claims against us. Litigation and other claims may arise in the ordinary course of our business and include employee claims, custom and duty claims, commercial disputes, intellectual property issues, product-oriented allegations, and slip and fall claims. Often these cases raise complex factual and legal issues, which are subject to risks and uncertainties and which could require significant management time. Litigation and other claims against us could result in unexpected expenses and liability, as well as materially adversely affect our operations and our reputation.
We may suffer negative publicity and our business may be harmed if we need to recall any products we sell.
We have in the past needed to, and may in the future need to, recall products that we determine may present safety issues. If products we sell have safety problems of which we are not aware, or if we or the Consumer Product Safety Commission recall a product sold in our stores, we may suffer negative publicity and, potentially, product liability lawsuits, which could have a material adverse impact on our reputation, financial condition and results of operations or cash flows.
Risks Related to the Securities Markets and Ownership of Our Common Stock
Our stock price may be volatile or may decline regardless of our operating performance, and you may not be able to resell shares at or above the price at which you purchase them.
The market price of our common stock may fluctuate significantly in response to a number of factors, most of which we cannot control, including:
• | actions by other shopping mall or lifestyle center tenants; |
• | weather conditions, particularly during the holiday shopping period; |
• | unexpected departure of key executives; |
• | financial projections that we may choose to provide to the public, any changes in these projections or our failure for any reason to meet these projections; |
• | public’s response to press releases or other public announcements by us or others, including our filings with the SEC and announcements relating to litigation and other matters; |
• | speculation about our business in the press or the investment community; |
• | future sales of our common stock by our significant shareholders, officers and directors; |
• | our entry into new markets; |
• | changes in laws or regulations that impact the retail industry; |
• | strategic actions by us or our competitors, such as acquisitions or restructurings; and |
22
• | changes in accounting principles. |
These and other factors may result in a lower market price of our common stock, regardless of our actual operating performance.
In addition, the stock markets, including The Nasdaq Global Select Market, have experienced extreme price and volume fluctuations that have affected and continue to affect the market prices of equity securities of many retail companies. In the past, stockholders have instituted securities class action litigation following periods of market volatility. If we were involved in securities litigation, we could incur substantial costs and our resources and the attention of management could be diverted from our business.
Our business could be negatively affected as a result of the actions of activist stockholders.
Over the last few years, proxy contests and other forms of stockholder activism have been directed against numerous public companies in retail businesses. We could become engaged in a consent solicitation, or proxy contest, or experience other stockholder activism, in the future. Activist shareholders may advocate for certain governance and strategic changes at our company. In the event of stockholder activism, particularly with respect to matters which our Board of Directors, in exercising their fiduciary duties, disagree with or have determined not to pursue, our business could be adversely affected because responding to actions by activist stockholders can be costly and time-consuming, disrupting our operations and diverting the attention of management, and perceived uncertainties as to our future direction may result in the loss of potential business opportunities and may make it more difficult to attract and retain qualified personnel, business partners and customers.
In addition, if faced with a consent solicitation or proxy contest, we may not be able to respond successfully to the contest or dispute, which would be disruptive to our business. If individuals are elected to our Board with a differing agenda, our ability to effectively and timely implement our strategic plan and create additional value for our stockholders may be adversely affected.
A limited number of shareholders control a large percentage of the voting power of our common stock, and therefore investors may have limited ability to determine the outcome of shareholder votes.
Michael Ray (our former CEO and Ms. Bradley Baekgaard's son in-law), Robert Hall, Barbara Bradley Baekgaard, Joan Hall (Mr. Hall’s wife and Ms. Bradley Baekgaard’s daughter), Patricia R. Miller and P. Michael Miller, directly or indirectly, beneficially own and have the ability to exercise voting control over, in the aggregate, 40.8% of our outstanding shares of common stock as of January 28, 2017. As a result, these shareholders are able to exercise significant influence over all matters requiring shareholder approval, including the election of directors, any amendments to our second amended and restated articles of incorporation and significant corporate transactions. This concentrated ownership of outstanding common stock may limit your ability to influence corporate matters, and the interests of these shareholders may not coincide with our interests or your interests. As a result, we may take actions that you do not believe to be in our interests or your interests and that could depress our stock price. In addition, this significant concentration of stock ownership may adversely affect the trading price of our common stock should investors perceive disadvantages in owning shares of common stock in a company that has such concentrated ownership.
Our actual operating results may differ significantly from our guidance.
From time to time, we provide guidance regarding our future performance that represents our management’s estimates as of the date of release. This guidance, which consists of forward-looking statements, is prepared by our management and is qualified by, and subject to, the assumptions and the other information contained or referred to in the release. Our guidance is not prepared with a view toward compliance with published guidelines of the American Institute of Certified Public Accountants, and neither our independent registered public accounting firm nor any other independent expert or outside party compiles or examines the guidance and, accordingly, no such person expresses any opinion or any other form of assurance with respect thereto.
Guidance is based upon a number of assumptions and estimates that, while presented with numerical specificity, are inherently subject to significant business, economic, and competitive uncertainties and contingencies, many of which are beyond our control and are based upon specific assumptions with respect to future business decisions, some of which will change. We generally state possible outcomes as high and low ranges which are intended to provide a sensitivity analysis as variables are changed, but are not intended to represent that actual results could not fall outside of the suggested ranges. The principal reason that we release this data is to provide a basis for our management to discuss our business outlook with analysts and investors. We do not accept any responsibility for any projections or reports published by any such persons.
Guidance is necessarily speculative in nature, and it can be expected that some or all of the assumptions of the guidance furnished by us will not materialize or will vary significantly from actual results. Accordingly, our guidance is only an estimate
23
of what management believes is realizable as of the date of release. Actual results will vary from the guidance and the variations may be material. Investors should also recognize that the reliability of any forecasted financial data diminishes the farther in the future that the data are forecast. In light of the foregoing, investors are urged to put the guidance in context and not to place undue reliance on it.
Anti-takeover provisions in our organizational documents and Indiana law may discourage or prevent a change in control, even if a sale of the Company would be beneficial to our shareholders, which could cause our stock price to decline and prevent attempts by shareholders to replace or remove our current management.
Our second amended and restated articles of incorporation and amended and restated bylaws contain provisions that may delay or prevent a change in control, discourage bids at a premium over the market price of our common stock, harm the market price of our common stock and diminish the voting and other rights of the holders of our common stock. These provisions include:
• | dividing our board of directors into three classes serving staggered three-year terms; |
• | authorizing our board of directors to issue preferred stock and additional shares of our common stock without shareholder approval; |
• | prohibiting shareholder action by written consent; |
• | prohibiting our shareholders from calling a special meeting of shareholders; |
• | prohibiting our shareholders from amending our amended and restated bylaws; and |
• | requiring advance notice for raising business matters or nominating directors at shareholders’ meetings. |
As permitted by our second amended and restated articles of incorporation and amended and restated bylaws, our board of directors also has the ability, should they so determine, to adopt a shareholder rights agreement, sometimes called a “poison pill,” providing for the issuance of a new series of preferred stock to holders of common stock. In the event of a takeover attempt, this preferred stock would give rights to holders of common stock (other than the potential acquirer) to buy additional shares of common stock at a discount, leading to the dilution of the potential acquirer’s stake. The adoption of a poison pill, or the board’s ability to do so, can have negative effects such as those described above.
As an Indiana corporation, we are governed by the Indiana Business Corporation Law (as amended from time to time, the “IBCL”). Under specified circumstances, certain provisions of the IBCL related to control share acquisitions, business combinations and constituent interests may delay, prevent or make more difficult unsolicited acquisitions or changes of control of us. These provisions also may have the effect of preventing changes in our management. It is possible that these provisions could make it more difficult to accomplish transactions that shareholders might deem to be in their best interest.
24
Item 1B. Unresolved Staff Comments
None.
Item 2. Properties
The following table sets forth the location, use, and size of our distribution, corporate facilities, and showrooms as of January 28, 2017. The leases on the leased properties expire at various times through 2028, subject to renewal options.
Location | Primary Use | Approximate Square Footage | Leased /Owned | |||
Roanoke, Indiana | Corporate headquarters, design center and showroom | 188,000 | Owned* | |||
Roanoke, Indiana | Warehouse and distribution | 428,500 | Owned** | |||
New York, New York | Office and showroom | 3,700 | Leased | |||
Hong Kong | Asia sourcing office | 5,100 | Leased | |||
Atlanta, Georgia | Showroom | 5,200 | Leased | |||
Dallas, Texas | Showroom | 1,800 | Leased | |||
Las Vegas, Nevada | Showroom | 2,200 | Leased | |||
* | The expansion of this property during fiscal 2015, added approximately 149,000 square feet to the existing building, which now serves as the Company's corporate headquarters. |
** | An additional 10,000 square feet of office space was added to this facility in fiscal 2015. |
As of January 28, 2017, we also leased 165 store locations in the United States, including five store locations opened or to be opened in fiscal 2018 and one store to be opened in fiscal 2019. See below for more information regarding the locations of our open stores as of January 28, 2017.
We consider these properties to be in good condition generally and believe that our facilities are adequate for our operations and provide sufficient capacity to meet our anticipated requirements. The properties in the above table are used by both the Direct segment and Indirect segment, excluding the three showrooms which are used exclusively by the Indirect segment.
25
Store Locations
Our full-line stores are located primarily in high-traffic regional malls, lifestyle centers, and mixed-use shopping centers across the United States. The following table shows the number of full-line and factory outlet stores we operated in each state as of January 28, 2017:
State | Total Number of Full-Line Stores | Total Number of Factory Outlet Stores | State | Total Number of Full-Line Stores | Total Number of Factory Outlet Stores | |||||||||
Alabama | 1 | 1 | Minnesota | 2 | 1 | |||||||||
Arizona | 3 | — | Missouri | 2 | 2 | |||||||||
California | 7 | — | Nebraska | — | 1 | |||||||||
Colorado | 3 | 1 | Nevada | — | 2 | |||||||||
Connecticut | 2 | 1 | New Jersey | 9 | 1 | |||||||||
Delaware | 1 | 1 | New York | 9 | 3 | |||||||||
Florida | 7 | 8 | North Carolina | 2 | 4 | |||||||||
Georgia | 2 | 2 | Ohio | 4 | 1 | |||||||||
Hawaii | 2 | 1 | Oklahoma | 2 | 1 | |||||||||
Illinois | 6 | 1 | Pennsylvania | 5 | 2 | |||||||||
Indiana | 2 | 1 | Rhode Island | 1 | — | |||||||||
Iowa | 1 | — | Tennessee | 3 | 2 | |||||||||
Kansas | 1 | — | Texas | 13 | 3 | |||||||||
Kentucky | 2 | 1 | Virginia | 3 | 2 | |||||||||
Louisiana | 2 | — | Washington | 1 | — | |||||||||
Maryland | 4 | — | Wisconsin | 2 | — | |||||||||
Massachusetts | 4 | 1 | Totals | 113 | 46 | |||||||||
Michigan | 5 | 2 | ||||||||||||
We lease all of our stores. Lease terms for our retail stores are generally ten years with options to renew for varying terms. The leases generally provide for a fixed minimum rental plus contingent rent, which is determined as a percentage of sales in excess of specified levels.
Item 3. Legal Proceedings
We may be involved from time to time, as a plaintiff or a defendant, in various routine legal proceedings incident to the ordinary course of our business. In the ordinary course, we are involved in the policing of our intellectual property rights. As part of our policing program, from time to time we file lawsuits in the United States and abroad, alleging acts of trademark counterfeiting, trademark infringement, trademark dilution, and ancillary and pendent state and foreign law claims. These actions often result in seizure of counterfeit merchandise and negotiated settlements with defendants. Defendants sometimes raise as affirmative defenses, or as counterclaims, the purported invalidity or unenforceability of our proprietary rights. We believe that the outcome of all pending legal proceedings in the aggregate will not have a material adverse effect on our business or financial condition.
Item 4. Mine Safety Disclosure
Not Applicable
26
PART II
Item 5. | Market for Registrant’s Common Equity, Related Stockholder Matters and Issuer Purchases of Equity Securities |
Our common stock is listed on the NASDAQ Global Select Market under the symbol “VRA”. The following table sets forth the high and low sales prices of our common stock, as reported by the NASDAQ Global Select Market, for each quarterly period in our two most recent fiscal years:
High | Low | |||||||
Fiscal 2017 Quarter ended: | ||||||||
January 28, 2017 | $ | 15.86 | $ | 11.29 | ||||
October 29, 2016 | 17.20 | 12.97 | ||||||
July 30, 2016 | 17.84 | 13.55 | ||||||
April 30, 2016 | 20.69 | 13.71 | ||||||
Fiscal 2016 Quarter ended: | ||||||||
January 30, 2016 | $ | 17.08 | $ | 10.54 | ||||
October 31, 2015 | 13.95 | 9.58 | ||||||
August 1, 2015 | 14.50 | 10.70 | ||||||
May 2, 2015 | 20.18 | 13.94 | ||||||
As of March 21, 2017, we had approximately 30 registered shareholders of record. The number of shareholders of record is based upon the actual number of shareholders registered at such date and does not include holders of shares in “street name” or persons, partnerships, associations, corporations, or other entities identified in security position listings maintained by depositories.
Unregistered Sales of Equity Securities and Use of Proceeds
On December 8, 2015, the Company's board of directors approved a share repurchase program (the “2015 Share Repurchase Program”) authorizing up to $50.0 million of repurchases of shares of the Company's common stock. The 2015 Share Repurchase Program expires in December 2017. The prior share repurchase program (the “2014 Share Repurchase Program”) was approved by the board of directors on September 9, 2014, and authorized share repurchases up to $40.0 million. The 2014 Share Repurchase Program was completed in fiscal 2016.
During the fiscal year ended January 28, 2017, the Company purchased and held 1,606,102 shares at an average price of $15.27 per share, excluding commissions, for an aggregate amount of $24.5 million, under the 2015 Share Repurchase Program.
During the fiscal year ended January 30, 2016, the Company purchased and held 2,481,367 shares at an average price of $12.57 per share, excluding commissions, for an aggregate amount of $31.2 million. Of these purchases, 283,354 shares at an average price of $14.64 per share, for an aggregate amount of $4.1 million, were purchased under the 2015 Share Repurchase Plan.
As of January 28, 2017, there was $21.3 million remaining available to repurchase shares of the Company's common stock under the 2015 Share Repurchase Program.
As of January 28, 2017, the Company held as treasury shares 4,708,454 shares of its common stock at an average price of $14.58 per share, excluding commissions, for an aggregate carrying amount of $68.7 million. The Company’s treasury shares may be issued under the 2010 Equity and Incentive Plan or for other corporate purposes.
Details on the shares repurchased under the program during the thirteen weeks ended January 28, 2017 are as follows:
Period | Total Number of Shares Purchased | Average Price Paid per Share | Total Number of Shares Purchased as Part of Publicly Announced Plans or Programs | Maximum Approximate Dollar Value of Shares that May Yet be Purchased Under the Plans or Program | |||||||||
October 30, 2016 - November 26, 2016 | 91,100 | $ | 13.33 | 91,100 | $ | 21,329,713 | |||||||
November 27, 2016 - December 31, 2016 | — | — | — | 21,329,713 | |||||||||
January 1, 2017 - January 28, 2017 | — | — | — | 21,329,713 | |||||||||
91,100 | $ | 13.33 | 91,100 | ||||||||||
27
Dividends
Our common stock began trading on October 21, 2010, following our initial public offering. Since that time, we have not declared any cash dividends, and we do not anticipate declaring any cash dividends in the foreseeable future.
Stock Performance Graph
The graph set forth below compares the cumulative shareholder return on our common stock between January 28, 2012, and January 28, 2017, to the cumulative return of (i) the S&P 500 Index and (ii) the S&P 500 Apparel, Accessories, and Luxury Goods Index over the same period. This graph assumes an initial investment of $100 on January 28, 2012, in our common stock, the S&P 500 Index, and the S&P 500 Apparel, Accessories, and Luxury Goods Index and assumes the reinvestment of dividends, if any.
The comparisons shown in the graph below are based on historical data. We caution that the stock price performance presented in the graph below is not necessarily indicative of, nor is it intended to forecast, the potential future performance of our common stock. Information used in the graph was obtained from The NASDAQ Stock Market website; we do not assume responsibility for any errors or omissions in such information.
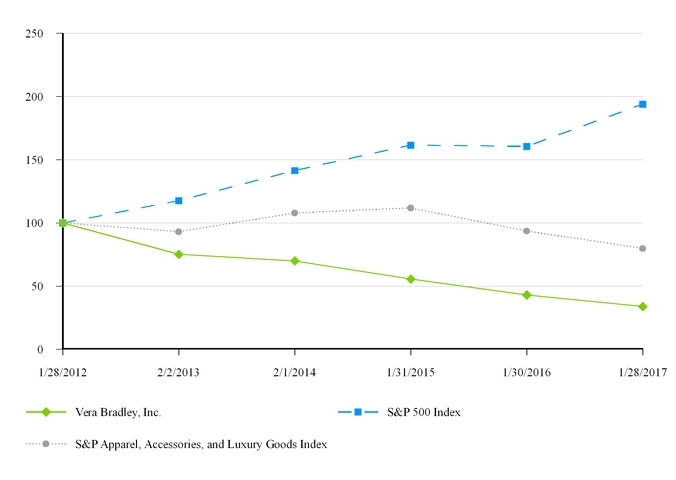
Company/Market/Peer Group | 1/28/2012 | 2/2/2013 | 2/1/2014 | 1/31/2015 | 1/30/2016 | 1/28/2017 | ||||||||||||||||||
Vera Bradley, Inc. | $ | 100.00 | $ | 75.15 | $ | 69.97 | $ | 55.55 | $ | 43.05 | $ | 33.79 | ||||||||||||
S&P 500 Index | $ | 100.00 | $ | 117.61 | $ | 141.49 | $ | 161.61 | $ | 160.54 | $ | 194.04 | ||||||||||||
S&P 500 Apparel, Accessories, and Luxury Goods Index | $ | 100.00 | $ | 92.94 | $ | 107.76 | $ | 111.72 | $ | 93.60 | $ | 79.75 | ||||||||||||
28
Item 6. Selected Financial Data
The following tables present selected consolidated financial and other data as of and for the years indicated. The selected income statement data for the most recent three fiscal years presented and the selected balance sheet data as of January 28, 2017 and January 30, 2016 are derived from our audited consolidated financial statements included in Item 8 of this report. The selected income statement data for the fiscal years ended February 1, 2014, and February 2, 2013, and selected balance sheet data as of January 31, 2015, February 1, 2014, and February 2, 2013, are derived from our audited consolidated financial statements that are not included elsewhere in this report. These results include adjustments necessary for comparability, including discontinued operations which is discussed further in Note 14 to the Consolidated Financial Statements. The historical results presented below are not necessarily indicative of the results to be expected for any future period. You should read this selected consolidated financial and other data in conjunction with the consolidated financial statements and related notes and the information under “Management’s Discussion and Analysis of Financial Condition and Results of Operations” appearing elsewhere in this report.
29
Fiscal Year Ended (1) | ||||||||||||||||||||
($ in thousands, except per share data and as otherwise indicated) | January 28, 2017 | January 30, 2016 | January 31, 2015 | February 1, 2014 | February 2, 2013 | |||||||||||||||
Consolidated Statement of Income Data (2): | ||||||||||||||||||||
Net revenues | $ | 485,937 | $ | 502,598 | $ | 508,990 | $ | 530,896 | $ | 535,667 | ||||||||||
Cost of sales | 209,891 | 221,409 | 239,981 | 238,684 | 231,135 | |||||||||||||||
Gross profit | 276,046 | 281,189 | 269,009 | 292,212 | 304,532 | |||||||||||||||
Selling, general, and administrative expenses (6) | 249,155 | 236,836 | 208,675 | 201,231 | 197,139 | |||||||||||||||
Other income | 1,329 | 2,369 | 3,736 | 4,776 | 6,277 | |||||||||||||||
Operating income | 28,220 | 46,722 | 64,070 | 95,757 | 113,670 | |||||||||||||||
Interest expense, net | 178 | 263 | 407 | 571 | 679 | |||||||||||||||
Income from continuing operations before income taxes | 28,042 | 46,459 | 63,663 | 95,186 | 112,991 | |||||||||||||||
Income tax expense | 8,284 | 18,901 | 22,828 | 35,057 | 40,597 | |||||||||||||||
Income from continuing operations | 19,758 | 27,558 | 40,835 | 60,129 | 72,394 | |||||||||||||||
Loss from discontinued operations, net of taxes | — | — | (2,386 | ) | (1,317 | ) | (3,524 | ) | ||||||||||||
Net income | $ | 19,758 | $ | 27,558 | $ | 38,449 | $ | 58,812 | $ | 68,870 | ||||||||||
Basic weighted-average shares outstanding | 36,838 | 38,795 | 40,568 | 40,599 | 40,536 | |||||||||||||||
Diluted weighted-average shares outstanding | 36,970 | 38,861 | 40,632 | 40,648 | 40,571 | |||||||||||||||
Net income (loss) per share - basic | ||||||||||||||||||||
Continuing operations | $ | 0.54 | $ | 0.71 | $ | 1.01 | $ | 1.48 | $ | 1.79 | ||||||||||
Discontinued operations | — | — | (0.06 | ) | (0.03 | ) | (0.09 | ) | ||||||||||||
Net income | $ | 0.54 | $ | 0.71 | $ | 0.95 | $ | 1.45 | $ | 1.70 | ||||||||||
Net income (loss) per share - diluted | ||||||||||||||||||||
Continuing operations | $ | 0.53 | $ | 0.71 | $ | 1.00 | $ | 1.48 | $ | 1.78 | ||||||||||
Discontinued operations | — | — | (0.06 | ) | (0.03 | ) | (0.09 | ) | ||||||||||||
Net income | $ | 0.53 | $ | 0.71 | $ | 0.95 | $ | 1.45 | $ | 1.70 | ||||||||||
Net Revenues by Segment (2): | ||||||||||||||||||||
Direct | $ | 355,175 | $ | 351,286 | $ | 335,602 | $ | 321,092 | $ | 287,083 | ||||||||||
Indirect | 130,762 | 151,312 | 173,388 | 209,804 | 248,584 | |||||||||||||||
Total | $ | 485,937 | $ | 502,598 | $ | 508,990 | $ | 530,896 | $ | 535,667 | ||||||||||
Store Data (3): | ||||||||||||||||||||
Total stores open at end of year | 159 | 150 | 125 | 99 | 76 | |||||||||||||||
Comparable sales (including e-commerce) (decrease) increase (4) | (7.0 | )% | (10.6 | )% | (7.6 | )% | (1.3 | )% | 9.8 | % | ||||||||||
Total gross square footage at end of year | 368,640 | 342,362 | 278,779 | 207,096 | 156,310 | |||||||||||||||
Average net revenues per gross square foot (5) | $ | 642 | $ | 703 | $ | 760 | $ | 887 | $ | 1,083 | ||||||||||
30
As of | ||||||||||||||||||||
($ in thousands) | January 28, 2017 | January 30, 2016 | January 31, 2015 | February 1, 2014 | February 2, 2013 | |||||||||||||||
Consolidated Balance Sheet Data: | ||||||||||||||||||||
Cash and cash equivalents | $ | 86,375 | $ | 97,681 | $ | 112,292 | $ | 59,215 | $ | 9,603 | ||||||||||
Short-term investments | 30,152 | — | — | — | — | |||||||||||||||
Working capital | 193,070 | 187,090 | 204,648 | 193,511 | 151,107 | |||||||||||||||
Total assets | 373,509 | 380,679 | 377,284 | 334,383 | 279,462 | |||||||||||||||
Long-term debt, including current portion | — | — | — | — | 15,095 | |||||||||||||||
Shareholders’ equity | 283,786 | 285,255 | 284,471 | 255,147 | 194,225 | |||||||||||||||
(1) | The Company utilizes a 52-53 week fiscal year. Fiscal years 2017, 2016, 2015 and 2014 consisted of 52 weeks. Fiscal year 2013 consisted of 53 weeks. |
(2) | Financial data recasts Japan results of operations as discontinued operations for all years presented. Japan was formerly included in the Direct segment results. Refer to Note 14 of the Notes to the Consolidated Financial Statements for additional information. |
(3) | Includes full-line and factory outlet stores. Our first full-line store opened in September 2007 and our first factory outlet store opened in November 2009. |
(4) | Comparable sales are calculated based upon our stores that have been open for at least 12 full fiscal months and net revenues from our e-commerce operations. Increase or decrease is reported as a percentage of the comparable sales for the same period in the prior fiscal year. Remodeled stores are included in comparable sales unless the store was closed for a portion of the current or comparable prior period or the remodel resulted in a significant change in square footage. Calculation excludes sales for the 53rd week in fiscal 2013. |
(5) | Dollars not in thousands. Average net revenues per gross square foot are calculated by dividing total net revenues for our stores that have been open at least 12 full fiscal months as of the end of the period by total gross square footage for those stores. |
(6) | Impairment charges, related to underperforming stores, recognized totaled $12.7 million, $2.8 million, $0.4 million, $1.2 million and $0.2 million during the fiscal years ended January 28, 2017, January 30, 2016, January 31, 2015, February 1, 2014, and February 2, 2013, respectively. |
31
Item 7. Management’s Discussion and Analysis of Financial Condition and Results of Operations
You should read the following discussion in conjunction with the consolidated financial statements and accompanying notes and the information contained in other sections of this report, particularly under the headings “Risk Factors,” “Selected Financial Data” and “Business.” This discussion and analysis is based on the beliefs of our management, as well as assumptions made by, and information currently available to, our management. The statements in this discussion and analysis concerning expectations regarding our future performance, liquidity, and capital resources, as well as other non-historical statements in this discussion and analysis, are forward-looking statements. See “Forward-Looking Statements.” These forward-looking statements are subject to numerous risks and uncertainties, including those described under “Risk Factors.” Our actual results could differ materially from those suggested or implied by any forward-looking statements.
Executive Summary
Fiscal 2017 was the third year of our multi-year turnaround, and we made significant progress against key elements of our long-term strategic plan, laid out in March 2014, focusing on the key planks of product, distribution, and marketing. Specifically:
Strategic Progress
• | We made progress on our product strategies, including: |
• | Continuing to reinvigorate and modernize our cotton assortment with new patterns, styles, silhouettes, hardware, and functionality. We are also continuing to innovate and drive sales with the addition of non-cotton offerings to our assortment; |
• | Expanding our collegiate collection to represent over 70 schools; and |
• | Announcing six licensing agreements in the areas of bedding, hosiery, swim, tech, stationery, and publishing for products that will debut throughout fiscal 2018. |
• | We made progress on our distribution strategies, including: |
• | Opening four full-line stores, all in our new modern store design, including our first flagship store in New York, New York in the SoHo neighborhood, which features innovative design elements, limited edition items and a unique store experience; |
• | Opening six factory outlet stores; |
• | Implementing our store renovation strategy and completing refreshes of 14 of our higher-volume and traffic full-line stores by adding our new branding, including storefront facade, logo, and interior changes. We also completed facade updates at 15 of our newest full line stores to reflect our new logo and signage; |
• | Continuing to work on the redesign and conversion of verabradley.com to a new platform, creating a dynamic digital flagship which launched in February 2017. The new site offers a number of enhancements including, among others, the ability to strategically segment and personalize messaging, express check-out, and “order on-line, pickup in-store;” and |
• | Adding additional distribution to approximately 130 Macy's, Belk and Bon-Ton department stores. |
• | We drove customer engagement through our marketing programs by: |
• | Increasing brand visibility and igniting a social movement with our multi-faceted “It's Good to be a Girl” marketing campaign; |
• | An intensified emphasis on influencers, social, mobile, and video content than in years past; and |
• | Generating over 500 million impressions through: |
▪ | National ads, editorial content, and gift guides in publications such as People StyleWatch, InStyle, Glamour, and Seventeen and appearing in Oprah's Favorite Things Holiday Gift Guide; |
▪ | Online and digital ads on Hulu, Pandora, and the Conde Nast network; and |
▪ | Increased influencer and celebrity marketing. |
Financial Summary
• | Net revenues decreased 3.3% to $485.9 million in fiscal 2017 compared to $502.6 million in fiscal 2016. |
• | Direct segment sales increased 1.1% to $355.2 million in fiscal 2017 compared to $351.3 million in fiscal 2016. Comparable sales for fiscal 2017 decreased 7.0%. |
32
• | Indirect segment sales decreased 13.6% to $130.8 million in fiscal 2017 compared to $151.3 million in fiscal 2016. |
• | Gross profit was $276.0 million (56.8% of net revenue) in fiscal 2017 compared to $281.2 million (55.9% of net revenue) in fiscal 2016. |
• | Selling, general and administrative expenses were $249.2 million (51.3% of net revenue) in fiscal 2017 compared to $236.8 million (47.1% of net revenue) in fiscal 2016. |
• | Operating income was $28.2 million (5.8% of net revenue) in fiscal 2017 compared to $46.7 million (9.3% of net revenue) in fiscal 2016. |
• | Net income was $19.8 million in fiscal 2017 compared to $27.6 million in fiscal 2016. |
• | Diluted net income per share decreased 25.4% to $0.53 in fiscal 2017 from $0.71 in fiscal 2016. |
• | Store impairment charges were $12.7 million ($8.0 million after the associated tax benefit) in fiscal 2017 compared to $2.8 million ($1.8 million after the associated tax benefit) in fiscal 2016. |
• | Cash and cash equivalents and short-term investments were $116.5 million at January 28, 2017 compared to $97.7 million at January 30, 2016. |
• | Capital expenditures for fiscal 2017 totaled $20.8 million, which were funded from cash generated from operations of $65.2 million. |
• | Repurchases of common stock for fiscal 2017 totaled $24.5 million, or 1.6 million shares, compared to $31.2 million, or 2.5 million shares, in fiscal 2016. |
Discontinued Operations
In June 2014, we entered into a five-year agreement with Mitsubishi Corporation Fashion Company and Look Inc. for the
importation and distribution of Vera Bradley products in Japan. As a result of moving to this wholesale business model, we exited our direct business in Japan during the third quarter of fiscal 2015 and have accounted for it as a discontinued operation. Consolidated income statement and Direct segment results for the current and prior periods presented are reported on a continuing operations basis unless otherwise stated.
How We Assess the Performance of Our Business
In assessing the performance of our business, we consider a variety of performance and financial measures.
Net Revenues
Net revenues reflect revenues from the sale of our merchandise and from distribution and shipping and handling fees, less returns and discounts. Revenues for the Direct segment reflect sales through our full-line and factory outlet stores, verabradley.com, direct-to-consumer eBay sales, and our annual outlet sale in Fort Wayne, Indiana. Revenues for the Indirect segment reflect sales to specialty retail partners, department stores, national accounts, third party e-commerce sites, our wholesale customer in Japan, and third party inventory liquidators. As of January 28, 2017, our specialty retail locations have decreased to approximately 2,600 locations from their peak during fiscal 2013 of approximately 3,600 locations.
Comparable Sales
Comparable sales are calculated based upon our stores that have been open for at least 12 full fiscal months and net revenues from our e-commerce operations. Comparable store sales are calculated based solely upon our stores that have been open for at least 12 full fiscal months. Remodeled stores are included in comparable sales and comparable store sales unless the store was closed for a portion of the current or comparable prior period or the remodel resulted in a significant change in square footage. Some of our competitors and other retailers calculate comparable or “same store” sales differently than we do. As a result, data in this report regarding our comparable sales and comparable store sales may not be comparable to similar data made available by other companies. Non-comparable sales include sales from stores not included in comparable sales or comparable store sales.
Measuring the change in year-over-year comparable sales allows us to evaluate how our store base and e-commerce operations are performing. Various factors affect our comparable sales, including:
• | Overall economic trends; |
• | Consumer preferences and fashion trends; |
• | Competition; |
33
• | Timing of our releases of new patterns and collections; |
• | Changes in our product mix; |
• | Pricing and level of promotions; |
• | Amount of store and mall traffic; |
• | Level of customer service that we provide in stores; |
• | Our ability to source and distribute products efficiently; |
• | Number of stores we open and close in any period; and |
• | Timing and success of promotional and advertising efforts. |
In recent years, comparable store sales have declined. Consequently, we do not currently have any new full-line stores planned to be opened during fiscal 2018. We expect to relocate or close up to 15 underperforming full-line stores over the next two years. We plan to open six new factory outlet stores during fiscal 2018. During the past five years, we opened an average of approximately 20 new stores annually. We will continue to evaluate our plans for store openings in future years in light of demand and store performance.
Gross Profit
Gross profit is equal to our net revenues less our cost of sales. Cost of sales includes the direct cost of purchased merchandise, distribution center costs, operations overhead, duty, and all inbound freight costs incurred. The components of our reported cost of sales may not be comparable to those of other retail and wholesale companies.
Gross profit can be impacted by changes in volume; fluctuations in sales price; operational efficiencies, such as leveraging of fixed costs; promotional activities, such as free shipping; commodity prices, such as cotton prices; and labor costs.
Selling, General, and Administrative Expenses (SG&A)
SG&A expenses include selling; advertising, marketing, and product development; and administrative. Selling expenses include Direct business expenses such as store expenses, employee compensation, and store occupancy and supply costs, as well as Indirect business expenses consisting primarily of employee compensation and other expenses associated with sales to Indirect retailers. Advertising, marketing, and product development expenses include employee compensation, media costs, creative production expenses, marketing agency fees, new product design costs, public relations expenses, and market research expenses. A portion of our advertising expenses may be reimbursed by Indirect retailers, and such amount is classified as other income. Administrative expenses include employee compensation for corporate functions, corporate headquarters occupancy costs, consulting and software expenses, and charitable donations.
Impairment charges are included in SG&A expenses and totaled $12.7 million, $2.8 million and $0.4 million for the fiscal years ended January 28, 2017, January 30, 2016 and January 31, 2015, respectively.
Other Income
We support many of our Indirect retailers’ marketing efforts by distributing certain catalogs and promotional mailers to current and prospective customers. Our Indirect retailers reimburse us for a portion of the cost to produce these materials. Reimbursement received is recorded as other income. The related cost to design, produce, and distribute the catalogs and mailers is recorded as SG&A expense. Other income also includes proceeds from the sales of tickets to our annual outlet sale.
Operating Income
Operating income is equal to gross profit less SG&A expenses plus other income. Operating income excludes interest income, interest expense, and income taxes.
Income from Continuing Operations
Income from continuing operations is equal to operating income less net interest expense and income taxes.
Loss from Discontinued Operations, Net of Taxes
Loss from discontinued operations, net of taxes, is equal to the loss from the results of operations related to the direct Japan business, which was exited in the third quarter of fiscal 2015, adjusted for the associated tax benefit.
34
Net Income
Net income is equal to the sum of income from continuing operations and loss from discontinued operations, net of taxes.
Results of Operations
The following tables summarize key components of our consolidated results of operations for the last three fiscal years, both in dollars and as a percentage of our net revenues.
Fiscal Year Ended (1) | ||||||||||||
($ in thousands) | January 28, 2017 | January 30, 2016 | January 31, 2015 | |||||||||
Statement of Income Data (2): | ||||||||||||
Net revenues | $ | 485,937 | $ | 502,598 | $ | 508,990 | ||||||
Cost of sales | 209,891 | 221,409 | 239,981 | |||||||||
Gross profit | 276,046 | 281,189 | 269,009 | |||||||||
Selling, general, and administrative expenses (6) | 249,155 | 236,836 | 208,675 | |||||||||
Other income | 1,329 | 2,369 | 3,736 | |||||||||
Operating income | 28,220 | 46,722 | 64,070 | |||||||||
Interest expense, net | 178 | 263 | 407 | |||||||||
Income from continuing operations before income taxes | 28,042 | 46,459 | 63,663 | |||||||||
Income tax expense | 8,284 | 18,901 | 22,828 | |||||||||
Income from continuing operations | 19,758 | 27,558 | 40,835 | |||||||||
Loss from discontinued operations, net of taxes | — | — | (2,386 | ) | ||||||||
Net income | $ | 19,758 | $ | 27,558 | $ | 38,449 | ||||||
Percentage of Net Revenues: | ||||||||||||
Net revenues | 100.0 | % | 100.0 | % | 100.0 | % | ||||||
Cost of sales | 43.2 | % | 44.1 | % | 47.1 | % | ||||||
Gross profit | 56.8 | % | 55.9 | % | 52.9 | % | ||||||
Selling, general, and administrative expenses | 51.3 | % | 47.1 | % | 41.0 | % | ||||||
Other income | 0.3 | % | 0.5 | % | 0.7 | % | ||||||
Operating income | 5.8 | % | 9.3 | % | 12.6 | % | ||||||
Interest expense, net | — | % | 0.1 | % | 0.1 | % | ||||||
Income from continuing operations before income taxes | 5.8 | % | 9.2 | % | 12.5 | % | ||||||
Income tax expense | 1.7 | % | 3.8 | % | 4.5 | % | ||||||
Income from continuing operations | 4.1 | % | 5.5 | % | 8.0 | % | ||||||
Loss from discontinued operations, net of taxes | — | % | — | % | (0.5 | )% | ||||||
Net income | 4.1 | % | 5.5 | % | 7.6 | % | ||||||
35
The following tables present net revenues by operating segment, both in dollars and as a percentage of our net revenues, and full-line and factory outlet store data for the last three fiscal years:
Fiscal Year Ended (1) | ||||||||||||
($ in thousands, except as otherwise indicated) | January 28, 2017 | January 30, 2016 | January 31, 2015 | |||||||||
Net Revenues by Segment (2): | ||||||||||||
Direct | $ | 355,175 | $ | 351,286 | $ | 335,602 | ||||||
Indirect | 130,762 | 151,312 | 173,388 | |||||||||
Total | $ | 485,937 | $ | 502,598 | $ | 508,990 | ||||||
Percentage of Net Revenues by Segment: | ||||||||||||
Direct | 73.1 | % | 69.9 | % | 65.9 | % | ||||||
Indirect | 26.9 | % | 30.1 | % | 34.1 | % | ||||||
Total | 100.0 | % | 100.0 | % | 100.0 | % | ||||||
Fiscal Year Ended | ||||||||||||
January 28, 2017 | January 30, 2016 | January 31, 2015 | ||||||||||
Store Data (3): | ||||||||||||
Total stores open at end of period | 159 | 150 | 125 | |||||||||
Comparable sales (including e-commerce) decrease (4) | (7.0 | )% | (10.6 | )% | (7.6 | )% | ||||||
Total gross square footage at end of period | 368,640 | 342,362 | 278,779 | |||||||||
Average net revenues per gross square foot (5) | $ | 642 | $ | 703 | $ | 760 | ||||||
(1) | The Company utilizes a 52-53 week fiscal year ending on the Saturday closest to January 31. Fiscal years 2017, 2016, and 2015 consisted of 52 weeks. |
(2) | Financial data recasts Japan results of operations as discontinued operations. Japan was formerly included in the Direct segment results. Refer to Note 14 of the Notes to the Consolidated Financial Statements for additional information. |
(3) | Includes full-line and factory outlet stores. |
(4) | Comparable sales are calculated based upon our stores that have been open for at least 12 full fiscal months and net revenues from our e-commerce operations. Decrease is reported as a percentage of the comparable sales for the same period in the prior fiscal year. Remodeled stores are included in comparable sales unless the store was closed for a portion of the current or comparable prior period or the remodel resulted in a significant change in square footage. |
(5) | Dollars not in thousands. Average net revenues per gross square foot are calculated by dividing total net revenues for our stores that have been open at least 12 full fiscal months as of the end of the period by total gross square footage for those stores. |
(6) | Impairment charges, related to underperforming stores, recognized totaled $12.7 million, $2.8 million and $0.4 million, during the fiscal years ended January 28, 2017, January 30, 2016 and January 31, 2015, respectively. |
Payment Card Incident
Description of Event
On September 15, 2016, we received information from law enforcement regarding a potential data security issue related to our retail store network. Findings from the investigation show unauthorized access to our payment processing system and the installation of a program that looked for payment card data. The program was specifically designed to find track data in the magnetic stripe of a payment card that may contain the card number, cardholder name, expiration date, and internal verification code as the data was being routed through the affected payment system. There is no indication that other customer information was at risk. Payment cards used at Vera Bradley store locations between July 25, 2016 and September 23, 2016 may have been affected. Not all cards used in stores during this time frame were affected. Cards used on verabradley.com were not affected.
We have resolved this incident and continue to work with the computer security firm to further strengthen the security of our systems to help prevent this from happening in the future. We continue to support law enforcement’s investigation and also promptly notified the payment card networks so that the banks that issue payment cards could initiate heightened monitoring on the affected cards.
Expenses Incurred and Amounts Accrued
During fiscal 2017, we recorded an immaterial amount of expense relating to the Payment Card Incident. Expenses included costs to investigate the Payment Card Incident and obtain legal and other professional services.
36
Future Costs
We expect to incur additional legal and professional services, as well as expenses and capital investments for remediation activities associated with the Payment Card Incident and will recognize the expenses as incurred. In addition, payment card companies and associations may require us to reimburse them for unauthorized card charges and costs to replace cards and may also impose fines or penalties in connection with the Payment Card Incident, and enforcement authorities may also impose fines or other remedies against us. At this time, we cannot reasonably estimate the potential loss or range of loss related to any fines or penalties that may be assessed. The Payment Card Incident, including customer response and any possible third party claims or assessments from payment card companies, could materially adversely affect our financial condition and operating results. We expect that our insurance coverage will offset most of the expenses for the investigation and other non-remediation legal and professional services associated with the incident, possible third party claims, as well as fines, penalties, or other expenses, if any, imposed by payment card companies, as discussed above.
Insurance Coverage
We maintain $15.0 million of cyber security insurance coverage above a $0.1 million deductible.
Restructuring and Other Charges Affecting Comparability of the Fifty-Two Weeks Ended January 28, 2017, and January 30, 2016
Fifty-Two Weeks Ended January 28, 2017
In the third quarter of fiscal 2017, we recognized a benefit of $1.6 million for certain income tax reserve releases as a result of the conclusion of an IRS audit (reflected in income tax expense).
Fifty-Two Weeks Ended January 30, 2016
In the first quarter of fiscal 2016, we closed our manufacturing facility located in New Haven, Indiana. We incurred restructuring and other charges during the first quarter of fiscal 2016 of approximately $3.4 million ($2.1 million after the associated tax benefit), related to the facility closing. These charges included:
• | Severance and benefit costs of approximately $1.7 million; |
• | Lease termination costs of approximately $0.7 million; |
• | Inventory-related charges of approximately $0.6 million; and |
• | Other associated net costs, which include accelerated depreciation related to fixed assets, of approximately $0.4 million. |
These charges are reflected in cost of sales in our Consolidated Financial Statements. All production from the facility was absorbed by our third-party manufacturing suppliers. There are no remaining liabilities associated with the facility closure.
Additional charges, incurred in the first quarter of fiscal 2016, affecting comparability of the financial results totaled approximately $1.8 million ($1.3 million after the associated tax benefit). These charges included:
• | $1.2 million due to a retail store early lease termination agreement (reflected in selling, general, and administrative expenses) and |
• | $0.6 million related to an increase in income tax reserves for uncertain federal and state tax positions related to research and development tax credits (reflected in income tax expense). |
See Note 15 to the Notes to the Consolidated Financial Statements, herein, for additional information.
Impairment Charges
Property, plant, and equipment are reviewed for impairment whenever events or changes in circumstances indicate that the carrying amount of the assets may not be recoverable. The reviews are conducted at the lowest identifiable level of cash flows. If the estimated undiscounted future cash flows related to the property, plant, and equipment are less than the carrying value, we recognize a loss equal to the difference between the carrying value and the fair value, as further defined in Note 2 to the Notes to the Consolidated Financial Statements, herein. An impairment charge of $12.7 million, $2.8 million and $0.4 million was recognized in the fiscal years ended January 28, 2017, January 30, 2016 and January 31, 2015, respectively, for assets related to underperforming stores and is included in selling, general, and administrative expenses in the Consolidated Statements of Income and in impairment charges in the Consolidated Statements of Cash Flows. The impairment charges are included in the Direct segment.
37
Fiscal 2017 Compared to Fiscal 2016
Net Revenues
For fiscal 2017, net revenues decreased $16.7 million, or 3.3%, to $485.9 million, from $502.6 million for fiscal 2016.
Direct. For fiscal 2017, net revenues increased $3.9 million, or 1.1%, to $355.2 million, from $351.3 million for fiscal 2016. This change resulted from a $28.0 million contribution of revenue from our non-comparable stores, which included ten additional stores in the current year, partially offset by a comparable sales decrease of $23.7 million, or 7.0%. The decrease in comparable sales includes a 6.7% decrease in e-commerce sales and a 7.1% decrease in comparable store sales. The decline in comparable sales was primarily due to year-over-year declines in store and e-commerce traffic, as well as lower levels of promotional activity in the first quarter of fiscal 2017. The aggregate number of full-line and factory outlet stores grew from 150 at the end of fiscal 2016 to 159 at the end of fiscal 2017, which excludes one store closed at the end of the fourth quarter.
Indirect. For fiscal 2017, net revenues decreased $20.5 million, or 13.6%, to $130.8 million, from $151.3 million for fiscal 2016, primarily due to lower orders from specialty retail accounts.
Gross Profit
For fiscal 2017, gross profit decreased $5.2 million, or 1.8%, to $276.0 million, from $281.2 million for fiscal 2016. As a percentage of net revenues, gross profit increased to 56.8% for fiscal 2017, from 55.9% for fiscal 2016. The increase as a percentage of net revenues was primarily due to sourcing efficiencies (partly due to reduced overhead costs resulting from the closing of our domestic manufacturing facility), partially offset by increased promotional activity at our factory outlet stores. In addition, gross profit in the first quarter of the comparable prior-year period was impacted by restructuring charges of $3.4 million related to the closure of our manufacturing facility in the first quarter of fiscal 2016, as discussed in more detail in Note 15 to the Notes to the Consolidated Financial Statements herein.
Selling, General and Administrative Expenses (SG&A)
For fiscal 2017, SG&A expenses increased $12.4 million, or 5.2%, to $249.2 million, from $236.8 million for fiscal 2016. As a percentage of net revenues, SG&A expenses were 51.3% and 47.1% for fiscal 2017 and fiscal 2016, respectively. The increase in SG&A expenses for fiscal 2017 was primarily due to $10.0 million in incremental store impairment charges and $7.1 million in new store expenses in the current-year period, partially offset by a $2.7 million reduction in incentive compensation due to Company performance. In addition, the first quarter of the prior-year period included $1.2 million in expense related to a retail store early termination agreement which did not recur in the current-year period. SG&A expenses as a percentage of net revenues increased primarily due to the aforementioned items and fixed expenses being spread over lower comparable sales and deleveraging of store operating expenses as a result of lower comparable store sales.
Other Income
For fiscal 2017, other income decreased $1.1 million, or 43.9%, to $1.3 million, from $2.4 million for fiscal 2016, primarily due to a decrease in participation in the co-op mailer program.
Operating Income
For fiscal 2017, operating income decreased $18.5 million, or 39.6%, to $28.2 million from $46.7 million for fiscal 2016. As a percentage of net revenues, operating income was 5.8% and 9.3% for fiscal 2017 and fiscal 2016, respectively. Operating income decreased due to the factors described above.
The following table provides additional information about our operating income (in thousands).
Fiscal Year Ended | $ Change | % Change | |||||||||||||
January 28, 2017 | January 30, 2016 | ||||||||||||||
Operating Income: | |||||||||||||||
Direct | $ | 62,577 | $ | 74,114 | $ | (11,537 | ) | (15.6 | )% | ||||||
Indirect | 50,955 | 60,409 | (9,454 | ) | (15.6 | )% | |||||||||
Less: Unallocated corporate expenses | (85,312 | ) | (87,801 | ) | 2,489 | (2.8 | )% | ||||||||
Operating income | $ | 28,220 | $ | 46,722 | $ | (18,502 | ) | (39.6 | )% | ||||||
Direct. For fiscal 2017, operating income decreased $11.5 million, or 15.6%. As a percentage of Direct segment net revenues, operating income in the Direct segment was 17.6% and 21.1% for fiscal 2017 and 2016, respectively. The decrease in operating
38
income as a percentage of Direct segment net revenues was primarily due to $10.0 million in incremental store impairment charges, $7.1 million in new store expenses, and deleveraging of store operating expenses as a result of lower comparable store sales, partially offset by $3.5 million in restructuring and other charges related to the closure of our manufacturing facility and a retail store early termination agreement in the comparable prior-year period, as well as an increase in gross profit as a percentage of net revenues, as described above.
Indirect. For fiscal 2017, operating income decreased $9.5 million, or 15.6%. As a percentage of Indirect segment net revenues, operating income in the Indirect segment was 39.0% and 39.9% for fiscal 2017 and 2016, respectively. The decrease in operating income as a percentage of Indirect segment net revenues was primarily due to lower sales, partially offset by an increase in gross profit as a percentage of net revenues, as described above, as well as $1.1 million in restructuring charges related to the closure of our manufacturing facility in the comparable prior-year period.
Corporate Unallocated. For fiscal 2017, unallocated expenses decreased $2.5 million, or 2.8%. The decrease in unallocated expenses was primarily due to a decrease in incentive compensation as a result of Company performance.
Interest Expense, Net. For fiscal 2017, net interest expense decreased $0.1 million, or 32.3%, to $0.2 million, from $0.3 million in fiscal 2016.
Income Tax Expense. For fiscal 2017, we recorded income tax expense of $8.3 million at an effective tax rate of 29.5%, compared to 40.7% for fiscal 2016. The year-over year decrease in the effective tax rate was primarily due to the release of approximately $1.6 million of certain income tax reserves as a result the conclusion of an IRS audit. The prior year included $0.6 million of income tax reserves for uncertain tax positions related to research and development tax credits.
Net Income
For fiscal 2017, net income decreased $7.8 million, or 28.3%, to $19.8 million from $27.6 million in fiscal 2016. The current-year period included $12.7 million ($8.0 million after the associated tax benefit) in store impairment charges, partially offset by a $1.6 million tax benefit, as described in Note 6 to the Notes to the Consolidated Financial Statements herein. The comparable prior-year period included restructuring and other charges of $5.2 million ($3.4 million after the associated tax benefit), as described in Note 15 herein, and $2.8 million in store impairment charges ($1.8 million after the associated tax benefit).
Fiscal 2016 Compared to Fiscal 2015
Net Revenues
For fiscal 2016, net revenues decreased $6.4 million, or 1.3%, to $502.6 million, from $509.0 million for fiscal 2015.
Direct. For fiscal 2016, net revenues increased $15.7 million, or 4.7%, to $351.3 million, from $335.6 million for fiscal 2015. This change resulted from a $51.3 million contribution of revenue from our non-comparable stores, which included 26 additional stores in the current year, partially offset by a comparable sales decrease of $33.7 million, or 10.6% and a gift card breakage revenue decrease of $1.1 million. Fiscal 2015 was the first year gift card breakage revenue was recognized; refer to Note 2, herein, for additional information. The decrease in comparable sales includes a 13.2% decrease in e-commerce sales and an 8.6% decrease in comparable store sales, primarily as a result of reduced traffic. There was also a decrease in sales at our annual outlet sale compared to the prior fiscal year. We believe the year-over-year traffic declines in e-commerce and stores are due, at least in part, to our intentional reduction of promotional activity. The aggregate number of full-line and factory outlet stores grew from 125 at the end of fiscal 2015, to 150 at the end of fiscal 2016, which includes the closure of one full-line store in fiscal 2016.
Indirect. For fiscal 2016, net revenues decreased $22.1 million, or 12.7%, to $151.3 million, from $173.4 million for fiscal 2015, primarily due to lower orders from specialty retail accounts, as well as a reduction in the number of specialty retailers.
Gross Profit
For fiscal 2016, gross profit increased $12.2 million, or 4.5%, to $281.2 million, from $269.0 million for fiscal 2015. As a percentage of net revenues, gross profit increased to 55.9% for fiscal 2016, from 52.9% for fiscal 2015. The year-over-year increase in the gross margin rate was primarily related to sourcing efficiencies (lower product costs combined with Fall 2014 cost reductions at the Company’s domestic manufacturing facility as well as leverage of overhead costs resulting from an increase in units manufactured), increased sales penetration of higher-margin made-for-outlet products, reduced promotional activity and lower levels of liquidation sales. Gross profit during fiscal 2016 was impacted by restructuring charges of $3.4 million related to the closure of our manufacturing facility in the first quarter of fiscal 2016, as discussed in more detail in Note 15 to the Notes to the Consolidated Financial Statements herein.
39
Selling, General and Administrative Expenses (SG&A)
For fiscal 2016, SG&A expenses increased $28.1 million, or 13.5%, to $236.8 million, from $208.7 million for fiscal 2015. As a percentage of net revenues, SG&A expenses were 47.1% and 41.0% for fiscal 2016 and fiscal 2015, respectively. The increase in SG&A expenses for fiscal 2016 included $1.3 million in employee severance expense and $1.2 million in expense related to a retail store early termination agreement that did not occur in the comparable prior year period. The remaining increase was primarily due to investments in new stores, $6.0 million in incremental marketing and advertising, $2.7 million in additional incentive compensation, as well as $2.3 million in incremental store impairment charges. SG&A expenses as a percentage of net revenues increased primarily due to the aforementioned items, as well as fixed expenses being spread over lower revenues and deleveraging of store operating expenses as a result of lower comparable store sales.
Other Income
For fiscal 2016, other income decreased $1.3 million, or 36.6%, to $2.4 million from $3.7 million for fiscal 2015, primarily due to a decrease in participation in the co-op mailer program.
Operating Income
For fiscal 2016, operating income decreased $17.4 million, or 27.1%, to $46.7 million, from $64.1 million for fiscal 2015. As a percentage of net revenues, operating income was 9.3% and 12.6% for fiscal 2016 and fiscal 2015, respectively. Operating income for fiscal 2016 was negatively impacted by the $5.9 million in restructuring and other charges described above under “Gross Profit” and “Selling, General, and Administrative Expenses.” The remaining decrease in operating income was due to an increase in selling, general, and administrative expenses and a decrease in other income, partially offset by an increase in gross profit, as described above.
The following table provides additional information about our operating income (in thousands).
Fiscal Year Ended | $ Change | % Change | |||||||||||||
January 30, 2016 | January 31, 2015 | ||||||||||||||
Operating Income: | |||||||||||||||
Direct | $ | 74,114 | $ | 74,099 | $ | 15 | — | % | |||||||
Indirect | 60,409 | 66,213 | (5,804 | ) | (8.8 | )% | |||||||||
Less: Unallocated corporate expenses | (87,801 | ) | (76,242 | ) | (11,559 | ) | 15.2 | % | |||||||
Operating income | $ | 46,722 | $ | 64,070 | $ | (17,348 | ) | (27.1 | )% | ||||||
Direct. For fiscal 2016, the change in operating income was essentially flat. As a percentage of Direct segment net revenues, operating income in the Direct segment was 21.1% and 22.1% for fiscal 2016 and 2015, respectively. Operating income for fiscal 2016 was negatively impacted by the $3.5 million, or 1.0% as a percentage of Direct segment net revenues, in restructuring and other charges related to the closure of our manufacturing facility in the first quarter of fiscal 2016 and a retail store early termination agreement.
Indirect. For fiscal 2016, operating income decreased $5.8 million, or 8.8%. As a percentage of Indirect segment net revenues, operating income in the Indirect segment was 39.9% and 38.2% for fiscal 2016 and 2015, respectively. The increase in operating income as a percentage of Indirect segment net revenues was primarily due to an increase in gross profit as a percentage of net revenues, as described above. This increase was partially offset by $1.1 million, or 0.8% as a percentage of Indirect segment net revenues, in restructuring charges related to the closure of our manufacturing facility in the first quarter of fiscal 2016.
Corporate Unallocated. For fiscal 2016, unallocated expenses increased $11.6 million, or 15.2%. The increase in unallocated expenses included $1.3 million in employee severance expense. The remaining increase was primarily due to incremental marketing and advertising investments, an increase in incentive compensation due to Company performance, as well as an increase in depreciation expense primarily as a result of the campus consolidation.
Interest Expense, Net. For fiscal 2016, net interest expense decreased $0.1 million, or 35.4%, to $0.3 million, from $0.4 million in fiscal 2015.
40
Income Tax Expense. For fiscal 2016, we recorded income tax expense of $18.9 million at an effective tax rate of 40.7%, compared to 35.9% for fiscal 2015. The increase in the effective tax rate was primarily due to decreases to tax expense in fiscal 2015 that did not occur in fiscal 2016, as well as increases in permanent tax exclusions in fiscal 2016 including an increase in income tax reserves for uncertain federal and state tax positions related to research and development tax credits from prior years. Fiscal 2016 included $0.6 million of income tax reserves for uncertain tax positions related to research and development tax credits.
Income from Continuing Operations
For fiscal 2016, income from continuing operations decreased $13.2 million, or 32.5%, to $27.6 million from $40.8 million in fiscal 2015. Included in this decrease were restructuring and other charges of $5.2 million ($3.4 million after the associated tax benefit), as described in Note 15 to the Notes to the Consolidated Financial Statements herein, in addition to $1.3 million in employee severance ($0.8 million after the associated tax benefit).
Loss from Discontinued Operations, Net of Taxes
For fiscal 2015, loss from discontinued operations, net of taxes was $2.4 million reflecting the exit of the direct Japan business in the third quarter of fiscal 2015.
Net Income
For fiscal 2016, net income decreased $10.8 million, or 28.3%, to $27.6 million from $38.4 million in fiscal 2015. Included in this decrease were restructuring and other charges of $5.2 million ($3.4 million after the associated tax benefit), as described in Note 15 to the Consolidated Financial Statements herein, in addition to $1.3 million in employee severance ($0.8 million after the associated tax benefit).
Liquidity and Capital Resources
General
Our primary source of liquidity is cash flow from operations. We also have access to additional liquidity, if needed, through availability under our $125.0 million second amended and restated credit agreement. Historically, our primary cash needs have been for merchandise inventories; payroll; store rent; capital expenditures associated with operational equipment, buildings, information technology, opening new stores; share repurchases; and debt repayments. The most significant components of our working capital are cash and cash equivalents, short-term investments, merchandise inventories, accounts receivable, accounts payable, and other current liabilities.
We believe that cash on hand and cash equivalents, cash flows from operating activities, short-term investments, and the availability of borrowings under our second amended and restated credit agreement or other financing arrangements will be sufficient to meet working capital requirements, anticipated capital expenditures, share repurchases, and debt payments for the foreseeable future.
Short-Term Investments
Short-term investments consist of a certificate of deposit with an original maturity of one year and a one-time option to accelerate maturity to 31 days without penalty. Interest income from the investment is included in interest expense, net, in our Consolidated Financial Statements. Our objective with respect to this investment is to earn a higher rate of return, relative to deposit accounts, on funds that are otherwise not anticipated to be required to meet liquidity needs in the near term while maintaining a low level of investment risk. We have the intent and ability to hold this investment to maturity.
Cash Flow Analysis
A summary of operating, investing, and financing activities is shown in the following table (in thousands):
Fiscal Year Ended | ||||||||||||
January 28, 2017 | January 30, 2016 | January 31, 2015 | ||||||||||
Net cash provided by operating activities | $ | 65,186 | $ | 43,270 | $ | 103,812 | ||||||
Net cash used in investing activities | (50,770 | ) | (26,322 | ) | (37,128 | ) | ||||||
Net cash used in financing activities | (25,715 | ) | (31,531 | ) | (13,604 | ) | ||||||
41
Net Cash Provided by Operating Activities
Net cash provided by operating activities consists primarily of net income adjusted for non-cash items, including depreciation, amortization, impairment charges, deferred taxes, and stock-based compensation, the effect of changes in assets and liabilities, and tenant-improvement allowances received from landlords under our store leases.
Net cash provided by operating activities was $65.2 million during fiscal 2017, as compared to $43.3 million during fiscal 2016. The increase in cash provided by operating activities was primarily a result of the timing of inventory receipts in the current-year period, which resulted in a source of cash for the current-year period of $11.3 million, as compared to an inventory build in the comparable prior-year period for made-for-outlet product, which resulted in a use of cash of $15.2 million in the comparable prior-year period. In addition, accounts payable resulted in a source of cash for the current-year period of $9.0 million, as compared to a use of cash of $8.7 million in the comparable prior-year period, primarily due to the timing of inventory payments. These sources of cash were partially offset by a change in income taxes which resulted in a use of cash of $12.0 million in the current-year period as compared to a source of cash of $12.5 million in the comparable prior-year period. The income tax change was primarily a result of the timing of an $11.5 million federal income tax payment in the current-year period, as well as incremental payments as a result of increased income at certain points in time during the current year.
In the comparable prior-year period, net income included cash payments of approximately $2.6 million for restructuring activities related to the closure of our domestic manufacturing facility which did not recur in the current period. These payments consisted of $1.7 million for severance and benefits, $0.7 million for a lease termination and $0.2 million in other associated costs.
Net cash provided by operating activities was $43.3 million during fiscal 2016, as compared to $103.8 million during fiscal 2015. The decrease was primarily due to a reduction in net income of $10.9 million and changes in assets and liabilities which provided an $8.8 million use of cash as compared to a $45.3 million source of cash in the prior year, primarily as a result of inventories, accounts payable and income taxes.
Net Cash Used in Investing Activities
Investing activities consist primarily of short-term investments and capital expenditures for growth related to new store openings, buildings, operational equipment, and information technology investments.
Net cash used in investing activities was $50.8 million in fiscal 2017, compared to $26.3 million in fiscal 2016. The increase in cash used in investing activities was due to a $30.0 million short-term investment in a certificate of deposit made in the first quarter of fiscal 2017, partially offset by a decrease in property, plant, and equipment spending compared to the prior-year period. The decrease in property, plant, and equipment spending was primarily a result of ten new stores opened in the current-year period as compared to 26 stores in the comparable prior-year period, as well as spending for the campus consolidation in the prior-year period which did not recur in the current-year period, partially offset by an increase in information technology investments, including spending for our e-commerce platform upgrade.
Net cash used in investing activities was $26.3 million in fiscal 2016, compared to $37.1 million in fiscal 2015. The $10.8 million decrease in capital expenditures was driven primarily by the campus consolidation which was substantially completed in fiscal 2015.
Capital expenditures for fiscal 2018 are expected to be approximately $10.0 million to $15.0 million.
Net Cash Used in Financing Activities
Net cash used in financing activities was $25.7 million in fiscal 2017 compared to $31.5 million in fiscal 2016. The decrease in cash used in financing activities was primarily due to $25.0 million of cash purchases of our common stock under the 2015 Share Repurchase Plan in the current-year period compared to $30.9 million of cash purchases of our common stock under the 2015 and 2014 Share Repurchase Plans in the prior-year period.
Net cash used in financing activities was $31.5 million in fiscal 2016 compared to $13.6 million in fiscal 2015. The $17.9 million increase in financing activities was primarily due to the completion of purchases of shares of the Company's common stock made under the 2014 Share Repurchase Program, as well as purchases under the 2015 Share Repurchase Program.
Second Amended and Restated Credit Agreement
On July 15, 2015, Vera Bradley Designs, Inc. (“VBD”), a wholly-owned subsidiary of the Company, entered into a Second Amended and Restated Credit Agreement among VBD, the lenders from time to time party thereto, JPMorgan Chase Bank, National Association, as administrative agent, Wells Fargo Bank, National Association, as syndication agent, and KeyBank National Association, as documentation agent (the “Credit Agreement”), which amended and restated our prior credit
42
agreement. The Credit Agreement provides for certain credit facilities to VBD in an aggregate principal amount not to initially exceed $125.0 million, the proceeds of which will be used for general corporate purposes of VBD and its subsidiaries, including but not limited to Vera Bradley International, LLC and Vera Bradley Sales, LLC (collectively, the “Named Subsidiaries”).
Amounts outstanding under the Credit Agreement bear interest, at VBD's option, at a per annum rate equal to either (A) the Alternate Base Rate (“ABR”) plus the Applicable Margin, where the ABR is the highest of (i) the prime rate, (ii) the federal funds rate plus 0.5%, and (iii) Adjusted LIBOR for a one-month interest period plus 1%, and the Applicable Margin is a percentage ranging from 0.00% to 0.70% depending upon the Company's leverage ratio or (B) Adjusted LIBOR plus the Applicable Margin, where Adjusted LIBOR means LIBOR, as adjusted for statutory reserve requirements for eurocurrency liabilities, and Applicable Margin is a percentage ranging from 1.00% to 1.70% depending upon the Company's leverage ratio. Any loans made, or letters of credit issued, pursuant to the Credit Agreement mature on July 15, 2020. As of January 28, 2017, the Company had no borrowings and availability of $125.0 million under the agreement.
VBD's obligations under the Credit Agreement are guaranteed by the Company and the Named Subsidiaries. The obligations of VBD under the Credit Agreement are secured by first priority security interests in all of the respective assets of VBD, the Company, and the Named Subsidiaries and a pledge of the equity interests of VBD and the Named Subsidiaries.
The Credit Agreement contains various restrictive covenants, including restrictions on the Company's ability to dispose of assets, make acquisitions or investments, incur debt or liens, make distributions to stockholders or repurchase outstanding stock, enter into related party transactions and make capital expenditures, other than upon satisfaction of the conditions set forth in the Credit Agreement. The Company is also required to comply with certain financial and non-financial covenants, including maintaining a maximum leverage ratio, a minimum ratio of EBITDAR to the sum of interest expense plus rentals (as defined in the Credit Agreement), and a limit on capital expenditures. Upon an event of default, which includes certain customary events such as, among other things, a failure to make required payments when due, a failure to comply with covenants, certain bankruptcy and insolvency events, a material adverse change (as defined in the Credit Agreement), defaults under other material indebtedness, and a change in control, the lenders may accelerate amounts outstanding, terminate the agreement and foreclose on all collateral. The Company was in compliance with these covenants as of January 28, 2017.
Contractual Obligations
We enter into long-term contractual obligations and commitments in the normal course of business, primarily non-cancellable operating leases. As of January 28, 2017, our contractual cash obligations over the next several periods are as follows:
Payments Due by Period (3) | ||||||||||||||||||||
($ in thousands) | Total | Less Than 1 Year | 1 - 3 Years | 3 - 5 Years | More Than 5 Years | |||||||||||||||
Operating leases (1) | $ | 222,150 | $ | 32,681 | $ | 62,098 | $ | 57,316 | $ | 70,055 | ||||||||||
Purchase obligations (2) | 54,049 | 54,049 | — | — | — | |||||||||||||||
Total | $ | 276,199 | $ | 86,730 | $ | 62,098 | $ | 57,316 | $ | 70,055 | ||||||||||
(1) | Our store leases are generally ten years with varying renewal options. Our future operating lease obligations would change if we were to extend these leases, or if we were to enter into new operating leases. |
(2) | Purchase obligations consist primarily of inventory purchases. |
(3) | Due to the uncertainty with respect to the timing of future cash flows associated with our uncertain tax positions at January 28, 2017, we are unable to make reasonably reliable estimates of the period of cash settlement with the respective taxing authorities. Therefore, $0.9 million of uncertain tax positions have been excluded from the contractual obligations table above. |
Off-Balance Sheet Arrangements
We do not have any off-balance sheet financing or unconsolidated special purpose entities.
Critical Accounting Policies and Estimates
The preparation of financial statements in accordance with accounting principles generally accepted in the United States (“GAAP”) requires management to make estimates and assumptions that affect the reported amounts of our assets, liabilities, revenues, and expenses, as well as the disclosures relating to contingent assets and liabilities at the date of the consolidated financial statements. We evaluate our accounting policies, estimates, and judgments on an on-going basis. We base our
43
estimates and judgments on historical experience and various other factors that we believe to be reasonable under the circumstances. Actual results may differ from these estimates under different assumptions and conditions.
We evaluate the development and selection of our critical accounting policies and estimates and believe that the following policies and estimates involve a higher degree of judgment or complexity and are most significant to reporting our results of operations and financial position, and are therefore discussed as critical. The following critical accounting policies reflect the significant estimates and judgments used in the preparation of our consolidated financial statements. With respect to critical accounting policies, even a relatively minor variance between actual and expected experience can potentially have a materially favorable or unfavorable impact on subsequent results of operations. Our historical results for the periods presented in the consolidated financial statements, however, have not been materially impacted by such variances. More information on all of our significant accounting policies can be found in Note 2, “Summary of Significant Accounting Policies,” to the consolidated financial statements.
Revenue Recognition
Revenue from the sale of our products is recognized upon customer receipt of the product when collection of the associated receivables is reasonably assured, persuasive evidence of an arrangement exists, the sales price is fixed and determinable, and ownership and risk of loss have been transferred to the customer, which, for e-commerce and most Indirect sales, reflects an estimate of shipments that customers have not yet received. The adjustment of these shipments is based on actual delivery dates to the customer. Significant changes in shipping terms or delivery times could materially impact our revenues in a given period.
We reserve for projected merchandise returns based on historical experience and other assumptions that we believe to be reasonable. In the Direct business, returns are refunded by issuing the same payment tender of the original purchase and in the Indirect business the customer is issued a credit to its account to apply to outstanding invoices. Merchandise exchanges of the same product at the same price are not considered merchandise returns. Product returns are often resalable through our annual outlet sale or other channels. Additionally, we reserve for other potential product credits and for customer shipments not yet received. The balance of the reserve for returns, customer shipments not yet received, and general credits was $6.2 million and $3.3 million as of January 28, 2017, and January 30, 2016, respectively.
We sell gift cards with no expiration dates to customers and do not charge administrative fees on unused gift cards. Gift cards that we issue are recorded as a liability until they are redeemed, at which point revenue is recognized. In addition, we recognize revenue on unredeemed gift cards when the likelihood of the gift card being redeemed is remote and there is no legal obligation to remit the value of unredeemed gift cards to the relevant jurisdictions. We determine the gift card breakage rate based on historical redemption patterns. During the fiscal years ended January 28, 2017, January 30, 2016 and January 31, 2015, the Company recorded $0.3 million, $0.3 million and $1.4 million of revenue related to gift card breakage, respectively.
Inventories
Inventories are stated at the lower of cost or market. Cost is determined using the first-in, first-out (“FIFO”) method. Market is determined based on net realizable value, which includes costs to dispose. Appropriate consideration is given to obsolescence, excess quantities, and other factors, including the popularity of a pattern or product, in evaluating net realizable value. We record valuation adjustments to our inventories, which are reflected in cost of sales, if the cost of specific inventory items on hand exceeds the amount we expect to realize from the ultimate sale or disposal of the inventory. This adjustment calculation requires us to make assumptions and estimates, which are based on factors such as merchandise seasonality, historical trends, and estimated sales and inventory levels, including sell-through of remaining units. In addition, as part of inventory adjustments, we provide for inventory shrinkage based on historical trends from our physical inventory counts. We perform physical inventory counts throughout the year and adjust the shrinkage provision accordingly.
The balance of inventory adjustments was $2.6 million and $5.5 million for these matters as of the fiscal years ended January 28, 2017, and January 30, 2016, respectively. These adjustments related primarily to raw materials of retired patterns and styles and merchandise from the baby gift category, which was discontinued by the Company, and technology accessories. The reduction in inventory adjustments primarily related to the destruction of certain raw materials and finished goods no longer needed or deemed salable, as well as the sell-through of retired finished goods. We have the ability to move retired finished goods through a number of channels, including the annual outlet sale, our website and factory outlet stores, and through third-party liquidators as needed.
44
Income Taxes
Our effective tax rate is based on our pre-tax income, statutory tax rates, tax laws and regulations, and tax planning opportunities available in the jurisdictions in which we operate. Significant judgment is required in determining our annual tax expense and in evaluating our tax positions. We establish reserves to remove some or all of the tax benefit of any of our tax positions at the time we determine that the positions become uncertain based upon one of the following: (1) the tax position is not “more likely than not” to be sustained; (2) the tax position is “more likely than not” to be sustained, but for a lesser amount; or (3) the tax position is “more likely than not” to be sustained, but not in the financial period in which the tax position was originally taken. Taxing authorities periodically audit our income tax returns. We believe that our tax filing positions are reasonable and legally supportable. Taxing authorities, however, may take a contrary position. Our results of operations and effective tax rate in a given period could be impacted if, upon final resolution with taxing authorities, we prevail in positions for which we have established reserves, or are required to pay amounts in excess of established reserves. The balance of the gross amount of unrecognized tax benefits (excluding interest and penalties) was $0.9 million, $3.1 million and $3.0 million as of January 28, 2017, January 30, 2016 and January 31, 2015, respectively. A benefit of $1.9 million, an expense of $0.1 million and a benefit of $0.1 million was recognized in income tax expense for these matters during the fiscal years ended January 28, 2017, January 30, 2016 and January 31, 2015, respectively.
Valuation of Long-lived Assets
Property, plant, and equipment assets are reviewed for impairment whenever events or changes in circumstances indicate that the carrying amount of an asset may not be recoverable. In evaluating an asset for recoverability, we estimate the future cash flows expected to result from the use of the asset at the store level, the lowest identifiable level of cash flow, if applicable. If the sum of the estimated undiscounted future cash flows related to the asset is less than the carrying value, we recognize a loss equal to the difference between the carrying value and the fair value, usually determined by an estimated discounted cash flow analysis of the asset. Factors used in the valuation of long-lived assets include, but are not limited to, our plans for future operations, brand initiatives, recent operating results, and projected future cash flows. With respect to our stores, we analyze store economics, location within the shopping center, the size and shape of the space, and desirable co-tenancies in our selection process. Impairment charges are classified in SG&A expenses and were $12.7 million, $2.8 million and $0.4 million for the periods ended January 28, 2017, January 30, 2016 and January 31, 2015, respectively.
The discounted cash flow models used to estimate the applicable fair values involve numerous estimates and assumptions that are highly subjective. Changes to these estimates and assumptions could materially impact the fair value estimates. The estimates and assumptions critical to the overall fair value estimates include: (1) estimated future cash flow generated at the store level; and (2) discount rates used to derive the present value factors used in determining the fair values. These and other estimates and assumptions are impacted by economic conditions and our expectations and may change in the future based on period-specific facts and circumstances. If economic conditions were to deteriorate, future impairment charges may be required.
Transactions with Related Parties
See Item 13, “Certain Relationships and Related Transactions, and Director Independence,” of this report for information regarding transactions with related parties.
45
Item 7A. Quantitative and Qualitative Disclosures About Market Risk
Interest Rate Risk
We are subject to interest rate risk in connection with borrowings under our second amended and restated credit agreement, which bear interest at variable rates. The second amended and restated credit agreement allows for a revolving credit commitment of $125.0 million, bearing interest at a variable rate, based on (A) the ABR plus the Applicable Margin, where the ABR is the highest of (i) the prime rate, (ii) the federal funds rate plus 0.5%, and (iii) Adjusted LIBOR for a one-month interest period plus 1%, and the Applicable Margin is a percentage ranging from 0.00% to 0.70% depending upon the Company's leverage ratio or (B) Adjusted LIBOR plus the Applicable Margin, where Adjusted LIBOR means LIBOR, as adjusted for statutory reserve requirements for eurocurrency liabilities, and Applicable Margin is a percentage ranging from 1.00% to 1.70% depending upon the Company's leverage ratio. Assuming borrowings available under the second amended and restated credit agreement are fully extended, each quarter point increase or decrease in the interest rate would change our annual interest expense by approximately $0.3 million.
Impact of Inflation
Our results of operations and financial condition are presented based on historical cost. Although it is difficult to accurately measure the impact of inflation due to the imprecise nature of the estimates required, we believe the effects of inflation, if any, on our results of operations and financial condition have been immaterial.
Foreign Exchange Rate Risk
We source a majority of our materials from various suppliers primarily in China and South Korea. Substantially all purchases and sales involving foreign persons are denominated in U.S. dollars, and therefore we do not hedge using any derivative instruments. Historically, we have not been impacted materially by changes in exchange rates.
46
Item 8. Financial Statements and Supplementary Data
Vera Bradley, Inc.
Index to Consolidated Financial Statements
47
REPORT OF INDEPENDENT REGISTERED PUBLIC ACCOUNTING FIRM
To the Board of Directors and Shareholders of
Vera Bradley, Inc.
Roanoke, Indiana
We have audited the accompanying consolidated balance sheet of Vera Bradley, Inc. and subsidiaries (the "Company") as of January 28, 2017, and the related consolidated statements of income, comprehensive income, shareholders' equity, and cash flows for the year then ended. These financial statements are the responsibility of the Company's management. Our responsibility is to express an opinion on these financial statements based on our audit.
We conducted our audit in accordance with the standards of the Public Company Accounting Oversight Board (United States). Those standards require that we plan and perform the audit to obtain reasonable assurance about whether the financial statements are free of material misstatement. An audit includes examining, on a test basis, evidence supporting the amounts and disclosures in the financial statements. An audit also includes assessing the accounting principles used and significant estimates made by management, as well as evaluating the overall financial statement presentation. We believe that our audit provides a reasonable basis for our opinion.
In our opinion, such consolidated financial statements present fairly, in all material respects, the financial position of Vera Bradley, Inc. and subsidiaries as of January 28, 2017, and the results of their operations and their cash flows for the year ended January 28, 2017, in conformity with accounting principles generally accepted in the United States of America.
We have also audited, in accordance with the standards of the Public Company Accounting Oversight Board (United States), the Company's internal control over financial reporting as of January 28, 2017, based on the criteria established in Internal Control - Integrated Framework (2013) issued by the Committee of Sponsoring Organizations of the Treadway Commission and our report dated March 28, 2017 expressed an unqualified opinion on the Company's internal control over financial reporting.
/s/ Deloitte & Touche LLP
Indianapolis, Indiana
March 28, 2017
48
REPORT OF INDEPENDENT REGISTERED PUBLIC ACCOUNTING FIRM
To the Board of Directors and Shareholders of
Vera Bradley, Inc.
Roanoke, Indiana
We have audited the internal control over financial reporting of Vera Bradley, Inc. and subsidiaries (the "Company") as of January 28, 2017, based on criteria established in Internal Control - Integrated Framework (2013) issued by the Committee of Sponsoring Organizations of the Treadway Commission. The Company's management is responsible for maintaining effective internal control over financial reporting and for its assessment of the effectiveness of internal control over financial reporting, included in the accompanying Management’s Report on Internal Control over Financial Reporting. Our responsibility is to express an opinion on the Company's internal control over financial reporting based on our audit.
We conducted our audit in accordance with the standards of the Public Company Accounting Oversight Board (United States). Those standards require that we plan and perform the audit to obtain reasonable assurance about whether effective internal control over financial reporting was maintained in all material respects. Our audit included obtaining an understanding of internal control over financial reporting, assessing the risk that a material weakness exists, testing and evaluating the design and operating effectiveness of internal control based on the assessed risk, and performing such other procedures as we considered necessary in the circumstances. We believe that our audit provides a reasonable basis for our opinion.
A company's internal control over financial reporting is a process designed by, or under the supervision of, the company's principal executive and principal financial officers, or persons performing similar functions, and effected by the company's board of directors, management, and other personnel to provide reasonable assurance regarding the reliability of financial reporting and the preparation of financial statements for external purposes in accordance with generally accepted accounting principles. A company's internal control over financial reporting includes those policies and procedures that (1) pertain to the maintenance of records that, in reasonable detail, accurately and fairly reflect the transactions and dispositions of the assets of the company; (2) provide reasonable assurance that transactions are recorded as necessary to permit preparation of financial statements in accordance with generally accepted accounting principles, and that receipts and expenditures of the company are being made only in accordance with authorizations of management and directors of the company; and (3) provide reasonable assurance regarding prevention or timely detection of unauthorized acquisition, use, or disposition of the company's assets that could have a material effect on the financial statements.
Because of the inherent limitations of internal control over financial reporting, including the possibility of collusion or improper management override of controls, material misstatements due to error or fraud may not be prevented or detected on a timely basis. Also, projections of any evaluation of the effectiveness of the internal control over financial reporting to future periods are subject to the risk that the controls may become inadequate because of changes in conditions, or that the degree of compliance with the policies or procedures may deteriorate.
In our opinion, the Company maintained, in all material respects, effective internal control over financial reporting as of January 28,2017, based on the criteria established in Internal Control - Integrated Framework (2013) issued by the Committee of Sponsoring Organizations of the Treadway Commission.
We have also audited, in accordance with the standards of the Public Company Accounting Oversight Board (United States), the consolidated balance sheet as of January 28, 2017, and the related consolidated statements of income, comprehensive income, shareholders’ equity, and cash flows for the year then ended of the Company and our report dated March 28, 2017 expressed an unqualified opinion on those financial statements.
/s/ Deloitte & Touche LLP
Indianapolis, Indiana
March 28, 2017
49
REPORT OF INDEPENDENT REGISTERED PUBLIC ACCOUNTING FIRM
To the Board of Directors and Shareholders of
Vera Bradley, Inc.
We have audited the accompanying consolidated balance sheet of Vera Bradley, Inc. and subsidiaries as of January 30, 2016, and the related consolidated statements of income, comprehensive income, shareholders' equity and cash flows for each of the two years in the period ended January 30, 2016. These financial statements are the responsibility of the Company's management. Our responsibility is to express an opinion on these financial statements based on our audits.
We conducted our audits in accordance with the standards of the Public Company Accounting Oversight Board (United States). Those standards require that we plan and perform the audit to obtain reasonable assurance about whether the financial statements are free of material misstatement. An audit includes examining, on a test basis, evidence supporting the amounts and disclosures in the financial statements. An audit also includes assessing the accounting principles used and significant estimates made by management, as well as evaluating the overall financial statement presentation. We believe that our audits provide a reasonable basis for our opinion.
In our opinion, the financial statements referred to above present fairly, in all material respects, the consolidated financial position of Vera Bradley, Inc. and subsidiaries at January 30, 2016, and the consolidated results of their operations and their cash flows for each of the two years in the period ended January 30, 2016, in conformity with U.S. generally accepted accounting principles.
/s/ Ernst & Young LLP
Indianapolis, Indiana
March 29, 2016
50
Vera Bradley, Inc.
Consolidated Balance Sheets
(in thousands)
January 28, 2017 | January 30, 2016 | |||||||
Assets | ||||||||
Current assets: | ||||||||
Cash and cash equivalents | $ | 86,375 | $ | 97,681 | ||||
Short-term investments | 30,152 | — | ||||||
Accounts receivable, net | 23,313 | 31,294 | ||||||
Inventories | 102,283 | 113,590 | ||||||
Income taxes receivable | 3,217 | 785 | ||||||
Prepaid expenses and other current assets | 10,237 | 10,292 | ||||||
Total current assets | 255,577 | 253,642 | ||||||
Property, plant, and equipment, net | 101,577 | 113,711 | ||||||
Deferred income taxes | 13,539 | 11,363 | ||||||
Other assets | 2,816 | 1,963 | ||||||
Total assets | $ | 373,509 | $ | 380,679 | ||||
Liabilities and Shareholders’ Equity | ||||||||
Current liabilities: | ||||||||
Accounts payable | $ | 32,619 | $ | 24,606 | ||||
Accrued employment costs | 12,474 | 14,937 | ||||||
Other accrued liabilities | 16,906 | 16,924 | ||||||
Income taxes payable | 508 | 10,085 | ||||||
Total current liabilities | 62,507 | 66,552 | ||||||
Long-term liabilities | 27,216 | 28,872 | ||||||
Total liabilities | 89,723 | 95,424 | ||||||
Commitments and contingencies | ||||||||
Shareholders’ equity: | ||||||||
Preferred stock; 5,000 shares authorized, no shares issued or outstanding | — | — | ||||||
Common stock, without par value; 200,000 shares authorized, 40,927 and 40,804 shares issued and 36,218 and 37,701 outstanding, respectively | — | — | ||||||
Additional paid-in capital | 88,739 | 85,436 | ||||||
Retained earnings | 263,767 | 244,009 | ||||||
Accumulated other comprehensive loss | (50 | ) | (43 | ) | ||||
Treasury stock | (68,670 | ) | (44,147 | ) | ||||
Total shareholders’ equity | 283,786 | 285,255 | ||||||
Total liabilities and shareholders’ equity | $ | 373,509 | $ | 380,679 | ||||
The accompanying notes are an integral part of these consolidated financial statements.
51
Vera Bradley, Inc.
Consolidated Statements of Income
(in thousands, except per share data)
Fiscal Year Ended | ||||||||||||
January 28, 2017 | January 30, 2016 | January 31, 2015 | ||||||||||
Net revenues | $ | 485,937 | $ | 502,598 | $ | 508,990 | ||||||
Cost of sales | 209,891 | 221,409 | 239,981 | |||||||||
Gross profit | 276,046 | 281,189 | 269,009 | |||||||||
Selling, general, and administrative expenses | 249,155 | 236,836 | 208,675 | |||||||||
Other income | 1,329 | 2,369 | 3,736 | |||||||||
Operating income | 28,220 | 46,722 | 64,070 | |||||||||
Interest expense, net | 178 | 263 | 407 | |||||||||
Income from continuing operations before income taxes | 28,042 | 46,459 | 63,663 | |||||||||
Income tax expense | 8,284 | 18,901 | 22,828 | |||||||||
Income from continuing operations | 19,758 | 27,558 | 40,835 | |||||||||
Loss from discontinued operations, net of taxes | — | — | (2,386 | ) | ||||||||
Net income | $ | 19,758 | $ | 27,558 | $ | 38,449 | ||||||
Basic weighted-average shares outstanding | 36,838 | 38,795 | 40,568 | |||||||||
Diluted weighted-average shares outstanding | 36,970 | 38,861 | 40,632 | |||||||||
Net income (loss) per share - basic | ||||||||||||
Continuing operations | $ | 0.54 | $ | 0.71 | $ | 1.01 | ||||||
Discontinued operations | — | — | (0.06 | ) | ||||||||
Net income | $ | 0.54 | $ | 0.71 | $ | 0.95 | ||||||
Net income (loss) per share - diluted | ||||||||||||
Continuing operations | $ | 0.53 | $ | 0.71 | $ | 1.00 | ||||||
Discontinued operations | — | — | (0.06 | ) | ||||||||
Net income | $ | 0.53 | $ | 0.71 | $ | 0.95 | ||||||
The accompanying notes are an integral part of these consolidated financial statements.
52
Vera Bradley, Inc.
Consolidated Statements of Comprehensive Income
(in thousands)
Fiscal Year Ended | ||||||||||||
January 28, 2017 | January 30, 2016 | January 31, 2015 | ||||||||||
Net income | $ | 19,758 | $ | 27,558 | $ | 38,449 | ||||||
Cumulative translation adjustment | (7 | ) | (28 | ) | (3 | ) | ||||||
Comprehensive income | $ | 19,751 | $ | 27,530 | $ | 38,446 | ||||||
The accompanying notes are an integral part of these consolidated financial statements.
53
Vera Bradley, Inc.
Consolidated Statements of Shareholders’ Equity
($ in thousands, except share data)
Number of Shares | Accumulated Other Comprehensive (Loss) Income | |||||||||||||||||||||||||
Common Stock | Treasury Stock | Additional Paid-in Capital | Retained Earnings | Treasury Stock | Total Equity | |||||||||||||||||||||
Balance at February 1, 2014 | 40,606,731 | — | $ | 78,153 | $ | 178,002 | $ | (1,008 | ) | $ | — | $ | 255,147 | |||||||||||||
Net income | — | — | — | 38,449 | — | — | 38,449 | |||||||||||||||||||
Translation adjustments | — | — | — | — | 993 | — | 993 | |||||||||||||||||||
Restricted shares vested, net of repurchase for taxes | 88,564 | — | (674 | ) | — | — | — | (674 | ) | |||||||||||||||||
Stock-based compensation | — | — | 3,513 | — | — | — | 3,513 | |||||||||||||||||||
Treasury stock purchased | (620,985 | ) | 620,985 | — | $ | — | $ | — | (12,957 | ) | (12,957 | ) | ||||||||||||||
Balance at January 31, 2015 | 40,074,310 | 620,985 | $ | 80,992 | $ | 216,451 | $ | (15 | ) | $ | (12,957 | ) | $ | 284,471 | ||||||||||||
Net income | — | — | — | 27,558 | — | — | 27,558 | |||||||||||||||||||
Translation adjustments | — | — | — | — | (28 | ) | — | (28 | ) | |||||||||||||||||
Restricted shares vested, net of repurchase for taxes | 108,228 | — | (583 | ) | — | — | — | (583 | ) | |||||||||||||||||
Stock-based compensation | — | — | 5,027 | — | — | — | 5,027 | |||||||||||||||||||
Treasury stock purchased | (2,481,367 | ) | 2,481,367 | — | — | — | (31,190 | ) | (31,190 | ) | ||||||||||||||||
Balance at January 30, 2016 | 37,701,171 | 3,102,352 | $ | 85,436 | $ | 244,009 | $ | (43 | ) | $ | (44,147 | ) | $ | 285,255 | ||||||||||||
Net income | — | — | — | 19,758 | — | — | 19,758 | |||||||||||||||||||
Translation adjustments | — | — | — | — | (7 | ) | — | (7 | ) | |||||||||||||||||
Stock-based compensation | — | — | 4,032 | — | — | — | 4,032 | |||||||||||||||||||
Restricted shares vested, net of repurchase for taxes | 123,002 | — | (729 | ) | — | — | — | (729 | ) | |||||||||||||||||
Treasury stock purchased | (1,606,102 | ) | 1,606,102 | — | — | — | (24,523 | ) | (24,523 | ) | ||||||||||||||||
Balance at January 28, 2017 | 36,218,071 | 4,708,454 | $ | 88,739 | $ | 263,767 | $ | (50 | ) | $ | (68,670 | ) | $ | 283,786 | ||||||||||||
The accompanying notes are an integral part of these consolidated financial statements.
54
Vera Bradley, Inc.
Consolidated Statements of Cash Flows
(in thousands)
Fiscal Year Ended | ||||||||||||
January 28, 2017 | January 30, 2016 | January 31, 2015 | ||||||||||
Cash flows from operating activities | ||||||||||||
Net income | $ | 19,758 | $ | 27,558 | $ | 38,449 | ||||||
Adjustments to reconcile net income to net cash provided by operating activities: | ||||||||||||
Depreciation of property, plant, and equipment | 19,516 | 19,418 | 14,802 | |||||||||
Impairment charges | 12,706 | 2,755 | 414 | |||||||||
Provision for doubtful accounts | 439 | 515 | (148 | ) | ||||||||
Loss on disposal of property, plant, and equipment | 14 | 141 | 21 | |||||||||
Stock-based compensation | 4,032 | 5,027 | 3,513 | |||||||||
Deferred income taxes | (2,176 | ) | (3,340 | ) | 428 | |||||||
Discontinued operations | — | — | 996 | |||||||||
Gain on short-term investment | (152 | ) | — | — | ||||||||
Changes in assets and liabilities: | ||||||||||||
Accounts receivable | 7,542 | (435 | ) | (2,052 | ) | |||||||
Inventories | 11,307 | (15,187 | ) | 38,520 | ||||||||
Prepaid expenses and other assets | (798 | ) | (2,571 | ) | 1,353 | |||||||
Accounts payable | 9,001 | (8,665 | ) | 2,873 | ||||||||
Income taxes | (12,009 | ) | 12,508 | (4,833 | ) | |||||||
Accrued and other liabilities | (3,994 | ) | 5,546 | 9,476 | ||||||||
Net cash provided by operating activities | 65,186 | 43,270 | 103,812 | |||||||||
Cash flows from investing activities | ||||||||||||
Purchases of property, plant, and equipment | (20,778 | ) | (26,322 | ) | (37,128 | ) | ||||||
Purchase of short-term investment | (30,000 | ) | — | — | ||||||||
Proceeds from disposal of property, plant, and equipment | 8 | — | — | |||||||||
Net cash used in investing activities | (50,770 | ) | (26,322 | ) | (37,128 | ) | ||||||
Cash flows from financing activities | ||||||||||||
Tax withholdings for equity compensation | (729 | ) | (583 | ) | (674 | ) | ||||||
Repurchase of common stock | (24,959 | ) | (30,870 | ) | (12,841 | ) | ||||||
Other financing activities, net | (27 | ) | (78 | ) | (89 | ) | ||||||
Net cash used in financing activities | (25,715 | ) | (31,531 | ) | (13,604 | ) | ||||||
Effect of exchange rate changes on cash and cash equivalents | (7 | ) | (28 | ) | (3 | ) | ||||||
Net (decrease) increase in cash and cash equivalents | (11,306 | ) | (14,611 | ) | 53,077 | |||||||
Cash and cash equivalents, beginning of period | 97,681 | 112,292 | 59,215 | |||||||||
Cash and cash equivalents, end of period | $ | 86,375 | $ | 97,681 | $ | 112,292 | ||||||
Supplemental disclosure of cash-flow information | ||||||||||||
Cash paid for income taxes, net | $ | 24,824 | $ | 9,302 | $ | 25,957 | ||||||
Cash paid for interest | $ | 248 | $ | 259 | $ | 275 | ||||||
Supplemental disclosure of non-cash activity | ||||||||||||
Non-cash operating, investing, and financing activities | ||||||||||||
Repurchase of common stock incurred but not yet paid | ||||||||||||
As of January 28, 2017, January 30, 2016 and January 31, 2015 | $ | — | $ | 436 | $ | 116 | ||||||
As of January 30, 2016, January 31, 2015 and February 1, 2014 | $ | 436 | $ | 116 | $ | — | ||||||
Purchases of property, plant, and equipment incurred but not yet paid | ||||||||||||
As of January 28, 2017, January 30, 2016 and January 31, 2015 | $ | 2,204 | $ | 2,872 | $ | 2,172 | ||||||
As of January 30, 2016, January 31, 2015 and February 1, 2014 | $ | 2,872 | $ | 2,172 | $ | — | ||||||
The accompanying notes are an integral part of these consolidated financial statements.
55
Vera Bradley, Inc.
Notes to Consolidated Financial Statements
1. | Description of the Company |
Vera Bradley, Inc. (“Vera Bradley” or the “Company”) is a leading designer of women’s handbags, luggage and travel items, fashion and home accessories, and unique gifts. Founded in 1982 by friends Barbara Bradley Baekgaard and Patricia R. Miller, the brand’s innovative designs, iconic patterns, and brilliant colors continue to inspire and connect women.
Vera Bradley offers a unique, multi-channel sales model, as well as a focus on service and a high level of customer engagement. The Company sells its products through two reportable segments: Direct and Indirect. The Direct business consists of sales of Vera Bradley products through the Company’s full-line and factory outlet stores in the United States, verabradley.com, direct-to-consumer eBay sales, and the Company's annual outlet sale in Fort Wayne, Indiana. As of January 28, 2017, the Company operated 113 full-line stores and 46 factory outlet stores. The Indirect business consists of sales of Vera Bradley products to approximately 2,600 specialty retail locations, substantially all of which are located in the United States, as well as department stores, national accounts, third party e-commerce sites, the Company's wholesale customer in Japan, and third party inventory liquidators.
Principles of Consolidation
The consolidated financial statements include the accounts of the Company and its wholly owned subsidiaries. The Company has eliminated intercompany balances and transactions in consolidation.
Fiscal Periods
The Company utilizes a 52-53 week fiscal year ended on the Saturday closest to January 31. As such, fiscal year 2017, 2016 and 2015 ending on January 28, 2017, January 30, 2016 and January 31, 2015, respectively, each reflected a 52-week period.
2. | Summary of Significant Accounting Policies |
Use of Significant Estimates
The preparation of financial statements in conformity with accounting principles generally accepted in the United States of America (“GAAP”) requires management to make estimates and assumptions that affect the reported amounts of the Company’s assets, liabilities, revenues, and expenses, as well as the disclosures relating to contingent assets and liabilities at the date of the consolidated financial statements. Significant areas requiring the use of management estimates include the valuation of inventories, accounts receivable valuation allowances, sales return allowances, and the useful lives of assets for depreciation or amortization. Actual results could differ from these estimates. The Company revises its estimates and assumptions as new information becomes available.
Prior period amounts related to impairment charges in the Consolidated Statements of Cash Flows have been reclassified to conform to the current year presentation.
Cash and Cash Equivalents
Cash and cash equivalents represent cash on hand, deposits with financial institutions, and investments with an original maturity of three months or less.
Concentration of Credit Risk
The Company maintains nearly all of its cash and cash equivalents with one financial institution. The Company monitors the credit standing of this financial institution on a regular basis.
Short-Term Investments
Short-term investments consist of a certificate of deposit with an original maturity of one year and a one-time option to accelerate maturity to 31 days without penalty. Interest income from the investment is included in interest expense, net, in the Company’s Consolidated Financial Statements. The Company’s objective with respect to this investment is to earn a higher rate of return, relative to deposit accounts, on funds that are otherwise not anticipated to be required to meet liquidity needs in the near term while maintaining a low level of investment risk. The Company has the intent and ability to hold this investment to maturity. As of January 28, 2017, the Company held $30.2 million in short-term investments, which included $0.2 million in interest income recognized in interest expense, net in the Company’s Consolidated Financial Statements. The Company did not have short-term investments as of January 30, 2016.
56
Inventories
Inventories are stated at the lower of cost or market. Cost is determined using the first-in, first-out (“FIFO”) method. Market is determined based on net realizable value, which includes costs to dispose. Appropriate consideration is given to obsolescence, excess quantities, and other factors, including the popularity of a pattern or product, in evaluating net realizable value.
Property, Plant, and Equipment
Property, plant, and equipment are carried at cost and depreciated or amortized over the following estimated useful lives using the straight-line method:
Buildings and building improvements .............................................. | 39.5 years | ||
Land improvements ........................................................................... | 5 – 15 years | ||
Furniture and fixtures, and leasehold improvements ........................ | 3 – 10 years | ||
Equipment ......................................................................................... | 7 years | ||
Vehicles ............................................................................................. | 5 years | ||
Computer equipment and software ................................................... | 3 – 5 years | ||
Leasehold improvements are amortized over the shorter of the life of the asset or the lease term. Lease terms typically range from three to ten years.
When a decision is made to abandon property, plant, and equipment prior to the end of the previously estimated useful life, depreciation or amortization estimates are revised to reflect the use of the asset over the shortened estimated useful life. At the time of disposal, the cost of assets sold or retired and the related accumulated depreciation or amortization are removed from the accounts and any resulting loss is included in the Consolidated Statements of Income.
Property, plant, and equipment are reviewed for impairment whenever events or changes in circumstances indicate that the carrying amount of the assets may not be recoverable. The reviews are conducted at the lowest identifiable level of cash flows. If the estimated undiscounted future cash flows related to the property, plant, and equipment are less than the carrying value, the Company recognizes a loss equal to the difference between the carrying value and the fair value, as further defined below in “Fair Value of Financial Instruments.”
Routine maintenance and repair costs are expensed as incurred.
The Company capitalizes certain costs incurred in connection with acquiring, modifying, and installing internal-use software. Capitalized costs are included in property, plant, and equipment and are amortized over three to five years. Software costs that do not meet capitalization criteria are expensed as incurred.
Revenue Recognition and Accounts Receivable
Revenue from the sale of the Company’s products is recognized upon customer receipt of the product when collection of the associated receivables is reasonably assured, persuasive evidence of an arrangement exists, the sales price is fixed and determinable, and ownership and risk of loss have been transferred to the customer, which, for e-commerce and most Indirect sales, reflects an adjustment for shipments that customers have not yet received. The adjustment of these shipments is based on actual delivery dates to the customer.
Included in net revenues are product sales to Direct and Indirect customers, including amounts billed to customers for shipping fees. Costs related to shipping of product are classified in cost of sales in the Consolidated Statements of Income. Net revenues exclude sales taxes collected from customers and remitted to governmental authorities.
Historical experience provides the Company the ability to reasonably estimate the amount of product sales that customers will return. Product returns are often resalable through the Company’s annual outlet sale or other channels. Additionally, the Company reserves for other potential product credits granted to Indirect retailers. The returns and credits reserve and the related activity for each fiscal year presented were as follows (in thousands):
57
Balance at Beginning of Year | Provision Charged to Net Revenues | Allowances Taken | Balance at End of Year | |||||||||||||
Fiscal year ended January 28, 2017 | $ | 2,317 | $ | 32,905 | $ | (29,862 | ) | $ | 5,360 | |||||||
Fiscal year ended January 30, 2016 | 2,173 | 25,707 | (25,563 | ) | 2,317 | |||||||||||
Fiscal year ended January 31, 2015 | 1,424 | 30,140 | (29,391 | ) | 2,173 | |||||||||||
The Company establishes an allowance for doubtful accounts based on historical experience and customer-specific identification and believes that collections of receivables, net of the allowance for doubtful accounts, are reasonably assured. The allowance for doubtful accounts was approximately $0.6 million and $0.5 million as of January 28, 2017, and January 30, 2016, respectively.
The Company sells gift cards with no expiration dates to customers and does not charge administrative fees on unused gift cards. Gift cards issued by the Company are recorded as a liability until they are redeemed, at which point revenue is recognized. In addition, the Company recognizes revenue on unredeemed gift cards when the likelihood of the gift card being redeemed is remote and there is no legal obligation to remit the value of unredeemed gift cards to the relevant jurisdictions. The Company determines the gift card breakage rate based on historical redemption patterns. During the fiscal years ended January 28, 2017, January 30, 2016 and January 31, 2015, the Company recorded $0.3 million, $0.3 million and $1.4 million of revenue related to gift card breakage, respectively. Gift card breakage is included in net sales in the Consolidated Statements of Income, as well as Direct segment sales.
Cost of Sales
Cost of sales includes material and labor costs, freight, inventory shrinkage, operating lease costs, duty, and other operating expenses, including depreciation of the Company’s distribution center and equipment. Costs and related expenses to purchase and distribute the products are recorded as cost of sales when the related revenues are recognized.
Operating Leases and Tenant-Improvement Allowances
The Company has leases that contain rent holidays and predetermined, fixed escalations of minimum rentals. For each of these leases, the Company recognizes the related rent expense on a straight-line basis commencing on the date of initial possession of the leased property. The Company records the difference between the recognized rent expense and the amount payable under the lease as a deferred rent liability. As of January 28, 2017 and January 30, 2016, deferred rent liability was $12.7 million and $11.5 million, respectively, and is included within long-term liabilities on the Consolidated Balance Sheets.
The Company receives tenant-improvement allowances from some of the landlords of its leased properties. These allowances generally are in the form of cash received by the Company from its landlords as part of the negotiated lease terms. The Company records each tenant-improvement allowance as a deferred credit and amortizes the allowance on a straight-line basis as a reduction to rent expense over the term of the lease, commencing on the possession date. As of January 28, 2017 and January 30, 2016, the deferred lease credit liability was $15.8 million and $16.2 million, respectively. Of this, $2.4 million and $2.3 million is included within other accrued liabilities and $13.4 million and $13.9 million is included within long-term liabilities on the Consolidated Balance Sheets as of January 28, 2017 and January 30, 2016, respectively.
Store Pre-Opening, Occupancy, and Operating Costs
The Company charges costs associated with the opening of new stores to selling, general, and administrative expenses as incurred. Selling, general, and administrative expenses also include store operating costs, store employee compensation, and store occupancy and supply costs.
Stock-Based Compensation
The Company accounts for stock-based compensation using the fair-value recognition provisions of Accounting Standards Codification 718, Stock Compensation. Under these provisions, for its awards of restricted stock and restricted-stock units, the Company recognizes stock-based compensation expense in an amount equal to the fair market value of the underlying
58
stock on the grant date of the respective award. The Company recognizes this expense, net of estimated forfeitures, on a straight-line basis over the requisite service period.
Other Income and Advertising Costs
The Company expenses advertising costs at the time the promotion first appears in media, in stores, or on the website, and includes those costs in selling, general, and administrative expenses in the Consolidated Statements of Income. The Company classifies the related recovery of a portion of such costs from Indirect retailers as other income in the Consolidated Statements of Income.
Total advertising expense was as follows (in thousands):
Fiscal year ended January 28, 2017 | $ | 32,222 | |
Fiscal year ended January 30, 2016 | 33,392 | ||
Fiscal year ended January 31, 2015 | 28,936 | ||
Total recovery from Indirect retailers was as follows (in thousands):
Fiscal year ended January 28, 2017 | $ | 1,000 | |
Fiscal year ended January 30, 2016 | 2,180 | ||
Fiscal year ended January 31, 2015 | 3,509 | ||
Debt-Issuance Costs
During the fiscal year ended January 30, 2016, in connection with the second amendment and restatement of the credit agreement (see Note 5), the Company incurred additional debt-issuance costs of $0.5 million. The Company is amortizing the remaining debt-issuance costs to interest expense over the five-year term of the second amended and restated credit agreement. Debt-issuance costs, net of accumulated amortization, totaled $0.6 million at January 28, 2017, and $0.8 million at January 30, 2016, and are included in other assets on the Consolidated Balance Sheets. Amortization expense of $0.2 million is included in interest expense in the Consolidated Statements of Income for each of the fiscal years ended January 28, 2017, January 30, 2016, and January 31, 2015.
Fair Value of Financial Instruments
Fair value is defined as the price that would be received to sell an asset or paid to transfer a liability in an orderly transaction between market participants at the measurement date. Assets and liabilities measured at fair value are classified using the following hierarchy, which is based upon the transparency of inputs to the valuation as of the measurement date:
•Level 1 – Quoted prices in active markets for identical assets or liabilities;
•Level 2 – Inputs, other than the quoted prices in active markets, that are observable either directly or indirectly;
•Level 3 – Unobservable inputs based on the Company’s own assumptions.
The classification of fair value measurements within the hierarchy is based upon the lowest level of input that is significant to the measurement.
The carrying amounts reflected on the Consolidated Balance Sheets for cash and cash equivalents, accounts receivable, other current assets, and accounts payable as of January 28, 2017 and January 30, 2016, approximated their fair values.
Short-term investments consist of a certificate of deposit with an original maturity of one year and a one-time option to accelerate maturity to 31 days without penalty. The initial investment was $30.0 million, and the Company has the positive intent and ability to hold the certificate of deposit to maturity. The accrued interest on the certificate of deposit is recognized in interest expense, net, in the Company's Consolidated Financial Statements. Due to the observable inputs, the certificate of deposit approximated its fair value as of January 28, 2017, and is classified within Level 2 of the fair value hierarchy.
The Company has certain assets that are measured under circumstances and events described in Note 4. The categorization of the framework to price these assets are level 3 due to subjective nature of unobservable inputs.
59
Income Taxes
The Company accrues income taxes payable or refundable and recognizes deferred tax assets and liabilities based on differences between the book and tax bases of assets and liabilities. The Company measures deferred tax assets and liabilities using enacted rates in effect for the years in which the differences are expected to reverse, and recognizes the effect of a change in enacted rates in the period of enactment.
The Company establishes liabilities for uncertain positions taken or expected to be taken in income tax returns, using a more-likely-than-not recognition threshold. The Company includes in income tax expense any interest and penalties related to uncertain tax positions.
Recently Issued Accounting Pronouncements
Recently Adopted Accounting Pronouncements
In March 2016, the Financial Accounting Standards Board ("FASB") issued Accounting Standards Update ("ASU") 2016-09, Compensation - Stock Compensation (Topic 718): Improvements to Employee Share-Based Payment Accounting. The updated guidance changes how companies account for certain aspects of share-based payment awards to employees, including the accounting for income taxes, forfeitures, and statutory tax withholding requirements, as well as the classification of related matters in the statement of cash flows. The standard is effective for public entities for annual periods beginning after December 15, 2016, and interim periods within those annual periods. Early adoption is permitted.
The Company early adopted this standard beginning with the quarter ended April 30, 2016. The impact of the adoption of this standard was as follows:
• | excess tax benefits were combined with other income tax cash flows within operating cash flows adopted on a prospective basis; |
• | excess tax benefits were recorded to income tax expense as a discrete item adopted on a prospective basis; and |
• | cash paid by the Company when directly withholding shares to satisfy an employee's statutory tax obligations continued to be classified as a financing activity. |
• | The Company has elected to continue its current policy of estimating forfeitures rather than recognizing forfeitures when they occur. |
Recently Issued Accounting Pronouncements Not Yet Adopted
In May 2014, the FASB issued ASU 2014-09, Revenue from Contracts with Customers. This guidance requires companies to recognize revenue in a manner that depicts the transfer of promised goods or services to customers in amounts that reflect the consideration to which a company expects to be entitled in exchange for those goods or services. The new standard also will result in enhanced disclosures about the nature, amount, timing and uncertainty of revenue and cash flows arising from contracts with customers. The standard allows for either a full retrospective or a modified retrospective transition method. In August 2015, the FASB issued ASU 2015-14 to defer the effective date of ASU 2014-09 for all entities by one year to annual periods beginning after December 15, 2017, including interim periods within that reporting period, which for the Company is fiscal 2019. Earlier application is permitted as of the original effective date, annual reporting periods beginning after December 2016, including interim periods within that reporting period.
In its preliminary assessment, the provisions of the standard the Company believes to be most significant is the determination of when a customer receives control of the product upon a sale, as this could result in earlier recognition of revenue as compared to the Company's current practice of adjusting for shipments not yet received. The Company is still evaluating the final impact on its consolidated results of operations, financial position and cash flows, as well as additional provisions that may impact the Company's recognition of revenue. The Company will adopt the standard in the first quarter of fiscal 2019 and is continuing to evaluate the transition method upon adoption.
In July 2015, the FASB issued ASU 2015-11, Inventory, which requires entities to measure inventory at the lower of cost and net realizable value. This guidance is effective for interim and annual periods beginning on or after December 15, 2016 which for the Company is fiscal 2018. The application of this standard will not have a material impact on the Company’s Consolidated Financial Statements upon adoption.
In February 2016, the FASB issued ASU 2016-02, Leases, which increases transparency and comparability among organizations by requiring lessees to recognize assets and liabilities on the balance sheet for the rights and obligations created by leases and disclosing key information about leasing arrangements. This guidance is effective for interim and annual periods beginning on or after December 15, 2018. The Company has operating leases at all of its retail stores;
60
therefore, the adoption of this standard will result a material increase of assets and liabilities on the Company's Consolidated Balance Sheets. The Company is continuing evaluate the impact on its consolidated results of operations and cash flows.
3. | Inventories |
The components of inventories were as follows (in thousands):
January 28, 2017 | January 30, 2016 | |||||||
Raw materials | $ | — | $ | 151 | ||||
Finished goods | 102,283 | 113,439 | ||||||
Total inventories | $ | 102,283 | $ | 113,590 | ||||
4. | Property, Plant, and Equipment |
Property, plant, and equipment consisted of the following (in thousands):
January 28, 2017 | January 30, 2016 | |||||||
Land and land improvements | $ | 5,981 | $ | 5,981 | ||||
Building and building improvements | 46,233 | 46,145 | ||||||
Furniture, fixtures, leasehold improvements, computer equipment and software | 127,791 | 127,913 | ||||||
Equipment and vehicles | 20,329 | 19,931 | ||||||
Construction in progress | 7,885 | 8,034 | ||||||
208,219 | 208,004 | |||||||
Less: Accumulated depreciation and amortization | (106,642 | ) | (94,293 | ) | ||||
Property, plant, and equipment, net | $ | 101,577 | $ | 113,711 | ||||
Property, plant, and equipment are reviewed for impairment whenever events or changes in circumstances indicate that the carrying amount of the assets may not be recoverable. The reviews are conducted at the lowest identifiable level of cash flows. If the estimated undiscounted future cash flows related to the property, plant, and equipment are less than the carrying value, the Company recognizes a loss equal to the difference between the carrying value and the fair value, as further defined in Note 2. An impairment charge of $12.7 million, $2.8 million and $0.4 million was recognized, using level 3 inputs, in the fiscal years ended January 28, 2017, January 30, 2016 and January 31, 2015, respectively, for assets related to underperforming stores and is included in selling, general, and administrative expenses in the Consolidated Statements of Income and in impairment charges in the Consolidated Statements of Cash Flows. The impairment charges are included in the Direct segment.
Depreciation and amortization expense associated with property, plant, and equipment, excluding impairment charges and discontinued operations (in thousands):
Fiscal year ended January 28, 2017 | $ | 19,516 | |
Fiscal year ended January 30, 2016 | 19,418 | ||
Fiscal year ended January 31, 2015 | 14,425 | ||
5. | Debt |
As of January 28, 2017 and January 30, 2016, the Company had no borrowings outstanding and availability of $125.0 million under the amended and restated credit agreement.
Second Amended and Restated Credit Agreement
On July 15, 2015, Vera Bradley Designs, Inc. (“VBD”), a wholly-owned subsidiary of the Company, entered into a Second Amended and Restated Credit Agreement among VBD, the lenders from time to time party thereto, JPMorgan Chase Bank,
61
National Association, as administrative agent, Wells Fargo Bank, National Association, as syndication agent, and KeyBank National Association, as documentation agent (the “Credit Agreement”), which amended and restated the Company's prior credit agreement. The Credit Agreement provides for certain credit facilities to VBD in an aggregate principal amount not to initially exceed $125.0 million, the proceeds of which will be used for general corporate purposes of VBD and its subsidiaries, including but not limited to Vera Bradley International, LLC and Vera Bradley Sales, LLC (collectively, the “Named Subsidiaries”).
Amounts outstanding under the Credit Agreement bear interest, at VBD's option, at a per annum rate equal to either (A) the Alternate Base Rate (“ABR”) plus the Applicable Margin, where the ABR is the highest of (i) the prime rate, (ii) the federal funds rate plus 0.5%, and (iii) Adjusted LIBOR for a one-month interest period plus 1%, and the Applicable Margin is a percentage ranging from 0.00% to 0.70% depending upon the Company's leverage ratio or (B) Adjusted LIBOR plus the Applicable Margin, where Adjusted LIBOR means LIBOR, as adjusted for statutory reserve requirements for eurocurrency liabilities, and Applicable Margin is a percentage ranging from 1.00% to 1.70% depending upon the Company's leverage ratio. Any loans made, or letters of credit issued, pursuant to the Credit Agreement mature on July 15, 2020.
VBD's obligations under the Credit Agreement are guaranteed by the Company and the Named Subsidiaries. The obligations of VBD under the Credit Agreement are secured by first priority security interests in all of the respective assets of VBD, the Company, and the Named Subsidiaries and a pledge of the equity interests of VBD and the Named Subsidiaries.
The Credit Agreement contains various restrictive covenants, including restrictions on the Company's ability to dispose of assets, make acquisitions or investments, incur debt or liens, make distributions to stockholders or repurchase outstanding stock, enter into related party transactions and make capital expenditures, other than upon satisfaction of the conditions set forth in the Credit Agreement. The Company is also required to comply with certain financial and non-financial covenants, including maintaining a maximum leverage ratio, a minimum ratio of EBITDAR to the sum of interest expense plus rentals (as defined in the Credit Agreement), and a limit on capital expenditures. Upon an event of default, which includes certain customary events such as, among other things, a failure to make required payments when due, a failure to comply with covenants, certain bankruptcy and insolvency events, a material adverse change (as defined in the Credit Agreement), defaults under other material indebtedness, and a change in control, the lenders may accelerate amounts outstanding, terminate the agreement and foreclose on all collateral.
6. | Income Taxes |
The components of income tax expense were as follows (in thousands):
January 28, 2017 | January 30, 2016 | January 31, 2015 | ||||||||||
Current: | ||||||||||||
Federal | $ | 8,810 | $ | 19,823 | $ | 20,715 | ||||||
Foreign | 526 | 18 | 54 | |||||||||
State | 1,124 | 2,400 | 1,631 | |||||||||
10,460 | 22,241 | 22,400 | ||||||||||
Deferred: | ||||||||||||
Federal | (1,623 | ) | (2,813 | ) | (19 | ) | ||||||
State | (553 | ) | (527 | ) | 447 | |||||||
(2,176 | ) | (3,340 | ) | 428 | ||||||||
Total income tax expense | $ | 8,284 | $ | 18,901 | $ | 22,828 | ||||||
A breakdown of the Company’s income from continuing operations before income taxes is as follows (in thousands):
January 28, 2017 | January 30, 2016 | January 31, 2015 | ||||||||||
Domestic | $ | 24,891 | $ | 46,386 | $ | 63,445 | ||||||
Foreign | 3,151 | 73 | 218 | |||||||||
Total income from continuing operations before income taxes | $ | 28,042 | $ | 46,459 | $ | 63,663 | ||||||
62
A reconciliation of income tax expense to the amount computed at the federal statutory rate is as follows (in thousands):
January 28, 2017 | January 30, 2016 | January 31, 2015 | |||||||||||||||||||
Federal taxes at statutory rate | $ | 9,815 | 35.0 | % | $ | 16,261 | 35.0 | % | $ | 22,282 | 35.0 | % | |||||||||
State and local income taxes, net of federal benefit | 371 | 1.3 | 1,217 | 2.6 | 1,350 | 2.2 | |||||||||||||||
Impact of foreign rate differential | (413 | ) | (1.5 | ) | — | — | — | — | |||||||||||||
Change in uncertain tax positions | (1,426 | ) | (5.1 | ) | — | — | — | — | |||||||||||||
Other | (63 | ) | (0.2 | ) | 1,423 | 3.1 | (804 | ) | (1.3 | ) | |||||||||||
Total income tax expense | $ | 8,284 | 29.5 | % | $ | 18,901 | 40.7 | % | $ | 22,828 | 35.9 | % | |||||||||
The decrease in the Company’s effective income tax rate from the federal statutory rate was primarily due to the release of certain federal and state income tax reserves resulting from the conclusion of an IRS audit in fiscal 2017. Additionally, in April 2016, the Company opened an office in Hong Kong to lead the global supply chain in Asia, including the oversight of sourcing and procurement. As a result, the Company began recognizing a small benefit in the current year.
During the third quarter of fiscal 2015, the Company discontinued retail operations in Japan. The above information consists of continuing operations only. At the beginning of fiscal 2015, the Company made an election for tax purposes to treat the Japan operations as a branch thereby causing the Japan activity to be taxed in the United States. The final tax accounting regarding Japan was recognized upon the sale of all Japan inventory in fiscal 2016.
Deferred income taxes reflect the net tax effects of temporary differences between the book and tax bases of assets and liabilities. Significant components of deferred tax assets and liabilities were as follows (in thousands):
January 28, 2017 | January 30, 2016 | |||||||
Deferred tax assets: | ||||||||
Compensation and benefits | $ | 5,420 | $ | 5,761 | ||||
Inventories | 2,718 | 4,855 | ||||||
Deferred credits from landlords | 11,722 | 11,056 | ||||||
Other | 4,913 | 5,162 | ||||||
Subtotal deferred tax assets | 24,773 | 26,834 | ||||||
Less: valuation allowances | — | (194 | ) | |||||
Total deferred tax assets | 24,773 | 26,640 | ||||||
Deferred tax liabilities: | ||||||||
Property, plant, and equipment | (8,505 | ) | (12,970 | ) | ||||
Other | (2,729 | ) | (2,307 | ) | ||||
Total deferred tax liabilities | (11,234 | ) | (15,277 | ) | ||||
Net deferred tax assets | $ | 13,539 | $ | 11,363 | ||||
As of January 28, 2017, a provision for U.S. income tax has not been recorded on the temporary difference of approximately $1.9 million related to the Company’s foreign subsidiary. The Company has determined that this temporary difference is indefinitely reinvested outside of the U.S. The amount of unrecognized deferred tax liability related to this temporary difference is estimated to be $0.4 million.
63
Uncertain Tax Positions
A reconciliation of the beginning and ending gross amount of unrecognized tax benefits (excluding interest and penalties) is as follows (in thousands):
January 28, 2017 | January 30, 2016 | January 31, 2015 | ||||||||||
Beginning balance | $ | 3,099 | $ | 3,018 | $ | 3,115 | ||||||
Net increases (decreases) in unrecognized tax benefits as a result of current year activity | 15 | 81 | (97 | ) | ||||||||
Reductions for tax positions of prior years | (1,695 | ) | — | — | ||||||||
Settlements | (214 | ) | — | — | ||||||||
Lapse of statute of limitations | (328 | ) | — | — | ||||||||
Ending balance | $ | 877 | $ | 3,099 | $ | 3,018 | ||||||
As of January 28, 2017, of the $0.9 million of total unrecognized tax benefits, $0.6 million, which is net of federal benefit, would, if recognized, favorably affect the effective tax rate in future periods. Total unrecognized tax benefits are currently not expected to decrease by a significant amount in the next twelve months. The Company recognized an immaterial amount of interest only, no penalties, related to unrecognized tax benefits in the fiscal years ended January 28, 2017, January 30, 2016 and January 31, 2015. Unrecognized tax benefits are included within long-term liabilities in the Company's Consolidated Balance Sheets.
The current year decrease is primarily related to the release of federal and state income tax reserves resulting from the conclusion of an IRS audit.
The Company files income tax returns in the U.S. federal jurisdiction and various U.S. state and foreign jurisdictions. The Company is subject to U.S. federal income tax examinations for fiscal years 2015 and forward. With a few exceptions, the Company is subject to audit by various state and foreign taxing authorities for fiscal 2013 through the current fiscal year.
7. | Leases |
The Company is party to non-cancellable operating leases. Future minimum lease payments under the non-cancellable operating leases through expiration are as follows (in thousands and by fiscal year):
Fiscal Year | Amount | |||
2018 | $ | 32,681 | ||
2019 | 31,456 | |||
2020 | 30,642 | |||
2021 | 29,908 | |||
2022 | 27,408 | |||
Thereafter | 70,055 | |||
$ | 222,150 | |||
Rental expense for all leases, excluding discontinued operations, was as follows (in thousands):
Fiscal year ended January 28, 2017 | $ | 33,925 | |
Fiscal year ended January 30, 2016 | 32,456 | ||
Fiscal year ended January 31, 2015 | 25,198 | ||
Lease terms generally range from three to ten years, generally ten years in the case of the Company's retail stores, with options to renew for varying terms. Future minimum lease payments relate primarily to the lease of retail space. Additionally, several lease agreements contain a provision for payments based on a percentage of sales in addition to the
64
stated lease payments. Percentage rent expense was $2.8 million, $2.4 million and $1.9 million for fiscal years ended January 28, 2017, January 30, 2016, and January 31, 2015, respectively.
During fiscal 2015, the Company leased one of its facilities from leasing companies owned by certain shareholders and directors. Lease expense related to this arrangement was $0.1 million for fiscal year ended January 31, 2015.
8. | Stock-Based Compensation |
The Company’s stock-based compensation consists of awards of restricted stock and restricted stock units. The Company recognized stock-based compensation expense of $4.0 million, $5.0 million and $3.5 million in the fiscal years ended January 28, 2017, January 30, 2016, and January 31, 2015, respectively.
Awards of Restricted-Stock Units
The Company reserved 6,076,001 shares of common stock for issuance or transfer under the 2010 Equity and Incentive Plan, which allows for grants of restricted stock units, as well as other equity awards. As of January 28, 2017, there were 4,961,706 of shares remaining in that program.
During the fiscal year ended January 28, 2017, the Company granted a total of 413,457 time-based and performance-based restricted stock units to certain employees and non-employee directors under the 2010 Equity and Incentive Plan with an aggregate fair value of $7.6 million. The Company determined the fair value of the units based on the closing price of the Company’s common stock on the grant date.
The majority of time-based restricted stock units vest and settle in shares of the Company’s common stock, on a one-for-one basis, in equal installments on each of the first three anniversaries of the grant date. Restricted stock awards issued to non-employee directors vest after a one-year period from grant date. The Company is recognizing the expense relating to these awards, net of estimated forfeitures, on a straight-line basis over the vesting period.
The majority of performance-based restricted stock units vest upon the completion of a three-year period of time (cliff vesting), subject to the employee’s continuing employment throughout the three-year performance period and the Company’s achievement of annual earnings per share targets, or other Company performance targets, during the three-year performance period. The Company is recognizing the expense relating to these units, net of estimated forfeitures and based on the probable outcome of achievement of the financial targets, on a straight-line basis over the vesting period.
The following table summarizes information about restricted-stock units as of and for the year ended January 28, 2017 (units in thousands):
Time-based Restricted Stock Units | Performance-based Restricted Stock Units | |||||||||||||
Number of Units | Weighted- Average Grant Date Fair Value (per unit) | Number of Units | Weighted- Average Grant Date Fair Value (per unit) | |||||||||||
Nonvested units outstanding at January 30, 2016 | 463 | $ | 18.05 | 303 | $ | 20.95 | ||||||||
Granted | 234 | 18.41 | 180 | 18.30 | ||||||||||
Vested | (164 | ) | 18.87 | — | — | |||||||||
Forfeited | (46 | ) | 17.08 | (108 | ) | 22.99 | ||||||||
Nonvested units outstanding at January 28, 2017 | 487 | $ | 18.04 | 375 | $ | 19.10 | ||||||||
As of January 28, 2017, there was $6.0 million of total unrecognized compensation cost, net of estimated forfeitures, related to nonvested restricted stock units. That cost is expected to be recognized over a weighted average period of 1.5 years. The total fair value of restricted stock units for which restrictions lapsed (vested) during fiscal 2017 was $3.0 million. No restricted-stock awards were granted, vested, or forfeited for the year ended January 28, 2017.
65
9. | Commitments and Contingencies |
Payment Card Incident
Description of Event
On September 15, 2016, the Company received information from law enforcement regarding a potential data security issue related to our retail store network. Findings from the investigation show unauthorized access to the Company's payment processing system and the installation of a program that looked for payment card data. The program was specifically designed to find track data in the magnetic stripe of a payment card that may contain the card number, cardholder name, expiration date, and internal verification code as the data was being routed through the affected payment system. There is no indication that other customer information was at risk. Payment cards used at Vera Bradley store locations between July 25, 2016 and September 23, 2016 may have been affected. Not all cards used in stores during this time frame were affected. Cards used on verabradley.com were not affected.
The Company has resolved this incident and continues to work with the computer security firm to further strengthen the security of its systems to help prevent this from happening in the future. The Company continues to support law enforcement’s investigation and also promptly notified the payment card networks so that the banks that issue payment cards could initiate heightened monitoring on the affected cards.
Expenses Incurred and Amounts Accrued
During fiscal 2017, the Company recorded an immaterial amount of expense relating to the Payment Card Incident. Expenses included costs to investigate the Payment Card Incident and obtain legal and other professional services.
Future Costs
The Company expects to incur additional legal and professional services, as well as expenses and capital investments for remediation activities associated with the Payment Card Incident and will recognize the expenses as incurred. In addition, payment card companies and associations may require the Company to reimburse them for unauthorized card charges and costs to replace cards and may also impose fines or penalties in connection with the Payment Card Incident, and enforcement authorities may also impose fines or other remedies against the Company. At this time, the Company cannot reasonably estimate the potential loss or range of loss related to any fines or penalties that may be assessed. The Payment Card Incident, including customer response and any possible third party claims or assessments from payment card companies, could materially adversely affect the Company's financial condition and operating results. The Company expects its insurance coverage will offset most of the expenses for the investigation and other non-remediation legal and professional services associated with the incident, possible third party claims, as well as fines, penalties, or other expenses, if any, imposed by payment card companies, as discussed above.
Insurance Coverage
The Company maintains $15.0 million of cyber security insurance coverage above a $0.1 million deductible.
Other Commitments and Contingencies
The Company is also subject to various claims and contingencies arising in the normal course of business, including those relating to product liability, legal claims, employee benefits, environmental, and other matters. Management believes that at this time it is not probable that any of these claims will have a material adverse effect on the Company’s financial condition, results of operations, or cash flows. However, the outcomes of legal proceedings and claims brought against the Company are subject to uncertainty and future developments could cause these actions or claims, individually or in aggregate, to have a material adverse effect on the Company’s financial condition, results of operations or cash flows of a particular reporting period.
66
10. | 401(k) Profit Sharing Plan and Trust |
The Company has a 401(k) profit sharing plan and trust for all qualified employees and provides a 100% match for the first 3% of employee contributions and a 50% match for the next 2% of employee contributions, for a maximum Company match of 4% of employee contributions, limited to the annual legal allowable limit. Additionally, the Company has the option of making discretionary profit sharing payments to the plan as approved by the board of directors. As of January 28, 2017, January 30, 2016 and January 31, 2015, no discretionary profit sharing payments had been approved. Total Company contributions to the plan, excluding discontinued operations, were as follows (in thousands):
Fiscal year ended January 28, 2017 | $ | 1,624 | |
Fiscal year ended January 30, 2016 | 1,965 | ||
Fiscal year ended January 31, 2015 | 2,394 | ||
11. | Related-Party Transactions |
The Company leased its former corporate headquarters in fiscal 2015 from leasing companies owned by certain shareholders and directors, as described further in Note 7.
During the fiscal year ended January 28, 2017 and January 31, 2015, the Company made charitable contributions of approximately $0.1 million and $0.8 million, respectively, to the Vera Bradley Foundation for Breast Cancer (the “Foundation”). The Company did not make charitable contributions during the fiscal year ended January 30, 2016. The Foundation was founded by two of the Company’s directors, who are also on the board of directors of the Foundation. The liability associated with commitments to the Foundation was approximately $0.4 million as of January 28, 2017 and January 30, 2016. The liability consisted of pass-through donations from customers and is included in other accrued liabilities in the Consolidated Balance Sheets.
The associated expense for contributions to the Foundation, which is included in selling, general, and administrative expenses, was as follows (in thousands):
Fiscal year ended January 28, 2017 | $ | 53 | |
Fiscal year ended January 30, 2016 | — | ||
Fiscal year ended January 31, 2015 | 750 | ||
67
12. | Earnings Per Share |
Basic net income per share is computed based on the weighted-average number of common shares outstanding during the period. Diluted net income per share is computed based on the weighted-average number of shares of common stock plus the effect of dilutive potential common shares outstanding during the period using the treasury stock method. Dilutive potential common shares include outstanding restricted stock and restricted-stock units. The components of basic and diluted net income per share are as follows (in thousands, except per share data):
Fiscal Year Ended | ||||||||||||
January 28, 2017 | January 30, 2016 | January 31, 2015 | ||||||||||
Numerator: | ||||||||||||
Income from continuing operations | $ | 19,758 | $ | 27,558 | $ | 40,835 | ||||||
Loss from discontinued operations, net of taxes | — | — | (2,386 | ) | ||||||||
Net income | $ | 19,758 | $ | 27,558 | $ | 38,449 | ||||||
Denominator: | ||||||||||||
Weighted-average number of common shares (basic) | 36,838 | 38,795 | 40,568 | |||||||||
Dilutive effect of stock-based awards | 132 | 66 | 64 | |||||||||
Weighted-average number of common shares (diluted) | 36,970 | 38,861 | 40,632 | |||||||||
Earnings per share - basic: | ||||||||||||
Continuing operations | $ | 0.54 | $ | 0.71 | $ | 1.01 | ||||||
Discontinued operations | — | — | (0.06 | ) | ||||||||
Net income | $ | 0.54 | $ | 0.71 | $ | 0.95 | ||||||
Earnings per share - diluted: | ||||||||||||
Continuing operations | $ | 0.53 | $ | 0.71 | $ | 1.00 | ||||||
Discontinued operations | — | — | (0.06 | ) | ||||||||
Net income | $ | 0.53 | $ | 0.71 | $ | 0.95 | ||||||
As of January 28, 2017, January 30, 2016 and January 31, 2015, there were an immaterial number of additional shares issuable upon the vesting of restricted stock units that were excluded from the diluted share calculations because they were anti-dilutive. The diluted share calculations include performance-based restricted stock units to the extent of the completed performance periods.
13. | Common Stock |
On December 8, 2015, the Company's board of directors approved a share repurchase program (the “2015 Share Repurchase Program”) authorizing up to $50.0 million of repurchases of shares of the Company's common stock. The 2015 Share Repurchase Program expires in December 2017. The prior share repurchase program (the “2014 Share Repurchase Program”) was approved by the board of directors on September 9, 2014, and authorized share repurchases up to $40.0 million. The 2014 Share Repurchase Program was completed in fiscal 2016.
During the fiscal year ended January 28, 2017, the Company purchased and held 1,606,102 shares at an average price of $15.27 per share, excluding commissions, for an aggregate amount of $24.5 million, under the 2015 Share Repurchase Program.
During the fiscal year ended January 30, 2016, the Company purchased and held 2,481,367 shares at an average price of $12.57 per share, excluding commissions, for an aggregate amount of $31.2 million. Of these purchases, 283,354 shares at an average price of $14.64 per share, for an aggregate amount of $4.1 million, were purchased under the 2015 Share Repurchase Plan.
As of January 28, 2017, there was $21.3 million remaining available to repurchase shares of the Company's common stock under the 2015 Share Repurchase Program.
As of January 28, 2017, the Company held as treasury shares 4,708,454 shares of its common stock at an average price of $14.58 per share, excluding commissions, for an aggregate carrying amount of $68.7 million. The Company’s treasury shares may be issued under the 2010 Equity and Incentive Plan or for other corporate purposes.
68
14. | Discontinued Operations |
On June 4, 2014, the Company entered into a five-year agreement with Mitsubishi Corporation Fashion Company and Look Inc. to import and distribute Vera Bradley products in Japan. As a result of moving to this wholesale business model, the Company exited its direct business in Japan during the third quarter of fiscal 2015 and the results of operations are reported as discontinued operations. Japan results were previously reported in the Direct segment, which has been restated to exclude the results of the discontinued operations for the periods presented. Following are the Japan results of operations (in thousands):
Fiscal Year Ended | ||||
January 31, 2015 | ||||
Net revenues | $ | 2,963 | ||
Cost of sales | 1,470 | |||
Gross profit | 1,493 | |||
Selling, general, and administrative expenses | 2,985 | |||
Operating loss | (1,492 | ) | ||
Loss on disposal from discontinued operations(1) | (1,769 | ) | ||
Loss before income taxes | (3,261 | ) | ||
Income tax benefit | (875 | ) | ||
Loss from discontinued operations | $ | (2,386 | ) | |
(1) Loss on disposal from discontinued operations primarily relates to cumulative foreign currency translation adjustments. | ||||
The fiscal years ended January 28, 2017 and January 30, 2016, did not have activity related to discontinued operations.
15. | Restructuring and Other Charges |
Fifty-Two Weeks Ended January 28, 2017
Refer to Note 4, herein, regarding the recognition of store impairment charges reflected in selling, general, and administrative expenses and Note 6, herein, regarding the release of certain income tax reserves related to uncertain tax positions reflected in income tax expense.
Fifty-Two Weeks Ended January 30, 2016
In the first quarter of fiscal 2016, the Company closed its manufacturing facility located in New Haven, Indiana. The Company incurred restructuring and other charges during the first quarter of fiscal 2016 of approximately $3.4 million ($2.1 million after the associated tax benefit), related to the facility closing. These charges included:
• | Severance and benefit costs of approximately $1.7 million; |
• | Lease termination costs of approximately $0.7 million; |
• | Inventory-related charges of approximately $0.6 million; and |
• | Other associated net costs, which include accelerated depreciation related to fixed assets, of approximately $0.4 million. |
These charges are reflected in cost of sales in the Company's Consolidated Financial Statements. All production from the facility was absorbed by the Company’s third-party manufacturing suppliers. There are no remaining liabilities associated with the facility closure.
Additional charges, incurred in the first quarter of fiscal 2016, affecting comparability of the financial results totaled approximately $1.8 million ($1.3 million after the associated tax benefit). These charges included:
69
• | $1.2 million due to a retail store early lease termination agreement (reflected in selling, general, and administrative expenses) and |
• | $0.6 million related to an increase in income tax reserves for uncertain federal and state tax positions related to research and development tax credits (reflected in income tax expense). |
Also refer to Note 4, herein, regarding the recognition of store impairment charges reflected in selling, general, and administrative expenses.
16. | Segment Reporting |
The Company has two operating segments, which are also its reportable segments: Direct and Indirect. These operating segments are components of the Company for which separate financial information is available and for which operating results are evaluated on a regular basis by the chief operating decision maker in deciding how to allocate resources and in assessing the performance of the segments.
The Direct segment includes the Company’s full-line and factory outlet stores, the Company’s website, verabradley.com, direct-to-consumer eBay sales, and the annual outlet sale. Revenues generated through this segment are driven through the sale of Company-branded products from Vera Bradley to end consumers. The Company exited its direct Japan operations in the third quarter of fiscal 2015. Direct segment results for the current and prior periods presented are reported on a continuing operations basis unless otherwise stated. Discontinued operations are described further in Note 14.
The Indirect segment represents revenues generated through the distribution of Company-branded products to specialty retailers representing approximately 2,600 locations, substantially all of which are located in the United States, as well as select department stores, national accounts, third party e-commerce sites, the Company's wholesale customer in Japan, and third-party inventory liquidators. No customer accounted for 10% or more of the Company’s net revenues during fiscal years 2017, 2016 and 2015.
Corporate costs represent the Company’s administrative expenses, which include, but are not limited to: human resources, legal, finance, information technology, and various other corporate-level-activity-related expenses. All intercompany-related activities are eliminated in consolidation and are excluded from the segment reporting.
Company management evaluates segment operating results based on several indicators. The primary or key performance indicators for each segment are net revenues and operating income. The table below represents key financial information for each of the Company’s operating and reportable segments, Direct and Indirect.
The accounting policies of the segments are the same as those described in Note 2. The Company does not report depreciation or amortization expense, total assets, or capital expenditures by segment as such information is neither used by management nor accounted for at the segment level.
70
Net revenues and operating income information for the Company’s reportable segments consisted of the following (in thousands):
Fiscal Year Ended | ||||||||||||
January 28, 2017 | January 30, 2016 | January 31, 2015 | ||||||||||
Segment net revenues: | ||||||||||||
Direct | $ | 355,175 | $ | 351,286 | $ | 335,602 | ||||||
Indirect | 130,762 | 151,312 | 173,388 | |||||||||
Total | $ | 485,937 | $ | 502,598 | $ | 508,990 | ||||||
Segment operating income: | ||||||||||||
Direct | $ | 62,577 | $ | 74,114 | $ | 74,099 | ||||||
Indirect | 50,955 | 60,409 | 66,213 | |||||||||
Total | $ | 113,532 | $ | 134,523 | $ | 140,312 | ||||||
Reconciliation: | ||||||||||||
Segment operating income | $ | 113,532 | $ | 134,523 | $ | 140,312 | ||||||
Less: | ||||||||||||
Unallocated corporate expenses | (85,312 | ) | (87,801 | ) | (76,242 | ) | ||||||
Operating income | $ | 28,220 | $ | 46,722 | $ | 64,070 | ||||||
Sales outside of the United States were excluded from the Direct segment, for all periods presented, due to the Japan operations being discontinued in the third quarter of fiscal 2015.
Revenues to external customers for Vera Bradley brand products are attributable to sales of bags, accessories, travel and home items. Other revenues to external customers primarily include revenues from our apparel/footwear, stationery, merchandising, freight, licensing, and gift card breakage.
Net revenues by product categories are as follows (in thousands):
Fiscal Year Ended | ||||||||||||
January 28, 2017 | January 30, 2016 | January 31, 2015 | ||||||||||
Net revenues: | ||||||||||||
Bags | $ | 207,765 | $ | 215,835 | $ | 230,978 | ||||||
Travel | 119,082 | 125,279 | 109,112 | |||||||||
Accessories | 106,223 | 112,066 | 116,031 | |||||||||
Home | 27,574 | 22,729 | 17,721 | |||||||||
Other | 25,293 | 26,689 | 35,148 | |||||||||
Total | $ | 485,937 | $ | 502,598 | $ | 508,990 | ||||||
As of January 28, 2017 and January 30, 2016, substantially all of the Company’s long-lived assets were located in the United States.
71
17. | Quarterly Financial Information (Unaudited) |
The table below sets forth selected quarterly financial data for each of the last two fiscal years (in thousands, except per share data). Each of the quarters presented was thirteen weeks in duration.
Fiscal Year Ended January 28, 2017 | ||||||||||||||||
First Quarter | Second Quarter(1) | Third Quarter(1) | Fourth Quarter(1) | |||||||||||||
(unaudited) | (unaudited) | (unaudited) | (unaudited) | |||||||||||||
Net revenues | $ | 105,181 | $ | 119,245 | $ | 126,662 | $ | 134,849 | ||||||||
Gross profit | 59,656 | 68,388 | 72,913 | 75,089 | ||||||||||||
Operating income | 3,857 | 8,303 | 11,402 | 4,658 | ||||||||||||
Net income | 2,418 | 5,109 | 8,780 | 3,451 | ||||||||||||
Basic net income per share | 0.06 | 0.14 | 0.24 | 0.10 | ||||||||||||
Diluted net income per share | 0.06 | 0.14 | 0.24 | 0.09 | ||||||||||||
(1) Includes impairment charges related to underperforming stores of $1.6 million ($1.0 million after the associated tax benefit), $0.6 million ($0.4 million after the associated tax benefit) and $10.5 million ($6.6 million after the associated tax benefit) during the second, third and fourth quarter, respectively. See Note 4, herein, for additional information.
Fiscal Year Ended January 30, 2016 | ||||||||||||||||
First Quarter(1) | Second Quarter | Third Quarter | Fourth Quarter(2) | |||||||||||||
(unaudited) | (unaudited) | (unaudited) | (unaudited) | |||||||||||||
Net revenues | $ | 101,104 | $ | 120,724 | $ | 126,674 | $ | 154,096 | ||||||||
Gross profit | 51,694 | 66,554 | 73,298 | 89,643 | ||||||||||||
Operating (loss) income | (4,971 | ) | 9,486 | 16,789 | 25,418 | |||||||||||
Net (loss) income | (4,136 | ) | 5,715 | 10,268 | 15,711 | |||||||||||
Basic net (loss) income per share | (0.10 | ) | 0.15 | 0.27 | 0.41 | |||||||||||
Diluted net (loss) income per share | (0.10 | ) | 0.15 | 0.27 | 0.41 | |||||||||||
(1) Includes restructuring and other charges described in Note 15, herein.
(2) Includes impairment charges related to underperforming stores of $2.8 million ($1.8 million after the associated tax benefit). See Note 4, herein, for additional information.
Information in any one Quarterly period should not be considered indicative of annual results due to the effect of seasonality of the business.
72
Item 9. Changes in and Disagreements With Accountants on Accounting and Financial Disclosure
None.
Item 9A. Controls and Procedures
Disclosure Controls and Procedures
Based on the evaluation of the Company’s disclosure controls and procedures, as that term is defined in Rule 13a-15(e) under the Securities Exchange Act of 1934, as amended (the “Exchange Act”), each of Robert Wallstrom, the Chief Executive Officer of the Company, and Kevin J. Sierks, the Executive Vice President – Chief Financial Officer of the Company, has concluded that the Company’s disclosure controls and procedures are effective as of January 28, 2017.
Management’s Report on Internal Control over Financial Reporting
The Company’s management is responsible for establishing and maintaining adequate internal control over financial reporting, as defined in rules 13a-15(f) and 15d-15(f) under the Exchange Act. The Company’s internal control over financial reporting is designed to provide reasonable assurance regarding the reliability of financial reporting and the preparation of financial statements for external reporting purposes in accordance with generally accepted accounting principles. Management, under the supervision and with the participation of the Company’s Chief Executive Officer and Chief Financial Officer, has evaluated the effectiveness of the Company’s internal control over financial reporting using the criteria set forth by the Committee of Sponsoring Organizations (COSO) of the Treadway Commission (2013 framework) in Internal Control-Integrated Framework. Based on the results of that evaluation, management has concluded that such internal control over financial reporting was effective as of January 28, 2017.
The effectiveness of the Company’s internal control over financial reporting as of January 28, 2017, has been audited by Deloitte and Touche LLP, an independent registered public accounting firm, as stated in their report which appears in Item 8. of this Annual Report on Form 10-K.
Changes in Internal Control over Financial Reporting
There were no changes in internal control over financial reporting that occurred during the fourth fiscal quarter that have materially affected, or are reasonably likely to materially affect, the Company’s internal control over financial reporting.
Item 9B. Other Information
None.
73
PART III
Item 10. Directors, Executive Officers and Corporate Governance
The information set forth in the Proxy Statement for the 2017 Annual Meeting of Shareholders under the headings “Board of Directors Information,” “Family Relationships,” “Section 16(a) Beneficial Ownership Reporting Compliance,” “Corporate Governance Guidelines, Committee Charters and Code of Ethics,” and “Committees – Audit Committee” is incorporated herein by reference. The Proxy Statement will be filed with the Commission within 120 days after the end of the fiscal year covered by this Form 10-K pursuant to Regulation 14A under the Securities Exchange Act of 1934, as amended. In addition, the information set forth under the heading “Item 1: Business – Executive Officers of the Company” in this Form 10-K is incorporated herein by reference.
Item 11. Executive Compensation
The information set forth in the Proxy Statement for the 2017 Annual Meeting of Shareholders under the headings “Executive Compensation Discussion and Analysis,” “Compensation Committee Interlocks and Insider Participation” and “Compensation Committee Report” is incorporated herein by reference. The Proxy Statement will be filed with the Commission within 120 days after the end of the fiscal year covered by this Form 10-K pursuant to Regulation 14A under the Securities Exchange Act of 1934, as amended.
Item 12. Security Ownership of Certain Beneficial Owners and Management and Related Stockholder Matters
The information set forth in the Proxy Statement for the 2017 Annual Meeting of Shareholders under the heading “Share Ownership by Certain Beneficial Owners and Management” is incorporated herein by reference. The Proxy Statement will be filed with the Commission within 120 days after the end of the fiscal year covered by this Form 10-K pursuant to Regulation 14A under the Securities Exchange Act of 1934, as amended.
Securities Authorized for Issuance Under Equity Compensation Plans
The following table sets forth information regarding equity securities authorized for issuance under our equity compensation plans as of January 28, 2017:
Plan Category | Number of Securities to Be Issued upon Exercise of Outstanding Options, Warrants and Rights (a)(2) | Weighted-Average Exercise Price of Outstanding Options, Warrants and Rights (b) ($) | Number of Securities Remaining Available for Future Issuance Under the Equity Compensation Plans (Excluding Securities Reflected in Column (a)) (c) | ||||||
Equity compensation plans approved by security holders (1) | 1,114,295 | — | 4,961,706 | ||||||
Equity compensation plans not approved by security holders | — | — | — | ||||||
Total | 1,114,295 | — | 4,961,706 | ||||||
(1) | Approved before our initial public offering. |
(2) | Assumes that target performance requirements will be achieved for performance shares with incomplete performance periods. |
74
Item 13. Certain Relationships and Related Transactions, and Director Independence
The information set forth in the Proxy Statement for the 2017 Annual Meeting of Shareholders under the headings “Certain Relationships and Related Party Transactions” and “Board Independence” is incorporated herein by reference. The Proxy Statement will be filed with the Commission within 120 days after the end of the fiscal year covered by this Form 10-K pursuant to Regulation 14A under the Securities Exchange Act of 1934, as amended.
Item 14. Principal Accounting Fees and Services
The information required by this item is incorporated herein by reference to our 2017 Proxy Statement under the caption “Principal Accounting Fees and Services.” The Proxy Statement will be filed with the Commission within 120 days after the end of the fiscal year covered by this Form 10-K pursuant to Regulation 14A under the Securities Exchange Act of 1934, as amended.
75
PART IV
Item 15. Exhibits, Financial Statement Schedules
(1) Consolidated Financial Statements
The following consolidated financial statements of Vera Bradley, Inc. are filed as part of this report under Item 8. Financial Statements and Supplementary Data:
(2) Financial Statement Schedules
Financial statement schedules have been omitted because they are not required or are not applicable or because the information required in those schedules either is not material or is included in the consolidated financial statements or the accompanying notes.
(3) List of Exhibits
The exhibits listed in the accompanying index to exhibits are filed or incorporated by reference as part of this Form 10-K.
Item 16. Form 10-K Summary
Not Applicable
76
SIGNATURES
Pursuant to the requirements of Section 13 or 15(d) of the Securities Exchange Act of 1934, as amended, the registrant has duly caused this report to be signed on its behalf by the undersigned, thereunto duly authorized, on March 28, 2017.
Vera Bradley, Inc. | |
/s/ Kevin J. Sierks | |
Kevin J. Sierks | |
Executive Vice President – Chief Financial Officer | |
POWER OF ATTORNEY
KNOW ALL PERSONS BY THESE PRESENTS, that each person whose signature appears below constitutes and appoints Kevin J. Sierks and Robert Wallstrom, and each of them, as his or her true and lawful attorneys-in-fact and agents, with full power of substitution and resubstitution, for him or her and in his or her name, place, and stead, in any and all capacities, to sign any and all amendments to this Annual Report on Form 10-K and to file the same, with all exhibits thereto and other documents in connection therewith, with the Securities and Exchange Commission, granting unto said attorneys-in-fact and agents and each of them, full power and authority to do and perform each and every act and thing requisite and necessary to be done in connection therewith as fully to all intents and purposes as he or she might or could do in person, hereby ratifying and confirming all that said attorneys-in-fact and agents, or any of them, or their or his or her substitute or substitutes, may lawfully do or cause to be done by virtue hereof.
Pursuant to the requirements of the Securities Exchange Act of 1934, this report has been signed below by the following persons on behalf of Registrant and in the capacities indicated on March 28, 2017.
Signature | Title | |
/s/ Robert Wallstrom | Director and Chief Executive Officer (principal executive officer) | |
Robert Wallstrom | ||
/s/ Kevin J. Sierks | Executive Vice President – Chief Financial Officer (principal accounting officer) | |
Kevin J. Sierks | ||
/s/ Barbara Bradley Baekgaard | Director | |
Barbara Bradley Baekgaard | ||
/s/ Richard Baum | Director | |
Richard Baum | ||
/s/ Robert J. Hall | Director | |
Robert J. Hall | ||
/s/ Mary Lou Kelley | Director | |
Mary Lou Kelley | ||
/s/ John E. Kyees | Director | |
John E. Kyees | ||
77
Signature | Title | |
/s/ Matthew McEvoy | Director | |
Matthew McEvoy | ||
/s/ P. Michael Miller | Director | |
P. Michael Miller | ||
/s/ Patricia R. Miller | Director | |
Patricia R. Miller | ||
/s/ Frances P. Philip | Director | |
Frances P. Philip | ||
/s/ Edward M. Schmults | Director | |
Edward M. Schmults | ||
78
EXHIBIT INDEX
Exhibit No. | Description | |
3.1 | Second Amended and Restated Articles of Incorporation (Incorporated by reference to Exhibit 3.1 to the Registration Statement on Form S-1, Registration No. 333-167934) | |
3.2 | Amended and Restated Bylaws (Incorporated by reference to Exhibit 3.2 to the Registration Statement on Form S-1, Registration No. 333-167934) | |
4.1 | Specimen Common Stock Certificate (Incorporated by reference to Exhibit 4.1 to the Registration Statement on Form S-1, Registration No. 333-167934) | |
10.1 | Vera Bradley, Inc. 2010 Equity and Incentive Plan (Incorporated by reference to Exhibit 10.1 to the Registration Statement on Form S-1, Registration No. 333-167934) | |
10.2 | Form of Indemnification Agreement (Incorporated by reference to Exhibit 10.5 to the Registration Statement on Form S-1, Registration No. 333-167934) | |
10.3 | Letter of Agreement with Kevin J. Sierks (Incorporated by reference to Exhibit 10.23 to the Annual Report on Form 10-K for the fiscal year ended February 2, 2013) | |
10.4 | Letter of Agreement with Sue Fuller (Incorporated by reference to Exhibit 10.19 to the Annual Report on Form 10-K for the fiscal year ended February 1, 2014) | |
10.5 | Form of Outside Director Restricted Stock Unit Terms and Conditions (Incorporated by reference to Exhibit 10.2 to the Quarterly Report on Form 10-Q for the quarter ended May 3, 2014) | |
10.6 | Vera Bradley, Inc. 2014 Executive Severance Plan (Incorporated by reference to Exhibit 10.5 to the Quarterly Report on Form 10-Q for the quarter ended May 3, 2014) | |
10.7 | Fiscal 2016 Restricted Stock Unit/Performance Unit Terms and Conditions (Incorporated by reference to Exhibit 10.1 to the Quarterly Report on Form 10-Q for the quarter ended May 2, 2015) | |
10.8 | Fiscal 2016 Annual Incentive Compensation Plan (Executives) (Incorporated by reference to Exhibit 10.2 to the Quarterly Report on Form 10-Q for the quarter ended May 2, 2015) | |
10.9 | Fiscal 2016 Performance-Based Award Agreement under the 2010 Equity and Incentive Plan (Incorporated by reference to Exhibit 10.3 to the Quarterly Report on Form 10-Q for the quarter ended May 2, 2015) | |
10.10 | Second Amended and Restated Credit Agreement dated as of July 15, 2015 among Vera Bradley Designs, Inc., JPMorgan Chase Bank, National Association, and the lenders party thereto (Incorporated by reference to Exhibit 10.1 to the Quarterly Report on Form 10-Q for the quarter ended August 1, 2015) | |
10.11 | Letter of Agreement with Theresa Palermo dated as of May 27, 2015 (Incorporated by reference to Exhibit 10.34 to the Annual Report on Form 10-K for the fiscal year ended January 30, 2016) | |
10.12 | Fiscal 2017 Restricted Stock Unit/Performance Unit Terms and Conditions (Incorporated by reference to Exhibit 10.1 to the Quarterly Report on Form 10-Q for the quarter ended April 30, 2016) | |
10.13 | Fiscal 2017 Annual Incentive Compensation Plan (Executives) (Incorporated by reference to Exhibit 10.2 to the Quarterly Report on Form 10-Q for the quarter ended April 30, 2016) | |
10.14 | Fiscal 2017 Performance-Based Award Agreement under the 2010 Equity and Incentive Plan (Incorporated by reference to Exhibit 10.3 to the Quarterly Report on Form 10-Q for the quarter ended April 30, 2016) | |
79
Exhibit No. | Description | |
10.15 | Employment Agreement for Robert Wallstrom dated November 11, 2013 (Incorporated by reference to Exhibit 10.1 to the Current Report on Form 8-K filed November 5, 2013) | |
10.16 | Second Amendment of Employment Agreement for Robert Wallstrom dated June 17, 2016 (Incorporated by reference to Exhibit 10.1 to the Current Report on Form 8-K filed June 22, 2016) | |
21.1* | Subsidiaries of Vera Bradley, Inc. | |
23.1* | Consent of Deloitte & Touche LLP | |
23.2* | Consent of Ernst & Young LLP | |
31.1* | Rule 13a-14(a)/15d-4(a) Certification of Chief Executive Officer | |
31.2* | Rule 13a-14(a)/15d-14(a) Certification of Chief Financial Officer | |
32.1* | Section 1350 Certifications | |
101 | The following materials from Vera Bradley, Inc.’s Annual Report on Form 10-K for the year ended January 28, 2017 formatted in Extensible Business Reporting Language (XBRL): (i) Consolidated Statements of Operations and Comprehensive Income for the fiscal years ended January 28, 2017, January 30, 2016, and January 31, 2015; (ii) Consolidated Balance Sheets as of January 28, 2017, and January 30, 2016; (iii) Consolidated Statements of Shareholders’ Equity for the fiscal years ended January 28, 2017, January 30, 2016 and January 31, 2015; (iv) Consolidated Statements of Cash Flows for the fiscal years ended January 28, 2017, January 30, 2016, and January 31, 2015; and (v) related notes. ** | |
* | Filed herewith | |
** | Pursuant to Rule 406T of SEC Regulation S-T, the Interactive Data Files included as Exhibit 101 hereto are deemed not filed or part of a registration statement or prospectus for purposes of Sections 11 or 12 of the Securities Act of 1933, as amended, are deemed not filed for purposes of Section 18 of the Securities Exchange Act of 1934, as amended, and otherwise are not subject to liability under these Sections. | |
80