Attached files
| file | filename |
|---|---|
| EX-99.1 - EX-99.1 - LAUREATE EDUCATION, INC. | a17-9927_1ex99d1.htm |
| 8-K - 8-K - LAUREATE EDUCATION, INC. | a17-9927_18k.htm |
Exhibit 99.2
Fourth Quarter & Year-End 2016 Earnings Presentation March 28, 2017

Forward Looking Statements 2 This presentation includes statements that express Laureate's opinions, expectations, beliefs, plans, objectives, assumptions or projections regarding future events or future results and therefore are, or may be deemed to be, "forward-looking statements" within the meaning of the federal securities laws, which involve risks and uncertainties. The Laureate’s actual results may vary significantly from the results anticipated in these forward-looking statements. You can identify forward-looking statements because they contain words such as ‘‘believes,’’ ‘‘expects,’’ ‘‘may,’’ ‘‘will,’’ ‘‘should,’’ ‘‘seeks,’’ ‘‘approximately,’’ ‘‘intends,’’ ‘‘plans,’’ ‘‘estimates’’ or ‘‘anticipates’’ or similar expressions that concern our strategy, plans or intentions. All statements we make relating to guidance, estimated and projected Adjusted EBITDA and earnings, costs, expenditures (including capital expenditures), cash flows, growth rates and financial results are forward-looking statements. In addition, we, through our senior management, from time to time make forward-looking public statements concerning our expected future operations and performance and other developments. All of these forward-looking statements are subject to risks and uncertainties that may change at any time, and, therefore, our actual results may differ materially from those we expected. We derive most of our forward-looking statements from our operating budgets and forecasts, which are based upon many detailed assumptions. While we believe that our assumptions are reasonable, we caution that it is very difficult to predict the impact of known factors, and, of course, it is impossible for us to anticipate all factors that could affect our actual results. Important factors that could cause actual results to differ materially from our expectations are disclosed in ‘‘Risk Factors” section of our 424(b) prospectus filed with the U.S. Securities and Exchange Commission (“SEC”) on February 2, 2017 and our Annual Report on Form 10-K to be filed with the SEC, and other filings with the SEC. These forward-looking statements speak only as of the time of this presentation and we do not undertake to publicly update or revise them, whether as a result of new information, future events or otherwise, except as required by law. Presentation of Non-GAAP Measures This presentation contains certain non-GAAP measures which are provided to assist in an understanding of the business and performance of Laureate Education Inc. These measures should always be considered in conjunction with the appropriate GAAP measure. Reconciliations of non-GAAP measures to the relevant GAAP measures are provided in our SEC filings. In addition, this presentation contains various operating data, including market share and market position, that are based on internal company data and management estimates. While management believes our internal company research is reliable and the definitions of our markets which are used herein are appropriate, neither such research nor these definitions have been verified by an independent source and there are inherent challenges and limitations involved in compiling data across various geographies and from various sources, including those discussed under “Market and Industry Data” in Laureate’s filings with the SEC.
Company Overview
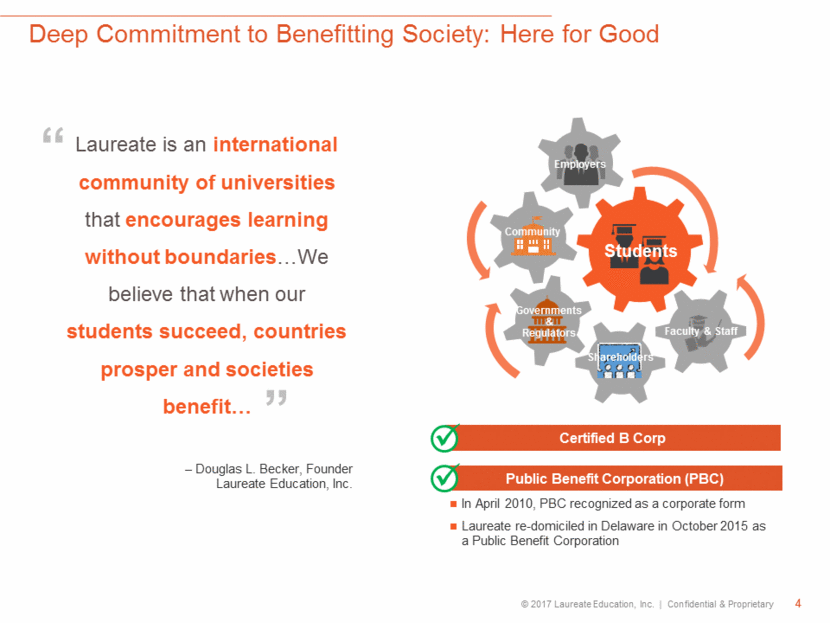
Deep Commitment to Benefitting Society: Here for Good 4 In April 2010, PBC recognized as a corporate form Laureate re-domiciled in Delaware in October 2015 as a Public Benefit Corporation Public Benefit Corporation (PBC) Certified B Corp Laureate is an international community of universities that encourages learning without boundaries We believe that when our students succeed, countries prosper and societies benefit Faculty & Staff Governments Community Shareholders Faculty & Staff Students Governments & Regulators Community Employers “ ” – Douglas L. Becker, Founder Laureate Education, Inc.
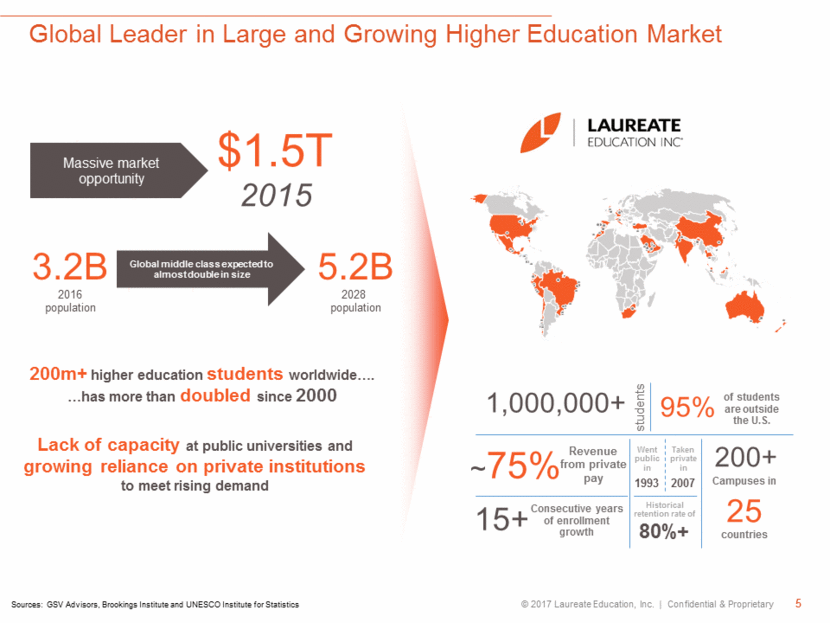
Global Leader in Large and Growing Higher Education Market 5 1993 students 200+ of students are outside the U.S. 95% Went public in 80%+ Historical retention rate of Campuses in 1,000,000+ Revenue from private pay ~75% 15+ 2007 Taken private in Consecutive years of enrollment growth 25 countries 200m+ higher education students worldwide . has more than doubled since 2000 Massive market opportunity Global middle class expected to almost double in size 5.2B 2028 population 3.2B 2016 population Lack of capacity at public universities and growing reliance on private institutions to meet rising demand $1.5T 2015 Sources: GSV Advisors, Brookings Institute and UNESCO Institute for Statistics
Large, Growing and Underserved Global Market 6 Strong Economic Incentives Significantly Underpenetrated by Participation (higher education participation rates (2)) Brazil Mexico China India United States (average wage premium for those with a tertiary education) United States Brazil Chile EU Increasing Reliance on the Private Sector Massive Global Market $1.5T 2015 (private enrollment as a % of total higher education enrollment in OECD countries(1)) 1 million students (~0.5% global market share) 200m+ higher education students Sources: UNESCO Institute for Statistics, OECD and GSV Advisors. Australia, Austria, Belgium, Canada, Chile, Czech Republic, Denmark, Estonia, Finland, France, Germany, Greece, Hungary, Iceland, Ireland, Israel, Italy, Japan, Korea, Luxembourg, Mexico, Netherlands, New Zealand, Norway, Poland, Portugal, Slovakia, Slovenia, Spain, Sweden, Switzerland, Turkey, United Kingdom and the United States. Based on total students as compared to 18-24 years old population; 2014 data 63% 35% 23% 28% 20% 55% 68% 139% 141% 26% 31% 2003 2013
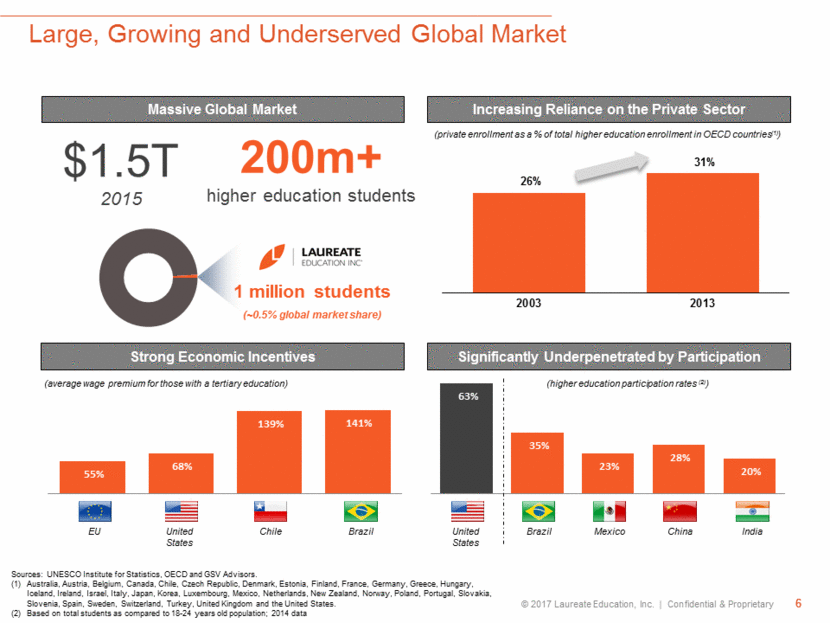
Attractive Business Model with a Track Record of Performance 7 Track Record of Consecutive Enrollment Growth Consistent Constant Currency Organic Growth (students in 000’s) +14% 2014 +11% 2015 2013 +15% +12% 2016 Analysis based on historical trends. Assumes stable retention / graduation rates and constant FX environment. Student retention rate represents students who have not yet graduated and are still active in their program. Based on company filings and press releases. 2013 growth rate excludes a $20.7 million restructuring charge in 2012 (2013 growth rate of 19% excluding impact). 2014 and 2015 exclude the benefit from Mexico Fiscal Reform; growth rates would be 18% and 8%, respectively, not adjusted for that item. Adj. EBITDA (4) Long-term Programs Drive Revenue Visibility Limited exposure to changes in public education funding Visibility into ~70% of the following year revenue after Q3 intake (1) Historical annual student retention rate(2) of ~80% (% of total students by program length) Private Pay Model (3) 1,043 2001 2004 2007 2010 2013 2016 100% 100% 75% 53% 37% 23% 25% 47% 63% 77% Bright Horizons Nord Anglia Laureate Kroton Devry Capella Private Pay Public Funding 1% 33% 66% < 2 years 2 years – 4 years 4 years +
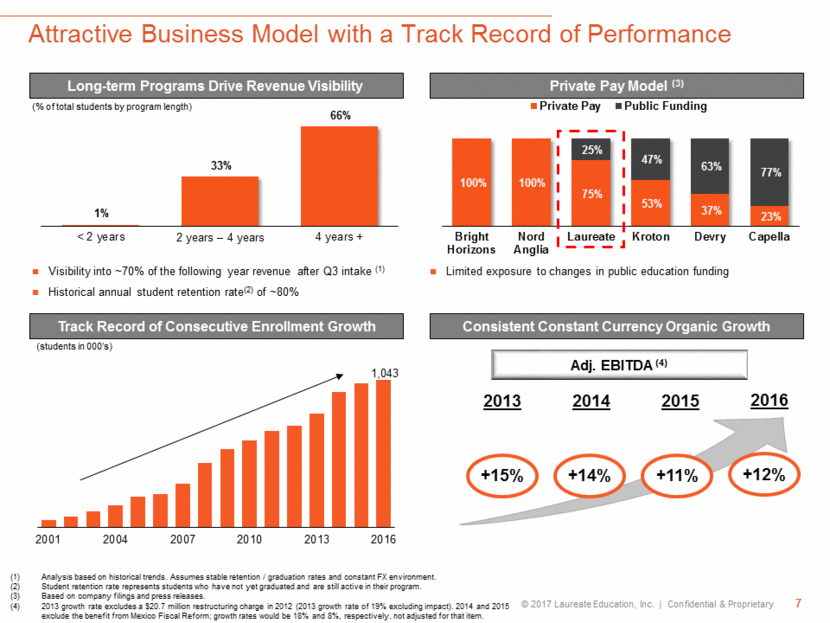
Proven & Replicable Growth Model 8 (total enrollment ‘000s) (total enrollment ‘000s) (total enrollment ‘000s) +9% CAGR +23% CAGR +10% CAGR Selected Case Studies Student outreach New product offerings New market segments Develop new locations Optimize campus operations Leverage network benefits Growth Through Leveraging Best-in-Class Operating Model Note: Numbers may not sum across due to rounding 37 130 42 38 19 (5) 2002 Existing programs (original campuses) Existing programs (new campuses) New programs (all campuses) Working adult (all campuses) 2016 4 51 8 12 13 13 2004 Existing programs (original campuses) Existing programs (new campuses) New programs (all campuses) Working adult (all campuses) 2016 21 49 3 6 17 1 2007 Existing programs (original campuses) Existing programs (new campuses) New programs (all campuses) Working adult (all campuses) 2016
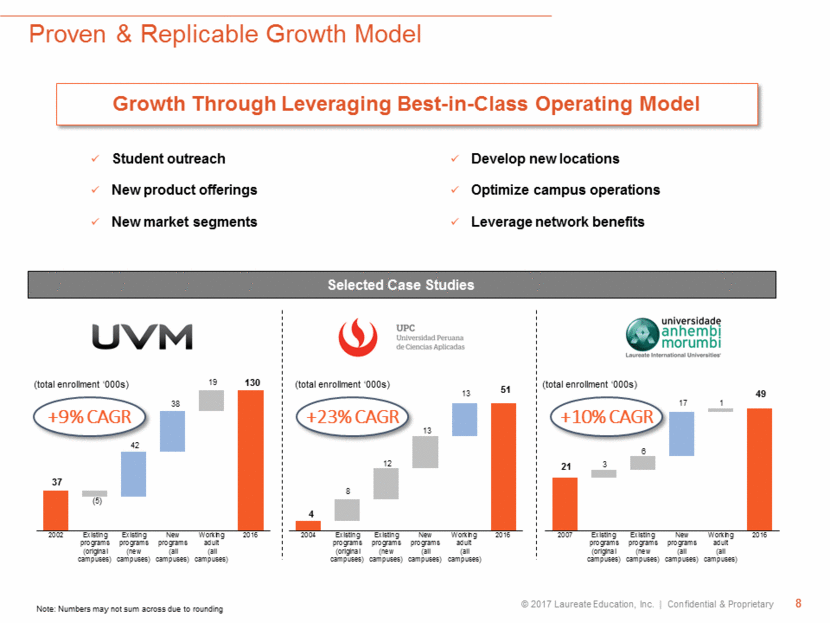
UNESCO Institute for Statistics Strong Presence and Brand Recognition Across Key Markets 9 Market opportunity First Peruvian institution with U.S. accreditation 19th in Washington Monthly’s top 100 “Best Colleges for Adult Learners” Among the top 3 private universities in São Paulo Chile's largest university Top ranked private university in Chile 1 of only 11 institutions in Latin America with U.S. accreditation Example Founded: 1960 QS Stars: Founded: 1989 QS Stars: Founded: 1994 QS Stars: Founded: 1970 QS Stars: NA Founded: 1970 QS Stars: Mexico Chile Peru Brazil Limited public capacity Low and growing participation rates Traditional campus-based programs Limited public infrastructure Heavy reliance on private sector Low and growing higher education participation rates Presence 220,000 students Presence in 20 other countries United States Developed market for online Strong growth in graduate working professionals Fully online Rest of World Leading market share Institutions in attractive regional markets with multiple campuses Multiple brands and market segments in each key country Represents 85% of the world’s higher education student enrollment, but only ~30% of Laureate revenue (1) Largest private university in Mexico Ranked 7th among all Mexican universities
2017 Key Financial Priorities Built on 2016 Accomplishments 10 Organic Growth Margin Expansion Hybridity Expansion Increased Free Cash Flow Conversion
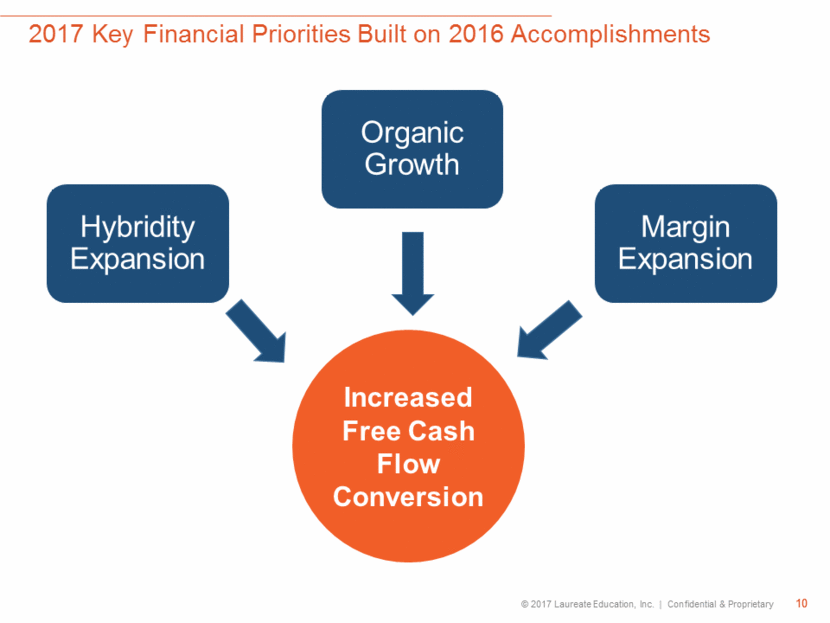
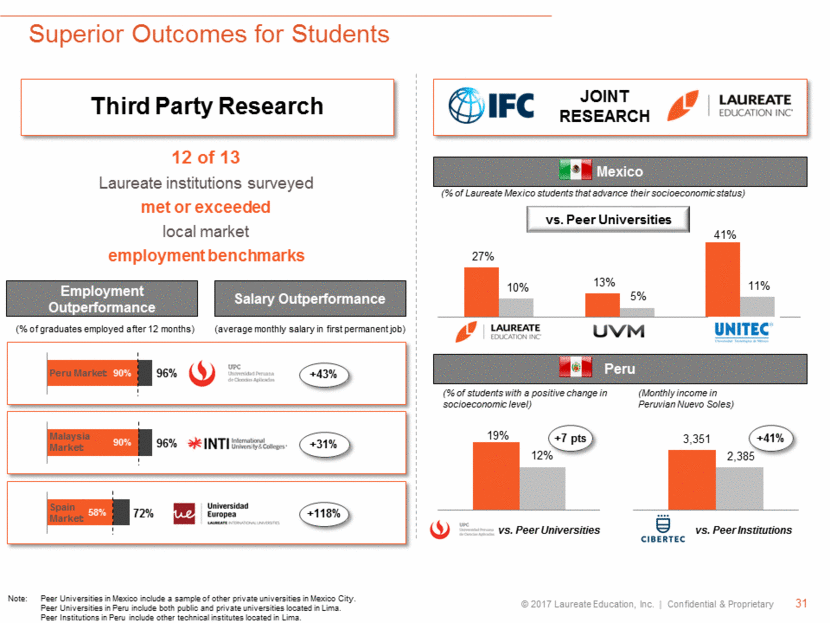
Academic Priority is Continued Focus on Outcomes & Quality Third Party Research(1) 12 of 13 institutions surveyed met or exceeded local market employment benchmarks Salary outperformance of 6% -118% vs. benchmark Market Studies Joint research with IFC in Mexico and Peru Laureate graduates have greater advances in socioeconomic level vs. peers in those markets QS StarsTM Independent third party rating system Most of our rated institutions have a 3 or 4 stars rating Measurable Performance Brazil Example (2)(3) ENADE scores improved to 82% IGC scores: 22% increase vs. 2010 All institutions rated 3 or above Study commissioned by Millward Brown; salary performance based on all premium institutions surveyed ENADE is an exam taken by graduates at the end of their course. Scores range from 1-worst to 5-best. ENADE 2015 compares to ENADE 2012, when similar courses were analyzed. IGC evaluates an entire institution with scores ranging from 1-worst to 5-best. The metric is used as an indicator of the performance of the institution and is calculated as a weighted average of the scores received by all courses offered by each institution for the past three years. Outcomes Social Mobility Quality Ratings
2016 PERFORMANCE HIGHLIGHTS
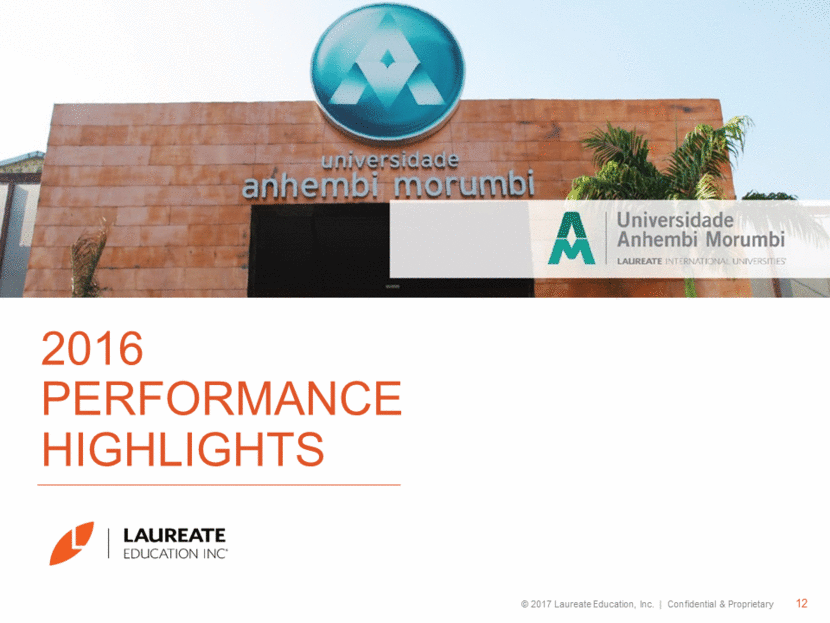
2016 Financial Performance Highlights 13 Total Enrollment: 1,043,200 3% growth vs. 2015 (PF for asset sales) New Enrollment: 507,700 1% growth vs. 2015 (PF for asset sales) Revenue$1.2B +8% Organic constant currency growth Adj. EBITDA $285M +34% Organic constant currency growth Revenue$4.2B +6% Organic constant currency growth Adj. EBITDA $766M +12% Organic constant currency growth 4th Quarter 2016 Full Year 2016
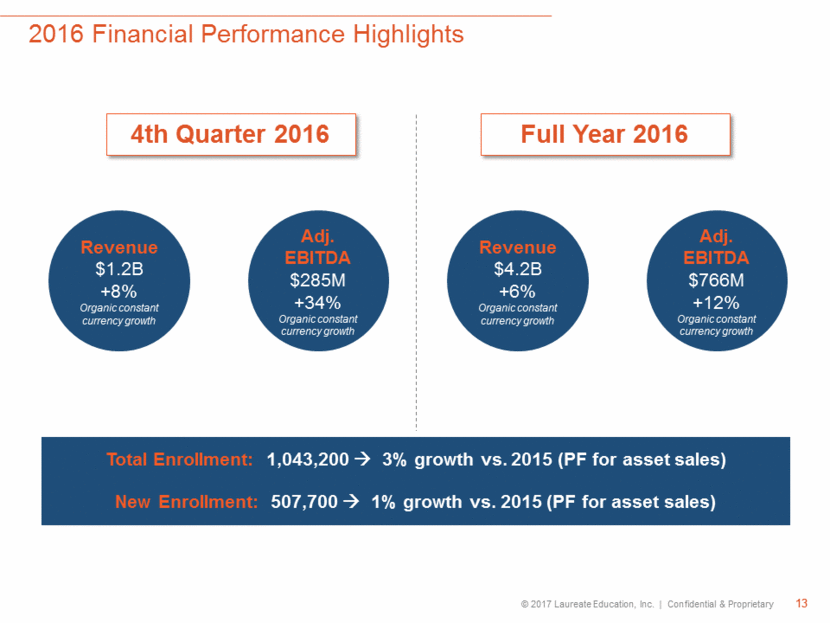
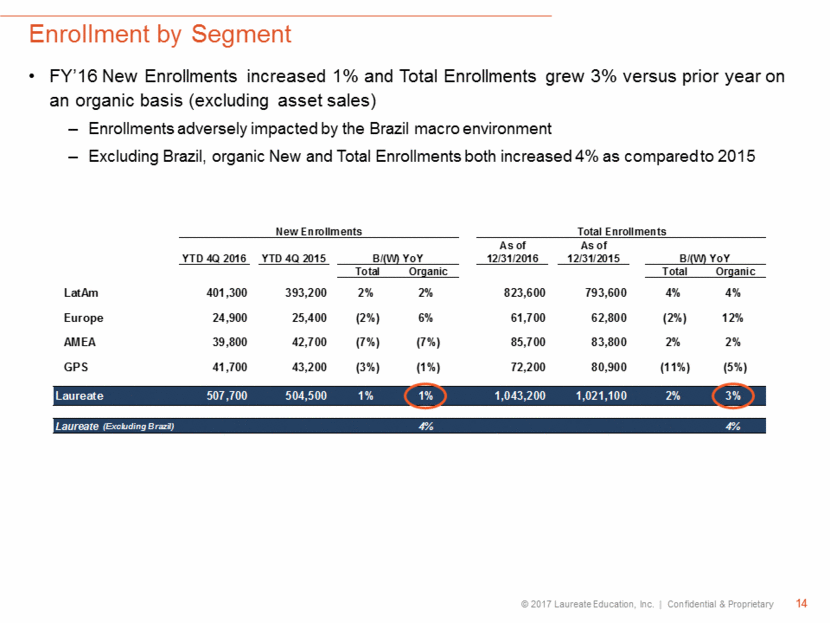
Enrollment by Segment FY’16 New Enrollments increased 1% and Total Enrollments grew 3% versus prior year on an organic basis (excluding asset sales) Enrollments adversely impacted by the Brazil macro environment Excluding Brazil, organic New and Total Enrollments both increased 4% as compared to 2015 14
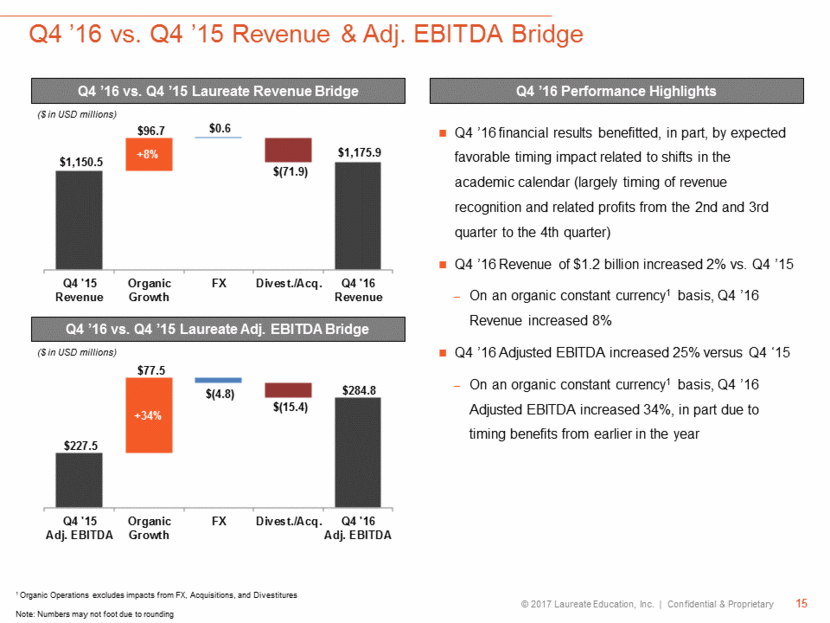
Q4 ’16 vs. Q4 ’15 Revenue & Adj. EBITDA Bridge 15 Q4 ’16 financial results benefitted, in part, by expected favorable timing impact related to shifts in the academic calendar (largely timing of revenue recognition and related profits from the 2nd and 3rd quarter to the 4th quarter) Q4 ’16 Revenue of $1.2 billion increased 2% vs. Q4 ’15 On an organic constant currency1 basis, Q4 ’16 Revenue increased 8% Q4 ’16 Adjusted EBITDA increased 25% versus Q4 ‘15 On an organic constant currency1 basis, Q4 ’16 Adjusted EBITDA increased 34%, in part due to timing benefits from earlier in the year Q4 ’16 vs. Q4 ’15 Laureate Revenue Bridge Q4 ’16 Performance Highlights Q4 ’16 vs. Q4 ’15 Laureate Adj. EBITDA Bridge 1 Organic Operations excludes impacts from FX, Acquisitions, and Divestitures Note: Numbers may not foot due to rounding +8% +34% ($ in USD millions) ($ in USD millions)
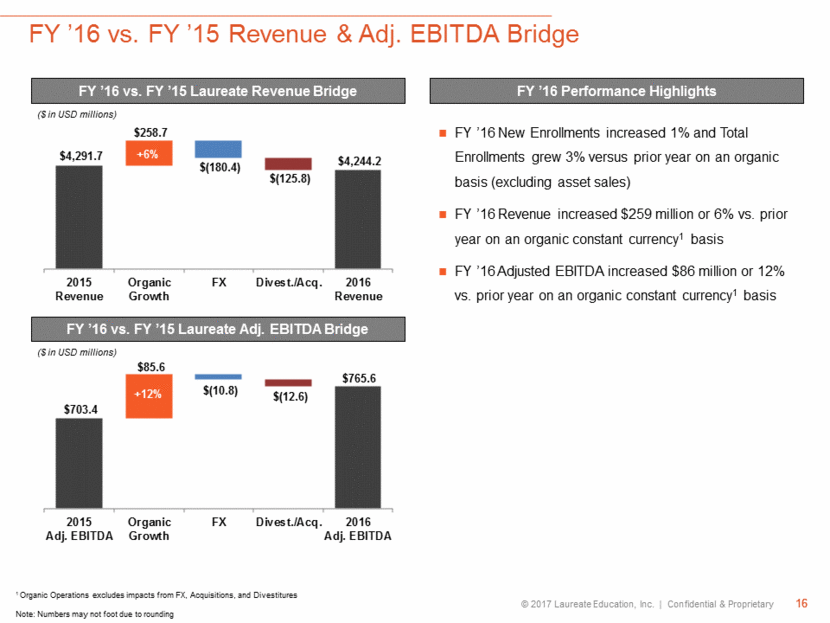
FY ’16 vs. FY ’15 Revenue & Adj. EBITDA Bridge 16 FY ’16 New Enrollments increased 1% and Total Enrollments grew 3% versus prior year on an organic basis (excluding asset sales) FY ’16 Revenue increased $259 million or 6% vs. prior year on an organic constant currency1 basis FY ’16 Adjusted EBITDA increased $86 million or 12% vs. prior year on an organic constant currency1 basis FY ’16 vs. FY ’15 Laureate Revenue Bridge FY ’16 Performance Highlights FY ’16 vs. FY ’15 Laureate Adj. EBITDA Bridge +6% +12% 1 Organic Operations excludes impacts from FX, Acquisitions, and Divestitures Note: Numbers may not foot due to rounding ($ in USD millions) ($ in USD millions)
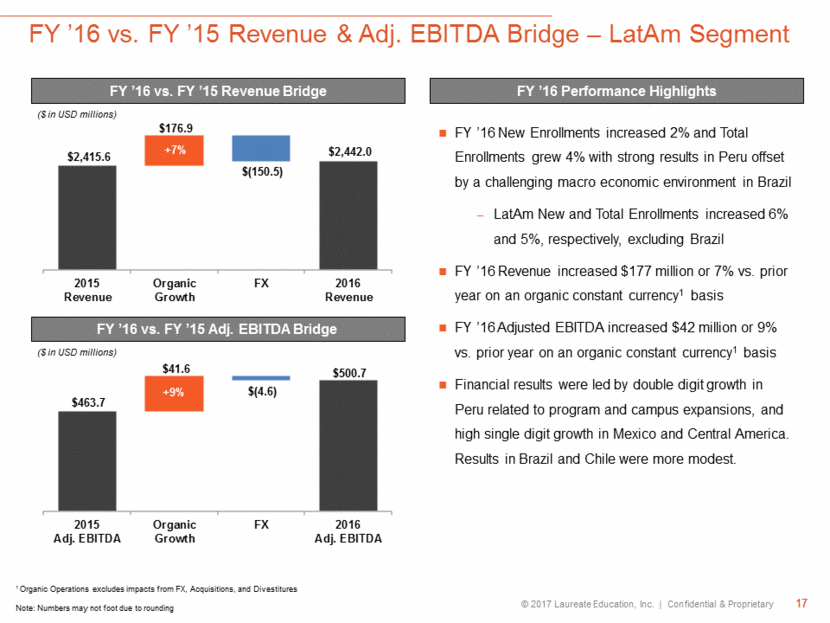
FY ’16 vs. FY ’15 Revenue & Adj. EBITDA Bridge – LatAm Segment 17 FY ’16 New Enrollments increased 2% and Total Enrollments grew 4% with strong results in Peru offset by a challenging macro economic environment in Brazil LatAm New and Total Enrollments increased 6% and 5%, respectively, excluding Brazil FY ’16 Revenue increased $177 million or 7% vs. prior year on an organic constant currency1 basis FY ’16 Adjusted EBITDA increased $42 million or 9% vs. prior year on an organic constant currency1 basis Financial results were led by double digit growth in Peru related to program and campus expansions, and high single digit growth in Mexico and Central America. Results in Brazil and Chile were more modest. FY ’16 vs. FY ’15 Revenue Bridge FY ’16 Performance Highlights FY ’16 vs. FY ’15 Adj. EBITDA Bridge 1 Organic Operations excludes impacts from FX, Acquisitions, and Divestitures Note: Numbers may not foot due to rounding +9% +7% ($ in USD millions) ($ in USD millions)
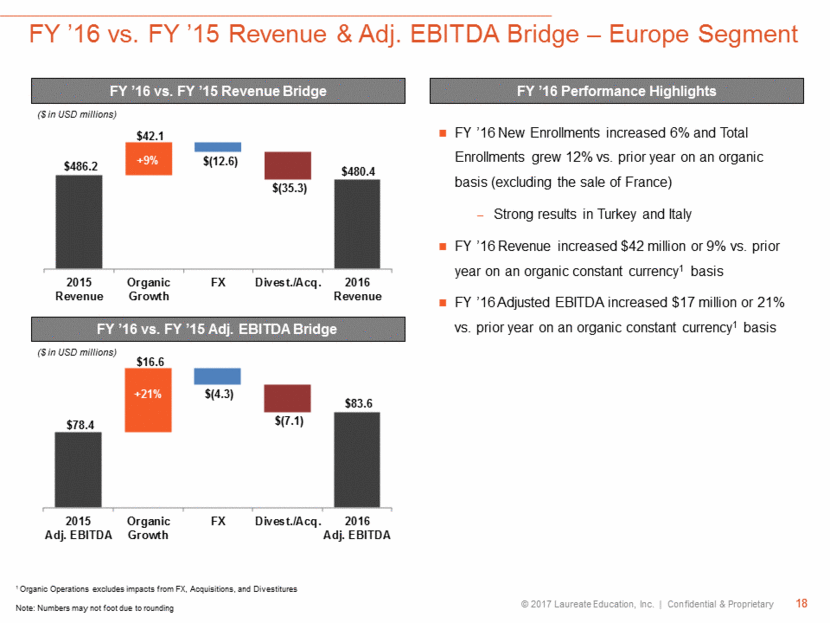
FY ’16 vs. FY ’15 Revenue & Adj. EBITDA Bridge – Europe Segment 18 FY ’16 vs. FY ’15 Revenue Bridge FY ’16 Performance Highlights FY ’16 vs. FY ’15 Adj. EBITDA Bridge 1 Organic Operations excludes impacts from FX, Acquisitions, and Divestitures Note: Numbers may not foot due to rounding FY ’16 New Enrollments increased 6% and Total Enrollments grew 12% vs. prior year on an organic basis (excluding the sale of France) Strong results in Turkey and Italy FY ’16 Revenue increased $42 million or 9% vs. prior year on an organic constant currency1 basis FY ’16 Adjusted EBITDA increased $17 million or 21% vs. prior year on an organic constant currency1 basis +21% +9% ($ in USD millions) ($ in USD millions)
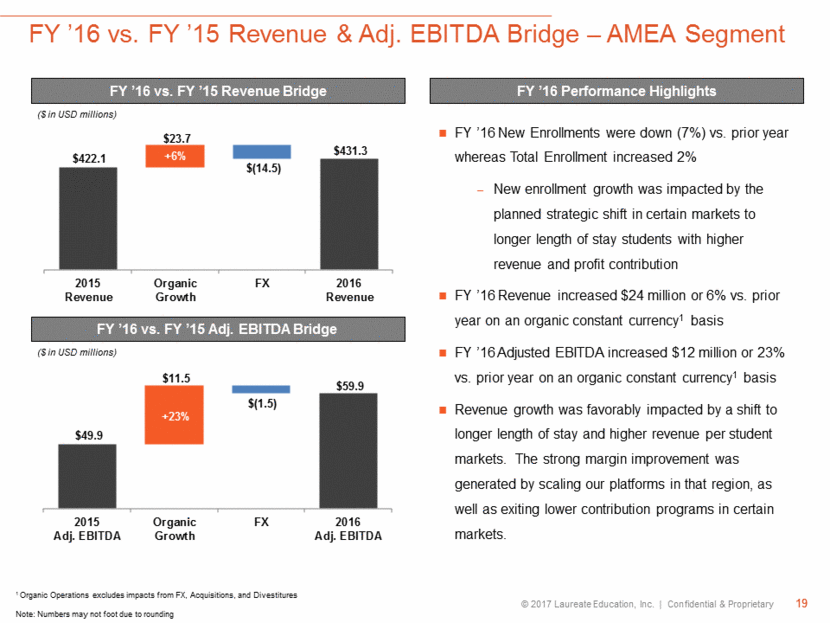
FY ’16 vs. FY ’15 Revenue & Adj. EBITDA Bridge – AMEA Segment 19 FY ’16 vs. FY ’15 Revenue Bridge FY ’16 Performance Highlights FY ’16 vs. FY ’15 Adj. EBITDA Bridge FY ’16 New Enrollments were down (7%) vs. prior year whereas Total Enrollment increased 2% New enrollment growth was impacted by the planned strategic shift in certain markets to longer length of stay students with higher revenue and profit contribution FY ’16 Revenue increased $24 million or 6% vs. prior year on an organic constant currency1 basis FY ’16 Adjusted EBITDA increased $12 million or 23% vs. prior year on an organic constant currency1 basis Revenue growth was favorably impacted by a shift to longer length of stay and higher revenue per student markets. The strong margin improvement was generated by scaling our platforms in that region, as well as exiting lower contribution programs in certain markets. +23% +6% 1 Organic Operations excludes impacts from FX, Acquisitions, and Divestitures Note: Numbers may not foot due to rounding ($ in USD millions) ($ in USD millions)
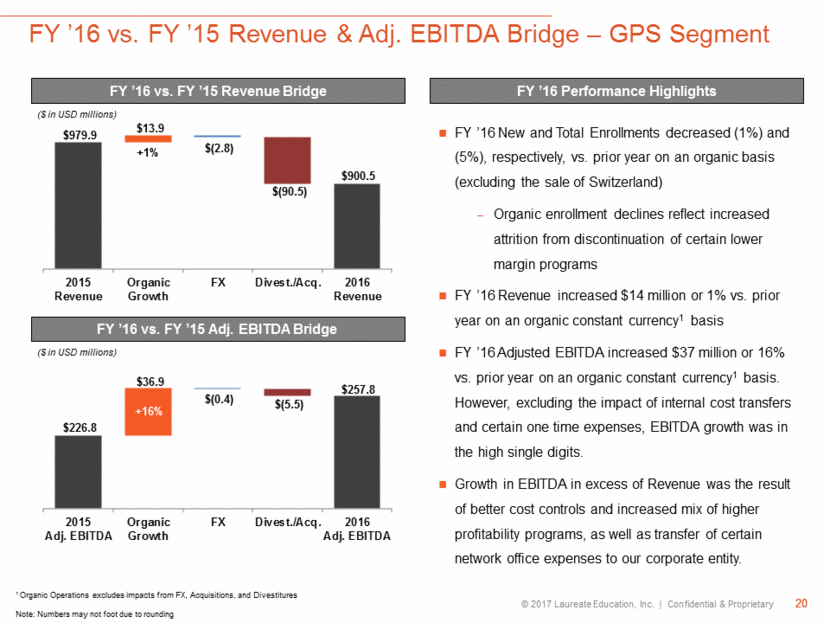
FY ’16 vs. FY ’15 Revenue & Adj. EBITDA Bridge – GPS Segment 20 FY ’16 vs. FY ’15 Revenue Bridge FY ’16 Performance Highlights FY ’16 vs. FY ’15 Adj. EBITDA Bridge FY ’16 New and Total Enrollments decreased (1%) and (5%), respectively, vs. prior year on an organic basis (excluding the sale of Switzerland) Organic enrollment declines reflect increased attrition from discontinuation of certain lower margin programs FY ’16 Revenue increased $14 million or 1% vs. prior year on an organic constant currency1 basis FY ’16 Adjusted EBITDA increased $37 million or 16% vs. prior year on an organic constant currency1 basis. However, excluding the impact of internal cost transfers and certain one time expenses, EBITDA growth was in the high single digits. Growth in EBITDA in excess of Revenue was the result of better cost controls and increased mix of higher profitability programs, as well as transfer of certain network office expenses to our corporate entity. +1% +16% 1 Organic Operations excludes impacts from FX, Acquisitions, and Divestitures Note: Numbers may not foot due to rounding ($ in USD millions) ($ in USD millions)
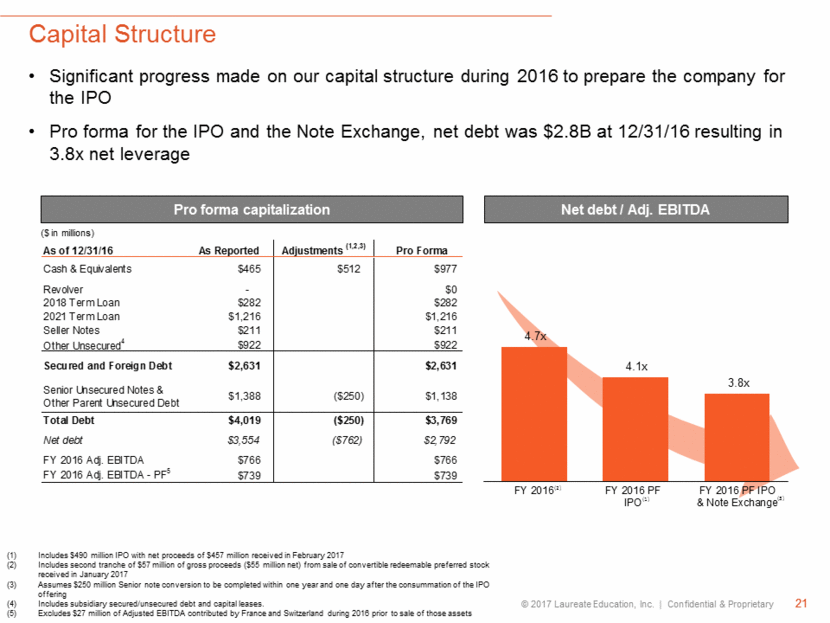
Capital Structure Significant progress made on our capital structure during 2016 to prepare the company for the IPO Pro forma for the IPO and the Note Exchange, net debt was $2.8B at 12/31/16 resulting in 3.8x net leverage 21 ($ in millions) Pro forma capitalization (1) Net debt / Adj. EBITDA (3) (1) Includes $490 million IPO with net proceeds of $457 million received in February 2017 (2) Includes second tranche of $57 million of gross proceeds ($55 million net) from sale of convertible redeemable preferred stock received in January 2017 (3) Assumes $250 million Senior note conversion to be completed within one year and one day after the consummation of the IPO offering Includes subsidiary secured/unsecured debt and capital leases. Excludes $27 million of Adjusted EBITDA contributed by France and Switzerland during 2016 prior to sale of those assets (2) 4.7x 4.1x 3.8x FY 2016 FY 2016 PF IPO FY 2016 PF IPO & Note Exchange
2017 Outlook
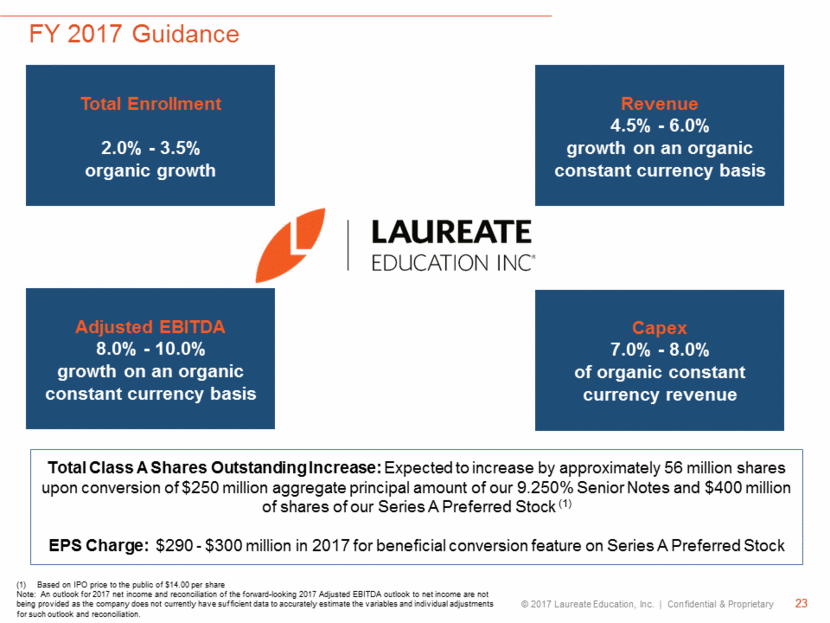
FY 2017 Guidance 23 Total Enrollment 2.0% - 3.5% organic growth Revenue 4.5% - 6.0% growth on an organic constant currency basis Adjusted EBITDA 8.0% - 10.0% growth on an organic constant currency basis Capex 7.0% - 8.0% of organic constant currency revenue Total Class A Shares Outstanding Increase: Expected to increase by approximately 56 million shares upon conversion of $250 million aggregate principal amount of our 9.250% Senior Notes and $400 million of shares of our Series A Preferred Stock (1) EPS Charge: $290 - $300 million in 2017 for beneficial conversion feature on Series A Preferred Stock Based on IPO price to the public of $14.00 per share Note: An outlook for 2017 net income and reconciliation of the forward-looking 2017 Adjusted EBITDA outlook to net income are not being provided as the company does not currently have sufficient data to accurately estimate the variables and individual adjustments for such outlook and reconciliation.
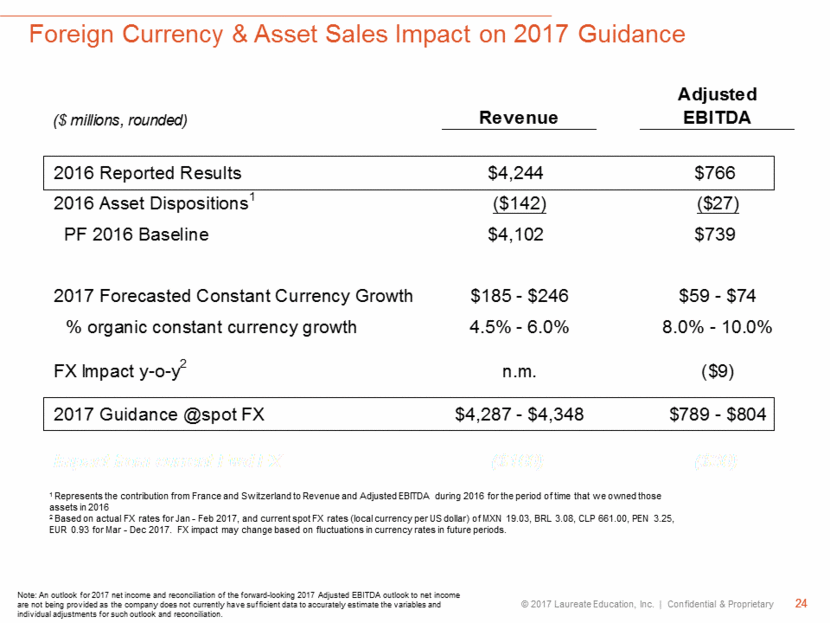
Foreign Currency & Asset Sales Impact on 2017 Guidance 24 Note: An outlook for 2017 net income and reconciliation of the forward-looking 2017 Adjusted EBITDA outlook to net income are not being provided as the company does not currently have sufficient data to accurately estimate the variables and individual adjustments for such outlook and reconciliation. 1 Represents the contribution from France and Switzerland to Revenue and Adjusted EBITDA during 2016 for the period of time that we owned those assets in 2016 2 Based on actual FX rates for Jan - Feb 2017, and current spot FX rates (local currency per US dollar) of MXN 19.03, BRL 3.08, CLP 661.00, PEN 3.25, EUR 0.93 for Mar - Dec 2017. FX impact may change based on fluctuations in currency rates in future periods.
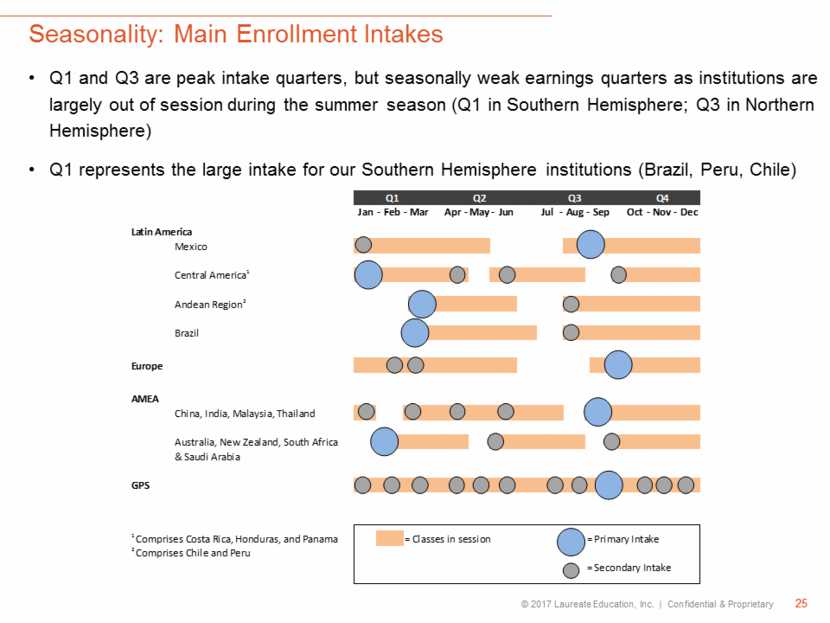
Seasonality: Main Enrollment Intakes Q1 and Q3 are peak intake quarters, but seasonally weak earnings quarters as institutions are largely out of session during the summer season (Q1 in Southern Hemisphere; Q3 in Northern Hemisphere) Q1 represents the large intake for our Southern Hemisphere institutions (Brazil, Peru, Chile) 25 Jan - Feb - Mar Apr - May - Jun Jul - Aug - Sep Oct - Nov - Dec Latin America Mexico Central America 1 Andean Region 2 Brazil Europe AMEA China, India, Malaysia, Thailand Australia, New Zealand, South Africa & Saudi Arabia GPS 1 Comprises Costa Rica, Honduras, and Panama = Classes in session = Primary Intake 2 Comprises Chile and Peru = Secondary Intake Q1 Q2 Q3 Q4
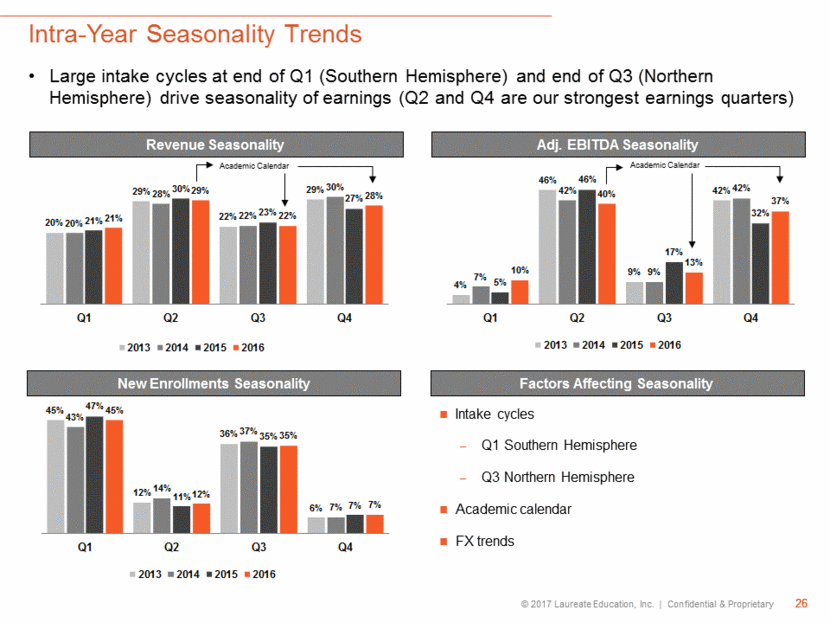
Intra-Year Seasonality Trends Large intake cycles at end of Q1 (Southern Hemisphere) and end of Q3 (Northern Hemisphere) drive seasonality of earnings (Q2 and Q4 are our strongest earnings quarters) 26 Revenue Seasonality Adj. EBITDA Seasonality New Enrollments Seasonality Factors Affecting Seasonality Intake cycles Q1 Southern Hemisphere Q3 Northern Hemisphere Academic calendar FX trends Academic Calendar Academic Calendar
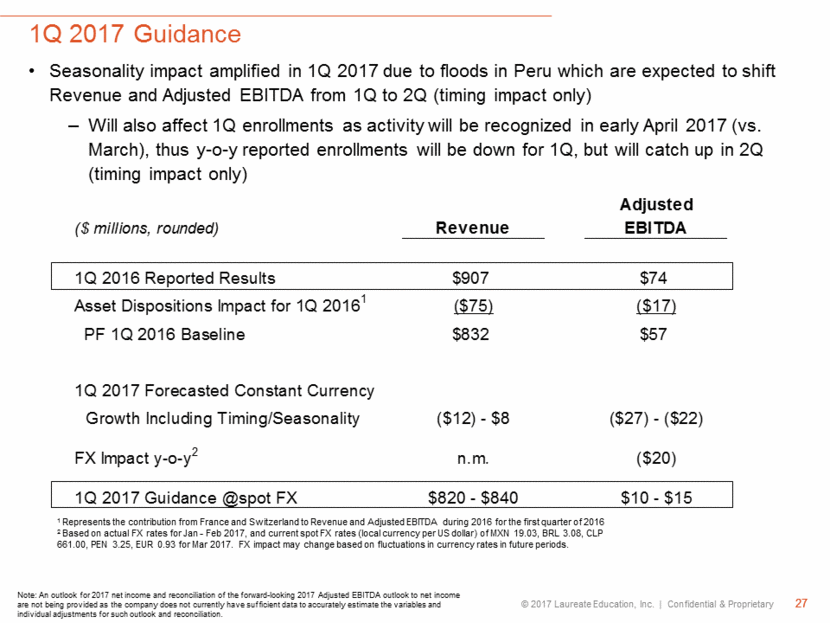
1Q 2017 Guidance 27 Seasonality impact amplified in 1Q 2017 due to floods in Peru which are expected to shift Revenue and Adjusted EBITDA from 1Q to 2Q (timing impact only) Will also affect 1Q enrollments as activity will be recognized in early April 2017 (vs. March), thus y-o-y reported enrollments will be down for 1Q, but will catch up in 2Q (timing impact only) 1 Represents the contribution from France and Switzerland to Revenue and Adjusted EBITDA during 2016 for the first quarter of 2016 2 Based on actual FX rates for Jan - Feb 2017, and current spot FX rates (local currency per US dollar) of MXN 19.03, BRL 3.08, CLP 661.00, PEN 3.25, EUR 0.93 for Mar 2017. FX impact may change based on fluctuations in currency rates in future periods. Note: An outlook for 2017 net income and reconciliation of the forward-looking 2017 Adjusted EBITDA outlook to net income are not being provided as the company does not currently have sufficient data to accurately estimate the variables and individual adjustments for such outlook and reconciliation.
Appendix
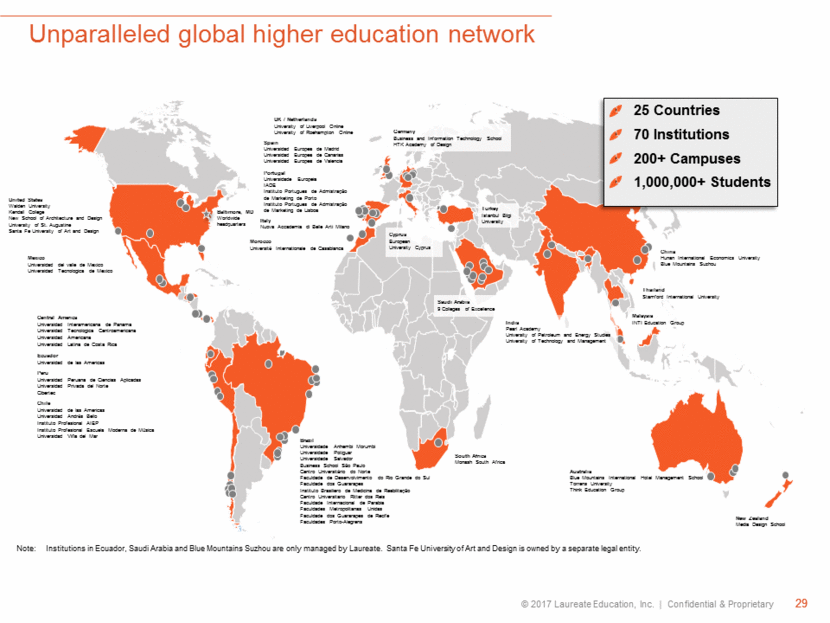
Unparalleled global higher education network 29 Brazil Universidade Anhembi Morumbi Universidade Potiguar Universidade Salvador Business School São Paulo Centro Universitário do Norte Faculdade de Desenvolvimento do Rio Grande do Sul Faculdade dos Guararapes Instituto Brasiliero de Medicina de Reabilitação Centro Universitario Ritter dos Reis Faculdade Internacional de Parabia Faculdades Metropolitanas Unidas Faculdade dos Guararapes de Recife Faculdades Porto-Alegrens United States Walden University Kendall College New School of Architecture and Design University of St. Augustine Santa Fe University of Art and Design Mexico Universidad del valle de Mexico Universidad Tecnologica de Mexico Central America Universidad Interamericana de Panama Universidad Tecnologica Centroamericana Universidad Americana Universidad Latina de Costa Rica Ecuador Universidad de las Americas Peru Universidad Peruana de Ciencias Aplicadas Universidad Privada del Norte Cibertec Chile Universidad de las Americas Universidad Andrés Bello Instituto Profesional AIEP Instituto Profesional Escuela Moderna de Música Universidad Viña del Mar Baltimore, MD Worldwide headquarters Morocco Université Internationale de Casablanca Italy Nuova Accademia di Belle Arti Milano Cyprus European University Cyprus Spain Universidad Europea de Madrid Universidad Europea de Canarias Universidad Europea de Valencia Germany Business and Information Technology School HTK Academy of Design UK / Netherlands University of Liverpool Online University of Roehampton Online Portugal Universidade Europeia IADE Instituto Portugues de Admistração de Marketing de Porto Instituto Portugues de Admistração de Marketing de Lisboa Turkey Istanbul Bilgi University Saudi Arabia 9 Colleges of Excellence South Africa Monash South Africa New Zealand Media Design School Australia Blue Mountains International Hotel Management School Torrens University Think Education Group India Pearl Academy University of Petroleum and Energy Studies University of Technology and Management Malaysia INTI Education Group China Hunan International Economics University Blue Mountains Suzhou Thailand Stamford International University 25 Countries 70 Institutions 200+ Campuses 1,000,000+ Students Note: Institutions in Ecuador, Saudi Arabia and Blue Mountains Suzhou are only managed by Laureate. Santa Fe University of Art and Design is owned by a separate legal entity.
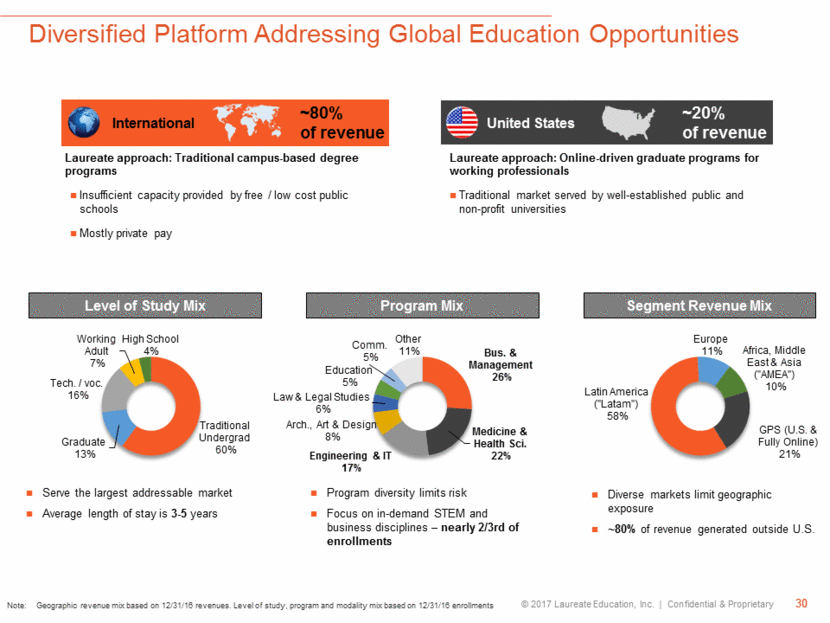
Diversified Platform Addressing Global Education Opportunities 30 Note: Geographic revenue mix based on 12/31/16 revenues. Level of study, program and modality mix based on 12/31/16 enrollments Program diversity limits risk Focus on in-demand STEM and business disciplines – nearly 2/3rd of enrollments Serve the largest addressable market Average length of stay is 3-5 years Program Mix Segment Revenue Mix Laureate approach: Traditional campus-based degree programs Insufficient capacity provided by free / low cost public schools Mostly private pay International Laureate approach: Online-driven graduate programs for working professionals Traditional market served by well-established public and non-profit universities United States ~80% of revenue ~20% of revenue Diverse markets limit geographic exposure ~80% of revenue generated outside U.S. Level of Study Mix Traditional Undergrad 60% Graduate 13% Tech. / voc. 16% Working Adult 7% High School 4% Bus. & Management 26% Medicine & Health Sci. 22% Engineering & IT 17% Arch., Art & Design 8% Law & Legal Studies 6% Education 5% Comm. 5% Other 11% Latin America ("Latam") 58% Europe 11% Africa, Middle East & Asia ("AMEA") 10% GPS (U.S. & Fully Online) 21%
Superior Outcomes for Students vs. Peer Universities (% of Laureate Mexico students that advance their socioeconomic status) JOINT RESEARCH +7 pts (% of students with a positive change in socioeconomic level) +41% (Monthly income in Peruvian Nuevo Soles) vs. Peer Universities vs. Peer Institutions Mexico Peru Employment Outperformance Salary Outperformance (average monthly salary in first permanent job) (% of graduates employed after 12 months) +43% +31% +118% 12 of 13 Laureate institutions surveyed met or exceeded local market employment benchmarks Peru Market: 96% Malaysia Market: 96% Spain Market: 72% Note: Peer Universities in Mexico include a sample of other private universities in Mexico City. Peer Universities in Peru include both public and private universities located in Lima. Peer Institutions in Peru include other technical institutes located in Lima. Third Party Research 27% 13% 41% 10% 5% 11% 19% 12% 3,351 2,385 90% Peru overall market 90% Peru overall market 58%
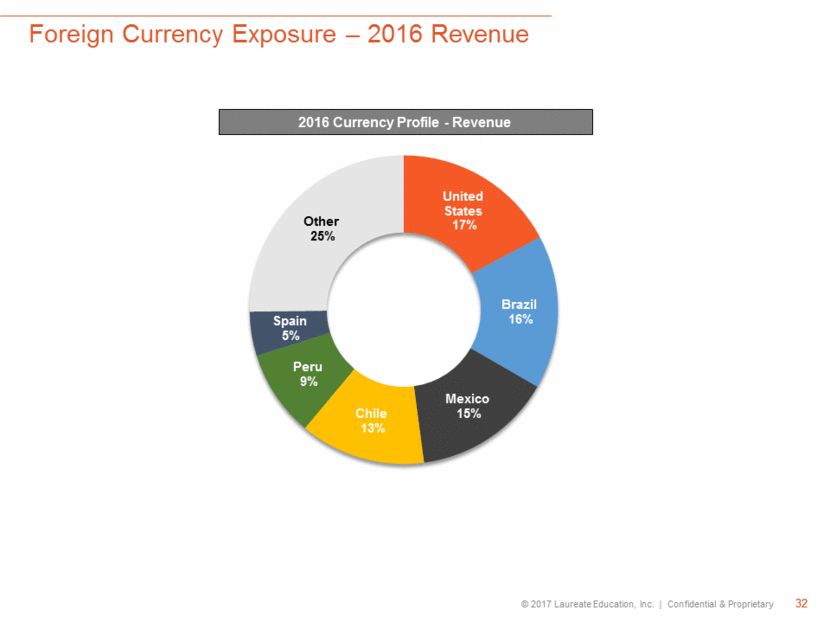
Foreign Currency Exposure – 2016 Revenue 32 2016 Currency Profile - Revenue United States 17% Brazil 16% Mexico 15% Chile 13% Peru 9% Spain 5% Other 25%
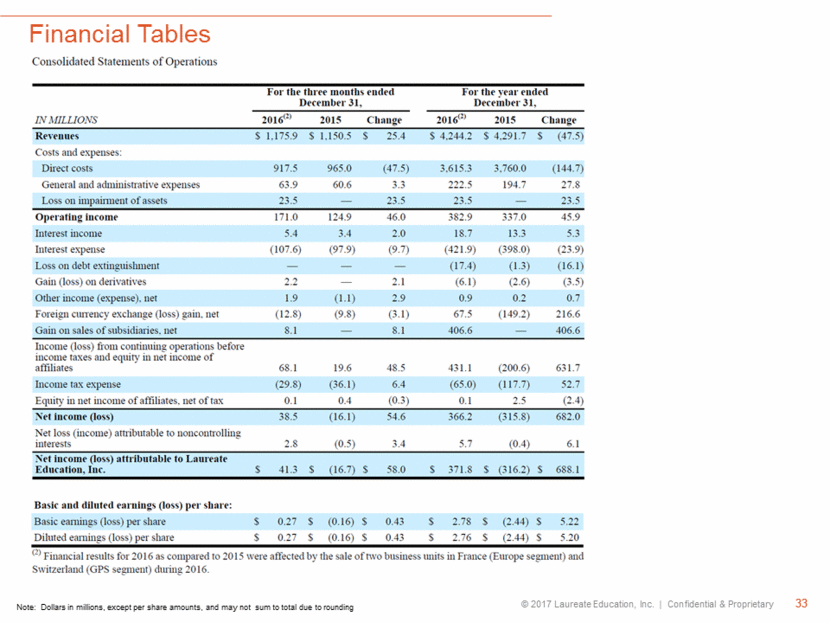
Financial Tables 33 Note: Dollars in millions, except per share amounts, and may not sum to total due to rounding
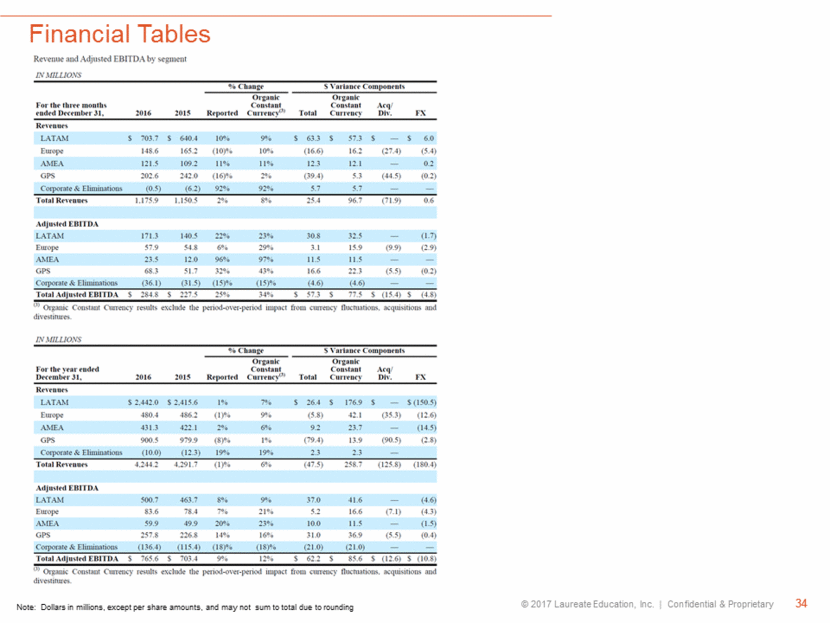
Financial Tables 34 Note: Dollars in millions, except per share amounts, and may not sum to total due to rounding
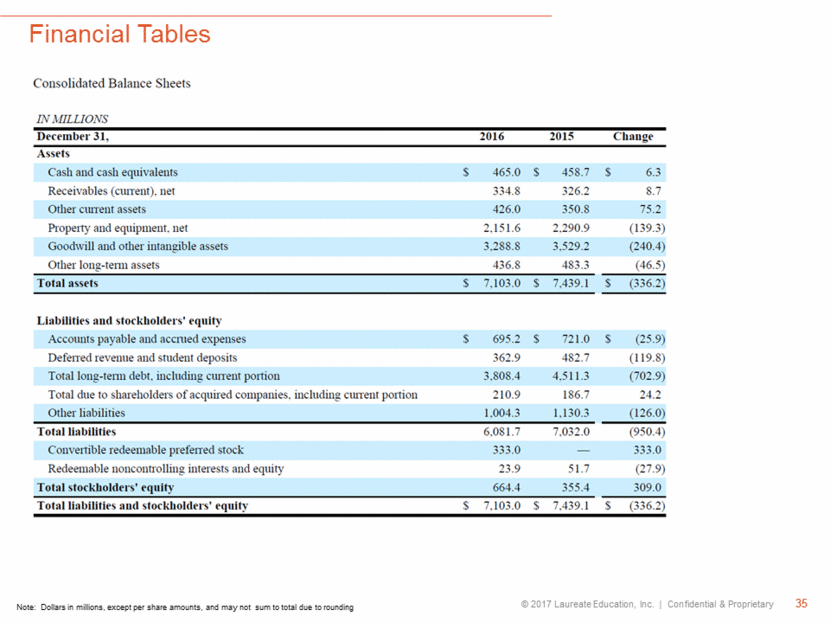
Financial Tables 35 Note: Dollars in millions, except per share amounts, and may not sum to total due to rounding
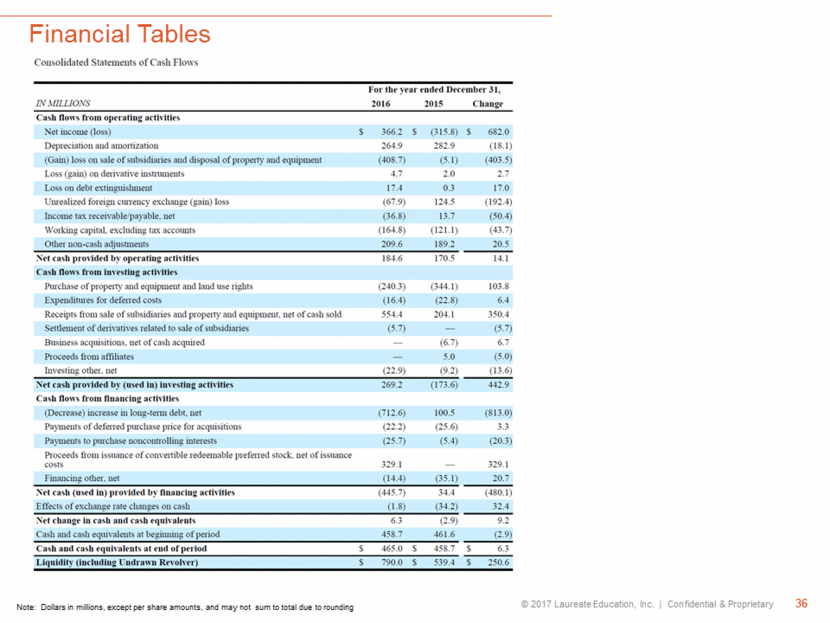
Financial Tables 36 Note: Dollars in millions, except per share amounts, and may not sum to total due to rounding
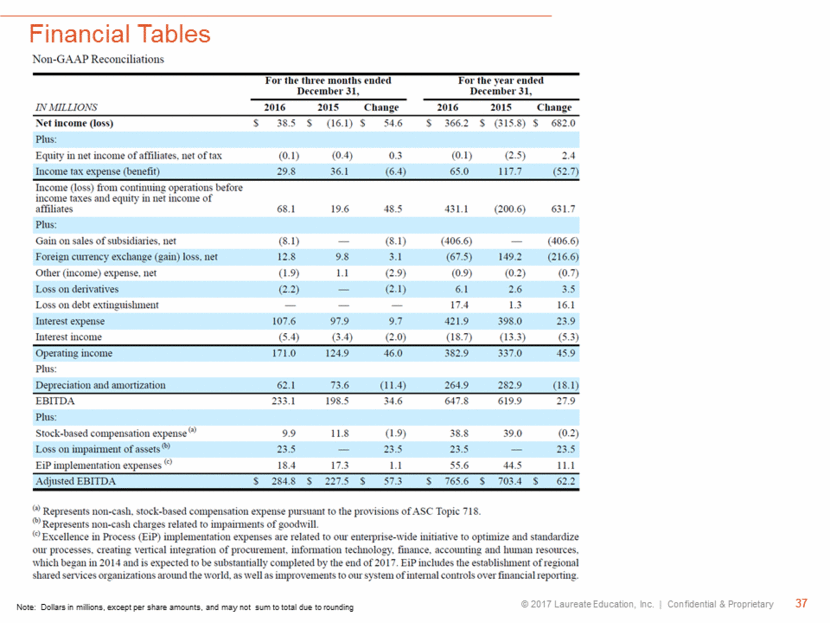
Financial Tables 37 Note: Dollars in millions, except per share amounts, and may not sum to total due to rounding
[LOGO]
