Attached files
| file | filename |
|---|---|
| 8-K - 8-K - SUPREME INDUSTRIES INC | a17-9883_18k.htm |
Exhibit 99.1
INVESTOR PRESENTATION March 2017 ACCELERATING PROFITABLE GROWTH
Safe Harbor Statement Other than historical facts contained herein, the matters set forth in this news release are "forward-looking statements" within the meaning of Section 27A of the Securities Act of 1933, as amended, and Section 21E of the Securities Exchange Act, as amended, and reflect the view of management with respect to future events. When used in this report, words such as "believe," "expect," "anticipate," "estimate," "intend," "plan" and similar expressions, as they relate to Supreme or its plans or operations, identify forward-looking statements. Such forward-looking statements are based on assumptions made by, and information currently available to, management. Although management believes that the expectations reflected in such forward-looking statements are reasonable, it can give no assurance that the expectations reflected in such forward-looking statements are reasonable, and it can give no assurance that such expectations will prove to be correct. Important factors that could cause actual results to differ materially from such expectations include, without limitation, an economic slowdown in the specialized vehicle industry, limitations on the availability of chassis on which Supreme’s product is dependent, availability of raw materials, raw material cost increases, interest rate increases, a change in the number of vehicles subject to a recall, changes in the costs of implementing the recall, actions by NHTSA, including fines and/or penalties, or limitations on the availability of materials used to implement the recall. Additionally, January 2017 backlog may not be indicative of first quarter, full-year or future performance. Furthermore, Supreme can provide no assurance that any raw material cost increases can be passed on to its customers through implementation of price increases for Supreme's products. The forward-looking statements contained herein reflect the current view of management with respect to future events and are subject to those factors and other risks, uncertainties and assumptions relating to the operations, results of operations, cash flows and financial position of Supreme. Supreme assumes no obligation to update the forward-looking statements or to update the reasons actual results could differ from those contemplated by such forward-looking statements. 2
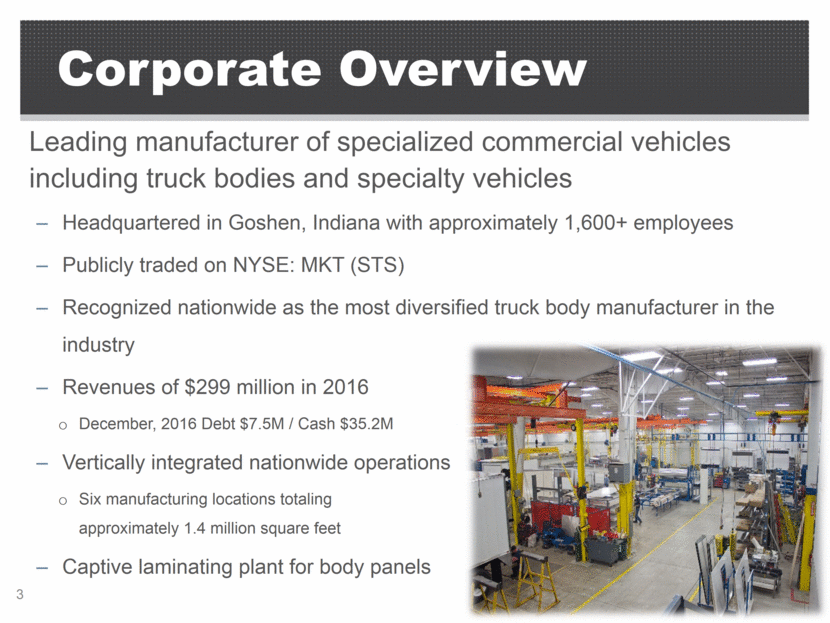
Leading manufacturer of specialized commercial vehicles including truck bodies and specialty vehicles Headquartered in Goshen, Indiana with approximately 1,600+ employees Publicly traded on NYSE: MKT (STS) Recognized nationwide as the most diversified truck body manufacturer in the industry Revenues of $299 million in 2016 December, 2016 Debt $7.5M / Cash $35.2M Vertically integrated nationwide operations Six manufacturing locations totaling approximately 1.4 million square feet Captive laminating plant for body panels Corporate Overview 3
Executive Management 4 Mark Weber President & CEO President and Chief Executive Officer since May of 2013 Extensive experience in operations, new product development and strategic leadership Prior to joining Supreme, served 10 years as the Group President of the Environmental Solutions Group at Federal Signal Corporation (FSS) Prior to FSS, served in various leadership assignments at Cummins Engine Company Matt Long CFO / Treasurer CFO since April 2011 and interim CEO from April 2012 to May 2013 More than 30 years experience in finance Prior to Supreme, was with CTS Corporation for 15 years holding key finance roles Was also with Emerson Electric and United Technologies previously Mike Oium VP of Operations Has been with Supreme since 1997 From 1997 until 2011, worked as Western Region General Manager. Has served as Vice President of Operations for the past five years A total of 30+ years experience in related truck body and trailer manufacturing operations Mickey McKee VP of Sales Before joining Supreme in February 2014, served as Vice President of Sales and Marketing at Nilfisk Advance for three years 30+ years in the sales and marketing area in progressively more challenging positions Career spans over several different companies such as J.I. Case and Federal Signal Corporation
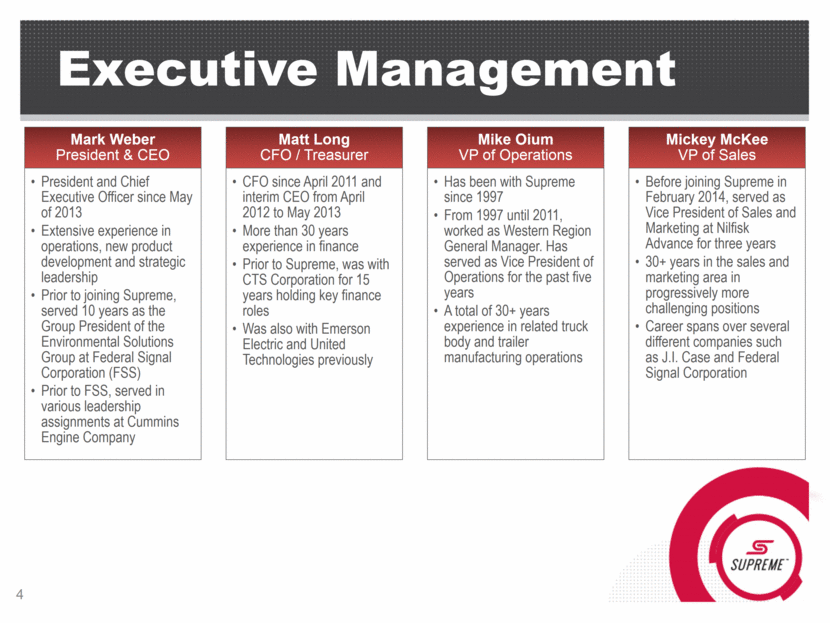
Restructuring Process Significant Turnaround in Financial Performance Achieved with Investments in Operations and Sales, Backed by Excellent Execution 5 2011 Hired new CFO Initiated financial turnaround Established margin discipline via Pricing Committee Invested capital to establish lean manufacturing Debt refinanced 2013 Hired new CEO Conducted strategic assessment of shuttle bus business Consolidated facility footprint 2014 Divested shuttle bus business 2015 Strategic Planning initiated Restructured sales organization Implemented CRM software platform Salesforce.com 2016 Divested Trolley product line Completed consolidation of Rhode Island facility Commissioned LEAN Manufacturing SWAT Team
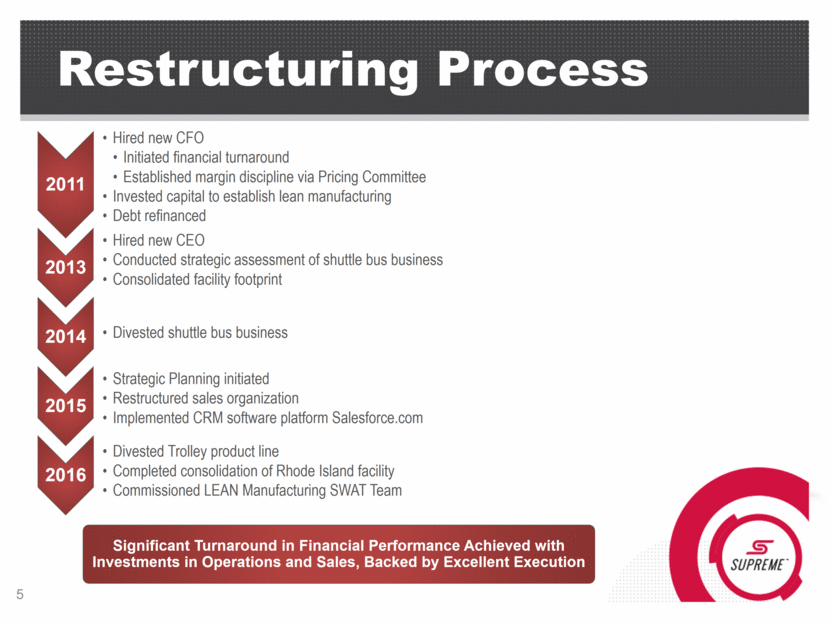
Investment Highlights Significant brand recognition with over 40 year heritage Over 20,000 truck bodies delivered annually Extensive pool chassis program with leading light-duty OEMs Market-Leading Position Nationwide footprint with six production facilities Application of computer aided design and 3-D modeling to optimize products Flexible manufacturing systems to support high volume fleets and low volume custom products Over $25M invested in equipment and facilities since 2012 State-of-the-Art Infrastructure Positive momentum in U.S. straight truck sales Housing starts forecast positive growth rates through 2017 Secular trends driving growth in leasing segment and home delivery Compelling Industry Dynamics Significant EBITDA growth since 2009 Cash generation continues to grow with modest debt Profitability margins are at levels of comparative “premium” businesses Targeted capital investments should improve margin performance Strong Financial Performance Continued organic growth as industry rebounds Highly fragmented market – abundant consolidation opportunities Product innovation to reduce “final mile” distribution costs Expand further into refrigerated market segment Visible Growth Opportunities Executive management team with significant industrial depth and breadth Focused on profitable growth Accelerating cost savings through lean initiatives Experienced Management Team 6
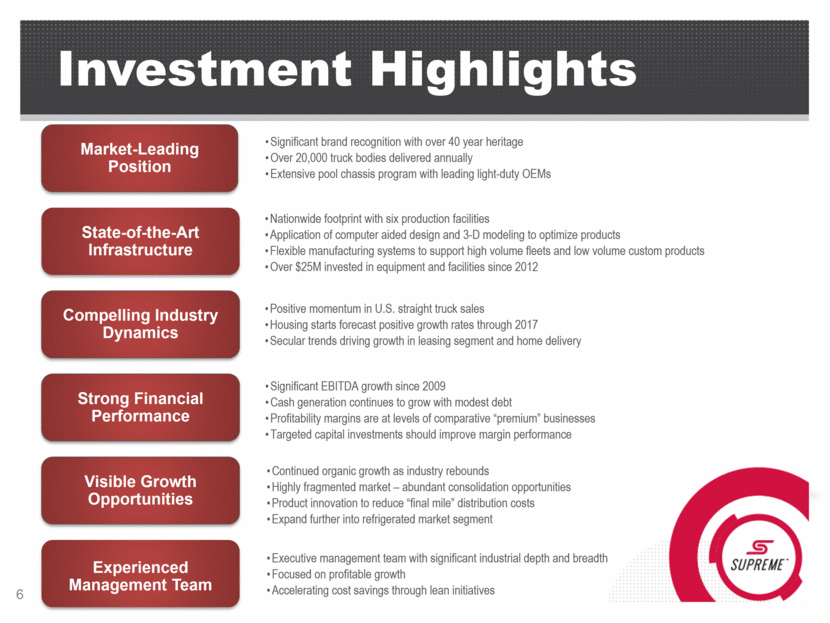
National Footprint Griffin, GA Cleburne, TX Goshen, IN (Corporate Office) Jonestown, PA Moreno Valley, California Ligonier, IN Truck Specialty Vehicles Structural Laminating 7 Moreno Valley, CA
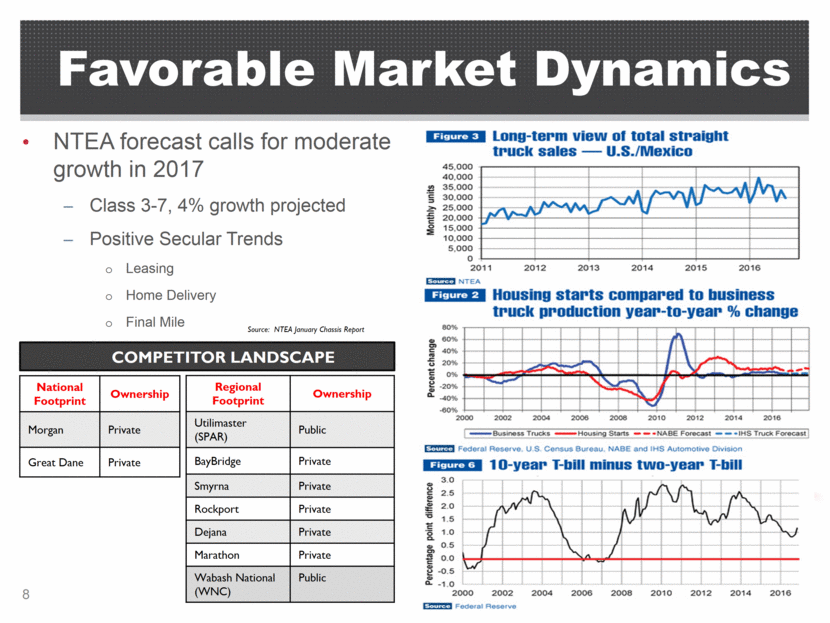
Favorable Market Dynamics NTEA forecast calls for moderate growth in 2017 Class 3-7, 4% growth projected Positive Secular Trends Leasing Home Delivery Final Mile Source: NTEA January Chassis Report 8 COMPETITOR LANDSCAPE Regional Footprint Ownership Utilimaster (SPAR) Public BayBridge Private Smyrna Private Rockport Private Dejana Private Marathon Private Wabash National (WNC) Public National Footprint Ownership Morgan Private Great Dane Private
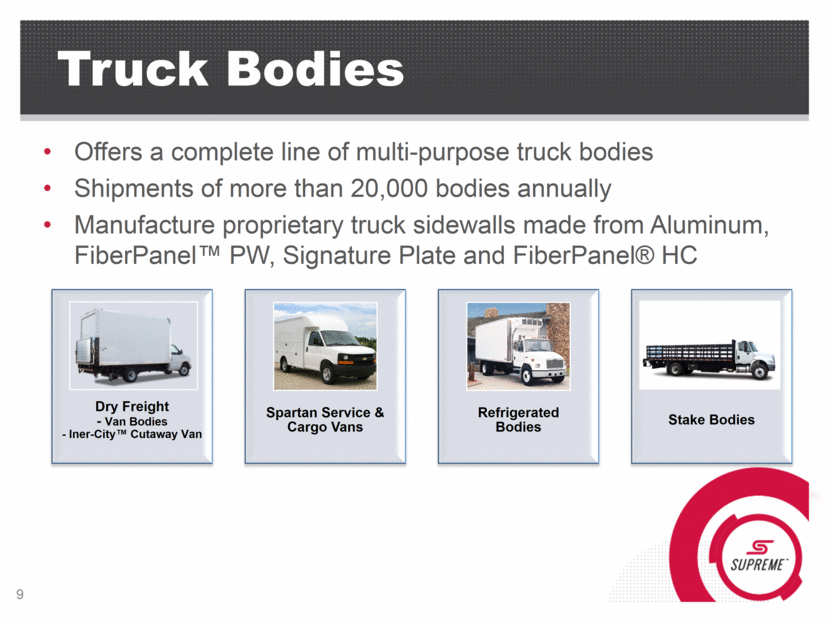
Truck Bodies COMPETITOR LANDSCAPE Offers a complete line of multi-purpose truck bodies Shipments of more than 20,000 bodies annually Manufacture proprietary truck sidewalls made from Aluminum, FiberPanel™ PW, Signature Plate and FiberPanel® HC 9 Dry Freight - Van Bodies - Iner-City™ Cutaway Van Spartan Service & Cargo Vans Refrigerated Bodies Stake Bodies
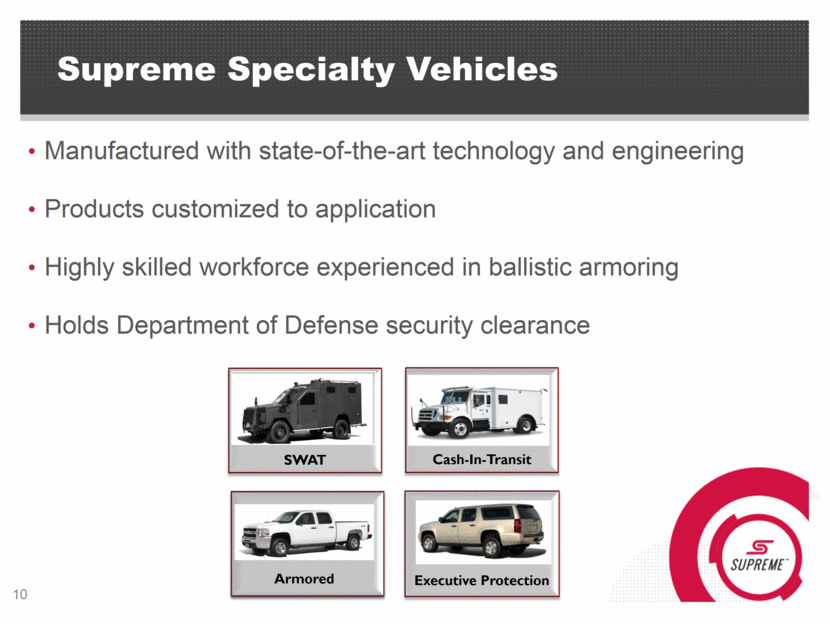
Supreme Specialty Vehicles COMPETITOR LANDSCAPE Manufactured with state-of-the-art technology and engineering Products customized to application Highly skilled workforce experienced in ballistic armoring Holds Department of Defense security clearance 10 SWAT Cash-In-Transit Armored Executive Protection
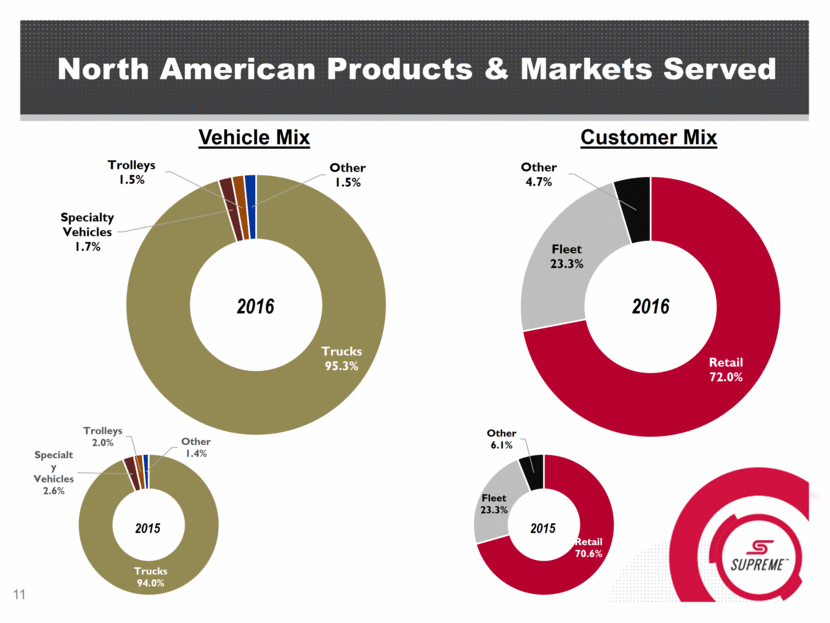
North American Products & Markets Served 2015 Vehicle Mix Customer Mix 2016 2015 2016 11 Trucks 95.3% Specialty Vehicles 1.7% Trolleys 1.5% Other 1.5% Retail 70.6% Fleet 23.3% Other 6.1% Retail 72.0% Fleet 23.3% Other 4.7% Trucks 94.0% Specialt y Vehicles 2.6% Trolleys 2.0% Other 1.4%
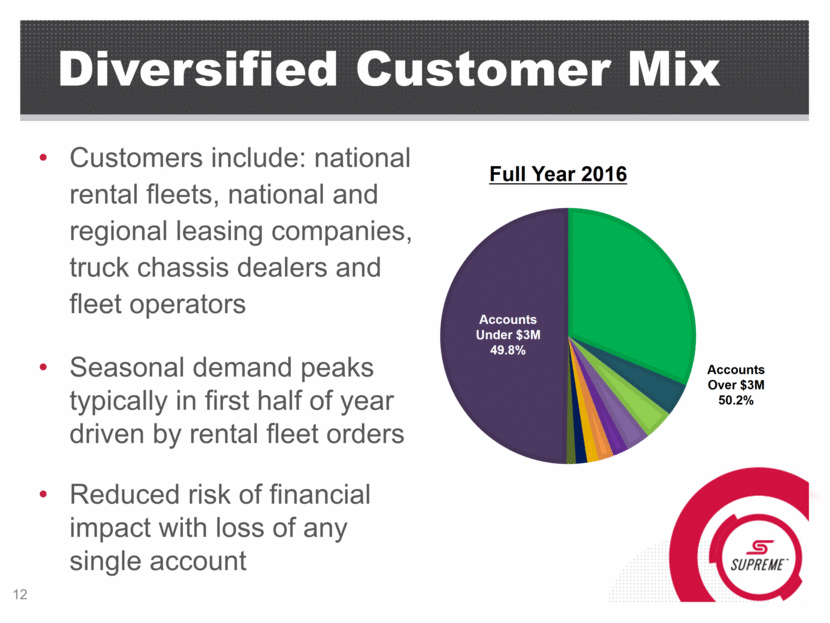
Diversified Customer Mix Customers include: national rental fleets, national and regional leasing companies, truck chassis dealers and fleet operators Seasonal demand peaks typically in first half of year driven by rental fleet orders Reduced risk of financial impact with loss of any single account Full Year 2016 Accounts Under $3M 49.8% Accounts Over $3M 50.2% 12
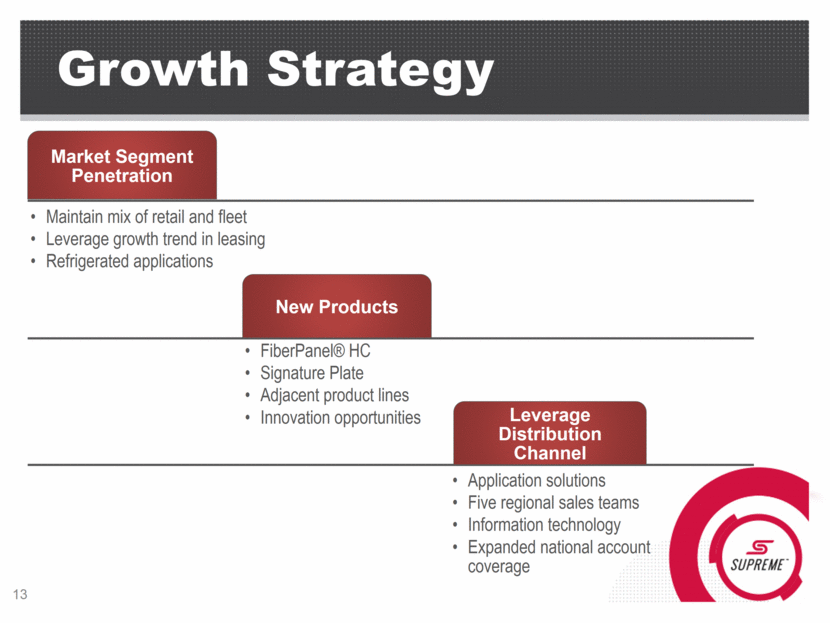
Growth Strategy 13 Market Segment Penetration Maintain mix of retail and fleet Leverage growth trend in leasing Refrigerated applications New Products FiberPanel® HC Signature Plate Adjacent product lines Innovation opportunities Leverage Distribution Channel Application solutions Five regional sales teams Information technology Expanded national account coverage
FINANCIAL SUMMARY
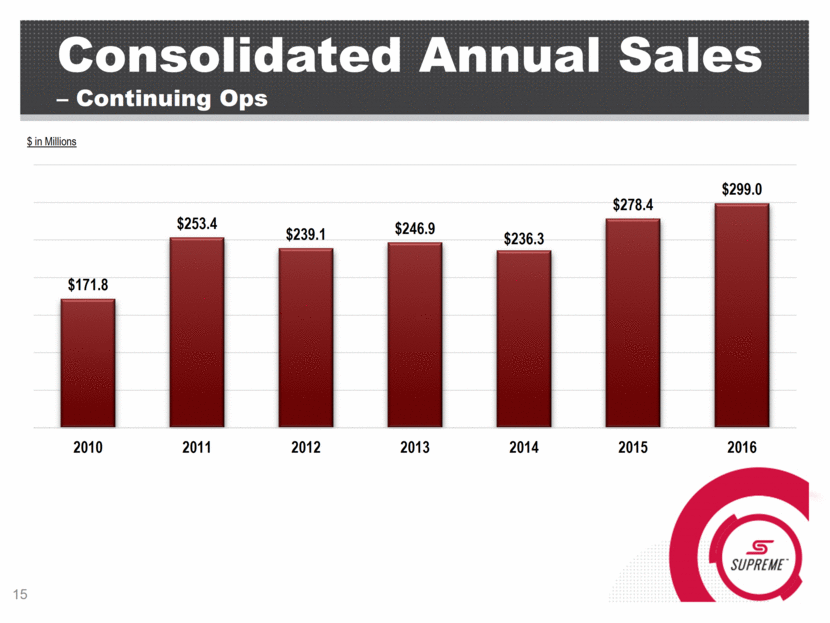
Consolidated Annual Sales – Continuing Ops $ in Millions 15 $171.8 $253.4 $239.1 $246.9 $236.3 $278.4 $299.0 2010 2011 2012 2013 2014 2015 2016
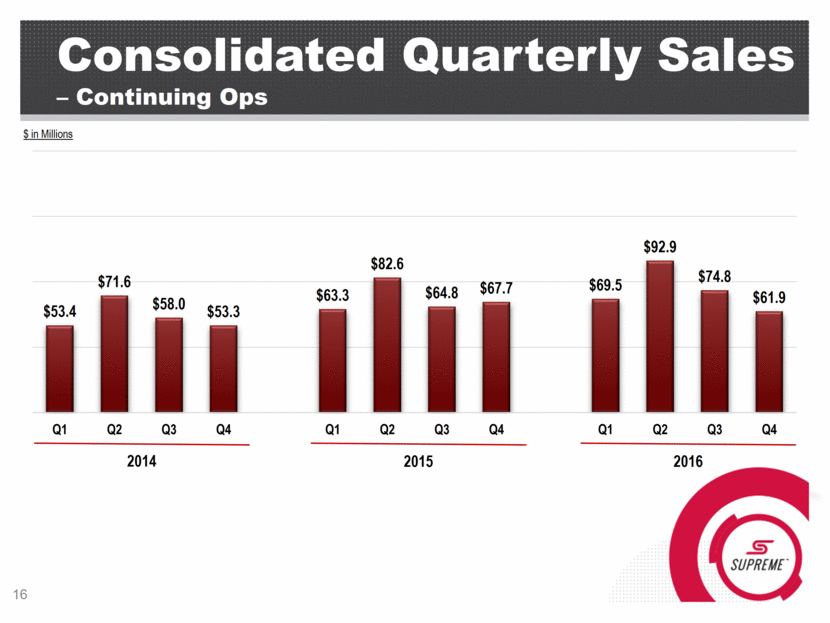
Consolidated Quarterly Sales – Continuing Ops $ in Millions 2014 2015 16 2016 $53.4 $71.6 $58.0 $53.3 $63.3 $82.6 $64.8 $67.7 $ 69.5 $92.9 $74.8 $61.9 Q1 Q2 Q3 Q4 Q1 Q2 Q3 Q4 Q1 Q2 Q3 Q4
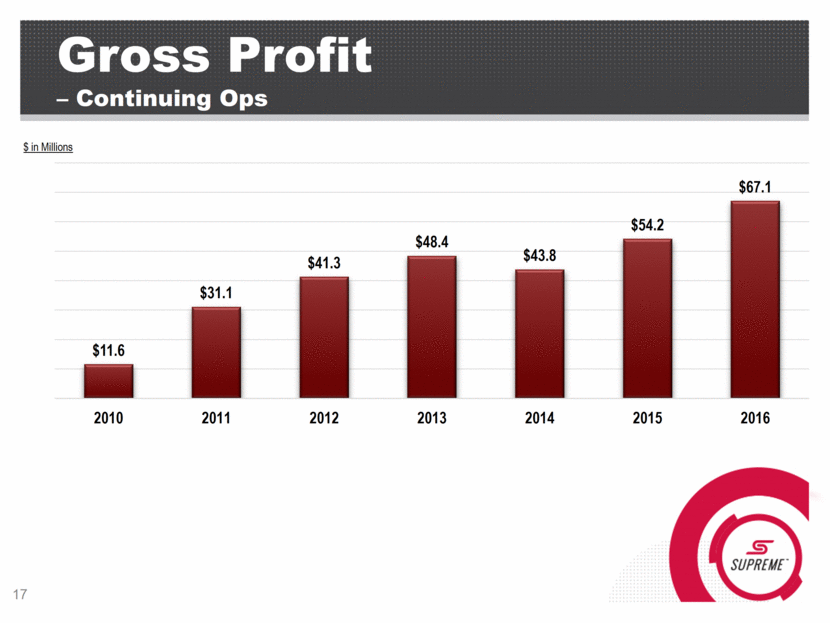
Gross Profit – Continuing Ops $ in Millions 17 $11.6 $31.1 $41.3 $48.4 $43.8 $54.2 $67.1 2010 2011 2012 2013 2014 2015 2016
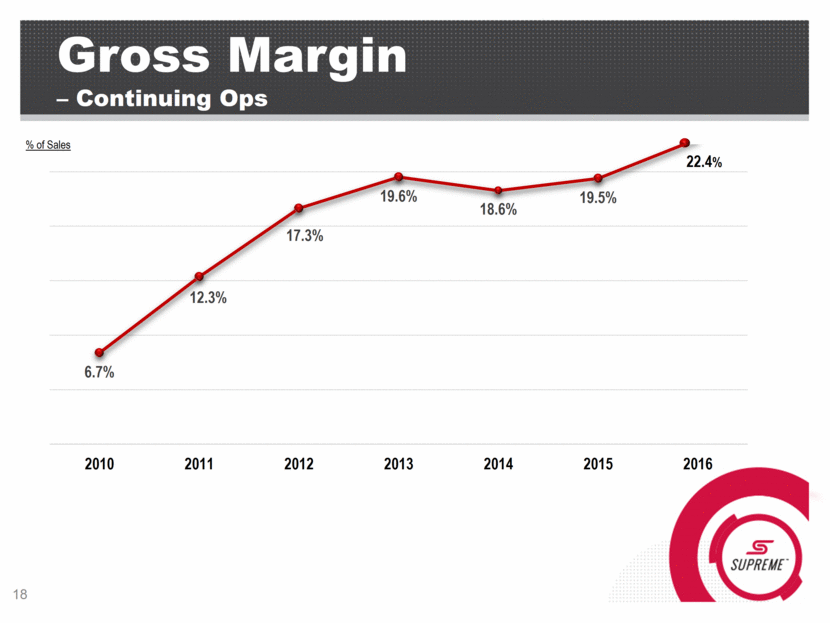
Gross Margin – Continuing Ops % of Sales 18 22.4% 6.7% 12.3% 17.3% 19.6% 18.6% 19.5% 2010 2011 2012 2013 2014 2015 2016
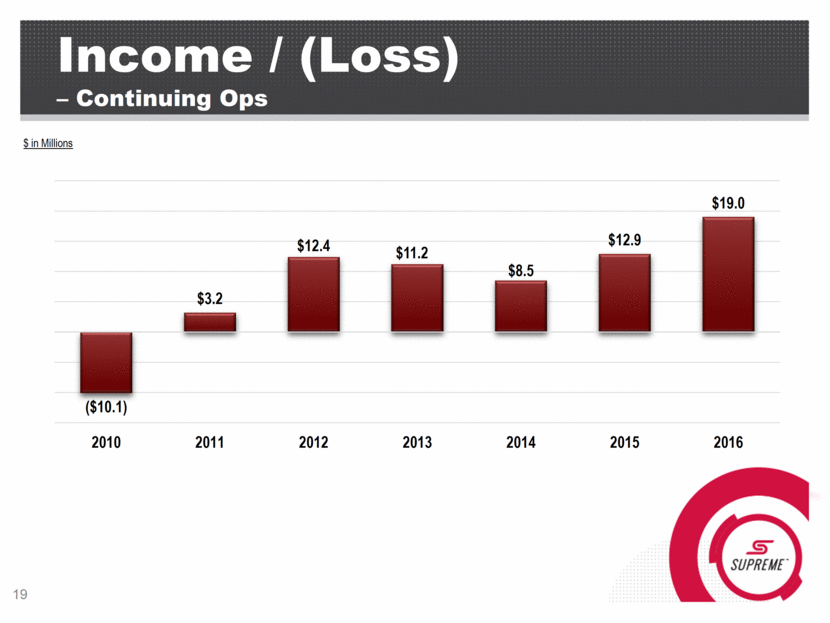
Income / (Loss) – Continuing Ops $ in Millions 19 ($10.1) $3.2 $12.4 $11.2 $8.5 $12.9 $19.0 2010 2011 2012 2013 2014 2015 2016
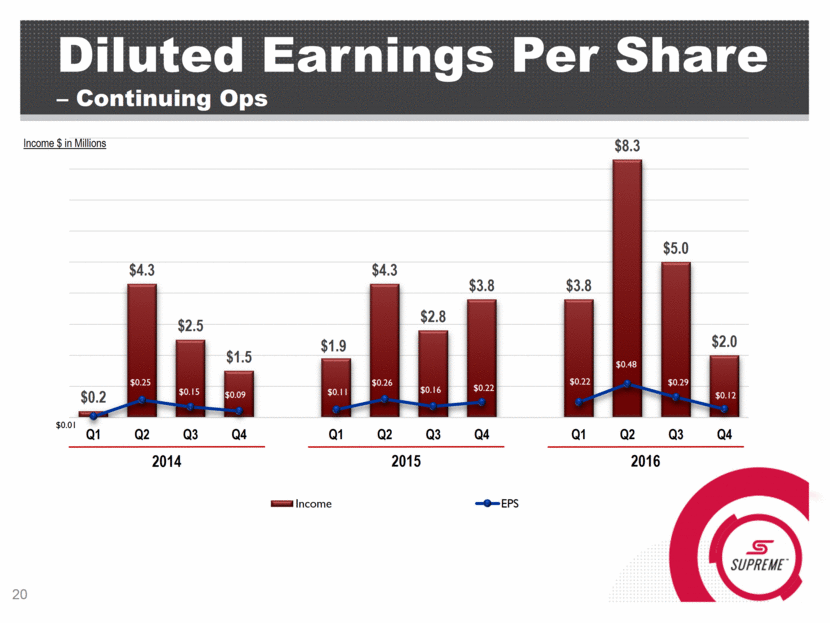
Diluted Earnings Per Share – Continuing Ops Income $ in Millions 2014 2016 20 2015
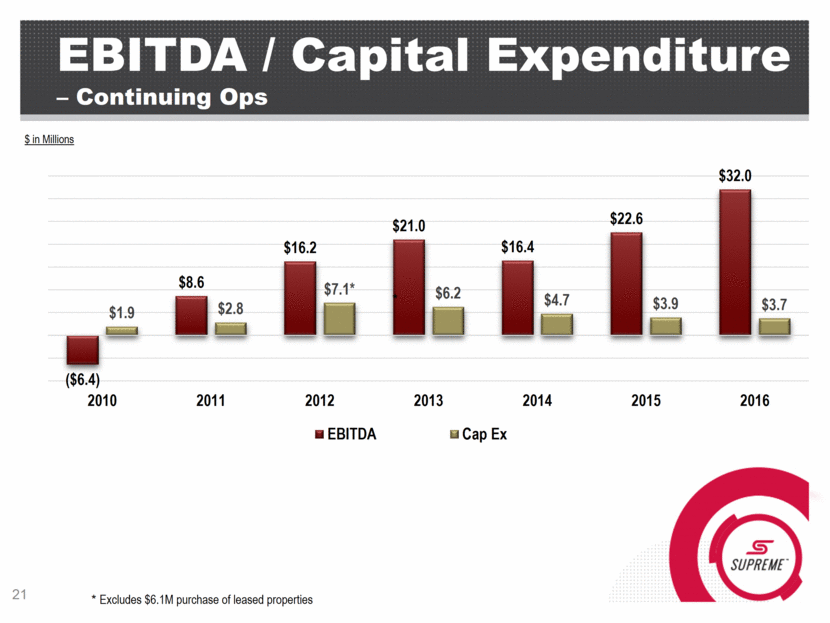
EBITDA / Capital Expenditure – Continuing Ops * Excludes $6.1M purchase of leased properties $ in Millions 21 * ($6.4) $8.6 $16.2 $21.0 $16.4 $22.6 $32.0 $1.9 $2.8 $7.1 * $6.2 $4.7 $3.9 $3.7 2010 2011 2012 2013 2014 2015 2016 EBITDA Cap Ex
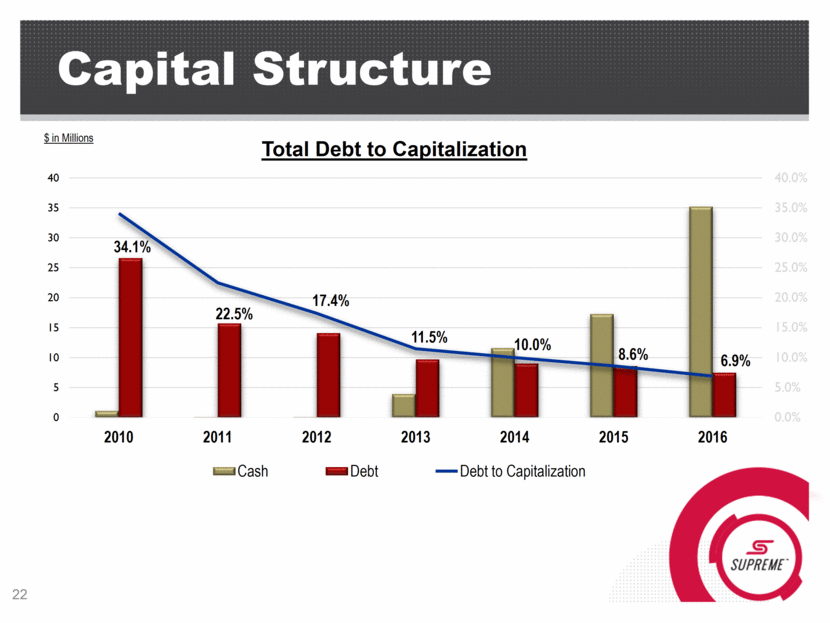
Capital Structure $ in Millions Total Debt to Capitalization 22 34.1% 22.5% 17.4% 11.5% 10.0% 8.6% 6.9% 0.0% 5.0% 10.0% 15.0% 20.0% 25.0% 30.0% 35.0% 40.0% 0 5 10 15 20 25 30 35 40 2010 2011 2012 2013 2014 2015 2016 Cash Debt Debt to Capitalization
APPENDIX
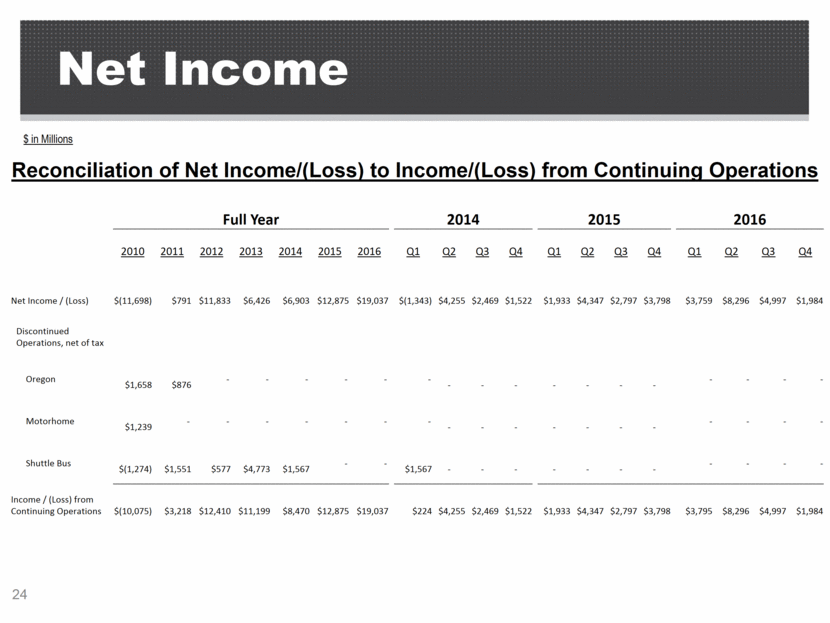
Net Income 24 Reconciliation of Net Income/(Loss) to Income/(Loss) from Continuing Operations $ in Millions Full Year 2014 2015 2016 2010 2011 2012 2013 2014 2015 2016 Q1 Q2 Q3 Q4 Q1 Q2 Q3 Q4 Q1 Q2 Q3 Q4 Net Income / (Loss) $(11,698) $791 $11,833 $6,426 $6,903 $12,875 $19,037 $(1,343) $4,255 $2,469 $1,522 $1,933 $4,347 $2,797 $3,798 $3,759 $8,296 $4,997 $1,984 Discontinued Operations, net of tax Oregon $1,658 $876 - - - - - - - - - - - - - - - - - Motorhome $1,239 - - - - - - - - - - - - - - - - - - Shuttle Bus $(1,274) $1,551 $577 $4,773 $1,567 - - $1,567 - - - - - - - - - - - Income / (Loss) from Continuing Operations $(10,075) $3,218 $12,410 $11,199 $8,470 $12,875 $19,037 $224 $4,255 $2,469 $1,522 $1,933 $4,347 $2,797 $3,798 $3,795 $8,296 $4,997 $1,984
