Attached files
| file | filename |
|---|---|
| EX-32.1 - EX-32.1 - SUPREME INDUSTRIES INC | a17-1018_1ex32d1.htm |
| EX-23.1 - EX-23.1 - SUPREME INDUSTRIES INC | a17-1018_1ex23d1.htm |
| EX-31.1 - EX-31.1 - SUPREME INDUSTRIES INC | a17-1018_1ex31d1.htm |
| EX-32.2 - EX-32.2 - SUPREME INDUSTRIES INC | a17-1018_1ex32d2.htm |
| EX-31.2 - EX-31.2 - SUPREME INDUSTRIES INC | a17-1018_1ex31d2.htm |
| EX-21.1 - EX-21.1 - SUPREME INDUSTRIES INC | a17-1018_1ex21d1.htm |
| EX-10.35 - EX-10.35 - SUPREME INDUSTRIES INC | a17-1018_1ex10d35.htm |
| EX-10.34 - EX-10.34 - SUPREME INDUSTRIES INC | a17-1018_1ex10d34.htm |
UNITED STATES
SECURITIES AND EXCHANGE COMMISSION
WASHINGTON D.C. 20549
FORM 10-K
x ANNUAL REPORT PURSUANT TO SECTION 13 OR 15(d) OF THE SECURITIES EXCHANGE ACT OF 1934
For the fiscal year ended: December 31, 2016
OR
o TRANSITION REPORT PURSUANT TO SECTION 13 OR 15(d) OF THE SECURITIES EXCHANGE ACT OF 1934
COMMISSION FILE NUMBER: 1-8183
SUPREME INDUSTRIES, INC.
(Exact name of Registrant as specified in its charter)
|
Delaware |
|
75-1670945 |
|
(State or other jurisdiction of incorporation) |
|
(I.R.S. Employer Identification Number) |
|
|
|
|
|
2581 E. Kercher Road |
|
46528 |
|
(Address of principal executive office) |
|
(Zip Code) |
Registrant’s telephone number, including area code: (574) 642-3070
Securities registered pursuant to Section 12(b) of the Exchange Act:
|
Title of each class: |
|
Name of each exchange on which registered: |
|
Class A Common Stock ($.10 Par Value) |
|
NYSE MKT |
Securities registered pursuant to Section 12(g) of the Exchange Act: None
Indicate by check mark if the registrant is a well-known seasoned issuer, as defined in Rule 405 of the Securities Act Yes o No x
Indicate by check mark if the registrant is not required to file reports pursuant to Section 13 or Section 15(d) of the Act.
Yes o No x
Indicate by check mark whether the registrant (1) has filed all reports required to be filed by Section 13 or 15(d) of the Securities Exchange Act of 1934 during the preceding 12 months (or for such shorter period that the registrant was required to file such reports), and (2) has been subject to such filing requirements for the past 90 days. Yes x No o
Indicate by check mark whether the registrant has submitted electronically and posted on its corporate Web site, if any, every Interactive Data File required to be submitted and posted pursuant to Rule 405 of Regulation S-T during the preceding 12 months (or for such shorter period that the registrant was required to submit and post such files). Yes x No o
Indicate by check mark if disclosure of delinquent filers pursuant to Item 405 of Regulation S-K is not contained herein, and will not be contained, to the best of registrant’s knowledge, in definitive proxy or information statements incorporated by reference in Part III of this Form 10-K or any amendment to this Form 10-K. o
Indicate by check mark whether the registrant is a large accelerated filer, an accelerated filer, a non-accelerated filer, or a smaller reporting company. See the definitions of “large accelerated filer,” “accelerated filer,” and “smaller reporting company” in Rule 12b-2 of the Exchange Act.
|
Large accelerated filer o |
|
Accelerated filer x |
|
|
|
|
|
Non-accelerated filer o |
|
Smaller reporting company o |
|
(Do not check if a smaller reporting company) |
|
|
Indicate by check mark whether the registrant is a shell company (as defined by Rule 12b-2 of the Exchange Act). Yes o No x
The aggregate market value of the voting and non-voting common stock held by non-affiliates of the registrant as of the last business day of the registrant’s most recently completed second fiscal quarter, based on the last closing sale price of $12.26 per share for the common stock on the NYSE MKT on such date, was approximately $162,029,129.
Indicate the number of shares outstanding of each of the registrant’s classes of common stock as of the latest practicable date.
|
Class |
|
Outstanding at February 21, 2017 |
|
Class A Common Stock ($.10 Par Value) |
|
15,427,033 shares |
Documents incorporated by reference
Listed below are documents, parts of which are incorporated herein by reference, and the part of this report into which the document is incorporated:
Portions of the Proxy Statement for the 2017 Annual Meeting of Stockholders — Part III
History
Supreme Industries, Inc., a Delaware corporation (the “Company,” “Supreme” or “we”), is one of the nation’s leading manufacturers of specialized commercial vehicles including truck bodies and specialty vehicles. The Company was originally incorporated in 1979.
In January of 1984, Supreme Corporation, the Company’s wholly-owned operating subsidiary, was formed to acquire a company engaged in the business of manufacturing, selling, and repairing specialized truck bodies and related equipment.
General Description of the Company’s Business
The Company has two operating segments — specialized commercial vehicles and fiberglass products. The fiberglass products segment does not meet the quantitative thresholds for separate disclosure. See segment information in Note 1 - Nature of Operations and Accounting Policies of the Notes to Consolidated Financial Statements (Item 8).
Supreme manufactures specialized commercial vehicles that are attached to a truck chassis. The truck chassis, which consists of an engine, drivetrain, a frame with wheels, and in some cases a cab, is manufactured by third parties who are major automotive or truck companies. Such companies typically do not build specialized commercial vehicles.
Supreme offers a wide range of specialized commercial vehicles including truck bodies and specialty vehicles ranging in price from $4,000 to more than $100,000. Supreme’s truck bodies are offered in aluminum, FiberPanel PW, FiberPanel HC, or SignaturePlate. Most of our products are attached to light-duty truck chassis and medium-duty truck chassis. Supreme integrates a wide range of options into its truck bodies including liftgates, cargo-handling equipment, customized doors, special bumpers, ladder racks, and refrigeration equipment. Supreme is primarily a build-to-order operation with very limited production occurring in anticipation of pending orders.
The following is a brief summary of Supreme’s products:
Signature van bodies. Supreme’s Signature van bodies range from 10 to 28 feet in length with exterior walls assembled from one of several material options including pre-painted aluminum, FiberPanel PW, FiberPanel HC, or SignaturePlate. Additional features include molded composite front and side corners, LED marker lights, sealed wiring harnesses, hardwood or pine flooring, and various door configurations to accommodate end-user loading and unloading requirements. This product is adaptable for a diverse range of uses in dry-freight transportation.
Iner-City® cutaway van bodies. An ideal route truck for a variety of commercial applications, the Iner-City bodies are manufactured on cutaway chassis which allow access from the cab to the cargo area. Borrowing many design elements from Supreme’s larger van body, the Iner-City is shorter in length (10 to 18 feet) than a typical van body.
Spartan service bodies. Built on a cutaway chassis out of durable FiberPanel PW, the Spartan service body is a virtual workshop on wheels. In lengths from 10 to 14 feet, the Spartan’s selection of compartments, shelves, doors, and pre-designed options provides job-site protection from the weather while offering a secure lockable workspace.
Spartan cargo vans. Built on a cutaway chassis and constructed of FiberPanel PW, the Spartan cargo van provides the smooth maneuverability of a commercial van with the full-height and spacious cargo area of a truck body. In lengths of 10 to 14 feet and available with a variety of pre-designed options, the Spartan cargo van is a bridge product for those moving up from a traditional cargo van into the truck body category.
Kold King® insulated van bodies. Kold King insulated bodies, in lengths of up to 28 feet, provide versatility and dependability for temperature controlled applications. Flexible for either hand-load or pallet-load requirements, they are ideal for multi-stop distribution of both fresh and frozen products.
Stake bodies. Stake bodies are flatbeds with various configurations of removable sides. The stake body is utilized for a broad range of agricultural and construction industries transportation needs.
Armored SUVs. Supreme’s armored SUV products offer the same outside appearance and interior as a stock model SUV, but with armored protection against hostile fire. These protective vehicles are used both abroad by governmental agencies and for various domestic applications.
Armored trucks and specialty vehicles. Supreme’s armored trucks and specialty vehicles include cash-in-transit vehicles as well as SWAT rapid deployment vehicles, prisoner transport vehicles, and a variety of other security vehicles.
Kold King®, Iner-City®, and Spartan are trade names used by Supreme in its marketing of truck bodies. Kold King®, Iner-City®, FiberPanel® and SignaturePlate® are trademarks registered in the U.S. Patent and Trademark Office.
Manufacturing
Supreme’s manufacturing facilities are located in Goshen and Ligonier, Indiana; Griffin, Georgia; Cleburne, Texas; Moreno Valley, California; and Jonestown, Pennsylvania.
Supreme builds specialized vehicle bodies and installs other equipment on truck chassis, most of which are provided through converter pool agreements or are owned by dealers or end-users. These truck bodies are built on an assembly line from engineered structural components such as floors, roofs, and wall panels. These components are manufactured from Supreme’s proprietary designs and are installed on the truck chassis. Supreme then installs optional equipment and applies any special finishes that the customer has specified. Throughout the manufacturing and installation process, Supreme conducts quality control procedures to ensure that the products meet its customers’ specifications. Supreme’s products are generally produced to firm orders and are designed and engineered by Supreme. Order levels will vary depending upon price, competition, prevailing economic conditions, and other factors.
The Company manufactures component parts including fiberglass-reinforced plywood in Ligonier, Indiana, and has extensive metal bending capabilities at all of its locations.
Supreme provides limited warranties against construction defects in its products. These warranties generally provide for the replacement or repair of defective parts or workmanship for periods of up to five years following the date of retail sale.
We purchase raw materials and component parts from a variety of sources. Although we generally do not enter into long-term supply contracts, management believes that we have good relationships with our primary suppliers. In past years prices have fluctuated significantly, but we have experienced no material adverse problems in obtaining adequate supplies of raw materials and component parts to meet the requirements of our production schedules. Management believes that the materials used in the production of our products are available at competitive prices from an adequate number of alternative suppliers. Accordingly, management does not believe that the loss of a single supplier would have a material adverse effect on our business.
Marketing
Supreme sells its products to commercial dealers/distributors, fleet leasing companies, or directly to end-users. Products purchased by a dealer/distributor from Supreme are sold by the dealer/distributor to its own customers.
Supreme’s dealer/distributor network consists of more than 1,000 commercial dealers and a limited number of truck equipment distributors. Management believes that this large network, coupled with Supreme’s geographically-dispersed manufacturing facilities, gives Supreme a marketing advantage over many of its competitors. Supreme generally delivers its products within 4 to 8 weeks after the receipt of orders.
Approximately 75 employees are engaged in direct sales. Supreme engages in direct marketing to target markets and participates in industry and vocational trade shows.
Trademarks
The Company owns and maintains trademarks that are used in marketing specialized products manufactured by Supreme. Management believes that these trademarks have significant customer goodwill. For this reason, management anticipates renewing each trademark discussed above for an additional ten-year period prior to such trademark’s expiration.
Working Capital
The Company had working capital of $58.2 million and $51.9 million at December 31, 2016, and December 26, 2015, respectively. The Company believes that its days sales outstanding, its days inventories on hand and its days payable outstanding are within normal industry levels.
Major Customers
During the year-ended December 31, 2016, one large national fleet leasing customer accounted for approximately 31% of the Company’s consolidated net sales. During the year-ended December 26, 2015, two large national fleet leasing customers accounted for approximately 24% and 11% of the Company’s consolidated net sales. During the year-ended December 27, 2014, one large national fleet leasing customer accounted for approximately 16% of the Company’s consolidated net sales. The Company’s export sales are minimal.
Competitive Conditions
The highly competitive nature of the specialized vehicle industry presents a number of challenges. With only a few national competitors, the Company often competes with smaller, regional companies. As a result of this broad competition, the Company is often faced with competitive pricing pressures. Other competitive factors include quality of product, lead times, geographic proximity to customers, and the ability to manufacture a product customized to customer specifications.
During favorable business cycles, the industry tends to experience an increase in smaller, regional competitors, and then a similar decrease during times of challenging economic pressures. With its national presence and diverse product offerings, the Company believes that it is well positioned to meet the competitive challenges presented.
Governmental Regulation
The Company’s operations are subject to a variety of federal, state, and local environmental and health and safety statutes and regulations including those related to emissions to the air, discharges to water, treatment, storage, and disposal of water, and remediation of contaminated sites. Additionally, the Company’s products are subject to a variety of federal, state, and local safety statutes and regulations. From time to time, the Company has received notices of noncompliance with respect to our operations and products. These notices have typically been resolved by investigating the alleged noncompliance and correcting any noncompliant conditions.
Cyclicality and Seasonality of Business
The Company’s business can be cyclical due to the normal replacement cycle particularly of its truck products (historically approximately seven years) being subject to customers delaying purchases due to adverse changes in economic conditions and other long range factors that can affect the transportation industry. Seasonality arises due to the Company typically participating in bids for large fleet contracts. If successful, the fleet orders generally require shipment of the truck bodies in the first and second quarters. Additionally, our business depends on various factors that are particularly sensitive to general economic conditions and business cycles including: corporate profitability; interest rates; fuel costs; changes in government regulations (i.e. fuel standards); customer preferences; industrial, commercial, and consumer spending patterns; and availability of truck chassis.
Employees
As of December 31, 2016 and December 26, 2015, the Company employed approximately 1,450 and 1,400 employees, respectively, none of whom are represented by a collective bargaining unit. The Company considers its relations with its employees to be favorable.
Backlog
The Company’s backlog of firm orders was $83.4 million at December 31, 2016 compared to $98.1 million at December 26, 2015.
Any investment in our Class A Common Stock involves a high degree of risk. You should carefully consider the risks and uncertainties described below and the other information included in this Form 10-K before purchasing our Class A Common Stock. Although the risks described below are the risks that we believe are material, they are not the only risks relating to our business and our Class A Common Stock. Additional risks and uncertainties, including those that are not yet identified or that we currently believe are immaterial, may also adversely affect our business, financial condition, or results of operations. If any of the events described
below occur, our business and financial results could be materially and adversely affected. The market price of our Class A Common Stock could decline due to any of these risks, perhaps significantly, and you could lose part or all of your investment.
A lack of credit and/or limited financing availability to the Company, its vendors, dealers, or end users could adversely affect our business.
The Company’s liquidity and financial condition could be materially and adversely affected if, under its current bank credit agreement, the Company’s ability to borrow money from its existing lenders to finance its operations is reduced or eliminated. Similar adverse effects may also result if the Company realizes lessened credit availability from trade creditors. Additionally, many of our customers require the availability of financing to facilitate the purchase of our products. As a result, a continuing period of reduced credit availability in the marketplace could have adverse effects on the Company’s business.
Increases in the price and demand for raw materials could lower our margins and profitability.
Supreme generally does not have long-term raw material contracts and is dependent upon suppliers of steel, aluminum, wood products, and fiberglass materials, among others, for its manufacturing operations. Consequently, our ability to produce and deliver our products could be affected by disruptions encountered by our raw material suppliers or freight carriers. Additionally, competitive market conditions may prevent the Company from implementing price increases to offset raw material cost increases. As a result the Company’s gross margin could be adversely affected.
Volatility in the supply of vehicle chassis and other vehicle components could adversely affect our business.
With the exception of some specialty vehicle products, the Company generally does not purchase vehicle chassis for its inventory. The Company accepts shipments of vehicle chassis owned by dealers or end-users for the purpose of installing and/or manufacturing its specialized truck bodies on such chassis. Historically, General Motors Corp. (“GM”) and Ford Motor Company (“Ford”) have been the primary suppliers of chassis. In the event of a disruption in supply from one major supplier, the Company would attempt to use another major supplier, but there can be no assurance that this attempt would be successful. Nevertheless, in the event of chassis supply disruptions, there could be unforeseen consequences that may have a significant adverse effect on the Company’s business operations.
The Company also faces risk relative to finance and storage charges for maintaining an excess supply of consigned chassis from GM and Ford. Under the consigned chassis agreements, if a chassis is not delivered to a customer within a specified time frame, the Company is required to pay finance or storage charges on such chassis.
We compete in the highly competitive specialized vehicle industry which may impact our financial results.
The competitive nature of the specialized vehicle industry creates a number of challenges for the Company. Important factors include product pricing, quality of product, lead times, geographic proximity to customers, and the ability to manufacture a product customized to customer specifications. Specialized vehicles are produced by a number of smaller, regional companies which create product pricing pressures that could adversely impact the Company’s profits. Chassis manufacturers have not generally shown an interest in manufacturing specialized vehicles, including truck bodies, because such manufacturers’ highly-automated assembly line operations do not lend themselves to the efficient production of a wide variety of highly-specialized vehicles with various options and equipment.
Demand for our products can be adversely impacted by negative economic trends.
Instability in the U.S. economy, negative conditions in the U.S. credit markets, volatility in the industries that our products serve, or adverse changes in the financial condition of our customers could lead to reduced, cancelled, or delayed orders for our products. Our fleet customers traditionally order our products on an annual basis, but the size of fleet orders may be negatively impacted by the negative economic factors listed above or the size of a fleet customer’s previous order. Additionally, negative economic trends may cause our retail customers to choose not to order, cancel orders, or delay ordering, our products. Such occurrences could adversely affect our cash flows and results of operations.
We have potential exposure to environmental and health and safety liabilities which may increase costs and lower profitability.
Our operations are subject to a variety of federal, state, and local environmental and health and safety statutes and regulations, including those relating to emissions to the air, discharges to water, treatment, storage, and disposal of waste, and remediation of contaminated sites. In certain cases, these requirements may limit the productive capacity of our operations.
Certain laws, including the Federal Comprehensive Environmental Response, Compensation, and Liability Act of 1980, as amended, have imposed strict and, under certain circumstances, joint and several liability for costs to remediate contaminated sites upon designated responsible parties including site owners or operators and persons who dispose of wastes at, or transport wastes to, such sites.
From time to time, we have received notices of noncompliance with respect to our operations. These notices have typically been resolved by investigating the alleged noncompliance and correcting any non-compliant conditions. New environmental requirements, more aggressive enforcement of existing ones, or discovery of presently unknown conditions could require material expenditures or result in liabilities which could limit expansion or otherwise have a material adverse effect on our business, financial condition, and operating cash flows.
A product defect claim in excess of our insurance coverage, or for which we have no insurance, or an inability to acquire or maintain insurance at commercially reasonable rates, could have a materially adverse effect upon our business.
We face an inherent risk of exposure to product liability, product recall, and other product defect related claims, if the use of our current or formerly manufactured products result, or are alleged to result, in personal injury and/or property damage, or if a significant number of our products must be recalled, or if a product defect results in the Company having to refund the purchase price of a substantial number of vehicles. If we manufacture a defective product, we may experience material losses and we may incur significant costs to defend product defect claims. We could also incur damages and significant costs in correcting any defects, experience lost sales, and suffer damage to our reputation. We may not have insurance coverage for certain types of claims or our insurance coverage may not be adequate for liabilities we could incur and may not continue to be available on terms acceptable to us.
Our manufacturer’s warranties expose us to potentially significant claims.
We are subject to product warranty claims in the ordinary course of our business. If we manufacture poor quality products or receive defective materials, we may incur unforeseen costs in excess of what we have reserved in our financial statements. These costs could have a material adverse effect on our business and operating cash flows.
We depend on the services of our key executives. Any loss of our key executives could have a material adverse effect on our operations.
Our ability to compete successfully and implement our business strategy depends on the efforts of our senior management personnel. The loss of the services of any one or more of these individuals could have a material adverse effect on our business. We do not maintain key-man life insurance policies on any of our executives. If we were unable to attract qualified personnel to our management, our existing management resources could become strained, which may harm our business and our ability to implement our strategies.
Our relatively low trading volumes may limit our stockholders’ abilities to buy or sell their shares.
Our Class A Common Stock has experienced, and may continue to experience, price volatility and low trading volumes. Overall market conditions, and other risk factors described herein, may cause the market price of our Class A Common Stock to fall. Our high and low sales prices for the twelve month period ended December 31, 2016 were $19.83 and $5.40, respectively. Our Class A Common Stock is listed on the NYSE MKT exchange under the symbol “STS.” However, daily trading volumes for our Class A Common Stock are, and may continue to be, relatively small compared to many other publicly-traded securities. For example, during the twelve month period ended December 31, 2016, our daily trading volume has been as low as 1,000 shares. It may be difficult for you to buy or sell shares in the public market at any given time at prevailing prices, and the price of our Class A Common Stock may, therefore, be volatile.
Our officers and directors own a large percentage of our common stock. They may vote their shares in ways with which you disagree.
As of February 21, 2017, our officers and directors as a group beneficially owned 19.3% of our Class A Common Stock and 95.8% of our Class B Common Stock. As a result, they will continue to be able to exercise significant influence, and in most cases, control, over matters requiring stockholder approval, including the election of directors, changes to our charter documents, and significant corporate transactions. This concentration of ownership makes it unlikely that any other holder or group of holders of our Class A Common Stock will be able to affect the way we are managed or the direction of our business.
Our split classes of stock may make it more difficult or expensive for a third party to acquire the Company which may adversely affect our stock price.
Our outstanding common stock is split into two classes. The Class A Common Stock is listed on the NYSE MKT exchange, and the holders thereof are entitled to elect three members of the Company’s Board of Directors. The majority (95.8%) of the Class B Common Stock is owned or controlled by the Company’s officers and directors and is entitled to elect the remaining seven members of the Company’s Board of Directors. The continuing ability of the holders of our Class B Common Stock to elect a majority of the members of the Company’s Board of Directors will make it difficult for another company to acquire us and for Class A stockholders to receive any related take-over premium (unless the controlling group approves the sale).
Our internal controls provide only reasonable assurance that objectives are met. Failure of one or more of these controls could adversely affect the Company.
While the Company believes that its control systems are effective, there are inherent limitations in all control systems, and misstatements due to error or fraud may occur and not be detected. The Company continues to take action to comply with the internal controls, disclosure controls, and other requirements of the Sarbanes-Oxley Act of 2002. Management, including our Chief Executive Officer and Chief Financial Officer, cannot guarantee that our internal controls and disclosure controls will prevent all possible errors or all fraud. A control system, no matter how well conceived and operated, can provide only reasonable, not absolute, assurance that the objectives of the control system are met. In addition, the design of a control system must reflect the fact that there are resource constraints, and the benefit of controls must be relative to their costs. Because of the inherent limitations in all control systems, no system of controls can provide absolute assurance that all control issues and instances of fraud, if any, within the Company have been detected. These inherent limitations include the realities that judgments in decision-making can be faulty and that breakdowns can occur because of simple error or mistake. Further, controls can be circumvented by individual acts of some persons, by collusion of two or more persons, or by management override of the controls. The design of any system of controls is also based in part upon certain assumptions about the likelihood of future events, and there can be no assurance that any design will succeed in achieving its stated goals under all potential future conditions. Over time, a control may be inadequate because of changes in conditions or the degree of compliance with the policies or procedures may deteriorate. Because of inherent limitations in a cost-effective control system, misstatements due to error or fraud may occur and not be detected.
We may not have the ability to sell idle facilities.
We currently own facilities which have been idle for a period of time and are currently being marketed for sale (see Item 2. “Properties”). Although management has exercised its best judgment to reflect accurate current market values of these properties in the Company’s financial statements, there cannot be any assurance that these properties can be sold for these values anytime in the near future.
(See other risk factors listed in Item 7 under the caption: “Forward-Looking Statements”).
ITEM 1B. UNRESOLVED STAFF COMMENTS.
Not applicable.
Set forth below is a brief summary of the properties which are owned or leased by the Company.
|
|
|
Square |
|
Owned or |
|
|
|
|
|
|
Footage |
|
Leased |
|
Operating Segment |
|
|
Manufacturing of Products |
|
|
|
|
|
|
|
|
Goshen, Indiana |
|
540,820 |
|
Owned |
|
Specialized Vehicles |
|
|
Jonestown, Pennsylvania |
|
423,957 |
|
Owned |
|
Specialized Vehicles |
|
|
Griffin, Georgia |
|
190,722 |
|
Owned |
|
Specialized Vehicles |
|
|
Cleburne, Texas |
|
180,785 |
|
Owned |
|
Specialized Vehicles |
|
|
Moreno Valley, California |
|
103,200 |
|
Owned |
|
Specialized Vehicles |
|
|
Moreno Valley, California |
|
13,758 |
|
Leased |
|
Specialized Vehicles |
|
|
|
|
1,453,242 |
|
|
|
|
|
|
|
|
|
|
|
|
|
|
|
Manufacturing of Component Parts |
|
|
|
|
|
|
|
|
Ligonier, Indiana |
|
52,142 |
|
Owned |
|
Fiberglass Products |
|
|
|
|
52,142 |
|
|
|
|
|
|
|
|
|
|
|
|
|
|
|
Properties for Sale |
|
|
|
|
|
|
|
|
Wilson, North Carolina |
|
113,694 |
|
Owned |
|
Not Applicable |
|
|
Harrisville, Rhode Island |
|
20,000 |
|
Owned |
|
Not Applicable |
|
|
Goshen, Indiana (land only) |
|
— |
|
Owned |
|
Not Applicable |
|
|
|
|
133,694 |
|
|
|
|
|
|
|
|
|
|
|
|
|
|
|
Corporate Office Building |
|
|
|
|
|
|
|
|
Goshen, Indiana |
|
26,000 |
|
Owned |
|
Not Applicable |
|
|
|
|
26,000 |
|
|
|
|
|
|
|
|
|
|
|
|
|
|
|
Total square footage |
|
1,665,078 |
|
|
|
|
|
In addition, the Company leases approximately 16 acres of land at its Pennsylvania and California locations. The land is used for chassis storage and is leased from unrelated parties.
In an effort to manage its capacity utilization and control its assets, the Company had previously ceased operations at a number of facilities. The North Carolina property and certain Indiana facilities are being marketed for sale or lease and were classified as property, plant, and equipment as of December 31, 2016. The Indiana land and the Rhode Island property were classified as assets held for sale as of December 31, 2016 and are being marketed for sale. The facilities owned or leased by the Company are well maintained, in good condition, and adequate for their intended purposes.
The Company is subject to various investigations, claims, and legal proceedings covering a wide range of matters that arise in the ordinary course of its business activities. Each of these matters is subject to various uncertainties, and it is possible that some of these matters may be resolved unfavorably to the Company. The Company establishes accruals for matters that are probable and reasonably estimable.
On January 3, 2017, an amended complaint was filed against the Company’s subsidiary, Supreme Corporation, in a suit (SVI, Inc. v. Supreme Corporation, Hometown Trolley (a/k/a Double K, Inc.) and Dustin Pence) in the United States District Court, District of Nevada. The amended complaint [followed the original complaint filed on May 16, 2016], from Supreme Corporation’s former trolley distributor, alleges that Supreme Corporation’s sale of its trolley assets to another manufacturer was improper. Claims alleged against Supreme Corporation are as follows: (i) misappropriation of trade secrets; (ii) civil conspiracy/collusion; (iii) tortious interference with contractual relationships; (iv) tortious interference with prospective economic advantage; (v) unjust enrichment; (vi) breach of contract; (vii) breach of the covenant of good faith and fair dealing; (viii) breach of fiduciary duties; (ix) promissory estoppel; (x) declaratory relief establishing a joint venture or partnership; and (xi) cancellation of a trademark registration. The plaintiff alleges that the net present value of the amount lost by the plaintiff is approximately $40,000,000. Supreme Corporation has filed a motion to dismiss which is pending. Due to the inherent risk of litigation, the outcome of this case is uncertain and unpredictable; however, at this time, management believes that the allegations are without merit and is vigorously defending the matter.
On November 4, 2016, a putative class action lawsuit was filed against the Company, Mark Weber (the Company’s Chief Executive Officer) and Matthew W. Long (the Company’s Chief Financial Officer) in the United States District Court for the Central District of California alleging the defendants violated Sections 10(b) and 20(a) of the Securities Exchange Act of 1934 and Rule 10b-5 by making material, misleading statements in July 2016 regarding projected backlog. The plaintiff seeks to recover unspecified damages. On February 14, 2017, the court transferred the venue of the case to the Northern District of Indiana upon the joint stipulation of the plaintiff and the defendants. Due to the inherent risk of litigation, the outcome of this case is uncertain and unpredictable; however, at this time, management believes that the allegations are without merit and is vigorously defending the matter.
ITEM 4. MINE SAFETY DISCLOSURES.
Not applicable.
ITEM 5. MARKET FOR REGISTRANT’S COMMON EQUITY, RELATED STOCKHOLDER MATTERS, AND ISSUER PURCHASES OF EQUITY SECURITIES.
The Company’s Class A Common Stock is traded on the NYSE MKT exchange (ticker symbol STS). The number of record holders of the Class A Common Stock as of February 21, 2017 was approximately 182. Due to the number of shares held in nominee or street name, it is likely that there are substantially more than 182 beneficial owners of the Company’s Class A Common Stock.
The Company’s Class A Common Stock closed at a price of $18.48 per share on the NYSE MKT exchange on February 21, 2017 on which date there were 15,427,033 shares of Class A Common Stock outstanding. High and low sales prices of the Class A Common Stock for the two-year periods ended December 31, 2016 and December 26, 2015 were:
|
|
|
2016 |
|
2015 |
| ||||||||
|
|
|
High |
|
Low |
|
High |
|
Low |
| ||||
|
1st Quarter |
|
$ |
8.83 |
|
$ |
5.40 |
|
$ |
8.75 |
|
$ |
6.96 |
|
|
2nd Quarter |
|
14.49 |
|
13.94 |
|
8.85 |
|
7.30 |
| ||||
|
3rd Quarter |
|
19.83 |
|
18.65 |
|
8.89 |
|
7.73 |
| ||||
|
4th Quarter |
|
19.34 |
|
11.03 |
|
8.41 |
|
6.76 |
| ||||
All of the 1,656,467 outstanding shares of the Company’s Class B Common Stock were held by a total of 9 persons as of February 21, 2017. There is no established trading market for the Class B Common Stock. The Class B Common Stock is freely convertible on a one-for-one basis into an equal number of shares of Class A Common Stock, and ownership of the Class B Common Stock is deemed to be beneficial ownership of the Class A Common Stock under Rule 13d-3(d) (1) promulgated under the Securities Exchange Act of 1934.
Pursuant to the terms of the Class B Common Stock, 54,371 shares of Class B Common Stock were converted into 54,371 shares of Class A Common Stock during 2016. The shares of Class A Common Stock were issued pursuant to Rule 3(a)(9) of the Securities Act of 1933, as amended.
The Board of Directors approved the following cash dividends on the Company’s outstanding Class A and Class B Common Stock during the years ended December 31, 2016, and December 26, 2015:
|
|
|
|
|
|
|
Cash Dividend |
| |
|
Declaration Date |
|
Record Date |
|
Paid Date |
|
Per Share |
| |
|
March 3, 2015 |
|
March 17, 2015 |
|
March 24, 2015 |
|
$ |
0.025 |
|
|
May 6, 2015 |
|
May 27, 2015 |
|
June 3, 2015 |
|
$ |
0.030 |
|
|
August 5, 2015 |
|
August 24, 2015 |
|
August 31, 2015 |
|
$ |
0.030 |
|
|
November 10, 2015 |
|
December 11, 2015 |
|
January 4, 2016 |
|
$ |
0.300 |
|
|
March 2, 2016 |
|
March 16, 2016 |
|
March 23, 2016 |
|
$ |
0.030 |
|
|
May 25, 2016 |
|
June 9, 2016 |
|
June 16, 2016 |
|
$ |
0.035 |
|
|
August 10, 2016 |
|
August 24, 2016 |
|
August 31, 2016 |
|
$ |
0.035 |
|
|
November 9, 2016 |
|
December 12, 2016 |
|
January 3, 2017 |
|
$ |
0.300 |
|
Future dividend payments will necessarily be subject to business conditions, the Company’s financial position, and requirements for working capital, property, plant and equipment expenditures, and other corporate purposes.
Stock Performance Graph
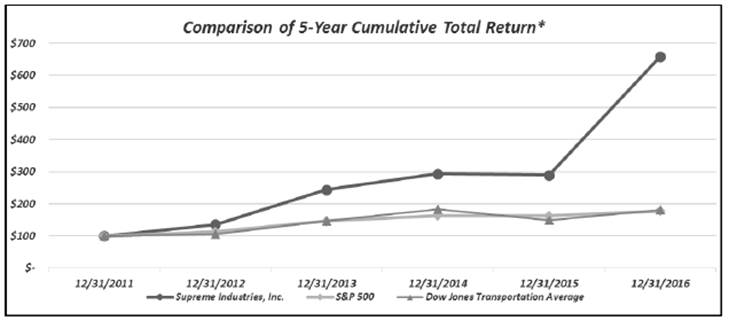
The following graph compares the cumulative 5-year total return to shareholders of the Company’s common stock relative to the cumulative total return of the S&P 500 Index and the Dow Jones Transportation Average. This graph assumes an initial investment of $100 (with reinvestment of all dividends) to have been made in our Class A Common Stock and the indexes on December 31, 2011 and their relative performance is tracked through December 31, 2016.
|
($) |
|
12/31/2011 |
|
12/31/2012 |
|
12/31/2013 |
|
12/31/2014 |
|
12/31/2015 |
|
12/31/2016 |
|
|
|
|
|
|
|
|
|
|
|
|
|
|
|
|
|
Supreme Industries, Inc. |
|
100 |
|
136 |
|
244 |
|
294 |
|
290 |
|
658 |
|
|
S&P 500 |
|
100 |
|
113 |
|
147 |
|
164 |
|
162 |
|
178 |
|
|
Dow Jones Transportation Average |
|
100 |
|
106 |
|
147 |
|
182 |
|
150 |
|
180 |
|
* The stock price performance included in this graph is not necessarily indicative of future stock price performance.
ITEM 6. SELECTED FINANCIAL DATA
The following selected financial data has been derived from our consolidated financial statements. The data set forth below should be read in conjunction with Management’s Discussion and Analysis of Financial Condition and Results of Operations and our consolidated financial statements and notes thereto.
All per share data has been adjusted to reflect the five percent (5%) common stock dividend declared and paid during 2013.
|
Consolidated Statement of Continuing Operations Data: |
|
For Fiscal Years Ended |
| |||||||||||||
|
(in millions, except per share amounts) |
|
2016 |
|
2015 |
|
2014 |
|
2013 |
|
2012 |
| |||||
|
Net sales |
|
$ |
299.0 |
|
$ |
278.4 |
|
$ |
236.3 |
|
$ |
246.8 |
|
$ |
239.1 |
|
|
|
|
|
|
|
|
|
|
|
|
|
| |||||
|
Income from continuing operations |
|
19.0 |
|
12.9 |
|
8.5 |
|
11.2 |
|
12.4 |
| |||||
|
|
|
|
|
|
|
|
|
|
|
|
| |||||
|
Income from continuing operations per share: |
|
|
|
|
|
|
|
|
|
|
| |||||
|
Basic earnings per share |
|
1.12 |
|
0.77 |
|
0.52 |
|
0.69 |
|
0.78 |
| |||||
|
Diluted earnings per share |
|
1.11 |
|
0.76 |
|
0.50 |
|
0.68 |
|
0.77 |
| |||||
|
|
|
|
|
|
|
|
|
|
|
|
| |||||
|
Cash dividends paid per common share |
|
.40 |
|
.11 |
|
.025 |
|
— |
|
— |
| |||||
|
Consolidated Balance Sheet Data: |
|
|
|
|
|
|
|
|
|
|
| |||||
|
(in millions) |
|
|
|
|
|
|
|
|
|
|
| |||||
|
|
|
|
|
|
|
|
|
|
|
|
|
|
|
|
|
|
|
Working capital (a) |
|
$ |
58.2 |
|
$ |
51.9 |
|
$ |
43.6 |
|
$ |
36.0 |
|
$ |
36.6 |
|
|
|
|
|
|
|
|
|
|
|
|
|
| |||||
|
Total assets |
|
134.0 |
|
121.1 |
|
108.9 |
|
110.5 |
|
102.5 |
| |||||
|
|
|
|
|
|
|
|
|
|
|
|
| |||||
|
Total debt |
|
7.5 |
|
8.3 |
|
9.0 |
|
9.7 |
|
14.1 |
| |||||
|
|
|
|
|
|
|
|
|
|
|
|
| |||||
|
Stockholders’ equity |
|
101.7 |
|
88.6 |
|
81.0 |
|
74.1 |
|
67.2 |
| |||||
(a) During the fourth quarter of 2016, the Company reclassified its previously long-term debt to current ($7.5 million at December 31, 2016) as the Credit Agreement is for a period of five years ending on December 19, 2017.
ITEM 7. MANAGEMENT’S DISCUSSION AND ANALYSIS OF FINANCIAL CONDITION AND RESULTS OF OPERATIONS.
The following discussion should be read in conjunction with the consolidated financial statements and related notes thereto (see Note 1 “Nature of Operations and Accounting Policies”) located in Item 8 of this document, and pertain to continuing operations unless otherwise noted.
Company Overview
Supreme Industries, Inc., through its wholly-owned subsidiary, Supreme Corporation, is a leading manufacturer of specialized commercial vehicles including truck bodies and specialty vehicles. Established in 1974 and based in Goshen, Indiana, the Company has operations nationwide at seven manufacturing and component locations. In order to serve major geographic markets, these operations are positioned at strategic locations across the continental United States. The Company’s significant brand recognition has a 40-plus-year heritage and offers a complete line of multi-purpose truck bodies. Customers include national rental fleets, national and regional leasing companies, truck dealers and fleet operators. With shipments of more than 20,000 truck bodies annually, the Company offers extensive pool chassis programs with leading light-duty original equipment manufacturers.
Supreme’s extensive truck body product lines include dry-freight, service, refrigerated, and platform/stake bodies. Most of the Company’s products are attached to light-duty and medium-duty truck chassis. Supreme integrates a wide range of options into its truck bodies including liftgates, cargo-handling equipment, customized doors, special bumpers, ladder racks, and refrigeration equipment. Specialty vehicles are designed and customized to move money, dispatch a tactical force, or respond to an emergency to meet many proactive and security needs of its customers.
With a nationwide footprint with seven facilities, the Company’s flexible manufacturing systems support high volume fleets and low volume custom products. Since 2012, the Company has invested more than $25 million in equipment and facilities including building additions, redesigned plant layouts, lean initiatives, and the application of computer-aided design software.
The Company and its product offerings are affected by various risk factors which include, but are not limited to, economic conditions, interest rate fluctuations, volatility in the supply chain of chassis, and the availability of credit and financing to the Company, our vendors, dealers, or end users. The Company’s business is also affected by the availability and costs of certain raw materials that serve as significant components of its product offerings. The Company’s risk factors are disclosed in Item 1A “Risk Factors” of this document.
Results of Operations
Overview
Consolidated net sales for the year ended December 31, 2016 increased 7.4% to $299.0 million, compared with $278.4 million for the year ended December 26, 2015. The sales growth was the result of continued strong demand in both retail and fleet truck body markets when compared with the prior year, which more than offset a decline in sales of specialty vehicles and trolleys.
The sales order backlog at the end of 2016 totaled $83.4 million, down 15.0% compared with $98.1 million at the end of 2015. The decline in backlog was due to lower retail orders received during the fourth quarter of 2016 compared with the fourth quarter of 2015. However, retail orders increased 11% sequentially from the third quarter of 2016.
For the year ended December 31, 2016, gross profit increased by $12.9 million, or 23.8%, to $67.1 million as compared with $54.2 million for the year ended December 26, 2015. Gross margin, as a percentage of net sales improved to 22.4% for the year ended December 31, 2016, as compared with 19.5% for the year ended December 26, 2015. The increase was the result of a favorable product mix including a higher proportion of retail truck sales which typically yield a higher gross margin. Additionally, improved capacity utilization and the fixed nature of certain overhead costs that do not fluctuate with the change in the higher sales volume contributed to the gross margin percentage improvement. The gross margin was negatively impacted by costs and charges associated with a product recall, higher repairs and maintenance due to plant reconfigurations and increased group health insurance costs.
On May 6, 2016, the Company submitted a Defect Information Report to the United States National Highway Traffic Safety Administration (NHTSA) reporting a potential safety defect. Supreme has notified affected customers and directed them to take their vehicle to an approved service center for installation of an appropriate amperage in-line fuse and a warning decal at no charge to the
customer. The Company has estimated its cost for the recall would be no more than $0.5 million which was accrued during the first half of 2016. The balance of the accrual, net of payments and reserve adjustments, was $0.1 million at December 31, 2016.
During the fourth quarter of 2016, the Company consolidated its Rhode Island service center into the Pennsylvania manufacturing campus, which will allow the Company to improve support levels across the East Coast while reducing overhead costs.
Selling, general and administrative expenses increased by $3.2 million, or 9.2%, to $38.5 million for the year ended December 31, 2016 as compared with $35.3 million for the year ended December 26, 2015. The increase was primarily due to higher commission expense on the increased sales volume, higher wages and related costs as the Company added key personnel, annual merit increases and profit-based incentive compensation plans.
The Company recorded income tax expense of $9.4 million at an effective tax rate of 33.1% for the year ended December 31, 2016, compared with $6.3 million at an effective tax rate of 32.9% for the year ended December 26, 2015. The increase in the effective tax rate was due to a change in state apportioned income at different tax rates, additional reserves for uncertain tax positions and a valuation allowance for certain tax credit carryforwards and state net operating losses. Additionally, the rates differ from the federal statutory rate primarily because of varying state income tax rates and permanent federal income tax differences including benefits from a captive insurance company and the domestic manufacturer deduction.
Net income for the year ended December 31, 2016 was $19.0 million, or $1.11 per diluted share, compared with net income of $12.9 million, or $0.76 per diluted share, for the comparable period last year.
On May 11, 2016, the Company entered into an Asset Purchase Agreement for the sale of certain assets of the Company’s trolley business. Trolley products represented less than 2% of the Company’s consolidated net sales in 2016 and 2015. The after-tax impact on consolidated operations for both periods was immaterial. The first stage of the transaction closed on June 30, 2016 and the final stage of the transaction is scheduled to close in the first half of 2017. The Company anticipates no material gain or loss will be recognized on the sale. The sale of the trolley business does not meet the criteria of the Financial Accounting Standards Board (“FASB”) ASU 2014-8 (Reporting Discontinued Operations and Disclosure of Disposals of Components of an Entity) and will not be reported as discontinued operations.
Working capital increased to $58.2 million at December 31, 2016, compared with $51.9 million at December 26, 2015. The Company ended the year with $35.2 million in cash and cash equivalents and $7.2 million in total debt (net of bank amortization fees of $0.3 million). Stockholders’ equity increased to $101.7 million at year end, compared with $88.6 million at December 26, 2015. Supreme invested $3.7 million in facilities and equipment during 2016, compared with $3.9 million in 2015. Net cash provided by operating activities during the year ended December 31, 2016 totaled $29.3 million, compared with $9.8 million in 2015.
As we closed 2016, the Company’s strong performance was primarily the result of focusing resources on several key initiatives including:
· Supplementing our sales team to maximize regional and national account coverage;
· Deployment of lean manufacturing techniques to reduce waste and cycle times;
· Reconfiguration and consolidation of the Indiana manufacturing campus:
· Consolidation of the Rhode Island service center into our Pennsylvania manufacturing plant to improve efficiencies and;
· Divestiture of the trolley product line to focus resources on advancing our work truck strategy.
These initiatives are expected to allow continued growth and help us leverage our existing capacity. Additionally, Supreme’s strong financial position has allowed the Company to invest in growth initiatives while continuing to pay quarterly cash dividends to shareholders. The Board of Directors declared a special cash dividend of $0.265 (26 ½ cents) per common share during the fourth quarter as a means of returning a portion of excess cash flow to shareholders. This was in addition to an increase in the regular quarterly cash dividend of $0.035 (3 ½ cents) per common share announced earlier in the year, and reflects the Board’s assessment of our current financial condition, cash flow and business outlook. Future dividend payments will necessarily be subject to business conditions, the Company’s financial position, and requirements for working capital, property, plant and equipment expenditures, and other corporate purposes.
Comparison of 2016 with 2015
Net sales
Net sales for the year ended December 31, 2016 increased $20.5 million, or 7.4%, to $299.0 million as compared with $278.4 million for the year ended December 26, 2015.
Truck sales increased $23.4 million, or 8.9%, in 2016 due to higher truck sales of both retail and fleet customers. The delivery of high-quality products has allowed the Company to grow at a faster rate than our core industry resulting in top-line growth and improved profitability. Trolley sales decreased $1.2 million, or 22.0%, for the year ended December 31, 2016 when compared with the year ended December 26, 2015. With the divestiture of the trolley product line, the Company will utilize its existing resources to focus on our work truck strategy. Specialty vehicle sales for 2016 decreased $2.1 million, or 29.4%, compared with 2015. Using existing products and capabilities as a foundation and an improved lower cost structure, we continue to look for opportunities to expand product offerings and our customer base for our specialty vehicle product lines. Our fiberglass facility supplies fiberglass-reinforced plywood to Supreme for use in the production of certain truck bodies and also sells to third parties. The fiberglass product sales to third parties increased $0.5 million, or 14.0%, for the year ended December 31, 2016 compared with 2015.
Cost of sales and gross profit
Gross profit increased by $12.9 million, or 23.8%, to $67.1 million for the year ended December 31, 2016 as compared with $54.2 million for the year ended December 26, 2015. Gross margin, as a percentage of net sales improved to 22.4%, for the year ended December 31, 2016 as compared with 19.5% for the year ended December 26, 2015.
Material cost as a percentage of net sales improved by 2.5% for the year ended December 31, 2016 as compared with 2015. The improvement was the result of a favorable product mix as we experienced a higher proportion of retail truck sales which typically yield a higher gross margin. Direct labor as a percentage of net sales remained consistent for the year ended December 31, 2016 as compared with 2015. Manufacturing overhead as a percentage of net sales decreased by 0.4% for the year ended December 31, 2016 as compared with 2015 due to improved capacity utilization and the fixed nature of certain overhead costs that do not fluctuate with the higher sales volume for 2016. The gross margin improvement was negatively impacted by costs and charges associated with a product recall, higher repairs and maintenance due to plant rearrangements and increased group health insurance costs. Increased market demand for certain commodities can result in fluctuating costs of raw materials and other items we utilize in our production processes and, accordingly, the Company closely monitors major commodities to identify any raw material cost movements and attempts to pass them on to customers through price increases.
Delivery expense as a percentage of net sales decreased to 1.7% for the year ended December 31, 2016 as compared with 1.8% at December 26, 2015. The slight decrease was due to changes in both product mix and customer shipment requirements.
Selling, general and administrative expenses
Selling, general and administrative expenses increased by $3.2 million, or 9.2%, to $38.5 million for the year ended December 31, 2016 as compared with $35.3 million for the year ended December 26, 2015.
Selling expenses for the year ended December 31, 2016 increased $1.3 million to $12.1 million as compared with $10.8 million for the year ended December 26, 2015. As a percentage of net sales, selling expenses increased 0.2% for the year ended December 31, 2016 as compared with 2015. The dollar increase was primarily due to higher commission expense on the higher sales volume, higher sales wages and related costs as the Company added sales personnel in key regions, annual merit increases and higher original equipment manufacturing (OEM) marketing expenses.
General and administrative expenses for the year ended December 31, 2016 increased $1.9 million to $26.4 million as compared with $24.5 million for the year ended December 26, 2015. As a percentage of net sales, general and administrative expenses remained consistent at 8.8% of the net sales for the years ended December 31, 2016 and December 26, 2015. The dollar increase was mainly the result of profit-based incentive compensation plans, higher salary costs related to adding strategic new hires and annual merit increases.
Other income
For the year ended December 31, 2016, other income was $0.3 million, or 0.1% of net sales, as compared with other income of $0.4 million, or 0.1% of net sales, for the year ended December 26, 2015. Other income consisted of rental income, gain on the sale of assets, and other miscellaneous income received by the Company.
Interest expense
Interest expense was $0.5 million for the year ended December 31, 2016 as compared with $0.1 million for the year ended December 26, 2015. Interest expense includes bank debt and chassis interest on bailment pool chassis offset by interest support received from the chassis manufacturers. Interest expense for the year ended 2016 increased due to higher chassis interest expense as the Company carried elevated levels of bailment pool chassis to meet customer demand. During the year ended December 26, 2015, the Company received interest income from chassis manufacturers which more than offset chassis interest due to demand for pool chassis outpacing the supply. The interest income partially offset the combination of chassis interest expense and interest on bank debt. The effective interest rate on bank borrowings was 3.05% at 2016 year-end, and the Company was in compliance with all provisions of its Credit Agreement.
Income taxes
For the year ended December 31, 2016, the Company recorded income tax expense of $9.4 million at an effective tax rate of 33.1% compared with $6.3 million at an effective tax rate of 32.9% for the year ended December 26, 2015. The increase in the effective tax rate was due to a change in state apportioned income at different tax rates, additional reserves for uncertain tax positions and a valuation allowance for certain tax credit carryforwards and state net operating losses. Additionally, the rates differ from the federal statutory rate primarily because of varying state income tax rates and permanent federal income tax differences including benefits from a captive insurance company and the allowable domestic manufacturer deduction.
Net Income
Reported net income for the year ended December 31, 2016 was $19.0 million, or $1.11 per diluted share, compared with net income of $12.9 million, or $0.76 per diluted share in 2015.
Basic and diluted income (loss) per share
The following table presents basic and diluted income per share and the changes from period to period:
|
|
|
2016 |
|
2015 |
|
Change |
| |||
|
Earnings per share: |
|
|
|
|
|
|
| |||
|
Basic |
|
$ |
1.12 |
|
$ |
0.77 |
|
$ |
0.35 |
|
|
Diluted |
|
$ |
1.11 |
|
$ |
0.76 |
|
$ |
0.35 |
|
Comparison of 2015 with 2014
Net sales
Net sales for the year ended December 26, 2015 increased $42.1 million, or 17.8%, to $278.4 million as compared with $236.3 million for the year ended December 27, 2014.
Truck sales increased $49.6 million, or 23.4%, for the 2015 year due to higher truck sales of both retail and fleet customers. Trolley sales decreased $2.7 million, or 32.7%, for the year ended December 26, 2015 when compared with the year ended December 27, 2014. Specialty vehicle sales for 2015 decreased $6.5 million, or 47.1%, compared with 2014 due to overall lower order volume and the completion of a large US Department of State contract in 2014. Our fiberglass facility supplies fiberglass-reinforced plywood to Supreme for use in the production of certain truck bodies and also sells to third parties. The fiberglass product sales to third parties increased $1.7 million, or 81.6%, for the year ended December 26, 2015 compared with 2014.
Cost of sales and gross profit
Gross profit increased by $10.4 million, or 23.7%, to $54.2 million for the year ended December 26, 2015 as compared with $43.8 million for the year ended December 27, 2014. Gross margin as a percentage of net sales improved by 90 basis points to 19.5%, for the year ended December 26, 2015 as compared with 18.6% for the year ended December 27, 2014.
Material cost as a percentage of net sales increased by 0.8% for the year ended December 26, 2015 as compared with 2014. The increase in the material cost percentage was due in part to a change in product mix with a higher proportion of fleet shipments and liftgate sales which carry a higher material cost percentage. Conversely, the material cost percentage was favorably impacted by decreased prices of steel and aluminum late in the year as well as an increase in supplier discounts. Direct labor as a percentage of net sales improved by 1.4% for the year ended December 26, 2015 as compared with 2014. The decrease was the result of improved
utilization aided by higher production and sale levels and production of large quantities of similar fleet units. Additionally, the first quarter of 2014 was negatively impacted by labor inefficiencies resulting from shortages of light-duty chassis from a major chassis supplier and extreme weather conditions causing inefficiencies in the movement, scheduling and production of truck bodies. Manufacturing overhead as a percentage of net sales increased slightly by 0.1% for the year ended December 26, 2015 as compared with 2014 due to higher wages including annual merit increases, maintenance repairs and group health insurance costs partially offset by improved worker compensation expense in 2015 when compared with 2014.
Delivery expense as a percentage of net sales decreased to 1.8% for the year ended December 26, 2015 as compared with 2.2% at December 27, 2014 due to changes in both product mix and customer shipment requirements.
Selling, general and administrative expenses
Selling, general and administrative expenses increased by $4.0 million, or 12.6%, to $35.3 million for the year ended December 26, 2015 as compared with $31.3 million for the year ended December 27, 2014.
Selling expenses for the year ended December 26, 2015 increased $0.9 million to $10.8 million as compared with $9.9 million for the year ended December 27, 2014. As a percentage of net sales, selling expenses decreased 0.3% for the year ended December 26, 2015 as compared with 2014. The dollar increase was partially due to higher sales compensation and related costs as the Company enhanced its market presence by adding and upgrading sales personnel in key regions and annual merit increases. Additionally, sales commissions increased as a result of the higher sales volume.
General and administrative expenses for the year ended December 26, 2015 increased $3.1 million to $24.5 million as compared with $21.4 million for the year ended December 27, 2014. As a percentage of net sales, general and administrative expenses decreased 0.3% for the year ended December 26, 2015 as compared with 2014. The dollar increase was mainly the result of profit-based incentive plans, higher compensation costs related to annual merit increases and higher group health insurance claims.
Other income
For the year ended December 26, 2015, other income was $0.4 million, or 0.1% of net sales, as compared with other income of $0.5 million, or 0.2% of net sales, for the year ended December 27, 2014. Other income consisted of rental income, gain on the sale of assets, and other miscellaneous income received by the Company.
Interest expense
Interest expense was $0.1 million for the year ended December 26, 2015 as compared with $0.5 million for the year ended December 27, 2014. Interest expense includes bank debt and chassis interest on bailment pool chassis offset by interest support received from the chassis manufacturers. The effective interest rate on bank borrowings was 2.79% at 2015 year-end, and the Company was in compliance with all provisions of its Credit Agreement.
Income taxes
For the year ended December 26, 2015, the Company recorded income tax expense of $6.3 million at an effective tax rate of 32.9% compared with $4.0 million at an effective tax rate of 32.1% for the year ended December 27, 2014. The rates differ from the statutory rate primarily because of varying state income tax rates and permanent federal income tax differences including benefits from a captive insurance company and the allowable domestic manufacturer deduction.
Income from continuing operations
Income from continuing operations for year ended December 26, 2015 was $12.9 million, or $0.76 per diluted share, compared with income from continuing operations of $8.5 million, or $0.50 per diluted share, for the year ended December 27, 2014.
Discontinued operations
The Company decided to discontinue its shuttle bus operations on December 31, 2013 and on February 28, 2014, the Company entered into an agreement for the sale of certain assets of those operations. Accordingly, the Company classified the results as discontinued operations. For the year ended December 27, 2014, the after-tax loss from discontinued operations was $1.6 million. There was no financial impact of these operations on the 2015 results.
Net Income
Reported net income for the year ended December 26, 2015 was $12.9 million, or $0.76 per diluted share, compared with net income of $6.9 million, or $0.41 per diluted share in 2014.
Basic and diluted income (loss) per share
The following table presents basic and diluted income (loss) per share and the changes from period to period:
|
|
|
2015 |
|
2014 |
|
Change |
| |||
|
Basic income (loss) per share: |
|
|
|
|
|
|
| |||
|
Income from continuing operations |
|
$ |
0.77 |
|
$ |
0.52 |
|
$ |
0.25 |
|
|
Loss from discontinued operations |
|
— |
|
(0.10 |
) |
0.10 |
| |||
|
Net income per basic share |
|
$ |
0.77 |
|
$ |
0.42 |
|
$ |
0.35 |
|
|
|
|
|
|
|
|
|
| |||
|
Diluted income (loss) per share: |
|
|
|
|
|
|
| |||
|
Income from continuing operations |
|
$ |
0.76 |
|
$ |
0.50 |
|
$ |
0.26 |
|
|
Loss from discontinued operations |
|
— |
|
(0.09 |
) |
0.09 |
| |||
|
Net income per diluted share |
|
$ |
0.76 |
|
$ |
0.41 |
|
$ |
0.35 |
|
Liquidity and Capital Resources
Cash Flows
The Company’s primary sources of liquidity have been cash flows from operating activities and borrowings under its Credit Agreement. Principal uses of cash have been to support working capital needs, fund capital expenditures, pay cash dividends, and meet debt service requirements.
Operating activities
Cash flows from operations represent the net income earned in the reported periods adjusted for non-cash charges and changes in operating assets and liabilities. Net cash from operating activities totaled $29.3 million for the year ended December 31, 2016 as compared with $9.8 million for the year ended December 26, 2015. Net income was $19.0 million in 2016 compared with $12.9 million in 2015. Changes in operating assets and liabilities were impacted by a $4.9 million decrease in accounts receivable due to lower sales in the fourth quarter of 2016 as compared with the same period in 2015. Inventories decreased $0.7 million due to a lower year-over-year sales order backlog. These increases in cash from operating activities were partially offset by a $1.1 million decrease in trade accounts payable due to the lower inventories.
Net cash from operating activities totaled $9.8 million for the year ended December 26, 2015 as compared with $9.5 million for the year ended December 27, 2014. Net income was $12.9 million in 2015 compared with $6.9 million in 2014. Changes in operating assets and liabilities were impacted by a $7.1 million increase in accounts receivable due to increased sales, and a $2.3 million increase in inventories caused by the year-over-year increase in sales order backlog. Despite the increase in inventories, trade accounts payable decreased by $1.0 million as a result of the acceleration of vendor payments to take advantage of discount payment terms. These uses of cash flow were partially offset by a $1.0 million return of cash deposits from the Company’s former workers compensation insurance carrier as a result of lower collateral requirements associated with having fewer and lower open claims.
Investing activities
Cash used by investing activities was $3.7 million for the year ended December 31, 2016 as compared with $2.1 million for the year ended December 26, 2015. During 2016, the Company’s capital expenditures totaled $3.7 million which predominantly related to property and plant improvements.
Cash used by investing activities was $2.1 million for the year ended December 26, 2015 as compared with $1.1 million for the year ended December 27, 2014. During 2015, the Company’s capital expenditures totaled $3.9 million and included facilities and equipment to enhance manufacturing efficiencies. Investing activities in 2015 provided cash of $1.0 million resulting from the routine sale of investments by the Company’s captive insurance subsidiary. Additionally, the Company received $0.9 million from the sale of two smaller facilities including a facility in Missouri, which was being leased to an unrelated party, and an idle facility in Indiana.
Financing activities
Financing activities used $7.7 million of cash for the year ended December 31, 2016 as compared with cash used of $2.0 million for the year ended December 26, 2015. During 2016, the Company used $6.8 million to pay cash dividends to its shareholders, and used $0.8 million to make scheduled quarterly principal payments on its outstanding term loan.
Financing activities used $2.0 million of cash for the year ended December 26, 2015 as compared with cash used of $0.7 million for the year ended December 27, 2014. During 2015, the Company used $1.8 million to pay cash dividends to its shareholders, and used $0.7 million to make scheduled quarterly principal payments on its outstanding term loan. These payments were partially offset by $0.6 million received from the exercise of stock options.
Capital Resources
On December 19, 2012, the Company entered into an Amended and Restated Credit Agreement (the “Credit Agreement”) with Wells Fargo Bank, National Association (“Wells Fargo”). Under the terms of the Credit Agreement, Wells Fargo agreed to provide to the Company a credit facility of up to $45.0 million consisting of a revolving credit facility, a term loan facility, and a letter of credit facility. The Credit Agreement is for a period of five years ending on December 19, 2017. The Company had unused credit capacity of $35.0 million at December 31, 2016. Interest on outstanding borrowings under the Credit Agreement is based on Wells Fargo’s prime rate or LIBOR depending on the pricing option selected and the Company’s leverage ratio (as defined in the Credit Agreement) resulting in an effective interest rate of 3.05% at December 31, 2016. Pursuant to the Credit Agreement, the financial covenants include a consolidated total leverage ratio, a consolidated fixed charge coverage ratio, and a limitation on annual capital expenditures. As of December 31, 2016 and December 26, 2015, the Company was in compliance with all three financial covenants. On August 27, 2014, the Company entered into an amendment of the Credit Agreement. The amendment changed the cash dividend limit from a percentage of consolidated net income for the immediately preceding fiscal quarter to a flat per fiscal quarter limit of $0.03 per share of capital stock then issued and outstanding. On November 19, 2015, the Company entered into an amendment of the Credit Agreement. The amendment permitted the Company to issue a special dividend of up to $6.5 million on or about January 4, 2016 and changed the cash dividend limit from a flat per fiscal quarter limit of $0.03 per share of capital stock then issued and outstanding to an amount paid in any fiscal quarter not to exceed an amount equal to 50% of the consolidated net income for the immediately preceding fiscal quarter. On November 16, 2016, the Company entered into an amendment of the Credit Agreement. The amendment permitted the Company to issue a special dividend of up to $6.5 million on or about January 2, 2017.
Revolving Credit Facility
The revolving credit facility provides for borrowings of up to $35.0 million. The revolving credit facility bears interest at (i) LIBOR plus a margin which varies from 1.50% to 2.50% based upon a leverage ratio of total indebtedness to trailing four quarter EBITDA or (ii) the higher of (a) the prime rate and (b) the federal funds rate plus 0.50% plus a margin which varies from 0.50% to 1.50% based upon the debt to EBITDA leverage ratio. The revolving credit facility also requires a quarterly commitment fee ranging from 0.20% to 0.50% per annum depending on the Company’s financial ratios and based upon the average daily unused portion. As of December 31, 2016, and December 26, 2015, there were no borrowings against the revolving credit facility.
Term Loan Facility
The term loan facility provides for borrowings of up to $10.0 million. Effective April 29, 2013, the Company and Wells Fargo entered into a $10.0 million term loan by converting $10.0 million of revolving credit facility borrowings to term debt. The term loan is secured by real estate and improvements, payable in quarterly installments of $166,667 commencing on June 28, 2013, plus interest at prime rate or LIBOR, with the remaining balance due upon maturity on December 19, 2017. As of December 31, 2016, the outstanding balance under the term loan facility was $7.5 million.
On August 9, 2013, the Company entered into an interest rate swap agreement for a portion of the term loan with a notional amount of $5.0 million. The interest rate swap agreement provides for a 3.1% fixed interest rate and matures on December 19, 2017. The Company designated this swap agreement as a cash flow hedge on its variable rate debt and records the fair value of the swap agreement as an asset or liability on the balance sheet with changes in fair value recognized in other comprehensive income (loss).
Letter of Credit Facility
Outstanding letters of credit, related to the Company’s workers’ compensation insurance policies, reduce available borrowings under the Credit Agreement. During 2014, the Company replaced all outstanding letters of credit with cash deposits with its insurance carriers. As of December 31, 2016 and December 26, 2015, cash deposits with insurance carriers totaled $1.9 million and $2.3 million, respectively, and are included in other current assets on the consolidated balance sheets.
Summary of Liquidity and Capital Resources
The Company’s primary capital needs are for working capital demands, to meet its debt service obligations, and to finance capital expenditure requirements. Cash generated from operations, and borrowings available under the Credit Agreement, are expected to be sufficient to finance the known and/or foreseeable liquidity and capital needs of the Company for at least the next 12 months based on our current cash flow budgets and forecasts of our liquidity needs.
Contractual Obligations
The Company’s fixed, noncancelable obligations as of December 31, 2016 were as follows:
|
|
|
Payments due by period |
| |||||||||||||
|
|
|
|
|
Less than |
|
1-3 |
|
3-5 |
|
More than |
| |||||
|
|
|
Total |
|
1 Year |
|
Years |
|
Years |
|
5 Years |
| |||||
|
Debt (a) |
|
$ |
7,500,000 |
|
$ |
7,500,000 |
|
$ |
— |
|
$ |
— |
|
$ |
— |
|
|
Interest payments on debt (b) |
|
283,888 |
|
283,888 |
|
— |
|
— |
|
— |
| |||||
|
Operating leases (c) |
|
221,472 |
|
111,364 |
|
64,826 |
|
45,282 |
|
— |
| |||||
|
Total |
|
$ |
8,005,360 |
|
$ |
7,895,252 |
|
$ |
64,826 |
|
$ |
45,282 |
|
$ |
— |
|
(a) Amounts are included on the Consolidated Balance Sheets. See Note 6 of the Notes to Consolidated Financial Statements for additional information regarding debt and related matters.
(b) Scheduled interest payments reflect expense related to debt obligations and are calculated based on interest rates in effect at December 31, 2016: fixed rate obligations under an interest rate swap — 3.10%, and LIBOR based obligations — 2.96%.
(c) See Note 10 of the Notes to Consolidated Financial Statements for additional information regarding property leases.
Critical Accounting Policies and Estimates
Management’s discussion and analysis of its financial position and results of operations are based upon the Company’s consolidated financial statements which have been prepared in accordance with accounting principles generally accepted in the United States of America. The preparation of these financial statements requires management to make estimates and judgments that affect the reported amounts of assets, liabilities, revenues, expenses, and related disclosure of contingent assets and liabilities. The Company’s significant accounting policies are discussed in Note 1 of the Notes to Consolidated Financial Statements. In management’s opinion, the Company’s critical accounting policies include revenue recognition, inventory reserves, fair value of assets held for sale, accrued insurance, accrued warranty and unrecognized tax positions.
Revenue Recognition - The Company generally recognizes revenue when products are shipped to the customer. Revenue on certain customer requested bill and hold transactions is recognized after the customer is notified that the products have been completed according to customer specifications, have passed all of the Company’s quality control inspections, and are ready for delivery based on established delivery terms.
Inventory Reserves - The Company makes estimates regarding the future use of raw materials and finished products and provides for obsolete or slow-moving inventories. Periodically, management reviews inventories and adjusts the excess and obsolete reserves based on product life cycles, product demand, and/or market conditions. In addition, the Company reserves for possible losses due to production reporting errors based upon monthly production. We conduct semi-annual physical inventories at a majority of our locations and schedule them in a manner that provides coverage in each of our calendar quarters.
Fair Value of Assets Held for Sale - The Company evaluates the carrying value of property held for sale whenever events or changes in circumstances indicate that a property’s carrying amount may not be recoverable. Such circumstances could include, but are not limited to: (1) a significant decrease in the market value of an asset, or (2) a significant adverse change in the extent or manner in which an asset is used. The Company measures the carrying amount of the asset against the estimated undiscounted future cash flows associated with it. Should the sum of the expected future net cash flows be less than the carrying value of the asset being evaluated, an impairment loss would be recognized. The impairment loss would be calculated as the amount by which the carrying value of the asset exceeds its fair value. The Company estimates the fair value of its properties held for sale based on appraisals and other current market data.
Accrued Insurance - The Company has a self-insured retention against product liability claims with insurance coverage over and above the retention. The Company is also self-insured for a portion of its employee medical benefits and workers’ compensation. Product liability claims are routinely reviewed by the Company’s insurance carrier, and management routinely reviews other self-insurance risks for purposes of establishing ultimate loss estimates. In addition, management must determine estimated liability for claims incurred but not reported. Such estimates, and any subsequent changes in estimates, may result in adjustments to our operating results in the future.
Accrued Warranty - The Company provides limited warranties for periods of up to five years from the date of retail sale. Estimated warranty costs are accrued at the time of sale and are based upon historical experience.
Unrecognized Tax Positions - The calculation of the Company’s tax liabilities involves dealing with uncertainties in the application of complex tax laws and regulations in a multitude of jurisdictions. ASC 740 states that a tax benefit from an uncertain tax position may be recognized when it is more likely than not that the position will be sustained upon examination, including resolutions of any related appeals or litigation processes, on the basis of the technical merits. We record unrecognized tax benefits as liabilities in accordance with ASC 740 and adjust these liabilities when our judgment changes as a result of the evaluation of new information not previously available. Because of the complexity of some of these uncertainties, the ultimate resolution may result in a payment that is different from our current estimate of the unrecognized tax benefit liabilities. These differences will be reflected as increases or decreases to income tax expense in the period in which new information is available.
Forward-Looking Statements
This report contains forward-looking statements within the meaning of Section 27A of the Securities Act of 1933, as amended, and Section 21E of the Securities Exchange Act of 1934, as amended, other than historical facts, which reflect the view of management with respect to future events. When used in this report, words such as “believe,” “expect,” “anticipate,” “estimate,” “intend,” “may,” “plan,” “will,” “could,” and similar expressions, as they relate to the Company or its plans or operations, identify forward-looking statements. Such forward-looking statements are based on assumptions made by, and information currently available to, management. Although management believes that the expectations reflected in such forward-looking statements are reasonable, it can give no assurance that the expectations reflected in such forward-looking statements are reasonable, and it can give no assurance that such expectations will prove to be correct. Important factors that could cause actual results to differ materially from such expectations include, without limitation, an economic slowdown in the specialized vehicle industry, restrictions on financing imposed by the Company’s lender(s), limitations on the availability of chassis on which the Company’s products are dependent, availability of raw materials, raw material cost increases, interest rate increases, a change in the number of vehicles subject to product recalls, changes in the costs of implementing the recalls, actions by NHTSA, including fines and / or penalties, or limitations on the availability of materials used to implement the recall. Furthermore, the Company can provide no assurance that such raw material cost increases can be passed on to its customers through implementation of price increases for the Company’s products. The forward-looking statements contained herein reflect the current view of management with respect to future events and are subject to those factors and other risks, uncertainties, and assumptions relating to the operations, results of operations, cash flows, and financial position of the Company. The Company assumes no obligation to update the forward-looking statements or to update the reasons actual results could differ from those contemplated by such forward-looking statements.
ITEM 7A. QUANTITATIVE AND QUALITATIVE DISCLOSURES ABOUT MARKET RISK.
In the normal course of business, the Company is exposed to fluctuations in interest rates that can impact the cost of investing, financing, and operating activities. The Company’s primary risk exposure results from changes in short-term interest rates. In an effort to manage risk exposures, the Company strives to achieve an acceptable balance between fixed and floating rate debt positions. The Company’s Credit Agreement is floating rate debt and bears interest at the bank’s prime rate or LIBOR plus certain basis points depending on the pricing option selected and the Company’s leverage ratio. On August 9, 2013, the Company entered into an interest rate swap agreement for a portion of its term loan with a notional amount of $5.0 million (See Note 6 - Long-Term Debt). The interest rate swap agreement is a contract to exchange floating rate for fixed rate interest payments over the life of the interest rate swap agreement and is used to measure interest to be paid or received and does not represent the amount of exposure of credit loss. The differential paid or received under the interest rate swap agreement is recognized as an adjustment to interest expense. At December 31, 2016, our total debt obligations under the Credit Agreement were under either an interest rate swap agreement at a fixed interest rate or LIBOR-based interest rates. A 100 basis point increase in the underlying LIBOR rates would result in an additional annual interest cost that would not be significant, assuming average related term debt subject to variable rates of $2.5 million, which was the amount of related borrowings at December 31, 2016 subject to variable rates.
ITEM 8. FINANCIAL STATEMENTS AND SUPPLEMENTARY DATA.
Index to Financial Statements
|
|
Page |
|
1. Financial Statements: |
|
|
|
|
|
Report of Crowe Horwath LLP, Independent Registered Public Accounting Firm |
21 |
|
|
|
|
Consolidated Balance Sheets as of December 31, 2016 and December 26, 2015 |
22 |
|
|
|
|
23 | |
|
|
|
|
24 | |
|
|
|
|
25 | |
|
|
|
|
26 | |
|
|
|
|
2. Financial Statement Schedule: |
|
|
|
|
|
40 | |
|
|
|
|
All other schedules are omitted because they are not applicable. |
|
|
|
|
|
3. Supplementary Data |
|
|
|
|
|
40 |
REPORT OF INDEPENDENT REGISTERED PUBLIC ACCOUNTING FIRM
To the Board of Directors and Stockholders of
Supreme Industries, Inc.
We have audited the accompanying consolidated balance sheets of Supreme Industries, Inc. and Subsidiaries (the “Company”) as of December 31, 2016 and December 26, 2015, and the related consolidated statements of comprehensive income, stockholders’ equity, and cash flows for each of the years in the three-year period ended December 31, 2016. We also have audited the consolidated financial statement schedule, Schedule II — Valuation and Qualifying Accounts, and the Company’s internal control over financial reporting as of December 31, 2016, based on criteria established in the 2013 Internal Control — Integrated Framework issued by the Committee of Sponsoring Organizations of the Treadway Commission (COSO). The Company’s management is responsible for these consolidated financial statements and consolidated financial statement schedule, for maintaining effective internal control over financial reporting, and for its assessment of the effectiveness of internal control over financial reporting, included in the accompanying “Management’s Report on Internal Control Over Financial Reporting”. Our responsibility is to express an opinion on these consolidated financial statements and consolidated financial statement schedule and an opinion on the Company’s internal control over financial reporting based on our audits.
We conducted our audits in accordance with the standards of the Public Company Accounting Oversight Board (United States). Those standards require that we plan and perform the audits to obtain reasonable assurance about whether the consolidated financial statements are free of material misstatement and whether effective internal control over financial reporting was maintained in all material respects. Our audits of the consolidated financial statements included examining, on a test basis, evidence supporting the amounts and disclosures in the consolidated financial statements, assessing the accounting principles used and significant estimates made by management, and evaluating the overall consolidated financial statement presentation. Our audit of internal control over financial reporting included obtaining an understanding of internal control over financial reporting, assessing the risk that a material weakness exists, and testing and evaluating the design and operating effectiveness of internal control based on the assessed risk. Our audits also included performing such other procedures as we considered necessary in the circumstances. We believe that our audits provide a reasonable basis for our opinions.
A company’s internal control over financial reporting is a process designed to provide reasonable assurance regarding the reliability of financial reporting and the preparation of consolidated financial statements for external purposes in accordance with generally accepted accounting principles. A company’s internal control over financial reporting includes those policies and procedures that (1) pertain to the maintenance of records that, in reasonable detail, accurately and fairly reflect the transactions and dispositions of the assets of the company; (2) provide reasonable assurance that transactions are recorded as necessary to permit preparation of consolidated financial statements in accordance with generally accepted accounting principles, and that receipts and expenditures of the company are being made only in accordance with authorizations of management and directors of the company; and (3) provide reasonable assurance regarding prevention or timely detection of unauthorized acquisition, use, or disposition of the company’s assets that could have a material effect on the consolidated financial statements.
Because of its inherent limitations, internal control over financial reporting may not prevent or detect misstatements. Also, projections of any evaluation of effectiveness to future periods are subject to the risk that controls may become inadequate because of changes in conditions, or that the degree of compliance with the policies or procedures may deteriorate.
In our opinion, the consolidated financial statements referred to above present fairly, in all material respects, the financial position of Supreme Industries, Inc. and Subsidiaries as of December 31, 2016 and December 26, 2015, and the results of their operations and their cash flows for each of the years in the three-year period ended December 31, 2016 in conformity with accounting principles generally accepted in the United States of America. Also in our opinion, the related consolidated financial statement schedule, when considered in relation to the basic consolidated financial statements taken as a whole, presents fairly, in all material respects, the information set forth therein. Also in our opinion, the Company maintained, in all material respects, effective internal control over financial reporting as of December 31, 2016, based on criteria established in the 2013 Internal Control — Integrated Framework issued by COSO.
|
|
/s/ Crowe Horwath LLP |
|
|
|
|
|
|
|
South Bend, Indiana |
|
|
March 3, 2017 |
|
Supreme Industries, Inc. and Subsidiaries
December 31, 2016 and December 26, 2015
|
|
|
2016 |
|
2015 |
| ||
|
ASSETS |
|
|
|
|
| ||
|
Current assets: |
|
|
|
|
| ||
|
Cash and cash equivalents |
|
$ |
35,222,620 |
|
$ |
17,247,891 |
|
|
Investments |
|
3,003,002 |
|
2,898,763 |
| ||
|
Accounts receivable, net of allowance for doubtful accounts of $50,000 in 2016 and $52,000 in 2015 |
|
20,106,253 |
|
25,006,551 |
| ||
|
Refundable income taxes |
|
310,412 |
|
235,071 |
| ||
|
Inventories |
|
24,245,322 |
|
24,992,743 |
| ||
|
Assets held for sale |
|
1,734,296 |
|
722,272 |
| ||
|
Other current assets |
|
3,599,446 |
|
3,830,243 |
| ||
|
Total current assets |
|
88,221,351 |
|
74,933,534 |
| ||
|
Property, plant and equipment, net |
|
45,747,933 |
|
46,186,364 |
| ||
|
Total assets |
|
$ |
133,969,284 |
|
$ |
121,119,898 |
|
|
|
|
|
|
|
| ||
|
LIABILITIES AND STOCKHOLDERS’ EQUITY |
|
|
|
|
| ||
|
|
|
|
|
|
| ||
|
Current liabilities: |
|
|
|
|
| ||
|
Current maturities of long-term debt |
|
$ |
7,195,105 |
|
$ |
361,748 |
|
|
Trade accounts payable |
|
6,803,769 |
|
7,950,620 |
| ||
|
Accrued wages and benefits |
|
3,421,106 |
|
3,670,359 |
| ||
|
Accrued self-insurance |
|
2,034,313 |
|
2,063,996 |
| ||
|
Customer deposits |
|
1,083,587 |
|
425,039 |
| ||
|
Accrued warranty |
|
1,226,000 |
|
1,055,000 |
| ||
|
Accrued income taxes |
|
1,146,101 |
|
911,000 |
| ||
|
Dividends payable |
|
5,124,130 |
|
5,019,785 |
| ||
|
Other accrued liabilities |
|
2,022,046 |
|
1,573,344 |
| ||
|
Total current liabilities |
|
30,056,157 |
|
23,030,891 |
| ||
|
Long-term debt |
|
— |
|
7,361,770 |
| ||
|
Deferred income taxes |
|
2,181,778 |
|
2,097,041 |
| ||
|
Other long-term liabilities |
|
— |
|
41,767 |
| ||
|
Total liabilities |
|
32,237,935 |
|
32,531,469 |
| ||
|
Commitments and contingencies (Note 10) |
|
|
|
|
| ||
|
Stockholders’ equity: |
|
|
|
|
| ||
|
Preferred Stock, $1 par value; authorized 1,000,000 shares, none issued |
|
— |
|
— |
| ||
|
Class A Common Stock, $.10 par value; authorized 25,000,000 shares, issued 16,939,634 shares in 2016 and 16,626,981 in 2015 |
|
1,693,963 |
|
1,662,698 |
| ||
|
Class B Common Stock, convertible into Class A Common Stock on a one-for-one basis, $.10 par value; authorized 5,000,000 shares, issued 1,688,111 shares in 2016 and 1,742,482 in 2015 |
|
168,811 |
|
174,248 |
| ||
|
Additional paid-in capital |
|
74,980,379 |
|
73,852,165 |
| ||
|
Retained earnings |
|
39,952,582 |
|
27,783,871 |
| ||
|
Treasury stock, Class A Common Stock, at cost, 1,740,152 shares in 2016 and 1,711,011 in 2015 |
|
(14,970,216 |
) |
(14,701,039 |
) | ||
|
Accumulated other comprehensive loss |
|
(94,170 |
) |
(183,514 |
) | ||
|
Total stockholders’ equity |
|
101,731,349 |
|
88,588,429 |
| ||
|
Total liabilities and stockholders’ equity |
|
$ |
133,969,284 |
|
$ |
121,119,898 |
|
See accompanying notes to consolidated financial statements.
Supreme Industries, Inc. and Subsidiaries
Consolidated Statements of Comprehensive Income
for the years ended December 31, 2016, December 26, 2015, and December 27, 2014
|
|
|
2016 |
|
2015 |
|
2014 |
| |||
|
|
|
|
|
|
|
|
| |||
|
Net sales |
|
$ |
298,971,665 |
|
$ |
278,424,799 |
|
$ |
236,308,920 |
|
|
Cost of sales |
|
231,860,105 |
|
224,202,596 |
|
192,462,081 |
| |||
|
Gross profit |
|
67,111,560 |
|
54,222,203 |
|
43,846,839 |
| |||
|
|
|
|
|
|
|
|
| |||
|
Selling, general and administrative expenses |
|
38,542,639 |
|
35,306,651 |
|
31,344,204 |
| |||
|
Other income |
|
(334,601 |
) |
(368,064 |
) |
(493,885 |
) | |||
|
Operating income |
|
28,903,522 |
|
19,283,616 |
|
12,996,520 |
| |||
|
|
|
|
|
|
|
|
| |||
|
Interest expense |
|
459,353 |
|
88,972 |
|
525,911 |
| |||
|
Income from continuing operations before income taxes |
|
28,444,169 |
|
19,194,644 |
|
12,470,609 |
| |||
|
|
|
|
|
|
|
|
| |||
|
Income tax expense |
|
9,406,831 |
|
6,319,375 |
|
4,000,655 |
| |||
|
Income from continuing operations |
|
19,037,338 |
|
12,875,269 |
|
8,469,954 |
| |||
|
|
|
|
|
|
|
|
| |||
|
Discontinued operations |
|
|
|
|
|
|
| |||
|
Gain on sale of discontinued operations, net of tax |
|
— |
|
— |
|
87,036 |
| |||
|
Operating loss from discontinued operations, net of tax |
|
— |
|
— |
|
(1,654,459 |
) | |||
|
Loss from discontinued operations, net of tax |
|
— |
|
— |
|
(1,567,423 |
) | |||
|
Net income |
|
19,037,338 |
|
12,875,269 |
|
6,902,531 |
| |||
|
|
|
|
|
|
|
|
| |||
|
Unrealized income (loss) on hedge activity, net of tax |
|
12,249 |
|
(2,459 |
) |
(5,444 |
) | |||
|
Unrealized holding income (loss) on investments, net of tax |
|
77,095 |
|
(115,482 |
) |
(17,023 |
) | |||
|
Other comprehensive income (loss) |
|
89,344 |
|
(117,941 |
) |
(22,467 |
) | |||
|
Comprehensive income |
|
$ |
19,126,682 |
|
$ |
12,757,328 |
|
$ |
6,880,064 |
|
|
|
|
|
|
|
|
|
| |||
|
Basic income (loss) per share: |
|
|
|
|
|
|
| |||
|
Income from continuing operations |
|
$ |
1.12 |
|
$ |
0.77 |
|
$ |
0.52 |
|
|
Loss from discontinued operations |
|
— |
|
— |
|
(0.10 |
) | |||
|
Net income |
|
$ |
1.12 |
|
$ |
0.77 |
|
$ |
0.42 |
|
|
|
|
|
|
|
|
|
| |||
|
Diluted income (loss) per share: |
|
|
|
|
|
|
| |||
|
Income from continuing operations |
|
$ |
1.11 |
|
$ |
0.76 |
|
$ |
0.50 |
|
|
Loss from discontinued operations |
|
— |
|
— |
|
(0.09 |
) | |||
|
Net income |
|
$ |
1.11 |
|
$ |
0.76 |
|
$ |
0.41 |
|
|
|
|
|
|
|
|
|
| |||
|
Shares used in the computation of income (loss) per share: |
|
|
|
|
|
|
| |||
|
Basic |
|
16,990,210 |
|
16,682,437 |
|
16,350,561 |
| |||
|
Diluted |
|
17,094,977 |
|
16,997,365 |
|
16,744,066 |
| |||
See accompanying notes to consolidated financial statements.
Supreme Industries, Inc. and Subsidiaries
Consolidated Statements of Stockholders’ Equity
for the years ended December 31, 2016, December 26, 2015, and December 27, 2014
|
|
|
|
|
|
|
|
|
|
|
|
|
|
|
|
|
Accumulated |
|
|
| |||||||
|
|
|
|
|
|
|
|
|
|
|
|
|
|
|
|
|
Other |
|
Total |
| |||||||
|
|
|
Class A Common Stock |
|
Class B Common Stock |
|
Additional |
|
Retained |
|
Treasury |
|
Comprehensive |
|
Stockholders’ |
| |||||||||||
|
|
|
Shares |
|
Amount |
|
Shares |
|
Amount |
|
Paid-In Capital |
|
Earnings |
|
Stock |
|
Income (Loss) |
|
Equity |
| |||||||
|
Balance, December 29, 2013 |
|
16,263,322 |
|
$ |
1,626,332 |
|
1,771,949 |
|
$ |
177,195 |
|
$ |
72,719,592 |
|
$ |
15,268,209 |
|
$ |
(15,668,055 |
) |
$ |
(43,106 |
) |
$ |
74,080,167 |
|
|
Net income |
|
— |
|
— |
|
— |
|
— |
|
— |
|
6,902,531 |
|
— |
|
— |
|
6,902,531 |
| |||||||
|
Unrealized loss on hedge activity, net of tax |
|
— |
|
— |
|
— |
|
— |
|
— |
|
— |
|
— |
|
(5,444 |
) |
(5,444 |
) | |||||||
|
Unrealized holding loss on investments, net of tax |
|
— |
|
— |
|
— |
|
— |
|
— |
|
— |
|
— |
|
(17,023 |
) |
(17,023 |
) | |||||||
|
Cash dividends declared |
|
— |
|
— |
|
— |
|
— |
|
— |
|
(826,805 |
) |
— |
|
— |
|
(826,805 |
) | |||||||
|
Exercise of stock options |
|
164,382 |
|
16,438 |
|
— |
|
— |
|
394,264 |
|
— |
|
— |
|
— |
|
410,702 |
| |||||||
|
Issuance of restricted stock |
|
48,594 |
|
4,859 |
|
— |
|
— |
|
304,668 |
|
— |
|
— |
|
— |
|
309,527 |
| |||||||
|
Stock-based compensation |
|
25,998 |
|
2,600 |
|
— |
|
— |
|
176,150 |
|
— |
|
— |
|
— |
|
178,750 |
| |||||||
|
Other |
|
(177,518 |
) |
(17,751 |
) |
— |
|
— |
|
(1,106,573 |
) |
— |
|
1,124,324 |
|
— |
|
— |
| |||||||
|
Balance, December 27, 2014 |
|
16,324,778 |
|
$ |
1,632,478 |
|
1,771,949 |
|
$ |
177,195 |
|
$ |
72,488,101 |
|
$ |
21,343,935 |
|
$ |
(14,543,731 |
) |
$ |
(65,573 |
) |
$ |
81,032,405 |
|
|
Net income |
|
— |
|
— |
|
— |
|
— |
|
— |
|
12,875,269 |
|
— |
|
— |
|
12,875,269 |
| |||||||
|
Unrealized loss on hedge activity, net of tax |
|
— |
|
— |
|
— |
|
— |
|
— |
|
— |
|
— |
|
(2,459 |
) |
(2,459 |
) | |||||||
|
Unrealized holding loss on investments, net of tax |
|
— |
|
— |
|
— |
|
— |
|
— |
|
— |
|
— |
|
(115,482 |
) |
(115,482 |
) | |||||||
|
Cash dividends declared |
|
— |
|
— |
|
— |
|
— |
|
— |
|
(6,435,333 |
) |
— |
|
— |
|
(6,435,333 |
) | |||||||
|
Exercise of stock options |
|
179,434 |
|
17,943 |
|
— |
|
— |
|
532,141 |
|
— |
|
— |
|
— |
|
550,084 |
| |||||||
|
Excess tax benefits from stock-based compensation |
|
— |
|
— |
|
— |
|
— |
|
63,030 |
|
— |
|
— |
|
— |
|
63,030 |
| |||||||
|
Issuance of restricted stock |
|
68,893 |
|
6,889 |
|
— |
|
— |
|
578,834 |
|
— |
|
— |
|
— |
|
585,723 |
| |||||||
|
Stock-based compensation |
|
24,409 |
|
2,441 |
|
— |
|
— |
|
190,059 |
|
— |
|
— |
|
— |
|
192,500 |
| |||||||
|
Conversion of Class B shares to Class A shares |
|
29,467 |
|
2,947 |
|
(29,467 |
) |
(2,947 |
) |
— |
|
— |
|
— |
|
— |
|
— |
| |||||||
|
Restricted stock received to satisfy tax obligations |
|
— |
|
— |
|
— |
|
— |
|
— |
|
— |
|
(157,308 |
) |
— |
|
(157,308 |
) | |||||||
|
Balance, December 26, 2015 |
|
16,626,981 |
|
$ |
1,662,698 |
|
1,742,482 |
|
$ |
174,248 |
|
$ |
73,852,165 |
|
$ |
27,783,871 |
|
$ |
(14,701,039 |
) |
$ |
(183,514 |
) |
$ |
88,588,429 |
|
|
Net income |
|
— |
|
— |
|
— |
|
— |
|
— |
|
19,037,338 |
|
— |
|
— |
|
19,037,338 |
| |||||||
|
Unrealized gain on hedge activity, net of tax |
|
— |
|
— |
|
— |
|
— |
|
— |
|
— |
|
— |
|
12,249 |
|
12,249 |
| |||||||
|
Unrealized holding gain on investments, net of tax |
|
— |
|
— |
|
— |
|
— |
|
— |
|
— |
|
— |
|
77,095 |
|
77,095 |
| |||||||
|
Cash dividends declared |
|
— |
|
— |
|
— |
|
— |
|
— |
|
(6,868,627 |
) |
— |
|
— |
|
(6,868,627 |
) | |||||||
|
Exercise of stock options |
|
135,654 |
|
13,565 |
|
— |
|
— |
|
57,261 |
|
— |
|
— |
|
— |
|
70,826 |
| |||||||
|
Excess tax benefits from stock-based compensation |
|
— |
|
— |
|
— |
|
— |
|
144,342 |
|
— |
|
— |
|
— |
|
144,342 |
| |||||||
|
Issuance of restricted stock |
|
104,446 |
|
10,445 |
|
— |
|
— |
|
740,009 |
|
— |
|
— |
|
— |
|
750,454 |
| |||||||
|
Stock-based compensation |
|
18,182 |
|
1,818 |
|
— |
|
— |
|
186,602 |
|
— |
|
— |
|
— |
|
188,420 |
| |||||||
|
Conversion of Class B shares to Class A shares |
|
54,371 |
|
5,437 |
|
(54,371 |
) |
(5,437 |
) |
— |
|
— |
|
— |
|
— |
|
— |
| |||||||
|
Restricted stock received to satisfy tax obligations |
|
— |
|
— |
|
— |
|
— |
|
— |
|
— |
|
(269,177 |
) |
— |
|
(269,177 |
) | |||||||
|
Balance, December 31, 2016 |
|
16,939,634 |
|
$ |
1,693,963 |
|
1,688,111 |
|
$ |
168,811 |
|
$ |
74,980,379 |
|
$ |
39,952,582 |
|
$ |
(14,970,216 |
) |
$ |
(94,170 |
) |
$ |
101,731,349 |
|
See accompanying notes to consolidated financial statements.
Supreme Industries, Inc. and Subsidiaries
Consolidated Statements of Cash Flows
for the years ended December 31, 2016, December 26, 2015, and December 27, 2014
|
|
|
2016 |
|
2015 |
|
2014 |
| |||
|
Cash flows from operating activities: |
|
|
|
|
|
|
| |||
|
Net income |
|
$ |
19,037,338 |
|
$ |
12,875,269 |
|
$ |
6,902,531 |
|
|
Adjustments to reconcile net income to net cash from operating activities: |
|
|
|
|
|
|
| |||
|
Depreciation |
|
3,124,435 |
|
3,284,313 |
|
3,441,281 |
| |||
|
Amortization and write-off of debt issuance costs |
|
304,920 |
|
304,920 |
|
304,920 |
| |||
|
Provision for losses on doubtful receivables |
|
25,314 |
|
826 |
|
6,880 |
| |||
|
Deferred income taxes |
|
84,737 |
|
332,956 |
|
1,530,367 |
| |||
|
Stock-based compensation expense |
|
938,874 |
|
778,223 |
|
488,277 |
| |||
|
Gain on sale of discontinued operations |
|
— |
|
— |
|
(127,994 |
) | |||
|
(Gain) loss on sale of property, plant, and equipment, net |
|
(76,474 |
) |
(73,295 |
) |
153,236 |
| |||
|
Changes in operating assets and liabilities |
|
|
|
|
|
|
| |||
|
Accounts receivable |
|
4,874,984 |
|
(7,109,323 |
) |
3,718,386 |
| |||
|
Inventories |
|
747,421 |
|
(2,330,929 |
) |
5,727,237 |
| |||
|
Other current assets |
|
91,395 |
|
1,740,455 |
|
(2,984,124 |
) | |||
|
Trade accounts payable |
|
(1,146,851 |
) |
(1,007,407 |
) |
(6,930,928 |
) | |||
|
Other current liabilities |
|
1,281,992 |
|
970,908 |
|
(2,688,508 |
) | |||
|
|
|
|
|
|
|
|
| |||
|
Net cash from operating activities |
|
29,288,085 |
|
9,766,916 |
|
9,541,561 |
| |||
|
|
|
|
|
|
|
|
| |||
|
Cash flows from investing activities: |
|
|
|
|
|
|
| |||
|
Proceeds from sale of discontinued operations |
|
— |
|
— |
|
3,884,656 |
| |||
|
Proceeds from sale of property, plant, and equipment |
|
120,838 |
|
862,435 |
|
830,451 |
| |||
|
Additions to property, plant and equipment |
|
(3,742,392 |
) |
(3,891,082 |
) |
(4,730,958 |
) | |||
|
Proceeds from sale of investments |
|
43,000 |
|
1,029,000 |
|
3,175,591 |
| |||
|
Purchases of investments |
|
(83,178 |
) |
(116,479 |
) |
(4,289,298 |
) | |||
|
|
|
|
|
|
|
|
| |||
|
Net cash from investing activities |
|
(3,661,732 |
) |
(2,116,126 |
) |
(1,129,558 |
) | |||
|
|
|
|
|
|
|
|
| |||
|
Cash flows from financing activities: |
|
|
|
|
|
|
| |||
|
Proceeds from revolving line of credit and other long-term debt |
|
— |
|
38,570,153 |
|
— |
| |||
|
Repayments of revolving line of credit and other long-term debt |
|
(833,333 |
) |
(39,236,818 |
) |
(666,668 |
) | |||
|
Payment of cash dividends |
|
(6,764,282 |
) |
(1,829,028 |
) |
(413,326 |
) | |||
|
Treasury stock purchased |
|
(269,177 |
) |
(157,308 |
) |
— |
| |||
|
Proceeds from exercise of stock options |
|
70,826 |
|
550,084 |
|
410,702 |
| |||
|
Excess tax benefits from stock-based compensation |
|
144,342 |
|
63,030 |
|
— |
| |||
|
|
|
|
|
|
|
|
| |||
|
Net cash from financing activities |
|
(7,651,624 |
) |
(2,039,887 |
) |
(669,292 |
) | |||
|
|
|
|
|
|
|
|
| |||
|
Change in cash and cash equivalents |
|
17,974,729 |
|
5,610,903 |
|
7,742,711 |
| |||
|
|
|
|
|
|
|
|
| |||
|
Cash and cash equivalents, beginning of year |
|
17,247,891 |
|
11,636,988 |
|
3,894,277 |
| |||
|
|
|
|
|
|
|
|
| |||
|
Cash and cash equivalents, end of year |
|
$ |
35,222,620 |
|
$ |
17,247,891 |
|
$ |
11,636,988 |
|
|
|
|
|
|
|
|
|
| |||
|
Supplemental disclosure of cash flow information: |
|
|
|
|
|
|
| |||
|
Cash paid (received) during the year for: |
|
|
|
|
|
|
| |||
|
Income taxes, net |
|
$ |
9,162,334 |
|
$ |
5,112,973 |
|
$ |
1,652,889 |
|
|
Interest, net |
|
185,480 |
|
(210,076 |
) |
247,178 |
| |||
|
|
|
|
|
|
|
|
| |||
|
Noncash financing activities: |
|
|
|
|
|
|
| |||
|
Common stock dividends declared and payable |
|
$ |
5,124,130 |
|
$ |
5,019,785 |
|
$ |
413,480 |
|
See accompanying notes to consolidated financial statements.
Supreme Industries, Inc. and Subsidiaries
Notes to Consolidated Financial Statements
1. NATURE OF OPERATIONS AND ACCOUNTING POLICIES.
Supreme Industries, Inc. and its Subsidiaries (collectively the “Company”) manufacture specialized commercial vehicles including truck bodies and specialty vehicles. The Company’s core products include cutaway and dry-freight van bodies, refrigerated units, stake bodies, and other specialized vehicles. At December 31, 2016, the Company operated seven manufacturing and component locations. The Company’s customers are located principally in the United States of America.
On December 31, 2013, the Company announced its intention to divest its shuttle bus business. The progressively competitive environment in the bus industry led to intensified price cutting, making it more difficult to sustain profitability. The shuttle bus business was sold on March 28, 2014 and has been presented as discontinued operations for all years presented.
On May 11, 2016, the Company entered into an Asset Purchase Agreement for the sale of certain assets of the Company’s trolley business. Trolley products represented less than 2% of the Company’s consolidated net sales in 2016 and 2015. The after-tax impact on consolidated operations for both periods was immaterial. The first stage of the transaction closed on June 30, 2016 and the final stage of the transaction is scheduled to close in the first half of 2017. The Company anticipates no material gain or loss will be recognized on the sale. The trolley business does not meet the criteria of FASB Accounting Standards Update 2014-8 (Reporting Discontinued Operations and Disclosure of Disposals of Components of an Entity) and will not be reported as discontinued operations.
Principles of Consolidation - The accompanying consolidated financial statements include the accounts of Supreme Industries, Inc. and its wholly-owned subsidiaries. All significant intercompany accounts and transactions have been eliminated in consolidation.
Fiscal Year End - The Company’s fiscal year ends the last Saturday in December. The fiscal year ended December 31, 2016 contained 53 weeks. The fiscal years ended December 26, 2015 and December 27, 2014 each contained 52 weeks.
Use of Estimates in the Preparation of Financial Statements - The preparation of financial statements in conformity with accounting principles generally accepted in the United States of America requires management to make estimates and assumptions that affect the reported amounts of assets and liabilities and disclosure of contingent assets and liabilities at the date of the financial statements and the reported amounts of revenues and expenses during the reporting period. Actual results could differ from those estimates. Significant estimates include but are not limited to, inventory reserves, fair value of assets held for sale, accrued insurance, accrued warranty, and unrecognized tax positions.
Revenue Recognition - The production of specialized commercial vehicles starts when an order is received from the customer, and revenue is typically recognized when the unit is shipped to the customer. Revenue on certain customer-requested bill and hold transactions is recognized subsequent to when the customer is notified that the products have been completed according to customer specifications, have passed all of the Company’s quality control inspections, and are ready for delivery based upon established delivery terms. Net sales are net of cash discounts which the Company offers its customers in the ordinary course of business.
Concentration of Credit Risk - Concentration of credit risk is limited due to the large number of customers and their dispersion among many different industries and geographic regions. During the year ended December 31, 2016, one large national fleet leasing customer accounted for approximately 31% of the Company’s consolidated net sales. During the year ended December 26, 2015, two large national fleet leasing customers accounted for approximately 24% and 11% of the Company’s consolidated net sales. During the year ended December 27, 2014, one large national fleet leasing customer accounted for approximately 16% of the Company’s consolidated net sales. The Company’s export sales are minimal.
Financial Instruments and Fair Values - The Company has utilized interest rate swap agreements to reduce the impact of changes in interest rates on certain of its floating rate debt. The swap agreements are contracts to exchange the debt obligation’s LIBOR floating rate (exclusive of the applicable spread) for fixed rate interest payments over the term of the swap agreement without exchange of the underlying notional amounts. The notional amounts of the interest rate swap agreements are used to measure interest to be paid or received and do not represent the amount of exposure of credit loss. The differential paid or received under interest rate swap agreements is recognized as an adjustment to interest expense.
Supreme Industries, Inc. and Subsidiaries
Notes to Consolidated Financial Statements, Continued
1. NATURE OF OPERATIONS AND ACCOUNTING POLICIES, Continued
At December 31, 2016, the Company had an interest rate swap agreement outstanding with a notional amount of $5.0 million. The interest rate swap agreement provides for a 3.1% fixed interest rate and matures on December 19, 2017. The Company designated this swap agreement as a cash flow hedge on its variable rate debt and records the fair value of the swap agreement as an asset or liability on the balance sheet, with changes in fair value recognized in other comprehensive income (loss).
Fair value is the exchange price that would be received for an asset or paid to transfer a liability (an exit price) in the principal or most advantageous market for the asset or liability in an orderly transaction between market participants on the measurement date. The Company utilizes a fair value hierarchy which requires an entity to maximize the use of observable inputs and minimize the use of unobservable inputs when measuring fair value. The hierarchy is as follows:
Level 1: Quoted prices (unadjusted) on identical assets or liabilities in active markets that the entity has the ability to access as of the measurement date.
Level 2: Significant other observable inputs other than Level 1 prices such as quoted prices for similar assets or liabilities; quoted prices in markets that are not active; or other inputs that are observable or can be corroborated by observable market data.
Level 3: Significant unobservable inputs that reflect a company’s own assumptions about the assumptions that market participants would use in pricing an asset or liability.
The carrying amounts of cash and cash equivalents, accounts receivable, and trade accounts payable approximated fair value as of December 31, 2016 and December 26, 2015 because of the relatively short maturities of these financial instruments. The carrying amount of long-term debt, including current maturities, approximated fair value as of December 31, 2016 and December 26, 2015, based upon terms and conditions available to the Company at those dates in comparison to the terms and conditions of its outstanding long-term debt.
Cash and Cash Equivalents - The Company considers all highly liquid investments with original maturities of three months or less to be cash equivalents.
Investments - The Company categorizes its investments as trading, available-for-sale, or held-to-maturity. The Company’s investments are comprised of available-for-sale securities and are carried at fair value with unrealized gains and losses, net of applicable income taxes, recorded within accumulated other comprehensive income (loss). The Company determined fair values of investments available for sale by obtaining quoted prices on nationally recognized securities exchanges (Level 1 inputs). Dividend and interest income are accrued as earned. The Company reviews its investments quarterly for changes in market value that are other than temporary.
Accounts Receivable - The Company accounts for trade receivables based on the amounts billed to customers. Past due receivables are determined based on contractual terms. The Company does not accrue interest on any of its trade receivables.
Allowance for Doubtful Accounts - The allowance for doubtful accounts is determined by management based on the Company’s historical losses, specific customer circumstances, and general economic conditions. Periodically, management reviews accounts receivable and adjusts the allowance based on current circumstances and charges off uncollectible receivables against the allowance when all attempts to collect the receivable have failed.
Inventories - Inventories are stated at the lower of cost or market with cost determined using the first-in, first-out method.
Assets Held For Sale - Assets are classified as held for sale upon meeting certain criteria as specified by accounting standards. Assets held for sale are not depreciated and are recorded at the lower of carrying amount or fair value less cost to sell. The Company evaluates the carrying value of property held for sale whenever events or changes in circumstances indicate that a property’s carrying amount may not be recoverable. Such circumstances could include, but are not limited to (1) a significant decrease in the market value of an asset, or (2) a significant adverse change in the extent or manner in which an asset is used. The Company measures the carrying amount of the asset against the estimated undiscounted future cash flows associated with it. Should the sum of the expected future net cash flows be less than the carrying value of the asset being evaluated, an impairment loss would be recognized. The impairment loss would be calculated as the amount by which the carrying value of the asset exceeds its fair value. As of December 31, 2016, the following assets were held for sale: two
Supreme Industries, Inc. and Subsidiaries
Notes to Consolidated Financial Statements, Continued
1. NATURE OF OPERATIONS AND ACCOUNTING POLICIES, Continued
parcels of land in Goshen, Indiana, and property in Harrisville, Rhode Island. As of December 26, 2015, the following assets were held for sale: two parcels of land in Goshen, Indiana.
Property, Plant and Equipment - Property, plant and equipment are recorded at cost. For financial reporting purposes, depreciation is provided based on the straight-line method over the estimated useful lives of the assets. The useful life of each class of property is as follows: land improvements (22 years); buildings (40 years); and machinery and equipment (3 to 10 years).
Upon sale or other disposition of assets, the cost and related accumulated depreciation and amortization are removed from the accounts, and any resulting gain or loss is reflected in operations (included in other income in the consolidated statements of comprehensive income). Expenditures for repairs and maintenance are charged to operations as incurred. Betterments and major renewals are capitalized and recorded in the appropriate asset accounts.
Evaluation of Impairment of Long-Lived Assets - The Company evaluates the carrying value of long-lived assets whenever significant events or changes in circumstances indicate the carrying value of these assets may be impaired. The Company evaluates potential impairment of long-lived assets by comparing the carrying value of the assets to the expected undiscounted future cash flows resulting from use of the assets. The Company determined there were no such impairments in 2016, 2015, and 2014.
Stock-Based Compensation - The Company records all stock-based payments, including grants of stock options and restricted stock, in the consolidated statements of comprehensive income based on their fair values at the date of grant.
Restricted stock awards are valued based upon the closing market price of the Company’s stock on the date of grant. The Company currently uses the Black-Scholes option pricing model to determine the fair value of stock options. The determination of the fair value of stock-based payment awards on the date of grant using an option-pricing model is affected by stock price as well as assumptions regarding a number of complex and subjective variables. These variables include expected stock price volatility over the term of the awards, actual and projected employee stock option exercise behaviors, risk-free interest rate, and expected dividends.
The risk-free interest rate is determined based on observed U.S. Treasury yields in effect at the time of grant for maturities equivalent to the expected life of the option. The expected life of the option (estimated average period of time the option will be outstanding) is estimated based on the historical exercise behavior of grantees with executives displaying somewhat longer holding periods than other grantees. Expected volatility is based on historical volatility measured daily for a time period equal to the expected life of the option ending on the day of grant. The expected dividend yield is estimated based on the dividend yield at the time of grant as adjusted for expected dividend increases and historical payout policy.
Compensation expense (net of estimated forfeitures) relative to stock-based awards (see Note 8), included in the consolidated statements of comprehensive income for the years ended December 31, 2016, December 26, 2015, and December 27, 2014, was $938,874, $778,223 and $488,277, respectively. There were no stock options issued during the years ended December 31, 2016, December 26, 2015, and December 27, 2014.
Warranty - The Company provides limited product warranties for periods of up to five years from the date of retail sale. Estimated warranty costs are provided at the time of sale and are based upon historical experience. Warranty activity for the years ended December 31, 2016, December 26, 2015, and December 27, 2014 was as follows:
|
|
|
2016 |
|
2015 |
|
2014 |
| |||
|
Accrued warranty, beginning of year |
|
$ |
1,055,000 |
|
$ |
949,000 |
|
$ |
1,432,000 |
|
|
Warranty expense |
|
1,296,944 |
|
1,050,955 |
|
605,413 |
| |||
|
Warranty claims paid |
|
(1,125,944 |
) |
(944,955 |
) |
(589,413 |
) | |||
|
Shuttle bus divestiture |
|
— |
|
— |
|
(499,000 |
) | |||
|
Accrued warranty, end of year |
|
$ |
1,226,000 |
|
$ |
1,055,000 |
|
$ |
949,000 |
|
Income Taxes - Deferred tax assets and liabilities are recognized for the future tax consequences attributable to differences between the financial statement carrying amounts of existing assets and liabilities and their respective tax bases. Deferred tax assets, including tax loss and credit carryforwards, and liabilities are measured using enacted tax rates expected to apply to
Supreme Industries, Inc. and Subsidiaries
Notes to Consolidated Financial Statements, Continued
1. NATURE OF OPERATIONS AND ACCOUNTING POLICIES, Continued
taxable income in the years in which those temporary differences are expected to be recovered or settled. The effect on deferred tax assets and liabilities of a change in tax rates is recognized in income in the period that includes the enactment date. Deferred income tax expense represents the change during the period in the deferred tax assets and deferred tax liabilities. Deferred tax assets are reduced by a valuation allowance when, in the opinion of management, it is more likely than not that some portion or all of the deferred tax assets will not be realized.
Earnings (Loss) Per Share - Basic earnings (loss) per share is computed by dividing net income (loss) by the weighted average number of shares of common stock outstanding during the period. Diluted earnings (loss) per share is computed by dividing net income (loss) by the weighted average number of shares of common stock outstanding plus the dilutive effect of stock options.
Comprehensive Income (Loss) - Other comprehensive income (loss) refers to revenues, expenses, gains, and losses that, under generally accepted accounting principles, are included in comprehensive income (loss) but are excluded from net income since these amounts are recorded directly as an adjustment to stockholders’ equity. The Company’s other comprehensive income (loss) is comprised of unrealized gains and losses on hedge activities and available-for-sale securities, net of tax.
Segment Information - The Company’s principal business is manufacturing specialized vehicles. Management has not separately organized the business beyond specialized vehicles (includes three categories of products) and manufacturing processes. The fiberglass manufacturing subsidiary constitutes a segment, however this segment does not meet the quantitative thresholds for separate disclosure. The fiberglass manufacturing subsidiary’s net sales are less than ten percent of consolidated net sales, the absolute amount of its net income is less than ten percent of the absolute amount of consolidated net income, and finally, its assets are less than ten percent of consolidated assets.
Net sales consist of the following:
|
|
|
2016 |
|
2015 |
|
2014 |
| |||
|
Specialized vehicles: |
|
|
|
|
|
|
| |||
|
Trucks |
|
$ |
284,994,546 |
|
$ |
261,598,525 |
|
$ |
211,975,917 |
|
|
Trolley |
|
4,422,375 |
|
5,666,944 |
|
8,414,833 |
| |||
|
Specialty vehicles |
|
5,153,965 |
|
7,297,564 |
|
13,791,906 |
| |||
|
|
|
294,570,886 |
|
274,563,033 |
|
234,182,656 |
| |||
|
Fiberglass products |
|
4,400,779 |
|
3,861,766 |
|
2,126,264 |
| |||
|
|
|
$ |
298,971,665 |
|
$ |
278,424,799 |
|
$ |
236,308,920 |
|
Recently Issued Accounting Pronouncements — In May 2014, the FASB issued ASU 2014-09, Revenue from Contracts with Customers. This ASU provides a five-step analysis of transactions to determine when and how revenue is recognized. The core principle is that a company should recognize revenue to depict the transfer of promised goods or services to customers in an amount that reflects the consideration to which the entity expects to be entitled in exchange for those goods or services. ASU 2014-09 (as updated by ASU 2015-14, ASU 2016-08, ASU 2016-10, ASU 2016-12, and ASU 2016-20) is for annual periods, and interim periods within those years, beginning after December 15, 2017, with early adoption permitted for years beginning after December 15, 2016, to be applied retrospectively to each period presented or as a cumulative-effect adjustment as of the date of adoption. The Company is evaluating the effects of adopting this new accounting guidance, but does not expect adoption will have a material impact on the Company’s results of operations, cash flows or financial position. The Company will adopt the accounting standard during the first quarter of 2018 as required, but has not yet decided on a transition method.
In April 2015, the FASB issued ASU 2015-03, Interest — Imputation of Interest. The ASU provides guidance that requires that debt issuance costs be presented in the consolidated balance sheet as a reduction in the carrying amount of debt, consistent with the presentation of debt issuance discounts. The Company adopted this new guidance, on a retrospective basis, in the fourth quarter of 2016. As a result, total assets and liabilities reported on the consolidated balance sheet as of December 26, 2015 were decreased by $612,815 of deferred financing costs related to the term loan as a result of retrospective application of the amendment.
Supreme Industries, Inc. and Subsidiaries
Notes to Consolidated Financial Statements, Continued
1. NATURE OF OPERATIONS AND ACCOUNTING POLICIES, Concluded
In February 2016, the FASB issued ASU 2016-02, Leases. The ASU provides guidance that will require an entity to recognize lease assets and lease liabilities on its balance sheet for leases in excess of one year that were previously classified as operating leases under U.S. GAAP. The guidance also requires companies to disclose in the footnotes to the financial statements information about the amount, timing, and uncertainty of the payments made for the lease agreements. The guidance is effective for financial statements issued for annual and interim periods beginning after December 15, 2018 on a retrospective basis. Early adoption is permitted. The Company is currently evaluating the effect of adopting this new accounting guidance but does not expect adoption will have a material impact on the Company’s results of operations, cash flows or financial position.
In March 2016, the FASB issued ASU 2016-9, Compensation — Stock Compensation. This ASU provides guidance for share-based payments, which simplifies (i) the income tax consequences related to exercised or vested share-based payment awards; (ii) the classification of awards as assets or liabilities; and (iii) the classification in the consolidated statements of cash flows. This guidance is effective for financial statements issued for annual and interim periods beginning after December 15, 2016 and early adoption is permitted. The Company will adopt this new guidance in the first quarter of 2017 as required. The adoption is not expected to have a material impact on the Company’s consolidated financial statements.
2. DISCONTINUED OPERATIONS.
On December 31, 2013, the Company announced its intention to divest its shuttle bus business. The progressively competitive environment in the bus industry led to intensified price cutting, making it more difficult to sustain profitability. Shuttle bus products represented less than 13% of the Company’s consolidated sales for the year ended December 28, 2013, but had a material adverse effect on reported financial results. On February 28, 2014, the Company entered into an Asset Purchase Agreement (the “Agreement”) for the sale of certain assets of the Company’s shuttle bus division.
The Company continued to operate the business for a period of time following the date of the Agreement to finish certain orders. The transaction closed on March 28, 2014. Net proceeds from the sale were $3.9 million and net assets of the shuttle bus operations sold consisted of inventory of $4.1 million, machinery and equipment of $0.2 million, reduced by a warranty obligation of $0.5 million, resulting in a gain of $0.1 million, net of tax, recorded during the three-month period ended March 29, 2014. The Agreement contains a five-year period during which the Company will not compete in the shuttle bus business, with the exception that the non-competition does not apply to the Company’s trolley division.
The results for the shuttle bus division are classified as discontinued operations as follows:
|
|
|
2014 |
| |
|
Net sales |
|
$ |
6,549,209 |
|
|
Pretax loss from operations |
|
(2,306,655 |
) | |
|
Net loss |
|
(1,567,423 |
) | |
3. INVESTMENTS.
Investment securities consist of the following:
|
|
|
2016 |
|
2015 |
| ||
|
Bond funds - cost |
|
$ |
3,081,654 |
|
$ |
3,054,510 |
|
|
Unrealized losses |
|
(78,652 |
) |
(155,747 |
) | ||
|
Bond funds - fair value |
|
$ |
3,003,002 |
|
$ |
2,898,763 |
|
Sales of securities were $43,000, $1,029,000, and $3,175,591 during 2016, 2015, and 2014, and resulted in gains of $0, $2,175, and $10,053, respectively. Investment income (included in other income) consisted of dividend income and aggregated $103,231, $125,876, and $68,612 for the years ended 2016, 2015, and 2014, respectively.
Supreme Industries, Inc. and Subsidiaries
Notes to Consolidated Financial Statements, Continued
4. INVENTORIES.
Inventories consist of the following:
|
|
|
2016 |
|
2015 |
| ||
|
Raw materials |
|
$ |
17,404,606 |
|
$ |
17,596,283 |
|
|
Work-in-progress |
|
3,397,225 |
|
3,146,984 |
| ||
|
Finished goods |
|
3,443,491 |
|
4,249,476 |
| ||
|
|
|
|
|
|
| ||
|
Total |
|
$ |
24,245,322 |
|
$ |
24,992,743 |
|
5. PROPERTY, PLANT AND EQUIPMENT.
Property, plant and equipment consist of the following:
|
|
|
2016 |
|
2015 |
| ||
|
Land |
|
$ |
3,888,316 |
|
$ |
3,746,093 |
|
|
Land improvements |
|
7,246,508 |
|
7,242,766 |
| ||
|
Buildings |
|
45,691,462 |
|
45,097,638 |
| ||
|
Machinery and equipment |
|
37,972,684 |
|
37,215,751 |
| ||
|
|
|
94,798,970 |
|
93,302,248 |
| ||
|
Less, accumulated depreciation and amortization |
|
49,051,037 |
|
47,115,884 |
| ||
|
|
|
|
|
|
| ||
|
Property, plant and equipment, net |
|
$ |
45,747,933 |
|
$ |
46,186,364 |
|
During the fourth quarter of 2016, the Company completed the consolidation of its Indiana campus, and the consolidation of its Rhode Island service center into its Pennsylvania manufacturing facility. These idled properties are being marketed for sale or lease, with portions classified as property, plant, and equipment, and other portions classified as assets held for sale, on the Consolidated Balance Sheets. As of December 31, 2016, the total net book value of these idled properties was approximately $7.1 million.
6. LONG-TERM DEBT.
Long-term debt consists of the following:
|
|
|
2016 |
|
2015 |
| ||
|
Term loan facility |
|
$ |
7,500,000 |
|
$ |
8,333,333 |
|
|
Less, debt issuance costs |
|
304,895 |
|
609,815 |
| ||
|
Total debt |
|
7,195,105 |
|
7,723,518 |
| ||
|
Less, current maturities |
|
7,195,105 |
|
361,748 |
| ||
|
Long-term debt |
|
$ |
— |
|
$ |
7,361,770 |
|
Credit Agreement
On December 19, 2012, the Company entered into an Amended and Restated Credit Agreement (the “Credit Agreement”) with Wells Fargo Bank, National Association (“Wells Fargo”). Under the terms of the Credit Agreement, Wells Fargo agreed to provide to the Company a credit facility of up to $45.0 million, consisting of a revolving credit facility, a term loan facility, and a letter of credit facility. The Credit Agreement is for a period of five years ending on December 19, 2017. The Company had unused credit capacity of $35.0 million at December 31, 2016. Interest on outstanding borrowings under the Credit Agreement is based on Wells Fargo’s prime rate or LIBOR depending on the pricing option selected and the Company’s leverage ratio (as defined in the Credit Agreement) resulting in an effective interest rate of 3.05% at December 31, 2016 and 2.79% at December 26, 2015. Pursuant to the Credit Agreement, the financial covenants include a consolidated total leverage ratio, a consolidated fixed charge coverage ratio, and a limitation on annual capital expenditures. As of December 31, 2016 and December 26, 2015, the Company was in compliance with all three financial covenants. On August 27, 2014, the Company entered into an amendment of the Credit Agreement. The amendment changed the cash dividend limit from a percentage of consolidated net income for the immediately preceding fiscal quarter to a flat per fiscal
Supreme Industries, Inc. and Subsidiaries
Notes to Consolidated Financial Statements, Continued
6. LONG-TERM DEBT, Concluded
quarter limit of $0.03 per share of capital stock then issued and outstanding. On November 19, 2015, the Company entered into an amendment of the Credit Agreement. The amendment permitted the Company to issue a special dividend of up to $6.5 million on or about January 4, 2016 and changed the cash dividend limit from a flat per fiscal quarter limit of $0.03 per share of capital stock then issued and outstanding to an amount paid in any fiscal quarter not to exceed an amount equal to 50% of the consolidated net income for the immediately preceding fiscal quarter. On November 16, 2016, the Company entered into an amendment of the Credit Agreement. The amendment permitted the Company to issue a special dividend of up to $6.5 million on or about January 2, 2017.
Revolving Credit Facility
The revolving credit facility provides for borrowings of up to $35.0 million. The revolving credit facility bears interest at (i) LIBOR plus a margin which varies from 1.50% to 2.50% based upon a leverage ratio of total indebtedness to trailing four quarter EBITDA or (ii) the higher of (a) the prime rate and (b) the federal funds rate plus 0.50% plus a margin which varies from 0.50% to 1.50% based upon the debt to EBITDA leverage ratio. The revolving credit facility also requires a quarterly commitment fee ranging from 0.20% to 0.50% per annum depending on the Company’s financial ratios and based upon the average daily unused portion. As of December 31, 2016, and December 26, 2015, there were no borrowings against the revolving credit facility.
Term Loan Facility
The term loan facility provides for borrowings of up to $10.0 million. Effective April 29, 2013, the Company and Wells Fargo entered into a $10.0 million term loan by converting $10.0 million of revolving credit facility borrowings to term debt. The term loan is secured by real estate and improvements, payable in quarterly installments of $166,667 commencing on June 28, 2013, plus interest at prime rate or LIBOR, with the remaining balance due upon maturity on December 19, 2017. Maturities of the term loan for the next year are as follows: 2017 - $7,500,000.
On August 9, 2013, the Company entered into an interest rate swap agreement for a portion of the term loan with a notional amount of $5.0 million. The interest rate swap agreement provides for a 3.1% fixed interest rate and matures on December 19, 2017. The Company designated this swap agreement as a cash flow hedge on its variable rate debt and records the fair value of the swap agreement as an asset or liability on the balance sheet, with changes in fair value recognized in other comprehensive income (loss).
Letter of Credit Facility
Outstanding letters of credit, related to the Company’s workers’ compensation insurance policies, reduce available borrowings under the Credit Agreement. During 2014, the Company replaced all outstanding letters of credit with cash deposits with its insurance carriers. As of December 31, 2016 and December 26, 2015, cash deposits with insurance carriers totaled $1.9 million and $2.3 million, respectively, and are included in other current assets on the consolidated balance sheets.
7. RETIREMENT PLAN.
The Company maintains a defined contribution plan which covers substantially all employees of the Company who have reached the age of twenty-one years and have completed thirty days of credited service. The plan provides that eligible employees can contribute from one to fifteen percent of their annual compensation and the Company will match fifty percent of each employee’s contributions up to four percent of the employee’s compensation. The Board of Directors may increase or decrease the Company’s contribution as business conditions permit. Expense for this plan was $438,329, $411,756 and $414,739 for the years ended December 31, 2016, December 26, 2015 and December 27, 2014, respectively.
Supreme Industries, Inc. and Subsidiaries
Notes to Consolidated Financial Statements, Continued
8. STOCKHOLDERS’ EQUITY.
Preferred Stock
The Company is authorized to issue 1,000,000 shares of preferred stock ($1 par value) of which none have been issued. The Board of Directors is vested with the authority to determine and state the designations and relative preferences, limitations, voting rights, if any, and other rights of the preferred shares.
Common Stock
The Board of Directors approved the following cash dividends on the Company’s outstanding Class A and Class B Common Stock during the years ended December 31, 2016 and December 26, 2015:
|
Declaration Date |
|
Record Date |
|
Paid Date |
|
Per Share |
| |
|
March 3, 2015 |
|
March 17, 2015 |
|
March 24, 2015 |
|
$ |
0.025 |
|
|
May 6, 2015 |
|
May 27, 2015 |
|
June 3, 2015 |
|
$ |
0.030 |
|
|
August 5, 2015 |
|
August 24, 2015 |
|
August 31, 2015 |
|
$ |
0.030 |
|
|
November 10, 2015 |
|
December 11, 2015 |
|
January 4, 2016 |
|
$ |
0.300 |
|
|
March 2, 2016 |
|
March 16, 2016 |
|
March 23, 2016 |
|
$ |
0.030 |
|
|
May 25, 2016 |
|
June 9, 2016 |
|
June 16, 2016 |
|
$ |
0.035 |
|
|
August 10, 2016 |
|
August 24, 2016 |
|
August 31, 2016 |
|
$ |
0.035 |
|
|
November 9, 2016 |
|
December 12, 2016 |
|
January 3, 2017 |
|
$ |
0.300 |
|
Convertible Class B Common Stock
Class B Common Stock is convertible into Class A Common Stock on a one-for-one basis. During 2016, 54,371 shares of Class B Common Stock were converted into Class A Common Stock. During 2015, 29,467 shares of Class B Common Stock were converted into Class A Common Stock. Holders of Class A Common Stock are entitled to elect one-third of the Board of Directors rounded to the lowest whole number. Holders of Class B Common Stock elect the remainder of the directors.
Stock Options
On January 23, 2004, the Company’s Board of Directors approved, and the Company’s stockholders subsequently ratified, the 2004 Stock Option Plan, as amended, under which 1,297,440 shares of Class A Common Stock were reserved for grant. This plan expired on January 22, 2014. Under the terms of the stock option plans, both incentive stock options and non-statutory stock options were granted by a specially designated Stock Awards Committee. The Stock Option Plan, as amended, also allowed for awards of common stock including restricted stock awards. Options granted under the stock option plans generally vest and become exercisable in annual installments of 33 1/3% beginning on the first anniversary date, and the options expire five or seven years after the date of grant. The Company generally issues new shares to satisfy stock option exercises.
The following table summarizes the activity for stock options:
|
|
|
|
|
Weighted - Average |
|
|
|
|
Options |
|
Exercise Price |
|
|
Outstanding, December 29, 2013 |
|
535,431 |
|
2.79 |
|
|
Exercised |
|
(183,623 |
) |
3.15 |
|
|
Outstanding, December 27, 2014 |
|
351,808 |
|
2.61 |
|
|
Exercised |
|
(182,548 |
) |
3.15 |
|
|
Outstanding, December 26, 2015 |
|
169,260 |
|
2.02 |
|
|
Exercised |
|
(151,410 |
) |
2.01 |
|
|
Outstanding, December 31, 2016 |
|
17,850 |
|
2.12 |
|
The total intrinsic value of options exercised during the fiscal years ended 2016, 2015 and 2014 approximated $1,771,913, $218,599 and $349,478, respectively.
Supreme Industries, Inc. and Subsidiaries
Notes to Consolidated Financial Statements, Continued
8. STOCKHOLDERS’ EQUITY, Continued
Information about stock options outstanding and exercisable at December 31, 2016 is as follows:
|
|
|
Outstanding |
|
Exercisable |
| ||||||
|
|
|
|
|
Weighted - |
|
|
|
|
|
|
|
|
|
|
|
|
Average |
|
Weighted - |
|
|
|
Weighted - |
|
|
|
|
|
|
Remaining |
|
Average |
|
|
|
Average |
|
|
Range of |
|
Number |
|
Contractual |
|
Exercise |
|
Number |
|
Exercise |
|
|
Exercise Price |
|
Outstanding |
|
Life in Years |
|
Price |
|
Exercisable |
|
Price |
|
|
|
|
|
|
|
|
|
|
|
|
|
|
|
2.12 |
|
17,850 |
|
0.75 |
|
2.12 |
|
17,850 |
|
2.12 |
|
At December 31, 2016 and December 26, 2015, the aggregate intrinsic value of options exercisable and the intrinsic value of all options outstanding approximated $242,335 and $862,495, respectively.
2012 Long-Term Incentive Plan
On May 23, 2012, the Company held its annual meeting of stockholders at which the Company’s stockholders approved the 2012 Long-Term Incentive Plan (the “2012 Plan”) which had previously been approved by the Board of Directors and recommended to the stockholders. The 2012 Plan was replaced by the 2016 Long-Term Incentive Plan described below; provided, however, any awards issued prior to the 2012 Plan’s termination will remain outstanding in accordance with their terms. The 2012 Plan authorized the issuance of 1,050,000 shares of the Company’s Class A Common Stock with certain officers being limited to receiving grants of 100,000 shares in any one year. Employees, contractors and non-employee directors of the Company and its subsidiaries were eligible to receive awards under the 2012 Plan. The following types of awards were permitted to be granted under the 2012 Plan: (1) stock options (incentive and non-qualified); (2) stock appreciation rights; (3) restricted stock and restricted stock units; (4) dividend equivalent rights; (5) performance awards based on achieving specified performance goals; and (6) other awards.
2016 Long-Term Incentive Plan
On May 25, 2016, the Company held its annual meeting of stockholders at which the Company’s stockholders approved the 2016 Long-Term Incentive Plan (the “2016 Plan”) which had previously been approved by the Board of Directors and recommended to the stockholders. The 2016 Plan is effective until May 25, 2026; provided, however, any awards issued prior to the 2016 Plan’s termination will remain outstanding in accordance with their terms. The 2016 Plan authorizes the issuance of 1,000,000 shares of the Company’s Class A Common Stock (subject to increase of Prior Plan Awards as defined in the 2016 Plan) with certain officers being limited to receiving grants of 100,000 shares in any one year. Employees, contractors and non-employee directors of the Company and its subsidiaries are eligible to receive awards under the 2016 Plan. The following types of awards may be granted under the 2016 Plan: (1) stock options (incentive and non-qualified); (2) stock appreciation rights; (3) restricted stock and restricted stock units; (4) dividend equivalent rights; (5) performance awards based on achieving specified performance goals; and (6) other awards.
Supreme Industries, Inc. and Subsidiaries
Notes to Consolidated Financial Statements, Continued
8. STOCKHOLDERS’ EQUITY, Concluded
The following table summarizes the activity for the unvested restricted stock:
|
|
|
Unvested |
|
|
|
|
|
|
Restricted |
|
Weighted - Average |
|
|
|
|
Stock |
|
Grant Date Fair Value |
|
|
Unvested, December 29, 2013 |
|
110,431 |
|
3.99 |
|
|
Granted |
|
60,896 |
|
6.87 |
|
|
Vested |
|
(65,510 |
) |
4.72 |
|
|
Unvested, December 27, 2014 |
|
105,817 |
|
5.19 |
|
|
Granted |
|
122,890 |
|
8.43 |
|
|
Vested |
|
(98,518 |
) |
5.95 |
|
|
Forfeited |
|
(13,761 |
) |
7.87 |
|
|
Unvested, December 26, 2015 |
|
116,428 |
|
7.66 |
|
|
Granted |
|
113,992 |
|
8.00 |
|
|
Vested |
|
(100,754 |
) |
7.45 |
|
|
Unvested, December 31, 2016 |
|
129,666 |
|
8.12 |
|
The total fair value of shares vested and recognized as stock-based compensation expense during the years ended December 31, 2016 and December 26, 2015 was $750,454 and $585,723 respectively.
Beginning in 2012, as a part of annual director compensation, a stock award is paid to each of the Company’s outside directors equal to $27,500 divided by the closing sales price on the grant date. The grants are made in quarterly increments. Shares granted during 2016 and 2015 totaled 18,182 and 24,409, respectively.
Total unrecognized compensation expense related to all share-based awards outstanding at December 31, 2016, was approximately $1,053,026 and is to be recorded over a weighted-average contractual life of 1.77 years.
As of December 31, 2016, 1,012,140 shares were reserved for the granting of future share-based awards compared to 627,540 shares at December 26, 2015.
9. INCOME TAXES.
|
|
|
2016 |
|
2015 |
|
2014 |
| |||
|
|
|
|
|
|
|
|
| |||
|
Federal: |
|
$ |
8,620,430 |
|
$ |
5,496,735 |
|
$ |
2,242,641 |
|
|
Current |
|
(172,449 |
) |
99,251 |
|
1,100,487 |
| |||
|
Deferred |
|
8,447,981 |
|
5,595,986 |
|
3,343,128 |
| |||
|
|
|
|
|
|
|
|
| |||
|
State: |
|
|
|
|
|
|
| |||
|
Current |
|
701,664 |
|
489,684 |
|
227,648 |
| |||
|
Deferred |
|
257,186 |
|
233,705 |
|
429,879 |
| |||
|
|
|
958,850 |
|
723,389 |
|
657,527 |
| |||
|
Total |
|
$ |
9,406,831 |
|
$ |
6,319,375 |
|
$ |
4,000,655 |
|
Supreme Industries, Inc. and Subsidiaries
Notes to Consolidated Financial Statements, Continued
9. INCOME TAXES, Continued
Deferred tax assets and deferred tax liabilities were as follows:
|
|
|
2016 |
|
2015 |
| ||
|
Deferred tax assets: |
|
|
|
|
| ||
|
Receivables |
|
$ |
18,757 |
|
$ |
20,020 |
|
|
Inventories |
|
575,675 |
|
612,830 |
| ||
|
Accrued liabilities |
|
1,330,441 |
|
1,028,149 |
| ||
|
Net operating losses and credit carryforwards |
|
2,263,667 |
|
1,906,406 |
| ||
|
Other |
|
413,374 |
|
93,600 |
| ||
|
|
|
4,601,914 |
|
3,661,005 |
| ||
|
Valuation allowance |
|
(1,072,022 |
) |
(784,925 |
) | ||
|
Total deferred tax assets |
|
3,529,892 |
|
2,876,080 |
| ||
|
|
|
|
|
|
| ||
|
Deferred tax liabilities: |
|
|
|
|
| ||
|
Depreciation |
|
(4,317,934 |
) |
(4,265,972 |
) | ||
|
Prepaids and other |
|
(1,393,736 |
) |
(707,149 |
) | ||
|
Total deferred tax liabilities |
|
(5,711,670 |
) |
(4,973,121 |
) | ||
|
Net deferred tax liabilities |
|
$ |
(2,181,778 |
) |
$ |
(2,097,041 |
) |
At December 31, 2016, the Company had state tax net operating loss carryforwards of approximately $23.1 million available to offset future taxable income, expiring in various amounts beginning December 31, 2020 through December 31, 2036. The Company had a tax valuation allowance for deferred tax assets related to state net operating loss carryforwards not expected to be utilized of $0.2 million for the year ended December 31, 2016. The Company had state credit carryforwards of approximately $1.0 million and $0.9 million for the years ended December 31, 2016 and December 26, 2015, respectively, to offset future taxable income, expiring in various amounts beginning December 31, 2017 through December 31, 2026. The Company has a valuation allowance for the state credits of $0.9 million and $0.8 million for the years ended December 31, 2016 and December 25, 2015, respectively. The ultimate realization of these deferred tax assets is dependent upon future state taxable income for certain entities. Although a majority of the state entities are currently generating taxable income, there is no certainty the Company will realize the full benefit of these deferred tax assets.
A reconciliation of the tax provision for income taxes from continuing operations at the U.S. Statutory rate to the effective income tax expense rate as reported is as follows:
|
|
|
2016 |
|
2015 |
|
2014 |
| |||||||||
|
U.S. Federal statutory rate |
|
$ |
9,955,459 |
|
35.0 |
% |
$ |
6,718,125 |
|
35.0 |
% |
$ |
4,364,717 |
|
35.0 |
% |
|
State income taxes, net of federal benefit |
|
623,253 |
|
2.2 |
|
470,203 |
|
2.4 |
|
617,410 |
|
5.0 |
| |||
|
Tax-exempt underwriting income of wholly- owned small captive insurance subsidiary |
|
(413,339 |
) |
(1.4 |
) |
(388,168 |
) |
(2.0 |
) |
(297,243 |
) |
(2.4 |
) | |||
|
Domestic production deduction |
|
(860,212 |
) |
(3.0 |
) |
(553,476 |
) |
(2.9 |
) |
(281,688 |
) |
(2.3 |
) | |||
|
Tax credits |
|
(101,000 |
) |
(0.4 |
) |
(101,000 |
) |
(0.5 |
) |
(97,750 |
) |
(0.8 |
) | |||
|
Other, net |
|
202,670 |
|
0.7 |
|
173,691 |
|
0.9 |
|
(304,791 |
) |
(2.4 |
) | |||
|
Effective tax rate |
|
$ |
9,406,831 |
|
33.1 |
% |
$ |
6,319,375 |
|
32.9 |
% |
$ |
4,000,655 |
|
32.1 |
% |
Uncertain Tax Positions
The Company recognizes income tax benefits only when it is more likely than not that the tax position will be allowed upon examination by taxing authorities, which is presumed to occur. The amount of such tax benefit recorded is the largest amount that is more likely than not to be allowed. A reconciliation of the change in the unrecognized tax benefits for the three years ended December 31, 2016 is as follows:
Supreme Industries, Inc. and Subsidiaries
Notes to Consolidated Financial Statements, Continued
9. INCOME TAXES, Concluded
|
Unrecognized tax benefits at December 29, 2013 |
|
$ |
659,000 |
|
|
Gross increases - tax positions in prior periods |
|
157,657 |
| |
|
Lapse of statute of limitations |
|
(70,657 |
) | |
|
Unrecognized tax benefits at December 27, 2014 |
|
746,000 |
| |
|
Gross increases - tax positions in prior periods |
|
229,191 |
| |
|
Lapse of statute of limitations |
|
(109,191 |
) | |
|
Unrecognized tax benefits at December 26, 2015 |
|
866,000 |
| |
|
Gross increases - tax positions in prior periods |
|
360,645 |
| |
|
Lapse of statute of limitations |
|
(136,645 |
) | |
|
Unrecognized tax benefits at December 31, 2016 |
|
$ |
1,090,000 |
|
The entire balance of approximately $1,090,000 at December 31, 2016, included in accrued income taxes, relates to unrecognized tax positions that, if recognized, would affect the annual effective tax rate. The Company is subject to U.S. federal income tax as well as various state taxes. The Company is no longer subject to examination by federal taxing authorities for the fiscal year ended 2012 and earlier. For certain state taxing authorities, the Company is no longer subject to examination for the fiscal years ended 2011 and 2012 and earlier. The Company does not expect the total amount of unrecognized tax benefits to significantly increase or decrease over the next twelve months. Interest and penalties related to income tax matters are recognized in income tax expense. Interest and penalties accrued for, and recognized during, the fiscal years ended December 31, 2016, December 26, 2015, and December 27, 2014 were immaterial.
10. COMMITMENTS AND CONTINGENCIES.
Lease Commitments
The Company leases certain land and manufacturing facilities under operating lease agreements which expire at various dates from February 2017 through April 2021. Rent expense under all operating leases aggregated $189,696, $166,830, and $159,010 for the fiscal years ended 2016, 2015, and 2014, respectively.
At December 31, 2016, future minimum rental payments under noncancelable operating leases aggregated $221,472 and are payable as follows: 2017 - $111,364; 2018 - $31,934; 2019 - $32,892; 2020 - $33,879; and 2021 - $11,403.
Consigned Inventories
The Company obtains most vehicle chassis for its specialized vehicle products directly from the chassis manufacturers under converter pool agreements. Chassis are obtained from the manufacturers based on orders from customers, and to a lesser extent, for unallocated orders. Although each manufacturer’s agreement has different terms and conditions, the agreements generally state that the manufacturer will provide a supply of chassis to be maintained from time to time at the Company’s various facilities with the condition that the Company will store such chassis and will not move, sell, or otherwise dispose of such chassis except under the terms of the agreement. The manufacturer transfers the chassis to the Company on a “restricted basis,” retaining the sole authority to authorize commencement of work on the chassis and to make certain other decisions with respect to the chassis including the terms and pricing of sales of the chassis to the manufacturer’s dealers. The manufacturer also does not transfer the certificate of origin to the Company nor permit the Company to sell or transfer the chassis to anyone other than the manufacturer (for ultimate resale to a dealer). Although the Company is party to related finance agreements with General Motors and Ally Bank, the Company has not historically settled, nor expects to in the future settle, any related obligations in cash. Instead, the obligation is settled by General Motors upon reassignment of the chassis to an accepted dealer, and the dealer is invoiced for the chassis by General Motors. Accordingly, the Company accounts for the chassis as consigned inventory belonging to the manufacturer. Under these agreements, if the chassis is not delivered to a customer within a specified time frame the Company is required to pay a finance or storage charge on the chassis. Additionally, the Company receives finance support funds from General Motors when the chassis are assigned into the Company’s chassis pool. Typically, chassis are converted and delivered to customers within 90 days of the receipt of the chassis by the Company. At December 31, 2016 and December 26, 2015, chassis inventory, accounted for as consigned inventory to the Company by the manufacturers, aggregated approximately $32.2 million and $33.7 million, respectively.
Supreme Industries, Inc. and Subsidiaries
Notes to Consolidated Financial Statements, Continued
10. COMMITMENTS AND CONTINGENCIES, Continued
Repurchase Commitments
The Company was contingently liable at December 31, 2016, under a repurchase agreement with a certain financial institution providing inventory financing for a retailer of its trolley product. Under the arrangement, the Company agrees to repurchase vehicles in the event of default by the retailer. The maximum repurchase liability is the total amount that would be paid upon the default of the Company’s independent dealer. The maximum potential repurchase liability, without reduction for the resale value of the repurchased units, was approximately $0.2 million and $1.8 million at December 31, 2016 and December 26, 2015, respectively. The loss, if any, under the agreement is the difference between the repurchase cost and the resale value of the units. The Company believes that any potential loss under this agreement in effect at December 31, 2016 would not be material.
Self-Insurance
The Company is self-insured for a portion of general liability ($100,000 per occurrence), certain employee health benefits ($200,000 annually per employee with no annual aggregate), and workers’ compensation in certain states ($250,000 per occurrence with no annual aggregate). The Company accrues for the estimated losses occurring from both asserted and unasserted claims. The estimate of the liability for unasserted claims arising from incurred but not reported claims is based on an analysis of historical claims data.
Ownership Transaction Incentive Plan
On October 25, 2011, the Company approved an Ownership Transaction Incentive Plan (the “2011 OTIP”). Pursuant to the terms of the 2011 OTIP, upon a “change of control”, (as defined in the 2011 OTIP), certain employees of the Company were entitled to receive a percentage of the difference between the per share value of the total cash proceeds or the per share fair market value of any other consideration received by the Company or the Company’s stockholders in connection with a change of control minus a base price defined in the agreement. The 2011 OTIP expired on December 31, 2015.
On March 2, 2016, the Company adopted the 2016 Ownership Transaction Incentive Plan (the “2016 OTIP”). This newly adopted plan replaced the 2011 OTIP. The 2016 OTIP provides that, upon a “change of control” (as defined in the 2016 OTIP) during the term of the plan, participants are entitled to receive a bonus based on a percentage of the difference between the per share value of the total cash proceeds or the per share fair market value of any other consideration received by the Company or the Company’s stockholders in connection with a change of control minus a base price defined in the agreement.
Other
The Company is subject to various investigations, claims, and legal proceedings covering a wide range of matters that arise in the ordinary course of its business activities. Each of these matters is subject to various uncertainties, and it is possible that some of these matters may be resolved unfavorably to the Company. The Company establishes accruals for matters that are probable and reasonably estimable. Management believes that any liability that may ultimately result from the resolution of these matters in excess of accruals and/or amounts provided by insurance coverage will not have a material adverse effect on the consolidated financial position or results of operations of the Company.
On January 3, 2017, an amended complaint was filed against the Company’s subsidiary, Supreme Corporation, in a suit (SVI, Inc. v. Supreme Corporation, Hometown Trolley (a/k/a Double K, Inc.) and Dustin Pence) in the United States District Court, District of Nevada. The amended complaint [followed the original complaint filed on May 16, 2016], from Supreme Corporation’s former trolley distributor, alleges that Supreme Corporation’s sale of its trolley assets to another manufacturer was improper. Claims alleged against Supreme Corporation are as follows: (i) misappropriation of trade secrets; (ii) civil conspiracy/collusion; (iii) tortious interference with contractual relationships; (iv) tortious interference with prospective economic advantage; (v) unjust enrichment; (vi) breach of contract; (vii) breach of the covenant of good faith and fair dealing; (viii) breach of fiduciary duties; (ix) promissory estoppel; (x) declaratory relief establishing a joint venture or partnership; and (xi) cancellation of a trademark registration. The plaintiff alleges that the net present value of the amount lost by the plaintiff is approximately $40,000,000. Supreme Corporation has filed a motion to dismiss which is pending. Due to the inherent risk of litigation, the outcome of this case is uncertain and unpredictable; however, at this time, management believes that the allegations are without merit and is vigorously defending the matter.
Supreme Industries, Inc. and Subsidiaries
Notes to Consolidated Financial Statements, Concluded
10. COMMITMENTS AND CONTINGENCIES, Concluded
On November 4, 2016, a putative class action lawsuit was filed against the Company, Mark Weber (the Company’s Chief Executive Officer) and Matthew W. Long (the Company’s Chief Financial Officer) in the United States District Court for the Central District of California alleging the defendants violated Sections 10(b) and 20(a) of the Securities Exchange Act of 1934 and Rule 10b-5 by making material, misleading statements in July 2016 regarding projected backlog. The plaintiff seeks to recover unspecified damages. On February 14, 2017, the court transferred the venue of the case to the Northern District of Indiana upon the joint stipulation of the plaintiff and the defendants. Due to the inherent risk of litigation, the outcome of this case is uncertain and unpredictable; however, at this time, management believes that the allegations are without merit and is vigorously defending the matter.
SUPREME INDUSTRIES, INC. AND SUBSIDIARIES
SCHEDULE II — VALUATION AND QUALIFYING ACCOUNTS
|
|
|
|
|
Column C |
|
|
|
|
| ||||
|
|
|
Column B |
|
Additions |
|
|
|
|
| ||||
|
|
|
Balance |
|
Charged to |
|
|
|
Column E |
| ||||
|
Column A |
|
Beginning |
|
Costs and |
|
Column D |
|
Balance End |
| ||||
|
Description |
|
of Period |
|
Expenses |
|
Deductions |
|
of Period |
| ||||
|
Year ended December 31, 2016: |
|
|
|
|
|
|
|
|
| ||||
|
Reserves and allowances deducted from asset accounts: |
|
|
|
|
|
|
|
|
| ||||
|
Allowance for doubtful receivables |
|
$ |
52,000 |
|
$ |
25,314 |
(1) |
$ |
27,314 |
|
$ |
50,000 |
|
|
Reserves for excess and obsolete inventory |
|
1,167,107 |
|
733,615 |
|
753,892 |
|
1,146,830 |
| ||||
|
Allowance for deferred tax asset valuation |
|
784,925 |
|
287,098 |
|
— |
|
1,072,023 |
| ||||
|
|
|
|
|
|
|
|
|
|
| ||||
|
|
|
|
|
|
|
|
|
|
| ||||
|
Year ended December 26, 2015: |
|
|
|
|
|
|
|
|
| ||||
|
Reserves and allowances deducted from asset accounts: |
|
|
|
|
|
|
|
|
| ||||
|
Allowance for doubtful receivables |
|
$ |
52,000 |
|
$ |
826 |
(1) |
$ |
826 |
|
$ |
52,000 |
|
|
Reserves for excess and obsolete inventory |
|
950,559 |
|
432,365 |
|
215,817 |
|
1,167,107 |
| ||||
|
Allowance for deferred tax asset valuation |
|
692,093 |
|
92,832 |
|
— |
|
784,925 |
| ||||
|
|
|
|
|
|
|
|
|
|
| ||||
|
|
|
|
|
|
|
|
|
|
| ||||
|
Year ended December 27, 2014: |
|
|
|
|
|
|
|
|
| ||||
|
Reserves and allowances deducted from asset accounts: |
|
|
|
|
|
|
|
|
| ||||
|
Allowance for doubtful receivables |
|
$ |
52,000 |
|
$ |
6,880 |
(1) |
$ |
6,880 |
|
$ |
52,000 |
|
|
Reserves for excess and obsolete inventory |
|
1,464,118 |
|
329,708 |
|
843,267 |
(2) |
950,559 |
| ||||
|
Allowance for deferred tax asset valuation |
|
— |
|
692,093 |
|
— |
|
692,093 |
| ||||
(1) Uncollectible accounts written off, net of recoveries.
(2) Includes impacts related to the shuttle bus sale.
SUPREME INDUSTRIES, INC. AND SUBSIDIARIES
|
|
|
First |
|
Second |
|
Third |
|
Fourth |
| ||||
|
2016 Quarter |
|
|
|
|
|
|
|
|
| ||||
|
Net sales |
|
$ |
69,449,903 |
|
$ |
92,871,671 |
|
$ |
74,790,098 |
|
$ |
61,859,993 |
|
|
Gross profit |
|
15,160,657 |
|
22,412,305 |
|
17,236,904 |
|
12,301,694 |
| ||||
|
Net income |
|
3,759,353 |
|
8,296,172 |
|
4,997,323 |
|
1,984,490 |
| ||||
|
Income per share: |
|
|
|
|
|
|
|
|
| ||||
|
Basic |
|
0.23 |
|
0.49 |
|
0.29 |
|
0.12 |
| ||||
|
Diluted |
|
0.22 |
|
0.48 |
|
0.29 |
|
0.12 |
| ||||
|
|
|
First |
|
Second |
|
Third |
|
Fourth |
| ||||
|
2015 Quarter |
|
|
|
|
|
|
|
|
| ||||
|
Net sales |
|
$ |
63,295,371 |
|
$ |
82,595,230 |
|
$ |
64,818,118 |
|
$ |
67,716,080 |
|
|
Gross profit |
|
11,445,026 |
|
15,468,058 |
|
12,642,390 |
|
14,666,729 |
| ||||
|
Net income |
|
1,933,119 |
|
4,346,664 |
|
2,796,894 |
|
3,798,592 |
| ||||
|
Income per share: |
|
|
|
|
|
|
|
|
| ||||
|
Basic |
|
0.12 |
|
0.26 |
|
0.17 |
|
0.23 |
| ||||
|
Diluted |
|
0.11 |
|
0.26 |
|
0.16 |
|
0.22 |
| ||||
The sum of quarterly earnings per share for the four quarters may not equal annual earnings per share due to rounding.
ITEM 9. CHANGES IN AND DISAGREEMENTS WITH ACCOUNTANTS ON ACCOUNTING AND FINANCIAL DISCLOSURE.
Not applicable.
ITEM 9A. CONTROLS AND PROCEDURES.
Management’s Conclusions Regarding Effectiveness of Disclosure Controls and Procedures
As of December 31, 2016, the Company conducted an evaluation, under the supervision and participation of management including the Chief Executive Officer and Chief Financial Officer, of the effectiveness of the Company’s disclosure controls and procedures (as defined in Rule 13a-15(e) and Rule 15d-15(e) of the Securities Exchange Act of 1934). Based upon that evaluation, the Chief Executive Officer and Chief Financial Officer concluded that the Company’s disclosure controls and procedures were effective as of December 31, 2016.
Management’s Report on Internal Control over Financial Reporting
Management of the Company is responsible for establishing and maintaining adequate internal control over financial reporting as defined in Rule 13a-15(f) and Rule 15d-15(f) of the Securities Exchange Act of 1934. Internal control over financial reporting provides reasonable assurance regarding the reliability of financial reporting and the preparation of financial statements for external purposes in accordance with generally accepted accounting principles.
The Company’s internal control over financial reporting includes policies and procedures that: (1) pertain to the maintenance of records that, in reasonable detail, accurately and fairly reflect the transactions and dispositions of the Company’s assets; (2) provide reasonable assurance that transactions are recorded as necessary to permit preparation of financial statements in accordance with generally accepted accounting principles; and that the Company’s receipts and expenditures are being made only in accordance with authorizations of management and directors; and (3) provide reasonable assurance regarding prevention or timely detection of unauthorized acquisition, use, or disposition of the Company’s assets that could have a material effect on the financial statements.
Because of its inherent limitations, internal control over financial reporting may not prevent or detect misstatements. Also, projections of any evaluation of effectiveness to future periods are subject to the risk that controls may become inadequate because of changes in conditions or that the degree of compliance with the policies or procedures may deteriorate.
Management of the Company has assessed the effectiveness of the Company’s internal control over financial reporting based on criteria established in the 2013 Internal Control-Integrated Framework issued by the Committee of Sponsoring Organizations of the Treadway Commission.
Management’s assessment included an evaluation of the design of the Company’s internal control over financial reporting and testing of the operational effectiveness of the Company’s internal control over financing reporting. Based on this assessment, management has concluded that the Company’s internal control over financial reporting was effective as of December 31, 2016.
The Company’s independent registered public accounting firm, Crowe Horwath LLP, audited our internal control over financial reporting as of December 31, 2016, as stated in their report included elsewhere in this Form 10-K, which expressed an unqualified opinion on the effectiveness of the Company’s internal control over financial reporting as of December 31, 2016.
Changes in Internal Control over Financial Reporting
No change in the Company’s internal control over financial reporting (as such term is defined in Exchange Act Rule 13a-15(f) and Rule 15d-15(f)) occurred during the fiscal quarter ended December 31, 2016 that materially affected, or is reasonably likely to materially affect, the Company’s internal control over financial reporting.
Not applicable.
ITEM 10. DIRECTORS, EXECUTIVE OFFICERS AND CORPORATE GOVERNANCE.
The information required by Item 10 of Form 10-K is hereby incorporated by reference from the Company’s definitive proxy statement which will be filed with the Securities and Exchange Commission in connection with the Company’s 2017 annual stockholders’ meeting.
ITEM 11. EXECUTIVE COMPENSATION.
The information required by Item 11 of Form 10-K is hereby incorporated by reference from the Company’s definitive proxy statement which will be filed with the Securities and Exchange Commission in connection with the Company’s 2017 annual stockholders’ meeting.
ITEM 12. SECURITY OWNERSHIP OF CERTAIN BENEFICIAL OWNERS AND MANAGEMENT AND RELATED STOCKHOLDER MATTERS.
The information required by Item 12 of Form 10-K is hereby incorporated by reference from the Company’s definitive proxy statement which will be filed with the Securities and Exchange Commission in connection with the Company’s 2017 annual stockholders’ meeting.
ITEM 13. CERTAIN RELATIONSHIPS AND RELATED TRANSACTIONS, AND DIRECTOR INDEPENDENCE.
The information required by Item 13 of Form 10-K is hereby incorporated by reference from the Company’s definitive proxy statement which will be filed with the Securities and Exchange Commission in connection with the Company’s 2017 annual stockholders’ meeting.
ITEM 14. PRINCIPAL ACCOUNTANT FEES AND SERVICES.
The information required by Item 14 of Form 10-K is hereby incorporated by reference from the Company’s definitive proxy statement which will be filed with the Securities and Exchange Commission in connection with the Company’s 2017 annual stockholders’ meeting.
ITEM 15. EXHIBITS, FINANCIAL STATEMENT SCHEDULES.
|
a. The following financial statements and financial statement schedule are included in Item 8 herein: |
|
|
|
1. Financial Statements |
|
|
|
Report of Crowe Horwath LLP, Independent Registered Public Accounting Firm |
|
|
|
Consolidated Balance Sheets as of December 31, 2016 and December 26, 2015 |
|
|
|
Consolidated Statements of Comprehensive Income for the years ended December 31, 2016, December 26, 2015 and December 27, 2014 |
|
|
|
Consolidated Statements of Stockholders’ Equity for the years ended December 31, 2016, December 26, 2015 and December 27, 2014 |
|
|
|
Consolidated Statements of Cash Flows for the years ended December 31, 2016, December 26, 2015 and December 27, 2014 |
|
|
|
Notes to Consolidated Financial Statements |
|
|
|
2. Financial Statement Schedule |
|
|
|
Schedule II - Valuation and Qualifying Accounts |
|
|
|
3. Exhibits |
|
|
|
See Index to Exhibits |
None.
SIGNATURES
Pursuant to the requirements of Section 13 or 15(d) of the Securities Exchange Act of 1934, the registrant has duly caused this report to be signed on its behalf by the undersigned, thereunto duly authorized.
|
|
|
|
SUPREME INDUSTRIES, INC. | |
|
|
|
|
|
|
|
|
|
|
|
|
|
Date: |
March 3, 2017 |
|
By: |
/s/ Mark D. Weber |
|
|
|
|
|
Mark D. Weber |
|
|
|
|
|
President and Chief Executive Officer |
Pursuant to the requirements of the Securities Exchange Act of 1934, this report has been signed below by the following persons on behalf of the registrant and in the capacities and on the dates indicated.
|
/s/ Herbert M. Gardner |
|
Chairman of the Board |
|
March 3, 2017 |
|
|
Herbert M. Gardner |
|
|
|
|
|
|
|
|
|
|
|
|
|
/s/ Mark D. Weber |
|
President, Chief Executive Officer |
|
|
|
|
Mark D. Weber |
|
and Director (Principal Executive Officer) |
|
March 3, 2017 |
|
|
|
|
|
|
|
|
|
/s/ William J. Barrett |
|
Executive Vice President, Secretary, |
|
|
|
|
William J. Barrett |
|
Assistant Treasurer and Director |
|
March 3, 2017 |
|
|
|
|
|
|
|
|
|
/s/ Matthew W. Long |
|
Chief Financial Officer, Treasurer and |
|
March 3, 2017 |
|
|
Matthew W. Long |
|
Assistant Secretary (Principal |
|
|
|
|
|
|
Financial and Accounting Officer) |
|
|
|
|
|
|
|
|
|
|
|
/s/ Peter D. Barrett |
|
Director |
|
March 3, 2017 |
|
|
Peter D. Barrett |
|
|
|
|
|
|
|
|
|
|
|
|
|
/s/ Edward L. Flynn |
|
Director |
|
March 3, 2017 |
|
|
Edward L. Flynn |
|
|
|
|
|
|
|
|
|
|
|
|
|
/s/ Arthur J. Gajarsa |
|
Director |
|
March 3, 2017 |
|
|
Arthur J. Gajarsa |
|
|
|
|
|
|
|
|
|
|
|
|
|
/s/ Thomas B. Hogan, Jr. |
|
Director |
|
March 3, 2017 |
|
|
Thomas B. Hogan, Jr. |
|
|
|
|
|
|
|
|
|
|
|
|
|
/s/ Michael L. Klofas |
|
Director |
|
March 3, 2017 |
|
|
Michael L. Klofas |
|
|
|
|
|
|
|
|
|
|
|
|
|
/s/ Mark C. Neilson |
|
Director |
|
March 3, 2017 |
|
|
Mark C. Neilson |
|
|
|
|
|
|
|
|
|
|
|
|
|
/s/ Wayne A. Whitener |
|
Director |
|
March 3, 2017 |
|
|
Wayne A. Whitener |
|
|
|
|
|
INDEX TO EXHIBITS
|
Exhibit |
|
Description | |
|
|
|
|
|
|
|
3.1 |
|
Certificate of Incorporation of the Company, filed as Exhibit 3(a) to the Company’s Registration Statement on Form 8-A, filed with the Commission on September 18, 1989, and incorporated herein by reference. |
|
|
|
|
|
|
|
3.2 |
|
Certificate of Amendment of Certificate of Incorporation of the Company filed with the Secretary of State of Delaware on June 10, 1993 filed as Exhibit 3.2 to the Company’s annual report on Form 10-K for the fiscal year ended December 31, 1993, and incorporated herein by reference. |
|
|
|
|
|
|
|
3.3 |
|
Certificate of Amendment of Certificate of Incorporation of the Company filed with the Secretary of State of Delaware on May 29, 1996 filed as Exhibit 3.3 to the Company’s annual report on Form 10-K for the fiscal year ended December 31, 1996, and incorporated herein by reference. |
|
|
|
|
|
|
|
3.4 |
|
Certificate of Amendment of Certificate of Incorporation of the Company filed with the Secretary of State of Delaware on June 16, 2014, filed as Exhibit 3.4 to the Company’s Quarterly Report on Form 10-Q for the quarter ended June 28, 2014, and incorporated herein by reference. |
|
|
|
|
|
|
|
3.5 |
|
Third Amended and Restated Bylaws, filed as Exhibit 3.1 to the Company’s current report on Form 8-K, filed on November 10, 2014, and incorporated herein by reference. |
|
|
|
|
|
|
|
10.1 |
|
Special Vehicle Manufacturer Converters Agreement with General Motors Corporation, effective February 29, 2008, between General Motors Corporation and Supreme Corporation, filed as Exhibit 10.11 to the Company’s annual report on Form 10-K for the fiscal year ended December 27, 2008, and incorporated herein by reference. |
|
|
|
|
|
|
|
10.2 |
|
Ford Authorized Converter Pool Agreement, effective May 1, 2008, among Ford Motor Company, Supreme Corporation and certain subsidiaries, filed as Exhibit 10.12 to the Company’s annual report on Form 10-K for the fiscal year ended December 27, 2008, and incorporated herein by reference. |
|
|
|
|
|
|
|
10.3 |
|
Asset Purchase Agreement dated as of February 28, 2014 between Supreme Corporation and Forest River Manufacturing, LLC, filed as Exhibit 2(a) to the Company’s Current Report on Form 8-K filed on March 6, 2014, and incorporated herein by reference. |
|
|
|
|
|
|
|
10.4 |
|
Special Vehicle Manufacturer Converters Agreement effective August 1, 2013, between General Motors LLC and Supreme Corporation, filed as Exhibit 10.40 to the Company’s annual report on Form 10-K for the fiscal year ended December 28, 2013, and incorporated herein by reference. |
|
|
|
|
|
|
+ |
10.5 |
|
2001 Stock Option Plan, filed as Exhibit 10.6 to the Company’s annual report on Form 10-K for the fiscal year ended December 31, 2001, and incorporated herein by reference. |
|
|
|
|
|
|
+ |
10.6 |
|
Amendment No. 1 to the Company’s 2001 Stock Option Plan, filed as Exhibit 10.7 to the Company’s annual report on Form 10-K for the fiscal year ended December 31, 2001, and incorporated herein by reference. |
|
|
|
|
|
|
+ |
10.7 |
|
2004 Stock Option Plan, filed as Exhibit 4.1 to the Company’s Registration Statement on Form S-8 effective on August 26, 2004, and incorporated herein by reference. |
|
|
|
|
|
|
+ |
10.8 |
|
Amended and Restated 2004 Stock Option Plan filed as Exhibit A to the Company’s Revised Definitive Proxy Statement filed on April 5, 2006, and incorporated herein by reference. |
|
|
|
|
|
|
+ |
10.9 |
|
Amendment Number One to the Company’s Amended and Restated 2004 Stock Option Plan dated October 25, 2006, included in the Company’s Definitive Proxy Statement filed on April 2, 2007, and incorporated herein by reference. |
|
|
|
|
|
|
+ |
10.10 |
|
Amendment No. Two to the Company’s Amended and Restated 2004 Stock Option Plan dated March 28, 2007, included in the Company’s Definitive Proxy Statement filed on April 2, 2007, and incorporated herein by reference. |
|
|
|
|
|
|
+ |
10.11 |
|
Amendment No. Three to the Company’s Amended and Restated 2004 Stock Option Plan dated March 25, 2008, included in the Company’s Definitive Proxy Statement filed on April 3, 2008, and incorporated herein by reference. |
|
Exhibit |
|
Description | |
|
+ |
10.12 |
|
Amendment No. Four to the Company’s Amended and Restated 2004 Stock Option Plan dated August 25, 2009, filed as Exhibit 10.3 to the Company’s quarterly report on Form 10-Q for the quarterly period ended September 26, 2009, and incorporated herein by reference. |
|
|
|
|
|
|
+ |
10.13 |
|
2012 Long-Term Incentive Plan, filed as Exhibit 10.1 to the Company’s Current Report on Form 8-K filed on May 29, 2012, and incorporated herein by reference. |
|
|
|
|
|
|
+ |
10.14 |
|
2016 Long-Term Incentive Plan, filed as Exhibit 10.1 to the Company’s Current Report on Form 8-K filed on June 1, 2016, and incorporated herein by reference. |
|
|
|
|
|
|
+ |
10.15 |
|
Ownership Transaction Incentive Plan, filed as Exhibit 10.1 to the Company’s Current Report on Form 8-K filed on March 8, 2016, and incorporated herein by reference. |
|
|
|
|
|
|
+ |
10.16 |
|
Amended and Restated Ownership Transaction Incentive Plan, filed as Exhibit 10.1 to the Company’s Current Report on Form 8-K filed on May 6, 2016, and incorporated herein by reference. |
|
|
|
|
|
|
+ |
10.17 |
|
Form of Supreme Industries, Inc. Director and Officer Indemnification Agreement, filed as Exhibit 10.1 to the Company’s Current Report on Form 8-K filed on October 6, 2008, and incorporated herein by reference. |
|
|
|
|
|
|
+ |
10.18 |
|
Indemnification Agreement, effective as of May 6, 2013, by and between Supreme Industries, Inc. and Mark D. Weber, filed as Exhibit 10.2 to the Company’s Current Report on Form 8-K filed on April 19. 2013, and incorporated herein by reference. |
|
|
|
|
|
|
+ |
10.19 |
|
Indemnification Agreement by and among Supreme Industries, Inc. and Matthew W. Long dated December 29, 2011, filed as Exhibit 10.2 to the Company’s Current Report on Form 8-K filed on January 5, 2012, and incorporated herein by reference. |
|
|
|
|
|
|
+ |
10.20 |
|
Amended and Restated Employment Contract by and among Supreme Industries, Inc. and Herbert M. Gardner dated to be effective January 1, 2005, filed as Exhibit 10.2 to the Company’s Current Report on Form 8-K dated February 10, 2006, and incorporated herein by reference. |
|
|
|
|
|
|
+ |
10.21 |
|
Amended and Restated Employment Contract by and among Supreme Industries, Inc. and William J. Barrett dated to be effective January 1, 2005, filed as Exhibit 10.3 to the Company’s Current Report on Form 8-K dated February 10, 2006, and incorporated herein by reference. |
|
|
|
|
|
|
+ |
10.22 |
|
Amendment Number One to Employment Contract between Supreme Industries, Inc. and William J. Barrett, effective June 29, 2012, filed as Exhibit 10.4 to the Company’s Form 10-Q for the quarter ended June 30, 2012, and incorporated herein by reference. |
|
|
|
|
|
|
+ |
10.23 |
|
Amendment Number One to Employment Contract between Supreme Industries, Inc. and Herbert M. Gardner, effective June 29, 2012, filed as Exhibit 10.5 to the Company’s Form 10-Q for the quarter ended June 30, 2012, and incorporated herein by reference. |
|
|
|
|
|
|
+ |
10.24 |
|
Amended and Restated Employment Agreement, effective as of May 6, 2016, by and among Supreme Industries, Inc., Supreme Corporation, and Mark D. Weber, filed as Exhibit 10.1 to the Company’s Current Report on Form 8-K filed on November 15, 2016, and incorporated herein by reference. |
|
|
|
|
|
|
+ |
10.25 |
|
Amended and Restated Employment Agreement, effective as of May 6, 2016, by and among Supreme Industries, Inc., Supreme Corporation, and Matthew W. Long, filed as Exhibit 10.1 to the Company’s Current Report on Form 8-K filed on January 9, 2017, and incorporated herein by reference. |
|
|
|
|
|
|
|
10.26 |
|
Amended and Restated Credit Agreement, dated as of April 29, 2013, by and among Supreme Industries, Inc. and Wells Fargo Bank, National Association, filed as Exhibit 10.1 to the Company’s Current Report on Form 8-K filed on May 3, 2013, and incorporated herein by reference. |
|
Exhibit |
|
Description | |
|
|
10.27 |
|
Omnibus Amendment and Reaffirmation Agreement, dated as of April 29, 2013, by and among Supreme Industries, Inc., the subsidiaries of Supreme Industries, Inc. and Wells Fargo Bank, National Association, filed as Exhibit 10.2 to the Company’s Current Report on Form 8-K filed on May 3, 2013, and incorporated herein by reference. |
|
|
|
|
|
|
|
10.28 |
|
Amendment No. 1 to Credit Agreement, dated as of April 17, 2014, by and among Supreme Industries, Inc., Wells Fargo Bank, National Association and BMO Harris Bank, N.A., and acknowledged by Supreme Corporation and other subsidiary guarantors, filed as Exhibit 10.2 to the Company’s Quarterly Report on Form 10-Q for the quarter ended September 27, 2014, and incorporated herein by reference. |
|
|
|
|
|
|
|
10.29 |
|
Amendment No. 2 to Credit Agreement, executed as of August 27, 2014, by and among Supreme Industries, Inc., Wells Fargo Bank, National Association, and BMO Harris Bank, N.A., and acknowledged by Supreme Corporation and other subsidiary guarantors, filed as Exhibit 10.1 to the Company’s Current Report on Form 8-K filed on September 2, 2014, and incorporated herein by reference. |
|
|
|
|
|
|
|
10.30 |
|
Amendment No. 3 to Credit Agreement, executed as of November 19, 2015, by and among Supreme Industries, Inc., Wells Fargo Bank, National Association, and BMO Harris Bank, N.A., and acknowledged by Supreme Corporation and other subsidiary guarantors, filed as Exhibit 10.1 to the Company’s Current Report on Form 8-K filed on November 25, 2015, and incorporated herein by reference. |
|
|
|
|
|
|
|
10.31 |
|
Amendment No. 4 to Credit Agreement, executed as of November 16, 2016, by and among Supreme Industries, Inc., Wells Fargo Bank, National Association, and BMO Harris Bank, N.A., and acknowledged by Supreme Corporation and other subsidiary guarantors, filed as Exhibit 10.1 to the Company’s Current Report on Form 8-K filed on November 22, 2016, and incorporated herein by reference. |
|
|
|
|
|
|
+ |
10.32 |
|
2016 Supreme Cash Bonus Plan, filed as Exhibit 10.1 to the Company’s Quarterly Report on Form 10-Q for the quarter ended March 26, 2016, and incorporated herein by reference. |
|
|
|
|
|
|
+ |
10.33 |
|
2015 Supreme Cash Bonus Plan, filed as Exhibit 10.1 to the Company’s Quarterly Report on Form 10-Q for the quarter ended September 26, 2015, and incorporated herein by reference. |
|
|
|
|
|
|
+* |
10.34 |
|
Form of Restricted Stock Award Agreement, 2013 to present for Mark D. Weber; 2017 for Matthew W. Long. |
|
|
|
|
|
|
+* |
10.35 |
|
Form of Restricted Stock Award Agreement, 2012 to present for all grantees other than Mark D. Weber and, beginning in 2017, Matthew W. Long. |
|
|
|
|
|
|
* |
21.1 |
|
Subsidiaries of the Registrant. |
|
|
|
|
|
|
* |
23.1 |
|
Consent of Crowe Horwath LLP, Independent Registered Public Accounting Firm. |
|
|
|
|
|
|
* |
31.1 |
|
Certification of Chief Executive Officer pursuant to Section 302 of the Sarbanes-Oxley Act of 2002. |
|
|
|
|
|
|
* |
31.2 |
|
Certification of Chief Financial Officer pursuant to Section 302 of the Sarbanes-Oxley Act of 2002. |
|
|
|
|
|
|
* |
32.1 |
|
Certification of Chief Executive Officer pursuant to Section 906 of the Sarbanes-Oxley Act of 2002. |
|
|
|
|
|
|
* |
32.2 |
|
Certification of Chief Financial Officer pursuant to Section 906 of the Sarbanes-Oxley Act of 2002. |
|
|
|
|
|
|
* |
101 |
|
The following financial statements from the Company’s Annual Report on Form 10-K for the fiscal year ended December 31, 2016, filed on March 3, 2017, formatted in XBRL: (i) Consolidated Balance Sheets, (ii) Consolidated Statements of Comprehensive Income, (iii) Consolidated Statements of Equity, (iv) Consolidated Statements of Cash Flows and (v) the Notes to Consolidated Financial Statements. |
* Filed herewith.
+ Management contract or compensatory plan or arrangement.