Attached files
| file | filename |
|---|---|
| EX-21.1 - EX-21.1 - Daseke, Inc. | a17-8418_1ex21d1.htm |
UNITED STATES
SECURITIES AND EXCHANGE COMMISSION
Washington, D.C. 20549
FORM 8-K/A
(Amendment No. 1)
CURRENT REPORT
Pursuant to Section 13 or 15(d)
of The Securities Exchange Act of 1934
Date of Report (Date of Earliest Event Reported): February 27, 2017
DASEKE, INC.
(Exact name of registrant as specified in its charter)
|
Delaware |
|
001-37509 |
|
47-3913221 |
|
15455 Dallas Parkway, Suite 440 |
|
75001 |
|
(Address of Principal Executive Offices) |
|
(Zip Code) |
Registrant’s Telephone Number, Including Area Code: (972) 248-0412
Not applicable
(Former Name or Former Address, If Changed Since Last Report)
Check the appropriate box below if the Form 8-K filing is intended to simultaneously satisfy the filing obligation of the registrant under any of the following provisions:
oWritten communications pursuant to Rule 425 under the Securities Act (17 CFR 230.425)
oSoliciting material pursuant to Rule 14a-12 under the Exchange Act (17 CFR 240.14a-12)
oPre-commencement communications pursuant to Rule 14d-2(b) under the Exchange Act (17 CFR 240.14d-2(b))
oPre-commencement communications pursuant to Rule 13e-4(c) under the Exchange Act (17 CFR 240.13e-4(c))
Explanatory Note
This Amendment No. 1 on Form 8-K/A (this “Amendment”) to the Current Report on Form 8-K of Daseke, Inc., originally filed with the Securities and Exchange Commission (the “SEC”) on March 3, 2017 (the “ Original Form 8-K”), is being filed solely to amend and restate in their entirety Item 2.01 and Item 9.01 in the Original Form 8-K. No other changes have been made to the Original Form 8-K. References to “this Form 8-K” are to the Original Form 8-K as amended by this Amendment.
Introductory Note
On February 27, 2017 (the “Closing Date”), the registrant consummated the previously announced merger of a wholly owned subsidiary of the registrant (“Merger Sub”) with and into Daseke, Inc., with Daseke, Inc. surviving (the “Surviving Company”) as a direct wholly owned subsidiary of the registrant (the “Business Combination”), in accordance with the Agreement and Plan of Merger, dated December 22, 2016 (the “Merger Agreement”), by and among the registrant, HCAC Merger Sub, Inc., Daseke, Inc. and Don R. Daseke, solely in his capacity as the Stockholder Representative (as defined therein).
In connection with the closing of the Business Combination (the “Closing”), the Surviving Company, a direct wholly owned subsidiary of the registrant, changed its name from Daseke, Inc. to Daseke Companies, Inc., and the registrant changed its name from Hennessy Capital Acquisition Corp. II to Daseke, Inc. The registrant (now named Daseke, Inc.) is a holding company and derives all of its operating income from its subsidiary, Daseke Companies, Inc.
Unless the context otherwise requires, “we,” “us,” “our” and the “Company” refer to Daseke, Inc. and its consolidated subsidiaries at and after the Closing, “Daseke” refers to Daseke, Inc. and its consolidated subsidiaries prior to the Closing, and “Hennessy Capital” refers to the registrant prior to the Closing.
In connection with its execution of the Merger Agreement, Hennessy Capital entered into, among other things, backstop and subscription agreements (the “Backstop and Subscription Agreements”) with certain institutional accredited investors (such investors referred to collectively as the “Backstop Commitment Investors”) and preferred subscription agreements with certain institutional accredited investors (collectively, the “Preferred Financing Investors”). In the Backstop and Subscription Agreements, the Backstop Commitment Investors made a commitment (the “Backstop Commitment”) pursuant to which they agreed to purchase an aggregate of up to $35.0 million in shares of Hennessy Capital common stock (as and to the extent requested by Hennessy Capital), through (x) open market or privately negotiated transactions with third parties (including forward contracts), (y) a private placement to occur concurrently with the consummation of the Business Combination at a purchase price of $10.00 per share, or (z) a combination thereof. In the preferred subscription agreements, the Preferred Financing Investors agreed to purchase from Hennessy Capital, concurrent with the consummation of the Closing, 650,000 shares of the Company’s 7.625% Series A Convertible Preferred Stock (the “Series A Preferred Stock”) for an aggregate purchase price of $65.0 million (the “Preferred Financing”).
On February 24, 2017, Hennessy Capital exercised the Backstop Commitment in full, and the Backstop Commitment Investors purchased an aggregate of $35.0 million in shares of Hennessy Capital common stock through open market or privately negotiated transactions with third parties at a purchase price of up to $10.00 per share.
Item 2.01 Completion of Acquisition or Disposition of Assets.
The disclosure set forth under “Introductory Note” above and in Item 2.01 “Completion of Acquisition or Disposition of Assets” in the Company’s Current Report on Form 8-K filed with the SEC on February 27, 2017 is incorporated in this Item 2.01 by reference.
Prior to the Closing, Hennessy Capital was a shell company with no operations, formed as a vehicle to effect a business combination with one or more operating businesses. After the Closing, the Company became a holding company whose assets primarily consist of interests in its direct wholly-owned subsidiary, Daseke
Companies, Inc. and the direct and indirect subsidiaries thereof. The following information is provided about the business of the Company following the consummation of the Business Combination,
Cautionary Note Regarding Forward-Looking Statements
We make forward-looking statements in this Form 8-K, including in the statements incorporated herein by reference. These forward-looking statements relate to expectations for future financial performance, business strategies or expectations for our business. These forward-looking statements are often preceded by, followed by or include the words “estimate,” “plan,” “project,” “forecast,” “intend,” “expect,” “anticipate,” “believe,” “seek,” “target,” “will” or similar expressions. Specifically, forward-looking statements may include statements relating to:
·the benefits of the Business Combination;
·the future financial performance of the Company following the Business Combination;
·changes in the market for the Company’s services; and
·expansion plans and opportunities, including future acquisitions or additional business combinations.
These forward-looking statements are based on information available as of the date of this Amendment (or, in the case of forward-looking statements incorporated herein by reference, as of the date of they were originally made), and expectations, forecasts and assumptions based on such information, and involve a number of judgments, risks and uncertainties. Accordingly, forward-looking statements should not be relied on as representing our views as of any subsequent date, and we do not undertake any obligation to update forward-looking statements to reflect events or circumstances after the date they were made, whether as a result of new information, future events or otherwise, except as may be required under applicable securities laws. As a result of a number of known and unknown risks and uncertainties, our actual results or performance may be materially different from those expressed or implied by these forward-looking statements. Some factors that could cause actual results to differ include:
·the outcome of any legal proceedings that may be instituted against us following consummation of the Business Combination and the transactions contemplated thereby;
·the inability to maintain the listing of the Company’s common stock and warrants on The Nasdaq Capital Market following the Business Combination;
·the risk that the Business Combination disrupts current plans and operations as a result of the consummation of the transactions contemplated thereby;
·the ability to recognize the anticipated benefits of the Business Combination, which may be affected by, among other things, competition and the Company’s ability to grow and manage growth profitably;
·the possibility that we may be adversely affected by other economic, business or competitive factors;
·changes in applicable laws or regulations; and
·other risks and uncertainties indicated in Hennessy Capital’s definitive proxy statement dated February 6, 2017 (the “Proxy Statement”), including those under “Risk Factors—Risk Factors Relating to Daseke’s Business and Industry” beginning on page 63, as well as those identified under “Risk Factors” in this Item 2.01.
Business
The business of the Company, including a description of its properties, is described in the Proxy Statement in the section entitled “Information About Daseke” beginning on page 229, which is incorporated by reference herein. The business of Hennessy Capital is described in the Proxy Statement in the Section entitled “Information About Hennessy Capital” beginning on page 208, which incorporated by reference herein. The below provides additional information about the Company’s business.
Overview
The Company is a leading consolidator of the open deck freight market in North America and, of the 50 largest U.S. trucking companies, Daseke was one of the fastest-growing companies in 2015.(1) Through its acquisition of nine operating companies, the Company believes it has become the largest owner of open deck equipment(2) and
(1) Journal of Commerce, April 2016
(2) CCJ Top 250, September 2016
the second largest provider of open deck transportation and logistics solutions by revenue in North America.(3) From 2009 to 2016, Daseke grew revenue from $30 million to $652 million at a compound annual growth rate (“CAGR”) of 55%. Although net loss increased from $0.4 million to $12.3 million from 2009 to 2016, Adjusted EBITDA grew from $6 million to $88 million at a CAGR of 47%.(4)
The Company operates an “asset right” business model that combines strategic equipment ownership with complementary asset-light operations, which maximizes scale, growth, flexibility and profitability. Asset-based operations have the benefit of providing shippers with certainty of delivery and continuity of operations, which is often a customer requirement. Alternatively, the Company’s asset-light operations offer flexibility and scalability to meet customers’ dynamic needs and have lower fixed costs, lower capital expenditure requirements and higher returns on invested capital. The Company’s asset-light operations provide the ability to expand during periods of high demand with minimal incremental investment and the ability to contract during times of lower demand with limited redundancy costs or under-utilized assets. The Company’s asset-light service solutions consist of owner-operator transportation and freight brokerage, which generated approximately 34% of Daseke’s freight and brokerage revenue in 2016.
The Company’s open deck fleet consists of approximately 2,900 tractors and 6,300 trailers, which allows it to serve the largest national customers throughout North America. In 2016, Daseke’s company and owner-operator drivers drove approximately 247 million miles. The Company provides solutions that can broadly be classified under three categories:
· Company freight (66% of Daseke’s 2016 freight and brokerage revenue) are loads that are fulfilled by company-owned equipment. As of December 31, 2016, Daseke operated a fleet of 2,300 company-owned tractor units and 6,300 trailers, supported by 2,100 company drivers.
· Owner-operator freight (20% of Daseke’s 2016 freight and brokerage revenue) consists of loads transported by independent contractors who provide asset-light capacity to the Company under exclusive arrangements. As of December 31, 2016, Daseke’s owner-operators operated a fleet of 600 tractor units.
· Freight brokerage (14% of Daseke’s 2016 freight and brokerage revenue) refers to non-asset services in which the Company arranges for third-party transportation and logistics companies under non-exclusive contractual arrangements to haul freight that does not fit within its network or economic objectives. The Company leverages relationships with a large and diverse group of more than 5,000 third-party carriers to provide scalable capacity and reliable service to its customers.
The Company provides these solutions through two reportable segments: Flatbed Solutions and Specialized Solutions.
· Flatbed Solutions focuses on delivering transportation and logistics solutions that principally require the use of flatbed and retractable-sided transportation equipment. The Company’s Flatbed Solutions segment hauls construction products, building materials, roofing, aluminum, iron and steel, among other products. As of December 31, 2016, Daseke’s Flatbed Solutions segment operated 1,600 tractors and 2,900 trailers. Daseke’s Flatbed Solutions segment generated revenue of $310 million in 2016.
· Specialized Solutions focuses on delivering transportation and logistics solutions that principally include super heavy haul, high-value customized, over-dimensional, step deck and removable gooseneck (RGN) solutions. Many of the shippers served by the Company’s Specialized Solutions segment require highly
(3) “Top 100 For-Hire Carriers,” 2016 Transport Topics
(4) Adjusted EBITDA is not a recognized measure under accounting principles that are generally accepted in the United States of America. For a definition of Adjusted EBITDA and a reconciliation of Adjusted EBITDA to net income, see “Management’s Discussion and Analysis of Financial Condition and Results of Operations and Quantitative and Qualitative Disclosures About Market Risk—Non-GAAP Financial Measures.”
engineered solutions and customized equipment to meet their unique transportation needs. Examples of the products the Company’s Specialized Solutions segment haul include aviation parts, wind turbines, agricultural equipment, building and construction equipment, manufacturing equipment and industrial machinery. As of December 31, 2016, Daseke’s Specialized Solutions segment operated 1,300 tractors and 3,400 trailers. Daseke’s Specialized Solutions segment generated revenue of $346 million in 2016.
Below are charts that show the contribution of each reportable segment to Daseke’s consolidated total revenue, net income (loss) and Adjusted EBITDA for 2016. Adjusted EBITDA is not a recognized measure under accounting principles generally accepted in the United States (“GAAP”). For a definition of Adjusted EBITDA and a reconciliation of Adjusted EBITDA to net loss, see “Management’s Discussion and Analysis of Financial Condition and Results of Operations and Quantitative and Qualitative Disclosures About Market Risk—Non-GAAP Financial Measures” below.
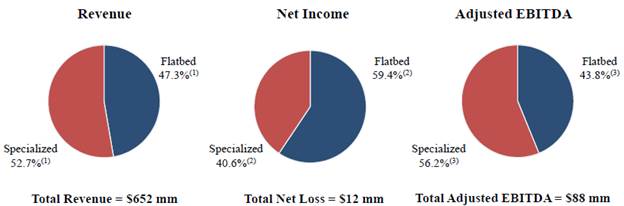
(1) Percentages are calculated based on revenues of each segment, inclusive of $2.1 million and $2.4 million of intersegment revenues for the Flatbed Solutions segment and the Specialized Solutions segment, respectively. Such intersegment revenues are eliminated in Daseke’s consolidated results.
(2) Percentages are calculated based on the net income of each segment, without including $14.6 million of unallocated corporate overhead in either the numerator or denominator.
(3) Percentages are calculated based on the Adjusted EBITDA of each segment, without including $2.8 million of unallocated corporate overhead in either the numerator or denominator.
Operations
Revenue Equipment. As of December 31, 2016, Daseke operated 2,300 company-owned tractors with an average age of 2.2 years. Daseke also had under contract 600 tractors owned and operated by independent contractors as of December 31, 2016. Daseke also operated 6,300 trailers as of December 31, 2016.
Customers. The Company believes that it provides one of the most comprehensive transportation and logistics solutions offerings in the open deck industry. The Company delivers a diverse offering of transportation and logistics solutions to approximately 3,600 customers across 49 U.S. states, Canada and Mexico through two reportable segments: Flatbed Solutions and Specialized Solutions. In 2016, Daseke’s Flatbed Solutions segment provided transportation and logistics solutions to more than 1,900 customers, and Daseke’s Specialized Solutions segment provided unique, value-added transportation and logistics solutions to more than 2,100 customers. See Note 20 of Daseke’s audited consolidated financial statements included in this Form 8-K for information on its two reportable segments.
A material portion of the Company’s revenue is generated from its major customers, the loss of one or more of which could have a material adverse effect on its business. In 2016, no customer of the Flatbed Solutions segment or the Specialized Solutions segment accounted for more than 10% of its consolidated total revenue.
Employees and Independent Contractors
As of December 31, 2016, there were approximately 2,892 full-time employees in Daseke’s total employee headcount of approximately 2,900, which includes approximately 2,100 drivers. The Company is not a party to any collective bargaining agreements.
The Company also contracts with owner-operator drivers to provide and operate tractors, which provide additional revenue equipment capacity. Independent contractors own their own tractors and are responsible for all associated expenses, including financing costs, fuel, maintenance, insurance and highway use taxes. As of December 31, 2016, Daseke had 600 independent contractors, who accounted for approximately 23% of total miles in 2016.
Available Information
We file annual, quarterly and current reports, proxy statements and other information with the SEC. Our SEC filings are available to the public through the Internet at the SEC’s website at http://www.sec.gov. You may also read and copy any document we file with the SEC at the SEC’s public reference room at 100 F Street, N.E. Washington, D.C. 20549. Please call the SEC at 1-800-SEC-0330 for further information about its public reference facilities and their copy charges.
We also make available free of charge on our Internet website http://investor.daseke.com all of the documents that we file with the SEC as soon as reasonably practicable after we electronically file those documents with the SEC. Information contained on our website is not incorporated by reference into this Form 8-K, and you should not consider information contained on our website as part of this Form 8-K.
Risk Factors
Risk factors related to the Company’s business, operations and industry and ownership of our common stock are described in the Proxy Statement in the section entitled “Risk Factors” beginning on page 63, which is incorporated by reference herein. The below provides additional risk factors. These risk factors are not exhaustive. We may face additional risks and uncertainties that are not presently known to us, or that we currently deem immaterial, which may also impair our business. The risk factors should be read in conjunction with the financial statements and notes to the financial statements included elsewhere in this Form 8-K.
The Company may not be able to generate sufficient cash to service all of its indebtedness and may be forced to take other actions to satisfy its obligations under applicable debt instruments, which may not be successful.
As of February 28, 2017, the Company had approximately $295.0 million of indebtedness outstanding. Its ability to make scheduled payments on or to refinance its indebtedness obligations depends on its financial condition and operating performance, which are subject to prevailing economic and competitive conditions and certain financial, business and other factors beyond its control. The Company may not be able to maintain a level of cash flows from operating activities sufficient to permit it to pay the principal, premium, if any, and interest on its indebtedness.
If the Company’s cash flows and capital resources are insufficient to fund debt service obligations, the Company may be forced to reduce or delay investments and capital expenditures, sell assets, seek additional capital or restructure or refinance indebtedness. The Company’s ability to restructure or refinance indebtedness will depend on the condition of the capital markets and its financial condition at such time. Any refinancing of indebtedness could be at higher interest rates and may require the Company to comply with more onerous covenants, which could further restrict business operations. The terms of existing or future debt instruments may restrict the Company from adopting some of these alternatives. In addition, any failure to make payments of interest and principal on outstanding indebtedness on a timely basis would likely result in a reduction of the Company’s credit rating, which could harm its ability to incur additional indebtedness. In the absence of sufficient cash flows and capital resources, the Company could face substantial liquidity problems and might be required to dispose of material assets or operations to meet debt service and other obligations. However, the proceeds of any such disposition may not be adequate to meet any debt service obligations then due.
The Company’s leverage and debt service obligations may adversely affect its financial condition, results of operations, business prospects and ability to make payments on its debt obligations.
As of February 28, 2017, the Company had approximately $295.0 million of indebtedness outstanding. The Company’s level of indebtedness could adversely affect it in several ways, including the following:
· require the Company to dedicate a substantial portion of its cash flow from operations to service its existing debt, thereby reducing the cash available to finance its operations and other business activities;
· limit management’s discretion in operating its business and its flexibility in planning for, or reacting to, changes in its business and the industry in which it operates;
· increase its vulnerability to downturns and adverse developments in its business and the economy generally;
· limit its ability to access the capital markets to raise capital on favorable terms or to obtain additional financing for working capital, capital expenditures or acquisitions or to refinance existing indebtedness;
· place restrictions on its ability to obtain additional financing, make investments, lease equipment, sell assets and engage in business combinations;
· make it more likely that a reduction in its borrowing base following a periodic redetermination could require it to repay a portion of its then-outstanding bank borrowings;
· make it vulnerable to increases in interest rates as indebtedness under the Company’s credit facilities may vary with prevailing interest rates;
· place it at a competitive disadvantage relative to competitors with lower levels of indebtedness in relation to their overall size or less restrictive terms governing their indebtedness; and
· make it more difficult for it to satisfy its obligations under its debt instruments and increase the risk that it may default on its debt obligations.
Increases in interest rates could adversely affect the Company’s business.
The Company’s business and operating results can be harmed by factors such as the availability, terms of and cost of capital, increases in interest rates or a reduction in credit rating. These changes could cause the Company’s cost of doing business to increase and limit its ability to pursue acquisition opportunities. For example, as of February 28, 2017, outstanding borrowings under the Term Loan Facility (as defined in the Original Form 8-K) was $250 million, and a 1.0% increase in interest rates would result in an increase in annual interest expense of approximately $2.5 million, assuming the $250 million in debt is outstanding for the full year, before the effects of income taxes. Recent and continuing disruptions and volatility in the global financial markets may lead to a contraction in credit availability impacting its ability to finance its operations. The Company requires continued access to capital. A significant reduction in cash flows from operations or the availability of credit could materially and adversely affect its ability to achieve its planned growth and operating results.
The Company derives a material portion of its revenue from its major customers, the loss of one or more of which could have a material adverse effect on its business.
A material portion of the Company’s revenue is generated from its major customers, the loss of one or more of which could have a material adverse effect on the Company’s business. In 2016 and 2015, Daseke’s top ten customers, based on revenue, accounted for approximately 23% and 33%, respectively, of Daseke’s revenue, and Daseke’s largest customer accounted for approximately 8% of its revenue in both 2016 and 2015. A material portion of the Company’s freight is from customers in the building materials industry, and as such, the Company’s results may be more susceptible to trends in construction cycles, which are affected by numerous factors, including rates of infrastructure spending, real estate equity values, interest rates and general economic conditions, than carriers that do not have this concentration.
Economic conditions and capital markets may adversely affect the Company’s customers and their ability to remain solvent. The Company’s customers’ financial difficulties can negatively impact the Company’s results of operations and financial condition and the Company’s ability to comply with the covenants in its debt agreements,
especially if they were to delay or default on payments to the Company. Generally, the Company does not have contractual relationships that guarantee any minimum volumes with customers, and the Company cannot assure you that customer relationships will continue as presently in effect. A reduction in, or termination of, the Company’s services by one or more of its major customers could have a material adverse effect on the Company’s business and operating results.
The Company’s contractual agreements with its owner-operators expose it to risks that it does not face with its company drivers.
The Company relies, in part, upon independent contractor owner-operators to perform the services for which it contracts with customers. Approximately 20% of Daseke’s freight was carried by independent contractor owner-operators in 2016. The Company’s reliance on independent contractor owner-operators creates numerous risks for the Company’s business. For example, the Company provides financing to certain of its independent contractor owner-operators purchasing tractors from the Company. If owner-operators operating the tractors the Company financed default under or otherwise terminate the financing arrangement and the Company is unable to find a replacement owner-operator, the Company may incur losses on amounts owed to it with respect to the tractor in addition to any losses it may incur as a result of idling the tractor. Further, if the Company is unable to provide such financing in the future, due to liquidity constraints or other restrictions, the Company may experience a shortage of owner-operators available to it.
If the Company independent contractor owner-operators fail to meet the Company contractual obligations or otherwise fail to perform in a manner consistent with the Company’s requirements, the Company may be required to use alternative service providers at potentially higher prices or with some degree of disruption of the services that the Company provides to customers. If the Company fails to deliver on time, if its contractual obligations are not otherwise met, or if the costs of its services increase, then the Company’s profitability and customer relationships could be harmed.
The financial condition and operating costs of the Company’s independent contractor owner-operators are affected by conditions and events that are beyond the Company’s control and may also be beyond their control. Adverse changes in the financial condition of the Company’s independent contractor owner-operators or increases in their equipment or operating costs could cause them to seek higher revenues or to cease their business relationships with the Company. The prices the Company charges its customers could be impacted by such issues, which may in turn limit pricing flexibility with customers, resulting in fewer customer contracts and decreasing the Company’s revenues.
Independent contractor owner-operators typically use tractors, trailers and other equipment bearing the Company’s trade names and trademarks. If one of the Company’s independent contractor owner-operators is subject to negative publicity, it could reflect on the Company and have a material adverse effect on the Company’s business, brand and financial performance. Under certain laws, the Company could also be subject to allegations of liability for the activities of its independent contractor owner-operators.
Owner-operators are third-party service providers, as compared to company drivers who are employed by the Company. As independent business owners, the Company’s owner-operators may make business or personal decisions that conflict with the Company’s best interests. For example, if a load is unprofitable, route distance is too far from home or personal scheduling conflicts arise, an owner-operator may deny loads of freight from time to time. In these circumstances, the Company must be able to timely deliver the freight in order to maintain relationships with customers.
The Company’s total assets include goodwill and indefinite-lived intangibles. If the Company determines that these items have become impaired in the future, net income could be materially and adversely affected.
As of December 31, 2016, Daseke had recorded goodwill of $89.0 million and indefinite-lived intangible assets of $30.1 million, net of accumulated amortization. Goodwill represents the excess of cost over the fair market value of net assets acquired in business combinations. In accordance with Financial Accounting Standards Board
Accounting Standards Codification, Topic 350, “Intangibles — Goodwill and Other,” the Company tests goodwill and indefinite-lived intangible assets for potential impairment annually and between annual tests if an event occurs or circumstances change that would more likely than not reduce the fair value below its carrying amount. Any excess in carrying value over the estimated fair value is charged to the Company’s results of operations. Further, the Company may never realize the full value of its intangible assets. Any future determination requiring the write-off of a significant portion of intangible assets could have an adverse effect on the Company’s financial condition and results of operations. If there are changes to the methods used to allocate carrying values, if management’s estimates of future operating results change, if there are changes in the identified reporting units or if there are changes to other significant assumptions, the estimated carrying values and the estimated fair value of the Company’s goodwill and long-lived assets could change significantly, and could result in future non-cash impairment charges, which could materially impact its results of operations and financial condition for any such future period.
Selected Historical Consolidated Financial and Other Data of Daseke
The following selected historical consolidated financial information is provided to assist in the analysis of Daseke financial performance. The table below provides Daseke’s revenue, net income (loss), Adjusted EBITDA and free cash flow for the years ended December 31, 2016, 2015, 2014, 2013, 2012, 2011, 2010 and 2009 on a historical basis. The historical revenue, net income (loss), Adjusted EBITDA and free cash flow for the years ended December 31, 2013, 2012, 2011, 2010 and 2009 are derived from Daseke’s audited historical consolidated financial statements not included in this Form 8-K. The historical revenue, net income (loss), Adjusted EBITDA and free cash flow for the years ended December 31, 2016, 2015 and 2014 are derived from Daseke’s audited historical consolidated financial statements included elsewhere in this Form 8-K.
|
|
|
Year Ended December 31, |
| ||||||||||||||||||||||
|
(in thousands) |
|
2016 |
|
2015 |
|
2014 |
|
2013 |
|
2012 |
|
2011 |
|
2010 |
|
2009 |
| ||||||||
|
Total revenue |
|
$ |
651,802 |
|
$ |
678,845 |
|
$ |
542,711 |
|
$ |
206,543 |
|
$ |
119,520 |
|
$ |
49,958 |
|
$ |
39,760 |
|
$ |
30,324 |
|
|
Net income (loss) |
|
$ |
(12,279 |
) |
$ |
3,263 |
|
$ |
1,300 |
|
$ |
(2,976 |
) |
$ |
3,151 |
|
$ |
2,976 |
|
$ |
1,263 |
|
$ |
(381 |
) |
|
Adjusted EBITDA(1) |
|
$ |
88,240 |
|
$ |
97,304 |
|
$ |
70,346 |
|
$ |
23,905 |
|
$ |
19,179 |
|
$ |
9,289 |
|
$ |
7,330 |
|
$ |
6,455 |
|
|
Free cash flow (1) |
|
$ |
56,571 |
|
$ |
30,335 |
|
$ |
(332 |
) |
$ |
3,180 |
|
$ |
(412 |
) |
$ |
4,942 |
|
$ |
5,754 |
|
$ |
5,907 |
|
(1) Adjusted EBITDA and free cash flow are not recognized measures under GAAP. For a definition of Adjusted EBITDA and free cash flow and a reconciliation of Adjusted EBITDA and free cash flow to net income (loss), see “Management’s Discussion and Analysis of Financial Condition and Results of Operations and Quantitative and Qualitative Disclosures About Market Risk—Non-GAAP Financial Measures” below.
The following table sets forth selected historical consolidated financial and other data as of and for the years ended December 31, 2016, 2015 and 2014. Such financial data are derived from Daseke’s audited consolidated financial statements included elsewhere in this Form 8-K. The historical results presented below and above are not necessarily indicative of the results to be expected for any future period and should be read in conjunction with “Management’s Discussion and Analysis of Financial Condition and Results of Operations and Quantitative and Qualitative Disclosures About Market Risk” below and Daseke’s audited consolidated financial statements and the related notes appearing elsewhere in this Form 8-K.
|
|
|
Year Ended December 31, |
| |||||||
|
(Dollars in thousands, except share and per share data) |
|
2016 |
|
2015 |
|
2014 |
| |||
|
Consolidated statement of operations data: |
|
|
|
|
|
|
| |||
|
Total revenue |
|
$ |
651,802 |
|
$ |
678,845 |
|
$ |
542,711 |
|
|
Operating expenses: |
|
|
|
|
|
|
| |||
|
Salaries, wages and employee benefits |
|
197,789 |
|
178,703 |
|
132,205 |
| |||
|
Fuel |
|
66,865 |
|
70,296 |
|
88,031 |
| |||
|
Operations and maintenance |
|
96,100 |
|
98,734 |
|
59,274 |
| |||
|
Purchased freight |
|
154,054 |
|
181,985 |
|
150,654 |
| |||
|
Taxes and licenses |
|
9,222 |
|
9,228 |
|
7,304 |
| |||
|
Insurance and claims |
|
19,114 |
|
19,655 |
|
15,446 |
| |||
|
Depreciation and amortization |
|
67,500 |
|
63,573 |
|
48,575 |
| |||
|
(Gain) loss on disposition of revenue property and equipment |
|
(116 |
) |
(2,184 |
) |
934 |
| |||
|
Impairments |
|
2,005 |
|
— |
|
1,838 |
| |||
|
Other operating expenses |
|
28,636 |
|
27,847 |
|
19,631 |
| |||
|
Total operating expenses |
|
641,169 |
|
647,837 |
|
523,892 |
| |||
|
Income from operations |
|
10,633 |
|
31,008 |
|
18,819 |
| |||
|
Interest expense |
|
23,124 |
|
20,602 |
|
15,978 |
| |||
|
Other income |
|
(375 |
) |
(320 |
) |
(243 |
) | |||
|
Total other expense |
|
22,749 |
|
20,282 |
|
15,735 |
| |||
|
Income (loss) before provision for income taxes |
|
(12,116 |
) |
10,726 |
|
3,084 |
| |||
|
Provision for income taxes |
|
163 |
|
7,463 |
|
1,784 |
| |||
|
Net income (loss) |
|
$ |
(12,279 |
) |
$ |
3,263 |
|
$ |
1,300 |
|
|
Dividends declared per preferred share |
|
$ |
75.00 |
|
$ |
75.00 |
|
$ |
75.00 |
|
|
Net income (loss) available to common stockholders |
|
$ |
(17,049 |
) |
$ |
(1,473 |
) |
$ |
272 |
|
|
Basic net income (loss) per common share |
|
$ |
(117.18 |
) |
$ |
(10.13 |
) |
$ |
2.02 |
|
|
Diluted net income (loss) per common share |
|
$ |
(117.18 |
) |
$ |
(10.13 |
) |
$ |
1.94 |
|
|
Basic weighted average common shares outstanding |
|
145,495 |
|
145,495 |
|
134,581 |
| |||
|
Diluted weighted average common shares outstanding |
|
145,495 |
|
145,495 |
|
140,280 |
| |||
|
Consolidated balance sheet data (at end of period): |
|
|
|
|
|
|
| |||
|
Cash |
|
$ |
3,695 |
|
$ |
4,886 |
|
$ |
2,406 |
|
|
Property and equipment, net |
|
$ |
318,747 |
|
$ |
354,535 |
|
$ |
303,515 |
|
|
Total assets |
|
$ |
570,235 |
|
$ |
627,607 |
|
$ |
509,922 |
|
|
Current liabilities |
|
$ |
92,398 |
|
$ |
109,669 |
|
$ |
89,224 |
|
|
Working capital(1) |
|
$ |
36,282 |
|
$ |
42,538 |
|
$ |
41,401 |
|
|
Long-term debt and other long-term liabilities |
|
$ |
374,774 |
|
$ |
397,888 |
|
$ |
313,583 |
|
|
Total stockholders’ equity |
|
$ |
103,063 |
|
$ |
120,050 |
|
$ |
107,115 |
|
|
Other financial data (unaudited): |
|
|
|
|
|
|
| |||
|
Adjusted EBITDA(2) |
|
$ |
88,240 |
|
$ |
97,304 |
|
$ |
70,346 |
|
|
Adjusted EBITDAR(2) |
|
$ |
101,177 |
|
$ |
106,261 |
|
$ |
76,641 |
|
|
Adjusted EBITDA Margin(2) |
|
13.5 |
% |
14.3 |
% |
13.0 |
% | |||
|
Free cash flow(2) |
|
$ |
56,571 |
|
$ |
30,335 |
|
$ |
(332 |
) |
|
Operating ratio |
|
98.4 |
% |
95.4 |
% |
96.5 |
% | |||
|
Adjusted operating ratio(2) |
|
95.6 |
% |
93.0 |
% |
93.4 |
% | |||
|
Operating statistics (unaudited): |
|
|
|
|
|
|
| |||
|
Total miles |
|
246,989,374 |
|
230,923,639 |
|
192,226,156 |
| |||
|
Company-operated tractors |
|
2,304 |
|
2,267 |
|
1,878 |
| |||
|
Owner-operated tractors |
|
609 |
|
702 |
|
735 |
| |||
|
Number of trailers |
|
6,347 |
|
5,977 |
|
5,515 |
| |||
(1) Working capital is defined as current assets (excluding cash) less current liabilities (excluding the current portion of long-term debt).
(2) Adjusted EBITDA, Adjusted EBITDAR, Adjusted EBITDA Margin, free cash flow and adjusted operating ratio are not recognized measures under GAAP. For a definition of Adjusted EBITDA, Adjusted EBITDAR, Adjusted EBITDA Margin, free cash flow and adjusted operating ratio, a reconciliation of Adjusted EBITDA, Adjusted EBITDAR and free cash flow to net income (loss) and a reconciliation of operating ratio to operating ratio, see “Management’s Discussion and Analysis of Financial Condition and Results of Operations and Quantitative and Qualitative Disclosures About Market Risk—Non-GAAP Financial Measures” below.
Unaudited Pro Forma Condensed Combined Financial Information
The following unaudited pro forma condensed combined financial statements give effect to the Business Combination under the acquisition method of accounting in accordance with Financial Accounting Standards Board (FASB) Accounting Standard Codification (“ASC”) Topic 805, Business Combinations (“ASC 805”). The Business Combination will be accounted for as a reverse merger in accordance with accounting principles generally accepted in the United States of America. Under this method of accounting, Hennessy Capital will be treated as the “acquired” company for financial reporting purposes. This determination was primarily based on Daseke comprising the ongoing operations of the combined company, Daseke’s senior management comprising the senior management of the combined company, and Daseke stockholders having a majority of the voting power of the combined company. For accounting purposes, Daseke will be deemed to be the accounting acquirer in the transaction and, consequently, the transaction will be treated as a recapitalization of Daseke (i.e., a capital transaction involving the issuance of stock by Hennessy Capital for the stock of Daseke). Accordingly, the consolidated assets, liabilities and results of operations of Daseke will become the historical financial statements of the combined company, and
Hennessy Capital’s assets, liabilities and results of operations will be consolidated with Daseke beginning on the acquisition date.
The historical consolidated financial information has been adjusted in these unaudited pro forma condensed combined financial statements to give effect to pro forma events that are (1) directly attributable to the Business Combination and the proposed related financing transactions, (2) factually supportable, and (3) with respect to the statements of operations, expected to have a continuing impact on the post-combination company. The unaudited pro forma condensed combined balance sheet is based on the historical audited consolidated balance sheet of Daseke, and the audited balance sheet of Hennessy Capital, as of December 31, 2016 and has been prepared to reflect the Business Combination and the proposed related financing transactions as if they occurred on December 31, 2016. The unaudited pro forma condensed combined statement of operations for the year ended December 31, 2016 combines the historical results of operations of Daseke together with the historical results for Hennessy Capital for the year ended December 31, 2016, giving effect to the Business Combination and the proposed related financing transactions as if they occurred on January 1, 2016.
The unaudited pro forma condensed combined statement of operations information for the year ended December 31, 2016 was derived from Daseke’s audited consolidated statement of operations and comprehensive loss for the year ended December 31, 2016 and Hennessy Capital’s audited statement of operations for the year ended December 31, 2016 included elsewhere in this Current Report on Form 8-K/A.
On January 5, 2017, Hennessy Capital consummated a transaction in which it received a $5 million release fee in exchange for releasing a party from a non-circumvention agreement with Hennessy Capital that was associated with a planned business combination with a third party that was not consummated. In connection with the receipt of this payment by Hennessy Capital, Hennessy Capital paid down approximately $6.6 million of liabilities accrued in connection with that business combination that did not close. The payment and settlement of these liabilities in January 2017 is not reflected in the unaudited pro forma condensed combined balance sheet because it is not related to the Business Combination.
These unaudited pro forma condensed combined financial statements are for informational purposes only. They do not purport to indicate the results that would actually have been obtained had the Business Combination and the proposed related financing transactions been completed on the assumed date or for the periods presented, or which may be realized in the future. The pro forma adjustments are based on the information currently available and the assumptions and estimates underlying the pro forma adjustments are described in the accompanying notes. Actual results may differ materially from the assumptions within the accompanying unaudited pro forma condensed combined financial information. The combined company will incur additional costs after the Business Combination in order to satisfy its obligations as a fully reporting public company. In addition, we anticipate the adoption of various stock compensation plans or programs (including the Incentive Plan) that are typical for employees, officers and directors of public companies. No adjustment to the unaudited pro forma statement of operations has been made for these items as they are not directly related to the Business Combination and amounts are not yet known.
The unaudited pro forma condensed combined financial information should be read in conjunction with the accompanying notes and the sections entitled “Daseke Management’s Discussion and Analysis of Financial Condition and Results of Operations,” “Hennessy Capital Management’s Discussion and Analysis of Financial Condition and Results of Operations” and the historical financial statements and notes thereto of Daseke and Hennessy Capital, included elsewhere in this Form 8-K or in the Proxy Statement.
The unaudited pro forma condensed combined financial statements have been prepared based on: (i) 11,616,990 shares of Hennessy Capital common stock redeemed at the Closing ($116.2 million) pursuant to Hennessy Capital’s pre-Business Combination certificate of incorporation of Hennessy Capital, (ii) $65.0 million of Series A Preferred Stock issued in connection with Preferred Financing at the Closing and the refinancing of certain Daseke long-term debt with a new $250.0 million term loan.
Unaudited Pro Forma Condensed Combined Balance Sheet
As of December 31, 2016
(In thousands)
|
|
|
Hennessy |
|
Daseke |
|
Pro Forma |
|
Footnote |
|
Pro Forma |
| ||||
|
ASSETS |
|
|
|
|
|
|
|
|
|
|
| ||||
|
Current assets |
|
|
|
|
|
|
|
|
|
|
| ||||
|
Cash and cash equivalents |
|
$ |
591 |
|
$ |
3,695 |
|
$ |
199,599 |
|
3a |
|
$ |
36,476 |
|
|
|
|
|
|
|
|
184 |
|
3a |
|
|
| ||||
|
|
|
|
|
|
|
236,000 |
|
3a |
|
|
| ||||
|
|
|
|
|
|
|
(293,455 |
) |
3a |
|
|
| ||||
|
|
|
|
|
|
|
(116,170 |
) |
3b |
|
|
| ||||
|
|
|
|
|
|
|
(36,168 |
) |
3c |
|
|
| ||||
|
|
|
|
|
|
|
(23,000 |
) |
3d |
|
|
| ||||
|
|
|
|
|
|
|
200 |
|
3d |
|
|
| ||||
|
|
|
|
|
|
|
65,000 |
|
3e |
|
|
| ||||
|
Accounts receivable, net |
|
— |
|
54,177 |
|
|
|
|
|
54,177 |
| ||||
|
Current portion of net investment in sales-type leases |
|
— |
|
3,516 |
|
|
|
|
|
3,516 |
| ||||
|
Prepaid expenses and other assets |
|
44 |
|
18,322 |
|
|
|
|
|
18,366 |
| ||||
|
Total current assets |
|
$ |
635 |
|
$ |
79,710 |
|
$ |
32,190 |
|
|
|
$ |
112,535 |
|
|
Cash and investments held in Trust Account |
|
199,783 |
|
— |
|
(199,599 |
) |
3a |
|
— |
| ||||
|
|
|
|
|
|
|
(184 |
) |
3a |
|
|
| ||||
|
Property and equipment, net |
|
— |
|
318,747 |
|
|
|
|
|
318,747 |
| ||||
|
Other intangible assets, net |
|
— |
|
71,653 |
|
|
|
|
|
71,653 |
| ||||
|
Goodwill |
|
— |
|
89,035 |
|
|
|
|
|
89,035 |
| ||||
|
Other long term assets |
|
— |
|
11,090 |
|
|
|
|
|
11,090 |
| ||||
|
TOTAL ASSETS |
|
$ |
200,418 |
|
$ |
570,235 |
|
$ |
(167,593 |
) |
|
|
$ |
603,060 |
|
|
|
|
|
|
|
|
|
|
|
|
|
| ||||
|
LIABILITIES AND STOCKHOLDERS’ EQUITY |
|
|
|
|
|
|
|
|
|
|
| ||||
|
Current liabilities |
|
|
|
|
|
|
|
|
|
|
| ||||
|
Current maturities of long-term debt |
|
$ |
— |
|
$ |
52,665 |
|
$ |
(52,665 |
) |
3a |
|
$ |
2,500 |
|
|
|
|
|
|
|
|
2,500 |
|
3a |
|
|
| ||||
|
Accounts payable |
|
328 |
|
5,954 |
|
|
|
|
|
6,282 |
| ||||
|
Accrued compensation |
|
— |
|
7,835 |
|
|
|
|
|
7,835 |
| ||||
|
Accrued expenses and taxes |
|
8,062 |
|
16,104 |
|
(2,600 |
) |
3d |
|
21,566 |
| ||||
|
|
|
|
|
|
|
|
|
|
|
|
| ||||
|
Accrued insurance and claims and other current liabilities |
|
— |
|
9,840 |
|
|
|
|
|
9,840 |
| ||||
|
Total current liabilities |
|
$ |
8,390 |
|
$ |
92,398 |
|
$ |
(52,765 |
) |
|
|
$ |
48,023 |
|
|
Long-term liabilities |
|
|
|
|
|
|
|
|
|
|
| ||||
|
Deferred underwriters’ fee |
|
7,185 |
|
— |
|
(7,185 |
) |
3d |
|
— |
| ||||
|
Long-term debt, net of current maturities |
|
— |
|
215,230 |
|
(174,347 |
) |
3a |
|
278,500 |
| ||||
|
|
|
|
|
|
|
4,117 |
|
3a |
|
|
| ||||
|
|
|
|
|
|
|
233,500 |
|
3a |
|
|
| ||||
|
Long-term deferred tax liability and other |
|
— |
|
93,101 |
|
|
|
|
|
93,101 |
| ||||
|
Subordinated debt |
|
— |
|
66,443 |
|
(66,443 |
) |
3a |
|
— |
| ||||
|
Common stock subject to possible redemption |
|
179,843 |
|
|
|
(179,843 |
) |
3d |
|
— |
| ||||
|
Stockholders’ Equity |
|
|
|
|
|
|
|
|
|
|
| ||||
|
Preferred stock |
|
— |
|
1 |
|
65,000 |
|
3e |
|
65,000 |
| ||||
|
|
|
|
|
|
|
(1 |
) |
3e |
|
|
| ||||
|
Common stock |
|
1 |
|
1 |
|
2 |
|
3c |
|
4 |
| ||||
|
|
|
|
|
|
|
1 |
|
3d |
|
|
| ||||
|
|
|
|
|
|
|
(1 |
) |
3e |
|
|
| ||||
|
Additional paid-in-capital |
|
14,752 |
|
117,807 |
|
266,651 |
|
3c |
|
$ |
150,959 |
| |||
|
|
|
|
|
|
|
(36,168 |
) |
3c |
|
|
| ||||
|
|
|
|
|
|
|
179,842 |
|
3d |
|
|
| ||||
|
|
|
|
|
|
|
(9,753 |
) |
3d |
|
|
| ||||
|
|
|
|
|
|
|
(266,653 |
) |
3c |
|
|
| ||||
|
|
|
|
|
|
|
2 |
|
3e |
|
|
| ||||
|
|
|
|
|
|
|
(116,170 |
) |
3b |
|
|
| ||||
|
|
|
|
|
|
|
649 |
|
3d |
|
|
| ||||
|
|
|
|
|
|
|
|
|
|
|
|
| ||||
|
Accumulated deficit |
|
(9,753 |
) |
(14,694 |
) |
(4,117 |
) |
3a |
|
(32,475 |
) | ||||
|
|
|
|
|
|
|
(16,464 |
) |
3d |
|
|
| ||||
|
|
|
|
|
|
|
200 |
|
3d |
|
|
| ||||
|
|
|
|
|
|
|
2,600 |
|
3d |
|
|
| ||||
|
|
|
|
|
|
|
9,753 |
|
3e |
|
|
| ||||
|
Accumulated other comprehensive loss |
|
— |
|
(52 |
) |
|
|
|
|
(52 |
) | ||||
|
Total stockholders’ equity |
|
$ |
5,000 |
|
$ |
103,063 |
|
$ |
73,373 |
|
|
|
$ |
183,436 |
|
|
TOTAL LIABILITIES AND STOCKHOLDERS’ EQUITY |
|
$ |
200,418 |
|
$ |
570,235 |
|
$ |
(167,593 |
) |
|
|
$ |
603,060 |
|
See accompanying notes to unaudited pro forma condensed combined financial information.
Unaudited Pro Forma Condensed Combined Statement of Operations
For the Year Ended December 31, 2016
(In thousands, except for per share information)
|
|
|
Hennessy |
|
Daseke |
|
Pro Forma |
|
Footnote |
|
Pro Forma |
| ||||
|
Net revenue |
|
$ |
— |
|
$ |
651,802 |
|
$ |
— |
|
|
|
$ |
651,802 |
|
|
Operating expenses: |
|
|
|
|
|
|
|
|
|
|
| ||||
|
Operations expenses |
|
— |
|
390,617 |
|
|
|
|
|
390,617 |
| ||||
|
Purchased freight |
|
|
|
154,054 |
|
|
|
|
|
154,054 |
| ||||
|
Depreciation and amortization |
|
|
|
67,500 |
|
|
|
|
|
67,500 |
| ||||
|
Selling, general and administrative expenses |
|
9,991 |
|
26,993 |
|
(10,052 |
) |
4a |
|
26,932 |
| ||||
|
Impairment loss |
|
— |
|
2,005 |
|
— |
|
|
|
2,005 |
| ||||
|
Total operating expenses |
|
9,991 |
|
641,169 |
|
(10,052 |
) |
|
|
641,108 |
| ||||
|
Income from operations |
|
(9,991 |
) |
10,633 |
|
10,052 |
|
|
|
10,694 |
| ||||
|
Other income (expense): |
|
|
|
|
|
|
|
|
|
|
| ||||
|
Interest and other income |
|
508 |
|
375 |
|
(508 |
) |
4b |
|
375 |
| ||||
|
|
|
|
|
|
|
|
|
|
|
|
| ||||
|
Interest and financing costs |
|
— |
|
(23,124 |
) |
(18,200 |
) |
4c |
|
(19,700 |
) | ||||
|
|
|
|
|
|
|
21,624 |
|
4c |
|
|
| ||||
|
Total other income (expense) |
|
508 |
|
(22,749 |
) |
2,916 |
|
|
|
(19,325 |
) | ||||
|
Income (loss) before income taxes |
|
(9,483 |
) |
(12,116 |
) |
12,968 |
|
|
|
(8,631 |
) | ||||
|
Provision (benefit) for income taxes |
|
|
|
(163 |
) |
(1,362 |
) |
4c |
|
(1,525 |
) | ||||
|
Net income (loss) |
|
(9,483 |
) |
(12,279 |
) |
11,606 |
|
|
|
(10,156 |
) | ||||
|
Less: Dividends to preferred stockholders |
|
— |
|
(4,770 |
) |
4,770 |
|
4d |
|
— |
| ||||
|
Net income (loss) available to common stockholders |
|
$ |
(9,483 |
) |
$ |
(17,049 |
) |
$ |
16,376 |
|
|
|
$ |
(10,156 |
) |
|
|
|
|
|
|
|
|
|
|
|
|
| ||||
|
Earnings (loss) per share available to common stockholders |
|
$ |
(1.46 |
) |
|
|
|
|
|
|
$ |
(0.27 |
) | ||
|
Weighted average shares outstanding — Basic and diluted |
|
6,490,000 |
|
|
|
31,226,000 |
|
5a |
|
37,716,000 |
| ||||
See accompanying notes to unaudited pro forma condensed combined financial information.
NOTES TO UNAUDITED PRO FORMA CONDENSED COMBINED FINANCIAL INFORMATION
1. Description of Transaction
Pursuant to the Merger Agreement and the transactions contemplated thereby, on February 27, 2017, Hennessy Capital consummated the acquisition of all of the outstanding capital stock of Daseke through a merger of a wholly owned subsidiary of the Company with and into Daseke, with Daseke surviving such merger as a direct wholly owned subsidiary of the Company.
The aggregate merger consideration paid upon the closing of the Business Combination (the “Closing Merger Consideration”) was $266.7 million comprised of an aggregate of 26,665,330 newly issued shares of Hennessy Capital common stock at a value of $10.00 per share. The Closing Merger Consideration was determined pursuant to the Merger Agreement and equaled the sum of (i) (a) $626 million, plus (b) approximately $1.8 million of adjusted Daseke cash, minus (c) approximately $341.2 million of Daseke indebtedness, approximately $0.3 million of unpaid income taxes, and approximately $36.2 million (the “Main Street and Prudential Consideration”) for payment to Main Street Capital II, LP, Main Street Mezzanine Fund, LP and Main Street Capital Corporation (collectively, “Main Street”) and Prudential Capital Partners IV, L.P., Prudential Capital Partners (Parallel Fund) IV, L.P. and Prudential Capital Partners Management Fund IV, L.P. (collectively, “Prudential”) and approximately $4.2 million of transaction fees and expenses, in each case estimated as of the end of the day immediately preceding the closing date, divided by (d) $10.00, plus (ii) the 2,079,042 shares forfeited by the HCAC Sponsor in the Sponsor Share Forfeiture (as defined and further discussed below). Pursuant to the letter agreement, dated December 22, 2016, among Hennessy Capital, Daseke, The Walden Group, Main Street and Prudential regarding, among other things, the conditional waiver of Main Street’s and Prudential’s respective put rights on their shares of Daseke common stock in exchange for aggregate consideration in an amount equal to the Main Street and Prudential Consideration in accordance with the terms and conditions of such agreement, Hennessy Capital repurchased all Daseke shares held by Main Street and Prudential immediately prior to closing for aggregate cash consideration of approximately $36.2 million. All other Daseke stockholders received all-stock consideration upon closing of the Business Combination consisting of newly issued shares of Hennessy Capital common stock (at a value of $10.00 per share) with an aggregate value equal to the Closing Merger Consideration.
In addition, the Merger Agreement contains an earn-out provision pursuant to which we may potentially issue up to 15 million additional shares of our common stock to Daseke stockholders for the achievement of specified share price thresholds and annualized Adjusted EBITDA (giving effect to acquisitions and as defined in the Merger Agreement) targets for the fiscal years ending December 31, 2017, 2018 and 2019 (the “Earn-Out Consideration”). The Earn-Out Consideration is payable entirely in newly issued shares of Hennessy Capital common stock.
In order to ensure sufficient funds (after redemptions) to refinance certain existing Daseke indebtedness, pay transaction fees and expenses and use for general corporate purposes, at closing, the Company sold 650,000 shares of its Series A Preferred Stock in a private placement for an aggregate purchase price of $65.0 million (referred to herein as the “Preferred Financing”) and consummated a $350.0 million debt financing (the “Debt Financing”), consisting of a $250.0 million senior secured term loan that was fully drawn at closing and a $100.0 million delayed drawn term loan that may be drawn within a 12-month period from closing of the Business Combination. At closing, the Company also refinanced its existing revolving credit facility with the ABL Facility.
In addition, Hennessy Capital received commitments from investors in the Backstop Commitment to purchase up to $35.0 million in shares of Company common stock (as and to the extent requested by Hennessy Capital) to help ensure that the Company received sufficient funds from our trust account after redemptions to (among other things) fund the payment of the Main Street and Prudential Consideration. On February 24, 2017, Hennessy Capital exercised the Backstop Commitment in full, and the Backstop Commitment investors purchased an aggregate of $35.0 million in shares of Hennessy Capital common stock through open market or privately negotiated transactions with third parties at a purchase price of up to $10.00 per share.
In order to facilitate the Business Combination, HCAC Sponsor forfeited more than half of its founder shares (resulting in 1,848,043 remaining founder shares held by HCAC Sponsor) for the benefit of Daseke stockholders and, to a lesser extent, for the benefit of investors in the Backstop Commitment and in connection with the payment of certain deferred underwriting discounts and fees to the underwriters (the “Underwriters”) of
Hennessy Capital’s July 2015 initial public offering (the “IPO”). Prior to the closing of the Business Combination, HCAC Sponsor forfeited to the Company 2,079,042 founder shares, and the Company issued an equivalent number of newly issued shares of Hennessy Capital common stock to Daseke stockholders as part of the Closing Merger Consideration (which Sponsor forfeiture and new issuance to Daseke stockholders is referred to collectively herein as the “Sponsor Share Forfeiture”). In addition, prior to closing, HCAC Sponsor forfeited 391,892 founder shares in connection with the Backstop Commitment and an additional 231,000 founder shares in connection with the payment of deferred underwriting discounts and fees to the Underwriters. At closing, in addition to the shares issued to Daseke stockholders as part of the Closing Merger Consideration, the Company also issued 419,669 newly issued shares of Company common stock (including 27,777 shares issued in consideration for the reduction of certain financial advisory fees) in the aggregate to the Backstop Commitment investors (such shares are referred to in the Backstop and Subscription Agreements and the Proxy Statement as “Utilization Fee Shares”).
Following the consummation of the Business Combination on February 27, 2017, there were 37,715,960 shares of Company common stock issued and outstanding, including 26,665,330 shares issued to former Daseke stockholders pursuant to the Merger Agreement and 8,342,918 “public” shares (issued in the IPO) of Company common stock remaining outstanding following redemptions.
The following pro forma information has been prepared based on: (i) 11,616,990 shares of Hennessy Capital common stock redeemed at closing (for a total cash payment of $116.2 million) pursuant to the terms of Hennessy Capital’s pre-Business Combination certificate of incorporation; (ii) 26,665,330 shares of Company common stock issued to former Daseke stockholders pursuant to the Merger Agreement; (iii) 419,669 shares of Company common stock issued to the Backstop Commitment investors; (iv) 650,000 shares of 7.625% Series A Convertible Preferred Stock of the Company issued in connection with the Preferred Financing for aggregate proceeds of $65.0 million; (v) the cash payment of Company and Hennessy Capital transaction fees and expenses including approximately $36.2 million of Main Street and Prudential Consideration and (vi) the payment of approximately $296.4 million of existing Daseke indebtedness (including approximately $1.8 million of interest and penalties) from, among other sources, the net proceeds of the Closing Date Term Loan.
2. Basis of Presentation
The Business Combination will be accounted for as a reverse merger in accordance with accounting principles generally accepted in the United States of America. Under this method of accounting, Hennessy Capital will be treated as the “acquired” company for financial reporting purposes. This determination was primarily based on Daseke comprising the ongoing operations of the combined company, Daseke’s senior management comprising the senior management of the combined company and Daseke stockholders having a majority of the voting power of the combined company. For accounting purposes, Daseke will be deemed to be the accounting acquirer in the transaction and, consequently, the transaction will be treated as a recapitalization of Daseke (i.e., a capital transaction involving the issuance of stock by Hennessy Capital for the stock of Daseke). Accordingly, the consolidated assets, liabilities and results of operations of Daseke will become the historical financial statements of the combined company, and Hennessy Capital’s assets, liabilities and results of operations will be consolidated with Daseke beginning on the Closing Date.
The unaudited pro forma condensed combined balance sheet as of December 31, 2016 was derived from Daseke’s audited consolidated balance sheet, and Hennessy Capital’s audited balance sheet, each as of December 31, 2016. The unaudited pro forma condensed combined balance sheet as of December 31, 2016 assumes that the Business Combination and the related proposed financing transactions were completed on December 31, 2016.
The unaudited pro forma condensed combined statement of operations information for the year ended December 31, 2016 was derived from Daseke’s audited consolidated statement of operations and comprehensive loss for the year ended December 31, 2016 and Hennessy Capital’s audited statement of operations for the year ended December 31, 2016 and gives pro forma effect to the Business Combination and the related proposed financing transactions as if they had occurred on January 1, 2016.
3. Unaudited Pro Forma Condensed Combined Balance Sheet Adjustments
The pro forma adjustments to the unaudited combined pro forma balance sheet consist of the following:
(a) Reflects cash funding and debt repayment as follows: (i) the transfer of $199.6 million from HennessyCapital’s trust account, (ii) the transfer of $184 thousand from Hennessy Capital’s trust account for the payment of taxes and working capital, (iii) the proceeds from the new $250.0 million term loan facility, net of approximately $14.0 million of financing costs including original issue discount of approximately $3.5 million and placement fees and expenses of approximately $10.5 million, and reflecting approximately $2.5 million as current portion of long-term debt, (iv) the repayment of approximately $293.4 million of the existing $338.4 million of debt together with the write off of deferred financing costs of approximately $4.1 million. Excluded from the repayment is approximately $45.0 million of equipment financing and real estate debt that remains outstanding.
(b) Represents 11,616,990 common shares ($116.2 million) redeemed on the closing date.
(c) Reflects the payment of purchase price as follows: $266.7 million in fair value of approximately 26,665,000 shares of common stock valued at $10.00 per share and, payment of approximately $36.2 million for the payment of the Main Street and Prudential Consideration.
The Merger Agreement contains an earn-out provision pursuant to which the Company may issue up to 15 million additional shares of its common stock to Daseke stockholders for the achievement of specified share price thresholds and annualized Adjusted EBITDA (giving effect to acquisitions and as defined in the Merger Agreement) targets for the fiscal years ending December 31, 2017, 2018 and 2019. The earn-out shares are to be issued contingent on future performance of the post combination company and, therefore, have not been recorded in the unaudited pro forma condensed combined financial statements.
(d) Reflects other transaction effects including: (i) the payment of transaction costs associated with the Business Combination which are estimated to be approximately $37.0 million in total for both parties, including approximately $14.0 million of financing costs associated with the Debt Financing (including approximately $3.5 million of original issue discount on the Debt Financing) and approximately $7.2 million of deferred underwriting discounts and fees from the IPO (“IPO fees”) which were due upon consummation of the Business Combination, less the waiver of approximately $0.65 million of IPO fees and (ii) the elimination of 18,932,591 shares of common stock subject to possible redemption. This adjustment reflects the elimination of Hennessy Capital’s retained earnings and Daseke’s par value of common and preferred stock upon consummation of the Business Combination. Also includes the adjustment to cash, accrued expenses and retained earnings for transaction expenses paid or accrued at December 31, 2016 including approximately $0.2 million of cash, and approximately $2.6 million of transaction costs included in accrued expenses (including $1.6 million at Hennessy Capital and $1.0 million at Daseke).
(e) Represents the issuance of 650,000 shares of Series A Preferred Stock at a per share purchase price of $100, for gross proceeds in the amount of $65.0 million. Each share of Series A Preferred Stock will be convertible into shares of common stock at a conversion price of $11.50. The unaudited pro forma combined balance sheet does not assume conversion of the Series A Preferred Stock. If the Series A Preferred Stock were to be converted into shares of common stock, the impact on the unaudited pro forma condensed unaudited balance sheet as of December 31, 2016 would be as follows:
|
|
|
(in thousands of dollars) |
| ||||
|
Line item |
|
Pro Forma |
|
Adjusted for the |
| ||
|
Convertible preferred stock |
|
$ |
65,000 |
|
$ |
— |
|
|
Common stock |
|
$ |
4 |
|
$ |
4 |
|
|
Additional paid-in-capital |
|
$ |
150,959 |
|
$ |
215,959 |
|
|
Stockholders’ equity |
|
$ |
183,436 |
|
$ |
183,436 |
|
4. Notes and Adjustments to Unaudited Pro Forma Condensed Combined Statements of Operations
The pro forma adjustments to the unaudited condensed combined pro forma statements of operations consist of the following:
(a) Elimination of Hennessy Capital’s costs to locate a potential acquisition target, and costs of the Business Combination incurred by Hennessy Capital ($9.1 million) and Daseke (1.0 million) at December 31, 2016.
(b) Elimination of interest income on the Hennessy Capital trust assets.
(c) Addition of incremental interest expense on the Debt Financing, entered into in connection with the Business Combination calling for an aggregate commitment of up to $350.0 million, $250 million of which was drawn on at Closing and the remainder, $100 million, is a delayed draw down term loan, as well as a $70.0 million asset-based revolving credit facility. The interest rate on the Debt Financing is LIBOR (with a floor of 1%) plus 5.5% and was approximately 6.5% at Closing. Therefore, the condensed combined pro forma statement of operations contains an adjustment for approximately $18.2 million annually representing approximately $16.2 million of annual interest at 6.5% on the pro forma outstanding debt of approximately $250.0 million plus approximately $2.0 million of annual amortization of approximately $14.0 million of original issue discount on, and financing costs of, the Debt Financing assuming the debt was outstanding at January 1, 2016. Each 0.125% change in the interest rate would generate an approximately $313 thousand change in interest expense.
In addition, the condensed combined pro forma statement of operations also contains an adjustment for approximately $21.6 million for the year ended December 31, 2016 to eliminate interest expense on the portion of the existing Daseke debt of $293.7 million (which excludes approximately $45 million of equipment and real estate debt that was not repaid at the Closing). Further, the condensed combined pro forma statement of operations contains an adjustment for the related effect on income tax expense (approximately $1.4 million for the year ended December 31, 2016) applied to the incremental change in interest expense, plus the 2016 Daseke transaction costs, using a tax rate of approximately 35%.
(d) Reflects elimination of dividends paid on Daseke preferred stock which was converted to common stock on a one-for-one basis immediately prior to closing of the Business Combination.
5. Earnings per Share
The pro forma adjustments to the unaudited combined pro forma statement of operations earnings per share consist of the following.
(a) The unaudited pro forma condensed combined basic and diluted earnings per share calculations are based on the historical Hennessy Capital weighted average number of shares outstanding of 6,490,000 for the year December 31, 2016, adjusted by: (a) 18,459,885 shares to increase the weighted average share amount to 24,949,885 at December 31, 2016, representing the total number of shares outstanding as of that date inclusive of the shares that are no longer subject to possible redemption as a result of the Business Combination, (b) 26,665,330 shares issued upon Closing (including 2,079,042 shares issued in respect of the Sponsor Share Forfeiture), (c) 11,616,990 shares redeemed by public stockholders upon closing of the Business Combination (d) 419,669 common shares issued to the Backstop Commitment investors (including 27,777 shares issued in consideration for the reduction of certain financial advisory fees) and (e) 2,701,934 founder shares forfeited to the Company by HCAC Sponsor, including 2,079,042 founder shares in respect of the Sponsor Share Forfeiture (for the benefit of the Daseke stockholders), 391,892 founder shares in connection with the Backstop Commitment (for the benefit of the Backstop Commitment investors) and 231,000 founder shares in connection with the payment of certain deferred underwriting discounts and fees to the IPO Underwriters, as follows (share amounts rounded to nearest thousand):
|
|
|
Year ended |
|
|
Weighted average shares reported |
|
6,490,000 |
|
|
|
|
|
|
|
Add: Redeemable/IPO shares |
|
18,460,000 |
|
|
Closing Merger Consideration payable in stock |
|
26,665,000 |
|
|
Shares issued to the Backstop Commitment investors |
|
420,000 |
|
|
Less: Shares Redeemed |
|
(11,617,000 |
) |
|
Founder Shares Forfeited by HCAC Sponsor |
|
(2,702,000 |
) |
|
Subtotal Added |
|
31,226,000 |
|
|
Weighted average shares pro forma |
|
37,716,000 |
|
There are currently 35,040,664 warrants outstanding to purchase up to a total of 17,520,332 shares. Additionally, the 650,000 shares of 7.65% Series A Convertible Preferred Stock issued at the Closing are currently convertible into 5,652,174 shares of common stock. Because the warrants are exercisable and the shares of 7.65% Series A Convertible Preferred Stock are convertible at per share amounts exceeding the current market price of our common stock and the approximate per share redemption price of $10.00, the warrants and Series A Convertible Preferred Stock are considered antidilutive and any shares that would be issued upon exercise of the warrants or conversion of the shares of 7.65% Series A Convertible Preferred Stock are not included in earnings per share.
Management’s Discussion and Analysis of Financial Condition and Results of Operations and Quantitative and Qualitative Disclosures About Market Risk
The following discussion and analysis should be read in conjunction with Daseke’s audited consolidated financial statements and the related notes appearing elsewhere in this Form 8-K. The following discussion contains forward-looking statements that reflect future plans, estimates, beliefs and expected performance. The forward-looking statements are dependent upon events, risks and uncertainties that may be outside the Company’s control. The Company’s actual results could differ materially from those discussed in these forward-looking statements. See “Cautionary Note Regarding Forward-Looking Statements” above.
Introduction
The Company is a leading provider of transportation and logistics solutions focused exclusively on open deck freight in North America. The transportation and logistics market is one of the largest industries in the United States. The open deck freight market is expected to represent an approximately $133 billion subset of the broader transportation and logistics market in 2016. The U.S. open deck freight market is expected to grow to approximately $150 billion in 2017-2018 and to approximately $174 billion in 2019.
The Company believes it is the largest owner of open deck equipment and the second largest provider of flatbed, open deck transportation and logistics solutions by revenue in North America. The Company delivers a comprehensive and diverse offering of flatbed and specialized transportation and logistics solutions to approximately 3,600 customers across 49 U.S. states, Canada and Mexico through two reportable segments: Flatbed Solutions and Specialized Solutions. The Flatbed Solutions segment focuses on delivering transportation and logistics solutions that principally require the use of flatbed and retractable-sided transportation equipment, and the Specialized Solutions segment focuses on delivering transportation and logistics solutions that principally include super heavy haul, high-value customized, over-dimensional, step deck and removable gooseneck trailer solutions. The Flatbed Solutions segment and Specialized Solutions segment generated approximately 47% and 53%, respectively, of revenue in 2016.
Since beginning operations in 2009, the Company has established a track record of growing its business both organically and through strategic and complementary acquisitions, having successfully completed the acquisition and integration of nine companies during such period. In 2016, Daseke generated revenue of approximately $652 million, compared to $30 million in 2009 (its first year of operation), reflecting a CAGR of approximately 55%.
Both of the Company’s reportable segments operate highly flexible business models comprised of
company-owned tractors and asset-light operations (which consist of owner-operator transportation and freight brokerage). The Company’s asset-based operations have the benefit of providing shippers with certainty of delivery and continuity of operations. Alternatively, the Company’s asset-light operations offer flexibility and scalability to meet customers’ dynamic needs and have lower capital expenditure requirements and fixed costs. Approximately 66% of 2016 freight and brokerage revenue was derived from company-owned equipment and approximately 34% was derived from asset-light services.
How The Company Evaluates Its Operations
The Company uses a number of primary indicators to monitor its revenue and expense performance and efficiency, including Adjusted EBITDA, Adjusted EBITDAR, free cash flow and adjusted operating ratio, and its key drivers of revenue quality, growth, expense control and operating efficiency. Adjusted EBITDA, Adjusted EBITDAR, free cash flow and adjusted operating ratio are not recognized measures under GAAP and should not be considered alternatives to, or more meaningful than, net income (loss), cash flows from operating activities, operating income, operating ratio, operating margin or any other measure derived in accordance with GAAP. See “—Non-GAAP Financial Measures” for more information on the Company’s use of these non-GAAP measures, as well as a description of the computation and reconciliation of the Company’s Adjusted EBITDA, Adjusted EBITDAR and free cash flow to net income (loss) and adjusted operating ratio to operating ratio.
Revenue
The Company records three types of revenue: freight, brokerage and fuel surcharge. Freight revenue is generated by hauling freight for the Company’s customers using its trucks or its owner-operators’ equipment. Generally, the Company’s customers pay for its services based on the number of miles in the most direct route between pick-up and delivery locations and other ancillary services the Company provides. Freight revenue is the product of the number of revenue-generating miles driven and the rate per mile the Company receives from customers plus accessorial charges, such as loading and unloading freight for its customers, cargo protection, fees for detaining its equipment or fees for route planning and supervision. Freight revenue is affected by fluctuations in North American economic activity as well as changes in specific customer demand, the level of capacity in the industry and driver availability.
The Company’s brokerage revenue is generated primarily by its use of third-party carriers when it needs capacity to move its customers’ loads. The main factor that affects brokerage revenue is the availability of the Company’s drivers and owner-operators (and hence the need for third-party carriers) and the rate for the load. Brokerage revenue is also affected by fluctuations in North American economic activity as well as changes in the level of capacity in the industry and driver availability.
Fuel surcharges are designed to compensate the Company for fuel costs above a certain cost per gallon base. Generally, the Company receives fuel surcharges on the miles for which it is compensated by customers. However, the Company continues to have exposure to increasing fuel costs related to empty miles, fuel efficiency due to engine idle time and other factors and to the extent the surcharge paid by the customer is insufficient. The main factors that affect fuel surcharge revenue are the price of diesel fuel and the number of loaded miles. In general, a declining energy and fuel price environment, such as in 2015 and most of 2016, negatively affects the Company’s fuel surcharge revenues, and conversely, an environment with rising fuel and energy prices benefits its fuel surcharge revenues. Although the Company’s surcharge programs vary by customer, they typically involve a computation based on the change in national or regional fuel prices. The Company’s fuel surcharges are billed on a lagging basis, meaning it typically bills customers in the current week based on a previous week’s applicable index. Therefore, in times of increasing fuel prices, the Company does not recover as much as it is currently paying for fuel. In periods of declining prices, the opposite is true. Also, its fuel surcharge programs typically require a specified minimum change in fuel cost to prompt a change in fuel surcharge revenue. Therefore, many of these programs have a time lag between when fuel costs change and when the change is reflected in fuel surcharge revenue.
Expenses
The Company’s most significant expenses vary with miles traveled and include driver wages, services purchased from owner-operators and other transportation providers (which are recorded on the “Purchased freight” line of Daseke’s consolidated statements of operations) and fuel. Although driver-related expenses vary with miles traveled, the Company currently expects that its expenses relating to driver wages, as a percentage of operating revenues, will increase in the near-term, with or without changes in total miles, due to expected increases in average driver wages paid per mile in the general trucking industry. The expected increases in driver wages per mile are due to current market conditions caused by a lack of qualified drivers in the industry.
Maintenance and tire expenses and cost of insurance and claims generally vary with the miles the Company travels but also have a controllable component based on safety improvements, fleet age, efficiency and other factors. The Company’s primary fixed costs are depreciation of long-term assets (such as tractors, trailers and terminals), interest expense, rent and non-driver compensation.
The Company’s fuel surcharge programs help to offset increases in fuel prices but typically do not offset empty miles, idle time and out of route miles driven. As discussed above under “—Revenue,” its fuel surcharge programs have a time lag between when fuel costs change and when the change is reflected in fuel surcharge revenue. Due to this time lag, the Company’s fuel expense, net of fuel surcharge, negatively impacts its operating income during periods of sharply rising fuel costs and positively impacts its operating income during periods of falling fuel costs. In general, due to the fuel surcharge programs, its operating income is less negatively affected by an environment with higher, stable fuel prices than an environment with lower fuel prices. In addition to its fuel surcharge programs, the Company believes the most effective protection against fuel cost increases is to maintain a fuel-efficient fleet by incorporating fuel efficiency measures. Also, the Company has arrangements with some of its significant fuel suppliers to buy the majority of its fuel at contracted pricing schedules that fluctuate with the market price of diesel fuel. The Company has not used derivatives as a hedge against higher fuel costs in the past but continues to evaluate this possibility.
Factors Affecting the Comparability of Daseke’s Financial Results
Acquisitions
The comparability of Daseke’s results of operations among the periods presented is impacted by the acquisitions listed below, which were completed in 2015. Also, as a result of the below acquisitions, Daseke’s historical results of operations may not be comparable or indicative of future results.
· Bulldog Acquisition — Effective as of July 1, 2015, Daseke acquired (the “Bulldog Acquisition”) all of the capital stock of Bulldog Hiway Express (“Bulldog”) to expand its presence in the Southeast and in the automotive, port intermodal and power generation markets. Bulldog is part of the Company’s Specialized Solutions segment.
· Hornady Acquisition — Effective as of August 1, 2015, Daseke acquired (the “Hornady Acquisition”) all of the capital stock of Hornady Truck Line, Inc. and B.C. Hornady & Associates, Inc. (collectively with Hornady Transportation, LLC, the wholly owned operating subsidiary of Hornady Truck Line, Inc., “Hornady”) to expand its presence in the eastern U.S. and in the building materials and steel markets. Hornady is part of the Company’s Flatbed Solutions segment.
We refer to the Bulldog Acquisition and the Hornady Acquisition collectively as the “Recent Acquisitions.”
Effective as of May 1, 2015, Daseke acquired (the “Davenport Acquisition”) substantially all of the assets of Davenport Transport & Rigging, LLC, a provider of heavy-haul and super-heavy and specialized carrier trucking services, to expand its specialized and heavy-haul capabilities. Due to its size, the Davenport Acquisition does not materially affect the comparability of Daseke’s results of operations or financial position period-to-period.
The Business Combination
Daseke’s historical results of operations may not be comparable or indicative of results after the
consummation of the Business Combination as a result of the following:
· Decreased Leverage. As of December 31, 2016, after giving pro forma effect to the Business Combination, Daseke would have had approximately $295.0 million of outstanding total indebtedness compared to the actual outstanding total indebtedness of $338.5 million, in each case, prior to debt issuance costs. For the year ended December 31, 2016, Daseke’s pro forma interest expense would have been approximately $3.4 million lower than its historical interest expense.
· Public Company Expenses. The Company incurred, and will continue to incur, direct, incremental general and administrative expense as a result of being a publicly traded company, including, but not limited to, costs associated with annual and quarterly reports to stockholders, tax return preparation, independent auditor fees, investor relations activities, registrar and transfer agent fees, incremental director and officer liability insurance costs and independent director compensation. These direct, incremental general and administrative expenses, which the Company’s management estimates will total approximately $0.5 million annually, are not included in Daseke’s historical financial results of operations.
· Transaction Costs. During the year ended December 31, 2016, Daseke expensed $3.5 million of transaction costs related to the Business Combination. There were no such expenses for the year ended December 31, 2015.
Results of Operations
Year Ended December 31, 2016 Compared to Year Ended December 31, 2015
The following table sets forth items derived from Daseke’s consolidated statements of operations for the years ended December 31, 2016 and 2015 in dollars and as a percentage of total revenue and the increase or decrease in the dollar amounts of those items.
|
|
|
Year Ended December 31, |
|
|
| |||||||||||
|
|
|
2016 |
|
2015 |
|
Increase (Decrease) |
| |||||||||
|
(Dollars in thousands) |
|
$ |
|
% |
|
$ |
|
% |
|
$ |
|
% |
| |||
|
REVENUE: |
|
|
|
|
|
|
|
|
|
|
|
|
| |||
|
Freight |
|
$ |
517,861 |
|
79.5 |
|
$ |
506,582 |
|
74.6 |
|
$ |
11,279 |
|
2.2 |
|
|
Brokerage |
|
87,410 |
|
13.4 |
|
108,900 |
|
16.0 |
|
(21,490 |
) |
(19.7 |
) | |||
|
Fuel surcharge |
|
46,531 |
|
7.1 |
|
63,363 |
|
9.3 |
|
(16,832 |
) |
(26.6 |
) | |||
|
Total revenue |
|
651,802 |
|
100.0 |
|
678,845 |
|
100.0 |
|
(27,043 |
) |
(4.0 |
) | |||
|
|
|
|
|
|
|
|
|
|
|
|
|
|
| |||
|
OPERATING EXPENSES: |
|
|
|
|
|
|
|
|
|
|
|
|
| |||
|
Salaries, wages and employee benefits |
|
197,789 |
|
30.3 |
|
178,703 |
|
26.3 |
|
19,086 |
|
10.7 |
| |||
|
Fuel |
|
66,865 |
|
10.3 |
|
70,296 |
|
10.4 |
|
(3,431 |
) |
(4.9 |
) | |||
|
Operations and maintenance |
|
96,100 |
|
14.7 |
|
98,734 |
|
14.5 |
|
(2,634 |
) |
(2.7 |
) | |||
|
Communications |
|
1,618 |
|
0.2 |
|
2,034 |
|
0.3 |
|
(416 |
) |
(20.5 |
) | |||
|
Purchased freight |
|
154,054 |
|
23.6 |
|
181,985 |
|
26.8 |
|
(27,931 |
) |
(15.3 |
) | |||
|
Administrative expenses |
|
25,250 |
|
3.9 |
|
21,710 |
|
3.2 |
|
3,540 |
|
16.3 |
| |||
|
Sales and marketing |
|
1,743 |
|
0.3 |
|
2,911 |
|
0.4 |
|
(1,168 |
) |
(40.1 |
) | |||
|
Taxes and licenses |
|
9,222 |
|
1.4 |
|
9,228 |
|
1.4 |
|
(6 |
) |
(0.1 |
) | |||
|
Insurance and claims |
|
19,114 |
|
2.9 |
|
19,655 |
|
2.9 |
|
(541 |
) |
(2.8 |
) | |||
|
Acquisition-related transaction expenses |
|
25 |
|
* |
|
1,192 |
|
0.2 |
|
(1,167 |
) |
(97.9 |
) | |||
|
|
|
Year Ended December 31, |
|
|
| |||||||||||
|
|
|
2016 |
|
2015 |
|
Increase (Decrease) |
| |||||||||
|
(Dollars in thousands) |
|
$ |
|
% |
|
$ |
|
% |
|
$ |
|
% |
| |||
|
Depreciation and amortization |
|
67,500 |
|
10.4 |
|
63,573 |
|
9.4 |
|
3,927 |
|
6.2 |
| |||
|
Gain on disposition of revenue property/equipment |
|
(116 |
) |
* |
|
(2,184 |
) |
(0.3 |
) |
2,068 |
|
(94.7 |
) | |||
|
Impairments |
|
2,005 |
|
0.3 |
|
— |
|
* |
|
2,005 |
|
* |
| |||
|
Total operating expenses |
|
641,169 |
|
98.4 |
|
647,837 |
|
95.4 |
|
(6,668 |
) |
(1.0 |
) | |||
|
Operating ratio |
|
98.4 |
% |
|
|
95.4 |
% |
|
|
|
|
|
| |||
|
Adjusted operating ratio(1) |
|
95.6 |
% |
|
|
93.0 |
% |
|
|
|
|
|
| |||
|
INCOME FROM OPERATIONS |
|
10,633 |
|
1.6 |
|
31,008 |
|
4.6 |
|
(20,375 |
) |
(65.7 |
) | |||
|
|
|
|
|
|
|
|
|
|
|
|
|
|
| |||
|
Other (income) expense: |
|
|
|
|
|
|
|
|
|
|
|
|
| |||
|
Interest income |
|
(44 |
) |
* |
|
(69 |
) |
* |
|
25 |
|
(36.2 |
) | |||
|
Interest expense |
|
23,124 |
|
3.5 |
|
20,602 |
|
3.0 |
|
2,522 |
|
12.2 |
| |||
|
Other |
|
(331 |
) |
(0.1 |
) |
(251 |
) |
* |
|
(80 |
) |
31.9 |
| |||
|
Total other expense, net |
|
22,749 |
|
3.5 |
|
20,282 |
|
3.0 |
|
2,467 |
|
12.2 |
| |||
|
|
|
|
|
|
|
|
|
|
|
|
|
|
| |||
|
Income (loss) before provision for income taxes |
|
(12,116 |
) |
(1.9 |
) |
10,726 |
|
1.6 |
|
(22,842 |
) |
(213.0 |
) | |||
|
Provision for income taxes |
|
163 |
|
* |
|
7,463 |
|
1.1 |
|
(7,300 |
) |
(97.8 |
) | |||
|
Net income (loss) |
|
$ |
(12,279 |
) |
(1.9 |
) |
$ |
3,263 |
|
0.5 |
|
$ |
(15,542 |
) |
(476.3 |
) |
* indicates not meaningful.
(1) Adjusted operating ratio is not a recognized measure under GAAP. For a definition of adjusted operating ratio and reconciliation of adjusted operating ratio to operating ratio, see “—Non-GAAP Financial Measures” below.
The following table sets forth Daseke’s Flatbed Solutions segment’s revenue, operating expenses, operating ratio, adjusted operating ratio and operating income for the years ended December 31, 2016 and 2015 in dollars and as a percentage of its Flatbed Solutions segment’s total revenue and the increase or decrease in the dollar amounts of those items. The following table also sets forth certain operating statistics for Daseke’s Flatbed Solutions segment for the years ended December 31, 2016 and 2015.
FLATBED SOLUTIONS
|
|
|
Year Ended December 31, |
|
|
|
|
| |||||||||
|
|
|
2016 |
|
2015 |
|
Increase (Decrease) |
| |||||||||
|
(Dollars in thousands) |
|
$ |
|
% |
|
$ |
|
% |
|
$ |
|
% |
| |||
|
REVENUE(1): |
|
|
|
|
|
|
|
|
|
|
|
|
| |||
|
Freight |
|
$ |
253,824 |
|
81.8 |
|
$ |
241,741 |
|
78.9 |
|
$ |
12,083 |
|
5.0 |
|
|
Brokerage |
|
29,745 |
|
9.6 |
|
29,151 |
|
9.5 |
|
594 |
|
2.0 |
| |||
|
Fuel surcharge |
|
26,871 |
|
8.7 |
|
35,428 |
|
11.6 |
|
(8,557 |
) |
(24.2 |
) | |||
|
Total revenue |
|
310,440 |
|
100.0 |
|
306,320 |
|
100.0 |
|
4,120 |
|
1.3 |
| |||
|
|
|
|
|
|
|
|
|
|
|
|
|
|
| |||
|
OPERATING EXPENSES(1): |
|
|
|
|
|
|
|
|
|
|
|
|
| |||
|
Salaries, wages and employee benefits |
|
93,818 |
|
30.2 |
|
87,936 |
|
28.7 |
|
5,882 |
|
6.7 |
| |||
|
Fuel |
|
36,503 |
|
11.8 |
|
39,788 |
|
13.0 |
|
(3,285 |
) |
(8.3 |
) | |||
|
Operations and maintenance |
|
32,845 |
|
10.6 |
|
29,288 |
|
9.6 |
|
3,557 |
|
12.1 |
| |||
|
Purchased freight |
|
77,563 |
|
25.0 |
|
75,785 |
|
24.7 |
|
1,778 |
|
2.3 |
| |||
|
Depreciation and amortization |
|
30,445 |
|
9.8 |
|
30,276 |
|
9.9 |
|
169 |
|
0.6 |
| |||
|
Impairments |
|
— |
|
* |
|
— |
|
* |
|
— |
|
* |
| |||
|
Other operating expenses |
|
23,623 |
|
7.6 |
|
23,016 |
|
7.5 |
|
607 |
|
2.6 |
| |||
|
Total operating expenses |
|
294,797 |
|
95.0 |
|
286,089 |
|
93.4 |
|
8,708 |
|
3.0 |
| |||
|
Operating ratio |
|
95.0 |
% |
|
|
93.4 |
% |
|
|
|
|
|
| |||
|
Adjusted operating ratio(2) |
|
93.4 |
% |
|
|
90.7 |
% |
|
|
|
|
|
| |||
|
INCOME FROM OPERATIONS |
|
$ |
15,643 |
|
5.0 |
|
$ |
20,231 |
|
6.6 |
|
$ |
(4,588 |
) |
(22.7 |
) |
|
|
|
|
|
|
|
|
|
|
|
|
|
|
| |||
|
OPERATING STATISTICS: |
|
|
|
|
|
|
|
|
|
|
|
|
| |||
|
Total miles |
|
149,284,755 |
|
|
|
136,945,193 |
|
|
|
12,339,562 |
|
|
| |||
|
Company-operated tractors |
|
1,203 |
|
|
|
1,205 |
|
|
|
(2 |
) |
|
| |||
|
Owner-operated tractors |
|
390 |
|
|
|
432 |
|
|
|
(42 |
) |
|
| |||
|
Number of trailers |
|
2,943 |
|
|
|
2,920 |
|
|
|
23 |
|
|
| |||
* indicates not meaningful.
(1) Includes intersegment revenues and expenses, as applicable, which are eliminated in Daseke’s consolidated results.
(2) Adjusted operating ratio is not a recognized measure under GAAP. For a definition of adjusted operating ratio and reconciliation of adjusted operating ratio to operating ratio, see “—Non-GAAP Financial Measures” below.
The following table sets forth Daseke’s Specialized Solutions segment’s revenue, operating expenses, operating ratio, adjusted operating ratio and operating income for the years ended December 31, 2016 and 2015 in dollars and as a percentage of its Specialized Solutions segment’s total revenue and the increase or decrease in the dollar amounts of those items. The following table also sets forth certain operating statistics for Daseke’s Specialized Solutions segment for the years ended December 31, 2016 and 2015.
SPECIALIZED SOLUTIONS
|
|
|
Year Ended December 31, |
|
|
| |||||||||||
|
|
|
2016 |
|
2015 |
|
Increase (Decrease) |
| |||||||||
|
(Dollars in thousands) |
|
$ |
|
% |
|
$ |
|
% |
|
$ |
|
% |
| |||
|
REVENUE(1): |
|
|
|
|
|
|
|
|
|
|
|
|
| |||
|
Freight |
|
$ |
268,121 |
|
77.5 |
|
$ |
269,000 |
|
71.3 |
|
$ |
(879 |
) |
(0.3 |
) |
|
Brokerage |
|
57,791 |
|
16.7 |
|
79,866 |
|
21.2 |
|
(22,075 |
) |
(27.6 |
) | |||
|
Fuel surcharge |
|
20,086 |
|
5.8 |
|
28,186 |
|
7.5 |
|
(8,100 |
) |
(28.7 |
) | |||
|
Total revenue |
|
345,998 |
|
100.0 |
|
377,052 |
|
100.0 |
|
(31,054 |
) |
(8.2 |
) | |||
|
|
|
|
|
|
|
|
|
|
|
|
|
|
| |||
|
OPERATING EXPENSES(1): |
|
|
|
|
|
|
|
|
|
|
|
|
| |||
|
Salaries, wages and employee benefits |
|
97,100 |
|
28.1 |
|
88,892 |
|
23.6 |
|
8,208 |
|
9.2 |
| |||
|
Fuel |
|
30,362 |
|
8.8 |
|
30,508 |
|
8.1 |
|
(146 |
) |
(0.5 |
) | |||
|
Operations and maintenance |
|
62,336 |
|
18.0 |
|
68,833 |
|
18.3 |
|
(6,497 |
) |
(9.4 |
) | |||
|
Purchased freight |
|
81,126 |
|
23.4 |
|
110,726 |
|
29.4 |
|
(29,600 |
) |
(26.7 |
) | |||
|
Depreciation and amortization |
|
36,899 |
|
10.7 |
|
33,179 |
|
8.8 |
|
3,720 |
|
11.2 |
| |||
|
Impairments |
|
2005 |
|
0.6 |
|
— |
|
* |
|
2,005 |
|
* |
| |||
|
Other operating expenses |
|
19,892 |
|
5.7 |
|
21,760 |
|
5.7 |
|
(1,868 |
) |
(8.6 |
) | |||
|
Total operating expenses |
|
329,720 |
|
95.3 |
|
353,898 |
|
93.9 |
|
(24,178 |
) |
(6.8 |
) | |||
|
Operating ratio |
|
95.3 |
% |
|
|
93.9 |
% |
|
|
|
|
|
| |||
|
Adjusted operating ratio(2) |
|
93.1 |
% |
|
|
91.9 |
% |
|
|
|
|
|
| |||
|
INCOME FROM OPERATIONS |
|
$ |
16,278 |
|
4.7 |
|
$ |
23,154 |
|
6.1 |
|
$ |
(6,876 |
) |
(29.7 |
) |
|
|
|
|
|
|
|
|
|
|
|
|
|
|
| |||
|
OPERATING STATISTICS: |
|
|
|
|
|
|
|
|
|
|
|
|
| |||
|
Total miles |
|
97,704,619 |
|
|
|
93,978,446 |
|
|
|
3,726,173 |
|
|
| |||
|
Company-operated tractors |
|
1,101 |
|
|
|
1,062 |
|
|
|
39 |
|
|
| |||
|
Owner-operated tractors |
|
219 |
|
|
|
270 |
|
|
|
(51 |
) |
|
| |||
|
Number of trailers |
|
3,404 |
|
|
|
3,057 |
|
|
|
347 |
|
|
| |||
* indicates not meaningful.
(1) Includes intersegment revenues and expenses, as applicable, which are eliminated in Daseke’s consolidated results.
(2) Adjusted operating ratio is not a recognized measure under GAAP. For a definition of adjusted operating ratio and reconciliation of adjusted operating ratio to operating ratio, see “—Non-GAAP Financial Measures” below.
Revenue. Total revenue decreased 4.0% to $651.8 million for the year ended December 31, 2016 from $678.8 million for the year ended December 31, 2015. The change in total revenue, excluding the effect of the Recent Acquisitions, was a decrease of $68.9 million, or 10.2%, primarily due to a decrease in fuel surcharge. Fuel surcharges, excluding the effect of the Recent Acquisitions, was a decrease of 30.3%. Freight revenue, excluding the effect of the Recent Acquisitions, decreased 5.5% to $478.7 million for the year ended December 31, 2016 from $506.6 million for the year ended December 31, 2015 primarily due to a highly competitive freight market resulting in downward pressure on rates. Brokerage revenue, excluding the effect of the Recent Acquisitions, decreased 20.1% to $87.0 million for the year ended December 31, 2016 from $108.9 million for the year ended December 31, 2015 primarily due to loads shifting to company tractors as Daseke’s freight capacity increased.
Daseke’s Flatbed Solutions segment’s revenue was $310.4 million for the year ended December 31, 2016 and $306.3 million for the year ended December 31, 2015, an increase of 1.3%. This increase is primarily a result of the Hornady Acquisition. Daseke’s Flatbed Solutions segment’s total revenue, excluding the effect of the Hornady Acquisition, was $287.6 million for the year ended December 31, 2016, which was a decrease of 6.1%, or $18.7 million, as compared to $306.3 for the year ended December 31, 2015. This decrease was primarily a result of the $10.4 million, or 29.4%, decrease in fuel surcharge revenue (excluding the effect of the Hornady Acquisition on fuel surcharge revenue) and the $8.9 million, or 3.7%, decrease in freight revenue (excluding the impact of the Hornady Acquisition on freight revenue).
Daseke’s Specialized Solutions segment’s revenue was $346.0 million for the year ended December 31, 2016 and $377.1 million for the year ended December 31, 2015, a decrease of 8.2%. Excluding the effect of the Bulldog Acquisition, the Specialized Solutions segment’s total revenue was $326.9 million for the year ended December 31, 2016, which was a decrease of 13.3%, or $50.2 million. This decrease resulted from decreases of $8.6 million, or 30.5%, in fuel surcharge revenue, $19.1 million, or 7.1%, in freight revenues and $22.5 million, or 28.1%, in brokerage revenue (in each case, excluding the effect of the Bulldog Acquisition on revenues).
In both segments, excluding the effect of the Hornady Acquisition and the Bulldog Acquisition, as applicable, the decrease in fuel surcharge was the result of the continuing decline in fuel prices during most of 2016, and the decrease in freight revenue was primarily attributable to a highly competitive freight market resulting in downward pressure on rates.
Salaries, Wages and Employee Benefits. Salaries, wages and employee benefits expense, which consists of compensation for all employees, is primarily affected by the number of miles driven by company drivers, the rate per mile paid to company drivers, employee benefits including, but not limited to, health care and workers’ compensation, and to a lesser extent, the number of, and compensation and benefits paid to, non-driver employees. In general, the Specialized Solutions segment drivers receive a higher driver pay per total mile than Flatbed Solutions segment drivers due to the former requiring a higher level of training and expertise.
Salaries, wages and employee benefits expense increased 10.7% to $197.8 million for the year ended December 31, 2016 from $178.7 million for the year ended December 31, 2015, primarily due to the increase in employees as a result of the Recent Acquisitions. The increase in salaries, wages and employee benefits expense, excluding the effect of the Recent Acquisitions, was 1.9%, or $3.5 million, and is primarily due to increased compensation for drivers and driver support teams and healthcare benefit costs.
Daseke’s Flatbed Solutions segment had a $5.9 million, or 6.7%, increase in salaries, wages and employee benefits expense for the year ended December 31, 2016 compared to the year ended December 31, 2015, primarily as a result of the increase in employees due to the Hornady Acquisition, which resulted in a $7.3 million increase. Excluding the effect of the Hornady Acquisition, salaries, wages and employee benefit expense decreased 1.6%, primarily due to a 5.1% decrease in the number of drivers, partially offset by a 0.8% increase in total miles in the Flatbed Solutions segment.
Daseke’s Specialized Solutions segment had an $8.2 million, or 9.2%, increase in salaries, wages and employee benefits expense primarily as a result of the increase in employees as a result of the Bulldog Acquisition, which resulted in an $8.3 million increase. Excluding the effect of the Bulldog Acquisition, salaries, wages and employee benefits expense was comparable with a 0.1% decrease from the year ended December 31, 2015.
Fuel. Fuel expense consists primarily of diesel fuel expense for company-owned tractors and fuel taxes. The primary factors affecting fuel expense are the cost of diesel fuel, the miles per gallon realized with its equipment and the number of miles driven by its company drivers.
Total fuel expense decreased $3.4 million, or 4.9%, to $66.9 million for the year ended December 31, 2016 from $70.3 million for the year ended December 31, 2015. This decrease is primarily a result of lower fuel prices, partially offset by a 7.0% increase in total miles. The U.S. national average diesel fuel price, as published by the U.S. Department of Energy, was $2.304 for the year ended December 31, 2016, compared to $2.691 for the year ended December 31, 2015, a 14.4% decrease. Excluding the effects of the Recent Acquisitions, total fuel expense decreased by 11.2%, primarily as a result of lower fuel prices. Fuel expense has also been positively impacted by improved efficiency from more fuel-efficient engines and driver training programs.
Daseke’s Flatbed Solutions segment’s fuel expense decreased 8.3% to $36.5 million for the year ended December 31, 2016 from $39.8 million for the year ended December 31, 2015. Excluding the effect of the Hornady Acquisition, fuel expense decreased 14.5% as a result of lower fuel prices, partially offset by an increase in total miles of 0.8% .
Daseke’s Specialized Solutions segment’s fuel expense decreased 0.5% to $30.4 million for the year ended December 31, 2016 from $30.5 million for the year ended December 31, 2015. Excluding the effect of the Bulldog Acquisition, fuel expense decreased 6.8% as the result of lower fuel prices and a decrease in total miles of 1.5%.
Operations and Maintenance. Operations and maintenance expense consists primarily of ordinary vehicle repairs and maintenance, costs associated with preparing tractors and trailers for sale or trade-in, driver recruiting, training and safety costs, permitting and pilot car fees and other general operations expenses. Operations and maintenance expense is primarily affected by the age of company-owned tractors and trailers, the number of miles driven in a period and driver turnover.
Operations and maintenance expense decreased 2.7% to $96.1 million for the year ended December 31, 2016 from $98.7 million for the year ended December 31, 2015. Operations and maintenance expense decreased 7.7% after adjusting for the effect of the Recent Acquisitions.
Daseke’s Flatbed Solutions segment’s operations and maintenance expense increased $3.6 million for the year ended December 31, 2016 as compared to the year ended December 31, 2015, primarily as a result of the Hornady Acquisition, which accounted for $1.9 million of the increase. Excluding the effect of the Hornady Acquisition, this increase was primarily from tractor lease costs as Daseke’s utilization of operating leases to finance tractor purchases increased in 2016.
Daseke’s Specialized Solutions segment’s operations and maintenance expense decreased $6.5 million for the year ended December 31, 2016 as compared to the year ended December 31, 2015. Excluding the effect of the Bulldog Acquisition, operations and maintenance expense decreased $9.5 million, or 13.8%, for the year ended December 31, 2016 as compared to the year ended December 31, 2015 primarily as a result of lower pilot car and maintenance costs due to a decrease in alternative energy project loads, which require a greater use of pilot cars than Daseke’s other loads, in 2016 as compared to 2015.
Purchased Freight. Purchased freight expense consists of the payments to owner-operators, including fuel surcharge reimbursements, and payments to third-party capacity providers that haul loads brokered to them. Purchased freight expense generally takes into account changes in diesel fuel prices, resulting in lower payments during periods of declining fuel prices.
Total purchased freight expense decreased 15.3% from $182.0 million during the year ended December 31, 2015 to $154.1 million during the year ended December 31, 2016, primarily as a result of a decrease in alternative energy project loads, which are serviced by more owner-operators than Daseke’s other loads, in 2016 as compared to 2015 combined with a shift to company drivers from third-party capacity providers. Excluding the effect of the Recent Acquisitions on purchased freight expense, total purchased freight expense decreased 18.5% to $148.3 million during the year ended December 31, 2016 as compared to the year ended December 31, 2015. Purchased freight expense from owner-operators decreased 16.1% from $99.7 million during the year ended December 31,
2015 to $83.7 million during the year ended December 31, 2016, excluding Hornady’s $5.4 million of purchased freight expense from owner-operators, primarily as a result of a decrease in total loads for alternative energy projects, which are serviced by more owner-operators than Daseke’s other projects, combined with a decline in the number of owner-operators and a decrease in fuel charge reimbursements made to owner-operators as a result of lower fuel prices. Purchased freight expense from third-party capacity providers decreased 24.7% from $82.3 million during the year ended December 31, 2015 to $62.0 million, primarily as a result of the decrease in brokered loads due to more loads being shifted to company tractors as Daseke’s capacity increased. The Recent Acquisitions did not have a material effect on purchased freight expense from third-party capacity providers during the year ended December 31, 2016.
Daseke’s Flatbed Solutions segment’s purchased freight expense increased 2.3% to $77.6 million for the year ended December 31, 2016 from $75.8 million for the year ended December 31, 2015, primarily due to the Hornady Acquisition. Excluding the effect of the Hornady Acquisition on purchased freight expense, Daseke’s Flatbed Solutions segment’s purchased freight expense decreased 4.7% to $72.2 million during the year ended December 31, 2016 as compared to the year ended December 31, 2015. Purchased freight expense from owner-operators, excluding Hornady’s $5.4 million of purchased freight expense from owner-operators, decreased 3.0% to $52.0 for the year ended December 31, 2016 from $53.5 for the year ended December 31, 2015. Purchased freight expense from third-party capacity providers decreased 16.9% from $21.4 million during the year ended December 31, 2015 to $17.8 million during the year ended December 31, 2016, primarily as a result of the decrease in brokered loads due to more loads being shifted to company tractors as Daseke’s capacity increased.
Daseke’s Specialized Solutions segment’s purchased freight expense decreased 26.7% to $81.1 million during the year ended December 31, 2016 from $110.7 million during the year ended December 31, 2015. Purchased freight expense from owner-operators decreased 31.3% from $46.2 million during the year ended December 31, 2015 to $31.7 million during the year ended December 31, 2016, primarily as a result of a decrease in total loads for alternative energy projects, which are serviced by more owner-operators than Daseke’s other loads, combined with a decline in the number of owner-operators and a decrease in fuel charge reimbursements made to owner-operators as a result of lower fuel prices. Purchased freight expense from third-party capacity providers decreased 27.4% from $60.9 million during the year ended December 31, 2015 to $44.2 million during the year ended December 31, 2016 for the same reasons the Flatbed Solutions segment’s purchased freight expense from third-party capacity providers decreased over the same periods. The Bulldog Acquisition did not have a material effect on purchased freight expense during the year ended December 31, 2016.
Depreciation and Amortization. Depreciation and amortization expense consists primarily of depreciation for company-owned tractors and trailers or amortization of those financed with capital leases. The primary factors affecting these expense items include the size and age of company-owned tractors and trailers and the cost of new equipment.
Depreciation and amortization expense increased 6.2% to $67.5 million during the year ended December 31, 2016 from $63.6 million during the year ended December 31, 2015, primarily as a result of the Recent Acquisitions. After adjusting for the effect of the Recent Acquisitions, depreciation and amortization expense decreased 3.1%, primarily as a result of a 1.6% reduction in company-owned tractors combined with an increasing shift in the utilization of operating leases to finance capital expenditures.
Daseke’s Flatbed Solutions segment had a 0.6% increase in depreciation and amortization expense primarily as a result of the Hornady Acquisition. Excluding Hornady’s $3.1 million depreciation and amortization expense during the year ended December 31, 2016, depreciation and amortization expense decreased 9.6% primarily due to the increased use of operating leases to finance capital expenditures, which resulted in a 34.1% increase in tractor lease cost for the year ended December 31, 2016 as compared to the year ended December 31, 2015.
Daseke’s Specialized Solutions segment had an 11.2% increase in depreciation and amortization expense primarily as a result of the Bulldog Acquisition. Excluding Bulldog’s $2.8 million depreciation and amortization expense during the year ended December 31, 2016, depreciation and amortization expense increased 2.7% primarily as a result of an 11.3% increase in company-owned trailers partially offset by a 3.7% reduction in company-owned tractors.
Taxes and Licenses. Operating taxes and licenses expense primarily represents the costs of taxes and licenses associated with the Company’s fleet of equipment and will vary according to the size of its equipment fleet. Taxes and license remained flat at $9.2 million during the years ended December 31, 2016 and 2015. As a percentage of revenue, operating taxes and license expense was 1.4% for the years ended December 31, 2016 and 2015. Excluding the impact of the Recent Acquisitions, taxes and licenses expense decreased by $0.6 million, or 6.3%.
Insurance and Claims. Insurance and claims expense consists of insurance premiums and the accruals Daseke makes for estimated payments and expenses for claims for bodily injury, property damage, cargo damage and other casualty events. The primary factors affecting the Company’s insurance and claims expense are seasonality (the Company typically experiences higher accident frequency in winter months), the frequency and severity of accidents, trends in the development factors used in its accruals and developments in large, prior-year claims. The frequency of accidents tends to increase with the miles the Company travels. Insurance and claims expense decreased 2.8% to $19.1 million during the year ended December 31, 2016 from $19.7 million during the year ended December 31, 2015. Insurance and claims expense, excluding Bulldog’s and Hornady’s insurance and claims expense, was $18.3 million, a decrease of 7.1% as compared to the year ended December 31, 2015. This decrease can be primarily attributed to lower premiums on marginally lower total miles of 0.1%.
Impairment. In 2016, certain long-lived assets in the Specialized Solutions segment were written down with a charge of $1.6 million due to a decline in market value on select tractors with defective diesel particulate filter systems. The charge was necessary to reduce the carrying value of this revenue equipment to the price expected to be received upon sale of the assets to a third party. Also in 2016, the carrying value of one subsidiary exceeded its estimated fair value. Accordingly, a non-cash, non-tax deductible goodwill impairment charge of $0.4 million was recognized during the fourth quarter of 2016. During 2015, Daseke had no charges relating to impairment of revenue equipment or goodwill.
Interest Expense. Interest expense consists of cash interest, non-cash paid-in-kind interest, amortization of related issuance costs and fees and prepayment penalties. Interest expense increased 12.2% to $23.1 million during the year ended December 31, 2016 from $20.6 million during the year ended December 31, 2015. Excluding Bulldog’s and Hornady’s interest expense, interest expense increased 9.8%, or $2.0 million, which interest expense was primarily attributable to the borrowings Daseke incurred to finance its acquisitions, prepayment penalties on equipment refinancing in August 2016 and additions of revenue equipment.
Income Tax. Provision for income taxes decreased from $7.5 million for the year ended December 31, 2015 to $0.2 million for the year ended December 31, 2016. The decrease is primarily the result of incurring a loss in the year ended December 31, 2016, as compared to income in the year ended December 31, 2015. The effective tax rate was (1.3)% for the year ended December 31, 2016, compared to 69.6% for the year ended December 31, 2015. The effective income tax rate varies from the federal statutory rate of 35% primarily due to state income taxes and the impact of nondeductible permanent differences, including driver per diems, transaction expenses and cumulative change in the state tax rate applied to the beginning net deferred tax liabilities balance.
Year Ended December 31, 2015 Compared to December 31, 2014
Please see the section entitled “Daseke Management’s Discussion and Analysis of Financial Condition and Results of Operations—Results of Operations—Year Ended December 31, 2015 Compared to Year Ended December 31, 2014” in the Proxy Statement beginning on page 266, which section is incorporated herein by reference.
Non-GAAP Financial Measures
Adjusted EBITDA, Adjusted EBITDAR and Free Cash Flow
Adjusted EBITDA, Adjusted EBITDAR and free cash flow are not recognized measures under GAAP. The Company uses these non-GAAP measures as supplements to its GAAP results in evaluating certain aspects of its business, as described below.
The Company defines Adjusted EBITDA as net income (loss) plus (i) depreciation and amortization, (ii) interest expense, including other fees and charges associated with indebtedness, net of interest income, (iii) income taxes, (iv) acquisition-related transaction expenses (including due diligence costs, legal, accounting and other advisory fees and costs, retention and severance payments and financing fees and expenses), (v) non-cash impairments, (vi) losses (gains) on sales of defective revenue equipment out of the normal replacement cycle, (vii) impairments related to defective revenue equipment sold out of the normal replacement cycle, (viii) initial public offering-related expenses (which offering Daseke withdrew at the end of 2015), (ix) expenses related to the Business
Combination and related transactions, (x) non-cash stock and equity-compensation expense, and (xi) accounting charges resulting from accounting for the possible earn-out pursuant to the Merger Agreement. The Company defines Adjusted EBITDAR as Adjusted EBITDA plus tractor operating lease charges.
The Company’s board of directors and executive management team use Adjusted EBITDA and Adjusted EBITDAR as key measures of its performance and for business planning. Adjusted EBITDA and Adjusted EBITDAR assist them in comparing its operating performance over various reporting periods on a consistent basis because it removes from its operating results the impact of items that, in their opinion, do not reflect its core operating performance. Adjusted EBITDA and Adjusted EBITDAR also allows the Company to more effectively evaluate its operating performance by allowing it to compare the results of operations against its peers without regard to its or its peers’ financing method or capital structure. Adjusted EBITDAR is used to view operating results before lease charges as these charges can vary widely among trucking companies due to differences in the way that trucking companies finance their fleet acquisitions. The Company’s method of computing Adjusted EBITDA is substantially consistent with that used in its debt covenants and also is routinely reviewed by its management for that purpose.
The Company believes its presentation of Adjusted EBITDA and Adjusted EBITDAR is useful because they provide investors and industry analysts the same information that the Company uses internally for purposes of assessing its core operating performance. However, Adjusted EBITDA and Adjusted EBITDAR is not a substitute for, or more meaningful than, net income (loss), cash flows from operating activities, operating income or any other measure prescribed by GAAP, and there are limitations to using non-GAAP measures such as Adjusted EBITDA and Adjusted EBITDAR. Certain items excluded from Adjusted EBITDA and Adjusted EBITDAR are significant components in understanding and assessing a company’s financial performance, such as a company’s cost of capital, tax structure and the historic costs of depreciable assets. Also, other companies in its industry may define Adjusted EBITDA and Adjusted EBITDAR differently than the Company does, and as a result, it may be difficult to use Adjusted EBITDA, Adjusted EBITDAR or similarly named non-GAAP measures that other companies may use to compare the performance of those companies to its performance. Because of these limitations, Adjusted EBITDA and Adjusted EBITDAR should not be considered measures of the income generated by the Company’s business or discretionary cash available to it to invest in the growth of its business. The Company’s management compensates for these limitations by relying primarily on the Company’s GAAP results and using Adjusted EBITDA and Adjusted EBITDAR supplementally.
The Company defines free cash flow as Adjusted EBITDA less net capital expenditures (capital expenditures less proceeds from equipment sales). Its board of directors and executive management team use free cash flow to assess its performance and ability to fund operations and make additional investments. Free cash flow represents the cash that its business generates from operations, before taking into account cash movements that are non-operational. The Company believes its presentation of free cash flow is useful because it is one of several indicators of its ability to service debt, make investments and/or return capital to its stockholders. The Company also believes that free cash flow is one of several benchmarks used by investors and industry analysts for comparison of performance in its industry, although its measure of free cash flow may not be directly comparable to similar measures reported by other companies. Furthermore, free cash flow is not a substitute for, or more meaningful than, net income (loss), cash flows from operating activities, operating income or any other measure prescribed by GAAP, and there are limitations to using non-GAAP measures such as free cash flow. Accordingly, free cash flow should not be considered a measure of the income generated by its business or discretionary cash available to it to invest in the growth of its business. The Company’s management compensates for these limitations by relying primarily on the Company’s GAAP results and using free cash flow supplementally.
A reconciliation of Adjusted EBITDA, Adjusted EBITDAR and free cash flow to net income (loss) for the years ended December 31, 2016, 2015 and 2014 is as follows:
|
|
|
Year Ended December 31, |
| |||||||
|
(In thousands) |
|
2016 |
|
2015 |
|
2014 |
| |||
|
Net income (loss) |
|
$ |
(12,279 |
) |
$ |
3,263 |
|
$ |
1,300 |
|
|
Depreciation and amortization |
|
67,500 |
|
63,573 |
|
48,575 |
| |||
|
Interest income |
|
(44 |
) |
(69 |
) |
(73 |
) | |||
|
Interest expense |
|
23,124 |
|
20,602 |
|
15,978 |
| |||
|
Provision for income taxes |
|
163 |
|
7,463 |
|
1,784 |
| |||
|
Acquisition-related transaction expenses |
|
296 |
|
1,192 |
|
944 |
| |||
|
Impairment |
|
2,005 |
|
— |
|
1,838 |
| |||
|
Withdrawn initial public offering-related expenses |
|
3,051 |
|
1,280 |
|
— |
| |||
|
Net losses on sales of defective revenue equipment out of the normal replacement cycle |
|
718 |
|
— |
|
— |
| |||
|
Impairments related to defective revenue equipment sold out of the normal replacement cycle |
|
190 |
|
— |
|
— |
| |||
|
Expenses related to the Business Combination and related transactions |
|
3,516 |
|
— |
|
— |
| |||
|
Tractor operating lease charges |
|
12,937 |
|
8,957 |
|
6,295 |
| |||
|
Adjusted EBITDAR |
|
$ |
101,177 |
|
$ |
106,261 |
|
$ |
76,641 |
|
|
Less tractor operating lease charges |
|
(12,937 |
) |
(8,957 |
) |
(6,295 |
) | |||
|
Adjusted EBITDA |
|
$ |
88,240 |
|
$ |
97,304 |
|
$ |
70,346 |
|
|
Net capital expenditures |
|
(31,669 |
) |
(66,969 |
) |
(70,678 |
) | |||
|
Free cash flow |
|
$ |
56,571 |
|
$ |
30,335 |
|
$ |
(332 |
) |
Adjusted Operating Ratio
Adjusted operating ratio is not a recognized measure under GAAP. The Company uses adjusted operating ratio as a supplement to its GAAP results in evaluating certain aspects of its business, as described below. The Company defines adjusted operating ratio as (a) total operating expenses (i) less fuel surcharges, acquisition-related transaction expenses, non-cash impairment charges and initial public offering-related expenses (which offering Daseke withdrew at the end of 2015) and (ii) further adjusted for the net impact of the step-up in basis resulting from acquisitions (such as increased depreciation and amortization expense), as a percentage of (b) total revenue excluding fuel surcharge revenue.
The Company’s board of directors and executive management team view adjusted operating ratio, and its key drivers of revenue quality, growth, expense control and operating efficiency, as a very important measure of the Company’s performance. The Company believes fuel surcharge is often volatile and eliminating the impact of this source of revenue (by eliminating fuel surcharge from revenue and by netting fuel surcharge against fuel expense) affords a more consistent basis for comparing its results of operations between periods. The Company also believes excluding acquisition-related transaction expenses, additional depreciation and amortization expenses as a result of acquisitions, non-cash impairments and withdrawn initial public offering-related expenses enhances the comparability of its performance between periods.
The Company believes its presentation of adjusted operating ratio is useful because it provides investors and industry analysts the same information that it uses internally for purposes of assessing its core operating profitability. However, adjusted operating ratio is not a substitute for, or more meaningful than, operating ratio, operating margin or any other measure derived solely from GAAP measures, and there are limitations to using non-GAAP measures such as adjusted operating ratio. Although the Company believes that adjusted operating ratio can make an evaluation of its operating performance more consistent because it removes items that, in its opinion, do not reflect its core operations, other companies in its industry may define adjusted operating ratio differently than it does. As a result, it may be difficult to use adjusted operating ratio or similarly named non-GAAP measures that other companies may use to compare the performance of those companies to the Company’s performance. The Company’s management compensates for these limitations by relying primarily on its GAAP results and using adjusted operating ratio supplementally.
A reconciliation of adjusted operating ratio to operating ratio for each of the years ended December 31, 2016, 2015 and 2014 is as follows:
|
|
|
Year Ended December 31, |
| |||||||
|
(Dollars in thousands) |
|
2016 |
|
2015 |
|
2014 |
| |||
|
Total revenue |
|
$ |
651,802 |
|
$ |
678,845 |
|
$ |
542,711 |
|
|
Fuel surcharge |
|
46,531 |
|
63,363 |
|
85,107 |
| |||
|
Operating revenue, net of fuel surcharge |
|
$ |
605,271 |
|
$ |
615,482 |
|
$ |
457,604 |
|
|
|
|
|
|
|
|
|
| |||
|
Total operating expenses |
|
$ |
641,169 |
|
$ |
647,837 |
|
$ |
523,892 |
|
|
Fuel surcharge |
|
46,531 |
|
63,363 |
|
85,107 |
| |||
|
Acquisition-related transaction expenses |
|
296 |
|
1,192 |
|
944 |
| |||
|
Impairment of equipment |
|
2,005 |
|
— |
|
1,838 |
| |||
|
Withdrawn initial public offering-related expenses |
|
3,051 |
|
1,280 |
|
— |
| |||
|
Expenses related to the Business Combination and related transactions |
|
3,516 |
|
— |
|
— |
| |||
|
Net impact of step-up in basis of acquired assets |
|
7,389 |
|
9,812 |
|
8,510 |
| |||
|
Adjusted operating expenses |
|
$ |
578,381 |
|
$ |
572,190 |
|
$ |
427,493 |
|
|
|
|
|
|
|
|
|
| |||
|
Operating ratio |
|
98.4 |
% |
95.4 |
% |
96.5 |
% | |||
|
Adjusted operating ratio |
|
95.6 |
% |
93.0 |
% |
93.4 |
% | |||
A reconciliation of Daseke’s Flatbed Solutions segment’s adjusted operating ratio to operating ratio for the years ended December 31, 2016, 2015 and 2014 is as follows:
FLATBED SOLUTIONS
|
|
|
Year Ended December 31, |
| |||||||
|
(Dollars in thousands) |
|
2016 |
|
2015 |
|
2014 |
| |||
|
Total revenue(1) |
|
$ |
310,440 |
|
$ |
306,320 |
|
$ |
322,527 |
|
|
Fuel surcharge |
|
26,871 |
|
35,428 |
|
58,122 |
| |||
|
Operating revenue, net of fuel surcharge |
|
$ |
283,569 |
|
$ |
270,892 |
|
$ |
264,405 |
|
|
|
|
|
|
|
|
|
| |||
|
Total operating expenses(1) |
|
$ |
294,797 |
|
$ |
286,089 |
|
$ |
309,352 |
|
|
Fuel surcharge |
|
26,871 |
|
35,428 |
|
58,122 |
| |||
|
Acquisition-related transaction expenses |
|
— |
|
— |
|
— |
| |||
|
Impairment |
|
— |
|
— |
|
1,838 |
| |||
|
Net impact of step-up in basis of acquired assets |
|
3,169 |
|
4,952 |
|
5,895 |
| |||
|
Adjusted operating expenses |
|
$ |
264,757 |
|
$ |
245,709 |
|
$ |
243,497 |
|
|
Operating ratio |
|
95.0 |
% |
93.4 |
% |
95.9 |
% | |||
|
Adjusted operating ratio |
|
93.4 |
% |
90.7 |
% |
92.1 |
% | |||
(1) Includes intersegment revenues and expenses, as applicable, which are eliminated in Daseke’s consolidated results.
A reconciliation of Daseke’s Specialized Solutions segment’s adjusted operating ratio to Operating Ratio for the years ended December 31, 2016, 2015 and 2014 is as follows:
SPECIALIZED SOLUTIONS
|
|
|
Year Ended December 31, |
| |||||||
|
(Dollars in thousands) |
|
2016 |
|
2015 |
|
2014 |
| |||
|
Total revenue(1) |
|
$ |
345,998 |
|
$ |
377,052 |
|
$ |
222,589 |
|
|
Fuel surcharge |
|
20,086 |
|
28,186 |
|
26,985 |
| |||
|
Operating revenue, net of fuel surcharge |
|
$ |
325,912 |
|
$ |
348,866 |
|
$ |
195,604 |
|
|
|
|
|
|
|
|
|
| |||
|
Total operating expenses(1) |
|
$ |
329,720 |
|
$ |
353,898 |
|
$ |
208,924 |
|
|
Fuel surcharge |
|
20,086 |
|
28,186 |
|
26,985 |
| |||
|
Acquisition-related transaction expenses |
|
— |
|
171 |
|
— |
| |||
|
Impairment |
|
2,005 |
|
— |
|
— |
| |||
|
Net impact of step-up in basis of acquired assets |
|
4,220 |
|
4,860 |
|
2,615 |
| |||
|
Adjusted operating expenses |
|
$ |
303,409 |
|
$ |
320,681 |
|
$ |
179,324 |
|
|
|
|
|
|
|
|
|
| |||
|
Operating ratio |
|
95.3 |
% |
93.9 |
% |
93.9 |
% | |||
|
Adjusted operating ratio |
|
93.1 |
% |
91.9 |
% |
91.7 |
% | |||
(1) Includes intersegment revenues and expenses, as applicable, which are eliminated in Daseke’s consolidated results.
Liquidity and Capital Resources and Capital Requirements
Overview
The Company’s business requires substantial amounts of cash to cover operating expenses as well as to fund items such as cash capital expenditures on its fleet and other assets, working capital changes, principal and interest payments on debt obligations, letters of credit to support insurance requirements and tax payments. The Company expects net capital expenditures to be approximately $49.0 million for 2017.
Daseke’s primary sources of liquidity have been provided by operations, issuances of capital stock and borrowings under its credit facility. Daseke had the following sources of liquidity available at December 31, 2016.
|
(In thousands) |
|
December 31, 2016 |
| |
|
Cash |
|
$ |
3,695 |
|
|
Availability under revolving line of credit |
|
32,958 |
| |
|
Total |
|
$ |
36,653 |
|
As of February 27, 2017, the Company has (i) a new $350.0 million senior secured term loan credit facility (which is referred to in this Form 8-K as the “Term Loan Facility”), consisting of a $250.0 million term loan (which is referred to in this Form 8-K as the “Closing Date Term Loan”) and up to $100.0 million of terms loans to be funded from time to time under a delayed draw term loan facility available until February 27, 2018 (which is referred to in this Form 8-K as the “Delayed Draw Term Loans”), and (ii) a $70.0 million asset-based senior secured revolving credit facility (which is referred to in this Form 8-K as the “ABL Facility”). The Closing Date Term Loan was used, in part, to pay off the existing Daseke term loan, which had a total balance of $125.7 million as of December 31, 2016 and $122.3 million immediately prior to such repayment. The Delayed Draw Term Loans are available to support the Company’s acquisition activities. See Item 1.01 “Entry Into a Material Definitive Agreement—Term Loan Facility” and “—ABL Revolving Credit Facility” for more information regarding the Term Loan Facility and the ABL Facility (collectively, the “New Credit Facilities”), respectively.
The Company believes it can finance its expected cash needs, including debt repayment, in the short-term with cash flows from operations and borrowings available under the ABL Facility. The Company expects that the New Credit Facilities will provide sufficient credit availability to support its ongoing operations, fund its new debt service requirements, capital expenditures, working capital and acquisition activities. Over the long-term, the Company will continue to have significant capital requirements, and expects to devote substantial financial resources to grow its operations and fund its acquisition activities. As a result of these funding requirements, the Company likely will need to sell additional equity or debt securities or seek additional financing through additional borrowings, lease financing or equity capital. The availability of financing or equity capital will depend upon the its financial condition and results of operations as well as prevailing market conditions. If such additional borrowings, lease financing or equity capital is not available at the time it needs to incur such expenditures, then the Company may be required to extend the maturity of then outstanding indebtedness, rely on alternative financing arrangements, engage in asset sales or suspend the anticipated quarterly cash dividends.
Cash Flows
Daseke’s summary statements of cash flows information for the years ended December 31, 2016 and 2015 is set forth in the table below:
|
|
|
Year Ended December 31, |
| ||||
|
(In thousands) |
|
2016 |
|
2015 |
| ||
|
Net cash provided by operating activities |
|
$ |
66,130 |
|
$ |
87,739 |
|
|
Net cash provided by (used in) investing activities |
|
$ |
1,798 |
|
$ |
(4,152 |
) |
|
Net cash used in financing activities |
|
$ |
(69,119 |
) |
$ |
(81,107 |
) |
Operating Activities. Cash provided by Daseke’s operating activities primarily consists of net income or loss adjusted for certain non-cash items, including depreciation and amortization, deferred interest, gain/loss on disposal of property and equipment, deferred income taxes, deferred gain and interest recognized on sales-type leases and the effect of changes in working capital and other activities.
Cash provided by operating activities was $66.1 million during the year ended December 31, 2016 and consisted of $12.3 million of net loss plus $71.3 million of non-cash items, consisting primarily of depreciation and amortization and impairment of equipment, plus $7.1 million of net cash provided by working capital and other activities. Cash used for working capital and other activities during the year ended December 31, 2016 primarily reflect an $8.7 million increase in accounts receivable, $3.7 million in payments received on sales-type leases, a $6.4 million decrease in prepaid expenses and other assets, and an $11.2 million decrease in accounts payable and accrued expenses. Cash provided by operating activities was $87.7 million during the year ended December 31, 2015 and consisted of $3.3 million of net income plus $70.8 million of non-cash items, consisting primarily of depreciation and amortization and deferred taxes, net gain on disposal of property and equipment, plus $13.7 million of net cash provided by working capital and other activities. Cash provided by working capital and other activities during the year ended December 31, 2015 primarily reflect a $6.8 million increase in accounts receivable, $2.2 million in payments received on sales-type leases, a $1.8 million increase in prepaid expenses and other assets, and a $5.7 million increase in accounts payable and accrued expenses.
The $21.6 million decrease in cash provided by operating activities during the year ended December 31, 2016 as compared with the year ended December 31, 2015 was primarily the result of a $15.5 million decrease in net income and $7.1 million of net cash provided by working capital and other activities during the year ended December 31, 2016 as compared to $13.7 million of net cash provided by working capital and other activities during the year ended December 31, 2015.
Investing Activities. Cash provided by investing activities increased $6.0 million during the year ended December 31, 2016 as compared to the year ended December 31, 2015, in part due to the Hornady Acquisition. Excluding Hornady’s impact on cash provided by investing activities, cash used in investing activities increased $3.7 million for the year ended December 31, 2016 as compared to the year ended December 31, 2015 primarily due to fewer tractor purchases in the year ended December 31, 2016 as Daseke’s utilization of operating leases to finance tractor purchases increased.
Total net capital expenditures for the year ended December 31, 2016 and 2015 are shown below:
|
|
|
Year Ended December 31, |
| ||||
|
(In thousands) |
|
2016 |
|
2015 |
| ||
|
Revenue equipment (tractors, trailers and trailer accessories) |
|
$ |
1,152 |
|
$ |
3,601 |
|
|
Buildings and building improvements |
|
1,685 |
|
1,164 |
| ||
|
Other |
|
1,271 |
|
1,666 |
| ||
|
Total cash capital expenditures |
|
$ |
4,108 |
|
$ |
6,431 |
|
|
Less: Proceeds from sales of property and equipment |
|
5,906 |
|
2,215 |
| ||
|
Net cash capital expenditures(1) |
|
$ |
(1,798 |
) |
$ |
4,216 |
|
(1) Daseke also acquires property and revenue equipment with debt and capital lease obligations. For the years ended December 31, 2016 and 2015, Daseke incurred $33.5 million and $62.8 million, respectively, of debt and capital lease obligations to acquire property and revenue equipment.
Financing Activities. Net cash used in financing activities decreased $12.0 million during the year ended December 31, 2016 as compared to the year ended December 31, 2015. This decreased outflow was primarily a result of a decrease of $2.9 million in cash outflows of bank overdrafts due to timing of payments, $7.6 million increase in net borrowings under the revolving line of credit, $14.2 million increase in proceeds of long-term debt, primarily due to the real estate term loan refinancing (discussed under “—Material Debt—Real Estate Term Loan” below), and $2.7 million decrease in related party debt payments due to the payoff of such debt in 2015, partially offset by $13.9 million of increases in principal payments on long-term debt incurred to finance the Bulldog Acquisition, the Hornady Acquisition and purchases of property and equipment.
Material Debt
Overview
As of December 31, 2016, Daseke had the following material debt:
· a senior secured credit facility consisting of a term loan due October 2019 (the “Old PNC Term Loan”) and a revolving line of credit due October 2019 (the “Old Revolving Credit Facility”);
· senior secured subordinated promissory notes in the initial aggregate principal amount of $20.0 million (the “Main Street Loan”);
· senior secured subordinated promissory notes in the initial aggregate principal amount of $20.0 million (the “PCP Subordinated Notes”);
· a $14.2 million loan agreement secured by certain real estate (the “Real Estate Term Loan”);
· subordinated promissory notes of $22.0 million (the “LST Subordinated Notes”);
· a $1.0 million subordinated promissory note (the “Davenport Subordinated Note”);
· a $0.3 million subordinated promissory note (the “Bulldog Subordinated Note”); and
· secured equipment loans and capital lease agreements.
The amounts outstanding under such agreements and other debt instruments were as follows as of December 31, 2016 and 2015:
|
|
|
December 31, |
| ||||
|
(In thousands) |
|
2016 |
|
2015 |
| ||
|
Revolving line of credit |
|
$ |
6,858 |
|
$ |
12,555 |
|
|
PNC term loan |
|
125,682 |
|
69,048 |
| ||
|
Main Street Loan |
|
21,660 |
|
21,118 |
| ||
|
PCP Subordinated Notes |
|
21,492 |
|
20,963 |
| ||
|
Real Estate Term Loan |
|
13,772 |
|
— |
| ||
|
LST Subordinated Notes |
|
22,000 |
|
22,000 |
| ||
|
Davenport Subordinated Note |
|
1,000 |
|
1,000 |
| ||
|
Bulldog Subordinated Note |
|
291 |
|
2,000 |
| ||
|
Mortgages |
|
11,636 |
|
8,225 |
| ||
|
Equipment term loans and capital leases |
|
114,064 |
|
210,857 |
| ||
|
Total long-term debt and capital leases |
|
$ |
338,455 |
|
$ |
367,766 |
|
|
Less: current portion |
|
(52,665 |
) |
(66,800 |
) | ||
|
Long-term debt and capital leases, less current portion |
|
$ |
285,790 |
|
$ |
300,966 |
|
On February 27, 2017, in conjunction with the Closing, the Company entered into the New Credit Facilities, a portion of the borrowings of which were used to pay off the Old PNC Term Loan, the Old Revolving Credit Facility, the Main Street Loan, the PCP Subordinated Notes, the LST Subordinated Notes, the Davenport Subordinated Note and the Bulldog Subordinated Note.
The Old PNC Term Loan and the Old Revolving Credit Facility
As of December 31, 2016, Daseke had lender commitments for the Old PNC Term Loan of $137.1 million. The amount available to be borrowed under the Old PNC Term Loan was subject to the value of Daseke’s trucking stock. As of December 31, 2016, the outstanding balance of the Old PNC Term Loan was $125.7 million. Daseke had a choice of whether the Old PNC Term Loan bore interest at a rate equal to (i) the current LIBOR plus 4.00% or (ii) the sum of (x) the greatest of (a) PNC’s reference rate, (b) the federal funds effective rate plus 0.50%, and (c) the daily LIBOR plus 1.00%, plus (y) a margin of 3.00%. At December 31, 2016, the interest rate on borrowings under the Old PNC Term Loan was 4.4%.
As of December 31, 2016, Daseke had lender commitments for the Old Revolving Credit Facility of $75.0 million and a sublimit for letters of credit of $10.0 million. The amount available to be borrowed under the Old Revolving Credit Facility was subject to a borrowing base that was determined monthly based upon a formula calculated by reference to eligible accounts receivable and inventory. As of December 31, 2016, Daseke had approximately $6.9 million of borrowings and $4.1 million in letters of credit outstanding under the Old Revolving Credit Facility, and Daseke was able to incur approximately $33.0 million of additional indebtedness under the Old Revolving Credit Facility. Daseke had a choice of borrowing in Eurodollars or at the adjusted base rate. As of December 31, 2016, borrowings under the Old Revolving Credit Facility bore interest at a rate equal to (i) the current LIBOR plus 3.25% or (ii) the sum of (x) the greatest of (a) PNC’s reference rate, (b) the federal funds effective rate plus 0.50%, and (c) the daily LIBOR plus 1.00%, plus (y) a margin of 2.25%. The applicable margins on Eurodollar and adjusted rate borrowings was able to be adjusted downward depending on the current fixed charge
coverage ratio as of the end of each fiscal quarter. At December 31, 2016, the interest rate on borrowings under the Old Revolving Credit Facility was 4.5%.
Main Street Loan and PCP Subordinated Notes
The initial aggregate principal amount of the Main Street Loan and the PCP Subordinated Notes was $20.0 million each. The outstanding principal balance of each such loan had an interest rate of 12.0% per annum paid in cash. With respect to each such loan, paid-in-kind interest, at a rate of 2.5% per annum, could be paid monthly in cash or accrued and added to the principal balance quarterly, at Daseke’s option. As of December 31, 2016, the outstanding principal balance of the Main Street Loan was $21.6 million and the outstanding principal balance of the PCP Subordinated Notes was $21.5 million, in each case including capitalized paid-in-kind interest.
Real Estate Term Loan
In April 2016, Daseke refinanced $14.2 million of the Old Revolving Credit Facility with bank debt utilizing nine wholly-owned real estate assets which previously served as collateral for the Old PNC Term Loan. As of December 31, 2016, $13.8 million remains outstanding on The Real Estate Term Loan which requires monthly payments of principal plus interest at the Libor Rate (as defined in the loan agreement), plus a margin of 2.75%, with any remaining amounts outstanding due in April 2021.
LST Subordinated Notes, Davenport Subordinated Note and Bulldog Subordinated Note
The LST Subordinated Notes had an interest rate of 10.0% per annum, payable in cash, and had a combined initial principal amount of $22.0 million. The Davenport Subordinated Note had an interest rate of 5.0% per annum, payable in cash, and had an initial principal amount of $1.0 million. The Bulldog Subordinated Note had an interest rate of 7.0% per annum, payable in cash, and had an initial principal amount of $2.0 million.
Mortgages
Daseke has a bank construction loan with a balance of $8.9 million as of December 31, 2016, which was incurred to finance the construction of a new headquarters and terminal in Arlington, Washington. The construction loan is collateralized by such property and buildings. The construction loan bears interest at 3.25% payable monthly, with principal payments of $30,036 due beginning October 29, 2016 through the maturity date of February 19, 2020. The Company has the option to extend the maturity date to February 19, 2022.
Daseke has a bank mortgage loan with a balance of $2.7 million as of December 31, 2016, which was incurred to finance the construction of the headquarters and terminal in Redmond, Oregon. The mortgage loan is collateralized by such property and buildings. The mortgage loan is payable in monthly installments. From December 1, 2014 through November 2017, the monthly installment payment is $15,776, including interest at 3.7%. The interest rate and monthly payment will be adjusted on November 1, 2017 and 2020 to a rate of 2.5%, plus the three-year advance rate published by the Federal Home Loan Bank of Seattle in effect 45 days prior to November 1, 2017 and 2020, but not less than 3.7%. The bank mortgage loan matures on November 1, 2023.
Equipment Term Loans and Capital Leases
As of December 31, 2016, Daseke and its subsidiaries had term loans collateralized by equipment in the aggregate amount of $100.2 million with 27 lenders. These equipment term loans bear interest at rates ranging from 1.5% to 6.9%, require monthly payments of principal and interest and mature at various dates through December 2023. Certain of these loans contain conditions, covenants, representations and warranties, events of default, and indemnification provisions applicable to the Company and certain of its subsidiaries that are customary for equipment financings, including, but not limited to, limitations on the incurrence of additional debt and the prepayment of existing indebtedness, certain payments (including dividends and other distributions to persons not party to its credit facility) and transfers of assets.
The Company also leases certain equipment under long-term capital lease arrangements that expire on various dates through October 2021. The present values of net minimum lease payments under the capital leases are
recorded in long-term debt, which was an aggregate of $13.8 million as of December 31, 2016. As of December 31, 2016, the book value of the property and equipment recorded under these capital leases was $24.1 million, net of accumulated depreciation of $17.0 million. Certain of these lease agreements contain conditions, covenants, representations and warranties, events of default, and indemnification provisions applicable to the Company that are customary for such leases, including, but not limited to, limitations on the incurrence of additional indebtedness and the prepayment of existing indebtedness, certain payments (including dividends and other distributions to persons not party to its credit facility) and transfers of assets.
Derivative Financial Instruments
The Company is exposed to certain risks relating to its ongoing business operations. The primary risk managed by using derivative instruments is interest rate risk. The Company’s strategy is to use pay-fixed/receive-variable interest rate swaps to reduce its aggregate exposure to interest rate risk associated with long-term variable rate debt. Daseke had one interest rate swap agreement in effect at December 31, 2016, with a total notional amount of $12.0 million, which matures on various dates through April 30, 2018. Daseke had another interest rate swap agreement with a total notional amount of $1.1 million as of December 31, 2015, which was terminated in 2016. These derivative instruments were not entered into for speculative purposes. The fair value of the interest rate swap liability at December 31, 2016 was $0.1 million. The fair values of the interest rate swaps are based on valuations provided by third parties and derivative pricing models.
Off-Balance Sheet Arrangements
The Company’s financial condition, results of operations, liquidity, capital expenditures and capital resources are not materially affected by off-balance sheet transactions. Daseke had stand-by letters of credit in the amount of $6.5 million at December 31, 2016. The letters of credit provide collateral primarily for liability insurance claims. Also, the Company leases certain revenue equipment, terminals and office building facilities under non-cancelable operating leases. Daseke’s rent expense under these leases for the year ended December 31, 2016 was approximately $16.0 million.
Contractual Obligations
The table below summarizes Daseke’s contractual obligations as of December 31, 2016:
|
|
|
Payments Due By Period |
| |||||||||||||
|
(In thousands) |
|
Less Than |
|
1-3 Years |
|
3-5 Years |
|
More Than |
|
Total |
| |||||
|
Long-term debt obligations, including interest(1) |
|
$ |
65,517 |
|
$ |
255,203 |
|
$ |
32,058 |
|
$ |
16,563 |
|
$ |
369,341 |
|
|
Capital lease obligations(2) |
|
5,113 |
|
8,906 |
|
1,074 |
|
— |
|
15,093 |
| |||||
|
Operating lease obligations(3) |
|
16,063 |
|
26,496 |
|
5,779 |
|
2,247 |
|
50,585 |
| |||||
|
Purchase obligations(4) |
|
— |
|
— |
|
— |
|
— |
|
— |
| |||||
|
Total contractual obligations |
|
$ |
86,693 |
|
$ |
290,605 |
|
$ |
38,911 |
|
$ |
18,810 |
|
$ |
435,019 |
|
(1) Includes interest obligations on long-term debt and excludes fees. For variable rate debt, the interest rate in effect as of December 31, 2016 was utilized. The table assumes long-term debt is held to maturity. As discussed above under “— Material Debt—Overview,” certain of Daseke’s long-term debt obligations were repaid, and the Company has entered into the New Credit Facilities in conjunction with the Closing on February 27, 2017.
(2) Capital lease obligations relate primarily to revenue equipment.
(3) Represents future monthly rental payment obligations, which include an interest element, under operating leases for tractors, trailers and facilities. Substantially all lease agreements for revenue equipment have fixed payment terms based on the passage of time. The tractor lease agreements generally stipulate maximum miles and provide for mileage penalties for excess miles. These leases generally run for a period of three to five years for tractors and five to seven years for trailers.
(4) Represents purchase obligations for fuel.
Inflation
Inflation can have an impact on the Company’s operating costs. A prolonged period of inflation could cause interest rates, fuel, wages and other costs to increase, which would adversely affect the Company’s results of operations unless freight rates correspondingly increase. The Company attempts to limit the effects of inflation through increases in freight rates, certain cost control efforts and limiting the effects of fuel prices through fuel surcharges and measures intended to reduce the consumption of fuel. Over the past three years, the effect of inflation has been minor.
Seasonality
In the transportation industry, results of operations generally show a seasonal pattern. The Company’s tractor productivity decreases during the winter season because inclement weather impedes operations and some shippers reduce their shipments during winter. At the same time, operating expenses increase and fuel efficiency declines because of engine idling and harsh weather creating higher accident frequency, increased claims and higher equipment repair expenditures. The Company also may suffer from weather-related or other events such as tornadoes, hurricanes, blizzards, ice storms, floods, fires, earthquakes and explosions. These events may disrupt fuel supplies, increase fuel costs, disrupt freight shipments or routes, affect regional economies, destroy the Company’s assets or adversely affect the business or financial condition of its customers, any of which could adversely affect results or make results more volatile.
Quantitative and Qualitative Disclosures About Market Risk
The Company has interest rate exposure arising from the credit facility and other financing agreements, which have variable interest rates. These variable interest rates are impacted by changes in short-term interest rates. Daseke manages interest rate exposure through an interest rate swap agreement in effect at December 31, 2016, with a total notional amount of $12.0 million (pay fixed — weighted average rate of 3.63% at December 31, 2016; receive LIBOR). Assuming the current level of borrowings, a hypothetical one-percentage point increase in interest rates would increase Daseke’s annual interest expense by $3.3 million. At December 31, 2016 and February 28, 2017, Daseke had outstanding approximately $139.3 million and $252.5 million, respectively, of variable rate borrowings that were not subject to interest rate swaps.
The Company has commodity exposure with respect to fuel used in company-owned and leased tractors. Increases in fuel prices will raise its operating costs, even after applying fuel surcharge revenue. Historically, Daseke has been able to recover a majority of fuel price increases from its customers in the form of fuel surcharges. The Company cannot predict the extent or speed of potential changes in fuel price levels in the future, the degree to which the lag effect of fuel surcharge programs will impact it as a result of the timing and magnitude of such changes, or the extent to which effective fuel surcharges can be maintained and collected to offset such increases. Daseke generally has not used derivative financial instruments to hedge its fuel price exposure in the past, but the Company continues to evaluate this possibility.
Critical Accounting Policies
The preparation of the Company’s consolidated financial statements in conformity with GAAP requires it to make estimates and assumptions that impact the amounts reported in its consolidated financial statements and accompanying notes. Therefore, the reported amounts of assets, liabilities, revenue, expenses, and associated disclosures of contingent assets and liabilities are affected by these estimates and assumptions. The Company evaluates these estimates and assumptions on an ongoing basis, utilizing historical experience, consultation with experts and other methods considered reasonable in the particular circumstances. Nevertheless, actual results may differ significantly from these estimates and assumptions, and it is possible that materially different amounts will be reported using differing estimates or assumptions. The Company considers critical accounting policies to be those that require it to make more significant judgments and estimates when preparing financial statements. The Company’s critical accounting policies include the following:
Revenue Recognition
The Company recognizes revenue and related costs when persuasive evidence of an arrangement exists, delivery has occurred, the fee is fixed or determinable and collectability is probable. With respect to freight, brokerage and fuel surcharge revenue, these conditions are met, and the Company recognizes such revenue, upon delivery of a load.
The Company recognizes brokerage revenue on a gross basis, as opposed to a net basis because it bears the risks and benefits associated with revenue-generated activities by, among other things, (i) acting as a principal in the transaction, (ii) establishing prices, (iii) managing all aspects of the shipping process, and (iv) taking the risk of loss for collection, delivery and returns. Accordingly, all such revenue billed to customers is classified as brokerage revenue, and all corresponding payments to carriers for transportation services arranged by the Company in connection with brokerage activities and to independent contractor providers of revenue equipment are classified as purchased freight.
Goodwill and Intangible Assets
Goodwill and other intangible assets result from business acquisitions. The Company accounts for business acquisitions by assigning the purchase price to tangible and intangible assets and liabilities. Assets acquired and liabilities assumed are recorded at their fair values and the excess of the purchase price over amounts assigned is recorded as goodwill.
Goodwill is tested for impairment at least annually by applying a fair value based analysis in accordance with the authoritative accounting guidance on goodwill and other intangible assets. The Company’s annual assessment is conducted in the fourth quarter of each year.
Other intangible assets recorded consist of indefinite-lived trade names and definite-lived non-competition agreements and customer relationships. These intangible assets are stated at estimated fair value at the time of acquisition less accumulated amortization. Amortization is recorded using the straight-line method over the following estimated useful lives: (i) non-competition agreements: two to five years, and (ii) customer relationships: 11 to 15 years. The Company evaluates its definite-lived assets for impairment when current facts or circumstances indicate that the carrying value of the assets to be held and used may not be recoverable. Indefinite-lived intangible assets are tested at least annually by applying a fair value based analysis in accordance with the authoritative accounting guidance for such assets.
Income Taxes
Income taxes are accounted for using an asset and liability approach that requires the recognition of deferred tax assets and liabilities for the expected future tax consequences of temporary differences between the consolidated financial statement and tax basis of assets and liabilities at the applicable enacted tax rates.
The Company adheres to the provisions of Financial Accounting Standards Board (“FASB”) Accounting Standards Codification (ASC) 740-10, Income Taxes, relating to accounting for uncertain tax positions. The Company recognizes the tax benefit from uncertain tax positions only if it is more likely than not that the tax positions will be sustained on examination by the tax authorities, based on the technical merits of the position. The tax benefit is measured based on the largest benefit that has a greater than 50% likelihood of being realized upon ultimate settlement.
Accrued Insurance and Claims
The Company uses a combination of purchased insurance and self-insurance programs to provide for the cost of vehicle liability, cargo loss or damage, workers’ compensation claims and employee medical benefits. Self-insurance accruals relate primarily to vehicle liability, cargo damage and workers’ compensation claims and employee medical benefits.
The measurement and classification of self-insured costs requires the consideration of historical cost
experience, demographic and severity factors, and judgments about the current and expected levels of cost per claim and retention levels. These methods provide estimates of the liability associated with claims incurred as of the balance sheet date, including claims not reported. The Company believes these methods are appropriate for measuring these highly judgmental self-insurance accruals. However, the use of any estimation method is sensitive to the assumptions and factors described above, based on the magnitude of claims and the length of time from the date the claim is incurred to ultimate settlement. Accordingly, changes in these assumptions and factors can materially affect actual costs paid to settle the claims and those amounts may be different than estimates.
Recently Issued Accounting Pronouncements
In January 2017, the FASB issued Accounting Standards Update (“ASU”) 2017-04, Intangibles — Goodwill and Other (Topic 350). ASU 2017-04 removes the requirement to perform a hypothetical purchase price allocation to measure goodwill impairment. A goodwill impairment will now be the amount by which a reporting unit’s carrying value exceeds its fair value, not to exceed the carrying amount of goodwill. ASU 2017-04 is effective for fiscal years beginning December 15, 2019, with early adoption permitted for interim and annual goodwill impairment tests performed on testing dates after January 1, 2017, and applied prospectively. The Company does not expect ASU 2017-04 to have a material impact on its consolidated results of operations, financial condition, cash flows, and financial statement disclosures.
In August 2016, the FASB issued ASU 2016-15, Statement of Cash Flows (Topic 230). ASU 2016-15 provides new guidance intended to reduce diversity in practice in how certain cash receipts and payments are classified in the statement of cash flows, including debt prepayment or extinguishment costs, the settlement of contingent liabilities arising from a business combination, proceeds from insurance settlements, and distributions from certain equity method investees. ASU 2016-05 will become effective for fiscal years beginning after December 15, 2017 and interim periods within fiscal years beginning after December 31, 2019. Early adoption is permitted. ASU 2016-15 requires application using a retrospective transition method. The Company is currently evaluating the impact of adopting this guidance.
On June 16, 2016, the FASB issued ASU No. 2016-13, Accounting for Credit Losses (Topic 326). ASU 2016-13 requires the use of an “expected loss” model on certain types of financial instruments. ASU 2016-13 is effective for fiscal years, and interim periods within those years, beginning after December 15, 2019, with early adoption permitted. The Company is currently evaluating the impact of adopting this guidance.
In February 2016, the FASB issued ASU 2016-02, Leases (Topic 842). ASU 2016-02 amends various aspects of existing guidance for leases. ASU 2016-02 requires an entity to recognize assets and liabilities arising from a lease for both financing and operating leases, along with additional qualitative and quantitative disclosures. The main difference between previous GAAP and the amended standard is the recognition of lease assets and lease liabilities of lessees on the balance sheet for those leases classified as operating leases under previous GAAP. ASU 2016-02 is effective for fiscal years beginning after December 15, 2018, with early adoption permitted. The Company is currently evaluating the effect this ASU will have on its consolidated financial position and results of operations.
In September 2015, the FASB issued ASU 2015-16, Business Combinations (Topic 805). ASU 2015-16 simplifies the accounting for measurement-period adjustments related to business combinations by removing the requirement to retrospectively apply adjustments made to estimated amounts recognized in a business combination. ASU 2015-16 permits the purchaser to adjust the estimated amounts in the reporting period in which the adjustments are determined. The ASU is effective for annual periods beginning after December 31, 2015 and interim periods within those annual periods. Adoption of this pronouncement did not have a material impact on Daseke’s consolidated financial statements.
In April 2015, the FASB issued ASU 2015-03, Interest-Imputation of Interest (Subtopic 835-30). ASU 2015-03 amends existing guidance to require the presentation of debt issuance costs in the consolidated balance sheets as a direct deduction from the carrying amount of the associated debt liability instead of a deferred charge. In August 2015, the FASB issued updated guidance with ASU 2015-15 pertaining to the presentation of debt issuance costs related to line-of-credit arrangements. This ASU allows an entity to defer and present debt issuance costs as an asset, subsequently amortizing the deferred debt issuance costs over the term of the line-of-credit arrangement,
regardless of whether there are any outstanding borrowings on the line-of-credit arrangement. Daseke elected to early adopt this standard effective September 30, 2016, on a retrospective basis. Adoption of this standard represents a change in accounting principle. See Note 2 to Daseke’s audited consolidated financial statements included in this Form 8-K for further information.
In January 2015, the FASB issued ASU 2015-01, Simplifying Income Statement Presentation by Eliminating the Concept of Extraordinary Items. ASU 2015-01 eliminates from GAAP the concept of an extraordinary item. The FASB released the new guidance as part of its simplification initiative, which is intended to identify, evaluate and improve areas of GAAP for which cost and complexity can be reduced while maintaining or improving the usefulness of the information provided to users of financial statements. The ASU is effective for annual periods beginning after December 31, 2015, and interim periods within those annual periods. Adoption of this pronouncement did not have a material impact on Daseke’s consolidated financial statements.
In May 2014, the FASB issued ASU No. 2014-09, Revenue from Contracts with Customers (Topic 606), which is effective for the Company in 2018. The core principle of the guidance is that an entity should recognize revenue to depict the transfer of promised goods or services to customers in an amount that reflects the consideration to which the entity expects to be entitled in exchange for those goods or services. In August 2015, the FASB issued update guidance with ASU 2015-14 which deferred the effective date of ASU 2014-09 by one year. The guidance in ASU 2014-09 is effective for annual periods beginning after December 15, 2017, and interim periods within those annual periods.
In March 2016, the FASB issued an accounting standards update that further clarifies guidance under ASU 2014-09 with respect to principal versus agent considerations in revenue from contracts with customers. In the second quarter of 2016, the FASB issued two accounting standard updates that provide additional guidance when identifying performance obligations and licenses as well as allowing for certain narrow scope improvements and practical expedients. These accounting standard updates have the same effective date as the original standard. The Company is in the process of evaluating ASU 2014-09, including the expected impact on business processes, systems and controls, and potential differences in the timing and/or method of revenue recognition for contracts. The Company has not determined if adoption of ASU 2014-09 will have a material impact on its results of operations or cash flows in the periods after adoption.
Security Ownership of Certain Beneficial Owners and Management
The following table sets forth information known to the Company regarding beneficial ownership of shares of common stock of the Company upon consummation of the Business Combination on February 27, 2017 by:
·each person who is known by the Company to be the beneficial owner of more than 5% of the outstanding shares of the Company’s common stock;
·each of the Company’s directors and executive officers; and
·all executive officers and directors of the Company as a group.
Beneficial ownership is determined according to the rules of the SEC, which generally provide that a person has beneficial ownership of a security if he, she or it possesses sole or shared voting or investment power over that security, including options and warrants that are currently exercisable or exercisable within 60 days.
Beneficial ownership of common stock of the Company is based on 37,715,960 shares of common stock of the Company issued and outstanding upon consummation of the Business Combination. The expected beneficial ownership percentages set forth in the following table with respect to the Company following the consummation of the Business Combination on February 27, 2017 do not give effect to the conversion to Company common stock of any of the 650,000 shares of Series A Preferred Stock issued to the Preferred Financing Investors upon Closing.
Unless otherwise indicated, we believe that all persons named in the following table have sole voting and investment power with respect to all shares of common stock beneficially owned by them.
|
Name and Address of Beneficial Owners(1) |
|
Number of |
|
% |
|
|
The Walden Group, Inc. |
|
13,757,629 |
|
36.5 |
|
|
Don R. Daseke(2) |
|
15,095,265 |
|
40.0 |
|
|
Joseph Kevin Jordan(3) |
|
2,653,353 |
|
7.0 |
|
|
Daniel J. Hennessy(4) |
|
1,848,043 |
|
4.9 |
|
|
Brian Bonner |
|
43,261 |
|
* |
|
|
Kevin M. Charlton(5) |
|
200,000 |
|
* |
|
|
Ronald J. Gafford(6) |
|
57,682 |
|
* |
|
|
Jonathan Shepko(7) |
|
34,609 |
|
* |
|
|
Mark Sinclair |
|
¾ |
|
* |
|
|
R. Scott Wheeler |
|
136,273 |
|
* |
|
|
Angie J. Moss |
|
27,255 |
|
* |
|
|
All directors and officers as a group (9 persons) |
|
17,442,388 |
|
46.2 |
|
* Indicates percentage of less than one percent.
(1) Unless otherwise noted, the business address of each of the following entities or individuals is 15455 Dallas Parkway, Suite 440, Addison, Texas 75001.
(2) Don R. Daseke is the majority stockholder and President of The Walden Group. As such, Mr. Daseke may be deemed to share voting and dispositive power over the 13,757,629 shares directly held by The Walden Group and therefore may also be deemed to be the beneficial owner of the 13,757,629 shares held by The Walden Group. Mr. Daseke may also be deemed to be the beneficial owner of the 28,841 shares held directly by his spouse. Mr. Daseke disclaims beneficial ownership of such shares in excess of his pecuniary interest in the shares. Mr. Daseke also directly holds 1,308,795 shares of our common stock.
(3) Includes 385,457 shares owned by The Joy and Kevin Jordan Revocable Trust (the “Jordan Revocable Trust”) and 1,017,359 shares of our common stock owned by the Jordan Family Irrevocable Trust (the “Jordan Irrevocable Trust” and, together with the Jordan Revocable Trust, the “Jordan Trusts”). Mr. Jordan is the trustee of the Jordan Trusts and has voting and dispositive power over the shares of our common stock held by the Jordan Trusts. As a result, Mr. Jordan may be deemed to be the beneficial owner of the shares held by the Jordan Trusts. Mr. Jordan disclaims beneficial ownership of such shares in excess of his pecuniary interest in the shares.
(4) These shares represent the shares held by Hennessy Capital Partners II LLC, Hennessy Capital’s sponsor (“HCAC Sponsor”). Daniel J. Hennessy, the Vice Chairman of the Board, is the sole managing member of Hennessy Capital LLC, the sole managing member of HCAC Sponsor. Consequently, Mr. Hennessy may be deemed the beneficial owner of the shares held by HCAC Sponsor and has sole voting and dispositive control over such securities. Mr. Hennessy disclaims beneficial ownership over any securities owned by HCAC Sponsor in which he does not have any pecuniary interest.
(5) Mr. Charlton may also be deemed the beneficial owner of certain of the shares held by HCAC Sponsor by virtue of his ownership of membership interests in HCAC Sponsor, but he disclaims beneficial ownership of such shares except to the extent of a pecuniary interest therein.
(6) These shares are owned of record by Gafford Investments, Ltd. Mr. Gafford is the general partner of Gafford Investments, Ltd. As such, Mr. Gafford may be deemed to share voting and dispositive power over the shares directly held by Gafford Investments, Ltd. and therefore may be deemed to be the beneficial owner of the shares held by Gafford Investments, Ltd. Mr. Gafford disclaims beneficial ownership of such shares in excess of his pecuniary interest in the shares.
(7) These shares are owned of record by Lenox Hill Capital, LLC, a limited liability company of which Mr. Shepko is a member. Mr. Shepko disclaims beneficial ownership of such in excess of his pecuniary interest therein.
Directors and Executive Officers
Information with respect to the Company’s directors and executive officers, including biographical information, is set forth in the Proxy Statement in the section entitled “Management After the Business Combination” beginning on page 285 and in the other sections of the Proxy Statement cross-referenced therein, all of which information is incorporated herein by reference.
At a special meeting of Hennessy Capital stockholders conducted on February 27, 2017 (the “Special Meeting”), Messrs. Hennessy, Daseke and Sinclair were each elected as directors with terms commencing upon consummation of the Closing and expiring at the time of our third annual meeting following the Business Combination (expected to be held during the second calendar quarter of 2019). Also on February 27, 2017, (i) effective immediately upon consummation of the Closing, (a) the size of the Board was increased to eight members, (b) the Board appointed Messrs. Charlton and Wheeler to serve as directors with terms expiring at the time of our second annual meeting following the Business Combination (expected to be held during the second calendar quarter
of 2018), and (c) the Board appointed Messrs. Bonner and Gafford to serve as directors with terms expiring at the time of our first annual meeting following the Business Combination (expected to be held during the second calendar quarter of 2017) and (ii) effective on February 28, 2017, the Board also appointed Mr. Shepko to serve as a director with a term expiring at the time of our first annual meeting following the Business Combination (expected to be held during the second calendar quarter of 2017).
The Board has determined that Messrs. Hennessy, Bonner, Charlton, Gafford, Shepko and Sinclair are independent within the meaning of Nasdaq Rule 5605(a)(2) and, to the extent applicable, that they qualify as independent directors according to the rules and regulations of the SEC with respect to audit committee membership.
On February 27, 2017, (i) Mr. Daseke was elected to serve as Chairman of the Board, (ii) Mr. Hennessy was elected to serve as Vice Chairman of the Board, (iii) Messrs. Bonner, Shepko and Sinclair were appointed by the Board to serve on the Board’s Audit Committee, with Mr. Sinclair as Chairman, (iv) Messrs. Charlton, Gafford and Hennessy were appointed by the Board to serve on the Board’s Compensation Committee, with Mr. Charlton as Chairman, and (v) Messrs. Bonner, Gafford and Hennessy were appointed by the Board to serve on the Board’s Nominating & Governance Committee, with Mr. Hennessy as Chairman, in each case effective immediately upon consummation of the Closing, except Mr. Shepko’s appointment was effective February 28, 2017. Information with respect to the Audit Committee, the Compensation Committee and the Nominating & Governance Committee is set forth in the Proxy Statement in the section entitled “Management after the Business Combination” beginning on page 285 and in the other sections of the Proxy Statement cross-referenced therein, all of which information is incorporated herein by reference.
Promptly after the Closing, and effective immediately upon consummation of the Business Combination, Mr. Daseke was appointed to serve as the Company’s Chief Executive Officer and President, Mr. Wheeler was appointed to serve as the Company’s Executive Vice President and Chief Financial Officer and Ms. Moss was appointed to serve as the Company’s Vice President, Chief Accounting Officer, Corporate Controller and Assistant Secretary. Biographical information for each of Messrs. Daseke and Wheeler and Ms. Moss, the new executive officers of the Company, is set forth in the Proxy Statement in the section entitled “Information About Daseke—Executive Officers” beginning on page 248, which is incorporated herein by reference.
In connection with the Closing, and effective immediately upon consummation of the Business Combination, Bradley Bell, Richard Burns, Peter Shea and Thomas J. Sullivan each resigned from their positions as directors of the Company and Daniel J. Hennessy, Kevin M. Charlton and Nicholas A. Petruska each resigned from their positions as officers of the Company.
Executive Compensation
The compensation of Hennessy Capital’s executive officers before the Business Compensation is described in the Proxy Statement in the section entitled “Information About Hennessy Capital—Executive Compensation” beginning on page 217, which is incorporated herein by reference. The compensation of Daseke’s named executive officers before the Business Combination is described in the Proxy Statement in the section entitled “Executive and Director Compensation of Daseke” beginning on page 250, which is incorporated herein by reference. Also, the disclosure set forth under “Item 1.01. Entry Into a Material Definitive Agreement—Employment Agreements” in the Original Form 8-K is incorporated herein by reference.
On February 27, 2017, the stockholders of Hennessy Capital approved the Daseke, Inc. 2017 Omnibus Incentive Plan (the “Incentive Plan”). The description of the Incentive Plan set forth in the section of the Proxy Statement entitled “Incentive Plan Proposal” beginning on page 197 is incorporated herein by reference. A copy of the full text of the Incentive Plan is filed with the Original Form 8-K as Exhibit 10.13 and is incorporated herein by reference, and the foregoing description of the Incentive Plan is qualified in its entirety by reference thereto.
Director Compensation
The compensation of Daseke’s directors before the Business Combination is described in the Proxy Statement in the section entitled “Executive and Director Compensation of Daseke” beginning on page 250, which is incorporated herein by reference.
The compensation to be paid to the Company’s non-employee directors subsequent to the Business Combination is described in the Proxy Statement in the section entitled “Management After the Business Combination—Director Compensation” beginning on page 288, which is incorporated herein by reference.
Certain Relationships and Related Party Transactions
A description of certain relationships and related party transactions is included in the Proxy Statement in the section entitled “Certain Relationships and Related Party Transactions” beginning on page 307, which is incorporated herein by reference. The information set forth under the headings “Employment Agreements” and “Indemnification Agreements” under “Item 1.01. Entry into a Material Definitive Agreement” in the Original Form 8-K is also incorporated herein by reference.
Legal Proceedings
The Company is involved in litigation and claims primarily arising in the normal course of business, which include claims for personal injury or property damage incurred in the transportation of freight. The Company’s insurance program for liability, physical damage and cargo damage involves self-insurance with varying risk retention levels. Claims in excess of these risk retention levels are covered by insurance in amounts that management considers to be adequate. Based on its knowledge of the facts and, in certain cases, advice of outside counsel, the Company believes the resolution of claims and pending litigation, will not have a material adverse effect on it, taking into account existing reserves.
Market Price of and Dividends on the Registrant’s Common Equity and Related Stockholder Matters
Information about the market price, number of stockholders and dividends for the Company’s securities is set forth in the Proxy Statement in the section entitled “Price Range of Securities and Dividends” beginning on page 315, which is incorporated herein by reference. On February 27, 2017, the closing sale price of our common stock and warrants was $10.22 per share and $1.15 per warrant, respectively. During the period from February 4, 2017 through February 27, 2017, the high and low sales prices for our common stock were $10.40 and $9.97, respectively, and the high and low sales prices for our warrants were $1.20 and $0.82, respectively.
The Company believes there were 15 (or 99, giving effect to the issuance of the Company’s common stock to Daseke’s pre-Business Combination stockholders, which will occur upon such stockholders’ delivery of requisite documents to the Company’s exchange agent) record holders of shares of common stock and two record holders of warrants immediately after the Business Combination on February 27, 2017.
In connection with the Closing, the Company’s common stock trading symbol was changed to “DSKE” and its warrant trading symbol was changed to “DSKEW” on The Nasdaq Capital Market.
We have not paid any cash dividends on our common stock to date. The payment of cash dividends in the future will be dependent upon our revenues and earnings, if any, capital requirements, debt covenants and general financial condition. The payment of any cash dividends will be within the discretion of our board of directors at such time. Under the Term Loan Facility and the ABL Facility, the payment of dividends and distributions generally are restricted, subject to certain exceptions.
Recent Sales of Unregistered Securities
Information about unregistered sales of Hennessy Capital’s equity securities is set forth in “Part II, Item 15. Recent Sales of Unregistered Securities” of Amendment No. 1 to Hennessy Capital’s Registration Statement on Form S-1 (File No. 333-205152) filed with the SEC on July 14, 2015 and in Item 3.02 of Hennessy Capital’s
Current Report on Form 8-K filed on July 28, 2015. Information about the Company’s unregistered sales of securities is set forth in Item 3.02 of the Company’s Current Report on Form 8-K filed on February 27, 2017. All such information is incorporated herein by reference.
Description of the Company’s Securities
A description of the Company’s common stock and warrants is included in the Proxy Statement in the sections entitled “Description of Securities—Authorized and Outstanding Stock” beginning on page 291 and “Description of Securities—Warrants” beginning on page 296, which descriptions are incorporated herein by reference. A description of the Company’s Series A Preferred Stock is included in the Proxy Statement in the section entitled “The Business Combination Proposal—Series A Convertible Preferred Stock Certificate of Designations” beginning on page 140, which description is incorporated herein by reference.
The Company has authorized 260 million shares of capital stock, consisting of 250 million shares of common stock, $0.0001 par value per share, and 10 million shares of preferred stock, $0.0001 par value per share.
Upon consummation of the Business Combination and the transactions related thereto, there were 37,715,960 shares of the Company’s common stock issued and outstanding, 650,000 shares of Series A Preferred Stock outstanding and 35,040,664 warrants to purchase 17,520,332 shares of the Company’s common stock outstanding.
The Company believes there were 15 (or 99, giving effect to the issuance of the Company’s common stock to Daseke’s pre-Business Combination stockholders, which will occur upon such stockholders’ delivery of requisite documents to the Company’s exchange agent) record holders of shares of common stock and two record holders of warrants immediately after the Business Combination on February 27, 2017.
Indemnification of Directors and Officers
Information about the indemnification of the Company’s directors and officers is set forth in the Proxy Statement in the section entitled “The Business Combination Proposal—Indemnification of Directors and Officers; Directors’ and Officers’ Insurance” beginning on page 133 and in Amendment No. 1 to Hennessy Capital’s Registration Statement on Form S-1 (File No. 333-205152) filed with the SEC on July 14, 2015, in the section entitled “Limitation on Liability and Indemnification of Officers and Directors,” beginning on page 104, and in Item 14 of Part II thereof, all of which information is incorporated herein by reference.
See also “Item 1.01 Entry Into a Material Agreement — Indemnification Agreements” of the Original Form 8-K, which is incorporated herein by reference.
Financial Statements and Supplementary Data
The historical financial statements and accompanying notes identified in Section (a) under “Item 9.01. Financial Statements and Exhibits” of this Form 8-K are incorporated herein by reference.
Changes in and Disagreements with Accountants on Accounting and Financial Disclosure
The information set forth under “Item 4.01. Changes in Registrant’s Certifying Accountant” of the Original Form 8-K is incorporated herein by reference.
Exhibits
The exhibits identified in Section (d) under “Item 9.01. Financial Statements and Exhibits” of this Form 8-K are incorporated herein by reference.
Item 9.01. Financial Statements and Exhibits.
(a) Financial Statements of Businesses Acquired.
The following audited consolidated financial statements of Daseke and its subsidiaries, together with the notes thereto, are included in this Form 8-K on the pages set forth below:
|
|
Page |
|
F-1 | |
|
Consolidated balance sheets as of December 31, 2016 and 2015 |
F-2 |
|
F-3 | |
|
F-4 | |
|
Consolidated statements of cash flows for the years ended December 31, 2016, 2015 and 2014 |
F-5 |
|
F-7 |
(b) Pro Forma Financial Information.
Reference is made to Item 2.01 of this Form 8-K, “Completion of Acquisition or Disposition of Assets—Unaudited Pro Forma Condensed Combined Financial Information” for the following pro forma financial information:
Introduction
Unaudited Pro Forma Condensed Combined Balance Sheet as of December 31, 2016
Unaudited Pro Forma Condensed Combined Statement of Operations for the Year Ended December 31, 2016
Notes to Unaudited Pro Forma Condensed Combined Financial Information
(d) Exhibits.
The Exhibit Index following the signature page below is incorporated herein by reference.
SIGNATURE
Pursuant to the requirements of the Securities Exchange Act of 1934, the registrant has duly caused this report to be signed on its behalf by the undersigned hereunto duly authorized.
|
Dated: March 16, 2017 |
DASEKE, INC. | |
|
|
| |
|
|
By: |
/s/ Angie J. Moss |
|
|
Name: |
Angie J. Moss |
|
|
Title: |
Vice President, Chief Accounting Officer and Corporate Controller |
EXHIBIT INDEX
|
Exhibit No. |
|
Exhibit |
|
2.1† |
|
Merger Agreement, dated as of December 22, 2016, by and among Hennessy Capital Acquisition Corp. II, HCAC Merger Sub, Inc., Daseke, Inc. and Don R. Daseke, solely in his capacity as the Stockholder Representative (incorporated by reference to Exhibit 2.1 to the registrant’s Current Report on Form 8-K filed by the registrant on December 29, 2016). |
|
3.1** |
|
Second Amended and Restated Certificate of Incorporation of Hennessy Capital Acquisition Corp. II. (renamed Daseke, Inc.). |
|
3.2** |
|
Certificate of Designations, Preferences, Rights and Limitations of 7.625% Series A Convertible Cumulative Preferred Stock of Daseke, Inc. |
|
4.1** |
|
Amended and Restated Registration Rights Agreement, dated February 27, 2017, by and among the registrant, Daseke Companies, Inc. (f/k/a Daseke, Inc.), Hennessy Capital Partners II LLC, and certain security holders of the registrant party thereto. |
|
4.2 |
|
Form of Lock-Up Agreement (incorporated by reference to Exhibit F to Exhibit 2.1 to the registrant’s Current Report on Form 8-K filed by the registrant on December 29, 2016). |
|
4.3 |
|
Warrant Agreement between Continental Stock Transfer & Trust Company and the registrant (incorporated by reference to Exhibit 4.1 to the registrant’s Current Report on Form 8-K filed on July 28, 2015). |
|
10.1** |
|
Term Loan Agreement, dated as of February 27, 2017, among the registrant, HCAC Merger Sub, Inc. (which merged with and into Daseke, Inc., which changed its name to Daseke Companies, Inc.), as borrower, certain financial institutions party thereto, as lenders, Credit Suisse AG, Cayman Islands Branch, as administrative agent, and Credit Suisse Securities (USA) LLC, UBS Securities LLC, and PNC Capital Markets LLC, as joint lead arrangers and joint bookrunners. |
|
10.2** |
|
Fifth Amended and Restated Revolving Credit and Security Agreement, dated February 27, 2017, among the registrant, HCAC Merger Sub, Inc. (which merged with and into Daseke, Inc., which changed its name to Daseke Companies, Inc.) and certain of its subsidiaries party thereto, PNC Bank, National Association, as lender and agent, and certain financial institutions, as lenders, from time to time party thereto. |
|
10.3** |
|
Employment Agreement, dated February 27, 2017, by and between the registrant and Don R. Daseke. |
|
10.4** |
|
Employment Agreement, dated February 27, 2017, by and between the registrant and R. Scott Wheeler. |
|
10.5** |
|
Employment Agreement, dated February 27, 2017, by and between the registrant and Angie J. Moss. |
|
10.6** |
|
Form of Indemnification Agreement between the registrant and each of its directors and executive officers. |
|
10.7** |
|
Form of Restricted Stock Unit Award Agreement of the registrant. |
|
10.8** |
|
Form of Non-Qualified Stock Option Award Agreement of the registrant. |
|
10.9** |
|
Form of Non-Qualified Stock Option Award Agreement for Non-Employee Directors of the registrant. |
|
10.10** |
|
Daseke, Inc. 2017 Management Stock Ownership Program. |
|
10.11** |
|
Daseke, Inc. 2017 Stock Ownership Program for Employees. |
|
10.12** |
|
Daseke, Inc. 2017 Stock Ownership Program for Truck Driver Employees. |
|
10.13** |
|
Daseke, Inc. 2017 Omnibus Incentive Plan. |
|
10.14 |
|
Form of Backstop and Subscription Agreement by and among Hennessy Capital Acquisition Corp. II, Hennessy Capital Partners II LLC and the investor(s) party thereto (incorporated by reference to Exhibit 10.1 to the registrant’s Current Report on Form 8-K filed by the registrant on December 29, 2016). |
|
10.15 |
|
Form of Subscription Agreement for 7.625% Series A Convertible Preferred Stock by and among Hennessy Capital Acquisition Corp. II and the investor(s) party thereto (including the form of Certificate of Designations, Preferences, Rights and Limitations of 7.625% Series A Convertible Cumulative Preferred Stock of Daseke, Inc. (f/k/a Hennessy Capital Acquisition Corp. II) attached as |
|
Exhibit No. |
|
Exhibit |
|
|
|
Exhibit A thereto) (incorporated by reference to Exhibit 10.2 to the registrant’s Current Report on Form 8-K filed by the registrant on December 29, 2016). |
|
10.16 |
|
Voting and Support Agreement, dated as of December 22, 2016, by and among Daseke, Inc., Hennessy Capital Partners II LLC and the other initial stockholders of Hennessy Capital Acquisition Corp. II set forth therein (incorporated by reference to Exhibit 10.3 to the registrant’s Current Report on Form 8-K filed by the registrant on December 29, 2016). |
|
10.17 |
|
Letter Agreement, dated as of December 22, 2016, by and among Hennessy Capital Acquisition Corp. II, Daseke, Inc., The Walden Group, Inc. Prudential Capital Partners IV, L.P., Prudential Capital Partners Management Fund IV, L.P., Prudential Capital Partners (Parallel Fund) IV, L.P., Main Street Capital Corporation, Main Street Capital II, LP and Main Street Mezzanine Fund, LP. (incorporated by reference to Exhibit 10.4 to the registrant’s Current Report on Form 8-K filed by the registrant on December 29, 2016). |
|
10.18 |
|
Sponsor Share Forfeiture Agreement, dated as of December 22, 2016, by and between Hennessy Capital Acquisition Corp. II, Hennessy Capital Partners II LLC and Daseke, Inc. (incorporated by reference to Exhibit 10.5 to the registrant’s Current Report on Form 8-K filed by the registrant on December 29, 2016). |
|
16.1** |
|
Letter from WithumSmith+Brown, PC to the Securities and Exchange Commission, dated March 3, 2017. |
|
21.1* |
|
List of subsidiaries. |
* Filed herewith.
** Previously filed in the Original Form 8-K.
† The exhibits and schedules to this Exhibit have been omitted in accordance with Regulation S-K Item 601(b)(2). The registrant agrees to furnish supplementally a copy of all omitted exhibits and schedules to the Securities and Exchange Commission upon its request.
REPORT OF INDEPENDENT REGISTERED PUBLIC ACCOUNTING FIRM
Board of Directors and Stockholders
Daseke, Inc.
We have audited the accompanying consolidated balance sheets of Daseke, Inc. (a Delaware corporation) and subsidiaries (the “Company”) as of December 31, 2016 and 2015, and the related consolidated statements of operations and comprehensive income (loss), changes in stockholders’ equity, and cash flows for each of the three years in the period ended December 31, 2016. These financial statements are the responsibility of the Company’s management. Our responsibility is to express an opinion on these financial statements based on our audits.
We conducted our audits in accordance with the standards of the Public Company Accounting Oversight Board (United States) and in accordance with auditing standards generally accepted in the United States of America. Those standards require that we plan and perform the audit to obtain reasonable assurance about whether the financial statements are free of material misstatement. We were not engaged to perform an audit of the Company’s internal control over financial reporting. Our audits included consideration of internal control over financial reporting as a basis for designing audit procedures that are appropriate in the circumstances, but not for the purpose of expressing an opinion on the effectiveness of the Company’s internal control over financial reporting. Accordingly, we express no such opinion. An audit also includes examining, on a test basis, evidence supporting the amounts and disclosures in the financial statements, assessing the accounting principles used and significant estimates made by management, as well as evaluating the overall financial statement presentation. We believe that our audits provide a reasonable basis for our opinion.
In our opinion, the consolidated financial statements referred to above present fairly, in all material respects, the financial position of Daseke, Inc. and subsidiaries as of December 31, 2016 and 2015, and the results of their operations and their cash flows for each of the three years in the period ended December 31, 2016 in conformity with accounting principles generally accepted in the United States of America.
/s/ GRANT THORNTON LLP
Dallas, Texas
March 16, 2017
DASEKE, INC. AND SUBSIDIARIES
(In thousands, except share and per share data)
|
|
|
December 31, |
| ||||
|
|
|
2016 |
|
2015 |
| ||
|
ASSETS |
|
|
|
|
| ||
|
Current assets: |
|
|
|
|
| ||
|
Cash |
|
$ |
3,695 |
|
$ |
4,886 |
|
|
Accounts receivable, net |
|
54,177 |
|
63,449 |
| ||
|
Drivers’ advances and other receivables |
|
2,632 |
|
2,463 |
| ||
|
Current portion of net investment in sales-type leases |
|
3,516 |
|
3,116 |
| ||
|
Parts supplies |
|
1,467 |
|
1,836 |
| ||
|
Income tax receivable |
|
719 |
|
688 |
| ||
|
Prepaid and other current assets |
|
13,504 |
|
13,854 |
| ||
|
Total current assets |
|
79,710 |
|
90,292 |
| ||
|
|
|
|
|
|
| ||
|
Property and equipment, net |
|
318,747 |
|
354,535 |
| ||
|
Intangible assets, net |
|
71,653 |
|
77,654 |
| ||
|
Goodwill |
|
89,035 |
|
88,611 |
| ||
|
Other long-term assets |
|
11,090 |
|
16,515 |
| ||
|
Total assets |
|
$ |
570,235 |
|
$ |
627,607 |
|
|
|
|
|
|
|
| ||
|
LIABILITIES AND STOCKHOLDERS’ EQUITY |
|
|
|
|
| ||
|
Current liabilities: |
|
|
|
|
| ||
|
Checks outstanding in excess of bank balances |
|
$ |
1,166 |
|
$ |
881 |
|
|
Accounts payable |
|
4,788 |
|
6,107 |
| ||
|
Accrued expenses and other liabilities |
|
16,104 |
|
17,002 |
| ||
|
Accrued payroll, benefits and related taxes |
|
7,835 |
|
8,473 |
| ||
|
Accrued insurance and claims |
|
9,840 |
|
10,405 |
| ||
|
Current portion of long-term debt |
|
52,665 |
|
66,801 |
| ||
|
Total current liabilities |
|
92,398 |
|
109,669 |
| ||
|
|
|
|
|
|
| ||
|
Line of credit |
|
6,858 |
|
12,555 |
| ||
|
Long-term debt, net of current portion |
|
208,372 |
|
217,755 |
| ||
|
Deferred tax liabilities |
|
92,815 |
|
92,299 |
| ||
|
Other long-term liabilities |
|
286 |
|
8,198 |
| ||
|
Subordinated debt |
|
66,443 |
|
67,081 |
| ||
|
Total liabilities |
|
467,172 |
|
507,557 |
| ||
|
Commitments and contingencies (Note 19) |
|
|
|
|
| ||
|
|
|
|
|
|
| ||
|
Stockholders’ equity: |
|
|
|
|
| ||
|
Series B convertible preferred stock, $0.01 par value; 75,000 shares authorized; 64,500 and 54,800 shares issued and outstanding |
|
1 |
|
1 |
| ||
|
Common stock (par value $0.01 per share); 300,000 shares authorized, 145,495 shares issued and outstanding |
|
1 |
|
1 |
| ||
|
Additional paid-in-capital |
|
117,807 |
|
117,807 |
| ||
|
(Accumulated deficit) retained earnings |
|
(14,694 |
) |
2,355 |
| ||
|
Accumulated other comprehensive loss |
|
(52 |
) |
(114 |
) | ||
|
Total stockholders’ equity |
|
103,063 |
|
120,050 |
| ||
|
Total liabilities and stockholders’ equity |
|
$ |
570,235 |
|
$ |
627,607 |
|
The accompanying notes are an integral part of the consolidated financial statements.
DASEKE, INC. AND SUBSIDIARIES
CONSOLIDATED STATEMENTS OF OPERATIONS AND COMPREHENSIVE INCOME (LOSS)
(In thousands, except share and per share data)
|
|
|
Years Ended December 31, |
| |||||||
|
|
|
2016 |
|
2015 |
|
2014 |
| |||
|
Revenues: |
|
|
|
|
|
|
| |||
|
Freight |
|
$ |
517,861 |
|
$ |
506,582 |
|
$ |
375,009 |
|
|
Brokerage |
|
87,410 |
|
108,900 |
|
82,595 |
| |||
|
Fuel surcharge |
|
46,531 |
|
63,363 |
|
85,107 |
| |||
|
Total revenue |
|
651,802 |
|
678,845 |
|
542,711 |
| |||
|
|
|
|
|
|
|
|
| |||
|
Operating expenses: |
|
|
|
|
|
|
| |||
|
Salaries, wages and employee benefits |
|
197,789 |
|
178,703 |
|
132,205 |
| |||
|
Fuel |
|
66,865 |
|
70,296 |
|
88,031 |
| |||
|
Operations and maintenance |
|
96,100 |
|
98,734 |
|
59,274 |
| |||
|
Communications |
|
1,618 |
|
2,034 |
|
1,674 |
| |||
|
Purchased freight |
|
154,054 |
|
181,985 |
|
150,654 |
| |||
|
Administrative expenses |
|
25,250 |
|
21,710 |
|
14,577 |
| |||
|
Sales and marketing |
|
1,743 |
|
2,911 |
|
2,436 |
| |||
|
Taxes and licenses |
|
9,222 |
|
9,228 |
|
7,304 |
| |||
|
Insurance and claims |
|
19,114 |
|
19,655 |
|
15,446 |
| |||
|
Acquisition-related transaction expenses |
|
25 |
|
1,192 |
|
944 |
| |||
|
Depreciation and amortization |
|
67,500 |
|
63,573 |
|
48,575 |
| |||
|
(Gain) loss on disposition of revenue property and equipment |
|
(116 |
) |
(2,184 |
) |
934 |
| |||
|
Impairments |
|
2,005 |
|
— |
|
1,838 |
| |||
|
Total operating expenses |
|
641,169 |
|
647,837 |
|
523,892 |
| |||
|
Income from operations |
|
10,633 |
|
31,008 |
|
18,819 |
| |||
|
|
|
|
|
|
|
|
| |||
|
Other (income) expense: |
|
|
|
|
|
|
| |||
|
Interest income |
|
(44 |
) |
(69 |
) |
(73 |
) | |||
|
Interest expense |
|
23,124 |
|
20,602 |
|
15,978 |
| |||
|
Other |
|
(331 |
) |
(251 |
) |
(170 |
) | |||
|
Total other expense |
|
22,749 |
|
20,282 |
|
15,735 |
| |||
|
|
|
|
|
|
|
|
| |||
|
Income (loss) before provision for income taxes |
|
(12,116 |
) |
10,726 |
|
3,084 |
| |||
|
Provision for income taxes |
|
163 |
|
7,463 |
|
1,784 |
| |||
|
Net income (loss) |
|
(12,279 |
) |
3,263 |
|
1,300 |
| |||
|
|
|
|
|
|
|
|
| |||
|
Other comprehensive income: |
|
|
|
|
|
|
| |||
|
Unrealized gain on interest rate swaps |
|
62 |
|
33 |
|
47 |
| |||
|
Comprehensive income (loss) |
|
$ |
(12,217 |
) |
$ |
3,296 |
|
$ |
1,347 |
|
|
|
|
|
|
|
|
|
| |||
|
Net income (loss) |
|
$ |
(12,279 |
) |
$ |
3,263 |
|
$ |
1,300 |
|
|
Less dividends to preferred stockholders |
|
(4,770 |
) |
(4,736 |
) |
(1,028 |
) | |||
|
Net income (loss) attributable to common stockholders |
|
$ |
(17,049 |
) |
$ |
(1,473 |
) |
$ |
272 |
|
|
|
|
|
|
|
|
|
| |||
|
Net income (loss) per common share: |
|
|
|
|
|
|
| |||
|
Basic |
|
$ |
(117.18 |
) |
$ |
(10.13 |
) |
$ |
2.02 |
|
|
Diluted |
|
$ |
(117.18 |
) |
$ |
(10.13 |
) |
$ |
1.94 |
|
|
Weighted-average common shares outstanding: |
|
|
|
|
|
|
| |||
|
Basic |
|
145,495 |
|
145,495 |
|
134,581 |
| |||
|
Diluted |
|
145,495 |
|
145,495 |
|
140,280 |
| |||
|
Dividends declared per preferred share |
|
$ |
75.00 |
|
$ |
75.00 |
|
$ |
75.00 |
|
The accompanying notes are an integral part of the consolidated financial statements.
DASEKE, INC. AND SUBSIDIARIES
CONSOLIDATED STATEMENTS OF CHANGES IN STOCKHOLDERS’ EQUITY
Years Ended December 31, 2016, 2015 and 2014
(In thousands, except share data)
|
|
|
Series B Convertible |
|
Common Stock |
|
|
|
Retained |
|
Accumulated |
|
|
| ||||||||||
|
|
|
Shares |
|
Par |
|
Shares |
|
Par |
|
Additional |
|
(Accumulated |
|
Comprehensive |
|
Total |
| ||||||
|
Balance at January 1, 2014 |
|
— |
|
$ |
— |
|
126,250 |
|
$ |
1 |
|
$ |
30,009 |
|
$ |
3,556 |
|
$ |
(194 |
) |
$ |
33,372 |
|
|
Issuance of common stock |
|
— |
|
— |
|
10,000 |
|
— |
|
4,000 |
|
— |
|
— |
|
4,000 |
| ||||||
|
Issuance of Series B Convertible Preferred Stock |
|
54,800 |
|
1 |
|
— |
|
— |
|
68,499 |
|
— |
|
— |
|
68,500 |
| ||||||
|
Exercise of warrants |
|
— |
|
— |
|
9,245 |
|
— |
|
924 |
|
— |
|
— |
|
924 |
| ||||||
|
Unrealized gain on interest rate swaps |
|
— |
|
— |
|
— |
|
— |
|
— |
|
— |
|
47 |
|
47 |
| ||||||
|
Series B Convertible Preferred Stock dividend |
|
— |
|
— |
|
— |
|
— |
|
— |
|
(1,028 |
) |
— |
|
(1,028 |
) | ||||||
|
Net income |
|
— |
|
— |
|
— |
|
— |
|
— |
|
1,300 |
|
— |
|
1,300 |
| ||||||
|
Balance at December 31, 2014 |
|
54,800 |
|
1 |
|
145,495 |
|
1 |
|
103,432 |
|
3,828 |
|
(147 |
) |
107,115 |
| ||||||
|
Issuance of Series B Convertible Preferred Stock |
|
9,700 |
|
— |
|
— |
|
— |
|
14,375 |
|
— |
|
— |
|
14,375 |
| ||||||
|
Unrealized gain on interest rate swaps |
|
— |
|
— |
|
— |
|
— |
|
— |
|
— |
|
33 |
|
33 |
| ||||||
|
Series B Convertible Preferred Stock dividend |
|
— |
|
— |
|
— |
|
— |
|
— |
|
(4,736 |
) |
— |
|
(4,736 |
) | ||||||
|
Net income |
|
— |
|
— |
|
— |
|
— |
|
— |
|
3,263 |
|
— |
|
3,263 |
| ||||||
|
Balance at December 31, 2015 |
|
64,500 |
|
1 |
|
145,495 |
|
1 |
|
117,807 |
|
2,355 |
|
(114 |
) |
120,050 |
| ||||||
|
Unrealized gain on interest rate swaps |
|
— |
|
— |
|
— |
|
— |
|
— |
|
— |
|
62 |
|
62 |
| ||||||
|
Series B Convertible Preferred Stock dividend |
|
— |
|
— |
|
— |
|
— |
|
— |
|
(4,770 |
) |
— |
|
(4,770 |
) | ||||||
|
Net loss |
|
— |
|
— |
|
— |
|
— |
|
— |
|
(12,279 |
) |
— |
|
(12,279 |
) | ||||||
|
Balance at December 31, 2016 |
|
64,500 |
|
$ |
1 |
|
145,495 |
|
$ |
1 |
|
$ |
117,807 |
|
$ |
(14,694 |
) |
$ |
(52 |
) |
$ |
103,063 |
|
The accompanying notes are an integral part of the consolidated financial statements.
DASEKE, INC. AND SUBSIDIARIES
CONSOLIDATED STATEMENTS OF CASH FLOWS
(In thousands)
|
|
|
Years Ended December 31, |
| |||||||
|
|
|
2016 |
|
2015 |
|
2014 |
| |||
|
Cash flows from operating activities |
|
|
|
|
|
|
| |||
|
Net (loss) income |
|
$ |
(12,279 |
) |
$ |
3,263 |
|
$ |
1,300 |
|
|
Adjustments to reconcile net (loss) income to net cash provided by operating activities: |
|
|
|
|
|
|
| |||
|
Depreciation |
|
61,499 |
|
58,407 |
|
45,118 |
| |||
|
Amortization of intangible assets |
|
6,001 |
|
5,166 |
|
3,457 |
| |||
|
Amortization of deferred financing fees |
|
1,347 |
|
1,456 |
|
1,095 |
| |||
|
Deferred taxes |
|
(349 |
) |
7,007 |
|
1,620 |
| |||
|
Bad debt expense |
|
612 |
|
328 |
|
152 |
| |||
|
Non-cash interest expense |
|
1,078 |
|
1,049 |
|
1,290 |
| |||
|
(Gain) loss on disposition of property and equipment |
|
(116 |
) |
(2,184 |
) |
934 |
| |||
|
Deferred compensation |
|
— |
|
— |
|
298 |
| |||
|
Gain recognized on sales-type leases |
|
(751 |
) |
(467 |
) |
(785 |
) | |||
|
Impairments |
|
2,005 |
|
— |
|
1,838 |
| |||
|
Changes in operating assets and liabilities, net of the effects of acquisitions: |
|
|
|
|
|
|
| |||
|
Accounts receivable |
|
8,660 |
|
6,837 |
|
(1,740 |
) | |||
|
Drivers’ advances and other receivables |
|
(405 |
) |
727 |
|
(1,838 |
) | |||
|
Payments received on sales-type leases |
|
3,653 |
|
2,191 |
|
1,747 |
| |||
|
Other current assets |
|
6,352 |
|
(1,757 |
) |
(445 |
) | |||
|
Accounts payable |
|
(1,319 |
) |
(2,484 |
) |
(5,606 |
) | |||
|
Accrued expenses and other liabilities |
|
(9,858 |
) |
8,200 |
|
(12 |
) | |||
|
Net cash provided by operating activities |
|
66,130 |
|
87,739 |
|
48,423 |
| |||
|
|
|
|
|
|
|
|
| |||
|
Cash flows from investing activities |
|
|
|
|
|
|
| |||
|
Purchase of property and equipment |
|
(4,108 |
) |
(6,431 |
) |
(6,571 |
) | |||
|
Proceeds from sale of property and equipment |
|
5,906 |
|
2,215 |
|
3,709 |
| |||
|
Cash paid in acquisitions, net of cash acquired |
|
— |
|
64 |
|
(28,130 |
) | |||
|
Net cash provided by (used in) investing activities |
|
1,798 |
|
(4,152 |
) |
(30,992 |
) | |||
|
|
|
|
|
|
|
|
| |||
|
Cash flows from financing activities: |
|
|
|
|
|
|
| |||
|
Checks outstanding in excess of bank balances |
|
285 |
|
(2,655 |
) |
3,535 |
| |||
|
Advances on line of credit |
|
702,846 |
|
671,070 |
|
507,437 |
| |||
|
Repayments on line of credit |
|
(706,724 |
) |
(682,516 |
) |
(528,643 |
) | |||
|
Principal payments on long-term debt |
|
(72,987 |
) |
(59,087 |
) |
(45,881 |
) | |||
|
Proceeds from long-term debt |
|
14,188 |
|
— |
|
6,246 |
| |||
|
Payments on related party debt |
|
— |
|
(2,700 |
) |
(1 |
) | |||
|
Payments on subordinated debt |
|
— |
|
— |
|
(5,269 |
) | |||
|
Payment of deferred financing fees |
|
(1,889 |
) |
(1,607 |
) |
(1,342 |
) | |||
|
Redemption of Series A preferred stock |
|
— |
|
— |
|
(3,500 |
) | |||
|
Issuance of Series B Convertible Preferred Stock |
|
— |
|
875 |
|
45,500 |
| |||
|
Issuance of common stock |
|
— |
|
— |
|
4,925 |
| |||
|
Series B convertible preferred stock dividends |
|
(4,838 |
) |
(4,487 |
) |
— |
| |||
|
Net cash used in financing activities |
|
(69,119 |
) |
(81,107 |
) |
(16,993 |
) | |||
|
|
|
|
|
|
|
|
| |||
|
Net (decrease) increase in cash |
|
(1,191 |
) |
2,480 |
|
438 |
| |||
|
Cash — beginning of year |
|
4,886 |
|
2,406 |
|
1,968 |
| |||
|
Cash — end of year |
|
$ |
3,695 |
|
$ |
4,886 |
|
$ |
2,406 |
|
The accompanying notes are an integral part of the consolidated financial statements.
DASEKE, INC. AND SUBSIDIARIES
CONSOLIDATED STATEMENTS OF CASH FLOWS — (Continued)
(In thousands)
|
|
|
Years Ended December 31, |
| |||||||
|
|
|
2016 |
|
2015 |
|
2014 |
| |||
|
Supplemental disclosure of cash flow information |
|
|
|
|
|
|
| |||
|
Cash paid for interest |
|
$ |
20,523 |
|
$ |
16,583 |
|
$ |
12,447 |
|
|
Cash paid for Series A preferred stock dividends |
|
$ |
— |
|
$ |
— |
|
$ |
263 |
|
|
Cash paid for income taxes |
|
$ |
1,010 |
|
$ |
892 |
|
$ |
984 |
|
|
|
|
|
|
|
|
|
| |||
|
Noncash investing and financing activities |
|
|
|
|
|
|
| |||
|
Property and equipment acquired with debt or capital lease obligations |
|
$ |
33,467 |
|
$ |
62,753 |
|
$ |
67,816 |
|
|
Property and equipment sold for notes receivable |
|
$ |
452 |
|
$ |
237 |
|
$ |
2,479 |
|
|
Property and equipment transferred to sales-type lease |
|
$ |
6,240 |
|
$ |
8,232 |
|
$ |
— |
|
|
Assets held for sale returned to property and equipment |
|
$ |
351 |
|
$ |
— |
|
$ |
— |
|
|
Sales-type lease returns to property and equipment |
|
$ |
1,830 |
|
$ |
807 |
|
$ |
2,078 |
|
|
Sales-type lease assets acquired with debt or capital lease obligations |
|
$ |
538 |
|
$ |
3,186 |
|
$ |
1,046 |
|
|
Sales-type lease assets sold for notes receivable |
|
$ |
20,934 |
|
$ |
15,437 |
|
$ |
1,703 |
|
|
Sales-type lease returns to sales-type lease assets |
|
$ |
16,784 |
|
$ |
8,282 |
|
$ |
497 |
|
|
Transfer between Senior Term Loan and line of credit |
|
$ |
— |
|
$ |
9,993 |
|
$ |
— |
|
|
Preferred Series B Convertible Preferred Stock issued for acquisitions |
|
$ |
— |
|
$ |
13,500 |
|
$ |
23,000 |
|
|
Issuance of seller subordinated notes |
|
$ |
— |
|
$ |
3,000 |
|
$ |
22,000 |
|
|
Acquisitions financed with Senior Term Loan and line of credit |
|
$ |
— |
|
$ |
48,000 |
|
$ |
— |
|
|
Accrued Series B Convertible Preferred Stock dividends |
|
$ |
1,209 |
|
$ |
1,277 |
|
$ |
1,028 |
|
|
BHE Subordinated Notes forgiven to fund pension plan liability |
|
$ |
1,709 |
|
$ |
— |
|
$ |
— |
|
The accompanying notes are an integral part of the consolidated financial statements.
DASEKE, INC. AND SUBSIDIARIES
NOTES TO CONSOLIDATED FINANCIAL STATEMENTS
NOTE 1 — NATURE OF OPERATIONS AND SUMMARY OF SIGNIFICANT ACCOUNTING POLICIES
Nature of Operations
Daseke, Inc. and its subsidiaries (collectively Daseke or the Company) was formed in 2008 and began operations on January 1, 2009. Daseke is engaged in full service open-deck trucking that specializes primarily in flatbed truckload and heavy haul transportation of specialized items throughout the United States and Canada and also into Mexico with trailers. The Company also provides logistical planning services to other customers. The Company is subject to regulation by the Department of Transportation and various state regulatory authorities.
Principles of Consolidation
The consolidated financial statements include the accounts of Daseke and its subsidiaries, all of which are wholly-owned. All significant intercompany balances and transactions have been eliminated in consolidation.
Use of Estimates
The preparation of the consolidated financial statements in conformity with accounting principles generally accepted in the United States of America (GAAP) requires management to make estimates and assumptions that affect the reported amounts of assets and liabilities and disclosure of contingent assets and liabilities at the date of the consolidated financial statements and the reported amounts of revenues and expenses during the reporting period. Actual results could differ from those estimates.
Accounts Receivable
The Company grants credit to its customers for substantially all of its sales. Accounts receivable are carried at original invoice amount less an estimate for doubtful accounts. The Company establishes an allowance for doubtful accounts based on a periodic review of its outstanding receivables and consideration of historical experience. Accounts receivable are written off when deemed uncollectible and recoveries of trade accounts receivable previously written off are recorded as income when received. Accounts receivable are unsecured and the Company does not charge interest on outstanding receivables.
Changes in the allowance for doubtful accounts is as follows (in thousands):
|
|
|
Year Ended December 31, |
| ||||
|
|
|
2016 |
|
2015 |
| ||
|
|
|
|
|
|
| ||
|
Beginning balance |
|
$ |
82 |
|
$ |
124 |
|
|
Provision, charged to expense |
|
612 |
|
328 |
| ||
|
Write-off, less recoveries |
|
(373 |
) |
(370 |
) | ||
|
Ending balance |
|
$ |
321 |
|
$ |
82 |
|
DASEKE, INC. AND SUBSIDIARIES
NOTES TO CONSOLIDATED FINANCIAL STATEMENTS — (Continued)
NOTE 1 — NATURE OF OPERATIONS AND SUMMARY OF SIGNIFICANT ACCOUNTING POLICIES — (Continued)
Cash and Cash Equivalents
Cash equivalents are defined as short-term investments that have an original maturity of three months or less at the date of purchase and are readily convertible into cash. The Company maintains cash in several banks and, at times, the balances may exceed federally insured limits. The Company does not believe it is exposed to any material credit risk on cash. There were no cash equivalents at December 31, 2016 and 2015.
Sales-Type Leases
The Company leases revenue equipment to certain of its owner-operators and accounts for these transactions as sales-type leases. These leases have terms of 30 to 72 months and are collateralized by a security interest in the related revenue equipment. A minimum lease receivable is recorded, net of unearned interest income and deferred gain on sale of the equipment. The gain is recognized as payments are collected, rather than in the period the lease is recorded due to the uncertainty of collection.
Parts Supplies
Parts supplies consists of parts, replacement tires, and miscellaneous supplies and are valued at the lower of cost or market with cost determined principally on the first-in, first out method. Tires on new revenue equipment are capitalized as a component of the related equipment cost when the tractor or trailer is placed in service. Replacement tires are expensed when placed on the tractor or trailer.
Property and Equipment
Property and equipment are stated at cost less accumulated depreciation, and are depreciated to estimated salvage value using the straight-line method over the estimated useful lives of the related assets as follows:
|
Buildings and building improvements |
|
10 – 40 years |
|
|
Leasehold improvements |
|
5 – 20 years |
|
|
Revenue equipment — tractors, trailers and accessories |
|
5 – 15 years |
|
|
Vehicles |
|
5 – 7 years |
|
|
Furniture and fixtures |
|
5 – 7 years |
|
|
Office and computer equipment |
|
3 – 5 years |
|
The Company periodically evaluates the carrying value of long-lived assets for recoverability. The carrying value of a long-lived asset is considered impaired if its future undiscounted cash flows is less than its carrying value.
In 2016, the carrying value of assets held for sale, consisting primarily of tractors, was reduced by $1.6 million due to a change in the estimated fair value less costs to sell. This adjustment to fair value is included in impairment on the consolidated statements of operations and comprehensive income (loss).
In 2014, the Company concluded that it had a triggering event requiring assessment of impairment of long-lived assets in its Flatbed Solutions segment’s intermodal business due to a decline in the use of certain specialized equipment which could not be utilized elsewhere in the business. As a result, the Company reviewed its intermodal long-lived assets for impairment and determined a $1.8 million charge was necessary to reduce the carrying value to the price expected to be received upon sale of the assets to a third party. This charge is included in impairment on the consolidated statements of operations and comprehensive income (loss).
DASEKE, INC. AND SUBSIDIARIES
NOTES TO CONSOLIDATED FINANCIAL STATEMENTS — (Continued)
NOTE 1 — NATURE OF OPERATIONS AND SUMMARY OF SIGNIFICANT ACCOUNTING POLICIES — (Continued)
Goodwill and Intangible Assets
Goodwill and other intangible assets result from business acquisitions. The Company accounts for business acquisitions by assigning the purchase price to tangible and intangible assets and liabilities. Assets acquired and liabilities assumed are recorded at their fair values and the excess of the purchase price over amounts assigned is recorded as goodwill.
Goodwill is tested for impairment at least annually by applying a fair value based analysis in accordance with the authoritative accounting guidance on goodwill. The Company estimates the fair value of a reporting unit using discounted expected future cash flows. If the carrying amount of the reporting unit exceeds its fair value, an additional valuation is performed to compare the carrying amount of goodwill to the implied fair value of that goodwill. If the carrying amount of goodwill exceeds the implied fair value of that goodwill, an impairment loss would be recognized in an amount equal to the excess. The Company’s annual assessment is conducted as of November 1 of each year.
In 2016, the carrying value of one subsidiary exceeded its estimated fair value. Accordingly, a non-cash, non-tax deductible goodwill impairment charge of $0.4 million was recognized during the three months ended December 31, 2016 and is included in impairment on the consolidated statements of operations and comprehensive income (loss). There was no goodwill impairment identified for the years ended December 31, 2015 and 2014.
Other intangible assets recorded consist of indefinite lived trade names and definite lived non-competition agreements and customer relationships. These intangible assets are stated at estimated fair value at the time of acquisition less accumulated amortization. Amortization is recorded using the straight-line method over the following estimated useful lives:
|
Customer relationships |
|
11 – 15 years |
|
|
Non-competition agreements |
|
2 – 5 years |
|
The Company evaluates its definite lived intangible assets for impairment when current facts or circumstances indicate that the carrying value of the assets to be held and used may not be recoverable. Indefinite-lived intangible assets are tested for impairment annually applying a fair value based analysis in accordance with the authoritative accounting guidance for such assets. No indicators of impairment were identified for the years ended December 31, 2016, 2015 and 2014.
Revenue and Expense Recognition
The Company recognizes revenue and related costs when persuasive evidence of an arrangement exists, delivery has occurred, the fee is fixed or determinable and collectability is probable. With respect to freight, brokerage and fuel surcharge revenue, these conditions are met, and the Company recognizes such revenue, upon delivery of a load.
DASEKE, INC. AND SUBSIDIARIES
NOTES TO CONSOLIDATED FINANCIAL STATEMENTS — (Continued)
NOTE 1 — NATURE OF OPERATIONS AND SUMMARY OF SIGNIFICANT ACCOUNTING POLICIES — (Continued)
The Company recognizes brokerage revenue on a gross basis, as opposed to a net basis, because it bears the risks and benefits associated with revenue-generating activities by, among other things, (1) acting as a principal in the transaction, (2) establishing prices, (3) managing all aspects of the shipping process, and (4) taking the risk of loss for collection, delivery and returns. Accordingly, all such revenue billed to customers is classified as brokerage revenue, and all corresponding payments to carriers for transportation services the Company arranges in connection with brokerage and intermodal activities and to independent contractor providers of revenue equipment are classified as purchased freight.
Advertising
Advertising costs are expensed as incurred and were insignificant for the years ended December 31, 2016, 2015 and 2014.
Sales Taxes
Taxes collected from customers and remitted to governmental authorities are presented in revenues in the consolidated statements of operations and comprehensive income (loss) on a net basis.
Income Taxes
Income taxes are accounted for using an asset and liability approach that requires the recognition of deferred tax assets and liabilities for the expected future tax consequences of temporary differences between the consolidated financial statement and tax basis of assets and liabilities at the applicable enacted tax rates.
The Company recognizes the tax benefit from uncertain tax positions only if it is more likely than not that the tax positions will be sustained on examination by the tax authorities, based on the technical merits of the position. The tax benefit is measured based on the largest benefit that has a greater than 50% likelihood of being realized upon ultimate settlement. The Company recognizes interest and penalties related to income tax matters in income tax expense within the statements of operations and comprehensive income (loss). The Company had no uncertain tax positions as of December 31, 2016 and 2015. The Company is no longer subject to U.S. federal income tax examinations by tax authorities for years before 2013. The Company is no longer subject to state income tax examinations by tax authorities for years before 2012.
Concentrations of Credit Risk
Financial instruments that potentially subject the Company to credit risk include accounts receivable. One customer represented approximately 13% of trade accounts receivable as of December 31, 2016 and 2015. No customer represented 10% or more of total revenue for the years ended December 31, 2016 and 2015. One customer in the Company’s Specialized Solutions reporting segment represented approximately 12% of total Company revenue for the year ended December 31, 2014.
DASEKE, INC. AND SUBSIDIARIES
NOTES TO CONSOLIDATED FINANCIAL STATEMENTS — (Continued)
NOTE 1 — NATURE OF OPERATIONS AND SUMMARY OF SIGNIFICANT ACCOUNTING POLICIES — (Continued)
Deferred Financing Fees
In conjunction with obtaining long-term debt, the Company incurred financing costs which are being amortized using the straight line method, which approximates the effective interest rate method, over the terms of the obligations. As of December 31, 2016 and 2015, the balance of deferred finance charges was $4.1 million and $3.6 million, respectively. Amortization expense for the years ended December 31, 2016, 2015 and 2014 totaled $1.3 million, $1.5 million and $1.1 million, respectively, which is included in interest expense.
Fair Value Measurements
The Company follows the accounting guidance for fair value measurements of financial assets and financial liabilities and for fair value measurements of nonfinancial items that are recognized or disclosed at fair value in the financial statements on a recurring basis. Fair value guidance defines fair value as the price that would be received to sell an asset or paid to transfer a liability in an orderly transaction between market participants at the measurement date. It also establishes a framework for measuring fair value and expands disclosures about fair value measurements. The three levels of the fair value framework are as follows:
Level 1 - Quoted market prices in active markets for identical assets or liabilities.
Level 2 - Observable market-based inputs or unobservable inputs that are corroborated by market data.
Level 3 - Unobservable inputs reflecting the reporting entity’s own assumptions or external inputs from inactive markets.
A financial asset or liability’s classification within the framework is determined based on the lowest level of input that is significant to the fair value measurement.
The fair value of the Company’s interest rate swaps (Note 18) is determined using cash flow computer models with unobservable inputs, therefore the liability for interest rate swaps is classified within Level 3 of the fair value framework. At December 31, 2016 and 2015, the fair value liability was $0.1 million and is classified in accrued expenses and other liabilities on the consolidated balance sheets. The table below is a summary of the changes in the fair value of this liability for the years ended December 31, 2016 and 2015 (in thousands):
|
|
|
2016 |
|
2015 |
| ||
|
|
|
|
|
|
| ||
|
Balance, beginning of year |
|
$ |
(124 |
) |
$ |
(183 |
) |
|
Change in fair value |
|
72 |
|
59 |
| ||
|
Balance, end of year |
|
$ |
(52 |
) |
$ |
(124 |
) |
Fair Value of Financial Instruments
The Company’s financial instruments consist of cash, accounts receivable, accounts payable and accrued expenses, interest rate swaps, the line of credit and long-term debt. The carrying value of these financial instruments approximates fair value based on the liquidity of these financial instruments, their short-term nature or variable interest rates.
DASEKE, INC. AND SUBSIDIARIES
NOTES TO CONSOLIDATED FINANCIAL STATEMENTS — (Continued)
NOTE 1 — NATURE OF OPERATIONS AND SUMMARY OF SIGNIFICANT ACCOUNTING POLICIES — (Continued)
Accrued Insurance and Claims
The Company uses a combination of purchased insurance and self-insurance programs to provide for the cost of vehicle liability, cargo loss, damage, and workers’ compensation claims and employee medical benefits. Self-insurance accruals relate primarily to vehicle liability, cargo damage, workers’ compensation and employee medical claims.
The measurement and classification of self-insured costs requires the consideration of historical cost experience, demographic and severity factors, and judgments about the current and expected levels of cost per claim and retention levels. These methods provide estimates of the liability associated with claims incurred as of the balance sheet date, including claims not reported. The Company believes these methods are appropriate for measuring these highly judgmental self-insurance accruals. However, the use of any estimation method is sensitive to the assumptions and factors described above, based on the magnitude of claims and the length of time from the date the claim is incurred to ultimate settlement. Accordingly, changes in these assumptions and factors can materially affect actual costs paid to settle the claims and those amounts may be different than estimates.
Segment Reporting
The Company determines its operating segments based on the information utilized by the chief operating decision maker to allocate resources and assess performance. Based on this information, the Company has determined it has eight operating segments that are aggregated into two reportable segments, Flatbed Solutions, which delivers its services using primarily flatbed transportation equipment to meet the needs of high-volume, time-sensitive shippers, and Specialized Solutions, which delivers transportation and logistics solutions for super heavy haul, high-value customized and over-dimensional loads, many of which require engineering and customized equipment.
New Accounting Pronouncements
In January 2017, the Financial Accounting Standards Board (FASB) issued Accounting Standards Update (ASU) 2017-04, Intangibles — Goodwill and Other (Topic 350). ASU 2017-04 removes the requirement to perform a hypothetical purchase price allocation to measure goodwill impairment. A goodwill impairment will now be the amount by which a reporting unit’s carrying value exceeds its fair value, not to exceed the carrying amount of goodwill. ASU 2017-04 is effective for fiscal years beginning December 15, 2019, with early adoption permitted for interim and annual goodwill impairment tests performed on testing dates after January 1, 2017, and applied prospectively. The Company does not expect ASU 2017-04 to have a material impact on its consolidated results of operations, financial condition, cash flows, and financial statement disclosures.
In August 2016, the FASB issued ASU 2016-15, Statement of Cash Flows (Topic 230). ASU 2016-15 provides new guidance intended to reduce diversity in practice in how certain cash receipts and payments are classified in the statement of cash flows, including debt prepayment or extinguishment costs, the settlement of contingent liabilities arising from a business combination, proceeds from insurance settlements, and distributions from certain equity method investees. ASU 2016-05 will become effective for fiscal years beginning after December 15, 2017 and interim periods within fiscal years beginning after December 31, 2019. Early adoption is permitted. ASU 2016-15 requires application using a retrospective transition method. The Company is currently evaluating the impact of adopting this guidance.
DASEKE, INC. AND SUBSIDIARIES
NOTES TO CONSOLIDATED FINANCIAL STATEMENTS — (Continued)
NOTE 1 — NATURE OF OPERATIONS AND SUMMARY OF SIGNIFICANT ACCOUNTING POLICIES — (Continued)
On June 16, 2016, the FASB issued ASU No. 2016-13, Accounting for Credit Losses (Topic 326). ASU 2016-13 requires the use of an “expected loss” model on certain types of financial instruments. ASU 2016-13 is effective for fiscal years, and interim periods within those years, beginning after December 15, 2019, with early adoption permitted. The Company is currently evaluating the impact of adopting this guidance.
In February 2016, the FASB issued ASU 2016-02, Leases (Topic 842). ASU 2016-02 amends various aspects of existing guidance for leases. ASU 2016-02 requires an entity to recognize assets and liabilities arising from a lease for both financing and operating leases, along with additional qualitative and quantitative disclosures. The main difference between previous GAAP and the amended standard is the recognition of lease assets and lease liabilities of lessees on the balance sheet for those leases classified as operating leases under previous GAAP. ASU 2016-02 is effective for fiscal years beginning after December 15, 2018, with early adoption permitted. The Company is currently evaluating the effect this ASU will have on the consolidated financial position and results of operations.
In September 2015, the FASB issued ASU 2015-16, Business Combinations (Topic 805). ASU 2015-16 simplifies the accounting for measurement-period adjustments related to business combinations by removing the requirement to retrospectively apply adjustments made to estimated amounts recognized in a business combination. ASU 2015-16 permits the purchaser to adjust the estimated amounts in the reporting period in which the adjustments are determined. The ASU is effective for annual periods beginning after December 31, 2015 and interim periods within those annual periods. Adoption of this pronouncement did not have a material impact on the consolidated financial statements.
In April 2015, the FASB issued ASU 2015-03, Interest-Imputation of Interest (Subtopic 835-30). ASU 2015-03 amends existing guidance to require the presentation of debt issuance costs in the consolidated balance sheets as a direct deduction from the carrying amount of the associated debt liability instead of a deferred charge. In August 2015, the FASB issued updated guidance with ASU 2015-15 pertaining to the presentation of debt issuance costs related to line-of-credit arrangements. This ASU allows an entity to defer and present debt issuance costs as an asset, subsequently amortizing the deferred debt issuance costs over the term of the line-of-credit arrangement, regardless of whether there are any outstanding borrowings on the line-of-credit arrangement. The Company has elected to early adopt this standard effective September 30, 2016, on a retrospective basis. Adoption of this standard represents a change in accounting principle. See Note 2 for further information.
In January 2015, the FASB issued ASU 2015-01, Simplifying Income Statement Presentation by Eliminating the Concept of Extraordinary Items. ASU 2015-01 eliminates from GAAP the concept of an extraordinary item. The Board released the new guidance as part of its simplification initiative, which is intended to identify, evaluate, and improve areas of GAAP for which cost and complexity can be reduced while maintaining or improving the usefulness of the information provided to users of financial statements. The ASU is effective for annual periods beginning after December 31, 2015, and interim periods within those annual periods. Adoption of this pronouncement did not have a material impact on the consolidated financial statements.
In May 2014, the FASB issued ASU No. 2014-09, Revenue from Contracts with Customers (Topic 606), which is effective for the Company in 2018. The core principle of the guidance is that an entity should recognize revenue to depict the transfer of promised goods or services to customers in an amount that reflects the consideration to which the entity expects to be entitled in exchange for those goods or services. In August 2015, the FASB issued update guidance with ASU 2015-14 which deferred the effective date of ASU 2014-09 by one year. The guidance in ASU 2014-09 is effective for annual periods beginning after December 15, 2017, and interim periods within those annual periods.
DASEKE, INC. AND SUBSIDIARIES
NOTES TO CONSOLIDATED FINANCIAL STATEMENTS — (Continued)
NOTE 1 — NATURE OF OPERATIONS AND SUMMARY OF SIGNIFICANT ACCOUNTING POLICIES — (Continued)
In March 2016, the FASB issued an accounting standards update that further clarifies guidance under ASU 2014-09 with respect to principal versus agent considerations in revenue from contracts with customers. In the second quarter of 2016, the FASB issued two accounting standard updates that provide additional guidance when identifying performance obligations and licenses as well as allowing for certain narrow scope improvements and practical expedients. These accounting standard updates have the same effective date as the original standard.
The Company is in the process of evaluating ASU 2014-09, including the expected impact on business processes, systems and controls, and potential differences in the timing and/or method of revenue recognition for contracts. The Company has not determined if adoption of ASU 2014-09 will have a material impact on results of operations or cash flows in the periods after adoption.
NOTE 2 — CHANGE IN ACCOUNTING PRINCIPLE
Pursuant to the adoption of ASU 2015-03, Interest-Imputation of Interest (Topic 835-30), the Company retrospectively classified deferred financing fees as a reduction of long-term debt, net of current portion in the consolidated balance sheets. Deferred financing fees assets of $4.1 million and $3.6 million were reclassified from assets to long-term debt, net of current portion as of December 31, 2016 and 2015, respectively.
NOTE 3 —AGREEMENT FOR BUSINESS COMBINATION
On December 22, 2016, the Company entered into an Agreement and Plan of Merger with Hennessy Capital Acquisition Corp II (Hennessy) and HCAC Merger Sub, Inc., a wholly-owned subsidiary of Hennessy (the Merger Agreement).
On February 27, 2017, the Company and Hennessy consummated the merger of Hennessy’s wholly-owned subsidiary with and into the Company, with the Company surviving as a direct wholly-owned subsidiary of Hennessy (the Business Combination). In accordance with the Merger Agreement, the aggregate consideration received upon closing was $266.7 million, consisting of newly issued shares of Hennessy common stock at a value of $10.00 per share. The Merger Agreement also contains an earn-out provision through which Hennessy may issue up to 15 million additional shares of its common stock to existing Daseke, Inc. stockholders for the achievement of specified Adjusted EBITDA targets (as defined in the Merger Agreement) and share price thresholds for the fiscal years ending 2017, 2018 and 2019.
In conjunction with the closing on February 27, 2017 (the Closing), a new $250.0 million term loan credit facility (Term Loan) with a committed $100.0 million delayed draw feature and a $70 million asset-based revolving line of credit (ABL Facility) were executed, refinancing the current Line of Credit and Senior Term Loan and certain equipment and real estate debt and capital leases. The Term Loan is payable in quarterly installments of 0.25% of the original principal amount, or $625,000, bears interest at either the Alternate Base Rate (as defined) or the Adjusted Eurodollar Rate (as defined) plus 4.5% or 5.5%, respectively, and matures on February 27, 2024. The Term Loan is collateralized by all Company assets, except those collateralizing the remaining equipment and mortgage notes and the ABL Facility. The Term Loan requires maintaining a total leverage ratio and other covenants customary in such agreements.
DASEKE, INC. AND SUBSIDIARIES
NOTES TO CONSOLIDATED FINANCIAL STATEMENTS — (Continued)
NOTE 3 —AGREEMENT FOR BUSINESS COMBINATION — (Continued)
The ABL Facility is subject to a borrowing base equal to 85% of the Company’s eligible accounts receivable, 80% of the Company’s eligible unbilled accounts receivable and 50% of parts supplies. Borrowings on the ABL Facility bear interest at either the Alternate Base Rate (as defined) or the LIBOR Rate (as defined) plus 2.25% or 3.25%, respectively, and matures on February 27, 2022. The ABL Facility contains financial covenants, including a minimum fixed charge coverage ratio and a funded debt to consolidated adjusted EBITDA ratio (as defined in the agreement). Availability under the ABL Facility at Closing was approximately $43 million.
At the Closing, Hennessy issued $65.0 million of 7.625% Series A Convertible Cumulative Preferred Stock in a private placement and exercised $35.0 million of commitments from certain investors to purchase Hennessy common stock through open market or privately negotiated transactions in order to backstop potential redemptions by Hennessy’s public stockholders.
Hennessy has 35,040,664 outstanding warrants, consisting of 19,959,908 public warrants originally sold as part of units in its initial public offering (IPO) on July 28, 2015 and 15,080,756 placement warrants issued to Hennessy Capital Partners II, LLC (Sponsor) in a private placement simultaneously with the consummation of Hennessy’s IPO. Each warrant entitles the holder thereof to purchase one-half of one share of Hennessy’s common stock at a price of $5.75 per half share ($11.50 per whole share), subject to adjustment. Warrants may be exercised only for a whole number of shares of Hennessy’s common stock. No fractional shares will be issued upon exercise of the warrants. The public warrants will become exercisable 30 days after the Closing of the Business Combination and expire in five years or earlier upon redemption or liquidation. Once the warrants become exercisable, Hennessy may redeem the outstanding warrants at a price of $0.01 per warrant, provided that the last sale price of Hennessy’s common stock equals or exceeds $24.00 per share for any 20 trading days within a 30 trading day period ending on the third trading day before Hennessy sends the notice of redemption to the warrant holders and certain other conditions are met. The placement warrants, however, are non-redeemable so long as they are held by the Sponsor or its permitted transferees.
The Business Combination will be accounted for as a reverse merger in accordance with accounting principles generally accepted in the United States of America. Under this method of accounting, Hennessy will be treated as the “acquired” company for financial reporting purposes. This determination was primarily based on the Company comprising the ongoing operations of the combined company, Daseke’s senior management comprising the senior management of the combined company, and Daseke stockholders having a majority of the voting power of the combined company. For accounting purposes, Daseke will be deemed to be the accounting acquirer in the transaction and, consequently, the transaction will be treated as a recapitalization of Daseke (i.e., a capital transaction involving the issuance of stock by Hennessy Capital for the stock of Daseke). Accordingly, the consolidated assets, liabilities and results of operations of Daseke will become the historical financial statements of the combined company, and Hennessy’s assets, liabilities and results of operations will be consolidated with Daseke beginning on the acquisition date.
In connection with the Closing, Daseke, Inc. changed its name to Daseke Companies, Inc. and Hennessy changed its name to Daseke, Inc. Daseke, Inc. began trading under the ticker symbols DSKE and DSKEW on February 28, 2017.
DASEKE, INC. AND SUBSIDIARIES
NOTES TO CONSOLIDATED FINANCIAL STATEMENTS — (Continued)
NOTE 4 — ACQUISITIONS
The Company has grown through acquisitions throughout its history. To date, the primary reason for each acquisition was to add resources and services in geographic areas, customers and markets the Company wants to serve. The fair values of the Series B Convertible Preferred Stock issued as consideration for the acquisitions were derived from the sales of Series B Convertible Preferred Stock at or near the respective dates of such acquisitions, the majority of which were purchased by investors that were unrelated to the Company at the time of the purchase.
2015 Acquisitions
As of August 1, 2015, the Company acquired Hornady Truck Lines, Inc. and its subsidiary Hornady Transportation, LLC and B.C. Hornady and Associates, Inc. (collectively, HTL). Total consideration paid was $25.4 million consisting of the issuance of 3,600 shares of Series B Convertible Preferred Stock valued at $5.4 million and cash of $20.0 million.
The following is a summary of the allocation of the purchase price paid to the fair values of the net assets (in thousands):
|
|
|
HTL |
| |
|
|
|
|
| |
|
Accounts receivable |
|
$ |
3,073 |
|
|
Other current assets |
|
4,829 |
| |
|
Property and equipment |
|
23,815 |
| |
|
Goodwill |
|
15,547 |
| |
|
Intangible assets |
|
8,800 |
| |
|
Deferred tax liabilities |
|
(7,908 |
) | |
|
Accounts payable and other liabilities |
|
(22,756 |
) | |
|
Total |
|
$ |
25,400 |
|
The assets acquired and liabilities assumed were recorded at fair value as of the acquisition date. The acquisition was a stock purchase, therefore the values assigned to the intangible assets and goodwill are not deductible for tax purposes. Approximately $0.2 million of transaction expenses were incurred in the acquisition, which are not deductible for tax purposes.
As of July 1, 2015, the Company acquired Bulldog Hiway Express (BHE). Total consideration paid was $28.1 million consisting of the issuance of 5,400 shares of Series B Convertible Preferred Stock valued at $8.1 million, subordinated notes of $2.0 million, and cash of $18.0 million.
DASEKE, INC. AND SUBSIDIARIES
NOTES TO CONSOLIDATED FINANCIAL STATEMENTS — (Continued)
NOTE 4 — ACQUISITIONS — (Continued)
The following is a summary of the allocation of the purchase price paid to the fair values of the net assets (in thousands):
|
|
|
BHE |
| |
|
|
|
|
| |
|
Accounts receivable |
|
$ |
3,252 |
|
|
Other current assets |
|
700 |
| |
|
Property and equipment |
|
17,860 |
| |
|
Indemnification asset |
|
4,168 |
| |
|
Goodwill |
|
14,244 |
| |
|
Intangible assets |
|
10,100 |
| |
|
Deferred tax liabilities |
|
(7,034 |
) | |
|
Accounts payable and other liabilities |
|
(15,190 |
) | |
|
Total |
|
$ |
28,100 |
|
The assets acquired and liabilities assumed were recorded at fair value as of the acquisition date. The acquisition was a stock purchase, therefore the values assigned to the intangible assets and goodwill are not deductible for tax purposes. Approximately $0.4 million of transaction expenses were incurred in the acquisition, which are not deductible for tax purposes.
As of May 1, 2015, Lone Star Transportation, LLC (LST) acquired Davenport Transport & Rigging, LLC (DTR). Total consideration paid was $8.0 million consisting of the issuance of subordinated notes of $1.0 million and cash of $7.0 million.
The following is a summary of the allocation of the purchase price paid to the fair values of the net assets (in thousands):
|
|
|
DTR |
| |
|
|
|
|
| |
|
Property and equipment |
|
$ |
6,348 |
|
|
Goodwill |
|
731 |
| |
|
Intangible assets |
|
921 |
| |
|
Total |
|
$ |
8,000 |
|
The assets acquired were recorded at fair value as of the acquisition date. The acquisition was an asset purchase, therefore the values assigned to the intangible assets and goodwill are deductible for tax purposes. Approximately $0.2 million of transaction expenses were incurred in the acquisition, all of which are deductible for tax purposes.
DASEKE, INC. AND SUBSIDIARIES
NOTES TO CONSOLIDATED FINANCIAL STATEMENTS — (Continued)
NOTE 4 — ACQUISITIONS — (Continued)
2014 Acquisition
As of October 1, 2014, the Company, through its wholly-owned subsidiary, Daseke Lone Star, Inc., acquired Lone Star Transportation, LLC, TexR Equipment, LLC, TexR Assets, LLC and TexR Assets 2, LLC (the LST Acquisition or LST). Total consideration paid was $73,129,659 consisting of the issuance of 18,400,000 shares of Series B Convertible Preferred Stock valued at $23.0 million, subordinated notes of $22.0 million and cash of $28.1 million.
The following is a summary of the allocation of the purchase price paid to the fair values of the net assets:
|
|
|
LST |
| |
|
|
|
|
| |
|
Accounts receivable |
|
$ |
22,024,984 |
|
|
Other current assets |
|
3,694,807 |
| |
|
Property and equipment |
|
64,167,913 |
| |
|
Goodwill |
|
12,319,776 |
| |
|
Intangible assets |
|
19,600,000 |
| |
|
Deferred tax liabilities |
|
(3,463,045 |
) | |
|
Accounts payable and other liabilities |
|
(45,214,776 |
) | |
|
Total |
|
$ |
73,129,659 |
|
The assets acquired and liabilities assumed were recorded at fair value as of the acquisition date. The acquisition was a combination asset and stock purchase, therefore the amount of values assigned to the intangible assets and goodwill deductible for tax is $26,762,947. Approximately $944,000 of transaction expenses were incurred in the acquisition, of which approximately $868,000 is deductible for tax purposes.
The goodwill for the acquisitions, in the aggregate, is a result of acquiring and retaining the existing workforces and expected synergies from integrating best practices across the acquired companies.
From the dates of acquisition through December 31, 2015, the 2015 acquisitions contributed revenues of $36.3 million and net income of $0.2 million. From the date of acquisition through December 31, 2014, the 2014 acquisition contributed revenues of $47.0 million and net income of $2.6 million. The following supplemental unaudited pro forma financial information for the Company for the years ended December 31, 2015 and 2014 includes the results of operations for the 2015 and 2014 acquisitions, in the aggregate, as if the acquisitions had been completed on January 1, 2014 (in thousands):
|
|
|
Year Ended December 31, |
| ||||
|
|
|
2015 |
|
2014 |
| ||
|
Pro forma revenues |
|
$ |
723,454 |
|
$ |
761,505 |
|
|
Pro forma net income |
|
$ |
6,264 |
|
$ |
7,798 |
|
|
Pro forma net income per common share: |
|
|
|
|
| ||
|
Basic |
|
$ |
9.80 |
|
$ |
49.05 |
|
|
Diluted |
|
$ |
9.80 |
|
$ |
47.05 |
|
The supplemental unaudited pro forma financial information above is presented for information purposes only. It is not necessarily indicative of what the Company’s financial position or results of operations actually would have been had the Company completed the acquisitions at the date indicated, nor is it intended to project the future financial position or operating results of the Company.
DASEKE, INC. AND SUBSIDIARIES
NOTES TO CONSOLIDATED FINANCIAL STATEMENTS — (Continued)
NOTE 5 — PREPAID AND OTHER CURRENT ASSETS
The components of prepaid expenses and other current assets are as follows as of December 31 (in thousands):
|
|
|
2016 |
|
2015 |
| ||
|
|
|
|
|
|
| ||
|
Other assets |
|
$ |
6,358 |
|
$ |
6,083 |
|
|
Insurance |
|
2,246 |
|
2,408 |
| ||
|
Other prepaids |
|
1,104 |
|
1,666 |
| ||
|
Licensing, permits and tolls |
|
2,772 |
|
2,719 |
| ||
|
Highway and fuel taxes |
|
1,024 |
|
978 |
| ||
|
Total |
|
$ |
13,504 |
|
$ |
13,854 |
|
NOTE 6 — GOODWILL AND INTANGIBLE ASSETS
Changes in the carrying amount of goodwill for the years ended December 31, 2016 and 2015 are as follows (in thousands):
|
|
|
Flatbed |
|
Specialized |
|
Total |
| |||
|
|
|
|
|
|
|
|
| |||
|
Goodwill balance at January 1, 2015 |
|
$ |
30,247 |
|
$ |
27,842 |
|
$ |
58,089 |
|
|
Goodwill related to acquisitions |
|
15,547 |
|
14,975 |
|
30,522 |
| |||
|
|
|
|
|
|
|
|
| |||
|
Goodwill balance at December 31, 2015 |
|
45,794 |
|
42,817 |
|
88,611 |
| |||
|
Impairment |
|
— |
|
(442 |
) |
(442 |
) | |||
|
Acquisitions |
|
866 |
|
— |
|
866 |
| |||
|
|
|
|
|
|
|
|
| |||
|
Goodwill balance at December 31, 2016 |
|
$ |
46,660 |
|
$ |
42,375 |
|
$ |
89,035 |
|
DASEKE, INC. AND SUBSIDIARIES
NOTES TO CONSOLIDATED FINANCIAL STATEMENTS — (Continued)
NOTE 6 — GOODWILL AND INTANGIBLE ASSETS — (Continued)
In December 2016, the Company identified and recorded a $0.9 million increase to goodwill and deferred tax liabilities related to the initial purchase accounting of HTL (See Note 4). The impact of this adjustment was not material to the prior year’s financial statements or as of and for the three months and year ended December 31, 2016.
Intangible assets consisted of the following at December 31, 2016 and 2015 (in thousands):
|
|
|
As of December 31, 2016 |
|
As of December 31, 2015 |
| ||||||||||||||
|
|
|
Intangible |
|
Accumulated |
|
Intangible |
|
Intangible |
|
Accumulated |
|
Intangible |
| ||||||
|
Non-competition agreements |
|
$ |
8,350 |
|
$ |
(3,929 |
) |
$ |
4,421 |
|
$ |
8,350 |
|
$ |
(2,319 |
) |
$ |
6,031 |
|
|
Customer relationships |
|
56,210 |
|
(19,078 |
) |
37,132 |
|
56,210 |
|
(14,687 |
) |
41,523 |
| ||||||
|
Trade names |
|
30,100 |
|
— |
|
30,100 |
|
30,100 |
|
— |
|
30,100 |
| ||||||
|
Total intangible assets |
|
$ |
94,660 |
|
$ |
(23,007 |
) |
$ |
71,653 |
|
$ |
94,660 |
|
$ |
(17,006 |
) |
$ |
77,654 |
|
As of December 31, 2016, non-competition agreements and customer relationships had weighted average remaining useful lives of 2.63 and 8.52 years, respectively.
Amortization expense for intangible assets with definite lives was $6.0 million, $5.2 million and $3.5 million for the years ended December 31, 2016, 2015 and 2014, respectively.
Future estimated amortization expense is as follows (in thousands):
|
Year ending December 31, |
|
Non- |
|
Customer |
| ||
|
|
|
|
|
|
| ||
|
2017 |
|
$ |
1,378 |
|
$ |
4,391 |
|
|
2018 |
|
1,378 |
|
4,391 |
| ||
|
2019 |
|
1,243 |
|
4,391 |
| ||
|
2020 |
|
422 |
|
4,391 |
| ||
|
2021 |
|
— |
|
4,391 |
| ||
|
Thereafter |
|
— |
|
15,177 |
| ||
|
Total |
|
$ |
4,421 |
|
$ |
37,132 |
|
DASEKE, INC. AND SUBSIDIARIES
NOTES TO CONSOLIDATED FINANCIAL STATEMENTS — (Continued)
NOTE 7 — PROPERTY AND EQUIPMENT
The components of property and equipment are as follows at December 31 (in thousands):
|
|
|
2016 |
|
2015 |
| ||
|
|
|
|
|
|
| ||
|
Revenue equipment |
|
$ |
398,394 |
|
$ |
403,719 |
|
|
Buildings and improvements |
|
43,000 |
|
39,847 |
| ||
|
Furniture and fixtures, office and computer equipment and vehicles |
|
14,421 |
|
11,964 |
| ||
|
|
|
455,815 |
|
455,530 |
| ||
|
Accumulated depreciation |
|
(137,068 |
) |
(100,995 |
) | ||
|
Total |
|
$ |
318,747 |
|
$ |
354,535 |
|
Depreciation expense on property and equipment was $61.5 million, $58.4 million and $45.1 million for the years ended December 31, 2016, 2015 and 2014, respectively.
NOTE 8 — SALES-TYPE LEASES
The components of the net investment in sales-type leases at December 31, 2016 and 2015 are as follows (in thousands):
|
|
|
2016 |
|
2015 |
| ||
|
|
|
|
|
|
| ||
|
Minimum lease receivable |
|
$ |
21,055 |
|
$ |
18,156 |
|
|
Deferred gain |
|
(3,049 |
) |
(3,171 |
) | ||
|
Net minimum lease receivable |
|
18,006 |
|
14,985 |
| ||
|
Unearned interest income |
|
(3,671 |
) |
(2,025 |
) | ||
|
|
|
|
|
|
| ||
|
Net investment in sales-type leases |
|
14,335 |
|
12,960 |
| ||
|
Current portion |
|
(3,516 |
) |
(3,116 |
) | ||
|
|
|
$ |
10,819 |
|
$ |
9,844 |
|
The long-term portion of sales-type leases is classified in other long-term assets on the consolidated balance sheets at December 31, 2016 and 2015.
Gain or loss on disposition of revenue equipment leased to owner-operators is included as a component of purchased freight in the consolidated statements of operations and comprehensive income (loss). For the years ended December 31, 2016, 2015 and 2014, the gain totaled approximately $0.8 million, $0.5 million and $1.0 million, respectively.
Future minimum lease receipts are as follows (in thousands):
|
Year ending December 31, |
|
Amount |
| |
|
|
|
|
| |
|
2017 |
|
$ |
3,516 |
|
|
2018 |
|
3,501 |
| |
|
2019 |
|
3,563 |
| |
|
2020 |
|
2,924 |
| |
|
2021 |
|
697 |
| |
|
Thereafter |
|
134 |
| |
|
Total |
|
$ |
14,335 |
|
DASEKE, INC. AND SUBSIDIARIES
NOTES TO CONSOLIDATED FINANCIAL STATEMENTS — (Continued)
NOTE 9 — ACCRUED EXPENSES AND OTHER LIABILITIES
The components of accrued expenses and other liabilities are as follows at December 31 (in thousands):
|
|
|
2016 |
|
2015 |
| ||
|
|
|
|
|
|
| ||
|
Brokerage and escorts |
|
$ |
3,559 |
|
$ |
6,341 |
|
|
Unvouchered payables |
|
2,587 |
|
3,134 |
| ||
|
Other accrued expenses |
|
3,956 |
|
2,601 |
| ||
|
Owner operator deposits |
|
2,032 |
|
1,485 |
| ||
|
Interest |
|
1,705 |
|
1,521 |
| ||
|
Dividends |
|
1,209 |
|
1,277 |
| ||
|
Fuel |
|
711 |
|
320 |
| ||
|
Fuel taxes |
|
345 |
|
323 |
| ||
|
|
|
$ |
16,104 |
|
$ |
17,002 |
|
NOTE 10 — LONG-TERM DEBT
Long-term debt consists of the following at December 31 (in thousands):
|
|
|
2016 |
|
2015 |
| ||
|
Senior debt |
|
|
|
|
| ||
|
|
|
|
|
|
| ||
|
Line of credit |
|
$ |
6,858 |
|
$ |
12,555 |
|
|
Senior term loan |
|
125,682 |
|
69,048 |
| ||
|
Equipment term loans |
|
111,882 |
|
190,527 |
| ||
|
Real estate term loan |
|
13,772 |
|
— |
| ||
|
Capital leases |
|
13,818 |
|
28,555 |
| ||
|
|
|
272,012 |
|
300,685 |
| ||
|
Less current portion |
|
(52,665 |
) |
(66,800 |
) | ||
|
Less unamortized debt issuance costs |
|
(4,117 |
) |
(3,575 |
) | ||
|
Long-term portion |
|
215,230 |
|
230,310 |
| ||
|
|
|
|
|
|
| ||
|
Subordinated debt |
|
|
|
|
| ||
|
|
|
|
|
|
| ||
|
Main Street Capital Corporation |
|
21,660 |
|
21,118 |
| ||
|
Prudential Capital Partners |
|
21,492 |
|
20,963 |
| ||
|
LST Seller |
|
22,000 |
|
22,000 |
| ||
|
DTR Sellers |
|
1,000 |
|
1,000 |
| ||
|
BHE Sellers |
|
291 |
|
2,000 |
| ||
|
Total subordinated debt |
|
66,443 |
|
67,081 |
| ||
|
|
|
|
|
|
| ||
|
Total long-term debt |
|
$ |
281,673 |
|
$ |
297,391 |
|
DASEKE, INC. AND SUBSIDIARIES
NOTES TO CONSOLIDATED FINANCIAL STATEMENTS — (Continued)
NOTE 10 — LONG-TERM DEBT — (Continued)
Line of Credit and Senior Term Loan
The Company has credit agreements with a consortium of lenders, led by PNC Business Credit (PNC). The credit agreements include a revolving line of credit and a term loan (Senior Term Loan). In August 2016, the credit agreement was amended, increasing the borrowing capacity to an aggregate $212.1 million from $150.0 million, consisting of a $75.0 million revolving line of credit and a $137.1 million Senior Term Loan. In conjunction with the amendment, the Company refinanced $73.0 million of equipment notes with various lenders under the PNC credit agreement. The maturity date for the credit facility remains at October 2, 2019. The line of credit is subject to a borrowing base equal to 85% of the Company’s eligible accounts receivable, 80% of the Company’s eligible unbilled accounts receivable and 50% of parts supplies.
As of December 31, 2016, borrowings on the line of credit bear interest at either (a) the Libor Rate (as defined in the credit agreement), plus a margin of 3.25%, or (b) the Base Rate (as defined in the credit agreement), plus a margin of 2.25%. The revolving credit facility also provides for the issuance of up to $10 million in letters of credit. As of December 31, 2016, the Company had outstanding letters of credit subject to the credit agreement totaling $4.1 million. Total availability under the revolving line of credit was $33.0 million as of December 31, 2016. At December 31, 2016, the average interest rate on the line of credit was 4.5%.
Prior to an amendment in August 2015, borrowings under the credit agreement for the line of credit had interest rates of either (a) the Libor Rate (as defined in the credit agreement), plus a margin of 2.75%, or (b) the Base Rate (as defined in the credit agreement), plus a margin of 1.75%.
As of December 31, 2016, the Senior Term Loan is due in monthly installments of $1,690,154, plus applicable interest at either (a) the Libor Rate (as defined in the credit agreement), plus a margin of 4.00%, or (b) the Base Rate (as defined in the credit agreement), plus a margin of 3.00%. At December 31, 2016, the average interest rate on the term loan was 4.4%.
Prior to the amendment in August 2016, debt on the Senior Term Loan had interest rates of either (a) the Libor Rate (as defined in the credit agreement), plus a margin of 3.75%, or (b) the Base Rate (as defined in the credit agreement), plus a margin of 2.75%.
Margins on the line of credit and Senior Term Loan are adjusted, if necessary to the applicable rates set forth in the following table corresponding to the fixed charge coverage ratio for the trailing twelve month period on the last day of the most recently completed fiscal quarter.
|
|
|
Base Rate Margins |
|
LIBOR Rate Margins |
| ||||
|
Fixed Charge Coverage Ratio |
|
Line of Credit |
|
Senior Term Loan |
|
Line of Credit |
|
Senior Term Loan |
|
|
|
|
|
|
|
|
|
|
|
|
|
Less than 1.00 to 1.00 |
|
2.25 |
% |
2.75 |
% |
3.25 |
% |
3.75 |
% |
|
Greater than or equal to 1.25 to 1.00, but less than 1.50 to 1.00 |
|
1.75 |
% |
2.25 |
% |
2.75 |
% |
3.25 |
% |
|
Greater than or equal to 1.50 to 1.00, but less than 1.75 |
|
1.25 |
% |
1.75 |
% |
2.25 |
% |
2.75 |
% |
|
Greater than or equal to 1.75 to 1.00 |
|
0.75 |
% |
1.25 |
% |
1.75 |
% |
2.25 |
% |
The Senior Term Loan agreement also contains a subjective acceleration clause, which permits the lender to demand payment in the event of a material adverse change. Only the scheduled principal payments are being presented in the current portion of long-term obligations as management believes the likelihood of the subjective acceleration clause being exercised is remote.
DASEKE, INC. AND SUBSIDIARIES
NOTES TO CONSOLIDATED FINANCIAL STATEMENTS — (Continued)
NOTE 10 — LONG-TERM DEBT — (Continued)
The credit agreement is collateralized by all assets of the Company, except those assets collateralizing equipment and certain real estate lenders debt, and contains certain financial covenants, including a minimum fixed charge coverage ratio, a senior secured debt to consolidated earnings before interest, taxes, depreciation and amortization (EBITDA) ratio and a funded debt to consolidated EBITDA ratio. Additionally, the credit agreement contains negative covenants limiting, among other things, additional indebtedness, transactions with affiliates, additional liens, sales of assets, dividends, investments and advances, prepayments of debt, mergers and acquisitions, and other matters customarily restricted in such agreements. As of December 31, 2016 and 2015 the Company was in compliance with all covenants contained in the credit agreement.
The credit agreement contains a required principal payment based on excess cash flow (as defined) beginning in fiscal 2016 and due fifteen (15) days following the delivery of the audited financial statements to PNC, but not later than May 15, 2017. In conjunction with the Term Loan and ABL Facility executed on February 27, 2017, the due date of the excess cash flow principal payment was amended to begin in fiscal 2018 with the first payment due April 6, 2019.
Equipment Term Loans and Mortgages
As of December 2016, the Company has term loans with twenty-seven (27) lenders collateralized by equipment. The equipment loans bear interest at rates ranging from 1.5% to 6.9%, require monthly payments of principal and interest and mature at various dates through December 2023.
The Company has a construction loan with a balance of $8.9 million incurred to finance the construction of a new office and terminal in Arlington, Washington The construction loan is collateralized by such property and buildings. The initial principal amount on February 19, 2015 of $7.8 million was increased on April 26, 2016 to $8.8 million. The construction loan bears interest at 3.25% payable monthly, with principal payments of $30,036 due beginning October 29, 2016 through the maturity date of February 19, 2020. The Company has the option to extend the maturity date to February 19, 2022.
The Company has a bank mortgage loan with a balance of $2.7 million incurred to finance the construction of a new office and terminal in Redmond, Oregon. The mortgage loan is collateralized by such property and buildings. The mortgage is payable in monthly installments of $15,776, including interest at 3.7% through November 2017.
The interest rate and monthly payments will be adjusted on November 1, 2017 and 2020 to a rate of 2.5%, plus the three-year advance rate published by the Federal Home Loan Bank of Seattle in effect 45 days prior to November 2017 and 2020, but not less than 3.7%. The bank mortgage loan matures November 1, 2023.
Real Estate Term Loan
In April 2016, the Company refinanced $14.2 million of its Line of Credit with bank debt (Real Estate Term Loan) utilizing nine wholly-owned real estate assets which previously served as collateral on the Senior Term Loan. The Real Estate Term Loan is subordinate to the PNC credit agreement and Equipment Term Loans and is due in monthly installments of $59,109 (based on twenty year amortization schedule), plus applicable interest at either (a) the Libor Rate (as defined in the loan agreement), plus a margin of 2.75%, or (b) the Default Rate (as defined in the loan agreement). The Real Estate Term Loan matures in April 2021 at which time the outstanding balance will be due in a balloon payment. The Company incurred debt issuance costs of $0.4 million, which are being amortized to interest expense over five years using the straight line method.
DASEKE, INC. AND SUBSIDIARIES
NOTES TO CONSOLIDATED FINANCIAL STATEMENTS — (Continued)
NOTE 10 — LONG-TERM DEBT — (Continued)
Capital Leases
The Company leases certain equipment under long-term capital lease agreements that expire on various dates through October 2021. As of December 31, 2016 and 2015, the book value of the property and equipment recorded under capital leases was $24.1 and $32.6 million, net of accumulated depreciation of $17.0 and $13.1 million, respectively. Depreciation expense related to leased equipment was $7.0 million, $6.0 million and $3.9 million for the years ended December 31, 2016, 2015 and 2014, respectively.
Main Street Capital Corporation
In 2013, Main Street Capital Corporation (Main Street) loaned the Company $20.0 million under a senior subordinated secured term loan (Main Street Loan). The Main Street Loan is subordinate to the PNC credit agreement and Equipment Term Loans. Interest payments are due monthly through maturity on July 31, 2018 at the rate of 12% per annum. Paid-in kind (PIK) interest, at a rate of 2.5% per annum, may be paid monthly or accrued and added to the principal balance quarterly, at the option of the Company. For the years ended December 31, 2016 and 2015, $0.5 million of accrued PIK interest was added to the principal balance of the loan and accrued PIK interest of $0.1 million was recorded in accrued expenses.
Prudential Capital Partners
In 2013, the Company issued senior secured subordinated promissory notes in the initial aggregate principal amount of $20.0 million (PCP Subordinated Notes) to Prudential Capital Partners IV, L.P., Prudential Capital Partners (Parallel Fund) IV, L.P. and Prudential Capital Partners Management fund IV, L.P. (PCP Investors) pursuant to the Securities Purchase Agreement, dated as of November 12, 2013, by and among the Company, certain of its subsidiaries and the PCP Investors. The PCP Subordinated Notes are subordinate to the PNC credit agreement and Equipment Term Loans. Interest payments are due monthly through maturity on July 31, 2018 at the rate of 12% per annum. PIK interest, at a rate of 2.5% per annum, may be paid monthly or accrued and added to the principal balance quarterly, at the option of the Company. For the years ended December 31, 2016 and 2015, $0.5 million accrued PIK interest was added to the principal balance of the loan and $0.1 million accrued PIK interest was recorded in accrued expenses.
The Main Street Loan and PCP Subordinated Notes (Subordinated Debt) are collateralized by all assets of the Company, except those assets collateralizing equipment lenders debt, and contain certain financial covenants, including a minimum fixed charge coverage ratio, a senior secured debt to consolidated EBITDA ratio and a funded debt to consolidated EBITDA ratio. Additionally, the loans contain negative covenants limiting, among other things, additional indebtedness, capital expenditures, transactions with affiliates, additional liens, sales of assets, dividends, investments and advances, prepayments of debt, mergers and acquisitions, and other matters customarily restricted in such agreements. The Subordinated Debt is subject to a make-whole payment of 5.0% of the prepayment amount if such prepayment is made before the third anniversary of the agreements.
LST Seller
As part of the consideration paid to the seller of LST (LST Seller), Daseke Lone Star, Inc. issued $22,000,000 of subordinated notes (LST Subordinated Notes). The LST Subordinated Notes bear interest at 10% payable monthly and mature on October 2, 2019, subject to certain acceleration events as defined in the note agreement. The LST Subordinated Notes are subordinate to the PNC Credit Agreement and the Main Street Loan and the PCP Subordinated Notes.
DASEKE, INC. AND SUBSIDIARIES
NOTES TO CONSOLIDATED FINANCIAL STATEMENTS — (Continued)
NOTE 10 — LONG-TERM DEBT — (Continued)
DTR Sellers
As part of the consideration paid to the sellers of DTR (DTR Sellers), LST issued $1,000,000 of subordinated notes (DTR Subordinated Notes). The DTR Subordinated Notes bear interest at 5% payable monthly and mature on May 1, 2020, subject to certain acceleration events as defined in the note agreement. The DTR Subordinated Notes are subordinate to the PNC Credit Agreement and the Main Street Loan and the PCP Subordinated Notes.
BHE Sellers
As part of the consideration paid to the sellers of BHE (BHE Sellers), the Company issued $2,000,000 of subordinated notes (BHE Subordinated Notes). The BHE Subordinated Notes bear interest at 7% payable monthly and mature on June 30, 2018, subject to certain acceleration events as defined in the note agreement. The BHE Subordinated Notes are subordinate to the PNC Credit Agreement and the Main Street Loan and the PCP Subordinated Notes.
On December 19, 2016, $1.7 million of the outstanding principal amount under the BHE Subordinated Notes was forgiven in conjunction with the settlement by the Company of certain pension liabilities of BHE. See Note 17 for additional details.
Future principal payments on long-term debt are as follows (in thousands):
|
|
|
Senior |
|
Subordinated |
|
Capital |
|
|
| ||||
|
Year ending December 31, |
|
Debt |
|
Debt (1) |
|
Leases |
|
Total |
| ||||
|
|
|
|
|
|
|
|
|
|
| ||||
|
2017 |
|
$ |
48,002 |
|
$ |
— |
|
$ |
5,113 |
|
$ |
53,115 |
|
|
2018 |
|
47,491 |
|
43,443 |
|
4,731 |
|
95,665 |
| ||||
|
2019 |
|
118,047 |
|
22,000 |
|
4,175 |
|
144,222 |
| ||||
|
2020 |
|
23,564 |
|
— |
|
982 |
|
24,546 |
| ||||
|
2021 |
|
6,181 |
|
— |
|
92 |
|
6,273 |
| ||||
|
Thereafter |
|
14,909 |
|
1,000 |
|
— |
|
15,909 |
| ||||
|
|
|
|
|
|
|
|
|
|
| ||||
|
Total minimum lease payments |
|
|
|
|
|
15,093 |
|
|
| ||||
|
Loan amount attributable to interest |
|
|
|
|
|
(1,275 |
) |
(1,275 |
) | ||||
|
|
|
|
|
|
|
|
|
|
| ||||
|
Total (Present value of minimum lease payments on capital leases) |
|
$ |
258,194 |
|
$ |
66,443 |
|
13,818 |
|
$ |
338,455 |
| |
|
Less current portion |
|
|
|
|
|
(4,664 |
) |
|
| ||||
|
Long-term capital leases |
|
|
|
|
|
$ |
9,154 |
|
|
| |||
(1) Contractual payments that cannot be repaid as long as the senior debt is outstanding.
DASEKE, INC. AND SUBSIDIARIES
NOTES TO CONSOLIDATED FINANCIAL STATEMENTS – (Continued)
NOTE 11 – INCOME TAXES
The Company files income tax returns in the U.S. federal jurisdiction and state tax returns in the states where it does business. The components of the Company’s provision for income taxes were as follows for the years ended December 31 (in thousands):
|
|
|
2016 |
|
2015 |
|
2014 |
| |||
|
Current: |
|
|
|
|
|
|
| |||
|
Federal |
|
$ |
(70 |
) |
$ |
— |
|
$ |
— |
|
|
State |
|
582 |
|
456 |
|
164 |
| |||
|
|
|
|
|
|
|
|
| |||
|
Total current taxes |
|
$ |
512 |
|
$ |
456 |
|
$ |
164 |
|
|
|
|
|
|
|
|
|
| |||
|
Deferred: |
|
|
|
|
|
|
| |||
|
Federal |
|
(1,139 |
) |
6,430 |
|
403 |
| |||
|
State |
|
790 |
|
577 |
|
1,217 |
| |||
|
|
|
|
|
|
|
|
| |||
|
Total deferred taxes |
|
(349 |
) |
7,007 |
|
1,620 |
| |||
|
|
|
|
|
|
|
|
| |||
|
Provision for income taxes |
|
$ |
163 |
|
$ |
7,463 |
|
$ |
1,784 |
|
A reconciliation between the effective income tax rate and the U.S. statutory income tax rate for the years ended December 31, 2016, 2015 and 2014 is as follows (in thousands):
|
|
|
2016 |
|
2015 |
|
2014 |
| |||
|
|
|
|
|
|
|
|
| |||
|
Income tax (benefit) expense at U.S. statutory income tax rate |
|
$ |
(4,241 |
) |
$ |
3,754 |
|
$ |
1,048 |
|
|
Federal income tax effects of: |
|
|
|
|
|
|
| |||
|
State income tax expense |
|
370 |
|
1,208 |
|
96 |
| |||
|
Per diem and other nondeductible expenses |
|
3,434 |
|
1,187 |
|
740 |
| |||
|
Cumulative effect of change in effective tax rate |
|
522 |
|
1,261 |
|
— |
| |||
|
Tax credits |
|
(70 |
) |
— |
|
— |
| |||
|
Return to provision |
|
148 |
|
53 |
|
(100 |
) | |||
|
Provision for income taxes |
|
$ |
163 |
|
$ |
7,463 |
|
$ |
1,784 |
|
|
|
|
|
|
|
|
|
| |||
|
Effective tax rate |
|
(1.3 |
)% |
69.6 |
% |
57.9 |
% | |||
The decrease in the effective tax rate for the year ended December 31, 2016 compared to the year ended December 31, 2015 is the result of an increase in nondeductible permanent differences related to driver per diems, nondeductible transaction expenses and the cumulative change in the state income tax rate applied to the beginning net deferred tax liabilities balance. The increase in the effective tax rate for the year ended December 31, 2015 compared to the year ended December 31, 2014 is the result of an increase in nondeductible permanent differences related to driver per diems and acquisition transaction costs and the cumulative change in the federal income tax rate from 34% to 35% applied to the beginning net deferred tax liabilities balance.
DASEKE, INC. AND SUBSIDIARIES
NOTES TO CONSOLIDATED FINANCIAL STATEMENTS — (Continued)
NOTE 11 — INCOME TAXES — (Continued)
The effects of temporary differences that give rise to significant elements of deferred tax assets and liabilities at December 31, 2016 and 2015 were as follows (in thousands):
|
|
|
2016 |
|
2015 |
| ||
|
Deferred tax assets (liabilities) |
|
|
|
|
| ||
|
Accrued expenses |
|
$ |
4,112 |
|
$ |
4,203 |
|
|
Vacation accrual |
|
329 |
|
322 |
| ||
|
Accounts receivable |
|
126 |
|
1,407 |
| ||
|
Prepaid expenses |
|
(2,102 |
) |
(1,964 |
) | ||
|
Net operating losses |
|
14,941 |
|
14,985 |
| ||
|
Property and equipment |
|
(91,149 |
) |
(91,507 |
) | ||
|
Intangible assets |
|
(21,020 |
) |
(22,661 |
) | ||
|
Sales-type leases |
|
874 |
|
— |
| ||
|
481(a) adjustment |
|
(446 |
) |
— |
| ||
|
Pension accrual |
|
— |
|
1,735 |
| ||
|
Accrued expenses |
|
1,511 |
|
1,205 |
| ||
|
Interest rate swap |
|
9 |
|
(24 |
) | ||
|
Total deferred tax liabilities |
|
$ |
(92,815 |
) |
$ |
(92,299 |
) |
At December 31, 2016, the Company has federal and state net operating loss carry forwards of approximately $37.5 million that begin to expire in 2022.
NOTE 12 — LIFE INSURANCE
The Company maintains life insurance policies on the CEOs, Presidents or CFOs of the eight subsidiaries (a total of 10 individuals). Life insurance coverages include $2,500,000 for each of two executives, $5,000,000 for each of six executives and $10,000,000 on each of two executives.
NOTE 13 — RELATED PARTY TRANSACTIONS
Related Party Debt
In September 2013, the Company borrowed $2,700,000 from the majority stockholder for the purchase of land in Arlington, Washington. Payments of interest were due monthly at a rate of 6.0% per annum through maturity on January 31, 2015, at which time all unpaid interest and principal were due. Interest of $24,300 and $162,000 was paid during 2015 and 2014, respectively. The note was paid in full in February 2015.
The Company had notes payable to one of the Smokey Point Distributing sellers in the total amount of $5,002,106 as of December 31, 2013. The loan was repaid in 2014. In conjunction with the loan, the Company issued detachable warrants to purchase 9,245 shares of the Company’s common stock at an exercise price of $100.00 per share. The warrants were exercisable through December 30, 2018 at any time. In connection with the purchase of one of the seller notes, the majority stockholder acquired the seller’s warrant in 2013 and in 2014 the majority stockholder acquired the remaining warrants. The majority stockholder exercised the warrants in 2014.
The Company had an obligation for $1,125,000 due to a stockholder that was contingent upon this individual being employed by the Company on December 30, 2014. Annually through 2014, the Company charged expense for one-sixth of the amount due, plus interest at 7.00% on the gross amount of the obligation. The balance of $1,688,322 was paid in 2014.
DASEKE, INC. AND SUBSIDIARIES
NOTES TO CONSOLIDATED FINANCIAL STATEMENTS — (Continued)
NOTE 13 — RELATED PARTY TRANSACTIONS — (Continued)
As described in Note 10, the Company issued Subordinated Debt to Main Street and PCP Investors. Both lenders are stockholders of the Company. For the years ended December 31, 2016, 2015 and 2014, Main Street received interest payments of $2.6 million, $2.5 million and $2.4 million, respectively. Accrued interest was $0.4 million as of December 31, 2016 and 2015. For the years ended December 31, 2016 and 2015, PCP Investors received interest payments of $2.6 million and $2.5 million, respectively. Accrued interest was $0.4 million and $0.3 million as of December 31, 2016 and 2015, respectively.
As disclosed in Note 10, the LST seller received subordinated notes as partial consideration. Interest paid to the LST seller was $2.2 million, $2.2 million and $0.4 million for the years ended December 31, 2016, 2015 and 2014. Accrued interest was $0.2 million as of December 31, 2016 and 2015.
As disclosed in Note 10, the BHE Sellers received subordinated notes as partial consideration. Interest paid to the BHE sellers was $0.1 million for the year ended December 31, 2016 and the period from July 1, 2015 to December 31, 2015.
Related Party Leases
The Company leases certain office facilities, terminals and revenue equipment from entities owned or partially owned by stockholders or employees on month-to-month and long term operating leases. Total lease expense related to these leases was $0.9 million, $1.2 million and $1.0 million for the years ended December 31, 2016, 2015 and 2014, respectively. Future minimum lease payments under non-cancelable related party operating leases are as follows:
|
Year ending December 31, |
|
Revenue |
|
Office and |
| ||
|
|
|
|
|
|
| ||
|
2017 |
|
$ |
101 |
|
$ |
337 |
|
|
2018 |
|
101 |
|
340 |
| ||
|
2019 |
|
101 |
|
344 |
| ||
|
2020 |
|
83 |
|
347 |
| ||
|
2021 |
|
— |
|
350 |
| ||
|
Thereafter |
|
— |
|
373 |
| ||
|
|
|
|
|
|
| ||
|
Total |
|
$ |
386 |
|
$ |
2,091 |
|
Other Related Party Transactions
A stockholder has a 1% investment in an entity that is also a vendor. Total amounts paid to this vendor for product and subscription purchases were approximately $0.8 million, $0.5 million and $0.1 million for the years ended December 31, 2016, 2015 and 2014, respectively. Amounts due the vendor as of December 31, 2016 and 2015 totaled approximately $20,000 and $7,000, respectively.
The Company does business with an entity in which two stockholders are minority owners. Revenue received from this customer totaled approximately $0.5 million, $0.4 million and $0.2 million for the years ended December 31, 2016, 2015 and 2014, respectively. Accounts receivable due from this entity totaled approximately $27,000 and $26,000 as of December 31, 2016 and 2015, respectively.
NOTE 14 — COMMON STOCK
Common stock has voting rights — one vote for each share of common stock. In April 2014 the Company sold 10,000 shares of common stock for $4,000,000 cash. In October 2014, 9,245 shares of common stock were sold upon exercise of warrants for $924,500 cash.
DASEKE, INC. AND SUBSIDIARIES
NOTES TO CONSOLIDATED FINANCIAL STATEMENTS — (Continued)
NOTE 15 — PREFERRED STOCK
Series A
On December 30, 2008, the Company issued 3,500 shares of preferred stock with a par value of $0.01 per share to the SPD Sellers. Additional features of this preferred stock are as follows:
a. Redemption — Subject to the payment restrictions described below, the Company was required to have redeemed all outstanding preferred shares on the earlier of the following to occur: (i) December 30, 2014 or (ii) the occurrence of a Change of Control that is not deemed a liquidation event. At any time, and from time to time, the Company may redeem, at its option, not less than 100 shares of Series A Preferred Stock on a date selected by the Company. Each share of Series A Preferred Stock shall be entitled to be redeemed for cash in an amount equal to the Series A liquidation preference prior to, and in preference to any distribution or equity securities ranking junior to the Series A Preferred Shares.
b. Liquidation — In the event of liquidation, holders of Series A Preferred Stock would have had preferential rights to liquidation payments over holders of common stock. Holders of Series A Preferred Stock shall be paid out of the assets of the Company at an amount equal to $1,000 per share.
c. Dividends — Holders of preferred stock had a 10% preferential dividend right to holders of common stock. Dividends are cumulative and payable to the preferred shareholders on a quarterly basis when declared by the board. At its option, the Company was allowed to defer cash dividend payments, however the interest rate increased to 12% if the Company elected not to pay the dividend amounts. For the year ended December 31, 2014, the Company paid $263,472, for dividends.
d. Voting rights — The holders of Series A preferred stock did not have voting rights.
The Series A Preferred Stock was recorded as a liability, as the shares had a mandatory redemption feature. On the redemption date, the Company was required to remit to the preferred stockholders a total of $3,500,000, plus any accrued and unpaid dividends. However, the note payable to related party specifically prohibited any payments on the preferred stock while the note payable to related party was outstanding.
During 2014, the related party debt was repaid and the Series A Preferred Stock was redeemed for $3,500,972.
Series B Convertible
In February 2015, the Company sold 700 shares of Series B Convertible Preferred Stock (Series B Preferred) for cash of $0.9 million. On July 1, 2015, the Company issued 5,400 shares of Series B Preferred to the BHE Sellers valued at $8.1 million and on August 1, 2015 the Company issued 3,600 shares of Series B Preferred to the HTL Seller valued at $5.4 million.
DASEKE, INC. AND SUBSIDIARIES
NOTES TO CONSOLIDATED FINANCIAL STATEMENTS — (Continued)
NOTE 15 — PREFERRED STOCK — (Continued)
The par value of Series B Preferred is $0.01 per share. Additional features of this preferred stock are as follows:
a. Conversion — The Series B Preferred is convertible at the option of the holder, or holders of at least two-thirds (66 2/3%) of the shares of Series B Preferred, into shares of the Company’s common stock upon written notice to convert all outstanding shares along with the aggregate accrued or accumulated and unpaid dividends into an aggregate number of shares of common stock determined by (i) multiplying the number of shares of Series B Preferred to be converted by the Series B Preferred liquidation preference (as defined) and then (ii) dividing the result by the conversion price in effect immediately prior to such conversion. The initial conversion price per share is $1,250. During 2015, 9,000 Series B Preferred shares were issued with a conversion price of $1,500. Advance notice of certain transactions that result in automatic conversion of the Series B Preferred into shares of common stock (as defined in the Certificate of Designation of the Series B Preferred) must be provided to the Series B Preferred holders 180 days in advance of closing such transactions.
b. Liquidation — In the event of liquidation, holders of Series B Preferred have preferential rights to liquidation payments over holders of common stock. Holders of Series B Preferred shall be paid out of the assets of the Company at an initial amount equal to $1,250 per share for 54,800 shared issued in 2014, 700 shares issued in February 2015 and $1,500 per share for 9,000 shares issued in July and August 2015 (adjusted for any stock splits, stock dividends, or recapitalizations).
c. Dividends — Holders of Series B Preferred are entitled to receive a 6% differential dividend right to holders of common stock. Dividends are cumulative and payable to the Series B Preferred shareholders on a quarterly basis when declared by the board. The Board declared quarterly dividends on the Series B Preferred of $18.75 per share on each of the following dates: February 28, 2015 paid on April 6, 2015; February 28, 2015 paid on July 7, 2015; May 20, 2015 paid on August 7, 2015; August 19, 2015 paid on October 9, 2015; November 18, 2015 paid on January 8, 2016; February 18, 2016 paid on April 8, 2016, April 14, 2016 paid on July 8, 2016; July 21, 2016 paid on October 7, 2016 and October 13, 2016. The Board declared a dividend on the Series B Preferred of $12.50 per share on February 21, 2017. Both the October 13, 2016 and February 21, 2017 dividends will be paid on February 27, 2017. As of December 31, 2016, accrued dividends of $1.2 million are recorded in accrued expenses and other liabilities.
d. Voting rights — The holders of shares of Series B Preferred shall vote, on an as-converted to common stock basis, together with the holders of common stock. The holders of at least two-thirds (66 2/3%) of the shares of Series B Preferred voting as a separate class must approve: certain amendments of corporate organizational documents, except the approval to change the number of authorized shares of common stock; creation or issue of any other security convertible or exercisable for any equity security of the Company having rights, preferences or privileges senior or pari passu to the Series B Preferred or increase the authorized number of shares of Series B Preferred; and pay any dividend on any capital stock of the Company other than on shares of Series B Preferred.
DASEKE, INC. AND SUBSIDIARIES
NOTES TO CONSOLIDATED FINANCIAL STATEMENTS — (Continued)
NOTE 16 — EARNINGS PER SHARE
Basic earnings per common share is calculated by dividing net income available to common stockholders by the weighted average number of shares of common stock outstanding during the period. Diluted earnings per share reflect the potential dilution that could occur if securities or other contracts to issue common stock were exercised or converted into common stock or resulted in the issuance of common stock that then shared in the Company’s earnings.
For the years ended December 31, 2016, 2015 and 2014, Series B Preferred Shares were not included in the computation of diluted earnings per share as their effects were anti-dilutive. The following table reconciles basic weighted average common stock outstanding to diluted weighted average common stock outstanding:
|
|
|
Year Ended December 31, |
| |||||||
|
|
|
2016 |
|
2015 |
|
2014 |
| |||
|
Numerator |
|
|
|
|
|
|
| |||
|
Net income (loss) |
|
$ |
(12,279 |
) |
$ |
3,263 |
|
$ |
1,300 |
|
|
Preferred stock dividends |
|
(4,770 |
) |
(4,736 |
) |
(1,028 |
) | |||
|
Net income (loss) available to common stockholders |
|
(17,049 |
) |
(1,473 |
) |
272 |
| |||
|
|
|
|
|
|
|
|
| |||
|
Denominator |
|
|
|
|
|
|
| |||
|
Basic weighted average common shares outstanding |
|
145,495 |
|
145,495 |
|
134,581 |
| |||
|
Effect of dilutive securities: |
|
|
|
|
|
|
| |||
|
Equivalent shares issuable upon exercises of warrants |
|
— |
|
— |
|
5,699 |
| |||
|
Denominator for diluted earnings per share — adjusted weighted average shares and assumed conversions |
|
145,495 |
|
145,495 |
|
140,280 |
| |||
|
|
|
|
|
|
|
|
| |||
|
Basic earnings (loss) per common share |
|
$ |
(117.18 |
) |
$ |
(10.13 |
) |
$ |
2.02 |
|
|
|
|
|
|
|
|
|
| |||
|
Diluted earnings (loss) per common share |
|
$ |
(117.18 |
) |
$ |
(10.13 |
) |
$ |
1.94 |
|
NOTE 17 — EMPLOYEE BENEFIT PLANS
Defined Contribution Plans
On January 1, 2015, the Company established the Daseke, Inc. 401(k) Retirement Plan (Retirement Plan) and merged six separate plans into the newly established plan. The Retirement Plan is a defined contribution plan and intended to qualify under ERISA provisions of 401(k). Under the safe harbor matching requirements, the Company had expenses of approximately $2.2 million and $1.3 million for the years ended December 31, 2016 and 2015, respectively. The Company sponsored defined contribution profit-sharing plans, including 401(k) provisions for substantially all employees of the Company and its subsidiaries prior to January 1, 2015 for the six plans merged and for plans not required to merge into the Retirement Plan until 2016. The Company provided matching contributions on some of these plans. Total contribution expenses under these plans were approximately $172,000 and $775,000 for the years ended December 31, 2015 and 2014, respectively.
DASEKE, INC. AND SUBSIDIARIES
NOTES TO CONSOLIDATED FINANCIAL STATEMENTS — (Continued)
NOTE 17 — EMPLOYEE BENEFIT PLANS — (Continued)
Defined Benefit Plan
Prior to the acquisition of BHE by the Company, BHE adopted a non-contributory defined benefit pension plan (the Pension Plan) covering substantially all employees of BHE hired prior to January 1, 2001. The Pension Plan was funded from Company contributions through amounts necessary to meet the minimum funding requirements as set forth in employee benefit and tax laws.
As part of the BHE acquisition, the Company’s defined benefit obligation was indemnified by the sellers of BHE. Employer contributions to the Pension Plan were funded by an escrow established on the date of acquisition. The Company recognized an indemnity asset of $4.2 million in connection with the acquisition of BHE. As of December 31, 2015, the Company’s indemnity asset was $4.5 million and was recorded in other long-term assets.
In June 2016, the Pension Benefit Guaranty Corporation (“PBGC”) approved the termination of the Pension Plan. In August 2016, the Pension Plan received a favorable determination letter from the IRS with regards to the Pension Plan, amendments and plan termination. The PBGC required funding and distribution of plan assets to participants by the end of 2016. On December 19, 2016, BHE finalized the termination of the Pension Plan. In accordance with the terms of the termination agreement, the Company contributed $3.2 million to the Pension Plan funded by the forgiveness of $1.7 million of debt owed under the BHE Subordinated Notes and a cash payment of $1.5 million to the Company from certain of the BHE sellers.
The following table sets forth a reconciliation of the projected benefit obligation and plan assets for the years ended December 31, 2016 and 2015 (in thousands):
|
|
|
2016 |
|
2015 |
| ||
|
|
|
|
|
|
| ||
|
Projected benefit obligation at beginning of period |
|
$ |
9,298 |
|
$ |
9,164 |
|
|
Service cost |
|
— |
|
452 |
| ||
|
Interest cost |
|
— |
|
154 |
| ||
|
Actuarial gain |
|
(1,282 |
) |
(472 |
) | ||
|
Plan termination |
|
(8,016 |
) |
— |
| ||
|
Projected benefit obligation at end of period |
|
— |
|
9,298 |
| ||
|
|
|
|
|
|
| ||
|
Fair value of plan assets at beginning of period |
|
4,798 |
|
4,995 |
| ||
|
Actual return on plan assets |
|
— |
|
(197 |
) | ||
|
Employer contributions |
|
3,218 |
|
— |
| ||
|
Distribution on plan termination |
|
(8,016 |
) |
— |
| ||
|
Fair value of plan assets at end of period |
|
— |
|
4,798 |
| ||
|
|
|
|
|
|
| ||
|
Underfunded status |
|
$ |
— |
|
$ |
(4,500 |
) |
DASEKE, INC. AND SUBSIDIARIES
NOTES TO CONSOLIDATED FINANCIAL STATEMENTS — (Continued)
NOTE 17 — EMPLOYEE BENEFIT PLANS — (Continued)
The Company had no required contributions to the Pension Plan for 2015.
Items recognized in the consolidated balance sheets at December 31, 2015 are as follows (in thousands):
|
Amounts recognized in: |
|
|
| |
|
Other long-term assets |
|
$ |
4,500 |
|
|
|
|
|
| |
|
Other long-term liabilities |
|
$ |
(4,500 |
) |
Net periodic benefit cost for the period from July 1, 2015 through December 31, 2015 includes the following components (in thousands):
|
Service cost |
|
$ |
340 |
|
|
Interest cost |
|
154 |
| |
|
Expected return on plan assets |
|
(162 |
) | |
|
Total net periodic benefit cost |
|
$ |
332 |
|
Actuarial assumptions utilized for the period ended December 31, 2015 are as follows:
|
|
|
2015 |
|
|
|
|
|
|
|
Discount rate — net periodic benefit cost |
|
4.14 |
% |
|
Expected long-term rate of return on plan assets |
|
5.00 |
% |
|
Rate of compensation / salary increase |
|
0.00 |
% |
Discount rates were determined based upon immediate annuity interest rates published by BCG Terminal Funding Company, one of the largest terminal funding consulting and placement firms in the U.S.
The asset allocations for the Pension Plan at December 31, 2015 are as follows. These assets were held by the Pension Plan and do not represent assets of the Company.
|
|
|
|
|
|
|
Fair Value Measurements |
| ||||||||||
|
December 31, 2015 |
|
Asset |
|
Asset |
|
Quoted Prices |
|
Significant |
|
Significant |
|
Total |
| ||||
|
Domestic equity securities |
|
6.9 |
% |
42 |
% |
$ |
331,690 |
|
$ |
— |
|
$ |
— |
|
$ |
331,690 |
|
|
Foreign equity securities |
|
7.6 |
% |
15 |
% |
363,142 |
|
— |
|
— |
|
363,142 |
| ||||
|
Corporate bonds |
|
28.1 |
% |
38 |
% |
1,350,446 |
|
— |
|
— |
|
1,350,446 |
| ||||
|
Cash and cash equivalents |
|
41.6 |
% |
5 |
% |
1,995,291 |
|
— |
|
— |
|
1,995,291 |
| ||||
|
Other |
|
15.8 |
% |
— |
|
757,734 |
|
— |
|
— |
|
757,734 |
| ||||
|
Total |
|
100 |
% |
100 |
% |
$ |
4,798,303 |
|
$ |
— |
|
$ |
— |
|
$ |
4,798,303 |
|
DASEKE, INC. AND SUBSIDIARIES
NOTES TO CONSOLIDATED FINANCIAL STATEMENTS — (Continued)
NOTE 17 — EMPLOYEE BENEFIT PLANS — (Continued)
The following is a description of the valuation methodologies for assets measured at fair value utilizing the fair value hierarchy discussed in Note 1.
Mutual funds, including equity and fixed income securities, real estate and commodities funds (Level 1): Public investment securities valued at the closing market price reported on the active market on which the public investment securities are traded.
The Company’s objective was to allocate assets in a manner that would maximize investment return while limiting, to the extent possible, investment volatility. The Company’s investment policy included various guidelines and procedures designed to ensure assets were invested in a manner necessary to meet expected future benefits earned by participants. The objectives of the target allocations were to maintain investment portfolios that diversify risk through prudent assets allocation parameters, achieve asset returns that meet or exceed the Pension Plan’s actuarial assumptions and achieve asset returns that were competitive with like institutions employing similar investment strategies.
Upon termination of the Pension Plan in December 2016, no future benefit payments are required.
NOTE 18 — INTEREST RATE SWAPS
The Company uses interest rate swaps to manage risks related to interest rate movements. These interest rate swaps are reported at fair value on the consolidated balance sheets in Accrued Expenses and Other Liabilities.
The Company entered into an interest rate swap agreement in 2013, which qualifies for hedge accounting and accordingly has been designated as a cash flow hedge. For this interest rate swap, the change in fair value on the effective portion of the hedge is recognized as a component of other comprehensive income. At December 31, 2016 and 2015, the fair value of this interest rate swap was a liability of $51,871 and $114,309, respectively. During the years ended December 31, 2016, 2015 and 2014 the change in fair value of this interest rate swap was an unrealized gain of $62,438, $33,420 and $46,456, respectively.
The terms of the interest rate swap designated as a cash flow hedge at December 31, 2016 is as follows:
|
Effective Date |
|
Notional Amount |
|
Termination Date |
|
Interest Rate |
|
Interest Rate |
| |
|
11/12/2013 |
|
$ |
12,000,000 |
|
4/30/2018 |
|
0.62 |
% |
3.63 |
% |
DASEKE, INC. AND SUBSIDIARIES
NOTES TO CONSOLIDATED FINANCIAL STATEMENTS — (Continued)
NOTE 18 — INTEREST RATE SWAPS — (Continued)
The Company had one interest rate swap that did not qualify for hedge accounting and accordingly was not designated as a cash flow hedge. For this interest rate swap, the change in fair value of the hedge was recognized as a component of interest expense. In conjunction with the August 2016 refinance of equipment notes discussed in Note 10, this interest rate swap was terminated. At December 31, 2015, the fair value of this interest rate swap was approximately $10,000.
The terms of the interest rate swap not designated as a cash flow hedge at December 31, 2015, that has been terminated during 2016 was as follows:
|
Effective Date |
|
Notional Amount |
|
Original |
|
Interest Rate |
|
Interest Rate |
| |
|
10/20/2011 |
|
$ |
1,064,177 |
|
10/15/2018 |
|
2.00 |
% |
3.55 |
% |
(1) — One month LIBOR (0.50% December 2015) plus the rate in table.
NOTE 19 — COMMITMENTS AND CONTINGENCIES
Operating Leases
The Company leases certain office building facilities, terminal locations and revenue equipment under non-cancelable operating leases. Certain of the Company’s operating lease agreements contain provisions for future rent increases, free rent periods or periods in which rent payments are reduced (abated). The total amount of rent payments due over the lease terms are charged to rent expense on the straight-line, undiscounted method over the lease terms. Rent expense under operating leases was $16.0 million, $11.2 million and $7.8 million for the years ended December 31, 2016, 2015 and 2014, respectively. Future minimum lease payments under non-cancelable operating leases, including related party leases, are as follows (in thousands):
|
Year ending December 31, |
|
Revenue |
|
Office and |
| ||
|
|
|
|
|
|
| ||
|
2017 |
|
$ |
14,024 |
|
$ |
2,039 |
|
|
2018 |
|
13,313 |
|
1,639 |
| ||
|
2019 |
|
10,043 |
|
1,501 |
| ||
|
2020 |
|
3,641 |
|
960 |
| ||
|
2021 |
|
510 |
|
667 |
| ||
|
Thereafter |
|
— |
|
2,247 |
| ||
|
Total |
|
$ |
41,531 |
|
$ |
9,053 |
|
Letters of Credit
The Company had outstanding letters of credit at December 31, 2016 totaling approximately $6.5 million, including those disclosed in Note 10. These letters of credit cover liability insurance claims.
Contingencies
The Company is involved in certain claims and pending litigation arising in the normal course of business. These proceedings primarily involve claims for personal injury or property damage incurred in the transportation of freight or for personnel matters. The Company maintains liability insurance to cover liabilities arising from these matters but is responsible to pay deductibles on such matters up to a certain threshold before the insurance is applied.
DASEKE, INC. AND SUBSIDIARIES
NOTES TO CONSOLIDATED FINANCIAL STATEMENTS — (Continued)
NOTE 20 — REPORTABLE SEGMENTS
The Company evaluates the performance of the segments primarily based on their respective revenues and operating income. Accordingly, interest expense and other non-operating items are not reported in segment results. In addition, the Company has disclosed a corporate segment, which is not an operating segment and includes acquisition transaction expenses, corporate salaries, interest expense and other corporate administrative expenses and intersegment eliminations.
The Company’s operating segments also provide transportation and related services for one another. Such services are generally billed at cost, and no profit is earned. Such intersegment revenues and expenses are eliminated in the Company’s consolidated results. Intersegment revenues and expenses totaled $2.2 million, $2.1 million and $1.6 million for the Flatbed Solutions segment for the years ended December 31, 2016, 2015 and 2014, respectively. Intersegment revenues and expenses totaled $2.4 million, $2.4 million and $0.9 million for the Specialized Solutions segment for the years ended December 31, 2016, 2015 and 2014, respectively.
The following table reflects certain financial data of the Company’s reportable segments for the years ended December 31, 2016, 2015 and 2014 (in thousands):
|
|
|
Flatbed |
|
Specialized |
|
Corporate/ |
|
Consolidated |
| ||||
|
|
|
Segment |
|
Segment |
|
Eliminations |
|
Totals |
| ||||
|
Year Ended December 31, 2016 |
|
|
|
|
|
|
|
|
| ||||
|
Total revenue |
|
$ |
310,440 |
|
$ |
345,998 |
|
$ |
(4,636 |
) |
$ |
651,802 |
|
|
Operating income (loss) |
|
15,643 |
|
16,278 |
|
(21,288 |
) |
10,633 |
| ||||
|
Depreciation |
|
28,523 |
|
32,820 |
|
156 |
|
61,499 |
| ||||
|
Amortization of intangible assets |
|
1,922 |
|
4,079 |
|
— |
|
6,001 |
| ||||
|
Income (loss) before income tax |
|
852 |
|
1,983 |
|
(14,951 |
) |
(12,116 |
) | ||||
|
Total assets |
|
283,370 |
|
282,156 |
|
4,709 |
|
570,235 |
| ||||
|
Capital expenditures |
|
18,427 |
|
21,926 |
|
215 |
|
40,568 |
| ||||
|
|
|
|
|
|
|
|
|
|
| ||||
|
Year Ended December 31, 2015 |
|
|
|
|
|
|
|
|
| ||||
|
Total revenue |
|
$ |
306,320 |
|
$ |
377,052 |
|
$ |
(4,527 |
) |
$ |
678,845 |
|
|
Operating income (loss) |
|
20,231 |
|
23,154 |
|
(12,377 |
) |
31,008 |
| ||||
|
Depreciation |
|
28,706 |
|
29,583 |
|
118 |
|
58,407 |
| ||||
|
Amortization of intangible assets |
|
1,570 |
|
3,596 |
|
— |
|
5,166 |
| ||||
|
Income (loss) before income tax |
|
9,393 |
|
11,649 |
|
(10,316 |
) |
10,726 |
| ||||
|
Total assets |
|
304,328 |
|
314,727 |
|
8,552 |
|
627,607 |
| ||||
|
Capital expenditures |
|
62,416 |
|
43,145 |
|
581 |
|
106,142 |
| ||||
|
|
|
|
|
|
|
|
|
|
| ||||
|
Year Ended December 31, 2014 |
|
|
|
|
|
|
|
|
| ||||
|
Total revenue |
|
$ |
322,527 |
|
$ |
222,589 |
|
$ |
(2,405 |
) |
$ |
542,711 |
|
|
Operating income (loss) |
|
13,175 |
|
13,665 |
|
(8,021 |
) |
18,819 |
| ||||
|
Depreciation |
|
28,446 |
|
16,622 |
|
50 |
|
45,118 |
| ||||
|
Amortization of intangible assets |
|
1,260 |
|
2,197 |
|
— |
|
3,457 |
| ||||
|
Income (loss) before income tax |
|
2,809 |
|
8,849 |
|
(8,574 |
) |
3,084 |
| ||||
|
Total assets |
|
240,728 |
|
267,949 |
|
4,668 |
|
513,345 |
| ||||
|
Capital expenditures |
|
44,884 |
|
30,398 |
|
290 |
|
75,572 |
| ||||
DASEKE, INC. AND SUBSIDIARIES
NOTES TO CONSOLIDATED FINANCIAL STATEMENTS — (Continued)
NOTE 21 — QUARTERLY RESULTS (UNAUDITED)
The following tables set forth certain unaudited consolidated quarterly financial data for each of the last eight quarters during our fiscal years ended December 31, 2016 and 2015. We have derived the information from unaudited Consolidated Financial Statements that, in the opinion of management, reflect all adjustments (consisting only of normal recurring adjustments) necessary for a fair presentation of such quarterly information. The operating results for any quarter are not necessarily indicative of the results to be expected for any future period.
|
|
|
2016 Quarter Ended |
| ||||||||||
|
|
|
Mar. 31 |
|
June 30 |
|
Sep. 30 |
|
Dec. 31 |
| ||||
|
|
|
(In thousands) |
| ||||||||||
|
Revenue: |
|
|
|
|
|
|
|
|
| ||||
|
Freight |
|
$ |
126,259 |
|
$ |
136,792 |
|
$ |
135,415 |
|
$ |
119,395 |
|
|
Brokerage |
|
20,604 |
|
21,778 |
|
25,977 |
|
19,051 |
| ||||
|
Fuel surcharge |
|
10,018 |
|
11,787 |
|
12,756 |
|
11,970 |
| ||||
|
Total revenue |
|
156,881 |
|
170,357 |
|
174,148 |
|
150,416 |
| ||||
|
Operating expenses: |
|
|
|
|
|
|
|
|
| ||||
|
Salaries, wages and employee benefits |
|
50,355 |
|
50,207 |
|
49,298 |
|
47,929 |
| ||||
|
Fuel |
|
14,497 |
|
17,283 |
|
17,296 |
|
17,789 |
| ||||
|
Operations and maintenance |
|
20,701 |
|
24,358 |
|
27,874 |
|
23,167 |
| ||||
|
Communications |
|
484 |
|
354 |
|
370 |
|
410 |
| ||||
|
Purchased freight |
|
36,775 |
|
41,185 |
|
42,541 |
|
33,553 |
| ||||
|
Administrative expense |
|
7,394 |
|
5,096 |
|
5,221 |
|
7,539 |
| ||||
|
Sales and marketing |
|
363 |
|
483 |
|
435 |
|
462 |
| ||||
|
Taxes and licenses |
|
2,333 |
|
2,345 |
|
2,268 |
|
2,276 |
| ||||
|
Insurance and claims |
|
4,041 |
|
4,542 |
|
5,065 |
|
5,466 |
| ||||
|
Acquisition transaction expenses |
|
15 |
|
3 |
|
— |
|
7 |
| ||||
|
Depreciation and amortization |
|
16,873 |
|
16,644 |
|
16,998 |
|
16,985 |
| ||||
|
Gain on disposition of equipment |
|
81 |
|
571 |
|
(495 |
) |
(273 |
) | ||||
|
Impairment |
|
— |
|
— |
|
1,195 |
|
810 |
| ||||
|
Total operating expenses |
|
153,912 |
|
163,071 |
|
168,066 |
|
156,120 |
| ||||
|
Total other expense |
|
5,258 |
|
5,301 |
|
6,656 |
|
5,534 |
| ||||
|
Provision (benefit) for income taxes |
|
(1,049 |
) |
974 |
|
683 |
|
(445 |
) | ||||
|
Net income (loss) |
|
(1,240 |
) |
1,011 |
|
(1,257 |
) |
(10,793 |
) | ||||
|
Less dividends to preferred stockholders |
|
(1,243 |
) |
(1,243 |
) |
(1,243 |
) |
(1,041 |
) | ||||
|
Net loss attributable to common stockholders |
|
$ |
(2,483 |
) |
$ |
(232 |
) |
$ |
(2,500 |
) |
$ |
(11,834 |
) |
DASEKE, INC. AND SUBSIDIARIES
NOTES TO CONSOLIDATED FINANCIAL STATEMENTS — (Continued)
NOTE 21 — QUARTERLY RESULTS (UNAUDITED) — (Continued)
|
|
|
2015 Quarter Ended |
| ||||||||||
|
|
|
Mar. 31 |
|
June 30 |
|
Sep. 30 |
|
Dec. 31 |
| ||||
|
|
|
(In thousands) |
| ||||||||||
|
Revenue: |
|
|
|
|
|
|
|
|
| ||||
|
Freight |
|
$ |
110,136 |
|
$ |
118,565 |
|
$ |
144,238 |
|
$ |
133,643 |
|
|
Brokerage |
|
22,739 |
|
25,882 |
|
30,733 |
|
29,546 |
| ||||
|
Fuel surcharge |
|
16,751 |
|
16,578 |
|
16,303 |
|
13,731 |
| ||||
|
Total revenue |
|
149,626 |
|
161,025 |
|
191,274 |
|
176,920 |
| ||||
|
Operating expenses: |
|
|
|
|
|
|
|
|
| ||||
|
Salaries, wages and employee benefits |
|
39,189 |
|
41,196 |
|
48,192 |
|
50,126 |
| ||||
|
Fuel |
|
17,394 |
|
18,643 |
|
18,313 |
|
15,946 |
| ||||
|
Operations and maintenance |
|
20,336 |
|
22,155 |
|
28,500 |
|
27,743 |
| ||||
|
Communications |
|
407 |
|
567 |
|
577 |
|
483 |
| ||||
|
Purchased freight |
|
40,961 |
|
44,758 |
|
50,527 |
|
45,739 |
| ||||
|
Administrative expense |
|
4,353 |
|
4,533 |
|
6,553 |
|
6,271 |
| ||||
|
Sales and marketing |
|
681 |
|
692 |
|
823 |
|
715 |
| ||||
|
Taxes and licenses |
|
2,152 |
|
2,143 |
|
2,388 |
|
2,545 |
| ||||
|
Insurance and claims |
|
5,178 |
|
3,996 |
|
4,983 |
|
5,498 |
| ||||
|
Acquisition transaction expenses |
|
3 |
|
167 |
|
611 |
|
411 |
| ||||
|
Depreciation and amortization |
|
14,460 |
|
14,714 |
|
16,719 |
|
17,680 |
| ||||
|
(Gain) loss on disposition of equipment |
|
(634 |
) |
(898 |
) |
(571 |
) |
(81 |
) | ||||
|
Total operating expenses |
|
144,480 |
|
152,666 |
|
177,615 |
|
173,076 |
| ||||
|
Total other expense |
|
4,704 |
|
4,598 |
|
5,363 |
|
5,617 |
| ||||
|
Provision (benefit) for income taxes |
|
256 |
|
2,181 |
|
6,054 |
|
(1,028 |
) | ||||
|
Net income (loss) |
|
186 |
|
1,580 |
|
2,242 |
|
(745 |
) | ||||
|
Less dividends to preferred stockholders |
|
(1,041 |
) |
(1,040 |
) |
(1,412 |
) |
(1,243 |
) | ||||
|
Net (loss)income available to common stockholders |
|
$ |
(855 |
) |
$ |
540 |
|
$ |
830 |
|
$ |
(1,988 |
) |
NOTE 22 — SUBSEQUENT EVENTS
Subsequent to December 31, 2016, the Company completed the merger with Hennessy Capital Acquisition Corp II. See Note 3 for additional information.
Subsequent events have been evaluated through March 16, 2017, the date the consolidated financial statements were available to be issued.