Attached files
| file | filename |
|---|---|
| 8-K - HIGHLANDS BANKSHARES INC /VA/ | hbiform8k03152017.htm |
Exhibit 99.1

OTCQX BanksInvestor Conference March 15, 2017

This presentation contains forward-looking statements, as defined by federal securities laws, including statements about Highlands and its financial outlook. These statements are based on management's current expectations and are provided to assist investors in understanding our operations and business outlook. Highlands' operations involve risks and uncertainties that may cause actual results to differ materially from those expressed or implied in forward-looking statements. For a discussion of some of the risks and other factors that may cause such forward-looking statements to differ materially from actual results, please refer to Highlands Bankshares, Inc.’s filings with the Securities and Exchange Commission, including its 2015 Annual Report on Form 10-K and its most recent quarterly report on Form 10-Q under the sections entitled “Forward-Looking Statements.” Forward-looking statements relate only to the date they are made. Highlands undertakes no obligation to update or revise forward-looking statements. hubank.com | 2 Forward-Looking Statements

3 hubank.com | Snapshot of Highlands Bankshares Market Data Ticker HLND Price (as of 3/09/2017) $6.65 Market Cap $54.5MM P/E NM P/BV1 127% Avg. Daily Vol. (30d) 1,250 Insider Ownership 16.3% Institutional Ownership 42.7% Fourth Quarter 2016 Assets $612.7MM Loans $409.7MM Deposits $489.9MM Common Equity $46.4MM Preferred Equity $7.3MM Equity / Assets 8.9% Total Risk Based Capital 13.0% Past Due Loans / Loans 1.87% Nonperforming Assets / Loans & OREO 1.64% Earnings per Share $0.02 Return on Assets 0.10% Return on Equity 1.14% Founded in 198515 financial services centers2 mortgage officesPrivate business/owner, professional, and entrepreneur focusShareholder-friendly management 1 Calculated using the conversion impact of HLND's preferred equity.

Originated in response to local consolidationFavorable market reception led to early success in both profitability and growthExpanded out of market without prior out of market experience or contactsFollowing expansion, profitability and growth declined below industry averagesOver time, shareholder returns suffered Little operational improvement leading to continued financial stressAdditional procedural and control issues identified resulting in prolonged Written AgreementNew CEO with turnaround and high performing bank experience hired in November 2015Significant progress achieved in stabilizing Highlands and transforming to a focused, shareholder-friendly company Pre-Crisis hubank.com | 4 History Crisis Post-Crisis Experienced severe credit related costs due to poor underwriting and credit risk managementEarnings and capital stressed due to elevated credit costs and higher operating expensesEntered into a Written AgreementIssued equity shoring up capital levels and significantly diluting shareholders
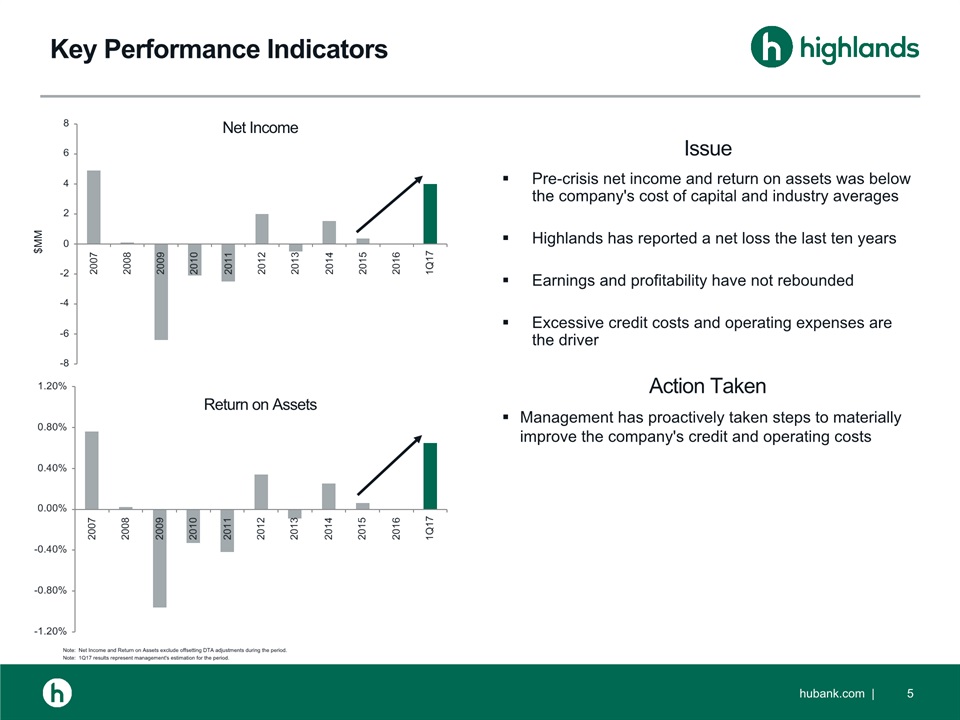
Net Income Note: Net Income and Return on Assets exclude offsetting DTA adjustments during the period.Note: 1Q17 results represent management's estimation for the period. hubank.com | 5 Key Performance Indicators Return on Assets $MM Pre-crisis net income and return on assets was below the company's cost of capital and industry averagesHighlands has reported a net loss the last ten yearsEarnings and profitability have not reboundedExcessive credit costs and operating expenses are the driver Issue Management has proactively taken steps to materially improve the company's credit and operating costs Action Taken

Note: 1Q17 results represent management's estimation for the period. hubank.com | 6 Key Performance Indicators Past Due Loans NPAs / Loans and OREO Pre-crisis past dues and credit related costs were more than double industry averagesApproval criteria was outside the industry normConcentrations in lower risk adjusted return categoriesLax collection culture and no collection process Issue Hired new Chief Credit Officer, Collections Manager, and Special Assets ManagerActively managed troubled and past due creditsReviewed portfolio for weak pass creditsReviewed and amended credit policy to industry normsOutsourced loan review Action Taken

Efficiency Ratio Note: 1Q17 results represent management's estimation for the period. hubank.com | 7 Key Performance Indicators Assets per Employee Pre-crisis efficiency ratio was higher than industry averagesStaffing levels were not monitored or managed to workload creating a low Assets per Employee ratioContracts were not marketed or renegotiated Issue Benchmarked staffing levels to other banks our size by department and workload2016 net income included nonrecurring severance expense related to associated staff reductionsBidding all major contracts (annual, recurring savings):Health insurance - $500,000 ATM/Debit card processing - $400,000 Data lines - $250,000Internal Audit - $140,000 Janitorial and trash collection - $120,000 P&C insurance - $100,000 Action Taken

hubank.com | 8 Management Team Title Major Experience Years inBanking Years atHLND Ray Skinner Chief Banking Officer American Savings, National Commerce 27 1 Kevin Pack CEO - Highlands Home Mortgage National Commerce 25 1 Brian Lowery Chief Credit Officer National Commerce 28 1 Vicki Andrews EVP Bank Operations National Commerce 34 1 Bryan Booher EVP Loan Operations BB&T, Highlands 25 13 Jim Edmondson Chief Financial Officer Highlands 31 20 Rusty Little Chief Risk Officer Highlands 25 25 Tim Schools joined Highlands in November 2015 as Chief Executive Officer and a Director. He is leading the execution of the company's strategic plan and effort to improve financial performance. Previously, he served as President of $7 billion American Savings Bank where over a three year period he led its highly successful transformation from an 82 year old thrift to a full service bank. With the assistance of six former National Commerce teammates, ASB: remediated a preexisting Cease and Desist Order, improved pretax preprovision income $38 million or 45%, enhanced its return on assets from 65 bps to 130 bps, increased its leverage ratio from 7.7% to 9.3% while at the same time providing a special one-time dividend to shareholders of $55 million, and created a dynamic culture that earned ASB a reputation as one of the best companies to work for. Schools began his banking career at National Commerce and SouthTrust.
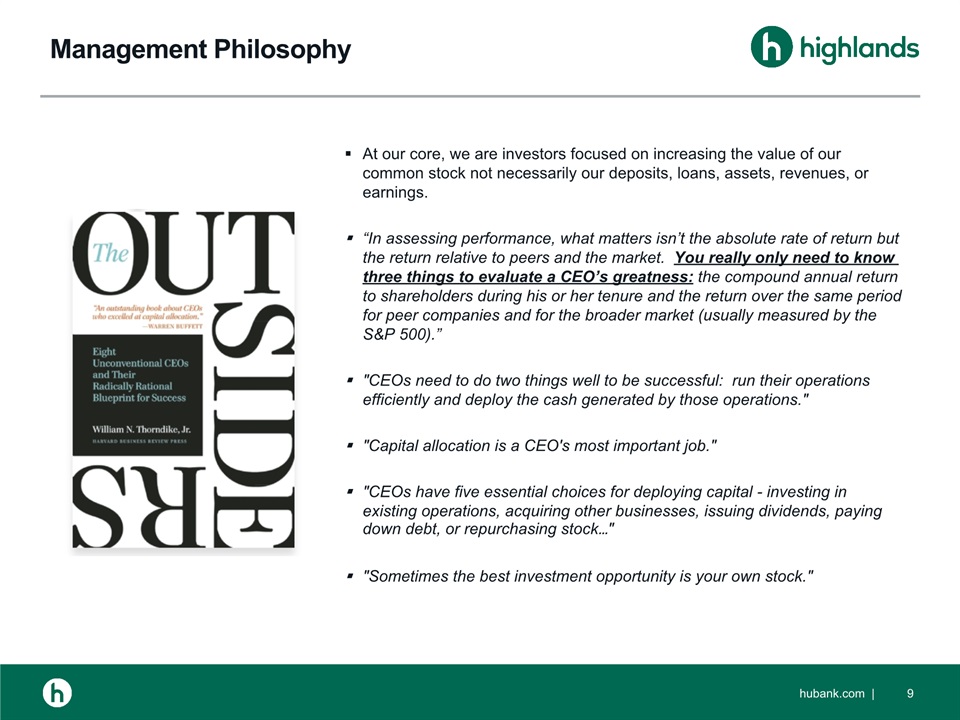
At our core, we are investors focused on increasing the value of our common stock not necessarily our deposits, loans, assets, revenues, or earnings.“In assessing performance, what matters isn’t the absolute rate of return but the return relative to peers and the market. You really only need to know three things to evaluate a CEO’s greatness: the compound annual return to shareholders during his or her tenure and the return over the same period for peer companies and for the broader market (usually measured by the S&P 500).”"CEOs need to do two things well to be successful: run their operations efficiently and deploy the cash generated by those operations.""Capital allocation is a CEO's most important job.""CEOs have five essential choices for deploying capital - investing in existing operations, acquiring other businesses, issuing dividends, paying down debt, or repurchasing stock…""Sometimes the best investment opportunity is your own stock." hubank.com | 9 Management Philosophy

Target Customer Small to mid-sized private businessesTheir owners and managementProfessionalsOther individuals Strategy Provide a differentiated, relationship-based, and highly personal banking experienceSeek low cost deposits and ancillary deposit servicesOperate with industry leading efficiencyInvest/lend prudently never sacrificing risk adjusted spreads for balance or earnings growth Delivery Focus on where we can find the best people; not filling in a geographic mapAttract and retain "best in breed" employees; hire better and manage lessLimit bricks and mortar to strategically located business-oriented officesApply technology strategically to provide a wow employee and customer experience Goals Outstanding customer serviceDisciplined capital allocationHigh returns on capitalStable and growing earnings per share hubank.com | 10 Business Model Simple, Focused, and Disciplined
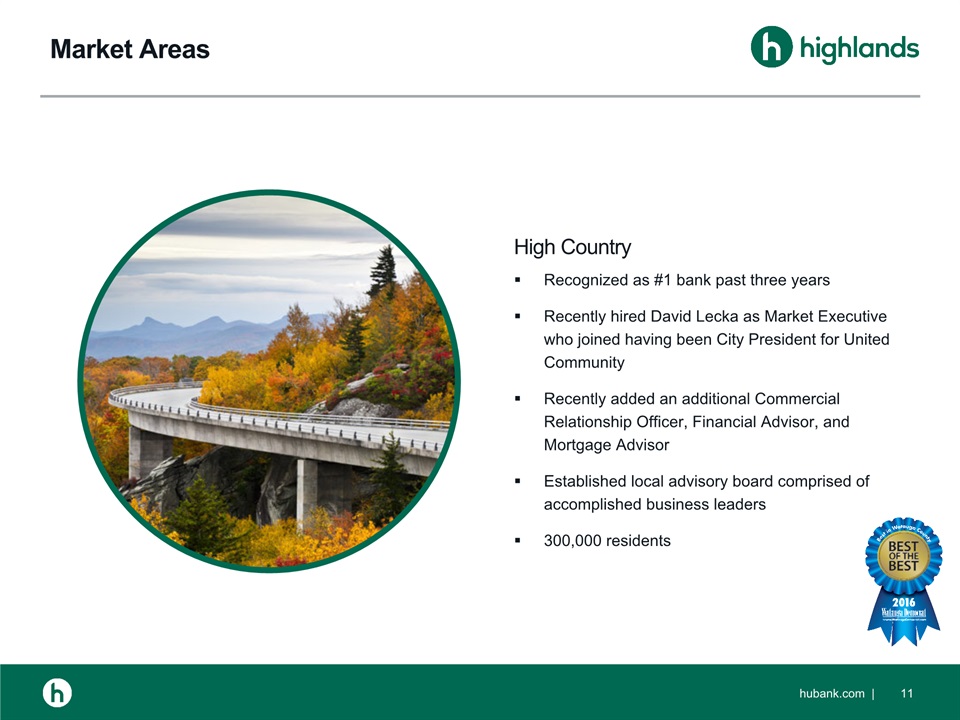
Recognized as #1 bank past three yearsRecently hired David Lecka as Market Executive who joined having been City President for United CommunityRecently added an additional Commercial Relationship Officer, Financial Advisor, and Mortgage AdvisorEstablished local advisory board comprised of accomplished business leaders300,000 residents High Country hubank.com | 11 Market Areas

Knoxville hubank.com | 12 Market Areas Recently hired Amy Pangelinan as Market Executive who joined having been a Commercial Relationship Officer at Atlantic Capital, Pinnacle, and BB&TEntered the market a decade ago with no brand recognition or contacts so limited success to dateRecently "redenovoed" recruiting well recognized names in the marketEstablished local advisory board comprised of accomplished business leaders1.1 million residents – 3rd largest area in TN

Southwest Virginia hubank.com | 13 Market Areas #1 deposit market share and recognized as #1 bank in Smyth CountyMark Farris serves as Market Executive and is a career Highlands employeeRecently added a Branch Manager and Personal Banker from Wells Fargo - the largest single branch in the areaEstablished local advisory board comprised of accomplished business leaders120,000 residents

Recognized as #1 bank in Bristol marketRecently hired Mike Hill as Market Executive who joined having been First Citizens' Market ExecutiveRecently added an additional Commercial Relationship Officer and Financial AdvisorEstablished local advisory board comprised of accomplished business leaders500,000 residents – 5th largest area in TN Tri-Cities hubank.com | 14 Market Areas

hubank.com | 15 HLND Trading Comps Banks headquartered in NC, SC, TN, and VA between $400MM and $1B in assets, equity/assets between 8 - 10.5%, nonperforming assets/assets < 1%, and return on assets > 0.50% Note: Market data as of March 2, 2017.Note: HLND data is management's estimation of 2017 earnings; Price to BV calculated using the conversion impact of HLND's preferred equity.Data Source: SNL Financial

hubank.com | 16 HLND Investment Thesis Quality ManagementNew management team comprised principally from the former National CommerceAdding three new board members with successful CEO/COO value creation experienceInsiders own 16.3% of the companyShareholder-friendly culture committed to prudent capital allocationIndustry Leading Operational ExperienceNational Commerce and SouthTrust maintained top decile financial performance for over twenty yearsCEO and CBO led highly successful transformation of American SavingsHighlands' operating metrics approaching median to top quartile performance in only a 12 month periodRepeatable Investment OpportunitiesWell networked management team providing numerous lift out opportunities for consolidated regional bank employees across the Southeast who value a higher touch and more entrepreneurial cultureExtensive experience in creating significant shareholder value from underperforming banks providing acquisition opportunities others might not find appealing or might not be as successful withAttractive ValuationMarket value to intrinsic value gap as operating metrics and growth prospects have materially improved and are approaching peer median to top quartile levels while Highlands' valuation lags these groups 30% – 60% for an equivalent price of $8.65 – $10.65

hubank.com

Appendix hubank.com | 18

hubank.com | * Balance Sheet Mix
hubank.com | 19 Balance Sheet Mix

hubank.com | 20 Loan Mix 4Q15 1Q16 2Q16 3Q16 4Q16 Commercial / Agricultural 6.2 6.1 5.9 5.6 5.6 Commercial / Real Estate 18.1 17.1 16.7 16.7 16.5 Total Commercial 24.3 23.2 22.6 22.4 22.1 1-4 Family 36.9 37.1 36.8 36.3 35.3 HELOC 1.0 1.0 1.0 1.1 2.2 Construction / Land / Farmland 5.0 4.9 4.8 4.9 4.6 Other Consumer 3.4 3.3 3.3 3.0 2.9 Total Consumer 46.2 46.3 45.8 45.3 45.0 Total Loans 70.5% 69.5% 68.4% 67.7% 67.0% Percentage of Average Assets

hubank.com | 21 Customer Funding Mix Percentage of Average Assets 4Q15 1Q16 2Q16 3Q16 4Q16 Noninterest Bearing 21.1 20.9 20.1 21.9 22.2 Interest Bearing 7.7 7.5 7.5 8.3 8.3 Total Checking 28.8 28.4 27.6 30.2 30.5 MMA 11.8 11.8 11.5 11.4 11.9 Savings 14.6 15.0 15.0 14.9 14.8 Total Core Deposits 55.2 55.2 53.7 56.5 57.2 CDs 25.4 24.6 24.3 24.0 22.9 Total Customer Funding 80.6% 80.0% 78.0% 80.5% 80.1%