Attached files
| file | filename |
|---|---|
| 8-K - HAWTHORN BANCSHARES, INC. | form8k-03152017_120306.htm |
Exhibit 99.1
Hawthorn Bancshares Reports 2016 Financial Results
Jefferson City, Mo. — March 15, 2017 — Hawthorn Bancshares Inc. (NASDAQ: HWBK), today reported consolidated financial results for the Company for the year ended December 31, 2016.
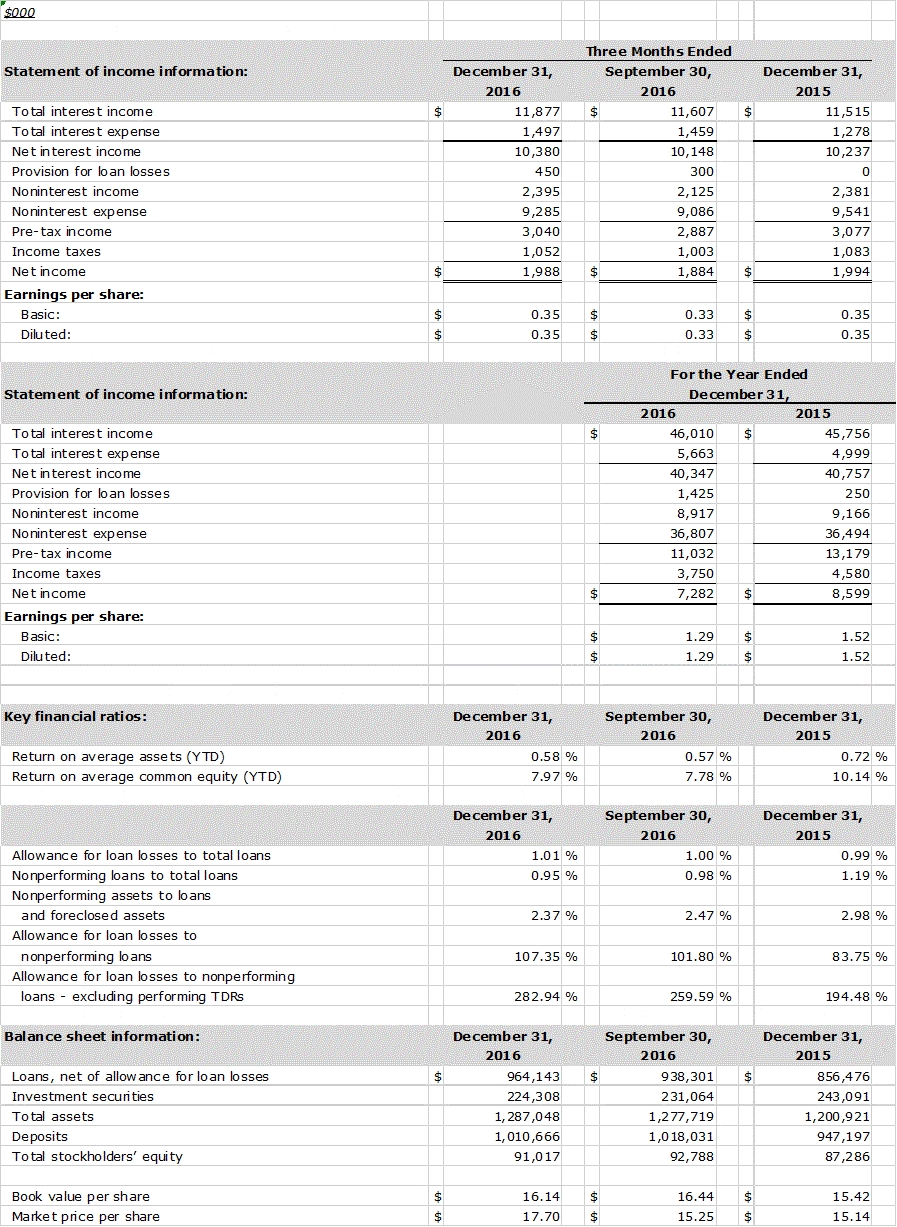
Net income for the current year was $7.3 million, or $1.29 per diluted common share, compared to $8.6 million, or $1.52 per diluted common share, for 2015.
The return on average common equity was 7.97% and the return on average assets was 0.58% for the current year compared to 10.14% and 0.72% for the prior year, respectively.
Commenting on earnings performance, Chairman David T. Turner said, “Hawthorn reported solid earnings for the current year in spite of a significant increase in the provision for loan losses from the prior year resulting primarily from growth in our loan portfolio. Loans increased $109 million, or 12.6%, from the prior year end and increased $51 million, or 5.9%, on average from the prior year. Our current year net interest margin remained strong at 3.47%, exceeding peers, while net interest income was $40.3 million, a slight decrease from the prior year. This decrease in net interest income is primarily attributable to the favorable impact of recoveries of nonaccrual interest from several problem loan relationships resolved during the prior year. Non-interest income of $8.9 million for the current year was $0.3 million below the prior year mostly due to decreased combined income from servicing and gains on sales of residential mortgage loans of $0.8 million partially offset by securities gains of $0.6 million. Non-interest expense of $36.8 million was $0.3 million higher than the prior year mostly due to a $0.6 million increase in real estate foreclosure expenses, partially offset by a $0.3 million decrease in FDIC assessment expense.”
Net Interest Income
Net interest income for the year ended December 31, 2016 was $40.3 million compared to $40.8 million for the prior year. Although loans at December 31, 2016 totaled $974.0 million, an increase of $108.9 million, or 12.6%, from outstanding loans of $865.1 million at December 31, 2015, approximately $1.1 million was recognized in interest income during 2015 as a result of recovering nonaccrual interest from resolving several problem loan relationships. This contributed to the decrease in net interest income and was a major cause of the decrease in the net interest margin to 3.47% for 2016 compared to 3.69% for 2015.
Non-Interest Income and Expense
Non-interest income for the year ended December 31, 2016 was $8.9 million compared to $9.2 million for the prior year ended December 31, 2015. The $0.3 million decrease from the prior year was primarily due to a $0.8 million decrease in combined real estate servicing and mortgage loan sales income resulting from decreased financing activity in the housing market during the current year, partially offset by securities gains of $0.6 million recognized for the year ended December 31, 2016.
1
Non-interest expense was $36.8 million for the year ended December 31, 2016 compared to $36.5 million for the prior year. Real estate foreclosure expense increased $0.6 million during the current year primarily due to net expense for foreclosed properties recognized in 2016 of $0.4 million compared to net gains of $0.2 million during 2015. Offsetting this increase was a decrease in FDIC assessment expense of $0.3 million, or 34.6%, due to lower assessment rates charged during 2016.
Allowance for Loan Losses
The Company’s level of non-performing loans continued to improve during the current year to 0.95% of total loans at December 31, 2016, compared to 1.19% at December 31, 2015. During the year ended December 31, 2016, the Company recorded net charge-offs of $143,000, or 0.02% of average loans, compared to net charge-offs of $745,000, or 0.09% of average loans for the year ended December 31, 2015. The decrease from the prior year was primarily due to charge-offs decreasing $900,000 while recoveries decreased only $298,000. The allowance for loan losses at December 31, 2016 was $9.9 million, or 1.01% of outstanding loans, 107.35% of non-performing loans and 282.94% of nonperforming loans when excluding accruing TDR’s. At December 31, 2015, the allowance for loan losses was $8.6 million, or 0.99% of outstanding loans, 83.75% of non-performing loans and 194.48% of nonperforming loans when excluding accruing TDR’s. The allowance for loan losses represents management’s best estimate of probable losses inherent in the loan portfolio and is commensurate with risks in the loan portfolio as of December 31, 2016.
Financial Condition
Comparing December 31, 2016 balances with December 31, 2015, total assets increased $86.1 million to $1.3 billion. The largest driver in asset growth was the increase in loans of $108.9 million, or 12.6%. Total deposits increased $63.5 million to $1.0 billion and FHLB advances increased $42.9 million to $92.9 million at December 31, 2016. During the same period, stockholders’ equity increased 4.3% to $91.0 million, or 7.1% of total assets. The total risk based capital ratio of 13.72% and the leverage ratio of 9.87% at December 31, 2016, respectively, far exceed minimum regulatory requirements of 8.00% and 4.00%, respectively.
[Tables follow]
2
About Hawthorn Bancshares
Hawthorn Bancshares, Inc., a financial-bank holding company headquartered in Jefferson City, Missouri, is the parent company of Hawthorn Bank of Jefferson City with locations in the Missouri communities of Lee's Summit, Liberty, Springfield, Branson, Independence, Columbia, Clinton, Windsor, Osceola, Warsaw, Belton, Drexel, Harrisonville, California and St. Robert.
Contact:
Bruce Phelps
Chief Financial Officer
TEL: 573.761.6100 FAX: 573.761.6272
www.HawthornBancshares.com
Statements made in this press release that suggest Hawthorn Bancshares' or management's intentions, hopes, beliefs, expectations, or predictions of the future include "forward-looking statements" within the meaning of Section 21E of the Securities and Exchange Act of 1934, as amended. It is important to note that actual results could differ materially from those projected in such forward-looking statements. Additional information concerning factors that could cause actual results to differ materially from those projected in such forward-looking statements is contained from time to time in the company's quarterly and annual reports filed with the Securities and Exchange Commission.
3