Attached files
| file | filename |
|---|---|
| 10-K - 10-K - CIVISTA BANCSHARES, INC. | d484526d10k.htm |
| EX-4.6 - EX-4.6 - CIVISTA BANCSHARES, INC. | d484526dex46.htm |
| EX-32.2 - EX-32.2 - CIVISTA BANCSHARES, INC. | d484526dex322.htm |
| EX-23.1 - EX-23.1 - CIVISTA BANCSHARES, INC. | d484526dex231.htm |
| EX-31.1 - EX-31.1 - CIVISTA BANCSHARES, INC. | d484526dex311.htm |
| EX-32.1 - EX-32.1 - CIVISTA BANCSHARES, INC. | d484526dex321.htm |
| EX-21.1 - EX-21.1 - CIVISTA BANCSHARES, INC. | d484526dex211.htm |
| EX-31.2 - EX-31.2 - CIVISTA BANCSHARES, INC. | d484526dex312.htm |
Exhibit 13.1
Dear Shareholders:
In last year’s report we offered that we were looking with optimism at 2016. Apparently we were correct in our optimism and enjoyed a record year. Our earnings for 2016 were $15,716,000 or $1.57 diluted per share. This is a per share increase of 34% over 2015 earnings of $11,168,000 or $1.17 diluted per share. We are continuing our steady progression of generating earnings and building the value of this corporation. You can see on the chart this steady progression:
| 2016 | 2015 | 2014 | 2013 | 2012 | ||||||||||||||||
| Net earnings per share (basic) |
$ | 1.96 | $ | 1.43 | $ | 0.99 | $ | 0.65 | $ | 0.57 | ||||||||||
| Net earnings per share (diluted) |
$ | 1.57 | $ | 1.17 | $ | 0.85 | $ | 0.64 | $ | 0.57 | ||||||||||
The results for the year did include principal and interest recovery on a loan charged down during the recession. The impact of this recovery on diluted net earnings per share was approximately $0.13. The net result would be approximately $1.44 diluted earnings per share versus our reported $1.57. Still a respectable increase over 2015.
The core business model for community banking is pretty simple. We gather deposits and make loans. Our primary source of deposits lies in our legacy markets. We can supplement those deposits with inexpensive borrowings and we have had great success in gathering noninterest-bearing commercial deposits in our urban locations. We grew deposits approximately 6.6% from year end 2015 to year end 2016. The key item to note is the growth in the noninterest-bearing. In 2012 noninterest-bearing deposits made up 21.9% of total deposits. At the end of 2016, this number was 30.8%. This is key in maintaining a strong net interest margin. Our net interest margin for 2016 was 3.93%. The median of a Midwest peer group we follow was 3.29% for 2016. This 64 basis point advantage on over a billion dollars in earning assets is significant and points to the importance of our deposit structure.
| (In thousands) | 2016 | 2015 | 2014 | 2013 | 2012 | |||||||||||||||
| Noninterest bearing deposits |
$ | 345,588 | $ | 300,615 | $ | 250,701 | $ | 234,976 | $ | 202,416 | ||||||||||
| Interest bearing deposits |
775,515 | 751,418 | 718,217 | 707,499 | 723,973 | |||||||||||||||
|
|
|
|
|
|
|
|
|
|
|
|||||||||||
| Total |
$ | 1,121,103 | $ | 1,052,033 | $ | 968,918 | $ | 942,475 | $ | 926,389 | ||||||||||
Putting these deposits to work, we increased the loan portfolio by $53,979,000, or 5.4%. Of course, we receive regular payments on loans and lines of credit are very active. To generate a net growth of $53,979,000, our gross production of loans was approximately $403,000,000. In addition we sold approximately $68,000,000 in residential real estate mortgages. Again, we sell these mortgages as we don’t want 30 year fixed rate mortgages on the books when rates are at an all-time low.
| (In thousands) | 2016 | 2015 | 2014 | 2013 | 2012 | |||||||||||||||
| Gross Loans |
$ | 1,055,506 | $ | 1,001,527 | $ | 914,857 | $ | 861,241 | $ | 815,553 | ||||||||||
With limited loan demand in our legacy markets, the bulk of new loan activity is primarily in our urban locations – Columbus, Cleveland, Akron, and Dayton. The economy in these areas has continued to be robust and provides lending opportunities. That said, the Ohio lending markets are very competitive. Within this competitive environment, we are pleased with our 5.4% growth. It would be very easy to expand that number, but we have remained disciplined with regard to loan structure – collateral, rates, terms, guarantors, etc. It’s the prudent thing to do.
Looking at the components of earnings on a per share basis, our net interest income (what we earn gathering deposits and making loans) was $6.27. This was up from $6.06 in 2015. With interest margin stable, the increase in this number was driven by growth. Growth in loans and growth in non-interest bearing deposits.
| 2016 | 2015 | 2014 | 2013 | 2012 | ||||||||||||||||
| Net interest income per share (basic) |
$ | 6.27 | $ | 6.06 | $ | 5.43 | $ | 5.19 | $ | 5.26 | ||||||||||
We supplement our net interest income with fee and service charge type income. On a per share basis, this increased from $1.83 in 2015 to $2.01 for 2016. Contributing to this increase was a $644,000 increase in fees from the sale of mortgages and a $750,000 increase in our revenue from the tax refund processing program.
| 2016 | 2015 | 2014 | 2013 | 2012 | ||||||||||||||||
| Noninterest income per share (basic) |
$ | 2.01 | $ | 1.83 | $ | 1.80 | $ | 1.56 | $ | 1.45 | ||||||||||
On a per share basis our noninterest expenses – salaries, occupancy, data processing, marketing, etc., was down slightly from 2015. In absolute dollars the total noninterest expenses were up 2.1%, which we were pleased with. It confirms we have been able to grow the company with only modest increases in expense.
| 2016 | 2015 | 2014 | 2013 | 2012 | ||||||||||||||||
| Noninterest expense per share (basic) |
$ | 5.47 | $ | 5.49 | $ | 5.39 | $ | 5.63 | $ | 4.94 | ||||||||||
A final component is the dollars we take from earnings and place into the reserve for loan loss. With continuing improvement in our loan portfolio and a large recovery of $1,300,000 on a loan charged down during the recession, we actually had a negative provision.
| 2016 | 2015 | 2014 | 2013 | 2012 | ||||||||||||||||
| Loan loss provision (credit) per share (basic) |
$ | (0.16 | ) | $ | 0.15 | $ | 0.19 | $ | 0.14 | $ | 0.83 | |||||||||
In 2016, we put to work the projects we began in 2015. The rebranding of Citizens into Civista, a full year of our Dayton operation, a full year of our Mayfield Heights operation, expansion of our tax refund processing operation have all contributed to the success of 2016. These items were but tools that allow us to push for prudent growth. Our performance of the last several years proves that growth is the key for continued success of the Company.
Looking at 2017 and beyond, we have recently opened a loan production office in Westlake, Ohio, near the Crocker Park area to service the west side of the Cleveland market. We have also added seasoned lending staff in the Toledo, Ohio market and will look for loan production opportunities in that area. We are now operating in 4 of the largest 5 SMA’s in Ohio. The key is attracting experienced lenders with strong relationship management skills who can bring in business. We believe that the combination of selective additions of loan production facilities plus the strength of our legacy markets will provide continuing opportunity for organic growth of the Company. However, to significantly grow the Company and generate high levels of performance, we believe that acquisition must be part of the growth strategy. As you may know by now through public notifications, we recently went to the public markets and successfully raised approximately $35,000,000 in common equity capital. As we stated in the past, we knew that additional capital would be required to significantly grow the Company, but we wanted to choose an opportune time to do so. One of the considerations was our trading price. Looking at our year end closing price of $19.43 on the chart below, we traded at 179% of tangible book value. This was a much better position than any of the prior year ends.
| 2016 | 2015 | 2014 | 2013 | 2012 | ||||||||||||||||
| End-of-year stock price |
$ | 19.43 | $ | 12.83 | $ | 10.28 | $ | 6.52 | $ | 5.25 | ||||||||||
In light of increased value of our common shares, the state of the equity markets, the availability of reasonably priced capital, and the view that mergers and acquisitions are going to accelerate – it was time for us to make the move to raise capital. We completed this offering on February 24, 2016, and received a price of $21.75 per share.
This additional capital provides Civista the flexibility to provide additional capital support for loan growth and to be prepared for potential acquisition opportunities.
As always, this is your company. Please read and consider the proxy included in this mailing. I hope to see you at the annual meeting.
| Very truly yours, |

|
| James O. Miller |
| Chairman, President & C.E.O. |
This page left blank intentionally.
ANNUAL REPORT
CONTENTS
| Five –Year Selected Consolidated Financial Data |
1 | |||
| Common Stock and Shareholder Matters |
3 | |||
| General Development of Business |
4 | |||
| Management’s Discussion and Analysis of Financial Condition and Results of Operations |
4 | |||
| Quantitative and Qualitative Disclosures about Market Risk |
20 | |||
| Financial Statements |
||||
| Management’s Report on Internal Control over Financial Reporting |
24 | |||
| Report of Independent Registered Public Accounting Firm on Internal Control Over Financial Statements |
25 | |||
| Report of Independent Registered Public Accounting Firm on Financial Statements |
26 | |||
| Consolidated Balance Sheets |
28 | |||
| Consolidated Statements of Operations |
29 | |||
| Consolidated Comprehensive Income Statements |
30 | |||
| Consolidated Statements of Changes in Shareholders’ Equity |
31 | |||
| Consolidated Statements of Cash Flow |
32 | |||
| Notes to Consolidated Financial Statements |
34 | |||
This page left blank intentionally.
Five-Year Selected Consolidated Financial Data
(Amounts in thousands, except per share data)
| Year ended December 31, | ||||||||||||||||||||
| 2016 | 2015 | 2014 | 2013 | 2012 | ||||||||||||||||
| Statements of income: |
||||||||||||||||||||
| Total interest and dividend income |
$ | 53,567 | $ | 50,701 | $ | 45,970 | $ | 44,881 | $ | 46,762 | ||||||||||
| Total interest expense |
3,308 | 3,309 | 4,104 | 4,907 | 6,184 | |||||||||||||||
|
|
|
|
|
|
|
|
|
|
|
|||||||||||
| Net interest income |
50,259 | 47,392 | 41,866 | 39,974 | 40,578 | |||||||||||||||
| Provision (credit) for loan losses |
(1,300 | ) | 1,200 | 1,500 | 1,100 | 6,400 | ||||||||||||||
|
|
|
|
|
|
|
|
|
|
|
|||||||||||
| Net interest income after provision for loan losses |
51,559 | 46,192 | 40,366 | 38,874 | 34,178 | |||||||||||||||
| Security gains/(losses) |
19 | (18 | ) | 113 | 204 | 40 | ||||||||||||||
| Other noninterest income |
16,113 | 14,296 | 13,761 | 11,858 | 11,160 | |||||||||||||||
|
|
|
|
|
|
|
|
|
|
|
|||||||||||
| Total noninterest income |
16,132 | 14,278 | 13,874 | 12,062 | 11,200 | |||||||||||||||
| Total noninterest expense |
43,855 | 42,944 | 41,550 | 43,384 | 38,074 | |||||||||||||||
|
|
|
|
|
|
|
|
|
|
|
|||||||||||
| Income before federal income taxes |
23,836 | 17,526 | 12,690 | 7,552 | 7,304 | |||||||||||||||
| Federal income tax expense |
6,619 | 4,781 | 3,162 | 1,373 | 1,725 | |||||||||||||||
|
|
|
|
|
|
|
|
|
|
|
|||||||||||
| Net income |
$ | 17,217 | $ | 12,745 | $ | 9,528 | $ | 6,179 | $ | 5,579 | ||||||||||
|
|
|
|
|
|
|
|
|
|
|
|||||||||||
| Preferred stock dividends and discount accretion |
1,501 | 1,577 | 1,873 | 1,159 | 1,193 | |||||||||||||||
|
|
|
|
|
|
|
|
|
|
|
|||||||||||
| Net income available to common shareholders |
$ | 15,716 | $ | 11,168 | $ | 7,655 | $ | 5,020 | $ | 4,386 | ||||||||||
|
|
|
|
|
|
|
|
|
|
|
|||||||||||
| Per common share earnings: |
||||||||||||||||||||
| Available to common shareholders (basic) |
1.96 | 1.43 | 0.99 | 0.65 | 0.57 | |||||||||||||||
| Available to common shareholders (diluted) |
1.57 | 1.17 | 0.85 | 0.64 | 0.57 | |||||||||||||||
| Dividends |
0.22 | 0.20 | 0.19 | 0.15 | 0.12 | |||||||||||||||
| Book value |
14.22 | 13.12 | 12.04 | 10.65 | 10.48 | |||||||||||||||
| Average common shares outstanding: |
||||||||||||||||||||
| Basic |
8,010,399 | 7,822,369 | 7,707,917 | 7,707,917 | 7,707,917 | |||||||||||||||
| Diluted |
10,950,961 | 10,918,335 | 10,904,848 | 7,821,780 | 7,707,917 | |||||||||||||||
| Year-end balances: |
||||||||||||||||||||
| Loans, net |
$ | 1,042,201 | $ | 987,166 | $ | 900,589 | $ | 844,713 | $ | 795,811 | ||||||||||
| Securities |
209,919 | 209,701 | 210,491 | 215,037 | 219,528 | |||||||||||||||
| Total assets |
1,377,263 | 1,315,041 | 1,213,191 | 1,167,546 | 1,136,971 | |||||||||||||||
| Deposits |
1,121,103 | 1,052,033 | 968,918 | 942,475 | 926,389 | |||||||||||||||
| Borrowings |
106,852 | 125,667 | 116,240 | 87,206 | 92,907 | |||||||||||||||
| Shareholders’ equity |
137,616 | 125,173 | 115,909 | 128,376 | 103,980 | |||||||||||||||
| Average balances: |
||||||||||||||||||||
| Loans, net |
$ | 1,011,683 | $ | 966,786 | $ | 858,532 | $ | 800,063 | $ | 759,105 | ||||||||||
| Securities |
213,496 | 211,436 | 214,123 | 216,848 | 224,566 | |||||||||||||||
| Total assets |
1,441,717 | 1,336,645 | 1,234,406 | 1,172,819 | 1,127,989 | |||||||||||||||
| Deposits |
1,210,283 | 1,107,445 | 1,026,093 | 965,370 | 914,851 | |||||||||||||||
| Borrowings |
79,391 | 95,132 | 83,058 | 89,496 | 95,973 | |||||||||||||||
| Shareholders’ equity |
133,445 | 120,350 | 114,266 | 103,563 | 104,114 | |||||||||||||||
See accompanying notes to consolidated financial statements.
1
Five-Year Selected Ratios
| Year ended December 31, | ||||||||||||||||||||
| 2016 | 2015 | 2014 | 2013 | 2012 | ||||||||||||||||
| Net interest margin |
3.93 | % | 3.96 | % | 3.79 | % | 3.79 | % | 3.98 | % | ||||||||||
| Return on average total assets |
1.19 | 0.95 | 0.77 | 0.53 | 0.49 | |||||||||||||||
| Return on average shareholders’ equity |
12.90 | 10.59 | 8.34 | 5.97 | 5.36 | |||||||||||||||
| Dividend payout ratio |
11.22 | 13.99 | 19.19 | 23.08 | 21.05 | |||||||||||||||
| Average shareholders’ equity as a percent of average total assets |
9.26 | 9.00 | 9.26 | 8.83 | 9.23 | |||||||||||||||
| Net loan charge-offs (recoveries) as a percent of average total loans |
(0.02 | ) | 0.11 | 0.43 | 0.53 | 1.01 | ||||||||||||||
| Allowance for loan losses as a percent of loans at year-end |
1.26 | 1.43 | 1.56 | 1.92 | 2.42 | |||||||||||||||
| Shareholders’ equity as a percent of total year-end assets |
9.99 | 9.52 | 9.55 | 11.00 | 9.15 | |||||||||||||||
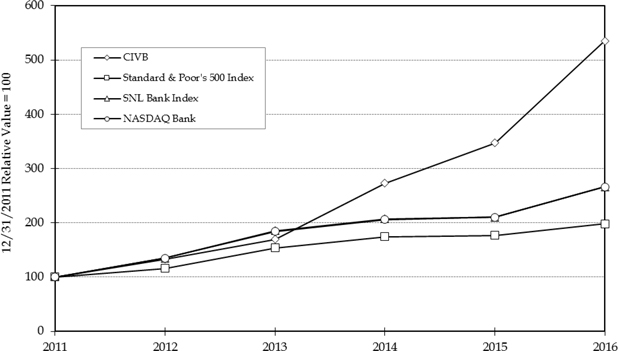
Stockholder Return Performance
Set forth below is a line graph comparing the five-year cumulative return of Civista Bancshares, Inc. (ticker symbol CIVB) common stock, based on an initial investment of $100 on December 31, 2011 and assuming reinvestment of dividends, with Standard & Poor’s 500 Index, the Nasdaq Bank Index and the SNL Bank Index. The comparative indices were obtained from SNL Securities and Nasdaq.
A copy of the Company’s Annual Report on Form 10-K, as filed with the Securities and Exchange Commission, will be furnished, free of charge, to shareholders, upon written request to James E. McGookey, Secretary of Civista Bancshares, Inc., 100 East Water Street, Sandusky, Ohio 44870.
See accompanying notes to consolidated financial statements.
2
Common Stock and Shareholder Matters
The common shares of Civista Bancshares, Inc. (“CBI”) trade on The NASDAQ Capital Market under the symbol “CIVB”. As of February 17, 2016, there were 8,454,509 shares outstanding and held by approximately 1,174 shareholders of record (not including the number of persons or entities holding stock in nominee or street name through various brokerage firms). Information below is the range of sales prices of our common shares for each quarter for the last two years for trades occurring during normal trading hours of CBI common shares as reported on The NASDAQ Capital Market.
| 2016 | ||||||||||||||||||||||
| First Quarter |
Second Quarter |
Third Quarter |
Fourth Quarter | |||||||||||||||||||
| $9.75 |
to | $13.29 | $10.20 | to | $13.10 | $12.99 | to | $15.16 | $14.09 | to | $19.99 | |||||||||||
| 2015 | ||||||||||||||||||||||
| First Quarter |
Second Quarter |
Third Quarter |
Fourth Quarter | |||||||||||||||||||
| $10.04 |
to | $11.54 | $10.11 | to | $11.47 | $9.68 | to | $10.93 | $9.81 | to | $13.65 | |||||||||||
Dividends per share declared on common shares by CBI were as follows:
| 2016 | 2015 | |||||||||||
| First quarter |
$ | 0.05 | $ | 0.05 | ||||||||
| Second quarter |
0.05 | 0.05 | ||||||||||
| Third quarter |
0.06 | 0.05 | ||||||||||
| Fourth quarter |
0.06 | 0.05 | ||||||||||
|
|
|
|
|
|||||||||
| $ | 0.22 | $ | 0.20 | |||||||||
|
|
|
|
|
|||||||||
Information regarding potential restrictions on dividends paid can be found in Note 19 to the Consolidated Financial Statements.
On December 19, 2013, CBI completed a public offering of 1,000,000 depositary shares, each representing a 1/40th ownership interest in a Noncumulative Redeemable Convertible Perpetual Preferred Share, Series B (the “Series B Preferred Shares”), of CBI. The depositary shares trade on The NASDAQ Capital Market under the symbol “CIVBP.” The terms of the Series B Preferred Shares provide for the payment of quarterly dividends on the Series B Preferred Shares (and, therefore, the depositary shares) at the rate of 6.50% per annum of the liquidation preference of $1,000 per Series B Preferred Share (or $25.00 per depositary share). Dividends are noncumulative and are payable if, when and as declared by the board of directors. However, no dividends may be declared or paid on the common shares of CBI during any calendar quarter unless full dividends on the Series B Preferred Shares (and, therefore, the depositary shares) have been declared for that quarter and all dividends previously declared on the Series B Preferred Shares (and, therefore, the depositary shares) have been paid in full. As of December 31, 2016, a total of 819,235 depository shares were outstanding.
See accompanying notes to consolidated financial statements.
3
General Development of Business
(Amounts in thousands)
CBI was organized under the laws of the State of Ohio on February 19, 1987 and is a registered financial holding company under the Gramm-Leach-Bliley Financial Modernization Act of 1999, as amended. CBI and its subsidiaries are sometimes referred to together as the Company. The Company’s office is located at 100 East Water Street, Sandusky, Ohio. The Company had total consolidated assets of $1,377,263 at December 31, 2016.
CIVISTA BANK (“Civista”), owned by the Company since 1987, opened for business in 1884 as The Citizens National Bank. In 1898, Civista was reorganized under Ohio banking law and was known as The Citizens Bank and Trust Company. In 1908, Civista surrendered its trust charter and began operation as The Citizens Banking Company. The name Civista Bank was introduced during the first quarter of 2015 to solidify our dual Citizens/Champaign brand and distinguish ourselves from the many other Citizens’ Banks in existing and prospective markets. Civista maintains its main office at 100 East Water Street, Sandusky, Ohio and operates branch banking offices in the following Ohio communities: Sandusky (2), Norwalk (2), Berlin Heights, Huron, Port Clinton, Castalia, New Washington, Shelby (2), Willard, Greenwich, Plymouth, Shiloh, Akron, Dublin, Plain City, Russells Point, Urbana (2), West Liberty, Quincy and Dayton(3). Civista also operates a loan production office in Mayfield Heights. Civista accounted for 99.9% of the Company’s consolidated assets at December 31, 2016.
FIRST CITIZENS INSURANCE AGENCY INC. (“FCIA”) was formed to allow the Company to participate in commission revenue generated through its third party insurance agreement. Assets of FCIA were less than one percent of the Company’s consolidated assets as of December 31, 2016.
WATER STREET PROPERTIES, INC. (“WSP”) was formed to hold properties repossessed by CBI subsidiaries. WSP accounted for less than one percent of the Company’s consolidated assets as of December 31, 2016.
FC REFUND SOLUTIONS, INC. (“FCRS”) was formed during 2012 and remained inactive for the periods presented.
FIRST CITIZENS INVESTMENTS, INC. (“FCI”) is wholly-owned by Civista and holds and manages its securities portfolio. The operations of FCI are located in Wilmington, Delaware.
FIRST CITIZENS CAPITAL LLC (“FCC”) is wholly-owned by Civista and holds inter-company debt that is eliminated in consolidation. The operations of FCC are located in Wilmington, Delaware.
Management’s Discussion and Analysis of Financial Condition and Results of Operations—As of December 31, 2016 and December 31, 2015 and for the Years Ended December 31, 2016, 2015 and 2014
(Amounts in thousands, except per share data)
General
The following paragraphs more fully discuss the significant highlights, changes and trends as they relate to the Company’s financial condition, results of operations, liquidity and capital resources as of December 31, 2016 and 2015, and during the three-year period ended December 31, 2016. This discussion should be read in conjunction with the Consolidated Financial Statements and Notes to the Consolidated Financial Statements, which are included elsewhere in this report.
See accompanying notes to consolidated financial statements.
4
Forward-Looking Statements
This report may contain “forward-looking statements” within the meaning of Section 27A of the Securities Act of 1933, as amended (the “Securities Act”), and Section 21E of the Securities Exchange Act of 1934, as amended (the “Exchange Act”), relating to such matters as financial condition, anticipated operating results, cash flows, business line results, credit quality expectations, prospects for new lines of business, economic trends (including interest rates) and similar matters. Forward-looking statements reflect our expectations, estimates or projections concerning future results or events. These statements are generally identified by the use of forward-looking words or phrases such as “believe,” “belief,” “expect,” “anticipate,” “may,” “could,” “intend,” “intent,” “estimate,” “plan,” “foresee,” “likely,” “will,” “should” or other similar words or phrases. Forward-looking statements are not guarantees of performance and are inherently subject to known and unknown risks, uncertainties and assumptions that are difficult to predict and could cause our actual results, performance or achievements to differ materially from those expressed in or implied by the forward-looking statements. Factors that could cause actual results, performance or achievements to differ from results discussed in the forward-looking statements include, but are not limited to, changes in financial markets or national or local economic conditions; sustained weakness or deterioration in the real estate market; volatility and direction of market interest rates; credit risks of lending activities; changes in the allowance for loan losses; legislation or regulatory changes or actions; increases in FDIC insurance premiums and assessments; changes in tax laws; failure of or breach in our information and data processing systems; unforeseen litigation; increased competition in our market area; failures to manage growth and/or effectively integrate acquisitions; future revenues of our tax refund program; and other risks identified from time-to-time in the Company’s other public documents on file with the Securities and Exchange Commission.
The forward-looking statements included in this report are only made as of the date of this report, and we disclaim any obligation to publicly update any forward-looking statement to reflect subsequent events or circumstances, except as required by law.
The Private Securities Litigation Reform Act of 1995 provides a safe harbor for forward-looking statements, and the purpose of this section is to secure the use of the safe harbor provisions.
Financial Condition
At December 31, 2016, the Company’s total assets were $1,377,263, compared to $1,315,041 at December 31, 2015. The increase in assets is primarily the result of growth in the loan portfolio during 2016. Other factors contributing to the change in assets are discussed in the following sections.
At $1,042,201, net loans increased from December 31, 2015 by 5.6%. Commercial & Agriculture, Commercial Real Estate—Non-Owner Occupied and Residential Real Estate loans increased $11,060, $47,492 and $10,970, respectively, since December 31, 2015, while Commercial Real Estate – Owner Occupied, Real Estate Construction, Farm Real Estate and Consumer and other loans portfolios decreased $6,533, $2,605, $5,823 and $582, respectively, since December 31, 2015.
Securities available for sale decreased by $385, or 0.2%, from $196,249 at December 31, 2015 to $195,864 at December 31, 2016. U.S. Treasury securities and obligations of U.S. government agencies decreased $3,491, from $40,937 at December 31, 2015 to $37,446 at December 31, 2016. Obligations of states and political subdivisions available for sale increased by $2,846 from 2015 to 2016. Mortgage-backed securities increased by $69 to total $62,642 at December 31, 2016. The Company continues to utilize letters of credit from the Federal Home Loan Bank (FHLB) to replace maturing securities that were pledged for public entities. As of December 31, 2016, the Company was in compliance with all pledging requirements.
See accompanying notes to consolidated financial statements.
5
Mortgage-backed securities totaled $62,642 at December 31, 2016 and none were considered unusual or “high risk” securities as defined by regulatory authorities. Of this total, $55,732 consisted of pass-through securities issued by the Federal National Mortgage Association (“FNMA”), Federal Home Loan Mortgage Corporation (“FHLMC”), and Government National Mortgage Association (“GNMA”), and $6,910 of these securities collateralized by mortgage-backed securities issued or guaranteed by FNMA, FHLMC, or GNMA. The average interest rate of the mortgage-backed portfolio at December 31, 2016 was 2.9%. The average maturity at December 31, 2016 was approximately 6.1 years. The Company has not invested in any derivative securities.
Securities available for sale had a fair value at December 31, 2016 of $195,864. This fair value includes unrealized gains of approximately $4,292 and unrealized losses of approximately $1,248. Net unrealized gains totaled $3,044 on December 31, 2016 compared to net unrealized gains of $5,386 on December 31, 2015. The change in unrealized gains is primarily due to changes in market interest rates. Note 3 to the Consolidated Financial Statements provides additional information on unrealized gains and losses.
Premises and equipment, net of accumulated depreciation, increased $976 from December 31, 2015 to December 31, 2016. The increase is attributed to new purchases of $2,437, offset by disposals, net of gains of $2, depreciation of $1,257, and the transfer of $202 of assets to premises and equipment held for sale.
Bank owned life insurance (BOLI) increased $4,448 from December 31, 2015 to December 31, 2016. The Company purchased an additional $3,885 of BOLI during 2016. The remaining difference is the result of increases in the cash surrender value of the underlying insurance policies.
Other assets increased $1,514 from December 31, 2015 to December 31, 2016. The increase is primarily the result of a matured investment security that was not settled as of the year end. In addition, the Company’s low income housing investment increased compared to 2015.
Year-end deposit balances totaled $1,121,103 in 2016 compared to $1,052,033 in 2015, an increase of $69,070, or 6.6%. Overall, the increase in deposits at December 31, 2016 compared to December 31, 2015 included increases in noninterest bearing demand deposits of $44,973, or 15.0%, statement and passbook savings accounts of $20,264, or 5.6%, interest bearing demand accounts of $7,456, or 4.2%, offset in part by declines in certificate of deposit accounts of $1,976, or 1.1% and individual retirement accounts of $1,647, or 6.2%. Average deposit balances for 2016 were $1,210,283 compared to $1,107,445 for 2015, an increase of 9.3%. Noninterest bearing deposits averaged $434,601 for 2016, compared to $340,360 for 2015, increasing $94,241, or 27.7%. Savings, NOW, and MMDA accounts averaged $566,589 for 2016 compared to $543,986 for 2015. Average certificates of deposit decreased $14,006 to total an average balance of $209,093 for 2016.
Borrowings from the Federal Home Loan Bank (“FHLB”) of Cincinnati were $48,500 at December 31, 2016. The detail of these borrowings can be found in Note 10 and Note 11 to the Consolidated Financial Statements. The balance decreased $22,700 from $71,200 at year-end 2015. The change in balance is mainly the result of a decrease in short term advances used as overnight funding.
Civista offers repurchase agreements in the form of sweep accounts to commercial checking account customers. These repurchase agreements totaled $28,925 at December 31, 2016 compared to $25,040 at December 31, 2015. U.S. Treasury securities and obligations of U.S. government agencies maintained under Civista’s control are pledged as collateral for the repurchase agreements. The detail related to these repurchase agreements can be found in Note 12 to the Consolidated Financial Statements
See accompanying notes to consolidated financial statements.
6
Total shareholders’ equity increased $12,443, or 9.9% during 2016 to $137,616. The change in shareholders’ equity resulted from net income of $17,217, offset by preferred dividends and common dividends of $1,501 and $1,753, respectively, and the decreased market value of securities available for sale, net of tax, of $1,546 and an increase in the Company’s pension liability, net of tax of $296. Additionally, $323 was recognized as stock-based compensation in connection with the grant of restricted common shares. For further explanation of these items, see Note 1, Note 15 and Note 16 to the Consolidated Financial Statements. The Company paid $0.22 per common share in dividends in 2016 compared to $0.20 per common share in dividends in 2015. Total outstanding common shares at December 31, 2016 were 8,343,509. Total outstanding common shares at December 31, 2015 were 7,843,578. The increase in common shares outstanding is the result of the conversion of 3,591 of the Company’s previously issued preferred shares into 459,192 common shares, the grant of 28,864 restricted common shares to certain officers under the Company’s 2014 Incentive Plan and the grant of 15,015 common shares to directors of Civista. There were 3,140 previously granted restricted common shares forfeited during the year ended December 31, 2016. The ratio of total shareholders’ equity to total assets was 9.9% and 9.5%, respectively, at December 31, 2016 and December 31, 2015.
Results of Operations
The operating results of the Company are affected by general economic conditions, the monetary and fiscal policies of federal agencies and the regulatory policies of agencies that regulate financial institutions. The Company’s cost of funds is influenced by interest rates on competing investments and general market rates of interest. Lending activities are influenced by the demand for real estate loans and other types of loans, which in turn is affected by the interest rates at which such loans are made, general economic conditions and the availability of funds for lending activities.
The Company’s net income primarily depends on its net interest income, which is the difference between the interest income earned on interest-earning assets, such as loans and securities, and interest expense incurred on interest-bearing liabilities, such as deposits and borrowings. The level of net interest income is dependent on the interest rate environment and the volume and composition of interest-earning assets and interest-bearing liabilities. Net income is also affected by provisions for loan losses, service charges, gains on the sale of assets, other income, noninterest expense and income taxes.
Comparison of Results of Operations for the Years Ended December 31, 2016 and December 31, 2015
Net Income
The Company’s net income for the year ended December 31, 2016 was $17,217, compared to $12,745 for the year ended December 31, 2015. The change in net income was the result of the items discussed in the following sections.
Net Interest Income
Net interest income for 2016 was $50,259, an increase of $2,867, or 6.0%, from 2015. Average earning assets increased 6.8% from 2015. Although market rates in 2016 remained at record lows, interest income increased $2,866, primarily due to increased loan volume. In addition, interest expense on interest-bearing liabilities decreased $1. The Company continually examines its rate structure to ensure that its interest rates are competitive and reflective of the current rate environment in which it competes.
Total interest income increased $2,866, or 5.7%, from 2015. The increase was mainly a result of an increase in loan volume. Average loans increased $44,433 from 2015 to 2016. The yield on the Company’s loan portfolio increased 3 basis points from 2015. The average balance of the securities portfolio for 2016 compared to 2015 increased $2,060. Interest earned on the security portfolio, including
See accompanying notes to consolidated financial statements.
7
bank stocks, increased $170 from 2015 to 2016. Average balances in interest-bearing deposits in other banks increased in 2016 by $37,578. The increase in average balance is due to additional interest-earning cash on deposit related to the tax refund processing program in 2016.
Total interest expense decreased $1 for 2016 compared to 2015. The total average balance of interest-bearing liabilities decreased $7,144 while the average rate increased 1 basis point in 2016. Average interest-bearing deposits increased $8,597 from 2015 to 2016. While average balances in interest-bearing deposits increased, the average balance in time deposits declined $14,006 and the rate on time deposits declined approximately 2 basis points, which caused interest expense on deposits to decrease by $91. Interest expense on FHLB borrowings decreased $37 due to a decline in average balance of $17,470. The average balance in subordinated debentures did not change from 2015 to 2016, but the rate on these securities increased 42 basis points, resulting in an increase in interest expense of $124. Repurchase agreements increased $1,681 in average balance from 2015 to 2016.
Refer to “Distribution of Assets, Liabilities and Shareholders’ Equity; Interest Rates and Interest Differential” and “Changes in Interest Income and Interest Expense Resulting from Changes in Volume and Changes in Rate” on pages 15 through 17 for further analysis of the impact of changes in interest-bearing assets and liabilities on the Company’s net interest income.
Provision and Allowance for Loan Losses
The following table contains information relating to the provision for loan losses, activity in and analysis of the allowance for loan losses as of and for each of the three years in the period ended December 31.
| As of and for year ended December 31, |
||||||||||||
| 2016 | 2015 | 2014 | ||||||||||
| Net loan charge-offs (recoveries) |
$ | (244 | ) | $ | 1,107 | $ | 3,760 | |||||
| Provision (credit) for loan losses charged to expense |
(1,300 | ) | 1,200 | 1,500 | ||||||||
| Net loan charge-offs (recoveries) as a percent of average outstanding loans |
-0.02 | % | 0.11 | % | 0.43 | % | ||||||
| Allowance for loan losses |
$ | 13,305 | $ | 14,361 | $ | 14,268 | ||||||
| Allowance for loan losses as a percent of year-end outstanding loans |
1.26 | % | 1.43 | % | 1.56 | % | ||||||
| Impaired loans, excluding purchase credit impaired loans (PCI) |
$ | 6,539 | $ | 7,354 | $ | 11,149 | ||||||
| Impaired loans as a percent of gross year-end loans (1) |
0.62 | % | 0.73 | % | 1.22 | % | ||||||
| Nonaccrual and 90 days or more past due loans, excluding PCI |
$ | 6,952 | $ | 9,259 | $ | 13,576 | ||||||
| Nonaccrual and 90 days or more past due loans, excluding PCI as a percent of gross year-end loans (1) |
0.66 | % | 0.92 | % | 1.48 | % | ||||||
| (1) | Nonperforming loans and impaired loans are defined differently. Some loans may be included in both categories, whereas other loans may only be included in one category. A loan is considered nonaccrual if it is maintained on a cash basis because of deterioration in the borrower’s financial condition, where payment in full of principal or interest is not expected and where the principal and interest have been in default for 90 days, unless the asset is both well-secured and in process of collection. A loan is considered impaired when it is probable that all of the interest and principal due will not be collected according to the terms of the original contractual agreement. |
The Company’s policy is to maintain the allowance for loan losses at a level sufficient to provide for probable losses incurred in the current portfolio. The Company provides for loan losses through regular provisions to the allowance for loan losses. The amount of the provision is affected by loan charge-offs, recoveries and changes in specific and general allocations required for the allowance for loan losses.
See accompanying notes to consolidated financial statements.
8
Provisions (credits) for loan losses totaled ($1,300), $1,200 and $1,500 in 2016, 2015 and 2014, respectively. Management believes the analysis of the allowance for loan losses supported a reserve of $13,305 at December 31, 2016.
The Company’s provision for loan losses decreased $2,500 during 2016. During 2016, the Company received a payoff on a nonperforming loan. This particular loan had been analyzed previously and had been charged down based on a deterioration of real estate collateral values during the recent recession. As a result of the payoff of the loan, the Company recovered the charged down amount of approximately $1,303. This loan payoff resulted in a reversal of $1,300 from the allowance for loan losses during 2016, compared to a $1,200 provision to allowance for loan losses in 2015. The provision is also affected by net charge-offs on loans and changes in specific and general allocations required on the allowance for loan losses. The decrease in provision for loan losses in 2016 is related to the decrease in net charge-offs compared to a year ago. A number of factors impact the provisions for loan losses, such as the level of higher risk loans in the portfolio, changes in practices related to loans, changes in collateral values and other factors. We continue to actively manage this process and have provided to maintain the reserve at a level that assures adequate coverage ratios.
Efforts are continually made to analyze each segment of the loan portfolio and quantify risk to assure that reserves are appropriate for each segment and the overall portfolio. Management specifically evaluates loans that are impaired, which includes restructured loans, to estimate potential loss. This analysis includes a review of the loss migration calculation for all loan categories as well as fluctuations and trends in various risk factors that have occurred within the portfolios’ economic life cycle. The analysis also includes assessment of qualitative factors such as credit trends, unemployment trends, vacancy trends and loan growth. The composition and overall level of the loan portfolio and charge-off activity are also factors used to determine the amount of the allowance for loan losses.
Management analyzes each impaired commercial and commercial real estate loan relationship with a balance of $350 or larger, on an individual basis and when it is in nonaccrual status or when an analysis of the borrower’s operating results and financial condition indicates that underlying cash flows are not adequate to meet its debt service requirements. In addition, loans held for sale and leases are excluded from consideration as impaired. Loans are generally moved to nonaccrual status when 90 days or more past due. Impaired loans or portions thereof are charged-off when deemed uncollectible.
Noninterest Income
Noninterest income increased $1,854, or 13.0%, to $16,132 for the year ended December 31, 2016, from $14,278 for the comparable 2015 period. The increase was primarily due to increases in earnings on service charges of $124, gain on sale of loans of $644, tax refund processing fees of $750 and other income of $303 which were partially offset by decreases in wealth management fees of $145 and net gain on sale of other real estate owned of $47.
Service charges increased primarily due to income received related to the Company’s tax refund processing program. Gain on sale of loans increased due to an increase in volume of loans sold, as well as an increase in the premium earned. Volume was $69,475, up $19,838 or 40.0% as compared to the same period in 2015, due largely to favorable market conditions and increased volume. In addition, the premium on loans sold increased 6 basis points as compared to the same period in 2015. Tax refund processing fees increased as a result of an increase in the volume of returns processed. Other income increased primarily due to an increase in swap related income. The decrease in wealth management fee income is related to a general decrease in brokerage transactions. Sales of other real estate owned resulted in recognized gains of $152 on the sale of 9 properties in 2016 compared to gains of $199 on the sale of 17 properties in 2015.
See accompanying notes to consolidated financial statements.
9
Noninterest Expense
Noninterest expense increased $911, or 2.1%, to $43,855 for the year ended December 31, 2016, from $42,944 for the comparable 2015 period. The increase was primarily due to increases in salaries, wages and benefits of $1,693, occupancy expense of $284 and equipment expense of $138 which were partially offset by decreases in contracted data processing of $275, FDIC assessments of $253, professional services of $566 and marketing expense of $110.
Salaries, wages and benefits increased mainly due to annual pay increases, incentive based costs and higher employee insurance costs, offset by a reduction in pension costs. Occupancy and equipment expenses increased due to increases in building and equipment repair and maintenance, rent expense and real estate tax expense. Building and equipment repair and maintenance expenses increased due to facility and technology improvement projects. Rent and real estate tax expense increased as a result of the Company’s acquisition of TCNB in 2015. The contracted data processing costs decrease was attributable to the increased core processing costs incurred in 2015 in connection with the acquisition of TCNB. The decrease in FDIC assessments is the result of a new lower assessment rate schedule that became effective in 2016. The year-over-year decrease in professional services was attributable to the increased professional services costs incurred in 2015 in connection with the acquisition of TCNB, increased recruiting expenses and increased legal expenses related to the Company’s filing of a Form S-3 shelf registration statement with the SEC and matters related to the Special Meeting of Shareholders held on November 4, 2015 for the purpose of voting to eliminate preemptive rights and cumulative voting in the election of directors. A general decrease in marketing costs occurred in 2016.
Income Tax Expense
Federal income tax expense was $6,619 in 2016 compared to $4,781 in 2015. Federal income tax expense as a percentage of pre-tax income was 27.8% in 2016 compared to 27.3% in 2015. A lower federal effective tax rate than the statutory rate of 35% in 2016 and 34% in 2015 is primarily due to tax-exempt interest income from state and municipal investments, municipal loans, income from BOLI and low income housing credits. Federal income tax expense increased in 2016 primarily due to an increase in pre-tax income, which also led to the increase in the effective tax rate in 2016.
Comparison of Results of Operations for the Years Ended December 31, 2015 and December 31, 2014
Net Income
The Company’s net income for the year ended December 31, 2015 was $12,745, compared to $9,528 for the year ended December 31, 2014. The change in net income was the result of the items discussed in the following sections.
Net Interest Income
Net interest income for 2015 was $47,392, an increase of $5,526, or 13.2%, from 2014. Average earning assets increased 8.3% from 2014. Although market rates in 2015 remained at record lows, interest income increased $4,731, primarily due to increased loan volume. In addition, interest expense on interest-bearing liabilities decreased $795. The Company continually examines its rate structure to ensure that its interest rates are competitive and reflective of the current rate environment in which it competes. A change in the mix of deposits from certificates of deposit to non-maturing deposits also contributed to the decline in interest expense in 2015.
See accompanying notes to consolidated financial statements.
10
Total interest income increased $4,731, or 10.3%, for 2015 compared to 2014. The increase was mainly a result of an increase in loan volume. Average loans increased $107,043 from 2014 to 2015. The yield on the Company’s loan portfolio declined 1 basis points from 2014. While the average balance of the securities portfolio for 2015 compared to 2014 decreased $2,687, this was primarily due to the Company not replacing matured securities. Interest earned on the security portfolio, including bank stocks, decreased mainly due to decreases in yield. Average balances in interest-bearing deposits in other banks decreased in 2015 by $9,182.
Total interest expense decreased $795, or 19.4%, for 2015 compared to 2014. The decrease in interest expense can be attributed to declines in market rates and the corresponding repricing of deposits and other sources of funding. The total average balance of interest-bearing liabilities increased $50,069 while the average rate decreased 13 basis points in 2015. Average interest-bearing deposits increased $37,995 from 2014 to 2015. While average balances in interest-bearing deposits increased, the average balance in time deposits declined $4,583 and the rate on time deposits declined approximately 9 basis points, which caused interest expense on deposits to decrease by $205. Interest expense on FHLB borrowings decreased $573 due to a decline in rate of 203 basis points. The average balance in FHLB borrowings increased. The increase in FHLB borrowings is due to an increase in overnight borrowings, which are paying a low interest rate. The average balance in subordinated debentures did not change from 2014 to 2015, but the rate on these securities decreased 6 basis points, resulting in a decrease in interest expense of $17. Repurchase agreements increased $327 in average balance from 2014 to 2015.
Refer to “Distribution of Assets, Liabilities and Shareholders’ Equity; Interest Rates and Interest Differential” and “Changes in Interest Income and Interest Expense Resulting from Changes in Volume and Changes in Rate” on pages 14 through 16 for further analysis of the impact of changes in interest-bearing assets and liabilities on the Company’s net interest income.
Provision and Allowance for Loan Losses
The following table contains information relating to the provision for loan losses, activity in and analysis of the allowance for loan losses as of and for each of the three years in the period ended December 31.
| As of and for year ended December 31, |
||||||||||||
| 2015 | 2014 | 2013 | ||||||||||
| Net loan charge-offs |
$ | 1,107 | $ | 3,760 | $ | 4,314 | ||||||
| Provision for loan losses charged to expense |
1,200 | 1,500 | 1,100 | |||||||||
| Net loan charge-offs as a percent of average outstanding loans |
0.11 | % | 0.43 | % | 0.53 | % | ||||||
| Allowance for loan losses |
$ | 14,361 | $ | 14,268 | $ | 16,528 | ||||||
| Allowance for loan losses as a percent of year-end outstanding loans |
1.43 | % | 1.56 | % | 1.92 | % | ||||||
| Impaired loans, excluding PCI loans |
$ | 7,354 | $ | 11,149 | $ | 18,057 | ||||||
| Impaired loans as a percent of gross year-end loans (1) |
0.73 | % | 1.22 | % | 2.10 | % | ||||||
| Nonaccrual and 90 days or more past due loans, excluding PCI |
$ | 9,259 | $ | 13,576 | $ | 20,459 | ||||||
| Nonaccrual and 90 days or more past due loans, excluding PCI as a percent of gross year-end loans (1) |
0.92 | % | 1.48 | % | 2.38 | % | ||||||
| (1) | Nonperforming loans and impaired loans are defined differently. Some loans may be included in both categories, whereas other loans may only be included in one category. A loan is considered nonaccrual if it is maintained on a cash basis because of deterioration in the borrower’s financial condition, where payment in full of principal or interest is not expected and where the principal and interest have been in default for 90 days, unless the asset is both well-secured and in process of collection. A loan is considered impaired when it is probable that all of the interest and principal due will not be collected according to the terms of the original contractual agreement. |
See accompanying notes to consolidated financial statements.
11
The Company’s policy is to maintain the allowance for loan losses at a level sufficient to provide for probable losses incurred in the current portfolio. The Company provides for loan losses through regular provisions to the allowance for loan losses. The amount of the provision is affected by loan charge-offs, recoveries and changes in specific and general allocations required for the allowance for loan losses. Provisions for loan losses totaled $1,200, $1,500 and $1,100 in 2015, 2014 and 2013, respectively. Management believes the analysis of the allowance for loan losses supported a reserve of $14,361 at December 31, 2015.
The Company’s provision for loan losses decreased $300 during 2015. The decrease in provision for loan losses was related to the decrease in the specific reserve required for loans and a decrease in net charge-offs compared to a year ago. A number of factors impact the provisions for loan losses, such as the level of higher risk loans in the portfolio, changes in practices related to loans, changes in collateral values and other factors. We continue to actively manage this process and have provided to maintain the reserve at a level that assures adequate coverage ratios.
Efforts are continually made to analyze each segment of the loan portfolio and quantify risk to assure that reserves are appropriate for each segment and the overall portfolio. Management specifically evaluates loans that are impaired, which includes restructured loans, to estimate potential loss. This analysis includes a review of the loss migration calculation for all loan categories as well as fluctuations and trends in various risk factors that have occurred within the portfolios’ economic life cycle. The analysis also includes assessment of qualitative factors such as credit trends, unemployment trends, vacancy trends and loan growth. The composition and overall level of the loan portfolio and charge-off activity are also factors used to determine the amount of the allowance for loan losses.
Management analyzes each impaired commercial and commercial real estate loan with a balance of $350 or larger on an individual basis and when it is in nonaccrual status or when an analysis of the borrower’s operating results and financial condition indicates that underlying cash flows are not adequate to meet its debt service requirements. In addition, loans held for sale and leases are excluded from consideration as impaired. Loans are generally moved to nonaccrual status when 90 days or more past due. Impaired loans or portions thereof are charged-off when deemed uncollectible.
Noninterest Income
Noninterest income increased $404, or 2.9%, to $14,278 for the year ended December 31, 2015, from $13,874 for the comparable 2014 period. The increase was primarily due to increases in earnings on service charges of $451, gain on sale of loans of $447, ATM fees of $136 and gain on sale of other real estate owned of $155 which were partially offset by decreases in wealth management fees of $307, tax refund processing fees of $324 and gain on sale of securities of $131.
Service charges increased in 2015 primarily due to increases in business service charges and overdraft fees. Gain on sale of loans increased due to an increase in volume of loans sold, as well as an increase in the premium earned. ATM fee income increased due to increased interchange fees. Sales of other real estate owned resulted in recognized gains of $199 on the sale of 17 properties in 2015 compared to gains of $44 on the sale of 16 properties in 2014. The decrease in wealth management fee income is related to a general decrease in brokerage transactions. Tax refund processing fees decreased due to a new fee structure in place during 2015. The new fee in 2015 called for a flat processing fee, whereas in 2014, the Company received a per transaction fee. Gain on the sale of securities decreased compared to the same period of 2014. Management, from time to time, will reposition the investment portfolio to match liquidity needs of the Company.
See accompanying notes to consolidated financial statements.
12
Noninterest Expense
Noninterest expense increased $1,394, or 3.4%, to $42,944 for the year ended December 31, 2015, from $41,550 for the comparable 2014 period. The increase was primarily due to increases in salaries, wages and benefits of $1,337, contracted data processing of $261 and professional services of $606 which were partially offset by decreases in ATM expense of $132, marketing expense of $565 and repossession expense of $165.
Salaries, wages and benefits increased mainly due to an increase in salaries and 401(k) expenses. Salaries and related payroll taxes increased mainly due to annual pay increases and overtime related to the 2015 acquisition of TCNB, as well as the addition of TCNB employees. In 2015, the Company adopted a Safe Harbor 401(k) plan which increased the match paid to participants. Contracted data processing costs increased due to the cost of technology services and core processing costs related to the acquisition of TCNB. Professional services increased due to increased legal and audit fees relating to the acquisition of TCNB, increased recruiting expenses and increased legal expenses related to the Company’s filing of a Form S-3 shelf registration statement with the SEC and matters related to the Special Meeting of Shareholders held on November 4, 2015 for the purpose of voting to eliminate preemptive rights and cumulative voting in the election of directors, as well as the previously disclosed litigation related to a proposed sale of real estate that the Company owns near one of its branches. The decrease in ATM costs was due to vendor credits that began in the second quarter of 2015. Marketing costs decreased in 2015, as the Company incurred increased marketing expenses in 2014 as part of its rebranding effort. The decrease in repossession expense is the result of a general decrease in expenses related to repossessions.
Income Tax Expense
Federal income tax expense was $4,781 in 2015 compared to $3,162 in 2014. Federal income tax expense as a percentage of income was 27.3% in 2015 compared to 24.9% in 2014. A lower federal effective tax rate than the statutory rate of 34% is primarily due to tax-exempt interest income from state and municipal investments, municipal loans, income from BOLI and low income housing credits. Federal income tax expense increased in 2015 primarily due to an increase in pre-tax income, which also led to the increase in the effective tax rate in 2015.
See accompanying notes to consolidated financial statements.
13
Distribution of Assets, Liabilities and Shareholders’ Equity;
Interest Rates and Interest Differential
The following table sets forth, for the years ended December 31, 2016, 2015 and 2014, the distribution of assets, including interest amounts and average rates of major categories of interest-earning assets and interest-bearing liabilities (Amounts in thousands):
| 2016 | 2015 | 2014 | ||||||||||||||||||||||||||||||||||
| Assets |
Average balance |
Interest | Yield/ rate |
Average balance |
Interest | Yield/ rate |
Average balance |
Interest | Yield/ rate |
|||||||||||||||||||||||||||
| Interest-earning assets: |
||||||||||||||||||||||||||||||||||||
| Loans (1)(2)(3)(5) |
$ | 1,025,908 | $ | 47,186 | 4.60 | % | $ | 981,475 | $ | 44,784 | 4.57 | % | $ | 874,432 | $ | 40,032 | 4.58 | % | ||||||||||||||||||
| Taxable securities (4) |
137,179 | 3,319 | 2.47 | % | 139,762 | 3,232 | 2.31 | % | 150,510 | 3,443 | 2.31 | % | ||||||||||||||||||||||||
| Non-taxable securities (4)(5) |
76,317 | 2,666 | 5.61 | % | 71,674 | 2,583 | 5.70 | % | 63,613 | 2,356 | 5.80 | % | ||||||||||||||||||||||||
| Interest-bearing deposits in other banks |
82,225 | 396 | 0.48 | % | 44,647 | 102 | 0.23 | % | 53,829 | 139 | 0.26 | % | ||||||||||||||||||||||||
|
|
|
|
|
|
|
|
|
|
|
|
|
|||||||||||||||||||||||||
| Total interest income assets |
1,321,629 | 53,567 | 4.18 | % | 1,237,558 | 50,701 | 4.23 | % | 1,142,384 | 45,970 | 4.15 | % | ||||||||||||||||||||||||
| Noninterest-earning assets: |
||||||||||||||||||||||||||||||||||||
| Cash and due from financial institutions |
49,888 | 34,616 | 35,784 | |||||||||||||||||||||||||||||||||
| Premises and equipment, net |
17,101 | 16,081 | 15,262 | |||||||||||||||||||||||||||||||||
| Accrued interest receivable |
4,432 | 4,476 | 4,242 | |||||||||||||||||||||||||||||||||
| Intangible assets |
29,213 | 28,568 | 24,122 | |||||||||||||||||||||||||||||||||
| Other assets |
10,230 | 10,181 | 9,133 | |||||||||||||||||||||||||||||||||
| Bank owned life insurance |
23,449 | 19,854 | 19,379 | |||||||||||||||||||||||||||||||||
| Less allowance for loan losses |
(14,225 | ) | (14,689 | ) | (15,900 | ) | ||||||||||||||||||||||||||||||
|
|
|
|
|
|
|
|||||||||||||||||||||||||||||||
| Total |
$ | 1,441,717 | $ | 1,336,645 | $ | 1,234,406 | ||||||||||||||||||||||||||||||
|
|
|
|
|
|
|
|||||||||||||||||||||||||||||||
| (1) | For purposes of these computations, the daily average loan amounts outstanding are net of unearned income and include loans held for sale. |
| (2) | Included in loan interest income are loan fees of $537 in 2016, $542 in 2015 and $387 in 2014. |
| (3) | Non-accrual loans are included in loan totals and do not have a material impact on the analysis presented. |
| (4) | Average balance is computed using the carrying value of securities. The average yield has been computed using the historical amortized cost average balance for available-for-sale securities. |
| (5) | Interest yield is calculated using the tax-equivalent adjustment. |
See accompanying notes to consolidated financial statements.
14
Distribution of Assets, Liabilities and Shareholders’ Equity;
Interest Rates and Interest Differential (Continued)
The following table sets forth, for the years ended December 31, 2016, 2015 and 2014, the distribution of liabilities and shareholders’ equity, including interest amounts and average rates of major categories of interest-earning assets and interest-bearing liabilities (Amounts in thousands):
| 2016 | 2015 | 2014 | ||||||||||||||||||||||||||||||||||
| Liabilities and |
Average balance |
Interest | Yield/ rate |
Average balance |
Interest | Yield/ rate |
Average balance |
Interest | Yield/ rate |
|||||||||||||||||||||||||||
| Interest-bearing liabilities: |
||||||||||||||||||||||||||||||||||||
| Savings and interest-bearing demand accounts |
$ | 566,589 | $ | 470 | 0.08 | % | $ | 543,986 | $ | 422 | 0.08 | % | $ | 501,408 | $ | 376 | 0.07 | % | ||||||||||||||||||
| Certificates of deposit |
209,093 | 1,526 | 0.73 | % | 223,099 | 1,665 | 0.75 | % | 227,682 | 1,916 | 0.84 | % | ||||||||||||||||||||||||
| Federal Home Loan Bank advances |
28,081 | 405 | 1.44 | % | 45,551 | 442 | 0.97 | % | 33,831 | 1,015 | 3.00 | % | ||||||||||||||||||||||||
| Securities sold under repurchase agreements |
21,767 | 22 | 0.10 | % | 20,086 | 20 | 0.10 | % | 19,759 | 20 | 0.10 | % | ||||||||||||||||||||||||
| Federal funds purchased |
116 | 1 | 0.86 | % | 68 | — | 0.00 | % | 41 | — | 0.00 | % | ||||||||||||||||||||||||
| Subordinated debentures |
29,427 | 884 | 3.00 | % | 29,427 | 760 | 2.58 | % | 29,427 | 777 | 2.64 | % | ||||||||||||||||||||||||
|
|
|
|
|
|
|
|
|
|
|
|
|
|||||||||||||||||||||||||
| Total interest-bearing liabilities |
855,073 | 3,308 | 0.39 | % | 862,217 | 3,309 | 0.38 | % | 812,148 | 4,104 | 0.51 | % | ||||||||||||||||||||||||
| Noninterest-bearing liabilities: |
||||||||||||||||||||||||||||||||||||
| Demand deposits |
434,601 | 340,360 | 297,003 | |||||||||||||||||||||||||||||||||
| Other liabilities |
18,598 | 13,718 | 10,989 | |||||||||||||||||||||||||||||||||
|
|
|
|
|
|
|
|||||||||||||||||||||||||||||||
| 453,199 | 354,078 | 307,992 | ||||||||||||||||||||||||||||||||||
| Shareholders’ equity |
133,445 | 120,350 | 114,266 | |||||||||||||||||||||||||||||||||
|
|
|
|
|
|
|
|||||||||||||||||||||||||||||||
| Total |
$ | 1,441,717 | $ | 1,336,645 | $ | 1,234,406 | ||||||||||||||||||||||||||||||
|
|
|
|
|
|
|
|||||||||||||||||||||||||||||||
| Net interest income and interest rate spread (1) |
$ | 50,259 | 3.79 | % | $ | 47,392 | 3.84 | % | $ | 41,866 | 3.64 | % | ||||||||||||||||||||||||
|
|
|
|
|
|
|
|
|
|
|
|
|
|||||||||||||||||||||||||
| Net interest margin (2) |
3.93 | % | 3.96 | % | 3.79 | % | ||||||||||||||||||||||||||||||
|
|
|
|
|
|
|
|||||||||||||||||||||||||||||||
| (1) | Interest rate spread is calculated by subtracting the rate on average interest-bearing liabilities from the yield on average interest-earning assets. |
| (2) | Net interest margin is calculated by dividing tax-equivalent adjusted net interest income by average interest-earning assets. |
See accompanying notes to consolidated financial statements.
15
Changes in Interest Income and Interest Expense
Resulting from Changes in Volume and Changes in Rate
The following table sets forth, for the periods indicated, a summary of the changes in interest income and interest expense resulting from changes in volume and changes in rate (Amounts in thousands):
| Increase (decrease) due to: | ||||||||||||
| Volume(1) | Rate(1) | Net | ||||||||||
| 2016 compared to 2015 |
||||||||||||
| Interest income: |
||||||||||||
| Loans |
$ | 2,041 | $ | 361 | $ | 2,402 | ||||||
| Taxable securities |
(62 | ) | 149 | 87 | ||||||||
| Nontaxable securities |
173 | (90 | ) | 83 | ||||||||
| Interest-bearing deposits in other banks |
127 | 167 | 294 | |||||||||
|
|
|
|
|
|
|
|||||||
| Total interest income |
$ | 2,279 | $ | 587 | $ | 2,866 | ||||||
|
|
|
|
|
|
|
|||||||
| Interest expense: |
||||||||||||
| Savings and interest-bearing demand accounts |
$ | 18 | $ | 30 | $ | 48 | ||||||
| Certificates of deposit |
(103 | ) | (36 | ) | (139 | ) | ||||||
| Federal Home Loan Bank advances |
(206 | ) | 169 | (37 | ) | |||||||
| Securities sold under repurchase agreements |
2 | — | 2 | |||||||||
| Federal funds purchased |
1 | — | 1 | |||||||||
| Subordinated debentures |
— | 124 | 124 | |||||||||
|
|
|
|
|
|
|
|||||||
| Total interest expense |
$ | (288 | ) | $ | 287 | $ | (1 | ) | ||||
|
|
|
|
|
|
|
|||||||
| Net interest income |
$ | 2,567 | $ | 300 | $ | 2,867 | ||||||
|
|
|
|
|
|
|
|||||||
| 2015 compared to 2014 |
||||||||||||
| Interest income: |
||||||||||||
| Loans |
$ | 4,885 | $ | (133 | ) | $ | 4,752 | |||||
| Taxable securities |
(252 | ) | 41 | (211 | ) | |||||||
| Nontaxable securities |
304 | (77 | ) | 227 | ||||||||
| Interest-bearing deposits in other banks |
(22 | ) | (15 | ) | (37 | ) | ||||||
|
|
|
|
|
|
|
|||||||
| Total interest income |
$ | 4,915 | $ | (184 | ) | $ | 4,731 | |||||
|
|
|
|
|
|
|
|||||||
| Interest expense: |
||||||||||||
| Savings and interest-bearing demand accounts |
$ | 33 | $ | 13 | $ | 46 | ||||||
| Certificates of deposit |
(38 | ) | (213 | ) | (251 | ) | ||||||
| Federal Home Loan Bank advances |
271 | (844 | ) | (573 | ) | |||||||
| Securities sold under repurchase agreements |
— | — | — | |||||||||
| Subordinated debentures |
— | (17 | ) | (17 | ) | |||||||
|
|
|
|
|
|
|
|||||||
| Total interest expense |
$ | 266 | $ | (1,061 | ) | $ | (795 | ) | ||||
|
|
|
|
|
|
|
|||||||
| Net interest income |
$ | 4,649 | $ | 877 | $ | 5,526 | ||||||
|
|
|
|
|
|
|
|||||||
| (1) | The change in interest income and interest expense due to changes in both volume and rate, which cannot be segregated, has been allocated proportionately to the change due to volume and the change due to rate. |
See accompanying notes to consolidated financial statements.
16
Liquidity and Capital Resources
Civista maintains a conservative liquidity position. All securities are classified as available for sale. At December 31, 2016, securities with maturities of one year or less, totaled $9,172, or 4.7%, of the total security portfolio. The available for sale portfolio helps to provide Civista with the ability to meet its funding needs. The Consolidated Statements of Cash Flows contained in the Consolidated Financial Statements detail the Company’s cash flows from operating activities resulting from net earnings.
Net cash provided by operating activities for 2016, 2015 and 2014 was $17,709, $15,073 and $14,886, respectively. The primary additions to cash from operating activities are from changes in amortization of intangible assets, amortization of securities net of accretion, the provision for loan losses, depreciation and proceeds from sale of loans. The primary use of cash from operating activities is from loans originated for sale. Net cash used for investing activities was $63,575, $11,904 and $48,496 in 2016, 2015 and 2014, respectively, principally reflecting our loan and investment security activities. Deposit and borrowing cash flows have comprised most of our financing activities, which resulted in net cash provided by of $47,000, $2,534 and $29,282 for 2016, 2015 and 2014 respectively.
Future loan demand of Civista can be funded by increases in deposit accounts, proceeds from payments on existing loans, the maturity of securities, the issuances of trust preferred obligations, and the sale of securities classified as available for sale. Additional sources of funds may also come from borrowing in the Federal Funds market and/or borrowing from the FHLB. As of December 31, 2016, Civista had total credit availability with the FHLB of $144,268 of which $48,500 was outstanding.
On a separate entity basis, CBI’s primary source of funds is dividends paid primarily by Civista. Generally, subject to applicable minimum capital requirements, Civista may declare a dividend without the approval of the Federal Reserve Bank of Cleveland and the State of Ohio Department of Commerce, Division of Financial Institutions, provided the total dividends in a calendar year do not exceed the total of its profits for that year combined with its retained profits for the two preceding years. At December 31, 2016, Civista was able to pay dividends to CBI without obtaining regulatory approval. During 2016, Civista did not pay dividends to CBI.
In addition to the restrictions placed on dividends by banking regulations, the Company is subject to restrictions on the payment of dividends as a result of the Company’s issuance of 1,000,000 depositary shares, each representing a 1/40th ownership interest in a Series B Preferred Share, of the Company on December 19, 2013. Under the terms of the Series B Preferred Shares, no dividends may be declared or paid on the common shares of the Company during any calendar quarter unless full dividends on the Series B Preferred Shares (and, therefore, the depositary shares) have been declared for that quarter and all dividends previously declared on the Series B Preferred Shares (and, therefore, the depositary shares) have been paid in full.
See accompanying notes to consolidated financial statements.
17
The Company manages its liquidity and capital through quarterly Asset/Liability Management Committee (ALCO) meetings. The ALCO discusses issues like those in the above paragraphs as well as others that will affect the future liquidity and capital position of the Company. The ALCO also examines interest rate risk and the effect that changes in rates will have on the Company. For more information about interest rate risk, please refer to the “Quantitative and Qualitative Disclosures about Market Risk” section.
Capital Adequacy
Shareholders’ equity totaled $137,616 at December 31, 2016 compared to $125,173 at December 31, 2015. The increase in shareholders’ equity resulted primarily from net income of $17,217, which was offset by dividends on preferred shares and common shares of $1,501 and $1,753, respectively.
During the first quarter of 2015, the Company adopted the new BASEL III regulatory capital framework as approved by the federal banking agencies. In addition to the existing regulatory capital rules, the final BASEL III rules also require the Company to now maintain minimum amounts and ratios of Common Equity Tier 1 (“CET1”) Capital to risk-weighted assets (as these terms are defined in the BASEL III rules). Under the BASEL III rules, the Company elected to opt-out of including accumulated other comprehensive income in regulatory capital. All of the Company’s capital ratios exceeded the regulatory minimum guidelines as of December 31, 2016 and December 31, 2015 as identified in the following table:
| Total Risk Based Capital |
Tier I Risk Based Capital |
CET1 Risk Based Capital |
Leverage Ratio |
|||||||||||||
| Company Ratios—December 31, 2016 |
14.2 | % | 13.0 | % | 8.6 | % | 10.6 | % | ||||||||
| Company Ratios—December 31, 2015 |
14.0 | % | 12.7 | % | 7.6 | % | 10.0 | % | ||||||||
| For Capital Adequacy Purposes |
8.0 | % | 6.0 | % | 4.5 | % | 4.0 | % | ||||||||
| To Be Well Capitalized Under Prompt Corrective Action Provisions |
10.0 | % | 8.0 | % | 6.5 | % | 5.0 | % | ||||||||
Common equity for the CET1 risk-based capital ratio includes common stock (plus related surplus) and retained earnings, plus limited amounts of minority interests in the form of common stock, less the majority of certain regulatory deductions.
Tier 1 capital includes common equity as defined for the CET1 risk-based capital ratio, plus certain non-cumulative preferred stock and related surplus, cumulative preferred stock and related surplus and trust preferred securities that have been grandfathered (but which are not permitted going forward), and limited amounts of minority interests in the form of additional Tier 1 capital instruments, less certain deductions.
Tier 2 capital, which can be included in the total capital ratio, includes certain capital instruments (such as subordinated debt) and limited amounts of the allowance for loan and lease losses, subject to new eligibility criteria, less applicable deductions.
See accompanying notes to consolidated financial statements.
18
The deductions from CET1 capital include goodwill and other intangibles, certain deferred tax assets, mortgage-servicing assets above certain levels, gains on sale in connection with a securitization, investments in a banking organization’s own capital instruments and investments in the capital of unconsolidated financial institutions (above certain levels). The deductions phase in from 2015 through 2019.
Under applicable regulatory guidelines, capital is compared to the relative risk related to the balance sheet. To derive the risk included in the balance sheet, one of several risk weights is applied to different balance sheet and off-balance sheet assets, primarily based on the relative credit risk of the counterparty. The capital amounts and classification are also subject to qualitative judgments by the regulators about components, risk weightings and other factors. Some of the risk weightings were changed effective January 1, 2015.
The new regulatory capital rules and regulations also place restrictions on the payment of capital distributions, including dividends, and certain discretionary bonus payments to executive officers if the company does not hold a capital conservation buffer of greater than 2.5 percent composed of CET1 capital above its minimum risk-based capital requirements, or if its eligible retained income is negative in that quarter and its capital conservation buffer ratio was less than 2.5 percent at the beginning of the quarter. The capital conservation buffer phases in starting on January 1, 2016, at 0.625%. The implementation of Basel III is not expected to have a material impact on CBI’s or Civista’ capital ratios.
Effects of Inflation
The Company’s balance sheet is typical of financial institutions and reflects a net positive monetary position whereby monetary assets exceed monetary liabilities. Monetary assets and liabilities are those which can be converted to a fixed number of dollars and include cash assets, securities, loans, money market instruments, deposits and borrowed funds.
During periods of inflation, a net positive monetary position may result in an overall decline in purchasing power of an entity. No clear evidence exists of a relationship between the purchasing power of an entity’s net positive monetary position and its future earnings. Moreover, the Company’s ability to preserve the purchasing power of its net positive monetary position will be partly influenced by the effectiveness of its asset/liability management program. As part of the asset/liability management process, management reviews and monitors information and projections on inflation as published by the Federal Reserve Board and other sources. This information speaks to inflation as determined by its impact on consumer prices and also the correlation of inflation and interest rates. This information is but one component in an asset/liability management process designed to limit the impact of inflation on the Company. Management does not believe that the effect of inflation on its nonmonetary assets (primarily bank premises and equipment) is material as such assets are not held for resale and significant disposals are not anticipated.
Fair Value of Financial Instruments
The Company has disclosed the fair value of its financial instruments at December 31, 2016 and 2015 in Note 17 to the Consolidated Financial Statements. The fair value of loans at December 31, 2016 was 100.5% of the carrying value compared to 100.0% at December 31, 2015. The fair value of deposits was 100.1% of the carrying value at December 31, 2015 and December 31, 2014.
See accompanying notes to consolidated financial statements.
19
Contractual Obligations
The following table represents significant fixed and determinable contractual obligations of the Company as of December 31, 2016.
| Contractual Obligations |
One year or less |
One to three years |
Three to five years |
Over five years |
Total | |||||||||||||||
| Deposits without a stated maturity |
$ | 913,677 | $ | — | $ | — | $ | — | $ | 913,677 | ||||||||||
| Certificates of deposit and IRAs |
138,657 | 59,097 | 9,287 | 385 | 207,426 | |||||||||||||||
| FHLB advances, securities sold under agreements to repurchase and U.S. Treasury interest-bearing demand note |
62,425 | 15,000 | — | — | 77,425 | |||||||||||||||
| Subordinated debentures (1) |
— | — | — | 29,427 | 29,427 | |||||||||||||||
| Operating leases |
537 | 681 | 160 | 23 | 1,401 | |||||||||||||||
| (1) | The subordinated debentures consist of $2,000, $2,500, $5,000, $7,500, and $12,500 debentures. |
The Company has retail repurchase agreements with clients within its local market areas. These borrowings are collateralized with securities owned by the Company. See Note 12 to the Consolidated Financial Statements for further detail. The Company also has a cash management advance line of credit and outstanding letters of credit with the FHLB. For further discussion, refer to Note 10 and Note 11 to the Consolidated Financial Statements.
Quantitative and Qualitative Disclosures about Market Risk
The Company’s primary market risk exposure is interest-rate risk and, to a lesser extent, liquidity risk. All of the Company’s transactions are denominated in U.S. dollars with no specific foreign exchange exposure.
Interest-rate risk is the exposure of a banking organization’s financial condition to adverse movements in interest rates. Accepting this risk can be an important source of profitability and shareholder value. However, excessive levels of interest-rate risk can pose a significant threat to the Company’s earnings and capital base. Accordingly, effective risk management that maintains interest-rate risk at prudent levels is essential to the Company’s safety and soundness.
Evaluating a financial institution’s exposure to changes in interest rates includes assessing both the adequacy of the management process used to control interest-rate risk and the organization’s quantitative level of exposure. When assessing the interest-rate risk management process, the Company seeks to ensure that appropriate policies, procedures, management information systems and internal controls are in place to maintain interest-rate risk at prudent levels with consistency and continuity. Evaluating the quantitative level of interest rate risk exposure requires the Company to assess the existing and potential future effects of changes in interest rates on its consolidated financial condition, including capital adequacy, earnings, liquidity and, where appropriate, asset quality.
The Federal Reserve Board, together with the Office of the Comptroller of the Currency and the Federal Deposit Insurance Corporation, adopted a Joint Agency Policy Statement on interest-rate risk, effective June 26, 1996. The policy statement provides guidance to examiners and bankers on sound practices for managing interest-rate risk, which will form the basis for ongoing evaluation of the adequacy of interest-rate risk management at supervised institutions. The policy statement also outlines fundamental elements of sound management that have been identified in prior Federal Reserve guidance and discusses the importance of these elements in the context of managing interest-rate risk. Specifically, the
See accompanying notes to consolidated financial statements.
20
guidance emphasizes the need for active board of director and senior management oversight and a comprehensive risk-management process that effectively identifies, measures, and controls interest-rate risk. Financial institutions derive their income primarily from the excess of interest collected over interest paid. The rates of interest an institution earns on its assets and owes on its liabilities generally are established contractually for a period of time. Since market interest rates change over time, an institution is exposed to lower profit margins (or losses) if it cannot adapt to interest-rate changes. For example, assume that an institution’s assets carry intermediate- or long-term fixed rates and that those assets were funded with short-term liabilities. If market interest rates rise by the time the short-term liabilities must be refinanced, the increase in the institution’s interest expense on its liabilities may not be sufficiently offset if assets continue to earn at the long-term fixed rates. Accordingly, an institution’s profits could decrease on existing assets because the institution will have either lower net interest income or, possibly, net interest expense. Similar risks exist when assets are subject to contractual interest-rate ceilings, or rate sensitive assets are funded by longer-term, fixed-rate liabilities in a decreasing-rate environment.
Several techniques may be used by an institution to minimize interest-rate risk. One approach used by the Company is to periodically analyze its assets and liabilities and make future financing and investment decisions based on payment streams, interest rates, contractual maturities, and estimated sensitivity to actual or potential changes in market interest rates. Such activities fall under the broad definition of asset/liability management. The Company’s primary asset/liability management technique is the measurement of the Company’s asset/liability gap, that is, the difference between the cash flow amounts of interest sensitive assets and liabilities that will be refinanced (or repriced) during a given period. For example, if the asset amount to be repriced exceeds the corresponding liability amount for a certain day, month, year, or longer period, the institution is in an asset sensitive gap position. In this situation, net interest income would increase if market interest rates rose or decrease if market interest rates fell.
If, alternatively, more liabilities than assets will reprice, the institution is in a liability sensitive position. Accordingly, net interest income would decline when rates rose and increase when rates fell. Also, these examples assume that interest rate changes for assets and liabilities are of the same magnitude, whereas actual interest rate changes generally differ in magnitude for assets and liabilities.
Several ways an institution can manage interest-rate risk include selling existing assets or repaying certain liabilities and matching repricing periods for new assets and liabilities, for example, by shortening terms of new loans or securities. Financial institutions are also subject to prepayment risk in falling rate environments. For example, mortgage loans and other financial assets may be prepaid by a debtor so that the debtor may refund its obligations at new, lower rates. The Company does not have significant derivative financial instruments and does not intend to purchase a significant amount of such instruments in the near future. Prepayments of assets carrying higher rates reduce the Company’s interest income and overall asset yields. A large portion of an institution’s liabilities may be short term or due on demand, while most of its assets may be invested in long term loans or securities. Accordingly, the Company seeks to have in place sources of cash to meet short-term demands. These funds can be obtained by increasing deposits, borrowing, or selling assets. Also, FHLB advances and wholesale borrowings may be used as important sources of liquidity for the Company.
See accompanying notes to consolidated financial statements.
21
The following table provides information about the Company’s financial instruments that are sensitive to changes in interest rates as of December 31, 2016 and 2015, based on certain prepayment and account decay assumptions that management believes are reasonable. The Company had derivative financial instruments as of December 31, 2016 and 2015. The changes in fair value of the assets and liabilities of the underlying contracts offset each other. For more information about derivative financial instruments see Note 24 to the Consolidated Financial Statements. Expected maturity date values for interest-bearing core deposits were calculated based on estimates of the period over which the deposits would be outstanding. The Company’s borrowings were tabulated by contractual maturity dates and without regard to any conversion or repricing dates.
| Net Portfolio Value
|
||||||||||||||||||||||||
| December 31, 2016 | December 31, 2015 | |||||||||||||||||||||||
| Change in Rates |
Dollar Amount |
Dollar Change |
Percent Change |
Dollar Amount |
Dollar Change |
Percent Change |
||||||||||||||||||
| +200bp |
$ | 229,366 | $ | 31,559 | 16 | % | $ | 188,643 | $ | 25,222 | 15 | % | ||||||||||||
| +100bp |
219,008 | 21,201 | 11 | % | 180,892 | 17,471 | 11 | % | ||||||||||||||||
| Base |
197,807 | — | — | 163,421 | — | — | ||||||||||||||||||
| -100bp |
186,624 | (11,183 | ) | -6 | % | 163,804 | 383 | 0 | % | |||||||||||||||
The change in net portfolio value from December 31, 2015 to December 31, 2016, can be attributed to both increases the volume and mix of assets and funding sources. To a lesser extent, the yield curve has flattened slightly since the end of the last year. The growth in loans compared to the end of the year contributed to the base being higher. The change in the mix of assets and the current rate environment, has somewhat muted asset volatility. The funding volume and mix has shifted from borrowed money and CDs to deposits, which slightly increases volatility. Beyond the change in the base level of net portfolio value, projected movements in rates, up or down, would also lead to changes in market values. The change in the rates up scenarios for both the 100 and 200 basis point movements would lead to a decrease in the fair value of liabilities as well as an increase in the fair value of assets. Accordingly we would see an increase in the net portfolio value. However, a downward change in rates would lead to a decrease in the net portfolio value as the fair value of liabilities would increase while the fair value of assets would decrease slightly.
Critical Accounting Policies
Allowance for Loan Losses: The allowance for loan losses is regularly reviewed by management to determine that the amount is considered adequate to absorb probable losses in the loan portfolio. If not, an additional provision is made to increase the allowance. This evaluation includes specific loss estimates on certain individually reviewed impaired loans, the pooling of commercial credits risk graded as special mention and substandard that are not individually analyzed, and general loss estimates that are based upon the size, quality, and concentration characteristics of the various loan portfolios, adverse situations that may affect a borrower’s ability to repay, and current economic and industry conditions, among other items.
Those judgments and assumptions that are most critical to the application of this accounting policy are assessing the initial and on-going credit-worthiness of the borrower, the amount and timing of future cash flows of the borrower that are available for repayment of the loan, the sufficiency of underlying collateral, the enforceability of third-party guarantees, the frequency and subjectivity of loan reviews and risk ratings, emerging or changing trends that might not be fully captured in the historical loss experience, and charges against the allowance for actual losses that are greater than previously estimated. These judgments and assumptions are dependent upon or can be influenced by a variety of factors, including the breadth and depth of experience of lending officers, credit administration and the corporate loan review staff that periodically review the status of the loan, changing economic and industry conditions, changes in the financial condition of the borrower and changes in the value and availability of the underlying collateral and guarantees.
See accompanying notes to consolidated financial statements.
22
Note 1 and Note 5 to the Consolidated Financial Statements provide additional information regarding Allowance for Loan Losses.
Goodwill: The Company performs an evaluation of goodwill for impairment on an annual basis, or more frequently if events or changes in circumstances indicate that the asset might be impaired. Management performed an evaluation of the Company’s goodwill during the fourth quarter of 2016. In performing its evaluation, management obtained several commonly used financial ratios from pending and completed purchase transactions for banks based in the Midwest. Management used these ratios to determine an implied fair value for the Company. The implied fair value exceeded the carrying value including goodwill. Therefore management concluded that goodwill was not impaired and made no adjustment in 2016.
Income Taxes: We determine our liabilities for income taxes based on current tax regulation. In estimating income taxes payable or receivable, we assess the relative merits and risks of the appropriate tax treatment considering statutory, judicial, and regulatory guidance in the context of each tax position. Accordingly, previously estimated liabilities are regularly reevaluated and adjusted through the provision for income taxes. Changes in the estimate of income taxes payable or receivable occur periodically due to changes in tax rates, interpretations of tax law, the status of examinations being conducted by various taxing authorities, and newly enacted statutory, judicial and regulatory guidance that impact the relative merits and risks of each tax position. These changes, when they occur, may affect the provision for income taxes as well as current and deferred income taxes, and may be significant to our statements of income and condition.
Management’s determination of the realization of net deferred tax assets is based upon management’s judgment of various future events and uncertainties, including the timing and amount of future income, as well as the implementation of various tax planning strategies to maximize realization of the deferred tax assets. A valuation allowance is provided when it is more likely than not that some portion of the deferred tax asset will not be realized.
Other-Than-Temporary Impairment of Investment Securities: The Company performs a quarterly valuation to determine if a decline in the value of an investment security is other than temporary. Although the term “other than temporary” is not intended to indicate that the decline is permanent, it does indicate that the prospects for a near-term recovery of value are not necessarily favorable, or that there is lack of evidence to support fair values equal to or greater than the carrying value of the investment. Once a decline in value is determined to be other than temporary, the value of the security is reduced and a corresponding charge to earnings is recognized. Management utilizes criteria such as the magnitude and duration of the decline, in addition to the reasons underlying the decline, to determine whether the loss in value is other than temporary.
Pension Benefits: Pension costs and liabilities are dependent on assumptions used in calculating such amounts. These assumptions include discount rates, benefits earned, interest costs, expected return on plan assets, mortality rates, and other factors. In accordance with GAAP, actual results that differ from the assumptions are accumulated and amortized over future periods and, therefore, generally affect recognized expense and the recorded obligation of future periods. While management believes that the assumptions used are appropriate, differences in actual experience or changes in assumptions may affect the Company’s pension obligations and future expense. Our pension benefits are described further in Note 15 of the “Notes to Consolidated Financial Statements.”
See accompanying notes to consolidated financial statements.
23
Management’s Report on Internal Control over Financial Reporting
We, as management of Civista Bancshares, Inc., are responsible for establishing and maintaining effective internal control over financial reporting that is designed to produce reliable financial statements in conformity with United States generally accepted accounting principles. The system of internal control over financial reporting as it relates to the financial statements is evaluated for effectiveness by management and tested for reliability through a program of internal audits. Actions are taken to correct potential deficiencies as they are identified. Any system of internal control, no matter how well designed, has inherent limitations, including the possibility that a control can be circumvented or overridden and misstatements due to error or fraud may occur and not be detected. Also, because of changes in conditions, internal control effectiveness may vary over time. Accordingly, even an effective system of internal control will provide only reasonable assurance with respect to financial statement preparation.
Management assessed the Company’s system of internal control over financial reporting as of December 31, 2016, in relation to criteria for effective internal control over financial reporting as described in “2013 Internal Control – Integrated Framework,” issued by the Committee of Sponsoring Organizations of the Treadway Commission. Based on this assessment, management concludes that, as of December 31, 2016, its system of internal control over financial reporting is effective and meets the criteria of the “2013 Internal Control – Integrated Framework”. S.R. Snodgrass, P.C., independent registered public accounting firm, has issued an audit report on the effectiveness of the Company’s internal control over financial reporting as of December 31, 2016.
Management is responsible for compliance with the federal and state laws and regulations concerning dividend restrictions and federal laws and regulations concerning loans to insiders designated by the FDIC as safety and soundness laws and regulations.
Management has assessed compliance by the Company with the designated laws and regulations relating to safety and soundness. Based on the assessment, management believes that the Company complied, in all significant respects, with the designated laws and regulations related to safety and soundness for the year ended December 31, 2016.

|

| |||
| James O. Miller | Todd A. Michel | |||
| President, Chief Executive Officer, | Senior Vice President, Controller | |||
| Chairman of the Board | ||||
| Sandusky, Ohio | ||||
| March 15, 2017 | ||||
See accompanying notes to consolidated financial statements.
24
Report of Independent Registered Public Accounting Firm on Internal Control over Financial Reporting
Board of Directors and Stockholders
Civista Bancshares, Inc.
Sandusky, Ohio
We have audited Civista Bancshares, Inc. and subsidiaries’ internal control over financial reporting as of December 31, 2016, based on criteria established in Internal Control — Integrated Framework issued by the Committee of Sponsoring Organizations of the Treadway Commission (“COSO”) in 2013. Civista Bancshares, Inc.’s management is responsible for maintaining effective internal control over financial reporting and for its assessment of the effectiveness of internal control over financial reporting included in the accompanying Management’s Report on Internal Control over Financial Reporting. Our responsibility is to express an opinion on the company’s internal control over financial reporting based on our audit.
We conducted our audit in accordance with the standards of the Public Company Accounting Oversight Board (United States). Those standards require that we plan and perform the audit to obtain reasonable assurance about whether effective internal control over financial reporting was maintained in all material respects. Our audit included obtaining an understanding of internal control over financial reporting, assessing the risk that a material weakness exists, and testing and evaluating the design and operating effectiveness of internal control based on the assessed risk. Our audit also included performing such other procedures as we considered necessary in the circumstances. We believe that our audit provides a reasonable basis for our opinion.
A company’s internal control over financial reporting is a process designed to provide reasonable assurance regarding the reliability of financial reporting and the preparation of financial statements for external purposes in accordance with generally accepted accounting principles. A company’s internal control over financial reporting includes those policies and procedures that (a) pertain to the maintenance of records that, in reasonable detail, accurately and fairly reflect the transactions and dispositions of the assets of the company; (b) provide reasonable assurance that transactions are recorded, as necessary, to permit preparation of financial statements in accordance with generally accepted accounting principles, and that receipts and expenditures of the company are being made only in accordance with authorizations of management and directors of the company; and (c) provide reasonable assurance regarding prevention or timely detection of unauthorized acquisition, use, or disposition of the company’s assets that could have a material effect on the financial statements.
Because of its inherent limitations, internal control over financial reporting may not prevent or detect misstatements. Also, projections of any evaluation of effectiveness to future periods are subject to the risk that controls may become inadequate because of changes in conditions, or that the degree of compliance with the policies or procedures may deteriorate.
In our opinion, Civista Bancshares, Inc. maintained, in all material respects, effective internal control over financial reporting as of December 31, 2016, based on criteria established in Internal Control — Integrated Framework issued by COSO in 2013.
We have also audited, in accordance with the standards of the Public Company Accounting Oversight Board (United States), the consolidated balance sheets of Civista Bancshares Inc. and subsidiaries as of December 31, 2016 and 2015, and the related consolidated statements of operations, comprehensive income, changes in shareholders’ equity, and cash flows for each of the three years in the period ended December 31, 2016, and our report dated March 15, 2017, expressed an unqualified opinion.

Cranberry Township, Pennsylvania
March 15, 2017
See accompanying notes to consolidated financial statements.
25
Report of Independent Registered Public Accounting Firm on Financial Statements
Board of Directors and Stockholders
Civista Bancshares, Inc.
Sandusky, Ohio
We have audited the accompanying consolidated balance sheets of Civista Bancshares, Inc. and subsidiaries as of December 31, 2016 and 2015, and the related consolidated statements of operations, comprehensive income, changes in shareholders’ equity, and cash flows for each of the three years in the period ended December 31, 2016. These consolidated financial statements are the responsibility of Civista Bancshares, Inc.’s management. Our responsibility is to express an opinion on these financial statements based on our audits.
We conducted our audits in accordance with the standards of the Public Company Accounting Oversight Board (United States). Those standards require that we plan and perform the audits to obtain reasonable assurance about whether the financial statements are free of material misstatement. An audit includes examining, on a test basis, evidence supporting the amounts and disclosures in the financial statements. An audit also includes assessing the accounting principles used and significant estimates made by management, as well as evaluating the overall financial statement presentation. We believe that our audits provide a reasonable basis for our opinion.
In our opinion, the consolidated financial statements referred to above present fairly, in all material respects, the consolidated financial position of Civista Bancshares, Inc. and subsidiaries as of December 31, 2016 and 2015, and the results of their operations and their cash flows for each of the three years in the period ended December 31, 2016, in conformity with U.S. generally accepted accounting principles.
We have also audited, in accordance with the standards of the Public Company Accounting Oversight Board (United States), Civista Bancshares, Inc. and subsidiaries’ internal control over financial reporting as of December 31, 2016, based on criteria established in Internal Control – Integrated Framework issued by the Committee of Sponsoring Organizations of the Treadway Commission in 2013, and our report dated March 15, 2017, expressed an unqualified opinion on the effectiveness of Civista Bancshares, Inc.’s internal control over financial reporting.

Cranberry Township, Pennsylvania
March 15, 2017
See accompanying notes to consolidated financial statements.
26
This page left blank intentionally.
See accompanying notes to consolidated financial statements.
27
CIVISTA BANCSHARES, INC.
CONSOLIDATED BALANCE SHEETS
December 31, 2016 and 2015
(Amounts in thousands, except share data)
| 2016 | 2015 | |||||||
| ASSETS |
||||||||
| Cash and due from financial institutions |
$ | 36,695 | $ | 35,561 | ||||
| Securities available for sale |
195,864 | 196,249 | ||||||
| Loans held for sale |
2,268 | 2,698 | ||||||
| Loans, net of allowance of $13,305 and $14,361 |
1,042,201 | 987,166 | ||||||
| Other securities |
14,055 | 13,452 | ||||||
| Premises and equipment, net |
17,920 | 16,944 | ||||||
| Accrued interest receivable |
3,854 | 3,902 | ||||||
| Goodwill |
27,095 | 27,095 | ||||||
| Other intangible assets |
1,784 | 2,409 | ||||||
| Bank owned life insurance |
24,552 | 20,104 | ||||||
| Other assets |
10,975 | 9,461 | ||||||
|
|
|
|
|
|||||
| Total assets |
$ | 1,377,263 | $ | 1,315,041 | ||||
|
|
|
|
|
|||||
| LIABILITIES |
||||||||
| Deposits |
||||||||
| Noninterest-bearing |
$ | 345,588 | $ | 300,615 | ||||
| Interest-bearing |
775,515 | 751,418 | ||||||
|
|
|
|
|
|||||
| Total deposits |
1,121,103 | 1,052,033 | ||||||
| Federal Home Loan Bank advances |
48,500 | 71,200 | ||||||
| Securities sold under agreements to repurchase |
28,925 | 25,040 | ||||||
| Subordinated debentures |
29,427 | 29,427 | ||||||
| Accrued expenses and other liabilities |
11,692 | 12,168 | ||||||
|
|
|
|
|
|||||
| Total liabilities |
1,239,647 | 1,189,868 | ||||||
|
|
|
|
|
|||||
| SHAREHOLDERS’ EQUITY |
||||||||
| Preferred stock, no par value, 200,000 shares authorized Series B Preferred stock, $1,000 liquidation preference, 20,481 shares issued at December 31, 2016 and 24,072 shares issued at December 31, 2015, net of issuance costs |
18,950 | 22,273 | ||||||
| Common stock, no par value, 20,000,000 shares authorized, 9,091,473 shares issued at December 31, 2016 and 8,591,542 shares issued at December 31, 2015 |
118,975 | 115,330 | ||||||
| Accumulated earnings |
19,263 | 5,300 | ||||||
| Treasury stock, 747,964 shares at cost |
(17,235 | ) | (17,235 | ) | ||||
| Accumulated other comprehensive loss |
(2,337 | ) | (495 | ) | ||||
|
|
|
|
|
|||||
| Total shareholders’ equity |
137,616 | 125,173 | ||||||
|
|
|
|
|
|||||
| Total liabilities and shareholders’ equity |
$ | 1,377,263 | $ | 1,315,041 | ||||
|
|
|
|
|
|||||
See accompanying notes to consolidated financial statements.
28
CIVISTA BANCSHARES, INC.
CONSOLIDATED STATEMENTS OF OPERATIONS
Years ended December 31, 2016, 2015 and 2014
(Amounts in thousands, except share data)
| 2016 | 2015 | 2014 | ||||||||||
| Interest and dividend income |
||||||||||||
| Loans, including fees |
$47,186 | $44,784 | $40,032 | |||||||||
| Taxable securities |
3,319 | 3,232 | 3,443 | |||||||||
| Tax-exempt securities |
2,666 | 2,583 | 2,356 | |||||||||
| Federal funds sold and other |
396 | 102 | 139 | |||||||||
|
|
|
|
|
|
|
|||||||
| Total interest and dividend income |
53,567 | 50,701 | 45,970 | |||||||||
|
|
|
|
|
|
|
|||||||
| Interest expense |
||||||||||||
| Deposits |
1,996 | 2,087 | 2,292 | |||||||||
| Federal Home Loan Bank advances |
405 | 442 | 1,015 | |||||||||
| Subordinated debentures |
884 | 760 | 777 | |||||||||
| Securities sold under agreements to repurchase |
23 | 20 | 20 | |||||||||
|
|
|
|
|
|
|
|||||||
| Total interest expense |
3,308 | 3,309 | 4,104 | |||||||||
|
|
|
|
|
|
|
|||||||
| Net interest income |
50,259 | 47,392 | 41,866 | |||||||||
| Provision (credit) for loan losses |
(1,300 | ) | 1,200 | 1,500 | ||||||||
|
|
|
|
|
|
|
|||||||
| Net interest income after provision (credit) for loan losses |
51,559 | 46,192 | 40,366 | |||||||||
|
|
|
|
|
|
|
|||||||
| Noninterest income |
||||||||||||
| Service charges |
4,832 | 4,708 | 4,257 | |||||||||
| Net gain (loss) on sale of securities |
19 | (18 | ) | 113 | ||||||||
| Net gain on sale of loans |
1,750 | 1,106 | 659 | |||||||||
| ATM fees |
2,094 | 1,986 | 1,850 | |||||||||
| Wealth management fees |
2,678 | 2,823 | 3,130 | |||||||||
| Bank owned life insurance |
563 | 467 | 492 | |||||||||
| Tax refund processing fees |
2,750 | 2,000 | 2,324 | |||||||||
| Computer center item processing fees |
251 | 267 | 260 | |||||||||
| Net gain on sale of other real estate owned |
152 | 199 | 44 | |||||||||
| Other |
1,043 | 740 | 745 | |||||||||
|
|
|
|
|
|
|
|||||||
| Total noninterest income |
16,132 | 14,278 | 13,874 | |||||||||
|
|
|
|
|
|
|
|||||||
| Noninterest expense |
||||||||||||
| Salaries, wages and benefits |
25,323 | 23,630 | 22,293 | |||||||||
| Net occupancy expense |
2,700 | 2,416 | 2,256 | |||||||||
| Equipment expense |
1,641 | 1,503 | 1,421 | |||||||||
| Contracted data processing |
1,546 | 1,821 | 1,560 | |||||||||
| FDIC Assessment |
611 | 864 | 905 | |||||||||
| State franchise tax |
923 | 847 | 888 | |||||||||
| Professional services |
1,895 | 2,461 | 1,855 | |||||||||
| Amortization of intangible assets |
699 | 711 | 769 | |||||||||
| ATM expense |
605 | 674 | 806 | |||||||||
| Marketing expense |
929 | 1,039 | 1,604 | |||||||||
| Repossession expense |
253 | 508 | 673 | |||||||||
| Other operating expenses |
6,730 | 6,470 | 6,520 | |||||||||
|
|
|
|
|
|
|
|||||||
| Total noninterest expense |
43,855 | 42,944 | 41,550 | |||||||||
|
|
|
|
|
|
|
|||||||
| Income before income taxes |
23,836 | 17,526 | 12,690 | |||||||||
| Income taxes |
6,619 | 4,781 | 3,162 | |||||||||
|
|
|
|
|
|
|
|||||||
| Net income |
17,217 | 12,745 | 9,528 | |||||||||
| Preferred stock dividends |
1,501 | 1,577 | 1,873 | |||||||||
|
|
|
|
|
|
|
|||||||
| Net income available to common shareholders |
$15,716 | $11,168 | $7,655 | |||||||||
|
|
|
|
|
|
|
|||||||
| Earnings per common share, basic |
$1.96 | $1.43 | $0.99 | |||||||||
|
|
|
|
|
|
|
|||||||
| Earnings per common share, diluted |
$1.57 | $1.17 | $0.85 | |||||||||
|
|
|
|
|
|
|
|||||||
See accompanying notes to consolidated financial statements.
29
CIVISTA BANCSHARES, INC.
CONSOLIDATED COMPREHENSIVE INCOME STATEMENTS
Years ended December 31, 2016, 2015 and 2014
(Amounts in thousands)
| 2016 | 2015 | 2014 | ||||||||||
| Net income |
$17,217 | $12,745 | $9,528 | |||||||||
| Other comprehensive income (loss): |
||||||||||||
| Unrealized holding gains (loss) on available for sale securities |
(2,342 | ) | (267 | ) | 5,134 | |||||||
| Tax effect |
796 | 91 | (1,745 | ) | ||||||||
| Pension liability adjustment |
(448 | ) | (412 | ) | 1,228 | |||||||
| Tax effect |
152 | 140 | (417 | ) | ||||||||
|
|
|
|
|
|
|
|||||||
| Total other comprehensive income (loss) |
(1,842 | ) | (448 | ) | 4,200 | |||||||
|
|
|
|
|
|
|
|||||||
| Comprehensive income |
$15,375 | $12,297 | $13,728 | |||||||||
|
|
|
|
|
|
|
|||||||
See accompanying notes to consolidated financial statements.
30
CIVISTA BANCSHARES, INC.
CONSOLIDATED STATEMENTS OF CHANGES IN SHAREHOLDERS’ EQUITY
Years ended December 31, 2016, 2015 and 2014
(Amounts in thousands, except share data)
| Preferred Stock | Common Stock | Accumulated (Deficit) |
Treasury | Accumulated Other Comprehensive |
Total Shareholders’ |
|||||||||||||||||||||||||||
| Shares | Amount | Shares | Amount | Earnings | Stock | Loss | Equity | |||||||||||||||||||||||||
| Balance, December 31, 2013 |
48,184 | $ | 46,316 | 7,707,917 | $ | 114,365 | $ | (10,823 | ) | $ | (17,235 | ) | $ | (4,247 | ) | $ | 128,376 | |||||||||||||||
|
|
|
|
|
|
|
|
|
|
|
|
|
|
|
|
|
|||||||||||||||||
| Net income |
9,528 | 9,528 | ||||||||||||||||||||||||||||||
| Other comprehensive income |
4,200 | 4,200 | ||||||||||||||||||||||||||||||
| Cash dividends ($0.19 per share) |
(1,465 | ) | (1,465 | ) | ||||||||||||||||||||||||||||
| Preferred stock dividends |
(1,873 | ) | (1,873 | ) | ||||||||||||||||||||||||||||
| Redemption of Series A preferred stock |
(23,184 | ) | (23,184 | ) | 327 | (22,857 | ) | |||||||||||||||||||||||||
|
|
|
|
|
|
|
|
|
|
|
|
|
|
|
|
|
|||||||||||||||||
| Balance, December 31, 2014 |
25,000 | $ | 23,132 | 7,707,917 | $ | 114,365 | $ | (4,306 | ) | $ | (17,235 | ) | $ | (47 | ) | $ | 115,909 | |||||||||||||||
|
|
|
|
|
|
|
|
|
|
|
|
|
|
|
|
|
|||||||||||||||||
| Net income |
12,745 | 12,745 | ||||||||||||||||||||||||||||||
| Other comprehensive loss |
(448 | ) | (448 | ) | ||||||||||||||||||||||||||||
| Conversion of Series B preferred shares to common shares |
(928 | ) | (859 | ) | 118,678 | 859 | — | |||||||||||||||||||||||||
| Stock-based compensation |
16,983 | 106 | 106 | |||||||||||||||||||||||||||||
| Cash dividends ($0.20 per share) |
(1,562 | ) | (1,562 | ) | ||||||||||||||||||||||||||||
| Preferred stock dividends |
(1,577 | ) | (1,577 | ) | ||||||||||||||||||||||||||||
|
|
|
|
|
|
|
|
|
|
|
|
|
|
|
|
|
|||||||||||||||||
| Balance, December 31, 2015 |
24,072 | $ | 22,273 | 7,843,578 | $ | 115,330 | $ | 5,300 | $ | (17,235 | ) | $ | (495 | ) | $ | 125,173 | ||||||||||||||||
|
|
|
|
|
|
|
|
|
|
|
|
|
|
|
|
|
|||||||||||||||||
| Net income |
17,217 | 17,217 | ||||||||||||||||||||||||||||||
| Other comprehensive loss |
(1,842 | ) | (1,842 | ) | ||||||||||||||||||||||||||||
| Conversion of Series B preferred shares to common shares |
(3,591 | ) | (3,323 | ) | 459,192 | 3,322 | (1 | ) | ||||||||||||||||||||||||
| Stock-based compensation |
40,739 | 323 | 323 | |||||||||||||||||||||||||||||
| Cash dividends ($0.22 per share) |
(1,753 | ) | (1,753 | ) | ||||||||||||||||||||||||||||
| Preferred stock dividends |
(1,501 | ) | (1,501 | ) | ||||||||||||||||||||||||||||
|
|
|
|
|
|
|
|
|
|
|
|
|
|
|
|
|
|||||||||||||||||
| Balance, December 31, 2016 |
20,481 | $ | 18,950 | 8,343,509 | $ | 118,975 | $ | 19,263 | $ | (17,235 | ) | $ | (2,337 | ) | $ | 137,616 | ||||||||||||||||
|
|
|
|
|
|
|
|
|
|
|
|
|
|
|
|
|
|||||||||||||||||
See accompanying notes to consolidated financial statements.
31
CIVISTA BANCSHARES, INC.
CONSOLIDATED STATEMENTS OF CASH FLOWS
Years ended December 31, 2016, 2015 and 2014
(Amounts in thousands)
| 2016 | 2015 | 2014 | ||||||||||
| Cash flows from operating activities: |
||||||||||||
| Net income |
$ | 17,217 | $ | 12,745 | $ | 9,528 | ||||||
| Adjustments to reconcile net income to net cash from operating activities |
||||||||||||
| Security amortization, net |
1,383 | 1,410 | 1,491 | |||||||||
| Depreciation |
1,257 | 1,193 | 1,176 | |||||||||
| Amortization of intangible assets |
699 | 711 | 769 | |||||||||
| Accretion of net deferred loan fees |
(172 | ) | (155 | ) | (123 | ) | ||||||
| Net (gain) loss on sale of securities |
(19 | ) | 18 | (113 | ) | |||||||
| Provision (credit) for loan losses |
(1,300 | ) | 1,200 | 1,500 | ||||||||
| Loans originated for sale |
(67,295 | ) | (48,745 | ) | (31,206 | ) | ||||||
| Proceeds from sale of loans |
69,475 | 49,637 | 29,893 | |||||||||
| Net gain on sale of loans |
(1,750 | ) | (1,180 | ) | (659 | ) | ||||||
| Net loss on sale of manufactured home loans |
— | 74 | — | |||||||||
| Net gain on sale of other real estate owned |
(152 | ) | (199 | ) | (44 | ) | ||||||
| Gain on sale of fixed assets |
(1 | ) | — | (60 | ) | |||||||
| Increase in cash surrender value of bank owned life insurance |
(563 | ) | (467 | ) | (492 | ) | ||||||
| Share-based compensation |
323 | 106 | — | |||||||||
| Change in |
||||||||||||
| Accrued interest payable |
61 | (11 | ) | (30 | ) | |||||||
| Accrued interest receivable |
48 | 144 | 29 | |||||||||
| Deferred taxes |
170 | (410 | ) | 11 | ||||||||
| Other, net |
(1,672 | ) | (998 | ) | 3,216 | |||||||
|
|
|
|
|
|
|
|||||||
| Net cash from operating activities |
17,709 | 15,073 | 14,886 | |||||||||
|
|
|
|
|
|
|
|||||||
| Cash flows used for investing activities: |
||||||||||||
| Securities available for sale |
||||||||||||
| Maturities, prepayments and calls |
34,089 | 29,733 | 45,743 | |||||||||
| Sales |
4,349 | — | 18,088 | |||||||||
| Purchases |
(41,759 | ) | (29,772 | ) | (58,367 | ) | ||||||
| Redemption of other securities |
— | 138 | 3,009 | |||||||||
| Purchases of other securities |
(603 | ) | (288 | ) | (171 | ) | ||||||
| Net cash from acquisition |
— | 926 | — | |||||||||
| Purchases of bank owned life insurance |
(3,885 | ) | — | — | ||||||||
| Net loan originations |
(52,022 | ) | (10,225 | ) | (53,562 | ) | ||||||
| Loans purchased, installment |
(1,643 | ) | (4,774 | ) | (4,382 | ) | ||||||
| Proceeds from sale of manufactured homes |
— | 3,492 | — | |||||||||
| Proceeds from sale of OREO properties |
333 | 865 | 349 | |||||||||
| Premises and equipment purchases |
(2,437 | ) | (1,999 | ) | (485 | ) | ||||||
| Proceeds from sale of premises and equipment |
3 | — | 1,282 | |||||||||
|
|
|
|
|
|
|
|||||||
| Net cash used for investing activities |
(63,575 | ) | (11,904 | ) | (48,496 | ) | ||||||
|
|
|
|
|
|
|
|||||||
See accompanying notes to consolidated financial statements.
32
CIVISTA BANCSHARES, INC.
CONSOLIDATED STATEMENTS OF CASH FLOWS (Continued)
Years ended December 31, 2016, 2015 and 2014
(Amounts in thousands)
| 2016 | 2015 | 2014 | ||||||||||
| Cash flows from financing activities: |
||||||||||||
| Increase (decrease) in deposits |
69,070 | (3,754 | ) | 26,443 | ||||||||
| Net change in short-term FHLB advances |
(22,700 | ) | 11,000 | 42,700 | ||||||||
| Repayment of long-term FHLB advances |
— | (5,000 | ) | (30,226 | ) | |||||||
| Proceeds from long-term FHLB advances |
— | — | 15,000 | |||||||||
| Increase in securities sold under repurchase agreements |
3,885 | 3,427 | 1,560 | |||||||||
| Repayment of series A preferred stock |
— | — | (22,857 | ) | ||||||||
| Cash paid on fractional shares on preferred stock conversion |
(1 | ) | — | — | ||||||||
| Cash dividends paid |
(3,254 | ) | (3,139 | ) | (3,338 | ) | ||||||
|
|
|
|
|
|
|
|||||||
| Net cash from financing activities |
47,000 | 2,534 | 29,282 | |||||||||
|
|
|
|
|
|
|
|||||||
| Increase (decrease) in cash and due from financial institutions |
1,134 | 5,703 | (4,328 | ) | ||||||||
| Cash and due from financial institutions at beginning of year |
35,561 | 29,858 | 34,186 | |||||||||
|
|
|
|
|
|
|
|||||||
| Cash and due from financial institutions at end of year |
$ | 36,695 | $ | 35,561 | $ | 29,858 | ||||||
|
|
|
|
|
|
|
|||||||
| Supplemental disclosures of cash flow information: |
||||||||||||
| Interest paid |
$ | 3,247 | $ | 3,315 | $ | 4,134 | ||||||
| Income taxes paid |
5,900 | 3,650 | 1,745 | |||||||||
| Transfer of loans from portfolio to other real estate owned |
102 | 222 | 691 | |||||||||
| Transfer of premises to held-for-sale |
202 | — | — | |||||||||
| Conversion of preferred stock to common stock |
3,323 | 859 | — | |||||||||
| Acquisition of TCNB Financial Corp. |
||||||||||||
| Noncash assets acquired: |
||||||||||||
| Loans receivable |
$ | 76,444 | ||||||||||
| Other securities |
716 | |||||||||||
| Accrued interest receivable |
194 | |||||||||||
| Premises and equipment, net |
1,738 | |||||||||||
| Core deposit intangible |
1,009 | |||||||||||
| Other assets |
472 | |||||||||||
|
|
|
|||||||||||
| Total non cash assets acquired |
80,573 | |||||||||||
| Liabilities assumed: |
||||||||||||
| Deposits |
86,869 | |||||||||||
| Other liabilities |
5 | |||||||||||
|
|
|
|||||||||||
| Total liabilities assumed |
86,874 | |||||||||||
| Net noncash liabilities acquired |
$ | 6,301 | ||||||||||
|
|
|
|||||||||||
See accompanying notes to consolidated financial statements.
33
CIVISTA BANCSHARES, INC.
NOTES TO CONSOLIDATED FINANCIAL STATEMENTS
December 31, 2016, 2015 and 2014
(Amounts in thousands, except share data)
NOTE 1 - SUMMARY OF SIGNIFICANT ACCOUNTING POLICIES
The following is a summary of the accounting policies adopted by Civista Bancshares, Inc., which have a significant effect on the financial statements.
Nature of Operations and Principles of Consolidation: The Consolidated Financial Statements include the accounts of Civista Bancshares, Inc. (“CBI”) and its wholly-owned subsidiaries: Civista Bank (“Civista”), First Citizens Insurance Agency, Inc. (“FCIA”), Water Street Properties, Inc. (“WSP”) and FC Refund Solutions, Inc. (“FCRS”). First Citizens Capital LLC (“FCC”) is wholly-owned by Civista and holds inter-company debt. First Citizens Investments, Inc. (“FCI”) is wholly-owned by Civista and holds and manages its securities portfolio. The operations of FCI and FCC are located in Wilmington, Delaware. The above companies together are sometimes referred to as the Company. Intercompany balances and transactions are eliminated in consolidation.
The Company provides financial services through its offices in the Ohio counties of Erie, Crawford, Champaign, Cuyahoga, Franklin, Logan, Summit, Huron, Ottawa, Madison, Montgomery and Richland. Its primary deposit products are checking, savings, and term certificate accounts, and its primary lending products are residential mortgage, commercial, and installment loans. Substantially all loans are secured by specific items of collateral including business assets, consumer assets and commercial and residential real estate. Commercial loans are expected to be repaid from cash flow from operations of businesses. There are no significant concentrations of loans to any one industry or customer. However, our customers’ ability to repay their loans is dependent on the real estate and general economic conditions in the area. Other financial instruments that potentially represent concentrations of credit risk include deposit accounts in other financial institutions.
FCIA was formed to allow the Company to participate in commission revenue generated through its third party insurance agreement. Insurance commission revenue was less than 1.0% of total revenue for the years ended December 31, 2016, 2015 and 2014. WSP was formed to hold repossessed assets of CBI’s subsidiaries. WSP revenue was less than 1% of total revenue for the years ended December 31, 2016, 2015 and 2014. FCRS was formed in 2012 and remained inactive for the periods presented.
Use of Estimates: To prepare financial statements in conformity with accounting principles generally accepted in the United States of America, management makes estimates and assumptions based on available information. These estimates and assumptions affect the amounts reported in the financial statements and the disclosures provided, and future results could differ. The allowance for loan losses, determination of goodwill impairment, fair values of financial instruments, valuation of deferred tax assets, pension obligations and other-than-temporary-impairment of securities are considered material estimates that are particularly susceptible to significant change in the near term.
Cash Flows: Cash and cash equivalents include cash on hand and demand deposits with financial institutions with original maturities of less than 90 days. Net cash flows are reported for customer loan and deposit transactions, interest bearing deposits in other financial institutions, federal funds purchased, short-term borrowings and repurchase agreements.
(Continued)
34
CIVISTA BANCSHARES, INC.
NOTES TO CONSOLIDATED FINANCIAL STATEMENTS
December 31, 2016, 2015 and 2014
(Amounts in thousands, except share data)
NOTE 1 - SUMMARY OF SIGNIFICANT ACCOUNTING POLICIES (Continued)
Securities: Debt securities are classified as available-for-sale when they might be sold before maturity. Equity securities with readily determinable fair values are also classified as available for sale. Securities available for sale are carried at fair value, with unrealized holding gains and losses reported in other comprehensive income, net of tax.
Interest income includes amortization of purchase premium or discount. Premiums and discounts on securities are amortized on the level-yield method without anticipating prepayments, except for mortgage backed securities where prepayments are anticipated. Gains and losses on sales are based on the amortized cost of the security sold using the specific identification method.
U.S. generally accepted accounting principles (“GAAP”) guidance specifies that if (a) a company does not have the intent to sell a debt security prior to recovery and (b) it is more-likely-than-not that it will not have to sell the debt security prior to recovery, the security would not be considered other-than-temporarily impaired unless there is a credit loss. When an entity does not intend to sell the security, and it is more-likely-than-not the entity will not have to sell the security before recovery of its cost basis, it will recognize the credit component of other-than-temporary impairment of a debt security in earnings and the remaining portion in other comprehensive income. For held-to-maturity debt securities, the amount of other-than-temporary impairment recorded in other comprehensive income for the non-credit portion of a previous other-than-temporary impairment should be amortized prospectively over the remaining life of the security on the basis of the timing of future estimated cash flows of the security.
For available-for-sale debt securities that management has no intent to sell and believes that it more-likely-than-not will not be required to sell prior to recovery, only the credit loss component of the impairment is recognized in earnings, while the non-credit loss is recognized in accumulated other comprehensive income. The credit loss component recognized in earnings is identified as the amount of principal cash flows not expected to be received over the remaining term of the security as projected based on cash flow projections.
Other securities which include FHLB stock, Federal Reserve Bank (“FRB”) stock, Federal Agricultural Mortgage Corporation stock, Bankers’ Bancshares Inc. (“BB”) stock, and Norwalk Community Development Corp (“NCDC”) stock are carried at cost.
Loans Held for Sale: Mortgage loans originated and intended for sale in the secondary market and loans that management no longer intends to hold for the foreseeable future, are carried at the lower of aggregate cost or fair value, as determined by outstanding commitments from investors. Net unrealized losses, if any, are recorded as a valuation allowance and charged to earnings.
Loans: Loans that management has the intent and ability to hold for the foreseeable future or until maturity or payoff are reported at the principal balance outstanding, net of deferred loan fees and costs, and an allowance for loan losses. Interest income is accrued on the unpaid principal balance. Loan origination fees, net of certain direct origination costs, are deferred and recognized in interest income using the level-yield method without anticipating prepayments.
(Continued)
35
CIVISTA BANCSHARES, INC.
NOTES TO CONSOLIDATED FINANCIAL STATEMENTS
December 31, 2016, 2015 and 2014
(Amounts in thousands, except share data)
NOTE 1 - SUMMARY OF SIGNIFICANT ACCOUNTING POLICIES (Continued)
Interest income on mortgage and commercial loans is discontinued at the time the loan is 90 days delinquent unless the credit is well-secured and in process of collection. Interest income on consumer loans is discontinued when management determines future collection is unlikely. In all cases, loans are placed on nonaccrual or charged-off at an earlier date if collection of principal or interest is considered doubtful.
All interest accrued, but not received, for loans placed on nonaccrual, is reversed against interest income. Interest received on such loans is accounted for on the cash-basis or cost-recovery method, until qualifying for return to accrual. Loans are returned to accrual status when all the principal and interest amounts contractually due are brought current and future payments are reasonably assured.
Purchased Loans: The Company purchases individual loans and groups of loans. Purchased loans that show evidence of credit deterioration since origination are recorded at the amount paid (or allocated fair value in a purchase business combination), such that there is no carryover of the seller’s allowance for loan losses. After acquisition, incurred losses are recognized by an increase in the allowance for loan losses.
Purchased loans are accounted for individually or aggregated into pools of loans based on common risk characteristics (e.g., credit score, loan type, and date of origination). The Company estimates the amount and timing of expected cash flows for each purchased loan or pool, and the expected cash flows in excess of amount paid is recorded as interest income over the remaining life of the loan or pool (accretable yield). The excess of the loan’s, or pool’s, contractual principal and interest over expected cash flows is not recorded (nonaccretable difference).
Over the life of the loan or pool, expected cash flows continue to be estimated. If the present value of expected cash flows is less than the carrying amount, a loss is recorded. If the present value of expected future cash flows is greater than the carrying amount, the excess is recognized as part of future interest income.
Allowance for Loan Losses: The allowance for loan losses (allowance) is calculated with the objective of maintaining a reserve sufficient to absorb inherent loan losses in the loan portfolio. Management establishes the allowance for loan losses based upon its evaluation of the pertinent factors underlying the types and quality of loans in the portfolio. In determining the allowance and the related provision for loan losses, the Company considers three principal elements: (i) specific impairment reserve allocations (valuation allowances) based upon probable losses identified during the review of impaired loans in the Commercial loan portfolio, (ii) allocations established for adversely-rated loans in the Commercial loan portfolio and nonaccrual Real Estate Residential, Consumer installment and Home Equity loans, (iii) allocations on all other loans based principally on the use of a three-year period for loss migration analysis. These allocations are adjusted for consideration of general economic and business conditions, credit quality and delinquency trends, collateral values, and recent loss experience for these similar pools of loans. The Company analyzes its loan portfolio each quarter to determine the appropriateness of its allowance for loan losses.
(Continued)
36
CIVISTA BANCSHARES, INC.
NOTES TO CONSOLIDATED FINANCIAL STATEMENTS
December 31, 2016, 2015 and 2014
(Amounts in thousands, except share data)
NOTE 1 - SUMMARY OF SIGNIFICANT ACCOUNTING POLICIES (Continued)
All commercial, commercial real estate and farm real estate loans are monitored on a regular basis with a detailed loan review completed for all loan relationships greater than $500. All commercial, commercial real estate and farm real estate loans that are 90 days past due or in nonaccrual status, are analyzed to determine if they are “impaired”, which means that it is probable that all amounts will not be collected according to the contractual terms of the loan agreement. All loans that are delinquent 90 days are classified as substandard and placed on nonaccrual status unless they are well-secured and in the process of collection. The remaining loans are evaluated and segmented with loans with similar risk characteristics. The Company allocates reserves based on risk categories and portfolio segments described below, which conform to the Company’s asset classification policy. In reviewing risk within Civista’s loan portfolio, management has identified specific segments to categorize loan portfolio risk: (i) Commercial & Agriculture loans; (ii) Commercial Real Estate – Owner Occupied loans; (iii) Commercial Real Estate – Non-Owner Occupied loans; (iv) Residential Real Estate loans; (v) Real Estate Construction loans; (vi) Farm Real Estate loans; and (vii) Consumer and Other loans. Additional information related to economic factors can be found in Note 5.
Loan Charge-off Policies: All unsecured open- and closed-ended retail loans that become past due 90 days from the contractual due date are charged off in full. In lieu of charging off the entire loan balance, loans with non-real estate collateral may be written down to the net realizable value of the collateral, if repossession of collateral is assured and in process. For open- and closed-ended loans secured by residential real estate, a current assessment of fair value is made no later than 180 days past due. Any outstanding loan balance in excess of the net realizable value of the property is charged off. All other loans are generally charged down to the net realizable value when Civista recognizes the loan is permanently impaired, which is generally after the loan is 90 days past due.
Troubled Debt Restructurings: In certain situations based on economic or legal reasons related to a borrower’s financial difficulties, management may grant a concession for other than an insignificant period of time to the borrower that would not otherwise be considered. The related loan is classified as a troubled debt restructuring (TDR). Management strives to identify borrowers in financial difficulty early and work with them to modify to more affordable terms before their loan reaches nonaccrual status. These modified terms may include rate reductions, principal forgiveness, payment forbearance and other actions intended to minimize the economic loss and to avoid foreclosure or repossession of the collateral. In cases where borrowers are granted new terms that provide for a reduction of either interest or principal, management measures any impairment on the restructuring as noted above for impaired loans. In addition to the allowance for the pooled portfolios, management has developed a separate reserve for loans that are identified as impaired through a TDR. These loans are excluded from pooled loss forecasts and a separate reserve is provided under the accounting guidance for loan impairment. Consumer loans whose terms have been modified in a TDR are also individually analyzed for estimated impairment.
Other Real Estate: Other real estate acquired through or instead of loan foreclosure is initially recorded at fair value less costs to sell when acquired, establishing a new cost basis and any deficiency in the value is charged off through the allowance. If fair value declines subsequent to foreclosure, a valuation allowance is recorded through expense. Operating costs after acquisition are expensed. Other real estate owned included in other assets totaled approximately $37 at December 31, 2016 and $116 at December 31, 2015.
(Continued)
37
CIVISTA BANCSHARES, INC.
NOTES TO CONSOLIDATED FINANCIAL STATEMENTS
December 31, 2016, 2015 and 2014
(Amounts in thousands, except share data)
NOTE 1 - SUMMARY OF SIGNIFICANT ACCOUNTING POLICIES (Continued)
Premises and Equipment: Land is carried at cost. Premises and equipment are stated at cost less accumulated depreciation. Depreciation is computed using both accelerated and straight-line methods over the estimated useful life of the asset, ranging from three to seven years for furniture and equipment and seven to fifty years for buildings and improvements.
Federal Home Loan Bank Stock: Civista is a member of the FHLB of Cincinnati and as such, is required to maintain a minimum investment in stock of the FHLB that varies with the level of advances outstanding with the FHLB. The stock is bought from and sold to the FHLB based upon its $100 par value. The stock does not have a readily determinable fair value and as such is classified as restricted stock, carried at cost and evaluated for impairment by management. The stock’s value is determined by the ultimate recoverability of the par value rather than by recognizing temporary declines. The determination of whether the par value will ultimately be recovered is influenced by criteria such as the following: (a) the significance of the decline in net assets of the FHLB as compared to the capital stock amount and the length of time this situation has persisted (b) commitments by the FHLB to make payments required by law or regulation and the level of such payments in relation to the operating performance (c) the impact of legislative and regulatory changes on the customer base of the FHLB and (d) the liquidity position of the FHLB. With consideration given to these factors, management concluded that the stock was not impaired at December 31, 2016 or 2015.
Federal Reserve Bank Stock: Civista is a member of the Federal Reserve System. FRB stock is carried at cost, classified as a restricted security, and periodically evaluated for impairment based on ultimate recovery of par value.
Bank Owned Life Insurance (BOLI): Civista has purchased BOLI policies on certain key executives. BOLI is recorded at the amount that can be realized under the insurance contract at the balance sheet date, which is the cash surrender value adjusted for other charges or other amounts due that are probable at settlement.
Goodwill and Other Intangible Assets: Goodwill results from prior business acquisitions and represents the excess of the purchase price over the fair value of acquired tangible assets and liabilities and identifiable intangible assets. Goodwill is assessed at least annually for impairment and any such impairment will be recognized in the period identified.
Other intangible assets consist of core deposit intangibles arising from whole bank and branch acquisitions. These intangible assets are measured at fair value and then amortized on an accelerated method over their estimated useful lives, which range from five to twelve years.
Servicing Rights: Servicing rights are recognized as assets for the allocated value of retained servicing rights on loans sold. Servicing rights are initially recorded at fair value at the date of transfer. The valuation technique used is the present value of estimated future cash flows using current market discount rates. Servicing rights are amortized in proportion to, and over the period of, estimated net servicing revenues. Impairment is evaluated based on the fair value of the rights, using groupings of the underlying loans as to interest rates and then, secondarily, prepayment characteristics. Fair value is determined using prices for similar assets with similar characteristics, when available, or based upon discounted cash flows using market-based assumptions. Any impairment of a grouping is reported as a valuation allowance to the extent that fair value is less than the capitalized asset for the grouping.
(Continued)
38
CIVISTA BANCSHARES, INC.
NOTES TO CONSOLIDATED FINANCIAL STATEMENTS
December 31, 2016, 2015 and 2014
(Amounts in thousands, except share data)
NOTE 1 - SUMMARY OF SIGNIFICANT ACCOUNTING POLICIES (Continued)
Long-term Assets: Premises and equipment, core deposit and other intangible assets, and other long-term assets are reviewed for impairment when events indicate their carrying amount may not be recoverable from future undiscounted cash flows. If impaired, the assets are recorded at fair value.
Repurchase Agreements: Substantially all repurchase agreement liabilities represent amounts advanced by various customers. Securities are pledged to cover these liabilities, which are not covered by federal deposit insurance.
Loan Commitments and Related Financial Instruments: Financial instruments include off-balance sheet credit instruments, such as commitments to make loans and commercial letters of credit, issued to meet customer financing needs. The face amount for these items represents the exposure to loss, before considering customer collateral or ability to repay.
Income Taxes: Income tax expense is the total of the current year income tax due or refundable and the change in deferred tax assets and liabilities. Deferred tax assets and liabilities are the expected future tax amounts for the temporary differences between carrying amounts and tax basis of assets and liabilities, computed using enacted tax rates. A valuation allowance, if needed, reduces deferred tax assets to the amount expected to be realized.
The Company prescribes a recognition threshold and a measurement attribute for the financial statement recognition and measurement of a tax position taken or expected to be taken in a tax return. Benefits from tax positions should be recognized in the financial statements only when it is more likely than not that the tax position will be sustained upon examination by the appropriate taxing authority that would have full knowledge of all relevant information.
A tax position that meets the more-likely-than-not recognition threshold is measured at the largest amount of benefit that is greater than 50% likely of being realized upon ultimate settlement. Tax positions that previously failed to meet the more-likely-than-not recognition threshold should be recognized in the first subsequent financial reporting period in which that threshold is met. Previously recognized tax positions that no longer meet the more-likely-than-not recognition threshold should be derecognized in the first subsequent financial reporting period in which that threshold is no longer met. The Company recognizes interest and/or penalties related to income tax matters in income tax expense.
Stock-Based Compensation: Compensation cost is recognized for stock options and restricted stock awards issued to employees, based on the fair value of these awards at the grant date. A Black-Scholes model is utilized to estimate the fair value of stock options, while the market price of the Company’s common stock at the date of the grant is used for restricted stock.
Compensation cost is recognized over the required service period, generally defined as the vesting period. For awards with graded vesting, compensation cost is recognized on a straight-line basis over the requisite service period for the entire award.
(Continued)
39
CIVISTA BANCSHARES, INC.
NOTES TO CONSOLIDATED FINANCIAL STATEMENTS
December 31, 2016, 2015 and 2014
(Amounts in thousands, except share data)
NOTE 1 - SUMMARY OF SIGNIFICANT ACCOUNTING POLICIES (Continued)
Retirement Plans: Pension expense is the net of service and interest cost, expected return on plan assets and amortization of gains and losses not immediately recognized. Employee 401(k) and profit sharing plan expense is the amount of matching contributions. Deferred compensation allocates the benefits over the years of service.
Earnings per Common Share: Basic earnings per share are net income available to common shareholders divided by the weighted average number of common shares outstanding during the period. Diluted earnings per common share include the dilutive effect of additional potential common shares issuable related to convertible preferred shares. Treasury shares are not deemed outstanding for earnings per share calculations.
Comprehensive Income: Comprehensive income consists of net income and other comprehensive income. Other comprehensive income includes unrealized gains and losses on securities available for sale and changes in the funded status of the pension plan.
Loss Contingencies: Loss contingencies, including claims and legal actions arising in the ordinary course of business, are recorded as liabilities when the likelihood of loss is probable and an amount or range of loss can be reasonably estimated. Management does not believe that any such loss contingencies currently exist that will have a material effect on the financial statements.
Restrictions on Cash: Cash on hand or on deposit with the Federal Reserve Bank was required to meet regulatory reserve and clearing requirements. These balances do not earn interest.
Dividend Restriction: Banking regulations require maintaining certain capital levels and may limit the dividends paid by Civista to CBI or by CBI to shareholders. Additional information related to dividend restrictions can be found in Note 19.
Fair Value of Financial Instruments: Fair values of financial instruments are estimated using relevant market information and other assumptions, as more fully disclosed in Note 17. Fair value estimates involve uncertainties and matters of significant judgment regarding interest rates, credit risk, prepayments, and other factors, especially in the absence of broad markets for particular items. Changes in assumptions or in market conditions could significantly affect these estimates.
Operating Segments: While the Company’s chief decision makers monitor the revenue streams of the Company’s various products and services, operations are managed and financial performance is evaluated on a Company-wide basis. Operating segments are aggregated into one as operating results for all segments are similar. Accordingly, all of the Company’s financial service operations are considered by management to be aggregated in one reportable operating segment.
Business Combinations: At the date of acquisition the Company records the assets and liabilities of the acquired companies on the Consolidated Balance Sheets at their estimated fair value. The results of operations for acquired companies are included in the Company’s Consolidated Statements of Operations beginning at the acquisition date. Expenses arising from acquisition activities are recorded in the Consolidated Statements of Operations during the period incurred.
(Continued)
40
CIVISTA BANCSHARES, INC.
NOTES TO CONSOLIDATED FINANCIAL STATEMENTS
December 31, 2016, 2015 and 2014
(Amounts in thousands, except share data)
NOTE 1 - SUMMARY OF SIGNIFICANT ACCOUNTING POLICIES (Continued)
Derivative Instruments and Hedging Activities: The Company enters into interest rate swap agreements to facilitate the risk management strategies of a small number of commercial banking customers. All derivatives are accounted for in accordance with ASC-815, Derivatives and Hedging. The Company mitigates the risk of entering into these agreements by entering into equal and offsetting swap agreements with highly rated third party financial institutions. The swap agreements are free-standing derivatives and are recorded at fair value in the Company’s Consolidated Balance Sheets. The Company is party to master netting arrangements with its financial institution counterparties; however, the Company does not offset assets and liabilities under these arrangements for financial statement presentation purposes because the Company does not currently intend to execute a setoff with its’ counterparties. The master netting arrangements provide for a single net settlement of all swap agreements, as well as collateral, in the event of default on, or termination of, any one contract. Collateral, usually in the form of marketable securities, is posted by the counterparty with net liability positions in accordance with contract thresholds.
Reclassifications: Some items in the prior year financial statements were reclassified to conform to the current presentation. Such reclassifications had no effect on net income or shareholders’ equity.
Effect of Newly Issued but Not Yet Effective Accounting Standards:
In May 2014, the FASB issued ASU 2014-09, Revenue from Contracts with Customers (a new revenue recognition standard). The Update’s core principle is that a company will recognize revenue to depict the transfer of goods or services to customers in an amount that reflects the consideration to which the entity expects to be entitled in exchange for those goods or services. In addition, this Update specifies the accounting for certain costs to obtain or fulfill a contract with a customer and expands disclosure requirements for revenue recognition. This Update is effective for annual reporting periods beginning after December 15, 2017, including interim periods within that reporting period. However, in August 2015, the FASB issued ASU 2015-14, Revenue from Contracts with Customers (Topic 606) to defer the effective date of ASU 2014-09 for all entities by one year. Public business entities, certain not-for-profit entities, and certain employee benefit plans should apply the guidance in ASU 2014-09 to annual reporting periods beginning after December 15, 2017, including interim reporting periods within that reporting period. All other entities should apply the guidance in ASU 2014-09 to annual reporting periods beginning after December 15, 2018, and interim reporting periods within annual reporting periods beginning after December 15, 2019. Because the guidance does not apply to revenue associated with financial instruments, including loans and securities, we do not expect new standard, or any of the amendments, to result in a material change from our current accounting for revenue because the majority of the Company’s financial instruments are not within the scope of Topic 606. However, we do expect that the standard will result in new disclosure requirements, which are currently being evaluated.
In January 2016, the FASB issued ASU 2016-01, Financial Instruments – Overall (Subtopic 825-10): Recognition and Measurement of Financial Assets and Financial Liabilities. This Update applies to all entities that hold financial assets or owe financial liabilities and is intended to provide more useful information on the recognition, measurement, presentation, and disclosure of financial instruments. Among other things, this Update (a) requires equity investments (except those accounted for under the equity method of accounting or those that result in consolidation of the investee) to be measured at fair value with changes in fair value recognized in net income; (b) simplifies the impairment assessment of equity
(Continued)
41
CIVISTA BANCSHARES, INC.
NOTES TO CONSOLIDATED FINANCIAL STATEMENTS
December 31, 2016, 2015 and 2014
(Amounts in thousands, except share data)
NOTE 1 - SUMMARY OF SIGNIFICANT ACCOUNTING POLICIES (Continued)
investments without readily determinable fair values by requiring a qualitative assessment to identify impairment; (c) eliminates the requirement to disclose the fair value of financial instruments measured at amortized cost for entities that are not public business entities; (d) eliminates the requirement for public business entities to disclose the method(s) and significant assumptions used to estimate the fair value that is required to be disclosed for financial instruments measured at amortized cost on the balance sheet; (e) requires public business entities to use the exit price notion when measuring the fair value of financial instruments for disclosure purposes; (f) requires an entity to present separately in other comprehensive income the portion of the total change in the fair value of a liability resulting from a change in the instrument-specific credit risk when the entity has elected to measure the liability at fair value in accordance with the fair value option for financial instruments; (g) requires separate presentation of financial assets and financial liabilities by measurement category and form of financial asset (that is, securities or loans and receivables) on the balance sheet or the accompanying notes to the financial statements; and (h) clarifies that an entity should evaluate the need for a valuation allowance on a deferred tax asset related to available-for-sale securities in combination with the entity’s other deferred tax assets. For public business entities, the amendments in this Update are effective for fiscal years beginning after December 15, 2017, including interim periods within those fiscal years. For all other entities including not-for-profit entities and employee benefit plans within the scope of Topics 960 through 965 on plan accounting, the amendments in this Update are effective for fiscal years beginning after December 15, 2018, and interim periods within fiscal years beginning after December 15, 2019. All entities that are not public business entities may adopt the amendments in this Update earlier as of the fiscal years beginning after December 15, 2017, including interim periods within those fiscal years. The Company is currently evaluating the impact the adoption of the standard will have on the Company’s financial position or results of operations.
In February 2016, the FASB issued ASU 2016-02, Leases (Topic 842). The standard in this Update requires lessees to recognize the assets and liabilities that arise from leases on the balance sheet. A lessee should recognize in the statement of financial position a liability to make lease payments (the lease liability) and a right-of-use asset representing its right to use the underlying asset for the lease term. A short-term lease is defined as one in which: (a) the lease term is 12 months or less, and (b) there is not an option to purchase the underlying asset that the lessee is reasonably certain to exercise. For short-term leases, lessees may elect to recognize lease payments over the lease term on a straight-line basis. For public business entities, the amendments in this Update are effective for fiscal years beginning after December 15, 2018, and interim periods within those years. For all other entities, the amendments in this Update are effective for fiscal years beginning after December 15, 2019, and for interim periods within fiscal years beginning after December 15, 2020. The amendments should be applied at the beginning of the earliest period presented using a modified retrospective approach with earlier application permitted as of the beginning of an interim or annual reporting period. The Company is currently assessing the practical expedients it may elect at adoption, but does not anticipate the amendments will have a significant impact to the financial statements. Based on the Company’s preliminary analysis of its current portfolio, the impact to the Company’s balance sheet is estimated to result in less than a 1% increase in assets and liabilities. The Company also anticipates additional disclosures to be provided at adoption.
(Continued)
42
CIVISTA BANCSHARES, INC.
NOTES TO CONSOLIDATED FINANCIAL STATEMENTS
December 31, 2016, 2015 and 2014
(Amounts in thousands, except share data)
NOTE 1 - SUMMARY OF SIGNIFICANT ACCOUNTING POLICIES (Continued)
In March 2016, the FASB issued ASU 2016-05, Derivatives and Hedging (Topic 815). The amendments in this Update apply to all reporting entities for which there is a change in the counterparty to a derivative instrument that has been designated as a hedging instrument under Topic 815. The standards in this Update clarify that a change in the counterparty to a derivative instrument that has been designated as the hedging instrument under Topic 815 does not, in and of itself, require designation of that hedging relationship provided that all other hedge accounting criteria continue to be met. For public business entities, the amendments in this Update are effective for financial statements issued for fiscal years beginning after December 15, 2016, and interim periods within those fiscal years. For all other entities, the amendments in this Update are effective for financial statements issued for fiscal years beginning after December 15, 2017, and interim periods within fiscal years beginning after December 15, 2018. An entity has an option to apply the amendments in this Update on either a prospective basis or a modified retrospective basis. Early adoption is permitted, including adoption in an interim period. This Update is not expected to have a significant impact on the Company’s financial statements.
In March 2016, the FASB issued ASU 2016-06, Derivatives and Hedging (Topic 815). The amendments apply to all entities that are issuers of, or investors in, debt instruments (or hybrid financial instruments in this Update that are determined to have a debt host) with embedded call (put) options. The amendments in this Update clarify the requirements for assessing whether contingent call (put) options that can accelerate the payment of principal on debt instruments are clearly and closely related to their debt host. An entity performing the assessment under the amendments in this Update is required to assess the embedded call (put) options solely in accordance with the four-step decision sequence. For public business entities, the amendments in this Update are effective for financial statements issued for fiscal years beginning after December 15, 2016, and interim periods within those fiscal years. For entities other than public business entities, the amendments in this Update are effective for financial statements issued for fiscal years beginning after December 15, 2017, and interim periods within fiscal years beginning after December 15, 2018. Early adoption is permitted, including adoption in an interim period. This Update is not expected to have a significant impact on the Company’s financial statements.
In March 2016, the FASB issued ASU 2016-07, Investments –Equity Method and Joint Ventures (Topic 323). The Update affects all entities that have an investment that becomes qualified for the equity method of accounting as a result of an increase in the level of ownership interest or degree of influence. The amendments in this Update eliminate the requirement that when an investment qualifies for use of the equity method as a result of an increase in the level of ownership interest or degree of influence, an investor must adjust the investment, results of operations, and retained earnings retroactively on a step-by-step basis as if the equity method had been in effect during all previous periods that the investment had been held. The amendments in this Update require that the equity method investor add the cost of acquiring the additional interest in the investee to the current basis of the investor’s previously held interest and adopt the equity method of accounting as of the date the investment becomes qualified for equity method accounting. Therefore, upon qualifying for the equity method of accounting, no retroactive adjustment of the investment is required. The amendments in this Update require that an entity that has an available-for-sale equity security that becomes qualified for the equity method of accounting recognize through earnings the unrealized holding gain or loss in accumulated other comprehensive income at the date the investment becomes qualified for use of the equity method. The amendments in this Update are effective for all entities for fiscal years, and interim periods within those fiscal years, beginning after December 15, 2016. The amendments should be applied prospectively upon
(Continued)
43
CIVISTA BANCSHARES, INC.
NOTES TO CONSOLIDATED FINANCIAL STATEMENTS
December 31, 2016, 2015 and 2014
(Amounts in thousands, except share data)
NOTE 1 - SUMMARY OF SIGNIFICANT ACCOUNTING POLICIES (Continued)
their effective date to increases in the level of ownership interest or degree of influence that result in the adoption of the equity method. Earlier application is permitted. This Update is not expected to have a significant impact on the Company’s financial statements.
In March 2016, the FASB issued ASU 2016-09, Compensation – Stock Compensation (Topic 718). The amendments in this Update affect all entities that issue share-based payment awards to their employees. The standards in this Update provide simplification for several aspects of the accounting for share-based payment transactions, including the income tax consequences, classification of awards as with equity or liabilities, and classification on the statement of cash flows. Some of the areas for simplification apply only to nonpublic entities. In addition to those simplifications, the amendments eliminate the guidance in Topic 718 that was indefinitely deferred shortly after the issuance of FASB Statement No. 123 (revised 2004), Share-Based Payment. This should not result in a change in practice because the guidance that is being superseded was never effective. For public business entities, the amendments in this Update are effective for annual periods beginning after December 15, 2016, and interim periods within those annual periods. For all other entities, the amendments are effective for annual periods beginning after December 15, 2017, and interim periods within annual periods beginning after December 15, 2018. Early adoption is permitted for any entity in any interim or annual period. This Update is not expected to have a significant impact on the Company’s financial statements.
In June 2016, the FASB issued ASU 2016-13, Financial Instruments-Credit Losses: Measurement of Credit Losses on Financial Instruments (“ASU 2016-13”), which changes the impairment model for most financial assets. This ASU is intended to improve financial reporting by requiring timelier recording of credit losses on loans and other financial instruments held by financial institutions and other organizations. The underlying premise of the ASU is that financial assets measured at amortized cost should be presented at the net amount expected to be collected, through an allowance for credit losses that is deducted from the amortized cost basis. The allowance for credit losses should reflect management’s current estimate of credit losses that are expected to occur over the remaining life of a financial asset. The income statement will be effected for the measurement of credit losses for newly recognized financial assets, as well as the expected increases or decreases of expected credit losses that have taken place during the period. ASU 2016-13 is effective for annual and interim periods beginning after December 15, 2019, and early adoption is permitted for annual and interim periods beginning after December 15, 2018. We expect to recognize a one-time cumulative effect adjustment to the allowance for loan losses as of the beginning of the first reporting period in which the new standard is effective, but cannot yet determine the magnitude of any such one-time adjustment or the overall impact of the new guidance on the consolidated financial statements.
In August 2016, the FASB issued ASU 2016-15, Statement of Cash Flows (Topic 230): Classification of Certain Cash Receipts and Cash Payments (“ASU 2016-15”), which addresses eight specific cash flow issues with the objective of reducing diversity in practice. Among these include recognizing cash payments for debt prepayment or debt extinguishment as cash outflows for financing activities; cash proceeds received from the settlement of insurance claims should be classified on the basis of the related insurance coverage; and cash proceeds received from the settlement of bank-owned life insurance policies should be classified as cash inflows from investing activities while the cash payments for premiums on bank-owned policies may be classified as cash outflows for investing activities, operating activities, or a combination of investing and operating activities. The amendments in this Update are effective for public business
(Continued)
44
CIVISTA BANCSHARES, INC.
NOTES TO CONSOLIDATED FINANCIAL STATEMENTS
December 31, 2016, 2015 and 2014
(Amounts in thousands, except share data)
NOTE 1 - SUMMARY OF SIGNIFICANT ACCOUNTING POLICIES (Continued)
entities for fiscal years beginning after December 15, 2017, and interim periods within those fiscal years. For all other entities, the amendments are effective for fiscal years beginning after December 15, 2018, and interim periods within fiscal years beginning after December 15, 2019. Early adoption is permitted, including adoption in an interim period. If an entity early adopts the amendments in an interim period, any adjustments should be reflected as of the beginning of the fiscal year that includes that interim period. An entity that elects early adoption must adopt all of the amendments in the same period. The amendments in this Update should be applied using a retrospective transition method to each period presented. If it is impracticable to apply the amendments retrospectively for some of the issues, the amendments for those issues would be applied prospectively as of the earliest date practicable. The Company is currently evaluating the impact the adoption of the standard will have on the Company’s statement of cash flows.
In October 2016, the FASB issued ASU 2016-17, Consolidation (Topic 810) (“ASU 2016-17”), which amends the consolidation guidance on how a reporting entity that is the single decision maker of a VIE should treat indirect interests in the entity held through related parties that are under common control with the reporting entity when determining whether it is the primary beneficiary of that VIE. The primary beneficiary of a VIE is the reporting entity that has a controlling financial interest in a VIE and, therefore, consolidates the VIE. A reporting entity has an indirect interest in a VIE if it has a direct interest in a related party that, in turn, has a direct interest in the VIE. Under the amendments, a single decision maker is not required to consider indirect interests held through related parties that are under common control with the single decision maker to be the equivalent of direct interests in their entirety. Instead, a single decision maker is required to include those interests on a proportionate basis consistent with indirect interests held through other related parties. The Company is currently evaluating the impact the adoption of the standard will have on the Company’s financial position or results of operations.
In December 2016, the FASB issued ASU 2016-20, Technical Corrections and Improvements to Topic 606, Revenue from Contracts with Customers “ASU 2016-20”. This Update, among others things, clarifies that guarantee fees within the scope of Topic 460, Guarantees, (other than product or service warranties) are not within the scope of Topic 606. The effective date and transition requirements for ASU 2016-20 are the same as the effective date and transition requirements for the new revenue recognition guidance. For public entities with a calendar year-end, the new guidance is effective in the quarter and year beginning January 1, 2018. For all other entities with a calendar year-end, the new guidance is effective in the year ending December 31, 2019, and interim periods in 2020. The Company is currently evaluating the impact the adoption of the standard will have on the Company’s financial position or results of operations.
In January 2017, the FASB issued ASU 2017-01, Business Combinations (Topic 805), Clarifying the Definition of a Business “ASU 2017-01”, which provides a more robust framework to use in determining when a set of assets and activities (collectively referred to as a “set”) is a business. The screen requires that when substantially all of the fair value of the gross assets acquired (or disposed of) is concentrated in a single identifiable asset or a group of similar identifiable assets, the set is not a business. This screen reduces the number of transactions that need to be further evaluated. Public business entities should apply the amendments in this Update to annual periods beginning after December 15, 2017, including interim periods within those periods. All other entities should apply the amendments to annual periods beginning after December 15, 2018, and interim periods within annual periods beginning after December 15, 2019. The amendments in this Update should be applied prospectively on or after the effective date.
(Continued)
45
CIVISTA BANCSHARES, INC.
NOTES TO CONSOLIDATED FINANCIAL STATEMENTS
December 31, 2016, 2015 and 2014
(Amounts in thousands, except share data)
NOTE 1 - SUMMARY OF SIGNIFICANT ACCOUNTING POLICIES (Continued)
The Company is currently evaluating the impact the adoption of the standard will have on the Company’s financial position or results of operations.
In January 2017, the FASB issued ASU 2017-03, Accounting Changes and Error Corrections (Topic 250) and Investments—Equity Method and Joint Ventures (Topic 323), Amendments to SEC Paragraphs Pursuant to Staff Announcements at the September 22, 2016 and November 17, 2016 EITF Meetings. This ASU adds an SEC paragraph to the Codification following an SEC Staff Announcement about applying Staff Accounting Bulletin (SAB) Topic 11.M. Specifically this announcement applies to ASU No. 2014- 09, Revenue from Contracts with Customers (Topic 606); ASU No. 2016-02, Leases (Topic 842); and ASU No. 2016-13, Financial Instruments—Credit Losses (Topic 326): Measurement of Credit Losses on Financial Instruments. A registrant should evaluate ASUs that have not yet been adopted to determine the appropriate financial statement disclosures about the potential material effects of those ASUs on the financial statements when adopted. If a registrant does not know or cannot reasonably estimate the impact that adoption of the ASUs referenced in this announcement are expected to have on the financial statements, then in addition to making a statement to that effect, that registrant should consider additional qualitative financial statement disclosures to assist the reader in assessing the significance of the impact that the standard will have on the financial statements of the registrant when adopted. In this regard, the SEC staff expects the additional qualitative disclosures to include a description of the effect of the accounting policies that the registrant expects to apply, if determined, and a comparison to the registrant’s current accounting policies. Also, a registrant should describe the status of its process to implement the new standards and the significant implementation matters yet to be addressed. The amendments in this Update are effective immediately.
NOTE 2 - MERGER
On March 6, 2015, CBI completed the acquisition by merger of TCNB Financial Corp. (“TCNB”) in an all-cash transaction for aggregate consideration of $17,226, or $23.50 per share of TCNB stock. The Company and TCNB had first announced that they had entered into an agreement to merge in September of 2014. Immediately following the merger, TCNB’s banking subsidiary, The Citizens National Bank of Southwestern Ohio, was merged into CBI’s banking subsidiary, Civista Bank.
At the time of the merger, TCNB had total assets of $97,479, including $76,771 in loans, and $86,708 in deposits. The transaction was recorded as a purchase and, accordingly, the operating results of TCNB have been included in the Company’s Consolidated Financial Statements since the close of business on March 6, 2015. The aggregate of the purchase price over the fair value of the net assets acquired of approximately $5,375 was recorded as goodwill and will be evaluated for impairment on an annual basis.
Merger-related costs were $391 and $236, respectively, as of December 31, 2015 and December 31, 2014. These costs were primarily included in salaries, wages and benefits, contracted data processing and professional services on the consolidated statements of operations.
(Continued)
46
CIVISTA BANCSHARES, INC.
NOTES TO CONSOLIDATED FINANCIAL STATEMENTS
December 31, 2016, 2015 and 2014
(Amounts in thousands, except share data)
NOTE 2 - MERGER (Continued)
The following table presents financial information for the former TCNB included in the Consolidated Statements of Operations from the date of acquisition through December 31, 2015.
| Actual From Acquisition Date Through December 31, 2015 (in thousands) |
||||
| Net interest income after provision for loan losses |
$ | 3,155 | ||
| Noninterest income |
138 | |||
| Net income |
1,282 | |||
The following table presents unaudited pro forma information for the periods ended December 31, 2016, 2015 and 2014 as if the acquisition of TCNB had occurred on January 1, 2014. This table has been prepared for comparative purposes only and is not indicative of the actual results that would have been attained had the acquisition occurred as of the beginning of the periods presented, nor is it indicative of future results.
| Pro Formas (unaudited) Twelve months ended December 31, |
||||||||||||
| 2016 | 2015 | 2014 | ||||||||||
| Net interest income after provision for loan losses |
$ | 51,389 | $ | 46,852 | $ | 44,583 | ||||||
| Noninterest income |
16,132 | 14,699 | 14,297 | |||||||||
| Net income |
16,949 | 11,931 | 10,045 | |||||||||
| Pro forma earnings per share: |
||||||||||||
| Basic |
$ | 1.93 | $ | 1.32 | $ | 1.06 | ||||||
| Diluted |
$ | 1.55 | $ | 1.09 | $ | 0.90 | ||||||
(Continued)
47
CIVISTA BANCSHARES, INC.
NOTES TO CONSOLIDATED FINANCIAL STATEMENTS
December 31, 2016, 2015 and 2014
(Amounts in thousands, except share data)
NOTE 2 - MERGER (Continued)
The following table summarizes the estimated fair values of the assets acquired and liabilities assumed at the date of acquisition for TCNB. Core deposit intangibles will be amortized over periods of between five and ten years using an accelerated method. Goodwill will not be amortized, but instead will be evaluated for impairment.
| At March 6, 2015 | ||||||||
| Total purchase price |
$ | 17,226 | ||||||
| Net assets acquired: |
||||||||
| Cash and short-term investments |
18,152 | |||||||
| Loans, net |
76,444 | |||||||
| Other securities |
716 | |||||||
| Premises and equipment |
1,738 | |||||||
| Accrued interest receivable |
194 | |||||||
| Core deposit intangible |
1,009 | |||||||
| Other assets |
472 | |||||||
| Noninterest-bearing deposits |
(18,263 | ) | ||||||
| Interest-bearing deposits |
(68,606 | ) | ||||||
| Other liabilities |
(5 | ) | ||||||
| 11,851 | ||||||||
|
|
|
|||||||
| Goodwill |
$ | 5,375 | ||||||
|
|
|
|||||||
The assets and liabilities acquired in the TCNB merger were measured at fair value. Management made certain estimates and exercised judgment in accounting for the acquisition. The following is a description of the methods used to determine fair value of significant assets and liabilities at the acquisition date:
Cash and short-term investments: The Company acquired $18.2 million in cash and short-term investments, which management deemed to reflect fair value based on the short term nature of the asset.
Loans: The Company acquired $76.4 million in loans receivable with and without evidence of credit quality deterioration. The loans consisted of Commercial loans, Commercial Real Estate loans, and Residential Real Estate loans including home equity secured lines of credit, as well as Real Estate Construction, Farm Real Estate loans and Consumer and other loans. The fair value of the performing loan portfolio includes separate adjustments to reflect a credit risk and marketability component and a yield component reflecting the differential between portfolio and market yields. Additionally, certain loans were valued based on their observable sales price. Loans acquired with credit deterioration of $831 were individually evaluated to estimate credit losses and a net recovery amount for each loan. The net cash flows for each loan were then discounted to present value using a risk-adjusted market rate.
(Continued)
48
CIVISTA BANCSHARES, INC.
NOTES TO CONSOLIDATED FINANCIAL STATEMENTS
December 31, 2016, 2015 and 2014
(Amounts in thousands, except share data)
NOTE 2 - MERGER (Continued)
Deposits: The Company acquired $86.9 million in deposits. Savings and transaction accounts are variable, have no stated maturity and can be withdrawn on short notice with no penalty. Therefore, the fair value of such deposits is considered equal to the carrying value. The fair value of CD’s is determined by comparing the contractual cost of the CD’s to the market rates with corresponding maturities. The valuation adjustment reflects the present value of the difference between the cash flows attributable to the CD’s based on contractual and market rates. The core deposit intangible is determined by the present value difference of the net cost of the core deposit versus the same amount for an alternative funding source.
The TCNB acquisition provided the Company with the strategic opportunity to expand into new markets that, while similar to existing markets, are projected to be more vibrant in population growth and business opportunity growth. Additionally, the acquisition provides the Company with additional exposure to suburbs of larger urban areas without the commitment of operating inside large metropolitan areas dominated by regional and national financial organizations. The acquisition also creates synergies on the operational side of the Company by allowing noninterest expenses to be spread over a larger operating base.
(Continued)
49
CIVISTA BANCSHARES, INC.
NOTES TO CONSOLIDATED FINANCIAL STATEMENTS
December 31, 2016, 2015 and 2014
(Amounts in thousands, except share data)
NOTE 3 - SECURITIES
The amortized cost and fair value of available for sale securities and the related gross unrealized gains and losses recognized in accumulated other comprehensive loss were as follows:
| Amortized Cost |
Gross Unrealized Gains |
Gross Unrealized Losses |
Fair Value | |||||||||||||
| 2016 |
||||||||||||||||
| U.S. Treasury securities and obligations of U.S.government agencies |
$ | 37,406 | $ | 117 | $ | (77 | ) | $ | 37,446 | |||||||
| Obligations of states and political subdivisions |
92,177 | 3,395 | (574 | ) | 94,998 | |||||||||||
| Mortgage-back securities in government sponsored entities |
62,756 | 483 | (597 | ) | 62,642 | |||||||||||
|
|
|
|
|
|
|
|
|
|||||||||
| Total debt securities |
192,339 | 3,995 | (1,248 | ) | 195,086 | |||||||||||
| Equity securities in financial institutions |
481 | 297 | — | 778 | ||||||||||||
|
|
|
|
|
|
|
|
|
|||||||||
| Total |
$ | 192,820 | $ | 4,292 | $ | (1,248 | ) | $ | 195,864 | |||||||
|
|
|
|
|
|
|
|
|
|||||||||
| Amortized Cost |
Gross Unrealized Gains |
Gross Unrealized Losses |
Fair Value | |||||||||||||
| 2015 |
||||||||||||||||
| U.S. Treasury securities and obligations of U.S.government agencies |
$ | 40,992 | $ | 74 | $ | (129 | ) | $ | 40,937 | |||||||
| Obligations of states and political subdivisions |
87,255 | 4,959 | (62 | ) | 92,152 | |||||||||||
| Mortgage-back securities in government sponsored entities |
62,135 | 681 | (243 | ) | 62,573 | |||||||||||
|
|
|
|
|
|
|
|
|
|||||||||
| Total debt securities |
190,382 | 5,714 | (434 | ) | 195,662 | |||||||||||
| Equity securities in financial institutions |
481 | 106 | — | 587 | ||||||||||||
|
|
|
|
|
|
|
|
|
|||||||||
| Total |
$ | 190,863 | $ | 5,820 | $ | (434 | ) | $ | 196,249 | |||||||
|
|
|
|
|
|
|
|
|
|||||||||
(Continued)
50
CIVISTA BANCSHARES, INC.
NOTES TO CONSOLIDATED FINANCIAL STATEMENTS
December 31, 2016, 2015 and 2014
(Amounts in thousands, except share data)
NOTE 3 - SECURITIES (Continued)
The amortized cost and fair value of securities at year end 2016 by contractual maturity were as follows. Securities not due at a single maturity date, primarily mortgage-backed securities, are shown separately.
| Available for sale | ||||||||
| Amortized Cost | Fair Value | |||||||
| Due in one year or less |
$ | 9,171 | $ | 9,172 | ||||
| Due from one to five years |
28,862 | 29,002 | ||||||
| Due from five to ten years |
31,047 | 32,692 | ||||||
| Due after ten years |
60,503 | 61,578 | ||||||
| Mortgage-backed securities in government sponsored entities |
62,756 | 62,642 | ||||||
| Equity securities in financial institutions |
481 | 778 | ||||||
|
|
|
|
|
|||||
| Total |
$ | 192,820 | $ | 195,864 | ||||
|
|
|
|
|
|||||
Securities with a carrying value of $139,179 and $142,888 were pledged as of December 31, 2016 and 2015, respectively, to secure public deposits, other deposits and liabilities as required or permitted by law.
Proceeds from sales of securities, gross realized gains and gross realized losses were as follows:
| 2016 | 2015 | 2014 | ||||||||||
| Sale proceeds |
$ | 4,349 | $ | — | $ | 18,088 | ||||||
| Gross realized gains |
18 | — | 113 | |||||||||
| Gross realized losses |
— | — | (1 | ) | ||||||||
| Gains (losses) from securities called or settled by the issuer |
1 | (18 | ) | 1 | ||||||||
(Continued)
51
CIVISTA BANCSHARES, INC.
NOTES TO CONSOLIDATED FINANCIAL STATEMENTS
December 31, 2016, 2015 and 2014
(Amounts in thousands, except share data)
NOTE 3 - SECURITIES (Continued)
Debt securities with unrealized losses at year end 2016 and 2015 not recognized in income are as follows:
| 2016 | 12 Months or less | More than 12 months | Total | |||||||||||||||||||||
| Description of Securities | Fair Value |
Unrealized Loss |
Fair Value |
Unrealized Loss |
Fair Value |
Unrealized Loss |
||||||||||||||||||
| U.S. Treasury securities and obligations of U.S. government agencies |
$ | 13,271 | $ | (61 | ) | $ | 893 | $ | (16 | ) | $ | 14,164 | $ | (77 | ) | |||||||||
| Obligations of states and political subdivisions |
17,167 | (558 | ) | 519 | (16 | ) | 17,686 | (574 | ) | |||||||||||||||
| Mortgage-backed securities in gov’t sponsored entities |
35,453 | (566 | ) | 2,849 | (31 | ) | 38,302 | (597 | ) | |||||||||||||||
|
|
|
|
|
|
|
|
|
|
|
|
|
|||||||||||||
| Total temporarily impaired |
$ | 65,891 | $ | (1,185 | ) | $ | 4,261 | $ | (63 | ) | $ | 70,152 | $ | (1,248 | ) | |||||||||
|
|
|
|
|
|
|
|
|
|
|
|
|
|||||||||||||
| 2015 | 12 Months or less | More than 12 months | Total | |||||||||||||||||||||
| Description of Securities | Fair Value |
Unrealized Loss |
Fair Value |
Unrealized Loss |
Fair Value |
Unrealized Loss |
||||||||||||||||||
| U.S. Treasury securities and obligations of U.S. government agencies |
$ | 25,464 | $ | (112 | ) | $ | 1,132 | $ | (17 | ) | $ | 26,596 | $ | (129 | ) | |||||||||
| Obligations of states and political subdivisions |
2,932 | (20 | ) | 1,469 | (42 | ) | 4,401 | (62 | ) | |||||||||||||||
| Mortgage-backed securities in gov’t sponsored entities |
27,263 | (172 | ) | 5,041 | (71 | ) | 32,304 | (243 | ) | |||||||||||||||
|
|
|
|
|
|
|
|
|
|
|
|
|
|||||||||||||
| Total temporarily impaired |
$ | 55,659 | $ | (304 | ) | $ | 7,642 | $ | (130 | ) | $ | 63,301 | $ | (434 | ) | |||||||||
|
|
|
|
|
|
|
|
|
|
|
|
|
|||||||||||||
The Company periodically evaluates securities for other-than-temporary impairment. An unrealized loss exists when the current fair value of an individual security is less than its amortized cost basis. Unrealized losses that are determined to be temporary in nature are recorded, net of tax, in accumulated other comprehensive loss on the Consolidated Balance Sheet.
(Continued)
52
CIVISTA BANCSHARES, INC.
NOTES TO CONSOLIDATED FINANCIAL STATEMENTS
December 31, 2016, 2015 and 2014
(Amounts in thousands, except share data)
NOTE 3 - SECURITIES (Continued)
The Company has assessed each available-for-sale security position for credit impairment. Factors considered in determining whether a loss is temporary include:
| • | The length of time and the extent to which fair value has been below cost; |
| • | The severity of impairment; |
| • | The cause of the impairment and the financial condition and near-term prospects of the issuer; |
| • | If the Company intends to sell the investment; |
| • | If it’s more-likely-than-not the Company will be required to sell the investment before recovering its amortized cost basis; and |
| • | If the Company does not expect to recover the investment’s entire amortized cost basis (even if the Company does not intend to sell the investment). |
The Company’s review for impairment generally entails:
| • | Identification and evaluation of investments that have indications of impairment; |
| • | Analysis of individual investments that have fair values less than amortized cost, including consideration of length of time each investment has been in unrealized loss position and the expected recovery period; |
| • | Evaluation of factors or triggers that could cause individual investments to qualify as having other-than-temporary impairment; and |
| • | Documentation of these analyses, as required by policy. |
At December 31, 2016, the Company owned 67 securities that were considered temporarily impaired. The unrealized losses on these securities have not been recognized into income because the issuers’ bonds are of high credit quality, management has the intent and ability to hold these securities for the foreseeable future, and the decline in fair value is largely due to changes in market interest rates. The Company also considers sector specific credit rating changes in its analysis. The fair value is expected to recover as the securities approach their maturity date or reset date. The Company does not intend to sell until recovery and does not believe selling will be required before recovery.
(Continued)
53
CIVISTA BANCSHARES, INC.
NOTES TO CONSOLIDATED FINANCIAL STATEMENTS
December 31, 2016, 2015 and 2014
(Amounts in thousands, except share data)
NOTE 4 - LOANS
Loans at year-end were as follows:
| 2016 | 2015 | |||||||
| Commercial and Agriculture |
$ | 135,462 | $ | 124,402 | ||||
| Commercial Real Estate - owner occupied |
161,364 | 167,897 | ||||||
| Commercial Real Estate - non-owner occupied |
395,931 | 348,439 | ||||||
| Residential Real Estate |
247,308 | 236,338 | ||||||
| Real Estate Construction |
56,293 | 58,898 | ||||||
| Farm Real Estate |
41,170 | 46,993 | ||||||
| Consumer and Other |
17,978 | 18,560 | ||||||
|
|
|
|
|
|||||
| Total Loans |
1,055,506 | 1,001,527 | ||||||
| Allowance for loan losses |
(13,305 | ) | (14,361 | ) | ||||
|
|
|
|
|
|||||
| Net loans |
$ | 1,042,201 | $ | 987,166 | ||||
|
|
|
|
|
|||||
Included in total loans above are deferred loan fees of $94 at December 31, 2016 and $78 at December 31, 2015.
Loans to principal officers, directors, and their affiliates at year-end 2016 and 2015 were as follows:
| 2016 | 2015 | |||||||
| Balance - Beginning of year |
$ | 15,147 | $ | 7,031 | ||||
| New loans and advances |
850 | 2,147 | ||||||
| Repayments |
(1,575 | ) | (2,947 | ) | ||||
| Effect of changes to related parties |
(33 | ) | 8,916 | |||||
|
|
|
|
|
|||||
| Balance - End of year |
$ | 14,389 | $ | 15,147 | ||||
|
|
|
|
|
|||||
(Continued)
54
CIVISTA BANCSHARES, INC.
NOTES TO CONSOLIDATED FINANCIAL STATEMENTS
December 31, 2016, 2015 and 2014
(Amounts in thousands, except share data)
NOTE 5 - ALLOWANCE FOR LOAN LOSSES
Management has an established methodology to determine the adequacy of the allowance for loan losses that assesses the risks and losses inherent in the loan portfolio. For purposes of determining the allowance for loan losses, the Company has segmented certain loans in the portfolio by product type. Loans are segmented into the following pools: Commercial and Agriculture loans, Commercial Real Estate – Owner Occupied loans, Commercial Real Estate – Non-owner Occupied loans, Residential Real Estate loans, Real Estate Construction loans, Farm Real Estate loans and Consumer and Other loans. Loss migration rates for each risk category are calculated and used as the basis for calculating loan loss allowance allocations. Loss migration rates are calculated over a three-year period for all portfolio segments. Starting in the third quarter of 2015, loss migration rates were calculated over a three-year period for all portfolio segments, except for the segment consisting of purchased automobile loans which was calculated over a two-year period and subsequently changed during the first quarter of 2016 to a three-year period. Previously, a two-year loss migration analysis had been used for the entire portfolio. With continued improvement and stability in economic conditions, regulatory guidance recommends a longer look-back period. In addition, Civista made significant changes to consumer and commercial lending policies in the first quarter of 2012. Combined, the stable economy and now seasoned policy changes indicate a three-year period is more reflective of future expectations. Management also considers certain economic factors for trends that management uses to account for the qualitative and environmental changes in risk, which affects the level of the reserve. The following economic factors are analyzed:
| • | Changes in lending policies and procedures |
| • | Changes in experience and depth of lending and management staff |
| • | Changes in quality of credit review system |
| • | Changes in the nature and volume of the loan portfolio |
| • | Changes in past due, classified and nonaccrual loans and TDRs |
| • | Changes in economic and business conditions |
| • | Changes in competition or legal and regulatory requirements |
| • | Changes in concentrations within the loan portfolio |
| • | Changes in the underlying collateral for collateral dependent loans |
The total allowance reflects management’s estimate of loan losses inherent in the loan portfolio at the consolidated balance sheet date. The Company considers the allowance for loan losses of $13,305 adequate to cover loan losses inherent in the loan portfolio, at December 31, 2016. The following tables present, by portfolio segment, the changes in the allowance for loan losses, the ending allocation of the allowance for loan losses and the loan balances outstanding for the years ended December 31, 2016, December 31, 2015 and December 31, 2014. The changes can be impacted by overall loan volume, adversely graded loans, historical charge-offs and economic factors.
(Continued)
55
CIVISTA BANCSHARES, INC.
NOTES TO CONSOLIDATED FINANCIAL STATEMENTS
December 31, 2016, 2015 and 2014
(Amounts in thousands, except share data)
NOTE 5 - ALLOWANCE FOR LOAN LOSSES (Continued)
Allowance for loan losses:
| December 31, 2016 | Beginning balance |
Charge-offs | Recoveries | Provision (Credit) |
Ending Balance |
|||||||||||||||
| Commercial & Agriculture |
$ | 1,478 | $ | (880) | $ | 105 | $ | 1,315 | $ | 2,018 | ||||||||||
| Commercial Real Estate: |
||||||||||||||||||||
| Owner Occupied |
2,467 | (228) | 56 | (124) | 2,171 | |||||||||||||||
| Non-Owner Occupied |
4,657 | (23) | 1,372 | (1,400) | 4,606 | |||||||||||||||
| Residential Real Estate |
4,086 | (455) | 479 | (1,021) | 3,089 | |||||||||||||||
| Real Estate Construction |
371 | (115) | 12 | 152 | 420 | |||||||||||||||
| Farm Real Estate |
538 | — | — | (96) | 442 | |||||||||||||||
| Consumer and Other |
382 | (125) | 46 | 11 | 314 | |||||||||||||||
| Unallocated |
382 | — | — | (137) | 245 | |||||||||||||||
|
|
|
|
|
|
|
|
|
|
|
|||||||||||
| Total |
$ | 14,361 | $ | (1,826) | $ | 2,070 | $ | (1,300) | $ | 13,305 | ||||||||||
|
|
|
|
|
|
|
|
|
|
|
|||||||||||
For the year ended December 31, 2016, the increase in allowance for Commercial & Agriculture loans was due to an increase in general reserves as a result of higher balances and higher loss rates in criticized loans. The result was represented as an increase in the provision. The allowance for Commercial Real Estate – Owner Occupied loans was reduced not only by a decrease in specific reserves required for this type, but also by a decrease in general reserves due to decreases in classified, non-accrual loans and lower loss rates for this type. The result of these changes was represented as a decrease in the provision. The decrease in allowance for Commercial Real Estate – Non-Owner Occupied loans was the result of a decrease in general reserves required as a result of lower loss rates and improvement in past due, classified and non-accrual loans for this type. In addition, a payoff on a previously charged down loan was received resulting in a recovery of approximately $1,303. The net result was represented as a decrease in the provision. The allowance for Residential Real Estate loans was reduced by a decrease in general reserves required for this type as a result of a decrease in loss rates, represented by a decrease in the provision. The allowance for Real Estate Construction loans increased due to an increase in loss rates for this type of loan, which was represented as an increase in the provision. The allowance for Farm Real Estate loans was reduced by a decrease in general reserves required for this type as a result of lower outstanding loan balances and a decrease in loss rates. The result of these changes was represented as a decrease in the provision. Management feels that the unallocated amount is appropriate and within the relevant range for the allowance that is reflective of the risk in the portfolio.
(Continued)
56
CIVISTA BANCSHARES, INC.
NOTES TO CONSOLIDATED FINANCIAL STATEMENTS
December 31, 2016, 2015 and 2014
(Amounts in thousands, except share data)
NOTE 5 - ALLOWANCE FOR LOAN LOSSES (Continued)
Allowance for loan losses:
| December 31, 2015
|
Beginning balance |
Charge-offs | Recoveries | Provision (Credit) |
Ending Balance |
|||||||||||||||
| Commercial & Agriculture |
$ | 1,819 | $ | (190 | ) | $ | 182 | $ | (333 | ) | $ | 1,478 | ||||||||
| Commercial Real Estate: |
||||||||||||||||||||
| Owner Occupied |
2,221 | (523 | ) | 187 | 582 | 2,467 | ||||||||||||||
| Non-Owner Occupied |
4,334 | (81 | ) | 115 | 289 | 4,657 | ||||||||||||||
| Residential Real Estate |
3,747 | (1,135 | ) | 331 | 1,143 | 4,086 | ||||||||||||||
| Real Estate Construction |
428 | — | 5 | (62 | ) | 371 | ||||||||||||||
| Farm Real Estate |
822 | — | 76 | (360 | ) | 538 | ||||||||||||||
| Consumer and Other |
200 | (120 | ) | 46 | 256 | 382 | ||||||||||||||
| Unallocated |
697 | — | — | (315 | ) | 382 | ||||||||||||||
|
|
|
|
|
|
|
|
|
|
|
|||||||||||
| Total |
$ | 14,268 | $ | (2,049 | ) | $ | 942 | $ | 1,200 | $ | 14,361 | |||||||||
|
|
|
|
|
|
|
|
|
|
|
|||||||||||
For the year ended December 31, 2015, the allowance for Commercial and Agriculture loans was reduced due to decreases in specific reserves for impaired loans of $625. The decrease in specific reserves for impaired loans was primarily the result of the resolution of an impaired loan. The Company did not incur losses with this resolution. The result was represented as a decrease in the provision. The increase in the allowance for Commercial Real Estate—Owner Occupied loans was the result of an increase in loss migration rates, which is attributable to the change in the lookback period to a three-year period. The increase in the allowance for Commercial Real Estate – Non–Owner Occupied loans was the result of an increase in loss migration rates, which is attributable to the change in the lookback period to a three-year period. The ending reserve balance for Residential Real Estate loans increased from the end of the previous year due to an increase in loss migration rates, which is attributable to the change in the look-back period to a three-year period. The allowance for Real Estate Construction loans decreased as a result of decreasing loan balances. The allowance for Farm Real Estate loans decreased as a result of decreasing loan balances and loss rates offset by an increase in classified loans. The increase in the allowance for Consumer and other loans increased due to an increase in loss rates, which is attributable to the change in the look-back period. Unallocated reserves declined due to a change in the Company’s lookback period. As described above, the Company changed from a two-year lookback period to a three-year lookback period when calculating all but one segment’s loss migration rates during the third quarter of 2015. The change in methodology resulted in a decline in the unallocated balance with corresponding increase in allocated balances within the reserve calculation. While loan balances were up, loss rates continued to trend downward, exclusive of the change in methodology, resulting in a lower allowance balance. While criticized loans increased slightly, we saw significant improvement in nonperforming loan balances resulting in a decline in specific reserves for impaired loans. As of December 31, 2015, management felt that the unallocated amount was appropriate and within the relevant range for the allowance that was reflective of the risk in the portfolio.
(Continued)
57
CIVISTA BANCSHARES, INC.
NOTES TO CONSOLIDATED FINANCIAL STATEMENTS
December 31, 2016, 2015 and 2014
(Amounts in thousands, except share data)
NOTE 5 - ALLOWANCE FOR LOAN LOSSES (Continued)
Allowance for loan losses:
| December 31, 2014 | Beginning balance |
Charge-offs | Recoveries | Provision (Credit) |
Ending Balance |
|||||||||||||||
| Commercial & Agriculture |
$ | 2,838 | $ | (338) | $ | 251 | $ | (932) | $ | 1,819 | ||||||||||
| Commercial Real Estate: |
||||||||||||||||||||
| Owner Occupied |
2,931 | (1,661) | 360 | 591 | 2,221 | |||||||||||||||
| Non-Owner Occupied |
3,888 | (198) | 50 | 594 | 4,334 | |||||||||||||||
| Residential Real Estate |
5,224 | (2,449) | 293 | 679 | 3,747 | |||||||||||||||
| Real Estate Construction |
184 | — | 6 | 238 | 428 | |||||||||||||||
| Farm Real Estate |
740 | — | — | 82 | 822 | |||||||||||||||
| Consumer and Other |
217 | (135) | 61 | 57 | 200 | |||||||||||||||
| Unallocated |
506 | — | — | 191 | 697 | |||||||||||||||
|
|
|
|
|
|
|
|
|
|
|
|||||||||||
| Total |
$ | 16,528 | $ | (4,781) | $ | 1,021 | $ | 1,500 | $ | 14,268 | ||||||||||
|
|
|
|
|
|
|
|
|
|
|
|||||||||||
For the year ended December 31, 2014, the allowance for Commercial and Agriculture loans was reduced not only by charge-offs, but also due to a decrease in both the loan balances outstanding and the specific reserve required for this type, which was driven by a decrease in the volume of impaired loans and classified loans. The net result of these changes was represented as a decrease in the provision. The decrease in the allowance for Commercial Real Estate—Owner Occupied loans was the result of eleven charge-offs, but also due to a decrease in loan balances outstanding and a decline in nonaccrual loans. The result of these changes was represented as a decrease in the allowance. The increase in the allowance for Commercial Real Estate—Non-Owner Occupied loans was the result of increasing loan balances and increased past-due balances. The allowance for Real Estate Construction loans increased as a result of a significant increase in loan balances. The ending reserve balance for Residential Real Estate loans declined from the end of the previous year due to charge-offs of loans that had a specific reserve previously applied. Additionally, a single relationship resulted in losses of $1,436 related to protecting the Company’s collateral. The net result of the changes was represented as a decrease in the allowance. The allowance for Consumer and Other loans decreased slightly during the year. While loan balances were up, loss rates continued to decrease resulting in the allowance being slightly lower. While we saw improvement in asset quality, given the uncertainty in the economy, management determined that it was appropriate to maintain unallocated reserves at a slightly higher level as of December 31, 2014.
(Continued)
58
CIVISTA BANCSHARES, INC.
NOTES TO CONSOLIDATED FINANCIAL STATEMENTS
December 31, 2016, 2015 and 2014
(Amounts in thousands, except share data)
NOTE 5 - ALLOWANCE FOR LOAN LOSSES (Continued)
| December 31, 2016 | Loans acquired with credit deterioration |
Loans individually evaluated for impairment |
Loans collectively evaluated for impairment |
Total | ||||||||||||
| Allowance for loan losses: |
||||||||||||||||
| Commercial & Agriculture |
$ | 86 | $ | 82 | $ | 1,850 | $ | 2,018 | ||||||||
| Commercial Real Estate: |
||||||||||||||||
| Owner Occupied |
— | 4 | 2,167 | 2,171 | ||||||||||||
| Non-Owner Occupied |
— | — | 4,606 | 4,606 | ||||||||||||
| Residential Real Estate |
89 | 102 | 2,898 | 3,089 | ||||||||||||
| Real Estate Construction |
— | — | 420 | 420 | ||||||||||||
| Farm Real Estate |
— | — | 442 | 442 | ||||||||||||
| Consumer and Other |
— | — | 314 | 314 | ||||||||||||
| Unallocated |
— | — | 245 | 245 | ||||||||||||
|
|
|
|
|
|
|
|
|
|||||||||
| Total |
$ | 175 | $ | 188 | $ | 12,942 | $ | 13,305 | ||||||||
|
|
|
|
|
|
|
|
|
|||||||||
| Outstanding loan balances: |
||||||||||||||||
| Commercial & Agriculture |
$ | 88 | $ | 1,983 | $ | 133,391 | $ | 135,462 | ||||||||
| Commercial Real Estate: |
||||||||||||||||
| Owner Occupied |
— | 1,896 | 159,468 | 161,364 | ||||||||||||
| Non-Owner Occupied |
— | 359 | 395,572 | 395,931 | ||||||||||||
| Residential Real Estate |
168 | 1,686 | 245,454 | 247,308 | ||||||||||||
| Real Estate Construction |
— | — | 56,293 | 56,293 | ||||||||||||
| Farm Real Estate |
— | 614 | 40,556 | 41,170 | ||||||||||||
| Consumer and Other |
— | 1 | 17,977 | 17,978 | ||||||||||||
|
|
|
|
|
|
|
|
|
|||||||||
| Total |
$ | 256 | $ | 6,539 | $ | 1,048,711 | $ | 1,055,506 | ||||||||
|
|
|
|
|
|
|
|
|
|||||||||
(Continued)
59
CIVISTA BANCSHARES, INC.
NOTES TO CONSOLIDATED FINANCIAL STATEMENTS
December 31, 2016, 2015 and 2014
(Amounts in thousands, except share data)
NOTE 5 - ALLOWANCE FOR LOAN LOSSES (Continued)
| December 31, 2015 | Loans acquired with credit deterioration |
Loans individually evaluated for impairment |
Loans collectively evaluated for impairment |
Total | ||||||||||||
| Allowance for loan losses: |
||||||||||||||||
| Commercial & Agriculture |
$ | — | $ | 23 | $ | 1,455 | $ | 1,478 | ||||||||
| Commercial Real Estate: |
||||||||||||||||
| Owner Occupied |
— | 103 | 2,364 | 2,467 | ||||||||||||
| Non-Owner Occupied |
— | — | 4,657 | 4,657 | ||||||||||||
| Residential Real Estate |
123 | 137 | 3,826 | 4,086 | ||||||||||||
| Real Estate Construction |
— | — | 371 | 371 | ||||||||||||
| Farm Real Estate |
— | — | 538 | 538 | ||||||||||||
| Consumer and Other |
— | — | 382 | 382 | ||||||||||||
| Unallocated |
— | — | 382 | 382 | ||||||||||||
|
|
|
|
|
|
|
|
|
|||||||||
| Total |
$ | 123 | $ | 263 | $ | 13,975 | $ | 14,361 | ||||||||
|
|
|
|
|
|
|
|
|
|||||||||
| Outstanding loan balances: |
||||||||||||||||
| Commercial & Agriculture |
$ | 132 | $ | 873 | $ | 123,397 | $ | 124,402 | ||||||||
| Commercial Real Estate: |
||||||||||||||||
| Owner Occupied |
— | 2,141 | 165,756 | 167,897 | ||||||||||||
| Non-Owner Occupied |
— | 1,742 | 346,697 | 348,439 | ||||||||||||
| Residential Real Estate |
131 | 1,642 | 234,565 | 236,338 | ||||||||||||
| Real Estate Construction |
— | — | 58,898 | 58,898 | ||||||||||||
| Farm Real Estate |
— | 953 | 46,040 | 46,993 | ||||||||||||
| Consumer and Other |
— | 3 | 18,557 | 18,560 | ||||||||||||
|
|
|
|
|
|
|
|
|
|||||||||
| Total |
$ | 263 | $ | 7,354 | $ | 993,910 | $ | 1,001,527 | ||||||||
|
|
|
|
|
|
|
|
|
|||||||||
(Continued)
60
CIVISTA BANCSHARES, INC.
NOTES TO CONSOLIDATED FINANCIAL STATEMENTS
December 31, 2016, 2015 and 2014
(Amounts in thousands, except share data)
NOTE 5 - ALLOWANCE FOR LOAN LOSSES (Continued)
The following tables represent credit exposures by internally assigned risk ratings for the periods ended December 31, 2016 and 2015. The remaining loans in the Residential Real Estate, Real Estate Construction and Consumer and Other loan categories that are not assigned a risk grade are presented in a separate table below. The risk rating analysis estimates the capability of the borrower to repay the contractual obligations of the loan agreements as scheduled or at all. The Company’s internal credit risk rating system is based on experiences with similarly graded loans.
The Company’s internally assigned grades are as follows:
| • | Pass – loans which are protected by the current net worth and paying capacity of the obligor or by the value of the underlying collateral. |
| • | Special Mention – loans where a potential weakness or risk exists, which could cause a more serious problem if not corrected. |
| • | Substandard – loans that have a well-defined weakness based on objective evidence and are characterized by the distinct possibility that Civista will sustain some loss if the deficiencies are not corrected. |
| • | Doubtful – loans classified as doubtful have all the weaknesses inherent in a substandard asset. In addition, these weaknesses make collection or liquidation in full highly questionable and improbable, based on existing circumstances. |
| • | Loss – loans classified as a loss are considered uncollectible, or of such value that continuance as an asset is not warranted. |
| • | Unrated – Generally, Residential Real Estate, Real Estate Construction and Consumer and Other loans are not risk-graded, except when collateral is used for a business purpose. |
(Continued)
61
CIVISTA BANCSHARES, INC.
NOTES TO CONSOLIDATED FINANCIAL STATEMENTS
December 31, 2016, 2015 and 2014
(Amounts in thousands, except share data)
NOTE 5 - ALLOWANCE FOR LOAN LOSSES (Continued)
| December 31, 2016 |
Pass | Special Mention |
Substandard | Doubtful | Ending Balance |
|||||||||||||||
| Commercial & Agriculture |
$ | 127,867 | $ | 4,300 | $ | 3,295 | $ | — | $ | 135,462 | ||||||||||
| Commercial Real Estate: |
||||||||||||||||||||
| Owner Occupied |
151,659 | 4,016 | 5,689 | — | 161,364 | |||||||||||||||
| Non-Owner Occupied |
393,592 | 1,676 | 663 | — | 395,931 | |||||||||||||||
| Residential Real Estate |
59,015 | 1,661 | 6,911 | — | 67,587 | |||||||||||||||
| Real Estate Construction |
50,678 | 16 | 27 | — | 50,721 | |||||||||||||||
| Farm Real Estate |
31,814 | 5,673 | 3,683 | — | 41,170 | |||||||||||||||
| Consumer and Other |
2,135 | — | 109 | — | 2,244 | |||||||||||||||
|
|
|
|
|
|
|
|
|
|
|
|||||||||||
| Total |
$ | 816,760 | $ | 17,342 | $ | 20,377 | $ | — | $ | 854,479 | ||||||||||
|
|
|
|
|
|
|
|
|
|
|
|||||||||||
| December 31, 2015 |
Pass | Special Mention |
Substandard | Doubtful | Ending Balance |
|||||||||||||||
| Commercial & Agriculture |
$ | 117,739 | $ | 3,090 | $ | 3,573 | $ | — | $ | 124,402 | ||||||||||
| Commercial Real Estate: |
||||||||||||||||||||
| Owner Occupied |
156,622 | 5,571 | 5,704 | — | 167,897 | |||||||||||||||
| Non-Owner Occupied |
339,734 | 6,100 | 2,605 | — | 348,439 | |||||||||||||||
| Residential Real Estate |
62,147 | 1,671 | 7,435 | — | 71,253 | |||||||||||||||
| Real Estate Construction |
52,399 | 216 | 29 | — | 52,644 | |||||||||||||||
| Farm Real Estate |
39,787 | 4,024 | 3,182 | — | 46,993 | |||||||||||||||
| Consumer and Other |
1,987 | 3 | 111 | — | 2,101 | |||||||||||||||
|
|
|
|
|
|
|
|
|
|
|
|||||||||||
| Total |
$ | 770,415 | $ | 20,675 | $ | 22,639 | $ | — | $ | 813,729 | ||||||||||
|
|
|
|
|
|
|
|
|
|
|
|||||||||||
(Continued)
62
CIVISTA BANCSHARES, INC.
NOTES TO CONSOLIDATED FINANCIAL STATEMENTS
December 31, 2016, 2015 and 2014
(Amounts in thousands, except share data)
NOTE 5 - ALLOWANCE FOR LOAN LOSSES (Continued)
The following tables present performing and nonperforming loans based solely on payment activity for the years ended December 31, 2016 and December 31, 2015 that have not been assigned an internal risk grade. The types of loans presented here are not assigned a risk grade unless there is evidence of a problem. Payment activity is reviewed by management on a monthly basis to evaluate performance. Loans are considered to be nonperforming when they become 90 days past due or if management thinks that we may not collect all of our principal and interest. Nonperforming loans also include certain loans that have been modified in Troubled Debt Restructurings (TDRs) where economic concessions have been granted to borrowers who have experienced or are expected to experience financial difficulties. These concessions typically result from the Company’s loss mitigation activities and could include reductions in the interest rate, payment extensions, forgiveness of principal, forbearance or other actions due to economic status. Certain TDRs are classified as nonperforming at the time of restructure and may only be returned to performing status after considering the borrower’s sustained repayment performance for a reasonable period, generally six months.
| December 31, 2016 |
Residential Real Estate |
Real Estate Construction |
Consumer and Other |
Total | ||||||||||||
| Performing |
$ | 179,721 | $ | 5,572 | $ | 15,725 | $ | 201,018 | ||||||||
| Nonperforming |
— | — | 9 | 9 | ||||||||||||
|
|
|
|
|
|
|
|
|
|||||||||
| Total |
$ | 179,721 | $ | 5,572 | $ | 15,734 | $ | 201,027 | ||||||||
|
|
|
|
|
|
|
|
|
|||||||||
| December 31, 2015 |
Residential Real Estate |
Real Estate Construction |
Consumer and Other |
Total | ||||||||||||
| Performing |
$ | 165,048 | $ | 6,254 | $ | 16,458 | $ | 187,760 | ||||||||
| Nonperforming |
37 | — | 1 | 38 | ||||||||||||
|
|
|
|
|
|
|
|
|
|||||||||
| Total |
$ | 165,085 | $ | 6,254 | $ | 16,459 | $ | 187,798 | ||||||||
|
|
|
|
|
|
|
|
|
|||||||||
(Continued)
63
CIVISTA BANCSHARES, INC.
NOTES TO CONSOLIDATED FINANCIAL STATEMENTS
December 31, 2016, 2015 and 2014
(Amounts in thousands, except share data)
NOTE 5 - ALLOWANCE FOR LOAN LOSSES (Continued)
The following tables include an aging analysis of the recorded investment of past due loans outstanding as of December 31, 2016 and 2015.
| December 31, 2016 |
30-59 Days Past Due |
60-89 Days Past Due |
90 Days or Greater |
Total Past Due |
Current | Purchased Credit- Impaired Loans |
Total Loans | Past Due 90 Days and Accruing |
||||||||||||||||||||||||
| Commercial & Agriculture |
$ | 156 | $ | 20 | $ | 152 | $ | 328 | $ | 135,046 | $ | 88 | $ | 135,462 | $ | — | ||||||||||||||||
| Commercial Real Estate: |
||||||||||||||||||||||||||||||||
| Owner Occupied |
722 | 553 | 280 | 1,555 | 159,809 | — | 161,364 | — | ||||||||||||||||||||||||
| Non-Owner Occupied |
147 | — | 316 | 463 | 395,468 | — | 395,931 | — | ||||||||||||||||||||||||
| Residential Real Estate |
1,812 | 507 | 1,049 | 3,368 | 243,772 | 168 | 247,308 | — | ||||||||||||||||||||||||
| Real Estate Construction |
— | — | 27 | 27 | 56,266 | — | 56,293 | — | ||||||||||||||||||||||||
| Farm Real Estate |
93 | — | — | 93 | 41,077 | — | 41,170 | — | ||||||||||||||||||||||||
| Consumer and Other |
215 | 31 | 31 | 277 | 17,701 | — | 17,978 | 9 | ||||||||||||||||||||||||
|
|
|
|
|
|
|
|
|
|
|
|
|
|
|
|
|
|||||||||||||||||
| Total |
$ | 3,145 | $ | 1,111 | $ | 1,855 | $ | 6,111 | $ | 1,049,139 | $ | 256 | $ | 1,055,506 | $ | 9 | ||||||||||||||||
|
|
|
|
|
|
|
|
|
|
|
|
|
|
|
|
|
|||||||||||||||||
| December 31, 2015 |
30-59 Days Past Due |
60-89 Days Past Due |
90 Days or Greater |
Total Past Due |
Current | Purchased Credit- Impaired Loans |
Total Loans | Past Due 90 Days and Accruing |
||||||||||||||||||||||||
| Commercial & Agriculture |
$ | 9 | $ | 32 | $ | 37 | $ | 78 | $ | 124,192 | $ | 132 | $ | 124,402 | $ | — | ||||||||||||||||
| Commercial Real Estate: |
||||||||||||||||||||||||||||||||
| Owner Occupied |
982 | 36 | 284 | 1,302 | 166,595 | — | 167,897 | — | ||||||||||||||||||||||||
| Non-Owner Occupied |
269 | 330 | 123 | 722 | 347,717 | — | 348,439 | — | ||||||||||||||||||||||||
| Residential Real Estate |
2,640 | 404 | 1,725 | 4,769 | 231,438 | 131 | 236,338 | — | ||||||||||||||||||||||||
| Real Estate Construction |
8 | — | — | 8 | 58,890 | — | 58,898 | — | ||||||||||||||||||||||||
| Farm Real Estate |
— | — | — | — | 46,993 | — | 46,993 | — | ||||||||||||||||||||||||
| Consumer and Other |
98 | 68 | 8 | 174 | 18,386 | — | 18,560 | — | ||||||||||||||||||||||||
|
|
|
|
|
|
|
|
|
|
|
|
|
|
|
|
|
|||||||||||||||||
| Total |
$ | 4,006 | $ | 870 | $ | 2,177 | $ | 7,053 | $ | 994,211 | $ | 263 | $ | 1,001,527 | $ | — | ||||||||||||||||
|
|
|
|
|
|
|
|
|
|
|
|
|
|
|
|
|
|||||||||||||||||
(Continued)
64
CIVISTA BANCSHARES, INC.
NOTES TO CONSOLIDATED FINANCIAL STATEMENTS
December 31, 2016, 2015 and 2014
(Amounts in thousands, except share data)
NOTE 5 - ALLOWANCE FOR LOAN LOSSES (Continued)
The following table presents loans on nonaccrual status, excluding purchased credit-impaired (PCI) loans, as of December 31, 2016 and 2015.
| 2016 | 2015 | |||||||
| Commercial & Agriculture |
$ | 1,622 | $ | 1,185 | ||||
| Commercial Real Estate: |
||||||||
| Owner Occupied |
1,461 | 1,645 | ||||||
| Non-Owner Occupied |
464 | 1,428 | ||||||
| Residential Real Estate |
3,266 | 3,911 | ||||||
| Real Estate Construction |
27 | 29 | ||||||
| Farm Real Estate |
2 | 961 | ||||||
| Consumer and Other |
101 | 100 | ||||||
|
|
|
|
|
|||||
| Total |
$ | 6,943 | $ | 9,259 | ||||
|
|
|
|
|
|||||
Nonaccrual Loans: Loans are considered for nonaccrual status upon reaching 90 days delinquency, unless the loan is well secured and in the process of collection, although the Company may be receiving partial payments of interest and partial repayments of principal on such loans. When a loan is placed on nonaccrual status, previously accrued but unpaid interest is deducted from interest income. A loan may be returned to accruing status only if one of three conditions are met: the loan is well-secured and none of the principal and interest has been past due for a minimum of 90 days; the loan is a TDR and the borrower has made a minimum of six months payments; or the principal and interest payments are reasonably assured and a sustained period of performance has occurred, generally six months. The gross interest income that would have been recorded on nonaccrual loans in 2016, 2015 and 2014 if the loans had been current in accordance with their original terms and had been outstanding throughout the period or since origination, if held for part of the period, was $701, $1,761 and $1,477, respectively. The amount of interest income on such loans recognized on a cash basis was $1,138 in 2016, $766 in 2015 and $719 in 2014.
Modifications: A modification of a loan constitutes a TDR when the Company for economic or legal reasons related to a borrower’s financial difficulties grants a concession to the borrower that it would not otherwise consider. The Company offers various types of concessions when modifying a loan, however, forgiveness of principal is rarely granted. Commercial Real Estate loans modified in a TDR often involve reducing the interest rate lower than the current market rate for new debt with similar risk. Real Estate loans modified in a TDR were primarily comprised of interest rate reductions where monthly payments were lowered to accommodate the borrowers’ financial needs.
Loans modified in a TDR are typically already on non-accrual status and partial charge-offs have in some cases already been taken against the outstanding loan balance. As a result, loans modified in a TDR may have the financial effect of increasing the specific allowance associated with the loan. An allowance for impaired loans that have been modified in a TDR are measured based on the present value of expected future cash flows discounted at the loan’s effective interest rate or the estimated fair value of the collateral, less any selling costs, if the loan is collateral dependent. Management exercises significant judgment in developing these estimates. TDRs accounted for $278 of the allowance for loan losses as of December 31, 2016, $286 as of December 31, 2015 and $895 as of December 31, 2014.
(Continued)
65
CIVISTA BANCSHARES, INC.
NOTES TO CONSOLIDATED FINANCIAL STATEMENTS
December 31, 2016, 2015 and 2014
(Amounts in thousands, except share data)
NOTE 5 - ALLOWANCE FOR LOAN LOSSES (Continued)
Loan modifications that are considered TDRs completed during the twelve month periods ended December 31, 2016, 2015 and 2014 were as follows:
| For the Twelve Month Period Ended December 31, 2016 |
||||||||||||
| Number of Contracts |
Pre- Modification Outstanding Recorded Investment |
Post- Modification Outstanding Recorded Investment |
||||||||||
| Commercial & Agriculture |
4 | $ | 529 | $ | 529 | |||||||
| Commercial Real Estate: |
||||||||||||
| Owner Occupied |
— | — | — | |||||||||
| Non-Owner Occupied |
— | — | — | |||||||||
| Residential Real Estate |
2 | 308 | 308 | |||||||||
| Real Estate Construction |
— | — | — | |||||||||
| Farm Real Estate |
3 | 700 | 700 | |||||||||
| Consumer and Other |
— | — | — | |||||||||
|
|
|
|
|
|
|
|||||||
| Total Loan Modifications |
9 | $ | 1,537 | $ | 1,537 | |||||||
|
|
|
|
|
|
|
|||||||
| For the Twelve Month Period Ended December 31, 2015 |
||||||||||||
| Number of Contracts |
Pre- Modification Outstanding Recorded Investment |
Post- Modification Outstanding Recorded Investment |
||||||||||
| Commercial & Agriculture |
— | $ | — | $ | — | |||||||
| Commercial Real Estate: |
||||||||||||
| Owner Occupied |
— | — | — | |||||||||
| Non-Owner Occupied |
— | — | — | |||||||||
| Residential Real Estate |
— | — | — | |||||||||
| Real Estate Construction |
1 | 41 | 41 | |||||||||
| Farm Real Estate |
— | — | — | |||||||||
| Consumer and Other |
— | — | — | |||||||||
|
|
|
|
|
|
|
|||||||
| Total Loan Modifications |
1 | $ | 41 | $ | 41 | |||||||
|
|
|
|
|
|
|
|||||||
(Continued)
66
CIVISTA BANCSHARES, INC.
NOTES TO CONSOLIDATED FINANCIAL STATEMENTS
December 31, 2016, 2015 and 2014
(Amounts in thousands, except share data)
NOTE 5 - ALLOWANCE FOR LOAN LOSSES (Continued)
| For the Twelve Month Period Ended December 31, 2014 |
||||||||||||
| Number of Contracts |
Pre- Modification Outstanding Recorded Investment |
Post- Modification Outstanding Recorded Investment |
||||||||||
| Commercial & Agriculture |
— | $ | — | $ | — | |||||||
| Commercial Real Estate: |
||||||||||||
| Owner Occupied |
— | — | — | |||||||||
| Non-Owner Occupied |
— | — | — | |||||||||
| Residential Real Estate |
9 | 619 | 554 | |||||||||
| Real Estate Construction |
1 | 35 | 35 | |||||||||
| Farm Real Estate |
— | — | — | |||||||||
| Consumer and Other |
— | — | — | |||||||||
|
|
|
|
|
|
|
|||||||
| Total Loan Modifications |
10 | $ | 654 | $ | 589 | |||||||
|
|
|
|
|
|
|
|||||||
Recidivism, or the borrower defaulting on its obligation pursuant to a modified loan, results in the loan once again becoming a non-accrual loan. Recidivism occurs at a notably higher rate than do defaults on new originations loans, so modified loans present a higher risk of loss than do new origination loans. During the period ended December 31, 2016, there were no defaults on loans that were modified and considered TDRs during the previous twelve months. During the twelve month period ended December 31, 2015, there was one default, totaling $107, on loans which were modified and considered TDRs during the previous twelve months. During the period ended December 31, 2014, there were no defaults on loans that were modified and considered TDRs during the previous twelve months.
Impaired Loans: Larger (greater than $350) commercial loan and commercial real estate loan relationships, all TDRs and residential real estate and consumer loans that are part of a larger relationship are tested for impairment. These loans are analyzed to determine if it is probable that all amounts will not be collected according to the contractual terms of the loan agreement. If management determines that the value of the impaired loan is less than the recorded investment in the loan (net of previous charge-offs, deferred loan fees or costs and unamortized premium or discount), impairment is recognized through an allowance estimate or a charge-off to the allowance.
(Continued)
67
CIVISTA BANCSHARES, INC.
NOTES TO CONSOLIDATED FINANCIAL STATEMENTS
December 31, 2016, 2015 and 2014
(Amounts in thousands, except share data)
NOTE 5 - ALLOWANCE FOR LOAN LOSSES (Continued)
The following tables include the recorded investment and unpaid principal balances for impaired financing receivables, excluding PCI loans, with the associated allowance amount, if applicable, as of December 31, 2016 and 2015.
| December 31, 2016 | December 31, 2015 | |||||||||||||||||||||||
| Recorded Investment |
Unpaid Principal Balance |
Related Allowance |
Recorded Investment |
Unpaid Principal Balance |
Related Allowance |
|||||||||||||||||||
| With no related allowance recorded: |
||||||||||||||||||||||||
| Commercial & Agriculture |
$ | 1,230 | $ | 1,751 | $ | 851 | $ | 1,034 | ||||||||||||||||
| Commercial Real Estate: |
||||||||||||||||||||||||
| Owner Occupied |
1,658 | 1,803 | 1,224 | 1,343 | ||||||||||||||||||||
| Non-Owner Occupied |
359 | 386 | 1,742 | 1,826 | ||||||||||||||||||||
| Residential Real Estate |
1,259 | 1,590 | 965 | 1,591 | ||||||||||||||||||||
| Farm Real Estate |
614 | 614 | 953 | 1,026 | ||||||||||||||||||||
| Consumer and Other |
1 | 1 | 3 | 3 | ||||||||||||||||||||
|
|
|
|
|
|
|
|
|
|||||||||||||||||
| Total |
5,121 | 6,145 | 5,738 | 6,823 | ||||||||||||||||||||
| With an allowance recorded: |
||||||||||||||||||||||||
| Commercial & Agriculture |
753 | 1,303 | $ | 82 | 22 | 23 | $ | 23 | ||||||||||||||||
| Commercial Real Estate: |
||||||||||||||||||||||||
| Owner Occupied |
238 | 238 | 4 | 917 | 999 | 103 | ||||||||||||||||||
| Non-Owner Occupied |
— | — | — | — | — | — | ||||||||||||||||||
| Residential Real Estate |
427 | 431 | 102 | 677 | 677 | 137 | ||||||||||||||||||
| Farm Real Estate |
— | — | — | — | — | — | ||||||||||||||||||
|
|
|
|
|
|
|
|
|
|
|
|
|
|||||||||||||
| Total |
1,418 | 1,972 | 188 | 1,616 | 1,699 | 263 | ||||||||||||||||||
| Total: |
||||||||||||||||||||||||
| Commercial & Agriculture |
1,983 | 3,054 | 82 | 873 | 1,057 | 23 | ||||||||||||||||||
| Commercial Real Estate: |
||||||||||||||||||||||||
| Owner Occupied |
1,896 | 2,041 | 4 | 2,141 | 2,342 | 103 | ||||||||||||||||||
| Non-Owner Occupied |
359 | 386 | — | 1,742 | 1,826 | — | ||||||||||||||||||
| Residential Real Estate |
1,686 | 2,021 | 102 | 1,642 | 2,268 | 137 | ||||||||||||||||||
| Farm Real Estate |
614 | 614 | — | 953 | 1,026 | — | ||||||||||||||||||
| Consumer and Other |
1 | 1 | — | 3 | 3 | — | ||||||||||||||||||
|
|
|
|
|
|
|
|
|
|
|
|
|
|||||||||||||
| Total |
$ | 6,539 | $ | 8,117 | $ | 188 | $ | 7,354 | $ | 8,522 | $ | 263 | ||||||||||||
|
|
|
|
|
|
|
|
|
|
|
|
|
|||||||||||||
(Continued)
68
CIVISTA BANCSHARES, INC.
NOTES TO CONSOLIDATED FINANCIAL STATEMENTS
December 31, 2016, 2015 and 2014
(Amounts in thousands, except share data)
NOTE 5 - ALLOWANCE FOR LOAN LOSSES (Continued)
The following tables include the average recorded investment and interest income recognized for impaired financing receivables as of, and for the years ended, December 31, 2016, 2015 and 2014.
| For the year ended: | December 31, 2016 | December 31, 2015 | ||||||||||||||
| Average Recorded Investment |
Interest Income Recognized |
Average Recorded Investment |
Interest Income Recognized |
|||||||||||||
| Commercial & Agriculture |
$ | 2,036 | $ | 40 | $ | 1,519 | $ | 54 | ||||||||
| Commercial Real Estate: |
||||||||||||||||
| Owner Occupied |
1,847 | 862 | 2,738 | 139 | ||||||||||||
| Non-Owner Occupied |
1,039 | 83 | 1,946 | 32 | ||||||||||||
| Residential Real Estate |
1,787 | 175 | 2,544 | 103 | ||||||||||||
| Real Estate Construction |
— | 1 | 16 | — | ||||||||||||
| Farm Real Estate |
1,006 | 95 | 653 | 56 | ||||||||||||
| Consumer and Other |
2 | — | 4 | — | ||||||||||||
|
|
|
|
|
|
|
|
|
|||||||||
| Total |
$ | 7,717 | $ | 1,256 | $ | 9,420 | $ | 384 | ||||||||
|
|
|
|
|
|
|
|
|
|||||||||
| For the year ended: | December 31, 2014 | |||||||||||||||
| Average Recorded Investment |
Interest Income Recognized |
|||||||||||||||
| Commercial & Agriculture |
$ | 3,316 | $ | 104 | ||||||||||||
| Commercial Real Estate: |
||||||||||||||||
| Owner Occupied |
5,720 | 200 | ||||||||||||||
| Non-Owner Occupied |
2,767 | 40 | ||||||||||||||
| Residential Real Estate |
3,291 | 207 | ||||||||||||||
| Real Estate Construction |
— | — | ||||||||||||||
| Farm Real Estate |
219 | 19 | ||||||||||||||
| Consumer and Other |
6 | — | ||||||||||||||
|
|
|
|
|
|||||||||||||
| Total |
$ | 15,319 | $ | 570 | ||||||||||||
|
|
|
|
|
|||||||||||||
Foreclosed assets acquired in settlement of loans are carried at fair value less estimated costs to sell and are included in other assets on the Consolidated Balance Sheet. As of December 31, 2016 and December 31, 2015, a total of $37 and $116, respectively of foreclosed assets were included with other assets. As of December 31, 2016, included within the foreclosed assets is $37 of consumer residential mortgages that were foreclosed on or received via a deed in lieu transaction prior to the period end. As of December 31, 2016 and December 31, 2015, the Company had initiated formal foreclosure procedures on $710 and $340, respectively of consumer residential mortgages.
(Continued)
69
CIVISTA BANCSHARES, INC.
NOTES TO CONSOLIDATED FINANCIAL STATEMENTS
December 31, 2016, 2015 and 2014
(Amounts in thousands, except share data)
NOTE 5 - ALLOWANCE FOR LOAN LOSSES (Continued)
Changes in the amortizable yield for PCI loans were as follows, since acquisition:
| At December 31, 2016 | At December 31, 2015 | |||||||
| (In Thousands) | (In Thousands) | |||||||
| Balance at beginning of period |
$ | 80 | $ | — | ||||
| Acquisition of PCI loans |
— | 140 | ||||||
| Accretion |
(31 | ) | (60 | ) | ||||
|
|
|
|
|
|||||
| Balance at end of period |
$ | 49 | $ | 80 | ||||
|
|
|
|
|
|||||
The following table presents additional information regarding loans acquired and accounted for in accordance with ASC 310-30:
| At December 31, 2016 | At December 31, 2015 | |||||||
| Acquired Loans with Specific Evidence of Deterioration of Credit Quality (ASC 310-30) |
Acquired Loans with Specific Evidence of Deterioration of Credit Quality (ASC 310-30) |
|||||||
| (In Thousands) | ||||||||
| Outstanding balance |
$ | 850 | $ | 965 | ||||
| Carrying amount |
256 | 263 | ||||||
There has been $175 and $123 in allowance for loan losses recorded for acquired loans with or without specific evidence of deterioration in credit quality as of December 31, 2016 and December 31, 2015, respectively.
(Continued)
70
CIVISTA BANCSHARES, INC.
NOTES TO CONSOLIDATED FINANCIAL STATEMENTS
December 31, 2016, 2015 and 2014
(Amounts in thousands, except share data)
NOTE 6 - OTHER COMPREHENSIVE INCOME (LOSS)
The following table presents the changes in each component of accumulated other comprehensive loss, net of tax, as of December 31, 2016, 2015 and 2014.
| For the Year Ended December 31, 2016 |
For the Year Ended December 31, 2015 |
For the Year Ended December 31, 2014 |
||||||||||||||||||||||||||||||||||
| Unrealized Gains and Losses on Available for Sale Securities |
Defined Benefit Pension Items |
Total | Unrealized Gains and Losses on Available for Sale Securities |
Defined Benefit Pension Items |
Total | Unrealized Gains and Losses on Available for Sale Securities |
Defined Benefit Pension Items |
Total | ||||||||||||||||||||||||||||
| Beginning balance |
$ | 3,554 | $ | (4,049 | ) | $ | (495 | ) | $ | 3,730 | $ | (3,777 | ) | $ | (47 | ) | $ | 341 | $ | (4,588 | ) | $ | (4,247 | ) | ||||||||||||
|
|
|
|
|
|
|
|
|
|
|
|
|
|
|
|
|
|
|
|||||||||||||||||||
| Other comprehensive income (loss) before reclassifications |
(1,533 | ) | (511 | ) | (2,044 | ) | (188 | ) | (449 | ) | (637 | ) | 3,464 | 591 | 4,055 | |||||||||||||||||||||
| Amounts reclassified from accumulated other comprehensive loss |
(13 | ) | 215 | 202 | 12 | 177 | 189 | (75 | ) | 220 | 145 | |||||||||||||||||||||||||
|
|
|
|
|
|
|
|
|
|
|
|
|
|
|
|
|
|
|
|||||||||||||||||||
| Net current-period other comprehensive income (loss) |
(1,546 | ) | (296 | ) | (1,842 | ) | (176 | ) | (272 | ) | (448 | ) | 3,389 | 811 | 4,200 | |||||||||||||||||||||
|
|
|
|
|
|
|
|
|
|
|
|
|
|
|
|
|
|
|
|||||||||||||||||||
| Ending balance |
$ | 2,008 | $ | (4,345 | ) | $ | (2,337 | ) | $ | 3,554 | $ | (4,049 | ) | $ | (495 | ) | $ | 3,730 | $ | (3,777 | ) | $ | (47 | ) | ||||||||||||
|
|
|
|
|
|
|
|
|
|
|
|
|
|
|
|
|
|
|
|||||||||||||||||||
Amounts in parentheses indicate debits on the consolidated balance sheets.
(Continued)
71
CIVISTA BANCSHARES, INC.
NOTES TO CONSOLIDATED FINANCIAL STATEMENTS
December 31, 2016, 2015 and 2014
(Amounts in thousands, except share data)
NOTE 6 - OTHER COMPREHENSIVE INCOME (LOSS) (Continued)
The following table presents the amounts reclassified out of each component of accumulated other comprehensive loss as of December 31, 2016, 2015 and 2014.
| Amout Reclassified from Accumulated Other Comprehensive Loss (a) |
||||||||||||||
| For the year ended December 31, | ||||||||||||||
| Details about Accumulated Other Comprehensive Loss |
2016 | 2015 | 2014 | Affected Line Item in the | ||||||||||
| Unrealized gains (losses) on available-for-sale securities |
$ | 19 | $ | (18 | ) | $ | 113 | Net gain (loss) on sale of securities | ||||||
| Tax effect |
(6 | ) | 6 | (38 | ) | Income taxes | ||||||||
|
|
|
|
|
|
|
|||||||||
| 13 | (12 | ) | 75 | |||||||||||
| Amortization of defined benefit pension items |
||||||||||||||
| Actuarial losses |
(326 | ) (b) | (270 | ) (b) | (334 | ) (b) | Salaries, wages and benefits | |||||||
| Tax effect |
111 | 93 | 114 | Income taxes | ||||||||||
|
|
|
|
|
|
|
|||||||||
| (215 | ) | (177 | ) | (220 | ) | |||||||||
| Total reclassifications for the period |
$ | (202 | ) | $ | (189 | ) | $ | (145 | ) | |||||
|
|
|
|
|
|
|
|||||||||
| (a) | Amounts in parentheses indicate expenses and other amounts indicate income. |
| (b) | These accumulated other comprehensive income (loss) components are included in the computation of net periodic pension cost. |
NOTE 7 - PREMISES AND EQUIPMENT
Year-end premises and equipment were as follows:
| 2016 | 2015 | |||||||
| Land and improvements |
$ | 5,094 | $ | 4,225 | ||||
| Buildings and improvements |
20,266 | 20,856 | ||||||
| Furniture and equipment |
16,070 | 15,996 | ||||||
|
|
|
|
|
|||||
| Total |
41,430 | 41,077 | ||||||
| Accumulated depreciation |
(23,510 | ) | (24,133 | ) | ||||
|
|
|
|
|
|||||
| Premises and equipment, net |
$ | 17,920 | $ | 16,944 | ||||
|
|
|
|
|
|||||
Depreciation expense was $1,257, $1,193 and $1,176 for 2016, 2015 and 2014, respectively.
72
CIVISTA BANCSHARES, INC.
NOTES TO CONSOLIDATED FINANCIAL STATEMENTS
December 31, 2016, 2015 and 2014
(Amounts in thousands, except share data)
NOTE 7 - PREMISES AND EQUIPMENT (Continued)
Rent expense was $540, $506 and $377 for 2016, 2015 and 2014, respectively. Rent commitments under non-cancelable operating leases at December 31, 2016 were as follows, before considering renewal options that generally are present.
| 2017 |
$ | 537 | ||
| 2018 |
362 | |||
| 2019 |
319 | |||
| 2020 |
104 | |||
| 2021 |
56 | |||
| Thereafter |
23 | |||
|
|
|
|||
| Total |
$ | 1,401 | ||
|
|
|
The rent commitments listed above are primarily for the leasing of seven financial services branches.
NOTE 8 - GOODWILL AND INTANGIBLE ASSETS
There has been no change in the carrying amount of goodwill of $27,095 for the years ended December 31, 2016 and December 31, 2015.
Management performs an evaluation of goodwill for impairment on an annual basis, or more frequently if events or changes in circumstances indicate that the asset might be impaired. Management performed an evaluation of the Company’s goodwill during the fourth quarter of 2016. In performing its evaluation, management obtained several commonly used financial ratios from pending and completed purchase transactions for banks based in the Midwest. Management used these ratios to determine an implied market value for the Company. The implied market value was then used to determine whether or not additional testing was required. Based on this test, management concluded that the Company’s goodwill was not impaired at December 31, 2016.
73
CIVISTA BANCSHARES, INC.
NOTES TO CONSOLIDATED FINANCIAL STATEMENTS
December 31, 2016, 2015 and 2014
(Amounts in thousands, except share data)
NOTE 8 - GOODWILL AND INTANGIBLE ASSETS (Continued)
Acquired intangible assets were as follows as of year end.
| 2016 | 2015 | |||||||||||||||||||||||
| Gross Carrying Amount |
Accumulated Amortization |
Net Carrying Amount |
Gross Carrying Amount |
Accumulated Amortization |
Net Carrying Amount |
|||||||||||||||||||
| Amortized intangible assets(1): |
||||||||||||||||||||||||
| MSRs |
$ | 912 | $ | 250 | $ | 662 | $ | 750 | $ | 162 | $ | 588 | ||||||||||||
| Core deposit intangibles |
7,274 | 6,152 | 1,122 | 7,274 | 5,453 | 1,821 | ||||||||||||||||||
|
|
|
|
|
|
|
|
|
|
|
|
|
|||||||||||||
| Total amortized intangible assets |
$ | 8,186 | $ | 6,402 | $ | 1,784 | $ | 8,024 | $ | 5,615 | $ | 2,409 | ||||||||||||
|
|
|
|
|
|
|
|
|
|
|
|
|
|||||||||||||
| (1) | Excludes fully amortized intangible assets |
Aggregate core deposit intangible amortization expense was $699, $711 and $769 for 2016, 2015 and 2014, respectively.
Aggregate mortgage servicing rights amortization was $74, $29 and $31 for 2016, 2015 nad 2014, respectively.
Estimated amortization expense for each of the next five years and thereafter is as follows:
| MSRs | Core deposit intangibles |
Total | ||||||||||
| 2017 |
$ | 37 | $ | 587 | $ | 624 | ||||||
| 2018 |
37 | 111 | 148 | |||||||||
| 2019 |
37 | 88 | 125 | |||||||||
| 2020 |
37 | 71 | 108 | |||||||||
| 2021 |
37 | 68 | 105 | |||||||||
| Thereafter |
477 | 197 | 674 | |||||||||
|
|
|
|
|
|
|
|||||||
| $ | 662 | $ | 1,122 | $ | 1,784 | |||||||
|
|
|
|
|
|
|
|||||||
74
CIVISTA BANCSHARES, INC.
NOTES TO CONSOLIDATED FINANCIAL STATEMENTS
December 31, 2016, 2015 and 2014
(Amounts in thousands, except share data)
NOTE 9 - INTEREST-BEARING DEPOSITS
Interest-bearing deposits as of December 31, 2016 and 2015 were as follows:
| 2016 | 2015 | |||||||
| Demand |
$ | 183,759 | $ | 176,303 | ||||
| Statement and Passbook Savings |
384,330 | 364,066 | ||||||
| Certificates of Deposit: |
||||||||
| In excess of $100 |
45,882 | 53,499 | ||||||
| Other |
136,481 | 130,840 | ||||||
| Individual Retirement Accounts |
25,063 | 26,710 | ||||||
|
|
|
|
|
|||||
| Total |
$ | 775,515 | $ | 751,418 | ||||
|
|
|
|
|
|||||
Scheduled maturities of certificates of deposit, including IRA’s at December 31, 2016 were as follows:
| 2017 |
$ | 138,657 | ||
| 2018 |
38,790 | |||
| 2019 |
19,980 | |||
| 2020 |
6,536 | |||
| 2021 |
3,078 | |||
| Thereafter |
385 | |||
|
|
|
|||
| Total |
$ | 207,426 | ||
|
|
|
Deposits from the Company’s principal officers, directors, and their affiliates at year-end 2016 and 2015 were $9,209 and $6,868, respectively.
As of December 31, 2016, CDs and IRAs totaling $14,825 met or exceeded the FDIC’s insurance limit.
75
CIVISTA BANCSHARES, INC.
NOTES TO CONSOLIDATED FINANCIAL STATEMENTS
December 31, 2016, 2015 and 2014
(Amounts in thousands, except share data)
NOTE 10 - SHORT-TERM BORROWINGS
Short-term borrowings, which consist of federal funds purchased and other short-term borrowings are summarized as follows:
| At December 31, 2016 | At December 31, 2015 | |||||||||||||||
| Federal Funds Purchased |
Short-term Borrowings |
Federal Funds Purchased |
Short-term Borrowings |
|||||||||||||
| Outstanding balance at year end |
$ | — | $ | 31,000 | $ | — | $ | 53,700 | ||||||||
| Maximum indebtedness during the year |
20,000 | 70,400 | — | 64,700 | ||||||||||||
| Average balance during the year |
116 | 10,483 | 69 | 26,880 | ||||||||||||
| Average rate paid during the year |
0.86 | % | 0.42 | % | 0.53 | % | 0.20 | % | ||||||||
| Interest rate on year end balance |
— | 0.64 | % | — | 0.35 | % | ||||||||||
| At December 31, 2014 | ||||||||
| Federal Funds Purchased |
Short-term Borrowings |
|||||||
| Outstanding balance at year end |
$ | — | $ | 42,700 | ||||
| Maximum indebtedness during the year |
— | 42,700 | ||||||
| Average balance during the year |
41 | 1,951 | ||||||
| Average rate paid during the year |
0.54 | % | 0.19 | % | ||||
| Interest rate on year end balance |
— | 0.14 | % | |||||
Average balance during the year represent daily averages. Average interest rates represent interest expense divided by the related average balances.
These borrowing transactions can range from overnight to six months in maturity. The average maturity was one day at December 31, 2016, 2015 and 2014.
76
CIVISTA BANCSHARES, INC.
NOTES TO CONSOLIDATED FINANCIAL STATEMENTS
December 31, 2016, 2015 and 2014
(Amounts in thousands, except share data)
NOTE 11 - FEDERAL HOME LOAN BANK ADVANCES
Long term advances from the FHLB were $17,500 at December 31, 2016 and $17,500 at December 31, 2015. Outstanding balances have maturity dates ranging from January 2017 to October 2019 and fixed rates ranging from 1.50% to 4.25%. The average rate on outstanding advances was 2.06%.
Scheduled principal reductions of FHLB advances outstanding at December 31, 2016 were as follows:
| 2017 |
$ | 2,500 | ||
| 2018 |
10,000 | |||
| 2019 |
5,000 | |||
|
|
|
|||
| Total |
$ | 17,500 | ||
|
|
|
In addition to the borrowings, the Company had outstanding letters of credit with the FHLB totaling $19,600 at year-end 2016 and $21,200 at year-end 2015 used for pledging to secure public funds. FHLB borrowings and the letters of credit were collateralized by FHLB stock and by $102,150 and $138,600 of residential mortgage loans under a blanket lien arrangement at year-end 2016 and 2015, respectively.
The Company had a FHLB maximum borrowing capacity of $144,268 as of December 31, 2016, with remaining borrowing capacity of approximately $76,168. The borrowing arrangement with the FHLB is subject to annual renewal. The maximum borrowing capacity is recalculated at least quarterly.
77
CIVISTA BANCSHARES, INC.
NOTES TO CONSOLIDATED FINANCIAL STATEMENTS
December 31, 2016, 2015 and 2014
(Amounts in thousands, except share data)
NOTE 12 - SECURITIES SOLD UNDER AGREEMENTS TO REPURCHASE
Securities sold under agreements to repurchase are used to facilitate the needs of our customers as well as to facilitate our short-term funding needs. Securities sold under repurchase agreements are carried at the amount of cash received in association with the agreement. We continuously monitor the collateral levels and may be required, from time to time, to provide additional collateral based on the fair value of the underlying securities. Securities pledged as collateral under repurchase agreements are maintained with our safekeeping agents.
The following table presents detail regarding the securities pledged as collateral under repurchase agreements as of December 31, 2016 and December 31, 2015. All of the repurchase agreements are overnight agreements.
| December 31, 2016 | December 31, 2015 | |||||||
| Securities pledged for repurchase agreements: |
||||||||
| U.S. Treasury securities |
$ | 1,761 | $ | 894 | ||||
| Obligations of U.S. government agencies |
27,164 | 24,146 | ||||||
|
|
|
|
|
|||||
| Total securities pledged |
$ | 28,925 | $ | 25,040 | ||||
|
|
|
|
|
|||||
| Gross amount of recognized liabilities for repurchase agreements |
$ | 28,925 | $ | 25,040 | ||||
|
|
|
|
|
|||||
| Amounts related to agreements not included in offsetting disclosures above |
$ | — | $ | — | ||||
|
|
|
|
|
|||||
Information concerning securities sold under agreements to repurchase was as follows:
| 2016 | 2015 | 2014 | ||||||||||
| Outstanding balance at year end |
$ | 28,925 | $ | 25,040 | $ | 21,613 | ||||||
| Average balance during the year |
21,767 | 20,086 | 19,759 | |||||||||
| Average interest rate during the year |
0.10 | % | 0.10 | % | 0.10 | % | ||||||
| Maximum month-end balance during the year |
$ | 28,925 | $ | 25,040 | $ | 33,764 | ||||||
| Weighted average interest rate at year end |
0.10 | % | 0.10 | % | 0.10 | % | ||||||
78
CIVISTA BANCSHARES, INC.
NOTES TO CONSOLIDATED FINANCIAL STATEMENTS
December 31, 2016, 2015 and 2014
(Amounts in thousands, except share data)
NOTE 13 - SUBORDINATED DEBENTURES
Trusts formed by the Company issued floating rate trust preferred securities, in the amounts of $5,000 and $7,500, through special purpose entities as part of pooled offerings of such securities. The Company issued subordinated debentures to the trusts in exchange for the proceeds of the offerings, which debentures represent the sole assets of the trusts. The Company may redeem the subordinated debentures, in whole but not in part, at face value. In April 2007, the Company elected to redeem and refinance the $5,000 floating rate subordinated debenture. The refinancing was done at face value and resulted in a 2.00% reduction in the rate. The new subordinated debenture has a 30-year maturity and is redeemable, in whole or in part, anytime without penalty. The replacement subordinated debenture does not have any deferred issuance cost associated with it. The interest rate at December 31, 2016 on the $7,500 debenture was 4.01% and the $5,000 debenture was 2.45%.
Additionally, the Company formed an additional trust that issued $12,500 of 6.05% fixed rate trust preferred securities for five years, then becoming floating rate trust preferred securities, through a special purpose entity as part of a pooled offering of such securities. The Company issued subordinated debentures to the trusts in exchange for the proceeds of the offerings, which debentures represent the sole assets of the trusts. The Company may redeem the subordinated debentures at face value without penalty. The current rate on the $12,500 subordinated debenture is 3.11%.
Finally, the Company acquired two additional trust preferred securities as part of its acquisition of Futura Banc Corp (Futura) in December 2007. Futura TPF Trust I and Futura TPF Trust II were formed in June of 2005 in the amounts of $2,500 and $1,927, respectively. Futura had issued subordinated debentures to the trusts in exchange for ownership of all of the common security of the trusts and the proceeds of the preferred securities sold by the trusts. The Company may redeem the subordinated debentures, in whole or in part, in a principal amount with integral multiples of $1,000, on or after June 15, 2010 at 100% of the principal amount, plus accrued and unpaid interest. The subordinated debentures mature on June 15, 2035. The subordinated debentures are also redeemable in whole or in part from time to time, upon the occurrence of specific events defined within the trust indenture. The current rate on the $2,500 subordinated debenture is variable at 2.51%. In June 2010, the rate on the $1,927 subordinated debenture switched from a fixed rate to a floating rate. The current rate on the $1,927 subordinated debenture is 2.51%.
NOTE 14 - INCOME TAXES
Income taxes were as follows for the years ended December 31:
| 2016 | 2015 | 2014 | ||||||||||
| Current |
$ | 6,449 | $ | 5,191 | $ | 3,151 | ||||||
| Deferred |
170 | (410 | ) | 11 | ||||||||
|
|
|
|
|
|
|
|||||||
| Income taxes |
$ | 6,619 | $ | 4,781 | $ | 3,162 | ||||||
|
|
|
|
|
|
|
|||||||
79
CIVISTA BANCSHARES, INC.
NOTES TO CONSOLIDATED FINANCIAL STATEMENTS
December 31, 2016, 2015 and 2014
(Amounts in thousands, except share data)
NOTE 14 - INCOME TAXES (Continued)
Effective tax rates differ from the statutory federal income tax rate of 35% in 2016 and 34% in 2015 and 2014 due to the following:
| 2016 | 2015 | 2014 | ||||||||||
| Income taxes computed at the statutory federal tax rate |
$ | 8,343 | $ | 5,959 | $ | 4,315 | ||||||
| Add (subtract) tax effect of: |
||||||||||||
| Nontaxable interest income, net of nondeductible interest expense |
(946 | ) | (900 | ) | (824 | ) | ||||||
| Low income housing tax credit |
(435 | ) | (303 | ) | (303 | ) | ||||||
| Cash surrender value of BOLI |
(197 | ) | (159 | ) | (167 | ) | ||||||
| Other |
(146 | ) | 184 | 141 | ||||||||
|
|
|
|
|
|
|
|||||||
| Income tax expense |
$ | 6,619 | $ | 4,781 | $ | 3,162 | ||||||
|
|
|
|
|
|
|
|||||||
There were no tax benefits attributable to security losses in 2016, 2015 and 2014, respectively.
Year-end deferred tax assets and liabilities were due to the following:
| 2016 | 2015 | |||||||
| Deferred tax assets |
||||||||
| Allowance for loan losses |
$ | 4,640 | $ | 5,005 | ||||
| Deferred compensation |
1,762 | 1,617 | ||||||
| Intangible assets |
187 | 224 | ||||||
| Pension costs |
277 | 232 | ||||||
| Other |
102 | 99 | ||||||
|
|
|
|
|
|||||
| Deferred tax asset |
6,968 | 7,177 | ||||||
|
|
|
|
|
|||||
| Deferred tax liabilities |
||||||||
| Tax depreciation in excess of book depreciation |
(97 | ) | (95 | ) | ||||
| Discount accretion on securities |
(58 | ) | (59 | ) | ||||
| Purchase accounting adjustments |
(1,091 | ) | (1,340 | ) | ||||
| FHLB stock dividends |
(1,705 | ) | (1,705 | ) | ||||
| Unrealized gain on securities available for sale |
(1,035 | ) | (1,831 | ) | ||||
| Other |
(256 | ) | (200 | ) | ||||
|
|
|
|
|
|||||
| Deferred tax liability |
(4,242 | ) | (5,230 | ) | ||||
|
|
|
|
|
|||||
| Net deferred tax asset |
$ | 2,726 | $ | 1,947 | ||||
|
|
|
|
|
|||||
No valuation allowance was established at December 31, 2016 and 2015, due to the Company’s ability to carryback to taxes paid in previous years and certain tax strategies, coupled with the anticipated future income as evidenced by the Company’s earning potential.
The Company and its subsidiaries are subject to U.S. federal income tax as well as income tax of the State of Ohio for all affiliates other than Civista. Civista is subject to tax in Ohio based upon its net worth.
80
CIVISTA BANCSHARES, INC.
NOTES TO CONSOLIDATED FINANCIAL STATEMENTS
December 31, 2016, 2015 and 2014
(Amounts in thousands, except share data)
NOTE 14 - INCOME TAXES (Continued)
There is currently no liability for uncertain tax positions and no known unrecognized tax benefits. The Company’s federal tax returns for taxable years through 2012 have been closed for purposes of examination by the Internal Revenue Service.
NOTE 15 - RETIREMENT PLANS
The Company sponsors a savings and retirement 401(k) plan, which covers all employees who meet certain eligibility requirements and who choose to participate in the plan. The matching contribution to the 401(k) plan was $734, $667 and $394 in 2016, 2015 and 2014, respectively. In conjunction with freezing the pension plan, as discussed below, the Company changed the matching contribution calculation from twenty-five percent of the first six percent of an employee’s contribution to 100% of an employee’s first three percent contributed and 50% of the next two percent contributed. This change took place on July 1, 2014.
The Company also sponsors a pension plan which is a noncontributory defined benefit retirement plan for all employees who have attained the age of 20 1⁄2, completed six months of service and work 1,000 or more hours per year. Annual payments, subject to the maximum amount deductible for federal income tax purposes, are made to a pension trust fund. In 2006, the Company amended the pension plan to provide that no employee could be added as a participant to the pension plan after December 31, 2006. In April 2014, the Company amended the pension plan again to provide that no additional benefits would accrue beyond April 30, 2014. This curtailment resulted in a $4,039 reduction to the projected benefit obligation in 2014. Also, the curtailment resulted in an increase in accumulated other comprehensive loss of $2,666 in 2014.
In October 2015, the Company, on behalf of it and its subsidiaries, entered into Pension Shortfall Agreements (the “Shortfall Agreements”) with ten employees of the Bank. When the Company ceased accruals to its defined benefit pension plan on April 30, 2014, the circumstances of some participants with limited periods until their anticipated retirement dates would not permit them to use other available alternatives to make up for the shortfall in their expected pension. The Company calculated the total amount of the shortfall for each of the referenced individuals after considering its contributions to other retirement benefits. Pension shortfall expense was $201 in 2016, $364 in 2015 and $222 in 2014. Included in pension shortfall expense was interest expense, totaling $11, $10 and $0 in 2016, 2015 and 2014, respectively, which was also recorded in and credited to the accounts of the ten individuals covered by this plan.
81
CIVISTA BANCSHARES, INC.
NOTES TO CONSOLIDATED FINANCIAL STATEMENTS
December 31, 2016, 2015 and 2014
(Amounts in thousands, except share data)
NOTE 15 - RETIREMENT PLANS (Continued)
Information about the pension plan is as follows:
| 2016 | 2015 | |||||||
| Change in benefit obligation: |
||||||||
| Beginning benefit obligation |
$ | 16,328 | $ | 16,953 | ||||
| Service cost |
— | — | ||||||
| Interest cost |
689 | 604 | ||||||
| Curtailment gain |
— | — | ||||||
| Settlement loss |
51 | 117 | ||||||
| Actuarial (gain)/loss |
669 | (6 | ) | |||||
| Benefits paid |
(773 | ) | (1,340 | ) | ||||
|
|
|
|
|
|||||
| Ending benefit obligation |
16,964 | 16,328 | ||||||
|
|
|
|
|
|||||
| Change in plan assets, at fair value: |
||||||||
| Beginning plan assets |
15,647 | 16,184 | ||||||
| Actual return |
802 | 129 | ||||||
| Employer contribution |
500 | 700 | ||||||
| Benefits paid |
(773 | ) | (1,340 | ) | ||||
| Administrative expenses |
(26 | ) | (26 | ) | ||||
|
|
|
|
|
|||||
| Ending plan assets |
16,150 | 15,647 | ||||||
|
|
|
|
|
|||||
| Funded status at end of year |
$ | (814 | ) | $ | (681 | ) | ||
|
|
|
|
|
|||||
Amounts recognized in accumulated other comprehensive loss at December 31, consist of unrecognized actuarial loss of $4,345, net of $2,238 tax in 2016 and $4,049, net of $2,086 tax in 2015.
The accumulated benefit obligation for the defined benefit pension plan was $16,964 at December 31, 2016 and $16,328 at December 31, 2015.
The components of net periodic pension expense were as follows:
| 2016 | 2015 | 2014 | ||||||||||
| Service cost |
$ | — | $ | — | $ | 306 | ||||||
| Interest cost |
689 | 604 | 639 | |||||||||
| Expected return on plan assets |
(1,090 | ) | (1,088 | ) | (1,021 | ) | ||||||
| Net amortization and deferral |
326 | 270 | 334 | |||||||||
|
|
|
|
|
|
|
|||||||
| Net periodic pension cost (benefit) |
$ | (75 | ) | $ | (214 | ) | $ | 258 | ||||
|
|
|
|
|
|
|
|||||||
| Net loss (gain) recognized in other comprehensive loss |
$ | 448 | $ | 412 | $ | (1,228 | ) | |||||
| Total recognized in net periodic benefit cost and other comprehensive loss (before tax) |
$ | 373 | $ | 198 | $ | (970 | ) | |||||
82
CIVISTA BANCSHARES, INC.
NOTES TO CONSOLIDATED FINANCIAL STATEMENTS
December 31, 2016, 2015 and 2014
(Amounts in thousands, except share data)
NOTE 15 - RETIREMENT PLANS (Continued)
The estimated net loss for the defined benefit pension plan that will be amortized from accumulated other comprehensive loss into net periodic benefit cost over the next fiscal year is $380.
The weighted average assumptions used to determine benefit obligations at year-end were as follows:
| 2016 | 2015 | 2014 | ||||||||||
| Discount rate on benefit obligation |
4.00 | % | 4.16 | % | 3.69 | % | ||||||
| Long-term rate of return on plan assets |
7.00 | % | 7.00 | % | 7.00 | % | ||||||
| Rate of compensation increase |
0.00 | % | 0.00 | % | 0.00 | % | ||||||
The weighted average assumptions used to determine net periodic pension cost were as follows:
| 2016 | 2015 | 2014 | ||||||||||
| Discount rate on benefit obligation |
4.16 | % | 3.69 | % | 4.38 | % | ||||||
| Long-term rate of return on plan assets |
7.00 | % | 7.00 | % | 7.00 | % | ||||||
| Rate of compensation increase |
0.00 | % | 0.00 | % | 3.00 | % | ||||||
The Company uses long-term market rates to determine the discount rate on the benefit obligation. Declines in the discount rate lead to increases in the actuarial loss related to the benefit obligation.
The expectation for long-term rate of return on the pension assets and the expected rate of compensation increases are reviewed periodically by management in consultation with outside actuaries and primary investment consultants. Factors considered in setting and adjusting these rates are historic and projected rates of return on the portfolio and historic and estimated rates of increases of compensation. Since the pension plan is frozen, the rate of compensation increase used to determine the benefit obligation for 2016, 2015 and 2014 was zero.
The Company’s pension plan asset allocation at year-end 2016 and 2015 and target allocation for 2017 by asset category are as follows:
| Percentage of Plan | ||||||||||||
| Target | Assets | |||||||||||
| Allocation | at Year-end | |||||||||||
| Asset Category |
2017 | 2016 | 2015 | |||||||||
| Equity securities |
20-50 | % | 47.5 | % | 48.2 | % | ||||||
| Debt securities |
30-60 | 52.1 | 47.0 | |||||||||
| Money market funds |
20-30 | 0.4 | 4.8 | |||||||||
|
|
|
|
|
|||||||||
| Total |
100.0 | % | 100.0 | % | ||||||||
|
|
|
|
|
|||||||||
83
CIVISTA BANCSHARES, INC.
NOTES TO CONSOLIDATED FINANCIAL STATEMENTS
December 31, 2016, 2015 and 2014
(Amounts in thousands, except share data)
NOTE 15 - RETIREMENT PLANS (Continued)
The Company developed the pension plan investment policies and strategies for plan assets with its pension management firm. The assets are currently invested in four diversified investment funds, which include two equity funds, one money market fund and one bond fund. The long-term guidelines from above were created to maximize the return on portfolio assets while reducing the risk of the portfolio. The management firm may allocate assets among the separate accounts within the established long-term guidelines. Transfers among these accounts will be at the management firm’s discretion based on their investment outlook and the investment strategies that are outlined at periodic meetings with the Company. The expected long-term rate of return on the plan assets was 7.00% in 2016 and 2015. This return is based on the expected return for each of the asset categories, weighted based on the target allocation for each class.
Although the plan is frozen, the Company expects to make a $500 contribution to its pension plan in 2017. Employer contributions totaled $500 in 2016. A decrease contributions and increases in plan assets and the benefit obligation led to a change in funded status from $(681) at December 31, 2015 to $(814) at December 31, 2016.
The following tables set forth by level, within the fair value hierarchy, the pension plan’s assets at fair value as of December 31, 2016 and 2015:
| December 31, 2016 | ||||||||||||||||
| Level 1 | Level 2 | Level 3 | Total | |||||||||||||
| Assets: |
||||||||||||||||
| Money market funds |
$ | — | $ | 64 | $ | — | $ | 64 | ||||||||
| Bond mutual funds |
23 | — | — | 23 | ||||||||||||
| Common/collective trust: |
||||||||||||||||
| Bonds |
8,390 | — | — | 8,390 | ||||||||||||
| Equities |
5,593 | — | — | 5,593 | ||||||||||||
| Equity market funds: |
||||||||||||||||
| International |
399 | — | — | 399 | ||||||||||||
| Large cap |
1,023 | — | — | 1,023 | ||||||||||||
| Mid cap |
282 | — | — | 282 | ||||||||||||
| Small cap |
376 | — | — | 376 | ||||||||||||
|
|
|
|
|
|
|
|
|
|||||||||
| Total assets at fair value |
$ | 16,086 | $ | 64 | $ | — | $ | 16,150 | ||||||||
|
|
|
|
|
|
|
|
|
|||||||||
84
CIVISTA BANCSHARES, INC.
NOTES TO CONSOLIDATED FINANCIAL STATEMENTS
December 31, 2016, 2015 and 2014
(Amounts in thousands, except share data)
NOTE 15 - RETIREMENT PLANS (Continued)
| December 31, 2015 | ||||||||||||||||
| Level 1 | Level 2 | Level 3 | Total | |||||||||||||
| Assets: |
||||||||||||||||
| Money market funds |
$ | — | $ | 94 | $ | — | $ | 94 | ||||||||
| Bond mutual funds |
23 | — | — | 23 | ||||||||||||
| Common/collective trust: |
||||||||||||||||
| Bonds |
7,338 | — | — | 7,338 | ||||||||||||
| Equities |
6,315 | — | — | 6,315 | ||||||||||||
| Equity market funds: |
||||||||||||||||
| International |
357 | — | — | 357 | ||||||||||||
| Large cap |
1,155 | — | — | 1,155 | ||||||||||||
| Mid cap |
242 | — | — | 242 | ||||||||||||
| Small cap |
123 | — | — | 123 | ||||||||||||
|
|
|
|
|
|
|
|
|
|||||||||
| Total assets at fair value |
$ | 15,553 | $ | 94 | $ | — | $ | 15,647 | ||||||||
|
|
|
|
|
|
|
|
|
|||||||||
Investment in equity securities, debt securities, money market funds and mutual funds are valued at the closing price reported on the active market on which the individual securities are traded.
The methods described above may produce a fair value calculation that may not be indicative of net realizable value or reflective of future fair values. Furthermore, while the Pension Plan believes its valuation methods are appropriate and consistent with other market participants, the use of different methodologies or assumptions to determine the fair value of certain financial instruments could result in a different fair value measurement at the reporting date.
Expected benefit payments, which reflect expected future service, are as follows:
| 2017 |
$ | 2,526 | ||
| 2018 |
442 | |||
| 2019 |
1,240 | |||
| 2020 |
753 | |||
| 2021 |
917 | |||
| 2022 through 2024 |
5,279 | |||
|
|
|
|||
| Total |
$ | 11,157 | ||
|
|
|
Supplemental Retirement Plan
Civista established a supplemental retirement plan (“SERP”) in 2013, which covers key members of management. Under the SERP, participants will receive annually, following retirement, a percentage of their base compensations at the time of their retirement for a maximum of ten years. The SERP liability recorded at December 31, 2016, was $1,984, compared to $1,775 at December 31, 2015. The expense related to the SERP was $243, $299 and $398 for 2016, 2015 and 2014, respectively. Distributions to participants made in 2016 totaled $34. Distributions to participants made in 2015 totaled $22.
85
CIVISTA BANCSHARES, INC.
NOTES TO CONSOLIDATED FINANCIAL STATEMENTS
December 31, 2016, 2015 and 2014
(Amounts in thousands, except share data)
NOTE 16 - EQUITY INCENTIVE PLAN
At the Company’s 2014 annual meeting, the shareholders adopted the Company’s 2014 Incentive Plan (“2014 Incentive Plan”). The 2014 Incentive Plan authorizes the Company to grant options, stock awards, stock units and other awards for up to 375,000 common shares of the Company. There were 317,280 shares available for grants under this plan at December 31, 2016.
During each of the last two years, the Board of Directors has awarded restricted common shares to senior officers of the Company. The restricted shares vest ratably over a three-year period following the grant date. The product of the number of restricted shares granted and the grant date market price of the Company’s common shares determines the fair value of restricted shares under the Company’s 2014 Incentive Plan. Management recognizes compensation expense for the fair value of restricted shares on a straight-line basis over the requisite service period for the entire award.
On March 17, 2015, certain officers were awarded an aggregate of 16,983 restricted common shares, of which 5,657 shares vested on January 2, 2016.
On January 4, 2016, directors of the Company’s banking subsidiary, Civista, were paid a retainer in the form of non-restricted common shares of the Company. The aggregate of 2,730 common shares were issued to Civista directors as payment of their retainer for their service on the Civista Board of Directors covering the period up to the 2016 Annual Meeting. This issuance was expensed in its entirety when the shares were issued in the amount of $32.
On January 15, 2016, certain of the Company’s lending officers were awarded an aggregate of 12,734 restricted common shares under the 2014 Incentive Plan. These restricted shares vest over a 5-year service period, with 20% each vesting on January 2 of 2017, 2018, 2019, 2020 and 2021.
On March 11, 2016, senior officers were awarded an aggregate of 16,130 restricted common shares, which vest over a three-year service period, with one third each vesting on January 2 of 2017, 2018 and 2019.
Finally, on May 17, 2016, directors of the Company’s banking subsidiary, Civista, were paid a retainer in the form of non-restricted common shares of the Company. The aggregate of 12,285 common shares were issued to Civista directors as payment of their retainer for their service on the Civista Board of Directors covering the period up to the 2017 Annual Meeting. This issuance was expensed in its entirety when the shares were issued in the amount of $130.
No options had been granted under the 2014 Incentive Plan as of December 31, 2016 and 2015.
The Company classifies share-based compensation for employees with “Salaries, wages and benefits” in the consolidated statements of operations. Additionally, generally accepted accounting principles require the Company to report: (1) the expense associated with the grants as an adjustment to operating cash flows, and (2) any benefits of realized tax deductions in excess of previously recognized tax benefits on compensation expense as a financing cash flow.
86
CIVISTA BANCSHARES, INC.
NOTES TO CONSOLIDATED FINANCIAL STATEMENTS
December 31, 2016, 2015 and 2014
(Amounts in thousands, except share data)
NOTE 16 - EQUITY INCENTIVE PLAN (Continued)
The following is a summary of the status of the Company’s restricted shares, and changes therein during the twelve months ended December 31, 2016 and 2015:
| December 31, 2016 | December 31, 2015 | |||||||||||||||
| Number of Restricted Shares |
Weighted Average Grant Date Fair Value |
Number of Restricted Shares |
Weighted Average Grant Date Fair Value |
|||||||||||||
| Nonvested at beginning of period |
16,983 | $ | 10.82 | — | $ | — | ||||||||||
| Granted |
28,864 | 10.75 | 16,983 | 10.82 | ||||||||||||
| Vested |
(5,657 | ) | 10.82 | — | — | |||||||||||
| Forfeited |
(3,140 | ) | 10.87 | — | — | |||||||||||
|
|
|
|
|
|||||||||||||
| Nonvested at December 31, 2016 |
37,050 | 10.77 | 16,983 | 10.82 | ||||||||||||
|
|
|
|
|
|||||||||||||
During the twelve-month period ended December 31, 2016, the Company recorded $323 of share-based compensation expense for shares granted under the 2014 Incentive Plan. At December 31, 2016, the expected future compensation expense relating to the 16,983 restricted shares awarded in 2015 is $37 over the remaining vesting period of 1.00 years. The expected future compensation expense relating to the 16,130 restricted shares awarded in 2016 to the officers and Civista directors is $67 over the remaining vesting period of 2.00 years. The expected future compensation expense relating to the 12,734 restricted common shares awarded to lending officers of the Company in 2016 is $89 over the remaining vesting period of 4.00 years. On May 13, 2016, an agreement was signed thereby ending the employment of a grantee of restricted shares. As a result, a total of 666 restricted shares granted, but unvested, were forfeited. On September 19, 2016, a lending officer and restricted share grantee left the company. As a result, a total of 916 restricted shares granted, but unvested, were forfeited. Finally, on November 3, 2016, a lending officer and restricted share grantee left the company. As a result, a total of 1,558 restricted shares granted, but unvested, were forfeited.
NOTE 17 - FAIR VALUE MEASUREMENT
U.S. generally accepted accounting principles establish a hierarchal disclosure framework associated with the level of observable pricing utilized in measuring assets and liabilities at fair value. The three broad levels defined by the hierarchy are as follows: Level 1: Quoted prices for identical assets in active markets that are identifiable on the measurement date; Level 2: Significant other observable inputs, such as quoted prices for similar assets, quoted prices in markets that are not active and other inputs that are observable or can be corroborated by observable market data; Level 3: Significant unobservable inputs that reflect the Company’s own view about the assumptions that market participants would use in pricing an asset.
87
CIVISTA BANCSHARES, INC.
NOTES TO CONSOLIDATED FINANCIAL STATEMENTS
December 31, 2016, 2015 and 2014
(Amounts in thousands, except share data)
NOTE 17 - FAIR VALUE MEASUREMENT (Continued)
Securities: The fair values of securities available for sale are determined by matrix pricing, which is a mathematical technique widely used in the industry to value debt securities without relying exclusively on quoted prices for the specific securities, but rather by relying on the securities’ relationship to other benchmark quoted securities (Level 2 inputs).
Equity securities: The Company’s equity securities are not actively traded in an open market. The fair values of these equity securities available for sale are determined by using market data inputs for similar securities that are observable. (Level 2 inputs).
Fair value swap asset/liability: The fair value of the swap asset and liability is based on an external derivative model using data inputs as of the valuation date and classified Level 3.
Impaired loans: The Company has measured impairment on impaired loans generally based on the fair value of the loan’s collateral. Fair value is generally determined based upon independent third-party appraisals of the properties. In some cases, management may adjust the appraised value due to the age of the appraisal, changes in market conditions, or observable deterioration of the property since the appraisal was completed. Additionally, management makes estimates about expected costs to sell the property which are also included in the net realizable value. If the fair value of the collateral dependent loan is less than the carrying amount of the loan, a specific reserve for the loan is made in the allowance for loan losses or a charge-off is taken to reduce the loan to the fair value of the collateral (less estimated selling costs) and the loan is included in the table above as a Level 3 measurement.
Other real estate owned: OREO is carried at the lower of cost or fair value, which is measured at the date foreclosure. If the fair value of the collateral exceeds the carrying amount of the loan, no charge-off or adjustment is necessary, the loan is not considered to be carried at fair value, and is therefore not included in the table below. If the fair value of the collateral is less than the carrying amount of the loan, management will charge the loan down to its estimated realizable value. Management may adjust the appraised value due to the age of the appraisal, changes in market conditions, or observable deterioration of the property since the appraisal was completed. In these cases, the properties are categorized in the below table as Level 3 measurements since these adjustments are considered to be unobservable inputs. Income and expenses from operations are included in other operating expenses. Further declines in the fair value of the collateral subsequent to foreclosure are included in net gain on sale of other real estate owned.
88
CIVISTA BANCSHARES, INC.
NOTES TO CONSOLIDATED FINANCIAL STATEMENTS
December 31, 2016, 2015 and 2014
(Amounts in thousands, except share data)
NOTE 17 - FAIR VALUE MEASUREMENT (Continued)
Assets measured at fair value are summarized below.
Fair Value Measurements at December 31, 2016 Using:
| (Level 1) | (Level 2) | (Level 3) | ||||||||||
| Assets measured at fair value on a recurring basis: |
||||||||||||
| U.S. Treasury securities and obligations of U.S. Government agencies |
$ | — | $ | 37,446 | $ | — | ||||||
| Obligations of states and political subdivisions |
— | 94,998 | — | |||||||||
| Mortgage-backed securities in government sponsored entities |
— | 62,642 | — | |||||||||
| Equity securities in financial institutions |
— | 778 | — | |||||||||
| Fair value swap asset |
— | — | 1,839 | |||||||||
| Liabilities measured at fair value on a recurring basis: |
||||||||||||
| Fair value swap liability |
— | — | 1,839 | |||||||||
| Assets measured at fair value on a nonrecurring basis: |
||||||||||||
| Impaired Loans |
$ | — | $ | — | $ | 952 | ||||||
| Other Real Estate Owned |
— | — | 37 | |||||||||
89
CIVISTA BANCSHARES, INC.
NOTES TO CONSOLIDATED FINANCIAL STATEMENTS
December 31, 2016, 2015 and 2014
(Amounts in thousands, except share data)
NOTE 17 - FAIR VALUE MEASUREMENT (Continued)
Fair Value Measurements at December 31, 2015 Using:
| (Level 1) | (Level 2) | (Level 3) | ||||||||||
| Assets measured at fair value on a recurring basis: |
||||||||||||
| U.S. Treasury securities and obligations of U.S. Government agencies |
$ | — | $ | 40,937 | $ | — | ||||||
| Obligations of states and political subdivisions |
— | 92,152 | — | |||||||||
| Mortgage-backed securities in government sponsored entities |
— | 62,573 | — | |||||||||
| Equity securities in financial institutions |
— | 587 | — | |||||||||
| Fair value swap asset |
— | — | 1,962 | |||||||||
| Liabilities measured at fair value on a recurring basis: |
||||||||||||
| Fair value swap liability |
— | — | 1,962 | |||||||||
| Assets measured at fair value on a nonrecurring basis: |
||||||||||||
| Impaired Loans |
$ | — | $ | — | $ | 759 | ||||||
| Other Real Estate Owned |
— | — | 109 | |||||||||
The following tables presents quantitative information about the Level 3 significant unobservable inputs for assets and liabilities measured at fair value on a nonrecurring basis at December 31, 2016 and 2015.
| Quantitative Information about Level 3 Fair Value Measurements | ||||||||||||||
| December 31, 2016 | Fair Value | Valuation Technique | Unobservable Input | Range | Weighted Average | |||||||||
| Impaired loans |
$952 | Appraisal of collateral | Appraisal adjustments | 10% - 67% | 64% | |||||||||
| Liquidation expense | 0% - 10% | 4% | ||||||||||||
| Holding period | 0 - 30 months | 19 months | ||||||||||||
| Other real estate owned |
$37 | Appraisal of collateral | Appraisal adjustments | 10% - 30% | 10% | |||||||||
| Liquidation expense | 0% - 10% | 10% | ||||||||||||
90
CIVISTA BANCSHARES, INC.
NOTES TO CONSOLIDATED FINANCIAL STATEMENTS
December 31, 2016, 2015 and 2014
(Amounts in thousands, except share data)
NOTE 17 - FAIR VALUE MEASUREMENT (Continued)
| Quantitative Information about Level 3 Fair Value Measurements | ||||||||||||
| December 31, 2015 | Fair Value | Valuation Technique | Unobservable Input | Range | Weighted Average | |||||||
| Impaired loans |
$ | 759 | Appraisal of collateral | Appraisal adjustments | 10% - 30% | 10% | ||||||
| Liquidation expense | 0% - 10% | 10% | ||||||||||
| Holding period | 0 - 30 months | 17 months | ||||||||||
| Other real estate owned |
$109 | Appraisal of collateral | Appraisal adjustments | 10% - 30% | 10% | |||||||
| Liquidation expense | 0% - 10% | 10% | ||||||||||
The carrying amount and fair value of financial instruments were as follows:
| December 31, 2016 | Carrying Amount |
Total Fair Value |
Level 1 | Level 2 | Level 3 | |||||||||||||||
| Financial Assets: |
||||||||||||||||||||
| Cash and due from financial institutions |
$ | 36,695 | $ | 36,695 | $ | 36,695 | $ | — | $ | — | ||||||||||
| Securities available for sale |
195,864 | 195,864 | — | 195,864 | — | |||||||||||||||
| Loans, held for sale |
2,268 | 2,268 | 2,268 | — | — | |||||||||||||||
| Loans, net of allowance for loan losses |
1,042,201 | 1,047,329 | — | — | 1,047,329 | |||||||||||||||
| Other securities |
14,055 | 14,055 | 14,055 | — | — | |||||||||||||||
| Bank owned life insurance |
24,552 | 24,552 | 24,552 | — | — | |||||||||||||||
| Accrued interest receivable |
3,854 | 3,854 | 3,854 | — | — | |||||||||||||||
| Swap asset |
1,839 | 1,839 | — | 1,839 | — | |||||||||||||||
| Financial Liabilities: |
||||||||||||||||||||
| Nonmaturing deposits |
913,677 | 913,677 | 913,677 | — | — | |||||||||||||||
| Time deposits |
207,426 | 207,784 | — | — | 207,784 | |||||||||||||||
| Short-term FHLB advances |
31,000 | 31,007 | 31,007 | — | — | |||||||||||||||
| Long-term FHLB advances |
17,500 | 17,553 | — | — | 17,553 | |||||||||||||||
| Securities sold under agreement to repurchase |
28,925 | 28,925 | 28,925 | — | — | |||||||||||||||
| Subordinated debentures |
29,427 | 27,414 | — | — | 27,414 | |||||||||||||||
| Accrued interest payable |
181 | 181 | 181 | — | — | |||||||||||||||
| Swap liability |
1,839 | 1,839 | — | 1,839 | — | |||||||||||||||
91
CIVISTA BANCSHARES, INC.
NOTES TO CONSOLIDATED FINANCIAL STATEMENTS
December 31, 2016, 2015 and 2014
(Amounts in thousands, except share data)
NOTE 17 - FAIR VALUE MEASUREMENT (Continued)
| December 31, 2015 | Carrying Amount |
Total Fair Value |
Level 1 | Level 2 | Level 3 | |||||||||||||||
| Financial Assets: |
||||||||||||||||||||
| Cash and due from financial institutions |
$ | 35,561 | $ | 35,561 | $ | 35,561 | $ | — | $ | — | ||||||||||
| Securities available for sale |
196,249 | 196,249 | — | 196,249 | — | |||||||||||||||
| Loans, held for sale |
2,698 | 2,698 | 2,698 | — | — | |||||||||||||||
| Loans, net of allowance for loan losses |
987,166 | 986,848 | — | — | 986,848 | |||||||||||||||
| Other securities |
13,452 | 13,452 | 13,452 | — | — | |||||||||||||||
| Bank owned life insurance |
20,104 | 20,104 | 20,104 | — | — | |||||||||||||||
| Accrued interest receivable |
3,902 | 3,902 | 3,902 | — | — | |||||||||||||||
| Swap asset |
1,962 | 1,962 | — | 1,962 | — | |||||||||||||||
| Financial Liabilities: |
||||||||||||||||||||
| Nonmaturing deposits |
840,984 | 840,984 | 840,984 | — | — | |||||||||||||||
| Time deposits |
211,049 | 212,006 | — | — | 212,006 | |||||||||||||||
| Short-term FHLB advances |
53,700 | 52,906 | 52,906 | — | — | |||||||||||||||
| Long-term FHLB advances |
17,500 | 17,687 | — | — | 17,687 | |||||||||||||||
| Securities sold under agreement to repurchase |
25,040 | 25,040 | 25,040 | — | — | |||||||||||||||
| Subordinated debentures |
29,427 | 25,572 | — | — | 25,572 | |||||||||||||||
| Accrued interest payable |
120 | 120 | 120 | — | — | |||||||||||||||
| Swap liability |
1,962 | 1,962 | — | 1,962 | — | |||||||||||||||
The estimated fair value approximates carrying amount for all items except those described below. Estimated fair value for securities is based on quoted market values for the individual securities or for equivalent securities. For fixed rate loans or deposits and for variable rate loans or deposits with infrequent repricing or repricing limits, fair value is based on discounted cash flows using current market rates applied to the cash flow analysis or underlying collateral values. Fair value of debt is based on current rates for similar financing. The fair value of off-balance-sheet items is based on the current fees or cost that would be charged to enter into or terminate such arrangements and are considered nominal.
For certain homogeneous categories of loans, such as some residential mortgages, credit card receivables, and other consumer loans, fair value is estimated using the quoted market prices for securities backed by similar loans, adjusted for differences in loan characteristics. The fair value of other types of loans is estimated by discounting the future cash flows using the current rates at which similar loans would be made to borrowers with similar credit ratings and for the same remaining maturities.
92
CIVISTA BANCSHARES, INC.
NOTES TO CONSOLIDATED FINANCIAL STATEMENTS
December 31, 2016, 2015 and 2014
(Amounts in thousands, except share data)
NOTE 18 - COMMITMENTS, CONTINGENCIES AND OFF-BALANCE-SHEET RISK
Some financial instruments, such as loan commitments, credit lines, letters of credit, and overdraft protection are issued to meet customer financing needs. These are agreements to provide credit or to support the credit of others, as long as conditions established in the contract are met, and usually have expiration dates. Commitments may expire without being used. Off-balance-sheet risk to credit loss exists up to the face amount of these instruments, although material losses are not anticipated. The same credit policies are used to make such commitments as are used for loans, including obtaining collateral at exercise of the commitment.
The contractual amount of financial instruments with off-balance-sheet risk was as follows at year-end.
| 2016 | 2015 | |||||||||||||||
| Fixed Rate |
Variable Rate |
Fixed Rate |
Variable Rate |
|||||||||||||
| Commitments to extend credit: |
||||||||||||||||
| Lines of credit and construction loans |
$ | 6,905 | $ | 202,923 | $ | 9,416 | $ | 195,732 | ||||||||
| Overdraft protection |
5 | 29,075 | 5 | 22,119 | ||||||||||||
| Letters of credit |
600 | 349 | 200 | 750 | ||||||||||||
|
|
|
|
|
|
|
|
|
|||||||||
| $ | 7,510 | $ | 232,347 | $ | 9,621 | $ | 218,601 | |||||||||
|
|
|
|
|
|
|
|
|
|||||||||
Commitments to make loans are generally made for a period of one year or less. Fixed-rate loan commitments included above had interest rates ranging from 3.25% to 8.50% at December 31, 2016 and 3.25% to 8.75% at December 31, 2015. Maturities extend up to 30 years.
Civista is required to maintain certain reserve balances on hand in accordance with the Federal Reserve Board requirements. The average reserve balance maintained in accordance with such requirements was $2,887 on December 31, 2016 and $2,448 on December 31, 2015.
93
CIVISTA BANCSHARES, INC.
NOTES TO CONSOLIDATED FINANCIAL STATEMENTS
December 31, 2016, 2015 and 2014
(Amounts in thousands, except share data)
NOTE 19 - CAPITAL REQUIREMENTS AND RESTRICTION ON RETAINED EARNINGS
The Company and Civista (“Companies”) are subject to various regulatory capital requirements administered by the federal banking agencies. Failure to meet minimum capital requirements can initiate certain mandatory-and possibly additional discretionary-actions by regulators that, if undertaken, could have a direct material effect on the Companies’ financial statements. Under capital adequacy guidelines and the regulatory framework for prompt corrective action, the Companies must meet specific capital guidelines that involve quantitative measures of the Companies’ assets, liabilities, and certain off-balance-sheet items as calculated under U.S. GAAP, regulatory reporting requirements, and regulatory capital standards. The Companies’ capital amounts and classification are also subject to qualitative judgments by the regulators about components, risk weightings, and other factor.
Quantitative measures established by regulatory capital standards to ensure capital adequacy require the Companies to maintain minimum amounts and ratios (set forth in the following table) of total and Tier 1 capital to risk-weighted assets, common equity Tier 1 capital to total risk-weighted assets, and of Tier 1 capital to average assets. Management believes, as of December 31, 2016, that the Companies met all capital adequacy requirements to which they were subject.
As of December 31, 2016, and December 31, 2015, the most recent notification from the Federal Reserve Bank categorized the Bank as well capitalized under the regulatory framework for prompt corrective action. To be categorized as well capitalized the Companies must maintain minimum total risk-based capital, Tier 1 risk-based capital, common equity Tier 1 risk-based capital, and Tier 1 leverage ratios as set forth in the table. There are no conditions or events since that notification that management believes have changed the institution’s category.
94
CIVISTA BANCSHARES, INC.
NOTES TO CONSOLIDATED FINANCIAL STATEMENTS
December 31, 2016, 2015 and 2014
(Amounts in thousands, except share data)
NOTE 19 - CAPITAL REQUIREMENTS AND RESTRICTION ON RETAINED EARNINGS (Continued)
The Company’s and Civista’s actual capital levels and minimum required capital levels at December 31, 2016 and 2015 were as follows:
| To Be Well | ||||||||||||||||||||||||
| Capitalized Under | ||||||||||||||||||||||||
| For Capital | Prompt Corrective | |||||||||||||||||||||||
| Actual | Adequacy Purposes | Action Purposes | ||||||||||||||||||||||
| Amount | Ratio | Amount | Ratio | Amount | Ratio | |||||||||||||||||||
| 2016 |
||||||||||||||||||||||||
| Total Risk Based Capital |
||||||||||||||||||||||||
| Consolidated |
$ | 155,145 | 14.2 | % | $ | 87,436 | 8.0 | % | n/a | n/a | ||||||||||||||
| Civista |
145,270 | 13.3 | 87,334 | 8.0 | $ | 109,168 | 10.0 | % | ||||||||||||||||
| Tier I Risk Based Capital |
||||||||||||||||||||||||
| Consolidated |
141,840 | 13.0 | 65,577 | 6.0 | n/a | n/a | ||||||||||||||||||
| Civista |
131,391 | 12.0 | 65,501 | 6.0 | 87,334 | 8.0 | ||||||||||||||||||
| CET1 Risk Based Capital |
||||||||||||||||||||||||
| Consolidated |
93,463 | 8.6 | 49,183 | 4.5 | n/a | n/a | ||||||||||||||||||
| Civista |
120,465 | 11.0 | 49,126 | 4.5 | 70,959 | 6.5 | ||||||||||||||||||
| Leverage |
||||||||||||||||||||||||
| Consolidated |
141,840 | 10.6 | 53,774 | 4.0 | n/a | n/a | ||||||||||||||||||
| Civista |
131,391 | 9.8 | 53,717 | 4.0 | 67,146 | 5.0 | ||||||||||||||||||
| 2015 |
||||||||||||||||||||||||
| Total Risk Based Capital |
||||||||||||||||||||||||
| Consolidated |
$ | 140,088 | 14.0 | % | $ | 80,050 | 8.0 | % | n/a | n/a | ||||||||||||||
| Civista |
126,795 | 12.7 | 79,871 | 8.0 | $ | 99,839 | 10.0 | % | ||||||||||||||||
| Tier I Risk Based Capital |
||||||||||||||||||||||||
| Consolidated |
127,519 | 12.7 | 60,245 | 6.0 | n/a | n/a | ||||||||||||||||||
| Civista |
113,883 | 11.4 | 59,938 | 6.0 | 79,918 | 8.0 | ||||||||||||||||||
| CET1 Risk Based Capital |
||||||||||||||||||||||||
| Consolidated |
75,819 | 7.6 | 44,893 | 4.5 | n/a | n/a | ||||||||||||||||||
| Civista |
102,755 | 10.1 | 45,782 | 4.5 | 66,129 | 6.5 | ||||||||||||||||||
| Leverage |
||||||||||||||||||||||||
| Consolidated |
127,519 | 10.0 | 51,008 | 4.0 | n/a | n/a | ||||||||||||||||||
| Civista |
113,883 | 8.9 | 51,183 | 4.0 | 63,979 | 5.0 | ||||||||||||||||||
95
CIVISTA BANCSHARES, INC.
NOTES TO CONSOLIDATED FINANCIAL STATEMENTS
December 31, 2016, 2015 and 2014
(Amounts in thousands, except share data)
NOTE 19 - CAPITAL REQUIREMENTS AND RESTRICTION ON RETAINED EARNINGS (Continued)
The Company’s primary source of funds for paying dividends to its shareholders and for operating expense is the cash accumulated from dividends received from Civista. Payment of dividends by Civista to the Company is subject to restrictions by Civista’s regulatory agencies. These restrictions generally limit dividends to the current and prior two years retained earnings as defined by the regulations. In addition, dividends may not reduce capital levels below minimum regulatory requirements. At December 31, 2016, Civista had $23,289 net profits available to pay dividends to CBI.
NOTE 20 - PARENT COMPANY ONLY CONDENSED FINANCIAL INFORMATION
Condensed financial information of CBI follows:
| December 31, | ||||||||
| Condensed Balance Sheets | 2016 | 2015 | ||||||
| Assets: |
||||||||
| Cash |
$ | 4,747 | $ | 7,493 | ||||
| Securities available for sale |
778 | 587 | ||||||
| Investment in bank subsidiary |
149,965 | 133,959 | ||||||
| Investment in nonbank subsidiaries |
12,635 | 12,615 | ||||||
| Other assets |
1,226 | 2,204 | ||||||
|
|
|
|
|
|||||
| Total assets |
$ | 169,351 | $ | 156,858 | ||||
|
|
|
|
|
|||||
| Liabilities: |
||||||||
| Deferred income taxes and other liabilities |
$ | 2,308 | $ | 2,258 | ||||
| Subordinated debentures |
29,427 | 29,427 | ||||||
|
|
|
|
|
|||||
| Total liabilities |
31,735 | 31,685 | ||||||
|
|
|
|
|
|||||
| Shareholders’ Equity: |
||||||||
| Preferred stock |
18,950 | 22,273 | ||||||
| Common stock |
118,975 | 115,330 | ||||||
| Accumulated earnings |
19,263 | 5,300 | ||||||
| Treasury Stock |
(17,235 | ) | (17,235 | ) | ||||
| Accumulated other comprehensive loss |
(2,337 | ) | (495 | ) | ||||
|
|
|
|
|
|||||
| Total shareholders’ equity |
137,616 | 125,173 | ||||||
|
|
|
|
|
|||||
| Total liabilities and shareholders’ equity |
$ | 169,351 | $ | 156,858 | ||||
|
|
|
|
|
|||||
96
CIVISTA BANCSHARES, INC.
NOTES TO CONSOLIDATED FINANCIAL STATEMENTS
December 31, 2016, 2015 and 2014
(Amounts in thousands, except share data)
NOTE 20 - PARENT COMPANY ONLY CONDENSED FINANCIAL INFORMATION (Continued)
| For the years ended December 31, | ||||||||||||
| Condensed Statements of Operations | 2016 | 2015 | 2014 | |||||||||
| Dividends from bank subsidiaries |
$ | — | $ | 14,226 | $ | 7,339 | ||||||
| Interest expense |
(884 | ) | (760 | ) | (777 | ) | ||||||
| Pension expense |
(184 | ) | (388 | ) | (397 | ) | ||||||
| Other expense, net |
(920 | ) | (1,755 | ) | (1,150 | ) | ||||||
|
|
|
|
|
|
|
|||||||
| Income (loss) before equity in undistributed net earnings of subsidiaries |
(1,988 | ) | 11,323 | 5,015 | ||||||||
| Income tax benefit |
676 | 959 | 763 | |||||||||
| Equity in undistributed net earnings of subsidiaries |
18,529 | 463 | 3,750 | |||||||||
|
|
|
|
|
|
|
|||||||
| Net income |
$ | 17,217 | $ | 12,745 | $ | 9,528 | ||||||
|
|
|
|
|
|
|
|||||||
| Comprehensive income |
$ | 15,375 | $ | 12,297 | $ | 13,728 | ||||||
|
|
|
|
|
|
|
|||||||
| For the years ended December 31, | ||||||||||||
| Condensed Statements of Cash Flows | 2016 | 2015 | 2014 | |||||||||
| Operating activities: |
||||||||||||
| Net income |
$ | 17,217 | $ | 12,745 | $ | 9,528 | ||||||
| Adjustment to reconcile net income to net cash from operating activities: |
||||||||||||
| Change in other assets and other liabilities |
1,821 | 1,324 | 1,508 | |||||||||
| Equity in undistributed net earnings of subsidiaries |
(18,529 | ) | (463 | ) | (3,750 | ) | ||||||
|
|
|
|
|
|
|
|||||||
| Net cash from operating activities |
509 | 13,606 | 7,286 | |||||||||
| Investing activities: |
||||||||||||
| Acquisition and additional capitalization of subsidiary, net of cash acquired |
— | (16,637 | ) | — | ||||||||
|
|
|
|
|
|
|
|||||||
| Net cash used for investing activities |
— | (16,637 | ) | — | ||||||||
| Financing activities: |
||||||||||||
| Cash paid on fractional shares on preferred stock conversion to common stock |
(1 | ) | — | — | ||||||||
| Payment to repurchase preferred stock |
— | — | (22,857 | ) | ||||||||
| Cash dividends paid |
(3,254 | ) | (3,139 | ) | (3,338 | ) | ||||||
|
|
|
|
|
|
|
|||||||
| Net cash used for financing activities |
(3,255 | ) | (3,139 | ) | (26,195 | ) | ||||||
|
|
|
|
|
|
|
|||||||
| Net change in cash and cash equivalents |
(2,746 | ) | (6,170 | ) | (18,909 | ) | ||||||
| Cash and cash equivalents at beginning of year |
7,493 | 13,663 | 32,572 | |||||||||
|
|
|
|
|
|
|
|||||||
| Cash and cash equivalents at end of year |
$ | 4,747 | $ | 7,493 | $ | 13,663 | ||||||
|
|
|
|
|
|
|
|||||||
97
CIVISTA BANCSHARES, INC.
NOTES TO CONSOLIDATED FINANCIAL STATEMENTS
December 31, 2016, 2015 and 2014
(Amounts in thousands, except share data)
NOTE 21 - PREFERRED SHARES
On December 19, 2013, the Company completed the sale of 1,000,000 depositary shares, each representing a 1/40th ownership interest in a 6.50% Noncumulative Redeemable Convertible Perpetual Preferred Share, Series B, of the Company, with a liquidation preference of $1,000 per share (equivalent to $25.00 per depositary share). The Company sold the maximum of 1,000,000 depositary shares in the offering, resulting in gross proceeds to the Company of $25,000.
Using proceeds from the sale of the depositary shares, the Company redeemed all of its outstanding Series A Preferred Shares for an aggregate purchase price of $22,857, which redemption was completed as of February 15, 2014.
As of December 31, 2016, a total of 819,235 depository shares were outstanding.
NOTE 22 - EARNINGS PER COMMON SHARE
The factors used in the earnings per share computation follow.
| 2016 | 2015 | 2014 | ||||||||||
| Basic |
||||||||||||
| Net income |
$ | 17,217 | $ | 12,745 | $ | 9,528 | ||||||
| Preferred stock dividends |
1,501 | 1,577 | 1,873 | |||||||||
|
|
|
|
|
|
|
|||||||
| Net income available to common shareholders—basic |
$ | 15,716 | $ | 11,168 | $ | 7,655 | ||||||
|
|
|
|
|
|
|
|||||||
| Weighted average common shares outstanding—basic |
8,010,399 | 7,822,369 | 7,707,917 | |||||||||
|
|
|
|
|
|
|
|||||||
| Basic earnings per share |
$ | 1.96 | $ | 1.43 | $ | 0.99 | ||||||
|
|
|
|
|
|
|
|||||||
| Diluted |
||||||||||||
| Net income available to common shareholders—basic |
$ | 15,716 | $ | 11,168 | $ | 7,655 | ||||||
| Preferred stock dividends on convertible preferred stock |
1,501 | 1,577 | 1,606 | |||||||||
|
|
|
|
|
|
|
|||||||
| Net income available to common shareholders—diluted |
$ | 17,217 | $ | 12,745 | $ | 9,261 | ||||||
|
|
|
|
|
|
|
|||||||
| Weighted average common shares outstanding for earnings per common share basic |
8,010,399 | 7,822,369 | 7,707,917 | |||||||||
| Add: dilutive effects of convertible preferred shares |
2,940,562 | 3,095,966 | 3,196,931 | |||||||||
|
|
|
|
|
|
|
|||||||
| Average shares and dilutive potential common shares outstanding—diluted |
10,950,961 | 10,918,335 | 10,904,848 | |||||||||
|
|
|
|
|
|
|
|||||||
| Diluted earnings per share |
$ | 1.57 | $ | 1.17 | $ | 0.85 | ||||||
|
|
|
|
|
|
|
|||||||
Basic earnings per common share are calculated by dividing net income by the weighted-average number of common shares outstanding for the period. Diluted earnings per common share include the dilutive effect, if any, of additional potential common shares issuable under the equity incentive plan, computed using the treasury stock method, and the impact of the Company’s convertible preferred shares using the “if converted” method.
98
CIVISTA BANCSHARES, INC.
NOTES TO CONSOLIDATED FINANCIAL STATEMENTS
December 31, 2016, 2015 and 2014
(Amounts in thousands, except share data)
NOTE 23 - QUARTERLY FINANCIAL DATA (UNAUDITED)
| Interest Income |
Net Interest Income |
Net Income |
Basic Earnings per Common Share |
Diluted Earnings per Common Share |
||||||||||||||||
| 2016 |
||||||||||||||||||||
| First quarter (1)(2) |
$ | 13,053 | $ | 12,235 | $ | 4,725 | $ | 0.55 | $ | 0.43 | ||||||||||
| Second quarter (3)(4) |
13,739 | 12,940 | 5,181 | 0.61 | 0.47 | |||||||||||||||
| Third quarter (5) |
13,370 | 12,526 | 3,680 | 0.41 | 0.34 | |||||||||||||||
| Fourth quarter (6) |
13,405 | 12,558 | 3,631 | 0.39 | 0.33 | |||||||||||||||
| 2015 |
||||||||||||||||||||
| First quarter (7)(8)(2) |
$ | 11,762 | $ | 10,915 | $ | 3,171 | $ | 0.36 | $ | 0.29 | ||||||||||
| Second quarter (7)(8) |
12,740 | 11,916 | 3,122 | 0.35 | 0.29 | |||||||||||||||
| Third quarter (8)(9) |
13,223 | 12,402 | 3,253 | 0.36 | 0.30 | |||||||||||||||
| Fourth quarter (8)(10) |
12,976 | 12,159 | 3,199 | 0.36 | 0.29 | |||||||||||||||
| (1) | Interest income and net interest income increased due to loan volume and rate and volume on interest-bearing deposits in other banks. |
| (2) | Net income increased due to fees on tax refund processing program. |
| (3) | Interest income and net interest income increased due to interest recoveries on non-performing loans. |
| (4) | Net income increased due to interest recoveries and provision credit. |
| (5) | Interest income, net interest income and net income decreased due to previous quarter interest recoveries and provision credit. |
| (6) | Interest income and net interest income increased due to loan volume and interest recoveries. |
| (7) | Interest income and net interest income increased due to loan volume. |
| (8) | Net interest income increased due to interest expense decreasing as deposits repriced downward and the deposit mix shifted toward cheaper funding sources. |
| (9) | Net income increased due to increased loan volume, offset by a decrease in fees on the tax refund processing program. |
| (10) | Interest income, net interest income and net income decreased due to decreased loan volume. |
99
CIVISTA BANCSHARES, INC.
NOTES TO CONSOLIDATED FINANCIAL STATEMENTS
December 31, 2016, 2015 and 2014
(Amounts in thousands, except share data)
NOTE 24 - DERIVATIVE HEDGING INSTRUMENTS
To accommodate customer need and to support the Company’s asset/liability positioning, on occasion we enter into interest rate swaps with a customer and a bank counterparty. The Company enters into a floating rate loan and a fixed rate swap with our customer. Simultaneously, the Company enters into an offsetting fixed rate swap with a bank counterparty. In connection with each swap transaction, the Company agrees to pay interest to the customer on a notional amount at a variable interest rate and receive interest from the customer on the same notional amount at a fixed interest rate. At the same time, the Company agrees to pay a bank counterparty the same fixed interest rate on the same notional amount and receive the same variable interest rate on the same notional amount. These transactions allow the Company’s customer to effectively convert variable rate loans to fixed rate loans. Since the Company acts as an intermediary for its customer, changes in the fair value of the underlying derivative contracts offset each other and do not significantly impact the Company’s results of operations.
The following table summarizes the Company’s interest rate swap positions and the impact of a 1 basis point change in interest rates as of December 31, 2016.
| Notional Amount |
Weighted Average Rate Received/ (Paid) |
Impact of a 1 basis point change in interest rates |
Repricing Frequency |
|||||||||||||
| Derivative Assets |
$ | 52,975 | 5.07 | % | $ | 30 | Monthly | |||||||||
| Derivative Liabilities |
(52,975 | ) | -5.07 | % | (30 | ) | Monthly | |||||||||
|
|
|
|
|
|||||||||||||
| Net Exposure |
$ | — | $ | — | ||||||||||||
|
|
|
|
|
|||||||||||||
The following table summarizes the Company’s interest rate swap positions and the impact of a 1 basis point change in interest rates as of December 31, 2015.
| Notional Amount |
Weighted Average Rate Received/ (Paid) |
Impact of a 1 basis point change in interest rates |
Repricing Frequency |
|||||||||||||
| Derivative Assets |
$ | 35,534 | 5.31 | % | $ | 20 | Monthly | |||||||||
| Derivative Liabilities |
(35,534 | ) | -5.31 | % | (20 | ) | Monthly | |||||||||
|
|
|
|
|
|||||||||||||
| Net Exposure |
$ | — | $ | — | ||||||||||||
|
|
|
|
|
|||||||||||||
The Company monitors and controls all derivative products with a comprehensive Board of Director approved commercial loan swap policy. All hedge transactions must be approved in advance by the Lenders Loan Committee or the Directors Loan Committee of the Board of Directors.
100
CIVISTA BANCSHARES, INC.
NOTES TO CONSOLIDATED FINANCIAL STATEMENTS
December 31, 2016, 2015 and 2014
(Amounts in thousands, except share data)
The Company invests in qualified affordable housing projects. At December 31, 2016 and 2015, the balance of the investment for qualified affordable housing projects was $2,754 and $2,177. These balances are reflected in the other assets line on the consolidated balance sheet. The unfunded commitments related to the investments in qualified affordable housing projects totaled $2,313 and $2,195 at December 31, 2016 and 2015, respectively.
During the year ended December 31, 2016 and 2015, the Company recognized amortization expense with respect to its investments in qualified affordable housing projects of $304 and $240, respectively, which was included within pre-tax income on the consolidated statements of operations.
Additionally, during the years ended December 31, 2016 and 2015, the Company recognized tax credits and other benefits from its investment in affordable housing tax credits of $538 and $422, respectively. During the years ended December 31, 2016 and 2015, the Company did not incur impairment losses related to its investment in qualified affordable housing projects.
NOTE 25 - SUBSEQUENT EVENTS
On February 24, 2017, Civista Bancshares, Inc. announced that it has completed a public offering of 1,610,000 of its common shares at a price of $21.75 per share. The offering resulted in gross proceeds of approximately $35.0 million and net proceeds of approximately $32.8 million.
Civista intends to use the net proceeds from the offering for general corporate purposes, including potential future acquisitions and to support organic growth.
101
CIVISTA BANCSHARES, INC.
NOTES TO CONSOLIDATED FINANCIAL STATEMENTS
December 31, 2016, 2015 and 2014
(Amounts in thousands, except share data)
This page left blank intentionally.
102