Attached files
| file | filename |
|---|---|
| EX-32.1 - EX-32.1 - Tabula Rasa HealthCare, Inc. | trhc-20161231ex32103cdc3.htm |
| EX-31.2 - EX-31.2 - Tabula Rasa HealthCare, Inc. | trhc-20161231ex3129673e6.htm |
| EX-31.1 - EX-31.1 - Tabula Rasa HealthCare, Inc. | trhc-20161231ex311c999d6.htm |
| EX-23.1 - EX-23.1 - Tabula Rasa HealthCare, Inc. | trhc-20161231ex231b19403.htm |
| EX-21.1 - EX-21.1 - Tabula Rasa HealthCare, Inc. | trhc-20161231ex211457414.htm |
UNITED STATES
SECURITIES AND EXCHANGE COMMISSION
Washington, D.C. 20549
Form 10-K
☒ ANNUAL REPORT PURSUANT TO SECTION 13 OR 15(d) OF THE SECURITIES EXCHANGE ACT OF 1934
For the year ended December 31, 2016
OR
☐ TRANSITION REPORT PURSUANT TO SECTION 13 OR 15(d) OF THE SECURITIES EXCHANGE ACT OF 1934
For the transition period from to
Commission file number 001-37888
Tabula Rasa HealthCare, Inc.
(Exact name of registrant as specified in its charter)
|
Delaware |
45-5726437 |
|
(State of incorporation) |
(I.R.S. Employer Identification No.) |
|
|
|
|
228 Strawbridge Drive, Suite 100 |
|
|
Moorestown, NJ 08057 |
(866) 648 - 2767 |
|
(Address of Principal Executive Offices, including Zip Code) |
(Registrant’s Telephone Number, including Area Code) |
|
|
|
|
Securities registered pursuant to Section 12(b) of the Act: |
|
|
Title of Each Class |
Name of Each Exchange on Which Registered |
|
Common Stock, par value $0.0001 per share |
The NASDAQ Stock Market |
Securities registered pursuant to Section 12(g) of the Act: None
Indicate by check mark if the registrant is a well-known seasoned issuer, as defined in Rule 405 of the Securities Act. Yes ☐ No ☒
Indicate by check mark if the registrant is not required to file reports pursuant to Section 13 or Section 15(d) of the Exchange Act. Yes ☐ No ☒
Indicate by check mark whether the registrant: (1) has filed all reports required to be filed by Section 13 or 15(d) of the Securities Exchange Act of 1934 during the preceding 12 months (or for such shorter period that the registrant was required to file such reports), and (2) has been subject to such filing requirements for the past 90 days. Yes ☒ No ☐
Indicate by check mark whether the registrant has submitted electronically and posted on its corporate Web site, if any, every Interactive Data File required to be submitted and posted pursuant to Rule 405 of Regulation S-T during the preceding 12 months (or for such shorter period that the registrant was required to submit and post such files). Yes ☒ No ☐
Indicate by check mark if disclosure of delinquent filers pursuant to Item 405 of Regulation S ‑K (§299.405 of this chapter) is not contained herein, and will not be contained, to the best of registrant’s knowledge, in definitive proxy or information statements incorporated by reference in Part III of this Form 10‑K or any amendment to this Form 10 ‑K. ☐
Indicate by check mark whether the registrant is a large accelerated filer, an accelerated filer, a non-accelerated filer, or a smaller reporting company. See the definitions of "large accelerated filer," "accelerated filer" and "smaller reporting company" in Rule 12b-2 of the Exchange Act.
|
Large accelerated filer ☐ |
Accelerated filer ☐ |
Non-accelerated filer ☒ |
Smaller reporting company ☐ |
|
(Do not check if a |
|||
|
smaller reporting company) |
Indicate by check mark whether the registrant is a shell company (as defined in Rule 12b2 of the Exchange Act). Yes ☐ No ☒
As of June 30, 2016, the last business day of the registrant’s most recently completed second fiscal quarter, there was no established public market for the registrant’s common stock and, therefore, the registrant cannot calculate the aggregate market value of its common stock held by non-affiliates as of such date. The registrant’s common stock began trading on September 29, 2016.
As of February 28, 2017, the Registrant had 17,073,067, shares of Common Stock outstanding.
DOCUMENTS INCORPORATED BY REFERENCE
Portions of the Registrant’s definitive proxy statement to be filed subsequently and delivered to stockholders in connection with the 2017 annual meeting of stockholders are incorporated herein by reference in response to Part III of this Annual Report on Form 10-K to the extent stated herein. Such proxy statement will be filed with the Securities and Exchange Commission within 120 days of the Registrant's fiscal year ended December 31, 2016
2
Special Note Regarding Forward Looking Statements
This Annual Report on Form 10-K contains “forward-looking statements” that involve risks and uncertainties, as well as assumptions that, if they never materialize or prove incorrect, could cause our results to differ materially from those expressed or implied by such forward-looking statements. The statements contained in this Annual Report on Form 10-K that are not purely historical are forward-looking statements within the meaning of Section 27A of the Securities Act of 1933, as amended (“Securities Act”), and Section 21E of the Securities Exchange Act of 1934, as amended (“Exchange Act”). Forward-looking statements are often identified by the use of words such as, but not limited to, “anticipate,” “believe,” “can,” “continue,” “could,” “estimate,” “expect,” “intend,” “may,” “might,” “will,” “plan,” “project,” “seek,” “should,” “target,” “would,” and similar expressions or variations intended to identify forward-looking statements. The forward-looking statements in this Annual Report on Form 10-K include, among other things, statements about
|
· |
our expectations regarding industry and market trends, including the expected growth and continued structural change and consolidation in the market for healthcare in the United States; |
|
· |
our expectations about the growth of PACE organizations; |
|
· |
our expectations about private payors establishing their own at-risk programs; |
|
· |
the advantages of our solutions as compared to those of competitors; |
|
· |
our estimates about our financial performance and that some of our expenses will decline as a percentage of total revenue; |
|
· |
the visibility into future cash flows from our business model; |
|
· |
our growth strategy, including our ability to grow our client base; |
|
· |
our plans to further penetrate existing markets and enter new markets; |
|
· |
expectations of earnings, revenue or other financial items; |
|
· |
plans, strategies and objectives of management for future operations; |
|
· |
our ability to establish and maintain intellectual property rights; |
|
· |
our ability to retain and hire necessary associates and appropriately staff our operations; |
|
· |
future capital expenditures; |
|
· |
future economic conditions or performance; |
|
· |
our plans to pursue strategic acquisitions and partnerships and international expansion; |
|
· |
our plans to expand and enhance our solutions; and |
|
· |
our estimates regarding capital requirements and needs for additional financing. |
These statements are based on the beliefs and assumptions of our management based on information currently available to management. Such forward-looking statements are subject to risks, uncertainties and other important factors that could cause actual results and the timing of certain events to differ materially from future results expressed or implied by such forward-looking statements. Factors that could cause or contribute to such differences include, but are not limited to:
|
· |
our ability to adapt to changes or trends within the market for healthcare in the United States; |
|
· |
a significant increase in competition from a variety of companies in the health care industry; |
|
· |
developments and changes in laws and regulations, including increased regulation of the healthcare industry through legislative action and revised rules and standards; |
|
· |
the extent to which we are successful in gaining new long-term relationships with clients or retaining existing clients; |
|
· |
the growth and success of our clients, which is difficult to predict and is subject to factors outside of our control; |
|
· |
our ability to maintain relationships with a specified drug wholesaler; |
|
· |
increasing consolidation in the healthcare industry; |
|
· |
managing our growth effectively; |
|
· |
failure or disruption of our information technology and security systems; |
|
· |
dependence on our senior management and key employees; |
|
· |
our future indebtedness and our ability to obtain additional financing; |
|
· |
our ability to achieve profitability in the future; |
3
|
· |
the requirements of being a public company; and |
|
· |
those discussed in the section titled “Risk Factors” included in Item 1A of Part I of this Annual Report on Form 10-K, and the risks discussed in our other SEC filings. |
Furthermore, such forward-looking statements speak only as of the date of this report. Except as required by law, we undertake no obligation to update any forward-looking statements to reflect events or circumstances after the date of such statements.
Unless the context requires otherwise, the terms the “Company,” “Tabula Rasa HealthCare Inc.,” “we,” “us” and “our” mean Tabula Rasa HealthCare, Inc., a Delaware Corporation, and its consolidated subsidiaries.
4
Overview
We are a healthcare technology company disrupting the field of medication safety. For over thirty years, traditional pharmacy software systems have offered clinicians a binary view of drug-to-drug interactions, presenting an assessment of one single drug against one single drug. These legacy systems may be adequate to assess the safety of a medication regimen consisting of only one or two medications. However, the elderly, the chronically ill and those with behavioral health challenges, who are more often times more likely to be subject to a medication profile of more than two medications, are typically at high risk of an adverse drug effect, or ADE. In these cases, the average patient often takes over 10 different medications a day and the current technologies are inadequate to optimize safety and minimize risk. Our novel and proprietary Medication Risk Mitigation Matrix, or MRM Matrix, delivers a simultaneous, multi-drug review which identifies medication-related risks across a variety of safety factors and presents meaningful opportunities to mitigate such risks. We partner with health plans and provider groups in comprehensive medication management and care transitions programs to identify and substantially mitigate the risks associated with ADEs. By working with us, health plans and provider groups have reduced their pharmacy spend and admissions rates.
We are a leader in providing patient-specific, data-driven technology and solutions that enable healthcare organizations to optimize medication regimens to improve patient outcomes, reduce hospitalizations, lower healthcare costs and manage risk. We deliver our solutions through a comprehensive suite of technology-enabled products and services for medication risk management, which includes bundled prescription fulfillment and reminder packaging services for client populations with complex prescription needs. We also provide risk adjustment services and pharmacy cost management services, which help our clients to properly characterize a patient's acuity, or severity of health condition, and optimize the associated payments for care. With 4.7 billion prescriptions filled in the United States in 2016, medication treatment is the most common medical intervention, and its imprecise use represents the fourth leading cause of death and contributes to an estimated 45 to 50 million ADEs annually with 2.5 to 4.0 million of those ADEs considered serious, disabling or fatal. The incidence of ADEs is highly correlated to the number of medications an individual is taking and non-adherence to prescribed regimens, and thus is particularly relevant to populations with complex healthcare needs. Our technology-driven approach to medication risk management represents an evolution from prevailing non-personalized approaches that primarily rely on single drug-to-drug interaction analysis. We currently serve approximately 133 healthcare organizations that focus on populations with complex healthcare needs and extensive medication requirements.
Our suite of cloud-based software solutions provides prescribers, pharmacists and healthcare organizations with sophisticated and innovative tools to better manage the medication-related needs of their patients. We believe we offer the first prospective clinical approach to medication risk management, which is designed to increase patient safety and promote adherence to a patient's personalized medication regimen. Furthermore, our medication risk management technology helps healthcare organizations lower costs by reducing ADEs, enhancing quality of care and avoiding preventable hospital admissions. Our products and services are built around our novel and proprietary MRM Matrix which enables optimization of a patient's medication regimen, involving personalizing medication selection, dosage levels, time-of-day administration and reducing the total medication burden by eliminating unnecessary prescriptions. The MRM Matrix analyzes a combination of clinical and pharmacology data, population-based algorithms and extensive patient-specific data, including medical history, lab results, medication lists and individual genomic data, to deliver "precision medicine." We provide software-enabled solutions that can be bundled with prescription fulfillment and reminder packaging services, which are informed by a patient's personalized MRM Matrix to increase adherence to a patient's optimized regimen, through our three prescription fulfillment pharmacies. Our prescription fulfillment pharmacies are strategically located to efficiently distribute medications nationwide for our clients and medications are packaged to promote adherence to their patients' personalized regimens and dosing schedules. Our team of clinical pharmacists is available to support prescribers at the point of care through our proprietary technology platform, including real-time secure messaging, with more than 136,000 messages exchanged during December 2016.
Total spending in the United States on prescription medicines was $462 billion in 2016, according to a report issued by the QuintilesIMS Institute. According to the Centers for Disease Control and Prevention, in any given month, 48% of Americans take a prescription medication, and 11% take five or more prescription medications. According to the U.S. Food and Drug Administration, ADEs result in more than 100,000 deaths annually in the United States, and a study by the U.S. Department of Health and Human Services, or HHS, notes that ADEs cause approximately 125,000 hospitalizations, one million emergency room visits, two million affected hospital stays and 3.5 million physician office
5
visits every year. According to a book published by the National Academy of Sciences in 2000, for every dollar spent on ambulatory medications, another dollar is spent to treat new health problems caused by the medication. These statistics indicate that medication treatment is complex, and current tools available to healthcare organizations have been largely unsuccessful in mitigating ADEs.
To enhance healthcare outcomes and better control costs, employers, health insurers and government agencies are restructuring health coverage and care models to make healthcare providers more accountable for healthcare utilization and quality of care. As the U.S. healthcare market continues to evolve from a fee-for-service to a value-based model of care, healthcare organizations require new and emerging technologies to optimize treatment and manage risk on a patient-specific, customized basis. Our solutions are targeted currently to "at-risk" healthcare organizations that are clinically and financially responsible for the populations they serve, receiving a fixed payment for the care provided to each patient for an entire episode of care or enrollment period. According to the Centers for Medicare & Medicaid Services, or CMS, and the Congressional Budget Office, or CBO, there were approximately 138 million people in the United States covered under government-sponsored programs in 2016, and this number is expected to reach 154 million by 2020. Government-sponsored programs are leading the shift to value-based healthcare. Our solutions support our clients in achieving the Institute for Healthcare Improvement, or IHI, "Triple Aim" of improving a patient's experience, while managing the health of a client's population and controlling costs.
We are led by highly experienced and entrepreneurial executive officers with more than 70 years of cumulative experience in the healthcare industry. Our co-founder, Dr. Calvin H. Knowlton, founded excelleRx, Inc., and along with Dr. Orsula Knowlton and other members of our management team, built it into the largest national hospice medication management pharmacy in the United States servicing approximately 400 hospice agencies with approximately 48,000 patients in 46 states, at the time it was sold to Omnicare, Inc. in 2005.
Since our first year of active operations in 2011, our revenue has grown to $94.1 million for the year ended December 31, 2016, with a net loss of $6.3 million and Adjusted EBITDA of $13.6 million. See "Management's Discussion and Analysis of Financial Condition and Results of Operations — Non-GAAP Financial Measures — Adjusted EBITDA" for our definition of Adjusted EBITDA, why we present Adjusted EBITDA and a reconciliation of net losses to Adjusted EBITDA. We had an annual revenue retention rate of 98% and client retention rate of 93% in 2016. See "Management's Discussion and Analysis of Financial Condition and Results of Operations — Key Business Metrics" for our definitions of revenue retention rate and client retention rate.
Corporate Information
We were incorporated in Delaware in May 2014. We completed our initial public offering in October 2016 and our common stock is listed on The NASDAQ Global Market under the symbol “TRHC.” Our principal executive offices are located at 228 Strawbridge Drive, Suite 100, Moorestown, NJ 08057, and our telephone number is (866) 648-2767.
Information about Segment and Geographic Revenue
We manage our operations and allocate resources as a single reportable segment. All of our revenue is recognized in the United States and all of our assets are located in the United States.
Recent Developments
Initial Public Offering
On October 4, 2016, we completed an initial public offering (the “IPO”) of our common stock pursuant to which we issued 4,300,000 shares of our common stock, plus the exercise of the underwriters’ option to purchase an additional 645,000 shares of common stock, at an issuance price of $12.00 per share. We received net proceeds of $55.2 million after deducting underwriting discounts and commissions of $4.2 million, but before deducting other offering expenses. Immediately prior to the completion of the IPO, all of the Company’s then outstanding Class A Non-Voting common stock and Class B Voting common stock, totaling 5,583,405 shares, were redesignated into shares of common stock, par value $.0001 per share, and all of the Company’s then outstanding convertible preferred stock converted into an aggregate of 5,089,436 million shares of common stock, par value $.0001 per share. Our common stock is listed on the NASDAQ Global Market under the symbol “TRHC.”
6
Acquisitions
In September 2016, we acquired certain assets, consisting primarily of intellectual property and software assets of 9176-1916 Quebec Inc. (an entity indirectly controlled by our Chief Scientific Officer, Jacques Turgeon). The intellectual property and software assets were previously licensed by us and are integrated into the MRM Matrix. The acquisition consideration consisted of cash consideration of up to $6.0 million, consisting of $1.0 million which was paid upon closing, $2.2 million paid on November 2, 2016, $2.2 million paid on December 9, 2016, and $600 thousand following the 12-month anniversary of the closing date of the acquisition, which is contingent upon no claims for indemnification being made pursuant to the purchase agreement. In addition to the cash consideration, the purchase price included $5.0 million worth of common stock, consisting of $2.5 million, or 201,353 shares, of common stock issued on November 15, 2016 and $2.5 million, or 194,054 shares, of common stock issued on December 29, 2016. The stock consideration issued on November 15, 2016 and on December 29, 2016 was calculated based on the arithmetic average of the daily volume-weighted average price of the Company’s common stock for the 30 business days ending on, and including, the 30th and 60th business day, respectively, following the completion of the IPO.
We account for acquisitions using the purchase method of accounting. We allocated the purchase price to the assets acquired, including intangible assets and liabilities assumed, based on estimated fair values at the date of the acquisition. The results of operations from the acquisition are included in our consolidated financial statements from the acquisition date.
Financing
On April 29, 2015 we entered into a revolving line of credit, which was amended on July 1, 2016, or the 2015 Line of Credit, with a lender pursuant to the terms of a loan and security agreement, which provides for borrowings in an aggregate amount up to $25.0 million to be used for general corporate purposes, including repayment of a prior line of credit. We borrowed $10.0 million under the 2015 Line of Credit at that time. As of December 31, 2016, we had no amounts outstanding under the 2015 Line of Credit. See "Management's Discussion and Analysis of Financial Condition and Results of Operations — Liquidity and Capital Resources — Revolving Credit Facility" below for additional information with respect to the 2015 Line of Credit.
On July 1, 2016, we entered into a term loan facility with ABC Funding, LLC, an affiliate of Summit Partners, L.P., or the ABC Credit Facility. The proceeds of the initial term loan advance of $30.0 million under the ABC Credit Facility were used to repay all outstanding amounts under the promissory notes related to the acquisition of Medliance LLC, or the Medliance Notes, and loans entered into with Eastward Capital Partners V, L.P. and its affiliates in April 2014 and December 2014. At the closing of the IPO in October 2016, we used a portion of the net proceeds from the offering to repay in full all outstanding amounts due under the ABC Credit Facility and the ABC Credit Facility was subsequently terminated. See "Management's Discussion and Analysis of Financial Condition and Results of Operations — Liquidity and Capital Resources — Term Loan Facility" below for additional information with respect to the ABC Credit Facility.
Enhanced Medication Therapy Management Program Development Opportunity
We have been selected to participate with a large, regional Medicare Part D Prescription Drug Plan, or Regional PDP, to develop and deliver an Enhanced Medication Therapy Management, or EMTM, program. We believe this EMTM program will address the requirements of the Part D Enhanced Medication Therapy Management Model test, which the Centers for Medicare and Medicaid Innovation, or CMMI, proposed in September 2015 and recently approved.
The Part D EMTM model created by the Centers for Medicare & Medicaid Services, or CMS, is designed to test strategies to improve medication use among Medicare beneficiaries enrolled in Part D and to assess whether providing selected Regional PDPs with additional incentives and increased flexibility to design and implement innovative programs will better achieve the overall goals for EMTM programs.
We launched the EMTM program on January 1, 2017. To execute this EMTM program, we are using our MRM Matrix and certain other services to perform medication risk stratification and reviews and safety assessments of complex medication regimens, providing an innovative, alternative approach to pharmacotherapy to the 240,000 members of this Regional PDP, representing less than one percent of the entire eligible Part D market. In 2016, the
7
number of individuals covered through Medicare Part D programs was nearly 41 million. We believe if we are successful in developing and delivering an EMTM program to the Regional PDP, we will be able to expand into a greater portion of the Part D market. There can be no assurances that our EMTM program will be successful or we will actually be able to expand this program as currently contemplated.
Our Solutions
Medication risk management is our leading offering, and our cloud-based software applications, including EireneRx and MedWise Advisor, together with our bundled prescription fulfillment and reminder packaging services, provide solutions for a range of payors, providers and other healthcare organizations. Our products and services are built around our proprietary MRM Matrix, which combines clinical and pharmacology data, population-based algorithms and extensive patient-specific data, including medical history, lab results, medication lists and personal genomic information, to deliver what the U.S. Food and Drug Administration, or FDA, refers to as "precision medicine." Precision medicine combines traditional evidence-based medication selection with new patient-specific medication selection to better optimize a patient's medication therapy. Our suite of technology products is built on a powerful rules engine that houses comprehensive pharmacotherapy profiles, provides risk alerts and includes a combination of proprietary decision-support tools, real-time secure messaging, e-prescribing and advanced precision-dosing functionality, among other functions. Our software applications help reduce ADEs, enhance medication adherence and quality of care, improve medication safety at the individual patient level and reduce the total medication burden by eliminating unnecessary prescriptions.
We also provide risk adjustment services and pharmacy cost management services to help our clients achieve correct reimbursement, maintain regulatory compliance and optimize pharmacy spend.
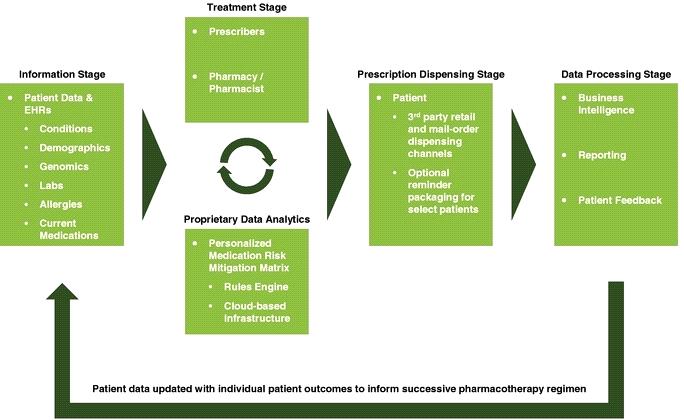
The following chart sets forth the environment within which our solutions, enabled by our personalized MRM Matrix, apply precision medicine practices to collect, analyze and process patient information to accurately inform each patient's medication regimen.
8
Our Strategy
Further Penetrate and Grow with the Expansion of Our Current At-Risk Markets
By leveraging our industry expertise and thought leadership and expanding our sales and marketing efforts, we believe that we can increasingly penetrate the market for existing and new at-risk clients. We are the market leader in providing medication risk management to Programs of All-Inclusive Care for the Elderly, or PACE, a CMS sponsored program through which participating healthcare organizations provide fully integrated healthcare delivery on an at-risk basis for elderly adults, most of whom are dually eligible for Medicare and Medicaid. Our PACE clients cover approximately 20% of the total PACE enrollees nationwide. We believe that we have a significant opportunity to continue to grow within this market. From 2012 to 2016, the number of PACE organizations has increased from 84 to 116 and the number of PACE centers has increased from 126 to 228. The number of participants enrolled in PACE organizations, who have a typical length of stay exceeding four years, has doubled over the last five years, yet, according to a study we commissioned from AEC Consulting, LLC, represents only 4% of the total eligible individuals within current PACE service areas.
We expect our PACE clients to continue to grow to cover more eligible lives. This growth may be facilitated by existing state and federal initiatives that present expansion opportunities for PACE, including recently allowing the formation of PACE organizations by for-profit providers, and the creation of other PACE-like, at-risk organizations, many of which would be targets for our solutions. For example, the PACE Innovation Act of 2015 allows CMS to develop pilot programs using the PACE model of care to serve individuals under age 55 and at risk of needing nursing home care as well as other patients with chronic diseases. On April 4, 2016, CMS announced payment changes that will impact PACE organizations in 2017, and we believe that such changes will produce increased payments of approximately 2%. Further, in August 2016, CMS proposed a rule to update and modernize the PACE program, which would include strengthening protections and improving care for beneficiaries, as well as providing administrative flexibility and regulatory relief for PACE organizations, resulting in program expansion. Working with our scalable solutions can help PACE organizations facilitate their growth.
Furthermore, in Medicare Advantage and similar value-based care models, patients are assigned relative risk scores based on diagnosis, which need to be documented accurately each year for proper reimbursement. We are also the market leader in risk adjustment and front-end coding for PACE organizations, and we plan to continue to expand these services to other Medicare Advantage programs as well as at-risk provider groups.
We have been selected to participate with a large, regional Medicare Part D Prescription Drug Plan, or Regional PDP, to develop and deliver an Enhanced Medication Therapy Management, or EMTM, program. We believe this EMTM program will address the requirements of the Part D Enhanced Medication Therapy Management Model test, which the Centers for Medicare and Medicaid Innovation, or CMMI, proposed in December 2015 and recently approved.
The Part D EMTM model created by the Centers for Medicare & Medicaid Services, or CMS, is designed to test strategies to improve medication use among Medicare beneficiaries enrolled in Part D and to assess whether providing selected Regional PDPs with additional incentives and increased flexibility to design and implement innovative programs will better achieve the overall goals for EMTM programs.
We launched the EMTM program on January 1, 2017. To execute this EMTM program, we are using our MRM Matrix and certain other services to perform medication risk stratification and reviews and safety assessments of complex medication regimens, providing an innovative, alternative approach to pharmacotherapy to the 240,000 members of this Regional PDP, representing less than one percent of the entire eligible Part D market. In 2016, the number of individuals covered through Medicare Part D programs was nearly 41 million. We believe if we are successful in developing and delivering an EMTM program to the Regional PDP, we will be able to expand into a greater portion of the Part D market. There can be no assurances that our EMTM program will be successful or we will actually be able to expand this program as currently contemplated.
9
Continue Expansion into Emerging At-Risk Provider and Payor Markets
We intend to leverage our expertise and experience from our existing clients to expand to other at-risk providers and payors through increased investment in our sales force and marketing efforts.
We believe that the growth in government healthcare programs and the shift to value-based care models are creating opportunities for many organizations to capture growing portions of the expanding healthcare market. Accordingly, we are actively targeting at-risk, value-based markets, including managed care organizations, physician provider groups, self-insured companies and Accountable Care Organizations, or ACOs, which are healthcare organizations characterized by a payment and care delivery model that ties provider reimbursement to quality metrics and the total cost of care for an assigned population. We also target post-acute healthcare organizations, which provide a range of medical services to support an individual's recovery or manage chronic illness after a period of in-patient care. We believe non-PACE ACOs offer another large market for our solutions, as they operate under a similar at-risk reimbursement model. The number of ACOs in the United States has increased from 64 in 2011 to 857 in the third quarter of 2016, collectively covering approximately 28.6 million individuals. Many physician provider groups are moving to at-risk, capitated payment models in response to incentives from managed care organizations and government programs.
Many post-acute healthcare services are also transitioning to value-based care models. On April 1, 2015, the CMS Innovation Center's Bundled Payments for Care Improvement, or BPCI, initiative began, which comprises four broadly defined models of care designed to improve the coordination and quality of care at a lower cost to Medicare. In the BPCI initiative, post-acute care facilities and home health agencies receive bundled payments for episodes of care. According to a recent report by the Advisory Board Company, more than 4,000 post-acute facilities and a number of home health agencies have already signed up to participate in the BPCI program. As the market leader in pharmacy cost management solutions in the post-acute market, we believe we are also well positioned to further serve these organizations with medication risk management solutions as they continue migrating to an at-risk reimbursement structure.
Expand Offerings to a Large and Growing Behavioral Health Market
We believe our solutions have the potential to offer substantial value to the behavioral health market. Behavioral health medications are powerful, are subject to trial-and-error prescribing methods and are prone to side effects and ADEs. The behavioral health market is growing in part as a result of the Patient Protection and Affordable Care Act, or ACA, which significantly expanded coverage for mental health and substance use disorder services. These protections build on the Mental Health Parity and Addiction Equity Act of 2008 provisions to expand mental health and substance use disorder benefits and federal parity protections to an estimated 62 million Americans.
Accordingly, we are pursuing intervention studies or pilot programs to evaluate the benefits of our medication risk management solutions in the behavioral health population. In addition, we were recently asked to participate in Medicaid 2.0: Blueprint for the Future in the state of New Jersey, which lays out a plan to redesign and modernize New Jersey’s Medicaid program. Since behavioral health patients represent a large number of the population that Medicaid serves, our participation in this program would enable us to expand our solutions to the behavioral health markets. We continue to explore additional expansion opportunities with behavioral health providers as this market evolves.
Continue to Innovate and Expand Platform Offerings to Meet Evolving Market Needs
We believe our investments in human capital, technology and services capabilities position us to continue to pursue rapid innovation and expand our medication risk management solutions and other platform offerings to the broader healthcare marketplace. For example, we are developing high-throughput medication risk stratification technology for identification of high-risk patients in need of clinical intervention, and we are developing a patient engagement application of our MRM Matrix solution. In addition, to further our commitment to innovation in the healthcare technology sector, we have established the Jack Russell Software Innovation Center which works collaboratively with our corporate university, TRHC University, to provide technology leadership, creative problem solving skills and training to our employees as well as the healthcare community more broadly. We also believe there is a substantial opportunity in our existing client base to cross-sell our full set of solutions.
10
Selectively Pursue Strategic Acquisitions and Partnerships
Since our founding in 2009, we have successfully completed and integrated five acquisitions, which have significantly expanded our market footprint and broadened our medication risk management and risk adjustment offerings. We plan to continue to acquire assets and businesses and may enter into strategic partnerships that strengthen or expand our service offerings, capabilities and geographic reach and facilitate our entry into new markets. Our acquisition strategy is driven by our commitment to serving client needs, and we are continuously assessing the market for potential opportunities.
Develop International Market Opportunities
We believe we are well positioned to provide our products and services to international healthcare organizations that face challenges similar to those that our clients face domestically. Our solutions are readily scalable and can be utilized by healthcare organizations abroad seeking to achieve the IHI Triple Aim. We believe our solutions would provide significant value to the international healthcare landscape, which is frequently characterized by single-payor government-administered healthcare.
Our Core Technology
ADEs often result from unintended drug overdoses due to factors such as multi-drug interactions, impaired renal function, medication-related genomic variants and the cumulative impact of drug-related sensitivities, such as excess sedation and increased risk of falls and injury. Combining medications with anticholinergic drugs, which are drugs that block the action of the neurotransmitter acetylcholine to the nervous system, increases the likelihood of these and other similar ADEs. The risk of ADEs resulting from combining certain drugs with those that have anticholinergic properties is high given the fact that many common over-the-counter and prescription medications contain anticholinergic ingredients. Our goal is to enable prescribers to optimize the use of medications using a prospective approach to medication risk management in order to avoid ADEs and improve patient outcomes. Our technology suite enables a novel approach to optimize the medication regimen of individual patients and address the issues with prevailing prescribing methodologies.
Utilizing our technology, prescribers obtain real-time information about the factors impacting a medication's effectiveness and safety for a particular patient grounded in evidence-based clinical data and extensive patient-specific data. Our technologies deliver prospective intervention and are designed to reduce ADEs, increase medication adherence and quality of care and improve medication safety at the individual patient level. Our cloud-based applications are scalable, easily accessible to healthcare organizations, seamlessly integrated with client applications and databases and customized for use across the healthcare continuum of care. Our software systems provide secure communication between prescribers and our pharmacists, and our sophisticated medication decision-support tools are interoperable with many industry-leading electronic health record systems, or EHRs. We believe our innovative technology platform offers a means of improving patient outcomes while mitigating medication-related and financial risk for healthcare organizations.
Our suite of cloud-based software solutions incorporates comprehensive pharmacotherapy profiles, a combination of proprietary decision-support tools, risk alerts, e-prescribing, advanced precision-dosing functionality, real-time secure messaging and health literacy aids, among other functions. At the core of our technology platform is our proprietary MRM Matrix. Through a sophisticated rules engine, the MRM Matrix combines patient-specific data with the science of pharmacokinetics, the effects of what the body does to drugs, and pharmacodynamics, the effects of what the drug does to the body, to enable our clients to personalize the medication regimen of each patient. The MRM Matrix also draws upon pharmacoevidence, which considers published guidelines that denote potentially inappropriate medications for older adults such as the Beers Criteria and potentially unsafe medications in various age groups such as the FDA's Black Box warnings, as well as pharmacoeconomics, which compares the cost, expressed in monetary terms, and effects, expressed in terms of monetary value, efficacy or enhanced quality of life, of one pharmaceutical drug or drug therapy to another.
11
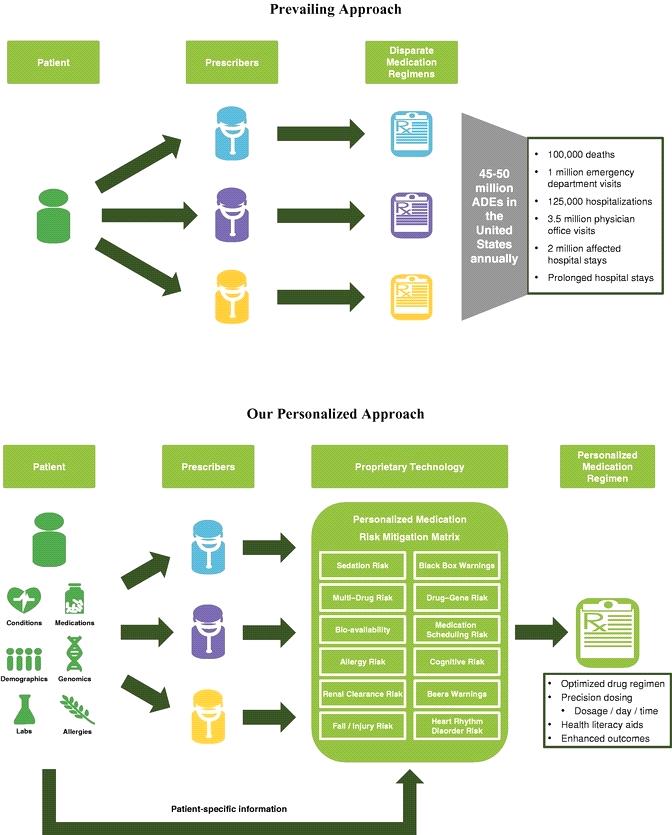
The following charts contrast the prevailing approach to prescribing medications, which is often uncoordinated and non-personalized and results in inconsistent and ineffective medication regimens for the same patient, with our personalized approach utilizing our proprietary MRM Matrix.
Our software offerings are developed by our in-house team of software engineers that continuously enhances our solutions and their functionality. By maintaining in-house development and support, we can efficiently leverage our institutional knowledge to augment our solutions while protecting our intellectual property. Our solutions are further protected by patent, copyright, trademark and trade secret laws as well as confidentiality agreements, licenses and other agreements with employees, consultants, vendors and clients. Our software offerings are scalable, fault-tolerant and compliant with the Health Insurance Portability and Accountability Act of 1996, or HIPAA, and Health Information Technology for Economic and Clinical Health Act, or HITECH, regulations and are Meaningful-Use certified, which
12
means they qualify in determining eligibility for EHR incentive payments from CMS under the American Recovery and Reinvestment Act of 2009.
Our Software and Services
Our Software
Our cloud-based software applications include EireneRx, which is used by at-risk healthcare organizations to access their patients' medication-related information through our dashboard that shows the results of the MRM Matrix and medication recommendations, MedWise Advisor, which allows for components of EireneRx to be used independently and by a broader healthcare audience, and NiaRx, which is our educational software platform designed to facilitate brand awareness of our solutions in the pharmacy educational community. These software-enabled solutions are offered on a standalone basis or bundled with prescription fulfillment and reminder packaging services for client populations with complex prescription needs.
Our personalized medication risk management services are based on our MRM Matrix technology. For each patient, our software creates a personalized MRM Matrix, which incorporates personal medical history data inputs, summarizes the medications the patient is taking and provides clinical alerts, including for the risk of falls and injury, sedation risk and medication scheduling risk. This MRM Matrix is utilized by prescribers independently and, in some cases, in conjunction with our pharmacists, to optimize each patient's medication regimen utilizing one of our proprietary software solutions below:
|
EireneRx |
MedWise Advisor |
|||
|
Revenue Model |
Per-member per-month Fee-for-service model (for prescription fulfillment and reminder packaging services) |
Recurring monthly subscription SaaS model |
||
|
Current Target Clients |
Healthcare organizations with all-inclusive, or closed, care models with an emphasis on coordination of care, such as PACE, ACOs, Integrated Delivery Networks and Patient Centered-Medical Homes Risk-bearing provider groups |
Healthcare organizations able to leverage the MRM Matrix Health plans Risk-bearing provider groups Hospitals and health systems Pharmacies and pharmacists Potential patient engagement application through existing relationships |
||
|
EireneRx |
MedWise Advisor |
|||
|
Key Technology Features |
Cloud-based electronic portal MRM Matrix e-prescribing Decision support at the point of care Computerized physician order entry Modular certified for Meaningful Use Real-time secure messaging capabilities with our pharmacists Storage of personalized actionable pharmacogenomic data, which is data on how genes affect a person's response to drugs |
Cloud-based electronic portal MRM Matrix Decision support at the point of care Real-time secure messaging capabilities with our pharmacists Storage of personalized actionable pharmacogenomic data |
13
|
Service Features |
Fully interoperable with many industry-leading EHRs and dispensing software Sophisticated medication decision-support tools Precision dosing systems May be combined with prescription fulfillment and adherence packaging, patient-focused health literacy and adherence tools and pharmacist consultation |
Used independently or readily integrated with other pharmacy management systems, long-term care clinical systems, case management platforms, industry-leading EHRs or dispensing software Sophisticated medication decision-support tools Precision dosing systems |
||
|
Differentiated Attributes |
Enables physicians and pharmacists to collaborate on a patient's medication management in real time Offers clinical analysis and aggregates reports that optimize outcomes and show risk mitigation results Compatible with third-party dispensing-systems |
Sophisticated alert functionalities and patient risk evaluation Built-in module with capabilities to remove repetitive components of a comprehensive medication review |
||
EireneRx
EireneRx is our cloud-based medication decision-support and e-prescribing platform, which includes a computerized order entry module used by healthcare organizations to access patient medication-related information and utilize our personalized proprietary MRM Matrix. EireneRx provides a single version of a patient's medication profile, enabling prescribers and our pharmacists to collaborate on a patient's medication management in real time. The EireneRx platform provides a dashboard report that shows the results of the MRM Matrix. We have a team of pharmacists available to perform a clinical analysis of the results and, when necessary, offer guidance to the prescriber based upon its assessment of the MRM Matrix and the individual patient's medical history. EireneRx provides several communication workflows through which our pharmacists can answer questions and make recommendations to prescribers.
Medication decision-support tools and precision-dosing aides are presented to prescribers at the point-of-prescribing, during pharmacist consultation and at periodic patient reviews, providing detailed patient-specific information. These tools are Meaningful Use Stage I and II certified, meaning they qualify in determining eligibility for EHR incentive payments from CMS under the American Recovery and Reinvestment Act of 2009. EireneRx is integrated with our prescription fulfillment pharmacies, which can deliver medications to our clients' patients nationally. The platform is also capable of sending prescriptions to substantially all pharmacies in the United States.
MedWise Advisor
MedWise Advisor software provides the medication decision support components of EireneRx, primarily our MRM Matrix, to support clients seeking to manage their medication risk and improve medication outcomes and patient relationships by enhancing their existing systems. MedWise Advisor can be integrated with a variety of e-prescribing modules, EHRs, pharmacy management systems, clinical systems, case management platforms and other clinical databases. The software enables a prescribing environment where the physician prescribes medication with real-time pharmacist consultation. We have a team of pharmacists available to perform clinical analysis of the results and, when necessary, offer guidance to the prescriber based upon their review of the MRM Matrix and the individual patient's medical history. We believe MedWise Advisor is broadly applicable to all healthcare organizations that employ clinicians who prescribe medications and those with pharmacists or other clinicians that provide support to prescribers. We are currently working with managed care and behavioral health organizations that are utilizing MedWise Advisor to improve medication therapy outcomes, and we are targeting a broad range of healthcare systems, hospitals, post-acute providers and pharmacies and intend to target consumers with this solution.
14
NiaRx
NiaRx is a cloud-based software platform designed to facilitate the cognitive practice of pharmacy through case-based learning utilizing the MRM Matrix. NiaRx is in use by six schools of pharmacy, with over 2,000 registered academic users, and is intended to build literacy and brand awareness of our suite of technology solutions with thought-leaders and students in the pharmacy educational community, and drive adoption in the professional pharmacy community.
Our Services
Our clinical pharmacist collaboration service, prescription fulfillment and reminder packaging service and pharmacy cost management service are designed to improve patient experiences and outcomes and contain costs while our risk adjustment services help optimize revenue. The revenue models under these service contracts typically include payments on a per-member per-month basis, payments on a subscription basis and charges and dispensing fees for medication fulfillment for our clients' patients.
Clinical Pharmacist Collaboration
We have a team of pharmacists available to perform medication risk analysis and offer guidance, including the clinical application of pharmacogenomic test results and data application, to the prescriber based upon their assessment of the MRM Matrix and the individual patient's medical history. Our clinical pharmacists provide these personalized medication recommendations predominantly through secure real-time messaging. Available 24/7, 365 days per year, this service supports the medication risk management clinical decision making process with medication safety recommendations, including to eliminate unnecessary prescriptions, and execution of the optimized medication regimen. We exchanged over 136,000 secure real-time messages in December 2016.
Prescription Fulfillment and Reminder Packaging
We operate three prescription fulfillment pharmacies strategically located to efficiently distribute medications nationwide for our clients. Informed by each patient's personalized MRM Matrix, we package, synchronize and aggregate medications by day, time-of-day and dosage to increase the ease of adherence by patients to their optimized medication regimens. Using automated, robotic dispensing machines, our scalable, high-performance systems allow for an array of medication packaging options, including multi-dose deep well cards and multi-dose pouches.
Effective March 2016, we entered into a prime vendor agreement with AmerisourceBergen Drug Corporation, or AmerisourceBergen, a drug wholesaler, to provide us with the pharmaceutical products we sell. The prime vendor agreement was subsequently amended and restated effective May 1, 2016. As part of this agreement, we are obligated to purchase at least 95% of the total dollar amount of prescription pharmaceutical products we sell from AmerisourceBergen. The contract also commits us to a monthly minimum purchase obligation of approximately $1.75 million. Our amended and restated contract with AmerisourceBergen has an initial term of three years expiring April 30, 2019, and can be terminated by, among other things, either party's material breach that continues for 30 days. Pursuant to the terms of a security agreement entered into in connection with the prime vendor agreement, AmerisourceBergen also holds a subordinated security interest in all of our assets.
The reason we purchase large quantities of pharmaceutical products from a single wholesaler is primarily for ease of administration and pricing. In the event of a termination of our relationship with AmerisourceBergen, we believe that there is typically at least one alternative drug wholesaler from whom we could source each non-limited distribution drug we dispense. We further believe that we could replace the inventories without a material disruption to our operations.
Risk Adjustment
We take a prospective approach to risk adjustment, going beyond the typical strategy of providing retrospective reviews and claims data analysis. We identify opportunities for efficiency and performance improvement in coding patterns, data integrity and diagnosis volumes and trends. Our consultants help clients to refine processes and systems to capture timely, complete and accurate claims data. Our team of expert physicians and nurse consultants trains client staff
15
and providers about documentation and diagnosis coding, analyzes client data collection and submission processes and delivers meaningful analytics for understanding reimbursement complexities.
Long-term optimization of risk adjustment outcomes is complex and, for many organizations, significantly affects financial performance. We specialize in helping clients optimize processes and systems to capture timely, complete and accurate data. Through these services, we currently help PACE and other healthcare organizations remain compliant with regulations, make reliable comparisons to internal and external benchmarks and identify high-volume/high-cost issues for quality program initiatives.
Pharmacy Cost Management
We design, implement and manage pharmacy cost-containment strategies for our post-acute care clients. Pharmacy cost management services help our clients reduce risk, increase compliance and optimize spending. For many of our clients, excessive pharmacy costs are a common driver of shrinking profit margins. Complex contract language, atypical dispensing practices and a lack of recourse for pricing errors contribute to inaccurate pharmacy budgets, improper reimbursement and waste. Our analytics provide real-time reporting, simplify drug-spend data and are designed to create contract transparency for our clients. By simplifying and adding oversight to the adjudication process, we help clients avoid risks associated with managing pharmacy costs by preventing overpayments and ensuring appropriate reimbursements.
Our Clients
Our clients are at-risk healthcare organizations, primarily PACE organizations, managed-care organizations, including government and commercial plans, post-acute care facilities, behavioral health organizations and other provider groups. We have strong and long-standing relationships with our clients, providing services under multi-year contracts. At the end of 2014, 2015, and 2016, we were serving 51, 119, and 133 healthcare organizations, respectively. Our annual revenue retention rate was 98%, 99%, and 95% for 2016, 2015, and 2014, respectively, and our client retention rate was 93%, 96% and 97%, respectively, which we believe reflects strong client satisfaction with our solutions. No single client accounted for more than 10% of our revenue during the year ended December 31, 2016. For the year ended December 31, 2015, our largest client accounted for 10% of our revenue, and for the year ended December 31, 2014, our two largest clients accounted for 11% and 10% of our revenue, respectively. We believe our clients view us as a trusted partner that shares their commitment to improving medication-related health outcomes and reducing overall healthcare costs.
Providers Serving Dual-eligible Patients
The majority of our clients serve dual-eligible patients as of December 31, 2016. Dual-eligible patients, who are eligible for coverage under both Medicare and Medicaid, are typically among the most vulnerable and highest-acuity beneficiaries covered by the healthcare system, with some of the most complex medication requirements. They represent 19% of the Medicare population and 15% of the Medicaid population, but account for 25% of total Medicare costs and 37% of total Medicaid costs. Because of the high costs associated with care for these patients, the federal government and many states are implementing systems and service models to integrate care and align reimbursement under at-risk structures.
PACE Organizations
PACE, a federal and state collaboration, is one growing model serving the dual-eligible patient population that focuses on averting institutional-based placement. PACE embodies many of the characteristics and trends affecting the healthcare industry as a whole. Our proof of concept was to provide medication risk management technology and services to PACE organizations, which are responsible for elderly patients, typically with complex medication regimens. Over the past four years, we have become the market-leader in providing PACE with medication risk management. Our PACE clients cover approximately 20% of the total PACE enrollees nationwide. However, the existing PACE enrollees represent only 4% of the 900,000 total eligible individuals within current PACE service areas, according to a study we commissioned from AEC Consulting, LLC. In addition to personalized medication management, we also provide risk adjustment services and intend to provide pharmacy cost management services to PACE organizations.
16
Managed Care Organizations
Since 2004, the number of beneficiaries enrolled in Medicare Advantage, or MA, plans has more than tripled from 5.3 million to 17.6 million in 2016 and is expected to grow to 22 million by 2020. MA is a capitated program with payment rates that are calculated based on the acuity of the patients served. Accordingly, patients are assigned relative risk scores based on diagnosis, which need to be documented accurately each year for appropriate reimbursement. We have become the market leader in risk adjustment and front-end coding for PACE organizations and we plan to continue to expand these services to other MA programs. Furthermore, we believe our solutions are broadly applicable throughout the managed care landscape, including to the self-funded employer groups. According to CMS and the CBO, in 2016 there were approximately 56 million people in the United States covered under Medicare, approximately 77 million people covered under Medicaid and 214 million people covered under commercial managed care. These numbers are expected to reach 63 million, 76 million and 220 million, respectively, by 2020.
Acute and Post-Acute Care Providers
Acute and post-acute care providers are increasingly operating in value-based care models. Under the BPCI, providers such as hospitals, skilled nursing facilities, in-patient rehabilitation facilities and home health agencies began to receive bundled payments for episodes of care. According to a recent report, more than 4,000 facilities and agencies have already signed up to participate in the BPCI program.
We are the market leader in pharmacy cost management solutions in the post-acute arena, helping facilities manage their pharmacy spend for their capitated patients. Our clients include approximately 1,000 of the more than 15,400 post-acute facilities in the United States. We believe there are significant opportunities to cross-sell our medication risk management solutions within this client base.
Physician Provider Groups
We contract with physician provider groups across the country for care transitions support and comprehensive medication management services. We risk-stratify patient cohorts for these groups and identify patients at risk of an ADE. We then collaborate with these groups on appropriate levels of intervention to mitigate that risk.
Behavioral Health Organizations
According to the National Institute of Mental Health, in 2014 there were 13.6 million people in the United States with a chronic severe mental illness like schizophrenia, major depression or bipolar disorder. According to the Substance Abuse and Mental Health Services Administration, total spending on mental health treatment is projected to increase from $147 billion in 2009 to $239 billion in 2020. For these individuals, in 2014, prescription medications were the most significant mental health spend, accounting for 30% of total expenditures by provider, more than total hospital costs, physician expenses and insurance administration, according to a 2014 study by HHS. Behavioral health organizations are increasingly operating under value-based care models, and according to the National Council for Behavioral Health, there are over 2,200 behavioral health organizations in the United States. We are currently pursuing intervention studies or pilot programs to evaluate the benefits of clinical interventions in the behavioral health setting.
17
Intellectual Property
We create, own and maintain a wide array of intellectual property assets which, in the aggregate, are of material importance to our business. Our intellectual property assets include: one patent and three pending patent applications related to our innovations, products and services; trademarks and trademark applications related to our brands, products and services; copyrights in software, documentation, content and databases; trade secrets relating to data processing, statistical methodologies, data security and other aspects of our business; and other intellectual property rights and licenses of various kinds. We are licensed to use certain technology and other intellectual property rights owned and controlled by others, and, similarly, other companies are licensed on a non-exclusive basis to use certain technology and other intellectual property rights owned and controlled by us.
We rely on patent, copyright, trademark and trade secret laws as well as confidentiality agreements, licenses and other agreements with employees, consultants, vendors and clients. We also seek to control access to and distribution of our proprietary software, confidential information and know-how, technology and other intellectual property. We have one issued patent for our medication management system and method (U.S. Pat. No. 8,392,220, issued March 2013) and three patent applications pending in the United States, the first, filed in December 2014, relates to our Medication Risk Mitigation System and Method and the second and third, filed in January 2016 and May 2016, respectively, relate to our MRM Matrix. Our issued patent expires on November 8, 2031. We own one registered copyright protecting the code and documentation related to EireneRx, initially filed in 2012 and updated in 2015.
We own and use trademarks in connection with products and services, including both unregistered common law marks and issued trademark registrations in the United States. Our material trademarks, service marks and other marks include: EireneRx®, Medication Risk Mitigation by CareKinesis®, MedWise Advisor®, NiaRx®, CareVentions™, Tabula Rasa HealthCare™, Medliance™, Capstone Performance Systems™, Medication Risk Mitigation™ and Medication Risk Mitigation Matrix™. We also have trademark applications pending to register marks in the United States.
Our Competitive Landscape
We compete with a broad and diverse set of businesses. We believe the competitive landscape is highly fragmented with no single competitor offering similarly expansive capabilities and solution offerings in medication risk management. Our competitive advantage is largely based on our analytical capabilities, healthcare industry expertise, breadth and depth of services, intellectual property, the size and quality of our underlying datasets and benchmarks, ease of use, reputation, innovation, security, price, reliability and client service. Our primary competitive challenge is to demonstrate to our existing and potential clients the value of utilizing our platforms rather than developing or assembling their own alternative capabilities or utilizing providers offering a subset of our services. However, we believe that the combination of our competitive strengths and successful culture of innovation, including our industry-leading analytics, the real-world-tested nature of our platforms and subject matter expertise of our associates, make it time and cost prohibitive for our clients or competitors to replace or replicate all that we offer without facing material risk.
Current industry players providing medication risk management and related service offerings include large and small healthcare data analytics and consulting companies, community or long-term care pharmacies, national pharmacy providers, health plans, genomic testing labs and healthcare information technology companies, among others. Many of our competitors' solutions are regulatory-driven, retrospective in nature and offer no intervention at the point of care. The services offered by these organizations may include e-prescribing and EHRs utilizing single drug-to-drug interaction analysis, lab-based genomic evaluation, basic risk stratification solutions and other prevailing approaches to medication therapy management. Many health plans attempt to address non-adherence through outreach efforts, which often require the intervention of in-house or third-party consultants and have low success rates. Some healthcare information technology providers offer risk adjustment and pharmacy cost management services, but lack the comprehensive solutions we provide. Many genomic testing labs lack the ability to apply patient test results in a useful way at the point of care. Post-acute providers typically employ pharmacist consultants to review prescription regimens every 30 days, which is retrospective in nature and generally ineffective in improving patient outcomes. Furthermore, typical prescription fulfillment models are reimbursed on a fee-for-service basis and are incentivized based on prescription dispensing volumes. Our clients partner with us in order to prospectively address ADEs, lower healthcare costs and improve overall health outcomes, which often involves utilizing our software to reduce the number of prescriptions per patient to optimize prescription regimens.
18
While we believe that no competitor provides the breadth of our suite of solutions, we nevertheless compete with other companies with regards to specific products or solutions and markets or care settings. We expect that competition will continue to increase as a result of consolidation in both the information technology and healthcare industries. The anticipated growth in healthcare spending, the shift to a value-based payment model, the rise of consumerism and changes in government regulation may draw increasing attention to healthcare data and analytics, and new competitors, such as management consultants, technology companies and start-ups may enter the market, and we may face increased competition from these sources.
Healthcare Regulatory Environment
We operate in a highly regulated industry and our business operations must comply with a number of complex and evolving federal and state agency requirements. While we believe we comply in all material respects with applicable healthcare laws and regulations, these laws can vary significantly from jurisdiction to jurisdiction, and the state and federal interpretation of existing laws and regulations, and their enforcement, may change from time to time. Additionally, a state or federal government enforcement body may disagree that we are in material compliance with applicable healthcare laws and regulations. Federal and state legislatures also may enact various legislative proposals that could materially impact certain aspects of our business.
A non-exhaustive list of federal and state statutes, regulations, sub-regulatory guidance and contractual provisions that may apply to our business activities include:
Healthcare Legislation
In 2010, Congress passed major health reform legislation, mostly through the ACA. Generally, the ACA was designed to expand coverage for the uninsured while at the same time containing overall healthcare costs. While not all of these reforms affect our business directly, many affect the coverage and plan designs that are or will be provided by many of our clients. Consequently, these reforms could impact some or many of our business arrangements directly or indirectly.
Given that certain regulations implementing ACA are still being formulated and finalized, and given that sub-regulatory guidance is still being promulgated by federal agencies, such as HHS and the Internal Revenue Service, and state agencies, we cannot predict with any certainty the outcome of any future legislation, regulation or litigation related to healthcare reform.
President Trump and the United States Congress are considering a number of legislative and regulatory proposals which could impact the healthcare system, the ACA, and/or the Medicare and Medicaid programs. While not all of the contemplated changes, if enacted, would affect our business directly, many could impact some or many of our business arrangements directly or indirectly. Given that legislative and regulatory change is still being formulated, we cannot predict with any certainty the outcome of any future legislation or regulation.
PACE Organizations
Our partnership with PACE organizations is a significant source of our current revenue stream. The PACE program is a unique, comprehensive managed care benefit for certain frail elderly individuals, most of whom are dually eligible for Medicare and Medicaid benefits, provided by a not-for-profit or public entity. The PACE program features a comprehensive medical and social service delivery system using an interdisciplinary team approach in an adult day health center that is supplemented by in-home and referral services in accordance with participants' needs. Financing for the program is capped, which allows providers to deliver all services participants need rather than only those reimbursable under Medicare and Medicaid fee-for-service plans. PACE is a program under Medicare, and states can elect to provide PACE services to Medicaid program beneficiaries as an optional Medicaid benefit. The PACE program becomes the sole source of Medicaid and Medicare benefits for PACE participants.
As PACE organization contractors, we are subject to numerous contractual obligations imposed by our partner organizations, as well as to various audit and certification requirements.
19
HIPAA Healthcare Fraud Provisions
HIPAA also created additional federal criminal statutes regarding fraud. Specifically, the HIPAA healthcare fraud statute prohibits, among other things, knowingly and willfully executing or attempting to execute a scheme to defraud any healthcare benefit program, or to obtain by false or fraudulent pretenses any of the money or property owned by a healthcare benefit program, knowingly and willfully embezzling or stealing from a healthcare benefit program, and willfully obstructing a criminal investigation of a healthcare offense. The HIPAA healthcare fraud statutes also prohibit, among other things, concealing a material fact or making a materially false statement in connection with the delivery of or payment for healthcare benefits, items or services. Like the federal Anti-Kickback Statute, the ACA amended the intent standard for certain healthcare fraud statutes under HIPAA such that a person or entity no longer needs to have actual knowledge of the statute or specific intent to violate it in order to have committed a violation. Those found to have aided in a violation of these prohibitions are deemed by statute to have committed the offense and are punishable as a principal offender.
State and Federal Data Privacy and Security Laws
We process, collect, use and disclose individual patient data for patients directly or for our clients and therefore, are subject to various laws protecting privacy and security of the patient information. Certain segments of our company qualify as a "Covered Entity" under HIPAA, and others qualify as a "Business Associate" to our partners who are Covered Entities and as such we are required to comply with HIPAA and HITECH, as implemented through regulations promulgated thereunder by HHS, including the HIPAA Omnibus Final Rule, the HIPAA Privacy Rule and the HIPAA Security Rule. HIPAA generally requires Covered Entities and their Business Associates to adopt certain safeguards to ensure the privacy and security of protected health information, or PHI, and to limit uses and disclosures of such PHI to those permissible under the law. When Covered Entities utilize Business Associates to provide services, pursuant to which the Business Associate may access the Covered Entity's PHI, the parties must enter into a Business Associate agreement through which the Business Associate must contractually agree to safeguard PHI in certain ways and to notify the Covered Entity of improper uses or disclosures of PHI.
Covered Entities and Business Associates are required to have written policies and procedures addressing HIPAA compliance and must designate a Security Officer to oversee the development and implementation of the policies and procedures related to the safeguards to protect privacy of electronic PHI. Covered Entities must also designate a Privacy Officer, although the Privacy Officer and the Security Officer may be the same person. As part of their security policies and procedures, Covered Entities and Business Associates are required to conduct periodic risk assessments to identify vulnerabilities to electronic PHI. Additionally, Covered Entities and Business Associates are required to train all employees on their HIPAA policies and procedures. Further, in the event of a breach of PHI as defined by HIPAA, Covered Entities must notify affected individuals, HHS and sometimes the media, as well as take steps to mitigate damage, and they may be subject to fines and penalties. HIPAA violations can result in significant civil monetary penalties and/or imprisonment for up to ten years depending on the facts surrounding the violation.
Many states also have similar data privacy and security laws that track federal requirements or impose different and/or more stringent conditions for use and disclosure of protected health information. Failure to comply with these laws may also result in the imposition of significant civil and/or criminal penalties.
Federal and State Oversight of Medical Devices, Genomic Testing, Drugs, and Controlled Substances
Some technologies and software applications used in connection with healthcare analytics and genomic testing and analysis are considered medical devices and are subject to regulation by the FDA. The 21st Century Cures Act (Pub. L. 114-255), enacted in December 2016, included certain changes to the Federal Food, Drug, and Cosmetic Act to exempt certain medical-related software from FDA regulation. Although we believe that our technologies and software are not subject to active FDA regulation, there is a risk that the FDA could disagree. If the FDA determines that any of our current or future services, technologies or software applications are regulated by the FDA as medical devices, we would become subject to various statutes, regulations and policies enforced by the FDA and other governmental authorities including both premarket and post-market requirements, and we would need to bring the affected services, technologies, and/or software into compliance with such requirements.
20
Clinical laboratories that perform human genomic testing are subject to oversight by CMS and state regulators. The laboratories that we partner with for genomic testing must comply with the relevant CMS and state laws and regulations applicable to clinical laboratories and genomic testing.
The Drug Enforcement Administration, or DEA, FDA, and state regulators, such as state boards of pharmacy, regulate drug and controlled substance packaging, repackaging, purchasing, handling, storage, distribution, security, and dispensing activities. Our prescription fulfillment pharmacies must comply with the applicable FDA, DEA, and state statutes, regulations, and policies. In addition, our prescription fulfillment pharmacies may be subject to periodic audits by state regulators, DEA, and/or FDA to assess our compliance with these requirements.
Noncompliance with applicable federal or state requirements, as described above, can result in an enforcement action that could substantially harm our business.
Anti-Kickback Laws
The federal Anti-Kickback Statute, or AKS, makes it unlawful for individuals or entities, among other things, to knowingly and willfully solicit, offer, receive or pay any kickback, bribe or other remuneration, directly or indirectly, overtly or covertly, in cash or in kind, in exchange for or to induce or reward the referral of an individual to a person for the furnishing or arranging for the furnishing of any item or service for which payment may be made in whole or in part under a federal healthcare program, or the purchase, lease or order, or arranging for or recommending purchasing, leasing or ordering, any good, facility, service or item for which payment may be made in whole or in part under a federal healthcare program. Penalties for violations include criminal penalties and civil sanctions such as fines, imprisonment and possible exclusion from federal healthcare programs. The federal AKS is an intent-based statute, but following amendment from the ACA, a person or entity no longer needs to have actual knowledge of the statute or specific intent to violate it in order to have committed a violation. Further, the failure of an arrangement to satisfy all elements of an AKS safe harbor will not necessarily make it illegal, but it may subject that arrangement to increased scrutiny by enforcement authorities. The federal AKS is applicable to us as operators of specialty pharmacies, contractors to health plans and providers, as well as contractors to various federal healthcare program payors. When our compensation arrangements implicate the AKS and/or state anti-kickback laws we evaluate whether we believe they fall within one of the safe harbors. If not, we consider the factors to identify the intent behind such arrangements and the relative risk of fraud and abuse. We also design business models that seek to reduce the risk that any such arrangements might be viewed as abusive and trigger AKS scrutiny or claims.
In addition to the federal AKS, many states have anti-kickback prohibitions that may apply to arrangements and claims involving healthcare items or services reimbursed by non-governmental third-party payors.
Federal and State Self-Referral Laws
The federal physician self-referral law, often referred to as the Stark Law, with limited exceptions, prohibits physicians from referring Medicare Program or Medicaid patients to an entity for the provision of certain designated health services, among them outpatient prescription medications, if the physician or a member of such physician's immediate family has a direct or indirect financial relationship (including an ownership or investment interest or a compensation arrangement) with the entity. The Stark Law also prohibits the entity from billing Medicare or Medicaid for such designated health services. A referral that does not fall within a statutory exception is strictly prohibited by the Stark Law. A violation of the Stark Law is punishable by civil sanctions, including significant fines and exclusion from participation in Medicare and Medicaid Programs.
We evaluate when these physician (or immediate family member) financial arrangements are created to strive to ensure we do not enter into a prohibited financial relationship and design structures that satisfy exceptions under the Stark Law.
Our business may implicate federal and state physician self-referral laws to the extent our pharmacy, a designated health services entity, has financial arrangements in the form of ownership, investment or compensation with referring physicians or a referring physician's immediate family member. No physician has an ownership or investment interest in our business, but our pharmacy may have compensation arrangements with physicians who serve on its Clinical Advisory Panel and who order designated health services for patients enrolled in a PACE program. If any such
21
compensation arrangements exist, we believe such compensation arrangements fall within an exception to the physician self-referral prohibition.
A number of states have statutes and regulations that prohibit the same general types of conduct as those prohibited by the Stark Law, but some have even broader application, extending beyond Medicare and Medicaid Programs and including commercial and self payors.
Federal and State False Claims Acts
The federal false claims and civil monetary penalties laws, including the civil False Claims Act, impose criminal and civil liability on individuals and entities that, among other things, knowingly submit, or cause to be submitted, false or fraudulent claims for payment to the federal government or knowingly make, or cause to be made, a false statement in order to have a false claim paid. The civil False Claims Act provides for treble damages and mandatory and significant minimum penalties per false claim or statement ($5,500 to $11,000 per false claim). The qui tam or whistleblower provisions of the civil False Claims Act permit a private individual to bring actions on behalf of the federal government alleging that the defendant has submitted a false claim to the federal government, and to share in any monetary recovery. Our future activities relating to the manner in which we sell and market our services may be subject to scrutiny under these laws. False Claims Act qui tam lawsuits in healthcare are common, although the government often declines to pursue such actions following investigation. Analogous state false claims laws also may apply to our sales or marketing arrangements and claims involving healthcare items or services reimbursed by non-governmental third party payors.
Other State Laws
The vast majority, if not all states have laws regulating licensure, registration and certification of pharmacies, pharmacists, pharmacy technicians and other pharmacy personnel. We are licensed in all states that require such licensure in which we do business and believe that we substantially comply with all state licensing laws applicable to our business. Where required by law, we also have pharmacists licensed in all states in which we dispense. If we violate state pharmacy licensure laws or engage in conduct prohibited under our license, we could be subject to enforcement action, including but not limited to suspension or loss of such pharmacy license
The U.S. Drug Enforcement Administration, as well as some similar state agencies, requires our pharmacy locations to individually register in order to handle controlled substances, including prescription pharmaceuticals. Federal and various state laws also regulate specific labeling, reporting and record-keeping aspects related to controlled substances. We maintain U.S. Drug Enforcement Administration registrations for each of our facilities that require such registration and follow procedures intended to comply with all applicable federal and state requirements regarding dispensing controlled substances.
Employees
As of December 31, 2016, we had 241 employees. Of those employees, 157 provide direct client service, including 64 who are clinical pharmacists who perform medication risk analysis and offer guidance, 14 are involved in sales, marketing and client support, 33 are involved in software development, 10 are involved in the development and enhancement of our service offerings and 27 are devoted to information technology, administrative and financial activities. None of our employees are represented by labor unions or subject to collective bargaining agreements and all of our employees currently work in the United States. We consider our employee relations to be good.
Available Information
We file our Annual Report on Form 10-K, Quarterly Reports on Form 10-Q, Current Reports on Form 8-K, and all amendments to those reports with the SEC. You may obtain copies of these documents by visiting the SEC's Public Reference Room at 100 F Street, N.E., Washington, D.C. 20549, by calling the Securities and Exchange Commission, or SEC, at 1-800-SEC-0330 or by accessing the SEC's website at www.sec.gov. In addition, as soon as reasonably practicable after such materials are furnished to the SEC, we make copies of these documents available to the public free of charge through our website. Our website address is www.tabularasahealthcare.com.
22
The contents of the websites referred to above are not incorporated into this filing. Further, our references to the URLs for these websites are intended to be inactive textual references only.
Financial Information
For required financial information related to our operations, please refer to our consolidated financial statements, including the notes thereto, included with this Annual Report on Form 10-K.
Investing in our common stock involves a high degree of risk. You should carefully consider the risks and uncertainties described below together with all of the other information contained in this Annual Report on Form 10-K, including the section of this report titled “Management’s Discussion and Analysis of Financial Condition and Results of Operations” and our audited consolidated financial statements and the related notes. We cannot assure you that any of the events discussed in the risk factors below will not occur. The occurrence of any of the events or developments described below could have a material and adverse impact on our business, results of operations, financial condition, and cash flows and future prospects and, if so, our future prospects would likely be materially and adversely affected. If any of such events were to happen, the trading price of our common stock could decline, and you could lose all or part of your investment. Although we have discussed all known material risks, the risks described below are not the only ones that we may face, and additional risks or uncertainties not known to us or that we currently deem immaterial may also impair our business and future prospects.
Risks Relating to Our Business and Industry
The healthcare industry in the United States is undergoing significant structural change and is rapidly evolving, and the market for technology-enabled healthcare products and services is in its early stages, which makes it difficult to forecast demand for our technology-enabled products and services. If we are not successful in promoting the benefits of our products and services, our growth may be limited.
The healthcare industry in the United States is undergoing significant structural change and is rapidly evolving. We believe demand for our products and services has been driven in large part by price pressure in traditional fee-for-service healthcare, a regulatory environment that is incentivizing value-based care models, the movement toward patient-centricity and personalized healthcare and advances in technology. Widespread acceptance of the value-based care model is critical to our future growth and success. A reduction in the growth of value-based care or patient-centric models could reduce the demand for our products and services and result in a lower revenue growth rate or decreased revenue.
The market for technology-enabled healthcare products and services is in the early stages and it is uncertain whether it will achieve and sustain high levels of demand and market adoption. Our future financial performance will depend in part on growth in this market and on our ability to adapt to emerging demands of our clients. It is difficult to predict the future growth rate and size of our target market.
Our success will depend to a substantial extent on the willingness of healthcare organizations to increase their use of our technology and our ability to demonstrate the value of our technology to our existing clients and potential clients. If healthcare organizations do not recognize or acknowledge the benefits of our products and services or if we are unable to reduce healthcare costs or drive positive health outcomes, then the market for our products and services might not develop at all, or it might develop more slowly than we expect.
If we are unable to offer innovative products and services or our products and services fail to keep pace with our clients' needs, our clients may terminate or fail to renew their agreements with us and our revenue and results of operations may suffer.
Our success depends on providing innovative, high-quality products and services that healthcare providers and payors use to improve clinical, financial and operational performance. If we cannot adapt to rapidly evolving industry standards, technology and increasingly sophisticated and varied client needs, our existing technology could become undesirable, obsolete or harm our reputation. In order to remain competitive, we must continue to invest significant
23
resources in our personnel and technology in a timely and cost-effective manner in order to enhance our existing products and services and introduce new high-quality products and services that existing clients and potential new clients will want. We are continually involved in a number of projects to develop new products and services, including the further refinement of our proprietary MRM Matrix. If our innovations are not responsive to the needs of our existing clients or potential new clients, are not appropriately timed with market opportunity, are not effectively brought to market or significantly increase our operating costs, we may lose existing clients or be unable to obtain new clients and our results of operations may suffer.
Our limited operating history may make it difficult for you to evaluate the success of our business to date and to assess our future viability.
We commenced active operations in 2011 and our operations to date have included organizing and staffing our company, business planning, raising capital and developing and marketing our product and services. As an early stage business, we may encounter unforeseen expenses, difficulties, complications, delays and other known and unknown factors.
We have incurred significant net losses and we may not be able to generate net income in the future.
As of December 31, 2016, we had an accumulated deficit of $34.9 million. Substantially all of our operating losses resulted from costs incurred in connection with our research and development program, acquisitions and from general and administrative costs associated with our operations. Our ability to generate net income is dependent upon, among other things, the acceptance of our products and services by, and the strength of, our existing and potential clients.
If we fail to effectively manage our growth, our business and results of operations could be harmed.
We have expanded our operations significantly since our inception. For example, we grew from 29 employees on January 1, 2011, the beginning of our first year of active operations, to 241 employees as of December 31, 2016, and our revenue increased from $70.0 million for the year ended December 31, 2015 to $94.1 million for the year ended December 31, 2016. If we do not effectively manage our growth as we continue to expand, the quality of our products and services could suffer and our revenue could decline. Our growth to date has increased the significant demands on our management, our operational and financial systems, IT infrastructure, security mechanisms and other resources. In order to successfully expand our business, we must effectively recruit, integrate and motivate new employees, while maintaining the beneficial aspects of our corporate culture. We may not be able to hire new employees, including software engineers, quickly enough to meet our needs. If we fail to effectively manage our hiring needs and successfully integrate our new hires, our efficiency and ability to meet our forecasts and our employee morale, productivity and retention could suffer, and our business and results of operations could be harmed. We must also continue to improve our existing systems for operational and financial management, including our reporting systems, procedures and controls. These improvements could require significant capital expenditures and place increasing demands on our management. We may not be successful in managing or expanding our operations or in maintaining adequate financial and operating systems and controls. If we do not successfully manage these processes, our business and results of operations could be harmed.
We may not grow at the rates we historically have achieved or at all, even if our key metrics may indicate growth, which could cause the market price of our common stock to decline.
We have experienced significant growth since 2011, our first year of active operations, with total revenue growing from $5.8 million for the year ended December 31, 2011, to $94.1 million for the year ended December 31, 2016. Future revenue may not grow at these same rates or may decline. Our future growth will depend, in part, on our ability to grow our revenue from existing clients, to complete sales to new clients and to expand our client base in the healthcare industry and with provider and payor organizations. We may not be successful in executing on our growth strategies and may not continue to grow our revenue at similar rates as we have in the past. Our ability to execute on our existing sales pipeline, create additional sales pipelines and expand our client base depends on, among other things, the attractiveness of our products and services relative to those offered by our competitors, our ability to demonstrate the value of our existing and future products and services and our ability to attract and retain a sufficient number of qualified
24
sales and marketing personnel. In addition, clients in some market segments in which we have a more limited presence may be slower to adopt our products and services than we currently anticipate.
Significant developments stemming from the recent U.S. presidential election could have an adverse effect on us.
On January 20, 2017, Mr. Donald J. Trump was inaugurated as the president of the United States. As a presidential candidate, President Trump indicated an intention to request Congress to make significant changes to U.S. tax laws, significant changes, replacement or elimination of the ACA, and government negotiation or regulation of drug prices paid by government programs. Changes in U.S. social, political, regulatory and economic conditions or laws and policies governing the health care system and drug prices, U.S. tax laws, manufacturing, and development and investment where we or our customers and suppliers operate could adversely affect our operating results and our business.
To date, we have derived substantially all of our product revenue from sales of prescription medications, and revenue from sales of prescription medications is dependent upon factors outside of our control.
To date, substantially all of our product revenue has been derived from sales of prescription medications and related services, and we expect to continue to derive the substantial majority of our product revenue from sales of prescription medications and related services for the foreseeable future. Revenue from prescription medication fulfillment is dependent upon a number of factors, many of which are outside of our control, such as growth or contraction in patient populations at our clients and the number and mix of medications each patient is prescribed. Any change in these factors could harm our financial results.
We derive a significant portion of our revenue from PACE organizations, and any changes in laws or regulations, or any other factors that cause a decline in the use of PACE organizations to provide healthcare could hurt our ability to generate revenue and grow our business.
We derive a significant portion of our revenue from PACE organizations, which are our largest clients, accounting for 87.4% of our revenue for the year ended December 31, 2016. PACE organizations reflect a relatively new, value-based model for providing healthcare to the elderly and are funded by both Medicare and Medicaid. If the laws and regulations that currently promote PACE organizations were to change in a way that makes operating a PACE organization less attractive, if other Medicare or Medicaid reimbursement models are developed that are more attractive to the healthcare providers that operate PACE organizations or if the prevalence of PACE organizations were to decline for any other reason, our ability to generate revenue and grow our business may be compromised.
Consolidation in the healthcare industry could lead to the elimination of some of our clients and make others larger, which could decrease demand for our solutions or create pricing pressure.
Many healthcare industry participants are consolidating to create larger and more integrated healthcare delivery systems. If regulatory and economic conditions continue to facilitate additional consolidation in the healthcare industry, some of our current clients, and possibly our future clients, may be eliminated. Such market fluctuations may result in decreased need for some or all of our products and services as some of our clients disappear, and others acquire larger market power, which may be used to develop various solutions in-house, rather than purchasing them from us, or negotiate fee reductions for our products and services.
Failure by PACE organization clients to meet applicable penetration benchmarks could result in loss of their service area, which could lead to our loss of that business and a corresponding decline in our revenue.
PACE organizations in many states are subject to penetration benchmarks regarding the number of eligible lives in their service areas that have been captured by the program. If the number of members covered by any of our PACE organization clients were to be reduced by a material amount, such decrease may lead to a loss of their service area, which could result in our loss of the client and a corresponding decline in our revenue.
25
The growth of our business relies, in part, on the growth of our clients, which is difficult to predict and is affected by factors outside of our control.
We enter into agreements with our clients under which a portion of our fees are dependent upon the number of members that are covered by our clients' programs each month. The number of members covered by a client's program is often affected by factors outside of our control, such as the client's pricing, overall quality of service and member retention initiatives. If the number of members covered by one or more of our client's programs were to be reduced, such decrease would lead to a decrease in our revenue. In addition, the growth forecasts of our clients are subject to significant uncertainty and are based on assumptions and estimates that may prove to be inaccurate. Even if the markets in which our clients compete meet the size estimates and growth forecasted, their program membership could fail to grow at similar rates, if at all.
A few clients account for a significant portion of our revenue and, as a result, the loss of one or more of these clients could hurt our revenue.
Our largest ten clients accounted for 51%, 53%, and 62% during the years ended December 31, 2016, 2015, and 2014 respectively. No single client accounted for more than 10% of our revenue during the year ended December 31, 2016. For the year ended December 31, 2015, our largest client accounted for 10% of our revenue, and for the year ended December 31, 2014, our two largest clients accounted for 11% and 10% of our revenue, respectively. Our engagement with these clients is generally covered through contracts that are multi-year in their duration. One or more of these clients may decline to renew their existing contracts with us upon expiration and any such failure to renew could have a negative impact on our revenue and compromise our growth strategy. Further, if one or more of these clients significantly decreases its use of our solutions, we would lose revenue and our growth would be compromised.
Because we generally bill our clients and recognize revenue over the term of the contract, near-term declines in new or renewed agreements may not be reflected immediately in our operating results.
Most of our revenue in each quarter is derived from agreements entered into with our clients during previous quarters. Consequently, a decline in new or renewed agreements in any one quarter may not be fully reflected in our revenue for that quarter because, although we enter into multi-year arrangements with our clients and recognize revenue over the term of the contract, such revenue varies based on the volume and pricing of prescriptions filled and the number of members of the healthcare organization and is, thus, not recognized evenly. Such declines, however, would negatively affect our revenue in future periods. The effect of any significant downturns in sales of, and market demand for, our products and services, as well as any potential changes in our rate of renewals or renewal terms, may not be fully reflected in our results of operations until future periods. In addition, we may be unable to adjust our cost structure rapidly or at all, to take account of reduced revenue.
If we do not continue to attract new clients, we may not be able to grow our business.
In order to grow our business, we must continually attract new clients. Our ability to do so depends in large part on the success of our sales and marketing efforts. Potential clients may seek out other options. Therefore, we must demonstrate that our products and services provide a viable solution for potential clients. If we fail to provide high-quality solutions and convince individual clients of our value proposition, we may not be able to attract new clients. If the market for our products and services declines or grows more slowly than we expect, or if the number of individual clients that use our solutions declines or fails to increase as we expect, our financial results could be harmed.
If we are not able to maintain and enhance our reputation and brand recognition, our business will be harmed.
Maintaining and enhancing our reputation and brand recognition is critical to our relationships with existing clients and to our ability to attract new clients. The promotion of our brand may require us to make substantial investments and we anticipate that, as our market becomes increasingly competitive, these marketing initiatives may become more difficult and expensive. Our marketing activities may not be successful or yield increased revenue, and to the extent that these activities yield increased revenue, the increased revenue may not offset the expenses we incur. In addition, any factor that diminishes our reputation or that of our management, including failing to meet the expectations of our clients, could make it substantially more difficult for us to attract new clients. If we do not successfully maintain and enhance our reputation and brand recognition, our business may not grow and we could lose our relationships with clients.
26
Initial positive outcomes and cost reductions for our clients have not been statistically analyzed, are not necessarily attributable to our services, and are not necessarily predictive of future outcomes or costs.
Although several of our clients have reported improved outcomes for their patients and cost reductions on a per member per month basis, these initial outcomes have not been statistically analyzed and are not necessarily predictive of future outcomes. Other factors, including changes in healthcare regulations or other business practices or our clients' implementation of other cost saving measures may have contributed to positive outcomes or reduced costs. Moreover, outcome and cost reduction data are often susceptible to varying interpretations and analyses, and many companies that believed their technologies and services were effective initially were unable to maintain positive results over time. If we fail to produce positive outcomes and reduce costs for our clients, they may not continue to use our services and we may be unable to attract new clients, each of which could harm our business.
Our marketing efforts depend significantly on our ability to receive positive references from our existing clients.
Our marketing efforts depend significantly on our ability to call on our current clients to provide positive references to new, potential clients. Given our limited number of long-term clients, the loss or dissatisfaction of any client could substantially harm our brand and reputation, inhibit the market adoption of our products and services, impair our ability to attract new clients and maintain existing clients and, ultimately, harm our financial results.
Our sales and implementation cycle can be long and unpredictable and can require considerable time and expense, which may cause our operating results to fluctuate.
The sales cycle for our products and services from initial sales activity with a potential client to contract execution and implementation can be long and varies widely by client, typically ranging from three to 12 months. Some of our clients undertake pilot programs for our products and services which range from six to 18 months in length. These pilot programs may result in extended sales cycles and upfront sales costs as the potential client evaluates our products and services. Our sales efforts involve educating our clients about the use, technical capabilities and benefits of our products and services. It is possible that in the future we may experience even longer sales cycles, more complex client requirements, higher upfront sales costs and less predictability in completing some of our sales as we continue to expand into new territories and add additional products and services. If our sales cycle lengthens or our substantial upfront sales and implementation investments do not result in sufficient sales to justify our investments, our operating results may be harmed.
Any failure to offer high-quality client support services may adversely affect our relationships with our clients and harm our financial results.
Our clients depend on our technical support to resolve any issues relating to our offering and technology solutions and to provide initial and ongoing training and education, when necessary. In addition, our sales process is highly dependent on the quality of our offering, our business reputation and on strong recommendations from our existing clients. Any failure to maintain high-quality and highly-responsive technical support, or a market perception that we do not maintain high-quality and highly-responsive support, could harm our reputation and compromise our ability to sell our solutions to existing and prospective clients.
We offer client support services with our offering and may be unable to respond quickly enough to accommodate short-term increases in client demand for support services, particularly as we increase the size of our client base. We also may be unable to modify the format of our support services to compete with changes in support services provided by competitors. It is difficult to predict client demand for our support services and if client demand increases significantly, we may be unable to provide satisfactory support services to our clients. Additionally, increased client demand for these services, without corresponding revenue, could increase costs and hurt our ability to achieve profitability.
27
Our proprietary products and services may not operate properly, which could damage our reputation, give rise to a variety of claims against us or divert our resources from other purposes, any of which could harm our business and operating results.
Technology-enabled product and service development is time-consuming, expensive and complex and may involve unforeseen difficulties. We may encounter technical obstacles, and we may discover additional problems that prevent our proprietary products and services from operating properly. If our products and services do not function reliably or fail to achieve client expectations in terms of performance, clients could assert liability claims against us and attempt to cancel their contracts with us. Moreover, material performance problems, defects or errors in our existing or new products and services may arise in the future and may result from, among other things, the lack of interoperability of our software with systems and data that we did not develop and the function of which are outside of our control or undetected in our testing. Defects or errors in our products or services might discourage existing or potential clients from purchasing services from us. Correction of defects or errors could prove to be time consuming, costly, impossible or impracticable. The existence of errors or defects in our products and services and the correction of such errors could divert our resources from other matters relating to our business, damage our reputation and increase our costs.
Adverse drug events resulting from optimizing a patient's medication regimen through recommendations made by our technology or our pharmacists could give rise to claims against us and could damage our reputation.
We provide medication risk management services which includes answering prescriber questions and making recommendations to prescribers at the point-of-prescribing, during pharmacist consultation and at periodic patient review. In the event that optimizing a patient's medication regimen through recommendations made by our technology or our pharmacists contribute to an ADE, clients and patients could assert liability claims against us, which may not be subject to a contractually agreed upon liability cap, and clients could attempt to cancel their contracts with us. Such instances may also generate significant negative publicity that could harm our reputation, increase our costs and materially affect our results of operations.
Future sales to clients outside the United States or clients with international operations might expose us to risks inherent in international markets, which could hurt our business.
An element of our growth strategy is to expand internationally. Operating in international markets requires significant resources and management attention and will subject us to regulatory, economic and political risks that are different from those in the United States. We currently do not have any international operations. Because of our lack of experience with international operations, any international expansion efforts might not be successful in creating demand for our products and services outside of the United States or in effectively selling our products and services in the international markets we enter. In addition, we will face risks in doing business internationally that could hurt our business, including:
|
· |
the need to localize and adapt our products and services for specific countries, including translation into foreign languages and associated expenses; |
|
· |
difficulties in staffing and managing foreign operations; |
|
· |
different pricing environments, longer sales cycles and longer accounts receivable payment cycles and collections issues; |
|
· |
new and different sources of competition; |
|
· |
weaker protection for intellectual property and other legal rights than in the United States and practical difficulties in enforcing intellectual property and other rights outside of the United States; |
|
· |
laws and business practices favoring local competitors; |
|
· |
compliance challenges related to the complexity of multiple, conflicting and changing governmental laws and regulations, including employment, anti-bribery, foreign investment, tax, privacy and data protection laws and regulations; |
28
|
· |
increased financial accounting and reporting burdens and complexities; |
|
· |
adverse tax consequences; and |
|
· |
if we denominate our international contracts in local currencies, fluctuations in the value of the U.S. dollar and foreign currencies might negatively affect our operating results when translated into U.S. dollars. |
We purchase a significant portion of our pharmaceutical products from one wholesaler.
Effective March 2016, we entered into a prime vendor agreement with AmerisourceBergen Drug Corporation, or AmerisourceBergen, a drug wholesaler, to provide us with the pharmaceutical products we sell. The prime vendor agreement was subsequently amended and restated effective May 1, 2016. As part of this agreement, we are obligated to purchase at least 95% of the total dollar amount of prescription pharmaceutical products we sell from AmerisourceBergen. The contract also commits us to a monthly minimum purchase obligation of approximately $1.75 million. Our amended and restated contract with AmerisourceBergen has an initial term of three years expiring April 30, 2019, and can be terminated by, among other things, either party's material breach that continues for 30 days, or a payment default that continues for five days after notice thereof. If we are no longer able to purchase our pharmaceutical products from AmerisourceBergen, there can be no assurance that our operations would not be disrupted or that we could obtain the necessary pharmaceutical products at similar cost or at all. In this event, failure to satisfy our clients' requirements would result in defaults under client contracts subjecting us to damages and the potential termination of those contracts.
Any restrictions on our ability to license or share data and integrate third-party technologies could harm our business.
We depend upon licenses from third parties for some of the technology and data used in our products and services, and for some of the technology platforms upon which these products and services are built and operate. Most of our third-party licenses are non-exclusive and our competitors may obtain the right to use any of the technology covered by these licenses to compete directly with us. We also license some of our technology and share data we collect with our clients, including under agreements with health systems and providers of electronic health records. We expect that we will need to obtain additional licenses from third parties in the future in connection with the development of our products and services. In addition, we obtain a portion of the data that we use from public records and from our clients for specific client engagements. Our licenses for information may not be sufficient to allow us to use the data that is incorporated into our products and services for all potential or contemplated applications and products.
In the future, data providers could withdraw their data from us or restrict our usage for any reason, including if there is a competitive reason to do so, if legislation is passed restricting the use of the data or if judicial interpretations are issued restricting use of the data that we currently use in our products and services. In addition, data providers could fail to adhere to our quality control standards in the future, causing us to incur additional expense to appropriately utilize the data. If a substantial number of data providers were to withdraw or restrict their data, or if they fail to adhere to our quality control standards, and if we are unable to identify and contract with suitable alternative data suppliers and integrate these data sources into our service offerings, our ability to provide products and services to our clients would be compromised and our future growth and success could be delayed or limited.
We also integrate into our proprietary applications and use third-party software to maintain and enhance, among other things, content generation and delivery, and to support our technology infrastructure. Some of this software is proprietary and some is open source software. Our use of third-party technologies exposes us to increased risks, including, but not limited to, risks associated with the integration of new technology into our solutions, the diversion of our resources from development of our own proprietary technology and our inability to generate revenue from licensed technology sufficient to offset associated acquisition and maintenance costs. These technologies may not be available to us in the future on commercially reasonable terms or at all and could be difficult to replace once integrated into our own proprietary applications. Most of these licenses can be renewed only by mutual consent and may be terminated if we breach the terms of the license and fail to cure the breach within a specified period of time. Our inability to obtain, maintain or comply with any of these licenses could delay development until equivalent technology can be identified, licensed and integrated, which could delay or limit our future growth.
29
Data loss or corruption due to failures or errors in our systems may expose us to liability, hurt our reputation and relationships with existing clients and force us to incur significant costs.
Hardware failures or errors in our systems could result in data loss or corruption or cause the information that we collect to be incomplete or contain inaccuracies that our clients regard as significant. Complex software such as ours may contain errors or failures that are not detected until after the software is introduced or updates and new versions are released. We continually introduce new software and updates and enhancements to our existing software. Despite testing by us, we may discover defects or errors in our software. Any defects or errors could expose us to risk of liability to clients and the government, and could cause delays in the introduction of new products and services, result in increased costs and diversion of development resources, require design modifications, decrease market acceptance or client satisfaction with our products and services or cause harm to our reputation. Data losses related to personal health records could result in additional risks. We are subject to data privacy and security laws and regulations and contractual obligations governing the transmission, security and privacy of health and other sensitive or proprietary information, which may impose restrictions on the manner in which we access, store, transmit, use and disclose such information and subject us to penalties if we are unable to fully comply with such laws or contractual provisions."
Furthermore, our clients might use our software together with products from other companies. As a result, when problems occur, it might be difficult to identify the source of the problem. Even when our software does not cause these problems, the existence of these errors might cause us to incur significant costs, divert the attention of our technical personnel from our product development efforts, hurt our reputation and lead to significant client relations problems.
Our business is subject to online security risks, and if we are unable to safeguard the security and privacy of confidential data, our reputation and business will be harmed.
Our products and services involve the collection, storage and analysis of confidential or proprietary information. If a cyber incident, such as a phishing attack, virus, malware installation, server malfunction, software or hardware failure, impairment of data integrity, loss of data or other computer assets, adware or other similar issue, impairs or shuts down one or more of our computing systems or our IT network, we may be subject to negative treatment and lawsuits by our clients. In addition, attention to remediating cyber incidents may distract our technical or management personnel from their normal responsibilities. Public announcements of such cyber incidents could occur and negative perception of such cyber incidents could adversely affect the price of our common stock, and we could lose sales and clients.
In certain cases, confidential or proprietary information is provided to third parties, such as the service providers that host our technology platform, and we may be unable to control the use of our information or the security protections used by third parties. Cyber incidents and malicious internet-based activity continue to increase generally, and providers of hosting and cloud-based services are often targeted. If the third parties with whom we work violate applicable laws, contracts or our security policies, these violations could also put our confidential or proprietary information at risk and otherwise hurt our business. In addition, if the security measures of our clients are compromised, even without any actual compromise of our own systems, we may face negative publicity or reputational harm if our clients or anyone else incorrectly attributes the blame for such security breaches to us or our systems.
We may be required to expend significant capital and other resources to protect against security incidents caused by known cyber vulnerabilities or to alleviate problems caused by security breaches. Despite our implementation of security measures, techniques used to obtain unauthorized access to information or to sabotage information technology systems change frequently and unknown cyber vulnerabilities caused by third-party software or services may exist within our system. As a result, we may be unable to anticipate such techniques or vulnerabilities or to implement adequate preventative measures. Any compromise or perceived compromise of our security could damage our reputation and our relationship with our clients, could reduce demand for our products and services and could subject us to significant liability or regulatory actions. In addition, in the event that new privacy or data security laws are implemented, we may not be able to timely comply with such requirements, or such requirements may not be compatible with our current processes. Changing our processes could be time consuming and expensive, and failure to timely implement required changes could subject us to liability for non-compliance.
30
We rely on internet infrastructure, bandwidth providers, other third parties and our own systems to provide services to our clients, and any failure or interruption in the services provided by these third parties or our own systems could expose us to litigation and hurt our reputation and relationships with clients.
Our ability to deliver our products and services, particularly our cloud-based solutions, is dependent on the development and maintenance of the infrastructure of the internet and other telecommunications services by third parties. This includes maintenance of a reliable network connection with the necessary speed, data capacity and security for providing reliable internet access and services and reliable telephone and facsimile services. Our services are designed to operate without perceptible interruption in accordance with our service level commitments.
We have, however, experienced limited interruptions in these systems in the past, including server failures that temporarily slow down the performance of our services, and we may experience similar or more significant interruptions in the future. We rely on internal systems as well as third-party suppliers, including bandwidth and telecommunications equipment providers, to provide our services. We do not currently maintain redundant systems or facilities for some of these services. Interruptions in these systems or services, whether due to system failures, cyber incidents, physical or electronic break-ins or other events, could affect the security or availability of our services and prevent or inhibit the ability of our clients and their patients to access our services. In the event of a catastrophic event with respect to one or more of these systems or facilities, we may experience an extended period of system unavailability, which could result in substantial costs to remedy those problems or harm our relationship with our clients and our business.
Additionally, any disruption in the network access, telecommunications or co-location services provided by third-party providers or any failure of or by third-party providers' systems or our own systems to handle current or higher volume of use could significantly harm our business. We exercise limited control over our third-party suppliers, which increases our vulnerability to problems with services they provide. Any errors, failures, interruptions or delays experienced in connection with these third-party technologies and information services or our own systems could hurt our relationships with clients and expose us to third-party liabilities. Although we maintain insurance for our business, the coverage under our policies may not be adequate to compensate us for all losses that may occur. In addition, we might not continue to be able to obtain adequate insurance coverage at an acceptable cost.
The reliability and performance of our internet connection may be harmed by increased usage or by denial-of-service attacks or related cyber incidents. The services of other companies delivered through the internet have experienced a variety of outages and other delays as a result of damages to portions of the internet's infrastructure, and such outages and delays could affect our systems and services in the future. These outages and delays could reduce the level of internet usage as well as the availability of the internet to us for delivery of our internet-based services.
We rely on third-party vendors to host and maintain our technology platform.
We rely on third-party vendors to host and maintain our technology platform, including our EireneRx and MedWise Advisor software. Our ability to offer our products and services and operate our business is dependent on maintaining our relationships with third-party vendors, particularly Amazon Web Services, and entering into new relationships to meet the changing needs of our business. Any deterioration in our relationships with such vendors or our failure to enter into agreements with vendors in the future could harm our business and our ability to pursue our growth strategy. Because of the large amount of data that we collect and manage, it is possible that, despite precautions taken at our vendors' facilities, the occurrence of a natural disaster, cyber incident, decision to close the facilities without adequate notice or other unanticipated problems could result in lengthy interruptions in our service. These service interruptions could cause our platform to be unavailable to our clients and impair our ability to deliver products and services and to manage our relationships with new and existing clients.
If our vendors are unable or unwilling to provide the services necessary to support our business, or if our agreements with such vendors are terminated, our operations could be significantly disrupted. Some of our vendor agreements may be unilaterally terminated by the licensor for convenience, and if such agreements are terminated, we may not be able to enter into similar relationships in the future on reasonable terms or at all. We may also incur substantial costs, delays and disruptions to our business in transitioning such services to ourselves or other third-party vendors. In addition, third-party vendors may not be able to provide the services required in order to meet the changing needs of our business.
31
We depend on our senior management team, and the loss of one or more of our executive officers or key employees or an inability to attract and retain highly skilled employees could compromise our ability to pursue our growth strategy and grow our business.
Our success depends largely upon the continued services of our executive officers and other key employees. We do not maintain "key person" insurance for our executive officers, other than for our Chief Executive Officer, Dr. Calvin H. Knowlton, or any of our other key employees. From time to time, there may be changes in our senior management team resulting from the hiring or departure of executives, which could disrupt our business. We are highly dependent on Dr. Calvin H. Knowlton, our Chief Executive Officer, and Dr. Orsula Knowlton, our President. All of our employees' employment is at-will, including the employment of Drs. Calvin and Orsula Knowlton, which means that any of these employees could leave our employment at any time. The replacement of one or more of our executive officers or other key employees would likely involve significant time and costs and may significantly delay or prevent the achievement of our business objectives.
In addition, competition for qualified management in our industry is intense. Many of the companies with which we compete for management personnel have greater financial and other resources than we do. As a result, we may experience difficulty hiring and retaining qualified personnel. The departure of key personnel could also hurt our business. In such event, we would be required to hire other personnel to manage and operate our business, and we might not be able to employ a suitable replacement for the departing individual, or a replacement might not be willing to work for us on terms that are favorable to us.
In addition, in making employment decisions, particularly in the technology industry, job candidates often consider the value of the stock options or other equity instruments they are to receive in connection with their employment. Volatility in the price of our common stock might, therefore, compromise our ability to attract or retain highly skilled personnel. Furthermore, the requirement to expense stock options and other equity instruments might discourage us from granting the size or type of stock option or equity awards that job candidates require to join our company. If we fail to attract new personnel or fail to retain and motivate our current personnel, our business and future growth prospects could be harmed.
We may make future acquisitions and investments that may be difficult to integrate, divert management resources, result in unanticipated costs or dilute our stockholders.
Part of our business strategy is to acquire or invest in companies, products or technologies that complement our current products and services, enhance our market coverage or technical capabilities or offer growth opportunities. Future acquisitions and investments could pose numerous risks to our operations, including:
|
· |
difficulty integrating the purchased operations, products or technologies; |
|
· |
substantial unanticipated integration costs; |
|
· |
assimilation of the acquired businesses, which may divert significant management attention and financial resources from our other operations and could disrupt our ongoing business; |
|
· |
the loss of key employees, particularly those of the acquired businesses; |
|
· |
difficulty retaining or developing the acquired business' clients; |
|
· |
adverse effects on our existing business relationships; |
|
· |
failure to realize the potential cost savings or other financial or strategic benefits of the acquisitions, including failure to consummate any proposed or contemplated transaction; and |
|
· |
liabilities from the acquired businesses for infringement of intellectual property rights, loss of intellectual property or goodwill through inadequate data security measures, unknown cyber vulnerabilities or network intrusions, or other claims and failure to obtain indemnification for such liabilities or claims. |
32
In connection with these acquisitions or investments, we could incur debt, amortization expenses related to intangible assets or large write-offs, assume liabilities or issue stock that would dilute our current stockholders' ownership. We may be unable to complete acquisitions or integrate the operations, products or personnel gained through any such acquisition successfully or without adversely affecting our business, financial condition and results of operations.
Substantially all of our assets are pledged as collateral under our existing line of credit.
As of December 31, 2016, our total indebtedness was $1.7 million. The 2015 Line of Credit provides for borrowings, on a revolving basis, in an aggregate amount up to $25.0 million to be used for general corporate purposes. The 2015 Line of Credit is secured by all of our personal property, whether presently existing or created or acquired in the future, as well as our intellectual property. If we are unable to repay any secured borrowings when due, whether at maturity or if declared due and payable following a default, the lenders would have the right to proceed against the collateral pledged to the indebtedness and may sell the assets pledged as collateral in order to repay those borrowings.
We may require additional capital to support business growth, and this capital might not be available to us on acceptable terms or at all.
Our operations have required a significant investment of cash since inception and we intend to continue to make significant investments to support our business growth, respond to business challenges or opportunities, develop new applications and services, enhance our existing platform and services, hire additional sales and marketing personnel, enhance our operating infrastructure and potentially acquire complementary businesses and technologies. As of December 31, 2016, we had $4.3 million of cash.
Our future capital requirements may be significantly different from our current estimates and will depend on many factors, including our growth rate, renewal activity, the timing and extent of spending to support product development efforts, the expansion of sales and marketing activities, the introduction of new and enhanced products and services and the continuing market acceptance of our products and services. Accordingly, we might need to engage in equity or debt financings or collaborative arrangements to secure additional funds. If we raise additional funds through further issuances of equity or convertible debt securities, our existing stockholders could suffer significant dilution, and any new equity securities we issue could have rights, preferences and privileges superior to those of holders of our common stock. Any debt financing secured by us in the future could involve restrictive covenants relating to our capital-raising activities and other financial and operational matters, which might make it more difficult for us to obtain additional capital and to pursue business opportunities, including potential acquisitions. We might have to obtain funds through arrangements with collaborators or others that may require us to relinquish rights to our technologies or offering that we otherwise would not consider. If we are unable to obtain adequate financing or financing on terms satisfactory to us when we require it, our ability to continue to support our business growth and to respond to business challenges could be limited.
We may become subject to litigation, which could be costly and result in significant liability.
We may become subject to litigation in the future. Any future claims may result in significant defense costs and potentially significant judgments against us, some of which we are not insured against. We generally intend to defend ourselves vigorously; however, we cannot be certain of the ultimate outcomes of any claims that may arise in the future. Resolution of these types of matters against us may result in our having to pay significant fines, judgments or settlements, which, if uninsured, or if the fines, judgments and settlements exceed insured levels, could diminish our financial resources. Litigation or the resolution of litigation may also affect the availability or cost of some of our insurance coverage, which could increase our costs, expose us to increased risks that would be uninsured and compromise our ability to attract directors and officers.
33
Risks Related to Our Intellectual Property
If we are unable to obtain, maintain and enforce intellectual property protection for our technology and products or if the scope of our intellectual property protection is not sufficiently broad, others may be able to develop and commercialize technology and products substantially similar to ours, and our ability to successfully commercialize our technology and products may be compromised.
Our business depends on proprietary technology and content, including software, databases, confidential information and know-how, the protection of which is crucial to the success of our business. We rely on a combination of patent, trademark, trade-secret and copyright laws, confidentiality procedures, cyber security practices and contractual provisions to protect the intellectual property rights of our proprietary technology and content. We are pursuing the registration of additional trademarks and service marks in the United States, as well as patent protection related to certain business methods employed by us. We may, over time, increase our investment in protecting our intellectual property through additional trademark, patent and other intellectual property filings, which could be expensive and time-consuming. We may not be able to obtain protection for our technology and even if we are successful in attaining effective patent, trademark, trade-secret and copyright protection, it is expensive to maintain these rights and the costs of defending our rights could be substantial. Furthermore, recent changes to U.S. intellectual property laws may jeopardize the enforceability and validity of our intellectual property portfolio and harm our ability to obtain patent protection of some of our unique business methods.
In addition, these measures may not be sufficient to offer us meaningful protection or provide us with any competitive advantages. If we are unable to adequately protect our intellectual property and other proprietary rights, our competitive position and our business could be harmed, as third parties may be able to commercialize and use technologies and software products that are substantially the same as ours without incurring the development and licensing costs that we have incurred. Any of our owned or licensed intellectual property rights could be challenged, invalidated, circumvented, infringed or misappropriated, our trade secrets and other confidential information could be disclosed in an unauthorized manner to third parties, or our intellectual property rights may not be sufficient to permit us to take advantage of current market trends or to otherwise to provide us with competitive advantages, which could result in costly redesign efforts, discontinuance of some of our offerings or other competitive harm.
Monitoring unauthorized use of our intellectual property is difficult and costly. From time to time, we seek to analyze our competitors' products and services, and may in the future seek to enforce our rights against potential infringement. However, the steps we have taken to protect our proprietary rights may not be adequate to enforce our rights as against infringement or misappropriation of our intellectual property. We may not be able to detect unauthorized use of, or take appropriate steps to enforce, our intellectual property rights. Any inability to meaningfully protect our intellectual property rights could harm our ability to compete and reduce demand for our products and services. Moreover, our failure to develop and properly manage new intellectual property could hurt our market position and business opportunities. Also, some of our products and services rely on technologies, data and software developed by or licensed from third parties, and we may not be able to maintain our relationships with such third parties or enter into similar relationships in the future on reasonable terms or at all. Any loss of the right to use any third-party technologies, data or software could result in delays in implementing or provisioning our products and services until equivalent technology is either developed by us or, if available, is identified, obtained and integrated, which could harm our business.
We may also be required to protect our proprietary technology and content in an increasing number of jurisdictions, a process that is expensive and may not be successful, or which we may not pursue in every location. In addition, effective intellectual property protection may not be available to us in every country, and the laws of some foreign countries may not be as protective of intellectual property rights as those in the United States. Additional uncertainty may result from changes to intellectual property legislation enacted in the United States and elsewhere, and from interpretations of intellectual property laws by applicable courts and agencies. Accordingly, we may be unable to obtain, maintain and enforce the intellectual property rights necessary to provide us with a competitive advantage. Our failure to obtain, maintain and enforce our intellectual property rights could therefore adversely affect our business, financial condition and results of operations.
34
If our trademarks and trade names are not adequately protected, we may not be able to build name recognition in our markets of interest and our competitive position may be harmed.
The registered or unregistered trademarks or trade names that we own may be challenged, infringed, circumvented, declared generic, lapsed or determined to be infringing on or dilutive of other marks. We may not be able to protect our rights in these trademarks and trade names, which we need in order to build name recognition with potential clients. In addition, third parties may in the future file for registration of trademarks similar or identical to our trademarks. If they succeed in registering or developing common law rights in such trademarks, and if we are not successful in challenging such third-party rights, we may not be able to use these trademarks to develop brand recognition of our technologies, products or services. If we are unable to establish name recognition based on our trademarks and trade names, we may not be able to compete effectively.
If we cannot protect our domain names, our ability to successfully promote our brand will be impaired.
We currently own the web domain names www.tabularasahealthcare.com, www.trhc.com, www.carekinesis.com, www.careventions.com, www.medliance.com, www.capstoneperformancesystems.com, www.eirenerx.com, www.medwiseadvisor.com and www.niarx.com, which are critical to the operation of our business. The acquisition and maintenance of domain names is generally regulated by governmental agencies and their designees. The regulation of domain names in the United States and in foreign countries is subject to change. Governing bodies may establish additional top-level domains, appoint additional domain name registrars or modify the requirements for holding domain names. As a result, we may be unable to acquire or maintain relevant domain names in all countries in which we conduct business. Furthermore, it is unclear whether laws protecting trademarks and similar proprietary rights will be extended to protect domain names. Therefore, we may be unable to prevent third parties from acquiring domain names that are similar to, infringe upon or otherwise decrease the value of our trademarks and other proprietary rights. We may not be able to successfully implement our business strategy of establishing a strong brand if we cannot prevent others from using similar domain names or trademarks. This failure could impair our ability to increase our market share and revenue.
We could incur substantial costs as a result of any claim of infringement of another party's intellectual property rights.
Our commercial success depends in part on our ability to develop and commercialize our products and services without infringing or being claimed to have infringed the intellectual property or proprietary rights of third parties. Intellectual property disputes can be costly to defend and may cause our business, operating results and financial condition to suffer. As the market for technology-enabled healthcare solutions in the United States expands and intellectual property protections asserted by others increase, the risk increases that there may be intellectual property asserted by others and patents issued to third parties that relate to our products and technology of which we are not aware or that we must challenge to continue our operations as currently contemplated. Whether merited or not, we may face allegations that we, our clients, our licensees or parties indemnified by us have infringed or otherwise violated the patents, trademarks, copyrights or other intellectual property rights of third parties. In addition, we have received letters from third parties in the past claiming that our software, technologies and methodologies are covered by their patents, and future claims may require us to expend time and money to address and resolve these claims. Such claims may be made by competitors seeking to obtain a competitive advantage or by other parties. Additionally, in recent years, individuals and groups have begun purchasing intellectual property assets for the purpose of making claims of infringement and attempting to extract settlements from other technology-reliant companies.
We may also face allegations that our employees or consultants have misappropriated the intellectual property or proprietary rights of their former employers or other third parties, as the case may be. It may be necessary for us to initiate litigation to defend ourselves in order to determine the scope, enforceability and validity of third-party intellectual property or proprietary rights, or to establish our respective rights. Regardless of whether claims that we are infringing patents or other intellectual property rights have merit, such claims can be time-consuming, divert management's attention and financial resources and can be costly to evaluate and defend. Results of any such litigation are difficult to predict and may require us to stop commercializing or using our products or technology, obtain licenses, modify our products and technology while we develop non-infringing substitutes, incur substantial damages or settlement costs, or face a temporary or permanent injunction prohibiting us from marketing or providing the affected products and services. If we require a third-party license, it may not be available on reasonable terms or at all, and we may have to pay substantial royalties, upfront fees or grant cross-licenses to intellectual property rights for our products
35
and services. We may also have to redesign our products or services so they do not infringe third-party intellectual property rights, which may not be possible or may require substantial monetary expenditures and time, during which our technology and products may not be available for commercialization or use. Even if we have an agreement to indemnify us against such costs, the indemnifying party may be unable to uphold its contractual obligations. If we cannot or do not obtain a third-party license to the infringed technology at all, license the technology on reasonable terms or obtain similar technology from another source, our ability to operate our business could be compromised.
Our use of open source software could compromise our ability to offer our services and subject us to possible litigation.
We use open source software in connection with our products and services. Companies that incorporate open source software into their products have, from time to time, faced claims challenging the use of open source software and compliance with open source license terms. As a result, we could be subject to suits by parties claiming ownership of what we believe to be open source software or claiming noncompliance with open source licensing terms. Some open source software licenses require users who distribute software containing open source software to publicly disclose all or part of the source code to the licensee's software that incorporates, links or uses such open source software, and make available to third parties for no cost, any derivative works of the open source code created by the licensee, which could include the licensee's own valuable proprietary code. While we monitor our use of open source software and try to ensure that none is used in a manner that would require us to disclose our proprietary source code or that would otherwise breach the terms of an open source agreement, such use could inadvertently occur, or could be claimed to have occurred, in part because open source license terms are often ambiguous. Any actual or claimed requirement to disclose our proprietary source code or pay damages for breach of contract could harm our business and could help our competitors develop products and services that are similar to or better than ours.
We may become involved in lawsuits to protect or enforce our patents or other intellectual property, which could be expensive, time consuming and unsuccessful.
Competitors may infringe our issued patents or other intellectual property. To counter infringement or unauthorized use, we may be required to monitor for such infringement and file infringement claims, both of which can be expensive and time consuming. Any claims we assert against perceived infringers could provoke these parties to assert counterclaims against us alleging that we infringe their patents. In addition, in a patent infringement proceeding, a court may decide that a patent of ours is invalid or unenforceable, in whole or in part, or may construe the patent's claims narrowly or refuse to stop the other party from using the technology at issue on the grounds that our patents do not cover the technology in question. An adverse result in a proceeding could put one or more of our patents at risk of being invalidated.
We may be subject to claims by third parties asserting that our employees, our consultants or we have misappropriated their intellectual property, or claiming ownership of what we regard as our own intellectual property.
Many of our employees were previously employed at universities or other technology or pharmaceutical companies, including our competitors or potential competitors. Although we try to ensure that our employees and our consultants do not use the proprietary information or know-how of others in their work for us, we may be subject to claims that our employees, our consultants, or we have used or disclosed intellectual property, including trade secrets or other proprietary information, of any such employee's former employer. Costly litigation may be necessary to defend against these claims.
In addition, while it is our policy to require our employees and contractors who may be involved in the development of intellectual property to execute agreements assigning such intellectual property to us, we may be unsuccessful in executing such an agreement with each party who in fact develops intellectual property that we regard as our own. Our and their assignment agreements may not be self-executing or may be breached, and we may be forced to bring claims against third parties, or defend claims they may bring against us, to determine the ownership of what we regard as our intellectual property.
If we fail in prosecuting or defending any such claims, in addition to paying monetary damages, we may lose valuable intellectual property rights or personnel. Even if we are successful in prosecuting or defending against such claims, litigation could result in substantial costs and be a distraction to management.
36
Intellectual property litigation could cause us to spend substantial resources and distract our personnel from their normal responsibilities.
Even if resolved in our favor, litigation or other legal proceedings against us relating to intellectual property claims may cause us to incur significant expenses, and could distract our technical and management personnel from their normal responsibilities. In addition, there could be public announcements of the results of hearings, motions or other interim proceedings or developments and if securities analysts or investors perceive these results to be negative, it could have a substantial adverse effect on the price of our common stock. Such litigation or proceedings could substantially increase our operating losses and reduce the resources available for development activities or any future sales, marketing or distribution activities. We may not have sufficient financial or other resources to conduct such litigation or proceedings adequately. Some of our competitors may be able to sustain the costs of such litigation or proceedings more effectively than we can because of their greater financial resources. Uncertainties resulting from the initiation and continuation of patent litigation or other proceedings could compromise our ability to compete in the marketplace.
If we are unable to protect the confidentiality of our trade secrets, know-how and other proprietary information, the value of our technology, products and services could be hurt.
We may not be able to protect our trade secrets, know-how and other proprietary information adequately. Although we use reasonable efforts to protect this proprietary information and technology, our employees, consultants and other parties may unintentionally or willfully disclose our information or technology to competitors. In addition, our trade secrets, know-how and other proprietary information may be accessed or disclosed during a cyber incident, which could have a significant negative impact on us. Further, such cyber incidents, if disclosed publicly, could adversely affect the price of our common stock.
Enforcing a claim that a third party illegally obtained and is using any of our proprietary information or technology is expensive and time-consuming, and the outcome is unpredictable. In addition, courts outside the United States are sometimes less willing to protect trade secrets, know-how and other proprietary information. We rely, in part, on non-disclosure, confidentiality and invention assignment agreements with our employees, consultants and other parties to protect our trade secrets, know-how and other intellectual property and proprietary information. These agreements may not be self-executing, or they may be breached and we may not have adequate remedies for such breach. Moreover, third parties may independently develop similar or equivalent proprietary information or otherwise gain access to our trade secrets, know-how and other proprietary information.
Risks Related to Industry Regulation and Other Legal Compliance Matters
The healthcare regulatory and political framework is uncertain and evolving.
Healthcare laws and regulations are rapidly evolving and may change significantly in the future. For example, in March 2010, the ACA was adopted, which is a healthcare reform measure that seeks to contain healthcare costs while improving quality and access to coverage. The ACA includes a variety of healthcare reform provisions and requirements that have already become effective or will become effective at varying times through 2018 and substantially changes the way healthcare is financed by both governmental and private insurers, which may significantly affect our industry and our business. Many of the provisions of the ACA will phase in over the course of the next several years, and we may be unable to predict accurately what effect the ACA or other healthcare reform measures that may be adopted in the future, including amendments to the ACA, will have on our business.
President Trump and the United States Congress are considering a number of legislative and regulatory proposals which could impact the healthcare system, the ACA, and/or the Medicare and Medicaid programs. While not all of the contemplated changes, if enacted, would affect our business directly, many could impact some or many of our business arrangements directly or indirectly. Given that legislative and regulatory change is still being formulated, we cannot predict with any certainty the outcome of any future legislation or regulation.
In addition, we are subject to various other healthcare laws and regulations, including, among others, the Stark Law relating to self-referrals, anti-kickback laws, including the federal Anti-Kickback Statute, antitrust laws and the data privacy and security laws and regulations described below. If we were to become subject to litigation or liabilities or
37
found to be out of compliance with these or other laws, our business could be hurt. We may become subject to litigation, which could be costly and result in significant liability.
We are subject to data privacy and security laws, regulations and contractual obligations governing the transmission, security and privacy of health and other sensitive or proprietary information, which may impose restrictions on the manner in which we access, store, transmit, use and disclose such information and subject us to penalties if we are unable to fully comply with such laws or contractual provisions.
As described below, we are required to comply with numerous federal and state laws and regulations governing the collection, use, disclosure, storage and transmission of individually identifiable health information that we may obtain or have access to in connection with the provision of our services. These laws and regulations, including their interpretation by governmental agencies, are subject to frequent change. These laws and regulations include the following.
|
· |
The Health Insurance Portability and Accountability Act, or HIPAA, and its implementing regulations, required expanded protection of the privacy and security of protected health information, the execution of certain contracts to safeguard protected health information and the adoption of standards for the exchange of electronic health information, for health plans, healthcare clearinghouses and certain healthcare providers, which we refer to as Covered Entities, and their business associates. Among the standards that HHS has adopted pursuant to HIPAA are standards for electronic transactions and code sets, unique identifiers for providers, employers, health plans and individuals, security, electronic signatures, privacy and enforcement. Actual failure to comply with HIPAA could result in fines and civil and criminal penalties, as well as contractual damages, which could harm our business, finances and reputation |
|
· |
The Health Information Technology for Economic and Clinical Health Act, or the HITECH Act, enacted as part of the American Recovery and Reinvestment Act of 2009, also known as the "Stimulus Bill", effective February 22, 2010, modified HIPAA by setting forth health information security breach notification requirements and increasing penalties for violations of HIPAA, among other things. The HITECH Act requires individual notification for all breaches as defined by HIPAA, media notification of breaches affecting over 500 individuals located in the same region and either prompt or annual reporting of breaches to HHS, depending on the number of affected individuals. The HITECH Act also replaced the prior monetary penalty system of $100 per violation and an annual maximum of $25,000 per violation with a four-tier system of sanctions for breaches. Penalties now range from a minimum of $100 per violation and an annual maximum of $25,000 per violation for the first tier to a minimum of $50,000 per violation and an annual maximum of $1.5 million per violation for the fourth tier. Failure to comply with HIPAA as modified by the HITECH Act could result in fines and penalties, criminal sanctions and reputational damage that could harm our business. |
|
· |
Numerous other federal and state laws may apply that restrict the use and disclosure and mandate the protection of the privacy and security of individually identifiable information, as well as employee personal information, and that require notifications and mitigation in the event of a breach. These include state medical information privacy laws, state social security number protection laws and federal and state consumer protection laws, among others. These various laws in many cases are not preempted by HIPAA and may be subject to varying interpretations by the courts and government agencies, creating complex compliance issues for us and our clients and potentially exposing us to additional expense, adverse publicity and liability. |
|
· |
Federal and state consumer protection laws are increasingly being applied by the United States Federal Trade Commission, or FTC, and states' attorneys general to regulate the collection, use, storage and disclosure of personal or individually identifiable information, through websites or otherwise, and to regulate the presentation of website content. |
There is ongoing concern from privacy advocates, regulators and others regarding data protection and privacy issues, and the number of jurisdictions with data protection and privacy laws has been increasing. In addition, the scope of protection afforded to data subjects by many of these data protection and privacy laws has been increasing. Also, there are ongoing public policy discussions regarding whether the standards for deidentified, anonymous or pseudonomized health information are sufficient, and the risk of re-identification sufficiently small, to adequately protect patient privacy.
38
These discussions may lead to further restrictions on the use of such information. These initiatives or future initiatives could compromise our ability to access and use data or to develop or market current or future services.
The security measures that we and our third-party vendors and subcontractors have in place to ensure compliance with privacy and data protection laws and contractual commitments may not protect our facilities and systems from security breaches, acts of vandalism or theft, cyber incidents, misplaced or lost data, programming and human errors or other similar events. The occurrence of a cyber incident that affects either individually identifiable health information or other confidential or proprietary information with which we have been entrusted may result in liability and hurt our reputation.
Additionally, as a business associate under HIPAA, we may also be liable for privacy and security breaches of protected health information and certain similar failures of our subcontractors. Even though we contractually require our subcontractors to safeguard protected health information as required by law, we still have limited control over their actions and practices. An actual or perceived breach of privacy or security of individually identifiable health information held by us or by our subcontractor may result in an enforcement action, including criminal and civil liability, against us, as well as negative publicity, reputational harm and contractual ramifications with our clients.
We are not able to predict the full extent of the impact such incidents may have on our business if such incidents occur. Any failure we may have in complying with HIPAA may result in criminal or civil liability, and due to the heightened enforcement climate and recent changes to the law, the potential for enforcement action against business associates under HIPAA is now greater than in prior years. Enforcement actions against us could be costly and could interrupt regular operations, which may harm our business. While we have not received any notices of violation of the applicable privacy and data protection laws and believe we adequately protect our information, including in compliance with such laws, there can be no assurance that we will not receive such notices in the future. Further, costly breaches can occur regardless of our compliance infrastructure.
We operate in a highly regulated industry and must comply with a significant number of complex and evolving requirements. Achieving and sustaining compliance with state and federal statutes and regulation related to the healthcare industry may prove costly. Changes in these laws could restrict our ability to conduct our business. Further, if we fail to comply with these requirements, we could incur significant penalties and our reputation could suffer.
In addition to HIPAA, additional federal and state statutes, regulations, guidance and contractual provisions regarding healthcare that may apply to our business activities, including:
|
· |
The federal Anti-Kickback Statute, or AKS, prohibits individuals and entities from knowingly and willfully paying, offering, receiving or soliciting anything of value in order to induce the referral of patients or in return for purchasing, leasing, ordering, arranging for, or recommending services or goods covered in whole or in part by Medicare, Medicaid, or other government healthcare programs. The AKS is an intent-based statute and the failure of an arrangement to satisfy all elements of a safe harbor will not necessarily make it illegal, but it may subject that arrangement to scrutiny by enforcement authorities. Any violation of the AKS can lead to significant penalties, including criminal penalties, civil fines and exclusion from participation in a federal healthcare program, among other penalties. |
|
· |
Various state anti-kickback laws that sometimes track federal AKS prohibitions, although some apply to all-payors as opposed to only government healthcare programs. |
|
· |
The federal physician self-referral law, often referred to as the Stark Law, prohibits physicians from referring Medicare or Medicaid patients to an entity for the provision of certain designated health services, or DHS, among them outpatient prescription medications, if the physician or a member of such physician's immediate family has a financial relationship (including an ownership or investment interest or a compensation arrangement) with the entity, unless the financial relationship meets an exception to the self-referral prohibition. The Stark Law also prohibits the entity from billing Medicare or Medicaid for such DHS if the financial relationship fails to meet the requirements of an exception. The Stark Law is considered a “strict liability” statute in that a referral from a physician with a financial relationship that does not meet the requirements of an exception is strictly prohibited by the Stark Law. A violation of the |
39
Stark Law is punishable by civil sanctions, including significant fines and exclusion from participation in Medicare and Medicaid programs. |
|
· |
State data privacy and security laws that track federal requirements or impose more stringent or different requirements than HIPAA regarding storage, transmission, use and disclosure of protected health information, general individually identifiable information or other sensitive information. |
|
· |
Consumer protection laws require us to publish statements to users of our services that describe how we handle personal information. If such information that we publish is considered untrue, we may be subject to claims of deceptive practices, which could lead to significant liabilities and consequences, including, costs of defending against litigation, settling claims and loss of willingness of current and potential future clients to work with us. |
|
· |
Federal and state false claims laws, including the civil False Claims Act, impose civil and criminal liability on individuals or entities that knowingly submit false or fraudulent claims for payment to the government or knowingly make, or cause to be made, a false statement in order to have a false claim paid. The civil False Claims Act provides for treble damages and mandatory minimum penalties per false claim or statement. In this context, it is particularly notable that a significant portion of our revenue is derived from services provided to PACE organizations. PACE organizations are funded by both Medicare and Medicaid, and the Medicare risk-adjustment methodology applies to the Medicare component of PACE organization reimbursement. PACE submissions may also be comparable to state Medicaid risk-adjustment submissions, and vary by state. Because risk adjustment submissions to Medicare and state Medicaid programs have a direct impact on the amounts that Medicare and Medicaid Programs pay to PACE organizations, these activities may be the subject of scrutiny and litigation under the federal civil False Claims Act. |
|
· |
HHS Office of Inspector General, or OIG, and many state Medicaid agencies maintain lists of individuals and organizations that have been excluded from participation in a federal healthcare program. A significant part of our revenue is derived from our services as federal healthcare program providers, specialty pharmacies, or contractors to federal healthcare program providers or plans and as such, we need to comply with restrictions on employing or contracting with personnel and vendors who have been excluded from participation in federal healthcare programs. Adhering to the best practice of conducting monthly screenings against the federal and state exclusion lists for employees and contractors may be costly and resource-consuming, but failure to do so may give rise to significant administrative liability and sanctions. |
|
· |
As contractors to PACE organizations and Medicare Advantage organizations, or MAOs, we are subject to contractual provisions, which impose on us various obligations related to healthcare compliance and healthcare fraud, waste and abuse reduction and elimination efforts. These obligations stem from the provisions contained in prime contracts between PACE organizations and MAOs, and the federal government. Examples of such flow down provisions include subcontractor's compliance with all applicable state and federal laws, subcontractor's obligation to screen state and federal exclusion lists and its obligation to conduct periodic audits, among many others. Breaches of these requirements would not necessarily be a regulatory risk per se, but they could create contract compliance issues, which may yield contractual damages, be costly to resolve and may hurt our reputation and restrict our ability to service such organizations in the future. |
|
· |
Various state licensure, registration and certification laws are applicable to pharmacies, pharmacists, pharmacy technicians and other pharmacy personnel. If we are unable to maintain our licenses or if states place burdensome restrictions or limitations on non-resident pharmacies, this could limit or affect our ability to operate in some states. Additionally, if we or any of our personnel violate conditions of their pharmacy or pharmacist licensure, we could face penalties and lose valuable personnel. |
|
· |
A number of federal and state laws and registration requirements are applicable to purchase, handling, and dispensing controlled substances. If we are unable to maintain our registrations this could limit or affect our ability to purchase, handle, or dispense controlled substances and other violations of these laws could subject us to criminal or other sanctions. |
40
|
· |
Federal and state laws and policies require pharmacies to maintain, enroll and participate in federal healthcare programs or to report specified changes in their operations to the agencies that administer these programs. If we do not comply with these laws, we may not be able to participate in some federal healthcare programs, which could compromise our ability to sell our solutions. |
|
· |
A number of FDA regulations are applicable to our business. Some technologies and software applications used in healthcare analytics, genomic testing and analysis are considered medical devices and are subject to regulation by the FDA. If the FDA determines that any of our current or future services, technologies, or software applications are regulated by the FDA as medical devices, we would become subject to various laws, regulations and policies enforced by the FDA or other governmental authorities, including both premarket and post-market requirements, and we would need to bring the affected services, technologies, or software into compliance with such requirements. FDA and state regulators, such as state boards of pharmacy, also regulate drug packaging and repackaging. Our drug packaging activities must comply with the relevant FDA and state statutes, regulations and policies. Noncompliance with applicable FDA or state requirements, including those related to pharmaceutical and medical device promotional practices and the pre-market and post-market approval requirements for medical devices can result in an enforcement action that could substantially harm our business. Changes in existing regulatory requirements, our failure to comply with current or future requirements or adoption of new requirements could negatively affect our business. |
|
· |
Clinical laboratories that perform human genomic testing are subject to oversight by CMS and state regulators. If the laboratories that we partner with for genomic testing are not in compliance with the applicable CMS or state laws or regulations, they could be subject to enforcement action, which could negatively affect our business. |
Further modifications to the Medicare Part D program and changes in pricing benchmarks may reduce revenue and impose additional costs to the industry.
The Medicare Prescription Drug Improvement and Modernization Act of 2003 included a major expansion of the Medicare program with the addition of a prescription drug benefit under the new Medicare Part D program. The continued impact of these regulations depends upon a variety of factors, including our ongoing relationships with the Part D Plans and the patient mix of our clients. Future modifications to the Medicare Part D program may reduce revenue and impose additional costs to the industry. In addition, contracts and fee schedules in the prescription drug industry, including our contracts with certain of our clients use certain published benchmarks, including average wholesale price, or AWP, to establish pricing for prescription drugs. Most of our contracts utilize the AWP standard. However, there can be no assurance that our clients will continue to utilize AWP, as previously calculated, or that other pricing benchmarks will not be adopted to establish prices for prescription drugs within the industry.
Risks Related to Our Common Stock
Our executive officers, directors and principal stockholders, if they choose to act together, will continue to have the ability to control all matters submitted to stockholders for approval.
Our executive officers and directors, combined with our stockholders who own more than five percent of our outstanding capital stock, in the aggregate, beneficially own shares representing approximately 51% of our capital stock. As a result, if these stockholders were to choose to act together, they would be able to control all matters submitted to our stockholders for approval, as well as our management and affairs. For example, these persons, if they choose to act together, would control the election of directors and approval of any merger, consolidation or sale of all or substantially all of our assets. This concentration of ownership control may:
|
· |
delay, defer or prevent a change in control; |
|
· |
entrench our management and the board of directors; or |
|
· |
impede a merger, consolidation, takeover or other business combination involving us that other stockholders may desire. |
41
As a result, these executive officers, directors and current five percent or greater stockholders could pursue transactions that may not be in our best interests and which could harm our business.
Some provisions of Delaware law, our amended and restated certificate of incorporation and our amended and restated bylaws may deter third parties from acquiring us.
Our amended and restated certificate of incorporation and amended and restated bylaws were adopted in connection with our IPO and, among other things:
|
· |
divide our board of directors into three staggered classes of directors that are each elected to three-year terms; |
|
· |
provide that the authorized number of directors may be changed only by resolution of our board of directors; |
|
· |
provide that all vacancies, including newly created directorships, may, except as otherwise required by law, be filled by the affirmative vote of a majority of directors then in office, even if less than a quorum; |
|
· |
prohibit stockholder action by written consent; |
|
· |
authorize the issuance of "blank check" preferred stock that could be issued by our board of directors to increase the number of outstanding shares of capital stock, making a takeover more difficult and expensive; |
|
· |
prohibit cumulative voting in the election of directors, which would otherwise allow less than a majority of stockholders to elect director candidates; |
|
· |
provide that special meetings of the stockholders may be called only by or at the direction of the board of directors, the chairman of our board or the chief executive officer; and |
|
· |
require advance notice to be given by stockholders for any stockholder proposals or director nominees. |
Because we are incorporated in Delaware, we are governed by the provisions of Section 203 of the Delaware General Corporation Law, or the DGCL, which may discourage, delay or prevent someone from acquiring us or merging with us whether or not it is desired by or beneficial to our stockholders. Under the DGCL, a corporation may not, in general, engage in a business combination with any holder of 15% or more of its capital stock unless the holder has held the stock for three years or, among other things, the board of directors has approved the transaction.
These and other provisions could have the effect of discouraging, delaying or preventing a transaction involving a change in control of our company or could make it more difficult for you and other stockholders to elect directors of your choosing or to cause us to take other corporate actions that you desire.
Our amended and restated certificate of incorporation designates courts in the State of Delaware as the sole and exclusive forum for certain types of actions and proceedings that may be initiated by our stockholders, which could limit our stockholders' ability to obtain a favorable judicial forum for disputes with us or our directors, officers or employees.
Our amended and restated certificate of incorporation provides that, subject to limited exceptions, the Court of Chancery of the State of Delaware will be the sole and exclusive forum for (a) any derivative action or proceeding brought on our behalf, (b) any action asserting a claim of breach of a fiduciary duty owed by any of our directors, officers or other employees to us or our stockholders, (c) any action asserting a claim against us arising pursuant to any provision of the DGCL, our amended and restated certificate of incorporation or our amended and restated bylaws, (d) any action to interpret, apply, enforce or determine the validity of our amended and restated certificate of incorporation or amended and restated bylaws or (e) any other action asserting a claim against us that is governed by the internal affairs doctrine. We refer to each of these proceedings as a covered proceeding. In addition, our amended and restated certificate of incorporation provides that if any action the subject matter of which is a covered proceeding is filed in a court other than the specified Delaware courts without the approval of our board of directors, which we refer to as a foreign action, the claiming party will be deemed to have consented to (1) the personal jurisdiction of the specified
42
Delaware courts in connection with any action brought in any such courts to enforce the exclusive forum provision described above and (2) having service of process made upon such claiming party in any such enforcement action by service upon such claiming party's counsel in the foreign action as agent for such claiming party. Any person or entity purchasing or otherwise acquiring any interest in shares of our capital stock will be deemed to have notice of and to have consented to these provisions. These provisions may limit a stockholder's ability to bring a claim in a judicial forum that it finds favorable for disputes with us or our directors, officers or other employees, which may discourage such lawsuits against us and our directors, officers and employees. Alternatively, if a court were to find these provisions of our amended and restated certificate of incorporation inapplicable to, or unenforceable in respect of, one or more of the specified types of actions or proceedings, we may incur additional costs associated with resolving such matters in other jurisdictions.
An active trading market for our common stock may not develop.
Prior to the IPO, there was no public market for our common stock. The IPO price for our common stock was determined through negotiations with the underwriters. Although our common stock is now listed on the NASDAQ Global Market, an active trading market for our shares may never develop or be sustained following the IPO. If an active market for our common stock does not develop, it may be difficult for you to sell your shares quickly or at the market price. An inactive market may also impair our ability to raise capital by selling our common stock and may impair our ability to acquire other companies, products or technologies by using our common stock as consideration.
NASDAQ may delist our securities from its exchange, which could limit investors’ ability to make transactions in our securities and subject us to additional trading restrictions.
Our common stock is listed on the NASDAQ Global Market. We cannot assure you that, in the future, our securities will meet the continued listing requirements to be listed on the NASDAQ Global Market. If the NASDAQ Global Market delists our common stock, we could face significant material adverse consequences, including:
|
· |
a limited availability of market quotations for our securities; |
|
· |
a determination that our common stock is a “penny stock” which will require brokers trading in our common stock to adhere to more stringent rules and possibly resulting in a reduced level of trading activity in the secondary trading market for our common stock; |
|
· |
a limited amount of news and analyst coverage for our company; and |
|
· |
a decreased ability to issue additional securities or obtain additional financing in the future. |
If securities or industry analysts do not publish research or publish inaccurate or unfavorable research about our business, our stock price and trading volume could decline.
The trading market for our common stock depends in part on the research and reports that securities or industry analysts publish about us or our business. If few securities analysts commence coverage of us, or if industry analysts cease coverage of us, the trading price for our common stock could be negatively affected. If one or more of the analysts who cover us downgrade our common stock or publish inaccurate or unfavorable research about our business, our common stock price will likely decline. If one or more of these analysts fails to publish reports on us regularly, demand for our common stock could decrease, which might cause our common stock price and trading volume to decline.
The price of our common stock may be volatile and fluctuate substantially, which could result in substantial losses for purchasers of our common stock.
Our stock price is likely to be volatile. The stock market in general and the market for smaller healthcare technology companies in particular have experienced extreme volatility that has often been unrelated to the operating performance of particular companies. As a result of this volatility, you may not be able to sell your common stock at or above the initial purchase price. The market price for our common stock may be influenced by many factors, including:
|
· |
the success of competitive products, services or technologies; |
43
|
· |
regulatory or legal developments in the United States and other countries; |
|
· |
developments or disputes concerning patent applications, issued patents or other proprietary rights; |
|
· |
the recruitment or departure of key personnel; |
|
· |
the level of expenses related to developing any of our products or services; |
|
· |
the results of our efforts to discover, develop, acquire or in-license additional products; |
|
· |
actual or anticipated changes in estimates as to financial results, development timelines or recommendations by securities analysts; |
|
· |
variations in our financial results or those of companies that are perceived to be similar to us |
|
· |
changes in the structure of healthcare payment systems; |
|
· |
market conditions in the healthcare technology sector; |
|
· |
global and general economic, industry and market conditions; and |
|
· |
the other factors described in this "Risk Factors" section. |
We had broad discretion in the use of the net proceeds from our initial public offering and may not have used them effectively.
Our management had broad discretion in the application of the net proceeds from the IPO and could have spent the proceeds in ways that may not improve our results of operations or enhance the value of our common stock. The failure by our management to apply these funds effectively could result in financial losses that could harm our business, cause the price of our common stock to decline and delay further development of our products.
A significant portion of our total outstanding shares are eligible to be sold into the market in the near future, which could cause the market price of our common stock to drop significantly, even if our business is doing well.
Sales of a substantial number of shares of our common stock in the public market, or the perception in the market that the holders of a large number of shares intend to sell shares, could reduce the market price of our common stock. At February 28, 2017, we had outstanding a total of 17,073,067 shares of common stock. Of these shares, approximately 12,128,067 shares are currently restricted as a result of securities laws or lock-up agreements but will become eligible to be sold at various times after the IPO. Moreover, holders of an aggregate of 5,357,388 shares of our common stock have rights, subject to specified conditions, to require us to file registration statements covering their shares or, along with holders of additional shares of our common stock, to include their shares in registration statements that we may file for ourselves or other stockholders. We also intend to register all shares of common stock that we may issue under our equity compensation plans. Once we register these shares, they can be freely sold in the public market upon issuance, subject to volume limitations applicable to affiliates and the lock-up agreements.
We are an "emerging growth company," and the reduced disclosure requirements applicable to emerging growth companies may make our common stock less attractive to investors.
We are an "emerging growth company," as defined in the Jumpstart Our Business Startups Act of 2012, or the JOBS Act, and may remain an emerging growth company for up to five years. For so long as we remain an emerging growth company, we are permitted and intend to rely on exemptions from some disclosure requirements that are applicable to other public companies that are not emerging growth companies. These exemptions include:
|
· |
not being required to comply with the auditor attestation requirements in the assessment of our internal control over financial reporting; |
44
|
· |
not being required to comply with any requirement that may be adopted by the Public Company Accounting Oversight Board regarding mandatory audit firm rotation or a supplement to the auditor's report providing additional information about the audit and the financial statements; |
|
· |
reduced disclosure obligations regarding executive compensation; and |
|
· |
exemptions from the requirements of holding a nonbinding advisory vote on executive compensation and shareholder approval of any golden parachute payments not previously approved. |
We have taken advantage of reduced reporting burdens in this Annual Report on Form 10-K. We cannot predict whether investors will find our common stock less attractive if we rely on these exemptions. If some investors find our common stock less attractive as a result, there may be a less active trading market for our common stock and our stock price may be more volatile. In addition, the JOBS Act provides that an emerging growth company can take advantage of an extended transition period for complying with new or revised accounting standards. This allows an emerging growth company to delay the adoption of these accounting standards until they would otherwise apply to private companies. We have irrevocably elected not to avail ourselves of this exemption and, therefore, we will be subject to the same new or revised accounting standards as other public companies that are not emerging growth companies.
If we are unable to implement and maintain effective internal control over financial reporting in the future, investors may lose confidence in the accuracy and completeness of our financial reports and the market price of our common stock may be negatively affected.
As a public company, we are required to maintain internal control over financial reporting and to report any material weaknesses in such internal control. Section 404 of the Sarbanes-Oxley Act of 2002, or the Sarbanes-Oxley Act, requires that we evaluate and determine the effectiveness of our internal control over financial reporting, beginning with our annual report for the year ending December 31, 2017. Our independent registered public accounting firm is not required to audit the effectiveness of our internal control over financial reporting until after we are no longer an "emerging growth company," as defined in the JOBS Act. At such time, our independent registered public accounting firm may issue a report that is adverse in the event it is not satisfied with the level at which our internal control over financial reporting is documented, designed or operating.
If we have a material weakness in our internal control over financial reporting, we may not detect errors on a timely basis and our consolidated financial statements may be materially misstated. In connection with the audit for the year ended December 31, 2015, we identified certain deficiencies in our internal controls over financial reporting, including a material weakness in our internal control over financial reporting during 2015 related to the determination of the fair value of stock-based compensation, the redemption value of our preferred stock and the preferred stock warrant liability. Specifically, as part of the valuation process, we provided our third-party valuation specialist our consolidated forecast file, which included clerical errors which arose as a result of a lack of (i) adequate resources to conduct a more thorough review of a complex area of accounting and (ii) systems with built in controls to assist in the prevention of clerical errors. We took the following actions to remediate the internal control deficiencies identified: (I) added resources to the accounting organization; and (II) increased management oversight. We are also in the process of adding new accounting software that would significantly cut down on the potential for clerical errors. Our common stock began trading publicly on September 29, 2016 and, therefore, we are no longer required to estimate the fair value of our common stock. Additionally, upon completion of our IPO on October 4, 2016, the preferred stock automatically converted into shares of common stock and the preferred stock warrants automatically converted into warrants to purchase common stock and became equity-classified and are no longer subject to re-measurement at fair value. Accordingly, this material weakness does not exist at December 31, 2016. If we are unable to comply with the requirements of Section 404 in a timely manner, if we are unable to assert that our internal control over financial reporting is effective, or if our independent registered public accounting firm is unable to express an opinion as to the effectiveness of our internal control over financial reporting, investors may lose confidence in the accuracy and completeness of our financial reports, the market price of our common stock could be negatively affected and we could become subject to investigations by the NASDAQ Global Market, on which our securities are listed, the SEC or other regulatory authorities, which could require us to obtain additional financial and management resources.
45
The requirements of being a public company may strain our resources and distract our management, which could make it difficult to manage our business, particularly after we are no longer an "emerging growth company".
Following the completion of the IPO, we are required to comply with various regulatory and reporting requirements, including those required by the SEC and the NASDAQ Stock Market. Complying with these reporting and other regulatory requirements will be time-consuming and will result in increased costs to us. As a public company, we are subject to the reporting requirements of the Securities Exchange Act of 1934, or the Exchange Act, and the Sarbanes-Oxley Act. These requirements may place a strain on our systems and resources. The Exchange Act requires that we file annual, quarterly and current reports with respect to our business and financial condition. The Sarbanes-Oxley Act requires that we maintain effective disclosure controls and procedures and internal controls over financial reporting. To maintain and improve the effectiveness of our disclosure controls and procedures, we may need to commit significant resources, hire additional staff and provide additional management oversight. We are implementing additional procedures and processes for the purpose of addressing the standards and requirements applicable to public companies. Sustaining our growth as a public company will also require us to commit additional management, operational and financial resources to identify new professionals to join our company and to maintain appropriate operational and financial systems to adequately support expansion. These activities may also divert management's attention from other business concerns.
As an "emerging growth company" as defined in the JOBS Act, we take advantage of temporary exemptions from various reporting requirements, including, but not limited to, not being required to comply with the auditor attestation requirements of Section 404 of the Sarbanes-Oxley Act and reduced disclosure obligations regarding executive compensation in our periodic reports and proxy statements.
When these exemptions cease to apply, we expect to incur additional expenses and devote increased management effort toward ensuring compliance with them. We cannot predict or estimate the amount of additional costs we may incur as a result of becoming a public company or the timing of such costs.
Our business and stock price may suffer as a result of our lack of public company operating experience.
We were a privately held company since we were founded in 2009 until the completion of our IPO in October 2016. Our lack of public company operating experience may make it difficult to forecast and evaluate our future prospects. If we are unable to execute our business strategy, either as a result of our inability to effectively manage our business in a public company environment or for any other reason, our stock price may be harmed.
Because we do not anticipate paying any cash dividends on our capital stock in the foreseeable future, capital appreciation, if any, will be your sole source of gain.
We have never declared or paid cash dividends on our capital stock. We currently intend to retain all of our future earnings, if any, to finance the growth and development of our business. In addition, the terms of any future debt agreements may preclude us from paying dividends. As a result, capital appreciation, if any, of our common stock will be your sole source of gain for the foreseeable future.
Our ability to use our net operating loss carryforwards and certain other tax attributes may be limited.
Under Section 382 of the Internal Revenue Code of 1986, as amended, if a corporation undergoes an "ownership change," generally defined as a greater than 50% change (by value) in its equity ownership over a three-year period, the corporation's ability to use its pre-change federal net operating loss carryforwards, or NOLs, and other pre-change federal tax attributes (such as research tax credits) to offset its post-change income may be limited. We may experience ownership changes as a result of shifts in our stock ownership that could limit the use of our NOLs. State NOL carryforwards may be similarly or more stringently limited. As a result, if we earn net taxable income, our ability to use our pre-change NOLs to offset United States federal taxable income may be subject to limitations, which could potentially result in increased future tax liability to us.
Item 1B. Unresolved Staff Comments
None.
46
Our corporate headquarters is located in Moorestown, New Jersey, where we occupy 74,565 square feet of space under three lease agreements that expire in November 2027. At our corporate headquarters, 24,855 square feet is utilized for prospective medication risk management using our proprietary technology and pharmacy distribution services, including competitive-inhibition informed robotic adherence packaging. Another 24,855 square feet is utilized for office space. In January 2017, we began occupying an additional 24,855 square feet in Moorestown, New Jersey, for our Enhanced Medication Therapy Management call center pharmacists and technicians. In addition, as of December 31, 2016, we leased an aggregate of 18,584 square feet at the following locations: Boulder, Colorado; Charleston, South Carolina; San Francisco, California; St. Louis, Missouri; and Phoenix, Arizona. This includes 9,599 square feet dedicated to pharmacy dispensing in Boulder, Colorado and San Francisco, California. In addition, we have entered into a new lease for 4,792 square feet in South San Francisco dedicated to pharmacy dispensing that we began to occupy in February 2017, which replaced the 1,754 square feet of space we previously occupied there. The new lease agreement expires in May 2023. The aggregate amount of dispensing space for Boulder and South San Francisco as of February 2017 is 12,637 square feet. We also have entered into a new lease for 8,622 square feet of space in Charleston dedicated to a new software research and development center, which we expect to begin to occupy in the second quarter of 2017. The new lease will replace the 3,146 square feet of space that we currently occupy there.
We are not currently party to any material legal proceedings. From time to time, however, we may be a party to litigation and subject to claims in the ordinary course of business. Regardless of the outcome, litigation can have an adverse impact on us because of defense and settlement costs, diversion of management resources and other factors
Item 4. Mine Safety Disclosures
Not applicable.
Item 5. Market for Registrant’s Common Equity, Related Stockholder Matters and Issuer Purchases of Equity Securities
Market Information
Our common stock has been listed on the NASDAQ Global Market under the symbol “TRHC” since September 29, 2016. Prior to that date, there was no public trading market for our common stock. The following table sets forth for the periods indicated the high and low intraday sales prices per share of our common stock as reported on the NASDAQ Global Market.
|
|
|
Year Ended |
||||
|
|
|
December 31, 2016 |
||||
|
|
|
HIGH |
|
LOW |
||
|
3rd Quarter |
|
$ |
14.88 |
|
$ |
14.32 |
|
4th Quarter |
|
$ |
14.98 |
|
$ |
10.74 |
Holders
As of February 28, 2017, we had 159 holders of record of our common stock. The actual number of stockholders is greater than this number of record holders and includes stockholders who are beneficial owners but whose shares are held in street name by brokers and other nominees. This number of holders of record also does not include stockholders whose shares may be held in trust by other entities
47
Dividends
We have never declared or paid any cash dividend on our common stock. We currently intend to retain all of our future earnings, if any, generated by our operations for the development and growth of our business for the foreseeable future. The decision to pay dividends is at the discretion of our board of directors and depends upon our financial condition, results of operations, capital requirements, and other factors that our board of directors deems relevant.
Stock Performance Graph
The following graph compares the cumulative total stockholder return on our common stock between September 28, 2016, and December 31, 2016, to the cumulative total returns of the NASDAQ Health Care Index and the NYSE Composite Index over the same period. This graph assumes an investment of $100 at the IPO price of $12 on September 28, 2016, in our common stock, the NASDAQ Health Care Index and the NYSE Composite Index, and assumes the reinvestment of dividends, if any.
The comparisons shown in the following graph are based upon historical data. We caution that the stock price performance shown in the graph below is not necessarily indicative of, nor is it intended to forecast, the potential future performance of our common stock.
|
9/28/2016 |
9/30/2016 |
10/31/2016 |
11/30/2016 |
12/31/2016 |
||||||
|
Tabula Rasa Healthcare, Inc. |
$ |
100 |
$ |
119 |
$ |
97 |
$ |
116 |
$ |
125 |
|
NASDAQ Composite |
100 | 100 | 98 | 100 | 102 | |||||
|
NASDAQ Healthcare Index |
100 | 99 | 89 | 94 | 92 |
Sale of Unregistered Securities
On October 12, 2016, 288,324 shares of our common stock were issued upon the net exercise of outstanding warrants. The value of the shares issued was $3.9 million based upon the average price of our common stock for the 10 business days ending on, and including, the date of the issuance of such shares.
On November 15, 2016, 201,353 shares of our common stock were issued as stock consideration related to the September 2016 acquisition of certain assets, consisting primarily of intellectual property and software assets of 9176-1916 Quebec Inc. The value of the shares issued was $2.5 million based on the arithmetic average of the daily volume-weighted average price of our common stock for the 30 business days ending on, and including, the 30th business day
48
following the completion of the IPO. In addition, on December 29, 2016, 194,054 shares of common stock were issued as additional stock consideration related to the acquisition. The value of the shares issued was $2.5 million based on the arithmetic average of the daily volume-weighted average price of our common stock for the 30 business days ending on, and including, the 60th business day following the completion of the IPO.
The offer, sale, and issuance of the securities described above was deemed to be exempt from registration under the Securities Act in reliance on Section 4(a)(2) of the Securities Act or Regulation D promulgated thereunder as a transaction by an issuer not involving a public offering. The recipients of securities in these transactions acquired the securities for investment only and not with a view to or for sale in connection with any distribution thereof and appropriate legends were affixed to the securities issued in this transaction. The recipients of securities in these transactions were accredited investors and had adequate access, through employment, business or other relationships, to information about us.
Use of Proceeds from our Public Offering of Common Stock
On September 28, 2016, our registration statement on Form S-1 (File No. 333-208857) relating to our IPO became effective. Our IPO closed on October 4, 2016 at which time we issued 4,945,000 shares of our common stock, which included the exercise in full by the underwriters of their option to purchase up to 645,000 additional shares of common stock, at an initial offering price of $12.00 per share. We received net proceeds from the IPO of approximately $55.2 million, after deducting underwriting discounts of approximately $4.2 million, but before deducting offering costs paid by us. We incurred additional costs of approximately $4.0 million in connection with the offering, which when added to the underwriting discounts and commissions paid by us, amounts to total expenses of approximately $8.2 million. Thus, the net offering proceeds to us, after deducting underwriting discounts and offering expenses, were approximately $51.2 million. None of the expenses associated with the IPO were paid to directors, officers, persons owning 10% or more of any class of our equity securities, or any of our affiliates. Wells Fargo Securities and UBS Investment Bank acted as joint-book running managers for the offering. Piper Jaffray also acted as a book-runner and Baird and Stifel acted as co-managers for the offering.
At the closing of the IPO on October 4, 2016, we used a portion of the net proceeds from the offering as follows:
|
· |
approximately $33.9 million to ABC Funding, LLC, an affiliate of Summit Partners, L.P., to repay in full all outstanding amounts due under our July 1, 2016 term loan credit facility; and |
|
· |
approximately $0.3 million to Dr. John Durham and Mrs. Joanne Durham to repay in full all outstanding amounts due under our demand promissory note. |
Additionally, we have used $4.4 million of the net proceeds from the offering to pay the remaining portion of the cash purchase price for the acquisition, completed in September 2016, of primarily intellectual property and software assets, which were previously licensed by us, that are integrated in the MRM Matrix that became due and payable in November and December of 2016. The remainder of the net proceeds from the offering have been used for working capital and other general corporate purposes. The foregoing amounts represent the Company’s reasonable estimate of the amount of net offering proceeds applied to such activities instead of the actual amount of net offering proceeds used. None of the net proceeds were, directly or indirectly, paid to any of our directors, officers or their associates, or any person owning 10% or more of any class of our equity securities, or any of our affiliates. There was no material change in the planned use of proceeds from our IPO from that described in the Prospectus.
The following selected consolidated financial data for the years ended December 31, 2016, 2015, and 2014 and the selected consolidated balance sheet data as of December 31, 2016, 2015, and 2014 are derived from our audited consolidated financial statements. Our historical results are not necessarily indicative of the results to be expected in the future. The selected consolidated financial data should be read together with “Management’s Discussion and Analysis of
49
Financial Condition and Results of Operations”, our consolidated financial statements, related notes, and other financial information included elsewhere in this Annual Report on Form 10-K.
|
|
|
Year Ended |
|||||||
|
December 31, |
|||||||||
|
2016 |
2015 |
2014 |
|||||||
|
Consolidated Statement of Operations Data: |
|
|
|
|
|
|
|
|
|
|
Revenue: |
|
|
|
|
|
|
|
|
|
|
Product revenue |
|
$ |
79,446 |
|
$ |
60,060 |
|
$ |
46,878 |
|
Service revenue |
|
|
14,616 |
|
|
9,979 |
|
|
1,550 |
|
Total revenue |
|
|
94,062 |
|
|
70,039 |
|
|
48,428 |
|
Cost of revenue, exclusive of depreciation and amortization shown below: |
|
|
|
|
|
|
|
|
|
|
Product cost |
|
|
59,901 |
|
|
45,829 |
|
|
37,073 |
|
Service cost |
|
|
5,276 |
|
|
3,299 |
|
|
739 |
|
Total cost of revenue |
|
|
65,177 |
|
|
49,128 |
|
|
37,812 |
|
Gross profit |
|
|
28,885 |
|
|
20,911 |
|
|
10,616 |
|
Operating (income) expenses: |
|
|
|
|
|
|
|
|
|
|
Research and development |
|
|
3,811 |
|
|
2,877 |
|
|
1,660 |
|
Sales and marketing |
|
|
3,860 |
|
|
2,880 |
|
|
2,272 |
|
General and administrative |
|
|
11,831 |
|
|
7,115 |
|
|
3,970 |
|
Change in fair value of acquisition-related contingent consideration (income) expense |
|
|
(338) |
|
|
(2,059) |
|
|
790 |
|
Change in fair value of acquisition-related consideration expense |
|
|
55 |
|
|
— |
|
|
— |
|
Depreciation and amortization |
|
|
5,115 |
|
|
3,933 |
|
|
1,817 |
|
Total operating expenses |
|
|
24,334 |
|
|
14,746 |
|
|
10,509 |
|
Income from operations |
|
|
4,551 |
|
|
6,165 |
|
|
107 |
|
Other (income) expense: |
|
|
|
|
|
|
|
|
|
|
Change in fair value of warrant liability |
|
|
(639) |
|
|
2,786 |
|
|
269 |
|
Interest expense |
|
|
4,488 |
|
|
5,915 |
|
|
1,354 |
|
Loss on extinguishment of debt |
|
|
6,411 |
|
|
— |
|
|
— |
|
Total other expense |
|
|
10,260 |
|
|
8,701 |
|
|
1,623 |
|
Loss before income taxes |
|
|
(5,709) |
|
|
(2,536) |
|
|
(1,516) |
|
Income tax expense (benefit) |
|
|
541 |
|
|
328 |
|
|
(409) |
|
Net loss |
|
$ |
(6,250) |
|
$ |
(2,864) |
|
$ |
(1,107) |
|
Decretion (accretion) of redeemable convertible preferred stock |
|
|
2,439 |
|
|
(9,966) |
|
|
(3,884) |
|
Net loss attributable to common stockholders: |
|
|
|
|
|
|
|
|
|
|
Basic |
|
$ |
(3,811) |
|
$ |
(12,830) |
|
$ |
(4,991) |
|
Diluted |
|
$ |
(6,889) |
|
$ |
(12,830) |
|
$ |
(4,991) |
|
Net loss per share attributable to common stockholders: |
|
|
|
|
|
|
|
|
|
|
Basic |
|
$ |
(0.51) |
|
$ |
(2.97) |
|
$ |
(1.23) |
|
Diluted |
|
$ |
(0.59) |
|
$ |
(2.97) |
|
$ |
(1.23) |
|
Weighted average common shares outstanding: |
|
|
|
|
|
|
|
|
|
|
Basic |
|
|
7,486,131 |
|
|
4,318,779 |
|
|
4,052,590 |
|
Diluted |
|
|
11,591,210 |
|
|
4,318,779 |
|
|
4,052,590 |
|
|
|
|
|
|
|
|
|
|
|
|
Adjusted EBITDA (1) |
|
$ |
13,633 |
|
$ |
8,604 |
|
$ |
2,968 |
|
(1) |
Adjusted EBITDA is a non-GAAP financial measure. See "Management's Discussion and Analysis of Financial Condition and Results of Operations — Non-GAAP Financial Measures — Adjusted EBITDA " for our definition of Adjusted EBITDA, why we present Adjusted EBITDA, limitations on the usefulness of Adjusted EBITDA and a reconciliation of Adjusted EBITDA to net loss, the most nearly comparable GAAP measurement. |
50
|
|
|
As of December 31, |
|||||||
|
|
|
2016 |
|
2015 |
|
2014 |
|||
|
|
|
(amounts in thousands) |
|||||||
|
Consolidated Balance Sheet Data: |
|
|
|
|
|
|
|
|
|
|
Cash |
|
$ |
4,345 |
|
$ |
2,026 |
|
$ |
4,122 |
|
Working capital |
|
|
4,655 |
|
|
(39,440) |
|
|
(9,822) |
|
Total assets |
|
|
72,739 |
|
|
58,602 |
|
|
58,823 |
|
Line of credit |
|
|
— |
|
|
10,000 |
|
|
6,860 |
|
Long-term debt, including current portion |
|
|
1,746 |
|
|
13,956 |
|
|
15,110 |
|
Notes payable to related parties |
|
|
— |
|
|
250 |
|
|
1,014 |
|
Notes payable related to acquisition |
|
|
— |
|
|
15,620 |
|
|
14,350 |
|
Warrant liability |
|
|
— |
|
|
5,569 |
|
|
2,783 |
|
Total liabilities |
|
|
16,633 |
|
|
61,257 |
|
|
59,818 |
|
Total redeemable convertible preferred stock |
|
|
— |
|
|
28,973 |
|
|
19,007 |
|
Total stockholders’ equity (deficit) |
|
$ |
56,106 |
|
$ |
(31,628) |
|
$ |
(20,002) |
51
Item 7. Management’s Discussion and Analysis of Financial Condition and Results of Operations
The following discussion and analysis of our financial condition and results of operations should be read together with our consolidated financial statements and the related notes and other financial information included elsewhere in this Annual Report on Form 10-K. Some of the information contained in this discussion and analysis or set forth elsewhere in this report including information with respect to our plans and strategy for our business, includes forward-looking statements that involve risks and uncertainties. You should review the “Risk Factors” section of this report beginning for a discussion of important factors that could cause actual results to differ materially from the results described in or implied by the forward-looking statements contained in the following discussion and analysis.
Overview
We are a leader in providing patient-specific, data-driven technology and solutions that enable healthcare organizations to optimize medication regimens to improve patient outcomes, reduce hospitalizations, lower healthcare costs and manage risk. We deliver our solutions through a comprehensive suite of technology-enabled products and services for medication risk management, which includes bundled prescription fulfillment and reminder packaging services for client populations with complex prescription needs. We also provide risk adjustment services, which help our clients to properly characterize a patient's acuity, or severity of health condition, and optimize the associated payments for care, as well as pharmacy cost management services, which help our clients manage and optimize pharmacy spend.
Our suite of cloud-based software solutions provides prescribers, pharmacists and healthcare organizations with sophisticated and innovative tools to better manage the medication-related needs of their patients. We believe we offer the first prospective clinical approach to medication risk management, which is designed to increase patient safety and promote adherence to a patient's personalized medication regimen. Furthermore, our medication risk management technology helps healthcare organizations lower costs by reducing ADEs, enhancing quality of care and avoiding preventable hospital admissions. Our products and services are built around our novel and proprietary Medication Risk Mitigation Matrix (“MRM Matrix”), which enables optimization of a patient's medication regimen, involving personalizing medication selection, dosage levels, time-of-day administration and reducing the total medication burden by eliminating unnecessary prescriptions. The MRM Matrix analyzes a combination of clinical and pharmacology data, population-based algorithms and extensive patient-specific data, including medical history, lab results, medication lists and individual genomic data, to deliver "precision medicine." We provide software-enabled solutions that can be bundled with prescription fulfillment and reminder packaging services, which are informed by a patient's personalized MRM Matrix to increase adherence to a patient's optimized regimen, through our three prescription fulfillment pharmacies. Our prescription fulfillment pharmacies are strategically located to efficiently distribute medications nationwide for our clients and medications are packaged to promote adherence to their patients' personalized regimens and dosing schedules. Our team of clinical pharmacists is available to support prescribers at the point of care through our proprietary technology platform, including real-time secure messaging, with more than 136,000 messages exchanged during December 2016.
Our technology-driven approach to medication risk management represents an evolution from prevailing non-personalized approaches that primarily rely on single drug-to-drug interaction analysis. At the end of 2014 and 2015 we were serving 51 and 119 healthcare organizations, respectively, and as of December 31, 2016, this number had grown to 133 healthcare organizations that focus on populations with complex healthcare needs and extensive medication requirements.
Our total revenues for the years ended December 31, 2016, 2015, and 2014 were $94.1 million, $70.0 million, and $48.4 million, respectively. We incurred net losses of $6.3 million, $2.9 million, and $1.1 million for the years ended December 31, 2016, 2015, and 2014, respectively. Our adjusted EBITDA for the year ended December 31, 2016 was $13.6 million compared to $8.6 million and $3.0 million for the years ended December 31, 2015 and 2014, respectively. See "Non-GAAP Financial Measures — Adjusted EBITDA" for our definition of Adjusted EBITDA, why we present Adjusted EBITDA and a reconciliation of net losses to Adjusted EBITDA.
We face a variety of challenges and risks, which we will need to address and manage as we pursue our growth strategy. In particular, we will need to continue to innovate in the face of a rapidly changing healthcare landscape if we are to remain competitive. We will also need to effectively manage our growth, especially related to our expansion beyond the PACE and post-acute markets to other at-risk providers and payors. Our senior management continuously
52
focuses on these and other challenges, and we believe that our culture of innovation and our history of growth and expansion will contribute to the success of our business. We cannot, however, assure you that we will be successful in addressing and managing the many challenges and risks that we face.
Key Business Metrics
We regularly review a number of metrics, including the following key metrics, to evaluate and manage our business. These metrics are useful in evaluating our operating performance compared to that of other companies in our industry.
|
|
|
Year Ended |
|
|
|
|
|
|
||||
|
|
|
December 31, |
|
Change |
|
|||||||
|
|
|
2016 |
|
2015 |
|
$ |
|
% |
|
|||
|
|
|
(Dollars in thousands) |
|
|||||||||
|
Revenues |
|
$ |
94,062 |
|
$ |
70,039 |
|
$ |
24,023 |
|
34 |
% |
|
Net loss |
|
|
(6,250) |
|
|
(2,864) |
|
|
(3,386) |
|
(118) |
% |
|
Adjusted EBITDA |
|
|
13,633 |
|
|
8,604 |
|
|
5,029 |
|
58 |
% |
|
|
|
Year Ended |
|
|
|
|
|
|
||||
|
|
|
December 31, |
|
Change |
|
|||||||
|
|
|
2015 |
|
2014 |
|
$ |
|
% |
|
|||
|
|
|
(Dollars in thousands) |
|
|||||||||
|
Revenues |
|
$ |
70,039 |
|
$ |
48,428 |
|
$ |
21,611 |
|
45 |
% |
|
Net loss |
|
|
(2,864) |
|
|
(1,107) |
|
|
(1,757) |
|
(159) |
% |
|
Adjusted EBITDA |
|
|
8,604 |
|
|
2,968 |
|
|
5,636 |
|
190 |
% |
We monitor the key metrics set forth in the preceding table to help us evaluate trends, establish budgets, measure the effectiveness and efficiency of our operations and gauge our cash generation. We discuss Adjusted EBITDA in more detail in "Non-GAAP Financial Measures — Adjusted EBITDA." We also monitor revenue retention rate and client retention rate described as follows.
Revenue retention rate
We believe that our ability to retain revenue associated with new or existing client relationships is an indicator of the stability of our revenue base and the long-term value we provide to our clients. We assess our performance in this area using a metric we refer to as our revenue retention rate. We calculate our revenue retention rate at the end of each calendar year by dividing total revenue in the year from client contracts that have not renewed or have been terminated during the year by our total revenue for that year, and subtracting this quotient from 100%. Our annual revenue retention rate was 98%, 99%, and 95% for the years ended 2016, 2015, and 2014, respectively.
Client retention rate
We monitor our client retention rate as a measure for our overall business performance. We believe that our ability to retain clients is an indicator of the stability of our revenue base and the long-term value of our client relationships. We assess our performance in this area using a metric we refer to as our client retention rate. We calculate this rate by dividing the number of client terminations and client non-renewals during a calendar year by the total number of clients serviced during that year, and subtracting this quotient from 100%. Our annual client retention rate was 93%, 96%, and 97% for the years ended 2016, 2015, and 2014, respectively.
Factors Affecting our Future Performance
We believe that our future success will be dependent on many factors, including our ability to maintain and grow our relationships with existing clients, expand our client base, continue to enter new markets and expand our offerings to meet evolving market needs. While these areas present significant opportunity, they also present risks that we must manage to ensure successful results. See the section entitled "Risk Factors" for a discussion of certain risks and uncertainties that may impact our future success.
53
Recent Developments
Initial Public Offering
On October 4, 2016, we completed the IPO of our common stock pursuant to which we issued 4,300,000 shares of our common stock, plus the exercise of the underwriters’ option to purchase an additional 645,000 shares of common stock, at an issuance price of $12.00 per share. We received net proceeds of $55.2 million after deducting underwriting discounts and commissions of $4.2 million, but before deducting other offering expenses. Immediately prior to the completion of the IPO, all of the Company’s then outstanding Class A Non-Voting common stock and Class B Voting common stock, totaling 5,583,405 shares, were redesignated into shares of common stock, par value $.0001 per share, and all of the Company’s then outstanding convertible preferred stock converted into an aggregate of 5,089,436 million shares of common stock, par value $.0001 per share. Our common stock is listed on the NASDAQ Global Market under the symbol “TRHC.”
Acquisitions
In September 2016, we acquired certain assets, consisting primarily of intellectual property and software assets of 9176-1916 Quebec Inc. (an entity indirectly controlled by our Chief Scientific Officer, Jacques Turgeon). The intellectual property and software assets were previously licensed by us and are integrated into the MRM Matrix. The acquisition consideration consisted of cash consideration of up to $6.0 million, consisting of $1.0 million which was paid upon closing, $2.2 million paid on November 2, 2016, $2.2 million paid on December 9, 2016, and $600 thousand following the 12-month anniversary of the closing date of the acquisition, which is contingent upon no claims for indemnification being made pursuant to the purchase agreement. In addition to the cash consideration, the purchase price included $5.0 million worth of common stock, consisting of $2.5 million, or 201,353 shares, of common stock issued on November 15, 2016 and $2.5 million, or 194,054 shares, of common stock issued on December 29, 2016. The stock consideration issued on November 15, 2016 and on December 29, 2016 was calculated based on the arithmetic average of the daily volume-weighted average price of the Company’s common stock for the 30 business days ending on, and including, the 30th and 60th business day, respectively, following the completion of the IPO.
We account for acquisitions using the purchase method of accounting. We allocated the purchase price to the assets acquired, including intangible assets and liabilities assumed, based on estimated fair values at the date of the acquisition. The results of operations from the acquisition are included in our consolidated financial statements from the acquisition date.
Financing
On July 1, 2016 we amended our revolving line of credit, or the 2015 Line of Credit, which was entered into on April 29, 2015 with a lender pursuant to the terms of a loan and security agreement. The 2015 Line of Credit provides for borrowings in an aggregate amount up to $25.0 million to be used for general corporate purposes, including repayment of a prior line of credit. We initially borrowed $10.0 million under the 2015 Line of Credit. As of December 31, 2016, no amounts were outstanding under the 2015 Line of Credit. See "Liquidity and Capital Resources — Revolving Credit Facility" below for additional information with respect to the 2015 Line of Credit.
On July 1, 2016, we entered into a term loan facility with ABC Funding, LLC, an affiliate of Summit Partners, L.P., or the ABC Credit Facility. The proceeds of the initial term loan advance of $30.0 million under the ABC Credit Facility were used to repay all outstanding amounts under the promissory notes related to the acquisition of Medliance LLC, or the Medliance Notes, and loans entered into with Eastward Capital Partners V, L.P. and its affiliates in April 2014 and December 2014. At the closing of the IPO in October 2016, we used a portion of the net proceeds from the offering to repay in full all outstanding amounts due under the ABC Credit Facility and the ABC Credit Facility was subsequently terminated. See "Liquidity and Capital Resources — Term Loan Facility" below for additional information with respect to the ABC Credit Facility.
Enhanced Medication Therapy Management Program Development Opportunity
We have been selected to participate with a large, regional Medicare Part D Prescription Drug Plan, or Regional PDP, to develop and deliver an Enhanced Medication Therapy Management, or EMTM, program. We believe this EMTM program will address the requirements of the Part D Enhanced Medication Therapy Management Model test,
54
which the Centers for Medicare and Medicaid Innovation, or CMMI, proposed in September 2015 and recently approved.
The Part D EMTM model created by the Centers for Medicare & Medicaid Services, or CMS, is designed to test strategies to improve medication use among Medicare beneficiaries enrolled in Part D and to assess whether providing selected Regional PDPs with additional incentives and increased flexibility to design and implement innovative programs will better achieve the overall goals for EMTM programs.
We launched the EMTM program on January 1, 2017. To execute this EMTM program, we are using our MRM Matrix and certain other services to perform medication risk stratification and reviews and safety assessments of complex medication regimens, providing an innovative, alternative approach to pharmacotherapy to the 240,000 members of this Regional PDP, representing less than one percent of the entire eligible Part D market. In 2016, the number of individuals covered through Medicare Part D programs was nearly 41 million. We believe if we are successful in developing and delivering an EMTM program to the Regional PDP, we will be able to expand into a greater portion of the Part D market. There can be no assurances that our EMTM program will be successful or we will actually be able to expand this program as currently contemplated.
Components of Our Results of Operations
Revenue
Our revenue is derived from our product sales and service activities. For the years ended December 31, 2016, 2015, and 2014, product sales represented 84%, 86%, and 97% of our total revenue, respectively. For the years ended December 31, 2016, 2015, and 2014, service revenue represented 16%, 14%, and 3% of our total revenue, respectively.
Product Revenue
Our product revenue is primarily generated through our medication risk management contracts with healthcare organizations. Under these contracts, we provide a group of services including the use of our MRM Matrix technology that enables our pharmacists to prospectively optimize personalized medication regimens for each patient, prescription fulfillment, and reminder packing services. Historically, substantially all of our medication risk management clients have contracted for a bundled offering of our software-enabled solutions, prescription fulfillment and reminder packaging services. In 2016, we began providing medication risk management services utilizing our MRM Matrix technology alone, without the related fulfillment services, which we refer to as MRM Service Contracts. Revenue generated from MRM Service Contracts without prescription fulfillment and reminder packaging services is included as a component of our service revenue.
Under our bundled medication risk management contracts, revenue is generated through the following components:
Prescription medication revenue. We sell prescription medications directly to healthcare organizations through our prescription fulfillment pharmacies. Prescription medication fees are based upon the prices stated in client contracts for the prescription and include a dispensing fee. For the periods presented, substantially all of our product revenue has consisted of prescription medication revenue.
Per member per month, or PMPM, fees. We also receive a fixed monthly administrative fee for each member in the program contracted for medication risk management services.
Our revenue from prescription medication sales varies based on the number and mix of medications dispensed; however, based on our historical experience, patient populations at our clients do not generally decline over time, the number of medications per patient have been consistent following an initial onboarding period and the overall mix of medications dispensed is generally predictable. In addition, our dispensing fees vary directly with the volume of prescription medication sales each period. Our PMPM fees vary directly with the number of members serviced by our clients each month. Although revenue is generated from various sources, pricing and other key contractual terms are negotiated on a bundled basis.
55
Service Revenue
Our service revenue is generated by the risk adjustment and pharmacy cost management services that we provide to healthcare organizations. Our client contracts for these services generally include a PMPM fee for selected services, monthly subscription fees, initial set up fees and hourly consulting charges. PMPM fees vary directly with the number of members serviced by our clients each month under our risk adjustment contracts. Additionally, service revenue includes data and statistics fees we receive from medication manufacturers for the sale of medication utilization data we collect through our pharmacy cost management engagements, which is recognized when we receive such amounts due to the variable nature of payment amounts. In 2016, we began to generate service revenue related to our MRM Service Contracts, which were structured under a fixed fee arrangement. As noted above, PMPM fees associated with our medication risk management services are currently included in product revenue.
Cost of Revenue
Product Cost
Cost of product revenue includes all costs directly related to the bundled medication risk management offering, including costs relating to our pharmacists' collaboration on a patient's medication management, medication risk analysis and offering guidance to the prescriber based upon the assessment of the MRM Matrix and the individual patient's medical history, as well as the fulfillment and distribution of prescription medications. Costs consist primarily of the purchase price of the prescription medications we dispense. For the years ended December 31, 2016, 2015, and 2014 prescription medication costs represented 76%, 76%, and 75% of our total product costs, respectively. In addition to costs incurred for the prescription medications we dispense, other costs include expenses to package, dispense and distribute prescription medications, expenses associated with our clinical pharmacist support centers and prescription fulfillment centers, including employment costs and stock-based compensation, and expenses related to the hosting of our technology platform. Such costs also include direct overhead expenses, as well as allocated miscellaneous overhead costs. We allocate miscellaneous overhead costs among functions based on employee headcount.
Service Cost
Cost of service revenue includes all labor costs, including stock-based compensation expense, directly related to the risk adjustment and pharmacy cost management services and expenses for claims processing, technology services and overhead costs. In addition, service costs include all costs directly related to servicing our MRM Service Contracts which primarily consist of labor costs and consultant fees.
Research and Development Expenses
Our research and development expenses consist primarily of salaries and related costs, including stock-based compensation expense, for personnel in our research and development functions, which include software developers, project managers and other employees engaged in the development and enhancement of our service offerings. Research and development expenses also include costs for design and development of new software and technology and new service offerings, as well as enhancement of existing software and technology and service offerings, including fees paid to third-party consultants, costs related to quality assurance and testing, and other allocated facility-related overhead and expenses.
We continue to focus our research and development efforts on adding new features and applications, increasing the functionality and enhancing the ease of use of our existing suite of software solutions.
We capitalize certain costs incurred in connection with obtaining or developing internal-use software, including external direct costs of material and services and payroll costs for employees directly involved with the software development. Capitalized software costs are amortized beginning when the software project is substantially complete and the asset is ready for its intended use. Costs incurred during the preliminary project stage and post-implementation stage, as well as maintenance and training costs, are expensed as incurred as part of research and development expenses.
We expect our research and development expenses will increase in absolute dollars as we increase our research and development headcount to further strengthen and enhance our software solutions and service offerings, but will
56
decrease as a percentage of revenue in the long term as we expect our revenue to increase at a greater rate than such expenses.
Sales and Marketing Expenses
Sales and marketing expenses consist principally of salaries, commissions, bonuses, stock-based compensation and employee benefits for sales and marketing personnel, as well as travel costs related to sales, marketing and client service activities. Marketing costs also include costs of communication and branding materials, trade shows and public relations, as well as allocated overhead.
We expect our sales and marketing expenses to increase in absolute dollars as we strategically invest to grow our marketing operations and expand into new products and markets, but decrease as a percentage of revenue in the long term. We expect to hire additional sales personnel and related account management and sales support personnel as we continue to grow.
General and Administrative Expenses
General and administrative expenses consist principally of salaries and related costs for executives, administrative personnel and consultants, including stock-based compensation and travel expenses. Other general and administrative expenses include professional fees for legal, consulting and accounting services. General and administrative expenses are expensed when incurred.
We expect that our general and administrative expenses will increase as we expand our infrastructure and transition to a public company. These increases will likely include increased costs for director and officer liability insurance, costs related to the hiring of additional personnel and increased fees for directors, outside consultants, lawyers and investor relations. We also expect to incur significant costs to comply with corporate governance, internal controls and similar requirements applicable to public companies.
Remeasurement of Acquisition-related Contingent Consideration
We classify our acquisition-related contingent consideration as a liability. Acquisition-related contingent consideration is subject to remeasurement at each balance sheet date. Any change in the fair value of such acquisition-related contingent consideration is reflected in our consolidated statements of operations as a change in fair value of the liability. We will continue to adjust the carrying value of the acquisition-related contingent consideration until the contingency is finally determined.
Depreciation and Amortization Expenses
Depreciation and amortization expenses are primarily attributable to our capital investment in equipment and our capitalized software and acquisition-related intangibles.
Change in Fair Value of Warrant Liability
Warrants to purchase shares of our preferred stock are classified as warrant liabilities and recorded at fair value. This warrant liability is subject to remeasurement at each balance sheet date and we recognize any change in fair value in our consolidated statements of operations as a change in fair value of the warrant liability. Upon the completion of the IPO in October 2016, these warrants automatically converted into warrants to purchase shares of our common stock and the warrant liabilities were reclassified to additional paid-in capital, a component of stockholders' equity (deficit).
Interest Expense
Interest expense is primarily attributable to interest expense associated with our revolving credit facility, term loans, related party notes, capital lease obligations and acquisition-related notes. It also includes the amortization of discounts on debt and amortization of deferred financing costs related to these various debt arrangements.
57
Accretion (Decretion) of Redeemable Convertible Preferred Stock
The carrying values of Series A and Series A-1 redeemable convertible preferred stock were being accreted to their respective redemption values at each reporting period, from the date of issuance to the earliest date the holders can demand redemption. The carrying value of Series B redeemable convertible preferred stock was being accreted (decreted) to redemption value at each reporting period at the greater of (i) the original issuance price plus unpaid accrued dividends or (ii) the fair value of the redeemable convertible preferred stock. Upon the completion of the IPO in October 2016, our preferred stock automatically converted into shares of our common stock.
Results of Operations
Comparison of the Years Ended December 31, 2016 and 2015
The following table summarizes our results of operations for the years ended December 31, 2016 and 2015:
|
|
|
Year Ended December 31, |
|
Change |
|
|||||||
|
|
|
2016 |
|
2015 |
|
$ |
|
% |
|
|||
|
Revenue: |
|
|
|
|
|
|
|
|
|
|
|
|
|
Product revenue |
|
$ |
79,446 |
|
$ |
60,060 |
|
$ |
19,386 |
|
32 |
% |
|
Service revenue |
|
|
14,616 |
|
|
9,979 |
|
|
4,637 |
|
46 |
|
|
Total revenue |
|
|
94,062 |
|
|
70,039 |
|
|
24,023 |
|
34 |
|
|
Cost of revenue, exclusive of depreciation and amortization shown below: |
|
|
|
|
|
|
|
|
|
|
|
|
|
Product cost |
|
|
59,901 |
|
|
45,829 |
|
|
14,072 |
|
31 |
|
|
Service cost |
|
|
5,276 |
|
|
3,299 |
|
|
1,977 |
|
60 |
|
|
Total cost of revenue |
|
|
65,177 |
|
|
49,128 |
|
|
16,049 |
|
33 |
|
|
Gross profit |
|
|
28,885 |
|
|
20,911 |
|
|
7,974 |
|
38 |
|
|
Operating (income) expenses: |
|
|
|
|
|
|
|
|
|
|
|
|
|
Research and development |
|
|
3,811 |
|
|
2,877 |
|
|
934 |
|
32 |
|
|
Sales and marketing |
|
|
3,860 |
|
|
2,880 |
|
|
980 |
|
34 |
|
|
General and administrative |
|
|
11,831 |
|
|
7,115 |
|
|
4,716 |
|
66 |
|
|
Change in fair value of acquisition-related contingent consideration (income) |
|
|
(338) |
|
|
(2,059) |
|
|
(1,721) |
|
(84) |
|
|
Change in fair value of acquisition-related consideration expense |
|
|
55 |
|
|
— |
|
|
55 |
|
100 |
|
|
Depreciation and amortization |
|
|
5,115 |
|
|
3,933 |
|
|
1,182 |
|
30 |
|
|
Total operating expenses |
|
|
24,334 |
|
|
14,746 |
|
|
9,588 |
|
65 |
|
|
Income from operations |
|
|
4,551 |
|
|
6,165 |
|
|
(1,614) |
|
(26) |
|
|
Other (income) expense: |
|
|
|
|
|
|
|
|
|
|
|
|
|
Change in fair value of warrant liability |
|
|
(639) |
|
|
2,786 |
|
|
(3,425) |
|
(123) |
|
|
Interest expense |
|
|
4,488 |
|
|
5,915 |
|
|
(1,427) |
|
(24) |
|
|
Loss on extinguishment of debt |
|
|
6,411 |
|
|
— |
|
|
6,411 |
|
100 |
|
|
Total other expense |
|
|
10,260 |
|
|
8,701 |
|
|
1,559 |
|
18 |
|
|
Loss before income taxes |
|
|
(5,709) |
|
|
(2,536) |
|
|
(3,173) |
|
125 |
|
|
Income tax expense |
|
|
541 |
|
|
328 |
|
|
213 |
|
65 |
|
|
Net loss |
|
$ |
(6,250) |
|
$ |
(2,864) |
|
$ |
(3,386) |
|
(118) |
% |
Product Revenue
Product revenue increased $19.4 million, or 32%, from $60.1 million for the year ended December 31, 2015 to $79.4 million for the year ended December 31, 2016. The increase was primarily driven by organic growth in medication risk management, which represented approximately $13.9 million of the increase. Of that $13.9 million increase, $4.8 million was attributable to a full year of revenues earned from new customers acquired during 2015 and $909 thousand was attributable to new customers acquired during 2016, while the remaining $8.2 million was attributable to increased prescription fulfillment volume from existing customers. Medication mix of prescriptions filled and payor mix contributed to an additional $5.5 million of the overall increase in product revenue.
58
Service Revenue
Service revenue increased $4.6 million, or 46%, from $10.0 million for the year ended December 31, 2015 to $14.6 million for the year ended December 31, 2016. The increase is primarily attributable to $4.5 million recognized from two MRM Service Contracts for a year-end quality initiative with our EMTM partner. The increase was also attributable to a $1.5 million increase in revenue related to our risk adjustment services. Of this total increase, $1.3 million was attributable to organic growth with existing clients and $185 thousand was related to revenue generated from new risk adjustment clients. These increases were partially offset by a $1.5 million decrease related to our pharmacy cost management services as a result of the loss of certain customers as well as a reduction in manufacturer fees related to the sale of medication utilization data.
For the year ended December 31, 2016, service revenue is comprised of $4.9 million related to PMPM fees and subscription revenue related to risk adjustment services, and $5.2 million represented hourly consulting charges, setup fees and data and statistics revenue related to pharmacy cost management services. The remaining $4.5 million of our service revenue was related to the portion of our fixed fee arrangement we recognized under our MRM Service Contracts with our EMTM partner.
Cost of Product Revenue
Cost of product revenue increased $14.1 million, or 31%, from $45.8 million for the year ended December 31, 2015 to $59.9 million for the comparable period in 2016. This increase was largely driven by increased volume of revenue, which contributed $8.1 million to the change. Manufacturer price increases and medication mix of prescriptions filled for our clients' patients contributed an additional $2.5 million to the overall increase in the cost of product revenue. In addition, labor costs increased $1.9 million, which was primarily due to added pharmacy headcount, including additional pharmacists, technicians and support staff, to support our growth. Distribution charges also increased $797 thousand related to higher shipping volume for the medications we fulfilled for our clients' patients. In addition, rent expense increased $307 thousand as a result of the new office location for our headquarters and pharmacy.
Cost of Service Revenue
Cost of service revenue increased $2.0 million, or 60%, from $3.3 million for the year ended December 31, 2015 to $5.3 million for the year ended December 31, 2016. The increase was primarily attributable to $970 thousand of added labor costs and internal labor allocations primarily to support two MRM Service Contracts for a year-end quality initiative with our EMTM partner. The increase in cost of service revenue was also due to a $365 thousand increase in risk adjustment personnel costs and a $259 thousand increase in pharmacy cost management personnel costs primarily due to added headcount to support client growth and increased salaries and benefits for existing employees related to market adjustments and performance-based increases.
Research and Development Expenses
Research and development expenses increased $934 thousand, or 32%, from $2.9 million for the year ended December 31, 2015 to $3.8 million for the year ended December 31, 2016. The increase was primarily due to an increase in payroll and payroll-related costs for additional headcount as well as increases in salary and benefits for existing employees related to market adjustments and performance-based increases.
Sales and Marketing Expenses
Sales and marketing expenses increased $980 thousand, or 34%, from $2.9 million for the year ended December 31, 2015 to $3.9 million for the year ended December 31, 2016. The increase was primarily attributable to an increase in personnel costs, which increased $440 thousand from the prior year, related to added headcount and increases in salaries and benefits for existing employees related to market adjustments and performance-based increases. The increase in sales and marketing expense was also due to increased marketing efforts, including a $244 thousand increase in marketing consulting costs, and a $296 thousand increase in advertising and promotions, travel and entertainment expenses, and other marketing expenses related to our ongoing operations.
59
General and Administrative Expenses
General and administrative expenses increased $4.7 million, or 66%, from $7.1 million for the year ended December 31, 2015 to $11.8 million for the year ended December 31, 2016. The increase was primarily attributable to a $3.5 million increase in stock compensation costs primarily related to shares of restricted common stock that were granted to certain employees on September 28, 2016, and an increase in stock option expense as a result of stock options granted to employees during 2016. Personnel costs, including salaries and benefits primarily related to an increase in headcount to support the overall growth of our operations, also increased by $657 thousand. In addition, legal expenses increased $248 thousand as a result of increased legal services related to ongoing business matters and the acquisition of certain assets of 9176-1916 Quebec Inc. We also incurred an additional $157 thousand of costs related to employee training and professional development. General and administrative expenses also increased due to increased business insurance and rent expense as a result of the new office location for our headquarters. The increase in general and administrative expenses was partially offset by a decrease in finance and accounting professional fees of $320 thousand primarily related to higher professional services related to the IPO preparation incurred in 2015 that did not qualify for deferral.
Acquisition-related Contingent Consideration (Income)
During the year ended December 31, 2016, we recognized a $338 thousand remeasurement gain compared to a $2.1 million remeasurement gain during the year ended December 31, 2015, related to the decrease of contingent consideration associated with our acquisition of Medliance LLC, or Medliance. The gain recognized during 2016 was due to a decrease in projected revenue from existing customers, which reduced the amount of contingent consideration we expect to pay. The gain during the year ended December 31, 2015 was due to a decrease in projected revenue related to the loss of certain customers from Medliance, which reduced the amount of contingent consideration we expect to pay.
Acquisition-related Consideration Expense
During the year ended December 31, 2016, we recognized a $55 thousand expense related to the change in fair value between the acquisition date and payment dates of liability-classified stock consideration payable to the owners of 9176-1916 Quebec, Inc. related to the acquisition of certain intellectual property and software assets.
Depreciation and Amortization Expenses
Depreciation and amortization expenses increased $1.2 million, or 30%, from $3.9 million for the year ended December 31, 2015 to $5.1 million for the comparable period in 2016. This increase was due to a $884 thousand increase in amortization expense due to a $451 thousand increase in amortization of capitalized software related to new software functionality placed into service during the year ended December 31, 2016, and a $433 thousand increase in amortization expense of intangible assets, primarily related to intangible assets acquired from 9176-1916 Quebec Inc. Depreciation expense also increased by $298 thousand related to purchases of property, plant and equipment and leasehold improvements primarily related to our new office location for our headquarters.
Change in Fair Value of Warrant Liability
During the year ended December 31, 2016, we recognized $639 thousand of income for the change in fair value of warrant liability as compared to a $2.8 million charge during the year ended December 31, 2015. The change in fair value of our warrant liability for the year ended December 31, 2016 was due to a decrease in the fair value of our Series A-1 and Series B redeemable convertible preferred stock. The change in fair value of warrant liability for the year ended December 31, 2015 was due to an increase in the estimated fair value of our Series A-1 and Series B redeemable convertible preferred stock. Upon the completion of the IPO in October 2016, these warrants automatically converted into warrants to purchase shares of our common stock and the warrant liabilities were reclassified to additional paid-in capital, a component of stockholders' equity.
Interest Expense
Interest expense decreased $1.4 million, or 24%, for the year ended December 31, 2016 compared to the year ended December 31, 2015 primarily due to the repayment of the Medliance Notes, as well as the April 2014 Eastward
60
Loan and the December 2014 Eastward Loan, in July 2016. See Note 10 – Lines of Credit and Long-Term Debt for additional information.
Loss on extinguishment of debt
During 2016, the Company recognized a $6.4 million loss on extinguishment of debt. The loss on extinguishment of debt is comprised of a $5.1 loss recognized as a result of a prepayment premium and the recognition of the remaining unamortized finance costs in connection with repayment of all outstanding principal and interest of the ABC Credit Facility during the fourth quarter of 2016. In addition, we recognized a $1.4 million loss as a result of a prepayment premium and the recognition of the remaining unamortized discounts and finance costs on the April 2014 Eastward Loan and the December 2014 Eastward Loan in connection with the repayment of all outstanding principal and interest with the proceeds of the ABC Credit Facility, entered into on July 1, 2016. See Note 10 – Lines of Credit and Long-Term Debt for additional information.
Income Taxes
For the year ended December 31, 2016 and December 31, 2015, we recorded income tax expense of $541 thousand and $328 thousand, respectively, which resulted in an effective tax rate of (9.5%) and (12.9%), respectively. The expense for each period was primarily related to deferred tax expense associated with indefinite-lived deferred tax liabilities for goodwill amortization.
Comparison of the Years Ended December 2015 and 2014
The following table summarizes our results of operations for the years ended December 31, 2015 and 2014:
|
|
|
Year Ended December 31, |
|
Change |
|
|||||||
|
2015 |
2014 |
$ |
% |
|||||||||
|
Revenue: |
|
|
|
|
|
|
|
|
|
|
|
|
|
Product revenue |
|
$ |
60,060 |
|
$ |
46,878 |
|
$ |
13,182 |
|
28 |
% |
|
Service revenue |
|
|
9,979 |
|
|
1,550 |
|
|
8,429 |
|
544 |
|
|
Total revenue |
|
|
70,039 |
|
|
48,428 |
|
|
21,611 |
|
45 |
|
|
Cost of revenue, exclusive of depreciation and amortization shown below: |
|
|
|
|
|
|
|
|
|
|
|
|
|
Product cost |
|
|
45,829 |
|
|
37,073 |
|
|
8,756 |
|
24 |
|
|
Service cost |
|
|
3,299 |
|
|
739 |
|
|
2,560 |
|
346 |
|
|
Total cost of revenue |
|
|
49,128 |
|
|
37,812 |
|
|
11,316 |
|
30 |
|
|
Gross profit |
|
|
20,911 |
|
|
10,616 |
|
|
10,295 |
|
97 |
|
|
Operating (income) expenses: |
|
|
|
|
|
|
|
|
|
|
|
|
|
Research and development |
|
|
2,877 |
|
|
1,660 |
|
|
1,217 |
|
73 |
|
|
Sales and marketing |
|
|
2,880 |
|
|
2,272 |
|
|
608 |
|
27 |
|
|
General and administrative |
|
|
7,115 |
|
|
3,970 |
|
|
3,145 |
|
79 |
|
|
Change in fair value of acquisition-related contingent consideration (income) expense |
|
|
(2,059) |
|
|
790 |
|
|
(2,849) |
|
(361) |
|
|
Depreciation and amortization |
|
|
3,933 |
|
|
1,817 |
|
|
2,116 |
|
116 |
|
|
Total operating expenses |
|
|
14,746 |
|
|
10,509 |
|
|
4,237 |
|
40 |
|
|
Income from operations |
|
|
6,165 |
|
|
107 |
|
|
6,058 |
|
5,662 |
|
|
Other (income) expense: |
|
|
|
|
|
|
|
|
|
|
|
|
|
Change in fair value of warrant liability |
|
|
2,786 |
|
|
269 |
|
|
2,517 |
|
936 |
|
|
Interest expense |
|
|
5,915 |
|
|
1,354 |
|
|
4,561 |
|
337 |
|
|
Total other expense |
|
|
8,701 |
|
|
1,623 |
|
|
7,078 |
|
436 |
|
|
Loss before income taxes |
|
|
(2,536) |
|
|
(1,516) |
|
|
(1,020) |
|
(67) |
|
|
Income tax expense (benefit) |
|
|
328 |
|
|
(409) |
|
|
737 |
|
180 |
|
|
Net loss |
|
$ |
(2,864) |
|
$ |
(1,107) |
|
$ |
(1,757) |
|
(159) |
% |
61
Product Revenue
Product revenue increased $13.2 million, or 28%, from $46.9 million for the year ended December 31, 2014 to $60.1 million for the year ended December 31, 2015. The increase was primarily driven by organic growth in our core business, medication risk management, which represented $9.0 million of the increase. Of that $9.0 million increase, $3.9 million was attributable to new customers acquired year over year, while the remaining $5.1 million was attributable to increased prescription fulfillment volume from existing customers. Manufacturer price increases, medication mix we fulfilled for our clients' patients, and payor mix contributed to an additional $4.2 million of the overall increase in product revenue.
Service Revenue
Service revenue increased $8.4 million from $1.6 million for the year ended December 31, 2014 to $10.0 million for the year ended December 31, 2015, which was primarily the result of a $7.0 million increase related to our pharmacy cost management services associated with Medliance, which we acquired in December 2014. Of this increase, $595 thousand was related to 12 months of revenue from risk adjustment services related to Capstone for the period ended December 31, 2015 as compared to only eight months for the period ended December 31, 2014. Additionally, new risk adjustment customers acquired during 2015 contributed $372 thousand to the increase and growth in service revenue from existing customers contributed $415 thousand.
For the year ended December 31, 2015, service revenue was comprised of $4.2 million related to PMPM fees and subscription revenue related to risk adjustment services, and $5.8 million represented hourly consulting charges and data and statistics revenue related to pharmacy cost management services. In comparison, for the year ended December 31, 2014, revenue generated from our PMPM fees and subscription revenue was $1.4 million, while the remainder of the service revenue primarily related to hourly consulting charges and setup fees.
Cost of Product Revenue
Cost of product revenue increased $8.8 million, or 24%, from $37.1 million for the year ended December 31, 2014 to $45.8 million for the year ended December 31, 2015. This increase was largely driven by increased volume of revenue, which contributed $5.8 million to the change, while manufacturer price increases and medication mix we fulfilled for our clients' patients contributed $2.5 million to the overall increase in the cost of product revenue. In addition, labor costs increased $998 thousand, which was primarily due to added pharmacy headcount, including additional pharmacists, technicians and support staff, to support our growth, as well as a $482 thousand increase in distribution charges related to increased shipping volume for the medications we fulfilled for our clients' patients. Of this increase, $179 thousand was attributable to increases in other normal pharmacy operating costs. These increases were offset by more favorable rebates on wholesale product purchases of prescription medications. Specifically, we joined a purchasing group in the first quarter of 2014 and, as a result, were able to gain access to more favorable pricing, which decreased the cost of the prescription medications we purchased by $1.2 million.
Cost of Service Revenue
Cost of service revenue increased $2.6 million from $739 thousand for the year ended December 31, 2014 to $3.3 million for the year ended December 31, 2015. Of the $2.6 million increase, $1.9 million was attributable to pharmacy cost management services related to Medliance, which we acquired in December 2014, and $262 thousand was the result of risk adjustment services related to Capstone for the 12 months ended December 31, 2015 as compared to eight months for the period ended December 31, 2014. The remainder of the increase was attributable to added headcount to support growth of our risk adjustment services.
Research and Development Expenses
Research and development expenses increased $1.2 million, or 73%, from $1.7 million for the year ended December 31, 2014 to $2.9 million for the year ended December 31, 2015. The overall increase was primarily attributable to a $952 thousand increase in payroll and payroll-related costs. Additionally, $285 thousand of the increase was from expenses related to developing new Medliance product offerings.
62
Sales and Marketing Expenses
Sales and marketing expenses increased $608 thousand, or 27%, from $2.3 million for the year ended December 31, 2014 to $2.9 million for the year ended December 31, 2015. The increase was primarily attributable to a $245 thousand increase in personnel costs, including salaries and benefits, related to market adjustments as well as performance-based increases for our existing employees. The remaining portion of the increase was principally related to increased marketing efforts, in particular marketing events and conferences, which contributed approximately $115 thousand to the overall increase in such expenses. The increase in the period also included $164 thousand in sales and marketing expenses related to the ongoing operations of Capstone and Medliance, each of which we acquired in 2014.
General and Administrative Expenses
General and administrative expenses increased $3.1 million, or 79%, from $4.0 million for the year ended December 31, 2014 to $7.1 million for the year ended December 31, 2015. The increase was primarily attributable to a $1.2 million increase in personnel costs, including salaries and benefits, related to an increase in headcount to support the overall growth of our operations. Finance and accounting fees increased by $922 thousand as a result of higher costs related to preparation for the IPO that did not qualify for deferral. Additionally, the increase in the period included $834 thousand of general and administrative expenses related to the ongoing operations of Medliance, which we acquired in December 2014.
Acquisition-related Contingent Consideration Expense
During the year ended December 31, 2014, we recognized a $790 thousand remeasurement charge, as compared to a $2.1 million remeasurement gain during the year ended December 31, 2015, related to the contingent consideration associated with our acquisitions of St. Mary Prescription Pharmacy, or SMPP, Capstone and Medliance. The remeasurement gain recorded during the year ended December 31, 2015 was due to a decrease in expected revenue for Medliance due to the loss of certain customers in 2015, which reduced the amount of contingent consideration we expect to pay.
Depreciation and Amortization Expenses
Depreciation and amortization expenses increased $2.1 million, or 116%, from $1.8 million for the year ended December 31, 2014 to $3.9 million for the year ended December 31, 2015. This increase was primarily due to an increase of $1.8 million due to amortization expense related to acquisition-related intangibles, an increase in amortization expense of $134 thousand primarily due to capitalized internal-use software placed into service, and an increase in depreciation expense of $138 thousand primarily related to the continued capital investment in pharmacy and other equipment to support our medication adherence and fulfillment technology.
Change in Fair Value of Warrant Liability
During the year ended December 31, 2014, we recognized $269 thousand of expense for the change in fair value of warrant liability as compared to expense of $2.8 million during the year ended December 31, 2015. The change in fair value of warrant liability for the year ended December 31, 2015 was due to the increase in the fair value of our Series A-1 and Series B redeemable convertible preferred stock.
Interest Expense
Interest expense increased $4.6 million from $1.4 million for the year ended December 31, 2014 to $5.9 million for the year ended December 31, 2015. The increase was primarily attributable to interest payable and the amortization of debt discounts recorded in connection with various acquisition debt financing, including the Medliance Notes, in an aggregate amount of $4.6 million, slightly offset by a decrease in interest payments as a result of continued principal payments on notes previously outstanding.
63
Income Taxes
During the year ended December 31, 2015, we recognized expense of $328 thousand related to state income taxes and deferred income tax expense. For the year ended December 31, 2014, we recognized a $409 thousand income tax benefit. The income tax benefit was primarily the result of deferred tax liabilities that were recorded in connection with the acquisition of SMPP, which created a source of recoverability of a portion of previously reserved deferred tax assets.
NON-GAAP FINANCIAL MEASURES
Adjusted EBITDA
To provide investors with additional information about our financial results, we disclose Adjusted EBITDA, a non-GAAP financial measure. Adjusted EBITDA consists of net loss plus certain other expenses, which includes change in fair value of warrant liability, interest expense, loss on extinguishment of debt, provision (benefit) for income tax, depreciation and amortization, change in fair value of acquisition-related contingent consideration (income) expense, change in fair value of acquisition-related consideration expense, and stock-based compensation expense. We present Adjusted EBITDA because it is one of the measures used by our management and board of directors to understand and evaluate our core operating performance, and we consider it an important supplemental measure of performance. We believe this metric is commonly used by the financial community, and we present it to enhance investors' understanding of our operating performance and cash flows. We believe Adjusted EBITDA provides investors and other users of our financial information consistency and comparability with our past financial performance and facilitates period-to-period comparisons of operations.
Our management uses Adjusted EBITDA:
|
· |
as a measure of operating performance to assist in comparing performance from period to period on a consistent basis; |
|
· |
to prepare and approve our annual budget; and |
|
· |
to develop short- and long-term operational plans |
Adjusted EBITDA is not in accordance with, or an alternative to, measures prepared in accordance with GAAP. In addition, this non-GAAP measure is not based on any comprehensive set of accounting rules or principles. As a non-GAAP measure, Adjusted EBITDA has limitations in that it does not reflect all of the amounts associated with our results of operations as determined in accordance with GAAP. In particular:
|
· |
although depreciation and amortization are non-cash charges, the assets being depreciated and amortized may have to be replaced in the future, and Adjusted EBITDA does not reflect cash capital expenditure requirements for such replacements or for new capital expenditure requirements; |
|
· |
Adjusted EBITDA does not reflect cash interest income or expense; |
|
· |
Adjusted EBITDA does not reflect changes in, or cash requirements for, our working capital needs; |
|
· |
Adjusted EBITDA does not reflect the potentially dilutive impact of stock-based compensation; |
|
· |
Adjusted EBITDA does not reflect tax payments that may represent a reduction in cash available to us; and |
|
· |
other companies, including companies in our industry, may calculate Adjusted EBITDA or similarly titled measures differently, which reduces its usefulness as a comparative measure. |
Because of these and other limitations, you should consider Adjusted EBITDA alongside other GAAP-based financial performance measures, including various cash flow metrics, net income and our other GAAP financial results and not in isolation from, or as a substitute for, financial information prepared in accordance with GAAP. You should be
64
aware that in the future we may incur expenses that are the same as or similar to some of the adjustments in the presentation, and we do not intend to imply that our future results will be unaffected by unusual or non-recurring items.
The following is a reconciliation of Adjusted EBITDA to our net loss for the periods presented:
|
|
|
Year Ended December 31, |
|||||||
|
|
|
2016 |
|
2015 |
|
2014 |
|||
|
Reconciliation of net loss to Adjusted EBITDA |
|
|
|
|
|
|
|
|
|
|
Net loss |
|
$ |
(6,250) |
|
$ |
(2,864) |
|
$ |
(1,107) |
|
Add: |
|
|
|
|
|
|
|
|
|
|
Change in fair value of warrant liability |
|
|
(639) |
|
|
2,786 |
|
|
269 |
|
Interest expense |
|
|
4,488 |
|
|
5,915 |
|
|
1,354 |
|
Loss on extinguishment of debt |
|
|
6,411 |
|
|
— |
|
|
— |
|
Income tax expense (benefit) |
|
|
541 |
|
|
328 |
|
|
(409) |
|
Depreciation and amortization |
|
|
5,115 |
|
|
3,933 |
|
|
1,817 |
|
Change in fair value of acquisition-related contingent consideration (income) expense |
|
|
(338) |
|
|
(2,059) |
|
|
790 |
|
Change in fair value of acquisition-related consideration expense |
|
|
55 |
|
|
— |
|
|
— |
|
Stock-based compensation expense |
|
|
4,250 |
|
|
565 |
|
|
254 |
|
Adjusted EBITDA |
|
$ |
13,633 |
|
$ |
8,604 |
|
$ |
2,968 |
Adjusted Diluted Net Income (Loss) Per Share Attributable to Common Stockholders, or Adjusted Diluted EPS
Adjusted Diluted EPS excludes the impact of certain items and, therefore, has not been calculated in accordance with GAAP. We believe the exclusion of these items assists in providing a more complete understanding of our underlying operations results and trends and allows for comparability with our peer company index and industry and to be more consistent with our expected capital structure on a going forward basis. Our management uses this measure along with corresponding GAAP financial measures to manage our business and to evaluate our performance compared to prior periods and the marketplace. We define Adjusted Diluted EPS as net income (loss) attributable to common stockholders before accretion of redeemable convertible preferred stock, fair value adjustments related to the remeasurement of warrant liabilities, losses on the extinguishment of debt, fair value adjustments for acquisition-related contingent consideration, fair value adjustments for acquisition-related consideration, stock-based compensation expense, and the tax impact of those items expressed on a per share basis using weighted average diluted shares outstanding.
Adjusted Diluted EPS is a non-GAAP financial measure and should not be considered in isolation or as a substitute for financial information provided in accordance with GAAP. This non-GAAP financial measure may not be computed in the same manner as similarly titled measures used by other companies. In the future, we may incur expenses that are the same as or similar to some of the adjustments in the presentation, and we do not intend to imply that our future results will be unaffected by unusual or non-recurring items.
65
The following table reconciles net loss per share attributable to common stockholders on a diluted basis, the most directly comparable GAAP measure, to Adjusted Diluted EPS:
|
|
|
Year Ended December 31, |
||||||||||||||||
|
|
|
2016 |
|
2015 |
|
2014 |
||||||||||||
|
|
|
(In thousands except per share amounts) |
||||||||||||||||
|
Reconciliation of diluted net loss per share attributable to common shareholders to Adjusted Diluted EPS |
|
|
|
|
|
|
|
|
|
|
|
|
|
|
|
|
|
|
|
Net loss |
|
$ |
(6,250) |
|
|
|
|
$ |
(2,864) |
|
|
|
|
$ |
(1,107) |
|
|
|
|
Decretion (accretion) of redeemable convertible preferred stock |
|
|
2,439 |
|
|
|
|
|
(9,966) |
|
|
|
|
|
(3,884) |
|
|
|
|
Net income (loss) attributable to common stockholders, basic, and net income (loss) per share attributable to common stockholders, basic |
|
$ |
(3,811) |
|
$ |
(0.51) |
|
$ |
(12,830) |
|
$ |
(2.97) |
|
$ |
(4,991) |
|
$ |
(1.23) |
|
Decretion of redeemable convertible preferred stock |
|
|
(2,439) |
|
|
|
|
|
— |
|
|
|
|
|
— |
|
|
|
|
Revaluation of warrant liability |
|
|
(639) |
|
|
|
|
|
— |
|
|
|
|
|
— |
|
|
|
|
GAAP Net loss attributable to common stockholders, diluted, and net income (loss) per share attributable to common stockholders, diluted |
|
$ |
(6,889) |
|
$ |
(0.59) |
|
$ |
(12,830) |
|
$ |
(2.97) |
|
$ |
(4,991) |
|
$ |
(1.23) |
|
Adjustments: |
|
|
|
|
|
|
|
|
|
|
|
|
|
|
|
|
|
|
|
Accretion of redeemable convertible preferred stock |
|
|
— |
|
|
|
|
|
9,966 |
|
|
|
|
|
3,884 |
|
|
|
|
Change in fair value of warrant liability |
|
|
— |
|
|
|
|
|
2,786 |
|
|
|
|
|
269 |
|
|
|
|
Loss on extinguishment of debt |
|
|
6,411 |
|
|
|
|
|
— |
|
|
|
|
|
— |
|
|
|
|
Change in fair value of acquisition-related contingent consideration (income) expense |
|
|
(338) |
|
|
|
|
|
(2,059) |
|
|
|
|
|
790 |
|
|
|
|
Change in fair value of acquisition-related consideration expense |
|
|
55 |
|
|
|
|
|
— |
|
|
|
|
|
— |
|
|
|
|
Stock-based compensation expense |
|
|
4,250 |
|
|
|
|
|
565 |
|
|
|
|
|
254 |
|
|
|
|
Impact to income taxes (1) |
|
|
(972) |
|
|
|
|
|
871 |
|
|
|
|
|
(311) |
|
|
|
|
Adjusted net income (loss) attributable to common stockholders and Adjusted Diluted EPS |
|
$ |
2,517 |
|
$ |
0.19 |
|
$ |
(701) |
|
$ |
(0.07) |
|
$ |
(105) |
|
$ |
(0.01) |
|
(1) |
The impact to taxes was calculated using a normalized statutory tax rate applied to pre-tax income (loss) adjusted for the respective items above and then subtracting the tax provision as determined for GAAP purposes. |
The following table reconciles the diluted weighted average shares of common stock outstanding used to calculate net loss per share attributable to common stockholders on a diluted basis for GAAP purposes to the diluted weighted average shares of common stock outstanding used to calculate Adjusted Diluted EPS:
|
|
|
Year Ended |
|
||||
|
|
|
December 31, |
|
||||
|
|
|
2016 |
|
2015 |
|
2014 |
|
|
Weighted average shares of common stock outstanding |
|
7,486,131 |
|
4,318,779 |
|
4,052,590 |
|
|
Effect of potential dilutive securities: |
|
|
|
|
|
|
|
|
Dilutive effect from preferred stock and preferred stock warrants assuming conversion at beginning of the year |
|
4,105,079 |
|
— |
|
— |
|
|
Weighted average shares of common stock outstanding, diluted for GAAP |
|
11,591,210 |
|
4,318,779 |
|
4,052,590 |
|
|
Adjustments: |
|
|
|
|
|
|
|
|
Weighted average dilutive effect of stock options (1) |
|
1,614,815 |
|
— |
|
— |
|
|
Weighted average dilutive effect of common shares from stock warrants (1) |
|
206,614 |
|
— |
|
— |
|
|
Weighted average dilutive effect of restricted stock (1) |
|
43,294 |
|
— |
|
— |
|
|
Dilutive effect from preferred stock and preferred stock warrants assuming conversion (2) |
|
— |
|
5,351,815 |
|
5,212,626 |
|
|
Weighted average shares of common stock outstanding, diluted for Adjusted Diluted EPS |
|
13,455,933 |
|
9,670,594 |
|
9,265,216 |
|
|
(1) |
In computing Adjusted Diluted EPS, these common shares were excluded from the calculation of Adjusted Diluted EPS for periods with a non-GAAP net loss because including them would have had an anti-dilutive effect. |
|
(2) |
In computing Adjusted Diluted EPS, net income attributable to common stockholders was adjusted to eliminate the effects of outstanding preferred stock and preferred stock warrants. As such, the weighted average share amounts of these potentially dilutive securities were included in the computation of diluted net loss per share attributable to common stockholders for the years ended December 31, 2015, and 2014. |
66
Liquidity and Capital Resources
Historically, we have incurred net losses from our operations. We incurred net losses of $6.3 million, $2.9 million, and $1.1 million for the years ended December 31, 2016, 2015, and 2014, respectively. Our primary liquidity and capital requirements are for research and development, sales and marketing, general and administrative expenses, debt service obligations and strategic business acquisitions. We have funded our operations, working capital needs and investments with cash generated through operations, issuance of preferred stock and borrowings under our credit facilities. In addition, as a result of our IPO, we received $55.2 million of cash proceeds in October 2016, net of underwriting discounts and commissions, but before deducting other offering expenses, of which $33.9 million was used to repay debt and related accrued interest under our ABC Credit Facility, $2.2 million was used to make the second cash payment toward the acquisition of certain assets of 9176-1916 Quebec Inc., an additional $2.2 million was used to make the third cash payment toward the aforementioned acquisition, and $250 thousand was used to repay our related party note. The remainder of the net proceeds were used for working capital and other general corporate purposes. At December 31, 2016, we had cash of $4.3 million.
Summary of Cash Flows
The following table shows a summary of our cash flows for the years ended December 31, 2016, 2015, and 2014:
|
|
|
Year Ended |
|||||||
|
|
|
December 31, |
|||||||
|
|
|
2016 |
|
2015 |
|
2014 |
|||
|
Net cash provided by operating activities |
|
$ |
6,774 |
|
$ |
3,256 |
|
$ |
870 |
|
Net cash used in investing activities |
|
|
(10,896) |
|
|
(3,277) |
|
|
(14,916) |
|
Net cash provided by (used in) financing activities |
|
|
6,441 |
|
|
(2,075) |
|
|
12,141 |
|
Net increase (decrease) in cash |
|
$ |
2,319 |
|
$ |
(2,096) |
|
$ |
(1,905) |
Operating Activities
Net cash provided by operating activities was $6.8 million for year ended December 31, 2016 and consisted primarily of our net loss of $6.3 million, offset by the addition of noncash items of $16.6 million and changes in our operating assets and liabilities totaling $286 thousand, partially offset by cash payments of $3.9 million for imputed interest on debt. The noncash items primarily included depreciation and amortization expenses related to leasehold improvements, capital equipment, capitalized internal-use software development costs, and acquisition related intangibles of $5.1 million, amortization of deferred financing fees and debt discounts of $1.3 million, loss on extinguishment of debt of $6.4 million, and stock-based compensation expense of $4.3 million, which were partially offset by a decrease in the fair value of warrant liabilities of $639 thousand and a decrease in the fair value of the acquisition contingent consideration of $338 thousand. The significant factors that contributed to the change in operating assets and liabilities primarily included a net increase in accrued expenses and other long-term liabilities for deferred rent expense related to our new office location for our headquarters. Cash provided by operating activities was also impacted by a decrease in rebates receivable due to a new rebate program from our inventory vendors in 2016, which was partially offset by an increase in prepaid expenses and other assets due to the timing of payments associated with business insurance premiums, 2017 subscriptions and conferences, and deferred costs related to our EMTM program which launched in January 2017. Cash provided by operating activities was also offset by an increase in inventories and accounts receivable due to an increased customer base and higher sales volumes.
Net cash provided by operating activities was $3.3 million for the year ended December 31, 2015 and consisted primarily of our net loss of $2.9 million and decreases in cash from changes in our operating assets and liabilities totaling $1.4 million, which were more than offset by non-cash charges of $7.6 million, which were primarily attributable to depreciation and amortization expenses related to leasehold improvements, capital equipment and capitalized internal-use software development costs of $3.9 million, amortization of deferred financing fees and debt discount of $2.1 million, stock-based compensation expense of $565 thousand, the non-cash expense related to the revaluation of the warrant liability of $2.8 million partially offset by a gain of $2.1 million for the revaluation of acquisition-related contingent consideration. The significant factors that contributed to the decrease in cash from changes in operating assets and liabilities included increases in accounts receivable, inventories and prepaid expenses and other assets due to the increase in our product sales and the timing of payments associated with rent and 2016 conferences, partially offset by increases in accounts payable of $440 thousand primarily due to the timing of our vendor payments
67
and the purchase of prescription medications to build inventory that supports our increase in sales, and accrued expenses and other liabilities of $1.1 million due to the increase in accrued interest on acquisition-related notes payable, offset by a $610 thousand decrease primarily attributable to contingent considerations payments made in connection with the acquisition of Capstone in excess of the estimated amount accrued as of the acquisition date.
Net cash provided by operating activities was $870 thousand for the year ended December 31, 2014 and consisted primarily of our net loss of $1.1 million and changes in our operating assets and liabilities totaling $1.0 million, offset by noncash items of $3.0 million. The significant factors that contributed to the change in operating assets and liabilities included increases in accounts receivable, inventories and rebates receivable, which were directly related to the increase in product sales, partially offset by increases in accounts payable of $1.4 million and accrued expenses and other liabilities of $604 thousand, each of which was primarily due to the timing of our vendor payments and the purchase of prescription medications to build inventory to support our increase in sales. The noncash items primarily included depreciation and amortization expenses related to leasehold improvements, capital equipment and capitalized internal-use software development costs of $1.8 million, amortization of deferred financing fees of $259 thousand, stock-based compensation expenses of $254 thousand and an expense of $790 thousand for the revaluation of acquisition contingent consideration partially offset by deferred income tax benefit of $422 thousand. The income tax benefit was primarily the result of deferred tax liabilities that were recorded in connection with the acquisition of SMPP, which created a source of recoverability of a portion of previously reserved deferred tax assets.
Investing Activities
Net cash used in investing activities was $10.9 million for the year ended December 31, 2016 and reflects $5.4 million in payments related to the acquisition of certain assets of 9176-1916 Quebec Inc. and the acquisition-related consideration payments made during the fourth quarter of 2016, $3.8 million in purchases of property, equipment and leasehold improvements primarily related to our new office location for our headquarters, and $1.9 million in software development costs. Net cash used in investing activities was partially offset by a decrease of $200 thousand in restricted cash from the release of funds for the final acquisition consideration payment related to the acquisition of SMPP in 2014.
Net cash used in investing activities was $3.3 million for the year ended December 31, 2015 and reflects $2.4 million paid in connection with the acquisition of Medliance, along with $234 thousand in purchases of property and equipment and $940 thousand in software development costs, offset by a decrease of $300 thousand in restricted cash from the release of funds related to a contingent purchase price payment for the SMPP acquisition that was paid.
Net cash used in investing activities was $14.9 million for the year ended December 31, 2014 and consists of $13.4 million paid in connection with the acquisitions of SMPP, Capstone and Medliance, net of cash acquired, along with $230 thousand in purchases of property and equipment, a $500 thousand increase in restricted cash due to funds placed in escrow for the SMPP acquisition and $738 thousand in software development costs.
Financing Activities
Net cash provided by financing activities was $6.4 million for the year ended December 31, 2016 and consisted of $55.2 million of cash proceeds, net of underwriting costs, from our IPO, which was partially offset by $17.4 million in net repayments of long-term debt, the repayment of $14.3 million of notes payable related to the Medliance acquisition, and net repayments of $10 million of the 2015 Line of Credit. Net cash provided by financing activities was also offset by $3.4 million in payments for costs associated with the IPO, $2.1 million in payments of deferred and contingent purchase price consideration related to our SMPP and Medliance acquisitions, and $1.5 million in payments for debt financing costs.
Net cash used in financing activities of $2.1 million for the year ended December 31, 2015 and was primarily attributable to $2.2 million in payments of deferred and contingent purchase price consideration related to our SMPP and Capstone acquisitions, $481 thousand in payments of deferred costs associated with the IPO, and $69 thousand in payments for deferred financing costs, which were partially offset by net borrowings of $625 thousand under our various financing arrangements.
Net cash provided by financing activities was $12.1 million for the year ended December 31, 2014 and primarily reflect net borrowings under our various financing arrangements of $13.2 million offset by $212 thousand in
68
deferred financing costs and $927 thousand in payments of deferred and contingent purchase price consideration related to our SMPP acquisition.
Funding Requirements
Historically, we have incurred net losses since our inception and we had an accumulated deficit of $34.9 million as of December 31, 2016. As a result of the IPO, which closed on October 4, 2016, we are a publicly traded company and will incur significant legal, accounting and other expenses that we were not required to incur as a private company. In addition, the Sarbanes-Oxley Act, as well as rules adopted by the SEC and NASDAQ Stock Market, require public companies to implement specified corporate governance practices that were not applicable to us as a private company. We expect these rules and regulations will increase our legal and financial compliance costs and will make some activities more time-consuming and costly.
As a result of our IPO, we received $55.2 million of cash proceeds in October 2016, net of underwriting discounts and commissions, but before deducting other offering expenses, of which $33.9 million was used to repay debt and related accrued interest under our ABC Credit Facility, $2.2 million was used to make the second cash payment toward the acquisition of certain assets of 9176-1916 Quebec Inc., $2.2 million was used to make the third cash payment toward the aforementioned acquisition, and $250 thousand was used to repay our related party note to date. The remainder of the net proceeds were used for working capital and other general corporate purposes. We believe that our cash of $4.3 million as of December 31, 2016, borrowing capacity under our 2015 Line of Credit and cash flows from continuing operations, will be sufficient to fund our planned operations through at least March 31, 2018. Our ability to maintain successful operations will depend on, among other things, new business, the retention of clients and the effectiveness of sales and marketing initiatives
We may seek additional funding through public or private debt or equity financings. We may not be able to obtain financing on acceptable terms, or at all. The terms of any financing may adversely affect our stockholders. If we are unable to obtain funding, we could be forced to delay, reduce or eliminate our research and development programs, product portfolio expansion or commercialization efforts, which could adversely affect our business prospects. There is no assurance that we will be successful in obtaining sufficient funding on terms acceptable to us to fund continuing operations, if at all.
Revolving Credit Facility
In April 2015, we entered into the 2015 Line of Credit with Western Alliance, which was amended in July 2016, pursuant to which we can request up to $25.0 million in revolving advances. In April 2015, we borrowed $10.0 million under the 2015 Line of Credit of which $6.9 million was used to repay all outstanding amounts owed under the Loan and Security Agreement with Silicon Valley Bank entered into in December 2013, and $2.6 million was used to fund the final deferred payments associated with the acquisition of Capstone. During the year ended December 31, 2016, we made additional borrowings of $6.0 million under the 2015 Line of Credit of which $2.0 million were used to make the first contingent payment associated with the acquisition of Medliance LLC, or Medliance, and the final consideration payment related to the acquisition of SMPP; $1.5 million was drawn down in conjunction with the refinancing of our Medliance Notes and several of our term loans as discussed below; and $1.0 million was used to make the closing payment for the acquisition of certain assets of 9176-1916 Quebec Inc. Amounts outstanding under the 2015 Line of Credit bear interest at a variable rate based upon Western Alliance's prime rate plus 0.5% with Western Alliance's prime rate having a floor of 3.5%. Interest is payable monthly. The 2015 Line of Credit has a maturity date of July 1, 2018, and is secured by all of our personal property, whether presently existing or created or acquired in the future, as well as our intellectual property. As of December 31, 2016, we had no amounts outstanding under the 2015 Line of Credit.
The 2015 Line of Credit contains financial covenants, including covenants requiring us to maintain a minimum unrestricted cash and unused availability balance under the 2015 Line of Credit, a minimum monthly recurring revenue retention rate, measured quarterly, and a minimum EBITDA, measured quarterly. The 2015 Line of Credit also contains operating covenants, including covenants restricting our ability to effect a sale of any part of our business, merge with or acquire another company, incur additional indebtedness, encumber or assign any right to or interest in our property, pay dividends or other distributions, make certain investments, transact with affiliates outside of the ordinary course of business and incur annual capital expenditures in excess of $2.5 million. The 2015 Line of Credit contains customary events of default, including upon the occurrence of a payment default, a covenant default, a material adverse change, our
69
insolvency and judgments against us in excess of $250 thousand that remain unsatisfied for 30 days or longer. The 2015 Line of Credit provides for a ten day cure period for a covenant breach, which may be extended to up to 30 days in certain circumstances. As of December 31, 2016, we were in compliance with all of the financial covenants related to the 2015 Line of Credit and expect to remain in compliance with such covenants.
Term Loan Facility
In July 2016, we entered into the ABC Credit Facility with ABC Funding, an affiliate of Summit Partners, L.P. The proceeds of the initial term loan advance of $30 million under ABC Credit Facility were used to repay all outstanding amounts under the Medliance Notes, repay the December 2014 Eastward Loan and the April 2014 Eastward Loan. Amounts outstanding under the ABC Credit Facility bore interest at a per annum rate equal to 12.0%, payable monthly in arrears. The ABC Credit Facility had a maturity date of December 30, 2021, and was secured by a subordinated security interest in all of our personal property, whether presently existing or created or acquired in the future, as well as our intellectual property. At the closing of the IPO, we used a portion of the net proceeds from the offering to repay in full all outstanding amounts due under the ABC Credit Facility and the ABC Credit Facility has been terminated.
Cumulative Preferred Stock Dividends
All accumulated dividends were forfeited upon conversion of our preferred stock into shares of our common stock, which occurred immediately prior to the consummation of the IPO on October 4, 2016.
Contractual Obligations and Commitments
The following summarizes our significant contractual obligations as of December 31, 2016
|
|
|
Payments due by period |
|||||||||||||
|
|
|
|
|
|
Less |
|
|
|
|
|
|
|
More |
||
|
|
|
|
|
|
than 1 |
|
|
|
|
|
|
|
than 5 |
||
|
|
|
Total |
|
year |
|
1-3 years |
|
3-5 years |
|
years |
|||||
|
|
|
|
(In thousands) |
||||||||||||
|
Contingent consideration payments (1) |
|
$ |
3,008 |
|
$ |
1,493 |
|
$ |
1,515 |
|
$ |
— |
|
$ |
— |
|
Acquisition consideration payment (2) |
|
|
600 |
|
|
600 |
|
|
— |
|
|
— |
|
|
— |
|
Inventory purchase obligation (3) |
|
|
49,000 |
|
|
21,000 |
|
|
28,000 |
|
|
— |
|
|
— |
|
Capital leases (4) |
|
|
2,078 |
|
|
868 |
|
|
1,180 |
|
|
30 |
|
|
— |
|
Operating leases (5) |
|
|
20,808 |
|
|
1,873 |
|
|
3,955 |
|
|
3,989 |
|
|
10,991 |
|
Letter of credit (6) |
|
|
500 |
|
|
— |
|
|
— |
|
|
— |
|
|
500 |
|
Total |
|
$ |
75,994 |
|
$ |
25,834 |
|
$ |
34,650 |
|
$ |
4,019 |
|
$ |
11,491 |
|
(1) |
Contingent consideration represents the estimated future cash payments as of December 31, 2016 related to our acquisition of Medliance in 2014. In accordance with the Medliance purchase agreement, the maximum contingent payments which could be payable is $5,684. |
|
(2) |
Acquisition consideration represents the final cash payment due related to our acquisition of certain assets of 8176-1916 Quebec, Inc. The final payment is due on the 12-month anniversary of the acquisition date, which was September 15, 2016. |
|
(3) |
Effective March 2016, we entered into a prime vendor agreement with AmerisourceBergen to provide us with the pharmaceutical products we sell. The contract commits us to a monthly minimum purchase obligation of approximately $1.75 million and expires on April 30, 2019. |
|
(4) |
Capital lease obligations represent future lease payments for equipment including interest. |
|
(5) |
The operating lease obligations represent future lease payments for office space. |
|
(6) |
We are contingently liable for $500 under an outstanding letter of credit related to our lease agreement for our corporate headquarters in Moorestown, NJ. The letter of credit renews annually and expires in September 2027. |
Our existing office lease agreements provide us with the option to renew and generally provide for rental payments on a graduated basis. Our future operating lease obligations would change if we entered into additional operating lease agreements as we expand our operations. The contractual commitment amounts in the table above are associated with agreements that are enforceable and legally binding and that specify all significant terms, including fixed or minimum services to be used, fixed, minimum or variable price provisions and the approximate timing of the transaction.
70
Off-Balance Sheet
During the periods presented, we did not have any off-balance sheet arrangements, as defined by applicable SEC rules and regulations.
Critical Accounting Policies and Significant Judgments and Estimate
We base this management's discussion and analysis of our financial condition and results of operations on our consolidated financial statements, which we have prepared in accordance with generally accepted accounting principles in the United States, or GAAP. The preparation of our consolidated financial statements requires us to make estimates and judgments that affect the reported amounts of assets, liabilities, revenue and expenses and the disclosure of contingent assets and liabilities in our consolidated financial statements. We evaluate our estimates and judgments, including those related to: (i) the fair value of assets acquired and liabilities assumed for business combinations, (ii) the valuation of our common stock and preferred stock, (iii) the recognition and disclosure of contingent liabilities, (iv) the useful lives of long-lived assets (including definite-lived intangible assets), (v) the evaluation of revenue recognition criteria, (vi) assumptions used in the Black-Scholes option-pricing model to determine the fair value of equity and liability classified warrants and stock-based compensation instruments and (vii) the realizability of long-lived assets including goodwill and intangible assets. We base our estimates on historical experience, known trends and events and various other factors that we believe to be reasonable under the circumstances, the results of which form the basis for making judgments about the carrying values of assets and liabilities that are not readily apparent from other sources. Actual results may differ from these estimates under different assumptions or conditions. You should consider your evaluation of our financial condition and results of operations with these policies, judgments and estimates in mind.
While we describe our significant accounting policies in the notes to our consolidated financial statements appearing elsewhere in this Annual Report on Form 10-K, we believe the following accounting policies are the most critical to the judgments and estimates we use in the preparation of our consolidated financial statements.
Revenue Recognition
We recognize revenue from product sales or services rendered when (i) persuasive evidence of an arrangement exists, (ii) services have been rendered, (iii) the price to our client is fixed or determinable and (iv) collectability is reasonably assured.
When we enter into arrangements with multiple deliverables, we apply the accounting guidance for revenue arrangements with multiple deliverables and evaluate each deliverable to determine whether it represents a separate unit of accounting based on the following criteria: (i) whether the delivered item has value to the client on a standalone basis, and (ii) if the contract includes a general right of return relative to the delivered item, delivery or performance of the undelivered item(s) is considered probable and substantially in our control. Revenue is allocated to each element in an arrangement based on a selling price hierarchy. The selling price for a deliverable is based on estimated selling prices, or ESP, as vendor specific objective evidence or third party evidence is not available. We establish ESP for the elements of our arrangements based upon our pricing practices and class of client. The stated prices for the various deliverables of our contracts are consistent across classes of clients.
Product Revenue
We enter into multiple-element arrangements with healthcare organizations to provide software-enabled medication risk management solutions. Under these contracts, revenue is generated through the following components:
Prescription medication revenue
We sell prescription medications directly to healthcare organizations through our prescription fulfillment pharmacies. Prescription medication fees are based upon the prices stated in client contracts for the prescription and include a dispensing fee. Prescription medications are considered a separate unit of accounting. Prescription medication revenue, including dispensing fees, is recognized when the product is shipped to the client. For the periods presented, substantially all of our product revenue has been in the form of prescription medication revenue.
71
Per member per month fees — medication risk management services
We receive a fixed monthly administrative fee for each member in the program contracted for medication risk management services. This fee, which is included in product revenue in our income statement, is recognized on a monthly basis as medication risk management services are provided. The services associated with the per member per month fees are considered a separate unit of accounting.
Service Revenue
We enter into contracts with healthcare organizations to provide (i) risk adjustment services and (ii) pharmacy cost management services, which include training client staff and providers about documentation and diagnosis coding, analyzing clients' data collection and submission processes and delivering meaningful analytics for understanding reimbursement complexities. In 2016, we began providing medication risk management services utilizing our MRM Matrix technology alone, without the related fulfillment services, which we refer to as MRM Service Contracts. These MRM Service Contracts were structured under a fixed fee arrangement, which provided for all performance obligations to be completed by December 31, 2016.
Under the risk adjustment contracts and MRM Service Contracts, there are generally three revenue generating components:
Set up fees
Our contracts with our risk adjustment and MRM Service Contract clients often require clients to pay non-refundable set up fees, which are deferred and recognized over the estimated term of the contract. These fees are charged at the beginning of the client relationship as compensation for our efforts to prepare the client and configure its system for the data collection process. The set up activities do not represent a separate unit of accounting as they do not have value apart from the broader risk adjustment and MRM Service Contracts. Incremental direct costs associated with the set up activities are also deferred and amortized over the shorter of the estimated customer life or stated contract period.
Per member per month fees
We receive a fixed monthly fee for each member in the program contracted for risk adjustment and MRM services. These services represent a separate unit of accounting and are offered independently from any other services. Revenue for these services is recognized each month as the related services are performed.
Hourly consulting fees
We sometimes contract with clients to perform various other services. Such services are billed on a time and materials basis, at agreed hourly rates. Consulting services represent a separate unit of accounting and are offered independently from any other services. Revenue for these services is recognized as time is incurred on the project.
Our pharmacy cost management services include subscription revenue from clients and revenues from drug manufacturers for the sale of drug utilization data. Subscription revenue is recognized monthly as either a flat fee or as a percentage of monthly transactions incurred. Data and statistics fees from drug manufacturers are recognized as revenue when received due to the unpredictable nature of the payment amounts and because fees are not fixed and determinable until received.
Business Combinations and Contingent Consideration
Acquired businesses are accounted for using the purchase method of accounting, which requires that the purchase price be allocated to the net assets acquired at their respective fair values. Any excess of the purchase price over the estimated fair values of the net assets acquired is recorded as goodwill. Amounts allocated to contingent consideration are recorded to the balance sheet at the date of acquisition based on their relative fair values. The purchase price allocation requires us to make significant estimates and assumptions, especially at the acquisition date, with respect to intangible assets. Although we believe the assumptions and estimates we have made are reasonable, they are based in part on historical experience and information obtained from the management of the acquired companies and are inherently uncertain.
72
We account for contingent consideration in accordance with applicable guidance provided within the business combination accounting rules. As part of our consideration for the SMPP, Capstone and Medliance acquisitions, we were and are contractually obligated to pay certain consideration resulting from the outcome of future events. Therefore, we are required to update our underlying assumptions each reporting period, based on new developments, and record such contingent consideration liabilities at fair value until the contingency is resolved. Changes in the fair value of the contingent consideration liabilities are recognized each reporting period and included in our consolidated statements of operations.
Examples of critical estimates used in valuing certain intangible assets and contingent consideration include:
|
· |
future expected cash flows from sales, and acquired developed technologies; |
|
· |
the acquired company's trade name and customer relationships as well as assumptions about the period of time the acquired trade name and customer relationships will continue to be used in the combined company's portfolio; |
|
· |
the probability of meeting the future events; and |
|
· |
discount rates used to determine the present value of estimated future cash flows. |
These estimates are inherently uncertain and unpredictable, and if different estimates were used the purchase price for the acquisition could be allocated to the acquired assets and liabilities differently from the allocation that we have made. In addition, unanticipated events and circumstances may occur, which may affect the accuracy or validity of such estimates, and if such events occur we may be required to record a charge against the value ascribed to an acquired asset or an increase in the amounts recorded for assumed liabilities.
Warrant Liability
We classified our warrants to purchase shares of our preferred stock as a warrant liability, which we recorded at fair value. We estimated the warrant fair values using the option pricing method as discussed in the American Institute of Certified Public Accountants, Audit and Accounting Practice Aid Series: Valuation of Privately Held Company Equity Securities Issued as Compensation, or the AICPA Practice Guide. The option pricing method treats securities as options based on the enterprise's value, with exercise prices based on the liquidation preferences set forth in the terms of the underlying stock, option or warrant agreements. Preferred stock, common stock, options and warrants are treated as call options that give the holder the right to buy the underlying net assets at a predetermined price or "strike" price at a liquidity event. The option pricing method considers the various terms of the stockholder agreements and implicitly considers the effect of the liquidation preference as of the appropriate date in the future and uses the Black-Scholes model to price the call option.
The significant inputs, which we estimated as part of this method, included the expected term of the warrants, expected volatility and the estimated fair value of the underlying share of preferred stock. Because we did not have sufficient history to estimate the expected volatility of our stock price, expected volatility was based on the average volatility of peer public entities that are similar in size and industry. We estimated the expected term of the warrants based on the timing of anticipated future liquidity events. The risk-free rate was based on the U.S. Treasury yield curve equal to the expected term of the warrant as of the measurement date. These warrant liabilities were subject to remeasurement at each balance sheet date, and we recognized any change in fair value in our statements of operations as a change in fair value of the derivative liability. Upon the closing of the IPO on October 4, 2016, the warrants converted into shares to purchase common stock and the warrant liability was reclassified to additional paid-in capital, a component of stockholders' equity.
Goodwill
Goodwill consists of the excess purchase price over fair value of net tangible and intangible assets acquired. Goodwill is not amortized, but tested for impairment annually. GAAP provides an entity an option to perform a qualitative assessment to determine whether it is more-likely than-not that the fair value of a reporting unit is less than its carrying amount prior to performing the two-step goodwill impairment test. If this is the case, the two-step goodwill
73
impairment test is required. If it is more-likely than-not that the fair value of a reporting unit is greater than its carrying amount, the two-step goodwill impairment test is not required. If the two-step goodwill impairment test is required, first, the fair value of the reporting unit is compared with its carrying amount (including goodwill). If the fair value of the reporting unit is less than its carrying amount, an indication of goodwill impairment exists for the reporting unit and the entity must perform step two of the impairment test (measurement). Under step two, an impairment loss is recognized for any excess of the carrying amount of the reporting units' goodwill over the implied fair value of that goodwill. The implied fair value of goodwill is determined by allocating the fair value of the reporting unit in a manner similar to a purchase price allocation and the residual fair value after this allocation is the implied fair value of the reporting unit goodwill.
Factors we generally consider important in our qualitative assessment that could trigger a step-two impairment test include significant underperformance relative to expected operating trends, significant changes in the way assets are used, underutilization of our tangible assets, discontinuance of certain products by us or by our clients, changes in the competitive environment and significant negative industry or economic trends.
Impairment of Long-Lived Assets Including Other Intangible Assets
Long-lived assets consist of property and equipment, software development costs and definite-lived intangible assets. Long-lived assets to be held and used are tested for recoverability whenever events or changes in business circumstances indicate that the carrying amount of the assets may not be fully recoverable. Factors that we consider in deciding when to perform an impairment review include significant underperformance of the business in relation to expectations, significant negative industry or economic trends and significant changes or planned changes in the use of the assets. If an impairment review is performed to evaluate a long-lived asset for recoverability, we compare forecasts of undiscounted cash flows expected to result from the use and eventual disposition of the long-lived asset to its carrying value. An impairment loss would be recognized when estimated undiscounted future cash flows expected to result from the use of an asset are less than its carrying amount. The impairment loss would be based on the excess of the carrying value of the impaired asset over its fair value, determined based on discounted cash flows.
Although we believe the carrying values of our long-lived assets are currently realizable, future events could cause us to conclude otherwise.
Stock-Based Compensation
We recognize compensation expense related to the fair value of stock-based awards in our consolidated statements of operations. For stock options we issued to employees and members of our board of directors for their services on our board of directors, we estimate the grant-date fair value of options using the Black-Scholes option pricing model. The use of the Black-Scholes option pricing model requires management to make assumptions with respect to the expected term of the option, the expected volatility of the common stock consistent with the expected life of the option, risk-free interest rates and the value of the common stock. For awards subject to time-based vesting, we recognize stock-based compensation expense, net of estimated forfeitures, on a straight-line basis over the requisite service period, which is generally the vesting term of the award. We record stock-based awards issued to non-employees and non-directors at their fair values, and periodically revalue them as the equity instruments vest and are recognized as expense over the related service period of the award.
We will continue to use judgment in evaluating the expected volatility, expected terms and forfeiture rates utilized for our stock-based compensation calculations on a prospective basis. As we continue to accumulate additional data related to our common stock, we may have refinements to the estimates of our expected volatility, expected terms and forfeiture rates, which could materially impact our future stock-based compensation expense.
Fair Value of Common and Preferred Stock
We were required to estimate the fair value of the common stock underlying our stock-based awards when performing fair value calculations. We were also required to estimate the fair value of our preferred stock as it relates to determining the fair value of our Series B redeemable convertible preferred stock and our warrant liability. We engaged an independent third-party valuation firm to assist our board of directors in estimating the fair value of the common and preferred stock on a retrospective basis. We have granted all options to purchase shares of our common stock with an
74
exercise price per share no less than the fair value per share of our common stock underlying those options on the date of grant, based on the information we knew on the date of grant.
In the absence of a public trading market for our common stock prior to our IPO, on each grant date, we developed an estimate of the fair value of our common stock in order to determine an exercise price for the option grants based in part on input from the independent third-party valuation firm. We determined the fair value of our common and preferred stock using methodologies, approaches and assumptions consistent with the AICPA Practice Guide. In addition, our board of directors considered various objective and subjective factors, along with input from management and the independent third-party valuation firm, to estimate the fair value of our common stock, including external market conditions affecting the healthcare market, trends within the healthcare market, the prices at which we sold shares of our different series of preferred stock, the superior rights and preferences of each series of preferred stock relative to our common stock at the time of each grant, our results of operations and financial position, our business strategy, the lack of an active public market for our common and our preferred stock and the likelihood of achieving a liquidity event such as an initial public offering or sale in light of prevailing market conditions.
In valuing our common and preferred stock, the board of directors determined the equity value of our business by taking a combination of the income and market approaches.
The income approach estimates the fair value of a company based on the present value of the company's future estimated cash flows and the residual value of the company beyond the forecast period. These future values are discounted to their present values using a discount rate which is derived from an analysis of the cost of capital of comparable publicly-traded companies in the same industry or similar lines of business as of each valuation date and is adjusted to reflect the risks inherent in the company achieving these estimated cash flows.
For the market approach, we utilized the guideline company method by analyzing a population of comparable companies and selected those technology companies that we considered to be the most comparable to us in terms of product offerings, revenue, margins and growth. Under the market approach, we then used these guideline companies to develop relevant market multiples and ratios, which are then applied to our corresponding financial metrics to estimate our equity value.
Prior to 2015, the enterprise values determined by the income and market approaches were then allocated to the common stock using the Option Pricing Method, or OPM.
The OPM treats common stock and preferred stock as call options on a company's enterprise value, with exercise prices based on the liquidation preferences of the preferred stock. Therefore, the common stock has value only if the funds available for distribution to the stockholders exceed the value of the liquidation preference at the time of an assumed liquidity event such as a merger, sale or IPO. The common stock is modeled as a call option with a claim on the enterprise at an exercise price equal to the remaining value immediately after the preferred stock is liquidated. The OPM uses the Black-Scholes option-pricing model to determine the price of the call option. The OPM is appropriate to use when the range of possible future outcomes is so difficult to predict that forecasts would be highly speculative.
Beginning in 2015, we used the probability-weighted expected return method to determine the value of our common stock. Under the probability-weighted expected return method, the value of an enterprise's common stock is estimated based upon an analysis of future values assuming various possible future liquidity events, such as an initial public offering, a strategic sale or merger and remaining a private enterprise without a liquidity event. The fair market value of the stock is based upon the probability-weighted present value of expected future net cash flows as a result of distributions to stockholders considering each of the possible future events, as well as the rights and preferences of each class of stock.
Our common stock commenced publicly trading on September 29, 2016 and it is no longer necessary to use estimates to determine the fair value of new stock-based awards. Additionally, we no longer need to estimate the fair value of our preferred stock as it converted to common stock.
Recent Accounting Pronouncements
See Note 2 of Notes to Consolidated Financial Statements in Part IV, Item 15 of this Annual Report on Form 10-K for a summary of new accounting standards.
75
Item 7A. Quantitative and Qualitative Disclosures About Market Risk
We are exposed to market risks in the ordinary course of our business. Market risk represents the risk of loss that may impact our financial position due to adverse changes in financial market prices and rates. Our market risks are principally limited to interest rate fluctuations.
As of December 31, 2016, no amounts were outstanding under our 2015 Line of Credit. We entered into the 2015 Line of Credit to refinance outstanding indebtedness and to fund acquisition-related activities. Interest on the loan is based on the lender's prime rate plus 1.0%, with the lender's prime rate having a floor of 3.5%, which exposes us to market risk due to changes in interest rates. This means that a change in the prevailing interest rates may cause our periodic interest payment obligations to fluctuate. We believe that a one percentage point increase in interest rates would result in an approximate $126 thousand increase to our interest expense for the year ended December 31, 2016.
Item 8. Financial Statements and Supplementary Data
Our Consolidated Financial Statements are listed in the Index to Consolidated Financial Statements and Financial Statement Schedule filed as part of this Annual Report on Form 10-K, beginning on page F-1.
Item 9. Changes in and Disagreements with Accountants on Accounting and Financial Disclosure
None.
Item 9A. Controls and Procedures
Evaluation of Disclosure Controls and Procedures
As required by Rule 13a-15(b) and Rule 15d-15(b) of the Exchange Act, our management, including our principal executive officer and our principal financial officer, conducted an evaluation as of the end of the period covered by this Annual Report on Form 10-K of the effectiveness of the design and operation of our disclosure controls and procedures. Based on that evaluation, our principal executive officer and principal financial officer concluded that our disclosure controls and procedures are effective at the reasonable assurance level in ensuring that information required to be disclosed by us in the reports that we file or submit under the Exchange Act is recorded, processed, summarized and reported within the time periods specified in the SEC’s rules and forms. Disclosure controls and procedures include, without limitation, controls and procedures designed to ensure that information required to be disclosed by us in the reports we file under the Exchange Act is accumulated and communicated to our management, including our principal executive officer and principal financial officer, as appropriate to allow timely decisions regarding required disclosure.
Inherent Limitations on Effectiveness of Controls and Procedures
Internal control over financial reporting may not prevent or detect all errors and all fraud. A control system, no matter how well conceived and operated, can provide only reasonable, not absolute, assurance that the objectives of the control system are met. Also, projections of any evaluation of effectiveness of internal control to future periods are subject to the risk that controls may become inadequate because of changes in conditions, or that the degree of compliance with the policies or procedures may deteriorate. Accordingly, our disclosure controls and procedures are designed to provide reasonable, not absolute, assurance that the objectives of our disclosure control system are met.
Management’s Annual Report on Internal Control Over Financial Reporting
This Annual Report on Form 10-K does not include a report of management’s assessment regarding internal control over financial reporting or an attestation report of our independent registered public accounting firm due to a transition period established by the rules of the Securities and Exchange Commission for newly public companies.
76
Changes in Internal Control Over Financial Reporting
There have not been any changes in our internal control over financial reporting (as defined in Rule 13a-15(f) of the Exchange Act) during the quarter ended December 31, 2016 that materially affected, or are reasonably likely to materially affect, our internal control over financial reporting.
Attestation Report of Registered Public Accounting Firm
This Annual Report on Form 10-K does not include an attestation report of our independent registered public accounting firm due to an exemption established by the JOBS Act for emerging growth companies.
None.
Information required by Items 10, 11, 12, 13 and 14 of Part III is omitted from this Annual Report and will be filed in a definitive proxy statement or by an amendment to this Annual Report not later than 120 days after the end of the fiscal year covered by this Annual Report.
Item 10. Directors, Executive Officers and Corporate Governance
The information required by this Item 10 will be included in our definitive proxy statement to be filed with the SEC with respect to our 2017 annual meeting of stockholders (the “Proxy Statement”) under the following captions: “Directors and Executive Officers” and “Corporate Governance” and possibly elsewhere therein and is incorporated herein by reference.
Code of Ethics
The Company has adopted a Code of Conduct and Ethics (the “Code of Ethics”) that applies to all of its directors, officers and employees. The Code of Ethics is reasonably designed to deter wrongdoing and to promote (i) honest and ethical conduct, including the ethical handling of actual or apparent conflicts of interest between personal and professional relationships, (ii) full, fair, accurate, timely and understandable disclosure in reports and documents filed with, or submitted to, the SEC and in other public communications made by the Company, (iii) compliance with applicable governmental laws, rules and regulations, (iv) the prompt internal reporting of violations of the Code of Ethics to appropriate persons identified in the Code of Ethics, and (v) accountability for adherence to the Code of Ethics. The Code of Ethics is available on the Investor Relations section of the Company’s website (http://ir.tabularasahealthcare.com) under the tab “Corporate Governance”.
Item 11. Executive Compensation
The information required by this Item 11 will be included in our Proxy Statement under the following caption: “Executive Compensation” and possibly elsewhere therein and is incorporated herein by reference.
Item 12. Security Ownership of Certain Beneficial Owners and Management and Related Stockholder Matters
The information required by this Item 12 will be included in our Proxy Statement under the following caption: “Security Ownership of Certain Beneficial Owners and Management and Related Stockholder Matters” and possibly elsewhere therein and is incorporated herein by reference.
Item 13. Certain Relationships and Related Transactions and Director Independence
The information required by this Item 13 will be included in our Proxy Statement under the following caption: “Certain Relationships and Related Transactions” and possibly elsewhere therein and is incorporated herein by reference.
77
Item 14. Principal Accounting Fees and Services
The information required by this Item 14 will be included in our Proxy Statement under the following caption: “Services and Fees of KPMG” and possibly elsewhere therein and is incorporated herein by reference.
Item 15 Exhibits and Financial Statement Schedules
A list of exhibits is set forth on the Exhibit Index immediately following the signature page of this Form 10-K, and is incorporated herein by reference.
(a) (1) The Registrant’s financial statements together with a separate table of contents are annexed hereto.
(2) Financial Statement Schedules are listed in the separate table of contents annexed hereto.
Schedule II—Valuation and Qualifying Accounts
(3) A list of exhibits is set forth on the Exhibit Index immediately following the signature page of this Form 10-K, and is incorporated herein by reference.
78
Signatures
Pursuant to the requirements of the Securities Exchange Act of 1934, the registrant has duly caused this report to be signed on its behalf by the undersigned thereunto duly authorized.
|
TABULA RASA HEALTHCARE, INC. |
||
|
Date: March 14, 2017 |
By: |
/s/ DR. CALVIN H. KNOWLTON |
|
Name: |
Dr. Calvin H. Knowlton |
|
|
Title: |
Chief Executive Officer and Chairman of the Board of Directors |
|
Pursuant to the requirements of the Securities Exchange Act of 1934, this report has been signed by the following persons on behalf of the Registrant and in the capacities and on the dates indicated.
|
Date: March 14, 2017 |
By: |
/s/ DR. CALVIN H. KNOWLTON |
|
Name: |
Dr. Calvin H. Knowlton |
|
|
Title: |
Chief Executive Officer and Chairman of the Board of Directors |
|
|
(Principal Executive Officer) |
||
|
Date: March 14, 2017 |
By: |
/s/ BRIAN W. ADAMS |
|
Name: |
Brian W. Adams |
|
|
Title: |
Chief Financial Officer |
|
|
(Principal Financial and Accounting Officer) |
||
|
Date: March 14, 2017 |
By: |
/s/ DR. ORSULA V. KNOWLTON |
|
Name: |
Orsula V. Knowlton |
|
|
Title: |
President and Director |
|
|
Date: March 14, 2017 |
By: |
/s/ GLEN BRESSNER |
|
Name: |
Glenn Bressner |
|
|
Title: |
Director |
|
|
Date: March 14, 2017 |
By: |
/s/ DENNIS HELLING |
|
Name: |
Dennis Helling |
|
|
Title: |
Director |
|
|
Date: March 14, 2017 |
By: |
/s/ DANIEL LUBIN |
|
Name: |
Daniel Lubin |
|
|
Title: |
Director |
|
|
Date: March 14, 2017 |
By: |
/s/ BRUCE LUEHRS |
|
Name: |
Bruce Luehrs |
|
|
Title: |
Director |
|
|
Date: March 14, 2017 |
By: |
/s/ A GORDON TUNSTALL |
|
Name: |
A Gordon Tunstall |
|
|
Title: |
Director |
79
EXHIBIT INDEX
|
|
|
|
|
|
|
|
|
|
|
|
|
|
|
|
|
Incorporated by Reference |
|
|
||||
|
Exhibit |
|
Exhibit Description |
|
Form |
|
Filing |
|
Exhibit |
|
Filed |
|
|
|
|
|
|
|
|
|
|
|
|
|
2.1# |
|
Membership Interest Purchase Agreement, dated as of December 31, 2014, by and between Tabula Rasa HealthCare, Inc., Fred Smith III, Olds Family 2002 Trust, Stephen F. Olds and Thomas Olds, Jr. |
|
S-1 |
|
1/4/2016 |
|
2.1 |
|
|
|
2.2# |
|
Asset Purchase Agreement, dated as of April 22, 2014, by and among Capstone Performance Systems, LLC (Delaware), CareKinesis, Inc., Capstone Performance Systems, LLC (Colorado), PPS Holdings, Inc. and David M. Reyes and Ronda L. Hackbart-Reyes |
|
S-1 |
|
1/4/2016 |
|
2.2 |
|
|
|
2.3# |
|
Stock Purchase Agreement, dated as of November 27, 2013, by and between CareKinesis, Inc. and Gary Tom, as amended |
|
S-1 |
|
1/4/2016 |
|
2.3 |
|
|
|
3.1 |
|
Amended and Restated Certificate of Incorporation of Tabula Rasa HealthCare, Inc. |
|
8-K |
|
8/4/2016 |
|
3.1 |
|
|
|
3.2 |
|
Amended and Restated Bylaws of Tabula Rasa HealthCare, Inc. |
|
8-K |
|
8/4/2016 |
|
3.2 |
|
|
|
4.1 |
|
Investor Rights Agreement, dated as of June 30, 2014 |
|
S-1 |
|
1/4/2016 |
|
4.1 |
|
|
|
4.2 |
|
Investor Rights Agreement, dated as of June 30, 2014 |
|
S-1/A |
|
7/21/2016 |
|
4.2 |
|
|
|
4.3 |
|
Amended and Restated Preferred Series A-1 Convertible Stock Warrant, dated as of April 21, 2016, issued to the New Jersey Economic Development Authority |
|
S-1/A |
|
7/21/2016 |
|
4.8 |
|
|
|
10.1 |
|
Tabula Rasa HealthCare, Inc. Amended and Restated 2014 Equity Compensation Plan, including forms of Incentive Stock Option Agreement, Nonqualified Stock Option Agreements and Restricted Stock Agreement thereunder |
|
S-1/A |
|
9/19/2016 |
|
10.1 |
|
|
|
10.2 |
|
Tabula Rasa HealthCare, Inc. Leadership Exit Bonus Plan |
|
S-1 |
|
1/4/2016 |
|
10.2 |
|
|
|
10.3 |
|
Tabula Rasa HealthCare, Inc. Company Management Plan, as amended |
|
S-1/A |
|
9/19/2016 |
|
10.3 |
|
|
|
10.4 |
|
Form of Indemnification Agreement |
|
S-1/A |
|
9/19/2016 |
|
10.5 |
|
|
|
10.5 |
|
Loan and Security Modification Agreement, dated as of July 1, 2016, by and between Western Alliance Bank, as successor in interest to Bridge Bank, National Association, and CareKinesis, Inc., Tabula Rasa HealthCare, Inc., CareVentions, Inc., Capstone Performance Systems, LLC, J.A. Robertson, Inc. and Medliance LLC |
|
S-1/A |
|
7/21/2016 |
|
10.7 |
|
|
|
10.6 |
|
Loan and Security Modification Agreement, dated as of September 15, 2016, by and between Western Alliance Bank, are CareKinesis, Inc., Tabula Rasa HealthCare, Inc., CareVentions, Inc., Capstone Performance Systems, LLC, J.A. Robertson, Inc., Medliance LLC and CK Solutions, LLC |
|
S-1/A |
|
9/19/2016 |
|
10.8 |
|
|
|
10.7 |
|
Tabula Rasa HealthCare, Inc. 2016 Omnibus Incentive Compensation Plan, including forms of Incentive Stock Option Agreement, Nonqualified Stock Option Agreement and Restricted Stock Agreement thereunder |
|
S-1/A |
|
9/19/2016 |
|
10.15 |
|
|
|
10.8 |
|
Lease Agreement, dated August 21, 2015, by and between 228 Strawbridge Associates, LLC and Tabula Rasa HealthCare, Inc. (Suite 100), as amended by that First Amendment to Lease Agreements, dated March 22, 2016 by and between 228 Strawbridge Associates, LLC and Tabula Rasa HealthCare, Inc., included as Exhibit 10.11 |
|
S-1 |
|
1/4/2016 |
|
10.9 |
|
|
|
10.9 |
|
Lease Agreement, dated August 21, 2015, by and between 228 Strawbridge Associates, LLC and Tabula Rasa HealthCare, Inc. (Suite 200), as amended by that First Amendment to Lease Agreements, dated March 22, 2016 by and between 228 Strawbridge Associates, LLC and Tabula Rasa HealthCare, Inc., included as Exhibit 10.11 |
|
S-1 |
|
1/4/2016 |
|
10.10 |
|
|
80
|
10.10 |
|
Lease Agreement, dated August 21, 2015, by and between 228 Strawbridge Associates, LLC and Tabula Rasa HealthCare, Inc. (Suite 300), as amended by that First Amendment to Lease Agreements, dated March 22, 2016 by and between 228 Strawbridge Associates, LLC and Tabula Rasa HealthCare, Inc., included as Exhibit 10.11 |
|
S-1 |
|
1/4/2016 |
|
10.11 |
|
|
|
10.11 |
|
First Amendment to Lease Agreements, dated March 22, 2016 by and between 228 Strawbridge Associates, LLC and Tabula Rasa HealthCare, Inc. |
|
S-1/A |
|
7/21/2016 |
|
10.11 |
|
|
|
10.12 |
|
Amended and Restated Prime Vendor Agreement, effective May 1, 2016, by and among AmerisourceBergen Drug Corporation, CareKinesis, Inc. and J.A. Robertson, Inc. d/b/a St. Mary |
|
S-1/A |
|
7/21/2016 |
|
10.13 |
|
|
|
21.1 |
|
Subsidiaries of Registrant |
|
|
|
|
|
|
|
X |
|
23.1 |
|
Consent of KPMG LLP |
|
|
|
|
|
|
|
X |
|
31.1 |
|
Certification of Chief Executive Officer (Principal Executive Officer) required by Rule 13a-14(a) or Rule 15d-14(a) of the Securities Exchange Act of 1934, as adopted pursuant to Section 302 of the Sarbanes-Oxley Act of 2002 |
|
|
|
|
|
|
|
X |
|
31.2 |
|
Certification of Chief Financial Officer (Principal Financial Officer) required by Rule 13a-14(a) or Rule 15d-14(a) of the Securities Exchange Act of 1934, as adopted pursuant to Section 302 of the Sarbanes-Oxley Act of 2002 |
|
|
|
|
|
|
|
X |
|
32.1* |
|
Certification of Chief Executive Officer (Principal Executive Officer) and Chief Financial Officer (Principal Financial Officer), as required by Rule 13a-14(b) or Rule 15d-14(b) and Section 1350 of Chapter 63 of Title 18 of the United States Code (18 U.S.C. §1350), as adopted pursuant to Section 906 of the Sarbanes-Oxley Act of 2002 |
|
|
|
|
|
|
|
X |
|
101.INS |
|
XBRL Instance Document |
|
|
|
|
|
|
|
X |
|
101.SCH |
|
XBRL Taxonomy Extension Schema Document |
|
|
|
|
|
|
|
X |
|
101.CAL |
|
XBRL Taxonomy Extension Calculation Linkbase |
|
|
|
|
|
|
|
X |
|
101.DEF |
|
XBRL Taxonomy Extension Definition Linkbase |
|
|
|
|
|
|
|
X |
|
101.LAB |
|
XBRL Taxonomy Extension Label Linkbase |
|
|
|
|
|
|
|
X |
|
101.PRE |
|
XBRL Taxonomy Extension Presentation Linkbase |
|
|
|
|
|
|
|
X |
*This certification attached as Exhibit 32.1 that accompanies this Annual Report on Form 10-K is not deemed filed with the Securities and Exchange Commission and is not to be incorporated by reference into any filing of Tabula Rasa HealthCare, Inc. under the Securities Act of 1933, as amended, or the Securities Exchange Act of 1934, as amended (whether made before or after the date of this Form 10-K), irrespective of any general incorporation language contained in such filing.
#Schedules to the agreement have been omitted pursuant to Item 601(b)(2) of Regulation S-K. The company undertakes to furnish supplemental copies of any of the omitted schedules upon request by the SEC.
81
INDEX TO CONSOLIDATED FINANCIAL STATEMENTS AND SUPPLEMENTAL DATA
|
|
|
|
Page |
|
|
|
|
Number |
|
|
|
|
|
|
1. |
Audited Consolidated Financial Statements of Tabula Rasa HealthCare, Inc. |
|
|
|
F-2 |
|||
|
|
Consolidated Balance Sheets as of December 31, 2016 and 2015 |
|
F-3 |
|
|
Consolidated Statements of Operations for the Years Ended December 31, 2016, 2015, and 2014 |
|
F-4 |
|
|
|
F-5 |
|
|
|
Consolidated Statements of Cash Flows for the Years Ended December 31, 2016, 2015, and 2014 |
|
F-6 |
|
|
|
F-7 |
|
|
2. |
Supplemental Financial Data |
|
|
|
|
The following supplemental financial data of the Registrant required to be included in Item 15(a)(2) on Form 10-K are listed below: |
|
|
|
|
|
F-41 |
F-1
REPORT OF INDEPENDENT REGISTERED PUBLIC ACCOUNTING FIRM
The Board of Directors and Stockholders
Tabula Rasa HealthCare, Inc.:
We have audited the accompanying consolidated balance sheets of Tabula Rasa HealthCare, Inc. and subsidiaries as of December 31, 2016 and 2015, and the related consolidated statements of operations, redeemable convertible preferred stock and stockholders’ equity (deficit), and cash flows for each of the years in the three-year period ended December 31, 2016. In connection with our audits of the consolidated financial statements, we also have audited financial statement Schedule II. These consolidated financial statements and financial statement schedule are the responsibility of the Company’s management. Our responsibility is to express an opinion on these consolidated financial statements and financial statement schedule based on our audits.
We conducted our audits in accordance with the standards of the Public Company Accounting Oversight Board (United States). Those standards require that we plan and perform the audit to obtain reasonable assurance about whether the financial statements are free of material misstatement. An audit includes examining, on a test basis, evidence supporting the amounts and disclosures in the financial statements. An audit also includes assessing the accounting principles used and significant estimates made by management, as well as evaluating the overall financial statement presentation. We believe that our audits provide a reasonable basis for our opinion.
In our opinion, the consolidated financial statements referred to above present fairly, in all material respects, the financial position of Tabula Rasa HealthCare, Inc. and subsidiaries as of December 31, 2016 and 2015, and the results of their operations and their cash flows for each of the years in the three-year period ended December 31, 2016, in conformity with U.S. generally accepted accounting principles. Also in our opinion, the related financial statement schedule, when considered in relation to the basic consolidated financial statements taken as whole, present fairly, in all material respects, the information set forth therein.
/s/ KPMG LLP
Philadelphia, Pennsylvania
March 14, 2017
F-2
TABULA RASA HEALTHCARE, INC.
(In thousands, except share and per share amounts)
|
|
|
December 31, |
||||
|
|
|
2016 |
|
2015 |
||
|
Assets |
|
|
|
|
|
|
|
Current assets: |
|
|
|
|
|
|
|
Cash |
|
$ |
4,345 |
|
$ |
2,026 |
|
Restricted cash |
|
|
— |
|
|
200 |
|
Accounts receivable, net |
|
|
6,646 |
|
|
6,013 |
|
Inventories |
|
|
2,911 |
|
|
2,304 |
|
Rebates receivable |
|
|
312 |
|
|
1,064 |
|
Prepaid expenses |
|
|
869 |
|
|
428 |
|
Other current assets |
|
|
581 |
|
|
94 |
|
Total current assets |
|
|
15,664 |
|
|
12,129 |
|
Property and equipment, net |
|
|
6,409 |
|
|
1,962 |
|
Software development costs, net |
|
|
3,350 |
|
|
2,505 |
|
Goodwill |
|
|
21,686 |
|
|
21,606 |
|
Intangible assets, net |
|
|
25,297 |
|
|
17,687 |
|
Other assets |
|
|
333 |
|
|
2,713 |
|
Total assets |
|
$ |
72,739 |
|
$ |
58,602 |
|
Liabilities, redeemable convertible preferred stock and stockholders’ equity (deficit) |
|
|
|
|
|
|
|
Current liabilities: |
|
|
|
|
|
|
|
Line of credit |
|
$ |
— |
|
$ |
10,000 |
|
Current portion of long-term debt |
|
|
674 |
|
|
13,526 |
|
Notes payable to related parties |
|
|
— |
|
|
250 |
|
Notes payable related to acquisition |
|
|
— |
|
|
15,620 |
|
Acquisition-related consideration payable |
|
|
568 |
|
|
235 |
|
Acquisition-related contingent consideration |
|
|
1,493 |
|
|
1,886 |
|
Accounts payable |
|
|
6,115 |
|
|
6,808 |
|
Accrued expenses and other liabilities |
|
|
2,159 |
|
|
3,244 |
|
Total current liabilities |
|
|
11,009 |
|
|
51,569 |
|
Long-term debt |
|
|
1,072 |
|
|
430 |
|
Long-term acquisition-related contingent consideration |
|
|
1,515 |
|
|
3,355 |
|
Warrant liability |
|
|
— |
|
|
5,569 |
|
Deferred income taxes |
|
|
832 |
|
|
334 |
|
Other long-term liabilities |
|
|
2,205 |
|
|
— |
|
Total liabilities |
|
|
16,633 |
|
|
61,257 |
|
|
|
|
|
|
|
|
|
Commitments and contingencies (Note 16) |
|
|
|
|
|
|
|
|
|
|
|
|
|
|
|
Redeemable convertible preferred stock: |
|
|
|
|
|
|
|
Series A and A-1 redeemable convertible preferred stock, $0.0001 par value, no shares authorized, issued and outstanding at December 31, 2016; 7,224,266 shares authorized and 6,911,766 shares issued and outstanding at December 31, 2015 |
|
|
— |
|
|
6,553 |
|
Series B redeemable convertible preferred stock, $0.0001 par value, no shares authorized, issued and outstanding at December 31, 2016; 3,548,614 shares authorized and 2,961,745 shares issued and outstanding at December 31, 2015 |
|
|
— |
|
|
22,420 |
|
Total redeemable convertible preferred stock |
|
|
— |
|
|
28,973 |
|
Stockholders' equity (deficit): |
|
|
|
|
|
|
|
Preferred Stock, $0.0001 par value; 10,000,000 shares authorized; no shares issued and outstanding at December 31, 2016 and December 31, 2015 |
|
|
— |
|
|
— |
|
Common stock, $0.0001 par value; 100,000,000 and 27,836,869 shares authorized, 16,628,476 and 4,575,897 shares issued and outstanding at December 31, 2016 and December 31, 2015, respectively |
|
|
2 |
|
|
— |
|
Additional paid-in capital |
|
|
91,027 |
|
|
— |
|
Accumulated deficit |
|
|
(34,923) |
|
|
(31,628) |
|
Total stockholders’ equity (deficit) |
|
|
56,106 |
|
|
(31,628) |
|
Total liabilities, redeemable convertible preferred stock and stockholders’ equity (deficit) |
|
$ |
72,739 |
|
$ |
58,602 |
See accompanying notes to audited consolidated financial statements.
F-3
TABULA RASA HEALTHCARE, INC.
CONSOLIDATED STATEMENTS OF OPERATIONS
(In thousands, except share and per share amounts)
|
|
|
Year Ended |
|||||||
|
|
|
December 31, |
|||||||
|
|
|
2016 |
|
2015 |
|
2014 |
|||
|
Revenue: |
|
|
|
|
|
|
|
|
|
|
Product revenue |
|
$ |
79,446 |
|
$ |
60,060 |
|
$ |
46,878 |
|
Service revenue |
|
|
14,616 |
|
|
9,979 |
|
|
1,550 |
|
Total revenue |
|
|
94,062 |
|
|
70,039 |
|
|
48,428 |
|
Cost of revenue, exclusive of depreciation and amortization shown below: |
|
|
|
|
|
|
|
|
|
|
Product cost |
|
|
59,901 |
|
|
45,829 |
|
|
37,073 |
|
Service cost |
|
|
5,276 |
|
|
3,299 |
|
|
739 |
|
Total cost of revenue |
|
|
65,177 |
|
|
49,128 |
|
|
37,812 |
|
Gross profit |
|
|
28,885 |
|
|
20,911 |
|
|
10,616 |
|
Operating (income) expenses: |
|
|
|
|
|
|
|
|
|
|
Research and development |
|
|
3,811 |
|
|
2,877 |
|
|
1,660 |
|
Sales and marketing |
|
|
3,860 |
|
|
2,880 |
|
|
2,272 |
|
General and administrative |
|
|
11,831 |
|
|
7,115 |
|
|
3,970 |
|
Change in fair value of acquisition-related contingent consideration (income) expense |
|
|
(338) |
|
|
(2,059) |
|
|
790 |
|
Change in fair value of acquisition-related consideration expense |
|
|
55 |
|
|
— |
|
|
— |
|
Depreciation and amortization |
|
|
5,115 |
|
|
3,933 |
|
|
1,817 |
|
Total operating expenses |
|
|
24,334 |
|
|
14,746 |
|
|
10,509 |
|
Income from operations |
|
|
4,551 |
|
|
6,165 |
|
|
107 |
|
Other (income) expense: |
|
|
|
|
|
|
|
|
|
|
Change in fair value of warrant liability |
|
|
(639) |
|
|
2,786 |
|
|
269 |
|
Interest expense |
|
|
4,488 |
|
|
5,915 |
|
|
1,354 |
|
Loss on extinguishment of debt |
|
|
6,411 |
|
|
— |
|
|
— |
|
Total other expense |
|
|
10,260 |
|
|
8,701 |
|
|
1,623 |
|
Loss before income taxes |
|
|
(5,709) |
|
|
(2,536) |
|
|
(1,516) |
|
Income tax expense (benefit) |
|
|
541 |
|
|
328 |
|
|
(409) |
|
Net loss |
|
$ |
(6,250) |
|
$ |
(2,864) |
|
$ |
(1,107) |
|
Decretion (accretion) of redeemable convertible preferred stock |
|
|
2,439 |
|
|
(9,966) |
|
|
(3,884) |
|
Net loss attributable to common stockholders: |
|
|
|
|
|
|
|
|
|
|
Basic |
|
$ |
(3,811) |
|
$ |
(12,830) |
|
$ |
(4,991) |
|
Diluted |
|
$ |
(6,889) |
|
$ |
(12,830) |
|
$ |
(4,991) |
|
Net loss per share attributable to common stockholders: |
|
|
|
|
|
|
|
|
|
|
Basic |
|
$ |
(0.51) |
|
$ |
(2.97) |
|
$ |
(1.23) |
|
Diluted |
|
$ |
(0.59) |
|
$ |
(2.97) |
|
$ |
(1.23) |
|
Weighted average common shares outstanding: |
|
|
|
|
|
|
|
|
|
|
Basic |
|
|
7,486,131 |
|
|
4,318,779 |
|
|
4,052,590 |
|
Diluted |
|
|
11,591,210 |
|
|
4,318,779 |
|
|
4,052,590 |
See accompanying notes to audited consolidated financial statements.
F-4
TABULA RASA HEALTHCARE, INC.
CONSOLIDATED STATEMENTS OF REDEEMABLE CONVERTIBLE PREFERRED STOCK AND STOCKHOLDERS' EQUITY (DEFICIT)
(In thousands, except share amounts)
|
|
|
|
|
|
|
|
|
|
|
|
|
|
|
|
|
|
|
|
|
Stockholders' Equity (Deficit) |
|||||||||||||||||||||||||||
|
|
|
Redeemable Convertible Preferred Stock |
|
|
|
|
|
|
Common Stock |
|
|
|
|
|
|
|
|
|
|
|
|
Total |
|||||||||||||||||||||||||
|
|
|
Series A |
|
Series A-1 |
|
Series B |
|
|
|
|
Preferred Stock |
|
Class A |
|
Class B |
|
Common Stock |
|
Additional |
|
Accumulated |
|
Stockholders' |
||||||||||||||||||||||||
|
|
|
Shares |
|
Amount |
|
Shares |
|
Amount |
|
Shares |
|
Amount |
|
Total |
|
Shares |
|
Amount |
|
Shares |
|
Amount |
|
Shares |
|
Amount |
|
Shares |
|
Amount |
|
Paid-in Capital |
|
Deficit |
|
Equity (Deficit) |
|||||||||||
|
Balance, January 1, 2014 |
|
4,411,766 |
|
$ |
3,556 |
|
2,500,000 |
|
$ |
2,242 |
|
2,961,745 |
|
$ |
9,325 |
|
$ |
15,123 |
|
— |
|
$ |
— |
|
1,799,264 |
|
$ |
— |
|
2,108,117 |
|
$ |
— |
|
— |
|
$ |
— |
|
$ |
— |
|
$ |
(16,020) |
|
$ |
(16,020) |
|
Issuance of common stock in connection with acquisition of St. Mary's Prescription Pharmacy |
|
— |
|
|
— |
|
— |
|
|
— |
|
— |
|
|
— |
|
|
— |
|
— |
|
|
— |
|
81,186 |
|
|
— |
|
— |
|
|
— |
|
— |
|
|
— |
|
|
291 |
|
|
— |
|
|
291 |
|
Issuance of common stock in connection with acquisition of Capstone Performance Systems, LLC |
|
— |
|
|
— |
|
— |
|
|
— |
|
— |
|
|
— |
|
|
— |
|
— |
|
|
— |
|
104,822 |
|
|
— |
|
— |
|
|
— |
|
— |
|
|
— |
|
|
374 |
|
|
— |
|
|
374 |
|
Accretion of redeemable convertible preferred stock |
|
— |
|
|
225 |
|
— |
|
|
142 |
|
— |
|
|
3,517 |
|
|
3,884 |
|
— |
|
|
— |
|
— |
|
|
— |
|
— |
|
|
— |
|
— |
|
|
— |
|
|
(1,009) |
|
|
(2,875) |
|
|
(3,884) |
|
Transfer of common stock |
|
— |
|
|
— |
|
— |
|
|
— |
|
— |
|
|
— |
|
|
— |
|
— |
|
|
— |
|
32,646 |
|
|
— |
|
(32,646) |
|
|
— |
|
— |
|
|
— |
|
|
— |
|
|
— |
|
|
— |
|
Exercise of stock options |
|
— |
|
|
— |
|
— |
|
|
— |
|
— |
|
|
— |
|
|
— |
|
— |
|
|
— |
|
41,151 |
|
|
— |
|
— |
|
|
— |
|
— |
|
|
— |
|
|
59 |
|
|
— |
|
|
59 |
|
Issuance of common stock warrants |
|
— |
|
|
— |
|
— |
|
|
— |
|
— |
|
|
— |
|
|
— |
|
— |
|
|
— |
|
— |
|
|
— |
|
— |
|
|
— |
|
— |
|
|
— |
|
|
31 |
|
|
— |
|
|
31 |
|
Stock-based compensation expense |
|
— |
|
|
— |
|
— |
|
|
— |
|
— |
|
|
— |
|
|
— |
|
— |
|
|
— |
|
— |
|
|
— |
|
— |
|
|
— |
|
— |
|
|
— |
|
|
254 |
|
|
|
|
|
254 |
|
Net loss |
|
— |
|
|
— |
|
— |
|
|
— |
|
— |
|
|
— |
|
|
— |
|
— |
|
|
— |
|
— |
|
|
— |
|
— |
|
|
— |
|
— |
|
|
— |
|
|
— |
|
|
(1,107) |
|
|
(1,107) |
|
Balance, December 31, 2014 |
|
4,411,766 |
|
|
3,781 |
|
2,500,000 |
|
|
2,384 |
|
2,961,745 |
|
|
12,842 |
|
|
19,007 |
|
— |
|
|
— |
|
2,059,069 |
|
|
— |
|
2,075,471 |
|
|
— |
|
— |
|
|
— |
|
|
— |
|
|
(20,002) |
|
|
(20,002) |
|
Issuance of common stock in connection with satisfaction of contingent consideration related to acquisition of St. Mary's Prescription Pharmacy |
|
— |
|
|
— |
|
— |
|
|
— |
|
— |
|
|
— |
|
|
— |
|
— |
|
|
— |
|
16,237 |
|
|
— |
|
— |
|
|
— |
|
— |
|
|
— |
|
|
94 |
|
|
— |
|
|
94 |
|
Issuance of common stock in connection with satisfaction of contingent consideration related to acquisition of Capstone Performance Systems, LLC |
|
— |
|
|
— |
|
— |
|
|
— |
|
— |
|
|
— |
|
|
— |
|
— |
|
|
— |
|
18,418 |
|
|
— |
|
— |
|
|
— |
|
— |
|
|
— |
|
|
107 |
|
|
— |
|
|
107 |
|
Accretion of redeemable convertible preferred stock |
|
— |
|
|
238 |
|
— |
|
|
150 |
|
— |
|
|
9,578 |
|
|
9,966 |
|
— |
|
|
— |
|
— |
|
|
— |
|
— |
|
|
— |
|
— |
|
|
— |
|
|
(1,204) |
|
|
(8,762) |
|
|
(9,966) |
|
Transfer of common stock |
|
— |
|
|
— |
|
— |
|
|
— |
|
— |
|
|
— |
|
|
— |
|
— |
|
|
— |
|
4,124 |
|
|
— |
|
(4,124) |
|
|
— |
|
— |
|
|
— |
|
|
— |
|
|
— |
|
|
— |
|
Exercise of stock options |
|
— |
|
|
— |
|
— |
|
|
— |
|
— |
|
|
— |
|
|
— |
|
— |
|
|
— |
|
3,132 |
|
|
— |
|
403,570 |
|
|
— |
|
— |
|
|
— |
|
|
422 |
|
|
— |
|
|
422 |
|
Issuance of common stock warrants |
|
— |
|
|
— |
|
— |
|
|
— |
|
— |
|
|
— |
|
|
— |
|
— |
|
|
— |
|
— |
|
|
— |
|
— |
|
|
— |
|
— |
|
|
— |
|
|
16 |
|
|
— |
|
|
16 |
|
Stock-based compensation expense |
|
— |
|
|
— |
|
— |
|
|
— |
|
— |
|
|
— |
|
|
— |
|
— |
|
|
— |
|
— |
|
|
— |
|
— |
|
|
— |
|
— |
|
|
— |
|
|
565 |
|
|
— |
|
|
565 |
|
Net loss |
|
— |
|
|
— |
|
— |
|
|
— |
|
— |
|
|
— |
|
|
— |
|
— |
|
|
— |
|
— |
|
|
— |
|
— |
|
|
— |
|
— |
|
|
— |
|
|
— |
|
|
(2,864) |
|
|
(2,864) |
|
Balance, December 31, 2015 |
|
4,411,766 |
|
|
4,019 |
|
2,500,000 |
|
|
2,534 |
|
2,961,745 |
|
|
22,420 |
|
|
28,973 |
|
— |
|
|
— |
|
2,100,980 |
|
|
— |
|
2,474,917 |
|
|
— |
|
— |
|
|
— |
|
|
— |
|
|
(31,628) |
|
|
(31,628) |
|
Issuance of common stock in connection with satisfaction of contingent consideration related to acquisition of St. Mary's Prescription Pharmacy |
|
— |
|
|
— |
|
— |
|
|
— |
|
— |
|
|
— |
|
|
— |
|
— |
|
|
— |
|
10,824 |
|
|
— |
|
— |
|
|
— |
|
— |
|
|
— |
|
|
35 |
|
|
— |
|
|
35 |
|
Accretion (decretion) of redeemable convertible preferred stock |
|
— |
|
|
188 |
|
— |
|
|
118 |
|
— |
|
|
(2,745) |
|
|
(2,439) |
|
— |
|
|
— |
|
— |
|
|
— |
|
— |
|
|
— |
|
— |
|
|
— |
|
|
(516) |
|
|
2,955 |
|
|
2,439 |
|
Transfer of common stock |
|
— |
|
|
— |
|
— |
|
|
— |
|
— |
|
|
— |
|
|
— |
|
— |
|
|
— |
|
2,577 |
|
|
— |
|
(2,577) |
|
|
— |
|
— |
|
|
— |
|
|
— |
|
|
— |
|
|
— |
|
Issuance of common stock |
|
— |
|
|
— |
|
— |
|
|
— |
|
— |
|
|
— |
|
|
— |
|
— |
|
|
— |
|
1 |
|
|
— |
|
— |
|
|
— |
|
— |
|
|
— |
|
|
— |
|
|
— |
|
|
— |
|
Issuance of restricted stock |
|
— |
|
|
— |
|
— |
|
|
— |
|
— |
|
|
— |
|
|
— |
|
— |
|
|
— |
|
722,646 |
|
|
— |
|
— |
|
|
— |
|
— |
|
|
— |
|
|
— |
|
|
— |
|
|
— |
|
Issuance of common stock upon initial public offering, net of issuance costs |
|
— |
|
|
— |
|
— |
|
|
— |
|
— |
|
|
— |
|
|
— |
|
— |
|
|
— |
|
— |
|
|
— |
|
— |
|
|
— |
|
4,945,000 |
|
|
— |
|
|
51,226 |
|
|
— |
|
|
51,226 |
|
Conversion of redeemable convertible preferred stock upon initial public offering |
|
(4,411,766) |
|
|
(4,207) |
|
(2,500,000) |
|
|
(2,652) |
|
(2,961,745) |
|
|
(19,675) |
|
|
(26,534) |
|
— |
|
|
— |
|
— |
|
|
— |
|
— |
|
|
— |
|
5,089,436 |
|
|
1 |
|
|
26,533 |
|
|
— |
|
|
26,534 |
|
Redesignation of Class A and Class B common stock upon initial public offering |
|
— |
|
|
— |
|
— |
|
|
— |
|
— |
|
|
— |
|
|
— |
|
— |
|
|
— |
|
(2,837,028) |
|
|
— |
|
(2,746,377) |
|
|
— |
|
5,583,405 |
|
|
1 |
|
|
— |
|
|
— |
|
|
1 |
|
Conversion of warrants upon initial public offering |
|
— |
|
|
— |
|
— |
|
|
— |
|
— |
|
|
— |
|
|
— |
|
— |
|
|
— |
|
— |
|
|
— |
|
— |
|
|
— |
|
— |
|
|
— |
|
|
4,930 |
|
|
— |
|
|
4,930 |
|
Surrender of common stock |
|
— |
|
|
— |
|
— |
|
|
— |
|
— |
|
|
— |
|
|
— |
|
— |
|
|
— |
|
— |
|
|
— |
|
— |
|
|
— |
|
(20,372) |
|
|
— |
|
|
— |
|
|
— |
|
|
— |
|
Issuance of common stock in connection with Leadership Exit Bonus Plan |
|
— |
|
|
— |
|
— |
|
|
— |
|
— |
|
|
— |
|
|
— |
|
— |
|
|
— |
|
— |
|
|
— |
|
— |
|
|
— |
|
20,372 |
|
|
— |
|
|
— |
|
|
— |
|
|
— |
|
Shares withheld for tax in connection with Leadership Exit Bonus Plan |
|
— |
|
|
— |
|
— |
|
|
— |
|
— |
|
|
— |
|
|
— |
|
— |
|
|
— |
|
— |
|
|
— |
|
— |
|
|
— |
|
(7,010) |
|
|
— |
|
|
(84) |
|
|
— |
|
|
(84) |
|
Issuance of common stock in connection with satisfaction of acquisition consideration related to asset acquisition of 9176-1916 Quebec, Inc. |
|
— |
|
|
— |
|
— |
|
|
— |
|
— |
|
|
— |
|
|
— |
|
— |
|
|
— |
|
— |
|
|
— |
|
— |
|
|
— |
|
395,407 |
|
|
— |
|
|
4,500 |
|
|
— |
|
|
4,500 |
|
Net exercise of stock warrants |
|
— |
|
|
— |
|
— |
|
|
— |
|
— |
|
|
— |
|
|
— |
|
— |
|
|
— |
|
— |
|
|
— |
|
210,817 |
|
|
— |
|
490,385 |
|
|
— |
|
|
— |
|
|
— |
|
|
— |
|
Net exercise of stock options |
|
— |
|
|
— |
|
— |
|
|
— |
|
— |
|
|
— |
|
|
— |
|
— |
|
|
— |
|
— |
|
|
— |
|
63,220 |
|
|
— |
|
7,052 |
|
|
— |
|
|
— |
|
|
— |
|
|
— |
|
Exercise of stock options |
|
— |
|
|
— |
|
— |
|
|
— |
|
— |
|
|
— |
|
|
— |
|
— |
|
|
— |
|
— |
|
|
— |
|
— |
|
|
— |
|
124,801 |
|
|
— |
|
|
153 |
|
|
— |
|
|
153 |
|
Stock-based compensation expense |
|
— |
|
|
— |
|
— |
|
|
— |
|
— |
|
|
— |
|
|
— |
|
— |
|
|
— |
|
— |
|
|
— |
|
— |
|
|
— |
|
— |
|
|
— |
|
|
4,250 |
|
|
— |
|
|
4,250 |
|
Net loss |
|
— |
|
|
— |
|
— |
|
|
— |
|
— |
|
|
— |
|
|
— |
|
— |
|
|
— |
|
— |
|
|
— |
|
— |
|
|
— |
|
— |
|
|
— |
|
|
— |
|
|
(6,250) |
|
|
(6,250) |
|
Balance, December 31, 2016 |
|
— |
|
$ |
— |
|
— |
|
$ |
— |
|
— |
|
$ |
— |
|
$ |
— |
|
— |
|
$ |
— |
|
— |
|
$ |
— |
|
— |
|
$ |
— |
|
16,628,476 |
|
$ |
2 |
|
$ |
91,027 |
|
$ |
(34,923) |
|
$ |
56,106 |
See accompanying notes to audited consolidated financial statements.
F-5
TABULA RASA HEALTHCARE, INC.
CONSOLIDATED STATEMENTS OF CASH FLOWS
(In thousands)
|
|
|
Year Ended |
|||||||
|
|
|
December 31, |
|||||||
|
|
|
2016 |
|
2015 |
|
2014 |
|||
|
Cash flows from operating activities: |
|
|
|
|
|
|
|
|
|
|
Net loss |
|
$ |
(6,250) |
|
$ |
(2,864) |
|
$ |
(1,107) |
|
Adjustments to reconcile net loss to net cash provided by operating activities: |
|
|
|
|
|
|
|
|
|
|
Depreciation and amortization |
|
|
5,115 |
|
|
3,933 |
|
|
1,817 |
|
Amortization of deferred financing costs and debt discount |
|
|
1,279 |
|
|
2,148 |
|
|
259 |
|
Payment of imputed interest on debt |
|
|
(3,893) |
|
|
(105) |
|
|
(13) |
|
Deferred taxes |
|
|
498 |
|
|
290 |
|
|
(422) |
|
Issuance of common stock warrants |
|
|
— |
|
|
16 |
|
|
31 |
|
Stock-based compensation |
|
|
4,250 |
|
|
565 |
|
|
254 |
|
Change in fair value of warrant liability |
|
|
(639) |
|
|
2,786 |
|
|
269 |
|
Change in fair value of acquisition-related contingent consideration |
|
|
(338) |
|
|
(2,059) |
|
|
790 |
|
Change in fair value of acquisition-related consideration |
|
|
55 |
|
|
— |
|
|
— |
|
Loss on extinguishment of debt |
|
|
6,411 |
|
|
— |
|
|
— |
|
Write-off in-process software development costs |
|
|
— |
|
|
— |
|
|
63 |
|
Other noncash items |
|
|
— |
|
|
(10) |
|
|
— |
|
Changes in operating assets and liabilities, net of effect from acquisitions: |
|
|
|
|
|
|
|
|
|
|
Accounts receivable, net |
|
|
(633) |
|
|
(1,711) |
|
|
(1,388) |
|
Inventories |
|
|
(607) |
|
|
(264) |
|
|
(792) |
|
Rebates receivable |
|
|
752 |
|
|
(96) |
|
|
(715) |
|
Prepaid expenses and other current assets |
|
|
(929) |
|
|
(259) |
|
|
(77) |
|
Other assets |
|
|
1 |
|
|
(4) |
|
|
(30) |
|
Acquisition-related contingent consideration |
|
|
— |
|
|
(610) |
|
|
(60) |
|
Accounts payable |
|
|
665 |
|
|
440 |
|
|
1,383 |
|
Accrued expenses and other liabilities |
|
|
(1,168) |
|
|
1,060 |
|
|
604 |
|
Other long-term liabilities |
|
|
2,205 |
|
|
— |
|
|
4 |
|
Net cash provided by operating activities |
|
|
6,774 |
|
|
3,256 |
|
|
870 |
|
|
|
|
|
|
|
|
|
|
|
|
Cash flows from investing activities: |
|
|
|
|
|
|
|
|
|
|
Purchases of property and equipment |
|
|
(3,813) |
|
|
(234) |
|
|
(230) |
|
Software development costs |
|
|
(1,854) |
|
|
(940) |
|
|
(738) |
|
Purchases of intangible assets |
|
|
(29) |
|
|
— |
|
|
— |
|
Change in restricted cash |
|
|
200 |
|
|
300 |
|
|
(500) |
|
Purchase of businesses, net of cash acquired |
|
|
(5,400) |
|
|
(2,403) |
|
|
(13,448) |
|
Net cash used in investing activities |
|
|
(10,896) |
|
|
(3,277) |
|
|
(14,916) |
|
|
|
|
|
|
|
|
|
|
|
|
Cash flows from financing activities: |
|
|
|
|
|
|
|
|
|
|
Proceeds from exercise of stock options |
|
|
153 |
|
|
12 |
|
|
59 |
|
Payments for debt financing costs |
|
|
(1,521) |
|
|
(69) |
|
|
(212) |
|
Proceeds from notes payable to related parties |
|
|
— |
|
|
— |
|
|
100 |
|
Repayments of notes payable to related parties |
|
|
(250) |
|
|
(354) |
|
|
(175) |
|
Borrowings on line of credit |
|
|
6,000 |
|
|
10,000 |
|
|
— |
|
Repayments of line of credit |
|
|
(16,000) |
|
|
(6,860) |
|
|
— |
|
Payments of acquisition-related consideration |
|
|
(180) |
|
|
(1,895) |
|
|
(487) |
|
Repayment of note payable related to acquisition |
|
|
(14,337) |
|
|
— |
|
|
— |
|
Payments of initial public offering costs |
|
|
(3,346) |
|
|
(481) |
|
|
— |
|
Payments of contingent consideration |
|
|
(1,895) |
|
|
(267) |
|
|
(440) |
|
Proceeds from long-term debt |
|
|
30,000 |
|
|
— |
|
|
15,000 |
|
Repayments of long-term debt |
|
|
(47,369) |
|
|
(2,161) |
|
|
(1,704) |
|
Proceeds from issuance of common stock under initial public offering, net of underwriting costs |
|
|
55,186 |
|
|
— |
|
|
— |
|
Net cash provided by (used in) financing activities |
|
|
6,441 |
|
|
(2,075) |
|
|
12,141 |
|
Net increase (decrease) in cash |
|
|
2,319 |
|
|
(2,096) |
|
|
(1,905) |
|
Cash, beginning of period |
|
|
2,026 |
|
|
4,122 |
|
|
6,027 |
|
Cash, end of period |
|
$ |
4,345 |
|
$ |
2,026 |
|
$ |
4,122 |
|
|
|
|
|
|
|
|
|
|
|
|
Supplemental disclosure of cash flow information |
|
|
|
|
|
|
|
|
|
|
Acquisition of equipment under capital leases |
|
$ |
1,605 |
|
$ |
373 |
|
$ |
326 |
|
Additions to property, equipment, and software development purchases included in accounts payable |
|
$ |
373 |
|
$ |
46 |
|
$ |
53 |
|
Deferred offering costs included in accounts payable |
|
$ |
132 |
|
$ |
1,817 |
|
$ |
— |
|
Cash paid for interest |
|
$ |
8,457 |
|
$ |
2,409 |
|
$ |
1,080 |
|
(Decretion) accretion of redeemable convertible preferred stock to redemption value |
|
$ |
(2,439) |
|
$ |
9,966 |
|
$ |
3,884 |
|
Fair value of promissory notes entered in connection with Medliance acquisition |
|
$ |
— |
|
$ |
— |
|
$ |
14,347 |
|
Fair value of preferred stock warrants issued to lender |
|
$ |
— |
|
$ |
— |
|
$ |
1,835 |
See accompanying notes to audited consolidated financial statements.
F-6
TABULA RASA HEALTHCARE, INC.
NOTES TO CONSOLIDATED FINANCIAL STATEMENTS
(Amounts in thousands, except share and per share data)
Tabula Rasa HealthCare, Inc. (the “Company”) provides patient-specific, data-driven technology and solutions that enable healthcare organizations to optimize medication regimens to improve patient outcomes, reduce hospitalizations, lower healthcare costs and manage risk. The Company delivers its solutions through a comprehensive suite of technology-enabled products and services for medication risk management and risk adjustment. The Company serves healthcare organizations that focus on populations with complex healthcare needs and extensive medication requirements. The Company's suite of cloud-based software solutions provides prescribers, pharmacists and healthcare organizations with sophisticated and innovative tools to better manage the medication-related needs of patients.
On October 4, 2016, the Company closed its initial public offering (the “IPO”) in which the Company issued and sold 4,300,000 shares of common stock, plus the exercise of the underwriters’ option to purchase an additional 645,000 shares of common stock, at an issuance price of $12.00 per share. The Company received net proceeds of $55,186 after deducting underwriting discounts and commissions of $4,154 but before deducting other offering expenses. In addition, upon the closing of the IPO, all of the Company’s then outstanding Class A Non-Voting common stock and Class B Voting common stock, totaling 5,583,405 shares, were automatically redesignated into shares of common stock, and all of the Company’s then outstanding convertible preferred stock converted into an aggregate of 5,089,436 shares of common stock. In addition, 202,061 shares of common stock were issued upon the automatic net exercise of outstanding warrants to purchase common stock that would have otherwise terminated immediately prior to the closing of the IPO. Additionally, in connection with the closing of the IPO, outstanding warrants to purchase shares of preferred stock converted into warrants to purchase an aggregate of 463,589 shares of common stock.
Upon completion of the IPO on October 4, 2016, the Company filed an amended and restated certificate of incorporation to, among other things, state that the aggregate number of shares of stock that the Company is authorized to issue is 100,000,000 shares of common stock, par value $.0001 per share, and 10,000,000 shares of undesignated preferred stock, par value $.0001 per share.
2. Summary of Significant Accounting Policies
(a) Basis of Presentation
The accompanying consolidated financial statements of the Company have been prepared in accordance with U.S. generally accepted accounting principles (“GAAP”) and applicable rules and regulations of the Securities and Exchange Commission (the “SEC”) regarding annual financial reporting. Any reference in these notes to applicable guidance is meant to refer to the authoritative United States GAAP as found in the Accounting Standards Codification ("ASC") and Accounting Standards Update ("ASU") of the Financial Accounting Standards Board ("FASB"). The accompanying consolidated financial statements include the accounts of the Company and its wholly owned subsidiaries. All intercompany accounts and transactions have been eliminated in consolidation.
(b) Reverse Stock Split
The Company effected a 1-for-1.94 reverse split of its common stock on September 16, 2016. The reverse split combined each 1.94 shares of the Company's issued and outstanding common stock into one share of common stock and correspondingly adjusted the conversion prices of its convertible preferred stock. No fractional shares were issued in connection with the reverse split. Any fractional shares resulting from the reverse split were rounded down to the nearest whole share, and in lieu of any fractional shares the Company will pay a cash amount to the holder of such fractional share equal to the fair market value of such fractional share as determined by the Company’s Board of Directors (the “Board”). All share, per share and related information presented in the consolidated financial statements and accompanying notes have been retroactively adjusted, where applicable, to reflect the reverse stock split.
F-7
TABULA RASA HEALTHCARE, INC.
NOTES TO CONSOLIDATED FINANCIAL STATEMENTS (Continued)
(Amounts in thousands, except share and per share data)
(c) Liquidity
The Company's audited consolidated financial statements have been prepared on the basis of continuity of operations, realization of assets and the satisfaction of liabilities in the ordinary course of business. Management believes that the Company's cash on hand of $4,345 as of December 31, 2016, cash flows from operations and borrowing availability under the Amended 2015 Revolving Line (Note 10) are sufficient to fund the Company's planned operations through at least March 31, 2018.
(d) Use of Estimates
The preparation of consolidated financial statements in conformity with GAAP requires management to make estimates and assumptions that affect the reported amounts of assets and liabilities, disclosure of contingent assets and liabilities at the date of the financial statements and the reported amounts of revenues and expenses during the reporting period. Actual results could differ from those estimates or assumptions.
On an ongoing basis, management evaluates its estimates and assumptions, including, but not limited to, those related to: (i) the fair value of assets acquired and liabilities assumed for business combinations, (ii) the valuation of the Company's common and preferred stock prior to the IPO, (iii) the recognition and disclosure of contingent liabilities, (iv) the useful lives of long-lived assets (including definite-lived intangible assets), (v) the evaluation of revenue recognition criteria, (vi) assumptions used in the Black-Scholes option-pricing model to determine the fair value of equity and liability classified warrants and stock-based compensation instruments and (vii) the realizability of long-lived assets, including goodwill and intangible assets. These estimates are based on historical data and experience, as well as various other factors that management believes to be reasonable under the circumstances, the results of which form the basis for making judgments about the carrying value of assets and liabilities that are not readily apparent from other sources. The Company has engaged and may, in the future, engage third-party valuation specialists to assist with estimates related to the valuation of its preferred and common stock, in addition to the valuation of assets and liabilities acquired. Such estimates often require the selection of appropriate valuation methodologies and models, and significant judgment in evaluating ranges of assumptions and financial inputs. Actual results may differ from those estimates under different assumptions or circumstances.
(e) Revenue Recognition
The Company recognizes revenue from product sales or services rendered when (i) persuasive evidence of an arrangement exists, (ii) services have been rendered, (iii) the price to its client is fixed or determinable and (iv) collectability is reasonably assured.
When the Company enters into arrangements with multiple deliverables, it applies the accounting guidance for revenue arrangements with multiple deliverables and evaluates each deliverable to determine whether it represents a separate unit of accounting based on the following criteria: (i) whether the delivered item has value to the customer on a standalone basis, and (ii) if the contract includes a general right of return relative to the delivered item, delivery or performance of the undelivered item(s) is considered probable and substantially in the control of the Company. Revenue is allocated to each element in an arrangement based on a selling price hierarchy. The selling price for a deliverable is based on estimated selling prices ("ESP") as vendor specific objective evidence or third party evidence is not available. The Company establishes ESP for the elements of its arrangements based upon its pricing practices and class of customers. The stated prices for the various deliverables of the Company's contracts are consistent across classes of customers.
Product Revenue
The Company enters into multiple-element arrangements with healthcare organizations to provide software enabled medication risk management solutions. Under these contracts, revenue is generated through the components listed below.
F-8
TABULA RASA HEALTHCARE, INC.
NOTES TO CONSOLIDATED FINANCIAL STATEMENTS (Continued)
(Amounts in thousands, except share and per share data)
Prescription medication revenue
The Company sells prescription medications directly to healthcare organizations through its prescription fulfillment pharmacies. Prescription medication fees are based upon the prices stated in customer contracts for the prescription and include a dispensing fee. Prescription medication revenue, including dispensing fees, is recognized when the product is shipped to the customer. Prescription medications are considered a separate unit of accounting.
Per member per month fees — medication risk management services
The Company receives a fixed monthly administrative fee for each member in the program contracted for medication risk management services. This fee, which is included in Product Revenue in the consolidated statement of operations, is recognized on a monthly basis as medication risk management services are provided. The services associated with the per member per month fees are considered a separate unit of accounting.
Service Revenue
The Company enters into contracts with healthcare organizations to provide (i) risk adjustment and (ii) pharmacy cost management services, which include training client staff and providers about documentation and diagnosis coding, analyzing clients' data collection and submission processes, and delivering meaningful analytics for understanding reimbursement complexities. In 2016, the Company also began providing medication risk management services utilizing the Medication Risk Mitigation Matrix (“MRM Matrix”) technology alone, without the related fulfillment services, which are referred to as MRM Service Contracts. These MRM Service Contracts were structured under a fixed fee arrangement, which provided for all performance obligations to be completed by December 31, 2016.
Under the risk adjustment contracts and MRM Service Contracts, there are generally three revenue generating components:
Set up fees:
The Company's contracts with its risk adjustment and MRM Service Contract customers often require customers to pay non-refundable set up fees, which are deferred and recognized over the estimated term of the contract. These fees are charged at the beginning of the customer relationship as compensation for the Company's efforts to prepare the customer and configure its system for the data collection process. The set up activities do not represent a separate unit of accounting as they do not have value apart from the broader risk adjustment and MRM Service Contracts. Incremental direct costs associated with such set up activities are also deferred and amortized over the shorter of the estimated customer life or stated contract period
Per member per month fees
The Company receives a fixed monthly fee for each member in the respective programs. These services represent a separate unit of accounting and are offered independently from any other services. Revenue for these services is recognized each month as the services are performed.
Hourly consulting fees
The Company sometimes contracts with customers to perform various other services. Such services are billed on a time and materials basis, at agreed hourly rates. Consulting services represent a separate unit of accounting and are offered independently from any other services. Revenue for these services is recognized as time is incurred on the project.
The Company's pharmacy cost management services include subscription revenue from customers and revenues from drug manufacturers for the sale of drug utilization data. Subscription revenue is recognized monthly as either a flat
F-9
TABULA RASA HEALTHCARE, INC.
NOTES TO CONSOLIDATED FINANCIAL STATEMENTS (Continued)
(Amounts in thousands, except share and per share data)
fee or as a percentage of monthly transactions incurred. Data and statistics fees from drug manufacturers are recognized as revenue when received due to the unpredictable nature of the payments and because fees are not fixed and determinable until received.
(f) Cost of Product Revenue
Cost of product revenue includes all costs directly related to the medication risk management offering, including costs relating to the Company's pharmacists' collaboration on a patient's medication management, clinical analysis of the results and, when necessary, offering guidance to the prescriber based upon the review of the medication risk mitigation matrix and the individual patient's medical history, as well as the fulfillment and distribution of prescription drugs. Costs consist primarily of the purchase price of the prescription drugs the Company dispenses, expenses to package, dispense and distribute prescription drugs, expenses associated with the Company's medication care plan support centers and prescription fulfillment centers, including employment costs and stock-based compensation, and expenses related to the hosting of the Company's technology platform. Such costs also include direct overhead expenses, as well as allocated miscellaneous overhead costs. The Company allocates miscellaneous overhead costs among functions based on employee headcount.
(g) Cost of Service Revenue
Cost of service revenue includes all labor costs, including stock-based compensation expense, directly related to the risk adjustment and pharmacy cost management services and expenses for claims processing, technology services and overhead costs.
(h) Research and Development
Research and development expenses consist primarily of salaries and related costs, including stock-based compensation expense, for personnel in the Company's research and development functions, costs relating to the design and development of new software and technology and new service offerings as well as enhancement of existing software and technology and new service offerings, including fees paid to third-party consultants, costs relating to quality assurance and testing, and other allocated facility-related overhead and expenses. Costs incurred in research and development are charged to expense as incurred.
(i) Stock-Based Compensation
The Company accounts for stock-based awards granted to employees and directors in accordance with ASC Topic 718, Compensation — Stock Compensation, which requires that compensation cost be recognized for awards based on the grant-date fair value of the award. That cost is recognized on a straight-line basis over the period during which an employee or director is required to provide service in exchange for the award — the requisite service period ("vesting period"). The grant-date fair value of employee and director stock-based awards is determined using the Black-Scholes option-pricing model.
Compensation expense for options granted to non-employees is determined based on the fair value of the consideration received or the fair value of the equity instruments issued, whichever is more reliably measured. Compensation expense is recognized over the period during which services are rendered by such non-employees until completed on a straight-line basis over the vesting period on each separate vesting tranche of the award, or the accelerated attribution method. At the end of each financial reporting period prior to completion of the service, the fair value of these awards is remeasured using the then-current fair value of the Company's common stock and updated assumption inputs in the Black-Scholes option-pricing model.
The Company classifies stock-based compensation expense in its statement of operations in the same manner in which the award recipient's payroll costs or recipients' service payments are classified.
F-10
TABULA RASA HEALTHCARE, INC.
NOTES TO CONSOLIDATED FINANCIAL STATEMENTS (Continued)
(Amounts in thousands, except share and per share data)
The fair value of each stock option is estimated on the date of grant using the Black-Scholes option-pricing model. The Company had been a private company until its common stock commenced public trading on September 29, 2016, and therefore lacks company-specific historical and implied volatility information. Therefore, the Company estimated its expected stock volatility based on the historical volatility of a publicly traded set of peer companies and expects to continue to do so until such time as it has adequate historical data regarding the volatility of its own traded stock price. The expected term of the Company's stock options has been determined utilizing the "simplified" method. The expected term of the stock options granted to non-employees is equal to the contractual term of the option award. The risk-free interest rate is determined by reference to the U.S. Treasury yield curve in effect at the time of grant of the award for time periods approximately equal to the expected term of the award. Expected dividend yield is based on the fact that the Company has never paid cash dividends and does not expect to pay any cash dividends in the foreseeable future.
(j) Income Taxes
Income taxes are accounted for under the asset and liability method. Deferred tax assets and liabilities are recognized for the future tax consequences attributable to differences between the financial statement carrying amounts of existing assets and liabilities and their respective tax bases and operating loss and tax credit carryforwards. Deferred tax assets and liabilities are measured using enacted tax rates expected to apply to taxable income in the years in which those temporary differences are expected to be recovered or settled. The effect on deferred tax assets and liabilities of a change in tax rates is recognized in the period that includes the enactment date. Valuation allowances are provided when necessary to reduce deferred tax assets to the amount expected to be realized.
(k) Accretion (Decretion) of Redeemable Convertible Preferred Stock
Accretion of redeemable convertible preferred stock included the accretion of accruing dividends on and issuance costs of the Company's Series A, Series A-1 and Series B redeemable convertible preferred stock. The carrying values of Series A and Series A-1 redeemable convertible preferred stock were being accreted to their respective redemption values at each reporting period using the effective interest method, from the date of issuance to the earliest date the holders could demand redemption. The carrying value of Series B redeemable convertible preferred stock was being accreted (decreted) to redemption value at each reporting period at the greater of (i) the original issuance price plus unpaid accrued dividends or (ii) the fair value of the redeemable convertible preferred stock. Upon the completion of the IPO on October 4, 2016, the preferred stock automatically converted into shares of common stock.
(l) Net Income (Loss) per Share Attributable to Common Stockholders
The Company uses the two-class method to compute net income (loss) attributable to common stockholders because the Company had issued securities, other than common stock, that contractually entitle the holders to participate in dividends and earnings of the Company. The two-class method requires net income (loss) applicable to common stockholders for the period, after an allocation of earnings to participating securities, to be allocated between common and participating securities based upon their respective rights to receive distributed and undistributed earnings. The Company's preferred stockholders were entitled to receive annual cumulative dividends payable prior and in preference to dividends paid to holders of common stock when, as and if declared by the Company's Board. In the event a dividend was paid on common stock, holders of preferred stock were entitled to a proportionate share of any such dividend as if they were holders of common shares (on an as-if converted basis). Immediately prior to the closing of the IPO on October 4, 2016, all accumulated dividends were forfeited upon conversion of preferred stock into shares of common stock.
(m) Cash
Cash at December 31, 2016 and 2015 consists of cash on deposit with banks. The Company considers all highly liquid investments with a maturity of three months or less when purchased to be cash equivalents. The Company did not have any cash equivalents as of December 31, 2016 or 2015.
F-11
TABULA RASA HEALTHCARE, INC.
NOTES TO CONSOLIDATED FINANCIAL STATEMENTS (Continued)
(Amounts in thousands, except share and per share data)
(n) Restricted cash
Restricted cash at December 31, 2015 consisted of cash required to be held for deferred payments associated with the St. Mary Prescription Pharmacy (“SMPP”) acquisition. There was no restricted cash at December 31, 2016.
(o) Accounts Receivable, net
Accounts receivable are recorded at the invoiced amount and do not bear interest. The Company maintains an allowance for doubtful accounts for estimated losses inherent in its accounts receivable portfolio. In establishing the required allowance, management considers historical losses adjusted to take into account current market conditions and its clients' financial condition, the amount of receivables in dispute and the current receivables aging and current payment patterns. The Company reviews its allowance for doubtful accounts monthly. The allowance for doubtful accounts was $39 and $49 as of December 31, 2016 and 2015, respectively.
(p) Inventories
Inventories consist of prescription medications and are stated at the lower of cost or market. Cost is determined using the first-in, first-out method.
(q) Property and Equipment, net
Property and equipment are stated at cost less accumulated depreciation. Additions or improvements that increase the useful life of existing assets are capitalized, while expenditures for repairs and maintenance that do not improve or extend the lives of the respective assets are charged to expense as incurred. Depreciation is recognized using the straight-line method over the estimated useful lives of the assets. The Company depreciates computer hardware and purchased software over a life of three years and office furniture and equipment over a life of five years. Leasehold improvements are amortized over the shorter of the estimated useful life of the asset or the lease term. Property and equipment under capital leases are amortized over the shorter of the lease term or the estimated useful life of the asset. Upon retirement or sale, the cost and related accumulated depreciation of assets disposed of are removed from the accounts and any resulting gain or loss is included in the consolidated statements of operations.
(r) Software Development Costs, net
Certain development costs of the Company's internal-use software are capitalized in accordance with ASC Topic 350, Intangibles — Goodwill and Other ("ASC 350"), which outlines the stages of computer software development and specifies when capitalization of costs is required. The Company capitalizes certain costs incurred in connection with obtaining or developing internal-use software, including external direct costs of material and services and payroll costs for employees directly involved with the software development. Projects that are determined to be in the development stage are capitalized. Subsequent additions, modifications, or upgrades to internal-use software are capitalized to the extent that they allow the software to perform tasks it previously did not perform. Capitalized software costs are amortized beginning when the software project is substantially complete and the asset is ready for its intended use. Capitalized internal-use software costs are amortized using the straight-line method over the remaining estimated useful life of the assets, which is generally three years. Costs incurred in the preliminary project stage and post-implementation stage, as well as maintenance and training costs, are expensed as incurred as part of research and development expense.
(s) Deferred Offering Costs
The Company capitalized certain legal, accounting and other third-party fees that were directly associated with the IPO as deferred offering costs (non-current). After the IPO on October 4, 2016 (Note 1), deferred offering costs of $3,960 were recorded in stockholders' equity as a reduction of additional paid-in capital generated as a result of the IPO. Deferred offering costs recorded in other assets on the consolidated balance sheets were $2,298 as of December 31, 2015.
F-12
TABULA RASA HEALTHCARE, INC.
NOTES TO CONSOLIDATED FINANCIAL STATEMENTS (Continued)
(Amounts in thousands, except share and per share data)
(t) Goodwill
Goodwill consists of the excess purchase price over fair value of net tangible and intangible assets acquired.
Goodwill is not amortized, but instead tested for impairment annually. Goodwill is assessed for impairment on October 1st of each year or more frequently if events or changes in circumstances indicate that the asset might be impaired. ASU 2011-08, Testing Goodwill for Impairment, provides an entity the option to perform a qualitative assessment to determine whether it is more-likely-than-not that the fair value of a reporting unit is less than its carrying amount prior to performing the two-step goodwill impairment test. If this is the case, the two-step goodwill impairment test is required. If it is more-likely-than-not that the fair value of a reporting unit is greater than its carrying amount, the two-step goodwill impairment test is not required.
If the two-step goodwill impairment test is required, first, the fair value of the reporting unit is compared with its carrying amount (including goodwill). If the fair value of the reporting unit is less than its carrying amount, an indication of goodwill impairment exists for the reporting unit and the entity must perform step two of the impairment test (measurement). Under step two, an impairment loss is recognized for any excess of the carrying amount of the reporting units' goodwill over the implied fair value of that goodwill. The implied fair value of goodwill is determined by allocating the fair value of the reporting unit in a manner similar to a purchase price allocation and the residual fair value after this allocation is the implied fair value of the reporting unit goodwill. Fair value of the reporting unit is determined using a discounted cash flow analysis. If the fair value of the reporting unit exceeds its carrying amount, step two does not need to be performed.
For the years ended December 31, 2016 and 2015, the Company performed a qualitative assessment of goodwill and determined that it is not more-likely-than-not that the fair values of its reporting unit is less than the carrying amount. Accordingly, no impairment loss was recorded for the years ended December 31, 2016 or 2015.
(u) Impairment of Long-Lived Assets Including Other Intangible Assets
Long-lived assets consist of property and equipment, software development costs and definite-lived intangible assets. Long-lived assets to be held and used are tested for recoverability whenever events or changes in business circumstances indicate that the carrying amount of the assets may not be fully recoverable. Factors that the Company considers in deciding when to perform an impairment review include significant underperformance of the business in relation to expectations, significant negative industry or economic trends and significant changes or planned changes in the use of the assets. If an impairment review is performed to evaluate a long-lived asset for recoverability, the Company compares forecasts of undiscounted cash flows expected to result from the use and eventual disposition of the long-lived asset to its carrying value. An impairment loss would be recognized when estimated undiscounted future cash flows expected to result from the use of an asset are less than its carrying amount. The impairment loss would be based on the excess of the carrying value of the impaired asset over its fair value, determined based on discounted cash flows. To date, the Company has not recorded any impairment losses on long-lived assets.
(v) Deferred Debt Financing Costs
Costs related to obtaining debt financing are capitalized and amortized to interest expense over the term of the related debt using the effective-interest method. If debt is prepaid or retired early, the related unamortized deferred financing costs are written off in the period the debt is retired. Deferred financing costs of $59 and $175, net of accumulated amortization, are included in other assets on the accompanying consolidated balance sheets as of December 31, 2016 and 2015, respectively.
Effective January 1, 2016, the Company adopted ASU 2015-03, Simplifying the Presentation of Debt Issuance Costs, which requires that debt issuance costs be reported in the balance sheet as a direct deduction from the face amount of the associated debt. Previously, the Company reported these costs in "Other assets" in the Company's consolidated balance sheets. The Company continues to defer the issuance costs related to its line of credit arrangement in "Other
F-13
TABULA RASA HEALTHCARE, INC.
NOTES TO CONSOLIDATED FINANCIAL STATEMENTS (Continued)
(Amounts in thousands, except share and per share data)
assets". The new guidance has been applied on a retrospective basis whereby prior-period financial statements have been adjusted to reflect the application of the new guidance, as required by the FASB and resulted in the reclassification of $105 as of December 31, 2015 from other assets to current portion of long-term debt.
(w) Deferred Rent
Rent expense is recorded on a straight-line basis over the term of the lease. Lease incentives, including tenant improvement allowances, are recorded to deferred rent and amortized on a straight-line basis over the lease term. Approximately $13 and $94 of deferred rent are included in accrued expenses and other liabilities in the accompanying consolidated balance sheets as of December 31, 2016 and 2015, respectively. Approximately $2,205 of deferred rent is included in long-term liabilities in the accompanying balance sheets as of December 31, 2016.
(x) Warrant Liability
Warrants to purchase shares of the Company’s preferred stock were classified as warrant liability and recorded at fair value. This warrant liability was subject to remeasurement at each balance sheet date and the Company recognized any change in fair value in its statements of operations as a change in fair value of the warrant liability. Upon the closing of the IPO on October 4, 2016, the warrants converted into shares to purchase common stock and the warrant liability was reclassified to additional paid-in capital, a component of stockholders' equity.
(y) Contingencies
Liabilities for loss contingencies arising from claims, assessments, litigation, fines, penalties and other sources are recorded when it is probable that a liability has been incurred and the amount can be reasonably estimated. Legal fees and other expenses related to litigation are expensed as incurred and included in general and administrative expenses in the consolidated statements of operations.
(z) Shipping and Handling Costs
Shipping and handling costs are charged to cost of product revenue when incurred. Shipping and handling costs totaled $2,673, $1,876, and $1,394 for the years ended December 31, 2016, 2015, and 2014, respectively.
(aa) Advertising Costs
Advertising costs are charged to operations when the advertising first takes place. The Company incurred advertising expense of $117, $43, and $39 for the years ended December 31, 2016, 2015, and 2014, respectively.
(bb) Business Combinations
The costs of business combinations are allocated to the assets acquired and liabilities assumed, in each case based on estimates of their respective fair values at the acquisition dates, using the purchase method of accounting. Fair values of intangible assets are estimated by valuation models prepared by management and third-party specialists. The assets purchased and liabilities assumed have been reflected in the Company's consolidated balance sheets, and the results are included in the consolidated statements of operations and consolidated statements of cash flows from the date of acquisition. Acquisition-related contingent consideration is classified as a liability and measured at fair value at the acquisition date with changes in fair value after the acquisition date affecting earnings in the period of the estimated fair value change. Acquisition-related transaction costs, including legal and accounting fees and other external costs directly related to the acquisition, are recognized separately from the acquisition and expensed as incurred in general and administrative expenses in the consolidated statements of operations. Unanticipated events and circumstances may occur that may affect the accuracy or validity of such assumptions, estimates, or actual results.
F-14
TABULA RASA HEALTHCARE, INC.
NOTES TO CONSOLIDATED FINANCIAL STATEMENTS (Continued)
(Amounts in thousands, except share and per share data)
(cc) Segment Data
The Company manages its operations as a single segment for the purposes of assessing performance and making operating decisions. The Company's chief operating decision maker allocates resources and assesses performance based upon financial information at the consolidated level. The Company's chief operating decision maker is the Chief Executive Officer. Since the Company operates in one operating segment, all required financial segment information can be found in the consolidated financial statements. All revenues are generated and all tangible assets are held in the United States.
(dd) Concentration of Credit Risk
The Company's medication risk management and risk adjustment clients consist primarily of healthcare organizations, which are sponsors of the federal Medicare Part D plan (prescription drug coverage plan) and dual funded by Medicaid and Medicare and, therefore, subject to the reporting requirements established by the Centers for Medicaid and Medicare Services ("CMS"). Under CMS guidelines, Medicare Part D sponsors are required to remit payment for claims within 14 calendar days of the date on which an electronic claim is received and within 30 calendar days of the date on which non-electronically submitted claims are received. The Company extends credit to clients based upon such terms, as well as management's evaluation of creditworthiness, and generally collateral is not required.
The Company’s pharmacy cost management clients consist primarily of post-acute care facilities. Credit associated with these accounts is extended based upon management’s evaluation of creditworthiness and is monitored on an on-going basis.
As of December 31, 2016, two clients represented 12% and 10% of net accounts receivable, respectively. As of December 31, 2015, one client represented 12% of net accounts receivable.
For the year ended December 31, 2016, no single client accounted for more than 10% of total revenue. For the year ended December 31, 2015, one client accounted for 10% of total revenue. For the year ended December 31, 2014, two clients accounted for 11% and 10% of total revenue, respectively.
(ee) Fair Value of Financial Instruments
Certain assets and liabilities are carried at fair value under GAAP. Fair value is defined as the exchange price that would be received for an asset or paid to transfer a liability (an exit price) in the principal or most advantageous market for the asset or liability in an orderly transaction between market participants on the measurement date. Valuation techniques used to measure fair value must maximize the use of observable inputs and minimize the use of unobservable inputs. Financial assets and liabilities carried at fair value are to be classified and disclosed in one of the following three levels of the fair value hierarchy, of which the first two are considered observable and the last is considered unobservable:
Level 1 — Quoted prices in active markets for identical assets or liabilities.
Level 2 — Observable inputs (other than Level 1 quoted prices), such as quoted prices in active markets for similar assets or liabilities, quoted prices in markets that are not active for identical or similar assets or liabilities or other inputs that are observable or can be corroborated by observable market.
Level 3 — Unobservable inputs which are supported by little or no market activity and that are significant to determining the fair value of the assets or liabilities, including pricing models, discounted cash flow methodologies and similar techniques.
The fair value hierarchy also requires an entity to maximize the use of observable inputs and minimize the use of unobservable inputs when measuring fair value.
F-15
TABULA RASA HEALTHCARE, INC.
NOTES TO CONSOLIDATED FINANCIAL STATEMENTS (Continued)
(Amounts in thousands, except share and per share data)
(ff) Recent Accounting Pronouncements
In May 2014, the FASB issued ASU No. 2014-09, Revenue from Contracts with Customers ("ASU 2014-09") and has subsequently issued a number of amendments to ASU 2014-09. ASU 2014-09, as amended, represents a comprehensive new revenue recognition model that requires a company to recognize revenue to depict the transfer of promised goods or services to clients in an amount that reflects the consideration to which the Company expects to be entitled to receive in exchange for those goods or services. ASU 2014-09 sets forth a new five-step revenue recognition model which replaces the prior revenue recognition guidance in its entirety and is intended to eliminate numerous industry-specific pieces of revenue recognition guidance that have historically existed. For public companies, ASU 2014-09 is effective for annual reporting periods beginning after December 15, 2017 and interim reporting periods within that reporting period. Early adoption is permitted for annual reporting periods beginning after December 15, 2016; however, the Company does not intend to early adopt the new standard. Companies may use either a full retrospective or a modified retrospective approach to adopt ASU 2014-09.
The Company intends to adopt the new standard effective January 1, 2018 but has not yet determined which transition method will be used. The Company is currently analyzing significant contracts with customers to determine the impact of the adoption of ASU 2014-09 on the Company’s consolidated financial statements and disclosures. The Company will continue to assess all potential impacts of the standard on existing and new customer contracts during 2017, with a final evaluation of the impact of the adoption of the new standard expected to be completed by the end of 2017.
In August 2014, the FASB issued ASU No. 2014-15, Disclosure of Uncertainties about an Entity's Ability to Continue as a Going Concern ("ASU 2014-15"). ASU 2014-15 explicitly requires management to assess a company's ability to continue as a going concern, and to provide related footnote disclosures in certain circumstances. The new standard was effective in the first annual period ending after December 15, 2016. The adoption of this standard did not have a material effect on the Company’s consolidated financial statements.
In July 2015, the FASB issued ASU 2015-11, Inventory (Topic 330): Simplifying the Measurement of Inventory ("ASU 2015-11"), which simplifies the subsequent measurement of inventories by replacing the current lower of cost or market test with a lower of cost and net realizable value test. ASU 2015-11 is effective for public business entities for fiscal years beginning after December 15, 2016, and interim periods within those fiscal years. Early adoption is permitted. The Company is currently evaluating the impact of ASU 2015-11 on the Company's consolidated financial statements and does not believe adoption of this standard will have a material effect on its consolidated financial statements.
In September 2015, the FASB issued ASU No. 2015-16, Business Combinations (Topic 805): Simplifying the Accounting for Measurement-Period Adjustments ("ASU 2015-16"). The standard requires that adjustments made to provisional amounts recognized in a business combination be recorded in the period such adjustments are determined, rather than retrospectively adjusting previously reported amounts. ASU 2015-16 is effective for fiscal years, and interim periods within those years, beginning after December 15, 2015, and early adoption is permitted. The Company has adopted ASU 2015-16 for the year ended December 31, 2016. The adoption of this standard did not have a material impact on the Company's consolidated financial statements.
In February 2016, the FASB issued ASU No. 2016-02, Leases (Topic 842) ("ASU 2016-02"). The new standard establishes a right-of-use ("ROU") model that requires a lessee to record a ROU asset and a lease liability on the balance sheet for all leases with terms longer than 12 months. Leases will be classified as either finance or operating, with classification affecting the pattern of expense recognition in the income statement. ASU 2016-02 is effective for annual periods beginning after December 15, 2018, including interim periods within those annual periods, with early adoption permitted. A modified retrospective transition approach is required for lessees for capital and operating leases existing at, or entered into after, the beginning of the earliest comparative period presented in the financial statements, with certain practical expedients available. The Company is currently evaluating the potential impact of the adoption of this standard and anticipates that this standard will have a material impact on the Company’s consolidated financial statements, as all long-term leases will be capitalized on the consolidated balance sheet.
F-16
TABULA RASA HEALTHCARE, INC.
NOTES TO CONSOLIDATED FINANCIAL STATEMENTS (Continued)
(Amounts in thousands, except share and per share data)
In March 2016, the FASB issued ASU 2016-09, Compensation — Stock Compensation (Topic 718): Improvements to Employee Share-Based Payment Accounting ("ASU 2016-09"). The amendments in this update will simplify certain aspects related to how share-based payments are accounted for and presented in the financial statements. The new guidance will require excess tax benefits and tax deficiencies be recorded as an income tax benefit or expense in the statement of operations when the awards vest or are settled. The excess tax benefits will be recognized regardless of the whether the benefit reduces income taxes payable in the current period. It also will allow an employer to repurchase more of an employee's shares than it can today for tax withholding purposes without triggering liability accounting and to make a policy election to account for forfeitures as they occur. ASU 2016-09 is effective for fiscal years beginning after December 15, 2016, and interim periods within those fiscal years. Early adoption is permitted in any annual or interim period for which financial statements haven't been issued or made available for issuance, but all guidance must be adopted in the same period. The Company is currently evaluating the potential impact of ASU 2016-09 on the Company's consolidated financial statements.
In August 2016, the FASB issued ASU No. 2016-15, Statement of Cash Flows (Topic 230): Classification of Certain Cash Receipts and Cash Payments ("ASU 2016-15"). ASU 2016-15 provides new guidance to reduce diversity in practice in how certain transactions are classified in the statement of cash flows. ASU 2016-15 is effective for financial statements issued for fiscal years beginning after December 15, 2017, and interim periods within those fiscal years. The Company is currently evaluating the potential impact of the adoption of ASU 2016-15 on the Company's consolidated financial statements.
In January 2017, the FASB issued Accounting Standards Update No. 2017-01, Business Combinations (“ASU 2017-01”). ASU 2017-01 provides guidance for evaluating whether a set of transferred assets and activities (the “set”) should be accounted for as an acquisition of a business or group of assets. The guidance provides a screen to determine when a set does not qualify to be a business. When substantially all of the fair value of the gross assets acquired (or disposed of) is concentrated in an identifiable asset or a group of similar assets, the set is not a business. Also to be considered a business, the set would have to include an input and a substantive process that together significantly contribute to the ability to create outputs. ASU 2017-01 is effective for financial statements issued for fiscal years beginning after December 15, 2017. The Company is currently evaluating the potential impact of the adoption of ASU 2017-01 on the Company's consolidated financial statements.
In January 2017, the FASB issued ASU No. 2017-04, Intangibles – Goodwill and Other (Topic 350): Simplifying the Test for Goodwill Impairment ("ASU 2017-04"). ASU 2017-04 simplifies the accounting for goodwill impairment by eliminating the requirement to calculate the implied fair value of goodwill to measure an impairment charge. Instead, entities will be required to record an impairment charge based on the excess of a reporting unit’s carrying value over its fair value. ASU 2017-04 is effective for financial statements issued for fiscal years beginning after December 15, 2019. The Company is currently evaluating the potential impact of the adoption of ASU 2017-04 on the Company's consolidated financial statements.
F-17
TABULA RASA HEALTHCARE, INC.
NOTES TO CONSOLIDATED FINANCIAL STATEMENTS (Continued)
(Amounts in thousands, except share and per share data)
3. Net Loss per Share
Basic net loss per share is computed by dividing net loss attributable to common stockholders by the weighted average number of shares of common stock of the Company outstanding during the period. The Company computed net loss per share of common stock in conformity with the two-class method required for participating securities for the years ended December 31, 2016, 2015, and 2014. The Company considered its redeemable convertible preferred stock to be participating securities as the holders of the preferred stock were entitled to receive a dividend in the event that a dividend was paid on common stock. Diluted net loss per share is computed by dividing net loss attributable to common stockholders by the weighted average number of shares of common stock during the period plus the impact of dilutive securities, to the extent that they are not anti-dilutive. The following table presents the calculation of basic and diluted net loss per share for the Company’s common stock:
|
|
|
Year Ended |
|||||||
|
|
|
December 31, |
|||||||
|
|
|
2016 |
|
2015 |
|
2014 |
|||
|
Numerator: |
|
|
|
|
|
|
|
|
|
|
Net loss |
|
$ |
(6,250) |
|
$ |
(2,864) |
|
$ |
(1,107) |
|
Decretion (accretion) of redeemable convertible preferred stock |
|
|
2,439 |
|
|
(9,966) |
|
|
(3,884) |
|
Net loss attributable to common stockholders, basic |
|
$ |
(3,811) |
|
$ |
(12,830) |
|
$ |
(4,991) |
|
Decretion of redeemable convertible preferred stock |
|
|
(2,439) |
|
|
— |
|
|
— |
|
Revaluation of warrant liability |
|
|
(639) |
|
|
— |
|
|
— |
|
Net loss attributable to common stockholders, diluted |
|
$ |
(6,889) |
|
$ |
(12,830) |
|
$ |
(4,991) |
|
Denominator (basic): |
|
|
|
|
|
|
|
|
|
|
Weighted average shares of common stock outstanding, basic |
|
|
7,486,131 |
|
|
4,318,779 |
|
|
4,052,590 |
|
Denominator (diluted): |
|
|
|
|
|
|
|
|
|
|
Weighted average shares of common stock outstanding |
|
|
7,486,131 |
|
|
4,318,779 |
|
|
4,052,590 |
|
Effect of potential dilutive securities: |
|
|
|
|
|
|
|
|
|
|
Dilutive effect from preferred stock and preferred stock warrants assuming conversion |
|
|
4,105,079 |
|
|
— |
|
|
— |
|
Weighted average shares of common stock outstanding, diluted |
|
|
11,591,210 |
|
|
4,318,779 |
|
|
4,052,590 |
|
Net loss per share attributable to common stockholders, basic |
|
$ |
(0.51) |
|
$ |
(2.97) |
|
$ |
(1.23) |
|
Net loss per share attributable to common stockholders, diluted |
|
$ |
(0.59) |
|
$ |
(2.97) |
|
$ |
(1.23) |
The following potential common shares, presented based on amounts outstanding at each period end, were excluded from the calculation of diluted net loss per share attributable to common stockholders for the periods indicated because including them would have had an anti-dilutive effect:
|
|
|
Year Ended |
||||
|
|
|
December 31, |
||||
|
|
|
2016 |
|
2015 |
|
2014 |
|
Stock options to purchase common stock |
|
3,059,690 |
|
2,791,754 |
|
2,845,226 |
|
Restricted stock |
|
722,646 |
|
— |
|
— |
|
Common stock warrants |
|
32,216 |
|
446,593 |
|
442,108 |
|
Preferred stock warrants (as converted to common stock) |
|
— |
|
463,589 |
|
463,589 |
|
Redeemable convertible preferred stock (as converted to common stock) |
|
— |
|
5,089,436 |
|
5,089,436 |
|
|
|
3,814,552 |
|
8,791,372 |
|
8,840,359 |
On October 4, 2016, the Company closed its IPO in which the Company issued and sold 4,300,000 shares of common stock, plus the exercise of the underwriters’ option to purchase an additional 645,000 shares, at an issuance price of $12.00 per share. See Notes 1 and 13 for additional information.
F-18
TABULA RASA HEALTHCARE, INC.
NOTES TO CONSOLIDATED FINANCIAL STATEMENTS (Continued)
(Amounts in thousands, except share and per share data)
4. Acquisitions
St. Mary Prescription Pharmacy
On January 7, 2014, the Company acquired all of the authorized, issued and outstanding shares of capital stock of J.A. Robertson, Inc., doing business as St. Mary Prescription Pharmacy (“SMPP”). SMPP is a pharmacy based in San Francisco, California that has been servicing the needs of Program of All-inclusive Care for the Elderly participants for over 30 years. The acquisition consideration was comprised of cash consideration of up to $2,000 and stock consideration of up to 108,247 shares of Class A Non-Voting common stock. The Company paid $1,000 cash and issued 54,124 shares of common stock upon closing of the acquisition, with the remaining cash and stock consideration payments to be made on the six-month, 12-month, and 24-month anniversary date of the closing date. The first two cash payments made subsequent to the closing date were contingent upon the achievement of specified revenue targets. The final payment on the 24-month anniversary of the closing date would be paid if the Company did not make any claims for indemnification pursuant to the purchase agreement.
The Company paid $500 in cash and issued 27,062 shares of the Company's common stock, with a fair value of $96, in the third quarter of 2014, and $300 in cash and 16,237 shares of the Company's common stock, with a fair value of $94, in the first quarter of 2015 in satisfaction of the SMPP acquisition-related contingent consideration.
During the first quarter of 2016, the Company made a final cash payment of $185, which included a $15 reduction for an indemnification claim made by the Company pursuant to the purchase agreement, and issued 10,824 shares of common stock, with a fair value of $35, in satisfaction of the remaining obligations under the purchase agreement.
Capstone
On April 22, 2014, the Company used the funds provided by the April 2014 Eastward Loan (see Note 10) to acquire substantially all of the assets, and assumed certain liabilities, of Capstone Performance Systems, LLC (“Capstone”), a consulting business providing expert Medicare risk adjustment services for healthcare organizations. The acquisition consideration was comprised of cash consideration consisting of $3,000 paid upon closing, $500 paid during the fourth quarter of 2014, and $2,000 paid during the second quarter of 2015. The acquisition-related cash consideration of $500 paid during the fourth quarter of 2014 was recorded at its acquisition date fair value of $487 and a $13 discount was amortized to interest expense using the effective interest method through its payment date in the fourth quarter of 2014. The acquisition-related consideration of $2,000 paid during the second quarter of 2015 was recorded at its acquisition date fair value of $1,895 and a $105 discount was amortized to interest expense using the effective interest method through its consideration payment date. The Company amortized $33 and $72 of the discount to interest expense for the years ended December 31, 2015 and 2014, respectively. The Company also paid $577 in cash and issued 18,418 shares of the Company's common stock, with a fair value of $107, in the second quarter of 2015 in full satisfaction of the acquisition-related contingent consideration.
Medliance LLC
On December 31, 2014, the Company acquired all of the authorized, issued and outstanding equity interests of Medliance LLC ("Medliance"), which provides pharmacy cost management services through data analytics. The acquisition consideration was comprised of $16,385 in non-cash consideration in the form of promissory notes to the sellers with a fair value of $14,347 (Note 9) and cash consideration consisting of $12,000 payable upon closing and contingent purchase price consideration with an estimated fair value of $7,300 ("Medliance Earnout") due upon achieving specified revenue targets as of the 12, 24 and 36 month anniversaries of the acquisition. The Company paid $9,597 in cash upon closing in the fourth quarter of 2014, with the remaining $2,403 paid in the first quarter of 2015.
The aggregate Medliance acquisition-related contingent consideration is equal to the difference of (i) the product of yearly revenue for the 2015 calendar year multiplied by 4.5 minus (ii) $26,000 (the "Aggregate Earn-Out Amount"). The Aggregate Earn-Out Amount is payable in cash, subject to achieving specified revenue targets, at three
F-19
TABULA RASA HEALTHCARE, INC.
NOTES TO CONSOLIDATED FINANCIAL STATEMENTS (Continued)
(Amounts in thousands, except share and per share data)
intervals: one-third following the 12-month anniversary of the closing date (the "Twelve Month Contingent Payment Date"), one-third following the 24-month anniversary of the closing date (the "Twenty-four Month Contingent Payment Date") and the Aggregate Earn-Out Amount less any portion actually paid at the Twelve Month Contingent Payment Date and Twenty-four Month Contingent Payment Date, following the 36-month anniversary of the closing date.
The Aggregate Earn-Out Amount is payable based on the yearly revenue of the acquired business during the twelve month period preceding each Contingent Payment Date ("Measurement Period"). If the yearly revenue is equal to or exceeds the 2015 Medliance calendar year revenue target ("Yearly Revenue Target") during a Measurement Period, the portion of the Aggregate Earn-Out Amount due, as defined above, is payable in full. If the yearly revenue is less than the Yearly Revenue Target for a Measurement Period, then an amount shall be payable equal to the portion of the Aggregate Earn-Out Amount due multiplied by a fraction, the numerator of which is the yearly revenue for the Measurement Period and the denominator of which is the Yearly Revenue Target.
The Company, with the assistance of a third-party appraiser, utilized a Monte Carlo simulation to estimate the acquisition-date fair value of the acquisition-related contingent consideration. The fair value measurement was based on significant inputs not observable in the market and thus represents a Level 3 measurement within the fair value hierarchy (see Note 15).
9179-1916 Quebec Inc.
On September 15, 2016, the Company acquired certain assets, consisting primarily of intellectual property and software assets of 9176-1916 Quebec Inc. (an entity indirectly controlled by the Company’s Chief Scientific Officer, Jacques Turgeon). The intellectual property and software assets were previously licensed by the Company and are integrated into the Company’s Medication Risk Mitigation Matrix. The purchase price consisted of cash consideration of up to $6,000, consisting of $1,000 which was paid upon closing, $2,200 paid on November 2, 2016, $2,200 paid on December 9, 2016, and $600 following the 12-month anniversary of the closing date of the acquisition, which is contingent upon no claims for indemnification being made pursuant to the purchase agreement. In addition to the cash consideration, the purchase price included $5,000 worth of common stock, consisting of $2,500, or 201,353 shares, of common stock issued on November 15, 2016 and $2,500, or 194,054 shares, of common stock issued on December 29, 2016. The stock consideration issued on November 15, 2016 and on December 29, 2016 was calculated based on the arithmetic average of the daily volume-weighted average price of the Company’s common stock for the 30 business days ending on, and including, the 30th and 60th business day, respectively, following the completion of the IPO.
The deferred acquisition cash consideration of $5,000 was recorded at its acquisition-date fair value of $4,955, using an assumed cost of debt of 7.8%. The $45 discount is being amortized to interest expense using the effective interest method through the consideration payment date. The Company amortized $13 of the discount to interest expense for the year ended December 31, 2016. Additionally, the deferred stock consideration of $5,000 was recorded at its acquisition-date fair value of $4,445 and was accreted up to its payment-date fair value of $4,500. The stock consideration paid in connection with the acquisition is subject to a lock-up agreement and, as a result, a discount for lack of marketability of 10% was applied to determine the fair value of the stock consideration as of the acquisition date. These amounts are included in acquisition-related consideration payable in the consolidated balance sheets. As of December 31, 2016, the acquisition-related consideration balance was $568.
The assets acquired, and revenue generated from the acquired assets, are included in the Company’s consolidated financial statements from the date of acquisition.
The following table summarizes the final allocation of the purchase price based on the estimated fair values of the assets acquired at the date of acquisition:
|
Developed technology |
|
$ |
10,100 |
|
Trade name |
|
|
220 |
|
Goodwill |
|
|
80 |
|
Total assets acquired |
|
$ |
10,400 |
F-20
TABULA RASA HEALTHCARE, INC.
NOTES TO CONSOLIDATED FINANCIAL STATEMENTS (Continued)
(Amounts in thousands, except share and per share data)
The purchase price was allocated to identifiable intangible assets acquired based on their acquisition-date estimated fair values. The identifiable intangible assets principally included developed technology valued at $10,100 and trade name valued at $220, each of which are subject to amortization on a straight-line basis over 7 and 5 years, respectively. The weighted average amortization period for acquired intangible assets as of the date of acquisition is 6.96 years.
The Company, with the assistance of a third-party appraiser, assessed the fair value of the assets. The fair value of the developed technology was estimated using a discounted present value income approach. To calculate fair value, the Company used cash flows discounted at a rate considered appropriate given the inherent risks associated with the intangible asset. The Company believes that the level and timing of cash flows appropriately reflect market participant assumptions. The fair value of the trade name was estimated using the relief from royalty method. The Company derived the hypothetical royalty income from the incremental projected revenues related to utilizing the acquired technology.
The amortization of intangible assets is deductible for income tax purposes.
The unaudited pro forma results presented below include the results of the SMPP, Capstone, Medliance, and 9176-1916 Quebec Inc. acquisitions as if they had been consummated as of January 1, 2014. The unaudited pro forma results include the amortization associated with acquired intangible assets and interest expense on debt to fund these acquisitions. Material nonrecurring charges directly attributable to the transactions are excluded. In addition, the unaudited pro forma results do not include any expected benefits of the acquisitions. Accordingly, the unaudited pro forma results are not necessarily indicative of either future results of operations or results that might have been achieved had the acquisitions been consummated as of January 1, 2014.
|
|
|
Year Ended |
|||||||
|
|
|
December 31, |
|||||||
|
|
|
2016 |
|
2015 |
|
2014 |
|||
|
Revenue |
|
$ |
94,101 |
|
$ |
70,076 |
|
$ |
55,429 |
|
Net loss |
|
|
(7,305) |
|
|
(4,335) |
|
|
(4,535) |
|
Net loss per share attributable to common stockholders, basic |
|
|
(0.54) |
|
|
(2.39) |
|
|
(1.47) |
|
Net loss per share attributable to common stockholders, diluted |
|
|
(0.60) |
|
|
(2.39) |
|
|
(1.47) |
5. Property and Equipment
As of December 31, 2016 and 2015, property and equipment consisted of the following:
|
|
|
Estimated |
|
|
December 31, |
|||
|
|
|
useful life |
|
2016 |
|
2015 |
||
|
Computer hardware and purchased software |
|
3 years |
|
$ |
1,789 |
|
$ |
961 |
|
Office furniture and equipment |
|
5 years |
|
|
5,671 |
|
|
4,088 |
|
Leasehold improvements |
|
5-11 years |
|
|
3,744 |
|
|
441 |
|
|
|
|
|
|
11,204 |
|
|
5,490 |
|
Less: accumulated depreciation |
|
|
|
|
(4,795) |
|
|
(3,528) |
|
Property and equipment, net |
|
|
|
$ |
6,409 |
|
$ |
1,962 |
Depreciation and amortization expense on property and equipment for the years ended December 31, 2016, 2015, and 2014 were $1,267, $969, and $883, respectively.
6. Software Development Costs
As of December 31, 2016 and 2015, gross capitalized software costs were $6,501 and $4,550 and accumulated amortization was $3,151 and $2,045, respectively. Amortization expense for the years ended December 31, 2016, 2015, and 2014 was $1,106, $655, and $518, respectively. As of December 31, 2016 and 2015, there was $911 and $888, respectively, of capitalized software costs that were not yet subject to amortization.
F-21
TABULA RASA HEALTHCARE, INC.
NOTES TO CONSOLIDATED FINANCIAL STATEMENTS (Continued)
(Amounts in thousands, except share and per share data)
7. Goodwill and Intangible Assets
The Company’s goodwill and related changes during the years ended December 31, 2016 and 2015 are as follows:
|
Balance at January 1, 2015 and 2016 |
|
$ |
21,606 |
|
Goodwill from 2016 acquisition |
|
|
80 |
|
Balance at December 31, 2016 |
|
$ |
21,686 |
There were no indicators of impairment during the years ended December 31, 2016 and 2015 and there are no accumulated impairment charges as of December 31, 2016 and 2015.
Intangible assets consisted of the following as of December 31, 2016 and 2015:
|
|
|
Weighted Average |
|
|
|
|
|
|
|
|
|
|
|
Amortization Period |
Accumulated |
Intangible |
||||||||||
|
|
|
(in years) |
|
Gross Value |
|
Amortization |
|
Assets, net |
|
|||
|
|
|
|
|
|
|
|
|
|
|
|
|
|
|
December 31, 2016 |
|
|
|
|
|
|
|
|
|
|
|
|
|
Trade names |
|
5.00 |
|
$ |
1,940 |
|
$ |
(791) |
|
$ |
1,149 |
|
|
Client relationships |
|
10.02 |
|
|
14,684 |
|
|
(3,289) |
|
|
11,395 |
|
|
Non-competition agreements |
|
4.64 |
|
|
652 |
|
|
(326) |
|
|
326 |
|
|
Developed technology |
|
7.76 |
|
|
13,500 |
|
|
(1,101) |
|
|
12,399 |
|
|
Domain name |
|
10.00 |
|
|
29 |
|
|
(1) |
|
|
28 |
|
|
Total intangible assets |
|
|
|
$ |
30,805 |
|
$ |
(5,508) |
|
$ |
25,297 |
|
|
|
|
Weighted Average |
|
|
|
|
|
|
|
|
|
|
|
|
|
Amortization Period |
|
|
|
|
Accumulated |
|
Intangible |
|
||
|
|
|
(in years) |
|
Gross Value |
|
Amortization |
|
Assets, net |
|
|||
|
|
|
|
|
|
|
|
|
|
|
|
|
|
|
December 31, 2015 |
|
|
|
|
|
|
|
|
|
|
|
|
|
Trade names |
|
5.00 |
|
$ |
1,720 |
|
$ |
(436) |
|
$ |
1,284 |
|
|
Client relationships |
|
10.02 |
|
|
14,684 |
|
|
(1,810) |
|
|
12,874 |
|
|
Non-competition agreements |
|
4.64 |
|
|
652 |
|
|
(183) |
|
|
469 |
|
|
Developed technology |
|
10.00 |
|
|
3,400 |
|
|
(340) |
|
|
3,060 |
|
|
Total intangible assets |
|
|
|
$ |
20,456 |
|
$ |
(2,769) |
|
$ |
17,687 |
|
Amortization expense for intangible assets for the years ended December 31, 2016, 2015, and 2014 was $2,739, $2,306, and $463 respectively.
The estimated amortization expense for each of the next five years and thereafter is as follows:
|
Years Ending December 31, |
|
|
|
|
2017 |
|
$ |
3,792 |
|
2018 |
|
|
3,755 |
|
2019 |
|
|
3,649 |
|
2020 |
|
|
3,309 |
|
2021 |
|
|
3,169 |
|
Thereafter |
|
|
7,623 |
|
|
|
$ |
25,297 |
F-22
TABULA RASA HEALTHCARE, INC.
NOTES TO CONSOLIDATED FINANCIAL STATEMENTS (Continued)
(Amounts in thousands, except share and per share data)
8. Accrued Expenses and Other Liabilities
At December 31, 2016 and 2015, accrued expenses and other liabilities consisted of the following:
|
|
|
December 31, |
||||
|
|
|
2016 |
|
2015 |
||
|
Employee related expenses |
|
$ |
1,174 |
|
$ |
1,232 |
|
Deferred revenue |
|
|
851 |
|
|
520 |
|
Interest |
|
|
16 |
|
|
1,371 |
|
Deferred rent |
|
|
13 |
|
|
94 |
|
Other expenses |
|
|
105 |
|
|
27 |
|
Total accrued expenses and other liabilities |
|
$ |
2,159 |
|
$ |
3,244 |
9. Notes Payable Related to Acquisition
In December 2014, as part of the acquisition-related consideration of the Medliance acquisition (see Note 4), the Company issued multiple subordinated convertible promissory notes (the "Medliance Notes") to the owners of Medliance for aggregate borrowings of $16,385. Interest was 8% and compounded annually. All unpaid principal and unpaid accrued interest was due and payable on June 30, 2016. On July 1, 2016, the Company repaid the Medliance Notes with the proceeds from a long-term credit facility (see Note 10). Interest expense was $709, $1,310, and $4 for the years ended December 31, 2016, 2015, and 2014, respectively.
The Company recorded the Medliance Notes at their aggregate acquisition date fair values of $14,347 and the notes were accreted up to their face values of $16,385 over the 18 month term using the effective-interest method. For the years ended December 31, 2016, 2015, and 2014, the Company amortized $755, $1,280, and $3 of the discount to interest expense, respectively.
10. Lines of Credit and Long-Term Debt
(a) Lines of Credit
On December 30, 2013, the Company entered into a Loan and Security Agreement (the "2013 Revolving Line") with Silicon Valley Bank ("SVB"), which provided for borrowings in an aggregate amount up to $7,000 to be used for general corporate purposes, to fund a portion of the Company's acquisition of SMPP and for repayment of a previous line of credit and a convertible loan agreement with the New Jersey Economic Development Authority. In April 2015, the Company repaid the outstanding balance in full with a new revolving line with Bridge Bank, National Association ("Bridge Bank") pursuant to a loan and security agreement (see below). Interest expense was $127 and $383 for the years ended December 31, 2015 and 2014, respectively. For the years ended December 31, 2015 and 2014, the Company also amortized $46 of deferred financing costs associated with the 2013 Revolving Line to interest expense.
On April 29, 2015, the Company entered into a new revolving line of credit (the “2015 Revolving Line”) with Bridge Bank pursuant to a loan and security agreement, which provided for borrowings in an aggregate amount up to $15,000 to be used for general corporate purposes, including repayment of the 2013 Revolving Line. On July 1, 2016, the Company entered into a Loan and Security Modification Agreement (the "Amended 2015 Revolving Line") with Western Alliance Bank, successor in interest to Bridge Bank, whereby the 2015 Revolving Line was amended to increase the Company's borrowing availability to up to $25,000 and extend the maturity date to July 1, 2018. The Company's ability to borrow under the Amended 2015 Revolving Line is based upon a specified borrowing base equal to the Company's trailing four months of monthly recurring revenue, as defined, from eligible recurring revenue contracts, as defined, through March 31, 2017 and based upon the Company's trailing three months of monthly recurring revenue, as defined, from eligible recurring revenue contracts, as defined, thereafter. Interest on the Amended 2015 Revolving Line was also amended to be calculated at a variable rate based upon Western Alliance Bank's prime rate plus 0.5% with Western Alliance Bank's prime rate having a floor of 3.5%. Financial covenants under the Amended 2015 Revolving Line require that the Company (i) maintain an unrestricted cash and unused availability balance under the Amended
F-23
TABULA RASA HEALTHCARE, INC.
NOTES TO CONSOLIDATED FINANCIAL STATEMENTS (Continued)
(Amounts in thousands, except share and per share data)
2015 Revolving Line of at least $3,000 at all times (the liquidity covenant), (ii) maintain a minimum EBITDA, as defined, of $2,000 for the quarter ending June 30, 2016, $2,250 for the quarter ending September 30, 2016, and $2,500 for the quarter ending December 31, 2016 and thereafter, and (iii) maintain a minimum monthly recurring revenue retention rate of at least 90%, measured quarterly.
As of December 31, 2016, the Company was in compliance with all of the financial covenants related to the Amended 2015 Revolving Line, and management expects that the Company will be able to maintain compliance with the financial covenants.
In September 2015, the Company arranged for Bridge Bank to issue a $500 letter of credit on its behalf in connection with the Company’s lease agreement for the office space in Moorestown, NJ (see Note 16). The letter of credit renews annually and expires in September 2027 and reduces amounts available on the line of credit.
As of December 31, 2016, there were no aggregate borrowings outstanding under the Amended 2015 Revolving Line. Amounts available for borrowings under the Amended 2015 Revolving Line were $24,500.
As of December 31, 2016, the interest rate on the Amended 2015 Revolving Line was 4.06% and interest expense was $570 and $290 for the years ended December 31, 2016 and 2015, respectively. In connection with the 2015 Revolving Line and the Amended 2015 Revolving Line, the Company recorded deferred financing costs of $141. The Company is amortizing the deferred financing costs associated with the 2015 Revolving Line to interest expense using the effective-interest method over the term of the Amended 2015 Revolving Line and amortized $46 and $35 to interest expense for the years ended December 31, 2016 and 2015, respectively.
(b) Term Loan Facility
On July 1, 2016, the Company entered into a term loan facility (the “ABC Credit Facility”) with ABC Funding, LLC, an affiliate of Summit Partners, L.P. (“Summit”). The proceeds of the initial term loan advance of $30,000 under the ABC Credit Facility were used to repay all outstanding principal and interest under the Medliance Notes, as well as loans entered into with Eastward Capital Partners V, L.P. and its affiliates in April 2014 and December 2014 with an original principal balance of $15,000 (collectively, the “Eastward Loans”). For the year ended December 31, 2016, the Company recognized a $1,396 loss on extinguishment of debt as a result of a prepayment premium and the recognition of the remaining unamortized discounts and finance costs on the Eastward Loans.
Amounts outstanding under the ABC Credit Facility bore interest at a per annum rate equal to 12.0% payable monthly in arrears. Interest expense under the ABC Credit Facility was $960 for the year ended December 31, 2016. The ABC Credit Facility had a maturity date of December 30, 2021, and was secured by a subordinated security interest in all personal property, whether presently existing or created or acquired in the future, as well as the Company's intellectual property. The Company recorded $1,487 in deferred financing costs associated with the ABC Credit Facility and was amortizing the deferred financing costs to interest expense using the effective-interest method over the term of the ABC Credit Facility. The Company amortized $69 to interest expense for the year ended December 31, 2016.
On October 4, 2016, the Company repaid all the then outstanding principal and interest on the ABC Credit Facility, as well as a prepayment penalty of $3,597, with proceeds received from the IPO and, in connection with such repayment, the ABC Credit Facility was terminated. The Company recorded a loss on debt extinguishment of $5,015 in the fourth quarter of 2016 related to the settlement of the ABC Credit Facility for the prepayment premium plus the amortization of the remaining deferred financing costs.
F-24
TABULA RASA HEALTHCARE, INC.
NOTES TO CONSOLIDATED FINANCIAL STATEMENTS (Continued)
(Amounts in thousands, except share and per share data)
(c) Other Term Loans and Capital Lease Obligations
The following table represents the total term loans and capital lease obligations of the Company at December 31, 2016 and 2015:
|
|
|
December 31, |
||||
|
|
|
2016 |
|
2015 |
||
|
Tranche A Term Loan |
|
$ |
— |
|
$ |
51 |
|
Tranche B Term Loan |
|
|
— |
|
|
28 |
|
April 2014 Eastward Loan |
|
|
— |
|
|
2,260 |
|
Unamortized finance costs on April 2014 Eastward Loan |
|
|
— |
|
|
(19) |
|
Unamortized discount on April 2014 Eastward Loan |
|
|
— |
|
|
(101) |
|
April 2014 Eastward Loan, net |
|
|
— |
|
|
2,140 |
|
December 2014 Eastward Loan |
|
|
— |
|
|
12,000 |
|
Unamortized finance costs on December 2014 Eastward Loan |
|
|
— |
|
|
(86) |
|
Unamortized discount on December 2014 Eastward Loan |
|
|
— |
|
|
(1,030) |
|
December 2014 Eastward Loan, net |
|
|
— |
|
|
10,884 |
|
Capital leases |
|
|
1,746 |
|
|
853 |
|
Total long-term debt, net |
|
$ |
1,746 |
|
$ |
13,956 |
|
Less current portion, net |
|
|
(674) |
|
|
(13,526) |
|
Total long-term debt, less current portion, net |
|
$ |
1,072 |
|
$ |
430 |
Term Loans
In January 2011, the Company entered into a loan agreement (the "Tranche A Term Loan") with Liberty Bell Bank ("Liberty Bank") that provided for aggregate borrowings of $1,265. The Tranche A Term Loan was collateralized by a first position lien upon a term life insurance policy on the life of the Company's Chairman and CEO and certain equipment, and was secured by a personal guarantee provided by the Company's Chairman and Chief Executive Officer. Interest on the Tranche A Term Loan was calculated at a fixed rate of 6.5% per year. Principal and interest were due in monthly installments of $25 through the maturity date of January 28, 2016. Interest expense on the Tranche A Term Loan was $12 and $30 for the years ended December 31, 2015 and 2014. The loan was fully repaid in January 2016.
In July 2011, the Company entered into another loan (the "Tranche B Term Loan") with Liberty Bank that provided for aggregate borrowings of $208. The Tranche B Term Loan was collateralized by a first position lien upon certain equipment and was secured by a personal guarantee provided by the Company's Chairman and Chief Executive Officer. Interest on the Tranche B Term Loan was calculated at a fixed rate of 6.5% per year. Principal and interest were due in monthly installments of $4 through the loan maturity date of July 14, 2016. Interest expense on the Tranche B Term Loan was $1, $3, and $6 for the years ended December 31, 2016, 2015, and 2014, respectively. The loan was fully repaid in July 2016.
In April 2014, the Company entered into a loan agreement with Eastward Capital Partners V, L.P. (the “April 2014 Eastward Loan”) that provided for aggregate borrowings of $3,000. The April 2014 Eastward Loan was collateralized by all of the Company's tangible and intangible assets (including its intellectual property), and was subordinated to all other credit facilities entered into and outstanding prior to the execution of the April 2014 Eastward Loan. Interest on the April 2014 Eastward Loan was calculated at an annual rate of 11.5%. Interest-only payments of $29 were due for the first twelve months commencing May 2014, subject to term adjustment, as defined, followed by monthly principal and interest installments of $114 through the April 2014 Eastward Loan maturity date of October 31, 2017. Interest expense on the April 2014 Eastward Loan was $112, $312, and $239 for the years ended December 31, 2016, 2015, and 2014, respectively.
In connection with the April 2014 Eastward Loan, the Company issued a warrant to purchase 105,005 shares of Series B Redeemable Convertible preferred stock ("Series B") at $2.86 per share for an aggregate exercise price of $300. The warrant was valued using the Black-Scholes option-pricing model and because the warrant was exercisable for a
F-25
TABULA RASA HEALTHCARE, INC.
NOTES TO CONSOLIDATED FINANCIAL STATEMENTS (Continued)
(Amounts in thousands, except share and per share data)
redeemable security it was liability classified. The estimated fair value of the preferred stock warrants on the date of issuance of $254 was recorded as a discount on the April 2014 Eastward Loan, with the corresponding credit to preferred stock liability. The preferred stock warrant was revalued at each reporting period to reflect any changes in fair value, with any gain or loss from the revaluation recorded in the statements of operations. Upon completion of the Company’s IPO, the warrants converted into warrants to purchase common stock.
The debt discount was amortized to interest expense using the effective interest method over the term of the April 2014 Eastward Loan. For the years ended December 31, 2016, 2015, and 2014, the Company amortized $40, $95, and $57, respectively, of the discount to interest expense. In connection with the April 2014 Eastward Loan, the Company recorded $61 in deferred financing costs, of which $9, $24, and $18 was amortized to interest expense using the effective-interest method in the year ended December 31, 2016, 2015 and 2014, respectively.
In December 2014, the Company entered into a loan agreement with Eastward Capital Partners V, L.P. (the "December 2014 Eastward Loan") in connection with the Medliance acquisition that provided for aggregate borrowings of $12,000. The December 2014 Eastward Loan was collateralized by all of the Company's tangible and intangible assets (including its intellectual property), and was subordinated to all other credit facilities entered into and outstanding prior to the execution of the December 2014 Eastward Loan. Interest on the December 2014 Eastward Loan was calculated at an annual rate of 12%. Interest-only payments of $120 were due for the first twelve months commencing January 2015, subject to term adjustment, as defined, followed by monthly principal and interest installments of $460 through the December 2014 Eastward Loan maturity date of June 30, 2018. Interest expense on the December 2014 Eastward Loan was $643, $1,440, and $4 for the years ended December 31, 2016, 2015, and 2014, respectively.
In connection with the December 2014 Eastward Loan, the Company issued a warrant to purchase 481,863 shares of Series B at $2.99 per share for an aggregate exercise price of $1,440. The warrant was valued using the Black-Scholes option-pricing model and because the warrant was exercisable for a redeemable security it was liability classified. The estimated fair value of the preferred stock warrant on the date of issuance of $1,581 was recorded as a discount on the December 2014 Eastward Loan, with the corresponding credit to preferred stock liability. The preferred stock warrant was revalued at each reporting period to reflect any changes in fair value, with any gain or loss from the revaluation recorded in the statements of operations. Upon completion of the Company’s IPO, the warrants converted into warrants to purchase common stock.
The debt discount was amortized to interest expense using the effective interest method over the term of the December 2014 Eastward Loan. For the years ended December 31, 2016, 2015, and 2014, the Company amortized $316, $550, and $2 of the discount to interest expense, respectively. In connection with the December 2014 Eastward Loan, the Company recorded $150 in deferred financing costs, of which $30, $64, and a de minimis amount was amortized to interest expense using the effective-interest method in the years ended December 31, 2016, 2015, and 2014, respectively.
On July 1, 2016, the Company repaid the April 2014 Eastward Loan and the December 2014 Eastward Loan with the proceeds from the ABC Credit Facility described above. As a result, all outstanding principal and interest related to the April 2014 Eastward Loan and the December 2014 Eastward Loan have been satisfied in full and the obligations under the 2014 Eastward Loan and the December 2014 Eastward Loan have been terminated.
Capital Lease Obligations
The Company has entered into leases for certain equipment and software, which are recorded as capital lease obligations. These leases have interest rates ranging from 7% to 26%. Interest expense related to the capital leases was $200, $181, and $228 and for the years ended December 31, 2016, 2015, and 2014, respectively.
Amortization of assets held under capital leases is included in depreciation and amortization expense. The net book value of equipment and software acquired under capital lease was $2,364 and $1,377 as of December 31, 2016 and 2015, respectively, and are reflected in property and equipment on the consolidated balance sheets.
F-26
TABULA RASA HEALTHCARE, INC.
NOTES TO CONSOLIDATED FINANCIAL STATEMENTS (Continued)
(Amounts in thousands, except share and per share data)
(d) Long-Term Debt Maturities
As of December 31, 2016, the Company's long-term debt consisted of capital lease obligations and is payable as follows:
|
|
Total |
|
|
|
long-term |
|
|
|
debt |
|
|
2017 |
|
868 |
|
2018 |
|
760 |
|
2019 |
|
420 |
|
2020 |
|
27 |
|
2021 |
|
3 |
|
|
|
2,078 |
|
Less amount representing interest |
|
(332) |
|
Present value of payments |
|
1,746 |
|
Less current portion |
|
(674) |
|
Total long-term debt, net of current portion |
$ |
1,072 |
(e) Other Financing
In May 2016, the Company signed a prime vendor agreement with AmerisourceBergen Drug Corporation, which was effective March 2016 and requires a monthly minimum purchase obligation of approximately $1,750. The Company fully expects to meet this requirement. This agreement was subsequently amended and restated effective May 1, 2016 with a three-year term expiring April 2019. As of December 31, 2016 and 2015, the Company had $3,327 and $3,691, respectively, due to AmerisourceBergen Drug Corporation as a result of prescription drug purchases. Pursuant to the terms of a security agreement entered into in connection with the prime vendor agreement, AmerisourceBergen also holds a subordinated security interest in all of the Company’s assets.
11. Income Taxes
The Company accounts for income taxes under ASC Topic 740 —Income Taxes ("ASC 740"). Deferred income tax assets and liabilities are determined based upon differences between financial reporting and tax bases of assets and liabilities, which are measured using the enacted tax rates and laws that will be in effect when the differences are expected to reverse.
The Company's loss before income taxes was $5,709, $2,536, and $1,516 for the years ended December 31, 2016, 2015 and 2014, respectively, and the Company has no foreign sources of income or loss.
The expense (benefit) for income taxes consists of the following:
|
|
|
Years Ended December 31, |
|||||||
|
|
|
2016 |
|
2015 |
|
2014 |
|||
|
Current: |
|
|
|
|
|
|
|
|
|
|
US federal |
|
$ |
(4) |
|
$ |
3 |
|
$ |
1 |
|
State and local |
|
|
47 |
|
|
35 |
|
|
12 |
|
Total current income tax expense |
|
|
43 |
|
|
38 |
|
|
13 |
|
Deferred: |
|
|
|
|
|
|
|
|
|
|
US federal |
|
|
440 |
|
|
278 |
|
|
(410) |
|
State and local |
|
|
58 |
|
|
12 |
|
|
(12) |
|
Total deferred income tax expense |
|
|
498 |
|
|
290 |
|
|
(422) |
|
Total income tax expense (benefit) |
|
$ |
541 |
|
$ |
328 |
|
$ |
(409) |
F-27
TABULA RASA HEALTHCARE, INC.
NOTES TO CONSOLIDATED FINANCIAL STATEMENTS (Continued)
(Amounts in thousands, except share and per share data)
For the years ended December 31, 2016, and 2015 the Company had an effective tax rate of (9.5)% and (12.9%), respectively, primarily related to deferred tax expense associated with indefinite-lived deferred tax liabilities for goodwill amortization. For the year ended December 31, 2014, the Company had an effective tax rate of 27.0% primarily related to the reversal of a portion of the valuation allowance as a result of deferred tax liabilities that were recorded in connection with the acquisition of SMPP (see Note 4), which created a source of recoverability of a portion of previously reserved deferred tax assets.
As of December 31, 2016, the Company had federal net operating loss ("NOL") carryforwards of $13,964 and state NOL carry forwards of $11,066, each of which are available to reduce future taxable income. The NOL carryforwards, if not utilized, will begin to expire in 2029 for federal purposes and in 2021 for state purposes.
The NOL carryforwards are subject to review and possible adjustment by the Internal Revenue Service and state tax authorities. The NOLs may become subject to an annual limitation in the event of certain cumulative changes in the ownership interest of significant shareholders over a three-year period in excess of 50%, as defined under Sections 382 and 383 of the Internal Revenue Code of 1986, as amended, as well as similar state tax provisions. This could limit the amount of NOLs that the Company can utilize annually to offset future taxable income or tax liabilities. The amount of the annual limitation, if any, will generally be determined based on the value of the Company immediately prior to the ownership change. Subsequent ownership changes may further affect the limitation in future years.
The tax benefits of uncertain tax positions are recognized only when the Company believes it is more likely than not that the tax position will be upheld on examination by the taxing authorities based on the merits of the position. The Company recognizes interest and penalties, if any, related to unrecognized income tax benefits in income tax expense. Through December 31, 2016, the Company had no unrecognized tax benefits or related interest and penalties accrued.
The principal components of the Company's deferred tax assets (liabilities) are as follows:
|
|
|
December 31, |
||||
|
|
|
2016 |
|
2015 |
||
|
Deferred tax assets: |
|
|
|
|
|
|
|
Net federal operating loss carry forward |
|
$ |
4,748 |
|
$ |
4,400 |
|
Net state operating loss carry forward |
|
|
599 |
|
|
404 |
|
Accruals |
|
|
256 |
|
|
178 |
|
Intangibles |
|
|
536 |
|
|
114 |
|
Stock options |
|
|
1,557 |
|
|
— |
|
Deferred rent |
|
|
862 |
|
|
— |
|
Other |
|
|
182 |
|
|
245 |
|
Deferred tax assets |
|
|
8,740 |
|
|
5,341 |
|
Less: valuation allowances |
|
|
(7,389) |
|
|
(4,489) |
|
Deferred tax assets after valuation allowance |
|
|
1,351 |
|
|
852 |
|
Deferred tax liabilities: |
|
|
|
|
|
|
|
Fixed assets |
|
|
(1,351) |
|
|
(556) |
|
Debt discount |
|
|
— |
|
|
(295) |
|
Indefinite-lived intangibles |
|
|
(832) |
|
|
(335) |
|
Deferred tax liabilities |
|
|
(2,183) |
|
|
(1,186) |
|
Net deferred tax liabilities |
|
$ |
(832) |
|
$ |
(334) |
ASC 740 requires a valuation allowance to reduce the deferred tax assets reported if, based on the weight of available evidence, it is more-likely-than-not that some portion or all of the deferred tax assets will not be realized. After consideration of all the evidence, both positive and negative, the Company has recorded a full valuation allowance against its deferred tax assets at December 31, 2016 and 2015, respectively, because the Company's management has determined that is it more-likely-than-not that these assets will not be fully realized. The Company experienced a net
F-28
TABULA RASA HEALTHCARE, INC.
NOTES TO CONSOLIDATED FINANCIAL STATEMENTS (Continued)
(Amounts in thousands, except share and per share data)
increase (decrease) in valuation allowance of $2,900 and $(137) for the years ended December 31, 2016 and 2015, respectively.
The changes in valuation allowance were as follows:
|
|
|
Year-Ended |
||||
|
|
|
December 31, |
||||
|
|
|
2016 |
|
2015 |
||
|
Balance at beginning of the period |
|
$ |
4,489 |
|
$ |
4,626 |
|
Increase (decrease) due to NOLs and temporary differences |
|
|
2,900 |
|
|
(137) |
|
Balance at end of the period |
|
$ |
7,389 |
|
$ |
4,489 |
A reconciliation of income tax (expense) benefit at the statutory federal income tax rate and income taxes as reflected in the financial statements is as follows:
|
|
|
December 31, |
|
||||||
|
|
|
2016 |
|
|
2015 |
|
|
2014 |
|
|
Federal statutory rate |
|
34.0 |
% |
|
34.0 |
% |
|
34.0 |
% |
|
State income taxes, net of federal income tax |
|
(1.6) |
|
|
(1.4) |
|
|
3.5 |
|
|
Change in fair value of warrant liabilities |
|
3.8 |
|
|
(37.4) |
|
|
(6.0) |
|
|
Change in valuation allowance |
|
(42.1) |
|
|
(1.1) |
|
|
7.1 |
|
|
Non-deductible stock compensation |
|
(2.7) |
|
|
(6.0) |
|
|
(5.1) |
|
|
Change in fair value of contingent consideration |
|
— |
|
|
— |
|
|
(4.1) |
|
|
Non-deductible expenses and other |
|
(0.9) |
|
|
(1.0) |
|
|
(2.4) |
|
|
Effective income tax rate |
|
(9.5) |
% |
|
(12.9) |
% |
|
27.0 |
% |
In the normal course of business, the Company is subject to examination by taxing authorities from the federal and state governments within the United States. As of December 31, 2016, the Company's tax years beginning in 2013 remain open for examination by taxing authorities.
12. Other Long-term Liabilities
Other long term liabilities as of December 31, 2016 consisted of $2,205, which represents the long-term portion of deferred rent related to the Company's new operating leases for office space in Moorestown, NJ.
13. Stockholders' Deficit and Redeemable Convertible Preferred Stock
(a) Capitalization and Initial Public Offering
As of December 31, 2015, the Company's amended and restated articles of incorporation stated that the aggregate number of shares of stock that the Company was authorized to issue was 38,609,749 shares with a par value of $0.0001 per share, including common stock authorized to be issued of 27,836,869 shares, consisting of 9,600,000 shares of Class A Non-Voting common stock and 18,236,869 shares of Class B Voting common stock, and convertible preferred stock authorized to be issued of 10,772,880, consisting of 4,411,766 shares of Series A Redeemable Convertible preferred stock ("Series A"), 2,812,500 shares of Series A-1 and 3,548,614 shares of Series B
On October 4, 2016, the Company closed its IPO in which the Company issued and sold 4,300,000 shares of common stock, plus the exercise of the underwriters’ option to purchase an additional 645,000 shares of common stock, at an issuance price of $12.00 per share. The Company received net proceeds of $55,186 after deducting underwriting discounts and commissions of $4,154 but before deducting other offering expenses. In addition, upon the closing of the IPO, all of the Company’s then outstanding Class A Non-Voting common stock and Class B Voting common stock, totaling 5,583,405 shares, were automatically redesignated into shares of common stock, and all of the Company’s then outstanding convertible preferred stock converted into an aggregate of 5,089,436 shares of common stock.
F-29
TABULA RASA HEALTHCARE, INC.
NOTES TO CONSOLIDATED FINANCIAL STATEMENTS (Continued)
(Amounts in thousands, except share and per share data)
Upon completion of the IPO on October 4, 2016, the Company filed an amended and restated certificate of incorporation to, among other things, state that the aggregate number of shares of stock that the Company is authorized to issue is 100,000,000 shares of common stock, par value $.0001 per share, and 10,000,000 shares of undesignated preferred stock, par value $.0001 per share.
(b) Common Stock
The holders of Class A Non-Voting common stock had the same rights, preferences, privileges, and restrictions as the holders of Class B Voting common stock with the exception of voting rights. The holders of Class B Voting common stock were entitled to one vote per share. The holders of Class A Non-Voting and Class B Voting common stock were entitled to receive dividends when, as and if declared by the Board, subject to payment of accrued dividends for redeemable convertible preferred stock. Class A Non-Voting and Class B Voting common stock were also subordinate to the redeemable convertible preferred stock with respect to liquidation, winding up and dissolution of the Company. The Class A Non-Voting and Class B Voting common stock were redesignated into shares of common stock upon the closing of the IPO. No dividends have been declared through December 31, 2016.
(c) Redeemable Convertible Preferred Stock
The Company had issued Series A, Series A-1, and Series B redeemable convertible preferred stock. The redeemable convertible preferred stock was classified outside of stockholders' deficit because the shares contained redemption features that were not solely within the control of the Company. Issuance costs incurred in connection with the sale of preferred stock were being accreted on a straight-line basis through the earliest redemption period, which was June 28, 2018 for all series of preferred stock. For the years ended December 31, 2016, 2015, and 2014 the Company accreted $11, $50 and $50, respectively, related to these costs. Upon the completion of the IPO on October 4, 2016, the preferred stock automatically converted into shares of common stock.
The rights, preferences, privileges, and restrictions granted or imposed upon the holders of Series A, Series A-1 and Series B up until the closing of the IPO were as follows:
Dividends
The holders of Series A, Series A-1 and Series B were entitled to annual dividends at a rate of 6% of the stated value of $0.68 per share of Series A, $0.80 per share of Series A-1, and $1.52 per share of Series B. The dividends accrued from the original date of issuance of each share of Series A, Series A-1 and Series B, whether or not earned or declared, were cumulative and compounded annually. The dividends were payable when, as and if declared by the Board. In the event that dividends were paid on any share of common stock (other than dividends paid in additional shares of common stock for which an adjustment to the conversion price is made), an additional dividend would be paid with respect to each outstanding share of Series A, Series A-1 and Series B in an amount (on an as-if converted basis) equal to the amount paid or set aside for each share of common stock. In the event of a liquidation event or upon redemption of any shares of outstanding Series A, Series A-1 or Series B, the Company would pay such accumulated dividends as a condition to consummating such event.
The aggregate amount of cumulative but unpaid dividends on the Series A and Series A-1 were $1,223 and $661, respectively, during 2016 prior to the closing of the IPO. The aggregate amount of cumulative but unpaid dividends on the Series A and Series A-1 were $1,042 and $547, respectively, at December 31, 2015. Cumulative but unpaid dividends on the Series B were $944 during 2016 prior to the closing of the IPO. Cumulative but unpaid dividends on the Series B were $712 at December 31, 2015. The redemption value of Series B redeemable convertible preferred stock was based on its estimated fair value at October 4, 2016 and December 31, 2015 because it was estimated to be greater than its original issue price plus accrued dividends. All accumulated dividends were forfeited upon conversion of the preferred stock into shares of common stock immediately prior to the closing of the IPO on October 4, 2016.
F-30
TABULA RASA HEALTHCARE, INC.
NOTES TO CONSOLIDATED FINANCIAL STATEMENTS (Continued)
(Amounts in thousands, except share and per share data)
Conversion
The Series A, Series A-1 and Series B shares were convertible, at the option of the holder at any time and from time to time, into shares of voting common stock of the Company as determined by dividing the original issue price of the Series A, the Series A-1 and the Series B by the conversion price, which initially would be the original issue price.
The Series A, Series A-1 and Series B also had certain anti-dilution provisions in which the conversion price would be adjusted should the Company issue additional shares of common stock, options, or other equity instruments at a price per share lower than the conversion price in effect prior to such issuance.
On September 16, 2016, the Company amended the conversion feature of the Series A, Series A-1, and Series B redeemable convertible preferred stock to provide that such shares of preferred stock would automatically convert in connection with the IPO. Upon the closing of the IPO, such shares of redeemable convertible preferred stock converted into 5,089,436 shares of the Company’s common stock.
Redemption
The Series A, Series A-1 and Series B were redeemable upon written request of the requisite holders at any time after June 28, 2018. The Series A redemption amount was equal to the Series A original issue price of $0.68 per share plus all accrued and unpaid dividends. The Series A-1 redemption amount was equal to the Series A-1 original issue price of $0.80 per share plus all accrued and unpaid dividends. The Series B redemption amount was equal to the greater of (i) the Series B original issue price of $1.52 per share plus any accrued and unpaid dividends and any other dividends declared but unpaid thereon of such shares or (ii) the fair market value, as defined in the amended and restated articles of incorporation, as of the date of the Series B redemption request.
Series A and Series A-1 redemption amounts were payable in three equal annual installments commencing 180 days after receipt by the Company of a written notice requesting redemption provided by the requisite Series A and Series A-1 holders. The Series B redemption amount was payable within 180 days following receipt by the Company of a written notice requesting redemption provided by the requisite Series B holders.
The carrying values of the Series A, Series A-1 and Series B redeemable convertible preferred stock were being accreted to their redemption values through June 28, 2018. The redemption value of Series B was based on its estimated fair value at December 31, 2015 because it was estimated to be greater than its original issue price plus accrued dividends.
Upon the completion of the IPO on October 4, 2016, the preferred stock automatically converted into shares of common stock.
Liquidation
In the event of any liquidation, dissolution or winding up of the Company, either voluntary or involuntary (a "Liquidation Event"), the holders of Series B were entitled to receive prior and in preference to any distribution of any of the assets of the Company to the holder of any other classes of preferred stock or common stock, an amount per share equal to the original issuance price plus any accrued and unpaid dividends on such share (the "Preferred B Liquidation Amount"). In the event of any Liquidation Event, after the payment of the Preferred B Liquidation Amount, the holders of Series A and Series A-1 were entitled to receive prior and in preference to any distribution of any of the assets of the Company to the holder of any common stock, an amount per share equal to the original issuance price plus any accrued and unpaid dividends on such share (the "Preferred A Liquidation Amount"). In the event that the assets and funds of the Company that were available for distribution to its stockholders were insufficient to pay the holders of shares of Series B or Series A and Series A-1 the full preferential liquidation amounts that they were entitled to, then the holders of the Series B, Series A and Series A-1 would share ratably in any distribution of the assets and funds legally available for distribution based on the preferential amounts each such holder was entitled to receive and in the priority set forth above.
F-31
TABULA RASA HEALTHCARE, INC.
NOTES TO CONSOLIDATED FINANCIAL STATEMENTS (Continued)
(Amounts in thousands, except share and per share data)
Participation Rights
After the payment in full of the Preferred B Liquidation Amount and the Preferred A Liquidation Amount (together, the "Preferred Liquidation Amount"), the assets and funds of the Company remaining available for distribution, if any, would be distributed ratably among the holders of the Company's common stock and Series B, Series A, and Series A-1 (on an as-converted basis) (the "Participation Distribution"). The Participation Distribution would continue with respect to the Series A and Series A-1 only until the holders of Series A and Series A-1 had received for each share of Series A and Series A-1 held, an aggregate amount per share that equaled three times the original issue price.
Voting
Each holder of the outstanding shares of Series A, Series A-1 and Series B was entitled to one vote per share of voting common stock into which the Series A, Series A-1 and Series B was convertible as of the record date for determining stockholders entitled to vote on such matters.
(d) Common Stock Warrants
As of December 31, 2015, the following warrants to purchase common stock were outstanding:
|
Warrants |
|
Number |
|
Exercise |
|
|
|
|
|
|
to Purchase |
|
of Warrants |
|
Price |
|
Term |
|
Expiration |
|
|
Common-A |
|
106,361 |
|
$ |
0.480 |
|
10 year |
|
May - October 2019 |
|
Common-B |
|
82,471 |
|
$ |
0.480 |
|
10 year |
|
May - October 2019 |
|
Common-A |
|
7,731 |
|
$ |
0.530 |
|
10 year |
|
May 2019 |
|
Common-B |
|
190,714 |
|
$ |
0.530 |
|
10 year |
|
May - December 2019 |
|
Common-A |
|
5,154 |
|
$ |
0.970 |
|
10 year |
|
December 2019 |
|
Common-A |
|
515 |
|
$ |
0.970 |
|
10 year |
|
March 2020 |
|
Common-B |
|
2,577 |
|
$ |
0.480 |
|
10 year |
|
June 2021 |
|
Common-B |
|
2,577 |
|
$ |
0.530 |
|
10 year |
|
June 2021 |
|
Common-B |
|
2,244 |
|
$ |
2.560 |
|
10 year |
|
January 2023 |
|
Common-B |
|
20,470 |
|
$ |
3.410 |
|
10 year |
|
January - December 2023 |
|
Common-B |
|
4,982 |
|
$ |
3.100 |
|
10 year |
|
May - December 2023 |
|
Common-B |
|
4,015 |
|
$ |
5.820 |
|
10 year |
|
January - December 2024 |
|
Common-B |
|
12,297 |
|
$ |
6.400 |
|
10 year |
|
January - December 2024 |
|
Common-B |
|
4,485 |
|
$ |
6.400 |
|
10 year |
|
January - June 2025 |
During the years ended December 31, 2015 and 2014, the Company issued warrants to purchase 4,485 and 16,312 shares of common stock, respectively, at exercise prices of $6.40 and from $5.82 to $6.40 per share, respectively, in connection with related party debt (see Note 18). The Company recognized total interest expense of $16 and $31 associated with the equity-classified warrants issued during the years ended December 31, 2015 and 2014, respectively. No warrants were issued during the year ended December 31, 2016.
During 2016 prior to the IPO, the Company issued 210,817 shares of common stock upon the cashless exercise of warrants to purchase 232,787 shares of common stock. Upon completion of the IPO on October 4, 2016, 202,061 shares of common stock were issued upon the automatic net exercise of then outstanding warrants that would otherwise have expired upon the completion of the IPO, immediately prior to the closing of the IPO.
F-32
TABULA RASA HEALTHCARE, INC.
NOTES TO CONSOLIDATED FINANCIAL STATEMENTS (Continued)
(Amounts in thousands, except share and per share data)
The warrants issued during the years ended December 31, 2015 and 2014 were valued using the Black-Scholes option-pricing model at the date of grant, and included the following weighted average assumptions:
|
|
|
Year Ended |
|
|||
|
|
|
December 31, |
|
|||
|
|
|
2015 |
|
|
2014 |
|
|
Valuation assumptions: |
|
|
|
|
|
|
|
Expected volatility |
|
50 |
% |
|
54 |
% |
|
Expected life (years) |
|
10.00 |
|
|
10.00 |
|
|
Risk-free interest rate |
|
2.13 |
% |
|
2.52 |
% |
|
Dividend yield |
— |
— |
||||
(e) Preferred Stock Warrants
As of December 31, 2015, the following warrants to purchase redeemable convertible preferred stock were outstanding:
|
Warrants |
|
Number |
|
Exercise |
|
|
|
|
|
|
|
to Purchase |
|
of Warrants |
|
Price |
|
Term |
|
Expiration |
|
|
|
Series A-1 |
|
250,000 |
|
$ |
0.800 |
|
10 year |
|
March 2022 |
|
|
Series A-1 |
|
62,500 |
|
$ |
0.800 |
|
10 year |
|
October 2022 |
|
|
Series B |
|
105,005 |
|
$ |
2.860 |
|
10 year |
|
April 2024 |
|
|
Series B |
|
481,863 |
|
$ |
2.990 |
|
10 year |
|
December 2024 |
|
In April 2014 and December 2014, the Company issued warrants to purchase 105,005 and 481,863 shares, respectively, of Series B at an exercise price of $2.86 and $2.99 per share, respectively, in connection with the April 2014 Eastward Loan and December 2014 Eastward Loan (see Note 10). No preferred stock warrants were issued during the years ended December 31, 2016 and 2015. Upon completion of the IPO on October 4, 2016, the then outstanding warrants to purchase preferred stock converted into warrants to purchase an aggregate of 463,589 shares of common stock. On October 12, 2016, 288,324 shares of common stock were issued upon the net exercise of 431,373 of these warrants. As of December 31, 2016, warrants to purchase 32,216 shares of common stock remain outstanding. These warrants have an exercise price of $1.56 and expire in October 2022.
14. Stock-Based Compensation
The Company's Amended and Restated 2014 Equity Compensation Plan (the "2014 Plan") authorizes the Company to grant up to 3,935,865 shares of common stock to the Company's employees and non-employees in the form of incentive stock options, nonqualified stock options, stock awards, stock units, stock appreciation rights, and other equity-based awards. In September 2016, the Board approved an increase in the shares of common stock authorized under the 2014 Plan to 4,037,981. This pool consisted of 2,702,443 shares of Class A common stock and 1,335,538 shares of Class B common stock.
On September 28, 2016, the Company adopted the 2016 Equity Compensation Plan (the “2016 Plan”) and merged the 2014 Plan into the 2016 Plan. No additional grants were made thereafter under the 2014 Plan. Outstanding grants under the 2014 Plan will continue in effect according to their terms as in effect before the merger with the 2016 Plan, and the shares with respect to outstanding grants under the 2014 Equity Plan were issued or transferred under the 2016 Plan. The 2016 Plan authorizes the issuance or transfer of up to the sum of the following: (1) 800,000 new shares, plus (2) the number of shares of our common stock subject to outstanding grants under the 2014 Equity Plan as of the effective date of the 2016 Plan; provided, however, that the aggregate number of shares of the Company’s common stock that may be issued or transferred under the 2016 Plan pursuant to incentive stock options may not exceed 800,000. During the term of the 2016 Plan, the share reserve will automatically increase on the first trading day in January of each calendar year, beginning in calendar year 2017, by an amount equal to the lesser of 5% of the total number of outstanding shares of common stock on the last trading day in December of the prior calendar year or such other number set by our Board. As of December 31, 2016, 296,028 shares were available for future grants under the 2016 Plan.
F-33
TABULA RASA HEALTHCARE, INC.
NOTES TO CONSOLIDATED FINANCIAL STATEMENTS (Continued)
(Amounts in thousands, except share and per share data)
The option price per share cannot be less than the fair market value of a share on the date the option was granted, and in the case of incentive stock options granted to an employee owning more than 10% of the total combined voting power of all classes of stock of the Company, the option price shall not be less than 110% of the fair market value of Company stock on the date of grant. Stock option grants under the Plan generally expire 10 years from the date of grant, other than incentive stock option grants to 10% shareholders, which have a 5 year term, 90 days after termination, or one year after the date of death or termination due to disability. Stock options generally vest over a period of four years, with 25% of the options becoming exercisable on the one-year anniversary of the commencement date and the remaining shares vesting monthly thereafter for 36 months in equal installments of 2.08% per month.
On September 28, 2016, the Board granted 700,386 shares of restricted common stock to certain Company employees, including executive officers, under the 2014 Plan, prior to merging it with the 2016 Plan, pursuant to a special equity award pool previously approved by the Board which was made immediately prior to the effectiveness of the Company's registration statement filed in connection with the Company's IPO. All shares of restricted common stock will vest in full on May 31, 2017. The value of the grants is based on the IPO price of $12.00 per share and the related non-cash compensation expense is being recognized ratably over the vesting period from the date of grant through May 31, 2017, when the shares underlying the grant fully vest. For the year ended December 31, 2016, $3,246 of expense was recognized related to this grant. As of December 31, 2016, there was unrecognized compensation expense of $5,159 related to this grant.
On September 28, 2016, the Company granted 22,260 shares of restricted common stock under the 2016 Plan to our non-employee directors, which represents both the initial and annual grants to such directors. The initial grant will vest in three substantially equal annual installments over three years following the grant date and the annual grant will vest in full on the earlier of the next annual shareholder meeting or the one year anniversary of the grant date. The value of the grants is based on the IPO price of $12.00. For the year ended December 31, 2016, $39 of expense was recognized related to these grants. As of December 31, 2016, there was unrecognized compensation expense of $228 related to these grants.
On October 4, 2016, 20,372 shares of the Company’s common stock were surrendered to the Company by Radius Venture Partners III QP, L.P. and its affiliates (“Radius”) Radius, at the completion of the IPO pursuant to the Letter Agreement, as amended, the Company entered into with Radius. The Board approved the issuance of these shares, 13,362 shares of common stock, net of 7,010 shares of common stock withheld for tax withholding purposes, to certain executive officers pursuant to the Leadership Exit Bonus Plan and under the 2016 Plan. On October 4, 2016, these shares were issued. The value of this issuance is $244 based upon the IPO price of $12.00 per share and the non-cash compensation charge was recognized in the fourth quarter of 2016 as all shares issued fully vested upon issuance.
The Company recorded $721, $565 and $254 of stock-based compensation expense related to the vesting of employee and non-employee stock options for the years ended December 31, 2016, 2015, and 2014, respectively.
The estimated fair value of options granted was calculated using a Black- Scholes option-pricing model. The computation of expected life for employees was determined based on the simplified method. The risk-free rate is based on the U.S. Treasury security with terms equal to the expected time of exercise as of the grant date. The Company's common stock had not been publicly traded until the IPO commenced on September 29, 2016; therefore, expected volatility is based on the historical volatilities of selected public companies whose services are comparable to that of the Company.
F-34
TABULA RASA HEALTHCARE, INC.
NOTES TO CONSOLIDATED FINANCIAL STATEMENTS (Continued)
(Amounts in thousands, except share and per share data)
The table below sets forth the weighted average assumptions for employee grants during the years ended December 31, 2016, 2015, and 2014.
|
|
|
Year Ended |
|
||||||
|
|
|
December 31, |
|
||||||
|
Valuation assumptions: |
|
2016 |
|
|
2015 |
|
|
2014 |
|
|
Expected volatility |
|
61.00 |
% |
|
55.21 |
% |
|
59.37 |
% |
|
Expected life (years) |
|
5.69 |
|
|
6.05 |
|
|
6.00 |
|
|
Risk-free interest rate |
|
1.37 |
% |
|
1.75 |
% |
|
1.98 |
% |
|
Dividend yield |
|
— |
|
|
— |
|
|
— |
|
The weighted average grant date fair value of employee options granted during the years ended December 31, 2016, 2015 and 2014 was $7.74, $3.34, and $1.57, respectively.
The following table summarizes stock option activity for the years ended December 2016, 2015, and 2014:
|
|
|
|
|
|
|
|
Weighted |
|
|
|
|
|
|
|
|
Weighted |
|
average |
|
|
|
|
|
|
|
|
|
average |
|
remaining |
|
Aggregate |
||
|
|
|
Number |
|
exercise |
|
contractual |
|
intrinsic |
||
|
|
|
of shares |
|
price |
|
term |
|
value |
||
|
Outstanding at January 1, 2014 |
|
2,635,827 |
|
$ |
2.20 |
|
|
|
|
|
|
Granted |
|
259,928 |
|
|
6.01 |
|
|
|
|
|
|
Exercised |
|
(41,151) |
|
|
1.42 |
|
|
|
|
|
|
Forfeited |
|
(9,378) |
|
|
4.17 |
|
|
|
|
|
|
Outstanding at December 31, 2014 |
|
2,845,226 |
|
$ |
2.56 |
|
|
|
|
|
|
Granted |
|
365,098 |
|
|
6.42 |
|
|
|
|
|
|
Exercised |
|
(406,683) |
|
|
1.04 |
|
|
|
|
|
|
Forfeited |
|
(11,887) |
|
|
6.24 |
|
|
|
|
|
|
Outstanding at December 31, 2015 |
|
2,791,754 |
|
$ |
3.27 |
|
|
|
|
|
|
Granted |
|
479,010 |
|
|
14.56 |
|
|
|
|
|
|
Exercised |
|
(203,991) |
|
|
1.32 |
|
|
|
|
|
|
Forfeited |
|
(7,083) |
|
|
9.02 |
|
|
|
|
|
|
Outstanding at December 31, 2016 |
|
3,059,690 |
|
$ |
5.14 |
|
6.2 |
|
$ |
30,178 |
|
Options vested and expected to vest at December 31, 2016 |
|
3,059,690 |
|
$ |
5.14 |
|
6.2 |
|
$ |
30,178 |
|
Exercisable at December 31, 2016 |
|
2,214,358 |
|
$ |
3.10 |
|
5.4 |
|
$ |
26,314 |
Included within the above table are 217,392 non-employee options outstanding as of December 31, 2016, of which 1,777 are unvested as of December 31, 2016 and therefore subject to remeasurement.
The aggregate intrinsic value of stock options is calculated as the difference between the exercise price of the stock options and the Company’s closing stock price or estimated fair value on the last trading day of the fiscal year for those stock options that had exercise prices lower than the fair value of the Company's common stock. This amount changes based on the fair market value of the Company’s stock. The total intrinsic values of options exercised during the years ended December 31, 2016, 2015, and 2014 were $2,785, $2,304, and $65, respectively.
As of December 31, 2016, there was $4,221 of unrecognized compensation cost related to nonvested stock options granted under the 2016 Plan, which is expected to be recognized over a weighted average period of 2.2 years.
Cash received from option exercises for the years ended December 31, 2016, 2015, and 2014 was $153, $12, and $59, respectively. There was no actual tax benefit realized for the tax deduction from option exercises of share-based payment arrangements for the years ended December 31, 2016, 2015, and 2014.
F-35
TABULA RASA HEALTHCARE, INC.
NOTES TO CONSOLIDATED FINANCIAL STATEMENTS (Continued)
(Amounts in thousands, except share and per share data)
The Company recorded total stock-based compensation expense for the years ended December 31, 2016, 2015 and 2014 in the following expense categories of its consolidated statement of operations:
|
|
|
Year Ended |
|||||||
|
|
|
December 31, |
|||||||
|
|
|
2016 |
|
2015 |
|
2014 |
|||
|
Cost of revenue - product |
|
$ |
191 |
|
$ |
102 |
|
$ |
57 |
|
Cost of revenue - service |
|
|
46 |
|
|
23 |
|
|
3 |
|
Research and development |
|
|
62 |
|
|
25 |
|
|
9 |
|
Sales and marketing |
|
|
138 |
|
|
91 |
|
|
57 |
|
General and administrative |
|
|
3,813 |
|
|
324 |
|
|
128 |
|
|
|
$ |
4,250 |
|
$ |
565 |
|
$ |
254 |
15. Fair Value Measurements
The Company’s financial instruments consist of accounts receivable, accounts payable, accrued expenses, acquisition-related contingent consideration, acquisition-related consideration payable, notes payable related to acquisition, notes payable to related parties, warrant liability and long-term debt. The carrying values of accounts receivable, accounts payable and accrued expenses are representative of their fair value due to the relatively short-term nature of those instruments. The carrying value of the Company’s long-term debt approximates fair value based on the terms of the debt. The notes payable related to acquisition were recorded on December 31, 2014 at their acquisition date fair values of $14,347. This valuation was determined using Level 3 inputs. The note was fully repaid on July 1, 2016 (see Note 9).
The Company has classified liabilities measured at fair value on a recurring basis at December 31, 2016 and 2015 as follows:
|
|
|
Fair Value Measurement |
||||||||||
|
|
|
at Reporting Date Using |
||||||||||
|
|
|
|
|
|
|
|
|
|
|
|
Balance as of |
|
|
|
|
Level 1 |
|
Level 2 |
|
Level 3 |
|
December 31, 2016 |
||||
|
|
|
|
|
|
|
|
|
|
|
|
|
|
|
Liabilities |
|
|
|
|
|
|
|
|
|
|
|
|
|
Acquisition-related contingent consideration - short-term |
|
$ |
— |
|
$ |
— |
|
$ |
1,493 |
|
$ |
1,493 |
|
Acquisition-related contingent consideration - long-term |
|
|
— |
|
|
— |
|
|
1,515 |
|
|
1,515 |
|
|
|
$ |
— |
|
$ |
— |
|
$ |
3,008 |
|
$ |
3,008 |
|
|
|
Fair Value Measurement |
||||||||||
|
|
|
at Reporting Date Using |
||||||||||
|
|
|
|
|
|
|
|
|
|
|
|
Balance as of |
|
|
|
|
Level 1 |
|
Level 2 |
|
Level 3 |
|
December 31, 2015 |
||||
|
Liabilities |
|
|
|
|
|
|
|
|
|
|
|
|
|
Warrant liability |
|
$ |
— |
|
$ |
— |
|
$ |
5,569 |
|
$ |
5,569 |
|
Note payable related to acquisition |
|
|
— |
|
|
— |
|
|
15,620 |
|
|
15,620 |
|
Acquisition-related contingent consideration - short-term |
|
|
— |
|
|
— |
|
|
1,886 |
|
|
1,886 |
|
Acquisition-related contingent consideration - long-term |
|
|
— |
|
|
— |
|
|
3,355 |
|
|
3,355 |
|
|
|
$ |
— |
|
$ |
— |
|
$ |
26,430 |
|
$ |
26,430 |
The fair value of the preferred stock warrants at December 31, 2015 was estimated using an option pricing model with the following weighted average assumptions: estimated life of 7.99 years, no dividend yield, risk-free interest rate of 2.10%, fair value of underlying instrument of $8.14 per share and volatility of 57.81%. The Company also applied a discount for lack of marketability of 10% to the resulting value from the option pricing model.
F-36
TABULA RASA HEALTHCARE, INC.
NOTES TO CONSOLIDATED FINANCIAL STATEMENTS (Continued)
(Amounts in thousands, except share and per share data)
The Company developed its own assumptions that do not have observable inputs or available market data to support the fair value. This method of valuation involves using inputs such as the fair value of the Company’s various classes of preferred stock, stock price volatility, the contractual term of the warrants, risk-free interest rates, and dividend yields. Due to the nature of these inputs, the valuation of the warrants is considered a Level 3 measurement. The Company accounted for its redeemable convertible preferred stock warrants as liabilities in accordance with the guidance for accounting for certain financial instruments with characteristics of both liabilities and equity, as warrants entitled the holder to purchase preferred stock that is considered contingently redeemable. The warrant liability was recorded on its own line item on the Company’s consolidated balance sheets. The warrant liability was marked-to-market each reporting period with the change in fair value recorded on its own line in the consolidated statements of operations until the warrants were exercised, expired or other facts and circumstances led the warrant liability to be reclassified as an equity instrument. Upon the closing of the IPO, the warrants converted into shares to purchase common stock and the warrant liability was reclassified to additional paid-in capital, a component of stockholders' equity.
The reconciliation of the warrant liability measured at fair value on a recurring basis using significant unobservable inputs (Level 3) is as follows:
|
Balance at January 1, 2015 |
|
$ |
2,783 |
|
Change in fair value |
|
|
2,786 |
|
Balance at December 31, 2015 |
|
|
5,569 |
|
Change in fair value |
|
|
(639) |
|
Conversion upon initial public offering |
|
|
(4,930) |
|
Balance at December 31, 2016 |
|
$ |
— |
Acquisition-related contingent consideration is measured at fair value on a recurring basis using unobservable inputs, hence these instruments represent Level 3 measurements within the fair value hierarchy. The acquisition-related contingent consideration liability represents the estimated fair value of the additional cash consideration payable that is contingent upon the achievement of certain financial and performance milestones.
During 2015, the Company paid the outstanding balance of the SMPP acquisition-related contingent consideration, which included a cash payment of $300 and 16,237 shares of the Company's common stock. The stock consideration was valued at a total of $94, or $5.82 per share, with the assistance of a third-party valuation specialist. There was no SMPP acquisition-related contingent consideration outstanding at December 31, 2016 and 2015.
During 2015, the Company paid the outstanding balance of the Capstone acquisition-related contingent consideration, which included a cash payment of $577 and 18,418 shares of the Company's common stock. The stock consideration was valued at a total of $107, or $5.82 per share, with the assistance of a third-party valuation specialist. There was no Capstone acquisition-related contingent consideration outstanding at December 31, 2016 and 2015.
During 2015, a $2,059 reduction to the Aggregate Earn-Out Amount of the Medliance acquisition-related contingent consideration was recorded based on estimated lost future revenues from several lost customers which occurred in 2015, using an average of claims per month for those customers and current data and statistics revenue rates. During 2016, the Company made a $1,895 cash payment toward the Medliance acquisition-related contingent consideration. The Company also recorded a $338 reduction to the Aggregate Earn-Out Amount during 2016 based on a decrease in estimated future revenues. The fair value of the Medliance contingent consideration was calculated to be $3,008 and $5,241 at December 31, 2016 and 2015, respectively.
F-37
TABULA RASA HEALTHCARE, INC.
NOTES TO CONSOLIDATED FINANCIAL STATEMENTS (Continued)
(Amounts in thousands, except share and per share data)
The changes in fair value of the Company’s acquisition-related contingent consideration for the years ended December 31, 2016 and 2015 was as follows:
|
Balance at January 1, 2015 |
|
$ |
8,378 |
|
Fair value of cash consideration paid |
|
|
(877) |
|
Fair value of equity consideration paid |
|
|
(201) |
|
Adjustments to fair value measurement |
|
|
(2,059) |
|
Balance at December 31, 2015 |
|
|
5,241 |
|
Fair value of cash consideration paid |
|
|
(1,895) |
|
Adjustments to fair value measurement |
|
|
(338) |
|
Balance at December 31, 2016 |
|
$ |
3,008 |
16. Commitments and Contingencies
(a) Leases
The Company has entered into various operating leases for office space expiring on various dates through 2027, which also contain renewal options and escalation clauses. On August 21, 2015, the Company entered into three operating lease agreements to expand its dispensary operations and corporate office space in Moorestown, NJ. Two of the three leases commenced on March 31, 2016 and the third lease commenced on October 1, 2016. All three leases expire on November 30, 2027. The Company will have the option to extend the leases for one additional period of ten years. In addition to the base rent payments, the Company will be obligated to pay a pro rata share of operating expenses and taxes.
Future minimum lease payments under operating leases as of December 31, 2016 are as follows:
|
|
|
December 31, 2016 |
|
|
|
|
|
|
|
2017 |
|
$ |
1,873 |
|
2018 |
|
|
1,997 |
|
2019 |
|
|
1,958 |
|
2020 |
|
|
1,977 |
|
2021 |
|
|
2,012 |
|
Thereafter |
|
|
10,991 |
|
Total minimum lease payments |
|
$ |
20,808 |
Rent expense under these operating leases was $1,342, $627, and $526 for the years ended December 31, 2016, 2015, and 2014 respectively.
(b) Employment Agreements
The Company has employment agreements with certain non-executive officers and key employees that provide for, among other things, salary and performance bonuses.
(c) Legal Proceedings
The Company is not currently involved in any significant claims or legal actions that, in the opinion of management, will have a material adverse impact on the Company.
(d) Letter of Credit
As of December 31, 2016 and 2015, the Company was contingently liable for $500 under an outstanding letter of credit related to the Company’s lease agreement for the office space in Moorestown, NJ (see Note 10).
F-38
TABULA RASA HEALTHCARE, INC.
NOTES TO CONSOLIDATED FINANCIAL STATEMENTS (Continued)
(Amounts in thousands, except share and per share data)
17. Retirement Plan
The Company has established a 401(k) plan that qualifies as a defined contribution plan under Section 401 of the Internal Revenue Code. The Company’s contributions to this plan are based on a percentage of eligible employees’ plan year earnings, as defined. The Company made matching contributions to participants’ accounts totaling $347, $475 and $146 during the years ended December 31, 2016, 2015 and 2014, respectively.
18. Related-Party Transactions
In December 2012, the Company entered into a $1,100 demand promissory note with certain executive officers. The note was repaid in full as of December 31, 2015. Interest on the note was 6% annually. The promissory note also provided for the issuance of warrants calculated based upon the principal outstanding on the last day of the prior month. The Company recognized $16 and $24 of interest expense in 2015 and 2014, respectively, for the value of the common stock warrants issued based on the principal outstanding at the end of each month (see Note 13). Interest expense recognized on the note was $26 and $47 for the years ended December 31, 2015 and 2014, respectively.
In January 2014, the Company entered into a second promissory note for $100 with certain executive officers. The note was repaid in full as of December 31, 2015. Interest on the note was 6% annually. Interest expense recognized on the note was $6 and $6 for the years ended December 31, 2015 and 2014, respectively.
During 2016, 2015, and 2014, the Company engaged Knowlton Advisors LLC, a management consulting services company, to provide professional accounting services. Knowlton Advisors LLC is owned and operated by an immediate relative of the Company's Chairman and Chief Executive Officer and the Company's President. Costs incurred by the Company for professional accounting services provided by the related party were $4, $13 and $19 during the years ended December 31, 2016, 2015 and 2014, respectively.
During 2015 and 2014, the Company engaged Space Age Robotics LLC, an IT consulting services company, to provide professional IT client services. Space Age Robotics LLC is owned and operated by an immediate relative of the President and Chief Executive Officer of Capstone. Costs incurred by the Company for professional IT client services provided by the related party were $24 and $18 in 2015 and 2014, respectively.
In August 2015, the Company made a loan to certain executive officers, pursuant to a promissory note, for an aggregate principal amount of $410. The note bore interest at 6% per annum. In December 2015, the executive officers repaid the loan in full by offsetting amounts due to them pursuant to demand promissory notes the Company previously issued.
As of December 31, 2015, there was a demand promissory note with a stockholder with a balance outstanding of $250, which bore interest at 6% annually. The promissory note also provided for the issuance of common stock warrants. The Company recognized $8 of interest expense for the year ended December 31, 2014 for the value of the common stock warrants issued based on the principal outstanding (see Note 13). The demand promissory note was repaid in full in October 2016 with the proceeds from the IPO. Total interest expense recognized on the note was $11, $15, and $15 for the years ended December 31, 2016, 2015, and 2014, respectively.
During 2016, the Company engaged Tunstall Consulting, a corporate financial planning company, to provide professional services related to obtaining the ABC Credit Facility. Tunstall Consulting is owned and operated by a member of the Board. Costs incurred by the Company for professional services provided by the related party were $104 and were recorded as deferred financing costs during 2016 (see Note 10 for additional information on the ABC Credit Facility).
On September 15, 2016, the Company acquired certain assets from an entity indirectly controlled by the Company’s Chief Scientific Officer (see Note 4 for additional information).
F-39
TABULA RASA HEALTHCARE, INC.
NOTES TO CONSOLIDATED FINANCIAL STATEMENTS (Continued)
(Amounts in thousands, except share and per share data)
19. Selected Quarterly Financial Data (unaudited)
The following tables set forth selected unaudited quarterly statements of operations data for each of the eight quarters in the years ended December 31, 2016 and 2015.
|
|
|
Three Months |
|
Three Months |
|
Three Months |
|
Three Months |
|
Twelve Months |
|||||
|
Ended |
Ended |
Ended |
Ended |
Ended |
|||||||||||
|
|
|
March 31, 2016 |
|
June 30, 2016 |
|
September 30, 2016 |
|
December 31, 2016 |
|
December 31, 2016 |
|||||
|
Total revenue |
|
$ |
20,157 |
|
$ |
22,418 |
|
$ |
24,174 |
|
$ |
27,313 |
|
$ |
94,062 |
|
Gross profit |
|
$ |
6,224 |
|
$ |
6,296 |
|
$ |
6,991 |
|
$ |
9,374 |
|
$ |
28,885 |
|
Income (loss) from operations |
|
$ |
1,614 |
|
$ |
1,479 |
|
$ |
1,706 |
|
$ |
(248) |
|
$ |
4,551 |
|
Net income (loss) attributable to common stockholders (1): |
|
|
|
|
|
|
|
|
|
|
|
|
|
|
|
|
Basic |
|
$ |
293 |
|
$ |
(890) |
|
$ |
1,228 |
|
$ |
(6,031) |
|
$ |
(3,811) |
|
Diluted |
|
$ |
94 |
|
$ |
(890) |
|
$ |
(803) |
|
$ |
(6,031) |
|
$ |
(6,889) |
|
Net income (loss) per share attributable to common stockholders (2): |
|
|
|
|
|
|
|
|
|
|
|
|
|
|
|
|
Basic |
|
$ |
0.06 |
|
$ |
(0.18) |
|
$ |
0.25 |
|
$ |
(0.39) |
|
$ |
(0.51) |
|
Diluted |
|
$ |
0.01 |
|
$ |
(0.18) |
|
$ |
(0.08) |
|
$ |
(0.39) |
|
$ |
(0.59) |
|
|
|
Three Months |
|
Three Months |
|
Three Months |
|
Three Months |
|
Twelve Months |
|||||
|
|
|
Ended |
|
Ended |
|
Ended |
|
Ended |
|
Ended |
|||||
|
|
|
March 31, 2015 |
|
June 30, 2015 |
|
September 30, 2015 |
|
December 31, 2015 |
|
December 31, 2015 |
|||||
|
Total revenue |
|
$ |
15,502 |
|
$ |
16,824 |
|
$ |
17,952 |
|
$ |
19,761 |
|
$ |
70,039 |
|
Gross profit |
|
$ |
4,574 |
|
$ |
4,820 |
|
$ |
5,675 |
|
$ |
5,842 |
|
$ |
20,911 |
|
Income from operations |
|
$ |
853 |
|
$ |
1,772 |
|
$ |
1,533 |
|
$ |
2,007 |
|
$ |
6,165 |
|
Net income (loss) attributable to common stockholders (1): |
|
|
|
|
|
|
|
|
|
|
|
|
|
|
|
|
Basic |
|
$ |
(696) |
|
$ |
(1,245) |
|
$ |
(14,066) |
|
$ |
1,504 |
|
$ |
(12,830) |
|
Diluted |
|
$ |
(696) |
|
$ |
(1,245) |
|
$ |
(14,066) |
|
$ |
395 |
|
$ |
(12,830) |
|
Net income (loss) per share attributable to common stockholders (2): |
|
|
|
|
|
|
|
|
|
|
|
|
|
|
|
|
Basic |
|
$ |
(0.17) |
|
$ |
(0.30) |
|
$ |
(3.21) |
|
$ |
0.33 |
|
$ |
(2.97) |
|
Diluted |
|
$ |
(0.17) |
|
$ |
(0.30) |
|
$ |
(3.21) |
|
$ |
0.03 |
|
$ |
(2.97) |
|
(1) |
Quarterly and year-to-date computations of net income (loss) attributable to common stockholders during the years ended December 31, 2016 and 2015 are made independently using the two-class method. Therefore, the sum of the net income (loss) attributable to common stockholders for the quarters may not agree with the net income (loss) attributable to common stockholders for the year. See Notes 2 and 3 for the Company’s accounting policy on calculating net income (loss) attributable to common stockholders and net income (loss) per share. |
|
(2) |
Quarterly and year-to-date computations of per share amounts are made independently during the years ended December 31, 2016 and 2015 using the two-class method. Therefore, the sum of the per-share amounts for the quarters may not agree with per share amounts for the year. See Notes 2 and 3 for the Company’s accounting policy on calculating net income (loss) attributable to common stockholders and net income (loss) per share. |
The quarterly unaudited consolidated financial statements have been prepared on the same basis as the audited consolidated financial statements included in this report and include all adjustments, consisting only of normal recurring adjustments, that we consider necessary for a fair presentation of such information when read in conjunction with our annual audited consolidated financial statements and notes appearing in this report. The operating results for any quarter do not necessarily indicate the results for any subsequent period or for the entire fiscal year.
F-40
Schedule II—Valuation and Qualifying Accounts (in thousands)
|
|
|
|
|
Additions |
|
|
|
|
|
|
||
|
|
|
Balance at |
|
Charged to |
|
|
|
|
|
|
||
|
|
|
Beginning of |
|
Costs and |
|
|
|
|
Balance at End |
|||
|
Description |
|
Period |
|
Expenses |
|
Deductions |
|
of Period |
||||
|
Allowance for doubtful accounts: |
|
|
|
|
|
|
|
|
|
|
|
|
|
Year Ended December 31, 2016 |
|
$ |
49 |
|
$ |
(10) |
|
$ |
— |
|
$ |
39 |
|
Year Ended December 31, 2015 |
|
$ |
12 |
|
$ |
43 |
|
$ |
(6) |
|
$ |
49 |
|
Year Ended December 31, 2014 |
|
$ |
6 |
|
$ |
12 |
|
$ |
(6) |
|
$ |
12 |
|
|
|
|
|
|
|
|
|
|
|
|
|
|
|
|
|
|
|
|
Allowance |
|
Release of |
|
|
|
||
|
|
|
Balance at |
|
Recorded on |
|
Allowance on |
|
|
||||
|
|
|
Beginning of |
|
Current Year |
|
Losses Expired |
|
Balance at End |
||||
|
Description |
|
Period |
|
Losses |
|
or Revalued |
|
of Period |
||||
|
Deferred tax asset valuation allowance: |
|
|
|
|
|
|
|
|
|
|
|
|
|
Year Ended December 31, 2016 |
|
$ |
4,489 |
|
$ |
2,900 |
|
$ |
— |
|
$ |
7,389 |
|
Year Ended December 31, 2015 |
|
$ |
4,626 |
|
$ |
(137) |
|
$ |
— |
|
$ |
4,489 |
|
Year Ended December 31, 2014 |
|
$ |
4,672 |
|
$ |
376 |
|
$ |
(422) |
|
$ |
4,626 |
F-41