Attached files
| file | filename |
|---|---|
| EX-99.1 - EX-99.1 - Freshpet, Inc. | frpt-ex991_21.htm |
| 8-K - 8-K - Freshpet, Inc. | frpt-8k_20160309.htm |
4th Quarter & Full Year 2016 Supplemental Presentation Strategic Operational and Financial Update March 9, 2017 Exhibit 99.2
Forward Looking Statements This presentation contains “forward-looking” statements that involve risks, uncertainties and assumptions. If the risks or uncertainties ever materialize or the assumptions prove incorrect, the Company’s results may differ materially from those expressed or implied by such forward-looking statements. All statements other than statements of historical fact could be deemed forward-looking, including, but not limited to, the Company’s intentions, beliefs or current expectations concerning, among other things, the Company’s results of operations, financial condition, liquidity, prospects, growth, strategies and the industry in which we operate and any statements of assumptions underlying any of the foregoing. These statements are based on estimates and information available to us at the time of this presentation and are not guarantees of future performance. These forward-looking statements are based on certain assumptions and are subject to risks and uncertainties, including those described in the “Risk Factors” section and elsewhere in the preliminary prospectus for this offering. You should read the prospectus, including the Risk Factors set forth therein and the documents that the Company has filed as exhibits to the registration statement, of which the prospectus is a part, completely and with the understanding that if any such risks or uncertainties materialize or if any of the relevant assumptions prove incorrect, the Company’s actual results could differ materially from the results expressed or implied by these forward-looking statements. Except as required by law we assume no obligation to update these forward-looking statements publicly, or to update the reasons why actual results could differ materially from those anticipated in the forward-looking statements, even if new information becomes available in the future. Safe Harbor
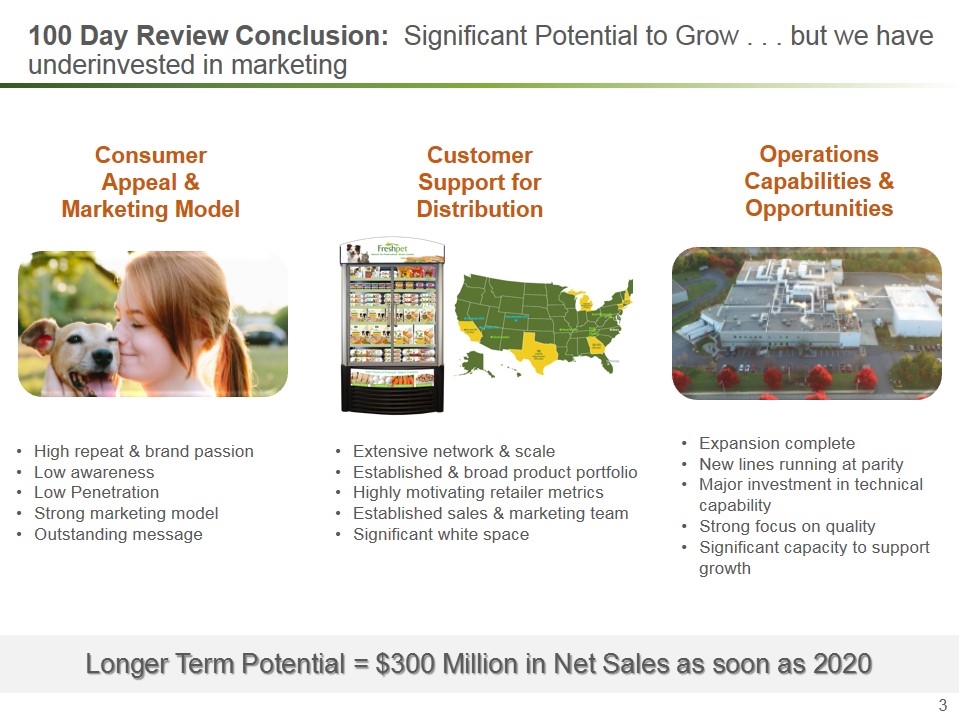
100 Day Review Conclusion: Significant Potential to Grow . . . but we have underinvested in marketing Expansion complete New lines running at parity Major investment in technical capability Strong focus on quality Significant capacity to support growth High repeat & brand passion Low awareness Low Penetration Strong marketing model Outstanding message Extensive network & scale Established & broad product portfolio Highly motivating retailer metrics Established sales & marketing team Significant white space Longer Term Potential = $300 Million in Net Sales as soon as 2020 Consumer Appeal & Marketing Model Customer Support for Distribution Operations Capabilities & Opportunities
Freshpet Lives at the Intersection of Two Very Powerful Macro-Trends in CPG Humanization of Pets Fresh, Wholesome, All-Natural Foods
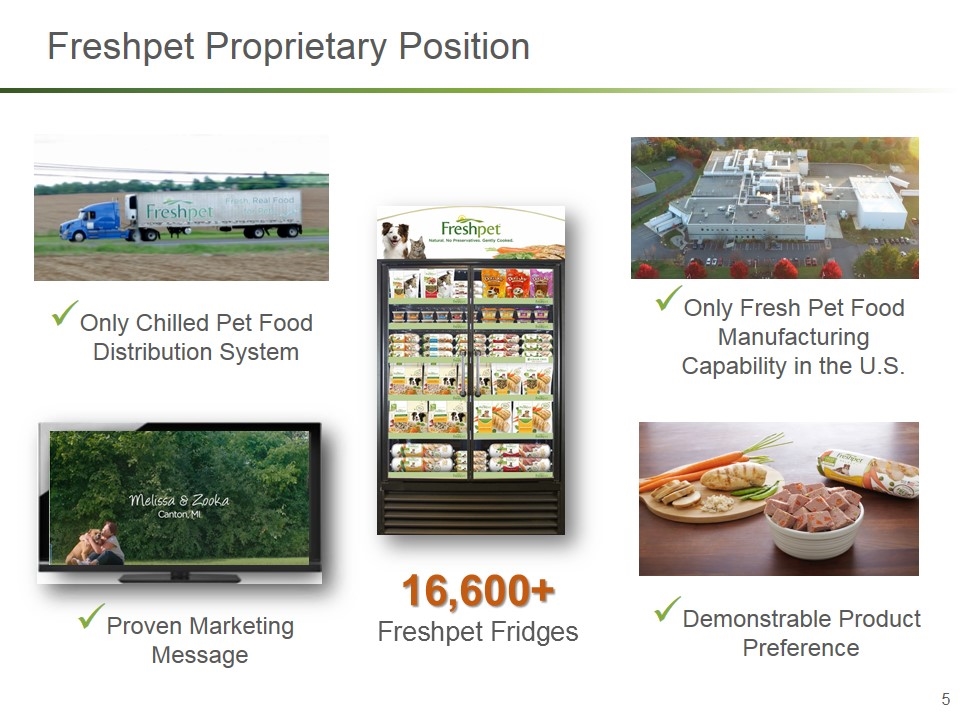
Freshpet Proprietary Position Only Chilled Pet Food Distribution System Only Fresh Pet Food Manufacturing Capability in the U.S. 16,600+ Freshpet Fridges Proven Marketing Message Demonstrable Product Preference
We Operate Differently Delighting consumers with fresh food & our company ideology Environmentally Focused Employee Engagement Community & Consumer Engagement
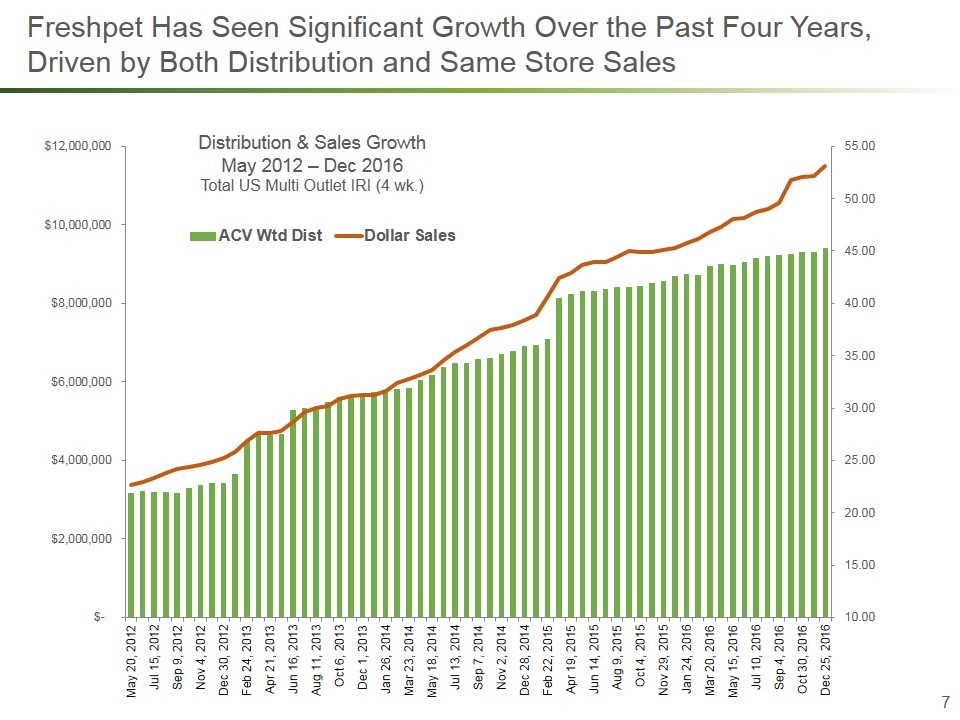
Freshpet Has Seen Significant Growth Over the Past Four Years, Driven by Both Distribution and Same Store Sales Distribution & Sales Growth May 2012 – Dec 2016 Total US Multi Outlet IRI (4 wk.)
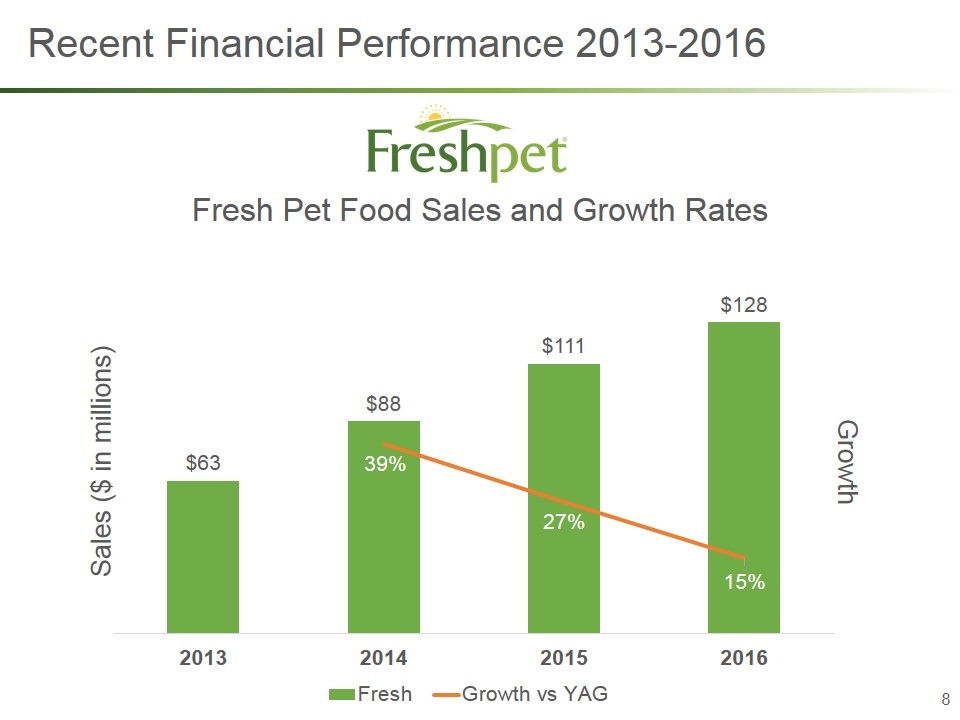
Recent Financial Performance 2013-2016 Fresh Pet Food Sales and Growth Rates
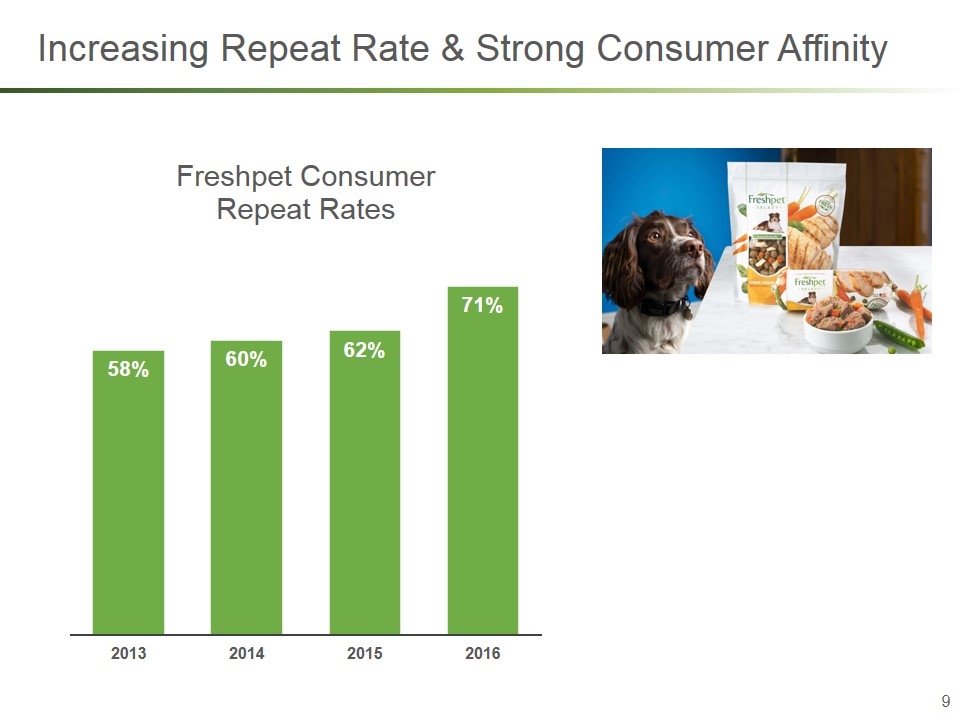
Increasing Repeat Rate & Strong Consumer Affinity
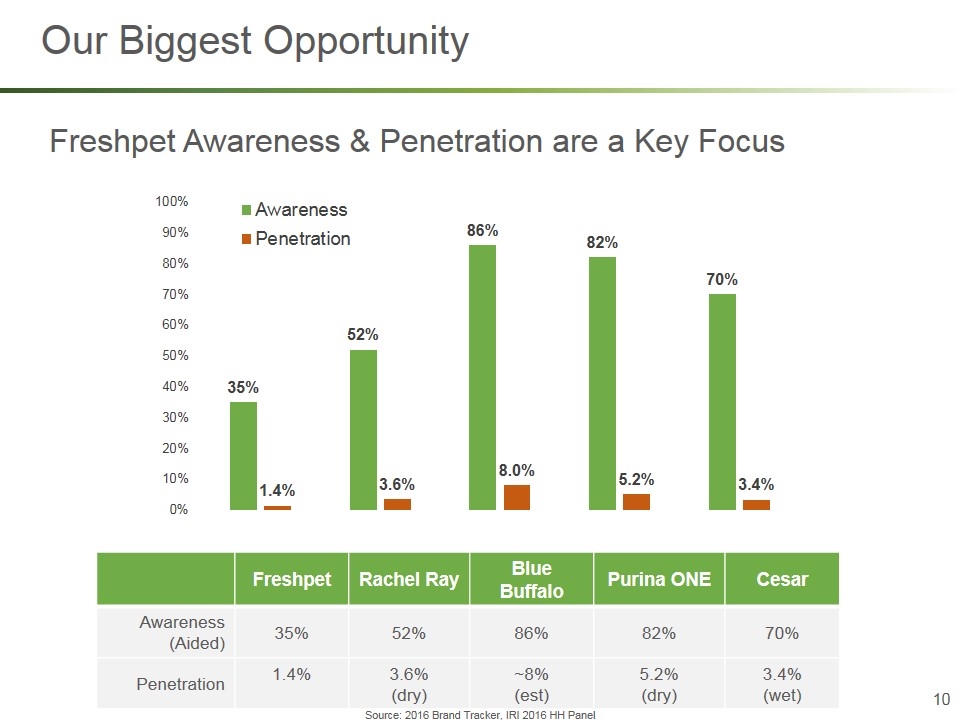
Our Biggest Opportunity Freshpet Rachel Ray Blue Buffalo Purina ONE Cesar Awareness (Aided) 35% 52% 86% 82% 70% Penetration 1.4% 3.6% (dry) ~8% (est) 5.2% (dry) 3.4% (wet) Source: 2016 Brand Tracker, IRI 2016 HH Panel Freshpet Awareness & Penetration are a Key Focus
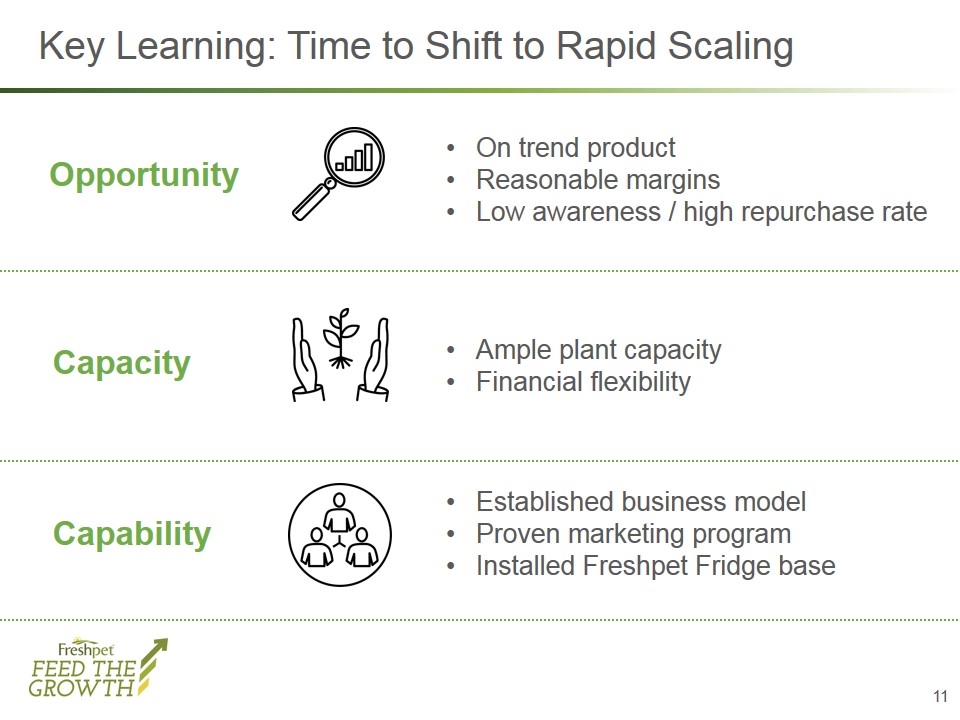
Key Learning: Time to Shift to Rapid Scaling On trend product Reasonable margins Low awareness / high repurchase rate Ample plant capacity Financial flexibility Established business model Proven marketing program Installed Freshpet Fridge base Opportunity Capacity Capability
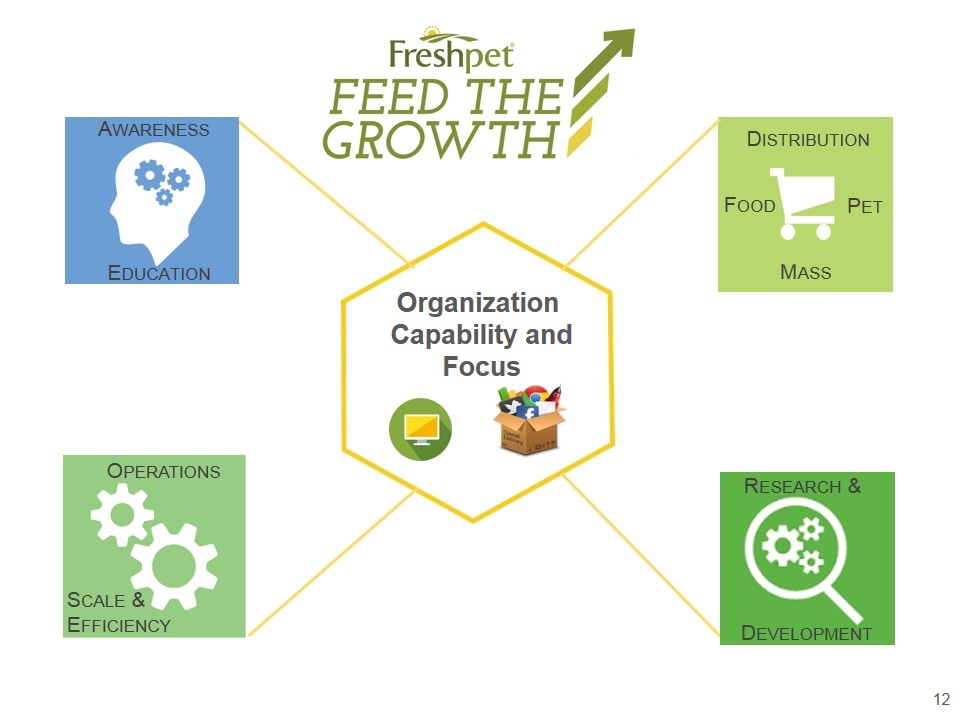
Organization Capability and Focus Distribution Food Pet Mass Operations Scale & Efficiency Education Awareness Research & Development
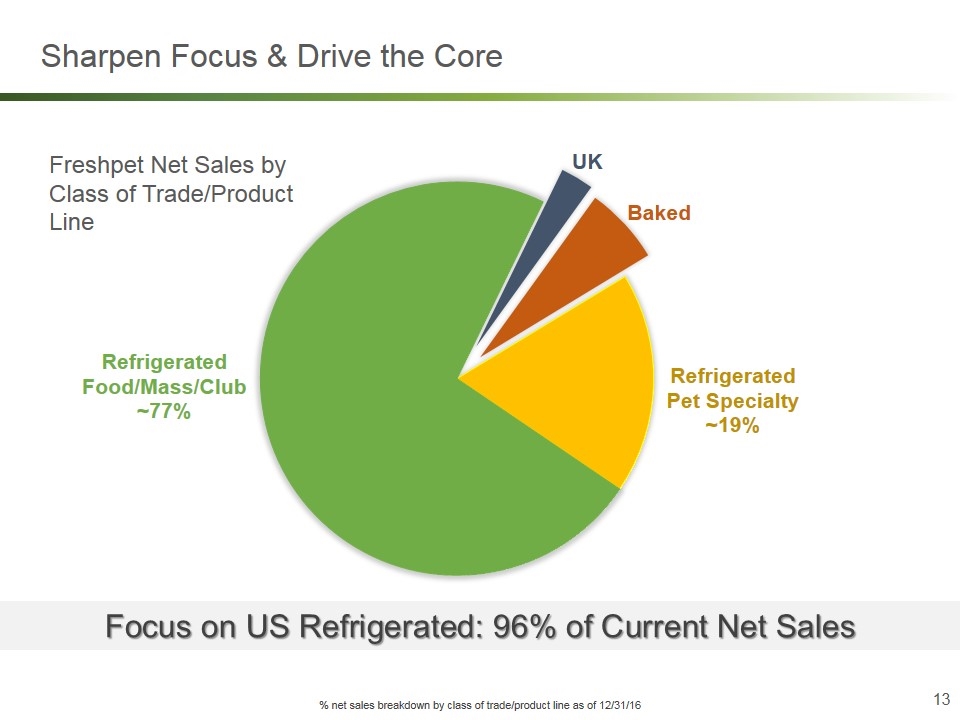
Sharpen Focus & Drive the Core Focus on US Refrigerated: 96% of Current Net Sales % net sales breakdown by class of trade/product line as of 12/31/16 Freshpet Net Sales by Class of Trade/Product Line
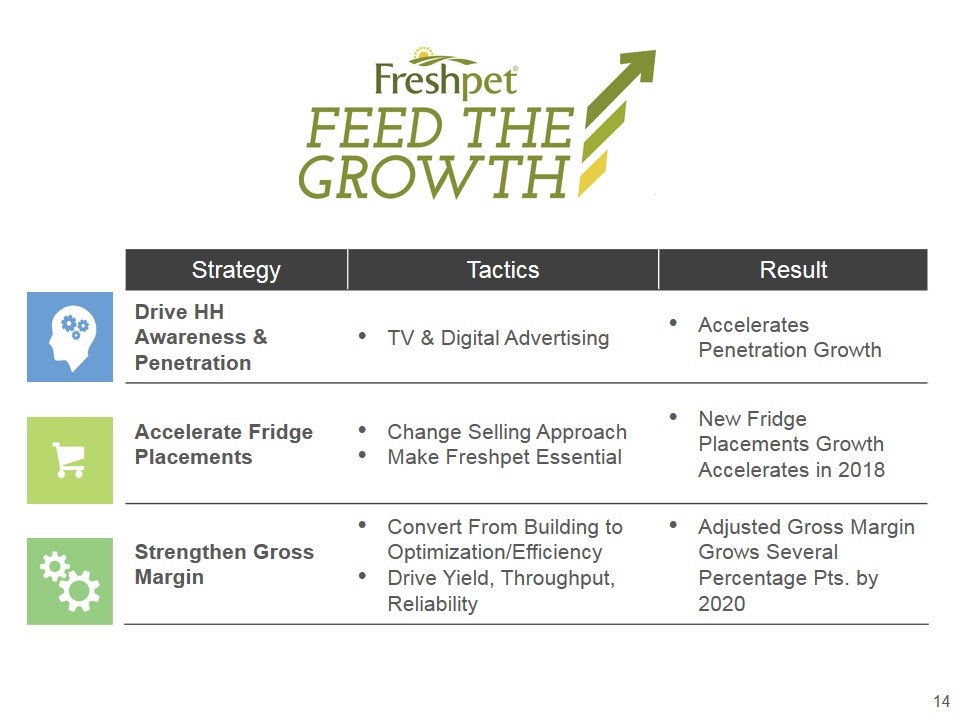
Strategy Tactics Result Drive HH Awareness & Penetration TV & Digital Advertising Accelerates Penetration Growth Accelerate Fridge Placements Change Selling Approach Make Freshpet Essential New Fridge Placements Growth Accelerates in 2018 Strengthen Gross Margin Convert From Building to Optimization/Efficiency Drive Yield, Throughput, Reliability Adjusted Gross Margin Grows Several Percentage Pts. by 2020
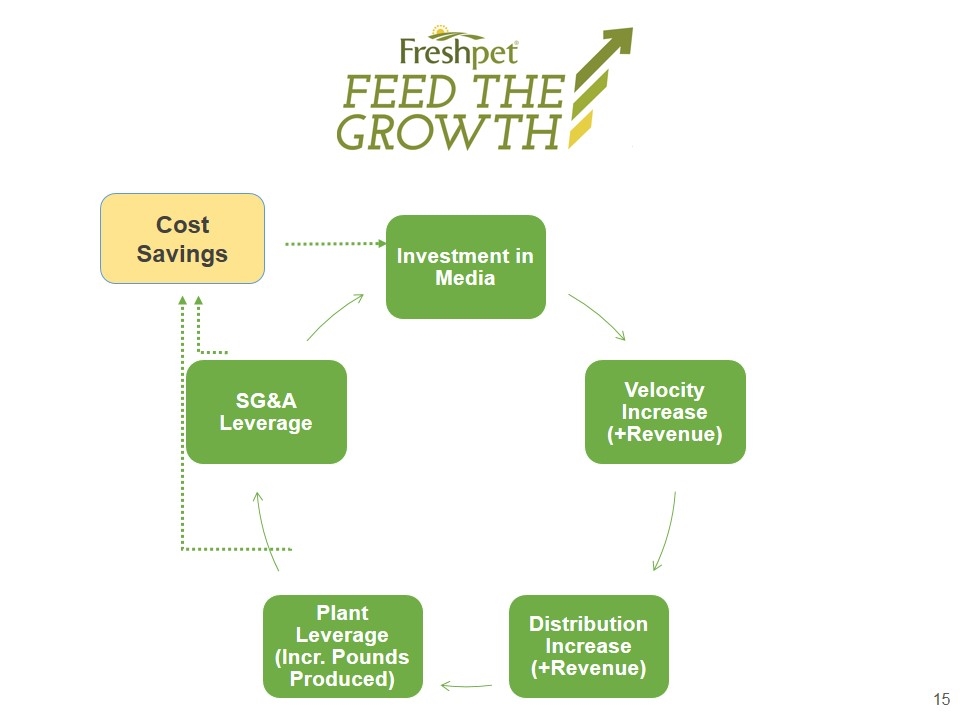
Cost Savings Investment in Media Velocity Increase (+Revenue) Distribution Increase (+Revenue) Plant Leverage (Incr. Pounds Produced) SG&A Leverage
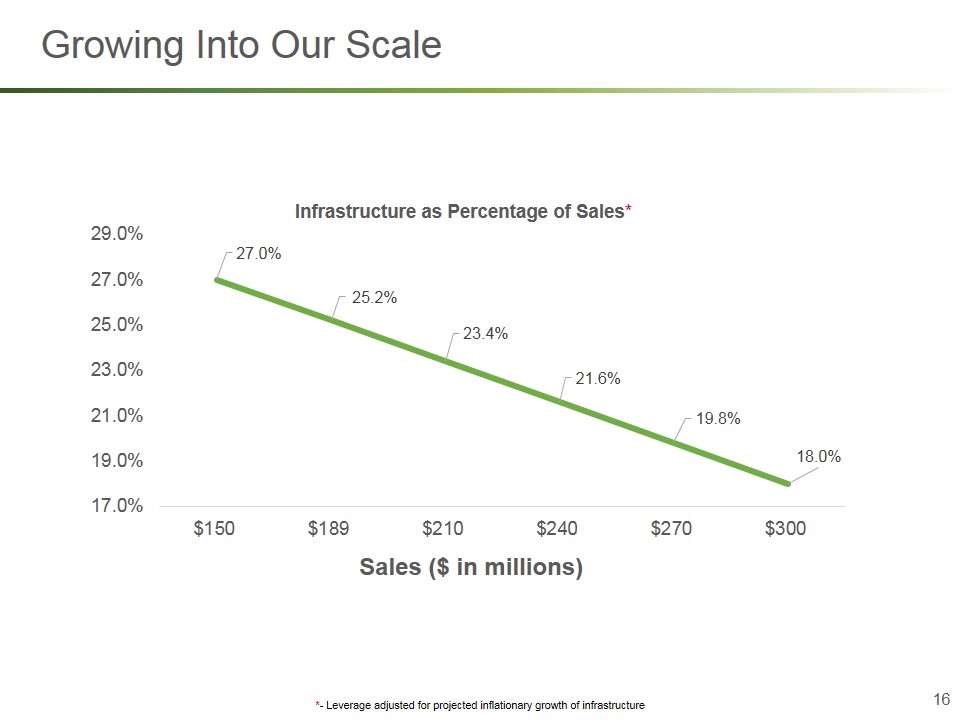
Growing Into Our Scale *- Leverage adjusted for projected inflationary growth of infrastructure Sales ($ in millions)
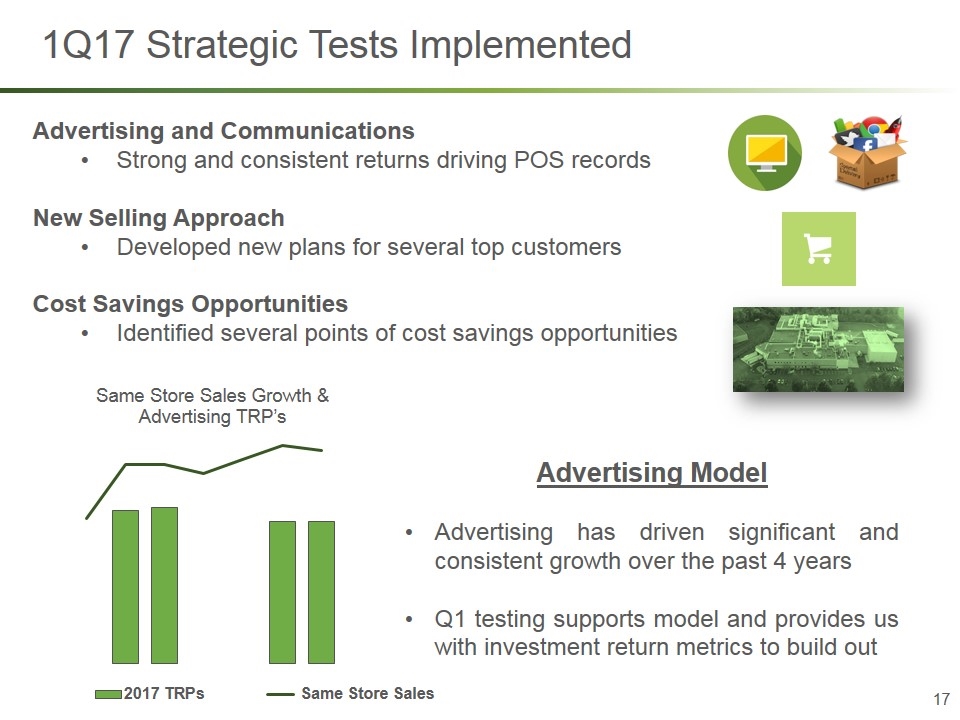
1Q17 Strategic Tests Implemented Advertising and Communications Strong and consistent returns driving POS records New Selling Approach Developed new plans for several top customers Cost Savings Opportunities Identified several points of cost savings opportunities Advertising Model Advertising has driven significant and consistent growth over the past 4 years Q1 testing supports model and provides us with investment return metrics to build out Same Store Sales
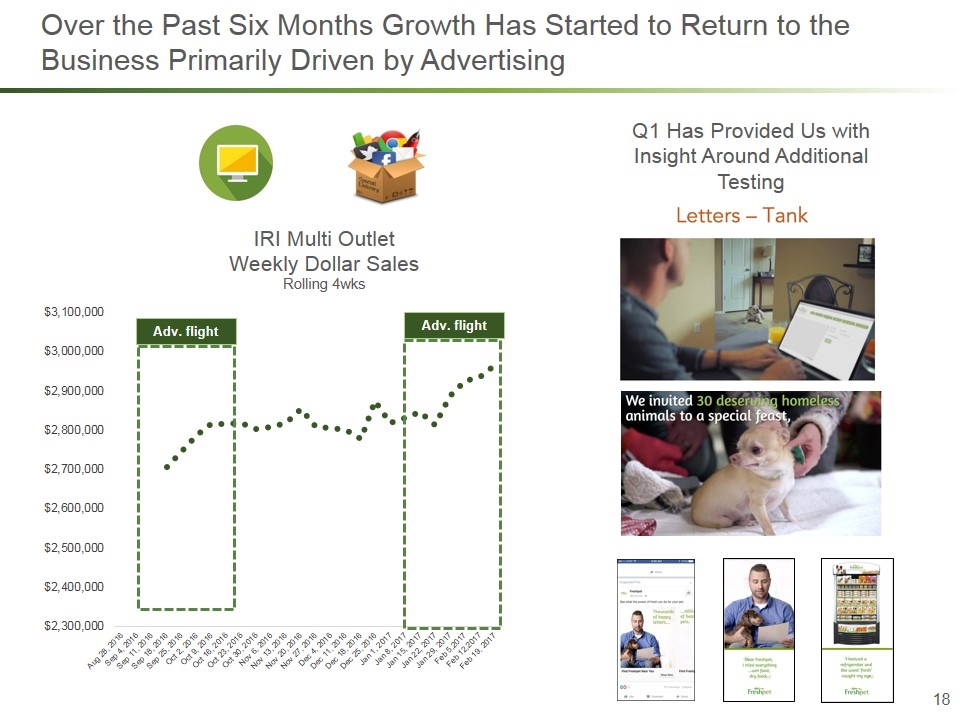
Over the Past Six Months Growth Has Started to Return to the Business Primarily Driven by Advertising Adv. flight Adv. flight Q1 Has Provided Us with Insight Around Additional Testing
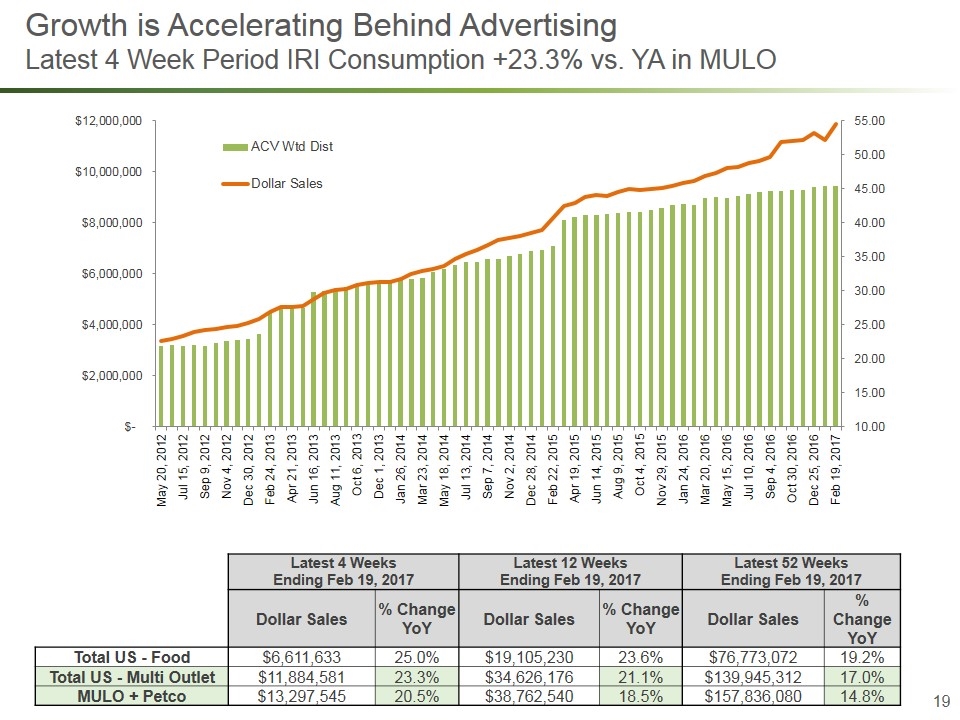
Growth is Accelerating Behind Advertising Latest 4 Week Period IRI Consumption +23.3% vs. YA in MULO Latest 4 Weeks Ending Feb 19, 2017 Latest 12 Weeks Ending Feb 19, 2017 Latest 52 Weeks Ending Feb 19, 2017 Dollar Sales % Change YoY Dollar Sales % Change YoY Dollar Sales % Change YoY Total US - Food $6,611,633 25.0% $19,105,230 23.6% $76,773,072 19.2% Total US - Multi Outlet $11,884,581 23.3% $34,626,176 21.1% $139,945,312 17.0% MULO + Petco $13,297,545 20.5% $38,762,540 18.5% $157,836,080 14.8%
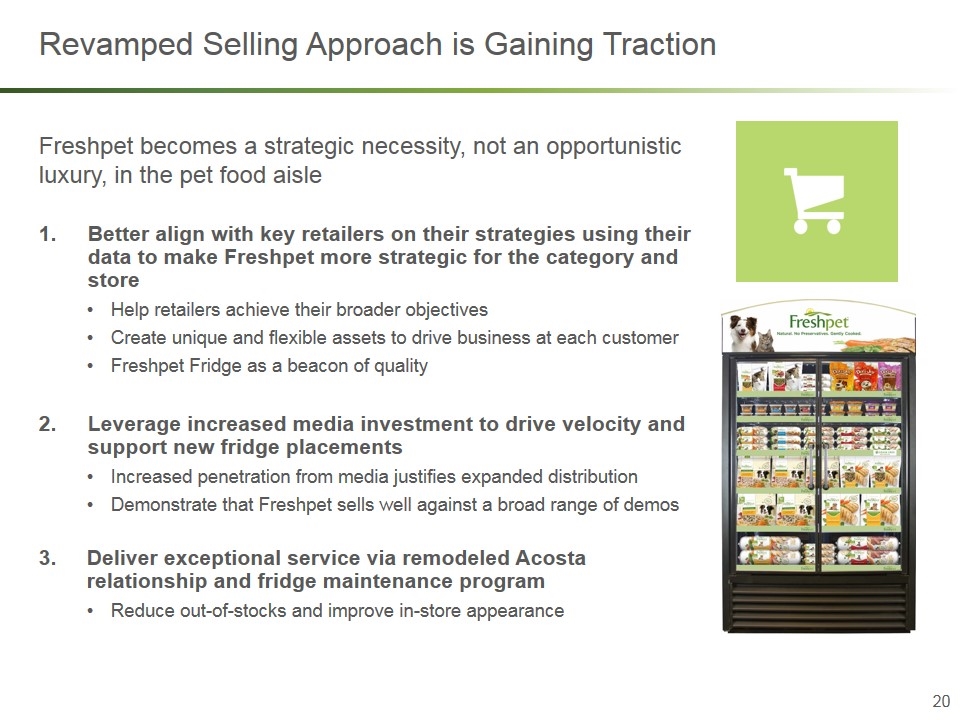
Better align with key retailers on their strategies using their data to make Freshpet more strategic for the category and store Help retailers achieve their broader objectives Create unique and flexible assets to drive business at each customer Freshpet Fridge as a beacon of quality Leverage increased media investment to drive velocity and support new fridge placements Increased penetration from media justifies expanded distribution Demonstrate that Freshpet sells well against a broad range of demos Deliver exceptional service via remodeled Acosta relationship and fridge maintenance program Reduce out-of-stocks and improve in-store appearance Revamped Selling Approach is Gaining Traction Freshpet becomes a strategic necessity, not an opportunistic luxury, in the pet food aisle
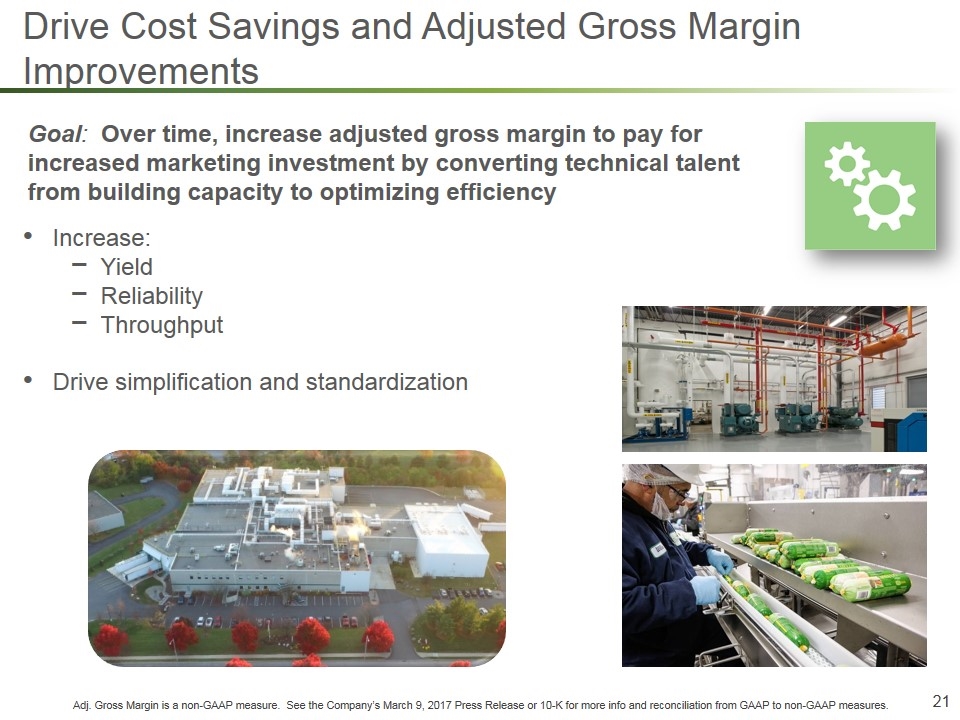
Increase: Yield Reliability Throughput Drive simplification and standardization Drive Cost Savings and Adjusted Gross Margin Improvements Adj. Gross Margin is a non-GAAP measure. See the Company’s March 9, 2017 Press Release or 10-K for more info and reconciliation from GAAP to non-GAAP measures. Goal: Over time, increase adjusted gross margin to pay for increased marketing investment by converting technical talent from building capacity to optimizing efficiency
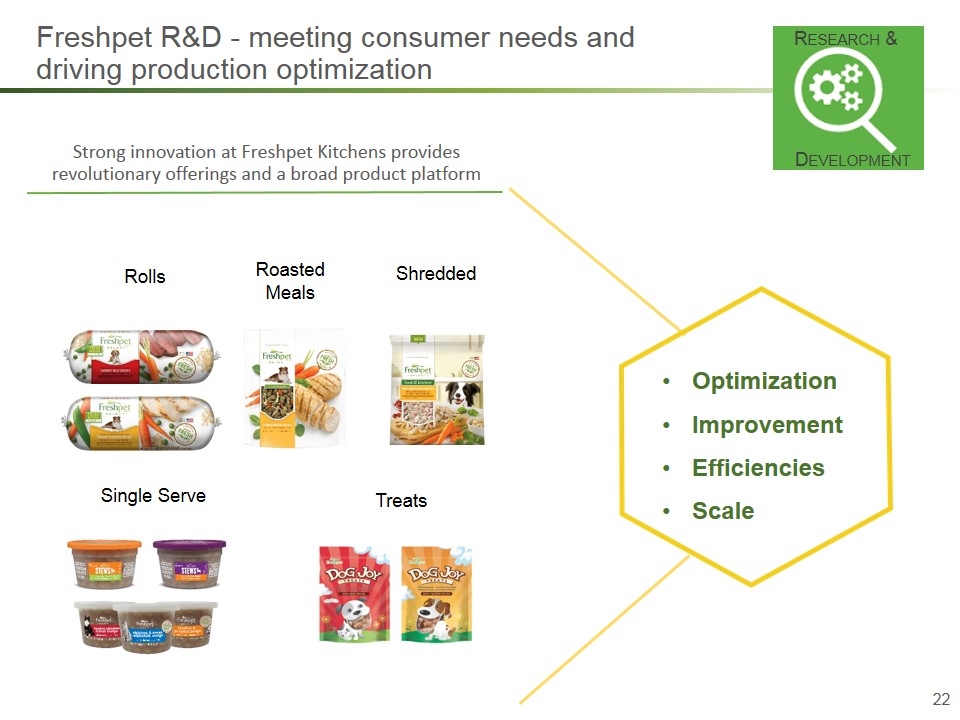
Strong innovation at Freshpet Kitchens provides revolutionary offerings and a broad product platform Freshpet R&D - meeting consumer needs and driving production optimization Rolls Single Serve Treats Roasted Meals Shredded Optimization Improvement Efficiencies Scale Research & Development
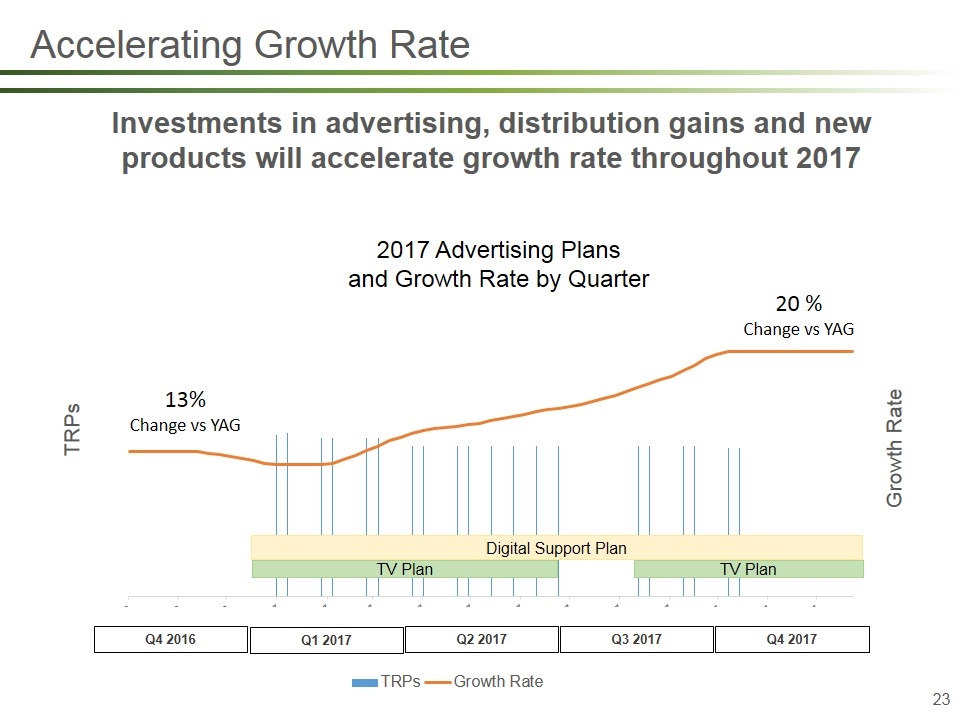
Q4 2017 Q3 2017 Q2 2017 Q1 2017 Q4 2016 Digital Support Plan TV Plan TV Plan Accelerating Growth Rate Investments in advertising, distribution gains and new products will accelerate growth rate throughout 2017 2017 Advertising Plans and Growth Rate by Quarter 13% Change vs YAG 20 % Change vs YAG
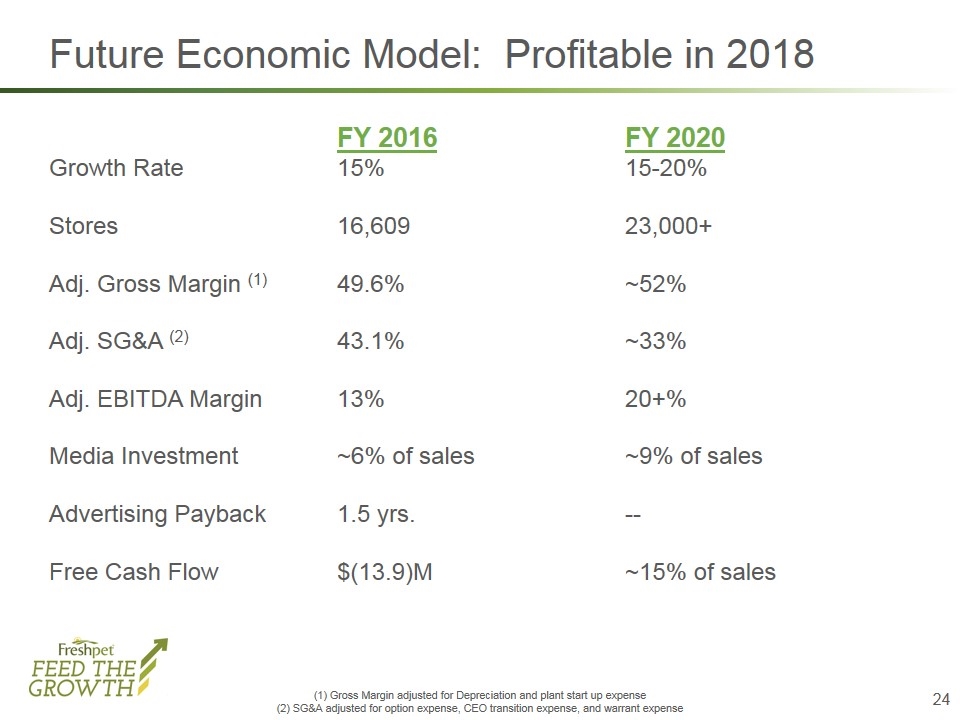
Future Economic Model: Profitable in 2018 FY 2016FY 2020 Growth Rate15%15-20% Stores16,60923,000+ Adj. Gross Margin (1)49.6%~52% Adj. SG&A (2) 43.1%~33% Adj. EBITDA Margin13%20+% Media Investment~6% of sales~9% of sales Advertising Payback1.5 yrs.-- Free Cash Flow$(13.9)M~15% of sales (1) Gross Margin adjusted for Depreciation and plant start up expense (2) SG&A adjusted for option expense, CEO transition expense, and warrant expense
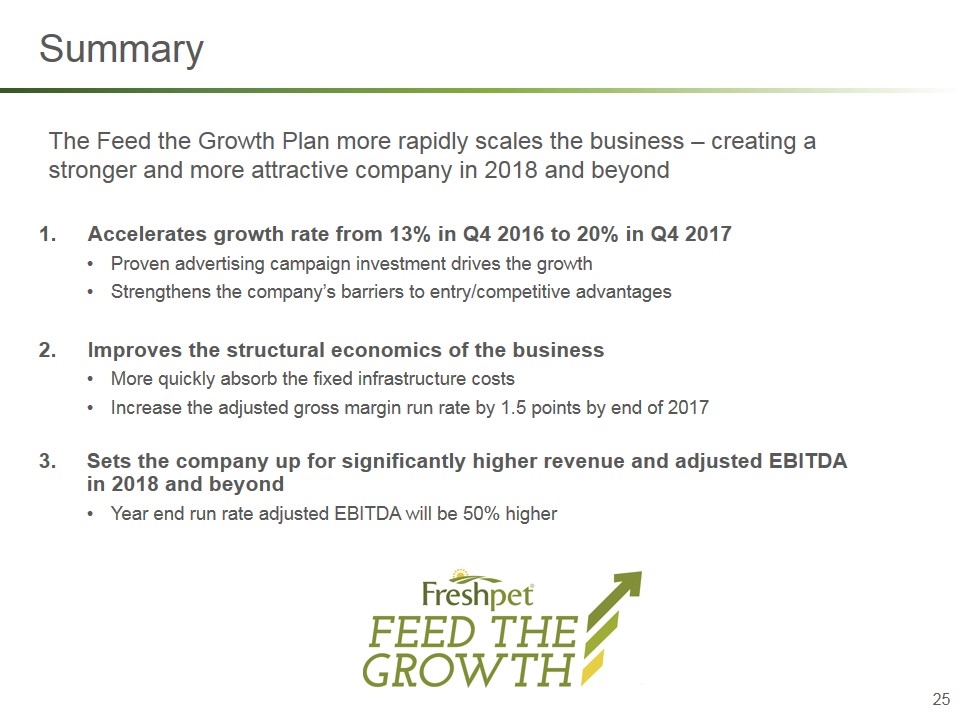
Accelerates growth rate from 13% in Q4 2016 to 20% in Q4 2017 Proven advertising campaign investment drives the growth Strengthens the company’s barriers to entry/competitive advantages Improves the structural economics of the business More quickly absorb the fixed infrastructure costs Increase the adjusted gross margin run rate by 1.5 points by end of 2017 Sets the company up for significantly higher revenue and adjusted EBITDA in 2018 and beyond Year end run rate adjusted EBITDA will be 50% higher Summary The Feed the Growth Plan more rapidly scales the business – creating a stronger and more attractive company in 2018 and beyond
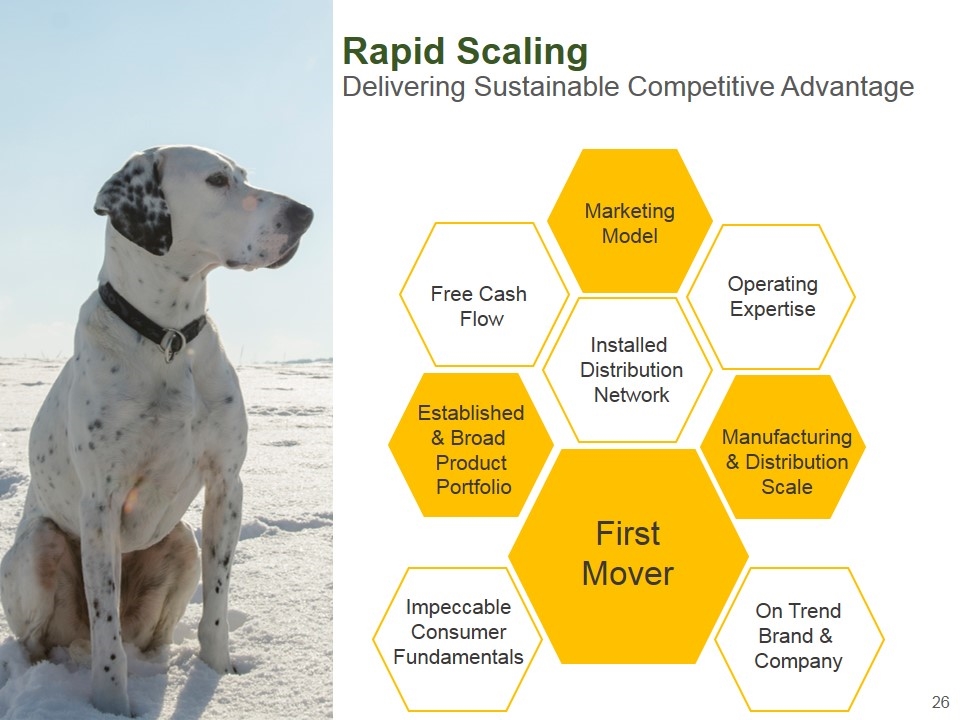
Rapid Scaling Delivering Sustainable Competitive Advantage Established & Broad Product Portfolio Impeccable Consumer Fundamentals First Mover On Trend Brand & Company Manufacturing & Distribution Scale Installed Distribution Network Free Cash Flow Marketing Model Operating Expertise
