Attached files
| file | filename |
|---|---|
| EX-99.1 - EXHIBIT 99.1 - ABM INDUSTRIES INC /DE/ | t1700651_ex99-1.htm |
| 8-K - FORM 8-K - ABM INDUSTRIES INC /DE/ | t1700651_8k.htm |
Exhibit 99.2

Cover Slide Title (20pt. Bold) First Quarter 2017 Teleconference March 8, 2017

Agenda 2 3 4 Capital Structure Fiscal 2017 Outlook Forward - Looking Statements and Non - GAAP Financial Information: Our discussions during this conference call will include forward - looking statements. Actual results could differ materially fro m those projected in the forward - looking statements. Some of the factors that could cause actual results to differ are discussed in the Company’s 2016 Annual Report on Form 10 - K and in our 2017 reports on Form 10 - Q and Form 8 - K. These reports are available on our website at http:// investor.abm.com under “SEC Filings”. A description of other factors that could cause actual results to differ is also set forth at the end of this presentation. Also, the discussion during this conference call will include certain financial measures that were not prepared in accordance wi th U.S. generally accepted accounting principles (“U.S. GAAP”). Reconciliations of those non - GAAP financial measures to the most directly comparable U.S. GAAP financ ial measures can be found on the Investor Relations portion of our website at http://investor.abm.com and at the end of this presentation. 1 ABM Business Overview 2 First Quarter 2017 Review

$1,268.4 $1,326.7 2016 2017 Q1 FY17 Revenue First Quarter 2017 Review 3 Note: Excluding the impact of currency translation, organic revenue growth for Q1 FY17 was 4.5% • Q1 FY17 revenue increase of 4.6% y - o - y • Q1 FY17 3.6% organic growth
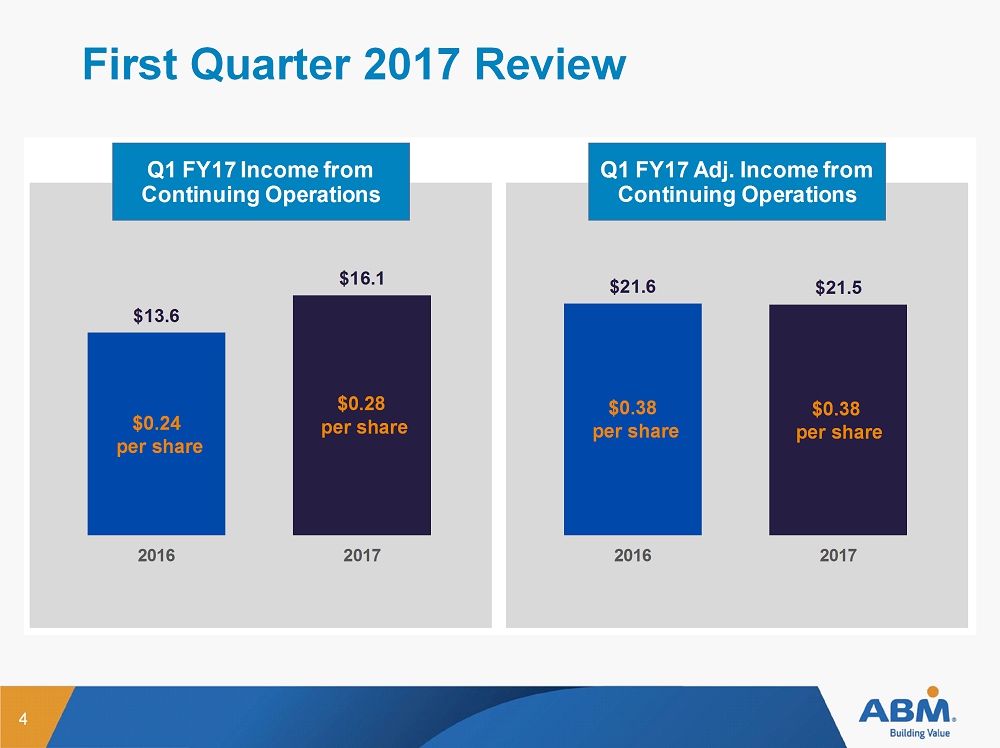
First Quarter 2017 Review 4 $13.6 $16.1 2016 2017 Q1 FY17 Income from Continuing Operations $21.6 $21.5 2016 2017 Q1 FY17 Adj. Income from Continuing Operations $0.28 per share $0.38 per share $0.38 per share $0.24 per share

$14.0 ($56.8) 2016 2017 Q1 FY17 Net Income (Loss) 1 $43.7 $48.1 2016 2017 Q1 FY17 Adj. EBITDA First Quarter 2017 Review 5 1 Net Income (Loss) includes income (loss) from discontinued operations • Q1 FY17 margin increase of 20 bps y - o - y 3.4% margin 3.6% margin
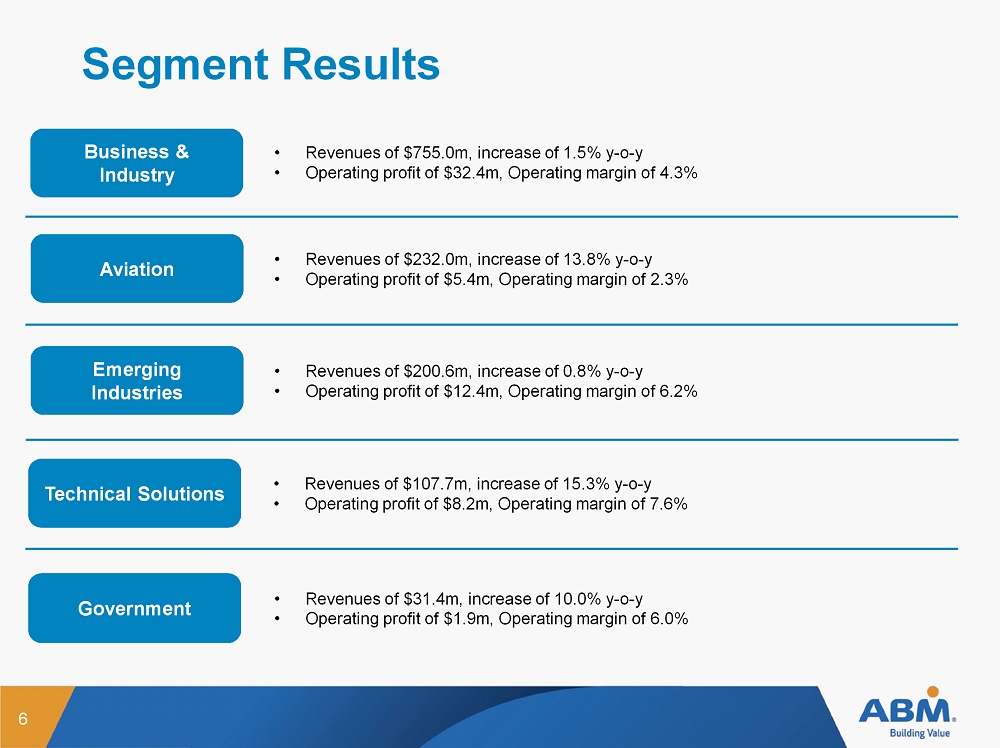
Segment Results 6 Business & Industry • Revenues of $755.0m, increase of 1.5% y - o - y • Operating profit of $ 32.4 m, Operating margin of 4.3 % Aviation • Revenues of $232.0m, increase of 13.8% y - o - y • Operating profit of $ 5.4 m, Operating margin of 2.3 % Emerging Industries • Revenues of $200.6m, increase of 0.8% y - o - y • Operating profit of $ 12.4 m, Operating margin of 6.2 % Technical Solutions Government • Revenues of $107.7m, increase of 15.3% y - o - y • Operating profit of $ 8.2 m, Operating margin of 7 .6% • Revenues of $31.4m, increase of 10.0% y - o - y • Operating profit of $ 1.9 m, Operating margin of 6.0 %

Capital Structure

Select Cash Flow & Balance Sheet Items Leverage 8 Q1 FY17 Leverage of ~2.5x * Note: Acquisitions shown represent purchase above $15m Long - Term Leverage Target 2.5x Future State 1 Decrease in FY15 Q4 leverage due to disposition of Security * Leverage calculated as total indebtedness / pro - forma adjusted EBITDA

Select Cash Flow & Balance Sheet Items Shareholder Return 9

Fiscal 2017 Outlook

Fiscal 2017 Outlook 11 Metric Amount Income from continuing operations per diluted share $1.40 - $1.50 Adjusted Income from continuing operations per diluted share $1.80 - $1.90 Depreciation & Amortization $57m - $61m Interest Expense $11m - $13m Capital Expenditures $60m - $70m Adjusted EBITDA Margin 4.5% to 4.6% Tax Rate (excluding WOTC & other discrete tax items) 1 ~42% Incremental 2017 impact H1 2017: $8m - $10m H2 2017: $10m - $12m 1 This tax rate excludes the $0.11 impact of 2017 Work Opportunity Tax Credits and $0.04 benefit from adoption of ASU 2016 - 09 2017 Working Days Quarter Q1 Q2 Q3 Q4 Days 66 63 66 66 Δ y - o - y +1 - 2 +1 0

12 New Segment Structure by Industry Group

13 New Segment Structure by Industry Group 1 Includes Education, Healthcare, and High - Tech 2 Includes Technical Solutions U.S. (formerly ABES) and Technical Solutions U.K. (formerly Westway ) Segment FY17 Operating Profit Margin % Business & Industry low to mid 5% Aviation mid to high 4% Emerging Industries 1 mid to high 6% Technical Solutions 2 mid to high 7% Government held for sale

Forward - Looking Statement This presentation contains both historical and forward - looking statements. In this context, ABM Industries Incorporated (“ABM”) and its subsidiaries (colle ctively referred to as “ABM,” “we,” “us,” “our,” or the “Company”). We make forward - looking statements related to future expectations, e stimates and projections that are uncertain, and often contain words such as “anticipate,” “believe,” “could,” “estimate,” “expect,” “forecast,” “intend,” “lik ely ,” “may,” “outlook,” “plan,” “predict,” “should,” “target,” or other similar words or phrases. These statements are not guarantees of future performance and are subject to kno wn and unknown risks, uncertainties, and assumptions that are difficult to predict. For us, particular uncertainties that could cause our actual results to be materia lly different from those expressed in our forward - looking statements include: (1) changes to our businesses, operating structure, financial reporting structure, or person nel relating to the implementation of our 2020 Vision strategic transformation initiative; (2) unfavorable developments in our class and representative actions and oth er lawsuits alleging various claims; (3) increases in estimates of ultimate insurance losses; (4) challenges implementing our risk management and safety programs; (5) un certainty in future cash flows, increases in the level of our borrowings, or inability to repurchase shares at anticipated levels; (6) challenges preserving lon g - term client relationships, passing through costs to clients, responding to competitive pressures, and retaining qualified personnel; (7) challenges in identifying, acqu iri ng, and integrating businesses; (8) unexpected tax liabilities or changes in tax laws; (9) changes in energy prices or energy regulations; (10) deterioration of gen eral economic conditions and reductions in commercial office building occupancy; (11) impairment of goodwill and long - lived assets; (12) changes in immigration laws or enf orcement actions or investigations under such laws; (13) significant delays or reductions in appropriations for our government contracts; (14) failure of our jo int venture partners to perform their obligations; (15) inability to complete the sale of our Government Services business in a timely manner or within the price r ang e we have assumed, or at all; (16) losses or other incidents at facilities in which we operate; (17) difficulty responding to cyber - security risks and business interrupti ons; (18) liabilities associated with participation in multiemployer pension plans; (19) actions of activist investors; and (20) weather conditions, catastrophic e ven ts, disasters, operations in areas of military conflict, and terrorist attacks. The list of factors above is illustrative and by no means exhaustive. Additional information regarding these and other risks and uncertainties we face is contained in our Annual Report on Form 10 - K for the yea r ended October 31, 2016 and in other reports we file from time to time with the Securities and Exchange Commission (including all amendments to those re ports). We urge readers to consider these risks and uncertainties in evaluating our forward - looking statements. We caution readers not to place undue reliance upon any such forward - looking statements, which speak only as of the date made. We undertake no obligation to publicly update any forward - looking statements, whether as a result of new information, future events, or otherwise, except as required by law. 14

Appendix

Unaudited Reconciliation of non - GAAP Financial Measures 16 (a) The Company adjusts income from continuing operations to exclude the impact of certain items that are unusual, non - recurring, or otherwise do not reflect management’s views of the underlying operational results and trends of the Company. (b) Represents adjustments to our self - insurance reserve for general liability, workers’ compensation and automobile claims related to prior p eriod accident years. Management believes these prior period reserve changes do not illustrate the performance of the Company’s normal ongoing operations given the current y ear ’s insurance expense is estimated by management in conjunction with the Company’s outside actuary to take into consideration past history and current costs and regulatory trend s. Once the Company develops its best estimate of insurance expense premiums for the year, the Company fully allocates such costs out to the business leaders to hold them accountable fo r t he current year costs within operations. However, since these prior period reserve changes relate to claims that could date back many years, current management has limited ability to infl uen ce the ultimate development of the prior year changes. Accordingly, including the prior period reserve changes in the Company’s current influence the ultimate development of the pr ior year changes. Accordingly, including the prior period reserve changes in the Company’s current operational results would not depict how the business is run as the Company holds its manage men t accountable for the current year’s operational performance. The Company believes this is the most meaningful presentation for its investors and analysts to evaluate perform anc e. (c) Represents reimbursement of previously expensed legal and other costs incurred in connection with an internal investigation i nto a foreign entity affiliated with a former joint venture partner. (d) Represents costs for 2020 Vision Transformation Initiative, net of the reversal of certain share - based compensation costs . (e) Tax impact is calculated using the federal and state statutory rate of 41.5%. (in millions)

Unaudited Reconciliation of non - GAAP Financial Measures 17 (f) Adjusted EBITDA does not include interest income for certain long term energy contracts, in which case a gross up of both int ere st income and interest expense is being recorded. (in millions, except for share amounts)

2017 Guidance 18