Attached files
| file | filename |
|---|---|
| 8-K - 8-K - UNITED INSURANCE HOLDINGS CORP. | form8-kq12017investorprese.htm |

United Insurance Holdings Corp.
NASDAQ: UIHC
Investor Presentation March 2017
“Moving Forward”

2 MARCH 2017 INVESTOR PRESENTATION “Moving Forward”
Executive Summary
• Our strategy is intact
• Execution of organic growth and geographic
diversification has exceeded plans
• Business outside Florida is growing and profitable
• Over 60% of exposure and 85% of new business is
outside Florida
• All non-Florida regions were solidly profitable in 2016
• AOB exposure is confined, small, and shrinking
• Miami/Dade and Broward counties represent only ~5% of
the Company’s total PIF
• Nonrenewals, cessation of new business, and no planned
takeouts will accelerate shrinkage of this exposure
• Pending American Coastal merger will…….
• increase scale, reduce earnings volatility, improve
returns, provide additional resiliency, and open up new
growth opportunities

MARCH 2017 INVESTOR PRESENTATION
OUR STRATEGY IS INTACT

4 MARCH 2017 INVESTOR PRESENTATION “Moving Forward”
Company Evolution
Merger with
American Coastal
creates a leading
specialty cat
underwriter in
both personal and
commercial
property
Added 3 new
Directors with
extensive
insurance
experience
Rollout of
additional property
products in
existing states
Continue
diversification of
exposure by peril
and geography
Phase 4
(2017-Forward)
Reconstituted
original Board of
Directors and
revamped
Executive Team
Public offering of
common stock &
became listed on
NASDAQ
Diversified outside
FL into 11 new
states
Strong organic
growth
complemented by
two strategic
acquisitions
Phase 3
(2012-2016)
Became a public
company
Legislative and
regulatory
changes
temporarily slow
growth and
profitability
Avoided Sinkhole
crisis through
disciplined
underwriting
Phase 2
(2008-2011)
Begin operations
in Florida with
$5.5m of capital
Maintained
profitability every
year despite 8
hurricanes in
2004-05
Phase 1
(1999-2007)
VISION: To be the premier provider of property
insurance in catastrophe-exposed areas

5 MARCH 2017 INVESTOR PRESENTATION “Moving Forward”
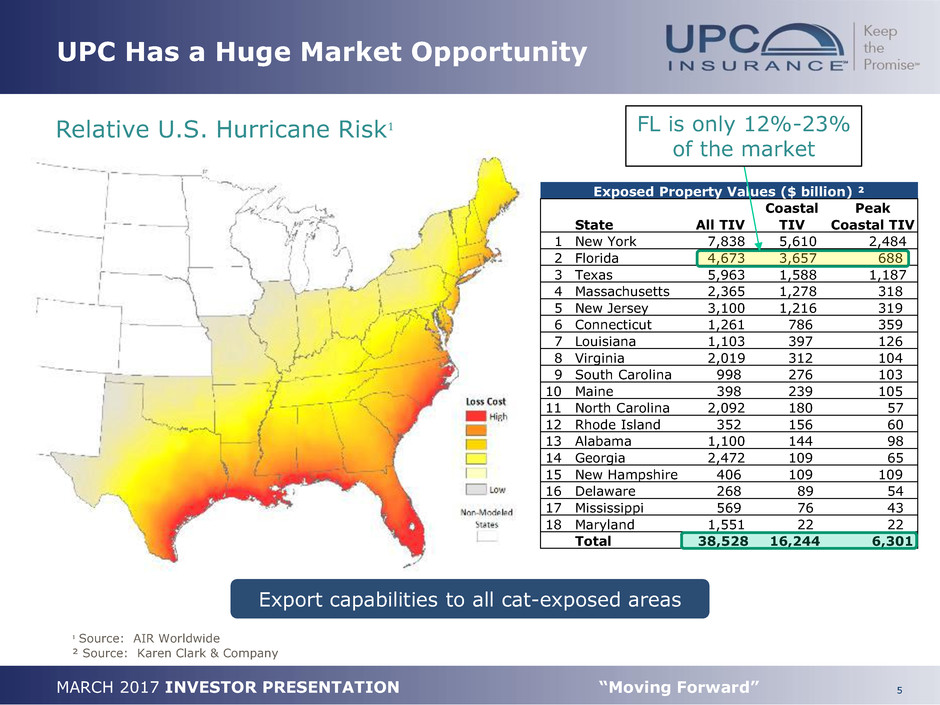
UPC Has a Huge Market Opportunity
Relative U.S. Hurricane Risk¹
¹ Source: AIR Worldwide
² Source: Karen Clark & Company
Export capabilities to all cat-exposed areas
Exposed Property Values ($ billion) ²
Coastal Peak
State All TIV TIV Coastal TIV
1 New York 7,838 5,610 2,484
2 Florida 4,673 3,657 688
3 Texas 5,963 1,588 1,187
4 Massachusetts 2,365 1,278 318
5 New Jersey 3,100 1,216 319
6 Connecticut 1,261 786 359
7 Louisiana 1,103 397 126
8 Virginia 2,019 312 104
9 South Carolina 998 276 103
10 Maine 398 239 105
11 North Carolina 2,092 180 57
12 Rhode Island 352 156 60
13 Alabama 1,100 144 98
14 Georgia 2,472 109 65
15 New Hampshire 406 109 109
16 Delaware 268 89 54
17 Mississippi 569 76 43
18 Maryland 1,551 22 22
Total 38,528 16,244 6,301
FL is only 12%-23%
of the market

6 MARCH 2017 INVESTOR PRESENTATION “Moving Forward”
UPC is Achieving Growth and
Geographic Diversification
Policies in-force at
12/31/2016
Policies in-force at
12/31/2015
Total PIF: 347,015
Total PIF: 451,155
Y/Y PIF growth
+30%

7 MARCH 2017 INVESTOR PRESENTATION “Moving Forward”
Property Exposure is Well Balanced
Total Insured Value
12/31/2016
Total Insured Value
12/31/2015
TIV = $159.6B
TIV = $214.1B
49%
22%
15%
14%
FL Northeast Southeast Gulf
37%
29%
15%
19%
FL Northeast Southeast Gulf

8 MARCH 2017 INVESTOR PRESENTATION “Moving Forward”
Quality Growth Continues to
Exceed Expectations
Consistent, controlled and well managed growth over time…
$-
$100,000
$200,000
$300,000
$400,000
$500,000
$600,000
$700,000
$800,000
2012 2013 2014 2015 2016
Gross Premiums Earned - All States
CAGR = 31.0%

9 MARCH 2017 INVESTOR PRESENTATION “Moving Forward”
UPC’s Four Proven Pathways for Growth
Organic
Underwriting
Carrier
Partnerships
Policy/Portfolio
Assumption
Mergers &
Acquisitions
12,000 Appointed
Independent
Agencies & MGA’s
Nationally.
Highest
PIF of any
producer
Largest
producer
of new
business
UPC has executed
two accretive
acquisitions and the
pending American
Coastal merger holds
great promise
Completed 1st ever
assumption from
TWIA in Q4-16
UPC is building significant value for shareholders through multi-
faceted distribution

MARCH 2017 INVESTOR PRESENTATION
BUSINESS OUTSIDE FLORIDA IS
GROWING AND PROFITABLE

11 MARCH 2017 INVESTOR PRESENTATION “Moving Forward”
Growth Outside Florida Has Been HUGE…
$-
$50,000
$100,000
$150,000
$200,000
$250,000
$300,000
$350,000
2012 2013 2014 2015 2016
Gross Premiums Earned - Excluding FL
CAGR = 77.5%

12 MARCH 2017 INVESTOR PRESENTATION “Moving Forward”
…….. And Profitable…….
Numbers in thousands ($000) FL Gulf NE SE Total
Total Revenue $ 218,023 $ 116,389 $ 94,787 $ 58,018 $ 487,217
Total Expense $ 233,571 $ 95,129 $ 81,677 $ 69,837 $ 480,214
Income (loss) before tax $ (15,547) $ 21,260 $ 13,110 $ (11,819) $ 7,003
Hurricane Matthew $ (13,002) $ - $ - $ (16,998) $ (30,000)
EBIT X-Matthew (2,545) 21,260 13,110 5,179 37,003
UPC Had Underlying Profitability in Every Zone Outside of Florida

13 MARCH 2017 INVESTOR PRESENTATION “Moving Forward”
….. And Sticky
Strong Retention Supports UPC’s First Mover Advantage
2014 2015 2016
Retained At Renewal 90% 92% 92%
Retained Through Full Policy Term 81% 84% 85%
74%
76%
78%
80%
82%
84%
86%
88%
90%
92%
94%
2014 2015 2016
Retention Rates
Retained At Renewal Retained Through Full Policy Term

MARCH 2017 INVESTOR PRESENTATION
AOB EXPOSURE IS CONFINED,
SMALL, AND SHRINKING

15 MARCH 2017 INVESTOR PRESENTATION “Moving Forward”
Perspective on Assignment of Benefits
• AOB is an industry problem impacting all property insurers in
Florida
• It is predominantly contained to water losses in Broward and
Miami-Dade counties (BMD)
• UPC had ~24,000 policies in BMD at 12/31/16 which is ~5% of
total policies in-force.
• UPC has stopped writing new business with very limited exceptions
in BMD, and is nonrenewing policies in accordance with regulatory
guidelines
• The Company has also adopted policy language changes that are
expected to curb loss costs
AOB is largely confined to a small
area of Florida that is a negligible
part of our overall risk portfolio

16 MARCH 2017 INVESTOR PRESENTATION “Moving Forward”
“Big 3” Operational Initiatives to Combat
AOB and Improve Overall Results
• Organizational redesign focused on reducing independent adjuster
utilization in favor of dedicated and highly trained UPC associates.
• Reducing the cycle time of the average claim through better
scoping, estimating and performance management
• Increased service level standards and vendor management
1. Claims Adjusting Capabilities
• Rate increase filed in Texas and will be filed in Florida Q1; other
states to come in Q2
• Coverage and rule changes designed to improve underwriting
results
2. Product Hygiene
• Focus on reduced claims cycle time and reserving to the ultimate
expected loss faster
• Improved file handling means fewer reopens
3. Control Development

MARCH 2017 INVESTOR PRESENTATION
FINANCIAL PERSPECTIVE

18 MARCH 2017 INVESTOR PRESENTATION “Moving Forward”
2016 Financial Highlights
36.2%
Revenue
Growth
2.4%
ROAE
89.0%
Underlying
Combined
Ratio ¹
Results for the year ended
December 31, 2016:
¹ “Underlying” results exclude losses incurred from catastrophes and prior year reserve development
Remained profitable despite $55.8 million of net catastrophe losses
2017 Goal: Earn >10% ROAE even with same level of CAT losses

19 MARCH 2017 INVESTOR PRESENTATION “Moving Forward”
How Have We Done Over the
Long-term? – Part 1
Year Ended
Key Metrics 12/31/2013 12/31/2014 12/31/2015 12/31/2016
Gross premium earned ($000) $ 316,708 $ 400,695 $ 504,215 $ 666,829
Net income ($000) $ 20,342 $ 41,013 $ 27,358 $ 5,698
EPS $ 1.26 $ 2.05 $ 1.28 $ 0.26
Combined ratio 87.7% 81.4% 94.0% 104.9%
ROAE 20.8% 27.2% 12.4% 2.4%
Net retained cat losses ($000) $ 5,666 $ 829 $ 28,565 $ 55,842
Net income ex-cat ($000) $ 23,690 $ 41,541 $ 46,027 $ 40,849
EPS ex-cat $ 1.46 $ 2.05 $ 2.14 $ 1.89
Underlying combined ratio ¹ 83.8% 82.6% 86.2% 89.0%
ROAE ex-cat 23.6% 22.3% 20.6% 17.4%
¹ Excludes catastrophe losses and prior year reserve development
Underlying results
represent the true
earnings power of
UPC Insurance over
the long-term
Property CAT is
inherently volatile

20 MARCH 2017 INVESTOR PRESENTATION “Moving Forward”
Underwriting Profits Drive Returns
Core
Results
Driving
Returns
20.8% 27.2% 2.4% ROAE
2013 2014 2016
$28.6m &
$55.8M of
CAT loss in
2015 & 2016
-80,000
-60,000
-40,000
-20,000
0
20,000
40,000
60,000
80,000
2013 2014 2015 2016
Underwriting Gain Investment Income CAT Losses Reserve Development
12.4%
2015
5-Year (2012-2016)
Average ~13%

21 MARCH 2017 INVESTOR PRESENTATION “Moving Forward”
Investments Avoid Asset Risk
• Designed to preserve capital, maximize
after-tax investment income & liquidity
while minimizing asset & interest rate risk
• As of December 31, 2016, 99.7% of the
Company’s fixed maturity portfolio
was rated investment grade
– Average duration: 3.7 years
– Composite rating: A
– Average coupon: 3.05%
All data as of December 31, 2016
Securities Portfolio
Value
($mm)
% of total
Cash and
Investments
Fixed Maturities $494.5 72.8%
Cash & Cash Equivalents 150.7 22.2%
Equity Securities 28.4 4.2%
Other Long-Term Investments 5.7 0.8%
Total cash and investments $679.3 100%
22.4%
24.9%
25.4%
4.3%
0.8%
22.2%
Government & Agency
Municipal Bonds
Corporate Bonds
Common & Preferred
Equity
Other long-term
investments
Cash & cash equivalents
-
10,000,000
20,000,000
30,000,000
40,000,000
50,000,000
60,000,000
70,000,000
80,000,000
90,000,000
100,000,000
FY'17 FY'18 FY'19 FY'20
Agencies Corporates CMOs Int Govt. Municipals US. Govt. Pfd. Stock
Fixed Income Maturities
Asset Allocation

22 MARCH 2017 INVESTOR PRESENTATION “Moving Forward”
Expense Ratio History
• Net Expense Ratio still declining excluding non-recurring items in
2015 and 2016.
• Quota-share reinsurance will impact comparability in 2017 since
ceding commission income is classified as “Other Revenue”, not a
reduction to PAC on a GAAP basis.
37.2% 32.3% 30.2% 25.6% 24.8% 26.0% 25.7%
5.9%
5.7% 7.1%
4.7% 4.4% 4.6% 4.5%
11.2%
10.7% 9.6%
7.4% 7.6% 8.9% 9.4%
54.4%
48.6% 46.9%
37.7% 36.8%
39.5% 39.6%
0.0%
20.0%
40.0%
60.0%
80.0%
100.0%
120.0%
2010 2011 2012 2013 2014 2015 2016
Net Expense Ratio
Net PAC Ratio Net Operating Ratio Net Admin Ratio Net Expense Ratio

23 MARCH 2017 INVESTOR PRESENTATION “Moving Forward”
How Have We Done Over the
Long-term? – Part 2
Consistent
Dividend & Book
Value Growth
Strong
Performance
Relative to Indices
$-
$0.05
$0.10
$0.15
$0.20
$0.25
FY13 FY14 FY15 FY16
Common Stock Dividends Paid
$-
$2.00
$4.00
$6.00
$8.00
$10.00
$12.00
FY12 FY13 FY14 FY15 FY16
Book Value Per Share
2012 2013 2014 2015 2016
UIHC $198.68 $469.44 $737.16 $581.00 $514.06
Russell 2000 $108.38 $148.49 $153.73 $144.95 $173.18
NASDAQ Insr Index (KIX) $117.01 $150.69 $163.56 $174.12 $207.78
S&P Insr EFT (KIE) $106.07 $154.18 $165.93 $175.78 $213.36
$-
$100.00
$200.00
$300.00
$400.00
$500.00
$600.00
$700.00
$800.00
Cumulative Value of $100 Investment from 1/1/12 to 12/31/16

MARCH 2017 INVESTOR PRESENTATION
PENDING MERGER WITH AMERICAN
COASTAL PROMISES HUGE BENEFITS

25 MARCH 2017 INVESTOR PRESENTATION “Moving Forward”
Merger Partner Brings Long Track Record
of Strong Underwriting Results
American Coastal is the largest writer of commercial residential insurance in Florida
•Attractive commercial property platform for expansion and diversification
•Superior underwriting and proven track record
5-year average combined ratio of 63%
5-year average ROE of 21%
5-year cumulative net earnings of $190mm
•Highest market share of private players in Florida Commercial Residential with 30%
•Long standing service to the Florida market and 15+ years since inception of AmRisc
•Exclusively short-tail property business with MINIMAL AOB EXPOSURE.
•Sophisticated multi-model underwriting approach
•Data capture is best in the industry
•100% Voluntary / No takeout business
•Strong relationship / growth opportunity with BB&T (AmRisc/CRC/BB&T/McGriff)

26 MARCH 2017 INVESTOR PRESENTATION “Moving Forward”
New Vice-Chairman of the Board
Dan Peed Background
• Currently serves as CEO of American Coastal and President and CEO of
AmRisc, LLC
• Mr. Peed has over 30 years of experience in the insurance industry
Includes both insurance and reinsurance underwriting focused on commercial property risk
• Mr. Peed previously was a Senior Vice President at Sorema N.A. Reinsurance
Company from 1991 – 2000
• He started his career as a Loss Prevention Consultant at Factory Mutual
Insurance Company (FM Global) from 1985 - 1991
• Mr. Peed received his MBA with insurance focus from University of North
Texas and a B.S. in Petroleum Engineering from Texas A&M University
AmRisc Overview
• AmRisc is a specialty windstorm MGA that has produced and underwritten
over $7 billion of direct written premium at a cumulative combined ratio of
approximately 55% since its founding in 2000
• These results include all the hurricane activity of 2004, 2005, 2008, and
2011
• AmRisc underwrites commercial property risks, including commercial
property construction, catastrophe property, commercial flood, residential
flood, tech property, and county habitational property risks
• The company was founded by Mr. Peed and others in 2000 and is based in
Houston, Texas

27 MARCH 2017 INVESTOR PRESENTATION “Moving Forward”
Transaction Benefits
•Diminished volatility of earnings
•Increased access to capital
•Rating agency benefits
Positive effects of increased size, scale, stability and market
presence
•Reduction in aggregate PML
•Expected annual cost savings
•Larger volume means greater market impact
Reinsurance optimization and expense reduction
•Minimal integration risk given ACIC’s infrastructure and limited overlap of resources
•Disciplined, risk-management oriented operating environments
Strategic, Operational & Cultural Fit
•Ability to increase participation in AmRisc E&S book over time
•Sale of admitted commercial policies through UPC agency network outside of Florida
•Opportunity to increase business with other parts of BB&T Insurance
Growth Opportunities
•Personal lines and Commercial lines
•Admitted and E&S
•Independent retail agents, aggregators, wholesale brokers and carrier partnerships
Diversification
1
2
3
4
5
Combined entity creates a leading specialty insurance underwriter
of catastrophe exposed property in the U.S.

28 MARCH 2017 INVESTOR PRESENTATION “Moving Forward”
Pro Forma Results with AmCo
With AmCo, UIHC would have achieved
its goal in 2016 and expects to in 2017
UIHC UIHC UIHC+AmCo UIHC+AmCo
as reported pro forma ¹ pro forma ¹ pro forma ²
2016 2016 2016 2017
Total Revenue $ 487.2 $ 487.2 $ 661.9 $ 742.5
NonCAT Loss & LAE $ 242.5 $ 242.5 $ 266.2 $ 269.4
CAT Loss & LAE $ 55.8 $ 45.0 $ 45.0 $ 80.0
Total Loss & LAE Incurred $ 298.3 $ 287.5 $ 311.2 $ 349.4
Operating Expenses $ 181.9 $ 181.9 $ 260.1 $ 271.5
Total Expenses $ 480.2 $ 469.4 $ 571.3 $ 620.9
Earnings before tax $ 7.0 $ 17.8 $ 90.6 $ 121.6
Income Tax Expense $ 1.3 $ 6.2 $ 31.7 $ 42.6
Net Income $ 5.7 $ 11.6 $ 58.9 $ 79.0
ROAE 2.4% 4.8% 12.3% 16.5%
¹ Actual CAT losses adjusted to just include 1 full Hurricane ($30m) and Aggregate retention ($15m)
² Pro forma CAT losses in UIHC’s proxy adjusted to just include 1 full Hurricane ($50m) and Aggregate retention ($30m)

29 MARCH 2017 INVESTOR PRESENTATION “Moving Forward”
AmCo Financial Summary
¹ Preliminary unaudited results
Consolidated GAAP ($000) 2016 2015
Revenue UIHC AmCo ¹ UIHC AmCo
Gross Earned $ 666,829 $ 281,041 $ 504,215 $ 313,298
Ceded Earned (209,898) (110,596) (168,257) (137,887)
Net Earned 456,931 170,445 335,958 175,411
Investment Income 10,679 4,333 9,212 2,867
Realized gain(loss) 547 14 827 4
Other revenue 18,960 — 11,572 —
Total Revenue 487,117 174,792 357,569 178,282
Expenses
Loss & LAE - NonCAT 242,511 23,739 154,543 33,370
Loss & LAE - CAT 55,842 26,000 28,565 —
Policy Acquisition 117,658 67,195 87,401 75,618
Operating & Admin 63,480 11,046 45,168 9,419
Interest Expense 723 — 326 —
Total Expense 480,214 127,980 316,003 118,407
Earnings before tax 6,903 46,812 41,566 59,875
Other Inc (Exp) 100 — 294 —
Income Tax 1,305 16,444 14,502 23,399
Net Income 5,698 30,368 27,358 36,476
Combined Ratio (CR) 104.9% 75.1% 94.0% 67.5%
Underlying CR 89.0% 60.1% 86.2% 67.5%
Net Income X-CAT $ 40,850 $ 47,235 $ 45,776 $ 36,476
UPC + AmCo = Stability of UIHC Earnings

MARCH 2017 INVESTOR PRESENTATION
CONCLUSION

31 MARCH 2017 INVESTOR PRESENTATION “Moving Forward”
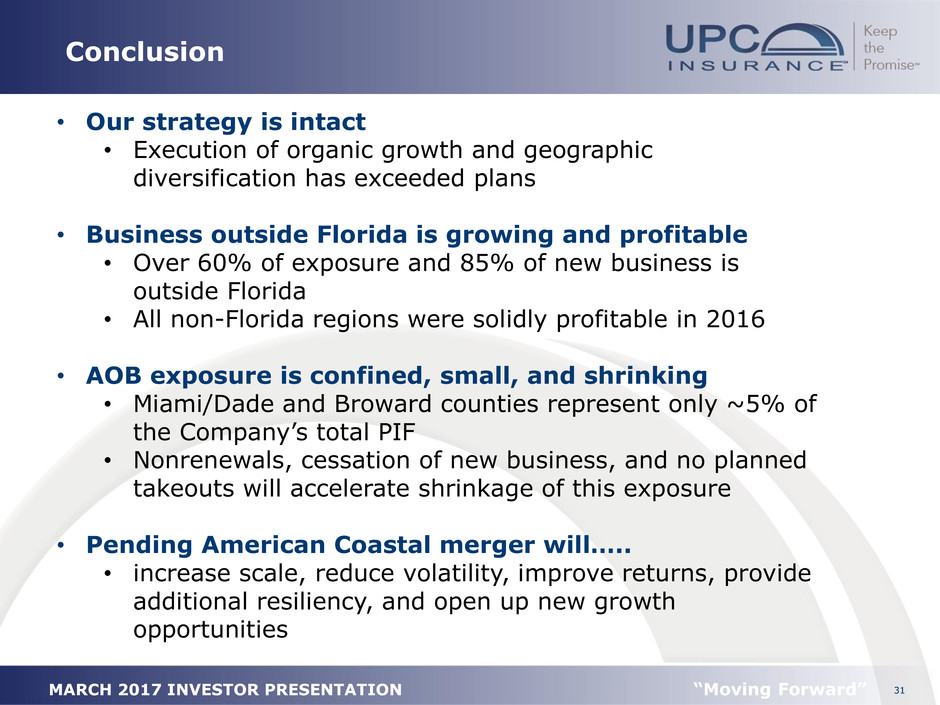
Conclusion
• Our strategy is intact
• Execution of organic growth and geographic
diversification has exceeded plans
• Business outside Florida is growing and profitable
• Over 60% of exposure and 85% of new business is
outside Florida
• All non-Florida regions were solidly profitable in 2016
• AOB exposure is confined, small, and shrinking
• Miami/Dade and Broward counties represent only ~5% of
the Company’s total PIF
• Nonrenewals, cessation of new business, and no planned
takeouts will accelerate shrinkage of this exposure
• Pending American Coastal merger will…..
• increase scale, reduce volatility, improve returns, provide
additional resiliency, and open up new growth
opportunities

32 MARCH 2017 INVESTOR PRESENTATION “Moving Forward”
Safe Harbor – At a Glance
Statements in this presentation that are not historical facts are forward-looking
statements that are subject to certain risks and uncertainties that could cause
actual events and results to differ materially from those discussed herein.
Without limiting the generality of the foregoing, words such as “may,” “will,”
“expect,” “believe,” “anticipate,” “intend,” “could,” “would,” “estimate,” “or
“continue” or the other negative variations thereof or comparable terminology
are intended to identify forward-looking statements. The forward-looking
statements in this presentation include statements regarding the Company’s or
management’s plans, objectives, goals, strategies, expectations, estimates,
beliefs or projections, or any other statements concerning future performance
or events. The risks and uncertainties that could cause our actual results to
differ from those expressed or implied herein include, without limitation, the
success of the Company’s marketing initiatives, inflation and other changes in
economic conditions (including changes in interest rates and financial
markets); the impact of new regulations adopted which affect the property and
casualty insurance market; the costs of reinsurance and the collectability of
reinsurance, assessments charged by various governmental agencies; pricing
competition and other initiatives by competitors; or ability to obtain regulatory
approval for requested rate changes, and the timing thereof; legislative and
regulatory developments; the outcome of litigation pending against us,
including the terms of any settlements; risks related to the nature of our
business; dependence on investment income and the composition of our
investment portfolio; the adequacy of our liability for loss and loss adjustment
expense; insurance agents; claims experience; ratings by industry services;
catastrophe losses; reliance on key personnel; weather conditions (including
the severity and frequency of storms, hurricanes, tornadoes and hail); changes
in loss trends; acts of war and terrorist activities; court decisions and trends in
litigation, and health care; and other matters described from time to time by
us in our filings with the SEC, including, but not limited to, the Company’s
Annual Report on Form 10-K for the year ended December 31, 2015. In
addition, investors should be aware that generally accepted accounting
principles prescribe when a company may reserve for particular risks, including
litigation exposures. Accordingly, results for a given reporting period could be
significantly affected if and when a reserve is established for a major
contingency. Reported results may therefore, appear to be volatile in certain
accounting periods. The Company undertakes no obligations to update, change
or revise any forward-looking statement, whether as a result of new
information, additional or subsequent developments or otherwise.
CORPORATE OVERVIEW
Exchange:Ticker NASDAQ : UIHC
Industry
Property/Casualty
Insurance
Business
Personal & Commercial
Property Insurance in
AL, CT, DE, FL, GA, HI,
LA, MA, MD, MS, NC,
NH, NJ, NY, RI, SC, TX
& VA
HQ St. Petersburg, FL
Employees 160
Policies in Force
451,771
(at 12/31/16)
Total Assets
$994M
(at 12/31/2016)
Dividend
$0.06
(at 2/22/2017)

33 MARCH 2017 INVESTOR PRESENTATION “Moving Forward”
Definitions of Non-GAAP Measures
We believe that investors’ understanding of UPC Insurance’s performance is enhanced by our
disclosure of the following non-GAAP measures. Our methods for calculating these measures may
differ from those used by other companies and therefore comparability may be limited.
Combined ratio excluding the effects of current year catastrophe losses, prior year
development from lines in run-off and prior year development (underlying combined ratio)
is a non-GAAP ratio, which is computed as the difference between four GAAP operating ratios: the
combined ratio, the effect of current year catastrophe losses on the combined ratio, and prior year
development on the combined ratio. We believe that this ratio is useful to investors and it is used by
management to reveal the trends in our business that may be obscured by current year catastrophe
losses, losses from lines in run-off and prior year development. Current year catastrophe losses cause
our loss trends to vary significantly between periods as a result of their incidence of occurrence and
magnitude, and can have a significant impact on the combined ratio. Prior year development from
lines in run-off is caused by unexpected development from our commercial auto product that is no
longer offered by the Company. Prior year development is unexpected loss development on historical
reserves. We believe it is useful for investors to evaluate these components separately and in the
aggregate when reviewing our performance. The most direct comparable GAAP measure is the
combined ratio. The underlying combined ratio should not be considered as a substitute for the
combined ratio and does not reflect the overall profitability of our business.

