Attached files
| file | filename |
|---|---|
| EX-99.1 - EX-99.1 - Manitex International, Inc. | d353199dex991.htm |
| 8-K - FORM 8-K - Manitex International, Inc. | d353199d8k.htm |
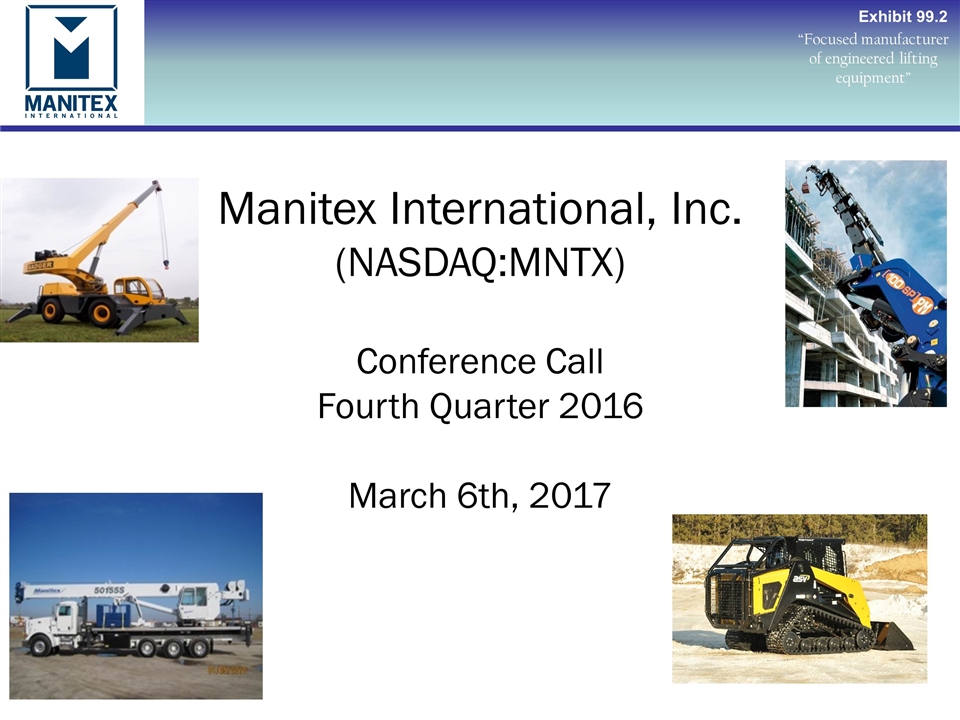
“Focused manufacturer of engineered lifting equipment” Manitex International, Inc. (NASDAQ:MNTX) Conference Call Fourth Quarter 2016 March 6th, 2017 Exhibit 99.2
Forward Looking Statements & Non GAAP Measures “Focused manufacturer of engineered lifting equipment” Safe Harbor Statement under the U.S. Private Securities Litigation Reform Act of 1995: This presentation contains statements that are forward-looking in nature which express the beliefs and expectations of management including statements regarding the Company’s expected results of operations or liquidity; statements concerning projections, predictions, expectations, estimates or forecasts as to our business, financial and operational results and future economic performance; and statements of management’s goals and objectives and other similar expressions concerning matters that are not historical facts. In some cases, you can identify forward-looking statements by terminology such as “anticipate,” “estimate,” “plan,” “project,” “continuing,” “ongoing,” “expect,” “we believe,” “we intend,” “may,” “will,” “should,” “could,” and similar expressions. Such statements are based on current plans, estimates and expectations and involve a number of known and unknown risks, uncertainties and other factors that could cause the Company's future results, performance or achievements to differ significantly from the results, performance or achievements expressed or implied by such forward-looking statements. These factors and additional information are discussed in the Company's filings with the Securities and Exchange Commission and statements in this presentation should be evaluated in light of these important factors. Although we believe that these statements are based upon reasonable assumptions, we cannot guarantee future results. Forward-looking statements speak only as of the date on which they are made, and the Company undertakes no obligation to update publicly or revise any forward-looking statement, whether as a result of new information, future developments or otherwise. Non-GAAP Measures: Manitex International from time to time refers to various non-GAAP (generally accepted accounting principles) financial measures in this presentation. Manitex believes that this information is useful to understanding its operating results without the impact of special items. See Manitex’s Fourth Quarter 2016 Earnings Release on the Investor Relations section of our website www.manitexinternational.com for a description and/or reconciliation of these measures.
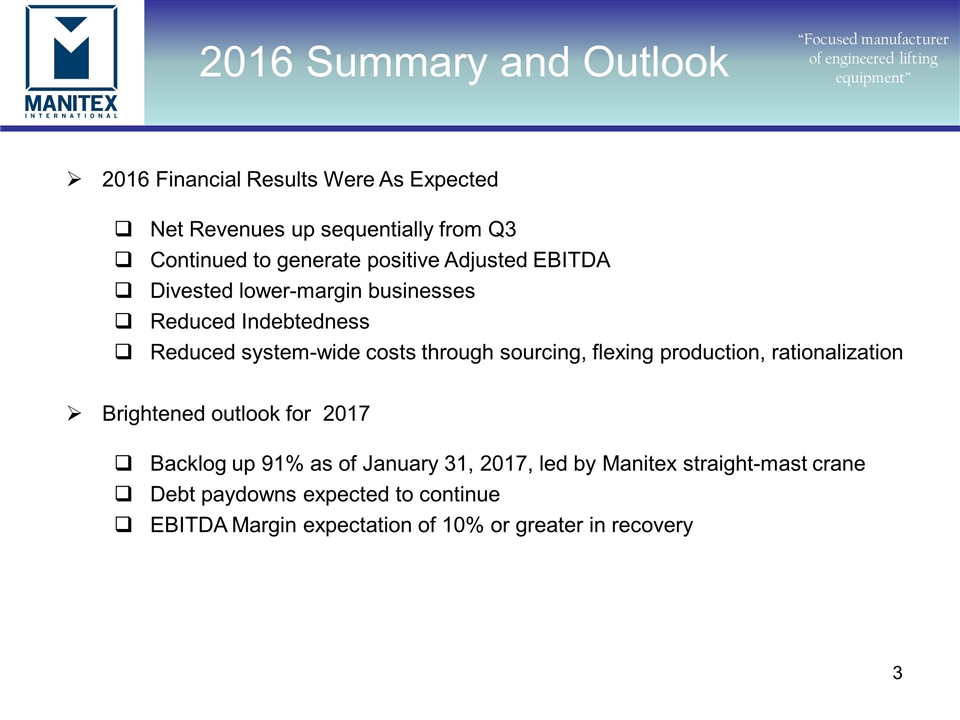
2016 Summary and Outlook “Focused manufacturer of engineered lifting equipment” 2016 Financial Results Were As Expected Net Revenues up sequentially from Q3 Continued to generate positive Adjusted EBITDA Divested lower-margin businesses Reduced Indebtedness Reduced system-wide costs through sourcing, flexing production, rationalization Brightened outlook for 2017 Backlog up 91% as of January 31, 2017, led by Manitex straight-mast crane Debt paydowns expected to continue EBITDA Margin expectation of 10% or greater in recovery
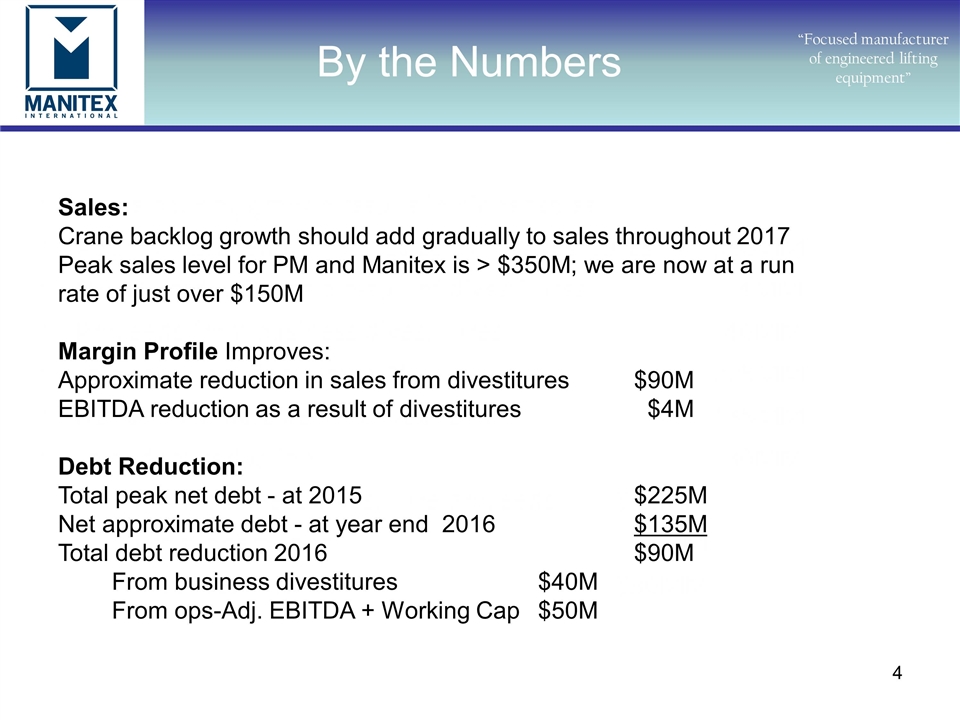
“Focused manufacturer of engineered lifting equipment” By the Numbers Sales: Crane backlog growth should add gradually to sales throughout 2017 Peak sales level for PM and Manitex is > $350M; we are now at a run rate of just over $150M Margin Profile Improves: Approximate reduction in sales from divestitures $90M EBITDA reduction as a result of divestitures $4M Debt Reduction: Total peak net debt - at 2015$225M Net approximate debt - at year end2016 $135M Total debt reduction 2016 $90M From business divestitures $40M From ops-Adj. EBITDA + Working Cap $50M
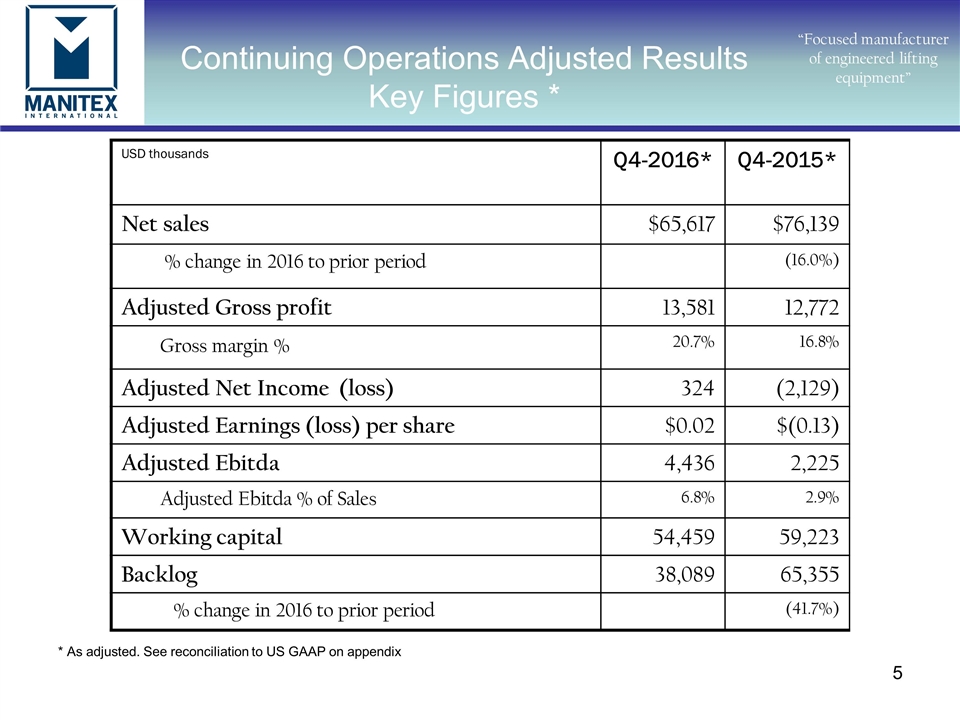
Continuing Operations Adjusted Results Key Figures * “Focused manufacturer of engineered lifting equipment” USD thousands Q4-2016* Q4-2015* Net sales $65,617 $76,139 % change in 2016 to prior period (16.0%) Adjusted Gross profit 13,581 12,772 Gross margin % 20.7% 16.8% Adjusted Net Income (loss) 324 (2,129) Adjusted Earnings (loss) per share $0.02 $(0.13) Adjusted Ebitda 4,436 2,225 Adjusted Ebitda % of Sales 6.8% 2.9% Working capital 54,459 59,223 Backlog 38,089 65,355 % change in 2016 to prior period (41.7%) * As adjusted. See reconciliation to US GAAP on appendix
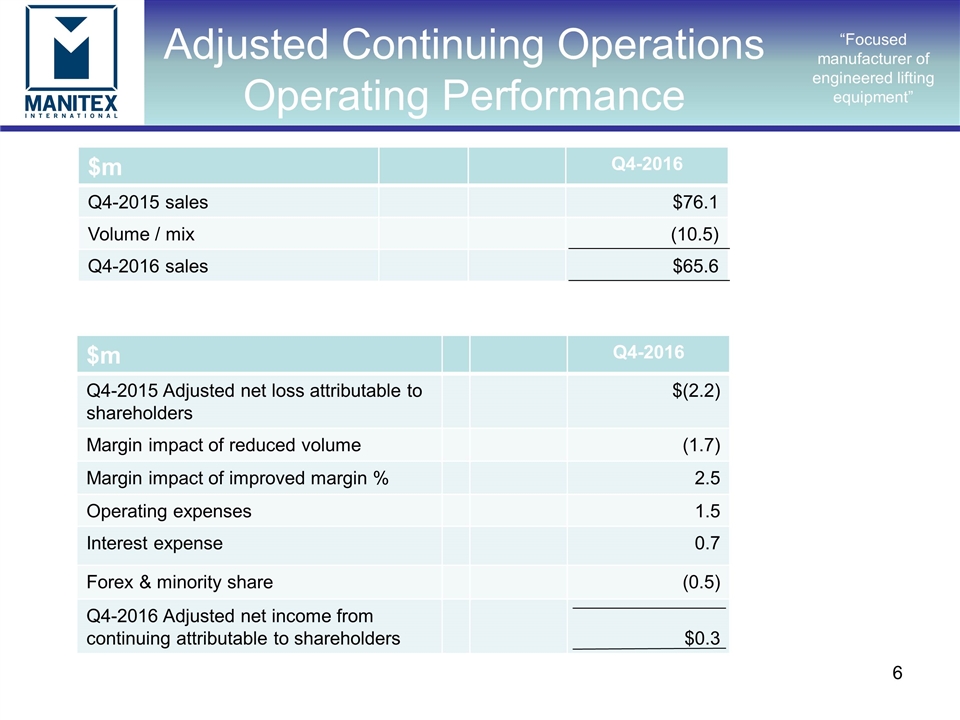
“Focused manufacturer of engineered lifting equipment” Adjusted Continuing Operations Operating Performance $m Q4-2016 Q4-2015 sales $76.1 Volume / mix (10.5) Q4-2016 sales $65.6 $m Q4-2016 Q4-2015 Adjusted net loss attributable to shareholders $(2.2) Margin impact of reduced volume (1.7) Margin impact of improved margin % 2.5 Operating expenses 1.5 Interest expense 0.7 Forex & minority share (0.5) Q4-2016 Adjusted net income from continuing attributable to shareholders $0.3
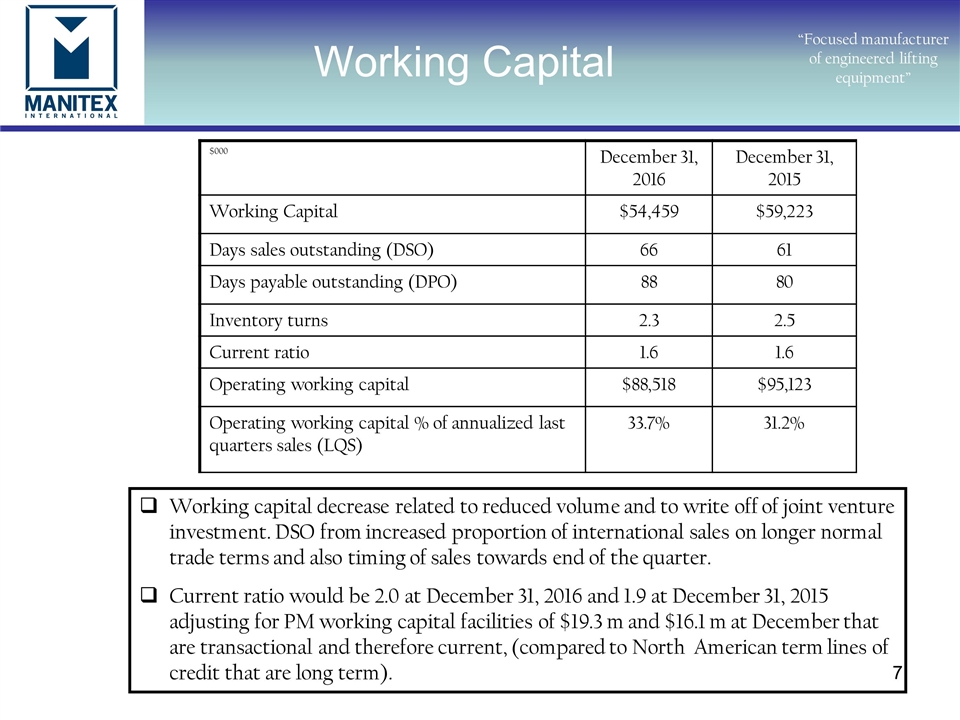
Working Capital “Focused manufacturer of engineered lifting equipment” $000 December 31, 2016 December 31, 2015 Working Capital $54,459 $59,223 Days sales outstanding (DSO) 66 61 Days payable outstanding (DPO) 88 80 Inventory turns 2.3 2.5 Current ratio 1.6 1.6 Operating working capital $88,518 $95,123 Operating working capital % of annualized last quarters sales (LQS) 33.7% 31.2% Working capital decrease related to reduced volume and to write off of joint venture investment. DSO from increased proportion of international sales on longer normal trade terms and also timing of sales towards end of the quarter. Current ratio would be 2.0 at December 31, 2016 and 1.9 at December 31, 2015 adjusting for PM working capital facilities of $19.3 m and $16.1 m at December that are transactional and therefore current, (compared to North American term lines of credit that are long term).
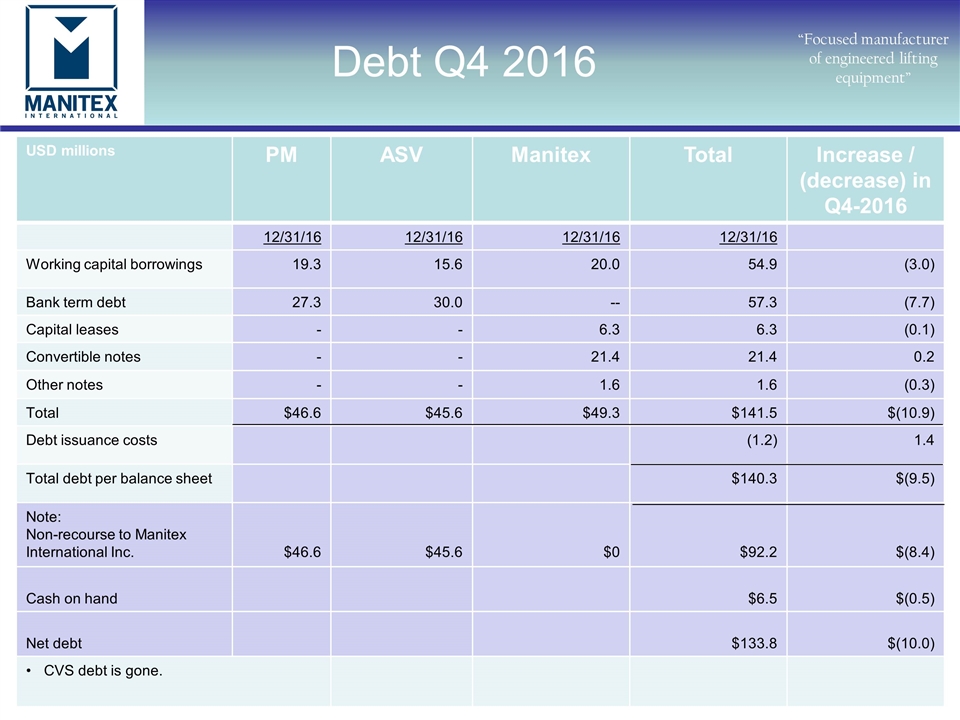
“Focused manufacturer of engineered lifting equipment” Debt Q4 2016 USD millions PM ASV Manitex Total Increase / (decrease) in Q4-2016 12/31/16 12/31/16 12/31/16 12/31/16 Working capital borrowings 19.3 15.6 20.0 54.9 (3.0) Bank term debt 27.3 30.0 -- 57.3 (7.7) Capital leases - - 6.3 6.3 (0.1) Convertible notes - - 21.4 21.4 0.2 Other notes - - 1.6 1.6 (0.3) Total $46.6 $45.6 $49.3 $141.5 $(10.9) Debt issuance costs (1.2) 1.4 Total debt per balance sheet $140.3 $(9.5) Note: Non-recourse to Manitex International Inc. $46.6 $45.6 $0 $92.2 $(8.4) Cash on hand $6.5 $(0.5) Net debt $133.8 $(10.0) CVS debt is gone.
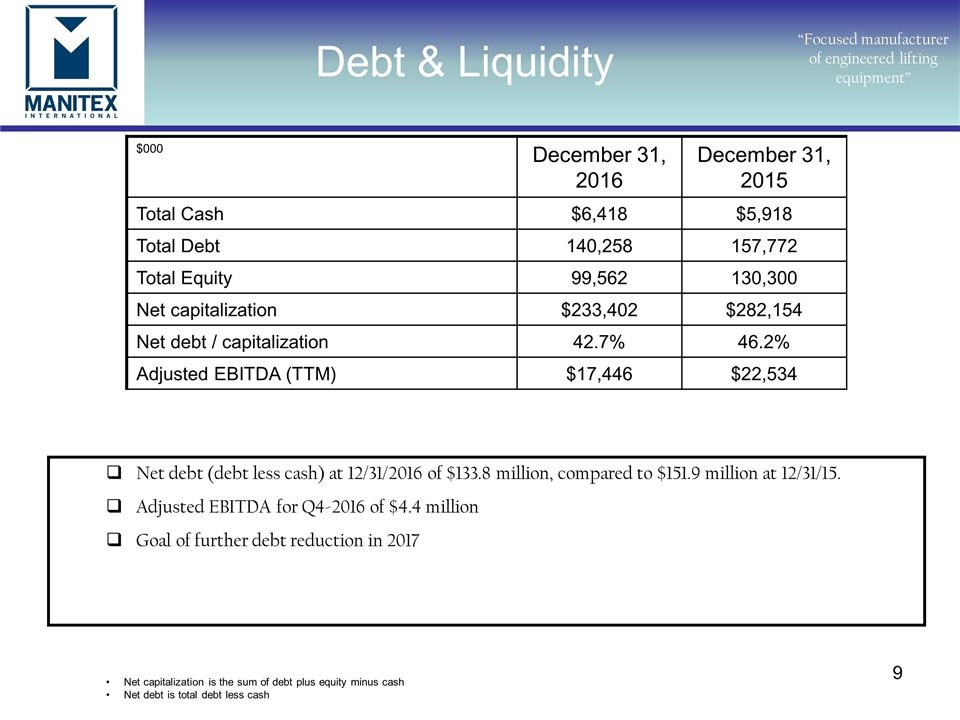
“Focused manufacturer of engineered lifting equipment” $000 December 31, 2016 December 31, 2015 Total Cash $6,418 $5,918 Total Debt 140,258 157,772 Total Equity 99,562 130,300 Net capitalization $233,402 $282,154 Net debt / capitalization 42.7% 46.2% Adjusted EBITDA (TTM) $17,446 $22,534 Net debt (debt less cash) at 12/31/2016 of $133.8 million, compared to $151.9 million at 12/31/15. Adjusted EBITDA for Q4-2016 of $4.4 million Goal of further debt reduction in 2017 Debt & Liquidity Net capitalization is the sum of debt plus equity minus cash Net debt is total debt less cash
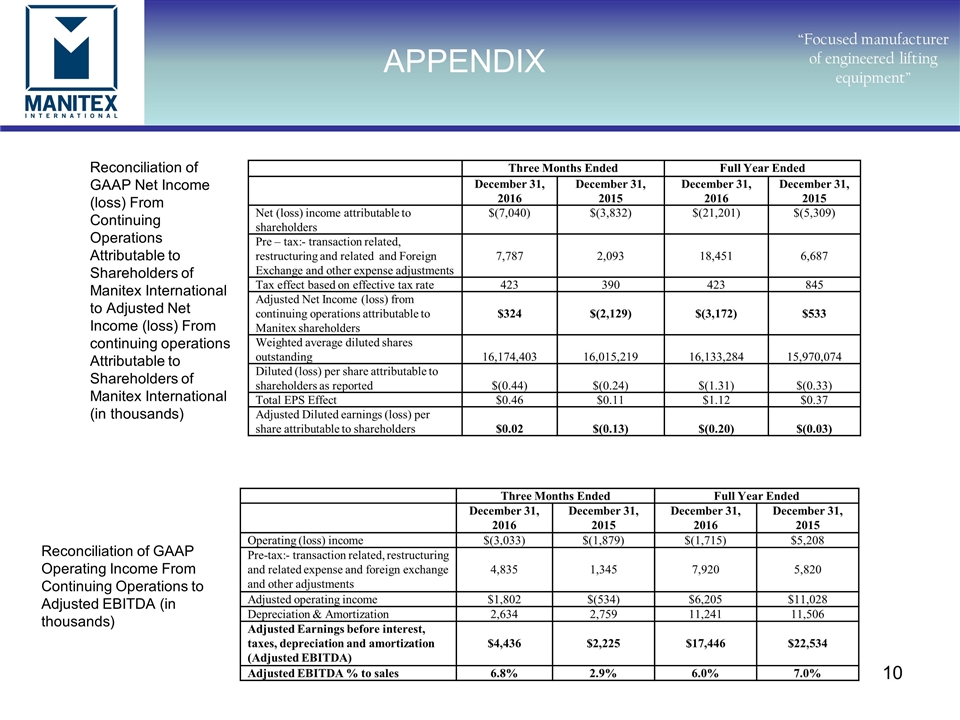
APPENDIX “Focused manufacturer of engineered lifting equipment” Reconciliation of GAAP Net Income (loss) From Continuing Operations Attributable to Shareholders of Manitex International to Adjusted Net Income (loss) From continuing operations Attributable to Shareholders of Manitex International (in thousands) Reconciliation of GAAP Operating Income From Continuing Operations to Adjusted EBITDA (in thousands) Three Months Ended Full Year Ended December 31, 2016 December 31, 2015 December 31, 2016 December 31, 2015 Net (loss) income attributable to shareholders $(7,040) $(3,832) $(21,201) $(5,309) Pre – tax:- transaction related, restructuring and related and Foreign Exchange and other expense adjustments 7,787 2,093 18,451 6,687 Tax effect based on effective tax rate 423 390 423 845 Adjusted Net Income (loss) from continuing operations attributable to Manitex shareholders $324 $(2,129) $(3,172) $533 Weighted average diluted shares outstanding 16,174,403 16,015,219 16,133,284 15,970,074 Diluted (loss) per share attributable to shareholders as reported $(0.44) $(0.24) $(1.31) $(0.33) Total EPS Effect $0.46 $0.11 $1.12 $0.37 Adjusted Diluted earnings (loss) per share attributable to shareholders $0.02 $(0.13) $(0.20) $(0.03) Three Months Ended Full Year Ended December 31, 2016 December 31, 2015 December 31, 2016 December 31, 2015 Operating (loss) income $(3,033) $(1,879) $(1,715) $5,208 Pre-tax:- transaction related, restructuring and related expense and foreign exchange and other adjustments 4,835 1,345 7,920 5,820 Adjusted operating income $1,802 $(534) $6,205 $11,028 Depreciation & Amortization 2,634 2,759 11,241 11,506 Adjusted Earnings before interest, taxes, depreciation and amortization (Adjusted EBITDA) $4,436 $2,225 $17,446 $22,534 Adjusted EBITDA % to sales 6.8% 2.9% 6.0% 7.0%
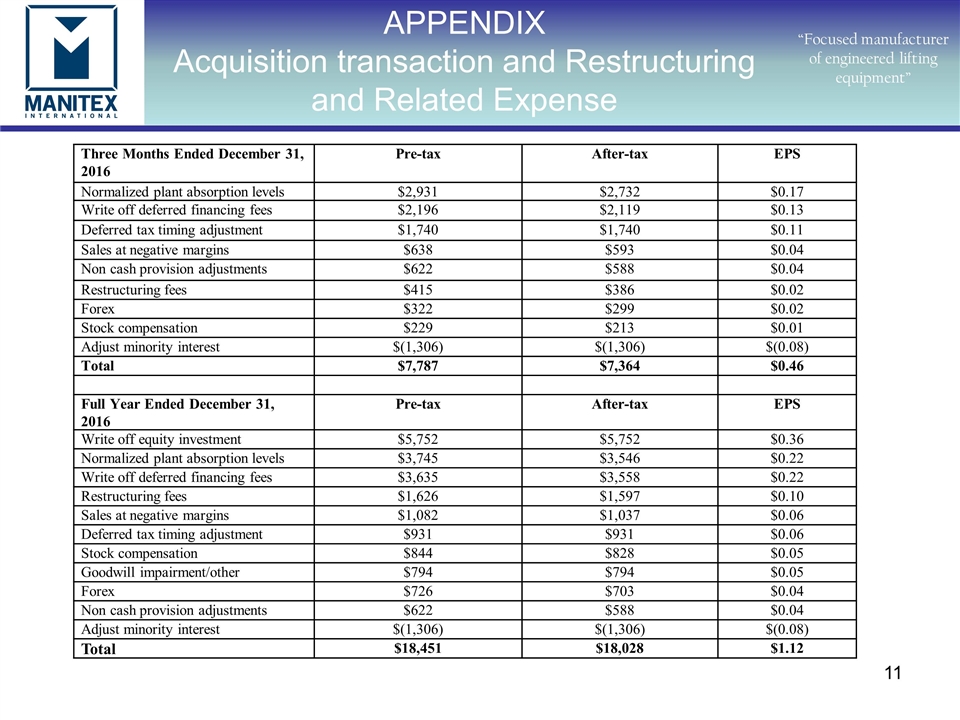
APPENDIX Acquisition transaction and Restructuring and Related Expense “Focused manufacturer of engineered lifting equipment” Three Months Ended December 31, 2016 Pre-tax After-tax EPS Normalized plant absorption levels $2,931 $2,732 $0.17 Write off deferred financing fees $2,196 $2,119 $0.13 Deferred tax timing adjustment $1,740 $1,740 $0.11 Sales at negative margins $638 $593 $0.04 Non cash provision adjustments $622 $588 $0.04 Restructuring fees $415 $386 $0.02 Forex $322 $299 $0.02 Stock compensation $229 $213 $0.01 Adjust minority interest $(1,306) $(1,306) $(0.08) Total $7,787 $7,364 $0.46 Full Year Ended December 31, 2016 Pre-tax After-tax EPS Write off equity investment $5,752 $5,752 $0.36 Normalized plant absorption levels $3,745 $3,546 $0.22 Write off deferred financing fees $3,635 $3,558 $0.22 Restructuring fees $1,626 $1,597 $0.10 Sales at negative margins $1,082 $1,037 $0.06 Deferred tax timing adjustment $931 $931 $0.06 Stock compensation $844 $828 $0.05 Goodwill impairment/other $794 $794 $0.05 Forex $726 $703 $0.04 Non cash provision adjustments $622 $588 $0.04 Adjust minority interest $(1,306) $(1,306) $(0.08) Total $18,451 $18,028 $1.12
