Attached files
| file | filename |
|---|---|
| 8-K - 8-K - XpresSpa Group, Inc. | v461256_8k.htm |
Exhibit 99.1
INVESTOR PRESENTATION 2017 | FIRST QUARTER

DISCLAIMERS Safe Harbor Statement This presentation includes forward - looking statements, which may be identified by words such as "believes," "expects," "anticipates," "estimates," "projects," "intends," "should," "seeks," "future," "continue," or the negative of such terms, or other comparable terminology. Forward - looking statements are statements that are not historical f acts. Such forward - looking statements are subject to risks and uncertainties, which could cause actual results to differ materially from the forward - looking statements contained herein. Statements in this presentation regarding the merger between FORM and XpresSpa; the potential value created by the merger for FORM's stockholders and XpresSpa’s equity holders; the potential of FORM’s business after the me rger; the ability to raise capital to fund FORM’s operations and business plan; market acceptance of FORM’s products; the collective ability to protect intellectual property rights; competition from other providers and products; FORM ’s management and board of directors after the merger; and any other statements about FORM's management team’s future expectations, beliefs, goals, plans, revenues or prosp ect s constitute forward - looking statements within the meaning of the Private Securities Litigation Reform Act of 1995. There are a number of important factors that could cause actual results or events t o d iffer materially from those indicated by such forward - looking statements, including, but not limited to: the inability to realize the potential value created by the merger for FORM’s stockholders; the potential lack of market acceptance of FORM's products; FORM’s inability to monetize and recoup FORM’s investment with respect to assets and other businesses that that we have acquired or will acquire in the future ; g eneral economic conditions and level of information technology and consumer electronics spending; unexpected trends in the mobile phone and telecom computing industries; the potential loss of one or mo re of FORM’s significant Original Equipment Manufacturer (“OEM”) suppliers; market acceptance, quality, pricing, availability and useful life of FORM’s products and services, as well as the mix of FOR M’s products and services sold; potential competition from other providers and products; FORM’s inability to license and monetize FORM’s patents, including the outcome of litigation; FORM’s inability t o d evelop and introduce new products and/or develop new intellectual property; FORM’s inability to protect FORM’s intellectual property rights; new legislation, regulations or court rulings related to e nfo rcing patents, that could harm FORM’s business and operating results; FORM’s inability to retain key members of its management team; and other risks and uncertainties and other factors discussed from ti me to time in our filings with the Securities and Exchange Commission ("SEC"), including FORM’s Annual Report on Form 10 - K for the year ended December 31, 2015 filed with the SEC on March 10, 2016 . FORM expressly disclaims any obligation to publicly update any forward - looking statements contained herein, whether as a result of new information, future events or otherwise, except as required by law . Trademark Usage FORM Holdings, the FORM Holdings logo, and other FORM Holdings trademarks, service marks, and designs are registered or unreg ist ered trademarks of FORM Holdings Corp. and its subsidiaries in the United States and in foreign countries. This presentation contains trade names, trademarks and service marks of other compani es. All such trade names, trademarks and service marks of other companies are property of their respective owners. FORM Holdings Corp. does not intend its use or display of other parties’ trade names, tr ade marks and service marks to imply a relationship with, or endorsement or sponsorship of or by, such other parties . Use of Non - GAAP Financial Measures XpresSpa uses GAAP and non - GAAP measurements to assess the trends in its business. Items XpresSpa reviews on an ongoing basis ar e revenues, Comp Store Sales (which it defines as sales from stores opened longer than a year compared to the same period sales of those stores a year ago), store contribution margins, and numb er of transactions (which is a way to measure traffic in spas). In addition, XpresSpa monitors stores’ performance compared to its model store metrics to ensure that it is consistently opening spas that ha ve the same or similar return dynamics as historical stores. XpresSpa believes the trends exhibited by its business are strong and substantiate its continued investment in additional locations and infrast ruc ture. Please note that FORM's consolidated Statement of Operations will include XpresSpa results from December 23, 2016 onwards. During th e f ull year of 2016, XpresSpa generated $43.4 million of revenue. Group Mobile uses bookings and customer commitments as a non GAAP measure to assess the health of the business. They represent orde rs placed and orders committed from the customers, which will be fulfilled in the future. Group Mobile expects to recognize bookings and commitments from customers as revenues throughout 201 7. 1

▪ We seek to invest in and acquire companies that would benefit from: ≻ Additional capital ≻ Rebranding ≻ Restructuring ≻ Implementation of best practices ≻ Talent recruiting ≻ Marketing, PR & visibility CORPORATE SNAPSHOT FORM Holdings is a diversified holding company with a focus on health and wellness as well as technology 2 SYMBOL FH EXCHANGE NASDAQ MARKET CAPITALIZATION $42.6 million 1 AVERAGE TRADING VOLUME 128,563 (3 month) 2 52 WEEK RANGE $1.55 – 4.05 2 CASH $21.7 million 3 CORPORATE HEADQUARTERS New York, NY AUDITOR CohnReznick LLP 1 based on 19.2 million shares of common stock outstanding as of March 3, 2017 2 as of March 3, 2017 3 as of September 30 , 2016
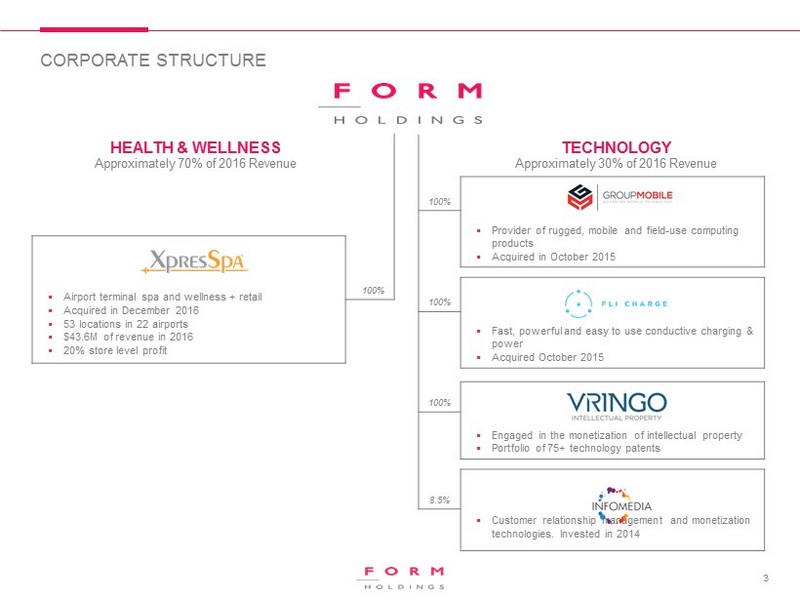
100% ▪ Provider of rugged, mobile and field - use computing products ▪ Acquired in October 2015 100% ▪ Fast, powerful and easy to use conductive charging & power ▪ Acquired October 2015 100% ▪ Engaged in the monetization of intellectual property ▪ Portfolio of 75+ technology patents 8.5% ▪ Customer relationship management and monetization technologies. Invested in 2014 ▪ Airport terminal spa and wellness + retail ▪ Acquired in December 2016 ▪ 53 locations in 22 airports ▪ $43.6M of revenue in 2016 ▪ 20% store level profit 100% CORPORATE STRUCTURE HEALTH & WELLNESS Approximately 70% of 2016 Revenue TECHNOLOGY Approximately 30% of 2016 Revenue 3
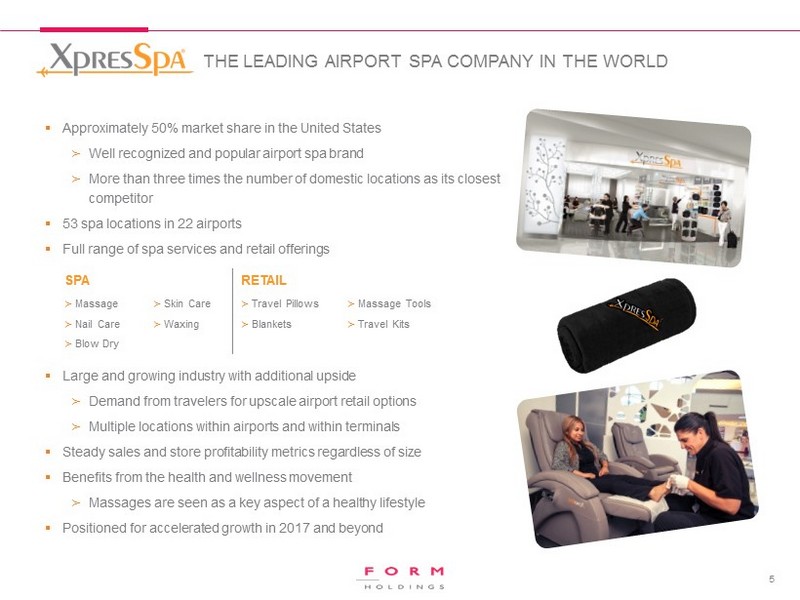
▪ Approximately 50% market share in the United S tates ≻ Well recognized and popular airport spa brand ≻ More than three times the number of domestic locations as its closest competitor ▪ 53 spa locations in 22 airports ▪ Full range of spa services and retail offerings ▪ Large and growing industry with additional upside ≻ Demand from travelers for upscale airport retail options ≻ Multiple locations within airports and within terminals ▪ Steady sales and store profitability metrics regardless of size ▪ Benefits from the health and wellness movement ≻ Massages are seen as a key aspect of a healthy lifestyle ▪ Positioned for accelerated growth in 2017 and beyond 5 THE LEADING AIRPORT SPA COMPANY IN THE WORLD SPA RETAIL ≻ Massage ≻ Nail Care ≻ Blow Dry ≻ Skin Care ≻ Waxing ≻ Travel Pillows ≻ Blankets ≻ Massage Tools ≻ Travel Kits
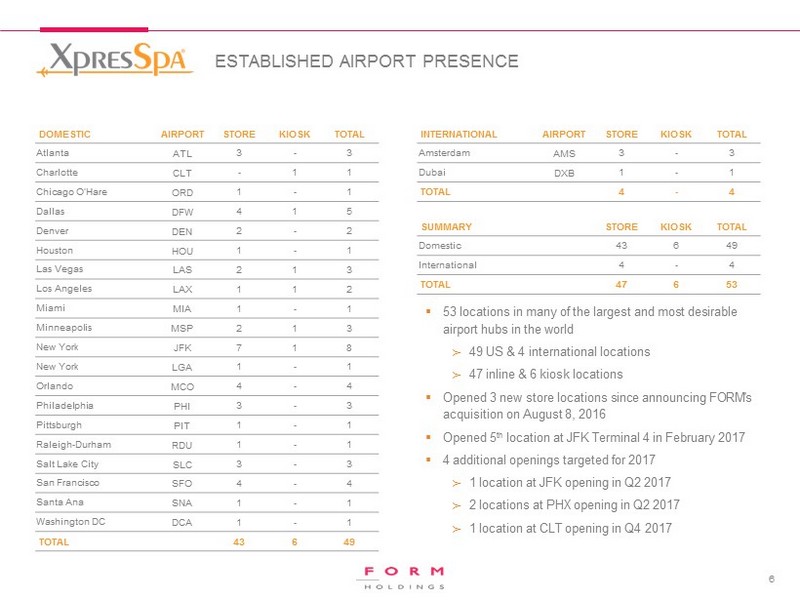
▪ 53 locations in many of the largest and most desirable airport hubs in the world ≻ 49 US & 4 international locations ≻ 47 inline & 6 kiosk locations ▪ Opened 3 new store locations since announcing FORM's acquisition on August 8, 2016 ▪ O pened 5 th location at JFK Terminal 4 in February 2017 ▪ 4 additional openings targeted for 2017 ≻ 1 location at JFK opening in Q2 2017 ≻ 2 locations at PHX opening in Q2 2017 ≻ 1 location at CLT opening in Q4 2017 6 ESTABLISHED AIRPORT PRESENCE DOMESTIC AIRPORT STORE KIOSK TOTAL Atlanta ATL 3 - 3 Charlotte CLT - 1 1 Chicago O’Hare ORD 1 - 1 Dallas DFW 4 1 5 Denver DEN 2 - 2 Houston HOU 1 - 1 Las Vegas LAS 2 1 3 Los Angeles LAX 1 1 2 Miami MIA 1 - 1 Minneapolis MSP 2 1 3 New York JFK 7 1 8 New York LGA 1 - 1 Orlando MCO 4 - 4 Philadelphia PHI 3 - 3 Pittsburgh PIT 1 - 1 Raleigh - Durham RDU 1 - 1 Salt Lake City SLC 3 - 3 San Francisco SFO 4 - 4 Santa Ana SNA 1 - 1 Washington DC DCA 1 - 1 TOTAL 43 6 49 INTERNATIONAL AIRPORT STORE KIOSK TOTAL Amsterdam AMS 3 - 3 Dubai DXB 1 - 1 TOTAL 4 - 4 SUMMARY STORE KIOSK TOTAL Domestic 43 6 49 International 4 - 4 TOTAL 47 6 53
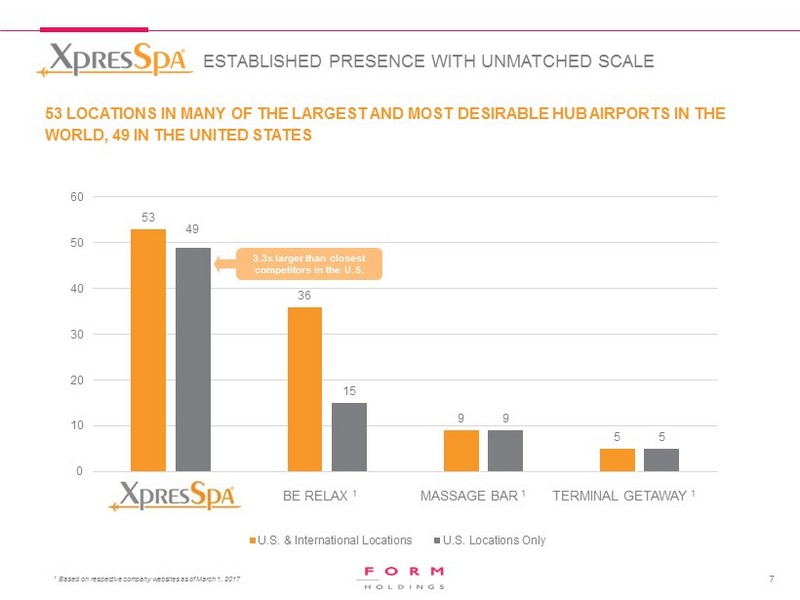
53 36 9 5 49 15 9 5 0 10 20 30 40 50 60 U.S. & International Locations U.S. Locations Only 53 LOCATIONS IN MANY OF THE LARGEST AND MOST DESIRABLE HUB AIRPORTS IN THE WORLD, 49 IN THE UNITED STATES 7 ESTABLISHED PRESENCE WITH UNMATCHED SCALE 3.3x larger than closest competitors in the U.S. BE RELAX 1 MASSAGE BAR 1 TERMINAL GETAWAY 1 1 Based on respective company websites as of March 1, 2017
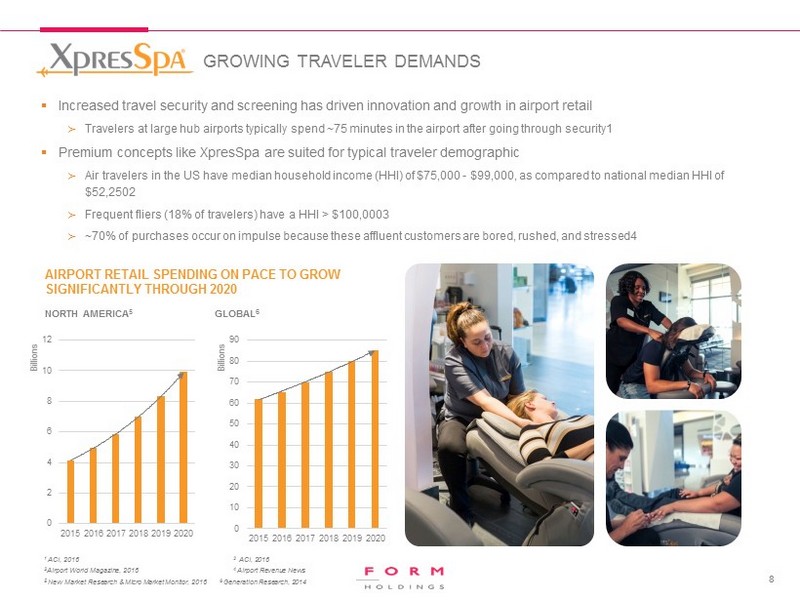
▪ Increased travel security and screening has driven innovation and growth in airport retail ≻ Travelers at large hub airports typically spend ~75 minutes in the airport after going through security1 ▪ Premium concepts like XpresSpa are suited for typical traveler demographic ≻ Air travelers in the US have median household income (HHI) of $75,000 - $99,000, as compared to national median HHI of $52,2502 ≻ Frequent fliers (18% of travelers) have a HHI > $100,0003 ≻ ~70% of purchases occur on impulse because these affluent customers are bored, rushed, and stressed4 8 GROWING TRAVELER DEMANDS 1 ACI, 2016 2 ACI, 2016 3 Airport World Magazine, 2016 4 Airport Revenue News 5 New Market Research & Micro Market Monitor, 2016 6 Generation Research, 2014 AIRPORT RETAIL SPENDING ON PACE TO GROW SIGNIFICANTLY THROUGH 2020 0 2 4 6 8 10 12 2015 2016 2017 2018 2019 2020 Billions 0 10 20 30 40 50 60 70 80 90 2015 2016 2017 2018 2019 2020 Billions NORTH AMERICA 5 GLOBAL 6
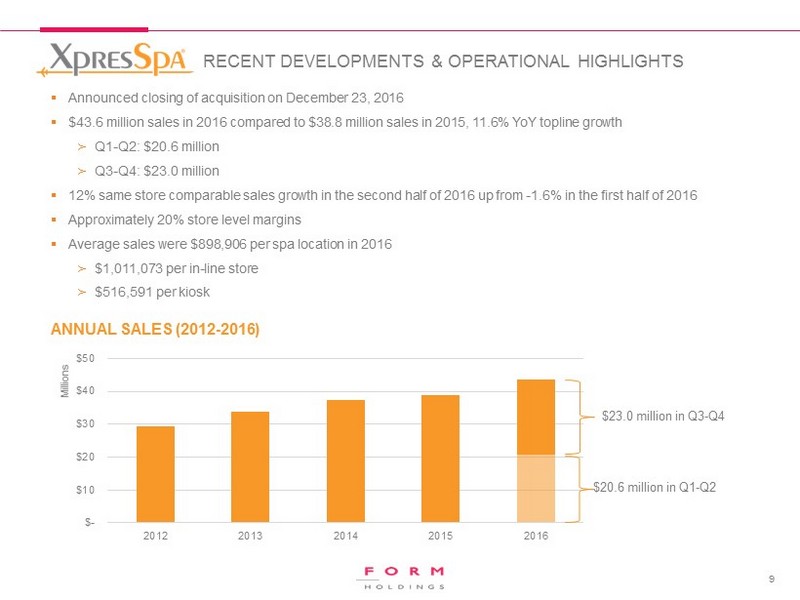
▪ Announced closing of acquisition on December 23, 2016 ▪ $43.6 million sales in 2016 compared to $38.8 million sales in 2015, 11.6% YoY topline growth ≻ Q1 - Q2: $ 20.6 million ≻ Q3 - Q4: $ 23.0 million ▪ 12 % same store comparable sales growth in the second half of 2016 up from - 1.6% in the first half of 2016 ▪ Approximately 20% store level margins ▪ Average sales were $ 898,906 per spa location in 2016 ≻ $1,011,073 per in - line store ≻ $ 516,591 per kiosk 9 RECENT DEVELOPMENTS & OPERATIONAL HIGHLIGHTS $- $10 $20 $30 $40 $50 2012 2013 2014 2015 2016 Millions $23.0 million in Q3 - Q4 $20.6 million in Q1 - Q2 ANNUAL SALES (2012 - 2016 )
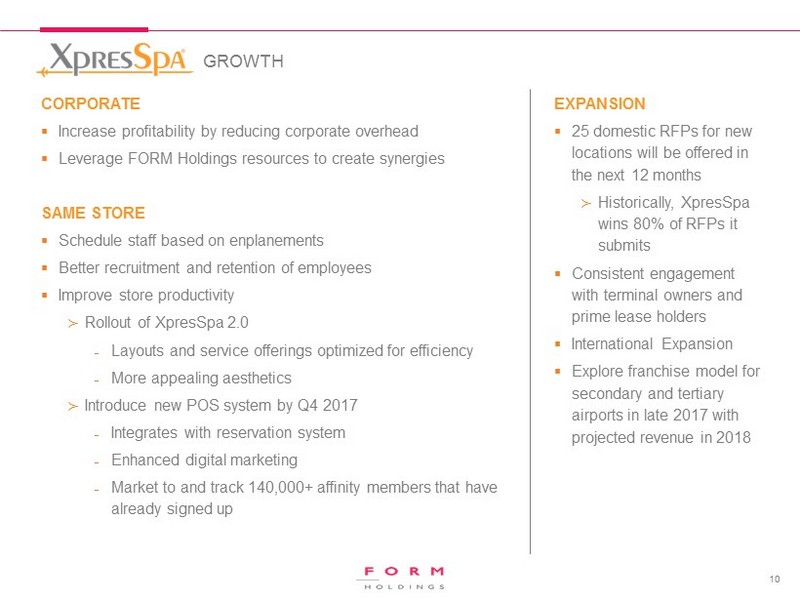
CORPORATE ▪ Increase profitability by reducing corporate overhead ▪ Leverage FORM Holdings resources to create synergies SAME STORE ▪ Schedule staff based on enplanements ▪ Better recruitment and retention of employees ▪ Improve store productivity ≻ Rollout of XpresSpa 2.0 - Layouts and service offerings optimized for efficiency - More appealing aesthetics ≻ Introduce new POS system by Q4 2017 - Integrates with reservation system - Enhanced digital marketing - Market to and track 140,000+ affinity members that have already signed up 10 GROWTH EXPANSION ▪ 25 domestic RFPs for new locations will be offered in the next 12 months ≻ Historically, XpresSpa wins 80% of RFPs it submits ▪ Consistent engagement with terminal owners and prime lease holders ▪ International Expansion ▪ Explore franchise model for secondary and tertiary airports in late 2017 with projected revenue in 2018
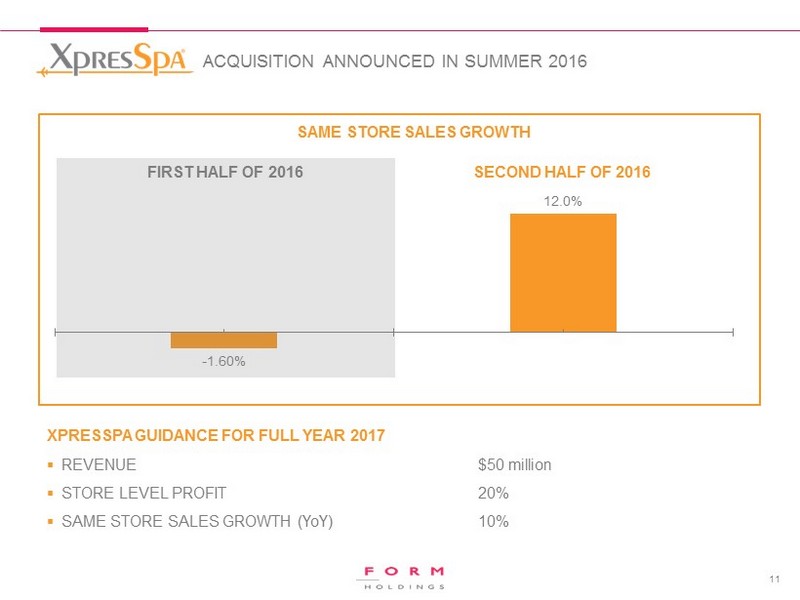
11 ACQUISITION ANNOUNCED IN SUMMER 2016 - 1.60% 12.0% FIRST HALF OF 2016 SECOND HALF OF 2016 XPRESSPA GUIDANCE FOR FULL YEAR 2017 ▪ REVENUE $50 million ▪ STORE LEVEL PROFIT 20% ▪ SAME STORE SALES GROWTH (YoY) 10% SAME STORE SALES GROWTH
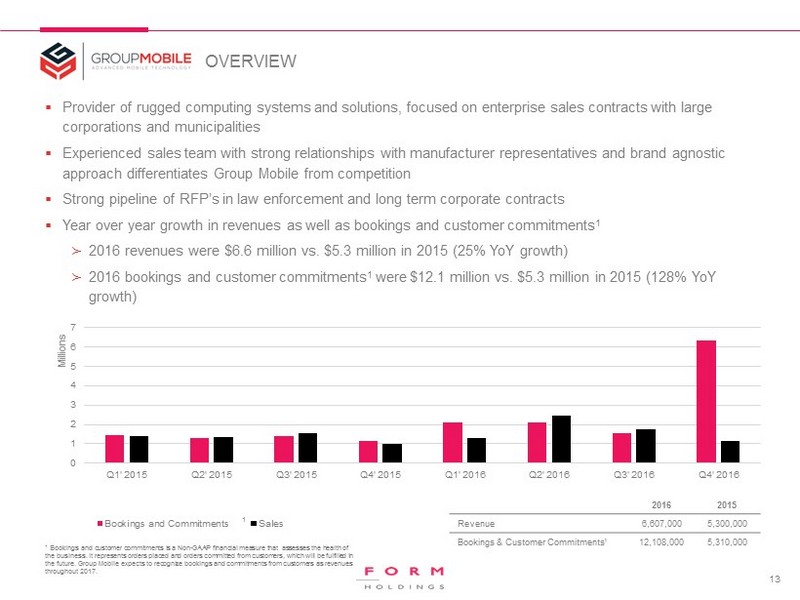
▪ Provider of rugged computing systems and solutions, focused on enterprise sales contracts with large corporations and municipalities ▪ Experienced sales team with strong relationships with manufacturer representatives and brand agnostic approach differentiates Group Mobile from competition ▪ Strong pipeline of RFP’s in law enforcement and long term corporate contracts ▪ Year over year growth in revenues as well as bookings and customer commitments 1 ≻ 2016 revenues wer e $6.6 million vs. $5.3 million in 2015 (25% YoY growth) ≻ 2016 bookings and customer commitments 1 were $12.1 million vs. $5.3 million in 2015 (128% YoY growth) 13 OVERVIEW 0 1 2 3 4 5 6 7 Q1' 2015 Q2' 2015 Q3' 2015 Q4' 2015 Q1' 2016 Q2' 2016 Q3' 2016 Q4' 2016 Millions Bookings and Commitments Sales 2016 2015 Revenue 6,607,000 5,300,000 Bookings & Customer Commitments 1 12,108,000 5,310,000 1 Bookings and customer commitments is a Non - GAAP financial measure that assesses the health of the business. It represents orders placed and orders committed from customers , which will be fulfilled in the future. Group Mobile expects to recognize bookings and commitments from customers as revenues throughout 2017. 1
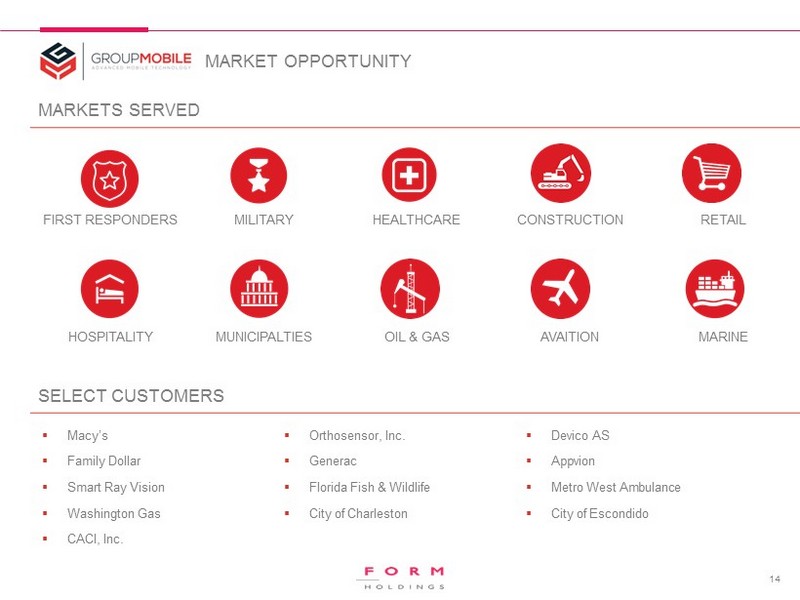
14 MARKET OPPORTUNITY FIRST RESPONDERS MILITARY HEALTHCARE CONSTRUCTION RETAIL HOSPITALITY MUNICIPALTIES OIL & GAS AVAITION MARINE MARKETS SERVED SELECT CUSTOMERS ▪ Macy’s ▪ Orthosensor , Inc. ▪ Devico AS ▪ Family Dollar ▪ Generac ▪ Appvion ▪ Smart Ray Vision ▪ Florida Fish & Wildlife ▪ Metro West Ambulance ▪ Washington Gas ▪ City of Charleston ▪ City of Escondido ▪ CACI, Inc.
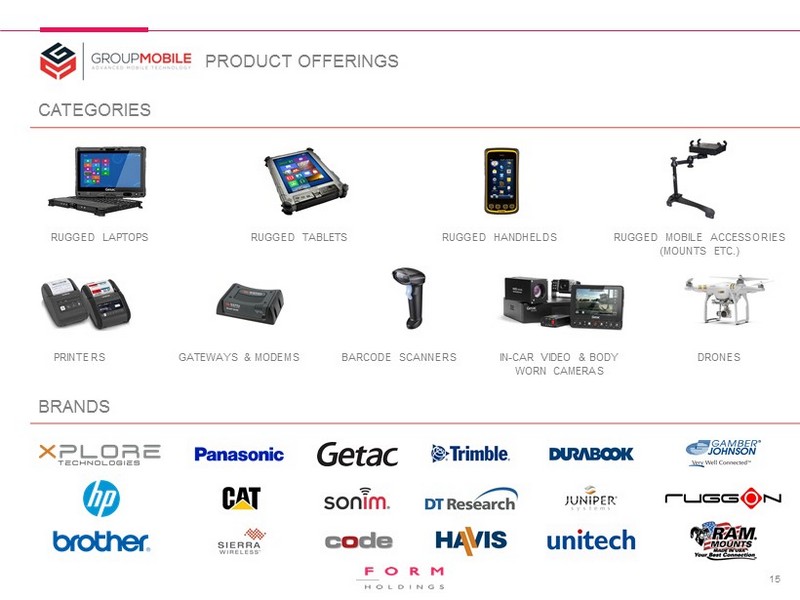
15 PRODUCT OFFERINGS RUGGED LAPTOPS RUGGED TABLETS RUGGED HANDHELDS RUGGED MOBILE ACCESSORIES (MOUNTS ETC.) PRINTERS GATEWAYS & MODEMS BARCODE SCANNERS IN - CAR VIDEO & BODY WORN CAMERAS DRONES CATEGORIES BRANDS
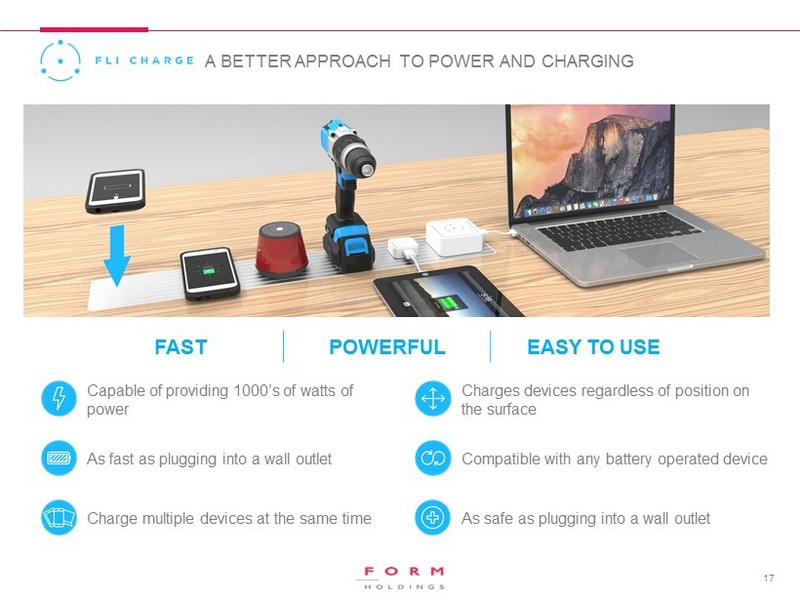
A BETTER APPROACH TO POWER AND CHARGING FAST POWERFUL EASY TO USE As fast as plugging into a wall outlet Compatible with any battery operated device Capable of providing 1000’s of watts of power Charges devices regardless of position on the surface Charge multiple devices at the same time As safe as plugging into a wall outlet 17
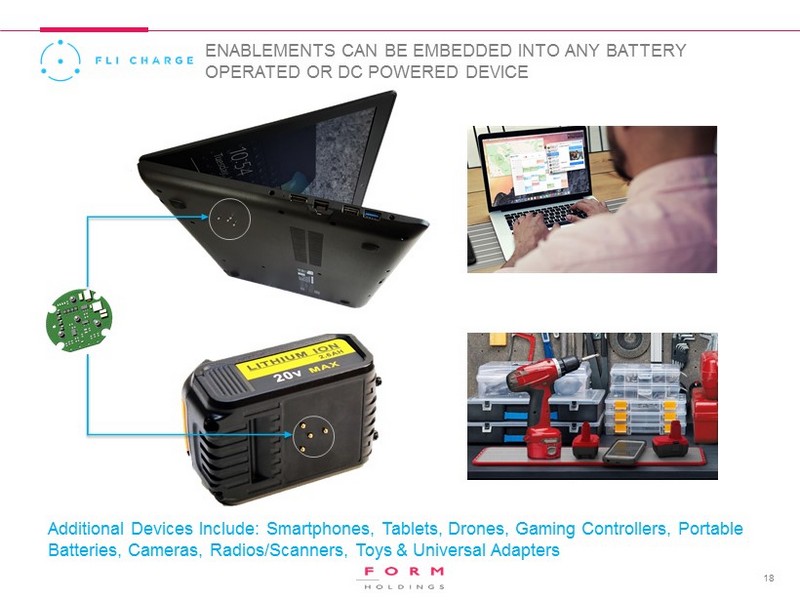
ENABLEMENTS CAN BE EMBEDDED INTO ANY BATTERY OPERATED OR DC POWERED DEVICE Additional Devices I nclude: Smartphones, Tablets, Drones, Gaming Controllers, Portable Batteries, Cameras, Radios/Scanners, Toys & Universal Adapters 18
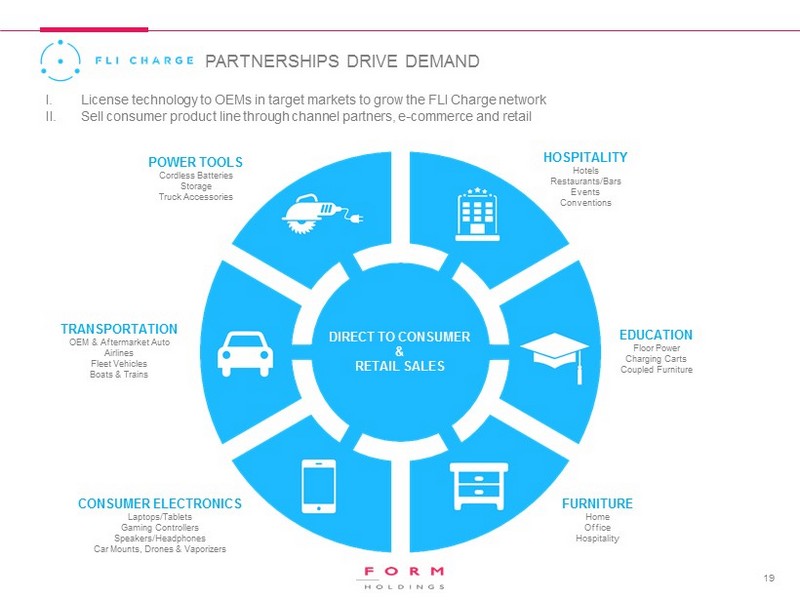
PARTNERSHIPS DRIVE DEMAND HOSPITALITY Hotels Restaurants/Bars Events Conventions EDUCATION Floor Power Charging Carts Coupled Furniture FURNITURE Home Office Hospitality POWER TOOLS Cordless Batteries Storage Truck Accessories TRANSPORTATION OEM & Aftermarket Auto Airlines Fleet Vehicles Boats & Trains CONSUMER ELECTRONICS Laptops/Tablets Gaming Controllers Speakers/Headphones Car Mounts, Drones & Vaporizers DIRECT TO CONSUMER & RETAIL SALES I. License technology to OEMs in target markets to grow the FLI Charge network II. Sell consumer product line through channel partners, e - commerce and retail 19
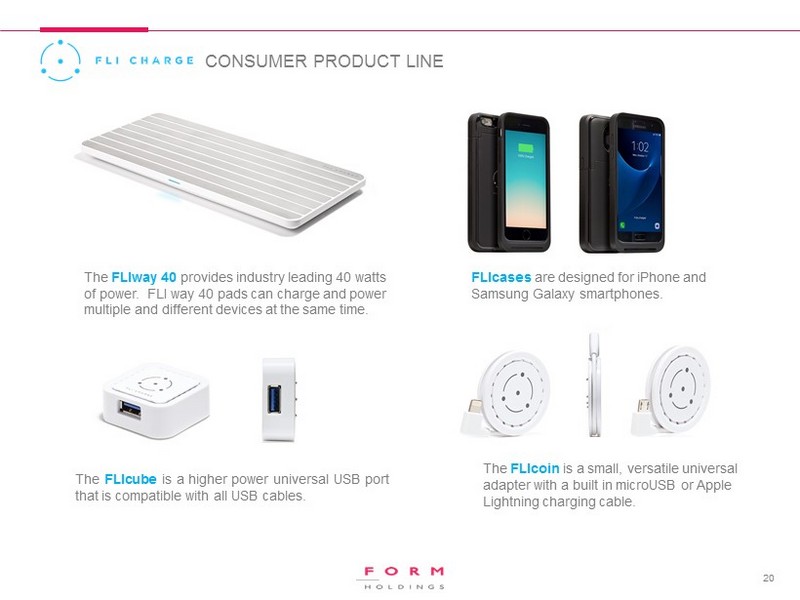
The FLIway 40 provides industry leading 40 watts of power. FLI way 40 pads can charge and power multiple and different devices at the same time. FLIcases are designed for iPhone and Samsung Galaxy smartphones. The FLIcube is a higher power universal USB port that is compatible with all USB cables . The FLIcoin is a small, versatile universal adapter with a built in microUSB or Apple Lightning charging cable. CONSUMER PRODUCT LINE 20
APPENDIX
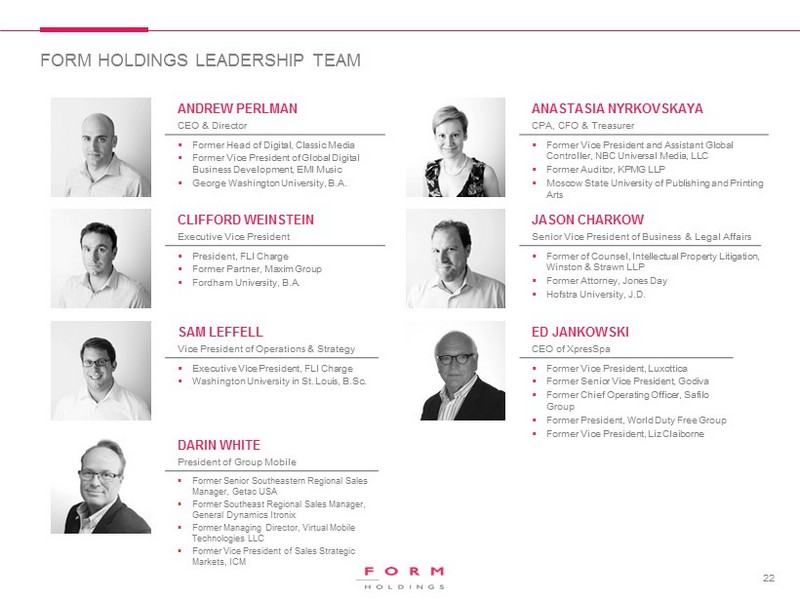
FORM HOLDINGS LEADERSHIP TEAM 22 ANDREW PERLMAN CEO & Director ▪ Former Head of Digital, Classic Media ▪ Former Vice President of Global Digital Business Development, EMI Music ▪ George Washington University, B.A. ANASTASIA NYRKOVSKAYA CPA, CFO & Treasurer ▪ Former Vice President and Assistant Global Controller, NBC Universal Media, LLC ▪ Former Auditor, KPMG LLP ▪ Moscow State University of Publishing and Printing Arts JASON CHARKOW Senior Vice President of Business & Legal Affairs ▪ Former of Counsel, Intellectual Property Litigation, Winston & Strawn LLP ▪ Former Attorney, Jones Day ▪ Hofstra University, J.D. CLIFFORD WEINSTEIN Executive Vice President ▪ President, FLI Charge ▪ Former Partner, Maxim Group ▪ Fordham University, B.A. SAM LEFFELL Vice President of Operations & Strategy ▪ Executive Vice President, FLI Charge ▪ Washington University in St. Louis, B.Sc. ED JANKOWSKI CEO of XpresSpa ▪ Former Vice President, Luxottica ▪ Former Senior Vice President, Godiva ▪ Former Chief Operating Officer, Safilo Group ▪ Former President, World Duty Free Group ▪ Former Vice President, Liz Claiborne DARIN WHITE President of Group Mobile ▪ Former Senior Southeastern Regional Sales Manager, Getac USA ▪ Former Southeast Regional Sales Manager, General Dynamics Itronix ▪ Former Managing Director, Virtual Mobile Technologies LLC ▪ Former Vice President of Sales Strategic Markets, ICM
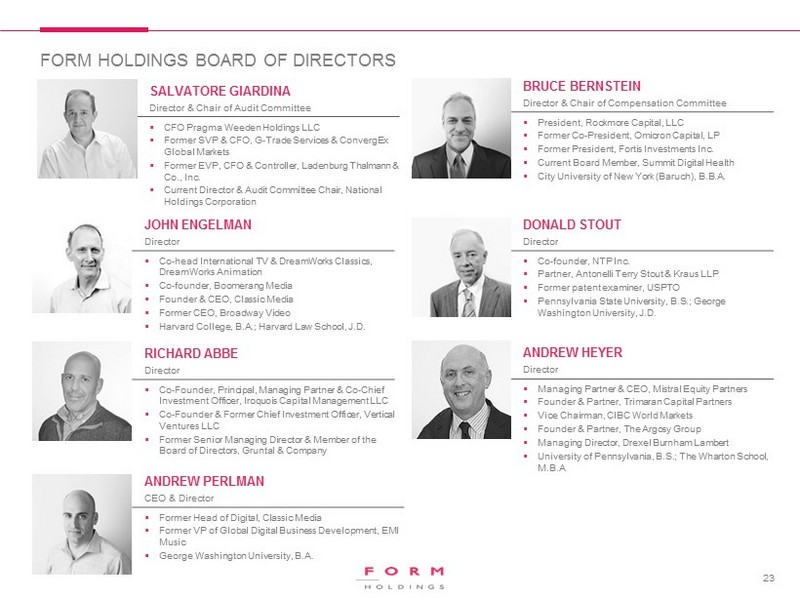
FORM HOLDINGS BOARD OF DIRECTORS 23 JOHN ENGELMAN Director ▪ Co - head International TV & DreamWorks Classics, DreamWorks Animation ▪ Co - founder, Boomerang Media ▪ Founder & CEO, Classic Media ▪ Former CEO, Broadway Video ▪ Harvard College, B.A.; Harvard Law School, J.D. DONALD STOUT Director ▪ Co - founder, NTP Inc. ▪ Partner, Antonelli Terry Stout & Kraus LLP ▪ Former patent examiner, USPTO ▪ Pennsylvania State University, B.S.; George Washington University, J.D. BRUCE BERNSTEIN Director & Chair of Compensation Committee ▪ President, Rockmore Capital, LLC ▪ Former Co - President, Omicron Capital, LP ▪ Former President, Fortis Investments Inc. ▪ Current Board Member, Summit Digital Health ▪ City University of New York (Baruch), B.B.A. RICHARD ABBE Director ▪ Co - Founder, Principal, Managing Partner & Co - Chief Investment Officer, Iroquois Capital Management LLC ▪ Co - Founder & Former Chief Investment Officer, Vertical Ventures LLC ▪ Former Senior Managing Director & Member of the Board of Directors, Gruntal & Company ANDREW PERLMAN CEO & Director ▪ Former Head of Digital, Classic Media ▪ Former VP of Global Digital Business Development, EMI Music ▪ George Washington University, B.A. SALVATORE GIARDINA Director & Chair of Audit Committee ▪ CFO Pragma Weeden Holdings LLC ▪ Former SVP & CFO, G - Trade Services & ConvergEx Global Markets ▪ Former EVP, CFO & Controller, Ladenburg Thalmann & Co., Inc. ▪ Current Director & Audit Committee Chair, National Holdings Corporation ANDREW HEYER Director ▪ Managing Partner & CEO, Mistral Equity Partners ▪ Founder & Partner, Trimaran Capital Partners ▪ Vice Chairman, CIBC World Markets ▪ Founder & Partner, The Argosy Group ▪ Managing Director, Drexel Burnham Lambert ▪ University of Pennsylvania, B.S.; The Wharton School, M.B.A
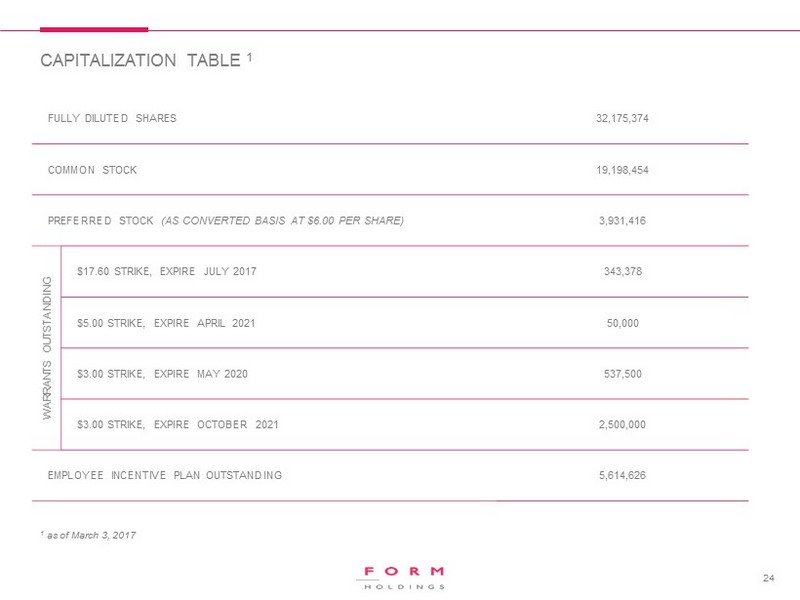
CAPITALIZATION TABLE 1 24 1 as of March 3, 2017 FULLY DILUTED SHARES 32,175,374 COMMON STOCK 19,198,454 PREFERRED STOCK (AS CONVERTED BASIS AT $6.00 PER SHARE) 3,931,416 WARRANTS OUTSTANDING $17.60 STRIKE, EXPIRE JULY 2017 343,378 $5.00 STRIKE, EXPIRE APRIL 2021 50,000 $3.00 STRIKE, EXPIRE MAY 2020 537,500 $3.00 STRIKE, EXPIRE OCTOBER 2021 2,500,000 EMPLOYEE INCENTIVE PLAN OUTSTANDING 5,614,626
CONTACT INFORMATION FORM Holdings Corp. 780 3rd Avenue, 12 th Floor New York, NY 10017 212 - 309 - 7549 IR@FORMHoldings.com For more information, please contact: 25