Attached files
| file | filename |
|---|---|
| EX-99.1 - EX-99.1 - SUPERIOR INDUSTRIES INTERNATIONAL INC | d315511dex991.htm |
| 8-K - 8-K - SUPERIOR INDUSTRIES INTERNATIONAL INC | d315511d8k.htm |
Superior Industries International Fourth Quarter and Full Year 2016 Earnings Conference Call March 2, 2017 Exhibit 99.2
Forward-Looking Statements This webcast and presentation contain statements that are forward-looking statements within the meaning of the Private Securities Litigation Reform Act of 1995. Forward-looking statements include all statements that do not relate solely to historical or current facts and can generally be identified by the use of future dates or words such as "may," "should," "could," “will,” "expects," "seeks to," "anticipates," "plans," "believes," "estimates," "intends," "predicts," "projects," "potential" or "continue" or the negative of such terms and other comparable terminology. These statements also include, but are not limited to, the 2017 outlook included herein, and the Company’s strategic and operational initiatives, including the resolution of operating inefficiencies, product mix and overall cost improvement and are based on current expectations, estimates, and projections about the Company's business based, in part, on assumptions made by management. These statements are not guarantees of future performance and involve risks, uncertainties and assumptions that are difficult to predict. Therefore, actual outcomes and results may differ materially from what is expressed or forecasted in such forward-looking statements due to numerous factors, risks, and uncertainties discussed in the Company's Securities and Exchange Commission filings and reports, including the Company's Annual Report on Form 10-K for the year-ended December 27, 2015, Quarterly Reports on Form 10-Q and other reports from time to time filed with the Securities and Exchange Commission. You are cautioned not to unduly rely on such forward looking statements when evaluating the information presented in this press release. Such forward-looking statements speak only as of the date on which they are made and the Company does not undertake any obligation to update any forward-looking statement to reflect events or circumstances after the date of this webcast and presentation. Use of Non-GAAP Financial Measures In addition to the results reported in accordance with GAAP included throughout this presentation, this presentation refers to “Adjusted EBITDA,” which we have defined as earnings before interest, taxes, depreciation, amortization, restructuring charges and impairments of long-lived assets and investments and “Value-Added Sales,” which we define as net sales less pass-through charges primarily for the value of aluminum. Adjusted EBITDA as a percentage of value-added sales is a key measure that is not calculated according to GAAP. Adjusted EBITDA as a percentage of value-added sales is defined as adjusted EBITDA divided by value-added sales. Management believes the non-GAAP financial measures used in this presentation are useful to both management and investors in their analysis of the Company’s financial position and results of operations. Further, management uses these non-GAAP financial measures for planning and forecasting future periods. This non-GAAP financial information is provided as additional information for investors and is not in accordance with or an alternative to GAAP. These non-GAAP measures may be different from similar measures used by other companies. For reconciliations of these non-GAAP financial measures to the most directly comparable financial measures calculated and presented in accordance with GAAP, see the appendix of this presentation. In reliance on the safe harbor provided under section 10(e) or Regulation S-K, we have not quantitatively reconciled differences between adjusted EBITDA presented in our 2017 Outlook to net income, the most comparable GAAP measure, as Superior is unable to quantify certain amounts that would be required to be included in net income without unreasonable efforts and due to the inherent uncertainty regarding such variables. Superior also believes that such a reconciliation would imply a degree of precision that could potentially be confusing or misleading to investors. However, the magnitude of these amounts may be significant. Non-GAAP Financial Measures and Forward-Looking Statements
Full Year 2016 Business Highlights Completed 500,000 wheel capacity expansion at new Mexico facility Established Mexican finishing joint venture Flexed to 24/7 plant operating pattern Implemented new tax strategy Initiated investments in additional premium finishing capabilities Established new global OEM relationship Produced 1.0M more units than previous year Awarded our first program for our patent pending AluliteTM product Established relationship with Chinese supplier
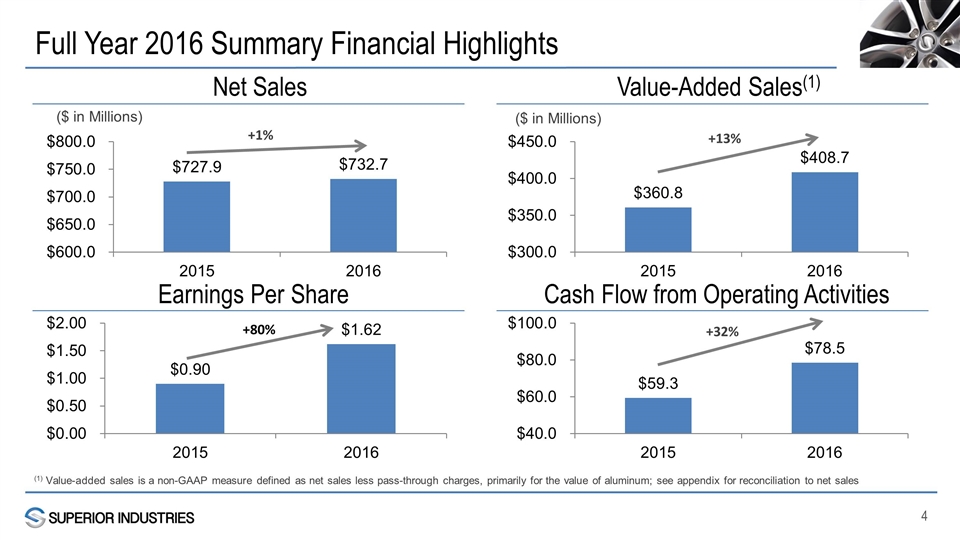
Full Year 2016 Summary Financial Highlights Cash Flow from Operating Activities ($ in Millions) +13% +32% Net Sales ($ in Millions) +1% +80% Earnings Per Share Value-Added Sales(1) (1) Value-added sales is a non-GAAP measure defined as net sales less pass-through charges, primarily for the value of aluminum; see appendix for reconciliation to net sales
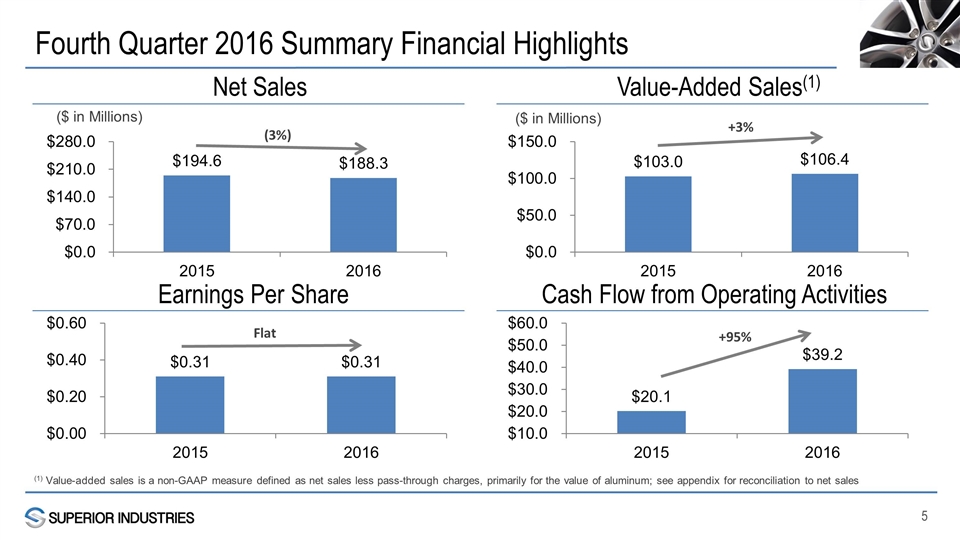
Fourth Quarter 2016 Summary Financial Highlights Cash Flow from Operating Activities ($ in Millions) +3% +95% Net Sales ($ in Millions) (3%) Flat Earnings Per Share Value-Added Sales(1) (1) Value-added sales is a non-GAAP measure defined as net sales less pass-through charges, primarily for the value of aluminum; see appendix for reconciliation to net sales
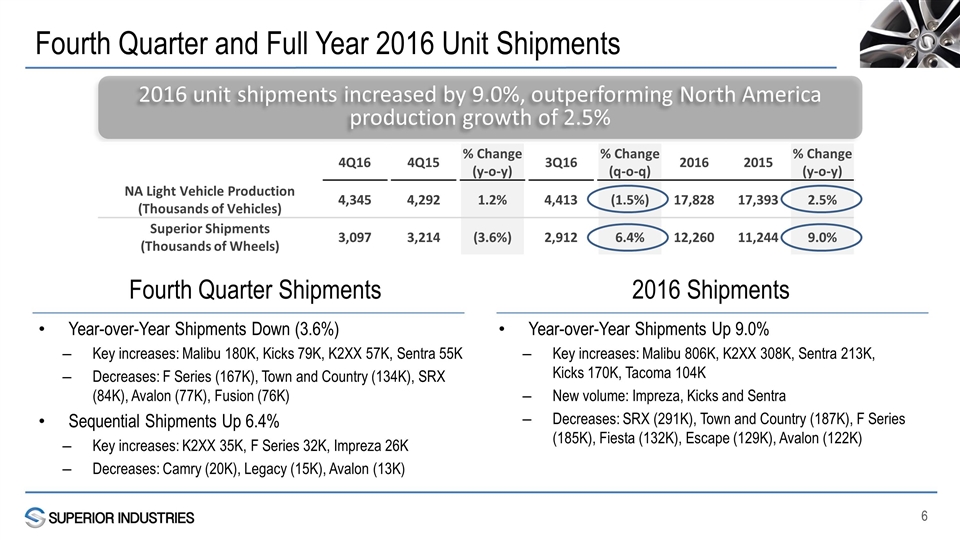
Fourth Quarter and Full Year 2016 Unit Shipments Year-over-Year Shipments Down (3.6%) Key increases: Malibu 180K, Kicks 79K, K2XX 57K, Sentra 55K Decreases: F Series (167K), Town and Country (134K), SRX (84K), Avalon (77K), Fusion (76K) Sequential Shipments Up 6.4% Key increases: K2XX 35K, F Series 32K, Impreza 26K Decreases: Camry (20K), Legacy (15K), Avalon (13K) Year-over-Year Shipments Up 9.0% Key increases: Malibu 806K, K2XX 308K, Sentra 213K, Kicks 170K, Tacoma 104K New volume: Impreza, Kicks and Sentra Decreases: SRX (291K), Town and Country (187K), F Series (185K), Fiesta (132K), Escape (129K), Avalon (122K) 2016 unit shipments increased by 9.0%, outperforming North America production growth of 2.5% 4Q16 4Q15 % Change (y-o-y) 3Q16 % Change (q-o-q) 2016 2015 % Change (y-o-y) NA Light Vehicle Production (Thousands of Vehicles) 4,345 4,292 1.2% 4,413 (1.5%) 17,828 17,393 2.5% Superior Shipments (Thousands of Wheels) 3,097 3,214 (3.6%) 2,912 6.4% 12,260 11,244 9.0% Fourth Quarter Shipments 2016 Shipments
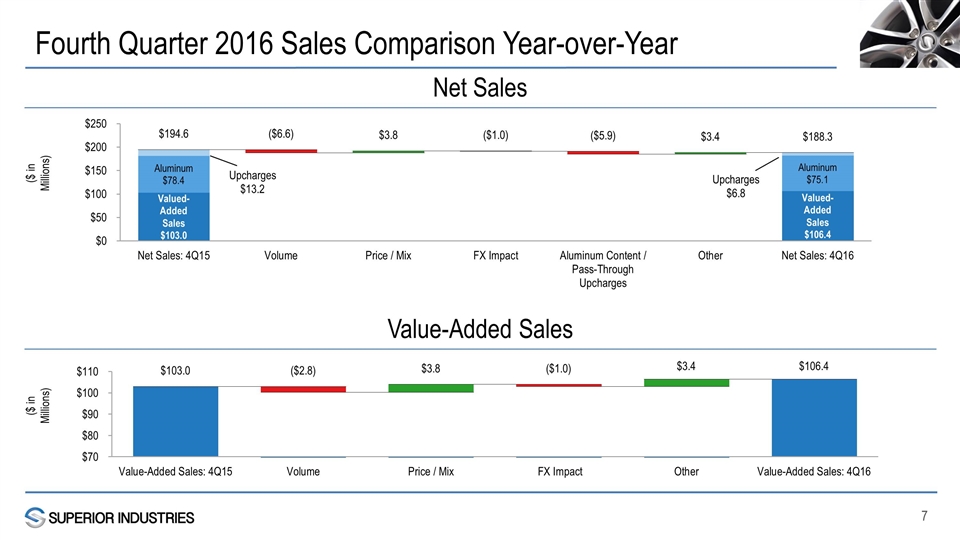
Fourth Quarter 2016 Sales Comparison Year-over-Year ($ in Millions) ($ in Millions) Net Sales Value-Added Sales
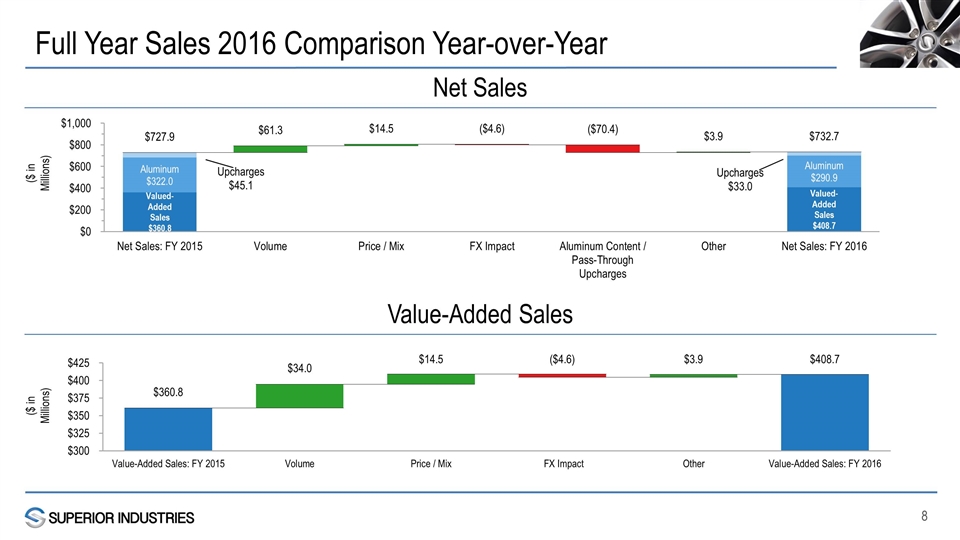
Full Year Sales 2016 Comparison Year-over-Year ($ in Millions) ($ in Millions) Net Sales Value-Added Sales
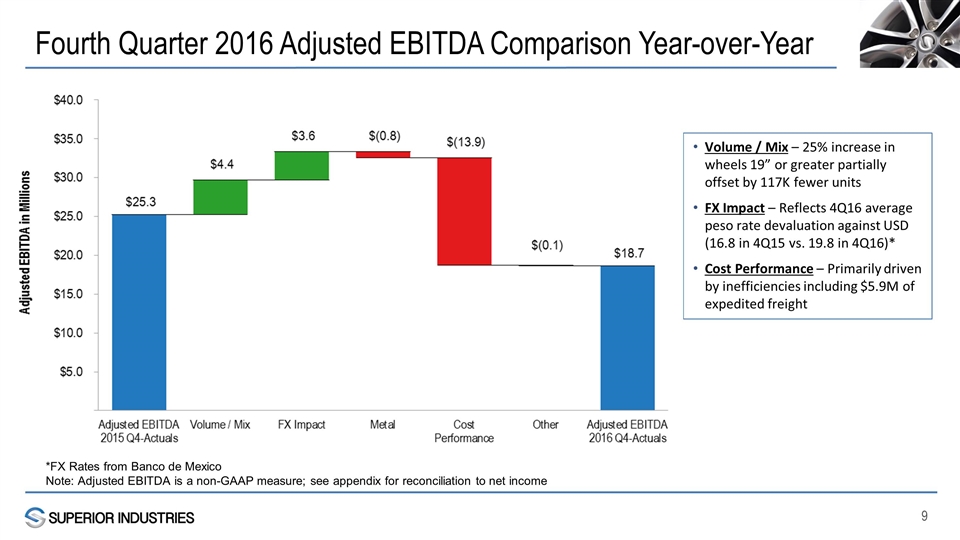
Fourth Quarter 2016 Adjusted EBITDA Comparison Year-over-Year Volume / Mix – 25% increase in wheels 19” or greater partially offset by 117K fewer units FX Impact – Reflects 4Q16 average peso rate devaluation against USD (16.8 in 4Q15 vs. 19.8 in 4Q16)* Cost Performance – Primarily driven by inefficiencies including $5.9M of expedited freight *FX Rates from Banco de Mexico Note: Adjusted EBITDA is a non-GAAP measure; see appendix for reconciliation to net income
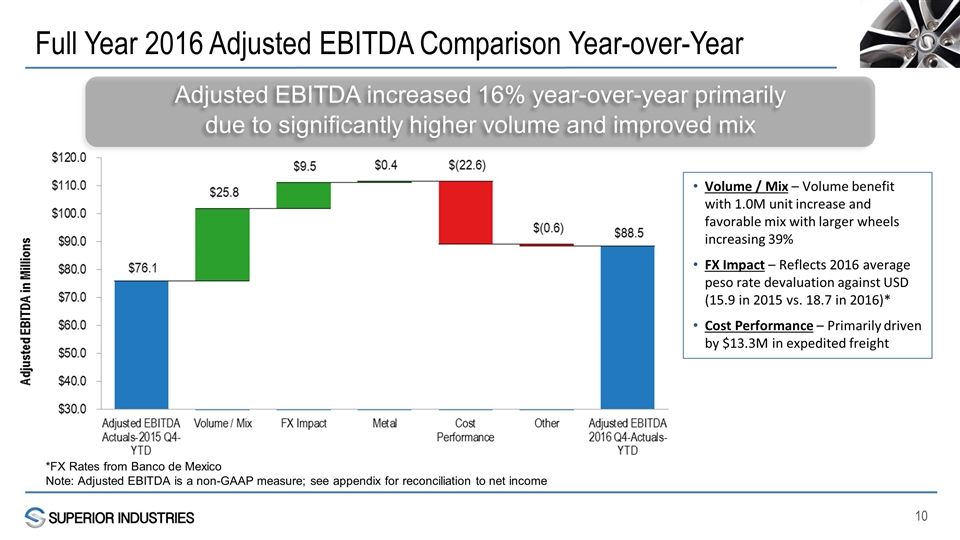
Full Year 2016 Adjusted EBITDA Comparison Year-over-Year Adjusted EBITDA increased 16% year-over-year primarily due to significantly higher volume and improved mix Volume / Mix – Volume benefit with 1.0M unit increase and favorable mix with larger wheels increasing 39% FX Impact – Reflects 2016 average peso rate devaluation against USD (15.9 in 2015 vs. 18.7 in 2016)* Cost Performance – Primarily driven by $13.3M in expedited freight *FX Rates from Banco de Mexico Note: Adjusted EBITDA is a non-GAAP measure; see appendix for reconciliation to net income
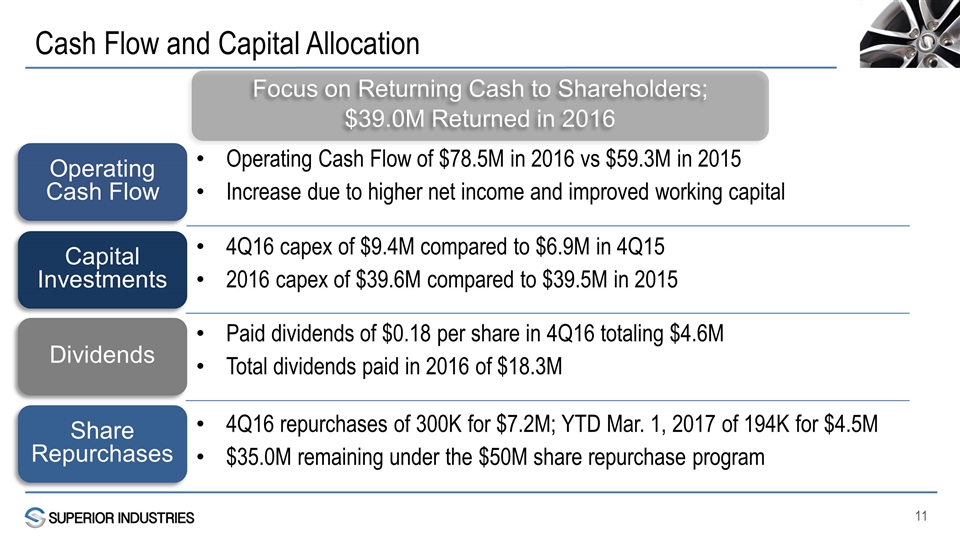
Cash Flow and Capital Allocation Paid dividends of $0.18 per share in 4Q16 totaling $4.6M Total dividends paid in 2016 of $18.3M Focus on Returning Cash to Shareholders; $39.0M Returned in 2016 Dividends Share Repurchases Capital Investments 4Q16 repurchases of 300K for $7.2M; YTD Mar. 1, 2017 of 194K for $4.5M $35.0M remaining under the $50M share repurchase program 4Q16 capex of $9.4M compared to $6.9M in 4Q15 2016 capex of $39.6M compared to $39.5M in 2015 Operating Cash Flow Operating Cash Flow of $78.5M in 2016 vs $59.3M in 2015 Increase due to higher net income and improved working capital
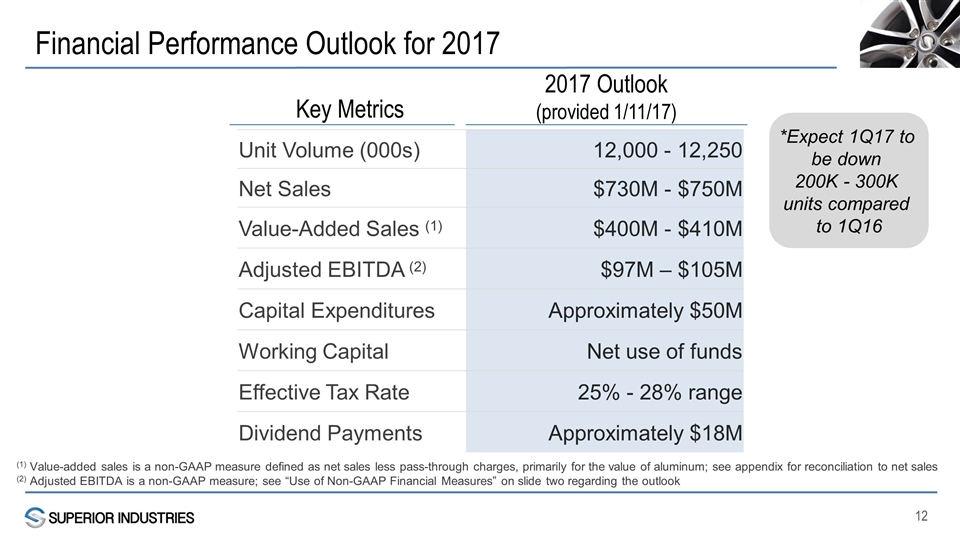
Financial Performance Outlook for 2017 Unit Volume (000s) 12,000 - 12,250 Net Sales $730M - $750M Value-Added Sales (1) $400M - $410M Adjusted EBITDA (2) $97M – $105M Capital Expenditures Approximately $50M Working Capital Net use of funds Effective Tax Rate 25% - 28% range Dividend Payments Approximately $18M Key Metrics 2017 Outlook (provided 1/11/17) *Expect 1Q17 to be down 200K - 300K units compared to 1Q16 (1) Value-added sales is a non-GAAP measure defined as net sales less pass-through charges, primarily for the value of aluminum; see appendix for reconciliation to net sales (2) Adjusted EBITDA is a non-GAAP measure; see “Use of Non-GAAP Financial Measures” on slide two regarding the outlook
Appendix
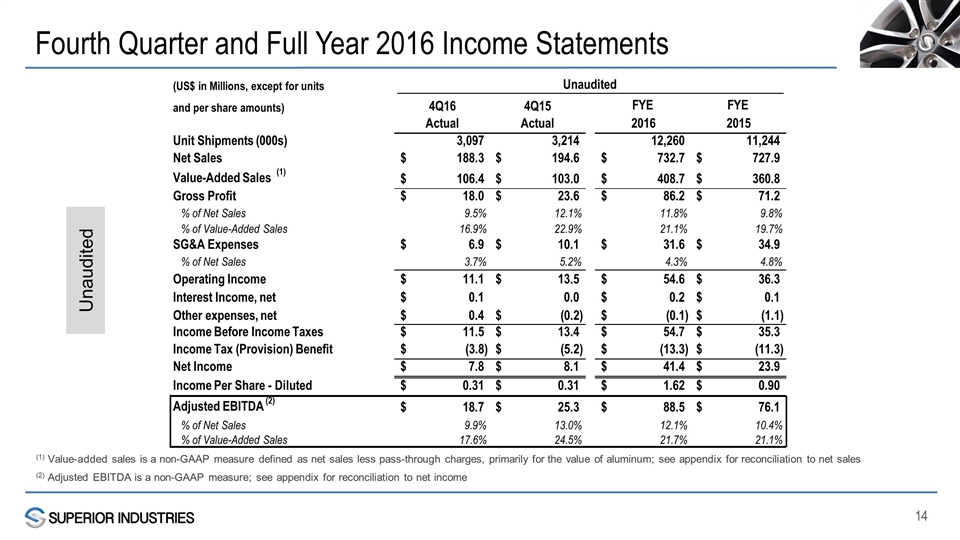
Fourth Quarter and Full Year 2016 Income Statements (1) Value-added sales is a non-GAAP measure defined as net sales less pass-through charges, primarily for the value of aluminum; see appendix for reconciliation to net sales (2) Adjusted EBITDA is a non-GAAP measure; see appendix for reconciliation to net income Unaudited (US$ in Millions, except for units Unaudited and per share amounts) 4Q16 4Q15 FYE FYE Actual Actual 2016 2015 Unit Shipments (000s) 3,097 3,214 12,260 11,244 Net Sales 188.3 $ 194.6 $ 732.7 $ 727.9 $ Value-Added Sales (1) 106.4 $ 103.0 $ 408.7 $ 360.8 $ Gross Profit 18.0 $ 23.6 $ 86.2 $ 71.2 $ % of Net Sales 9.5% 12.1% 11.8% 9.8% % of Value-Added Sales 16.9% 22.9% 21.1% 19.7% SG&A Expenses 6.9 $ 10.1 $ 31.6 $ 34.9 $ % of Net Sales 3.7% 5.2% 4.3% 4.8% Operating Income 11.1 $ 13.5 $ 54.6 $ 36.3 $ Interest Income, net 0.1 $ 0.0 0.2 $ 0.1 $ Other expenses, net 0.4 $ (0.2) $ (0.1) $ (1.1) $ Income Before Income Taxes 11.5 $ 13.4 $ 54.7 $ 35.3 $ Income Tax (Provision) Benefit (3.8) $ (5.2) $ (13.3) $ (11.3) $ Net Income 7.8 $ 8.1 $ 41.4 $ 23.9 $ Income Per Share - Diluted 0.31 $ 0.31 $ 1.62 $ 0.90 $ Adjusted EBITDA (2) 18.7 $ 25.3 $ 88.5 $ 76.1 $ % of Net Sales 9.9% 13.0% 12.1% 10.4% % of Value-Added Sales 17.6% 24.5% 21.7% 21.1%
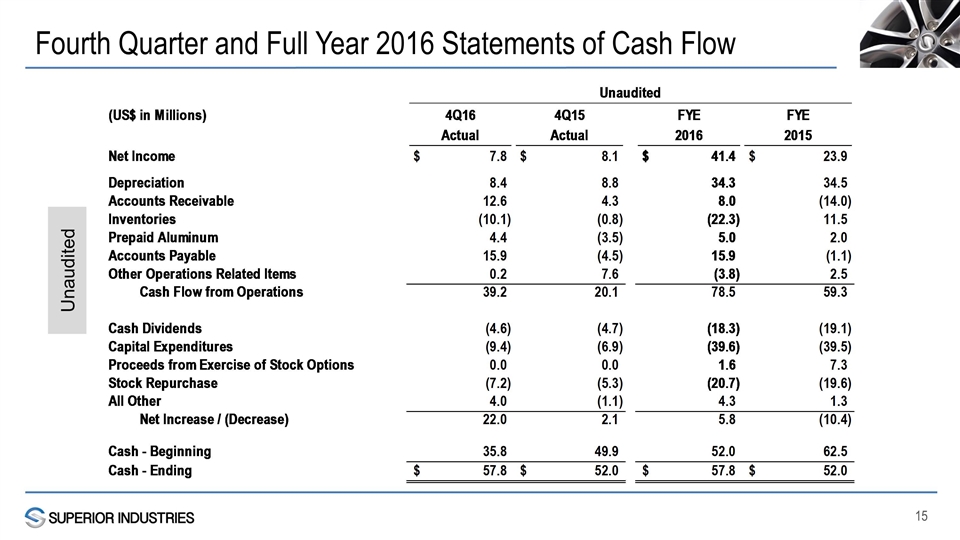
Fourth Quarter and Full Year 2016 Statements of Cash Flow Unaudited Superior Industries International, Inc. Summary Cash Flow Statements Quarter Ended December 2015 and 2014 Unaudited (US$ in Millions) 4Q16 4Q15 FYE FYE Actual Actual 2016 2015 Net Income $7.7801163659999997 $8.1301774569999647 $41.381733938000004 $23.944358883999406 Depreciation 8.3728330999999994 8.8345692000000007 34.260550849999902 34.530237519999986 Accounts Receivable 12.570565241308302 4.2839584852076049 8.0429187042695691 -14.029999999999996 Inventories -10.1317480226464 -0.77075946146219942 -22.339115349870301 11.508722545356441 Prepaid Aluminum 4.3869999999999996 -3.5080969800000004 5.0449999999999999 1.9792925800000001 Accounts Payable 15.9 -4.5003338391409997 15.9 -1.1323954834901593 Other Operations Related Items 0.2 7.6235458497551001 -3.7796783735765729 2.498590519678018 Cash Flow from Operations 39.200000000000003 20.09306071135947 78.511409768822602 59.2988065655437 Cash Dividends -4.5570000000000004 -4.7110239600000039 -18.34 -19.081830040000007 Capital Expenditures -9.4 -6.9140700998555404 -39.6 -39.542999999999999 Proceeds from Exercise of Stock Options 2.51400000000001E-2 2.5645999999960624E-4 1.6407213300000001 7.26534192 Stock Repurchase -7.1931003658000003 -5.2636012112999992 -20.719492516700001 -19.637846109999998 All Other 4 -1.1164115521478364 4.2522736843443276 1.2838317761948617 Net Increase / (Decrease) 21.984788685388502 2.088210348056089 5.8 -10.414695888261441 Cash - Beginning 35.801107585218197 49.948161017685209 52.036000000000001 62.5 193.2 193.2 193.2 193.2 Cash - Ending $57.785896270606699 $52.036371365741296 $57.835999999999999 $51.985304111738557 $21.535999999999987 $0 $21.535999999999987 $-5.314695888261447 $26.850695888261434 Plant 15 June Ytd Capex per CI schedule
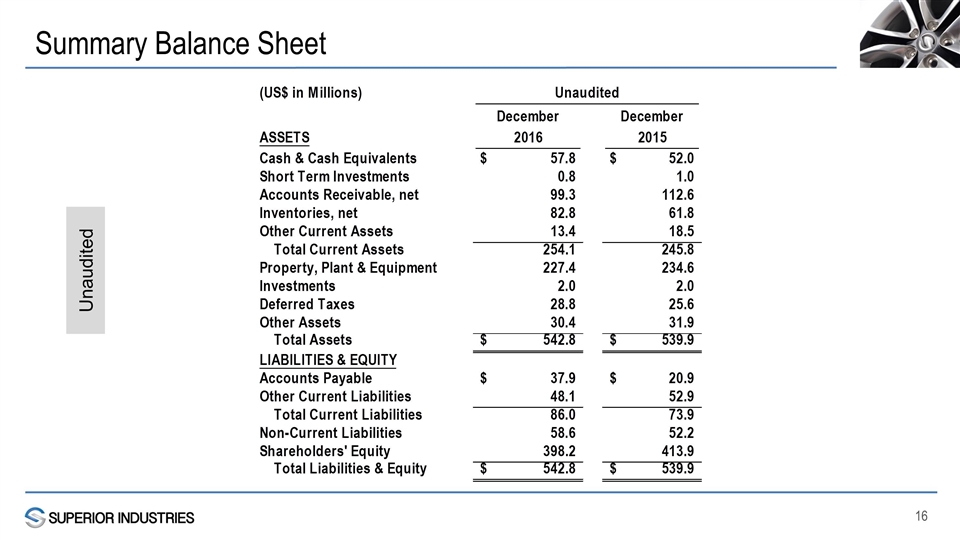
Summary Balance Sheet Unaudited Superior Industries International, Inc. Summary Balance Sheets (US$ in Millions) Unaudited December December ASSETS 2016 2015 Cash & Cash Equivalents $57.786000000000001 $52.036116290000002 Short Term Investments 0.75 0.95 Accounts Receivable, net 99.3 112.58885485899999 Inventories, net 82.8 61.769375689999997 Other Current Assets 13.376971999999999 18.477 Total Current Assets 254.1 245.821509499 Property, Plant & Equipment 227.4 234.64628787999993 Investments 2 2.0140216799999999 Deferred Taxes 28.8 25.597737289999998 Other Assets 30.4 31.850316060000125 Total Assets $542.79999999999995 $539.92987240900004 LIABILITIES & EQUITY Accounts Payable $37.85 $20.91348481 Other Current Liabilities 48.1 52.948632230000001 Total Current Liabilities 85.95 73.862117040000001 Non-Current Liabilities 58.6 52.155507254996948 Shareholders' Equity 398.226 413.912248118001 Total Liabilities & Equity $542.77600000000007 $539.92987241299795 A/R 99.3 112.58885485899999 Inventory 82.8 61.769375689999997 Ppd Alum #REF! #REF! Less: A/P -37.85 -20.91348481 #REF! #REF! Prepaid Aluminum 12,424,715.52 18,654,228.91
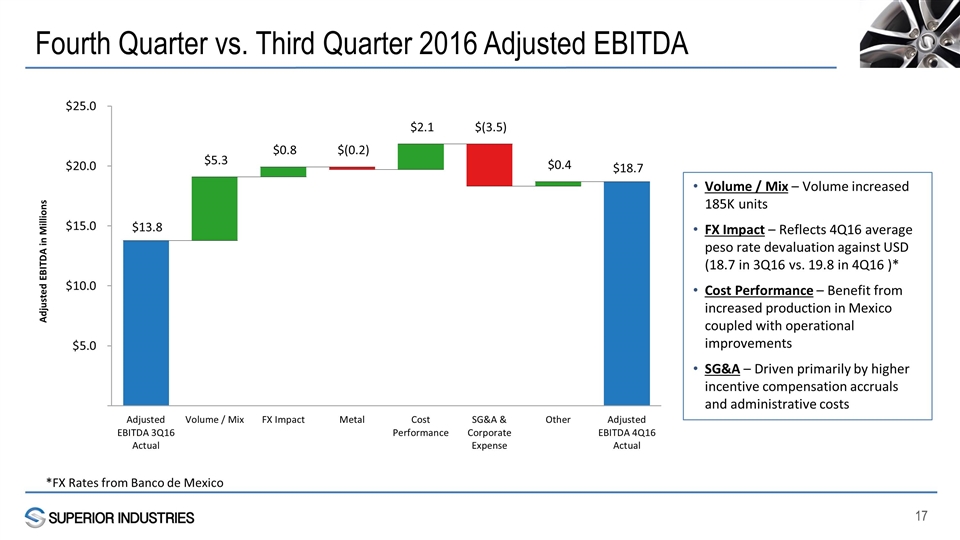
Fourth Quarter vs. Third Quarter 2016 Adjusted EBITDA *FX Rates from Banco de Mexico Volume / Mix – Volume increased 185K units FX Impact – Reflects 4Q16 average peso rate devaluation against USD (18.7 in 3Q16 vs. 19.8 in 4Q16 )* Cost Performance – Benefit from increased production in Mexico coupled with operational improvements SG&A – Driven primarily by higher incentive compensation accruals and administrative costs
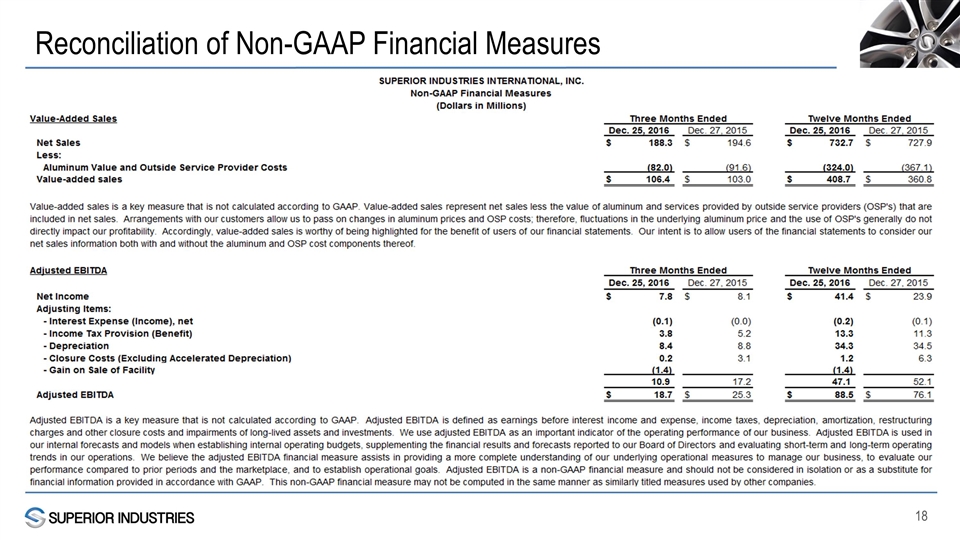
Reconciliation of Non-GAAP Financial Measures
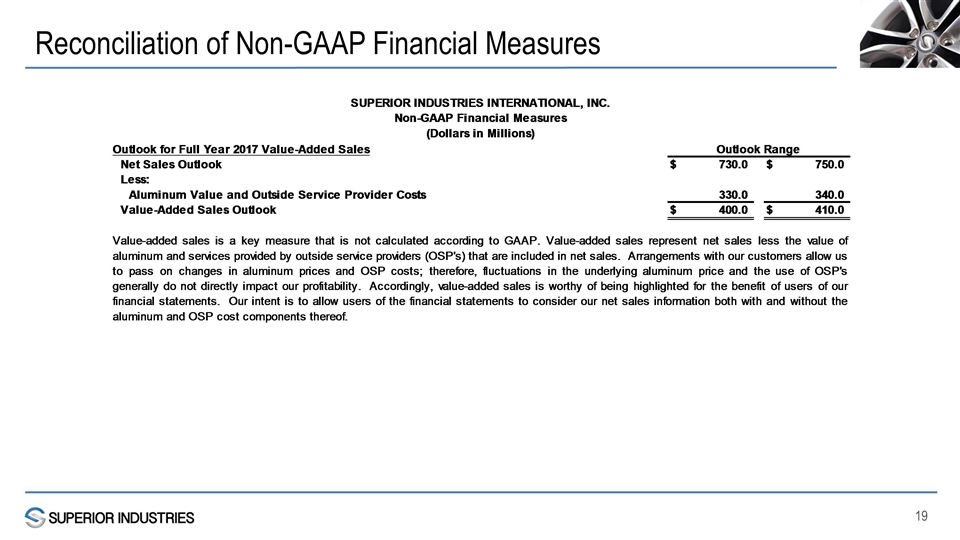
Reconciliation of Non-GAAP Financial Measures
