Attached files
| file | filename |
|---|---|
| EX-31.2 - EX-31.2 - SUPERIOR INDUSTRIES INTERNATIONAL INC | d525981dex312.htm |
| EX-32.1 - EX-32.1 - SUPERIOR INDUSTRIES INTERNATIONAL INC | d525981dex321.htm |
| EX-31.1 - EX-31.1 - SUPERIOR INDUSTRIES INTERNATIONAL INC | d525981dex311.htm |
| EX-23 - EX-23 - SUPERIOR INDUSTRIES INTERNATIONAL INC | d525981dex23.htm |
| EX-21 - EX-21 - SUPERIOR INDUSTRIES INTERNATIONAL INC | d525981dex21.htm |
Table of Contents
UNITED STATES
SECURITIES AND EXCHANGE COMMISSION
WASHINGTON, D.C. 20549
FORM 10-K
| ☒ | ANNUAL REPORT PURSUANT TO SECTION 13 OR 15(d) OF THE SECURITIES EXCHANGE ACT OF 1934 |
For the fiscal year ended December 31, 2017
Commission file number: 1-6615
SUPERIOR INDUSTRIES INTERNATIONAL, INC.
(Exact Name of Registrant as Specified in Its Charter)
| Delaware | 95-2594729 | |
| (State or Other Jurisdiction of Incorporation or Organization) |
(I.R.S. Employer Identification No.) | |
| 26600 Telegraph Road, Suite 400 Southfield, Michigan |
48033 | |
| (Address of Principal Executive Offices) | (Zip Code) | |
Registrant’s Telephone Number, Including Area Code: (248) 352-7300
Securities registered pursuant to Section 12(b) of the Act:
| Title of Each Class |
Name of Each Exchange on Which Registered | |
| Common Stock, $0.01 par value | New York Stock Exchange |
Securities registered pursuant to Section 12(g) of the Act: None
Indicate by check mark if the registrant is a well-known seasoned issuer, as defined in Rule 405 of the Securities Act. Yes ☐ No ☒
Indicate by check mark if the registrant is not required to file reports pursuant to Section 13 or Section 15(d) of the Act. Yes ☐ No ☒
Indicate by check mark whether the registrant: (1) has filed all reports required to be filed by Section 13 or 15(d) of the Securities Exchange Act of 1934 during the preceding 12 months (or for such shorter period that the registrant was required to file such reports), and (2) has been subject to such filing requirements for the past 90 days. Yes ☒ No ☐
Indicate by check mark whether the registrant has submitted electronically and posted on its corporate Web site, if any, every Interactive Data File required to be submitted and posted pursuant to Rule 405 of Regulation S-T (§ 232.405 of this chapter) during the preceding 12 months (or for such shorter period that the registrant was required to submit and post such files). Yes ☒ No ☐
Indicate by check mark if the disclosure of delinquent filers pursuant to Item 405 of Regulation S-K (§ 229.405) is not contained herein, and will not be contained, to the best of the registrant’s knowledge, in definitive proxy or information statements incorporated by reference in Part III of this Form 10-K or any amendment to this Form 10-K. ☐
Indicate by check mark whether the registrant is a large accelerated filer, an accelerated filer, a non-accelerated filer, a smaller reporting company or an emerging growth company. See the definitions of “large accelerated filer,” “accelerated filer,” “smaller reporting company” and “emerging growth company” in Rule 12b-2 of the Exchange Act.
| Large accelerated filer | ☐ | Accelerated filer | ☒ | |||
| Non-accelerated filer | ☐ | Smaller reporting company | ☐ | |||
| Emerging growth company | ☐ |
If an emerging growth company, indicate by check mark if the registrant has elected not to use the extended transition period for complying with any new or revised financial accounting standards provided pursuant to Section 13(a) of the Exchange Act. ☐
Indicate by check mark whether the registrant is a shell company (as defined in Rule 12b-2 of the Act). Yes ☐ No ☒
The aggregate market value of the registrant’s $0.01 par value common equity held by non-affiliates as of the last business day of the registrant’s most recently completed second quarter was $486,960,608, based on a closing price of $19.55. On February 28, 2018, there were 24,917,025 shares of common stock issued and outstanding.
DOCUMENTS INCORPORATED BY REFERENCE
Portions of the registrant’s 2018 Proxy Statement, to be filed with the Securities and Exchange Commission within 120 days after the close of the registrant’s fiscal year, are incorporated by reference into Part III of this Form 10-K.
Table of Contents
SUPERIOR INDUSTRIES INTERNATIONAL, INC.
ANNUAL REPORT ON FORM 10-K
| PART I | PAGE | |||||
| Item 1 | 1 | |||||
| Item 1A | 7 | |||||
| Item 1B | 20 | |||||
| Item 2 | 20 | |||||
| Item 3 | 20 | |||||
| Item 4 | 20 | |||||
| Item 4A | 21 | |||||
| PART II |
||||||
| Item 5 | 23 | |||||
| Item 6 | 25 | |||||
| Item 7 | Management’s Discussion and Analysis of Financial Condition and Results of Operations. |
27 | ||||
| Item 7A | 49 | |||||
| Item 8 | 52 | |||||
| Item 9 | Changes in and Disagreements With Accountants on Accounting and Financial Disclosure. |
103 | ||||
| Item 9A | 103 | |||||
| Item 9B | 104 | |||||
| PART III |
||||||
| Item 10 | 105 | |||||
| Item 11 | 105 | |||||
| Item 12 | Security Ownership of Certain Beneficial Owners and Management and Related Stockholder Matters. |
105 | ||||
| Item 13 | Certain Relationships and Related Transactions, and Director Independence. |
105 | ||||
| Item 14 | 105 | |||||
| PART IV |
||||||
| Item 15 | 106 | |||||
| Schedule II | 110 | |||||
| SIGNATURES |
||||||
Table of Contents
CAUTIONARY STATEMENT REGARDING FORWARD-LOOKING INFORMATION
The Private Securities Litigation Reform Act of 1995 provides a safe harbor for forward-looking statements made by us or on our behalf. We have included or incorporated by reference in this Annual Report on Form 10-K (including in the sections entitled “Risk Factors” and “Management’s Discussion and Analysis of Financial Condition and Results of Operations”) and from time to time our management may make statements that may constitute “forward-looking statements” within the meaning of Section 27A of the Securities Exchange Act of 1933 and Section 21E of the Securities Act of 1934. These forward-looking statements are based upon management’s current expectations, estimates, assumptions and beliefs concerning future events and conditions and may discuss, among other things, anticipated future performance (including sales and earnings), expected growth, future business plans and costs and potential liability for environmental-related matters. Any statement that is not historical in nature is a forward-looking statement and may be identified by the use of words and phrases such as “expects,” “anticipates,” “believes,” “will,” “will likely result,” “will continue,” “plans to” and similar expressions. These statements include our belief regarding general automotive industry and market conditions and growth rates, as well as general domestic and international economic conditions.
Readers are cautioned not to place undue reliance on forward-looking statements. Forward-looking statements are necessarily subject to risks, uncertainties and other factors, many of which are outside the control of the company, which could cause actual results to differ materially from such statements and from the company’s historical results and experience. These risks, uncertainties and other factors include, but are not limited to, those described in Part I, Item 1A, “Risk Factors” and Part II - Item 7, “Management’s Discussion and Analysis of Financial Condition and Results of Operations” of this Annual Report on Form 10-K and elsewhere in the Annual Report and those described from time to time in our other reports filed with the Securities and Exchange Commission.
Readers are cautioned that it is not possible to predict or identify all of the risks, uncertainties and other factors that may affect future results and that the risks described herein should not be considered to be a complete list. Any forward-looking statement speaks only as of the date on which such statement is made, and the company undertakes no obligation to update or revise any forward-looking statement, whether as a result of new information, future events or otherwise.
Table of Contents
Description of Business and Industry
The principal business of Superior Industries International, Inc. (referred to herein as the “company” or “we,” “us” and “our”) is the design and manufacture of aluminum wheels for sale to original equipment manufacturers (“OEMs”) and aftermarket customers. We believe we are the #1 North American aluminum wheel supplier, the #3 European OEM supplier and #1 European aftermarket supplier. Our OEM aluminum wheels are primarily sold for factory installation, as either standard equipment or optional equipment, on approximately 180 vehicle models manufactured by Audi, BMW, Fiat Chrysler Automobiles N.V. (“FCA”), Ford, General Motors (“GM”), Jaguar-Land Rover, Mercedes-Benz, Mitsubishi, Nissan, Subaru, Tesla, Toyota, Volkswagen and Volvo. North America and Europe represent the principal markets for our products but we have a global presence and opportunities with North American, European and Asian OEMs. The following chart below included twelve months of proforma sales for our European operations for informational purposes. All of the other charts in this document include seven months of sales for our European operations, which aligns with the acquisition date. On May 30, 2017, we acquired a majority interest in Uniwheels AG (“Uniwheels”), which is also referred to as our “European operations.”
|
CUSTOMER SALES PERCENTAGES FOR 2016 AND 2017 ASSUMING 12 MONTHS OF UNIWHEELS
|
|

|
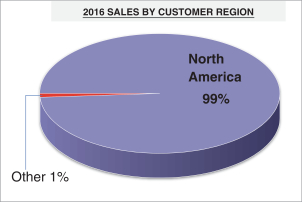
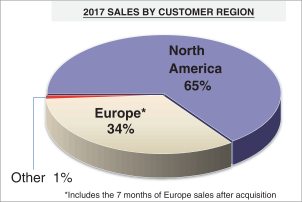
With the acquisition of our European operations in 2017, we diversified our customer base from predominately North American to include Europe and North America. The following chart demonstrates the shift in diversification of our business from 2016 to 2017.
|
DIVERSIFICATION
|
|
|
1
Table of Contents
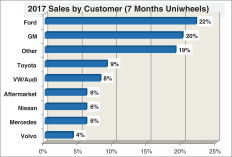
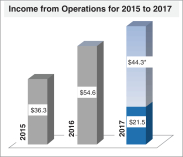
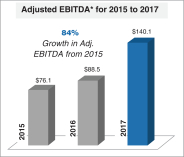
Uniwheels is a European supplier of OEM aluminum wheels and also a supplier of European aftermarket aluminum wheels. As a result of the acquisition, we have expanded into the European market, broadened our product portfolio and acquired a significant customer share with European OEMs, including Audi, Jaguar-Land Rover, Mercedes Benz and Volvo. The acquisition is not only complementary in terms of customers, market coverage and product offerings but also very much aligned with our strategic direction with a focus on larger diameter wheels, premium finishes, luxury brands and specialty wheels for high performance motorsport racing vehicles, all providing enhanced opportunity for higher value added business. With the acquisition, our global reach encompasses sales to nine of the ten largest OEMs in the world with sales surpassing $1.1 billion. The following charts show key highlights of 2017 and sales by major customer based on seven months of Uniwheels. The chart includes net income from operations and Adjusted EBITDA, which is a key metric we use to measure operating performance but is not calculated according to GAAP.
|
SALES BY CUSTOMER AND PROFITABILITY
|
|
|
| ||
| * Income from operations in 2017 includes $44.3 million in costs related to acquisition costs and integration costs. |
* See the Non-GAAP Financial Measures section of this annual report for a reconciliation of our Adjusted EBIDA to income from operations. |
Historically, the focus of the Company was on providing wheels for relatively high-volume programs with lower degrees of competitive differentiation. In order to improve our strategic position and better serve our customers, we are augmenting our product portfolio with wheels containing higher technical content and greater differentiation. We believe this direction is consistent with current trends in the market and needs of our customers. To achieve this objective, we have invested and continue to invest in new manufacturing capabilities in order to produce more sophisticated finishes and larger diameter products, which typically provide higher value in the market. The acquisition of our European operations and the construction of a new finishing facility align with this strategic mission. We have constructed a physical vapor deposition (“PVD”) finishing facility, which we believe will establish us as the first OEM automotive wheel manufacturer to have this capability in-house in North America and Europe. PVD is a wheel coating process that creates bright chrome-like surfaces in an environmentally friendly manner.
Demand for our products is mainly driven by light-vehicle production levels in North America and Europe. The North American light-vehicle production level in 2017 was 17.0 million vehicles, a 4.7 percent decrease from 2016. Despite this decrease, the 2017 North American production level was one of the highest in the history of the industry. In Europe, the passenger car and light duty truck vehicle production level in 2017 was 18.7 million vehicles, a 0.3 percent increase over 2016. We track annual production rates based on information from Ward’s Automotive Group, as well as other sources. The majority of our customers’ wheel programs are awarded to suppliers two or three years in advance. Our purchase orders with OEMs are typically specific to a particular vehicle model.
Raw Materials
The raw materials used in manufacturing our products are readily available and are obtained through numerous suppliers with whom we have established trade relations. Purchased aluminum accounted for the vast majority of
2
Table of Contents
our total raw material requirements during 2017. Our aluminum requirements are met through purchase orders with major producers, with physical supply primarily obtained from in-country production locations. Generally, aluminum purchase orders are fixed as to minimum and maximum quantities, which the producers must supply and we must purchase during the term of the orders. During 2017, we were able to successfully secure aluminum commitments from our primary suppliers to meet production requirements, and we anticipate being able to source aluminum requirements to meet our expected level of production in 2018. We procure other raw materials through numerous suppliers with whom we have established trade relationships. We also enter into commodity forward contracts and swaps covering up to twelve months aftermarket production volume in which the aluminum price is linked to the London Metal Exchange (LME) index. Moreover, in both our North American and European businesses, OEM wheel sale prices are adjusted for fluctuating aluminum commodity prices based on changes in commodity indices.
When market conditions warrant, we may also enter into purchase commitments to secure the supply of certain commodities used in the manufacture of our products, such as aluminum, natural gas and other raw materials.
Customer Dependence
We have proven our ability to be a consistent producer of high quality aluminum wheels with the capability to meet our customers’ price, quality, delivery and service requirements. We strive to continually enhance our relationships with our customers through continuous improvement programs, not only through our manufacturing operations but in the engineering, design, development and quality areas as well. These key business relationships have resulted in multiple vehicle supply contract awards with our key customers in the past few years.
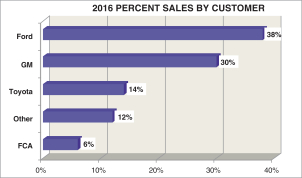
Ford and GM were our only customers individually accounting for more than 10 percent of our consolidated trade sales in 2017. Net sales to these customers, as well as Toyota, in 2017, 2016 and 2015 were as follows (dollars in millions):
| 2015 | 2016 | 2017 | ||||||||||||||||||||||
| Percent of Net Sales |
Dollars | Percent of Net Sales |
Dollars | Percent of Net Sales |
Dollars | |||||||||||||||||||
| Ford |
44 | % | $ | 315.1 | 38 | % | $ | 271.4 | 22 | % | $ | 248.8 | ||||||||||||
| GM |
24 | % | $ | 175.6 | 30 | % | $ | 216.4 | 20 | % | $ | 217.5 | ||||||||||||
| Toyota |
14 | % | $ | 104.5 | 14 | % | $ | 98.4 | 9 | % | $ | 103.8 | ||||||||||||
In addition, sales to Nissan and Volkswagen Group (“VW”), which includes Audi, exceeded 5 percent of sales during 2017, and sales to Mercedes and Volvo for the seven months following the acquisition of Uniwheels exceeded 5 percent during 2017 on an annualized basis. The loss of all or a substantial portion of our sales to Ford, GM, Toyota, Nissan, VW, Mercedes or Volvo would have a significant adverse effect on our financial results. See also Item 1A, “Risk Factors” of this Annual Report.
Foreign Operations
We manufacture a significant portion of our North American products in Mexico that are sold both in the United States and Mexico. Net sales of wheels manufactured in our Mexico operations in 2017 totaled $608.0 million and represented 83.0 percent of our total net sales in North America. We anticipate that the portion of our products produced in Mexico versus the United States will remain comparable in 2018. Net property, plant and equipment used in our operations in Mexico totaled $214.5 million at December 31, 2017. The overall cost for us to manufacture wheels in Mexico currently is lower than in the United States, due to lower labor costs as a result of lower prevailing wage rates.
Similarly, we manufacture the majority of our products for the European market in Poland, which are sold throughout Europe. Net sales of wheels manufactured in our Poland operations for the seven months following
3
Table of Contents
the acquisition were $220.4 million and represented 58.7 percent of our total net sales in Europe in 2017. Net property, plant and equipment used in our operations in Poland totaled $227.3 million at December 31, 2017. Similar to our Mexican operations, the overall cost to manufacture wheels in Poland is substantially lower than in both the United States and Germany at the present time due principally to lower labor costs.
Cost of manufacturing our product in Mexico, Germany and Poland may be affected by changes in cost structures, tariffs imposed by the United States, trade protection laws, policies and other regulations affecting trade and investments, social, political, labor, or general economic conditions. Other factors that can affect the business and financial results of our Mexican, German, Polish and U.S. operations include, but are not limited to, currency effects of the Peso, Euro and Zloty currencies, availability and competency of personnel and tax regulations. See also Item 1A, “Risk Factors - Our international operations and international trade agreements make us vulnerable to risks associated with doing business in foreign countries that can affect our business, financial condition and results of operations” and Item 1A, “Risk Factors - Fluctuations in foreign currencies may adversely impact our financial condition.”
Net Sales Backlog
Our customers typically award programs several years before actual production is scheduled to begin. Each year, the automotive manufacturers introduce new models, update existing models and discontinue certain models. In this process, we may be selected as the supplier on a new model, we may continue as the supplier on an updated model or we may lose a new or updated model to a competitor. The Company’s estimated net sales may be impacted by various assumptions, including new program vehicle production levels, customer price reductions, currency exchange rates and program launch timing. Our customers may terminate the awarded programs at any time or reduce order levels. Therefore, expected net sales information does not represent firm commitments or firm orders. We estimate that we have been awarded programs covering approximately 89 percent of our manufacturing capacity over the next three years.
Competition
Competition in the market for aluminum wheels is based primarily on delivery, overall customer service, price, quality and technology. We are the largest producer of aluminum wheels for OEM installations in North America and one of the largest in Europe. We currently supply approximately 20 percent and 14 percent of the aluminum wheels installed on passenger cars and light-duty trucks in North America and Europe, respectively.
Competition is global in nature with a significant volume of exports from Asia into North America. There are several competitors with facilities in North America but we estimate that we have more than twice the North American production capacity of any competitor. Some of the key competitors in North America include Central Motor Wheel of America (“CMWA”), CITIC Dicastal Co., Ltd., Prime Wheel Corporation, and Ronal. In 2017, the European Union renewed a tariff on aluminum wheels from China, which lessens the competitive pressures from Chinese competitors in that market. Key European competitors include Ronal (Switzerland), Borbet (Germany) and CMS (Turkey). The accessories market, by contrast, is heavily fragmented. We are the leading manufacturer of alloy wheels in the European aftermarket. Key competitors include Alcar (Austria), Brock (Germany), Borbet (Germany), ATU (Germany) and Mak (Italy). See also Item 1A, “Risk Factors” of this Annual Report.
Steel and other types of wheels also compete with our products. According to Ward’s Automotive Group, the aluminum wheel penetration rate on passenger cars and light-duty trucks in North America was 87 percent for the 2017 model year and 81 percent for the 2016 model year, compared to 79 percent for the 2015 model year. The aluminum wheel penetration rate on passenger cars and light-duty trucks in Europe was 70 percent in 2017. We expect the aluminum wheel penetration rate to continue to increase. However, several factors can affect this rate including price, fuel economy requirements and styling preference. Although aluminum wheels currently are more costly than steel, aluminum is a lighter material than steel, which is desirable for fuel efficiency and generally viewed as aesthetically superior to steel and, thus, more desirable to the OEMs and their customers.
4
Table of Contents
Research and Development
Our policy is to continuously review, improve and develop our engineering capabilities to satisfy our customer requirements in the most efficient and cost-effective manner available. We strive to achieve this objective by attracting and retaining top engineering talent and by maintaining the latest state-of-the-art computer technology to support engineering development. Fully developed engineering centers located in Fayetteville, Arkansas, and in Lüdenscheid, Germany support our research and development manufacturing needs. We also have a technical sales function at our corporate headquarters in Southfield, Michigan that maintains a complement of engineering staff located near some of our largest customers’ headquarters and engineering and purchasing offices.
Research and development costs (primarily engineering and related costs), which are expensed as incurred, are included in cost of sales in our consolidated income statements. Research and development costs during each of the last three years were $7.7 million in 2017, $3.8 million in 2016 and $2.6 million in 2015.
Government Regulation
Safety standards in the manufacture of vehicles and automotive equipment have been established under the National Traffic and Motor Vehicle Safety Act of 1966, as amended. We believe that we are in compliance with all federal standards currently applicable to OEM suppliers and to automotive manufacturers.
Environmental Compliance
Our manufacturing facilities, like most other manufacturing companies, are subject to solid waste, water and air pollution control standards mandated by federal, state and local laws. Violators of these laws are subject to fines and, in extreme cases, plant closure. We believe our facilities are in material compliance with all presently applicable standards. However, costs related to environmental protection may grow due to increasingly stringent laws and regulations. The cost of environmental compliance was approximately $0.6 million in 2017, $0.4 million in 2016 and $0.7 million in 2015. We expect that future environmental compliance expenditures will approximate these levels and will not have a material effect on our consolidated financial position or results of operations. However, climate change legislation or regulations restricting emission of “greenhouse gases” could result in increased operating costs and reduced demand for the vehicles that use our products. See also Item 1A, “Risk Factors - We are subject to various environmental laws” of this Annual Report.
In response to climate change, the reduction of greenhouse gas emissions is on the agenda of the European authorities. As a result, the EU has made a commitment in an EU Directive to reduce emissions by at least 20 percent by the year 2020 (measured on 1990 levels). Passenger cars have been identified as a key causal factor in emissions. A central element of the regulation is an average CO2 emissions target of 95g CO2 / km per new car registration. From 2025 this target has been further tightened to an average of between 68 and 78g CO2 / km. This value should be reached by means of improvements to engine technology and innovative technologies in terms of weight reduction.
Employees
As of December 31, 2017, we had approximately 7,800 full-time employees and 350 contract employees compared to 4,189 full-time employees and 682 contract employees at December 31, 2016. None of our employees in North America are covered by a collective bargaining agreement. Uniwheels’ subsidiary, Uniwheels Production (Germany) GmbH (“UPG”), is a member of the employers’ association for the metal and electronic industry in North Rhine-Westphalia (METALL NRW Verband der Metall und Elektro-Industrie North Rhine-Westphalia e.V.) and is subject to various collective bargaining agreements for the metal and electronic industry in North Rhine-Westphalia entered into by the employers’ association with the trade union IG Metall. These collective bargaining agreements include provisions relating to wages, holidays, and partial retirement. It is estimated that approximately 410 employees of Uniwheels employed at UPG in Germany were unionized
5
Table of Contents
and/or subject to collective bargaining agreements in 2017. UPG and Uniwheels Automotive (Germany) GmbH (operating a joint workers council) operate a statutory workers council and Uniwheels Production (Poland) Sp. z o.o. (“UPP”) operates a voluntary workers council. The increase in employees in 2017 was due to the acquisition of the Uniwheels business in Europe. See Item 7, “Management’s Discussion and Analysis of Financial Conditions and Results of Operations.”
Fiscal Year End
The fiscal year of 2017 consisted of the 53-week period ended December 31, 2017 and the 2016 and 2015 fiscal years consisted of the 52-week periods ended on December 25, 2016 and December 27, 2015, respectively. Historically, our fiscal year ended on the last Sunday of the calendar year. Uniwheels, our European operation acquired on May 30, 2017, is reported on a calendar year end. These fiscal periods align as of December 31, 2017. Beginning in 2018, both our North American and European operations will be on a calendar fiscal year with each month ending on the last day of the calendar month. For convenience of presentation, all fiscal years are referred to as beginning as of January 1, and ending as of December 31, but actually reflect our financial position and results of operations for the periods described above.
Segment Information
As a result of the Uniwheels acquisition, the company expanded into the European market and extended its customer base to include the principal European OEMs. As a consequence, we have realigned our executive management structure, organization and operations to focus on our performance in our North American and European regions. Accordingly, we have concluded that our North American and European businesses represent separate operating segments in view of significantly different markets and customers within each of these regions. Financial information about our operating segments is contained in Note 6, “Business Segments” in the Notes to Consolidated Financial Statements in Item 8, “Financial Statements and Supplementary Data” of this Annual Report.
Seasonal Variations
The automotive industry is cyclical and varies based on the timing of consumer purchases of vehicles, which in turn varies based on a variety of factors such as general economic conditions, availability of consumer credit, interest rates and fuel costs. While there have been no significant seasonal variations in the past few years, production schedules in our industry can vary significantly from quarter to quarter to meet the scheduling demands of our customers. Typically, our aftermarket business experiences two seasonal peaks, which require substantially higher levels of production. The higher demand for aftermarket wheels from our customers occurs in March and September leading into the spring and winter peak consumer selling seasons.
History
We were initially incorporated in Delaware in 1969. Our entry into the OEM aluminum wheel business in 1973 resulted from our successful development of manufacturing technology, quality control and quality assurance techniques that enabled us to satisfy the quality and volume requirements of the OEM market for aluminum wheels. The first aluminum wheel for a domestic OEM customer was a Mustang wheel for Ford Motor Company. We reincorporated in California in 1994, and in 2015, we moved our headquarters from Van Nuys, California to Southfield, Michigan and reincorporated in Delaware. On May 30, 2017, we acquired a majority interest in Uniwheels, which is a European supplier of OEM and aftermarket aluminum wheels. Our stock is traded on the New York Stock Exchange under the symbol “SUP.”
Available Information
Our Annual Report on Form 10-K, quarterly reports on Form 10-Q and any amendments thereto are available, without charge, on or through our website, www.supind.com, under “Investors,” as soon as reasonably
6
Table of Contents
practicable after they are filed electronically with the Securities and Exchange Commission (“SEC”). The public may read and copy any materials filed with the SEC at the SEC’s Public Reference Room at 100 F Street, NE, Washington, DC 20549. Information on the operation of the Public Reference Room can be obtained by calling the SEC at 1-800-SEC-0330. The SEC also maintains a website, www.sec.gov, which contains these reports, proxy and information statements and other information regarding the company. Also included on our website, www.supind.com, under “Investor,” is our Code of Conduct, which, among others, applies to our Chief Executive Officer (“CEO”), Chief Financial Officer and Chief Accounting Officer. Copies of all SEC filings and our Code of Conduct are also available, without charge, upon request from Superior Industries International, Inc., Shareholder Relations, 26600 Telegraph Road, Suite 400, Southfield, Michigan 48033.
The content on any website referred to in this Annual Report on Form 10-K is not incorporated by reference in this Annual Report on Form 10-K.
The following discussion of risk factors contains “forward-looking” statements, which may be important to understanding any statement in this Annual Report or elsewhere. The following information should be read in conjunction with Item 7, “Management’s Discussion and Analysis of Financial Condition and Results of Operations (“MD&A”)” and Item 8, “Financial Statements and Supplementary Data” of this Annual Report.
Our business routinely encounters and addresses risks and uncertainties. Our business, results of operations and financial condition could be materially adversely affected by the factors described below. Discussion about the important operational risks that our business encounters can also be found in the MD&A section and in the business description in Item 1, “Business” of this Annual Report. Below, we have described our present view of the most significant risks and uncertainties we face. Additional risks and uncertainties not presently known to us, or that we currently do not consider significant, could also potentially impair our business, results of operations and financial condition. Our reactions to these risks and uncertainties as well as our competitors’ reactions will affect our future operating results.
Risks Relating to Our Company
Efforts to integrate our Europe segment, including substantial integration expenses and the additional indebtedness incurred to finance our acquisition of Uniwheels, could disrupt our business and adversely impact our stock price and future business and results of operations.
Since the acquisition of Uniwheels (now referred to as our “Europe segment,” “Europe business” or “Europe operations”) on May 30, 2017 (the “Acquisition”), we have made significant strides toward integrating the two companies. However, the continuing integration of our Europe segment with our North America segment will be a complex and time-consuming process that may not be successful. The company has a limited history of integrating a significant acquisition into its business and the integration process may produce unforeseen operating difficulties and expenditures. The primary areas of focus for successfully combining our Europe segment with our North American operations may include, among others: retaining and integrating management and other key employees; realizing overall improvement in the design, engineering, start-up and production of wheel programs; aligning customer interface across the combined business; integrating information, communications and other systems; and managing the growth of the combined company. Our integration efforts could disrupt our business in the following ways, among others, and any of the following could adversely affect our business, harm our financial condition, results of operations or business prospects:
| • | the attention of management may be directed toward the completion of the integration and other transaction-related considerations and may be diverted from the day-to-day business operations of Superior, and matters related to the Acquisition may require commitments of time and resources that could otherwise have been devoted to other opportunities that might have been beneficial to us; |
7
Table of Contents
| • | our employees may experience uncertainty regarding their future roles in the combined company, which might adversely affect our ability to retain, recruit and motivate key personnel; and |
| • | customers, suppliers and other third parties with business relationships with Superior may decide not to renew or may decide to seek to terminate, change and/or renegotiate their relationships with Superior as a result of the Acquisition, whether pursuant to the terms of their existing agreements with Superior or otherwise. |
There are a large number of processes, policies, procedures, operations, technologies and systems that must be integrated with the rest of our operations, including purchasing, accounting and finance, sales, billing, payroll, manufacturing, marketing and employee benefits. While we expect to incur integration and restructuring costs and other transaction-related costs following completion of the Acquisition that currently are estimated to range between $5.0 million and $7.0 million, many of the expenses that will be incurred, especially with respect to manufacturing operations are, by their nature, difficult to estimate accurately. These expenses could, particularly in the near term, exceed the savings that we expect to achieve from elimination of duplicative expenses and the realization of economies of scale and cost savings. Although we expect that the realization of efficiencies related to the integration of the businesses will offset incremental transaction, Acquisition-related and restructuring costs over time, we cannot give any assurance that this net benefit will be achieved in the near term, or at all.
Even if we successfully integrate our Europe segment with our North American operations, there can be no assurance that we will realize the anticipated benefits. The Acquisition is expected to result in various benefits for the combined company including, among others, business growth opportunities and synergies in operations, purchasing and administration. Increased competition and/or deterioration in business conditions may limit our ability to expand this business. As such, we may not be able to realize the synergies, business opportunities and growth prospects anticipated in connection with the Acquisition.
The automotive industry is cyclical and volatility in the automotive industry could adversely affect our financial performance.
The majority of our sales are made in European and domestic U.S. markets. Therefore, our financial performance depends largely on conditions in the European and U.S. automotive industry, which in turn can be affected significantly by broad economic and financial market conditions. Consumer demand for automobiles is subject to considerable volatility as a result of consumer confidence in general economic conditions, levels of employment, prevailing wages, fuel prices and the availability and cost of consumer credit. There can be no guarantee that the improvements in recent years will be sustained or that reductions from current production levels will not occur in future periods. Demand for aluminum wheels can be further affected by other factors, including pricing and performance comparisons to competitive materials such as steel. Finally, the demand for our products is influenced by shifts of market share between vehicle manufacturers and the specific market penetration of individual vehicle platforms being sold by our customers.
A limited number of customers represent a large percentage of our sales. The loss of a significant customer or decrease in demand could adversely affect our operating results.
Ford, GM and Toyota, together, represented 82 percent of our sales in 2016 and just more than half of our total consolidated combined sales in 2017. Despite the decrease in the combined percentage of our three largest customers in 2017, a loss of a significant customer or decrease in demand still remains a risk. Our OEM customers are not required to purchase any minimum amount of products from us. Increasingly global procurement practices, the pace of new vehicle introduction and demand for price reductions may make it more difficult to maintain long-term supply arrangements with our customers, and there are no guarantees that we will be able to negotiate supply arrangements with our customers on terms acceptable to us in the future. The contracts we have entered into with most of our customers provide that we will manufacture wheels for a particular vehicle model, rather than manufacture a specific quantity of products. Such contracts range from one
8
Table of Contents
year to the life of the model (usually three to five years), typically are non-exclusive and do not require the purchase by the customer of any minimum number of wheels from us. Therefore, a significant decrease in consumer demand for certain key models or group of related models sold by any of our major customers, or a decision by a manufacturer not to purchase from us, or to discontinue purchasing from us, for a particular model or group of models, could adversely affect our results of operations and financial condition.
We operate in a highly competitive industry.
The automotive component supply industry is highly competitive, both domestically and internationally. Competition is based on a number of factors, including price, technology, quality, delivery and overall customer service and available capacity to meet customer demands. Some of our competitors are companies, or divisions or subsidiaries of companies, which are larger and have greater financial and other resources than we do. We cannot ensure that our products will be able to compete successfully with the products of these competitors. In particular, our ability to increase manufacturing capacity typically requires significant investments in facilities, equipment and personnel. Our operating facilities are at full or near to full capacity levels which may cause us to incur labor costs at premium rates in order to meet customer requirements, experience increased maintenance expenses or require us to replace our machinery and equipment on an accelerated basis. Furthermore, the nature of the markets in which we compete has attracted new entrants, particularly from low cost countries. As a result, our sales levels and margins continue to be adversely affected by pricing pressures reflective of significant competition from producers located in low-cost foreign markets, such as China. Such competition with lower cost structures poses a significant threat to our ability to compete internationally and domestically. These factors have led to our customers awarding business to foreign competitors in the past, and they may continue to do so in the future. In addition, any of our competitors may foresee the course of market development more accurately, develop products that are superior to our products, have the ability to produce similar products at a lower cost or adapt more quickly to new technologies or evolving customer requirements. Consequently, our products may not be able to compete successfully with competitors’ products.
We experience continual pressure to reduce costs.
The vehicle market is highly competitive at the OEM level, which drives continual cost-cutting initiatives by our customers. Customer concentration, relative supplier fragmentation and product commoditization have translated into continual pressure from OEMs to reduce the price of our products. It is possible that pricing pressures beyond our expectations could intensify as OEMs pursue restructuring and cost-cutting initiatives. If we are unable to generate sufficient production cost savings in the future to offset such price reductions, our gross margin, rate of profitability and cash flows could be adversely affected. In addition, changes in OEMs’ purchasing policies or payment practices could have an adverse effect on our business. Our OEM customers typically attempt to qualify more than one wheel supplier for the programs we participate in and for programs we may bid on in the future. As such, our OEM customers are able to negotiate favorable pricing or may decrease wheel orders. Such actions may result in decreased sales volumes and unit price reductions for our company, resulting in lower revenues, gross profit, operating income and cash flows.
We may be unable to successfully implement cost-saving measures or achieve expected benefits under our plans to improve operations.
As part of our ongoing focus to provide high quality products, we continually analyze our business to further improve our operations and identify cost-cutting measures. We may be unable to successfully identify or implement plans targeting these initiatives, or fail to realize the benefits of the plans we have already implemented, as a result of operational difficulties, a weakening of the economy or other factors. Cost reductions may not fully offset decreases in the prices of our products due to the time required to develop and implement cost reduction initiatives. Additional factors such as inconsistent customer ordering patterns, increasing product complexity and heightened quality standards are making it increasingly more difficult to reduce our costs. It is possible that as we incur costs to implement improvement strategies, the impact on our financial position, results of operations and cash flow may be negative.
9
Table of Contents
Interruption in our production capabilities could result in increased freight costs or contract cancellations.
In the last six months of 2016, we experienced significant operating inefficiencies primarily in one of our manufacturing facilities. The inefficiencies stemmed from a variety of issues that reduced production rates. Contributing factors to the inefficiencies included an electricity outage and unanticipated equipment reliability issues which reduced finished goods and work-in-process inventories. We also experienced several new product launches and significant ramp-up in demand for newer products for which unusually high scrap rates were occurring. Lower than normal production yields coupled with the loss of inventory safety stock resulted in a series of expedited shipments to customers. The higher than normal costs included approximately $13 million in freight expediting costs and additional costs related to the production inefficiencies. In 2017, we were able to reduce the expedited shipping costs to less than $1 million and have made strides toward improving the production inefficiencies at this plant. However, headcount at this plant remained at elevated levels in 2017 to ensure we could meet new product launches, better serve our customers and avoid expedited shipping charges.
An interruption in production capabilities at any of our facilities as a result of equipment failure, interruption of raw materials or other supplies, labor disputes or other reasons could result in our inability to produce our products, which would reduce our sales and operating results for the affected period and harm our customer relationships. We have, from time to time, undertaken significant re-tooling and modernization initiatives at our facilities, which in the past have caused, and in the future may cause, unexpected delays and plant underutilization, and such adverse consequences may continue to occur as we continue to modernize our production facilities. In addition, we generally deliver our products only after receiving the order from the customer and thus typically do not hold large inventories. In the event of a production interruption at any of our manufacturing facilities, even if only temporary, or if we experience delays as a result of events that are beyond our control, delivery times to our customers could be severely affected. Any significant delay in deliveries to our customers could lead to premium freight costs and other performance penalties, as well as contract cancellations, and cause us to lose future sales and expose us to other claims for damages. Our manufacturing facilities are also subject to the risk of catastrophic loss due to unanticipated events such as fires, earthquakes, explosions or violent weather conditions. We have in the past, and may in the future, experience plant shutdowns or periods of reduced production which could have a material adverse effect on our results of operations or financial condition.
Similarly, it also is possible that our customers may experience production delays or disruptions for a variety of reasons, which could include supply-chain disruption for parts other than wheels, equipment breakdowns or other events affecting vehicle assembly rates that impact us, work stoppages or slow-downs at factories where our products are consumed, or even catastrophic events such as fires, disruptive weather conditions or natural disasters. Such disruptions at the customer level may cause the affected customer to halt or limit the purchase of our products.
We may be unable to successfully launch new products and/or achieve technological advances.
In order to effectively compete in the automotive supply industry, we must be able to launch new products and adopt technology to meet our customers’ demands in a timely manner. However, we cannot ensure that we will be able to install and certify the equipment needed for new product programs in time for the start of production, or that the transitioning of our manufacturing facilities and resources under new product programs will not impact production rates or other operational efficiency measures at our facilities. In addition, we cannot ensure that our customers will execute the launch of their new product programs on schedule. We are also subject to the risks generally associated with new product introductions and applications, including lack of market acceptance, delays in product development and failure of products to operate properly. Further, changes in competitive technologies may render certain of our products obsolete or less attractive. Our ability to anticipate changes in technology and to successfully develop and introduce new and enhanced products on a timely basis will be a significant factor in our ability to remain competitive. Our failure to successfully and timely launch new products or adopt new technologies, or a failure by our customers to successfully launch new programs, could adversely affect our results. We cannot ensure that we will be able to achieve the technological advances that may be necessary for us to remain competitive or that certain of our products will not become obsolete.
10
Table of Contents
Our international operations and international trade agreements make us vulnerable to risks associated with doing business in foreign countries that can affect our business, financial condition and results of operations.
We manufacture a substantial portion of our products in Mexico, Germany and Poland and we sell our products internationally. Accordingly, unfavorable changes in foreign cost structures, trade protection laws, tariffs on aluminum, regulations and policies affecting trade and investments and social, political, labor or economic conditions in a specific country or region, among other factors, could have a negative effect on our business and results of operations. Legal and regulatory requirements differ among jurisdictions worldwide. Violations of these laws and regulations could result in fines, criminal sanctions, prohibitions on the conduct of our business and damage to our reputation. Although we have policies, controls and procedures designed to ensure compliance with these laws, our employees, contractors, or agents may violate our policies.
Changes in North American and European Union (EU) social, political, regulatory and economic conditions or in laws and policies governing foreign trade, manufacturing, development and investment in the countries where we currently develop and sell products could adversely affect our business. A significant portion of our business activities are conducted in Mexico. Current leadership in the U.S. federal government is not supportive of certain existing international trade agreements, including the North American Free Trade Agreement (“NAFTA”). If the U.S. withdraws from or materially modifies NAFTA or certain other international trade agreements, our business, financial condition and results of operations could be adversely affected. In addition, proposals to institute a border adjustment of 20 percent for imports could have a negative impact on our operations.
Fluctuations in foreign currencies may adversely impact our financial condition.
Due to the growth of our operations outside of the United States, we have experienced increased exposure to foreign currency gains and losses in the ordinary course of our business. As a result, fluctuations in the exchange rate between the U.S. dollar, the Mexican peso, the Euro, the Polish Zloty and any currencies of other countries in which we conduct our business may have a material impact on our financial condition, as cash flows generated in foreign currencies may be used, in part, to service our U.S. dollar-denominated liabilities, or vice versa.
Fluctuations in foreign currency exchange rates may also affect the value of our foreign assets as reported in U.S. dollars, and may adversely affect reported earnings and, accordingly, the comparability of period-to-period results of operations. Changes in currency exchange rates may affect the relative prices at which we and our foreign competitors sell products in the same market. In addition, changes in the value of the relevant currencies may affect the cost of certain items required in our operations. We cannot ensure that fluctuations in exchange rates will not otherwise have a material adverse effect on our financial condition or results of operations or cause significant fluctuations in quarterly and annual results of operations.
Our business requires us to settle transactions between currencies in both directions - i.e., peso to U.S. dollar, Euro to U.S. Dollar, Euro to Zloty and vice versa for all transactions. To the greatest extent possible, we attempt to match the timing and magnitude of transaction settlements between currencies to create a “natural hedge.” Based on the current business model and levels of production and sales activity, the net imbalance between currencies depends on specific circumstances. While changes in the terms of the contracts with our customers will be creating an imbalance between currencies that we are hedging with foreign currency forward contracts, there can be no assurances that our hedging program will effectively offset the impact of the imbalance between currencies or that the net transaction balance will not change significantly in the future.
To manage this risk, we may enter into foreign currency forward and option contracts with financial institutions to protect against foreign exchange risks associated with certain existing assets and liabilities, certain firmly committed transactions and forecasted future cash flows. We have a program to hedge a portion of our material foreign exchange exposures, typically for up to 42 months. However, we may choose not to hedge certain foreign exchange exposures for a variety of reasons including, but not limited to, accounting considerations and the prohibitive economic cost of hedging particular exposures. There is no guarantee that our hedge program will effectively mitigate our exposures to foreign exchange changes which could have material adverse effects on our cash flows and results of operations.
11
Table of Contents
Our substantial indebtedness could adversely affect our financial condition
We have a significant amount of new indebtedness. As of December 31, 2017, our total debt was $707.9 million ($683.6 million, net of unamortized debt issuance costs of $24.3 million), and we had availability of $157.2 million under the Senior Secured Credit Facilities, as well as 30.0 million Euros under a European revolving line of credit. The interest expense on the significant amount of new indebtedness will be significantly higher than historical interest expense and could adversely affect our financial condition.
Subject to the limits contained in the Credit Agreement governing the Senior Secured Credit Facilities and the indenture governing the Notes (the “Indenture”) and our other debt instruments, we may be able to incur substantial additional debt from time to time to finance working capital, capital expenditures, investments or acquisitions, or for other purposes. If we do so, the risks related to our high level of debt could intensify.
In addition, the Indenture and the Credit Agreement governing the Senior Secured Credit Facilities contain restrictive covenants that will limit our ability to engage in activities that may be in our long-term best interest. Our failure to comply with those covenants could result in an event of default which, if not cured or waived, could result in the acceleration of all our debt.
We may not be able to generate sufficient cash to service all of our indebtedness, including the Notes, and may be forced to take other actions to satisfy our obligations under our indebtedness, which may not be successful.
Our ability to make scheduled payments or to refinance our debt obligations depends on our financial and operating performance, which is subject to prevailing economic, industry and competitive conditions and to certain financial, business, economic and other factors beyond our control. We may not be able to maintain a sufficient level of cash flow from operating activities to permit us to pay the principal, premium, if any, and interest on the Notes and our other indebtedness.
If our cash flows and capital resources are insufficient to fund our debt service obligations, we may be forced to reduce or delay capital expenditures, sell assets, seek additional capital or seek to restructure or refinance our indebtedness, including the Notes. Our ability to restructure or refinance our debt will depend on the condition of the capital and credit markets and our financial condition at such time. Any refinancing of our debt could be at higher interest rates and may require us to comply with more onerous covenants, which could further restrict our business operations and limit our financial flexibility. In addition, any failure to make payments of interest and principal on our outstanding indebtedness on a timely basis would likely result in a reduction of our credit rating, which could harm our ability to incur additional indebtedness. These alternative measures may not be successful and may not permit us to meet our scheduled debt service obligations. In the absence of such cash flows and resources, we could face substantial liquidity problems and might be required to sell material assets or operations to attempt to meet our debt service and other obligations. The Credit Agreement governing the Senior Secured Credit Facilities and the Indenture will restrict our ability to conduct asset sales and/or use the proceeds from asset sales. We may not be able to consummate these asset sales to raise capital or sell assets at prices and on terms that we believe are fair and any proceeds that we do receive may not be adequate to meet any debt service obligations then due. For more information on the Indenture, see Exhibit 4.2 to this Annual Report on Form 10-K. If we cannot meet our debt service obligations, the holders of our debt may accelerate our debt and, to the extent such debt is secured, foreclose on our assets. In such an event, we may not have sufficient assets to repay all of our debt.
The terms of the Credit Agreement governing the Senior Secured Credit Facilities and the Indenture will, and the documents governing other debt that we may incur in the future may, restrict our current and future operations, particularly our ability to respond to changes or to take certain actions.
The Indenture and the Credit Agreement governing the Senior Secured Credit Facilities, and the documents governing other debt that we may incur in the future may, contain a number of restrictive covenants that impose
12
Table of Contents
significant operating and financial restrictions on us and may limit our ability to engage in acts that may be in our long-term best interests, including restrictions on our ability to:
| • | incur additional indebtedness and guarantee indebtedness; |
| • | create or incur liens; |
| • | engage in mergers or consolidations or sell all or substantially all of our assets; |
| • | sell, transfer or otherwise dispose of assets; |
| • | make investments, acquisitions, loans or advances or other restricted payments; |
| • | pay dividends or distributions, repurchase our capital stock or make certain other restricted payments; |
| • | prepay, redeem, or repurchase any subordinated indebtedness; |
| • | designate our subsidiaries as unrestricted subsidiaries; |
| • | enter into agreements which limit the ability of our non-guarantor subsidiaries to pay dividends or make other payments to us; and |
| • | enter into certain transactions with our affiliates. |
In addition, the restrictive covenants in the Credit Agreement governing the Senior Secured Credit Facilities require us to maintain specified financial ratios and satisfy other financial condition tests to the extent subject to certain financial covenant conditions. Our ability to meet those financial ratios and tests can be affected by events beyond our control. We may not meet those ratios and tests.
A breach of the covenants or restrictions under the Indenture governing the Notes or under the Credit Agreement governing the Senior Secured Credit Facilities could result in an event of default under the applicable indebtedness. Such a default may allow the creditors under such facility to accelerate the related debt, which may result in the acceleration of any other debt to which a cross-acceleration or cross-default provision applies. In addition, an event of default under the Credit Agreement governing our Senior Secured Credit Facilities would permit the lenders under our revolving credit facility to terminate all commitments to extend further credit under that facility. Furthermore, if we were unable to repay the amounts due and payable under the Senior Secured Credit Facilities, those lenders could proceed against the collateral granted to them to secure that indebtedness. We have pledged substantially all of our assets as collateral under the Senior Secured Credit Facilities. In the event our lenders or holders of the Notes accelerate the repayment of our borrowings, we may not have sufficient assets to repay that indebtedness or be able to borrow sufficient funds to refinance it. Even if we are able to obtain new financing, it may not be on commercially reasonable terms or on terms acceptable to us. As a result of these restrictions, we may be:
| • | limited in how we conduct our business; |
| • | unable to raise additional debt or equity financing to operate during general economic or business downturns; or |
| • | unable to compete effectively or to take advantage of new business opportunities. These restrictions, along with restrictions that may be contained in agreements evidencing or governing other future indebtedness, may affect our ability to grow or pursue other important initiatives in accordance with our growth. |
Our variable rate indebtedness subjects us to interest rate risk, which could cause our debt service obligations to increase significantly.
Borrowings under our Senior Secured Credit Facilities are at variable rates of interest and expose us to interest rate risk. If interest rates increase, our debt service obligations on the variable rate indebtedness could increase even though the amount borrowed remains the same, and our net income and cash flows, including cash available
13
Table of Contents
for servicing our indebtedness, would correspondingly decrease. As of December 31, 2017, approximately $386.8 million of our debt was variable rate debt. Our anticipated annual interest expense on $386.8 million variable rate debt at the current rate of 6.05 percent would be $23.4 million. In the future, we may enter into interest rate swaps that involve the exchange of floating for fixed rate interest payments in order to reduce interest rate volatility. However, we may not maintain interest rate swaps with respect to all of our variable rate indebtedness, and any swaps we enter into may not fully mitigate our interest rate risk.
We are subject to taxation related risks in multiple jurisdictions.
We are a U.S.-based multinational company subject to tax in multiple U.S. and foreign tax jurisdictions. Significant judgment is required in determining our global provision for income taxes, deferred tax assets or liabilities and in evaluating our tax positions on a worldwide basis. While we believe our tax positions are consistent with the tax laws in the jurisdictions in which we conduct our business, it is possible that these positions may be overturned by jurisdictional tax authorities, which may have a significant impact on our global provision for income taxes. Tax laws are dynamic and subject to change as new laws are passed and new interpretations of the law are issued or applied. We are also subject to ongoing tax audits. These audits can involve complex issues, which may require an extended period of time to resolve and can be highly subjective. Tax authorities may disagree with certain tax reporting positions taken by us and, as a result, assess additional taxes against us. We regularly assess the likely outcomes of these audits in order to determine the appropriateness of our tax provision.
On December 22, 2017, the Tax Cuts and Jobs Act (the “Tax Reform”) was signed into law. The newly enacted Tax Reform, among other things, contains significant changes to corporate taxation, including the reduction of the corporate tax rate from 35 percent to 21 percent, a one-time transition tax on offshore earnings at reduced tax rates regardless of whether earnings are repatriated, the elimination of U.S. tax on foreign dividends (subject to certain important exceptions), new taxes on certain foreign earnings, a new minimum tax related to payments to foreign subsidiaries and affiliates, immediate deductions for certain new investments and the modification or repeal of many business deductions and credits.
The changes effected by the Tax Reform required us to remeasure existing net deferred tax liabilities using the lower rate in the period of enactment. We have reported provisional amounts for the income tax effects of Tax Reform for which the accounting is incomplete but a reasonable estimate could be determined. Based on a continued analysis of the estimates and further guidance on the application of the law, it is anticipated that additional revisions may occur throughout the allowable measurement period.
In addition, governmental tax authorities are increasingly scrutinizing the tax positions of companies. Many countries in the European Union, as well as a number of other countries and organizations such as the Organization for Economic Cooperation and Development, are actively considering changes to existing tax laws that, if enacted, could increase our tax obligations in countries where we do business. The impact of tax reform in the US or other foreign tax law changes could result in an overall tax rate increase to our business.
Increases in the costs and restrictions on availability of raw materials could adversely affect our operating margins and cash flow.
Generally, we obtain our raw materials, supplies and energy requirements from various sources. Although we currently maintain alternative sources, our business is subject to the risk of price increases and periodic delays in delivery. Fluctuations in the prices of raw materials may be driven by the supply/demand relationship for that commodity or governmental regulation. In addition, if any of our suppliers seek bankruptcy relief or otherwise cannot continue their business as anticipated, the availability or price of raw materials could be adversely affected.
Although we are able to periodically pass certain aluminum cost increases on to our customers, we may not be able to pass along all changes in aluminum costs, or there may be a delay in passing the aluminum costs onto our
14
Table of Contents
customers. Our customers are not obligated to accept energy or other supply cost increases that we may attempt to pass along to them. This inability to pass on these cost increases to our customers could adversely affect our operating margins and cash flow, possibly resulting in lower operating income and profitability.
Aluminum and alloy pricing may have a material effect on our operating margins and results of operations.
The cost of aluminum is a significant component in the overall cost of a wheel and in our selling prices to OEM customers. The price for aluminum we purchase is adjusted monthly based primarily on changes in certain published market indices, but the timing of such adjustments is based on specific customer agreements and can vary from monthly to quarterly. As a result, the timing of aluminum price adjustments flowing through sales rarely will match the timing of such changes in cost and can result in fluctuations to our gross profit. This is especially true during periods of frequent increases or decreases in the market price of aluminum.
The aluminum we use to manufacture wheels also contains additional alloy materials, including silicon. The cost of alloying materials also is a component of the overall cost of a wheel. The price of the alloys we purchase is also based on certain published market indices; however, most of our customer agreements do not provide price adjustments for changes in market prices of alloying materials. Increases or decreases in the market prices of these alloying materials could have a material effect on our operating margins and results of operations.
There is a risk of discontinuation of anti-dumping duty from China which may increase the competitive pressure from Chinese producers, primarily in the aftermarket.
In 2010, the European Commission imposed provisional anti-dumping duties of 22.3 percent on imports of aluminum road wheels from China after a complaint of unfair competition from European manufacturers. The European Commission argued that the EU manufacturers had suffered a significant decrease in production and sales, and a loss of market share, as well as price depression due to cheaper imports from China. On January 23, 2017, the European Commission decided to maintain the anti-dumping duties (Commission Implementing Regulation (EU) 2017/109) for another five year period. The anti-dumping duties protect the EU producers until January 24, 2022. After this date, the competitive pressures from Chinese producers, which have cost advantages, primarily in the aftermarket, may adversely affect the company’s assets, financial condition and results of operations or prospects.
We are subject to various environmental laws.
We incur costs to comply with applicable environmental, health and safety laws and regulations in the ordinary course of our business. We cannot ensure that we have been or will be at all times in complete compliance with such laws and regulations. Failure to be in compliance with such laws and regulations could result in material fines or sanctions. Additionally, changes to such laws or regulations may have a significant impact on our cash flows, financial condition and results of operations.
We are also subject to various foreign, federal, state and local environmental laws, ordinances and regulations, including those governing discharges into the air and water, the storage, handling and disposal of solid and hazardous wastes, the remediation of soil and groundwater contaminated by hazardous substances or wastes and the health and safety of our employees. The nature of our current and former operations and the history of industrial uses at some of our facilities expose us to the risk of liabilities or claims with respect to environmental and worker health and safety matters which could have a material adverse effect on our financial health. In addition, some of our properties are subject to indemnification and/or cleanup obligations of third parties with respect to environmental matters. However, in the event of the insolvency or bankruptcy of such third parties, we could be required to bear the liabilities that would otherwise be the responsibility of such third parties.
Further, changes in legislation or regulation imposing reporting obligations on, or limiting emissions of greenhouse gases from, or otherwise impacting or limiting our equipment and operations or from the vehicles that use our products could adversely affect demand for those vehicles or require us to incur costs to become compliant with such regulations.
15
Table of Contents
We are from time to time subject to litigation, which could adversely impact our financial condition or results of operations.
The nature of our business exposes us to litigation in the ordinary course of our business. We are exposed to potential product liability and warranty risks that are inherent in the design, manufacture and sale of automotive products, the failure of which could result in property damage, personal injury or death. Accordingly, individual or class action suits alleging product liability or warranty claims could result. Although we currently maintain what we believe to be suitable and adequate product liability insurance in excess of our self-insured amounts, we cannot assure you that we will be able to maintain such insurance on acceptable terms or that such insurance will provide adequate protection against potential liabilities. In addition, if any of our products prove to be defective, we may be required to participate in a recall. A successful claim brought against us in excess of available insurance coverage, if any, or a requirement to participate in any product recall, could have a material adverse effect on our results of operations or financial condition. We cannot give assurance that any current or future claims will not adversely affect our cash flows, financial condition or results of operations.
Our business involves extensive product development activities leading to the creation of new products. In the case of new products, there is a risk that wheels under development may not be ready by the start of production (“SOP”) and/or may fail to meet the customer’s specifications. In any such case, warranty or compensation claims might be raised, or litigation might be commenced, against the company. Moreover, the company could lose its reputation of an entrepreneur actively developing new and innovative solutions, which in turn could affect the volume of orders, particularly orders for new designs.
Moreover, there are risks related to civil liability under supply contracts (civil liability clauses in contracts with customers, contractual risks related to civil liability for causing delay in production launch, etc.). If we fail to ensure production launch as and when required by the customer, thus jeopardizing production processes at the customer’s facilities, this could lead to increased costs, giving rise to recourse claims against, or causing loss of orders by the company. This could also have an adverse effect on our assets, financial condition, results of operations or prospects.
We may be unable to attract and retain key personnel.
Our success depends, in part, on our ability to attract, hire, train and retain qualified managerial, engineering, sales and marketing personnel. We face significant competition for these types of employees in our industry. We may be unsuccessful in attracting and retaining the personnel we require to conduct our operations successfully. In addition, key personnel may leave us and compete against us. Our success also depends to a significant extent on the continued service of our senior management team. We may be unsuccessful in replacing key managers who either resign or retire. The loss of any member of our senior management team or other experienced senior employees could impair our ability to execute our business plans and strategic initiatives, cause us to lose customers and experience reduced net sales, or lead to employee morale problems and/or the loss of other key employees. In any such event, our financial condition, results of operations, internal control over financial reporting or cash flows could be adversely affected.
Furthermore, in order to remain competitive and retain our Europe segment employees, the company may be forced to increase its labor costs at a faster pace than it historically has done. Labor costs represent a considerable part of the cost of our Europe segment’s products. Though the workforce currently costs less in Poland than in other EU member states, the difference should decrease over time as the Polish economy is catching up with the average of the EU.
If the company fails to attract an adequate number of qualified employees and to retain such employees at salaries prevailing in the industry and increase labor efficiency and effectiveness (particularly with respect to our Europe segment’s manufacturing and production in Poland and Germany), this may have a material adverse effect on the company’s assets, financial condition, results of operations or prospects.
16
Table of Contents
We may be unable to maintain effective internal control over financial reporting.
Management is responsible for establishing and maintaining adequate internal control over financial reporting. Many of our key controls rely on maintaining personnel with an appropriate level of accounting knowledge, experience and training in the application of U.S. GAAP in order to operate effectively. Material weaknesses or deficiencies may cause our financial statements to contain material misstatements, unintentional errors or omissions and late filings with regulatory agencies may occur. As part of the integration, we will be aligning the control framework in 2018 to ensure our Europe segment has adequate internal control over financial reporting, as such term is defined in Exchange Act Rule 13a-15(f). If the Europe segment is unable to implement the control framework in 2018, we will not have adequate control over financial reporting for the consolidated company.
A disruption in our information technology systems, including a disruption related to cybersecurity, could adversely affect our financial performance.
We rely on the accuracy, capacity and security of our information technology systems. Despite the security measures that we have implemented, including those measures related to cybersecurity, our systems, as well as those of our customers, suppliers and other service providers could be breached or damaged by computer viruses, malware, phishing attacks, denial-of-service attacks, natural or man-made incidents or disasters or unauthorized physical or electronic access. These types of incidents have become more prevalent and pervasive across industries, including in our industry, and are expected to continue in the future. A breach could result in business disruption, theft of our intellectual property, trade secrets or customer information and unauthorized access to personnel information. Although cybersecurity and the continued development and enhancement of our controls, processes and practices designed to protect our information technology systems from attack, damage or unauthorized access are a high priority for us, our activities and investment may not be deployed quickly enough or successfully protect our systems against all vulnerabilities, including technologies developed to bypass our security measures. In addition, outside parties may attempt to fraudulently induce employees or customers to disclose access credentials or other sensitive information in order to gain access to our secure systems and networks. There are no assurances that our actions and investments to improve the maturity of our systems, processes and risk management framework or remediate vulnerabilities will be sufficient or completed quickly enough to prevent or limit the impact of any cyber intrusion. Moreover, because the techniques used to gain access to or sabotage systems often are not recognized until launched against a target, we may be unable to anticipate the methods necessary to defend against these types of attacks and we cannot predict the extent, frequency or impact these problems may have on us. To the extent that our business is interrupted or data is lost, destroyed or inappropriately used or disclosed, such disruptions could adversely affect our competitive position, relationships with our customers, financial condition, operating results and cash flows. In addition, we may be required to incur significant costs to protect against the damage caused by these disruptions or security breaches in the future.
We are also dependent on security measures that some of our third-party customers, suppliers and other service providers take to protect their own systems and infrastructures. Some of these third parties store or have access to certain of our sensitive data, as well as confidential information about their own operations, and as such are subject to their own cybersecurity threats. Any security breach of any of these third-parties’ systems could result in unauthorized access to our information technology systems, cause us to be non-compliant with applicable laws or regulations, subject us to legal claims or proceedings, disrupt our operations, damage our reputation, and cause a loss of confidence in our products and services, any of which could adversely affect our financial performance.
Competitors could copy our products or technologies and we could violate protected intellectual property rights or trade secrets of our competitors or other third parties.
We register business-related intellectual property rights, such as industrial designs and trademarks, hold licenses and other agreements covering the use of intellectual property rights, and have taken steps to ensure that our
17
Table of Contents
trade secrets and technological know-how remain confidential. Nevertheless, there is a risk that third parties would attempt to copy, in full or in part, our products, technologies or industrial designs, or to obtain unauthorized access and use of company secrets, technological know-how or other protected intellectual property rights. Also, other companies could successfully develop technologies, products or industrial designs similar to, and thus potentially compete with, us.
Further, there can be no assurance that we will not unknowingly infringe intellectual property rights of our competitors, such as patents and industrial designs, especially due to the fact that the interpretations of what constitutes protected intellectual property may differ. Similarly, there is a risk that we will illegitimately use intellectual property developed by our employees, which is subject in each case to relevant regulations governing employee-created innovations. If a dispute concerning intellectual property rights arises, in which the relevant court issues an opinion on the disputed intellectual property rights contrary to us, identifying a breach of intellectual property rights, we may be required to pay substantial damages or to stop the use of such intellectual property. In addition, we are exposed to the risk of injunctions being imposed to prevent further infringement, leading to a decrease in the number of orders.
All these events could have a material adverse effect on our assets, financial condition, results of operations or prospects.
We may be unable to successfully achieve expected benefits from our joint ventures or acquisitions.
As we continue to expand globally, we have engaged, and may continue to engage, in joint ventures and we may pursue acquisitions that involve potential risks, including failure to successfully integrate and realize the expected benefits of such joint ventures or acquisitions. Integrating acquired operations is a significant challenge, and there is no assurance that we will be able to manage the integrations successfully. Failure to successfully integrate operations or to realize the expected benefits of such joint ventures or acquisitions may have an adverse impact on our results of operations and financial condition.
Our financial statements are subject to changes in accounting standards that could adversely impact our profitability or financial position.
Our consolidated financial statements are subject to the application of U.S. GAAP, which are periodically revised and/or expanded. Accordingly, from time to time, we are required to adopt new or revised accounting standards issued by recognized authoritative bodies, including the FASB. Recently, accounting standard setters issued new guidance which further interprets or seeks to revise accounting pronouncements related to revenue recognition and lease accounting as well as to issue new standards expanding disclosures. The impact of accounting pronouncements that have been issued but not yet implemented is disclosed in our annual and quarterly reports on Form 10-K and Form 10-Q. An assessment of proposed standards is not provided, as such proposals are subject to change through the exposure process and, therefore, their effects on our consolidated financial statements cannot be meaningfully assessed. It is possible that future accounting standards we are required to adopt could change the current accounting treatment that we apply to our consolidated financial statements and that such changes could have a material adverse effect on our reported results of operations and financial position.
We may fail to comply with conditions of the state tax incentive programs in Poland.
We have three production plants in a special Poland economic zone, Tanobrzeska Specjalna Strefa Ekonomiczna Euro-Park Wislosan in Stalowa Wola, Poland. Our Polish operations were granted seven permits to operate in such special economic zone, which allows us to benefit from Polish state tax incentives. The permits require certain conditions to be met, which include increasing the number of employees, keeping the number of employees at such level and incurring required capital expenditures. In addition, particular permits indicate deadlines for completion of respective stages of investments. For three of the seven permits, conditions have
18
Table of Contents
already been fulfilled. As of December 31, 2017, the tax subsidies are limited to 2017 (for three permits) and 2026 (for four permits). If we do not fulfill the conditions required by the permits, the permits might be withdrawn and we would no longer benefit from state tax incentives, which may impact our assets, financial condition, results of operations or prospects in a material way. Furthermore, under current Polish regulations, special economic zones are scheduled to cease to exist in 2026.
We are currently unable to fully deduct interest charges on German indebtedness.
The interest deduction barrier (Zinsschranke) limits the tax deductibility of interest expenses for a German business. If no exception to the interest deduction barrier applies, the net interest expense (interest expense less interest income) is deductible up to 30 percent of the taxable EBITDA (verrechenbares EBITDA) taxable in Germany in a given financial year. Non-deductible interest expenses can be carried forward. Interest carry-forwards are subject to the same tax cancellation rules as tax loss carry-forwards. Whenever interest expenses are not deductible or if an interest carry-forward is lost, the tax burden in future assessment periods could rise, which might have alone, or in combination, a material adverse effect on our assets, financial condition, results of operation or prospects.
We may be exposed to risks related to existing and future profit and loss transfer agreements executed with German subsidiaries of Uniwheels.
Profit and loss transfer agreements are one of the prerequisites of the taxation of Superior and its German subsidiaries as a German tax group. For tax purposes, a profit and loss transfer agreement must have a contract term for a minimum of five years. In addition, such agreement must be fully executed. If a profit and loss transfer agreement or its actual execution does not meet the prerequisites for the taxation as a German tax group, Superior Industries International AG (SII AG) and each subsidiary are taxed on their own income (and under certain circumstances even with retrospective effect). Additionally, 5 percent of dividends from the subsidiary to SII AG would be regarded as non-deductible expenses at the SII AG level. Furthermore, the compensation of a loss of a subsidiary would be regarded as contribution by SII AG into the subsidiary and thus, would not directly reduce SII AG’s profits. As a consequence, if the profit and loss transfer agreements do not meet the prerequisites of a German tax group, this could have a future material adverse effect on our assets, financial condition, results of operations or prospects.
We may not have the ability to use cash to settle the principal amount of the Notes upon redemption or to repurchase the Notes upon a fundamental change, which could adversely affect our financial condition.
The Notes are redeemable any time on or after June 15, 2020 at a redemption price set forth in the Indenture. In addition, the company may redeem some or all of the Notes prior to June 15, 2020 at a price equal to 100 percent of the principal amount thereof plus a “make-whole” premium and accrued and unpaid interest, if any, to, but not including, the redemption date. Prior to June 15, 2020, the company may redeem up to 40 percent of the aggregate principal amount of the Notes using the proceeds of certain equity offerings at the redemption price set forth in the Indenture. If the company experiences a change of control or sells certain assets, the company may be required to offer to purchase the Notes from holders. If we do not have adequate cash available or cannot obtain additional financing, or our use of cash is restricted by applicable law, regulations or agreements governing our current or future indebtedness, we may not be able to repurchase the Notes when required under the Indenture, which would constitute an event of default under the Indenture. An event of default under the Indenture could also lead to a default under other agreements governing our current and future indebtedness, and if the repayment of such other indebtedness were accelerated, we may not have sufficient funds to repay the indebtedness and repurchase the Notes or make cash payments upon conversion of the Notes.
The terms of the Notes could delay or prevent an attempt to take over our company.
The terms of the Notes require us to repurchase the Notes in the event of a fundamental change. A takeover of our company would constitute a fundamental change. This could have the effect of delaying or preventing a takeover of our company that may otherwise be beneficial to our stockholders.
19
Table of Contents
Purchase of additional shares of Uniwheels could take more time than anticipated and may take more resources and a higher purchase price.
Superior executed a Domination and Profit Loss Transfer Agreement, “DPLTA”, which became effective in January 2018. According to the terms of the DPLTA, Superior AG offered to purchase any further tendered shares for cash consideration of Euro 62.18, or approximately Polish Zloty 264 per share. This cash consideration may be subject to change based on appraisal proceedings that the minority shareholders of Uniwheels have initiated.
ITEM 1B - UNRESOLVED STAFF COMMENTS
None.
Our worldwide headquarters is located in Southfield, Michigan. In our North American operations, we maintain and operate five facilities that manufacture aluminum wheels for the automotive industry and a new facility for finishing wheels. Four of these five facilities are located in Chihuahua, Mexico and one facility is located in Fayetteville, Arkansas. The five manufacturing facilities encompass 2.5 million square feet of manufacturing space. We own all of our manufacturing facilities, and we lease our worldwide headquarters located in Southfield, Michigan and other temporary facilities.
Our European operations include five locations. The European headquarters is situated in Bad Dürkheim, Germany which includes our European management, sales and distribution functions, as well as the logistics center for the aftermarket business. European production operations consist of three production facilities, the largest of which is in Stalowa Wola, Poland which includes three plants. Another plant is situated in Werdohl, Germany, where most development work is performed. Forged wheels are manufactured in Fußgönheim, Germany, near the Bad Dürkheim offices. The newest plant in Poland was put into operation in the beginning of June 2016. Our European production facilities encompass approximately 1.5 million square feet.
In general, our manufacturing facilities, which have been constructed at various times over the past several years, are in good operating condition and are adequate to meet our current production capacity requirements. There are active maintenance programs to keep these facilities in good condition, and we have an active capital spending program to replace equipment as needed to maintain factory reliability and remain technologically competitive on a worldwide basis.
Additionally, reference is made to Note 1, “Summary of Significant Accounting Policies,” Note 9, “Property, Plant and Equipment” and Note 15 “Leases and Related Parties”, in the Notes to the Consolidated Financial Statements in Item 8, “Financial Statements and Supplementary Data” of this Annual Report.
We are party to various legal and environmental proceedings incidental to our business. Certain claims, suits and complaints arising in the ordinary course of business have been filed or are pending against us. Based on facts now known, we believe all such matters are adequately provided for, covered by insurance, are without merit, and/or involve such amounts that would not materially adversely affect our consolidated results of operations, cash flows or financial position. See also under Item 1A, “Risk Factors - We are from time to time subject to litigation, which could adversely impact our financial condition or results of operations” of this Annual Report.
ITEM 4 - MINE SAFETY DISCLOSURES
Not applicable.
20
Table of Contents
ITEM 4A - EXECUTIVE OFFICERS OF THE REGISTRANT
Information regarding executive officers who are also Directors is contained in our 2018 Proxy Statement under the caption “Election of Directors.” Such information is incorporated into Part III, Item 10, “Directors, Executive Officers and Corporate Governance.” With the exception of the CEO, all executive officers are appointed annually by the Board of Directors and serve at the will of the Board of Directors. For a description of the CEO’s employment agreement, see “Employment Agreements” in our 2018 Proxy Statement, which is incorporated herein by reference.
21
Table of Contents
Listed below alphabetically are the name, age, position and business experience of each of our officers, as of the filing date:
| Name |
Age | Position |
Assumed Position | |||
| Scot S. Bowie | 44 | Vice President and Corporate Controller | 2015 | |||
| Corporate Controller, Black Diamond Equipment | 2014 | |||||
| Chief Accounting Officer, Affinia Group Inc. | 2011 | |||||
| Corporate Controller of External Reporting, Affinia Group Inc. | 2008 | |||||
| Joanne M. Finnorn | 53 | Senior Vice President, General Counsel and Corporate Secretary | 2017 | |||
| Vice President and General Counsel of Amerisure Mutual Insurance Company | 2016 | |||||
| General Counsel and Principal of HouseSetter LLC | 2013 | |||||
| Principal of Finnorn Law & Advisory Services | 2012 | |||||
| Vice President, Subscriber Services, OnStar | 2011 | |||||
| Vice President and General Counsel, OnStar | 2004 | |||||
| Parveen Kakar | 51 | Senior Vice President Sales, Marketing and Product Development | 2014 | |||
| Senior Vice President, Corporate Engineering and Product Development | 2008 | |||||
| Vice President, Program Development | 2003 | |||||
| Nadeem Moiz | 47 | Executive Vice President, Chief Financial Officer | 2017 | |||
| Senior Vice President and Chief Financial Officer, Direct ChassisLink Inc. | 2013 | |||||
| Vice President of Finance Strategic Planning and Supply Chain Finance, Graphic Packaging International | 2011 | |||||
| Shawn J. Pallagi | 60 | Senior Vice President and Chief Human Resources Officer | 2016 | |||
| Senior Vice President Chief Human Resource Officer, Remy International | 2014 | |||||
| Vice President, Human Resources, Remy International | 2011 | |||||
| Executive Director, Human Resources, Global Manufacturing and Labor Relations, General Motors | 2006 | |||||
| James F. Sistek | 54 | Senior Vice President, Business Operations and Systems | 2014 | |||
| Chief Executive Officer and Founder, Infologic, Inc. | 2013 | |||||
| Vice President, Shared Services and Chief Information Officer, Visteon Corporation | 2009 | |||||
| Donald J. Stebbins | 60 | President and Chief Executive Officer | 2014 | |||
| Chairman, President and Chief Executive Officer of Visteon Corporation | 2008 | |||||
| Robert M. Tykal | 55 | Senior Vice President, Operations | 2017 | |||
| Vice President, Global Operations, Gilbarco Veeder Root, Fortive Corporation | 2013 | |||||
| President and Chief Executive Officer, DaimlerChrysler AG/MTU Drive Shafts | 2002 | |||||
In addition to the officers of the Company we have two key executives, Dr. Wolfgang Hiller and Dr. Karsten Obenaus, that manage the European operations.
22
Table of Contents
PART II
ITEM 5 - MARKET FOR REGISTRANT’S COMMON EQUITY, RELATED STOCKHOLDER MATTERS AND ISSUER PURCHASES OF EQUITY SECURITIES
Performance Graph
The following graph compares the cumulative total stockholder return from December 31, 2012 through December 31, 2017, for our common stock, the Russell 2000 and a peer group(1) of companies that we have selected for purposes of this comparison. We have assumed that dividends have been reinvested, and the returns of each company in the Russell 2000 and the peer group have been weighted to reflect relative stock market capitalization. The graph below assumes that $100 was invested on December 31, 2012, in each of our common stock, the stocks comprising the Russell 2000 and the stocks comprising the peer group.
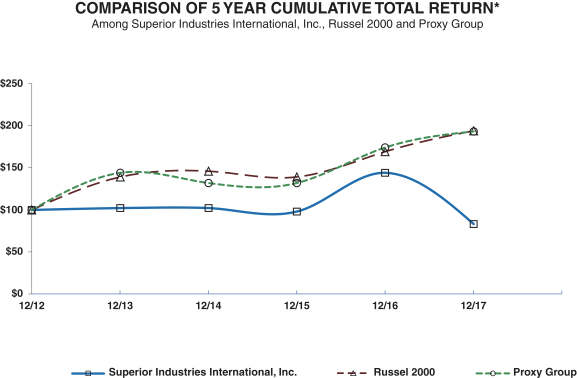
| Superior Industries International, Inc. |
Russel 2000 | Peer Group(1) | ||||||||||
| 2012 |
$ | 100 | $ | 100 | $ | 100 | ||||||
| 2013 |
$ | 102 | $ | 139 | $ | 144 | ||||||
| 2014 |
$ | 102 | $ | 146 | $ | 132 | ||||||
| 2015 |
$ | 98 | $ | 139 | $ | 132 | ||||||
| 2016 |
$ | 144 | $ | 169 | $ | 174 | ||||||
| 2017 |
$ | 83 | $ | 194 | $ | 193 | ||||||
| (1) | We do not believe that there is a single published industry or line of business index that is appropriate for comparing stockholder returns. As a result, we have selected a peer group comprised of companies as disclosed in the 2018 Proxy Statement. |
23
Table of Contents
Dividends
Per share quarterly cash dividends declared totaled $0.45 during 2017 and $0.72 during 2016. Continuation of dividends is contingent upon various factors, including economic and market conditions, none of which can be accurately predicted, and the approval of our Board of Directors.
Holders of Common Stock
As of March 12, 2018, there were approximately 368 holders of record of our common stock.
Quarterly Common Stock Price Information
Our common stock is traded on the New York Stock Exchange under the symbol “SUP”.
The following table sets forth the high and low sales price per share of our common stock during the fiscal periods indicated.
| 2017 | 2016 | |||||||||||||||
| High | Low | High | Low | |||||||||||||
| First Quarter |
$ | 27.40 | $ | 21.90 | $ | 23.43 | $ | 16.35 | ||||||||
| Second Quarter |
$ | 25.90 | $ | 18.58 | $ | 27.90 | $ | 21.53 | ||||||||
| Third Quarter |
$ | 20.95 | $ | 14.00 | $ | 32.12 | $ | 24.76 | ||||||||
| Fourth Quarter |
$ | 17.45 | $ | 13.95 | $ | 30.12 | $ | 22.45 | ||||||||
Purchases of Equity Securities by the Issuer and Affiliated Purchasers
The following table shows our purchases of our common stock during the fourth quarter of 2017:
| Period |
(a) Total Number of Shares Purchased1 |
(b) Average Price Paid Per Share |
(c) Total Number of Shares Purchased as Part of Publicly Announced Programs |
(d) Maximum Dollar Value of Shares That May Yet be Purchased Under Publicly Announced Programs (1) (in thousands) |
||||||||||||
| October 2017 |
— | — | — | 34,600,000 | ||||||||||||
| November 2017 |
— | — | — | 34,600,000 | ||||||||||||
| December 2017 |
— | — | — | 34,600,000 | ||||||||||||
|
|
|
|
|
|
|
|||||||||||
| Total |
— | — | ||||||||||||||
|
|
|
|
|
|||||||||||||
| (1) | In October 2014, our Board of Directors approved a stock repurchase program (the “2014 Repurchase Program”) authorizing the repurchase of up to $30.0 million of our common stock. Under the 2014 Repurchase Program, we repurchased common stock from time to time on the open market or in private transactions, totaling 1,056,954 shares of company stock at a cost of $19.6 million in 2015 and 585,970 shares for $10.3 million in January of 2016, which completed the 2014 Repurchase Program. The repurchased shares described above were either canceled and retired or added to treasury stock after the reincorporation in Delaware in 2015. |
In January of 2016, our Board of Directors approved a new stock repurchase program (the “2016 Repurchase Program”), authorizing the repurchase of up to an additional $50.0 million of common stock. The timing and extent of the repurchases under the 2016 Repurchase Program will depend upon market conditions and other corporate considerations in our sole discretion. Under the 2016 Repurchase Program, we repurchased common stock from time to time on the open market or in private transactions, totaling
24
Table of Contents
454,718 shares of company stock at a cost of $10.4 million in 2016. In the aggregate, we purchased $20.7 million in company stock during 2016 under the 2014 Repurchase Program and 2016 Repurchase Program. During 2017, we purchased an additional 215,841 shares of company stock at a cost of $5.0 million under the 2016 Repurchase Program.
Recent Sales of Unregistered Securities
Except as set forth below, the company has not issued any securities that were not registered under the Securities Act of 1933, as amended (the “Securities Act”) within the past three fiscal years.
On May 22, 2017, we completed the private placement of 140,202 shares of our Series A redeemable preferred stock, par value $0.01 per share, and 9,798 shares of our Series B redeemable preferred stock, par value $0.01 per share (together, the “Preferred Stock”), to TPG Growth III Sidewall, L.P. (the “Investor”) for a purchase price of $150.0 million. On August 30, 2017, our stockholders approved the conversion of the 9,798 shares of Series B redeemable preferred stock into Series A redeemable preferred stock and all shares of Series B redeemable preferred stock were automatically converted. Series A redeemable preferred stock is convertible into shares of Superior common stock equal to the number of shares determined by dividing the sum of the stated value and any accrued and unpaid dividends by the conversion price of $28.162.
The private placement of the Preferred Stock is exempt from the registration requirements of the Securities Act under Section 4(a)(2) and Regulation D thereunder. The Investor has represented to Superior that it is an “accredited investor” as defined by Rule 501 of the Securities Act and that the Preferred Stock is being acquired for investment purposes and not with a view to or for sale in connection with any distribution thereof and appropriate legends will be affixed to any certificates evidencing the shares of Preferred Stock. Additional information regarding this transaction is set forth in Note 13, “Redeemable Preferred Shares” in the Notes to our Consolidated Financial Statements in Item 8.
On June 15, 2017, we issued €250.0 million aggregate principal amount of our 6.00% Senior Notes due June 15, 2025 (the “Notes”) to initial purchasers including J.P. Morgan Securities plc, Citigroup Global Markets Limited, RBC Europe Limited and Deutsche Bank Securities Inc. The offering of the Notes is exempt from the registration requirements of the Securities Act under Rule 144A and Regulation S. The purchasers of the notes have represented to Superior that they are either (1) Qualified Institutional Buyers within the meaning of Rule 144A of the Securities Act or (2) is a qualified investor outside of the United States. Additional information regarding this transaction is set forth in Note 12, “Long-Term Debt” in the Notes to our Consolidated Financial Statements in Item 8.
Securities Authorized for Issue Under Equity Compensation Plans
The information about securities authorized for issuance under Superior’s equity compensation plans is included in Note 18, “Stock-Based Compensation” in the Notes to Consolidated Financial Statements in Item 8 and will also be included in our 2018 Proxy Statement under the caption “Securities Authorized for Issuance under the Equity Compensation Plans.”
ITEM 6 - SELECTED FINANCIAL DATA
The following selected consolidated financial data should be read in conjunction with Item 7, “Management’s Discussion and Analysis of Financial Condition and Results of Operations” and Item 8, “Financial Statements and Supplementary Data” of this Annual Report.
The fiscal year of 2017 consisted of the 53-week period ended December 31, 2017 and the 2016 and 2015 fiscal years consisted of the 52-week periods ended on December 25, 2016 and December 27, 2015, respectively. Historically, our fiscal year ended on the last Sunday of the calendar year. Uniwheels, our European operation
25
Table of Contents
acquired on May 30, 2017, is based on a calendar year end. These fiscal periods align as of December 31, 2017. Beginning in 2018, both our North American and European operations will be on a calendar fiscal year with each month ending on the last day of the month. For convenience of presentation, all fiscal years are referred to as beginning as of January 1, and ending as of December 31, but actually reflect our financial position and results of operations for the periods described above.
| Fiscal Year Ended December 31, |
2017 | 2016 | 2015 | 2014 | 2013 | |||||||||||||||
| Income Statement (000s) |
||||||||||||||||||||
| Net sales |
$ | 1,108,055 | $ | 732,677 | $ | 727,946 | $ | 745,447 | $ | 789,564 | ||||||||||
| Value added sales (1) |
$ | 616,753 | $ | 408,690 | $ | 360,846 | $ | 369,355 | $ | 400,591 | ||||||||||
| Closure and Impairment Costs (2) |
$ | 138 | $ | 1,458 | $ | 7,984 | $ | 8,429 | $ | — | ||||||||||
| Gross profit |
$ | 102,897 | $ | 86,204 | $ | 71,217 | $ | 50,222 | $ | 64,061 | ||||||||||
| Income from operations |
$ | 21,518 | $ | 54,602 | $ | 36,294 | $ | 17,913 | $ | 34,593 | ||||||||||
| Consolidated Income before income taxes and equity earnings |
$ | 866 | $ | 54,721 | $ | 35,283 | $ | 15,702 | $ | 36,841 | ||||||||||
| Income tax benefit (provision) (3) |
$ | (6,875 | ) | $ | (13,340 | ) | $ | (11,339 | ) | $ | (6,899 | ) | $ | (14,017 | ) | |||||
| Net income |
$ | (6,009 | ) | $ | 41,381 | $ | 23,944 | $ | 8,803 | $ | 22,824 | |||||||||
| Adjusted EBITDA (4) |
$ | 140,085 | $ | 88,511 | $ | 76,053 | $ | 55,753 | $ | 63,616 | ||||||||||
| Balance Sheet (000s) |
||||||||||||||||||||
| Current assets |
$ | 417,383 | $ | 254,081 | $ | 245,820 | $ | 276,011 | $ | 384,218 | ||||||||||
| Current liabilities |
$ | 195,059 | $ | 85,964 | $ | 73,862 | $ | 71,962 | $ | 99,430 | ||||||||||
| Working capital |
$ | 222,324 | $ | 168,117 | $ | 171,958 | $ | 204,049 | $ | 284,788 | ||||||||||
| Total assets |
$ | 1,551,252 | $ | 542,756 | $ | 539,929 | $ | 579,910 | $ | 653,388 | ||||||||||
| Long-term debt |
$ | 679,552 | $ | — | $ | — | $ | — | $ | — | ||||||||||
| Shareholders’ equity |
$ | 445,723 | $ | 398,226 | $ | 413,912 | $ | 439,006 | $ | 483,063 | ||||||||||
| Financial Ratios |
||||||||||||||||||||
| Current ratio (5) |
2.1:1 | 3.0:1 | 3.3:1 | 3.8:1 | 3.9:1 | |||||||||||||||
| Return on average shareholders’ equity (6) |
(1.4 | )% | 10.2 | % | 5.6 | % | 1.9 | % | 4.8 | % | ||||||||||
| Share Data |
||||||||||||||||||||
| Net income |
||||||||||||||||||||
| - Basic |
$ | (1.01 | ) | $ | 1.63 | $ | 0.90 | $ | 0.33 | $ | 0.83 | |||||||||
| - Diluted |
$ | (1.01 | ) | $ | 1.62 | $ | 0.90 | $ | 0.33 | $ | 0.83 | |||||||||
| Shareholders’ equity at year-end |
$ | 17.89 | $ | 15.84 | $ | 15.86 | $ | 16.42 | $ | 17.79 | ||||||||||
| Dividends declared |
$ | 0.45 | $ | 0.72 | $ | 0.72 | $ | 0.72 | $ | 0.20 | ||||||||||
| (1) | Value added sales is a key measure that is not calculated according to U.S. GAAP. In the discussion of operating results, we provide information regarding value added sales. Value added sales represents net sales less the value of aluminum and services provided by outside service providers that are included in net sales. As discussed further below, arrangements with our customers allow us to pass on changes in aluminum prices and outside service provider costs; therefore, fluctuations in underlying aluminum prices and the use of outside service providers generally do not directly impact our profitability. Accordingly, value added sales is worthy of being highlighted for the benefit of users of our financial statements. Our intent is to allow users of the financial statements to consider our net sales information both with and without the aluminum and outside service provider cost components thereof. Management uses value added sales as a key metric to determine growth of the company because it eliminates the volatility of aluminum prices. During 2015, we modified the presentation of value added sales to also exclude third-party manufacturing costs passed directly through to customers and retrospectively applied this modification to 2012 through 2014. See the Non-GAAP Financial Measures section of this Annual Report for a reconciliation of value added sales to net sales. |
| (2) | See Note 3, “Restructuring” in the Notes to Consolidated Financial Statements in Item 8, “Financial Statements and Supplementary Data” in this Annual Report for a discussion of restructuring charges. During 2016, we sold the shut-down Rogers facility for total proceeds of $4.3 million, resulting in a $1.4 million gain on sale. Prior to selling the facility, we incurred $1.5 million of further closure costs including carrying costs |
26
Table of Contents
| for the closed facility and $0.3 million in depreciation. During 2015, the shutdown of the Rogers facility resulted in a gross margin loss of $8.0 million. We incurred $4.3 million in restructuring costs related to an impairment of fixed assets and other associated costs such as asset relocation costs. Additionally, we incurred $2.0 million of further closure costs including carrying costs for the closed facility and $1.7 million in depreciation. The Adjusted EBITDA impact of the Rogers facility closure for 2015 was $6.3 million, which includes the $4.3 million of restructuring costs and $2.0 million of carrying costs related to the closed facility. During 2014, we had $8.4 million of restructuring costs related to the closure of the Rogers facility. The carrying costs for the closed facility are not included in the restructuring line in the Consolidated Income Statements of our Consolidated Financial Statements. |
| (3) | See Note 14, “Income Taxes” in the Notes to Consolidated Financial Statements in Item 8, “Financial Statements and Supplementary Data” in this Annual Report for a discussion of material items impacting the 2017, 2016 and 2015 income tax provisions. |
| (4) | Adjusted EBITDA is a key measure that is not calculated according to GAAP. Adjusted EBITDA is defined as earnings before interest income and expense, income taxes, depreciation, amortization, restructuring and other closure costs, impairments of long-lived assets and investments, acquisition costs and integration costs. We use Adjusted EBITDA as an important indicator of the operating performance of our business. We use Adjusted EBITDA in internal forecasts and models when establishing internal operating budgets, supplementing the financial results and forecasts reported to our Board of Directors and evaluating short-term and long-term operating trends in our operations. We believe the Adjusted EBITDA financial measure assists in providing a more complete understanding of our underlying operational measures to manage our business, to evaluate our performance compared to prior periods and the marketplace, and to establish operational goals. We believe that these non-GAAP financial adjustments are useful to investors because they allow investors to evaluate the effectiveness of the methodology and information used by management in our financial and operational decision-making. Adjusted EBITDA is a non-GAAP financial measure and should not be considered in isolation or as a substitute for financial information provided in accordance with GAAP. This non-GAAP financial measure may not be computed in the same manner as similarly titled measures used by other companies. See the Non-GAAP Financial Measures section of this Annual Report for a reconciliation of our Adjusted EBITDA to net income. |
| (5) | The current ratio is current assets divided by current liabilities. |
| (6) | Return on average shareholders’ equity is net income divided by average shareholders’ equity. Average shareholders’ equity is the beginning of the year shareholders’ equity plus the end of year shareholders’ equity divided by two. |
ITEM 7 - MANAGEMENT’S DISCUSSION AND ANALYSIS OF FINANCIAL CONDITION AND RESULTS OF OPERATIONS
The following discussion of our financial condition and results of operations should be read in conjunction with our Consolidated Financial Statements and the Notes to the Consolidated Financial Statements included in Item 8, “Financial Statements and Supplementary Data” in this Annual Report. This discussion contains forward-looking statements, which involve risks and uncertainties. Please refer to the section entitled “Forward Looking Statements” at the beginning of this Annual Report immediately prior to Item 1. Our actual results could differ materially from those anticipated in the forward-looking statements as a result of certain factors, including but not limited to those discussed in Item 1A, “Risk Factors” and elsewhere in this Annual Report.
Executive Overview
We believe we are the #1 North American aluminum wheel manufacturer, the #3 European aluminum wheel manufacturer and the #1 European aluminum wheel aftermarket supplier. Our OEM aluminum wheels accounted for approximately 94 percent of our sales and are primarily sold for factory installation on many vehicle models manufactured by Audi, BMW, FCA, Ford, GM, Jaguar-Land Rover, Mercedes-Benz, Mitsubishi, Nissan, Subaru, Tesla, Toyota, Volkswagen and Volvo. We sell aluminum wheels to the European aftermarket under the brands ATS, RIAL, ALUTEC and ANZIO. North America and Europe represent the principal markets for our products
27
Table of Contents
but we have a global presence and influence with North American, European and Asian OEMs. With the acquisition of our European operations in 2017, we diversified our customer base from predominately North American OEMs (e.g. Ford and G.M.) to a global customer base of OEMs (e.g. Audi, Mercedes-Benz, and Toyota). The following chart demonstrates the shift in diversification of our business from 2016 to 2017.
|
DIVERSIFICATION
|
|
|
|
Historically, the focus of the Company was on providing wheels for relatively high-volume programs with lower degrees of competitive differentiation. In order to improve our strategic position and better serve our customers, we are augmenting our product portfolio with wheels containing higher technical content and greater differentiation. We believe this direction is consistent with current trends in the market and needs of our customers. To achieve this objective, we have invested in the past and continue to invest in new manufacturing capabilities in order to produce more sophisticated finishes and larger diameter products, which typically provide higher value in the market. The acquisition of our European operations and the construction of a new finishing facility align with this strategic mission. We are in the process of constructing a physical vapor deposition PVD finishing facility, which will establish us as the first OEM automotive wheel manufacturer to have this capability in-house. PVD is a wheel coating process that creates bright chrome-like surfaces in an environmentally friendly manner.
As a result of the acquisition of the European operations on May 30, 2017, we have broadened our product portfolio and acquired a significant customer share with European OEMs, including Audi, Jaguar-Land Rover, Mercedes Benz and Volvo. The acquisition is not only complementary in terms of customers, market coverage and product offerings but also very much aligned with our strategic direction with a priority focus on larger diameter wheels, premium finishes, luxury brands and specialty wheels for high performance motorsport racing vehicles, all providing enhanced opportunity for higher margin business. With the acquisition, our global reach encompasses sales to nine of the ten largest OEMs in the world with sales surpassing $1.1 billion. The following charts show sales by major customer. The sales to our top four customers in 2017 represented 59 percent of total sales compared to 88 percent in 2016.
28
Table of Contents
|
SALES BY CUSTOMER
|
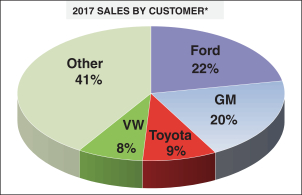
|
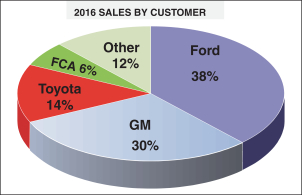
|
Net sales in 2017 increased 51 percent to $1,108.1 million from $733 million in 2016 due to the inclusion of seven months of our European operations. Our North American sales were $732 million and $733 million for 2017 and 2016, respectively. During 2017, we incurred $44.3 million in nonrecurring costs related to the acquisition of Uniwheels and integration of our European business with our North American operations. Excluding the nonrecurring costs, our income from operations improved compared to last year due to the inclusion of the seven months of European operations. We anticipate incurring further integration costs in 2018 to complete the integration of the two companies. The following charts show the impact of the nonrecurring costs on our 2017 operating results.
|
SALES AND PROFITABILITY
|
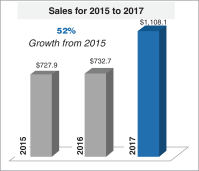
|
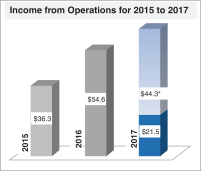
|
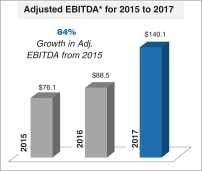
| ||
| * Income from operations in 2017 includes $44.3 million in costs related to acquisition costs and integration costs. |
* See the Non-GAAP Financial Measures section of this annual report for a reconciliation of our Adjusted EBIDA to income from operations. |
Our current year income from operations decreased while our Adjusted EBITDA increased. Income from operations decreased in 2017 to $21.5 million from $54.6 million in 2016 due to $44.3 million of nonrecurring expenses related to the acquisition of Uniwheels and integration of our European business. Our Adjusted EBITDA increased to $140.1 million in 2017 from $88.5 million in 2016. The increase in Adjusted EBITDA was driven by the inclusion of $61.0 million from our new European operations. On a comparable basis the North American Adjusted EBITDA decreased from $88.5 in 2016 to $79.1 million in 2017 due to lower volumes and Mexican operational inefficiencies.
Overall North American production of passenger cars and light-duty trucks in 2017 was reported by industry publications as decreasing by 4.7 percent versus 2016 with production of light-duty trucks, which includes pick-up trucks, SUVs, vans and “crossover vehicles,” increasing 2.1 percent and production of passenger cars decreasing 15.8 percent. While North American production was a solid 17.0 million this year, it did decrease for
29
Table of Contents
the first time since 2009. The decrease in sales is driven by a shift in consumer demand away from passenger cars to crossover vehicles and used vehicles. Superior North America unit sales followed the industry decline with a sales decrease of 6.4 percent in 2017 due to a 21.4 percent decline in passenger cars offset by 1.0 percent increase in light-duty trucks. In 2017, we had decreased sales with our North American OEM customers offset by increased sales with Nissan and other international customers.
Overall European new vehicle production of passenger cars and light-duty trucks in 2017 were reported by industry publications as increasing 0.3 percent versus 2016. This was the fourth consecutive annual increase in European new vehicle registrations. Germany, UK, France, Italy and Spain remained the five largest car markets in Europe for 2017. Germany, France, Italy and Spain new vehicle registrations increased in 2017 while the UK experienced a decrease in the current year. From an OEM perspective, European sales increased in 2017 for Renault, Peugeot, Mercedes and FIAT, partially offset by slight decreases in Volkswagen, Audi, Opel and Ford. Our 2017 European operation sales increased at a rate higher than the industry. Unit sales for the last seven months of 2017 increased by 6.2 percent over the same time period in 2016 due to favorable market conditions.
Results of Operations
| Fiscal Year Ended December 31, |
2017 | 2016 | 2015 | |||||||||
| (Thousands of dollars, except per share amounts) | ||||||||||||
| Net Sales |
||||||||||||
| North America |
$ | 732,418 | $ | 732,677 | $ | 727,946 | ||||||
| Europe |
375,637 | — | — | |||||||||
|
|
|
|
|
|
|
|||||||
| Net sales |
1,108,055 | 732,677 | 727,946 | |||||||||
| Cost of sales |
1,005,158 | 646,473 | 656,729 | |||||||||
|
|
|
|
|
|
|
|||||||
| Gross profit |
102,897 | 86,204 | 71,217 | |||||||||
| Percentage of net sales |
9.3 | % | 11.8 | % | 9.8 | % | ||||||
| Selling, general and administrative |
81,379 | 31,602 | 34,923 | |||||||||
|
|
|
|
|
|
|
|||||||
| Income from operations |
21,518 | 54,602 | 36,294 | |||||||||
| Percentage of net sales |
1.9 | % | 7.5 | % | 5.0 | % | ||||||
| Interest (expense) income, net |
(40,004 | ) | 245 | 103 | ||||||||
| Other income (expense), net |
13,188 | (126 | ) | (1,114 | ) | |||||||
| Change in fair value of redeemable preferred stock embedded derivative |
6,164 | — | — | |||||||||
| Income tax benefit (provision) |
(6,875 | ) | (13,340 | ) | (11,339 | ) | ||||||
|
|
|
|
|
|
|
|||||||
| Consolidated net income |
(6,009 | ) | 41,381 | 23,944 | ||||||||
| Less: net loss attributable to non-controlling interests |
(194 | ) | — | — | ||||||||
|
|
|
|
|
|
|
|||||||
| Net income attributable to Superior |
(6,203 | ) | 41,381 | 23,944 | ||||||||
| Percentage of net sales |
(0.6 | )% | 5.6 | % | 3.3 | % | ||||||
| Diluted (loss) earnings per share |
$ | (1.01 | ) | $ | 1.62 | $ | 0.90 | |||||
| Value added sales (1) |
616,753 | 408,690 | 360,846 | |||||||||
| Adjusted EBITDA (2) |
$ | 140,085 | $ | 88,511 | $ | 76,053 | ||||||
| Percentage of net sales (3) |
12.6 | % | 12.1 | % | 10.4 | % | ||||||
| Percentage of value added sales (4) |
22.7 | % | 21.7 | % | 21.1 | % | ||||||
| Unit shipments in thousands |
17,008 | 12,260 | 11,244 | |||||||||
| (1) | Value added sales is a key measure that is not calculated according to GAAP. In the discussion of operating results, we provide information regarding value added sales. Value added sales represents net sales less the value of aluminum and services provided by outside service providers that are included in net sales. As discussed further below, arrangements with our customers allow us to pass on changes in aluminum prices and outside service provider costs; therefore, fluctuations in underlying aluminum prices and the use of outside service providers generally do not directly impact our profitability. Accordingly, value added sales is worthy |
30
Table of Contents
| of being highlighted for the benefit of users of our financial statements. Our intent is to allow users of the financial statements to consider our net sales information both with and without the aluminum and outside service provider cost components thereof. Management utilizes value added sales as a key metric to determine growth of the company because it eliminates the volatility of aluminum prices. See the Non-GAAP Financial Measures section of this Annual Report for a reconciliation of value added sales to net sales. |
| (2) | Adjusted EBITDA is a key measure that is not calculated according to GAAP. Adjusted EBITDA is defined as earnings before interest income and expense, income taxes, depreciation, amortization, restructuring and other closure costs, impairments of long-lived assets and investments, acquisition costs and integration costs. We use Adjusted EBITDA as an important indicator of the operating performance of our business. We use Adjusted EBITDA in internal financial forecasts and models when establishing internal operating budgets, supplementing the financial results and forecasts reported to our Board of Directors and evaluating short-term and long-term operating trends in our operations. We believe the Adjusted EBITDA financial measure assists in providing a more complete understanding of our underlying operational measures to manage our business, to evaluate our performance compared to prior periods and the marketplace and to establish operational goals. We believe that these non-GAAP financial measures are useful to investors because they allow investors to evaluate the effectiveness of the methodology and information used by management in our financial and operational decision-making. Adjusted EBITDA is a non-GAAP financial measure and should not be considered in isolation or as a substitute for financial information provided in accordance with GAAP. This non-GAAP financial measure may not be computed in the same manner as similarly titled measures used by other companies. See the Non-GAAP Financial Measures section of this Annual Report for a reconciliation of our Adjusted EBITDA to net income. |
| (3) | Adjusted EBITDA: Percentage of net sales is a key measure that is not calculated according to GAAP. Adjusted EBITDA as a percentage of net sales is defined as Adjusted EBITDA divided by net sales. See the Non-GAAP Financial Measures section of this Annual Report for a reconciliation of Adjusted EBITDA. |
| (4) | Adjusted EBITDA: Percentage of value added sales is a key measure that is not calculated according to GAAP. Adjusted EBITDA as a percentage of value added sales is defined as Adjusted EBITDA divided by value added sales. See the Non-GAAP Financial Measures section of this Annual Report for a reconciliation of Adjusted EBITDA and value added sales. |
2017 versus 2016
Net Sales
Net sales for 2017 increased $375.4 million over 2016 due to the inclusion of seven months of sales of our European operations. Overall unit shipments increased in the current year to 17.0 million from 12.3 million, an increase of 38.2 percent, which was driven by the addition of seven months’ unit sales for our newly acquired European operations. Net sales were also favorably impacted by an increase in the value of the aluminum component of sales, which we generally pass through to our customers. The North American average selling price per wheel increased by 6.8 percent during 2017 in comparison to 2016 due mainly to favorable mix with a higher percentage of larger diameter wheels and the increase in aluminum prices.
As a result of the acquisition of Uniwheels in 2017, our major customer mix of shipments became more diversified as shown below:
| Fiscal Year Ended December 31, |
2017 | 2016 | 2015 | |||||||||
| Ford |
22 | % | 36 | % | 42 | % | ||||||
| GM |
20 | % | 29 | % | 25 | % | ||||||
| Toyota |
9 | % | 14 | % | 14 | % | ||||||
| Other international customers |
49 | % | 21 | % | 19 | % | ||||||
|
|
|
|
|
|
|
|||||||
| Total |
100 | % | 100 | % | 100 | % | ||||||
|
|
|
|
|
|
|
|||||||
31
Table of Contents
Cost of Sales
Cost of sales increased significantly in 2017 due to the inclusion of seven months of costs of our newly acquired European operations. In addition, an increase in aluminum costs resulted in higher cost of sales in our North American operations, which is typically passed through to the customer.
Selling, General and Administrative Expenses
Selling, general and administrative expenses also increased significantly in 2017 in comparison to 2016 due to the inclusion of seven months of our European operations and $32.1 million of acquisition and integration expenses related to the acquisition of Uniwheels.
Net Interest Expense
Net interest expense for 2017 was $40.0 million, while the company recognized $0.2 million of net interest income in 2016. Interest expense increased in 2017 due to the new debt issued to finance the acquisition of Uniwheels.
Net Other Income
Net other income was $13.2 million in 2017 compared with net other expense of $0.1 million in 2016. The significant increase was due in part to foreign exchange gains of $12.9 million in 2017 (including an acquisition-related foreign exchange gain of $8.2 million), as compared to foreign exchange losses of $0.4 million in 2016. We also recognized a $0.5 million gain on sale of our minority interest in Synergies Casting Limited, a private aluminum wheel manufacturer based in Visakhapatnam, India
Change in Fair Value of Embedded Derivative Liability
During 2017, we recognized a $6.2 million change in the fair value of our redeemable preferred stock embedded derivative liability. The beginning fair value of the embedded derivative liability was measured as of the date of issuance, May 22, 2017. During the third and fourth quarter, the fair value of the embedded derivative liability decreased, primarily due to the decline in our stock price.
Income Tax Provision
The income tax provision for 2017 was $6.9 million on a pre-tax income of $0.9 million due primarily to the split of jurisdictional pre-tax income or loss, certain non-deductible acquisition costs related to the Uniwheels acquisition, and provisional estimates recorded for the transition tax on offshore earnings and a deferred tax expense. The deferred tax expense resulted from the reduction of our deferred tax assets due to the change in the statutory federal income tax rate from 35% to 21% for years subsequent to 2017, based on the newly enacted U.S. Tax Cuts and Jobs Act (“The Act”). The income tax provision for 2016 was $13.3 million, representing an effective income tax rate of 24.4 percent. The effective tax rate for 2016 was lower than the statutory rate due to earnings in countries with tax rates lower than the U.S. statutory rate.
Net Income Attributable to Superior
Net loss attributable to Superior in 2017 was $6.2 million, or a loss of $1.01 per diluted share, compared to net income in 2016 of $41.4 million, or $1.62 per diluted share. The decrease in 2017 diluted per share was mainly driven by the acquisition costs, integration costs, interest expense, accretion on preferred equity, and the dividends that were issued to the preferred equity holder.
32
Table of Contents
Segment Sales and Income from Operations
| Year Ended December 31, |
|
|||||||||||
| 2017 | 2016 | Change | ||||||||||
| (Dollars in thousands) | ||||||||||||
| Selected data |
||||||||||||
| Net Sales |
||||||||||||
| North America |
$ | 732,418 | $ | 732,677 | $ | (259 | ) | |||||
| Europe |
375,637 | — | 375,637 | |||||||||
|
|
|
|
|
|
|
|||||||
| Total net sales |
$ | 1,108,055 | $ | 732,677 | $ | 375,378 | ||||||
|
|
|
|
|
|
|
|||||||
| Income (loss) from Operations |
||||||||||||
| North America |
$ | 9,808 | $ | 54,602 | $ | (44,794 | ) | |||||
| Europe |
11,710 | — | 11,710 | |||||||||
|
|
|
|
|
|
|
|||||||
| Total income from operations |
$ | 21,518 | $ | 54,602 | $ | (33,084 | ) | |||||
|
|
|
|
|
|
|
|||||||
North America
Due to the acquisition of our European operations on May 30, 2017, we will provide geographical segment analysis for the 2017 and 2016 results of operations discussion and analysis rather than the geographical discussion that was provided in 2016 and 2015. In 2017, net sales of our North America segment remained at a consistent level despite a 6.4 percent decrease in volume due to a 6.8 percent increase in average unit selling price. Unit shipments declined from 12.3 million in 2016 to 11.5 million in 2017 resulting in a $47.0 million reduction in revenue which was fully offset by the increase in average selling price. The decline in volume resulted from lower unit sales with Ford, GM and FCA, partially offset by increased sales at Nissan and Subaru. The increase in average selling price was driven by an increase in the value of the aluminum component of sales, which we generally pass through to our customers, and our value added sales. The split between U.S. and Mexico sales were approximately 17.0 percent and 83.0 percent, respectively during 2017, which compares to 16.4 percent and 83.6 percent for 2016.
The North America segment income from operations decreased in 2017 due to nonrecurring costs and production inefficiencies. During 2017, the company incurred $29.5 million of additional costs relating to the acquisition and integration of the European operations. We continued to invest in our machinery through higher levels of maintenance than in past years to alleviate the production issues that we have experienced since the second quarter of 2016.
Europe
We acquired the Uniwheels business on May 30, 2017, which comprises our European operations. As a result, we have included seven months of our European operations in our consolidated statement of operations for 2017. The European operations sales increased over the same seven-month period last year by 18.6 percent. Income from operations for this period included purchase accounting adjustments of $14.8 million related to inventory, and other expenses related to the acquisition and integration of the business.
2016 versus 2015
Net Sales
Net sales in 2016 increased $4.8 million to $732.7 million from $727.9 million in 2015. Wheel shipments increased by 9 percent in 2016 compared to 2015 resulting in $60.8 million higher sales compared to 2015. Net sales were unfavorably impacted by a decline in the value of the aluminum component of sales which we
33
Table of Contents
generally pass through to our customers and resulted in $61.5 million lower revenues. The average selling price of our wheels decreased 8 percent due to the unfavorable impact of the decline in aluminum value. Increases in unit shipments to GM, Nissan, Toyota and Subaru were partially offset by decreases in unit shipments to Ford and FCA. Wheel program development revenues totaled $10.0 million in 2016 and $6.9 million in 2015.
U.S. Operations
Net sales of our U.S. plants in 2016 decreased 32 percent, to $120.4 million from $177.2 million in 2015, reflecting a decrease in unit shipments and a decrease in the average selling price of our wheels. Unit shipments from our U.S. plants decreased 28 percent in 2016, primarily reflecting the reallocation of production volume to our plants in Mexico. The decline in volume resulted in $50.5 million lower sales. The average selling price of our wheels decreased 7 percent primarily due to the decline in the value of the aluminum component coupled with the mix of wheel sizes and finishes sold. The lower aluminum value decreased revenues by approximately $9.4 million when compared to 2015.
Mexico Operations
Net sales of our Mexico plants in 2016 increased 11 percent, to $612.3 million from $550.7 million in 2015, reflecting a 20 percent increase in unit shipments offset partially by an 8 percent decrease in the average selling prices of our wheels. The unit shipment volume increase in 2016 resulted in $111.3 million higher sales. The 8 percent decrease in the average selling price of our wheels was primarily a result of the lower pass-through price of aluminum partially offset by a favorable mix of wheel sizes and finishes sold. The lower aluminum value decreased revenues by approximately $52.1 million when compared to 2015.
Our major customer mix, based on unit shipments, is shown below:
| Fiscal Year Ended December 31, |
2016 | 2015 | 2014 | |||||||||
| Ford |
36 | % | 42 | % | 42 | % | ||||||
| GM |
29 | % | 25 | % | 24 | % | ||||||
| Toyota |
14 | % | 14 | % | 12 | % | ||||||
| FCA |
6 | % | 8 | % | 10 | % | ||||||
| Other international customers |
15 | % | 11 | % | 12 | % | ||||||
|
|
|
|
|
|
|
|||||||
| Total |
100 | % | 100 | % | 100 | % | ||||||
|
|
|
|
|
|
|
|||||||
According to Ward’s Auto Info Bank, overall North American production of passenger cars and light-duty trucks in 2016 increased approximately 3 percent, while production of the specific passenger car and light-duty truck programs using our wheels increased 1 percent. In contrast to the overall market, our total shipments increased by 9 percent, resulting in our share of the North American aluminum wheel market increasing by 1 percentage point on a year-over-year basis. The increase in market share was 4 percentage points in passenger car programs, offset by a 3 percentage point decline in light-duty trucks.
Cost of Sales
In 2016, our consolidated cost of goods sold decreased $10.2 million to $646.5 million, or 88 percent of net sales, compared to $656.7 million, or 90 percent of net sales, in 2015. Cost of sales in 2016 primarily reflects a decline in aluminum prices of approximately $53.8 million, which we generally pass through to our customers, offset by an increase in freight, maintenance and supply costs. Freight costs increased $16.4 million to $20.4 million in 2016, compared to $4.0 million in 2015 due mainly to expedited shipments of approximately $13 million to customers arising from the operating inefficiencies discussed in the executive overview section. Repair and maintenance costs increased $4.3 million and supply costs increased $3.4 million in 2016 when compared to 2015. Cost of sales associated with corporate services such as engineering support for wheel program development and manufacturing support increased $2.4 million in 2016 when compared to 2015 primarily due to pre-production charges incurred on new product platforms and increased compensation costs.
34
Table of Contents
U.S. Operations
Cost of sales for our U.S. operations decreased in 2016 by $61.6 million, or 30 percent when compared to 2015. The 2016 decline in cost of sales for our U.S. plant primarily reflects the effect of reallocating production volume to our Mexico facilities which resulted in a 28 percent decline in unit shipments and the reduction of labor and aluminum costs by $6.1 million and $10.9 million, respectively, when compared to 2015. Lower aluminum prices also contributed to the decline.
Mexico Operations
Cost of sales for our Mexico operations increased by $51.4 million in 2016 when compared to 2015, which is mainly driven by a 20 percent increase in wheel shipments. During 2016, plant labor and benefit costs, including overtime premiums, increased approximately $4.6 million, primarily as a result of higher average headcount and wage increases. Direct material and contract labor costs increased approximately $1.9 million from 2015 primarily due to the 20 percent rise in unit shipments. The increase in direct material costs was more than offset by a decrease of approximately $42.9 million of aluminum purchase costs which we generally pass through to our customers. Depreciation increased $0.8 million in 2016 compared to 2015. Supply and small tool costs increased $4.5 million and plant repair and maintenance expenses increased $4.9 million in 2016 compared to 2015.
Gross Profit
Consolidated gross profit increased $15.0 million to $86.2 million, or 12 percent of net sales, compared to $71.2 million, or 10 percent of net sales, last year. The increase in gross profit primarily reflects the favorable impact of the 9 percent increase in unit shipments and cost reduction resulting from the shift in manufacturing from our U.S. facility to facilities in Mexico. Partially offsetting the increase in gross profit were operating inefficiencies incurred in one of our manufacturing facilities in the last six months of 2016.
Selling, General and Administrative Expenses
Selling, general and administrative expenses were $31.6 million, or 4 percent of net sales, in 2016 compared to $34.9 million, or 5 percent of net sales, in 2015. The 2016 decrease is primarily attributable to a $1.4 million gain on sale of the Rogers facility in the last quarter of 2016, a $1.0 million reduction of severance costs and a $1.4 million decline in compensation and employee benefit costs.
Income from Operations
Consolidated income from operations increased $18.3 million in 2016 to $54.6 million, or 7 percent of net sales, from $36.3 million, or 5 percent of net sales, in 2015.
Consolidated income from operations in 2016 was favorably impacted by a 9 percent increase in unit shipments, which was partially offset by operating inefficiencies incurred in one of our manufacturing facilities as more fully explained in the cost of sales discussion above.
U.S. Operations
Operating income from our U.S. operations for 2016 increased by $5.5 million compared to 2015. Operating income increased in 2016 as improved cost performance offset the impact of a 28 percent decrease in unit shipments. The overall cost improvement resulted from improved productivity, as well as lower supply and repair and maintenance costs. However, the lower production levels had an unfavorable impact on operating income due to lower absorption of fixed overhead costs in 2016 when compared to 2015.
35
Table of Contents
Mexico Operations
Operating income from our Mexico operations increased by $12.8 million in 2016 compared to 2015 and reflects a $12.5 million increase in gross profit in 2016. The increase in gross profit primarily reflects a 20 percent increase in unit shipments and a favorable mix of wheel sizes and finishes sold, when compared to 2015.
U.S. versus Mexico Production
During 2016, wheels produced by our Mexico and U.S. operations accounted for 86 percent and 14 percent, respectively, of our total production. During 2015, wheels produced by our Mexico and U.S. operations accounted for 78 percent and 22 percent, respectively, of our total production.
Interest Income, net and Other Income (Expense), net
Net interest income was $0.2 million and $0.1 million in 2016 and 2015, respectively due to the increase in the average cash balance which was mainly related to the increase in operating income.
Net other income (expense) was expense of $0.1 million and $1.1 million in 2016 and 2015, respectively.
Also included in other income (expense) net are foreign exchange losses of $0.4 million and $1.2 million in 2016 and 2015, respectively.
Effective Income Tax Rate
Our income before income taxes was $54.7 million in 2016 and $35.3 million in 2015. The effective tax rate on the 2016 pretax income was 24.4 percent compared to 32.1 percent in 2015.
The 2016 effective income tax rate was 24.4 percent. The effective tax rate was lower than the U.S. federal statutory rate primarily as a result of income in jurisdictions where the statutory rate is lower than the U.S. rate and tax benefits due to the release of tax liabilities related to uncertain tax positions as a result of settlements with various tax jurisdictions.
Our effective income tax rate for 2015 was 32.1 percent. The effective tax rate was lower than the U.S. federal statutory rate primarily as a result of net decreases in the liability for uncertain tax positions partially offset by the reversal of deferred tax assets related to stock based compensation.
Net Income
Net income in 2016 was $41.4 million, or 6 percent of net sales compared to $23.9 million, or 3 percent of net sales in 2015. Earnings per share were $1.62 and $0.90 per diluted share in 2016 and 2015, respectively.
Liquidity and Capital Resources
Our sources of liquidity primarily include cash, cash equivalents and short-term investments, net cash provided by operating activities, our senior notes and borrowings under available debt facilities and, from time to time, other external sources of funds. Working capital (current assets minus current liabilities) and our current ratio (current assets divided by current liabilities) were $222.3 million and 2.1:1, respectively, at December 31, 2017, versus $168.1 million and 3.0:1 at December 31, 2016. As of December 31, 2017, our cash, cash equivalents and short-term investments totaled $47.1 million compared to $58.5 million at December 31, 2016. The 2017 increase in working capital resulted primarily from the acquisition of Uniwheels.
Our working capital requirements, investing activities and cash dividend payments historically have been funded from internally generated funds, or existing cash, cash equivalents and short-term investments, and we believe these sources will continue to meet our capital requirements in the foreseeable future. Our working capital decreased in 2017, primarily due to an increase in accounts payable related to timing of payments.
36
Table of Contents
In connection with the acquisition of Uniwheels, we entered into several debt and equity financing arrangements during 2017. On March 22, 2017, we entered into a senior secured credit agreement (the “Credit Agreement”) with Citibank, N.A, JP Morgan Chase N.A., Royal Bank of Canada and Deutsche Bank A.G. New York Branch (collectively, the “Lenders”). The Credit Agreement consists of a $400.0 million senior secured term loan facility (the “Term Loan Facility”) and a $160.0 million revolving credit facility. On May 22, 2017, we issued 140,202 shares of Series A redeemable preferred stock and 9,798 shares of Series B redeemable preferred stock to TPG Superior and TPG Growth III Sidewall, L.P. (“TPG”) for an aggregate purchase price of $150.0 million. On June 15, 2017, we issued €250.0 million aggregate principal amount of 6.00% Senior Notes (the “Notes”) due June 15, 2025. In addition, as a part of the Uniwheels acquisition, we assumed $70.7 million of outstanding debt. At December 31, 2017, balances outstanding under the Term Loan Facility, Notes and an equipment loan were $386.8 million, $300.3 million and $20.8 million, respectively. Unused commitments under the revolving credit facility were $157.2 million and there was 30.0 million Euro available under a Uniwheels line of credit as of December 31, 2017.
As part of our commitment to enhancing shareholder value, we have engaged in repurchases of our common stock from time to time. In October 2014, our Board of Directors approved the 2014 Repurchase Program, authorizing the repurchase of up to $30.0 million of our common stock. The 2014 Repurchase Program was completed in January 2016, with purchases from October 2014 to January 2016 of 1,642,924 shares for a cost of $30.0 million. In January 2016, the Board of Directors authorized the repurchase of up to $50.0 million of common stock under the 2016 Repurchase Program. Under the 2016 Repurchase Program, we may repurchase common stock from time to time on the open market or in private transactions. During 2016, we repurchased 454,718 shares of company stock at a cost of $10.4 million under the 2016 Repurchase Program. During 2017, we purchased an additional 215,841 shares of company stock at a cost of $5.0 million under the 2016 Repurchase Program. The timing and extent of the repurchases under the 2016 Repurchase Program will depend upon market conditions and other corporate considerations in our sole discretion.
The following table summarizes the cash flows from operating, investing and financing activities as reflected in the consolidated statements of cash flows.
| Fiscal Year Ended December 31, |
2017 | 2016 | 2015 | |||||||||
| (Thousands of dollars) | ||||||||||||
| Net cash provided by operating activities |
$ | 63,710 | $ | 78,491 | $ | 59,349 | ||||||
| Net cash used in investing activities |
(777,614 | ) | (35,038 | ) | (34,946 | ) | ||||||
| Net cash used in financing activities |
701,107 | (37,327 | ) | (31,348 | ) | |||||||
| Effect of exchange rate changes on cash |
1,371 | (376 | ) | (3,470 | ) | |||||||
|
|
|
|
|
|
|
|||||||
| Net (decrease) increase in cash and cash equivalents |
$ | (11,426 | ) | $ | 5,750 | $ | (10,415 | ) | ||||
|
|
|
|
|
|
|
|||||||
2017 versus 2016
Operating Activities
Net cash provided by operating activities was $63.7 million in 2017, compared to net cash provided by operating activities of $78.5 million for 2016. The decrease in cash flow provided by operating activities was mainly due to lower net income primarily due to the acquisition of Uniwheels and integration related fees, and an increase in inventory partially offset by increases in trade payables.
Investing Activities
Net cash used in investing activities was $777.6 million in 2017 compared to $35.0 million in 2016. Net cash used in investing activities was higher in 2017 primarily due to the Uniwheels acquisition.
37
Table of Contents
Financing Activities
Net cash provided by financing activities was $701.1 million in 2017 compared to net cash used in financing activities of $37.3 million in 2017. Net cash provided by financing activities was higher in 2017 due to debt issued to finance the Uniwheels acquisition.
2016 versus 2015
Our liquidity remained strong in 2016. Working capital (current assets minus current liabilities) and our current ratio (current assets divided by current liabilities) were $168.1 million and 3.0:1, respectively, at December 31, 2016, versus $172.0 million and 3.3:1 at December 31, 2015. The 2016 decrease in working capital resulted primarily from an increase in accounts payable related to timing of payments which was partially offset by an increase in inventory. We generate our principal working capital resources primarily through operations. The increase in cash from working capital in 2016 primarily reflects a significant increase in net income and an increase in accounts payable offset by increased inventories. Assuming continuation of our historically strong liquidity, which includes funds available under our revolving credit facility, we believe we are well positioned to take advantage of new and complementary business opportunities, and to fund our working capital and capital expenditure requirements for the foreseeable future.
Operating Activities
Net cash provided by operating activities increased $19.1 million to $78.5 million for 2016, compared to net cash provided by operating activities of $59.3 million for 2015. The increase in operating activities relates primarily to the $17.4 million increase in net income. Additional sources of cash flow related to a $15.9 million increase in accounts payable and an $8.0 million decrease in accounts receivable. Offsetting amounts were cash flow uses of $22.3 million increase in inventories and a $4.7 million decrease in income tax payable.
Investing Activities
Our principal investing activities during 2016 were the funding of $39.6 million of capital expenditures and $4.3 million proceeds from the sale of the Rogers facility. Principal investing activities during 2015 included the funding of $39.5 million of capital expenditures and the purchase of $1.0 million of certificates of deposit, partially offset by the receipt of $3.8 million cash proceeds from maturing certificates of deposit and $1.9 million proceeds from sales of fixed assets.
Financing Activities
Our principal financing activities during 2016 consisted of the repurchase of our common stock for cash totaling $20.7 million and payment of cash dividends on our common stock totaling $18.3 million, partially offset by the receipt of cash proceeds from the exercise of stock options totaling $1.6 million. Financing activities during 2015 consisted of the repurchase of our common stock for cash totaling $19.6 million and payment of cash dividends on our common stock totaling $19.1 million, partially offset by the receipt of cash proceeds from the exercise of stock options totaling $7.3 million.
Risk Management
We are subject to various risks and uncertainties in the ordinary course of business due, in part, to the competitive global nature of the industry in which we operate, to changing commodity prices for the materials used in the manufacture of our products, and to development of new products.
We have operations in Mexico with sale and purchase transactions denominated in both Pesos and dollars. The Peso is the functional currency of certain of our operations in Mexico. The settlement of accounts receivable and
38
Table of Contents
accounts payable transactions denominated in a non-functional currency results in foreign currency transaction gains and losses. In 2017, the value of the Mexican Peso increased by 5.1 percent in relation to the U.S. dollar. We had foreign currency transaction gains in 2017 of $11.0 million and losses in 2016 and 2015 of $0.4 million and $1.2 million, respectively, which are included in other income (expense) in the Consolidated Income Statements in Item 8, “Financial Statements and Supplementary Data” of this Annual Report. In addition to gains on Peso foreign currency transactions, the 2017 gain includes an $8.2 million realized gain on a Zloty forward contract used to hedge the acquisition purchase price and a $2.5 million unrealized loss on a Euro cross currency swap.
Since 1990, the Mexican Peso has experienced periods of relative stability followed by periods of major declines in value. The impact of changes in value of our foreign operations relative to the U.S. dollar has resulted in a cumulative unrealized translation loss at December 31, 2017 of $101.0 million. Translation gains and losses are included in other comprehensive income (loss) in the Consolidated Statements of Shareholders’ Equity in Item 8, “Financial Statements and Supplementary Data” of this Annual Report.
We also have operations in Europe with sale and purchase transactions denominated in Euros and Zlotys. The Euro is the functional currency of our operations in Europe. A significant component of our European production operations is located in Poland. The settlement of accounts receivable and accounts payable for these operations requires the transfer of funds denominated in Zlotys. The value of the Euro has increased 7.2 percent in relation to the U.S. dollar in the seven months following the acquisition of Uniwheels ended December 31, 2017. During that same period the value of the Zloty has remained relatively flat in relation to the Euro. Foreign currency transaction gains totaled $1.9 million in 2017. All transaction gains and losses are included in other income (expense) in the condensed consolidated statements of operations.
As it relates to foreign currency translation gains and losses, the Euro has experienced periods of relative stability in value. The impact of changes in value relative to our European operations resulted in a cumulative unrealized translation gain at December 31, 2017 of $26.2 million. Translation gains and losses are included in other comprehensive income in the condensed consolidated statements of comprehensive income.
Changes in currency exchange rates may affect the relative prices at which we and our foreign competitors sell products in the same market. In addition, changes in the value of the relevant currencies may affect the cost of certain items required in our operations. The vast majority of our European revenues will be denominated in the Euros. Accordingly, the foreign exchange exposure associated with Peso and Zloty denominated costs is a growing risk factor and could have a material adverse effect on our operating results.
We are entering into foreign currency forward and option contracts with financial institutions to protect against foreign exchange risks associated with certain existing assets and liabilities, certain firmly committed transactions and forecasted future cash flows. We have implemented a program to hedge a portion of our material foreign exchange exposures, typically for up to 48 months. However, we may choose not to hedge certain foreign exchange exposures for a variety of reasons, including but not limited to accounting considerations and prohibitive economic cost of hedging particular exposures. We do not use derivative contracts for trading, market-making, or speculative purposes. For additional information on our derivatives, see Notes 5 and 20 of the Notes to the Financial Statements in Item 8, “Financial Statements and Supplementary Data” of this Annual Report.
When market conditions warrant, we may enter into purchase commitments to secure the supply of certain commodities used in the manufacture of our products, such as aluminum, natural gas and other raw materials. We previously had several purchase commitments for the delivery of natural gas through 2015. These natural gas contracts were considered to be derivatives under U.S. GAAP, and when entering into these contracts, it was expected that we would take full delivery of the contracted quantities of natural gas over the normal course of business. Accordingly, at inception, these contracts qualified for the normal purchase, normal sale (“NPNS”) exemption provided for under U.S. GAAP.
39
Table of Contents
Contractual Obligations
Contractual obligations as of December 31, 2017 are as follows (amounts in millions):
| Payments Due by Fiscal Year | ||||||||||||||||||||||||||||
| Contractual Obligations |
2018 | 2019 | 2020 | 2021 | 2022 | Thereafter | Total | |||||||||||||||||||||
| Long-term debt |
$ | 4.0 | $ | 3.2 | $ | 3.2 | $ | 7.2 | $ | 7.2 | $ | 683.1 | $ | 707.9 | ||||||||||||||
| Retirement plans |
1.4 | 1.4 | 1.5 | 1.4 | 1.5 | 43.9 | 51.1 | |||||||||||||||||||||
| Purchase obligations |
13.6 | — | — | — | — | — | 13.6 | |||||||||||||||||||||
| Capital leases |
0.8 | 0.5 | — | — | — | — | 1.3 | |||||||||||||||||||||
| Operating leases |
4.4 | 3.2 | 3.2 | 2.9 | 2.5 | 7.2 | 23.4 | |||||||||||||||||||||
|
|
|
|
|
|
|
|
|
|
|
|
|
|
|
|||||||||||||||
| Total |
$ | 24.2 | $ | 8.3 | $ | 7.9 | $ | 11.5 | $ | 11.2 | $ | 734.2 | $ | 797.3 | ||||||||||||||
|
|
|
|
|
|
|
|
|
|
|
|
|
|
|
|||||||||||||||
The table above does not reflect unrecognized tax benefits and related interest and penalties of $35.5 million, for which the timing of settlement is uncertain, a $16.1 million liability carried on our consolidated balance sheet at December 31, 2017 for derivative financial instruments maturing in 2018 through 2021 nor the redeemable preferred stock embedded derivative liability of $4.7 million. In addition, the table does not include dividend payments nor redemption of the redeemable preferred stock
Off-Balance Sheet Arrangements
As of December 31, 2017, we had no significant off-balance sheet arrangements other than factoring of $13.6 million of our trade receivables in European business.
Inflation
Inflation has not had a material impact on our results of operations or financial condition for the three years ended December 31, 2017. Cost increases in our principal raw material, aluminum, fundamentally are passed through to our customers, with timing of the pass-through dependent on the specific commercial agreements. Wage increases during the current year ranged from approximately 3 percent to 6 percent depending on location and job performance. Cost increases for labor, other raw materials and for energy may not be recovered in our selling prices. Additionally, competitive global pricing pressures are expected to continue, which may lessen the possibility of recovering these types of cost increases in selling prices.
NON-GAAP FINANCIAL MEASURES
In this Annual Report, we discuss two important measures that are not calculated according to U.S. GAAP, value added sales and Adjusted EBITDA.
Value added sales is a key measure that is not calculated according to GAAP. In the discussion of operating results, we provide information regarding value added sales. Value added sales represents net sales less the value of aluminum and services provided by outsourced service providers (OSPs) that are included in net sales. As discussed further below, arrangements with our customers allow us to pass on changes in aluminum prices and OSP costs; therefore, fluctuations in underlying aluminum price and the use of OSPs generally do not directly impact our profitability. Accordingly, value added sales is worthy of being highlighted for the benefit of users of our financial statements. Our intent is to allow users of the financial statements to consider our net sales information both with and without the aluminum and OSP cost components thereof. Management utilizes value
40
Table of Contents
added sales as a key metric to determine growth of the company because it eliminates the volatility of aluminum prices.
| Fiscal Year Ended December 31, |
2017 | 2016 | 2015 | 2014 | 2013 | |||||||||||||||
| (Thousands of dollars) | ||||||||||||||||||||
| Net Sales |
$ | 1,108,055 | $ | 732,677 | $ | 727,946 | $ | 745,447 | $ | 789,564 | ||||||||||
| Less, aluminum value and OSP |
(491,302 | ) | (323,987 | ) | (367,100 | ) | (376,092 | ) | (388,973 | ) | ||||||||||
|
|
|
|
|
|
|
|
|
|
|
|||||||||||
| Value added sales |
$ | 616,753 | $ | 408,690 | $ | 360,846 | $ | 369,355 | $ | 400,591 | ||||||||||
|
|
|
|
|
|
|
|
|
|
|
|||||||||||
Adjusted EBITDA is a key measure that is not calculated according to GAAP. Adjusted EBITDA is defined as earnings before interest income and expense, income taxes, depreciation, amortization, restructuring charges and other closure costs and impairments of long-lived assets and investments, acquisition costs and integration costs. We use Adjusted EBITDA as an important indicator of the operating performance of our business. Adjusted EBITDA is used in our internal forecasts and models when establishing internal operating budgets, supplementing the financial results and forecasts reported to our Board of Directors and evaluating short-term and long-term operating trends in our operations. We believe the Adjusted EBITDA financial measure assists in providing a more complete understanding of our underlying operational measures to manage our business, to evaluate our performance compared to prior periods and the marketplace and to establish operational goals. Adjusted EBITDA is a non-GAAP financial measure and should not be considered in isolation or as a substitute for financial information provided in accordance with GAAP. This non-GAAP financial measure may not be computed in the same manner as similarly titled measures used by other companies.
Adjusted EBITDA as a percentage of net sales is a key measure that is not calculated according to GAAP. Adjusted EBITDA as a percentage of net sales is defined as Adjusted EBITDA divided by net sales.
Adjusted EBITDA as a percentage of value added sales is a key measure that is not calculated according to GAAP. Adjusted EBITDA as a percentage of value added sales is defined as Adjusted EBITDA divided by value added sales.
41
Table of Contents
The following table reconciles our net income, the most directly comparable GAAP financial measure, to our Adjusted EBITDA:
| Fiscal Year Ended December 31, |
2017 | 2016 | 2015 | 2014 | 2013 | |||||||||||||||
| (Thousands of dollars) | ||||||||||||||||||||
| Income from operations |
21,518 | 54,602 | 36,294 | 17,913 | 34,593 | |||||||||||||||
| Interest (expense) income, net |
(40,004 | ) | 245 | 103 | 1,095 | 1,691 | ||||||||||||||
| Other income (expense), net |
13,188 | (126 | ) | (1,114 | ) | (3,306 | ) | 557 | ||||||||||||
| Change in fair value of redeemable preferred stock embedded derivative liability (3) |
6,164 | — | — | — | — | |||||||||||||||
| Income tax provision |
(6,875 | ) | (13,340 | ) | (11,339 | ) | (6,899 | ) | (14,017 | ) | ||||||||||
|
|
|
|
|
|
|
|
|
|
|
|||||||||||
| Net income |
$ | (6,009 | ) | $ | 41,381 | $ | 23,944 | $ | 8,803 | $ | 22,824 | |||||||||
| Interest expense (income), net |
40,004 | (245 | ) | (103 | ) | (1,095 | ) | (1,691 | ) | |||||||||||
| Income tax provision |
6,875 | 13,340 | 11,339 | 6,899 | 14,017 | |||||||||||||||
| Depreciation (1) |
54,167 | 34,261 | 34,530 | 35,582 | 28,466 | |||||||||||||||
| Amortization |
15,168 | — | — | — | — | |||||||||||||||
| Acquisition support, integration and other (2) |
35,906 | — | — | — | — | |||||||||||||||
| Change in fair value of redeemable preferred stock embedded derivative liability (3) |
(6,164 | ) | — | — | — | — | ||||||||||||||
| Closure costs (excluding accelerated depreciation) (4) |
138 | 1,210 | 6,343 | 5,564 | — | |||||||||||||||
| Gain on sale of facility (4) |
— | (1,436 | ) | — | — | — | ||||||||||||||
|
|
|
|
|
|
|
|
|
|
|
|||||||||||
| Adjusted EBITDA |
$ | 140,085 | $ | 88,511 | $ | 76,053 | $ | 55,753 | $ | 63,616 | ||||||||||
|
|
|
|
|
|
|
|
|
|
|
|||||||||||
| Adjusted EBITDA as a percentage of net sales |
12.6 | % | 12.1 | % | 10.4 | % | 7.5 | % | 8.1 | % | ||||||||||
| Adjusted EBITDA as a percentage of value added sales |
22.7 | % | 21.7 | % | 21.1 | % | 15.1 | % | 15.9 | % | ||||||||||
| (1) | Depreciation expense in 2016 and 2015 includes $0.2 million and $1.7 million, respectively, of accelerated depreciation charges as a result of shortened estimated useful lives due to restructuring activities described in Note 3, “Restructuring” in the Notes to Consolidated Financial Statements in Item 8, “Financial Statements and Supplementary Data” in this Annual Report. |
| (2) | We incurred $25.1 million of costs related to the acquisition of Uniwheels. Additionally, we have incurred approximately $10.8 million in integration costs related to aligning the two companies. |
| (3) | The change in the fair value is mainly driven by the change in our stock price from the original valuation date in May 2017. Refer to Note 13, “Redeemable Preferred Shares” in the Notes to the Consolidated Financial Statements in Item 8, “Financial Statements and Supplementary Data” in this Annual Report. |
| (4) | In the fourth quarter of 2016, we sold the Rogers facility for total proceeds of $4.3 million, resulting in a $1.4 million gain on sale. Prior to the sale in 2016, Rogers incurred $1.5 million in closure and operating costs, which included $0.3 million in depreciation. The Rogers facility Adjusted EBITDA was a positive $0.2 million in 2016 due to the $1.4 million gain on sale. During 2015, we had completed the shutdown of the Rogers facility which resulted in a gross margin loss of $8.0 million. We incurred $4.3 million in restructuring costs related to an impairment of fixed assets and other associated costs such as asset relocation costs. Additionally, we experienced $2.0 million of further closure costs including inefficiencies and $1.7 million in depreciation. The Adjusted EBITDA impact of the Rogers facility closure for 2015 was $6.3 million, which includes the $4.3 million of restructuring costs and $2.0 million of inefficiency costs related to the closure. During 2014, we recorded $3.1 million of restructuring costs excluding accelerated depreciation and we impaired an investment by $2.5 million. |
Critical Accounting Policies and Estimates
The preparation of consolidated financial statements in conformity with U.S. GAAP requires management to apply significant judgment in making estimates and assumptions that affect amounts reported therein, as well as
42
Table of Contents
financial information included in this Management’s Discussion and Analysis of Financial Condition and Results of Operations. These estimates and assumptions, which are based upon historical experience, industry trends, terms of various past and present agreements and contracts and information available from other sources that are believed to be reasonable under the circumstances, form the basis for making judgments about the carrying values of assets and liabilities that are not readily apparent through other sources. There can be no assurance that actual results reported in the future will not differ from these estimates, or that future changes in these estimates will not adversely impact our results of operations or financial condition. As described below, the most significant accounting estimates inherent in the preparation of our financial statements include estimates and assumptions as to revenue recognition, inventory valuation, amortization of preproduction costs, impairment of and the estimated useful lives of our long-lived assets, the fair value of stock-based compensation, as well as those used in the determination of liabilities related to self-insured portions of employee benefits, workers’ compensation, derivatives and deferred income taxes.
Wheel Revenue Recognition - Our products are manufactured to customer specifications under standard purchase orders. We ship our products to OEM customers based on release schedules provided weekly by our customers. Our sales and production levels are highly dependent upon the weekly forecasted production levels of our customers. Sales of these products, net of estimated pricing adjustments and their related costs are recognized when title and risk of loss transfers to the customer, generally upon shipment. A portion of our selling prices to OEM customers is attributable to the aluminum content of our wheels. Our selling prices are adjusted periodically for changes in the current aluminum market based upon specified aluminum price indices during specific pricing periods, as agreed with our customers. See Preproduction Costs and Revenue Recognition Related to Long-Term Supply Arrangements below for a discussion of tooling reimbursement revenues.
Derivative Financial Instruments and Hedging Activities - In order to hedge exposure related to fluctuations in foreign currency rates and the cost of certain commodities used in the manufacture of our products, we periodically may purchase derivative financial instruments such as forward contracts, options or collars to offset or mitigate the impact of such fluctuations. Programs to hedge currency rate exposure may address ongoing transactions, including foreign-currency-denominated receivables and payables, as well as specific transactions related to purchase obligations. Programs to hedge exposure to commodity cost fluctuations would be based on underlying physical consumption of such commodity.
We account for our derivative instruments as either assets or liabilities and carry them at fair value. For derivative instruments that hedge the exposure to variability in expected future cash flows that are designated as cash flow hedges, the effective portion of the gain or loss on the derivative instrument is reported as a component of accumulated other comprehensive income (“AOCI”) in shareholders’ equity and reclassified into income in the same period or periods during which the hedged transaction affects earnings. The ineffective portion of the gain or loss on the derivative instrument, if any, is recognized in current income. To receive hedge accounting treatment, cash flow hedges must be highly effective in offsetting changes to expected future cash flows on hedged transactions. For forward exchange contracts designated as cash flow hedges, changes in the time value are included in the definition of hedge effectiveness. Accordingly, any gains or losses related to this component are reported as a component of AOCI in shareholders’ equity and reclassified into income in the same period or periods during which the hedged transaction affects earnings. Derivatives that do not qualify as hedges are adjusted to fair value through current income. See Note 5, “Derivative Financial Instruments” in the Notes to Consolidated Financial Statements in Item 8 for further discussion of derivatives.
When market conditions warrant, we may also enter into contracts to secure the supply of certain commodities used in the manufacture of our products, such as aluminum, natural gas and other raw materials. We previously had several purchase commitments for the delivery of natural gas through the end of 2015. These natural gas contracts were considered to be derivative instruments under U.S. GAAP and when entering into these contracts, it was expected that we would take full delivery of the contracted quantities of natural gas over the normal course of business. Accordingly, at inception, these contracts qualified for the normal purchase normal sale exemption provided for under U.S. GAAP. As such, we do not account for these purchase commitments as derivatives
43
Table of Contents
unless there is a change in the facts or circumstances that causes management to believe that these commitments would not be used in the normal course of business. In our European business, we have entered into forward contracts for aluminum which hedge the risk of fluctuations in commodity prices. See Note 20, “Risk Management” in the Notes to Consolidated Financial Statements in Item 8 for additional information pertaining to these purchase commitments.
Redeemable Preferred Stock Embedded Derivative - In addition to derivative financial instruments used in hedging activities, we issued redeemable preferred stock as a part of the financing for the acquisition of our European business. The redeemable preferred stock includes embedded derivatives relating to the conversion and early redemption options. Accordingly, we have recorded an embedded derivative liability representing the combined fair value of the right of holders to receive common stock upon conversion of Series A redeemable preferred stock at any time (the “conversion option”) and the right of the holders to exercise their early redemption option upon the occurrence of a redemption event (the “early redemption option”). The embedded derivative liability is adjusted to reflect fair value at each period end with changes in fair value recorded in the “Change in fair value of redeemable preferred stock embedded derivative liability” financial statement line item of the company’s consolidated statements of operations.
A binomial option pricing model is used to estimate the fair value of the conversion and early redemption options embedded in the redeemable preferred stock. The binomial model utilizes a “decision tree” whereby future movement in the company’s common stock price is estimated based on the volatility factor. The binomial options pricing model requires the development and use of assumptions. These assumptions include estimated volatility of the value of our common stock, assumed possible conversion or early redemption dates, an appropriate risk-free interest rate, risky bond rate and dividend yield. See Note 13, “Redeemable Preferred Shares” in the Notes to Consolidated Financial Statements in Item 8 for additional information pertaining to these embedded derivatives.
Fair Value Measurements - The company applies fair value accounting for all financial assets and liabilities and non-financial assets and liabilities that are recognized or disclosed at fair value in the financial statements on a recurring basis, while other assets and liabilities are measured at fair value on a nonrecurring basis, such as when we have an asset impairment. Fair value is estimated by applying the following hierarchy, which prioritizes the inputs used to measure fair value into three levels and bases the categorization within the hierarchy upon the lowest level of input that is available and significant to the fair value measurement:
Level 1 - Quoted prices in active markets for identical assets or liabilities.
Level 2 - Observable inputs other than quoted prices in active markets for identical assets and liabilities, quoted prices for identical or similar assets or liabilities in inactive markets, or other inputs that are observable or can be corroborated by observable market data for substantially the full term of the assets or liabilities.
Level 3 - Inputs that are generally unobservable and typically reflect management’s estimate of assumptions that market participants would use in pricing the asset or liability.
Our derivatives are over-the-counter customized derivative transactions and are not exchange traded. We estimate the fair value of these instruments using industry-standard valuation models such as a discounted cash flow. These models project future cash flows and discount the future amounts to a present value using market-based expectations for interest rates, foreign exchange rates, commodity prices and the contractual terms of the derivative instruments. The discount rate used is the relevant interbank deposit rate (e.g., LIBOR) plus an adjustment for non-performance risk. In certain cases, market data may not be available and we may use broker quotes and models (e.g., Black-Scholes) to determine fair value. This includes situations where there is lack of liquidity for a particular currency or commodity or when the instrument is longer dated. The fair value measurements of the redeemable preferred shares embedded derivatives are based upon Level 3 unobservable inputs reflecting management’s own assumptions about the inputs used in pricing the liability - refer to Note 5, “Derivative Financial Instruments” in the Notes to Consolidated Financial Statements in Item 8.
44
Table of Contents
Inventories - Inventories are stated at the lower of cost or market value and categorized as raw material, work-in-process or finished goods. When necessary, management uses estimates of net realizable value to record inventory reserves for obsolete and/or slow-moving inventory. Our inventory values in North America, which are based upon standard costs for raw materials and labor and overhead established at the beginning of the year, are adjusted to actual costs on a first-in, first-out (“FIFO”) basis. Current raw material prices and labor and overhead costs are utilized in developing these adjustments. Our inventories in Europe are based on average cost or the FIFO method.
Preproduction Costs and Revenue Recognition Related to Long-Term Supply Arrangements - We incur preproduction engineering and tooling costs related to the products produced for our customers under long-term supply agreements. We expense all preproduction engineering costs for which reimbursement is not contractually guaranteed by the customer or which are in excess of the contractually guaranteed reimbursement amount. We amortize the cost of the customer-owned tooling over the expected life of the wheel program on a straight-line basis. Also, we defer any reimbursements made to us by our customers and recognize the tooling reimbursement revenue over the same period in which the tooling is in use. Changes in the facts and circumstances of individual wheel programs may accelerate the amortization of both the cost of the customer-owned tooling and the deferred tooling reimbursement revenues. Recognized tooling reimbursement revenues, which totaled approximately $11.9 million, $8.0 million and $5.8 million, in 2017, 2016 and 2015, respectively, are included in net sales in the Consolidated Income Statements in Item 8, “Financial Statements and Supplementary Data” of this Annual Report. The following tables summarize the unamortized customer-owned tooling costs included in our non-current assets, and the deferred tooling revenues included in accrued liabilities and other non-current liabilities:
| December 31, |
2017 | 2016 | ||||||
| (Dollars in Thousands) | ||||||||
| Unamortized Preproduction Costs |
||||||||
| Preproduction costs |
$ | 84,198 | $ | 78,299 | ||||
| Accumulated amortization |
(71,409 | ) | (65,100 | ) | ||||
|
|
|
|
|
|||||
| Net preproduction costs |
$ | 12,789 | $ | 13,199 | ||||
|
|
|
|
|
|||||
| Deferred Tooling Revenue |
||||||||
| Accrued liabilities |
$ | 4,654 | $ | 5,419 | ||||
| Other non-current liabilities |
1,974 | 2,593 | ||||||
|
|
|
|
|
|||||
| Total deferred tooling revenue |
$ | 6,628 | $ | 8,012 | ||||
|
|
|
|
|
|||||
Impairment of Goodwill - As of December 31, 2017, we had recorded goodwill of $304.8 million as a result of our acquisition of our European business on May 30, 2017. Goodwill must be tested on at least an annual basis and as of an interim period if an event or circumstance indicates that an impairment is more likely than not to have occurred. In conducting our annual impairment testing, we may first perform a qualitative assessment of whether it is more likely than not that a reporting unit’s fair value is less than its carrying amount. If not, no further goodwill impairment testing is performed. If it is more likely than not that a reporting unit’s fair value is less than its carrying amount, or if we elect not to perform a qualitative assessment of a reporting unit, we compare the fair value of the reporting unit to the related net book value. If the net book value of a reporting unit exceeds its fair value, an impairment loss is measured and recognized. We conduct our annual impairment testing as of the last day of our fourth quarter. We utilize a market approach supplemented by an income approach to assess fair value for goodwill.
In 2017, we performed a quantitative assessment of our European reporting unit as of December 31, 2017. The assessment indicated that the fair value of the European reporting unit exceeded its respective carrying value.
Impairment of Long-Lived Assets and Investments - In accordance with U.S. GAAP, management evaluates the recoverability and estimated remaining lives of long-lived assets whenever facts and circumstances suggest that
45
Table of Contents
the carrying value of the assets may not be recoverable or the useful life has changed. See Note 1, “Summary of Significant Accounting Policies” in the Notes to Consolidated Financial Statements in Item 8 for further discussion of asset impairments.
When facts and circumstances indicate that there may have been a loss in value, management will also evaluate its cost and equity method investments to determine whether there was an other-than-temporary impairment. If a loss in the value of the investment is determined to be other than temporary, then the decline in value is recognized in earnings. See Note 10, “Investment in Unconsolidated Affiliate” in the Notes to Consolidated Financial Statements in Item 8 for discussion of our investment.
Trade names - The fair value of our trade name is estimated based upon management’s estimates using a royalty savings approach, which is based on the principle that, if the business did not own the asset, it would have to license it in order to earn the returns that it was earning. The fair value is calculated based on the present value of the royalty stream that the business was saving by owning the asset. The projections that we use in our model are updated annually and will change over time based on the historical performance and changing business conditions of the European business. The determination of whether a trade name is impaired involves a significant level of judgment in these assumptions, and changes in our business strategy, or economic or market conditions could significantly impact these judgments.
Retirement Plans - Subject to certain vesting requirements, our unfunded retirement plan generally provides for a benefit based on final average compensation, which becomes payable on the employee’s death or upon attaining age 65, if retired. The net periodic pension cost and related benefit obligations are based on, among other things, assumptions of the discount rate, future salary increases and the mortality of the participants. The net periodic pension costs and related obligations are measured using actuarial techniques and assumptions. See Note 16, “Retirement Plans” in the Notes to Consolidated Financial Statements in Item 8 for a description of these assumptions.
The following information illustrates the sensitivity to a change in certain assumptions of our unfunded retirement plans as of December 31, 2017. Note that these sensitivities may be asymmetrical and are specific to 2017. They also may not be additive, so the impact of changing multiple factors simultaneously cannot be calculated by combining the individual sensitivities shown.
The effect of the indicated increase (decrease) in selected factors is shown below (in thousands):
| Increase (Decrease) in: | ||||||||||||
| Assumption |
Percentage Change |
Projected Benefit Obligation at December 31, 2017 |
2017 Net Periodic Pension Cost |
|||||||||
| Discount rate |
+1.0 | % | $ | (3,429 | ) | $ | (156 | ) | ||||
| Rate of compensation increase |
+1.0 | % | $ | 427 | $ | 51 | ||||||
Stock-Based Compensation - We account for stock-based compensation using the fair value recognition in accordance with U.S. GAAP. We use the Black-Scholes option-pricing model to determine the fair value of any stock options granted, which requires us to make estimates regarding dividend yields on our common stock, expected volatility in the price of our common stock, risk free interest rates, forfeiture rates and the expected life of the option. To the extent these estimates change, our stock-based compensation expense would change as well. The fair value of any restricted shares awarded is calculated using the closing market price of our common stock on the date of issuance. We recognize these compensation costs net of the applicable forfeiture rates and recognize the compensation costs for only those shares expected to vest on a straight-line basis over the requisite service period of the award, which is generally the option vesting term of three or four years. We estimated the forfeiture rate based on our historical experience.
Trade names - The fair value of our trade name is estimated based upon management’s estimates using a royalty savings approach, which is based on the principle that, if the business did not own the asset, it would have to
46
Table of Contents
license it in order to earn the returns that it was earning. The fair value is calculated based on the present value of the royalty stream that the business was saving by owning the asset. The projections that we use in our model are updated annually and will change over time based on the historical performance and changing business conditions of the European business. The determination of whether a trade name is impaired involves a significant level of judgment in these assumptions, and changes in our business strategy, or economic or market conditions could significantly impact these judgments.
Workers’ Compensation and Loss Reserves - We self-insure any losses arising out of workers’ compensation claims. Workers’ compensation accruals are based upon reported claims in process and actuarial estimates for losses incurred but not reported. Loss reserves, including incurred but not reported reserves, are estimated using actuarial methods and ultimate settlements may vary significantly from such estimates due to increased claim frequency or the severity of claims.
Accounting for Income Taxes - We account for income taxes using the asset and liability method. The asset and liability method requires the recognition of deferred tax assets and liabilities for expected future tax consequences of temporary differences that currently exist between the tax basis and financial reporting basis of our assets and liabilities. We calculate current and deferred tax provisions based on estimates and assumptions that could differ from actual results reflected on the income tax returns filed during the following years. Adjustments based on filed returns are recorded when identified in the subsequent years.
The effect on deferred taxes for a change in tax rates is recognized in income in the period that the tax rate change is enacted. In assessing the realizability of deferred tax assets, we consider whether it is more likely than not that some portion of the deferred tax assets will not be realized. A valuation allowance is provided for deferred income tax assets when, in our judgment, based upon currently available information and other factors, it is more likely than not that all or a portion of such deferred income tax assets will not be realized. The determination of the need for a valuation allowance is based on an on-going evaluation of current information including, among other things, historical operating results, estimates of future earnings in different taxing jurisdictions and the expected timing of the reversals of temporary differences. We believe that the determination to record a valuation allowance to reduce a deferred income tax asset is a significant accounting estimate because it is based, among other things, on an estimate of future taxable income in the U.S. and certain other jurisdictions, which is susceptible to change and may or may not occur, and because the impact of adjusting a valuation allowance may be material.
In determining when to release the valuation allowance established against our net deferred income tax assets, we consider all available evidence, both positive and negative. Consistent with our policy, the valuation allowance against our net deferred income tax assets will not be reversed until such time as we have generated three years of cumulative pre-tax income and have reached sustained profitability, which we define as two consecutive one-year periods of pre-tax income.
We account for our uncertain tax positions utilizing a two-step approach to evaluate tax positions. Step one, recognition, requires evaluation of the tax position to determine if based solely on technical merits it is more likely than not to be sustained upon examination. Step two, measurement, is addressed only if a position is more likely than not to be sustained. In step two, the tax benefit is measured as the largest amount of benefit, determined on a cumulative probability basis, which is more likely than not to be realized upon ultimate settlement with tax authorities. If a position does not meet the more likely than not threshold for recognition in step one, no benefit is recorded until the first subsequent period in which the more likely than not standard is met, the issue is resolved with the taxing authority, or the statute of limitations expires. Positions previously recognized are derecognized when we subsequently determine the position no longer is more likely than not to be sustained. Evaluation of tax positions, their technical merits and measurements using cumulative probability are highly subjective management estimates. Actual results could differ materially from these estimates.
Presently, we have not recorded a deferred tax liability for temporary differences related to investments in foreign subsidiaries that are essentially permanent in duration. These temporary differences may become taxable
47
Table of Contents
upon a repatriation of earnings from the subsidiaries or a sale or liquidation of the subsidiaries. At this time the company does not have any plans to repatriate income from its foreign subsidiaries.
New Accounting Standards
In May 2014, the FASB issued ASU 2014-09, Revenue from Contracts with Customers. This update outlines a single, comprehensive model for accounting for revenue from contracts with customers. We plan to adopt this update on January 1, 2018. The guidance permits two methods of adoption: retrospectively to each prior reporting period presented (full retrospective method), or retrospectively with the cumulative effect of initially applying the guidance recognized at the date of initial application (modified retrospective method). We anticipate adopting the standard using the modified retrospective method. We have completed our assessment and do not expect that implementation will have any material effect on our financial position or operations.
In February 2016, the FASB issued ASU 2016-02, Leases (Topic 842) (“ASU 2016-02”). ASU 2016-02 requires an entity to recognize right-of-use assets and lease liabilities on its balance sheet and disclose key information about leasing arrangements. ASU 2016-02 offers specific accounting guidance for a lessee, a lessor and sale and leaseback transactions. Lessees and lessors are required to disclose qualitative and quantitative information about leasing arrangements to enable a user of the financial statements to assess the amount, timing and uncertainty of cash flows arising from leases. For public companies, ASU 2016-02 is effective for annual reporting periods beginning after December 15, 2018, including interim periods within that reporting period, and requires a modified retrospective adoption, with early adoption permitted. We are evaluating the impact this guidance will have on our financial position and statement of operations.
In August 2016, the FASB issued an ASU entitled “Statement of Cash Flows (Topic 740): Classification of Certain Cash Receipts and Cash Payments.” The objective of the ASU is to address the diversity in practice in the presentation of certain cash receipts and cash payments in the statement of cash flows. This ASU is effective for fiscal years beginning after December 15, 2017, including interim periods within those fiscal years. Early adoption is permitted. We are evaluating the impact this guidance will have on our statement of cash flows.
In January 2017, the FASB issued an ASU entitled “Intangibles - Goodwill and Other (Topic 350): Simplifying the Test for Goodwill Impairment.” The objective of the ASU is to simplify how an entity is required to test goodwill for impairment by eliminating Step 2 from the goodwill impairment test. Step 2 measures a goodwill impairment loss by comparing the implied fair value of a reporting unit’s goodwill with the carrying amount of that goodwill. This ASU is effective for fiscal years beginning after December 15, 2019, including interim periods within those fiscal years. Early adoption is permitted. We are evaluating the impact this guidance will have on our financial position and statement of operations.
In January 2017, the FASB issued an ASU entitled “Business Combinations (Topic 805): Clarifying the Definition of a Business.” The objective of the ASU is to assist entities with evaluating whether transactions should be accounted for as acquisitions (or disposals) of assets or businesses. This ASU is effective for fiscal years beginning after December 15, 2017, including interim periods within those fiscal years. Early adoption is permitted. We are evaluating the impact this guidance will have on our financial position and statement of operations.
In March 2017, the FASB issued an ASU entitled “Compensation-Retirement Benefits (Topic 715): Improving the Presentation of Net Periodic Pension Cost and Net Periodic Postretirement Benefit Cost.” The objective of the ASU is to improve the reporting of net benefit cost in the financial statements. This ASU is effective for fiscal years beginning after December 15, 2017, including interim periods within those fiscal years. Early adoption is permitted. We are evaluating the impact this guidance will have on our financial position and statement of operations.
In July 2017, the FASB issued an ASU entitled “(Part I) Accounting for Certain Financial Instruments with Down Round Features, (Part II) Replacement of the Indefinite Deferral for Mandatorily Redeemable Financial
48
Table of Contents
instruments of Certain Nonpublic Entities and Certain Mandatorily Redeemable Noncontrolling Interests with a Scope Exception.” The objective of this ASU is to reduce the complexity in accounting for certain financial instruments with down round features. When determining whether certain financial instruments should be classified as debt or equity instruments, a down round feature would no longer preclude equity classification when assessing whether the instrument is indexed to an entity’s own stock. As a result, a freestanding equity-linked financial instrument (or embedded conversion option) no longer would be accounted for as a derivative liability at fair value as a result of the existence of a down round feature. Early adoption is permitted. We are evaluating the impact this guidance will have on our financial position and statement of operations.
In August 2017, the FASB issued an ASU entitled “Derivatives and Hedging (Topic 815).” The objective of this standard is to better align financial reporting with risk management activities, provide a more faithful representation of hedging activities and reduce complexity and costs associated with hedging. This ASU removes the requirement to recognize hedge ineffectiveness in income prior to settlement, allows documentation of hedge effectiveness at inception to be completed by quarter-end, allows qualitative rather than quantitative assessment of effectiveness (subsequent to initial quantitative assessment), allows critical terms match for cash flow hedges of a group of forecasted transactions if derivatives mature within the same month as transactions, permits use of the “back up” long haul method for hedges initially designated using the short cut method and permits cash flow hedging of a component of purchases and sales of non-financial assets (i.e., commodity price excluding transportation) resulting in higher hedge effectiveness. The ASU also permits fair value hedging of the benchmark interest rate component of interest rate risk as well as partial term hedging, allows partial term fair value hedges of interest rate risk, permits cash flow hedging of interest rate risk for a contractually specified rate rather than a benchmark rate and permits exclusion of cross currency basis spread in determining effectiveness. This ASU is effective for fiscal years beginning after December 15, 2018 and early adoption is permitted. We are evaluating the impact this guidance will have on our financial position and statement of operations.
On December 22, 2017, the Securities and Exchange Commission issued Staff Accounting Bulletin No. 118 (SAB 118) to provide guidance regarding accounting and disclosure for tax effects arising from changes in tax regulations under the Tax Cuts and Jobs Act (the “Act”) enacted December 22, 2017. The Act contains significant changes to corporate taxation, including reduction in the corporate tax rate from 35 percent to 21 percent, a one-time transition tax on offshore earnings at reduced tax rates, elimination of U.S. tax on foreign dividends, new taxes on certain foreign earnings, a new minimum tax related to payments to foreign subsidiaries and affiliates, immediate deductions for certain new investments and the modification or repeal of many business deductions and credits. The Act will also have international tax consequences for many companies that operate internationally. Generally, the SEC guidance directs companies to recognize income tax effects where requisite analysis can be completed prior to issuance of financial statements; estimate income tax effects where analysis is not yet complete but a reasonable estimate can be determined; and disclose effects where no reasonable estimate can be determined. The reasonable estimate would be reported as a provisional amount during a “measurement period.” In circumstances in which provisional amounts cannot be prepared, tax provisions should be determined based on tax laws in effect immediately prior to enactment of the Act. Disclosures should include tax effects for which accounting is incomplete; items reported as provisional amounts; current or deferred tax amounts for which the income tax effects of the Act have not been completed; the reason the initial accounting is incomplete; additional information needed to complete the accounting requirements under ASC Topic 740; nature and amount of any measurement period adjustments recognized during the reporting period; effect of measurement period adjustments on the effective tax rate; and the point at which accounting for the all tax effects of the Act has been completed. Refer to Note 14, “Income Taxes” in the Notes to the Consolidated Financial Statements in Item 8 for additional information including the impact of the Act on our financial position and results of operations.
ITEM 7A - QUANTITATIVE AND QUALITATIVE DISCLOSURES ABOUT MARKET RISK
Foreign Currency. A significant portion of our business operations are conducted in Mexico and Europe, principally Germany and Poland. As a result, we have a certain degree of market risk with respect to our cash
49
Table of Contents
flows due to changes in foreign currency exchange rates when transactions are denominated in currencies other than our functional currency, including inter-company transactions.
In accordance with our corporate risk management policies, we may enter into foreign currency forward and option contracts and currency swaps with financial institutions to protect against foreign exchange risks associated with certain existing assets and liabilities, certain firmly committed transactions and forecasted future cash flows. We have implemented a program to hedge a portion of our material foreign exchange exposures, for up to approximately 48 months. However, we may choose not to hedge certain foreign exchange exposures for a variety of reasons including, but not limited to, accounting considerations and prohibitive economic cost of hedging particular exposures. We do not use derivative contracts for trading, market-making, or speculative purposes. For additional information on our derivatives, see Note 5, “Derivative Financial Instruments” in the Notes to Consolidated Financial Statements in Item 8.
At December 31, 2017, the fair value net liability for foreign currency exchange derivatives for the Peso was $11.5 million. The potential loss in fair value for such financial instruments from a 10 percent adverse change in quoted foreign currency exchange rates would be $23.3 million at December 31, 2017.
During 2017, the Mexican peso to U.S. dollar exchange rate averaged 18.96 Pesos to $1.00. Based on the balance sheet at December 31, 2017, the value of net assets for our operations in Mexico was 2,456 million Pesos. Accordingly, a 10 percent change in the relationship between the peso and the U.S. dollar would result in a translation impact of $13.0 million, which would be recognized in other comprehensive (loss) income.
Since Uniwheels was acquired on May 30, 2017, the Euro to U.S. dollar exchange rate averaged $1.17 to 1.00 Euro. Based on the balance sheet at December 31, 2017, the value of net assets for our operations in Europe was 683.1 million Euros. Accordingly, a 10 percent change in the relationship between the Euro and the U.S. dollar would result in a translation impact of $79.8 million, which would be recognized in other comprehensive income.
At December 31, 2017 the fair value liability for foreign currency exchange derivatives (consisting of cross currency swaps) for the Euro was $2.5 million. The potential loss in fair value for such financial instruments from a 10 percent adverse change in quoted foreign currency exchange rates would be $4.2 million at December 31, 2017.
At December 31, 2017, the fair value net asset for foreign currency exchange derivatives for the Zloty was $2.4 million. The potential loss in fair value for such financial instruments from a 10 percent adverse change in quoted foreign currency exchange rates would be $17.2 million at December 31, 2017.
Our business requires us to settle transactions between currencies in both directions - i.e., peso to U.S. dollar and vice versa. To the greatest extent possible, we attempt to match the timing and magnitude of transaction settlements between currencies to create a “natural hedge.” For 2017, we had a $12.9 million net gain on foreign exchange transactions related to the Peso, Euro and Zloty. The net imbalance between currencies depends on many factors including but not limited to, the company’s business model, location of production operations and associated currencies, and geographic distribution of sales activity and associated currencies. While changes in the terms of the contracts with our customers may create an imbalance between currencies that we are hedging with foreign currency forward contracts, there can be no assurances that our hedging program will effectively offset the impact of the imbalance between currencies or that the net transaction balance will not change significantly in the future.
Commodity Purchase Commitments. When market conditions warrant, we enter into purchase commitments to secure the supply of certain commodities used in the manufacture of our products, such as aluminum, natural gas and other raw materials. However, we do not enter into derivatives or other financial instrument transactions for speculative purposes. At December 31, 2017, we had no purchase commitments in place for the delivery of
50
Table of Contents
aluminum, natural gas or other raw materials. However, our European business has entered into forward contracts to hedge price fluctuations in its aluminum raw materials. At December 31, 2017 the fair value asset relating to forward contracts for aluminum was $1.8 million. The change in fair value for such financial instruments from a 10 percent adverse change in market price for aluminum would be $1.6 million at December 31, 2017.
See the section captioned “Risk Management” in Item 7, “Management’s Discussion and Analysis of Financial Condition and Results of Operations” for a further discussion about the market risk we face.
51
Table of Contents
ITEM 8 - FINANCIAL STATEMENTS AND SUPPLEMENTARY DATA
Index to the Consolidated Financial Statements of Superior Industries International, Inc.
52
Table of Contents
REPORT OF INDEPENDENT REGISTERED PUBLIC ACCOUNTING FIRM
To the shareholders and the Board of Directors of Superior Industries International, Inc.
Opinion on the Financial Statements
We have audited the accompanying consolidated balance sheets of Superior Industries International, Inc. and subsidiaries (the “Company”) as of December 31, 2017 and December 25, 2016, the related consolidated income statements, statements of comprehensive income, shareholders’ equity, and cash flows, for each of the three years in the periods ended December 31, 2017, December 25, 2016, and December 27, 2015, and the related notes and the schedule listed in the Index at Item 15 (collectively referred to as the “financial statements”). In our opinion, the financial statements present fairly, in all material respects, the financial position of the Company as of December 31, 2017 and December 25, 2016, and the results of its operations and its cash flows for each of the three years in the periods ended December 31, 2017, December 25, 2016, and December 27, 2015, in conformity with accounting principles generally accepted in the United States of America.
We have also audited, in accordance with the standards of the Public Company Accounting Oversight Board (United States) (PCAOB), the Company’s internal control over financial reporting as of December 31, 2017, based on criteria established in Internal Control — Integrated Framework (2013) issued by the Committee of Sponsoring Organizations of the Treadway Commission and our report dated March 15, 2018, expressed an unqualified opinion on the Company’s internal control over financial reporting.
Basis for Opinion
These financial statements are the responsibility of the Company’s management. Our responsibility is to express an opinion on the Company’s financial statements based on our audits. We are a public accounting firm registered with the PCAOB and are required to be independent with respect to the Company in accordance with the U.S. federal securities laws and the applicable rules and regulations of the Securities and Exchange Commission and the PCAOB.
53
Table of Contents
We conducted our audits in accordance with the standards of the PCAOB. Those standards require that we plan and perform the audit to obtain reasonable assurance about whether the financial statements are free of material misstatement, whether due to error or fraud. Our audits included performing procedures to assess the risks of material misstatement of the financial statements, whether due to error or fraud, and performing procedures that respond to those risks. Such procedures included examining, on a test basis, evidence regarding the amounts and disclosures in the financial statements. Our audits also included evaluating the accounting principles used and significant estimates made by management, as well as evaluating the overall presentation of the financial statements. We believe that our audits provide a reasonable basis for our opinion.
/s/ Deloitte & Touche LLP
Detroit, Michigan
March 15, 2018
We have served as the Company’s auditor since 2009.
54
Table of Contents
REPORT OF INDEPENDENT REGISTERED PUBLIC ACCOUNTING FIRM
To the shareholders and the Board of Directors of Superior Industries International, Inc.
Opinion on Internal Control over Financial Reporting
We have audited the internal control over financial reporting of Superior Industries International, Inc. and subsidiaries (the “Company”) as of December 31, 2017, based on criteria established in Internal Control -Integrated Framework (2013) issued by the Committee of Sponsoring Organizations of the Treadway Commission (COSO). In our opinion, the Company maintained, in all material respects, effective internal control over financial reporting as of December 31, 2017, based on criteria established in Internal Control - Integrated Framework (2013) issued by COSO.
We have also audited, in accordance with the standards of the Public Company Accounting Oversight Board (United States) (PCAOB), the consolidated financial statements and financial statement schedule as of and for the year ended December 31, 2017, of the Company and our report dated March 15, 2018, expressed an unqualified opinion on those financial statements.
As described in Management’s Report on Internal Control Over Financial Reporting, management excluded from its assessment the internal control over financial reporting at Uniwheels AG, which was acquired on May 30, 2017 and whose financial statements constitute 32.8 percent of total assets (excluding goodwill and intangibles which are included within the scope of management’s assessment) and 33.9 percent of net sales of the consolidated financial statement amounts as of and for the year ended December 31, 2017. Accordingly, our audit did not include the internal control over financial reporting at Uniwheels AG.
Basis for Opinion
The Company’s management is responsible for maintaining effective internal control over financial reporting and for its assessment of the effectiveness of internal control over financial reporting, included in the accompanying Management’s Report on Internal Control Over Financial Reporting. Our responsibility is to express an opinion on the Company’s internal control over financial reporting based on our audit. We are a public accounting firm registered with the PCAOB and are required to be independent with respect to the Company in accordance with the U.S. federal securities laws and the applicable rules and regulations of the Securities and Exchange Commission and the PCAOB.
We conducted our audit in accordance with the standards of the PCAOB. Those standards require that we plan and perform the audit to obtain reasonable assurance about whether effective internal control over financial reporting was maintained in all material respects. Our audit included obtaining an understanding of internal control over financial reporting, assessing the risk that a material weakness exists, testing and evaluating the design and operating effectiveness of internal control based on the assessed risk, and performing such other procedures as we considered necessary in the circumstances. We believe that our audit provides a reasonable basis for our opinion.
55
Table of Contents
Definition and Limitations of Internal Control over Financial Reporting
A company’s internal control over financial reporting is a process designed to provide reasonable assurance regarding the reliability of financial reporting and the preparation of financial statements for external purposes in accordance with generally accepted accounting principles. A company’s internal control over financial reporting includes those policies and procedures that (1) pertain to the maintenance of records that, in reasonable detail, accurately and fairly reflect the transactions and dispositions of the assets of the company; (2) provide reasonable assurance that transactions are recorded as necessary to permit preparation of financial statements in accordance with generally accepted accounting principles, and that receipts and expenditures of the company are being made only in accordance with authorizations of management and directors of the company; and (3) provide reasonable assurance regarding prevention or timely detection of unauthorized acquisition, use, or disposition of the company’s assets that could have a material effect on the financial statements.
Because of its inherent limitations, internal control over financial reporting may not prevent or detect misstatements. Also, projections of any evaluation of effectiveness to future periods are subject to the risk that controls may become inadequate because of changes in conditions, or that the degree of compliance with the policies or procedures may deteriorate.
/s/ Deloitte & Touche LLP
Detroit, Michigan
March 15, 2018
56
Table of Contents
SUPERIOR INDUSTRIES INTERNATIONAL, INC.
CONSOLIDATED INCOME STATEMENTS
(Dollars in thousands, except per share data)
| Fiscal Year Ended December 31, |
2017 | 2016 | 2015 | |||||||||
| NET SALES |
$ | 1,108,055 | $ | 732,677 | $ | 727,946 | ||||||
| Cost of sales: |
||||||||||||
| Cost of sales |
1,005,020 | 645,015 | 650,717 | |||||||||
| Restructuring costs (Note 3) |
138 | 1,458 | 6,012 | |||||||||
|
|
|
|
|
|
|
|||||||
| 1,005,158 | 646,473 | 656,729 | ||||||||||
|
|
|
|
|
|
|
|||||||
| GROSS PROFIT |
102,897 | 86,204 | 71,217 | |||||||||
| Selling, general and administrative expenses |
81,379 | 31,602 | 34,923 | |||||||||
|
|
|
|
|
|
|
|||||||
| INCOME FROM OPERATIONS |
21,518 | 54,602 | 36,294 | |||||||||
| Interest (expense) income, net |
(40,004 | ) | 245 | 103 | ||||||||
| Other income (expense), net |
13,188 | (126 | ) | (1,114 | ) | |||||||
| Change in fair value of redeemable preferred stock embedded derivative liability |
6,164 | — | — | |||||||||
|
|
|
|
|
|
|
|||||||
| CONSOLIDATED INCOME BEFORE INCOME TAXES |
866 | 54,721 | 35,283 | |||||||||
| Income tax provision |
(6,875 | ) | (13,340 | ) | (11,339 | ) | ||||||
|
|
|
|
|
|
|
|||||||
| CONSOLIDATED NET INCOME (LOSS) |
(6,009 | ) | 41,381 | 23,944 | ||||||||
| Less: Net income attributable to non-controlling interest |
(194 | ) | — | — | ||||||||
|
|
|
|
|
|
|
|||||||
| NET INCOME (LOSS) ATTRIBUTABLE TO SUPERIOR |
$ | (6,203 | ) | $ | 41,381 | $ | 23,944 | |||||
|
|
|
|
|
|
|
|||||||
| EARNINGS (LOSS) PER SHARE ATTRIBUTABLE TO SUPERIOR – BASIC |
$ | (1.01 | ) | $ | 1.63 | $ | 0.90 | |||||
|
|
|
|
|
|
|
|||||||
| EARNINGS (LOSS) PER SHARE ATTRIBUTABLE TO SUPERIOR – DILUTED |
$ | (1.01 | ) | $ | 1.62 | $ | 0.90 | |||||
|
|
|
|
|
|
|
|||||||
The accompanying notes are an integral part of these consolidated financial statements.
57
Table of Contents
SUPERIOR INDUSTRIES INTERNATIONAL, INC.
CONSOLIDATED STATEMENTS OF COMPREHENSIVE INCOME
(Dollars in thousands)
| Fiscal Year Ended December 31, |
2017 | 2016 | 2015 | |||||||||
|
|
|
|
|
|
|
|||||||
| Net income (loss) attributable to Superior |
$ | (6,203 | ) | $ | 41,381 | $ | 23,944 | |||||
| Other comprehensive (loss) income, net of tax: |
||||||||||||
| Foreign currency translation gain (loss) |
29,822 | (16,904 | ) | (16,810 | ) | |||||||
| Change in unrecognized gains (losses) on derivative instruments: |
||||||||||||
| Change in fair value of derivatives |
14,067 | (11,062 | ) | (7,189 | ) | |||||||
| Tax benefit (provision) |
(6,464 | ) | 4,250 | 2,665 | ||||||||
|
|
|
|
|
|
|
|||||||
| Change in unrecognized gains (losses) on derivative instruments, net of tax |
7,603 | (6,812 | ) | (4,524 | ) | |||||||
| Defined benefit pension plan: |
||||||||||||
| Actuarial (losses) gains on pension obligation, net of curtailments and amortization |
(1,931 | ) | 799 | 1,807 | ||||||||
| Tax benefit (provision) |
310 | (295 | ) | (761 | ) | |||||||
|
|
|
|
|
|
|
|||||||
| Pension changes, net of tax |
(1,621 | ) | 504 | 1,046 | ||||||||
|
|
|
|
|
|
|
|||||||
| Other comprehensive income, net of tax |
35,804 | (23,212 | ) | (20,288 | ) | |||||||
|
|
|
|
|
|
|
|||||||
| Comprehensive income attributable to Superior |
$ | 29,601 | $ | 18,169 | $ | 3,656 | ||||||
|
|
|
|
|
|
|
The accompanying notes are an integral part of these consolidated financial statements.
58
Table of Contents
SUPERIOR INDUSTRIES INTERNATIONAL, INC.
(Dollars in thousands)
| Fiscal Year Ended December 31, |
2017 | 2016 | ||||||
| ASSETS |
||||||||
| Current assets: |
||||||||
| Cash and cash equivalents |
$ | 46,360 | $ | 57,786 | ||||
| Short-term investments |
750 | 750 | ||||||
| Accounts receivable, net |
160,167 | 99,331 | ||||||
| Inventories |
173,999 | 82,837 | ||||||
| Income taxes receivable |
6,929 | 3,682 | ||||||
| Other current assets |
29,178 | 9,695 | ||||||
|
|
|
|
|
|||||
| Total current assets |
417,383 | 254,081 | ||||||
| Property, plant and equipment, net |
536,686 | 227,403 | ||||||
| Investment in unconsolidated affiliate |
— | 2,000 | ||||||
| Non-current deferred income tax assets, net |
54,302 | 28,838 | ||||||
| Goodwill |
304,805 | — | ||||||
| Intangibles |
203,473 | — | ||||||
| Other non-current assets |
34,603 | 30,434 | ||||||
|
|
|
|
|
|||||
| Total assets |
$ | 1,551,252 | $ | 542,756 | ||||
|
|
|
|
|
|||||
| LIABILITIES, MEZZANINE EQUITY AND SHAREHOLDERS’ EQUITY |
||||||||
| Current liabilities: |
||||||||
| Accounts payable |
$ | 118,424 | $ | 37,856 | ||||
| Short-term debt |
4,000 | — | ||||||
| Accrued expenses |
68,786 | 46,315 | ||||||
| Income taxes payable |
3,849 | 1,793 | ||||||
|
|
|
|
|
|||||
| Total current liabilities |
195,059 | 85,964 | ||||||
| Long-term debt (less current portion) |
679,552 | — | ||||||
| Embedded derivative liability |
4,685 | — | ||||||
| Non-current income tax liabilities |
5,731 | 5,301 | ||||||
| Non-current deferred income tax liabilities, net |
28,539 | 3,628 | ||||||
| Other non-current liabilities |
47,269 | 49,637 | ||||||
| Commitments and contingent liabilities (Note 21) |
— | — | ||||||
| Mezzanine equity: |
||||||||
| Preferred stock, $0.01 par value |
||||||||
| Authorized - 1,000,000 shares; issued and outstanding - 150,000 shares (no shares at December 31, 2016) |
144,694 | — | ||||||
| Shareholders’ equity: |
||||||||
| Common stock, $0.01 par value |
||||||||
| Authorized - 100,000,000 shares |
||||||||
| Issued and outstanding - 24,917,025 shares (25,143,950 shares at December 31, 2016) |
89,755 | 89,916 | ||||||
| Accumulated other comprehensive loss |
(89,121 | ) | (124,925 | ) | ||||
| Retained earnings |
393,146 | 433,235 | ||||||
|
|
|
|
|
|||||
| Superior shareholders’ equity |
393,780 | 398,226 | ||||||
| Noncontrolling interests |
51,943 | — | ||||||
|
|
|
|
|
|||||
| Total shareholders’ equity |
445,723 | 398,226 | ||||||
|
|
|
|
|
|||||
| Total liabilities, mezzanine equity and shareholders’ equity |
$ | 1,551,252 | $ | 542,756 | ||||
|
|
|
|
|
|||||
The accompanying notes are an integral part of these consolidated financial statements.
59
Table of Contents
SUPERIOR INDUSTRIES INTERNATIONAL, INC.
CONSOLIDATED STATEMENTS OF SHAREHOLDERS’ EQUITY
FISCAL YEAR ENDED DECEMBER 31, 2015
(Dollars in thousands, except per share data)
| Accumulated Other Comprehensive Income (Loss) |
Retained Earnings |
Total | ||||||||||||||||||||||||||
| Unrecognized Gains/Losses on Derivative Instruments |
Pension Obligations |
Cumulative Translation Adjustment |
||||||||||||||||||||||||||
| Common Stock | ||||||||||||||||||||||||||||
| Number of Shares |
Amount | |||||||||||||||||||||||||||
| BALANCE AT FISCAL YEAR END 2014 |
26,730,247 | $ | 81,473 | $ | (4,765 | ) | $ | (5,186 | ) | $ | (71,474 | ) | $ | 438,958 | $ | 439,006 | ||||||||||||
| Net income |
— | — | — | — | — | 23,944 | 23,944 | |||||||||||||||||||||
| Change in unrecognized gains/losses on derivative instruments, net of tax |
— | — | (4,524 | ) | — | — | — | (4,524 | ) | |||||||||||||||||||
| Change in employee benefit plans, net of taxes |
— | — | — | 1,046 | — | — | 1,046 | |||||||||||||||||||||
| Net foreign currency translation adjustment |
— | — | — | — | (16,810 | ) | — | (16,810 | ) | |||||||||||||||||||
| Stock options exercised |
420,642 | 7,265 | — | — | — | — | 7,265 | |||||||||||||||||||||
| Restricted stock awards granted, net of forfeitures |
4,960 | — | — | — | — | — | — | |||||||||||||||||||||
| Stock-based compensation expense |
— | 2,807 | — | — | — | — | 2,807 | |||||||||||||||||||||
| Tax impact of stock options |
— | — | — | — | — | — | — | |||||||||||||||||||||
| Common stock repurchased |
(1,056,954 | ) | (3,437 | ) | — | — | — | (16,201 | ) | (19,638 | ) | |||||||||||||||||
| Cash dividends declared ($0.72 per share) |
— | — | — | — | — | (19,184 | ) | (19,184 | ) | |||||||||||||||||||
|
|
|
|
|
|
|
|
|
|
|
|
|
|
|
|||||||||||||||
| BALANCE AT FISCAL YEAR END 2015 |
26,098,895 | $ | 88,108 | $ | (9,289 | ) | $ | (4,140 | ) | $ | (88,284 | ) | $ | 427,517 | $ | 413,912 | ||||||||||||
|
|
|
|
|
|
|
|
|
|
|
|
|
|
|
|||||||||||||||
The accompanying notes are an integral part of these consolidated financial statements.
60
Table of Contents
SUPERIOR INDUSTRIES INTERNATIONAL, INC.
CONSOLIDATED STATEMENTS OF SHAREHOLDERS’ EQUITY
FISCAL YEAR ENDED DECEMBER 31, 2016
(Dollars in thousands, except per share data)
| Accumulated Other Comprehensive Income (Loss) |
Retained Earnings |
Total | ||||||||||||||||||||||||||
| Unrecognized Gains/Losses on Derivative Instruments |
Pension Obligations |
Cumulative Translation Adjustment |
||||||||||||||||||||||||||
| Common Stock | ||||||||||||||||||||||||||||
| Number of Shares |
Amount | |||||||||||||||||||||||||||
| BALANCE AT FISCAL YEAR END 2015 |
26,098,895 | $ | 88,108 | $ | (9,289 | ) | $ | (4,140 | ) | $ | (88,284 | ) | $ | 427,517 | $ | 413,912 | ||||||||||||
| Net income |
— | — | — | — | — | 41,381 | 41,381 | |||||||||||||||||||||
| Change in unrecognized gains/losses on derivative instruments, net of tax |
— | — | (6,812 | ) | — | — | — | (6,812 | ) | |||||||||||||||||||
| Change in employee benefit plans, net of taxes |
— | — | — | 504 | — | — | 504 | |||||||||||||||||||||
| Net foreign currency translation adjustment |
— | — | — | — | (16,904 | ) | — | (16,904 | ) | |||||||||||||||||||
| Stock options exercised |
86,908 | 1,641 | — | — | — | — | 1,641 | |||||||||||||||||||||
| Restricted stock awards granted, net of forfeitures |
(1,165 | ) | — | — | — | — | — | — | ||||||||||||||||||||
| Stock-based compensation expense |
— | 3,618 | — | — | — | — | 3,618 | |||||||||||||||||||||
| Tax impact of stock options |
— | 92 | — | — | — | — | 92 | |||||||||||||||||||||
| Common stock repurchased |
(1,040,688 | ) | (3,543 | ) | — | — | — | (17,176 | ) | (20,719 | ) | |||||||||||||||||
| Cash dividends declared ($0.72 per share) |
— | — | — | — | — | (18,487 | ) | (18,487 | ) | |||||||||||||||||||
|
|
|
|
|
|
|
|
|
|
|
|
|
|
|
|||||||||||||||
| BALANCE AT FISCAL YEAR END 2016 |
25,143,950 | $ | 89,916 | $ | (16,101 | ) | $ | (3,636 | ) | $ | (105,188 | ) | $ | 433,235 | $ | 398,226 | ||||||||||||
|
|
|
|
|
|
|
|
|
|
|
|
|
|
|
|||||||||||||||
The accompanying notes are an integral part of these consolidated financial statements.
61
Table of Contents
SUPERIOR INDUSTRIES INTERNATIONAL, INC.
CONSOLIDATED STATEMENTS OF SHAREHOLDERS’ EQUITY
FISCAL YEAR ENDED DECEMBER 31, 2017
(Dollars in thousands, except per share data)
| Accumulated Other Comprehensive Income (Loss) |
Retained Earnings |
Non- Controlling Interest |
Total | |||||||||||||||||||||||||||||
| Unrecognized Gains/Losses on Derivative Instruments |
Pension Obligations |
Cumulative Translation Adjustment |
||||||||||||||||||||||||||||||
| Common Stock | ||||||||||||||||||||||||||||||||
| Number of Shares |
Amount | |||||||||||||||||||||||||||||||
| BALANCE AT FISCAL YEAR END 2016 |
25,143,950 | $ | 89,916 | $ | (16,101 | ) | $ | (3,636 | ) | $ | (105,188 | ) | $ | 433,235 | $ | — | $ | 398,226 | ||||||||||||||
| Consolidated net income (loss) |
— | — | — | — | — | (6,203 | ) | 194 | (6,009 | ) | ||||||||||||||||||||||
| Change in unrecognized gains/losses on derivative instruments, net of tax |
— | — | 7,603 | — | — | — | — | 7,603 | ||||||||||||||||||||||||
| Change in employee benefit plans, net of taxes |
— | — | — | (1,621 | ) | — | — | — | (1,621 | ) | ||||||||||||||||||||||
| Net foreign currency translation adjustment |
— | — | — | — | 29,822 | — | 4,267 | 34,089 | ||||||||||||||||||||||||
| Stock options exercised |
2,000 | 41 | — | — | — | — | — | 41 | ||||||||||||||||||||||||
| Restricted stock awards granted, net of forfeitures |
(13,084 | ) | — | — | — | — | — | — | — | |||||||||||||||||||||||
| Stock-based compensation expense |
— | 889 | — | — | — | — | — | 889 | ||||||||||||||||||||||||
| Common stock repurchased |
(215,841 | ) | (777 | ) | — | — | — | (4,237 | ) | — | (5,014 | ) | ||||||||||||||||||||
| Cash dividends declared |
— | — | — | — | — | (10,737 | ) | — | (10,737 | ) | ||||||||||||||||||||||
| ($0.45 per share) |
||||||||||||||||||||||||||||||||
| Redeemable preferred dividend and accretion |
— | — | — | — | — | (18,912 | ) | — | (18,912 | ) | ||||||||||||||||||||||
| Non-controlling interest |
— | — | — | — | — | — | 63,200 | 63,200 | ||||||||||||||||||||||||
| Uniwheels additional tenders |
— | (314 | ) | — | — | — | — | (15,718 | ) | (16,032 | ) | |||||||||||||||||||||
|
|
|
|
|
|
|
|
|
|
|
|
|
|
|
|
|
|||||||||||||||||
| BALANCE AT FISCAL YEAR END 2017 |
24,917,025 | $ | 89,755 | $ | (8,498 | ) | $ | (5,257 | ) | $ | (75,366 | ) | $ | 393,146 | $ | 51,943 | $ | 445,723 | ||||||||||||||
|
|
|
|
|
|
|
|
|
|
|
|
|
|
|
|
|
|||||||||||||||||
The accompanying notes are an integral part of these consolidated financial statements.
62
Table of Contents
SUPERIOR INDUSTRIES INTERNATIONAL, INC.
CONSOLIDATED STATEMENTS OF CASH FLOWS
(Dollars in thousands)
| Fiscal Year Ended December 31, |
2017 | 2016 | 2015 | |||||||||
| CASH FLOWS FROM OPERATING ACTIVITIES: |
||||||||||||
| Net income |
$ | (6,009 | ) | $ | 41,381 | $ | 23,944 | |||||
| Adjustments to reconcile net income to net cash provided by operating activities: |
||||||||||||
| Depreciation and amortization |
69,335 | 34,261 | 34,530 | |||||||||
| Income tax, non-cash changes |
(3,395 | ) | (4,669 | ) | (9,531 | ) | ||||||
| Impairments of long-lived assets and other charges |
— | — | 2,688 | |||||||||
| Stock-based compensation |
2,576 | 3,618 | 2,807 | |||||||||
| Debt amortization |
7,328 | — | — | |||||||||
| Other non-cash items |
1,133 | 812 | 1,400 | |||||||||
| Changes in operating assets and liabilities: |
||||||||||||
| Accounts receivable |
4,599 | 8,043 | (14,030 | ) | ||||||||
| Inventories |
(1,264 | ) | (22,339 | ) | 11,509 | |||||||
| Other assets and liabilities |
(8,214 | ) | 6,244 | 2,469 | ||||||||
| Accounts payable |
1,411 | 15,880 | (1,132 | ) | ||||||||
| Income taxes |
(3,790 | ) | (4,740 | ) | 4,695 | |||||||
|
|
|
|
|
|
|
|||||||
| NET CASH PROVIDED BY OPERATING ACTIVITIES |
63,710 | 78,491 | 59,349 | |||||||||
|
|
|
|
|
|
|
|||||||
| CASH FLOWS FROM INVESTING ACTIVITIES: |
||||||||||||
| Additions to property, plant and equipment |
(70,937 | ) | (39,575 | ) | (39,543 | ) | ||||||
| Acquisition of Uniwheels, net of cash acquired |
(706,733 | ) | — | — | ||||||||
| Proceeds from sales and maturities of investments |
— | 200 | 3,750 | |||||||||
| Purchase of investments |
— | — | (950 | ) | ||||||||
| Proceeds from sales of fixed assets |
56 | 4,337 | 1,815 | |||||||||
| Other |
— | — | (18 | ) | ||||||||
|
|
|
|
|
|
|
|||||||
| NET CASH USED IN INVESTING ACTIVITIES |
(777,614 | ) | (35,038 | ) | (34,946 | ) | ||||||
|
|
|
|
|
|
|
|||||||
| CASH FLOWS FROM FINANCING ACTIVITIES: |
||||||||||||
| Proceeds from issuance of long-term debt |
975,571 | — | — | |||||||||
| Proceeds from issuance of redeemable preferred shares |
150,000 | — | — | |||||||||
| Debt repayment |
(323,177 | ) | — | — | ||||||||
| Cash dividends paid |
(19,473 | ) | (18,340 | ) | (19,082 | ) | ||||||
| Cash paid for common stock repurchase |
(5,014 | ) | (20,719 | ) | (19,638 | ) | ||||||
| Payments related to tax withholdings for stock-based compensation |
(1,687 | ) | — | — | ||||||||
| Net increase (decrease) in short term debt |
(10,877 | ) | — | — | ||||||||
| Proceeds from borrowings on revolving credit facility |
71,750 | — | — | |||||||||
| Repayments of borrowings on revolving credit facility |
(100,650 | ) | — | — | ||||||||
| Proceeds from exercise of stock options |
41 | 1,641 | 7,265 | |||||||||
| Redeemable preferred shares issuance costs |
(3,737 | ) | — | — | ||||||||
| Financing costs paid |
(31,640 | ) | — | — | ||||||||
| Excess tax benefits from exercise of stock options |
— | 91 | 107 | |||||||||
|
|
|
|
|
|
|
|||||||
| NET CASH PROVIDED BY (USED IN) FINANCING ACTIVITIES |
701,107 | (37,327 | ) | (31,348 | ) | |||||||
|
|
|
|
|
|
|
|||||||
| Effect of exchange rate changes on cash |
1,371 | (376 | ) | (3,470 | ) | |||||||
|
|
|
|
|
|
|
|||||||
| Net increase (decrease) in cash and cash equivalents |
(11,426 | ) | 5,750 | (10,415 | ) | |||||||
| Cash and cash equivalents at the beginning of the period |
57,786 | 52,036 | 62,451 | |||||||||
|
|
|
|
|
|
|
|||||||
| Cash and cash equivalents at the end of the period |
$ | 46,360 | $ | 57,786 | $ | 52,036 | ||||||
|
|
|
|
|
|
|
|||||||
The accompanying notes are an integral part of these consolidated financial statements.
63
Table of Contents
SUPERIOR INDUSTRIES INTERNATIONAL, INC.
NOTES TO CONSOLIDATED FINANCIAL STATEMENTS
December 31, 2017
NOTE 1 - SUMMARY OF SIGNIFICANT ACCOUNTING POLICIES
Nature of Operations
Headquartered in Southfield, Michigan, the principal business of Superior Industries International, Inc. (referred to herein as “Superior”, the “Company” or “we,” “us” and “our”) is the design and manufacture of aluminum wheels for sale to original equipment manufacturers (“OEMs”). We are one of the largest suppliers of cast aluminum wheels to the world’s leading automobile and light truck manufacturers, with manufacturing operations in the United States, Mexico, Germany and Poland. Customers in North America and Europe represent the principal markets for our products. On May 30, 2017, we acquired Uniwheels, a large European supplier of OEM aluminum wheels, as well as a supplier of European aftermarket wheels, which we believe is viewed as one of the technological leaders in the market for alloy wheels. As a result of the Uniwheels acquisition, we have determined that our North American and European businesses should be treated as separate reportable segments in view of differences in economic circumstances, markets and customers as further described in Note 6, “Business Segments”.
Presentation of Consolidated Financial Statements
The consolidated financial statements include the accounts of the company and its wholly owned subsidiaries. All intercompany transactions are eliminated in consolidation.
We have made a number of estimates and assumptions related to the reporting of assets, liabilities, revenues and expenses to prepare these financial statements in conformity with U.S. GAAP as delineated by the FASB in its ASC. Generally, assets and liabilities that are subject to estimation and judgment include the allowance for doubtful accounts, inventory valuation, amortization of preproduction costs, impairment of and the estimated useful lives of our long-lived assets, intangible assets and goodwill, self-insurance portions of employee benefits, workers’ compensation and general liability programs, fair value of stock-based compensation, income tax liabilities and deferred income taxes. While actual results could differ, we believe such estimates to be reasonable.
The fiscal year for 2017 consisted of the 53-week period ended December 31, 2017 and the 2016 and 2015 fiscal years consisted of the 52-week periods ended on December 25, 2016 and December 27, 2015, respectively. Historically our fiscal year ended on the last Sunday of the calendar year. Uniwheels, our European operation acquired on May 30, 2017, is reported on a calendar year end. These fiscal periods align as of December 31, 2017. Beginning in 2018, both our North American and European operations will be on a calendar fiscal year with each month ending on the last day of the calendar month. For convenience of presentation, all fiscal years are referred to as beginning as of January 1, and ending as of December 31, but actually reflect our financial position and results of operations for the periods described above.
Cash and Cash Equivalents
Cash and cash equivalents generally consist of cash, certificates of deposit and fixed deposits and money market funds with original maturities of three months or less. Our cash and cash equivalents are not subject to significant interest rate risk due to the short maturities of these investments. Certificates of deposit and fixed deposits whose original maturity is greater than three months and is one year or less are classified as short-term investments and certificates of deposit and fixed deposits whose maturity is greater than one year at the balance sheet date are classified as non-current assets in our consolidated balance sheets. The purchase of any certificates of deposit or fixed deposits that are classified as short-term investments or non-current assets appear in the investing section of our consolidated statements of cash flows. At times throughout the year and at year-end, cash balances held at financial institutions were in excess of federally insured limits.
64
Table of Contents
Restricted Deposits
We purchase certificates of deposit that mature within twelve months and are used to secure or collateralize letters of credit securing our workers’ compensation obligations. At December 31, 2017 and 2016, certificates of deposit totaling $0.8 million were restricted in use and were classified as short-term investments on our consolidated balance sheet.
Derivative Financial Instruments and Hedging Activities
In order to hedge exposure related to fluctuations in foreign currency rates and the cost of certain commodities used in the manufacture of our products, we periodically may purchase derivative financial instruments such as forward contracts, options or collars to offset or mitigate the impact of such fluctuations. Programs to hedge currency rate exposure may address ongoing transactions including, foreign-currency-denominated receivables and payables, as well as specific transactions related to purchase obligations. Programs to hedge exposure to commodity cost fluctuations would be based on underlying physical consumption of such commodity.
We account for our derivative instruments as either assets or liabilities and carry them at fair value. For derivative instruments that hedge the exposure to variability in expected future cash flows that are designated as cash flow hedges, the effective portion of the gain or loss on the derivative instrument is reported as a component of accumulated other comprehensive income or loss in shareholders’ equity and reclassified into income in the same period or periods during which the hedged transaction affects earnings. The ineffective portion of the gain or loss on the derivative instrument, if any, is recognized in current income. To receive hedge accounting treatment, cash flow hedges must be highly effective in offsetting changes to expected future cash flows on hedged transactions. For forward exchange contracts designated as cash flow hedges, changes in the time value are included in the definition of hedge effectiveness. Accordingly, any gains or losses related to this component are reported as a component of accumulated other comprehensive income or loss in shareholders’ equity and reclassified into income in the same period or periods during which the hedged transaction affects earnings. Derivatives that do not qualify as hedges are adjusted to fair value through current income. See Note 5, “Derivative Financial Instruments” for additional information pertaining to our derivative instruments.
We enter into contracts to purchase certain commodities used in the manufacture of our products, such as aluminum, natural gas and other raw materials. These contracts are considered to be derivative instruments under U.S. GAAP. However, upon entering into these contracts, we expect to fulfill our purchase commitments and take full delivery of the contracted quantities of these commodities during the normal course of business. Accordingly, under U.S. GAAP, these purchase contracts are not accounted for as derivatives because they qualify for the normal purchase normal sale exception under U.S. GAAP, unless there is a change in the facts or circumstances that causes management to believe that these commitments would not be used in the normal course of business. See Note 20, “Risk Management” for additional information pertaining to these purchase commitments.
Cash Paid for Interest and Taxes and Non-Cash Investing Activities
Cash paid for interest was $24.3 million, $0.3 million and $0.3 million for the years ended December 31, 2017, 2016 and 2015. Cash paid for income taxes was $11.1 million, $21.9 million and $12.6 million for the years ended December 31, 2017, 2016 and 2015.
As of December 31, 2017, 2016 and 2015, $15.1 million, $4.0 million and $1.1 million, respectively, of equipment had been purchased but not yet paid for and are included in accounts payable and accrued expenses in our consolidated balance sheets.
65
Table of Contents
Accounts Receivable
We maintain an allowance for doubtful accounts receivable based upon the expected collectability of all trade receivables. The allowance is reviewed continually and adjusted for amounts deemed uncollectible by management.
Inventories
Inventories, which are categorized as raw materials, work-in-process or finished goods, are stated at the lower of cost or market using the first-in, first-out method. When necessary, management uses estimates of net realizable value to record inventory reserves for obsolete and/or slow-moving inventory. Aluminum is the primary material component in our inventories. Our aluminum requirements have historically been supplied from two primary vendors, each accounting for more than 10 percent of our aluminum purchases during 2016 and 2015. During 2017, we added an additional vendor and we added the suppliers from our European operations. Despite the diversification of aluminum vendors, the two primary vendors still made up more than 10 percent of our aluminum purchases in 2017.
Property, Plant and Equipment
Property, plant and equipment are carried at cost, less accumulated depreciation. The cost of additions, improvements and interest during construction, if any, are capitalized. Our maintenance and repair costs are charged to expense when incurred. Depreciation is calculated generally on the straight-line method based on the estimated useful lives of the assets.
| Classification |
Expected Useful Life | |||
| Computer equipment |
3 to 5 years | |||
| Production machinery and technical equipment |
3 to 20 years | |||
| Buildings |
15 to 50 years | |||
| Other equipment, operating and office equipment |
3 to 20 years | |||
When property, plant and equipment is replaced, retired or disposed of, the cost and related accumulated depreciation are removed from the accounts. Property, plant and equipment no longer used in operations, which are generally insignificant in amount, are stated at the lower of cost or estimated net realizable value. Gains and losses, if any, are recorded as a component of operating income if the disposition relates to an operating asset. If a non-operating asset is disposed of, any gains and losses are recorded in other income or expense in the period of disposition or write down.
Preproduction Costs and Revenue Recognition Related to Long-Term Supply Arrangements
We incur preproduction engineering and tooling costs related to the products produced for our customers under long-term supply agreements. We expense all preproduction engineering costs for which reimbursement is not contractually guaranteed by the customer or which are in excess of the contractually guaranteed reimbursement amount. We amortize the cost of the customer-owned tooling over the expected life of the wheel program on a straight-line basis. Also, we defer any reimbursements made to us by our customer and recognize the tooling reimbursement revenue over the same period in which the tooling is in use. Changes in the facts and circumstances of individual wheel programs may accelerate the amortization of both the cost of customer-owned tooling and the deferred tooling reimbursement revenues. Recognized tooling reimbursement revenues, which totaled $11.9 million, $8.0 million and $5.8 million in 2017, 2016 and 2015, respectively, are included in net sales in the consolidated income statements. The following tables summarize the unamortized customer-owned
66
Table of Contents
tooling costs included in our other non-current assets, and the deferred tooling revenues included in accrued expenses and other non-current liabilities:
| December 31, |
2017 | 2016 | ||||||
| (Dollars in Thousands) | ||||||||
| Customer-Owned Tooling Costs |
||||||||
| Preproduction costs |
$ | 84,198 | $ | 78,299 | ||||
| Accumulated amortization |
(71,409 | ) | (65,100 | ) | ||||
|
|
|
|
|
|||||
| Net preproduction costs |
$ | 12,789 | $ | 13,199 | ||||
|
|
|
|
|
|||||
| Deferred Tooling Revenue |
||||||||
| Accrued expenses |
$ | 4,654 | $ | 5,419 | ||||
| Other non-current liabilities |
1,974 | 2,593 | ||||||
|
|
|
|
|
|||||
| Total deferred tooling revenue |
$ | 6,628 | $ | 8,012 | ||||
|
|
|
|
|
|||||
Impairment of Goodwill
Goodwill must be tested on at least an annual basis, and as of an interim period if an event or circumstance indicates that an impairment is more likely than not to have occurred. In conducting our annual impairment testing, we may first perform a qualitative assessment of whether it is more likely than not that a reporting unit’s fair value is less than its carrying amount. If not, no further goodwill impairment testing is performed. If it is more likely than not that a reporting unit’s fair value is less than its carrying amount, or if we elect not to perform a qualitative assessment of a reporting unit, we compare the fair value of the reporting unit to the related net book value. If the net book value of a reporting unit exceeds its fair value, an impairment loss is measured and recognized. We conduct our annual impairment testing as of December 31 of each year.
Impairment of Long-Lived Assets and Investments
In accordance with ASC 360 entitled “Property, Plant and Equipment”, management evaluates the recoverability and estimated remaining lives of long-lived assets. The company reviews long-lived assets for impairment whenever facts and circumstances suggest that the carrying value of the assets may not be recoverable or the useful life has changed.
When facts and circumstances indicate that there may have been a loss in value, management will also evaluate its cost method investments to determine whether there was an other-than-temporary impairment. If a loss in the value of the investment is determined to be other than temporary, then the decline in value is recognized as a loss.
Foreign Currency Transactions and Translation
We have wholly-owned foreign subsidiaries with operations in Mexico and Europe whose functional currency is the peso and Euro, respectively. In addition, we have operations with U.S. dollar functional currency with transactions denominated in pesos and other currencies and operations in Europe with Euro functional currency with transactions denominated in Polish Zlotys and other currencies. These operations had monetary assets and liabilities that were denominated in currencies that were different than their functional currency and were translated into the functional currency of the entity using the exchange rate in effect at the end of each accounting period. Any gains and losses recorded as a result of the remeasurement of monetary assets and liabilities into the functional currency are reflected as transaction gains and losses and included in other expense, net in the consolidated income statements. We had foreign currency transaction gains of $12.9 million in 2017 and losses of $0.4 million and $1.2 million in 2016 and 2015, respectively, which are included in other income (expense), net in the consolidated income statements. In addition, we had a minority investment in India that had a functional currency of the Indian rupee which was divested in September 2017.
67
Table of Contents
When our foreign subsidiaries translate their financial statements from the functional currency to the reporting currency, the balance sheet accounts are translated using the exchange rates in effect at the end of the accounting period and retained earnings is translated using historical rates. The income statement accounts are generally translated at the weighted average of exchange rates during the period and the cumulative effect of translation is recorded as a separate component of accumulated other comprehensive income or loss in shareholders’ equity, as reflected in the consolidated statements of shareholders’ equity. The value of the Mexican peso and Euro increased 5.1 percent and 7.2 percent, respectively, in relation to the U.S. dollar, while the Zloty remained essentially flat in relation to the Euro in 2017.
Revenue Recognition
Sales of products and any related costs are recognized when title and risk of loss transfers to the purchaser, generally upon shipment. Tooling reimbursement revenues related to initial tooling reimbursed by our customers are deferred and recognized over the expected life of the wheel program on a straight-line basis, as discussed above.
Research and Development
Research and development costs (primarily engineering and related costs) are expensed as incurred and are included in cost of sales in the consolidated income statements. Amounts expensed during 2017, 2016 and 2015 were $7.7 million, $3.8 million and $2.6 million, respectively.
Value-Added Taxes
Value-added taxes that are collected from customers and remitted to taxing authorities are excluded from sales and cost of sales.
Stock-Based Compensation
We account for stock-based compensation using the estimated fair value recognition method in accordance with U.S. GAAP. We recognize these compensation costs net of the applicable forfeiture rate and recognize the compensation costs for only those shares expected to vest on a straight-line basis over the requisite service period of the award, which is generally the vesting term of three to four years. We estimate the forfeiture rate based on our historical experience. See Note 18, “Stock-Based Compensation” for additional information concerning our share-based compensation awards.
Income Taxes
We account for income taxes using the asset and liability method. The asset and liability method requires the recognition of deferred tax assets and liabilities for expected future tax consequences of temporary differences that currently exist between the tax basis and financial reporting basis of our assets and liabilities. We calculate current and deferred tax provisions based on estimates and assumptions that could differ from actual results reflected on the income tax returns filed during the following years. Adjustments based on filed returns are recorded when identified in the subsequent years.
The effect on deferred taxes for a change in tax rates is recognized in income in the period that the tax rate change is enacted. In assessing the realizability of deferred tax assets, we consider whether it is more likely than not that some portion of the deferred tax assets will not be realized. A valuation allowance is provided for deferred income tax assets when, in our judgment, based upon currently available information and other factors, it is more likely than not that all or a portion of such deferred income tax assets will not be realized. The determination of the need for a valuation allowance is based on an on-going evaluation of current information including, among other things, historical operating results, estimates of future earnings in different taxing
68
Table of Contents
jurisdictions and the expected timing of the reversals of temporary differences. We believe that the determination to record a valuation allowance to reduce a deferred income tax asset is a significant accounting estimate because it is based, among other things, on an estimate of future taxable income in the U.S. and certain other jurisdictions, which is susceptible to change and may or may not occur, and because the impact of adjusting a valuation allowance may be material.
In determining when to release the valuation allowance established against our net deferred income tax assets, we consider all available evidence, both positive and negative. Consistent with our policy, the valuation allowance against our net deferred income tax assets will not be reversed until such time as we have generated three years of cumulative pre-tax income and have reached sustained profitability, which we define as two consecutive one year periods of pre-tax income.
We account for uncertain tax positions utilizing a two-step approach to evaluate tax positions. Step one, recognition, requires evaluation of the tax position to determine if based solely on technical merits it is more likely than not to be sustained upon examination. Step two, measurement, is addressed only if a position is more likely than not to be sustained. In step two, the tax benefit is measured as the largest amount of benefit, determined on a cumulative probability basis, which is more-likely-than-not to be realized upon ultimate settlement with tax authorities. If a position does not meet the more-likely-than-not threshold for recognition in step one, no benefit is recorded until the first subsequent period in which the more likely than not standard is met, the issue is resolved with the taxing authority, or the statute of limitations expires. Positions previously recognized are derecognized when we subsequently determine the position no longer is more likely than not to be sustained. Evaluation of tax positions, their technical merits, and measurements using cumulative probability are highly subjective management estimates. Actual results could differ materially from these estimates.
Presently, we have not recorded a deferred tax liability for temporary differences related to investments in foreign subsidiaries that are essentially permanent in duration. These temporary differences may become taxable upon a repatriation of earnings from the subsidiaries or a sale or liquidation of the subsidiaries. At this time the company does not have any plans to repatriate income from its foreign subsidiaries.
Earnings (Loss) Per Share
As summarized below, basic earnings (loss) per share is computed by dividing net income (loss) attributable to Superior, less preferred dividends, by the weighted average number of common shares outstanding for the period. For purposes of calculating diluted earnings per share, net income is divided by the total of the weighted average shares outstanding plus the dilutive effect outstanding stock options and restricted stock under the treasury stock method, which includes consideration of stock-based compensation required by U.S. GAAP. The redeemable convertible preferred stock has been excluded from the weighted average shares since inclusion would be
69
Table of Contents
antidilutive. Accordingly, preferred stock dividends (including accretion of the preferred stock redemption premium which has been treated as deemed dividends) have been deducted from net income.
| Year Ended December 31, |
2017 | 2016 | 2015 | |||||||||
| (Dollars in thousands, except per share amounts) | ||||||||||||
| Basic Earnings (Loss) Per Share |
||||||||||||
| Net income (loss) attributable to Superior |
$ | (6,203 | ) | $ | 41,381 | $ | 23,944 | |||||
| Less: Redeemable preferred stock dividends and accretion |
(18,912 | ) | — | — | ||||||||
|
|
|
|
|
|
|
|||||||
| Basic Numerator |
(25,115 | ) | 41,381 | 23,944 | ||||||||
|
|
|
|
|
|
|
|||||||
| Weighted average shares outstanding - basic |
24,929 | 25,439 | 26,599 | |||||||||
|
|
|
|
|
|
|
|||||||
| Basic (loss) earnings per share |
$ | (1.01 | ) | $ | 1.63 | $ | 0.90 | |||||
|
|
|
|
|
|
|
|||||||
| Diluted Earnings Per Share |
||||||||||||
| Net income (loss) attribute to Superior |
$ | (6,203 | ) | $ | 41,381 | $ | 23,944 | |||||
| Less: Redeemable preferred stock dividends and accretion |
(18,912 | ) | — | — | ||||||||
|
|
|
|
|
|
|
|||||||
| Diluted Numerator |
(25,115 | ) | 41,381 | 23,944 | ||||||||
|
|
|
|
|
|
|
|||||||
| Weighted average shares outstanding - basic |
24,929 | 25,439 | 26,599 | |||||||||
| Weighted average dilutive stock options and restricted stock |
— | 100 | 34 | |||||||||
|
|
|
|
|
|
|
|||||||
| Weighted average shares outstanding - diluted |
24,929 | 25,539 | 26,633 | |||||||||
|
|
|
|
|
|
|
|||||||
| Diluted (loss) earnings per share |
$ | (1.01 | ) | $ | 1.62 | $ | 0.90 | |||||
|
|
|
|
|
|
|
|||||||
For the year ended December 31, 2017, no options or restricted stock were included in the diluted earnings per share calculation because to do so would have been anti-dilutive. All stock options and restricted stock have been included in the diluted earnings per share calculations for the year ended December 31, 2016, but for the year ended December 31, 2015, we have excluded options to purchase 147,150 shares at prices ranging from $21.84 to $22.57 because exercise prices exceeded average market price and as a consequence they were antidilutive. In addition, the performance shares discussed in Note 18, “Stock-Based Compensation” are not included in the diluted income per share because the performance metrics had not been met as of December 31, 2017.
New Accounting Pronouncements
In May 2014, the FASB issued ASU 2014-09, Revenue from Contracts with Customers. This update outlines a single, comprehensive model for accounting for revenue from contracts with customers. We plan to adopt this update on January 1, 2018. The guidance permits two methods of adoption: retrospectively to each prior reporting period presented (full retrospective method), or retrospectively with the cumulative effect of initially applying the guidance recognized at the date of initial application (modified retrospective method). We will adopt the standard using the modified retrospective method. We have completed our assessment and do not expect that implementation will have a material effect on our financial position or results of operations.
In February of 2016, the FASB issued ASU 2016-02, Leases (Topic 842) (“ASU 2016-02”). ASU 2016-02 requires an entity to recognize right-of-use assets and lease liabilities on its balance sheet and disclose key information about leasing arrangements. ASU 2016-02 offers specific accounting guidance for a lessee, a lessor and sale and leaseback transactions. Lessees and lessors are required to disclose qualitative and quantitative information about leasing arrangements to enable a user of the financial statements to assess the amount, timing and uncertainty of cash flows arising from leases. For public companies, ASU 2016-02 is effective for annual reporting periods beginning after December 15, 2018, including interim periods within that reporting period, and
70
Table of Contents
requires a modified retrospective adoption, with early adoption permitted. We are evaluating the impact this guidance will have on our financial position and results of operations.
In August 2016, the FASB issued an ASU entitled “Statement of Cash Flows (Topic 740): Classification of Certain Cash Receipts and Cash Payments.” The objective of the ASU is to address the diversity in practice in the presentation of certain cash receipts and cash payments in the statement of cash flows. This ASU is effective for fiscal years beginning after December 15, 2017, including interim periods within those fiscal years. We are evaluating the impact this guidance will have on our statement of cash flows.
In January 2017, the FASB issued an ASU entitled “Intangibles - Goodwill and Other (Topic 350): Simplifying the Test for Goodwill Impairment.” The objective of the ASU is to simplify how an entity is required to test goodwill for impairment by eliminating Step 2 from the goodwill impairment test. Step 2 measures a goodwill impairment loss by comparing the implied fair value of a reporting unit’s goodwill with the carrying amount of that goodwill. This ASU is effective for fiscal years beginning after December 15, 2019, including interim periods within those fiscal years. Early adoption is permitted. We are evaluating the impact this guidance will have on our financial position and results of operations.
In January 2017, the FASB issued an ASU entitled “Business Combinations (Topic 805): Clarifying the Definition of a Business.” The objective of the ASU is to add guidance to assist entities with evaluating whether transactions should be accounted for as acquisitions (or disposals) of assets or businesses. This ASU is effective for fiscal years beginning after December 15, 2017, including interim periods within those fiscal years. We will apply this guidance in the future as applicable.
In March 2017, the FASB issued an ASU entitled “Compensation-Retirement Benefits (Topic 715): Improving the Presentation of Net Periodic Pension Cost and Net Periodic Postretirement Benefit Cost.” The objective of the ASU is to improve the reporting of net benefit cost in the financial statements. This ASU is effective for fiscal years beginning after December 15, 2017, including interim periods within those fiscal years. We are evaluating the impact this guidance will have on our financial position and results of operations.
In July 2017, the FASB issued an ASU entitled “(Part I) Accounting for Certain Financial Instruments with Down Round Features, (Part II) Replacement of the Indefinite Deferral for Mandatorily Redeemable Financial instruments of Certain Nonpublic Entities and Certain Mandatorily Redeemable Noncontrolling Interests with a Scope Exception”. The objective of this ASU is to reduce the complexity in accounting for certain financial instruments with down round features. When determining whether certain financial instruments should be classified as debt or equity instruments, a down round feature would no longer preclude equity classification when assessing whether the instrument is indexed to an entity’s own stock. As a result, a freestanding equity-linked financial instrument (or embedded conversion option) no longer would be accounted for as a derivative liability at fair value as a result of the existence of a down round feature. We are evaluating the impact this guidance will have on our financial position and results of operations.
In August 2017, the FASB issued an ASU entitled “Derivatives and Hedging (Topic 815).” The objective of this standard is to better align financial reporting with risk management activities, provide a more faithful representation of hedging activities and reduce complexity and costs associated with hedging. This ASU removes the requirement to recognize hedge ineffectiveness in income prior to settlement, allows documentation of hedge effectiveness at inception to be completed by quarter-end, allows qualitative rather than quantitative assessment of effectiveness (subsequent to initial quantitative assessment), allows critical terms match for cash flow hedges of a group of forecasted transactions if derivatives mature within the same month as transactions, permits use of the “back up” long haul method for hedges initially designated using the short cut method and permits cash flow hedging of a component of purchases and sales of non-financial assets (i.e., commodity price excluding transportation) resulting in higher hedge effectiveness. The ASU also permits fair value hedging of the benchmark interest rate component of interest rate risk as well as partial term hedging, allows partial term fair value hedges of interest rate risk, permits cash flow hedging of interest rate risk for a contractually specified rate
71
Table of Contents
rather than a benchmark rate and permits exclusion of cross currency basis spread in determining effectiveness. This ASU is effective for fiscal years beginning after December 15, 2018 and early adoption is permitted. We are evaluating the impact this guidance will have on our financial position and statement of operations.
On December 22, 2017, The Securities and Exchange Commission issued Staff Accounting Bulletin No. 118 (SAB 118) to provide guidance regarding accounting and disclosure for tax effects arising from changes in tax regulations under the Tax Cuts and Jobs Act (the “Act”) enacted December 22, 2017. The Act contains significant changes to corporate taxation, including reduction in the corporate tax rate from 35 percent to 21 percent, a one-time transition tax on offshore earnings at reduced tax rates, elimination of U.S. tax on foreign dividends, new taxes on certain foreign earnings, a new minimum tax related to payments to foreign subsidiaries and affiliates, immediate deductions for certain new investments and the modification or repeal of many business deductions and credits. The Act will also have tax consequences for many companies that operate internationally. Generally, the SEC guidance directs companies to recognize income tax effects where requisite analysis can be completed prior to issuance of financial statements; estimate income tax effects where analysis is not yet complete but a reasonable estimate can be determined; and disclose effects where no reasonable estimate can be determined. The reasonable estimate would be reported as a provisional amount during a “measurement period.” In circumstances in which provisional amounts cannot be prepared, tax provisions should be determined based on tax laws in effect immediately prior to enactment of the Act. Disclosures should include tax effects for which accounting is incomplete; items reported as provisional amounts; current or deferred tax amounts for which the income tax effects of the Act have not been completed; the reason the initial accounting is incomplete; additional information needed to complete the accounting requirements under ASC Topic 740; nature and amount of any measurement period adjustments recognized during the reporting period; effect of measurement period adjustments on the effective tax rate; and the point at which accounting for the all tax effects of the Act has been completed. Refer to Note 14, “Income Taxes” in the Notes to the Consolidated Financial Statements in Item 8 for additional information including the impact of the Act on our financial position and results of operations.
NOTE 2 - ACQUISITION
On March 23, 2017, Superior announced that it had entered into various agreements to commence a tender offer to acquire 100 percent of the outstanding equity interests of Uniwheels (the “Acquisition”) through a newly-formed, wholly-owned subsidiary (the “Acquisition Sub”). The Acquisition will be effected through a multi-step process as more fully described below.
In the first step of the Acquisition, on March 23, 2017, Superior obtained a commitment from the owner of approximately 61 percent of the outstanding stock of Uniwheels, Uniwheels Holding (Malta) Ltd. (the “Significant Holder”), evidenced by an irrevocable undertaking agreement (the “Undertaking Agreement”) to tender such stock in the second step of the Acquisition. In connection with the Undertaking Agreement, on March 23, 2017: (i) Superior entered into a business combination agreement with Uniwheels pursuant to which, subject to the provisions of the German Stock Corporation Act, Uniwheels and its subsidiaries undertook to, among other things, cooperate with the financing of the Acquisition; and (ii) Superior and the Significant Holder entered into a guarantee and indemnification agreement pursuant to which Superior will hold the Significant Holder harmless for claims that may arise relating to its involvement with Uniwheels. As Uniwheels was a company listed on the Warsaw Stock Exchange, the Acquisition was required to be carried out in accordance with the Polish Act of 29 July 2005 on Public Offerings and the Conditions for Introducing Financial Instruments to Organized Trading and Public Companies (the “Public Offering Act”).
Following the publication of a formal tender offer document by Superior, as required by the Public Offering Act, Superior commenced the acceptance period for the tender offer (the “Tender Offer”) on April 12, 2017, pursuant to which Superior offered to purchase all (but not less than 75 percent) of the outstanding stock of Uniwheels and, upon the consummation of the Tender Offer, agreed to purchase the stock of the Significant Holder along with all other stock of Uniwheels tendered pursuant to the Tender Offer. On May 30, 2017, Superior acquired 92.3 percent of the outstanding stock of Uniwheels for approximately $703.0 million (based on an exchange rate of 1.00 Dollar = 3.74193 Polish Zloty). We refer to this acquisition as the “First Step Acquisition.”
72
Table of Contents
Under the terms of the Tender Offer:
| • | the Significant Holder received cash consideration of Polish Zloty 226.5 per share; and |
| • | Uniwheels’ other shareholders received cash consideration of Polish Zloty 247.87 per share, equivalent to the volume weighted-average-price of Uniwheels’ shares for the three months prior to commencement of the Tender Offer, plus 5.0 percent. |
On June 30, 2017, the company announced that it had commenced the delisting and associated tender process for the remaining outstanding shares of Uniwheels. As of July 31, 2017, 153,251 additional shares (representing 1.2 percent of Uniwheels shares) were tendered at Polish Zloty 247.87 per share. On December 15, 2017, an additional 75,000 shares (representing 0.6 percent of Uniwheels shares) were tendered at Polish Zloty 262.50 per share.
Superior decided to pursue a DPLTA, without concurrently pursuing a merger/squeeze-out. This was executed and became effective in January 2018. This approach enables Superior to realize substantial synergies of a consolidated entity without the distraction or expense associated with simultaneously pursuing the purchase of the remaining shares. According to the terms of the DPLTA, Superior AG offered to purchase any further tendered shares for cash consideration of Euro 62.18, or approximately Polish Zloty 264 per share. This cash consideration may be subject to change based on appraisal proceedings that the minority shareholders of Uniwheels have initiated. Because the aggregate equity purchase price of the Acquisition (assuming an exchange rate of 1.00 Dollar = 3.74193 Polish Zloty) was determined at the time of the initial acquisition, any increase in the resulting price must be reflected as a reduction to common stock. For each share that is not tendered, Superior will be obligated to pay a guaranteed annual dividend of Euro 3.23 as long as the DPLTA is in effect beginning in 2019.
The aggregate equity purchase price of the Acquisition (assuming the remaining shares of Uniwheels’ stock are acquired for cash consideration of Polish Zloty 247.87 per share, the price paid to Uniwheels’ shareholders in the Tender Offer, and an exchange rate of 1.00 Dollar = 3.74193 Polish Zloty) will be approximately $778.0 million, including the cost of shares which have not yet been tendered. We entered into foreign currency hedges prior to the closing of the First Step Acquisition intended to reduce currency risk associated with the settlement of the Tender Offer (the “Hedging Transactions”). The net benefit of such Hedging Transactions to Superior reduced the total anticipated purchase price of the Acquisition to $766.2 million.
The company’s consolidated financial statements for the year ended December 31, 2017 include Uniwheels results of operations subsequent to May 30, 2017 (please see Note 6, “Business Segments” for the segment results in 2017). The company’s consolidated financial statements reflect the purchase accounting adjustments in accordance with ASC 805 “Business Combinations”, whereby the purchase price was allocated to the assets acquired and liabilities assumed based upon their estimated fair values on the acquisition date.
73
Table of Contents
During the fourth quarter of 2017, the company obtained an updated valuation of the identifiable assets acquired and the liabilities assumed. The following is the preliminary allocation of the purchase price:
| (Dollars in thousands) | ||||
| Estimated purchase price |
||||
| Cash consideration |
$ | 703,000 | ||
|
|
|
|||
| Non-controlling interest |
63,200 | |||
|
|
|
|||
| Preliminary purchase price allocation |
||||
| Cash and cash equivalents |
12,296 | |||
| Accounts receivable |
60,580 | |||
| Inventories |
83,901 | |||
| Prepaid expenses and other current assets |
11,859 | |||
|
|
|
|||
| Total current assets |
168,636 | |||
| Property and equipment |
259,784 | |||
| Intangible assets (1) |
205,000 | |||
| Goodwill |
286,249 | |||
| Other assets |
32,987 | |||
|
|
|
|||
| Total assets acquired |
952,656 | |||
|
|
|
|||
| Accounts payable |
61,883 | |||
| Other current liabilities |
40,903 | |||
|
|
|
|||
| Total current liabilities |
102,786 | |||
| Other long-term liabilities |
83,670 | |||
|
|
|
|||
| Total liabilities assumed |
186,456 | |||
|
|
|
|||
| Net assets acquired |
$ | 766,200 | ||
|
|
|
|||
| (1) | Intangible assets are recorded at estimated fair value, as determined by management based on available information which includes a preliminary valuation prepared by an independent third party. The fair values assigned to identifiable intangible assets were determined through the use of the income approach, specifically the relief from royalty and multi-period excess earnings methods. The major assumptions used in arriving at the estimated identifiable intangible asset values included management’s estimates of future cash flows, discounted at an appropriate rate of return which are based on the weighted average cost of capital for both the company and other market participants. The useful lives for intangible assets were determined based upon the remaining useful economic lives of the intangible assets that are expected to contribute directly or indirectly to future cash flows. The estimated fair value of intangible assets and related useful lives as included in the preliminary purchase price allocation include: |
| Estimated Fair Value |
Estimated Useful Life (in Years) |
|||||||
| (Dollars in thousands) | ||||||||
| Brand name |
$ | 9,000 | 4-6 | |||||
| Technology |
15,000 | 4-6 | ||||||
| Customer relationships |
167,000 | 7-11 | ||||||
| Trade names |
14,000 | Indefinite | ||||||
|
|
|
|||||||
| $ | 205,000 | |||||||
|
|
|
|||||||
The above goodwill represents future economic benefits expected to be recognized from the company’s expansion into the European wheel market, as well as expected future synergies and operating efficiencies from combining operations with Uniwheels. Acquisition goodwill of $304.8 million (initial balance of $286.2 million, increased for post-acquisition translation adjustments) has been allocated to the European segment.
74
Table of Contents
The following unaudited combined pro forma information is for informational purposes only. The pro forma information is not necessarily indicative of what the combined company’s results actually would have been had the Acquisition been completed as of the beginning of the periods as indicated. In addition, the unaudited pro forma information does not purport to project the future results of the combined company.
| Twelve Months Ended | ||||||||
| December 31, 2017 |
December 31, 2016 |
|||||||
| Proforma | Proforma | |||||||
| (Dollars in thousands) | ||||||||
| Net sales as reported |
$ | 1,108,055 | $ | 732,677 | ||||
| Uniwheels sales, prior to the Acquisition |
243,744 | 513,571 | ||||||
|
|
|
|
|
|||||
| Proforma combined sales |
$ | 1,351,799 | $ | 1,246,248 | ||||
|
|
|
|
|
|||||
| Net (loss) income as reported |
$ | (6,009 | ) | $ | 41,381 | |||
| Uniwheels net income before income taxes, prior to the Acquisition |
25,394 | 55,883 | ||||||
| Incremental interest expense on the debt |
(17,716 | ) | (42,518 | ) | ||||
| Incremental amortization on the identifiable intangible assets |
(9,769 | ) | (23,446 | ) | ||||
| Transaction expenses incurred by both the company and Uniwheels |
35,906 | — | ||||||
| Income tax expense related to the proforma adjustments |
(10,114 | ) | 7,509 | |||||
|
|
|
|
|
|||||
| Proforma net income |
$ | 17,692 | $ | 38,809 | ||||
|
|
|
|
|
|||||
| Proforma basic and diluted (loss) earnings per share (1) |
$ | (0.55 | ) | $ | 0.28 | |||
|
|
|
|
|
|||||
| (1) | Earnings attributable to Superior common stockholders used in computing basic and diluted earnings per share has been reduced by estimated annual preferred stock dividends (including accretion of the preferred stock redemption premium which has been treated as a deemed dividend). Refer to Note 1 “Summary of Significant Accounting Policies - Earnings per Share” for further information. |
NOTE 3 - RESTRUCTURING
During 2014, we completed a review of initiatives to reduce costs and enhance our competitive position. Based on this review, we committed to a plan to close operations at our Rogers, Arkansas facility, which was completed during the fourth quarter of 2014. The action was undertaken in order to reduce costs and enhance our global competitive position. During 2016, we sold the Rogers facility for total proceeds of $4.3 million, resulting in a $1.4 million gain on sale, which is recorded as a reduction to selling, general and administrative expense in the consolidated income statements.
75
Table of Contents
The total cost incurred as a result of the Rogers facility closure was $16.0 million, of which $0.1 million, $1.5 million, $6.0 million and $8.4 million was recognized as of December 31, 2017, 2016, 2015 and 2014, respectively. The following table summarizes the Rogers, Arkansas plant closure costs and classification in the consolidated income statement for the years ended December 31, 2017, 2016, 2015 and 2014:
| (Dollars in thousands) | Costs Incurred Through December 31, 2016 |
Costs in the Year Ended December 31, 2017 |
Total Costs |
Classification | ||||||||||
| Accelerated and other depreciation of assets idled (1) |
$ | 7,254 | $ | 13 | $ | 7,267 | Cost of sales, Restructuring costs | |||||||
| Severance costs (2) |
Cost of sales, | |||||||||||||
| 2,011 | — | 2,011 | Restructuring costs | |||||||||||
| Equipment removal and impairment, inventory written-down, lease termination and other costs (3) |
6,634 | 125 | 6,759 | Cost of sales, Restructuring costs | ||||||||||
|
|
|
|
|
|
|
|||||||||
| Total restructuring costs |
15,899 | 138 | 16,037 | |||||||||||
| Gain on sale of the facility |
(1,436 | ) | — | (1,436 | ) | |||||||||
|
|
|
|
|
|
|
|||||||||
| Total |
$ | 14,463 | $ | 138 | $ | 14,601 | ||||||||
|
|
|
|
|
|
|
|||||||||
| (1) | Cost of sales includes accelerated depreciation due to shorter useful lives for assets to be retired after operations ceased at the Rogers facility. |
| (2) | The closure resulted in a reduction of workforce of approximately 500 employees and a shift in production to other facilities. |
| (3) | We incurred other associated costs such as moving costs, impairment of assets and other closing costs. In 2016, the majority of the costs related to closing, maintenance and other costs. In 2015, we determined that some of the assets would not ultimately be transferred to other facilities and recorded a $2.7 million impairment. In 2014, the majority of the restructuring costs related to inventory write-downs, moving costs and other costs. |
Changes in the accrued expenses related to restructuring liabilities during the years ended December 31, 2017 and 2016 were less than $0.1 million.
NOTE 4 - FAIR VALUE MEASUREMENTS
The company applies fair value accounting for all financial assets and liabilities and non-financial assets and liabilities that are recognized or disclosed at fair value in the financial statements on a recurring basis, while other assets and liabilities are measured at fair value on a nonrecurring basis, such as when we have an asset impairment. Fair value is estimated by applying the following hierarchy, which prioritizes the inputs used to measure fair value into three levels and bases the categorization within the hierarchy upon the lowest level of input that is available and significant to the fair value measurement:
Level 1 - Quoted prices in active markets for identical assets or liabilities.
Level 2 - Observable inputs other than quoted prices in active markets for identical assets and liabilities, quoted prices for identical or similar assets or liabilities in inactive markets, or other inputs that are observable or can be corroborated by observable market data for substantially the full term of the assets or liabilities.
Level 3 - Inputs that are generally unobservable and typically reflect management’s estimate of assumptions that market participants would use in pricing the asset or liability.
76
Table of Contents
The carrying amounts for cash and cash equivalents, investments in certificates of deposit, accounts receivable, accounts payable and accrued expenses approximate their fair values due to the short period of time until maturity.
Cash and Cash Equivalents
Included in cash and cash equivalents are highly liquid investments that are readily convertible to known amounts of cash, and which are subject to an insignificant risk of change in value due to interest rate, quoted price or penalty on withdrawal. A debt security is classified as a cash equivalent if it meets these criteria and if it has a remaining time to maturity of three months or less from the date of acquisition. Amounts on deposit and available upon demand, or negotiated to provide for daily liquidity without penalty, are classified as cash and cash equivalents. Time deposits, certificates of deposit and money market accounts that meet the above criteria are reported at par value on our balance sheet and are excluded from the table below.
Derivative Financial Instruments
Our derivatives are over-the-counter customized derivative transactions and are not exchange traded. We estimate the fair value of these instruments using industry-standard valuation models such as a discounted cash flow. These models project future cash flows and discount the future amounts to a present value using market-based expectations for interest rates, foreign exchange rates, commodity prices and the contractual terms of the derivative instruments. The discount rate used is the relevant interbank deposit rate (e.g., LIBOR) plus an adjustment for non-performance risk. In certain cases, market data may not be available and we may use broker quotes and models (e.g., Black-Scholes) to determine fair value. This includes situations where there is lack of liquidity for a particular currency or commodity or when the instrument is longer dated. The fair value measurements of the redeemable preferred shares embedded derivatives are based upon Level 3 unobservable inputs reflecting management’s own assumptions about the inputs used in pricing the liability – refer to “Note 5, Derivative Financial Instruments.”
Cash Surrender Value
The cash surrender value of the life insurance policies is the sum of money the insurance company will pay to the company in the event the policy is voluntarily terminated before its maturity or the insured event occurs. Over the term of the life insurance contracts, the cash surrender value changes as a result of premium payments and investment income offset by investment losses, charges and miscellaneous fees. The amount of the asset recorded for the investment in the life insurance contracts is equal to the cash surrender value which is the amount that will be realized under the contract as of the balance sheet date if the insured event occurs.
77
Table of Contents
The following tables categorize items measured at fair value at December 31, 2017 and 2016:
| Fair Value Measurement at Reporting Date Using | ||||||||||||||||
| December 31, 2017 |
Quoted Prices in Active Markets for Identical Assets (Level 1) |
Significant Other Observable Inputs (Level 2) |
Significant Unobservable Inputs (Level 3) |
|||||||||||||
| (Dollars in thousands) | ||||||||||||||||
| Assets |
||||||||||||||||
| Certificates of deposit |
$ | 750 | — | 750 | — | |||||||||||
| Cash surrender value |
8,040 | — | 8,040 | — | ||||||||||||
| Derivative contracts |
6,342 | — | 6,342 | — | ||||||||||||
|
|
|
|
|
|
|
|
|
|||||||||
| Total |
15,132 | — | 15,132 | — | ||||||||||||
|
|
|
|
|
|
|
|
|
|||||||||
| Liabilities |
||||||||||||||||
| Derivative contracts |
16,106 | — | 16,106 | — | ||||||||||||
| Embedded derivative liability |
4,685 | — | — | 4,685 | ||||||||||||
|
|
|
|
|
|
|
|
|
|||||||||
| Total |
$ | 20,791 | — | 16,106 | 4,685 | |||||||||||
|
|
|
|
|
|
|
|
|
|||||||||
| Fair Value Measurement at Reporting Date Using | ||||||||||||||||
| December 31, 2016 |
Quoted Prices in Active Markets for Identical Assets (Level 1) |
Significant Other Observable Inputs (Level 2) |
Significant Unobservable Inputs (Level 3) |
|||||||||||||
| (Dollars in thousands) | ||||||||||||||||
| Assets |
||||||||||||||||
| Certificates of deposit |
$ | 750 | $ | — | $ | 750 | $ | — | ||||||||
| Cash surrender value |
7,480 | — | 7,480 | — | ||||||||||||
| Derivative contracts |
13 | — | 13 | — | ||||||||||||
|
|
|
|
|
|
|
|
|
|||||||||
| Total |
8,243 | — | 8,243 | — | ||||||||||||
|
|
|
|
|
|
|
|
|
|||||||||
| Liabilities |
||||||||||||||||
| Derivative contracts |
24,773 | — | 24,773 | — | ||||||||||||
|
|
|
|
|
|
|
|
|
|||||||||
| Total |
$ | 24,773 | $ | — | $ | 24,773 | $ | — | ||||||||
|
|
|
|
|
|
|
|
|
|||||||||
The following table summarizes the changes during 2017 in level 3 fair value measurement of the embedded derivative liability relating to the redeemable preferred shares issued May 22, 2017 in connection with the acquisition of Uniwheels:
| Year Ended December 31, |
2017 | |||
| (Dollars in thousands) | ||||
| Change in fair value: |
||||
| Beginning fair value at date of issuance on May 22, 2017 |
$ | 10,849 | ||
| Change in fair value of redeemable preferred stock embedded derivative liability |
(6,164 | ) | ||
|
|
|
|||
| Ending fair value at December 31, 2017 |
$ | 4,685 | ||
|
|
|
|||
Debt Instruments
The carrying values of the company’s debt instruments vary from their fair values. The fair values were determined by reference to transacted prices of these securities (Level 2 input based on the GAAP fair value
78
Table of Contents
hierarchy). The estimated fair value, as well as the carrying value, of the company’s debt instruments are shown below (in thousands):
| December 31, 2017 |
||||
| (Dollars in thousands) | ||||
| Estimated aggregate fair value |
$ | 704,005 | ||
| Aggregate carrying value (1) |
707,864 | |||
(1) Long-term debt excluding the impact of unamortized debt issuance costs.
NOTE 5 - DERIVATIVE FINANCIAL INSTRUMENTS
Derivative Instruments and Hedging Activities
We use derivatives to partially offset our business exposure to foreign currency risk. We may enter into forward contracts, option contracts, swaps, collars or other derivative instruments to offset some of the risk on expected future cash flows and on certain existing assets and liabilities. However, we may choose not to hedge certain exposures for a variety of reasons including, but not limited to, accounting considerations and the prohibitive economic cost of hedging particular exposures. During 2017, the Company entered into a Euro cross currency swap to effectively convert Uniwheels Euro denominated earnings into dollars for use in repaying the debt issued to finance the acquisition. There can be no assurance the hedges will offset more than a portion of the financial impact resulting from movements in foreign currency exchange rates.
To help protect gross margins from fluctuations in foreign currency exchange rates, certain of our subsidiaries whose functional currency is the U.S. dollar hedge a portion of forecasted foreign currency costs. Generally, we may hedge portions of our forecasted foreign currency exposure associated with costs, typically for up to 48 months.
We record all derivatives in the consolidated balance sheet at fair value. Our accounting for these instruments depends on whether the hedges have been designated for hedge accounting treatment. For hedges subject to hedge accounting treatment, the effective portions of cash flow hedges are recorded in accumulated other comprehensive income or loss until the hedged item is recognized in earnings. The ineffective portions of cash flow hedges are recorded in cost of sales. Derivatives that are not designated as hedging instruments are adjusted to fair value through earnings in the financial statement line item to which the derivative relates. At December 31, 2017, the Company held derivatives that were designated for hedge accounting treatment as well as derivatives that did not qualify or had not been designated for hedge accounting treatment. All derivatives were designated as hedging instruments at December 31, 2016.
Deferred gains and losses associated with cash flow hedges of foreign currency costs are recognized as a component of cost of sales in the same period as the related cost is recognized. Our foreign currency transactions hedged with cash flow hedges as of December 31, 2017, are expected to occur within 1 month to 48 months.
Derivative instruments designated as cash flow hedges must be de-designated as hedges when it is probable the forecasted hedged transaction will not occur in the initially identified time period or within a subsequent two-month time period. Deferred gains and losses in accumulated other comprehensive income or loss associated with such derivative instruments are reclassified immediately into other expense. Any subsequent changes in fair value of such derivative instruments are reflected in other expense unless they are re-designated as hedges of other transactions.
Redeemable Preferred Stock Embedded Derivative
We have determined that the conversion option embedded in the Series A redeemable preferred stock is required to be accounted for separately from the Series A redeemable preferred stock as a derivative liability. Separation
79
Table of Contents
of the conversion option as a derivative liability is required because its economic characteristics are considered more akin to an equity instrument and therefore the conversion option is not considered to be clearly and closely related to the economic characteristics of the redeemable preferred stock. This is because the economic characteristics of the redeemable preferred stock are considered more akin to a debt instrument due to the fact that the shares are redeemable at the holder’s option, the redemption value is significantly greater than the face amount, the shares carry a fixed mandatory dividend and the stock price necessary to make conversion more attractive than redemption is $56.324 and is significantly greater than the company’s stock price at the date of issuance of $19.05, all of which lead to the conclusion that redemption is more likely than conversion. For additional information on the redeemable preferred stock, see Note 13, “Redeemable Preferred Shares”.
We have also determined that the early redemption option upon the occurrence of a redemption event (e.g. change of control) must be bifurcated and accounted for separately from the redeemable preferred stock at fair value, because the debt host contract involves a substantial discount (face of $150.0 million as compared to the redemption value of $300 million) and exercise of the early redemption option would accelerate the holder’s option to redeem the shares.
Accordingly, we have recorded an embedded derivative liability representing the combined fair value of the right of holders to receive common stock upon conversion of Series A redeemable preferred stock at any time (the “conversion option”) and the right of the holders to exercise their early redemption option upon the occurrence of a redemption event (the “early redemption option”). The embedded derivative liability is adjusted to fair value at each period end with changes in fair value recorded in change in fair value of redeemable preferred stock embedded derivative liability in the company’s consolidated statements of operations (refer to Note 13, “Redeemable Preferred Shares”).
A binomial option pricing model is used to estimate the fair value of the conversion and early redemption options embedded in the redeemable preferred stock. The binomial model utilizes a “decision tree” whereby future movement in the company’s common stock price is estimated based on a volatility factor. The binomial options pricing model requires the development and use of assumptions. These assumptions include estimated volatility of the value of our common stock, assumed possible conversion or early redemption dates, an appropriate risk-free interest rate, risky bond rate and dividend yield.
The expected volatility of the company’s equity is estimated based on the historical volatility of our common stock. The assumed base case term used in the valuation model is the period remaining until May 22, 2024 (the earliest date at which the holder may exercise its unconditional redemption option). A number of other scenarios incorporated earlier redemption dates to address the possibility of early redemption upon the occurrence of a redemption event. The risk-free interest rate is based on the yield on the U.S. Treasury zero coupon yield curve with a remaining term equal to the expected term of the conversion and early redemption options. The significant assumptions utilized in the company’s valuation of the embedded derivatives at December 31, 2017 are as follows: valuation scenario terms between 4.0 and 6.39 years, volatility of 32.0 percent, risk-free rate of 2.1 percent to 2.3 percent related to the respective assumed terms, a risky bond rate of 19.2 percent and a dividend yield of 2.4 percent.
Based on the foregoing assumptions, the fair value of the redeemable preferred stock embedded derivative liability at December 31, 2017 is $4.7 million and the change in fair value of redeemable preferred stock embedded derivative liability during the year was $6.2 million mainly due to the decline in our stock price from $19.05 (at date of issuance) to $14.85 (at December 31, 2017) and the reduction in the remaining term of the options used in the valuation scenarios due to the months elapsed since issuance.
80
Table of Contents
The following tables display the fair value of derivatives by balance sheet line item at December 31, 2017 and December 31, 2016:
| December 31, 2017 | ||||||||||||||||
| Other Current Assets |
Other Non-current Assets |
Accrued Liabilities |
Other Non-current Liabilities |
|||||||||||||
| (Dollars in thousands) | ||||||||||||||||
| Foreign exchange forward contracts and collars designated as hedging instruments |
$ | 3,065 | 723 | 4,922 | 8,405 | |||||||||||
| Foreign exchange forward contracts not designated as hedging instruments |
721 | — | 206 | — | ||||||||||||
| Aluminum forward contracts not designated as hedges |
1,833 | — | — | — | ||||||||||||
| Cross currency swap not designated as hedging instrument |
— | — | 1,467 | 1,106 | ||||||||||||
| Embedded derivative liability |
— | — | — | 4,685 | ||||||||||||
|
|
|
|
|
|
|
|
|
|||||||||
| Total derivative financial instruments |
$ | 5,619 | 723 | 6,595 | 14,196 | |||||||||||
|
|
|
|
|
|
|
|
|
|||||||||
| December 31, 2016 | ||||||||||||||||
| Other Current Assets |
Other Non-current Assets |
Accrued Liabilities |
Other Non-current Liabilities |
|||||||||||||
| (Dollars in thousands) | ||||||||||||||||
| Foreign exchange forward contracts and collars designated as hedging instruments |
$ | 13 | $ | — | $ | 10,076 | $ | 14,697 | ||||||||
|
|
|
|
|
|
|
|
|
|||||||||
| Total derivative financial instruments |
$ | 13 | $ | — | $ | 10,076 | $ | 14,697 | ||||||||
|
|
|
|
|
|
|
|
|
|||||||||
The following table summarizes the notional amount and estimated fair value of our derivative financial instruments:
| December 31, 2017 | December 31, 2016 | |||||||||||||||
| Notional U.S. Dollar Amount |
Fair Value |
Notional U.S. Dollar Amount |
Fair Value |
|||||||||||||
| (Dollars in thousands) | ||||||||||||||||
| Foreign currency forward contracts and collars designated as hedging instruments |
$ | 397,744 | $ | (9,539 | ) | $ | 160,461 | $ | 24,760 | |||||||
| Foreign exchange forward contracts not designated as hedging instruments |
23,305 | 515 | — | — | ||||||||||||
| Aluminum forward contracts not designated as hedges |
15,564 | 1,833 | — | — | ||||||||||||
| Cross currency swap not designated as hedging instrument |
36,454 | (2,573 | ) | — | — | |||||||||||
|
|
|
|
|
|
|
|
|
|||||||||
| Total derivative financial instruments |
$ | 473,067 | $ | (9,764 | ) | $ | 160,461 | $ | 24,760 | |||||||
|
|
|
|
|
|
|
|
|
|||||||||
Notional amounts are presented on a gross basis. The notional amounts of the derivative financial instruments do not represent amounts exchanged by the parties and, therefore, are not a direct measure of our exposure to the financial risks described above. The amounts exchanged are calculated by reference to the notional amounts and by other terms of the derivatives, such as interest rates, foreign currency exchange rates or commodity volumes and prices.
81
Table of Contents
The following table provides the impact of derivative instruments designated as cash flow hedges on our consolidated income statement:
| Year ended December 31, 2017 |
Amount of Gain or (Loss) Recognized in AOCI on Derivatives (Effective Portion) |
Amount of Pre-tax
Gain or (Loss) Reclassified from AOCI into Income (Effective Portion) |
Amount of Pre-tax Gain or (Loss) Recognized in Income on Derivatives (Ineffective Portion and Amount Excluded from Effectiveness Testing) |
|||||||||
| (Dollars in thousands) | ||||||||||||
| Foreign currency forward contracts and collars |
$ | 7,603 | $ | (4,539 | ) | $ | (538 | ) | ||||
|
|
|
|
|
|
|
|||||||
| Total |
$ | 7,603 | $ | (4,539 | ) | $ | (538 | ) | ||||
|
|
|
|
|
|
|
|||||||
| Year ended December 31, 2016 |
Amount of Gain or (Loss) Recognized in AOCI on Derivatives (Effective Portion) |
Amount of Pre-tax
Gain or (Loss) Reclassified from AOCI into Income (Effective Portion) |
Amount of Pre-tax Gain or (Loss) Recognized in Income on Derivatives (Ineffective Portion and Amount Excluded from Effectiveness Testing) |
|||||||||
| (Dollars in thousands) | ||||||||||||
| Foreign currency forward contracts and collars |
$ | (6,812 | ) | $ | (13,597 | ) | $ | (156 | ) | |||
|
|
|
|
|
|
|
|||||||
| Total |
$ | (6,812 | ) | $ | (13,597 | ) | $ | (156 | ) | |||
|
|
|
|
|
|
|
|||||||
| Year ended December 31, 2015 |
Amount of Gain or (Loss) Recognized in AOCI on Derivatives (Effective Portion) |
Amount of Pre-tax
Gain or (Loss) Reclassified from AOCI into Income (Effective Portion) |
Amount of Pre-tax Gain or (Loss) Recognized in Income on Derivatives (Ineffective Portion and Amount Excluded from Effectiveness Testing) |
|||||||||
| (Dollars in thousands) | ||||||||||||
| Foreign currency forward contracts and collars |
$ | (4,524 | ) | $ | (9,960 | ) | $ | 19 | ||||
|
|
|
|
|
|
|
|||||||
| Total |
$ | (4,524 | ) | $ | (9,960 | ) | $ | 19 | ||||
|
|
|
|
|
|
|
|||||||
82
Table of Contents
NOTE 6 - BUSINESS SEGMENTS
As a result of the Acquisition, the company expanded into the European market and extended its customer base to include the principal European OEMs. As a consequence, we have realigned our executive management structure, organization and operations to focus on our performance in our North American and European regions. In accordance with the requirements of ASC Topic 280, “Segment Reporting,” we have concluded that our North American and European businesses represent separate operating segments in view of significantly different markets, customers and products within each of these regions. Each operating segment has discrete financial information which is evaluated regularly by the company’s CEO in determining resource allocation and assessing performance. Within each of these regions, markets, customers, products and production processes are similar and production can be readily transferred between production facilities. Moreover, our business within each region leverages common systems, processes and infrastructure. Accordingly, North America and Europe comprise the company’s reportable segments for purposes of segment reporting.
| (Dollars in thousands) | Net Sales | Income from Operations | ||||||||||||||||||||||
| 2017 | 2016 | 2015 | 2017 | 2016 | 2015 | |||||||||||||||||||
| North America |
$ | 732,418 | $ | 732,677 | $ | 727,946 | $ | 9,808 | $ | 54,602 | $ | 36,294 | ||||||||||||
| Europe |
375,637 | — | — | 11,710 | — | — | ||||||||||||||||||
|
|
|
|
|
|
|
|
|
|
|
|
|
|||||||||||||
| $ | 1,108,055 | $ | 732,677 | $ | 727,946 | $ | 21,518 | $ | 54,602 | $ | 36,294 | |||||||||||||
|
|
|
|
|
|
|
|
|
|
|
|
|
|||||||||||||
| (Dollars in thousands) | Depreciation and Amortization |
Capital Expenditures | ||||||||||||||||||||||
| 2017 | 2016 | 2015 | 2017 | 2016 | 2015 | |||||||||||||||||||
| North America |
$ | 35,931 | $ | 34,261 | $ | 34,530 | $ | 47,493 | $ | 39,575 | $ | 39,543 | ||||||||||||
| Europe |
33,404 | — | — | 23,444 | — | — | ||||||||||||||||||
|
|
|
|
|
|
|
|
|
|
|
|
|
|||||||||||||
| $ | 69,335 | $ | 34,261 | $ | 34,530 | $ | 70,937 | $ | 39,575 | $ | 39,543 | |||||||||||||
|
|
|
|
|
|
|
|
|
|
|
|
|
|||||||||||||
| (Dollars in thousands) | ||||||||||||||||
| Property, plant, and equipment, net |
Long-lived intangible assets |
|||||||||||||||
| 2017 | 2016 | 2017 | 2016 | |||||||||||||
| North America |
$ | 245,178 | $ | 227,403 | $ | — | $ | — | ||||||||
| Europe |
291,508 | — | 203,473 | — | ||||||||||||
|
|
|
|
|
|
|
|
|
|||||||||
| $ | 536,686 | $ | 227,403 | $ | 203,473 | $ | — | |||||||||
|
|
|
|
|
|
|
|
|
|||||||||
| (Dollars in millions) | Total Assets | |||||||
| 2017 | 2016 | |||||||
| North America |
$ | 519,192 | $ | 542,756 | ||||
| Europe |
1,032,060 | — | ||||||
|
|
|
|
|
|||||
| $ | 1,551,252 | $ | 542,756 | |||||
|
|
|
|
|
|||||
83
Table of Contents
Geographic information
Net sales by geographic location is the following:
| Year Ended December 31, |
2017 | 2016 | 2015 | |||||||||
| (Dollars in thousands) | ||||||||||||
| Net sales: |
||||||||||||
| U.S. |
$ | 124,711 | $ | 120,395 | $ | 177,198 | ||||||
| Mexico |
607,707 | 612,282 | 550,748 | |||||||||
| Germany |
155,227 | — | — | |||||||||
| Poland |
220,410 | — | — | |||||||||
|
|
|
|
|
|
|
|||||||
| Consolidated net sales |
$ | 1,108,055 | $ | 732,677 | $ | 727,946 | ||||||
|
|
|
|
|
|
|
|||||||
NOTE 7 - ACCOUNTS RECEIVABLE
| December 31, |
2017 | 2016 | ||||||
| (Dollars in thousands) | ||||||||
| Trade receivables |
$ | 152,476 | $ | 91,213 | ||||
| Other receivables |
10,016 | 9,037 | ||||||
|
|
|
|
|
|||||
| 162,492 | 100,250 | |||||||
| Allowance for doubtful accounts |
(2,325 | ) | (919 | ) | ||||
|
|
|
|
|
|||||
| Accounts receivable, net |
$ | 160,167 | $ | 99,331 | ||||
|
|
|
|
|
|||||
The following percentages of our consolidated net sales were made to Ford, GM and Toyota: 2017 - 22 percent, 20 percent and 9 percent, respectively; 2016 - 38 percent, 30 percent and 14 percent, respectively; and 2015 - 44 percent, 24 percent and 14 percent, respectively.
The accounts receivable from GM, Ford and Toyota at December 31, 2017 represented approximately 26 percent, 20 percent and 4 percent, respectively of the total accounts receivable. The accounts receivable from GM, Ford and Toyota at December 31, 2016, represented approximately 39 percent, 32 percent and 14 percent, respectively of the total accounts receivable.
NOTE 8 - INVENTORIES
| December 31, |
2017 | 2016 | ||||||
| (Dollars in thousands) | ||||||||
| Raw materials |
$ | 59,353 | $ | 40,255 | ||||
| Work in process |
48,803 | 21,447 | ||||||
| Finished goods |
65,843 | 21,135 | ||||||
|
|
|
|
|
|||||
| Inventories |
$ | 173,999 | $ | 82,837 | ||||
|
|
|
|
|
|||||
Service wheel and supplies inventory included in other non-current assets in the consolidated balance sheets totaled $8.1 million and $6.5 million at December 31, 2017 and 2016, respectively. Included in raw materials were operating supplies and spare parts totaling $12.5 million and $10.3 million at December 31, 2017 and 2016, respectively.
84
Table of Contents
NOTE 9 - PROPERTY, PLANT AND EQUIPMENT
| December 31, |
2017 | 2016 | ||||||
| (Dollars in thousands) | ||||||||
| Land and buildings |
$ | 136,918 | $ | 67,915 | ||||
| Machinery and equipment |
720,175 | 485,185 | ||||||
| Leasehold improvements and others |
12,192 | 4,868 | ||||||
| Construction in progress |
58,753 | 26,301 | ||||||
|
|
|
|
|
|||||
| 928,038 | 584,269 | |||||||
| Accumulated depreciation |
(391,352 | ) | (356,866 | ) | ||||
|
|
|
|
|
|||||
| Property, plant and equipment, net |
$ | 536,686 | $ | 227,403 | ||||
|
|
|
|
|
|||||
Depreciation expense was $54.2 million, $34.3 million and $34.5 million for the years ended December 31, 2017, 2016 and 2015, respectively.
NOTE 10 - INVESTMENT IN UNCONSOLIDATED AFFILIATE
On June 28, 2010, we executed a share subscription agreement (the “Agreement”) with Synergies, a private aluminum wheel manufacturer based in Visakhapatnam, India, providing for our acquisition of a minority interest in Synergies. The total cash investment in Synergies amounted to $4.5 million, representing 12.6 percent of the outstanding equity shares of Synergies. Our Synergies investment is accounted for using the cost method. During 2011, a group of existing equity holders, including the company, made a loan of $1.5 million to Synergies for working capital needs. The company’s share of this unsecured advance was $0.5 million. The remaining principal balance of the unsecured advance was paid in full during the first quarter of 2015.
In October 2014, a typhoon caused significant damage to the facilities and operations of Synergies, and in the fourth quarter of 2014, we tested the $4.5 million carrying value of our investment for impairment. Based on our evaluation, we determined there was an other-than-temporary impairment and wrote the investment down to its estimated fair value of $2.0 million, with the $2.5 million loss recognized in income for the year ended December 31, 2014. The valuation was based on an income approach using current financial forecast data, and rates and assumptions market participants would use in pricing the investment. There was no further impairment in 2016 and 2015.
In the third quarter of 2017, the company divested its interest Synergies in exchange for a $2.6 million note receivable realizing a gain of $0.5 million. The note receivable is payable in installments through April 4, 2019. A payment of $0.5 million due October 14, 2017 was received and the remaining balance at December 31, 2017 was $2.1 million.
NOTE 11 - GOODWILL AND OTHER INTANGIBLE ASSETS
Goodwill and indefinite-lived assets, such as certain trade names acquired in connection with the Acquisition on May 30, 2017, are not amortized, but are instead evaluated for impairment on an annual basis, or more frequently if events or circumstances indicate that impairment may be more likely. At December 31, 2017, the goodwill balance is $304.8 million, consisting of the initial balance of $286.2 million, increased for post-Acquisition translation adjustments. The carrying amount of goodwill arose from the Acquisition described in Note 2, “Acquisition”.
We conducted the annual impairment testing as of December 31, 2017. In performing our valuation, we have utilized a market approach to estimate the fair value of our European reporting unit due to the fact that Uniwheels stock is still publicly traded. In our market approach, we estimated value based on the market price of Uniwheels shares as of December 31, 2017 of 305 Polish Zloty, as well as the price of our most recent purchase of
85
Table of Contents
Uniwheels shares of 264 Zloty on December 15, 2017. In addition to the market approach, we have used the income approach to further support our analysis. The income approach is based on projected debt-free cash flow which is discounted to the present value using discount factors that consider the timing and risk of cash flows. The discount rate used is the value-weighted average of our estimated cost of equity and of debt (“weighted average cost of capital”). Our weighted average cost of capital is adjusted as necessary to reflect risk associated with the business of the reporting unit. Business forecasts are based on estimated production volumes, product prices and expenses, including raw material cost, wages, energy and other expenses. Other significant assumptions include terminal value cash flow and growth rates, future capital expenditures and changes in future working capital requirements. Our assessment indicated that the fair value of the European reporting unit exceeded its respective carrying value.
The company’s other intangible assets consist of assets with finite lives and a trade name with an indefinite life. These assets are amortized on a straight-line basis over their estimated useful lives. Following is a summary of the company’s finite-lived and indefinite-lived intangible assets as of December 31, 2017. There were no such intangible assets at December 31, 2016.
| Gross Carrying Amount |
Accumulated Amortization |
Currency Translation |
Net | Remaining Weighted Average Amortization Period |
||||||||||||||||
| (Dollars in thousands | ||||||||||||||||||||
| Brand name |
$ | 9,000 | $ | (1,091 | ) | $ | 581 | $ | 8,490 | 5-6 | ||||||||||
| Technology |
15,000 | (1,818 | ) | 968 | 14,150 | 4-6 | ||||||||||||||
| Customer relationships |
167,000 | (12,259 | ) | 11,005 | 165,746 | 6-11 | ||||||||||||||
|
|
|
|
|
|
|
|
|
|||||||||||||
| Total finite |
191,000 | (15,168 | ) | 12,554 | 188,386 | |||||||||||||||
| Trade names |
14,000 | — | 1,087 | 15,087 | Indefinite | |||||||||||||||
|
|
|
|
|
|
|
|
|
|||||||||||||
| Total |
$ | 205,000 | $ | (15,168 | ) | $ | 13,641 | $ | 203,473 | |||||||||||
|
|
|
|
|
|
|
|
|
|||||||||||||
Amortization expense for these intangible assets was $15.2 million for the year ended December 31, 2017. The anticipated annual amortization expense for these intangible assets is $25.0 million for 2018 to 2021 and $22.2 million for 2022.
Note 12 – LONG-TERM DEBT
A summary of long-term debt and the related weighted average interest rates is shown below (in thousands):
| December 31, 2017 | ||||||||||||||||
| Debt Instrument | Total Debt |
Debt Issuance Costs (1) |
Total Debt, Net |
Weighted Average Interest Rate |
||||||||||||
| Credit Facility - Term Loan |
$ | 386,800 | $ | (15,802 | ) | $ | 370,998 | 5.6 | % | |||||||
| 6.00% Senior Notes due 2025 |
300,250 | (8,510 | ) | 291,740 | 6.0 | % | ||||||||||
| Other |
20,814 | — | 20,814 | 1.0 | % | |||||||||||
|
|
|
|
|
|
|
|||||||||||
| $ | 707,864 | $ | (24,312 | ) | 683,552 | |||||||||||
|
|
|
|
|
|||||||||||||
| Less: Current portion |
(4,000 | ) | ||||||||||||||
|
|
|
|||||||||||||||
| Long-term debt |
$ | 679,552 | ||||||||||||||
|
|
|
|||||||||||||||
| (1) | Unamortized portion |
86
Table of Contents
Senior Notes
On June 15, 2017, Superior issued €250.0 million aggregate principal amount of 6.00% Senior Notes (the “Notes”) due June 15, 2025. Interest on the Notes is payable semiannually, on June 15 and December 25. Superior may redeem the Notes, in whole or in part, on or after June 15, 2020 at redemption prices of 103.000% and 101.500% of the principal amount thereof if the redemption occurs during the 12-month period beginning June 15, 2020 or 2021, respectively, and a redemption price of 100.000% of the principal amount thereof on or after June 15, 2022, in each case plus accrued and unpaid interest to, but not including, the applicable redemption date. In addition, the company may redeem some or all of the Notes prior to June 15, 2020 at a price equal to 100.000% of the principal amount thereof plus a “make-whole” premium and accrued and unpaid interest, if any, to, but not including, the redemption date. Prior to June 15, 2020, the company may redeem up to 40.000% of the aggregate principal amount of the Notes using the proceeds of certain equity offerings at a certain redemption price. If we experience a change of control or sell certain assets, the company may be required to offer to purchase the Notes from the holders.
The Notes are senior unsecured obligations ranking equally in right of payment with all of the Company’s existing and future senior indebtedness and senior in right of payment to any subordinated indebtedness. The notes are effectively subordinated in right of payment to the existing and future secured indebtedness of the Company, including the Senior Secured Credit Facilities (as defined below), to the extent of the assets securing such indebtedness.
Guarantee
The Notes are unconditionally guaranteed by all material wholly-owned direct and indirect domestic restricted subsidiaries of the company (the “Subsidiary Guarantors”), with customary exceptions including, among other things, where providing such guarantees is not permitted by law, regulation or contract or would result in adverse tax consequences.
Covenants
Subject to certain exceptions, the indenture governing the Notes contains restrictive covenants that, among other things, limit the ability of Superior and the Subsidiary Guarantors to: (i) incur additional indebtedness or issue certain preferred stock; (ii) pay dividends on, or make distributions in respect of, their capital stock; (iii) make certain investments or other restricted payments; (iv) sell certain assets or issue capital stock of restricted subsidiaries; (v) create liens; (vi) merge, consolidate, transfer or dispose of substantially all of their assets; and (vii) engage in certain transactions with affiliates. These covenants are subject to a number of important limitations and exceptions that are described in the indenture.
The indenture provides for customary events of default that include, among other things (subject in certain cases to customary grace and cure periods): (i) nonpayment of principal, premium, if any, and interest, when due; (ii) breach of covenants in the indenture; (iii) a failure to pay certain judgments; and (iv) certain events of bankruptcy and insolvency. If an event of default occurs and is continuing, the Trustee or holders of at least 30 percent in principal amount of the then outstanding Notes may declare the principal, premium, if any, and accrued and unpaid interest on all the Notes to be due and payable. These events of default are subject to a number of important qualifications, limitations and exceptions that are described in the indenture. As of December 31, 2017, the company was in compliance with all covenants under the indentures governing the Notes.
Senior Secured Credit Facilities
On March 22, 2017, Superior entered into a senior secured credit agreement (the “Credit Agreement”) with Citibank, N.A, JP Morgan Chase N.A., Royal Bank of Canada and Deutsche Bank A.G. New York Branch
87
Table of Contents
(collectively, the “Lenders”). The Credit Agreement consists of a $400.0 million senior secured term loan facility (the “Term Loan Facility”) and a $160.0 million revolving credit facility (the “Revolving Credit Facility” and, together with the Term Loan Facility, the “Senior Secured Credit Facilities”). Borrowings under the Term Loan Facility will bear interest at a rate equal to, at the company’s option, either (a) LIBOR for the relevant interest period, adjusted for statutory reserve requirements, subject to a floor of 1.00 percent per annum, plus an applicable rate of 4.50 percent or (b) a base rate, subject to a floor of 2.00 percent per annum, equal to the highest of (1) the rate of interest in effect as publicly announced by the administrative agent as its prime rate, (2) the federal funds rate plus 0.50 percent and (3) LIBOR for an interest period of one month plus 1.00 percent, in each case, plus an applicable rate of 3.50 percent. Borrowings under the Revolving Credit Facility initially bear interest at a rate equal to, at the company’s option, either (a) LIBOR for the relevant interest period, adjusted for statutory reserve requirements, subject to a floor of 1.00 percent per annum, plus an applicable rate of 3.50 percent or (b) a base rate, subject to a floor of 2.00 percent per annum, equal to the highest of (1) the rate of interest in effect as publicly announced by the administrative agent as its prime rate, (2) the federal funds effective rate plus 0.50 percent and (3) LIBOR for an interest period of one month plus 1.00 percent, in each case, plus an applicable rate of 3.50 percent provided such rate may not be less than zero. The initial commitment fee for unused commitments under the Revolving Credit Facility shall be 0.50 percent. After September 30, 2017, the applicable rates for borrowings under the Revolving Credit Facility and commitment fees for unused commitments under the Revolving Credit Facility are based upon the First Lien Net Leverage Ratio effective for the preceding quarter with LIBOR applicable rates between 3.50 percent and 3.00 percent, base rate applicable rates between 2.50 percent and 2.00 percent and commitment fees between 0.50 percent and 0.25 percent. Commitment fees are included in our consolidated financial statements line, interest (expense) income, net. During the year ended December 31, 2017, the company repaid $13.2 million under the term loan facility resulting in a balance of $386.8 million.
Quarterly principal payments of $1.0 million are due on the term loan, however, as a result of prepayments, there are no quarterly payments due until 2021. Beginning in January 2019, payments may be due on the term loan in an amount equal to a percentage (up to 50 percent) of excess cash flow as defined under the Credit Agreement. In addition, further payments may be due in the event of asset sales equal to net proceeds on such dispositions in excess of $5.0 million individually and $20.0 million in the aggregate in any year.
As of December 31, 2017, the company had no outstanding borrowings under the Revolving Credit Facility, had outstanding letters of credit of $2.8 million and available unused commitments under the facility of $157.2 million.
Guarantees
Our obligations under the Credit Agreement are unconditionally guaranteed by all material wholly-owned direct and indirect domestic restricted subsidiaries of the company, with customary exceptions including, among other things, where providing such guarantees is not permitted by law, regulation or contract or would result in adverse tax consequences. The guarantees of such obligations, will be secured, subject to permitted liens and other exceptions, by substantially all of our assets and the Subsidiary Guarantors’ assets, including but not limited to: (i) a perfected pledge of all of the capital stock issued by each of the company’s direct wholly-owned domestic restricted subsidiaries or any guarantor (subject to certain exceptions) and up to 65 percent of the capital stock issued by each direct wholly-owned foreign restricted subsidiary of the company or any guarantor (subject to certain exceptions) and (ii) perfected security interests in and mortgages on substantially all tangible and intangible personal property and material fee-owned real property of the Company and the guarantors (subject to certain exceptions and exclusions).
Covenants
The Senior Secured Credit Facilities contain a number of covenants that, among other things, restrict, subject to certain exceptions, our ability to incur additional indebtedness and guarantee indebtedness, create or incur liens,
88
Table of Contents
engage in mergers or consolidations, sell, transfer or otherwise dispose of assets, make investments, acquisitions, loans or advances, pay dividends, distributions or other restricted payments, or repurchase our capital stock, prepay, redeem, or repurchase any subordinated indebtedness, enter into agreements which limit our ability to incur liens on our assets or that restrict the ability of restricted subsidiaries to pay dividends or make other restricted payments to us, and enter into certain transactions with our affiliates.
In addition, the Credit Agreement contains customary default provisions, representations and warranties and restrictive covenants. The Credit Agreement also contains a provision permitting the Lenders to accelerate the repayment of all loans outstanding under the Senior Secured Credit Facilities during an event of default. As of December 31, 2017, the Company was in compliance with all covenants under the Credit Agreement.
Uniwheels Debt
In connection with the Acquisition, the Company assumed $70.7 million of outstanding debt. At December 31, 2017, $20.8 million of debt remained outstanding, relating to an equipment loan with quarterly principal payments of $0.8 million. At December 31, 2017, $4.0 million of this debt was classified as current. Uniwheels also has an undrawn revolving line of credit for 30 million Euro which expires July 31, 2020. The revolving credit facility bears interest at Euribor plus 0.95 percent (but in any event not less than 0.95 percent) and the equipment loan bears interest at 2.20 percent.
NOTE 13 - REDEEMABLE PREFERRED SHARES
On March 22, 2017, Superior and TPG Growth III Sidewall, L.P. (“TPG”) entered into an Investment Agreement pursuant to which Superior agreed to issue a number of shares of Series A Perpetual Convertible Preferred Stock (the “Series A redeemable preferred stock”) and Series B Perpetual Preferred Stock (the “Series B redeemable preferred stock”), par value $0.01 per share (the “Series A redeemable preferred stock” and “Series B redeemable preferred stock” referred to collectively as the “redeemable preferred stock”) to TPG for an aggregate purchase price of $150.0 million (the “Investment”). As of the closing of the Investment on May 22, 2017, Superior issued 140,202 shares of Series A redeemable preferred stock, which was equal to 19.99 percent of Superior’s common stock outstanding on such date, and 9,798 shares of Series B redeemable preferred stock to TPG.
On August 30, 2017, our stockholders approved the conversion of 9,798 shares of Series B redeemable preferred stock into Series A redeemable preferred stock and all outstanding shares of Series B redeemable preferred stock were automatically converted into Series A redeemable preferred stock (the “Conversion”). Series A redeemable preferred stock has an initial stated value of $1,000 per share, par value of $0.01 per share and liquidation preference over common stock. Series A redeemable preferred stock is convertible into shares of Superior common stock equal to the number of shares determined by dividing the sum of the stated value and any accrued and unpaid dividends by the conversion price of $28.162. Series A redeemable preferred stock accrues dividends at a rate of 9 percent per annum, payable at Superior’s election either in-kind or in cash. Series A redeemable preferred stock is also entitled to participate in dividends on common stock in an amount equal to that which would have been due had the shares been converted into common stock.
We may mandate conversion of the Series A redeemable preferred stock if the price of the common stock exceeds $84.49. TPG may redeem the shares upon the occurrence of any of the following events (referred to as a “redemption event”): a change in control, recapitalization, merger, sale of substantially all of the company’s assets, liquidation or delisting of the company’s common stock. In addition, TPG may, at its option, unconditionally redeem the shares at any time after May 23, 2024. Superior may, at its option, redeem in whole at any time all of the shares of Series A redeemable preferred stock outstanding. If redeemed by either party on or before October 22, 2018, the redemption value (the “redemption value”) would be $262.5 million (1.75 times stated value). If redeemed after October 22, 2018, the redemption value would be the greater of $300 million (2.0 times stated value) or the product of the number of common shares into which the Series A redeemable preferred stock could be converted (5.3 million shares currently) and the then current market price of the common stock.
89
Table of Contents
We have determined that the conversion option embedded in the redeemable preferred stock is required to be accounted for separately from the redeemable preferred stock as a derivative liability. Separation of the conversion option as a derivative liability is required because its economic characteristics are considered more akin to an equity instrument and therefore the conversion option is not considered to be clearly and closely related to the economic characteristics of the redeemable preferred stock. This is because the economic characteristics of the redeemable preferred stock are considered more akin to a debt instrument due to the fact that the shares are redeemable at the holder’s option, the redemption value is significantly greater than the face amount, the shares carry a fixed mandatory dividend, the stock price necessary to make conversion more attractive than redemption ($56.324) is significantly greater than the price at the date of issuance ($19.05), all of which lead to the conclusion that redemption is more likely than conversion.
We have also determined that the early redemption option exercisable upon the occurrence of a redemption event must also be bifurcated and accounted for separately from the redeemable preferred stock at fair value, because the debt host contract involves a substantial discount (face of $150.0 million as compared to the redemption value of $300.0 million) and the exercise of the early redemption option upon the occurrence of a redemption event would accelerate the holder’s option to redeem the shares.
Accordingly, we have recorded an embedded derivative liability representing the estimated combined fair value of the right of holders to receive common stock upon conversion (the “conversion option”) and the right of the holders to exercise their early redemption option upon the occurrence of a redemption event. The embedded derivative liability is adjusted to reflect fair value at each period end with changes in fair value recorded in the “Change in fair value of redeemable preferred stock embedded derivative liability” financial statement line item of the company’s consolidated statements of operations. Refer to Note 5, “Derivative Financial Instruments” for further information regarding the valuation of the embedded derivative.
Since the redeemable preferred stock may be redeemed at the option of the holder, but is not mandatorily redeemable, the redeemable preferred stock has been classified as mezzanine equity and initially recognized at fair value of $150.0 million (the proceeds on the date of issuance) less issuance costs of $3.7 million, resulting in an initial value of $146.3 million. This amount had been further reduced by $10.9 million assigned to the embedded derivative liability at date of issuance, resulting in an adjusted initial value of $135.5 million. We are accreting the difference between the adjusted initial value of $135.5 million and the redemption value of $300.0 million over the seven-year period from date of issuance through May 23, 2024 (the date at which the holder has the unconditional right to redeem the shares, deemed to be the earliest likely redemption date) using the effective interest method. The accretion to the carrying value of the redeemable preferred stock is treated as a deemed dividend, recorded as a charge to retained earnings and deducted in computing earnings per share (analogous to the treatment for stated and participating dividends paid on the redeemable preferred shares). We have accreted $9.2 million through December 31, 2017 resulting in a balance of $144.7 million.
NOTE 14 - INCOME TAXES
Income before income taxes from domestic and international jurisdictions is comprised of the following:
| Year Ended December 31, |
2017 | 2016 | 2015 | |||||||||
| (Dollars in thousands) | ||||||||||||
| Income before income taxes: |
||||||||||||
| Domestic |
$ | (63,716 | ) | $ | 18,499 | $ | 25,069 | |||||
| Foreign |
64,582 | 36,222 | 10,214 | |||||||||
|
|
|
|
|
|
|
|||||||
| $ | 866 | $ | 54,721 | $ | 35,283 | |||||||
|
|
|
|
|
|
|
|||||||
90
Table of Contents
The provision for income taxes is comprised of the following:
| Year Ended December 31, |
2017 | 2016 | 2015 | |||||||||
| (Dollars in thousands) | ||||||||||||
| Current taxes |
||||||||||||
| Federal |
$ | 6,121 | $ | (5,017 | ) | $ | (10,900 | ) | ||||
| State |
(390 | ) | 450 | 481 | ||||||||
| Foreign |
(12,564 | ) | (10,639 | ) | (2,099 | ) | ||||||
|
|
|
|
|
|
|
|||||||
| Total current taxes |
(6,833 | ) | (15,206 | ) | (12,518 | ) | ||||||
|
|
|
|
|
|
|
|||||||
| Deferred taxes |
||||||||||||
| Federal |
(4,387 | ) | (1,199 | ) | (961 | ) | ||||||
| State |
1,492 | (332 | ) | (576 | ) | |||||||
| Foreign |
2,853 | 3,397 | 2,716 | |||||||||
|
|
|
|
|
|
|
|||||||
| Total deferred taxes |
(42 | ) | 1,866 | 1,179 | ||||||||
|
|
|
|
|
|
|
|||||||
| Income tax provision |
$ | (6,875 | ) | $ | (13,340 | ) | $ | (11,339 | ) | |||
|
|
|
|
|
|
|
|||||||
The following is a reconciliation of the U.S. federal tax rate to our effective income tax rate:
| Year Ended December 31, |
2017 | 2016 | 2015 | |||||||||
| Statutory rate |
(35.0 | )% | (35.0 | )% | (35.0 | )% | ||||||
| State tax provisions, net of federal income tax benefit |
263.4 | (6.3 | ) | 3.8 | ||||||||
| Tax credits |
88.9 | 0.6 | 0.9 | |||||||||
| Foreign income taxes at rates other than the statutory rate |
1,206.6 | 11.7 | 2.3 | |||||||||
| Valuation allowance and other |
(138.0 | ) | 5.1 | (5.6 | ) | |||||||
| Changes in tax liabilities, net |
(11.3 | ) | 0.5 | 6.4 | ||||||||
| Share based compensation |
(61.5 | ) | (1.2 | ) | (4.4 | ) | ||||||
| Transaction costs |
(372.2 | ) | — | — | ||||||||
| Tax Reform |
(1,918.7 | ) | — | — | ||||||||
| Non taxable income |
152.6 | — | — | |||||||||
| Other |
31.3 | 0.2 | (0.5 | ) | ||||||||
|
|
|
|
|
|
|
|||||||
| Effective income tax rate |
(793.9 | )% | (24.4 | )% | (32.1 | )% | ||||||
|
|
|
|
|
|
|
|||||||
Our effective income tax rate for 2017 was 793.9 percent. The effective tax rate was higher than the U.S. federal statutory rate primarily due to non-deductible acquisition costs related to the Uniwheels acquisition, and provisional estimates recorded for the transition tax on offshore earnings and a deferred tax expense resulting from the reduction of our deferred tax assets. The reduction in deferred tax assets was due to the change in the U.S. statutory federal income tax rate from 35% to 21% for years subsequent to 2017 arising from the newly enacted U.S. Tax Cuts and Jobs Act.
Our effective income tax rate for 2016 was 24.4 percent. The effective tax rate was lower than the U.S. federal statutory rate primarily as a result of income in jurisdictions where the statutory rate is lower than the U.S. rate and tax benefits due to the release of tax liabilities related to uncertain tax positions.
Our effective income tax rate for 2015 was 32.1 percent. The effective tax rate was lower than the U.S. federal statutory rate primarily as a result of net decreases in the liability for uncertain tax positions partially offset by the reversal of deferred tax assets related to share-based compensation shortfalls.
91
Table of Contents
Tax effects of temporary differences that gave rise to significant portions of the deferred tax assets and deferred liabilities are as follows:
| December 31, |
2017 | 2016 | ||||||
| (Dollars in thousands) | ||||||||
| Deferred income tax assets: |
||||||||
| Accrued liabilities |
$ | 2,445 | $ | 6,120 | ||||
| Hedging and foreign currency losses |
2,034 | 9,475 | ||||||
| Deferred compensation |
8,628 | 11,723 | ||||||
| Inventory reserves |
2,954 | 3,563 | ||||||
| Net loss carryforwards and credits |
69,018 | 3,123 | ||||||
| Competent authority deferred tax assets and other foreign timing differences |
6,939 | 5,135 | ||||||
| Other |
(830 | ) | 462 | |||||
|
|
|
|
|
|||||
| Total before valuation allowance |
91,188 | 39,601 | ||||||
| Valuation allowance |
(7,634 | ) | (3,123 | ) | ||||
|
|
|
|
|
|||||
| Net deferred income tax assets |
83,554 | 36,478 | ||||||
|
|
|
|
|
|||||
| Deferred income tax liabilities: |
||||||||
| Intangibles, property, plant and equipment and other |
(57,791 | ) | (11,268 | ) | ||||
|
|
|
|
|
|||||
| Deferred income tax liabilities |
(57,791 | ) | (11,268 | ) | ||||
|
|
|
|
|
|||||
| Net deferred income tax assets |
$ | 25,763 | $ | 25,210 | ||||
|
|
|
|
|
|||||
The classification of our net deferred tax asset is shown below:
| December 31, |
2017 | 2016 | ||||||
| (Dollars in thousands) | ||||||||
| Long-term deferred income tax assets |
$ | 54,302 | $ | 28,838 | ||||
| Long-term deferred income tax liabilities |
(28,539 | ) | (3,628 | ) | ||||
|
|
|
|
|
|||||
| Net deferred tax asset |
$ | 25,763 | $ | 25,210 | ||||
|
|
|
|
|
|||||
Realization of any of our deferred tax assets at December 31, 2017 is dependent on the company generating sufficient taxable income in the future. The determination of whether or not to record a full or partial valuation allowance on our deferred tax assets is a critical accounting estimate requiring a significant amount of judgment on the part of management. In determining when to release the valuation allowance established against our deferred income tax assets, we consider all available evidence, both positive and negative. We perform our analysis on a jurisdiction by jurisdiction basis at the end of each reporting period. The increase in the valuation allowance of $4.5 million relates to State net operating loss carryforwards the company is not more likely than not to utilize prior to expiration, as well as, German loss carryforwards that are frozen under the Domination and Profit and Loss Transfer Agreement with UNIWHEELS AG.
The U.S. Tax Cuts and Jobs Act (“Act”) was enacted on December 22, 2017. The Act reduces the U.S. federal corporate tax rate from 35% to 21%, requires companies to pay a one-time transition tax on earnings of certain foreign subsidiaries that were previously tax deferred and creates new taxes on certain foreign sourced earnings. Staff Accounting Bulletin No. 118, Income Tax Accounting Implications of the Tax Cut and Jobs Act, allows filers to use prior year methodologies or estimates of the anticipated current impact of the Act in the preparation of their 2017 financial statements. At December 31, 2017, the Company had not completed its accounting for the tax effects of enactment of the Act; however, in certain cases, as described below, it has made a reasonable estimate of the effects on its existing deferred tax balances and the one-time transition tax. In all cases, the Company will continue to make and refine its calculations as additional data is gathered and further analysis is completed. In addition, the Company’s estimates may also be affected as it gains a more thorough
92
Table of Contents
understanding of the tax law and certain aspects of the Act are clarified by the taxing authorities. Any adjustments to these provisional amounts will be reported as a component of tax expense (benefit) in the reporting period in which any such adjustments are determined, which will be no later than the fourth quarter of 2018.
We recognized the impact of the Act for the year ended December 31, 2017. The impact primarily consists of a $7.3 million related to re-measurement of U.S. deferred tax assets due to the lowering of the corporate tax rate described above and $9.3 million of expense for the estimate of the impact of one-time transition tax on the mandatory repatriation of earnings of foreign subsidiaries. The Company anticipates additional guidance and clarification regarding the implementation of the transition tax will be issued by federal and state taxing authorities and this estimate is, therefore, subject to future refinement.
As of December 31, 2017, we have cumulative U.S. state and Germany NOL carryforwards of $87.0 million that expire in the years 2018 to 2037. Also, we have $58.0 million of tax credit carryforwards, primarily in Poland, which expire in the years 2021 to 2026.
Historically, U.S. income tax has not been recognized on the excess of the amount for financial reporting over the tax basis of the Company’s investment in its non-U.S. subsidiaries derived from foreign earnings that are indefinitely reinvested outside the U.S. At December 31, 2017, unremitted earnings of the $164.3 million have been included in the computation of the transition tax associated with the Act. The Company remains indefinitely reinvested with respect to its initial investment and any associated potential withholding tax on earnings of its non-U.S. subsidiaries subject to the transition tax, as well as with respect to future earnings that will primarily fund the operations of the subsidiary; however, the Company continues to evaluate its position under SAB 118.
We account for our uncertain tax positions in accordance with U.S. GAAP. A reconciliation of the beginning and ending amounts of these tax benefits is as follows:
| Year Ended December 31, |
2017 | 2016 | 2015 | |||||||||
| (Dollars in thousands) | ||||||||||||
| Beginning balance |
$ | 3,446 | $ | 7,318 | $ | 7,193 | ||||||
| Increases (decreases) due to foreign currency translations |
— | — | — | |||||||||
| Increases (decreases) as a result of positions taken during: |
— | — | — | |||||||||
| Prior periods |
— | (3,872 | ) | 1,238 | ||||||||
| Current period |
29,773 | — | 1,798 | |||||||||
| Settlements with taxing authorities |
— | — | — | |||||||||
| Expiration of applicable statutes of limitation |
(165 | ) | — | (2,911 | ) | |||||||
|
|
|
|
|
|
|
|||||||
| Ending balance (1) |
$ | 33,054 | $ | 3,446 | $ | 7,318 | ||||||
|
|
|
|
|
|
|
|||||||
| (1) | Increases in uncertain tax positions are primarily due to acquisition of UNIWHEELS AG. These uncertain tax positions offset certain deferred tax assets of UNIWHEELS AG. |
Our policy regarding interest and penalties related to uncertain tax positions is to record interest and penalties as an element of income tax expense. At the end of 2017, 2016 and 2015 the company had liabilities of $2.4 million, $1.8 million and $2.1 million of potential interest and penalties associated with uncertain tax positions. Included in the unrecognized tax benefits is $1.8 million that, if recognized, would favorably affect our annual effective tax rate. Within the next twelve-month period we do not expect a decrease in unrecognized tax benefits.
93
Table of Contents
Income tax returns are filed in multiple jurisdictions and are subject to examination by tax authorities in various jurisdictions where the Company operates. The Company has open tax years from 2013 to 2017 with various significant tax jurisdictions.
NOTE 15 - LEASES AND RELATED PARTIES
We lease certain land, facilities and equipment under long-term operating leases expiring at various dates through 2026. Total lease expense for all operating leases amounted to $4.3 million in 2017 and $1.9 million in 2016 and 2015. During 2015, we moved our headquarters from Van Nuys, California to Southfield, Michigan.
Our former headquarters in Van Nuys, California is leased from the Louis L. Borick Foundation (the “Foundation”). The Foundation is controlled by Mr. Steven J. Borick, the former Chairman and CEO of the company, as President and Director of the Foundation.
The lease provided for annual lease payments of approximately $427,000, through March 2015. In November 2014, the lease was amended to extend the lease term from March 2015 to March 2017, and to reduce the amount of office space and annual rent. As amended, beginning April 2015, the annual lease payment is approximately $225,000. The future minimum lease payments that are payable to the Foundation for the Van Nuys administrative office lease total $0.1 million. Total lease payments to these related entities were less than $0.1 million, $0.2 million and $0.3 million for 2017, 2016 and 2015, respectively. We also have a lease for our headquarters in Southfield, Michigan from October 2015 to September 2026 which is with an unrelated party.
The following are summarized future minimum payments under all leases:
| Year Ended December 31, |
Operating Leases |
|||
| (Dollars in thousands) | ||||
| 2018 |
$ | 4,447 | ||
| 2019 |
3,242 | |||
| 2020 |
3,207 | |||
| 2021 |
2,845 | |||
| 2022 |
2,463 | |||
| Thereafter |
7,192 | |||
|
|
|
|||
| $ | 23,396 | |||
|
|
|
|||
Purchase Agreement
In the first quarter of 2015, we entered into an agreement to purchase a subscription to online software provided by NGS Inc. Our Senior Vice President, Business Operations, is a passive investor and our Vice President of Information Technology is also a passive investor in NGS. We made payments to NGS of $376,920 and $243,000 during the 2017 and 2016 fiscal year, respectively. The transaction was entered into in the ordinary course of business and is an arms-length transaction.
NOTE 16 - RETIREMENT PLANS
We have an unfunded salary continuation plan covering certain directors, officers and other key members of management. We purchase life insurance policies on certain participants to provide in part for future liabilities. Cash surrender value of these policies, totaling $8.0 million and $7.5 million at December 31, 2017 and 2016, respectively, are included in other non-current assets in the company’s consolidated balance sheets. Subject to certain vesting requirements, the plan provides for a benefit based on final average compensation, which becomes payable on the employee’s death or upon attaining age 65, if retired. The plan was closed to new participants effective February 3, 2011. We have measured the plan assets and obligations of our salary continuation plan for all periods presented.
94
Table of Contents
The following table summarizes the changes in plan benefit obligations:
| Year Ended December 31, |
2017 | 2016 | ||||||
| (Dollars in thousands) | ||||||||
| Change in benefit obligation |
||||||||
| Beginning benefit obligation |
$ | 27,612 | $ | 28,399 | ||||
| Service cost |
— | — | ||||||
| Interest cost |
1,189 | 1,216 | ||||||
| Actuarial gain (loss) |
2,300 | (464 | ) | |||||
| Benefit payments |
(1,342 | ) | (1,539 | ) | ||||
|
|
|
|
|
|||||
| Ending benefit obligation |
$ | 29,759 | $ | 27,612 | ||||
|
|
|
|
|
|||||
| Year Ended December 31, |
2017 | 2016 | ||||||
| (Dollars in thousands) | ||||||||
| Change in plan assets |
||||||||
| Fair value of plan assets at beginning of year |
$ | — | $ | — | ||||
| Employer contribution |
1,342 | 1,539 | ||||||
| Benefit payments |
(1,342 | ) | (1,539 | ) | ||||
|
|
|
|
|
|||||
| Fair value of plan assets at end of year |
$ | — | $ | — | ||||
|
|
|
|
|
|||||
| Funded status |
$ | (29,759 | ) | $ | (27,612 | ) | ||
|
|
|
|
|
|||||
| Amounts recognized in the consolidated balance sheets consist of: |
||||||||
| Accrued expenses |
(1,407 | ) | (1,177 | ) | ||||
| Other non-current liabilities |
(28,352 | ) | (26,435 | ) | ||||
|
|
|
|
|
|||||
| Net amount recognized |
$ | (29,759 | ) | $ | (27,612 | ) | ||
|
|
|
|
|
|||||
| Amounts recognized in accumulated other comprehensive loss consist of: |
||||||||
| Net actuarial loss |
$ | 7,722 | $ | 5,692 | ||||
| Prior service cost |
(1 | ) | (1 | ) | ||||
|
|
|
|
|
|||||
| Net amount recognized, before tax effect |
$ | 7,721 | $ | 5,691 | ||||
|
|
|
|
|
|||||
| Weighted average assumptions used to determine benefit obligations: |
||||||||
| Discount rate |
3.7 | % | 4.4 | % | ||||
| Rate of compensation increase |
3.0 | % | 3.0 | % | ||||
Components of net periodic pension cost are described in the following table:
| Year Ended December 31, |
2017 | 2016 | 2015 | |||||||||
| (Dollars in thousands) | ||||||||||||
| Components of net periodic pension cost: |
||||||||||||
| Service cost |
$ | — | $ | — | $ | 44 | ||||||
| Interest cost |
1,189 | 1,216 | 1,230 | |||||||||
| Amortization of actuarial loss |
369 | 335 | 535 | |||||||||
|
|
|
|
|
|
|
|||||||
| Net periodic pension cost |
1,558 | $ | 1,551 | $ | 1,809 | |||||||
|
|
|
|
|
|
|
|||||||
| Weighted average assumptions used to determine net periodic pension cost: |
| |||||||||||
| Discount rate |
4.4 | % | 4.4 | % | 4.2 | % | ||||||
| Rate of compensation increase |
3.0 | % | 3.0 | % | 3.0 | % | ||||||
95
Table of Contents
The decrease in the 2017 net periodic pension cost compared to the 2016 cost was primarily due to decreased amortization of actuarial losses. The decrease in the 2016 net periodic pension cost compared to the 2015 cost was primarily due to decreased amortization of actuarial losses and decreased service cost from terminations and retirements.
Benefit payments during the next ten years, which reflect applicable future service, are as follows:
| Year Ended December 31, |
Amount | |||
| (Dollars in thousands) | ||||
| 2018 |
$ | 1,433 | ||
| 2019 |
$ | 1,410 | ||
| 2020 |
$ | 1,468 | ||
| 2021 |
$ | 1,442 | ||
| 2022 |
$ | 1,479 | ||
| Years 2023 to 2027 |
$ | 8,282 | ||
The following is an estimate of the components of net periodic pension cost in 2018:
| Estimated Year Ended December 31, |
2018 | |||
| (Dollars in thousands) | ||||
| Service cost |
$ | — | ||
| Interest cost |
1,086 | |||
| Amortization of actuarial loss |
437 | |||
|
|
|
|||
| Estimated 2018 net periodic pension cost |
$ | 1,523 | ||
|
|
|
|||
Other Retirement Plans
We also contribute to employee retirement savings plans in the U.S. and Mexico that cover substantially all of our employees in those countries. The employer contribution totaled $1.7 million, $1.4 million and $1.5 million for the three years ended December 31, 2017, 2016 and 2015, respectively.
NOTE 17 - ACCRUED EXPENSES
| December 31, |
2017 | 2016 | ||||||
| (Dollars in thousands) | ||||||||
| Payroll and related benefits |
$ | 27,954 | $ | 12,766 | ||||
| Taxes, other than income taxes |
9,419 | 7,325 | ||||||
| Current portion of derivative liability |
6,595 | 10,076 | ||||||
| Dividends |
7,322 | 5,127 | ||||||
| Deferred tooling revenue |
4,654 | 5,419 | ||||||
| Current portion of executive retirement liabilities |
1,407 | 1,177 | ||||||
| Other |
11,435 | 4,425 | ||||||
|
|
|
|
|
|||||
| Accrued liabilities |
$ | 68,786 | $ | 46,315 | ||||
|
|
|
|
|
|||||
NOTE 18 - STOCK-BASED COMPENSATION
2008 Equity Incentive Plan
Our 2008 Equity Incentive Plan, as amended (the “Plan”), authorizes us to issue up to 3.5 million shares of common stock, along with non-qualified stock options, stock appreciation rights, restricted stock and performance units to our officers, key employees, non-employee directors and consultants. At December 31,
96
Table of Contents
2017, there were 1.7 million shares available for future grants under this Plan. No more than 600,000 shares may be used under the Plan as “full value” awards, which include restricted stock and performance stock units. It is our policy to issue shares from authorized but not issued shares upon the exercise of stock options.
During the first quarter of 2015, the company implemented a long-term incentive program for the benefit of certain members of company management. The program was designed to strengthen employee retention and to provide a more structured incentive program to stimulate improvement in future company results. Per the terms of the program, participants were granted, in 2015, 2016 and 2017, time value restricted stock units (“RSUs”), vesting ratably over a three-year time period, and performance restricted stock units (“PSUs”), with a three-year cliff vesting. Upon vesting, each restricted stock award is exchangeable for one share of the company’s common stock, with accrued dividends. The PSUs are categorized further into three individual categories whose vesting is contingent upon the achievement of certain targets as follows:
| • | 40 percent of the PSUs vest upon certain Return on Invested Capital targets for 2017, 2016 and 2015 units |
| • | 40 percent of the PSUs vest upon certain Cumulative EPS targets for 2017 and 2016 units |
| • | 40 percent of the PSUs vest upon certain EBITDA margin targets for 2015 units |
| • | 20 percent of the PSUs vest upon certain market based Shareholder Return targets for 2017, 2016 and 2015 units |
Other Awards
During 2014, we granted 132,455 restricted shares, including 50,000 shares vesting April 30, 2017, and 82,455 shares vesting on December 31, 2016 under an Executive Employment Agreement (the “Employment Agreement”). The fair value of each of these restricted shares was $19.44. These grants were made outside of the Plan as inducement grants in connection with the appointment of our current CEO and company President. Beginning in 2015, the CEO will be granted restricted stock unit awards each year under Superior’s 2008 Equity Incentive Plan, or any successor equity plan. Under the CEO’s Employment Agreement, time-vested restricted stock units will be granted each year with cliff vesting at the third fiscal year end following grant. The CEO will also be granted performance-vested restricted stock units each year, vesting based on company performance goals established by the independent compensation committee during the three fiscal years following the grant.
97
Table of Contents
Options
Options are granted at not less than fair market value on the date of grant and expire no later than ten years after the date of grant. Options and restricted shares granted under this Plan generally require no less than a three-year ratable vesting period. Stock option activity in 2017 and 2016 are summarized in the following table:
| Outstanding | Weighted Average Exercise Price |
Remaining Contractual Life in Years |
Aggregate Intrinsic Value |
|||||||||||||
| Balance at December 31, 2015 |
376,033 | $ | 18.89 | 3.6 | $ | 452,128 | ||||||||||
| Granted |
— | $ | — | |||||||||||||
| Exercised |
(86,908 | ) | $ | 18.77 | ||||||||||||
| Canceled |
(24,750 | ) | $ | 21.51 | ||||||||||||
| Expired |
(32,750 | ) | $ | 17.56 | ||||||||||||
|
|
|
|||||||||||||||
| Balance at December 31, 2016 |
231,625 | $ | 18.88 | 3.1 | $ | 1,845,263 | ||||||||||
| Granted |
— | — | ||||||||||||||
| Exercised |
(2,000 | ) | $ | 16.76 | ||||||||||||
| Canceled |
(6,000 | ) | $ | 21.09 | ||||||||||||
| Expired |
(78,000 | ) | $ | 18.62 | ||||||||||||
|
|
|
|||||||||||||||
| Balance at December 31, 2017 |
145,625 | $ | 18.96 | |||||||||||||
|
|
|
|||||||||||||||
| Options vested or expected to vest at December 31, 2017 |
145,625 | $ | 18.96 | 2.0 | $ | — | ||||||||||
|
|
|
|||||||||||||||
| Exercisable at December 31, 2017 |
145,625 | |||||||||||||||
|
|
|
|||||||||||||||
We received cash proceeds of less than $0.1 million, $1.6 million and $7.3 million from stock options exercised in 2017, 2016 and 2015, respectively. The total intrinsic value of options exercised was less than $0.1 million, $0.7 million and $0.8 million, for the years ended December 31, 2017, 2016 and 2015, respectively. Upon the exercise of stock options and the issuance of restricted stock awards, it is our policy to only issue shares from authorized common stock.
The aggregate intrinsic value represents the total pretax difference between the closing stock price on the last trading day of the reporting period and the option exercise price, multiplied by the number of in-the-money options. This is the amount that would have been received by the option holders had they exercised and sold their options on that day. This amount varies based on changes in the fair market value of our common stock. The closing price of our common stock on the last trading day of our fiscal year was $14.85.
Stock options outstanding at December 31, 2017 and 2016 are summarized in the following tables:
| Range of Exercise Prices |
Options Outstanding at |
Weighted Contractual |
Weighted Price |
Options Exercisable at |
Weighted Price |
|||||||||||||||||||||||||
| $ | 15.17 | — | $ | 15.75 | 29,375 | 1.6 | $ | 15.17 | 29,375 | $ | 15.17 | |||||||||||||||||||
| $ | 15.76 | — | $ | 16.54 | 24,250 | 2.4 | $ | 16.32 | 24,250 | $ | 16.32 | |||||||||||||||||||
| $ | 16.55 | — | $ | 19.65 | 22,000 | 4.5 | $ | 17.07 | 22,000 | $ | 17.07 | |||||||||||||||||||
| $ | 19.66 | — | $ | 22.21 | 49,000 | 0.4 | $ | 21.84 | 49,000 | $ | 21.84 | |||||||||||||||||||
| $ | 22.22 | — | $ | 22.57 | 21,000 | 3.4 | $ | 22.57 | 21,000 | $ | 22.57 | |||||||||||||||||||
|
|
|
|
|
|||||||||||||||||||||||||||
| 145,625 | 2.0 | $ | 18.96 | 145,625 | $ | 18.96 | ||||||||||||||||||||||||
|
|
|
|
|
|||||||||||||||||||||||||||
98
Table of Contents
| Range of Exercise Prices |
Options Outstanding at |
Weighted Contractual |
Weighted Price |
Options Exercisable at |
Weighted Price |
|||||||||||||||||||||||||
| $ | 15.17 | — | $ | 16.54 | 54,625 | 3.0 | $ | 15.68 | 54,625 | $ | 15.68 | |||||||||||||||||||
| $ | 16.55 | — | $ | 17.58 | 36,000 | 5.5 | $ | 16.95 | 36,000 | $ | 16.95 | |||||||||||||||||||
| $ | 17.59 | — | $ | 20.20 | 54,000 | 2.3 | $ | 18.16 | 54,000 | $ | 18.16 | |||||||||||||||||||
| $ | 20.21 | — | $ | 22.21 | 51,000 | 1.4 | $ | 21.84 | 51,000 | $ | 21.84 | |||||||||||||||||||
| $ | 22.22 | — | $ | 22.57 | 36,000 | 4.4 | $ | 22.57 | 36,000 | $ | 22.57 | |||||||||||||||||||
|
|
|
|
|
|||||||||||||||||||||||||||
| 231,625 | 3.1 | $ | 18.88 | 231,625 | $ | 18.88 | ||||||||||||||||||||||||
|
|
|
|
|
|||||||||||||||||||||||||||
Restricted Stock Awards
Restricted stock awards, or “full value” awards, generally vest ratably over no less than a three-year period. Shares of restricted stock granted under the Plan are considered issued and outstanding at the date of grant, have the same dividend and voting rights as other outstanding common stock, are subject to forfeiture if employment terminates prior to vesting, and are expensed ratably over the vesting period. Dividends paid on the restricted shares granted under the Plan are non-forfeitable if the restricted shares do not ultimately vest. Restricted stock activity in 2017 and 2016 are summarized in the following table:
| Number of Awards |
Weighted Average Grant Date Fair Value |
Weighted Average Remaining Amortization Period (in Years) |
||||||||||
| Balance at December 31, 2015 |
192,293 | $ | 19.20 | 1.7 | ||||||||
| Granted |
— | $ | — | |||||||||
| Vested |
(42,546 | ) | $ | 18.47 | ||||||||
| Canceled |
(5,452 | ) | $ | 18.75 | ||||||||
|
|
|
|||||||||||
| Balance at December 31, 2016 |
144,295 | $ | 19.43 | 0.5 | ||||||||
| Granted |
— | $ | — | |||||||||
| Vested |
(140,628 | ) | $ | 19.43 | ||||||||
| Canceled |
(3,667 | ) | $ | 19.16 | ||||||||
|
|
|
|||||||||||
| Balance at December 31, 2017 |
— | $ | — | — | ||||||||
|
|
|
|||||||||||
99
Table of Contents
Restricted Stock Units
Restricted stock unit activity in 2017 and 2016 are summarized in the following table:
| Number of Awards |
Weighted Average Grant Date Fair Value |
Weighted Average Remaining Amortization Period (in Years) |
||||||||||
| Balance at December 31, 2015 |
53,323 | $ | 18.78 | 2.1 | ||||||||
| Granted |
84,200 | $ | 23.71 | |||||||||
| Vested |
(7,227 | ) | $ | 18.78 | ||||||||
| Canceled |
(2,729 | ) | $ | 18.78 | ||||||||
|
|
|
|||||||||||
| Balance at December 31, 2016 |
127,567 | $ | 22.03 | 1.7 | ||||||||
| Granted |
131,656 | $ | 22.24 | |||||||||
| Vested |
(67,889 | ) | $ | 21.54 | ||||||||
| Canceled |
(22,068 | ) | $ | 22.95 | ||||||||
|
|
|
|||||||||||
| Balance at December 31, 2017 |
169,266 | $ | 22.27 | 1.6 | ||||||||
|
|
|
|||||||||||
Restricted Performance Stock Units
Restricted performance stock unit activity in 2017 and 2016 are summarized in the following table:
| Number of Awards |
Weighted Average Grant Date Fair Value |
Weighted Average Remaining Amortization Period (in Years) |
||||||||||
| Balance at December 31, 2015 |
106,647 | $ | 18.78 | 2.0 | ||||||||
| Granted |
127,139 | $ | 23.14 | |||||||||
| Vested |
— | $ | — | |||||||||
| Canceled |
(6,593 | ) | $ | 19.92 | ||||||||
|
|
|
|||||||||||
| Balance at December 31, 2016 |
227,193 | $ | 21.72 | 1.6 | ||||||||
| Granted |
164,566 | $ | 22.39 | |||||||||
| Vested |
(71,493 | ) | $ | 19.00 | ||||||||
| Added by performance factor |
4,268 | 19.00 | ||||||||||
| Canceled |
(84,860 | ) | $ | 22.76 | ||||||||
|
|
|
|||||||||||
| Balance at December 31, 2017 |
239,674 | $ | 22.58 | 1.7 | ||||||||
|
|
|
|||||||||||
Stock Based Compensation
Stock-based compensation expense related to our equity incentive plans in accordance with U.S. GAAP was allocated as follows:
| Year Ended December 31, |
2017 | 2016 | 2015 | |||||||||
| (Thousands of dollars) | ||||||||||||
| Cost of sales |
$ | 452 | $ | 472 | $ | 370 | ||||||
| Selling, general and administrative expenses |
2,124 | 3,218 | 2,437 | |||||||||
|
|
|
|
|
|
|
|||||||
| Stock-based compensation expense before income taxes |
2,576 | 3,690 | 2,807 | |||||||||
| Income tax benefit |
(970 | ) | (1,361 | ) | (1,044 | ) | ||||||
|
|
|
|
|
|
|
|||||||
| Total stock-based compensation expense after income taxes |
$ | 1,606 | $ | 2,329 | $ | 1,763 | ||||||
|
|
|
|
|
|
|
|||||||
100
Table of Contents
As of December 31, 2017, a total of $2.5 million of unrecognized stock-based compensation expense related to non-vested awards is expected to be recognized over a weighted average period of approximately 1.6 years. There were no significant capitalized stock-based compensation costs at December 31, 2017, 2016 or 2015.
NOTE 19 - COMMON STOCK REPURCHASE PROGRAMS
In October 2014, our Board of Directors approved the 2014 Repurchase Program, which authorized the repurchase of up to $30.0 million of our common stock. Under the 2014 Repurchase Program, we repurchased common stock from time to time on the open market or in private transactions. Shares repurchased under the 2014 Repurchase Program during 2015 totaled 1,056,954 shares at a cost of $19.6 million. The 2014 Repurchase Program was completed in the beginning of 2016, with purchases of 585,970 shares for a cost of $10.3 million. The repurchased shares described above were either canceled and retired or added to treasury stock after the reincorporation in Delaware in 2015.
In January of 2016, our Board of Directors approved the 2016 Repurchase Program, which authorized the repurchase of up to $50.0 million of common stock. Under the 2016 Repurchase Program, we may repurchase common stock from time to time on the open market or in private transactions. During 2016, we repurchased 454,718 shares of company stock at a cost of $10.4 million under the 2016 Repurchase Program. In the aggregate, we purchased $20.7 million in company stock during 2016 under the 2014 Repurchase Program and 2016 Repurchase Program. During 2017, we purchased an additional 215,841 shares of company stock at a cost of $5.0 million under the 2016 Repurchase Program.
NOTE 20 - RISK MANAGEMENT
We are subject to various risks and uncertainties in the ordinary course of business due, in part, to the competitive global nature of the industry in which we operate, changing commodity prices for the materials used in the manufacture of our products and the development of new products.
We have operations in Mexico with sale and purchase transactions denominated in both Pesos and dollars. The Peso is the functional currency of certain of our operations in Mexico. The settlement of accounts receivable and accounts payable for our operations in Mexico requires the transfer of funds denominated in the Mexican peso, the value of which increased 5.1 percent in relation to the U.S. dollar in 2017. Foreign currency transaction gains totaled $11.0 million in 2017, and foreign currency losses were $0.4 million and $1.2 million in 2016 and 2015, respectively. In addition to gains on Peso foreign currency transactions, the 2017 foreign currency transaction gains include an $8.2 million realized gain on a Zloty forward contract used to hedge the acquisition purchase price, partially offset by $2.5 million unrealized loss on a Euro cross currency swap. All transaction gains and losses are included in other income (expense), net, in the consolidated income statements.
As it relates to foreign currency translation gains and losses, however, since 1990, the Mexican peso has experienced periods of relative stability followed by periods of major declines in value. The impact of these changes in value relative to our Mexico operations resulted in a cumulative unrealized translation loss at December 31, 2017 of $101.0 million. Translation gains and losses are included in other comprehensive income (loss) in the consolidated statements of comprehensive income.
We also have operations in Europe with sale and purchase transactions denominated in Euros and Zlotys. The Euro is the functional currency of our operations in Europe. A significant component of our European production operations is located in Poland. The settlement of accounts receivable and accounts payable for these operations requires the transfer of funds denominated in Zlotys. The value of the Euro has increased 7.2 percent in relation to the U.S. dollar in the seven months following the acquisition of Uniwheels ended December 31, 2017. During that same period, the value of the Zloty has remained relatively flat in relation to the Euro. Foreign currency transaction gains totaled $1.9 million for the seven months ended December 31, 2017. All transaction gains and losses are included in other income (expense) in the consolidated income statements.
101
Table of Contents
As it relates to foreign currency translation gains and losses, the Euro has experienced periods of relative stability in value. The impact of changes in value relative to our European operations resulted in a cumulative unrealized translation gain at December 31, 2017 of $26.2 million. Translation gains and losses are included in other comprehensive income (loss) in the consolidated statements of comprehensive income.
When market conditions warrant, we may also enter into purchase commitments to secure the supply of certain commodities used in the manufacture of our products, such as aluminum, natural gas and other raw materials. However, our European business had entered into forward contracts to hedge price fluctuations in its aluminum raw materials. At December 31, 2017, the fair value asset relating to foreign contracts for aluminum was $1.8 million.
NOTE 21 - CONTINGENCIES
We are party to various legal and environmental proceedings incidental to our business. Certain claims, suits and complaints arising in the ordinary course of business have been filed or are pending against us. Based on facts now known, we believe all such matters are adequately provided for, covered by insurance, are without merit and/or involve such amounts that would not materially adversely affect our consolidated results of operations, cash flows or financial position.
NOTE 22 - QUARTERLY FINANCIAL DATA (UNAUDITED)
(Dollars in thousands, except per share amounts)
| Year 2017 |
First Quarter |
Second Quarter |
Third Quarter |
Fourth Quarter |
Year | |||||||||||||||
| Net sales |
$ | 174,220 | 240,628 | 331,404 | 361,803 | 1,108,055 | ||||||||||||||
| Gross profit |
$ | 19,204 | 20,105 | 23,893 | 39,695 | 102,897 | ||||||||||||||
| Income (loss) from operations |
$ | 3,944 | (1,998 | ) | 5,758 | 13,814 | 21,518 | |||||||||||||
| Consolidated income (loss) before income taxes |
$ | 3,300 | (9,241 | ) | (501 | ) | 7,308 | 866 | ||||||||||||
| Income tax (provision) benefit |
$ | (198 | ) | 1,722 | 3,355 | (11,754 | ) | (6,875 | ) | |||||||||||
| Consolidated net income (loss) |
$ | 3,102 | (7,519 | ) | 2,854 | (4,446 | ) | (6,009 | ) | |||||||||||
| Less: Net (income) loss attributable to non-controlling interest non-controlling interest |
— | 247 | (239 | ) | (202 | ) | (194 | ) | ||||||||||||
| Net income (loss) attributable to Superior |
3,102 | (7,272 | ) | 2,615 | (4,648 | ) | (6,203 | ) | ||||||||||||
| Income (loss) per share: |
||||||||||||||||||||
| Basic |
$ | 0.12 | (0.41 | ) | (0.22 | ) | (0.50 | ) | (1.01 | ) | ||||||||||
| Diluted |
$ | 0.12 | (0.41 | ) | (0.22 | ) | (0.50 | ) | (1.01 | ) | ||||||||||
| Dividends declared per share |
$ | 0.18 | 0.09 | 0.09 | 0.09 | 0.45 | ||||||||||||||
| Year 2016 |
First Quarter |
Second Quarter |
Third Quarter |
Fourth Quarter |
Year | |||||||||||||||
| Net sales |
$ | 186,065 | $ | 182,709 | $ | 175,580 | $ | 188,323 | $ | 732,677 | ||||||||||
| Gross profit |
$ | 27,715 | $ | 29,540 | $ | 10,981 | $ | 17,968 | $ | 86,204 | ||||||||||
| Income from operations |
$ | 18,722 | $ | 19,540 | $ | 5,250 | $ | 11,090 | $ | 54,602 | ||||||||||
| Income before income taxes |
$ | 19,022 | $ | 19,247 | $ | 4,910 | $ | 11,542 | $ | 54,721 | ||||||||||
| Income tax (provision) benefit |
$ | (4,558 | ) | $ | (6,082 | ) | $ | 1,064 | $ | (3,764 | ) | $ | (13,340 | ) | ||||||
| Net income |
$ | 14,464 | $ | 13,165 | $ | 5,974 | $ | 7,778 | $ | 41,381 | ||||||||||
| Income per share: |
||||||||||||||||||||
| Basic |
$ | 0.56 | $ | 0.52 | $ | 0.24 | $ | 0.31 | $ | 1.63 | ||||||||||
| Diluted |
$ | 0.56 | $ | 0.52 | $ | 0.23 | $ | 0.31 | $ | 1.62 | ||||||||||
| Dividends declared per share |
$ | 0.18 | $ | 0.18 | $ | 0.18 | $ | 0.18 | $ | 0.72 | ||||||||||
102
Table of Contents
ITEM 9 - CHANGES IN AND DISAGREEMENTS WITH ACCOUNTANTS ON ACCOUNTING AND FINANCIAL DISCLOSURE
None.
ITEM 9A - CONTROLS AND PROCEDURES
Evaluation of Disclosure Controls
We acquired Uniwheels on May 30, 2017 and are in the process of reviewing and evaluating their internal controls as a part of the process of aligning and integrating the business and operations. SEC guidance allows companies to exclude acquisitions from their assessment of internal control over financial reporting during the first year of acquisition while integrating the acquired company. Accordingly, the scope of our assessment of the effectiveness of disclosure controls and procedures does not include internal control over financial reporting relating to Uniwheels constituted 32.8 percent of our total assets as of December 31, 2017 (excluding goodwill and intangibles which are included within the scope of the assessment), and 33.9 percent of our net sales for the year ended December 31, 2017.
The company’s management, with the participation of the CEO and Chief Financial Officer, evaluated the effectiveness of the company’s disclosure controls and procedures (as defined in Rules 13a-15(e) and 15d-15(e) under the Exchange Act) as of December 31, 2017. Our disclosure controls and procedures are designed to ensure that information required to be disclosed in reports we file or submit under the Exchange Act is recorded, processed, summarized and reported within the time periods specified in SEC rules and forms and that such information is accumulated and communicated to our management, including our CEO and Chief Financial Officer, to allow timely decisions regarding required disclosures.
Based on this evaluation, our Chief Executive Officer and Chief Financial Officer concluded that, as of December 31, 2017 our disclosure controls and procedures were effective.
Management’s Report on Internal Control Over Financial Reporting
Management is responsible for establishing and maintaining adequate internal control over financial reporting. As defined in Rule 13a-15(f) under the Exchange Act, internal control over financial reporting is a process designed to provide reasonable assurance regarding the reliability of financial reporting and the preparation of financial statements for external purposes in accordance with generally accepted accounting principles. The company’s internal control over financial reporting includes those policies and procedures that (i) pertain to the maintenance of records that, in reasonable detail, accurately and fairly reflect the transactions and dispositions of the assets of the company; (ii) provide reasonable assurance that transactions are recorded as necessary to permit preparation of financial statements in accordance with generally accepted accounting principles, and that receipts and expenditures of the company are being made only in accordance with authorizations of management and directors of the company; and (iii) provide reasonable assurance regarding prevention or timely detection of unauthorized acquisition, use, or disposition of the company’s assets that could have a material effect on the financial statements.
As previously mentioned, we acquired Uniwheels on May 30, 2017 and are in the process of reviewing and evaluating its internal control over financial reporting as a part of the process of aligning and integrating the business and operations. SEC guidance allows companies to exclude acquisitions from their assessment of internal control over financial reporting during the first year of acquisition while integrating the acquired company. Accordingly, the scope of our assessment does not include internal control over financial reporting relating to Uniwheels. Uniwheels constituted 32.8 percent of our total assets as of December 31, 2017 (excluding goodwill and intangibles which are included within the scope of the assessment) assets recorded as part of the purchase accounting), and 33.9 percent of our net sales for the year ended December 31, 2017.
103
Table of Contents
Because of its inherent limitations, internal control over financial reporting may not prevent or detect all misstatements. Also, projections of any evaluation of effectiveness to future periods are subject to the risk that controls may become inadequate because of changing conditions, or that the degree of compliance with policies or procedures may deteriorate.
A material weakness is a deficiency, or combination of deficiencies, in internal control over financial reporting, such that there is a reasonable possibility that a material misstatement of the company’s annual or interim financial statements will not be prevented or detected on a timely basis.
Management performed an assessment of the effectiveness of the company’s internal control over financial reporting as of December 31, 2017 based upon criteria established in the 2013 Internal Control - Integrated Framework issued by the Committee of Sponsoring Organizations of the Treadway Commission (COSO). Based on our assessment, management determined that our internal control over financial reporting, excluding the recently acquired Uniwheels business, was effective as of December 31, 2017 based on the criteria in the 2013 Internal Control - Integrated Framework issued by COSO.
The effectiveness of the company’s internal control over financial reporting as of December 31, 2017 has been audited by Deloitte and Touche LLP, an independent registered public accounting firm, as stated in their report, which is included in this Annual Report.
Changes in Internal Control Over Financial Reporting
Other than the acquisition of Uniwheels referenced above, there has been no change in our internal control over financial reporting during the most recent fiscal quarter ended December 31, 2017 that has materially affected, or is reasonably likely to materially affect, our internal control over financial reporting.
None.
104
Table of Contents
PART III
ITEM 10 - DIRECTORS, EXECUTIVE OFFICERS AND CORPORATE GOVERNANCE
Except as set forth herein, the information required by this Item is incorporated by reference to our 2018 Proxy Statement.
Executive Officers - The names of corporate executive officers as of fiscal year end who are not also Directors are listed at the end of Part I of this Annual Report. Information regarding executive officers who are Directors is contained in our 2018 Proxy Statement under the caption “Proposal No. 1 - Election of Directors.” Such information is incorporated herein by reference. With the exception of the CEO, all executive officers are appointed annually by the Board of Directors and serve at the will of the Board of Directors. For a description of the CEO’s employment agreement, see “Executive Compensation and Related Information - Compensation Discussion and Analysis” in our 2018 Proxy Statement, which is incorporated herein by reference.
Code of Ethics - Included on our website, www.supind.com, under “Investors,” is our Code of Conduct, which, among others, applies to our CEO, Chief Financial Officer and Chief Accounting Officer. Copies of our Code of Conduct are available, without charge, from Superior Industries International, Inc., Shareholder Relations, 26600 Telegraph Road, Suite 400, Southfield, Michigan 48033.
ITEM 11 - EXECUTIVE COMPENSATION
Information relating to Executive Compensation is set forth under the captions “Compensation of Directors” and “Executive Compensation and Related Information - Compensation Discussion and Analysis” in our 2018 Proxy Statement, which is incorporated herein by reference.
ITEM 12 - SECURITY OWNERSHIP OF CERTAIN BENEFICIAL OWNERS AND MANAGEMENT AND RELATED STOCKHOLDER MATTERS
Information related to Security Ownership of Certain Beneficial Owners and Management and Related Stockholder Matters is set forth under the caption “Voting Securities and Principal Ownership” in our 2018 Proxy Statement. Also see Note 18, “Stock Based Compensation” in the Notes to the Consolidated Financial Statements in Item 8, “Financial Statements and Supplementary Data” of this Annual Report.
ITEM 13 - CERTAIN RELATIONSHIPS AND RELATED TRANSACTIONS, AND DIRECTOR INDEPENDENCE
Information related to Certain Relationships and Related Transactions is set forth under the caption, “Certain Relationships and Related Transactions,” in our 2018 Proxy Statement, and in Note 15, “Leases and Related Parties” in the Notes to the Consolidated Financial Statements in Item 8, “Financial Statements and Supplementary Data” of this Annual Report.
ITEM 14 - PRINCIPAL ACCOUNTANT FEES AND SERVICES
Information related to Principal Accountant Fees and Services is set forth under the caption “Proposal No. 4 - Ratification of Independent Registered Public Accounting Firm - Principal Accountant Fees and Services” in our 2018 Proxy Statement and is incorporated herein by reference.
105
Table of Contents
PART IV
ITEM 15 - EXHIBITS AND FINANCIAL STATEMENT SCHEDULES
| (a) | The following documents are filed as a part of this report: |
| 1. | Financial Statements: See the “Index to the Consolidated Financial Statements and Financial Statement Schedule” in Item 8 of this Annual Report. |
| 2. | Financial Statement Schedule |
Schedule II – Valuation and Qualifying Accounts for the Years Ended December 31, 2017, 2016 and 2015
| 3. | Exhibits |
106
Table of Contents
107
Table of Contents
108
Table of Contents
| * | Indicates management contract or compensatory plan or arrangement. |
| ** | Filed herewith. |
| *** | Certain schedules and exhibits to this agreement have been omitted in accordance with Item 601(b)(2) of Regulation S-K. A copy of any omitted schedule or exhibit will be furnished supplementally to the Securities and Exchange Commission upon request. |
| **** | Submitted electronically with the report. |
109
Table of Contents
SUPERIOR INDUSTRIES INTERNATIONAL, INC.
ANNUAL REPORT ON FORM 10-K
VALUATION AND QUALIFYING ACCOUNTS
FOR THE YEARS ENDED DECEMBER 31, 2017, 2016 AND 2015
(Dollars in thousands)
| Additions | ||||||||||||||||||||
| Balance at Beginning of Year |
Charge to Costs and Expenses |
Other | Deductions From Reserves |
Balance at End of Year |
||||||||||||||||
| 2017 |
||||||||||||||||||||
| Allowance for doubtful accounts receivable |
$ | 919 | $ | 1,127 | $ | 1,162 | $ | (883 | ) | $ | 2,325 | |||||||||
| Valuation allowances for deferred tax assets |
$ | 3,123 | $ | 1,005 | $ | 3,506 | — | $ | 7,634 | |||||||||||
| 2016 |
||||||||||||||||||||
| Allowance for doubtful accounts receivable |
$ | 867 | $ | 403 | $ | — | $ | (351 | ) | $ | 919 | |||||||||
| Valuation allowances for deferred tax assets |
$ | 5,891 | $ | 698 | $ | — | $ | (3,466 | ) | $ | 3,123 | |||||||||
| 2015 |
||||||||||||||||||||
| Allowance for doubtful accounts receivable |
$ | 514 | $ | 380 | $ | — | $ | (27 | ) | $ | 867 | |||||||||
| Valuation allowances for deferred tax assets |
$ | 3,911 | $ | 1,980 | $ | — | $ | — | $ | 5,891 | ||||||||||
110
Table of Contents
SUPERIOR INDUSTRIES INTERNATIONAL, INC.
ANNUAL REPORT ON FORM 10-K
SIGNATURES
Pursuant to the requirements of Section 13 or 15(d) of the Securities Exchange Act of 1934, the Registrant has duly caused this report to be signed on its behalf by the undersigned, thereunto duly authorized.
| SUPERIOR INDUSTRIES INTERNATIONAL, INC. | ||||||
| (Registrant) | ||||||
| By | /s/ Donald J. Stebbins | March 15, 2018 | ||||
| Donald J. Stebbins | ||||||
| Chief Executive Officer and President | ||||||
Pursuant to the requirements of the Securities Exchange Act of 1934, this report has been signed below by the following persons on behalf of the registrant and in the capacity and on the dates indicated.
| /s/ Donald J. Stebbins Donald J. Stebbins |
Chief Executive Officer and President (Principal Executive Officer) | March 15, 2018 | ||
| /s/ Nadeem Moiz Nadeem Moiz |
Executive Vice President and Chief Financial Officer (Principal Financial Officer) | March 15, 2018 | ||
| /s/ Scot S. Bowie Scot S. Bowie |
Vice President and Corporate Controller (Principal Accounting Officer) | March 15, 2018 | ||
| /s/ Michael R. Bruynesteyn Michael R. Bruynesteyn |
Director | March 15, 2018 | ||
| /s/ Jack A. Hockema Jack A. Hockema |
Director | March 15, 2018 | ||
| /s/ Paul J. Humphries Paul J. Humphries |
Director | March 15, 2018 | ||
| /s/ James S. McElya James S. McElya |
Director | March 15, 2018 | ||
| /s/ Timothy C. McQuay Timothy C. McQuay |
Director | March 15, 2018 | ||
| /s/ Ellen B. Richstone Ellen B. Richstone |
Director | March 15, 2018 | ||
| /s/ Francisco S. Uranga Francisco S. Uranga |
Director | March 15, 2018 | ||
| /s/ Ransom A. Langford Ransom A. Langford |
Director | March 15, 2018 | ||
111