Attached files
| file | filename |
|---|---|
| EX-32.2 - EXHIBIT 32.2 - Jason Industries, Inc. | ex-322x12312016.htm |
| EX-32.1 - EXHIBIT 32.1 - Jason Industries, Inc. | ex-321x12312016.htm |
| EX-31.2 - EXHIBIT 31.2 - Jason Industries, Inc. | ex-312x12312016.htm |
| EX-31.1 - EXHIBIT 31.1 - Jason Industries, Inc. | ex-311x12312016.htm |
| EX-23 - EXHIBIT 23 - Jason Industries, Inc. | ex-23x12312016.htm |
| EX-21 - EXHIBIT 21 - Jason Industries, Inc. | ex-21x12312016.htm |
| EX-12 - EXHIBIT 12 - Jason Industries, Inc. | ex-12x12312016.htm |
UNITED STATES
SECURITIES AND EXCHANGE COMMISSION
Washington, D.C. 20549
FORM 10-K
ý ANNUAL REPORT PURSUANT TO SECTION 13 OR 15(d) OF THE SECURITIES EXCHANGE ACT OF 1934
For the fiscal year ended December 31, 2016
¨ TRANSITION REPORT PURSUANT TO SECTION 13 OR 15(d) OF THE SECURITIES EXCHANGE ACT OF 1934
Commission File Number: 001-36051

JASON INDUSTRIES, INC.
(Exact name of registrant as specified in its charter
Delaware | 46-2888322 | |
(State or other jurisdiction of incorporation or organization) | (I.R.S. Employer Identification Number) | |
833 East Michigan Street Suite 900 Milwaukee, Wisconsin 53202 |
(Address of principal executive offices) |
(414) 277-9300 |
(Registrant’s telephone number, including area code) |
Securities registered pursuant to Section 12(b) of the Act: | ||
Common Stock, $0.0001 par value per share | The NASDAQ Stock Market LLC | |
Warrants to purchase Common Stock | The NASDAQ Stock Market LLC | |
(Title of class) | (Name of exchange on which registered) | |
Securities registered pursuant to Section 12(g) of the Act: None | ||
Indicate by check mark if the registrant is a well-known seasoned issuer, as defined in Rule 405 of the Securities Act. Yes ¨ No ý
Indicate by check mark if the registrant is not required to file reports pursuant to Section 13 or Section 15(d) of the Act. Yes ¨ No ý
Indicate by check mark whether the registrant (1) has filed all reports required to be filed by Section 13 or 15(d) of the Securities Exchange Act of 1934 during the preceding 12 months (or for such shorter period that the registrant was required to file such reports), and (2) has been subject to such filing requirements for the past 90 days. Yes ý No ¨
Indicate by check mark whether the registrant has submitted electronically and posted on its corporate Website, if any, every Interactive Date File required to be submitted and posted pursuant to Rule 405 of Regulation S-T (§232.405 of this chapter) during the preceding 12 months (or for such shorter period that the registrant was required to submit and post such files). Yes ý No ¨
Indicate by check mark if disclosure of delinquent filers pursuant to Item 405 of Regulation S-K is not contained herein, and will not be contained, to the best of registrant’s knowledge, in definitive proxy or information statements incorporated by reference in Part III of this Form 10-K or any amendment to this Form 10-K. ý
Indicate by check mark whether the registrant is a large accelerated filer, an accelerated filer, a non-accelerated filer, or a smaller reporting company. See definitions of “large accelerated filer”, “accelerated filer” and “smaller reporting company” in Rule 12b-2 of the Exchange Act. (Check one):
Large accelerated filer ¨ | Accelerated filer ý | |
Non-accelerated filer ¨ | Smaller reporting company ¨ | |
(Do not check if a smaller reporting company) | ||
Indicate by check mark whether the registrant is a shell company (as defined in Rule 12b-2 of the Exchange Act). Yes ¨ No ý
The aggregate market value of the voting and non-voting stock held by non-affiliates of the registrant, as of July 1, 2016, the last business day of the registrant’s most recently completed second fiscal quarter, was approximately $65.5 million (based upon the closing price of $3.64 per share on The NASDAQ Stock Market as of such date). Solely for the purposes of this disclosure, shares of common stock held by executive officers and directors of the registrant as of such date have been excluded because such persons may be deemed to be affiliates. This determination of executive officers and directors as affiliates is not necessarily a conclusive determination for any other purposes.
There were 25,886,203 shares of common stock issued and outstanding as of February 23, 2017.
Documents Incorporated by Reference
Portions of the registrant’s definitive proxy statement relating to its 2017 Annual Meeting of Shareholders (the “2017 Proxy Statement”) are incorporated by reference into Part III of this Annual Report on Form 10-K. The 2017 Proxy Statement will be filed with the U.S. Securities and Exchange Commission within 120 days after the end of the fiscal year to which this report relates.
JASON INDUSTRIES, INC.
TABLE OF CONTENTS
1
Cautionary Note Regarding Forward-Looking Statements
Unless otherwise indicated, references to “Jason Industries,” the “Company,” “we,” “our” and “us” in this Annual Report on Form 10-K refer to Jason Industries, Inc. and its consolidated subsidiaries.
This report contains forward-looking statements within the meaning of the “safe harbor” provisions of the Private Securities Litigation Reform Act of 1995. Specifically, forward-looking statements may include statements relating to the Company’s future financial performance, changes in the markets for the Company’s products, the Company’s expansion plans and opportunities, and other statements preceded by, followed by or that include the words “estimate,” “plan,” “project,” “forecast,” “intend,” “expect,” “anticipate,” “believe,” “seek,” “target” or similar expressions.
These forward-looking statements are based on information available to the Company as of the date of this report and current expectations, forecasts and assumptions, and involve a number of judgments, risks and uncertainties. Accordingly, forward-looking statements should not be relied upon as representing the Company’s views as of any subsequent date, and the Company does not undertake any obligation to update forward-looking statements to reflect events or circumstances after the date they were made, whether as a result of new information, future events or otherwise, except as may be required under applicable securities laws.
As a result of a number of known and unknown risks and uncertainties, the Company’s actual results or performance may be materially different from those expressed or implied by these forward-looking statements. Some factors that could cause actual results to differ include the following:
• | level of demand for the Company’s products; |
• | competition in the Company’s markets; |
• | the Company’s ability to grow and manage growth profitably; |
• | the Company’s ability to access additional capital; |
• | changes in applicable laws or regulations; |
• | the Company’s ability to attract and retain qualified personnel; |
• | the possibility that the Company may be adversely affected by other economic, business, and/or competitive factors; and |
• | other risks and uncertainties indicated in this report, including those discussed under “Risk Factors” in Item 1A of Part I of this report, as such may be amended or supplemented in Part II, Item 1A, “Risk Factors”, of the Company’s subsequently filed Quarterly Reports on Form 10-Q. |
Introductory Note
On June 30, 2014, the Company (formerly known as Quinpario Acquisition Corp.) and Jason Partners Holdings Inc. (“Jason”) completed a transaction in which JPHI Holdings Inc. (“JPHI”), a majority owned subsidiary of the Company, acquired 100 percent of the capital stock of Jason from its then current owners, Saw Mill Capital, LLC, Falcon Investment Advisors, LLC and other investors (the “Business Combination”). In connection with the closing of the Business Combination, the Company changed its name to Jason Industries, Inc., and commenced trading of its common stock and warrants under the symbols, “JASN” and “JASNW”, respectively, on The NASDAQ Stock Market. This transaction is further described in Note 2 to the Company’s consolidated financial statements included herein.
PART I
ITEM 1. BUSINESS
Corporate History
Jason Industries, a Delaware corporation, was originally formed in May 2013 as a blank check company under the name Quinpario Acquisition Corp. (“QPAC”) for the purpose of effecting a merger, capital stock exchange, asset acquisition, stock purchase, reorganization or similar business combination involving QPAC and one or more businesses. Until the consummation of the Business Combination, QPAC’s securities were traded on The NASDAQ Stock Market (“Nasdaq”) under the ticker symbols “QPAC,” “QPACU” and “QPACW.”
On June 30, 2014, the Company completed the Business Combination pursuant to a stock purchase agreement, dated as of March 16, 2014 (the “Purchase Agreement”), that provided for the acquisition of all of the capital stock of Jason, the indirect parent company of Jason Incorporated, by JPHI from Jason Partners Holdings LLC (“Seller”) and certain members of Seller. In connection with the Business Combination, the Company entered into new senior secured credit facilities with a syndicate of lenders led by Deutsche Bank AG New York Branch, as administrative agent, in the aggregate amount of approximately $460.0
2
million, which was primarily used to refinance Jason Incorporated’s existing indebtedness, pay transaction fees and expenses and pay a portion of the purchase price under the Purchase Agreement. The purchase price under the Purchase Agreement was also funded with cash held in our trust account, the contribution of Jason common stock to JPHI by certain members of Seller and certain directors and management of Jason Incorporated (collectively, the “Rollover Participants”) in exchange for JPHI stock, and the proceeds from the sale of our 8% Series A Convertible Perpetual Preferred Stock (the “Series A Preferred Stock”) in a private placement that closed simultaneously with the Business Combination.
Following the Business Combination, Jason Incorporated became an indirect majority-owned subsidiary of the Company and our only significant asset, with the Rollover Participants indirectly owning 16.9% of Jason Incorporated and the Company indirectly owning 83.1% of Jason Incorporated. We also changed our name from “Quinpario Acquisition Corp.” to “Jason Industries, Inc.” and continued the listing of our Common Stock and Warrants on Nasdaq under the symbols “JASN” and “JASNW,” respectively, effective July 1, 2014.
Through October 2016, the Rollover Participants owned 16.9% of Jason Incorporated. In November and December of 2016 and the first quarter of 2017, certain Rollover Participants exchanged their JPHI stock for Company common stock, which decreased the Rollover Participant’s ownership percentage in JPHI to 0% as of February 23, 2017.
Presentation of Financial and Operating Data
The Business Combination was accounted for using the acquisition method of accounting under the provisions of Accounting Standards Codification Topic 805, “Business Combinations.” Accordingly, we are treated as the legal and accounting acquirer and Jason is treated as the legal and accounting acquiree. However, Jason is considered to be our accounting predecessor, and therefore unless otherwise indicated, the financial information and operating data presented in this Annual Report on Form 10-K is that of Jason Partners Holdings Inc.
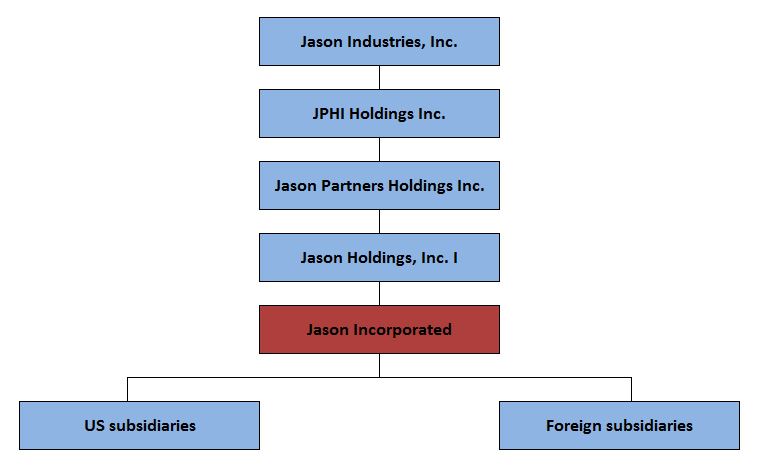
Organizational Chart
The following chart sets forth our organizational structure as of February 23, 2017:
Our Business
Jason Industries is a global industrial manufacturing company with significant market share positions in each of its four businesses: seating, finishing, acoustics and components. Jason Incorporated was founded in 1985 and today provides critical components and manufacturing solutions to customers across a wide range of end markets, industries and geographies through a global network of 34 manufacturing facilities and 14 sales offices, warehouses and joint venture facilities throughout the United States and 14 foreign countries. The Company has embedded relationships with long standing customers, superior scale and resources and specialized capabilities to design and manufacture specialized products on which our customers rely.
The Company focuses on markets with sustainable growth characteristics and where it is, or has the opportunity to become, the industry leader. The Company’s seating segment supplies seating solutions to equipment manufacturers in the motorcycle, lawn and turf care, industrial, agricultural, construction and power sports end markets. The finishing segment focuses on the production of industrial brushes, buffing wheels, buffing compounds, and abrasives that are used in a broad range of industrial and infrastructure applications. The acoustics segment manufactures engineered non-woven, fiber-based
3
acoustical products for the automotive industry. The components segment is a diversified manufacturer of expanded and perforated metal components and subassemblies for smart utility meters.
Jason Incorporated History
The formation of Jason Incorporated’s platform began in 1985 when it completed the buyout of three businesses, collectively generating $71.6 million of revenue, from AMCA International, a manufacturing conglomerate that served a variety of industries. The acquired businesses consisted of (i) Osborn Manufacturing, the largest manufacturer of industrial brushes in the United States; (ii) Janesville Products, the largest manufacturer of automotive acoustical fiber insulation in the United States; and (iii) Jackson Buff, the largest manufacturer of industrial buffs in the United States, each of which has a history spanning decades.
Description of Business Segments
Jason Industries’ global industrial platform encompasses a diverse group of industries, geographies and end markets. Through our four business segments, we deliver an array of industrial consumables and critical manufactured components to a number of industries, including industrial equipment, motorcycles, lawn and turf care, rail, automotive and smart meters. The highly fragmented nature of the Company’s end markets creates growth opportunities given our established global footprint and leading share positions. Our businesses serve multiple industries and can be categorized under four businesses: seating, finishing, acoustics and components.
Net sales are distributed amongst the four segments as follows:
Successor | Combined* | |||||||
Year ended December 31, | ||||||||
2016 | 2015 | 2014 | ||||||
Net sales | ||||||||
Seating | 22.8 | % | 25.0 | % | 24.5 | % | ||
Finishing | 27.9 | % | 27.0 | % | 26.7 | % | ||
Acoustics | 35.4 | % | 30.8 | % | 31.1 | % | ||
Components | 13.9 | % | 17.2 | % | 17.7 | % | ||
100.0 | % | 100.0 | % | 100.0 | % | |||
*We have combined our net sales in the period June 30, 2014 through December 31, 2014 with our predecessor’s net sales in the period January 1, 2014 through June 29, 2014. Net sales were not affected by acquisition accounting.
See more information regarding our segments and sales by geography within Part II, Item 8, Note 16 to the Consolidated Financial Statements.
Seating
Market/Industry Overview
The Company’s product line includes motorcycle seats; operator seats for the construction, agriculture, lawn and turf care and other industrial equipment markets; and seating for the power sports market. The market for seating products is dominated by several large domestic and international participants, who are often awarded contracts as the sole supplier for a particular motorcycle, riding lawn mower or other construction, agriculture or material handling platform. We believe that competition is based mostly on innovative styling, manufacturing flexibility, quality, prices and delivery.
Motorcycle production has experienced a decline in the past year, and we believe demand in the global motorcycle market will be flat to down modestly in 2017. Demand for lawn and turf care equipment is primarily dependent on weather and trends in personal consumption expenditures, recreational and leisure activities, and residential and commercial real estate construction and sales. The market for lawn and turf care equipment has remained relatively flat in the past year and we expect it to mirror general economic conditions.
Key Products
Through the seating business, which represented 22.8% of the Company’s 2016 revenue, the Company provides seating solutions for a variety of applications, including motorcycle, agricultural, construction, industrial, lawn and turf care, and power sports. The seating business was established in 1995 through the acquisition of Milsco Manufacturing Company, which has provided high-quality seats since 1934. The seating business operates under the Milsco brand, which was originally established as a harness maker in 1924 and, early in its history, gained notice as the first company to put padded seating on tractors and farm equipment.
4
The seating business offers a distinct vertically integrated operating model, which includes a full range of functions, such as research and development, design and engineering, manufacturing of components and final assembly. Through our broad manufacturing capabilities and high quality products, we have established longstanding relationships with our top customers, which average over 30 years.
Finishing
Market/Industry Overview
The Company’s product lines are comprised of industrial brushes, polishing buffs and compounds, and abrasives used primarily in the metalworking, welding and construction industries. The market for finishing products is highly fragmented with most participants having single or limited product lines and serving specific geographic markets. While the finishing business competes with numerous domestic and international companies across a variety of product lines, we do not believe that any one competitor directly competes with us on all of our product lines. We believe we are the only market participant that reaches all regions of the world. End users of finishing products are broadly diversified across many sectors of the economy. In the long-term, the finishing market is closely tied to overall growth in industrial production, which we believe has fundamental long-term growth potential.
The finishing market is also characterized by the need for sophisticated manufacturing equipment, the ability to produce a broad number of niche products and the flexibility in manufacturing operations to adapt to ever-changing customer demands and schedules. We believe entry into markets by competitors with lower labor costs, including foreign competitors, will be limited because labor is a relatively small portion of total manufacturing costs. The cost of labor, manufacturing, shipping and logistics is dramatically rising in countries such as China and customers continue to have increasing demand for shorter lead times and lower inventory and carrying costs.
Key Products
Through the finishing business, which represented 27.9% of the Company’s 2016 revenue, Jason Industries produces and supplies industrial brushes, buffing wheels and buffing compounds, and abrasives. We established the finishing business in 1985 by acquiring the business of Osborn Manufacturing, which has been in operation since 1889. Our products are used in a variety of applications with no single customer or industry accounting for a significant portion of business revenue. The Company has strategic facilities located globally, including labor-intensive production sites in low-cost locations such as China, Portugal, Romania, Mexico and Taiwan.
The finishing business is a one-stop provider of standard and customized brush, buffing wheel and buffing compound, and abrasives products used across multiple industries, including aerospace, engineering, plastic, finishing, building, leisure, steel, hardware, welding and naval, among others. Our broad product suite is composed of brush types used for a variety of applications, including power, maintenance, strip, punch, and roller brushes. These products are marketed under leading brand names that include Osborn®, Sealeze® and Dendix®. Our buff products are sold under the Jackson®, Lea®, JacksonLea®, Langsol® and Unipol® brands and are comprised of industrial buffs and abrasives used primarily to finish parts requiring a high degree of luster and/or a satin or textured surface. In addition to manufacturing buffs, the Company also produces the industry’s broadest product line of buffing compounds available in liquid or bar form that are customized to specific end use requirements. Our abrasives products are marketed under the DRONCO® and Osborn® brands and include bonded abrasives such as cutting and grinding wheels and flap discs, as well as diamond cutting wheels and tools. We also service customers with products complementing our brush, polishing, and abrasives lines, including heavy-duty idler rollers for high-capacity precision load handling sold under the Load Runners® brand.
The Company has representatives who reach more than 30,000 customers in approximately 130 countries worldwide. During 2016, the finishing segment derived approximately 61% of finishing sales from North America and the majority of the remaining revenue from Europe and South America. We service our diverse customer base through U.S. facilities in Ohio, Indiana, California and Virginia and 13 foreign countries, including joint ventures in China and Taiwan. Our manufacturing and service locations allow us to work on a regional and local basis with customers to develop custom products and provide significant technical support, resulting in strong relationships with our top customers that average 25 years. In addition, the Company has invested in state-of-the-art laboratories in Richmond, Indiana and Burgwald, Germany to provide further technical design capabilities for its North American and European customers.
Acoustics
Market/Industry Overview
The market for automotive acoustical products is dominated by several large domestic and international participants. These participants are often awarded contracts as the sole supplier for a particular automotive platform. Competition includes manufacturers of mechanically bonded non-woven products, resin-bonded products and urethane foam. Competition is based
5
on innovative styling, price, acoustical performance and weight. Engineering, design and innovation are key distinguishing factors because acoustical products represent a small percentage of the total cost to manufacture an automobile.
Growth in the automotive acoustics market is driven by increasing demand for enhanced acoustics and improved noise, vibration and harshness characteristics within the automotive market. As overall vehicle quality has improved, consumers have increasingly equated quality with the acoustic performance of a vehicle. As a result, car manufacturers have expended significant capital for sophisticated acoustical testing systems and laboratories. In addition, an increasing regulatory focus on reducing vehicle mass, increasing fuel-efficiency and stringent end of vehicle life recycling standards have driven the penetration of non-woven materials that are lighter than other acoustical products and that utilize recycled post-industrial textile fibers and recycled PET containers. The replacement of interior and exterior products previously served by plastic-based materials has created a trend in new vehicle designs to substitute structured non-woven acoustical products with vehicle manufacturers, which has helped to expand non-woven acoustical content per vehicle.
Key Products
Through the acoustics business, which represented 35.4% of the Company’s 2016 revenue, we manufacture engineered non-woven, fiber-based acoustical products primarily for the automotive industry. The acoustics business was established in 1985 through the acquisition of Janesville Products, which has developed extensive design and manufacturing expertise over its 140 year history that allows it to provide custom acoustical solutions for each vehicle platform it serves. We market our products as being lighter, improving acoustical performance, enhancing aesthetics, and being easier to install than other acoustical products manufactured by our competitors. As a result, our products are used in a large share of light vehicles manufactured in North America today, including 10 of 2016’s top 20 models.
We believe the acoustics business offers the broadest product line of value-added, higher margin components used in a wide range of vehicles, including automobiles, sport utility vehicles and light trucks, as well as in the industrial and transportation markets. The Company has focused on developing premier lightweight fiber-based solutions that provide competitive or superior acoustical properties. Our production of non-woven fiber-based products is organized by the form in which it is supplied: (i) die cut, (ii) molded, (iii) rolls and blanks, and (iv) other non-woven products.
The acoustics business operates principally as an automotive Original Equipment Manufacturer (“OEM”) and Tier-1 supplier. Recently, the Company has focused on increasing sales directly to automotive OEMs, which allows us to integrate our technology and value-added capabilities within OEM organizations. These efforts have shifted sales to what we believe is a more desirable balance between OEMs and Tier-1 suppliers while also broadening the number of vehicle platforms that utilize the Company’s products. Additionally, the Company has increased its North American content per vehicle on a compound annual growth rate of approximately 4% over the past three years. Substantially all automotive products are sole sourced by customers for a particular vehicle and are used for the life of the platform.
Components
Market/Industry Overview
The market for component products is highly fragmented with most participants having single or limited product lines, serving specific geographic markets or providing niche capabilities applicable to a limited customer base. While there are numerous competitors with limited product offerings, there are only a few national and international competitors of a size comparable to the components business. While we compete with certain domestic and international competitors across a portion of our product lines, we believe that no one competitor directly competes with us across all of our product lines. End users of component products are broadly diversified across many sectors of the economy.
Demand in the components market is influenced by the broader industrial manufacturing market, as well as trends in the perforated and expanded metal, rail and outdoor power equipment industries. The best gauge of domestic industrial production is the U.S. Industrial Production Index, which measures the monthly level of output arising from the manufacturing, mining and gas sectors.
Key Products
Through the components business, which represented 13.9% of the Company’s 2016 revenue, we manufacture a broad range of expanded and perforated metal components and subassemblies. The Company is a provider of components that are used in a broad array of products, including smart meters, hardware, railcars and off-road equipment. The components business was originally acquired in 1993 through the purchase of the Koller Group, a producer of metal formed components such as stampings, subassemblies, wire forms and expanded metal products. Today, the components business operates through the Metalex and Morton brands, as we made the strategic decision to discontinue certain product lines and selling under the Assembled Products brand in 2016.
Within each of the components business product categories, our strategy is to have engineers work alongside customers to create value-added components and solutions for various end products. Our engineering resources, manufacturing
6
capabilities and low cost production availability through our operations in Mexico provide opportunities to deliver value to customers. These characteristics drive long-standing relationships with our top customers that average over 20 years.
Competitive Strengths
The Company believes the following key characteristics provide a competitive advantage and position us for future growth:
Established Industry Leader Across Our Four Businesses
The Company’s businesses have developed leading positions across various niche markets. For example, in our turf care seats, buffing wheels and buffing compounds and automotive acoustical insulation product lines, we believe we are more than twice the size of the next largest direct competitor. The Company’s market share positions have created a stable platform upon which to grow. Our products’ significant brand recognition helps to sustain our market share positions. The Company’s products are often viewed as a brand of choice for quality, dependability, value and continuous innovation. In several niche markets, the Company is the only provider of certain products or manufacturing capabilities. We have served many of our customers for over 25 years. Despite leading positions in many of our markets, we face competitive challenges in others. In the Company’s finishing and components segments, we believe certain of our competitors are small and family-owned, operate with lower operating expenses, have lower profit expectations and/or supply lower cost commodity products, which allows such competitors to provide lower cost products and compete with us on pricing. In our seating segment, specifically with respect to highly technical seats for the agricultural and construction vehicle markets, the cost to customers of switching from a current supplier’s products to ours is high, and we believe certain of our competitors have established long-term and entrenched relationships with such customers. These costs and relationships make it challenging to convince such customers to purchase products from us instead of from their existing supplier.
Superior Design & Manufacturing Solutions
The Company has a track record of providing customers with innovative, customized solutions through production flexibility and collaboration with their design and manufacturing teams. We have consistently refined manufacturing processes to incorporate design technologies that improve design capabilities, breadth of product offering, product quality and manufacturing efficiency.
Across our businesses, we maintain teams of designers and a diverse product selection in numerous geographic regions, which allows us to respond quickly to real-time customer needs. Our versatile design and manufacturing capabilities enable us to deliver differentiated and highly-customized solutions for customers by leveraging experienced engineering staff and technologically advanced manufacturing equipment. We believe our diverse product offerings and customized design and manufacturing capabilities have made us a preferred choice within many industries and an entrenched key solutions provider to customers. Some of the Company’s competitors focus on commodity products and lower-value-added products that appeal to certain end users and markets.
We believe we have become a partner at each stage in product development, which has deepened our relationships with an already entrenched customer base and driven revenue growth from existing accounts and new customers.
Scalable Business Philosophy
We use a consistent strategy and focus and deploy capital and resources across our businesses to projects with the highest returns on invested capital. Through corporate strategic planning initiatives, we annually assess our three-year outlook and goals, by using a policy deployment matrix disseminated throughout the organization. The Company’s management utilizes the strategic plan and resulting policy deployment matrix to develop an annual budget and profit plan and monitors progress towards long-term strategic goals.
Across the Company’s businesses, our management team is focused on enhancing product innovation, efficiency, global accessibility and competitiveness. Shared best practices serve to continually improve the processes and products that our customers depend on by delivering customized, value-added solutions across the platform. This global reach offers customers a consistent and fully integrated manufacturing partner capable of serving their needs on a global, regional and local basis.
Diverse, Global Footprint with Growing Presence in Emerging Markets
The Company maintains 34 global manufacturing locations, consisting of 14 in the United States and 20 in foreign countries, giving each business a strong international presence. Approximately 30% of the Company’s 2016 revenue was generated from products manufactured outside of the United States. In addition, our global presence enables us to take advantage of low-cost manufacturing at our facilities in China, India, Romania, Mexico, Portugal and other countries and to meet the needs of local customers with operations in those regions. The Company continues to build upon its established presence in low-cost production locations through the expansion of owned operations and the development of joint ventures and sourcing relationships in Asia, Eastern Europe and Mexico. Our management believes that this global footprint also
7
provides channels of organic growth through the introduction of products into new markets. Our management frequently evaluates our manufacturing, warehouse, distribution and sales locations to identify revenue enhancement opportunities, optimize production costs and ensure proximity to key customers.
Growth Strategies
The Company is focused on delivering sustained profitable growth through a number of avenues. Our growth initiatives are developed based on strategic plans conducted on an annual basis within each business. These plans are regularly reviewed and updated by our leadership team. As a result, we have a uniform strategy that focuses all of our resources on the following key initiatives:
Margin Growth
We are focused on continuous improvement in our profit margins through the development of higher-margin products, continued operational improvements and active product portfolio management. We anticipate our strategy of shifting toward innovative higher-value engineered products will continue to improve our pricing power and profitability. Among other initiatives, the Company is focused on redesigning products to reduce materials costs, continuing to reduce labor-intensive manufacturing processes and reducing logistics costs, which have traditionally been a significant component of overall costs and an important consideration when choosing its strategic manufacturing locations.
The Company is focused on creating operational effectiveness at each of its business segments through deployment of lean principles and implementation of continuous operational improvement initiatives. While many of these activities have focused on implementing shop floor improvements, we have also targeted our selling and administrative functions in order to reduce the cost of serving our customers. The Company is also focused on improving profitability through an active evaluation of customer pricing and a reduction in the number of parts and product variations that are produced. While these initiatives may result in lower overall sales, they are focused on creating shareholder value through higher margins and profitability, as well as lower inventory levels and working capital requirements.
Market Share Gains
While our four businesses pursue growth within new and existing markets through customized strategies targeted for the markets we serve, all businesses are tasked with identifying and pursuing key growth opportunities through new products, end markets, geographies and sales channels. Management believes we have the potential to increase market share due to the highly fragmented nature of our end markets. Each business has identified specific opportunities to expand market share, with associated incremental revenue targets.
Product Innovation
Management believes that the Company’s strategy of developing innovative products will position us for continued growth. Working in collaboration with key customers, the design and manufacture of customized products that deliver value will support this growth. We believe that developing new products will allow us to deepen our value-added relationships with customers, open new opportunities for revenue generation, improve pricing power and enhance profitability. The Company has a focused and dedicated strategy for continuous innovation, which is supported by sophisticated manufacturing capabilities and engineering expertise. Such research and development costs incurred in the development of new products or significant improvements to existing products were $4.2 million in the year ended December 31, 2016, $5.0 million in the year ended December 31, 2015, $2.1 million in the period June 30, 2014 through December 31, 2014, and $2.7 million in the period January 1, 2014 through June 29, 2014. This continued focus on innovation has driven many successful new product introductions, which we believe will enable continued growth.
Acquisitions
The Company uses acquisitions to increase revenues with existing customers and to expand revenues to both new markets and customers. The Company intends to only pursue an acquisition if it is accretive to EBITDA (earnings before interest, income taxes, depreciation and amortization) margins post-synergies, has a strategic focus that aligns with our core strategy and generates the appropriate estimated return on investment as part of our capital resource and allocation process.
Customers
The Company has an entrenched base of blue chip customers that are leaders in their respective markets. Our customer relationships often span decades in each business. Additionally, our customer base is diversified. In our finishing segment, no customers were at or above 10% of the revenue of such segment. In our seating segment, only three customers were at or above 10% of the revenues of such segment. In our acoustics and components segments, only two customers were at or above 10% of the revenues of such segments. Across all of Jason Industries, no customers were at or above 10% of 2016 , 2015 or 2014 revenues. In 2016, our five largest customers represent a combined 30% of 2016 revenues.
8
Suppliers and Raw Materials
Polyurethane foam, vinyl, plastics, steel, polyester fiber, bicomponent fiber and machined fiber are the primary raw materials that we use to manufacture our products. There are a limited number of domestic and foreign suppliers of these raw materials. The Company generally orders supplies on a purchase order basis. Although our contracts and long term arrangements with our customers generally do not expressly allow us to pass through increases in our raw materials, energy costs and other inputs to our customers, we endeavor to discuss price adjustments with our customers on a case by case basis where it makes business sense. For the year ended December 31, 2016, the spend with our top three material suppliers accounted for less than 10% of total material spend and our largest supplier accounts for approximately 3% of total spend. The Company makes an ongoing effort to reduce and contain raw material costs. We do not engage in raw material commodity hedging contracts. The Company attempts to reflect raw material price changes in the sale price of our products.
Seasonality
We experience seasonality of demand for our products in the seating business. Due to our experience in this market, we have adapted our business operations to manage this seasonality. The business also depends upon general economic conditions and other market factors beyond our control, and the Company serves customers in cyclical industries. See “Seasonality and Working Capital” in the accompanying “Management’s Discussion and Analysis of Financial Condition and Results of Operations” contained herein for further discussion.
Employees
As of December 31, 2016, the Company had approximately 4,400 employees and manufactured products in 34 locations around the world. Approximately 62% of the seating segment’s hourly employees and 42% of the components segment’s hourly employees are unionized. Contracts are negotiated on a local basis, significantly mitigating the risk of a company-wide or segment level work stoppage. Additionally, approximately 1,000 of the Company’s employees reside in Europe, where trade union membership is common. We believe we have a strong relationship with our employees, including those represented by labor unions.
Environmental Matters
The Company’s operations and facilities are subject to extensive federal, state, local and foreign laws and regulations related to pollution and the protection of the environment, health, safety and natural resources, including those governing, among other things, emissions to air, discharges to water, the use, generation, handling, storage, treatment and disposal of hazardous substances and wastes and other materials and the remediation of contaminated sites. The operation of manufacturing plants entails risks in these areas, and a failure by the Company to comply with applicable environmental laws and regulations, or to obtain and comply with the permits required for its operations, could result in civil or criminal fines, penalties, enforcement actions, third party claims for property damage and personal injury, requirements to clean up property or to pay for the capital or operating costs of cleanup, or regulatory or judicial orders enjoining or curtailing operations or requiring corrective measures, including the installation of pollution control equipment or remedial actions. Moreover, if applicable environmental, health and safety laws and regulations, or the interpretation or enforcement thereof, become more stringent in the future, the Company could incur capital or operating costs beyond those currently anticipated.
Compliance with environmental laws has not historically had a material adverse effect on the Company’s capital expenditures, earnings or competitive position, and we anticipate that such compliance will not have a material effect on its business or financial condition in the future.
Available Information
The Company’s Internet website address is www.jasoninc.com. The Company makes available free of charge (other than an investor’s own Internet access charges) through its Internet website its Annual Report on Form 10-K, Quarterly Reports on Form 10-Q, Current Reports on Form 8-K, and amendments to those reports, on the same day they are electronically filed with, or furnished to, the U.S. Securities and Exchange Commission (the “SEC”). The Company is not including the information contained on or available through its website as a part of, or incorporating such information by reference into, this Annual Report on Form 10-K.
9
Executive Officers of the Registrant
The following table sets forth information concerning our executive officers as of February 23, 2017:
Name | Age | Position | ||
Brian K. Kobylinski | 50 | President and Chief Executive Officer | ||
Sarah C. Lauber | 45 | Senior Vice President and Chief Financial Officer | ||
Thomas L. Doerr, Jr. | 41 | Vice President, General Counsel and Secretary | ||
John J. Hengel | 58 | Vice President—Finance, Treasurer and Assistant Secretary | ||
Srivas Prasad | 48 | Senior Vice President and General Manager—Acoustics | ||
Steven G. Carollo | 45 | Senior Vice President and General Manager—Components | ||
Brian K. Kobylinski has served as President and Chief Executive Officer since December 2016. Prior to being named Chief Executive Officer, Mr. Kobylinski served as President & Chief Operating Officer since April 8, 2016. Prior to joining Jason Industries, Mr. Kobylinski served as Executive Vice President, Energy Segment and China for Actuant Corporation (“Actuant”) based in Milwaukee, Wisconsin. During his 23 years with Actuant, Mr. Kobylinski progressed through a number of management roles, including Vice President - Industrial and Energy Segments, Vice President – Business Development and Global Business Leader – Hydratight. Mr. Kobylinski received his masters of business administration from the University of Wisconsin - Madison and his bachelors of art from St. Norbert College.
Sarah C. Lauber has served as Senior Vice President since January 2016 and as our Chief Financial Officer since April 20, 2015. Prior to joining Jason Industries, Mrs. Lauber served as Vice President, Financial Planning and Analysis at Regal-Beloit Corporation from 2011 until April 2015. Mrs. Lauber previously served as Chief Financial Officer of A.O. Smith Corporation’s Electrical Products Company (“EPC”), a $700 million global manufacturer of electric motors for residential and commercial applications, from 2002 until EPC was acquired by Regal-Beloit in 2011. Mrs. Lauber began her career as an accountant at KPMG, and is a certified public accountant and member of the AICPA. Mrs. Lauber earned a Bachelor of Science in administration, with an accounting concentration, from California State University, San Bernardino, and an Executive Master of Business Administration from Northwestern University, Kellogg School of Management.
Thomas L. Doerr, Jr. has served as Vice President since January 2016 and as our General Counsel and Secretary since November 9, 2015. Prior to joining Jason Industries, Mr. Doerr served as Associate General Counsel for The Manitowoc Company, Inc. where he was responsible for overseeing the legal matters for Manitowoc’s crane segment. Mr. Doerr joined Manitowoc in 2006 as legal counsel; in 2008 he expatriated to London, England, and in 2009 to Lyon, France where he was serving as Assistant General Counsel - International and responsible for all legal matters for both Manitowoc’s crane segment and Manitowoc’s foodservice segment in Europe, Middle East, Africa and Asia Pacific. After spending four years abroad, Mr. Doerr moved back to the United States and assumed global legal responsibility for Manitowoc’s crane segment. Prior to joining Manitowoc, Mr. Doerr was most recently with the law firm von Briesen & Roper, s.c. in the firm’s Milwaukee office. Mr. Doerr is a graduate of Marquette University Law School and the University of St. Thomas.
John J. Hengel has served as our Vice President—Finance, Treasurer and Assistant Secretary since June 30, 2014 and previously served as Vice President of Finance of Jason Incorporated since 1999. Prior to joining Jason Incorporated, Mr. Hengel was a director in the audit and business advisory services practice at PricewaterhouseCoopers LLP from 1992 to 1999. Mr. Hengel is a Certified Public Accountant and a member of both the American and Wisconsin Institutes of Certified Public Accountants. He holds a Bachelor of Science in accounting from Carroll University.
Srivas Prasad has served as our Senior Vice President and General Manager—Acoustics since December 2016. Prior to that, Mr. Prasad served as Senior Vice President and General Manager - Seating and Acoustics since January 2016 and as President of our Seating segment since June 30, 2014 (and previously served in the same position of Jason Incorporated since April 2014). Prior to serving as the President of the Seating segment, he served as Vice President—Business Development at Jason Incorporated from 2011 to 2014 and held key leadership positions in Jason Incorporated’s Acoustics segment from 2006 to 2010. Mr. Prasad holds a Bachelor’s degree in engineering from Bangalore University and a Masters in engineering from Lamar University.
Steven G. Carollo has served as our Senior Vice President and General Manager—Components since December 2016. Prior to that, Mr. Carollo served as the Senior Vice President and General Manager - Finishing and Components since January 2016 and as Vice President and General Manager of our Components segment since June 30, 2014 (and previously served in the same position of Jason Incorporated since July 2012). Prior to serving as the Vice President and General Manager of the Components segment, he served as Vice President and General Manager at Assembled Products from 2006 to 2013 and held key leadership positions in Jason Incorporated’s Acoustic and Components segments from 1994 to 2006. Mr. Carollo holds a Bachelor’s degree in Accounting from Central Michigan University and a Masters in Business Administration from the University of Notre Dame.
10
ITEM 1A. RISK FACTORS
An investment in our securities involves a high degree of risk. You should consider carefully all of the risks described below and all of the other information contained in this report before deciding to invest in our securities. If any of the events or developments described below occur, our business, financial condition and/or results of operations could be negatively affected. In that case, the trading price of our securities could decline, and you could lose all or part of your investment.
Risk Factors Relating to Our Business
We are affected by developments in the industries in which our customers operate.
We derive our revenues largely from customers in the following industry sectors: agricultural, automotive, motorcycles, construction and industrial manufacturing. Factors affecting any of these industries in general, or any of our customers in particular, could adversely affect us because our revenue growth largely depends on the continued growth of our customers’ businesses in their respective industries. These factors include:
• | seasonality of demand for our customers’ products which may cause our manufacturing capacity to be underutilized for periods of time; |
• | our customers’ failure to successfully market their products, to gain or retain widespread commercial acceptance of their products or to compete effectively in their industries; |
• | loss of market share for our customers’ products, which may lead our customers to reduce or discontinue purchasing our products and to reduce prices, thereby exerting pricing pressure on us; |
• | economic conditions in the markets in which our customers operate, in particular, the United States and Europe, including recessionary periods such as the 2008/2009 global economic downturn; and |
• | product design changes or manufacturing process changes that may reduce or eliminate demand for the components we supply. |
We expect that future sales will continue to depend on the success of our customers. If economic conditions and demand for our customers’ products deteriorate, we may experience a material adverse effect on our business, operating results and financial condition.
Some of our business segments are cyclical. A downturn or weakness in overall economic activity can have a material negative impact on us.
Historically, sales of products that we manufacture have been subject to cyclical variations caused by changes in general economic conditions. During recessionary periods, we have been adversely affected by reduced demand for our products. In addition, the strength of the economy generally may affect the rates of expansion, consolidation, renovation and equipment replacement in the industries we serve.
Volatility in the prices of raw materials and energy prices and our ability to pass along increased costs to our customers could adversely affect our results of operations.
The prices of raw materials critical to our business and performance, such as steel, are based on global supply and demand conditions. Certain raw materials used by us, including polyurethane foam, vinyl, plastics, steel, polyester fiber, bicomponent fiber and machined fiber are only available from a limited number of suppliers, and it may be difficult to find alternative suppliers at the same or similar costs. Although our contracts and long term arrangements with our customers generally do not expressly allow us to pass through increases in our raw materials, energy costs and other inputs to our customers, we endeavor to discuss price adjustments with our customers on a case by case basis where it makes business sense. While we strive to pass through the price of raw materials to our customers (other than increases in order amounts which are subject to negotiation), we may not be able to do so in the future, and volatility in the prices of raw materials may affect customer demand for certain products. In addition, we, along with our suppliers and customers, rely on various energy sources for a number of activities connected with our business, such as the transportation of raw materials and finished products. Energy and utility prices, including electricity and water prices, and in particular prices for petroleum-based energy sources, are volatile. Increased supplier and customer operating costs arising from volatility in the prices of energy sources, such as increased energy and utility costs and transportation costs, could be passed through to us and we may not be able to increase our product prices sufficiently or at all to offset such increased costs. The impact of any volatility in the prices of energy or the raw materials on which we rely, including the reduction in demand for certain products caused by such price volatility, could result in a loss of revenue and profitability and adversely affect our results of operations.
11
We compete with numerous other manufacturers in each of our segments and competition from these providers may affect the profitability of our business.
The industries we serve are highly competitive. We compete with numerous companies that manufacture finishing, seating, automotive acoustics and components products. Many of our competitors have international operations and significant financial resources and some have substantially greater manufacturing, research and design and marketing resources than us. These competitors may, among others:
• | respond more quickly to new or emerging technologies; |
• | have greater name recognition, critical mass or geographic market presence; |
• | be better able to take advantage of acquisition opportunities; |
• | adapt more quickly to changes in customer requirements; |
• | devote greater resources to the development, promotion and sale of their products; |
• | be better positioned to compete on price for their products, due to any combination of low-cost labor, raw materials, components, facilities or other operating items, or willingness to make sales at lower margins than us; |
• | consolidate with other competitors in the industry which may create increased pricing and competitive pressures on our business; and |
• | be better able to utilize excess capacity which may reduce the cost of their products or services. |
Competitors with lower cost structures may have a competitive advantage when bidding for business with our customers. We also expect our competitors to continue to improve the performance of their current products or services, to reduce prices of their existing products or services and to introduce new products or services that may offer greater performance and improved pricing. Additionally, we may face competition from new entrants to the industry in which we operate. Any of these developments could cause a decline in sales and average selling prices, loss of market share of our products or profit margin compression.
We face risks related to sales through distributors and other third parties.
We sell a portion of our products through third parties such as distributors, agents and channel partners (collectively referred to as distributors). Using third parties for distribution exposes us to many risks, including competitive pressure, concentration, credit risk, and compliance risks. Distributors may sell products that compete with our products, and we may need to provide financial and other incentives to focus distributors on the sale of our products. We may rely on one or more key distributors for a product, and the loss of these distributors could reduce our revenue. Distributors may face financial difficulties, including bankruptcy, which could harm our collection of accounts receivable and financial results. Violations of the Foreign Corrupt Practices Act or similar laws by distributors or other third-party intermediaries could have a material impact on our business. Failing to manage risks related to our use of distributors may reduce sales, increase expenses, and weaken our competitive position.
We may not be able to maintain our engineering, technological and manufacturing expertise.
The markets for our products are characterized by changing technology and evolving process development. The continued success of our business will depend upon our ability to:
• | hire, retain and expand our pool of qualified engineering and technical personnel; |
• | maintain technological leadership in our industry; |
• | successfully anticipate or respond to changes in manufacturing processes in a cost-effective and timely manner; and |
• | successfully anticipate or respond to changes in cost to serve in a cost-effective and timely manner. |
We cannot be certain that we will develop the capabilities required by our customers in the future. The emergence of new technologies, industry standards or customer requirements may render our equipment, inventory or processes obsolete or uncompetitive. We may have to acquire new technologies and equipment to remain competitive. The acquisition and implementation of new technologies and equipment may require us to incur significant expense and capital investment, which could reduce our margins and affect our operating results. When we establish or acquire new facilities, we may not be able to maintain or develop our engineering, technological and manufacturing expertise due to a lack of trained personnel, effective training of new staff or technical difficulties with machinery. Failure to anticipate and adapt to customers’ changing technological needs and requirements or to hire and retain a sufficient number of engineers and maintain engineering, technological and manufacturing expertise may have a material adverse effect on our business.
12
We may be unable to realize the expected benefits of capital expenditures, which could adversely affect our profitability and operations.
We expect to continue to invest in our business through capital expenditures to support our facilities and purchases of production equipment and acquisitions. There can be no assurance that these investments will generate any specific return on investment.
Our goodwill and other intangible assets represent a substantial amount of our total assets. A decline in future operating performance at one or more of our reporting units could result in the further impairment of goodwill or other intangible assets, which could have a material adverse effect on our financial condition and results of operations.
At December 31, 2016, goodwill and other intangible assets totaled $186.4 million, or approximately 32% of our total assets. The goodwill results from our acquisitions, representing the excess of cost over the fair value of the net tangible and other identifiable intangible assets we have acquired. We assess annually whether there has been impairment in the value of our goodwill. If future operating performance at one or more of our reporting units were to fall below current or planned levels, we could be required to recognize a non-cash charge to operating earnings for goodwill (at our finishing reporting unit) or record an impairment charge related to other intangible assets. In the fourth quarter of 2016, the Company recorded charges of $63.3 million for the impairment of goodwill. Given the continued significance of the Company’s goodwill and intangible assets, any additional significant goodwill or intangible asset impairment could reduce earnings in such period and have a material adverse effect on our financial condition and results of operations.
Divestitures and discontinued operations could negatively impact our business, and contingent liabilities from businesses that we sell could adversely affect our financial results.
As part of our portfolio management process, we review our operations for businesses which may no longer be aligned with our strategic initiatives and long-term objectives. Divestitures pose risks and challenges that could negatively impact our business. For example, when we decide to sell a business, we may be unable to do so on satisfactory terms and within our anticipated time-frame, and even after reaching a definitive agreement to sell a business, the sale may be subject to satisfaction of pre-closing conditions, which may not be satisfied, as well as regulatory and governmental approvals, which may prevent us from completing a transaction on acceptable terms. In addition, the impact of the divestiture on our revenue and net earnings may be larger than projected, which could distract management, and disputes may arise with buyers. Dispositions may also involve continued financial involvement, as we may be required to retain responsibility for, or agree to indemnify buyers against contingent liabilities related to businesses sold, such as lawsuits, tax liabilities, product liability claims or environmental matters. Under these types of arrangements, performance by the divested businesses or other conditions outside our control could affect our future financial results.
If we fail to develop new and innovative products or if customers in our markets do not accept them, our results could be negatively affected.
Our products must be kept current to meet our customers’ needs. To remain competitive, we therefore must develop new and innovative products on an ongoing basis. If we fail to make innovations or the market does not accept our new products, our sales and results would likely suffer. We invest significantly in the research and development of new products. These expenditures do not always result in products that will be accepted by the market. To the extent they do not, whether as a function of the product or the business cycle, we will have increased expenses without significant sales to benefit us. Failure to develop successful new products may also cause potential customers to purchase competitors’ products, rather than invest in products manufactured by us.
The potential impact of failing to deliver products on time could increase the cost of the products.
In most instances, we guarantee that we will deliver a product by a scheduled date. If we subsequently fail to deliver the product as scheduled, we may be held responsible for cost impacts and/or other damages resulting from any delay. To the extent that these failures to deliver may occur, the total damages for which we could be liable could significantly increase the cost of the products; as such, we could experience reduced profits or, in some cases, a loss for that contract. Additionally, failure to deliver products on time could result in damage to customer relationships, the potential loss of customers, and reputational damage which could impair our ability to attract new customers.
Increasing costs of doing business in many countries in which we operate may adversely affect our business and financial results.
Increasing costs such as labor and overhead costs in the countries in which we operate may erode our profit margins and compromise our price competitiveness. Historically, the low cost of labor in certain of the countries in which we operate has been a competitive advantage but labor costs in these countries, such as China, have been increasing. Our profitability also depends on our ability to manage and contain our other operating expenses such as the cost of utilities, factory supplies, factory space costs, equipment rental, repairs and maintenance and freight and packaging expenses. In the event we are unable to
13
manage any increase in our labor and other operating expenses in an environment where revenue does not increase proportionately, our financial results would be adversely affected.
Our international scope will require us to obtain financing in various jurisdictions.
We operate manufacturing facilities in the United States and 14 foreign countries, which creates financing challenges for us. These challenges include navigating local legal and regulatory requirements associated with obtaining debt or equity financing in the respective foreign jurisdictions in which we operate. In the event that we are not able to obtain financing on satisfactory terms in any of these jurisdictions, it could significantly impair our ability to run our foreign operations on a cost effective basis or to grow such operations. Failure to manage such challenges may adversely affect our business and results of operations.
We have operations in many countries and such operations may be subject to a number of risks specific to these countries.
Our international operations across many different jurisdictions may be subject to a number of risks specific to these countries, including:
• | less flexible employee relationships which can be difficult and expensive to terminate; |
• | labor unrest; |
• | political and economic instability (including war and acts of terrorism); |
• | inadequate infrastructure for our operations (i.e., lack of adequate power, water, transportation and raw materials); |
• | health concerns and related government actions; |
• | risk of governmental expropriation of our property; |
• | less favorable, or relatively undefined, intellectual property laws; |
• | unexpected changes in regulatory requirements and laws; |
• | longer customer payment cycles and difficulty in collecting trade accounts receivable; |
• | export duties, tariffs, import controls and trade barriers (including quotas); |
• | adverse trade policies or adverse changes to any of the policies of either the United States or any of the foreign jurisdictions in which we operate; |
• | adverse changes in tax rates or regulations; |
• | legal or political constraints on our ability to maintain or increase prices; |
• | burdens of complying with a wide variety of labor practices and foreign laws, including those relating to export and import duties, environmental policies and privacy issues; |
• | inability to utilize net operating losses incurred by our foreign operations against future income in the same jurisdiction; |
• | economies that are emerging or developing, that may be subject to greater currency volatility, negative growth, high inflation, limited availability of foreign exchange and other risks; and |
• | ability to repatriate cash on a tax effective basis. |
These factors may harm our results of operations, and any measures that we may implement to reduce the effect of volatile currencies and other risks of our international operations may not be effective. In our experience, entry into new international markets requires considerable management time as well as start-up expenses for market development, hiring and establishing office facilities before any significant revenue is generated. As a result, initial operations in a new market may operate at low margins or may be unprofitable.
Our international sales and operations are subject to applicable laws relating to trade, export controls and foreign corrupt practices, the violation of which could adversely affect our operations.
We are subject to applicable international trade, customs, export controls and economic sanctions laws and regulations of the United States and other countries and the Foreign Corrupt Practices Act and other anti-bribery laws that generally bar bribes or unreasonable gifts to foreign governments or officials. Changes in such laws may restrict our business practices, including cessation of business activities in sanctioned countries or with sanctioned entities, and may result in modifications to compliance programs. Violation of these laws or regulations could result in sanctions or fines and could have a material adverse effect on our financial condition, results of operations and cash flows.
14
We are subject to risks of currency fluctuations and related hedging operations, and the devaluation of the currencies of countries in which we conduct our manufacturing operations, particularly the Euro, that may negatively affect the profitability of our business.
We report our financial results in U.S. dollars. Approximately 30% of our net sales in 2016 were in currencies other than the U.S. dollar. Changes in exchange rates among other currencies, especially the Euro to the U.S. dollar, may negatively affect our net sales, cost of sales, gross profit and net income where our expenses and revenues are denominated in different currencies. We cannot predict the effect of future exchange rate fluctuations. We may from time to time use financial instruments, primarily short-term forward contracts, to hedge Euro and other currency commitments arising from foreign currency obligations. Where possible, we endeavor to match our non-functional currency exchange requirements to our receipts. If our hedging activities are not successful or if we change or reduce these hedging activities in the future, we may experience significant unexpected expenses from fluctuations in exchange rates.
We depend on our key executive officers, managers and skilled personnel and may have difficulty retaining and recruiting qualified employees.
Our success depends to a large extent upon the continued services of our executive officers, senior management personnel, managers and other skilled personnel and our ability to recruit and retain skilled personnel to maintain and expand our operations. We could be affected by the loss of any of our executive officers who are responsible for formulating and implementing our business plan and strategy. In addition, we need to recruit and retain additional management personnel and other skilled employees. However, competition is high for skilled technical personnel among companies that rely on engineering and technology, and the loss of qualified employees or an inability to attract, retain and motivate additional skilled employees required for the operation and expansion of our business could hinder our ability to conduct design, engineering and manufacturing activities successfully and develop marketable products. We may not be able to attract the skilled personnel we require or retain those whom we have trained at our own cost. If we are not able to do so, our business and our ability to continue to grow could be negatively affected and we could face additional competition from those who leave and work for our competitors.
Many of our customers do not commit to long-term production schedules, which makes it difficult for us to schedule production accurately and achieve maximum efficiency of our manufacturing capacity.
Generally, our customers do not commit to long-term contracts. Many of our customers do not commit to firm production schedules and we continue to experience reduced lead-times in customer orders. Additionally, customers may change production quantities or delay production with little lead-time or advance notice. Therefore, we rely on and plan our production and inventory levels based on our customers’ advance orders, commitments or forecasts, as well as our internal assessments and forecasts of customer demand. The volume and timing of sales to our customers may vary due to, among other factors:
• | variation in demand for or discontinuation of our customers’ products; |
• | our customers’ attempts to manage their inventory; |
• | design changes; |
• | changes in our customers’ manufacturing strategies; and |
• | acquisitions of or consolidation among customers. |
The variations in volume and timing of sales make it difficult to schedule production and optimize manufacturing capacity. This uncertainty may require us to increase staffing and incur other expenses in order to meet an unexpected increase in customer demand, potentially placing a significant burden on our resources. Additionally, an inability to respond to such increases may cause customer dissatisfaction, which may negatively affect our customers’ relationships.
Further, in order to secure sufficient production scale, we may make capital investments in advance of anticipated customer demand. Such investments may lead to low utilization levels if customer demand forecasts change and we are unable to utilize the additional capacity. Because fixed costs make up a large proportion of our total production costs, a reduction in customer demand can have a significant adverse impact on our gross profits and operating results. Additionally, we order materials and components based on customer forecasts and orders and suppliers may require us to purchase materials and components in minimum quantities that exceed customer requirements, which may have an adverse impact on our gross profits and operating results. In the past, anticipated orders from some of our customers have failed to materialize and delivery schedules have been deferred as a result of changes in our customers’ business needs. We have also allowed long-term customers to delay orders to absorb excess inventory. Such order fluctuations and deferrals may have an adverse effect on our business, operating results and/or financial conditions.
15
We may incur additional expenses and delays due to technical problems or other interruptions at our manufacturing facilities.
Disruptions in operations due to technical problems or other interruptions such as floods or fire would adversely affect the manufacturing capacity of our facilities. Such interruptions could cause delays in production and cause us to incur additional expenses such as charges for expedited deliveries for products that are delayed. Additionally, our customers have the ability to cancel purchase orders in the event of any delays in production and may decrease future orders if delays are persistent. Additionally, to the extent that such disruptions do not result from damage to our physical property, these may not be covered by our business interruption insurance. Any such disruptions may adversely affect our business, operations, and financial results.
We may be unable to realize the expected benefits of our restructuring actions, which could adversely affect our profitability and operations.
In order to align our resources with our growth strategies, operate more efficiently and control costs, we have periodically announced restructuring plans, which include workforce reductions, plant closures and consolidations, asset impairments and other cost reduction initiatives. On March 1, 2016, as part of a strategic review of organizational structure and operations, the Company announced a global cost reduction and restructuring program. This program includes entering into severance and termination agreements with employees and footprint rationalization activities, including exit and relocation costs for the consolidation and closure of plant facilities and lease termination costs. These activities were ongoing during 2016 and are expected to be completed in 2017. We may undertake additional restructuring actions and workforce reductions in the future. As these plans and actions are complex, unforeseen factors could result in expected savings and benefits to be delayed or not realized to the full extent planned, and our operations and business may be disrupted.
The operations of our manufacturing facilities may be disrupted by union activities and other labor-related problems.
We have labor unions at certain of our facilities. As of December 31, 2016, we had approximately 500 unionized personnel in the United States. For such employees, we have entered into collective bargaining agreements with the respective labor unions. In the future, such agreements may limit our ability to contain increases in our labor costs as our ability to control future labor costs depends partly on the outcome of wage negotiations with our employees. Any future collective bargaining agreements may lead to further increases in our labor costs. Although our employees in certain other facilities are currently not unionized, there can be no assurance that they will continue to remain as such.
Union activities and other labor-related problems not linked to union activities may disrupt our operations and adversely affect our business and results of operations. We cannot provide any assurance that we will not be affected by any such labor unrest, or increase in labor cost, or interruptions to the operations of our existing manufacturing plants or new manufacturing plants that we may set up in the future. Any disruptions to our manufacturing facilities as a result of labor-related disturbances could affect our ability to meet delivery and efficiency targets resulting in an adverse effect on our customer relationships and our financial results. Such disruptions may not be covered by our business interruption insurance.
Any disruption in our information systems could disrupt our operations and would be adverse to our business and financial operations.
We depend on various information systems to support our customers’ requirements and to successfully manage our business, including managing orders, supplies, accounting controls and payroll. Any inability to successfully manage the procurement, development, implementation or execution of our information systems and back-up systems, including matters related to system security, reliability, performance and access, as well as any inability of these systems to fulfill their intended purpose within our business, could have an adverse effect on our business and financial performance. Such disruptions may not be covered by our business interruption insurance.
Security breaches and other disruptions could compromise our information and expose us to liability, which would cause our business and reputation to suffer.
In the ordinary course of business, we collect and store sensitive data, including our proprietary business information and that of our customers, suppliers and business partners, as well as personally identifiable information of our customers and employees, in our data centers and on our networks. The secure processing, maintenance and transmission of this information is critical to our operations and business strategy. Despite our security measures, our information technology, infrastructure and business processes may be vulnerable to malicious attacks or breached due to employee error, malfeasance or other disruptions, including as a result of rollouts of new systems. Any such breach could compromise our networks and the information stored there could be accessed, publicly disclosed, lost or stolen. Any such access, disclosure or other loss of information could result in legal claims or proceedings and/or regulatory penalties, disruption of our operations, damage of our reputation, financial loss through unauthorized payments and/or cause a loss of confidence in our products and services, which could adversely affect our business.
16
Natural disasters, epidemics and other events outside our control, and the ineffective management of such events, may harm our business.
Some of our facilities are located in areas that may be affected by natural disasters such as hurricanes, earthquakes, water shortages, tsunamis and floods. All facilities are subject to other natural or man-made disasters such as fires, acts of terrorism, failures of utilities and epidemics. If such an event were to occur, our business could be harmed due to the event or our inability to effectively manage the effects of the particular event. Potential harms include the loss of business continuity, the loss of business data and damage to infrastructure.
Our production could be severely affected if our employees or the regions in which our facilities are located are affected by a significant outbreak of any disease or epidemic. For example, a facility could be closed by government authorities for a sustained period of time, some or all of our workforce could be unavailable due to quarantine, fear of catching the disease or other factors, and local, national or international transportation or other infrastructure could be affected, leading to delays or loss of production. In addition, our suppliers and customers are subject to similar risks, which could lead to a shortage of components or a reduction in our customers’ demand for our services.
We rely on a variety of common carriers to transport our materials from our suppliers, and to transport products from us to our customers. Problems suffered by any of these common carriers, whether due to a natural disaster, labor problem, act of terrorism, increased energy prices or some other issue, could result in shipping delays, increased costs or some other supply chain disruption and could therefore have a material adverse effect on our operations.
In addition, some of our facilities possess certifications, machinery, equipment or tooling necessary to work on specialized products that our other locations lack. If work is disrupted at one of these facilities, it may not be practicable or feasible to transfer such specialized work to another facility without significant costs and delays. Thus, any disruption in operations at a facility possessing specialized certifications, machinery, equipment or tooling could adversely affect our ability to provide products to our customers and thus negatively affect our relationships and financial results.
Political and economic developments could adversely affect our business.
Increased international political instability and social unrest, evidenced by the threat or occurrence of terrorist attacks, enhanced national security measures and the related decline in consumer confidence may hinder our ability to do business. Any escalation in these events or similar future events may disrupt our operations or those of our customers and suppliers and could affect the availability of raw materials and components needed to manufacture our products or the means to transport those materials to manufacturing facilities and finished products to customers. These events have had and may continue to have an adverse effect, generally, on the world economy and consumer confidence and spending, which could adversely affect our revenue and operating results. The effect of these events on the volatility of the world financial markets could in future lead to volatility of the market price of our securities and may limit the capital resources available to us, our customers and suppliers.
Sales of our products may result in exposure to product liability, intellectual property infringement and other claims.
Our manufactured products can expose us to potential liabilities. For instance, our manufacturing businesses expose us to potential product liability claims resulting from injuries caused by defects in products we design or manufacture, as well as potential claims that products we design or processes we use infringe on third-party intellectual property rights. Such claims could subject us to significant liability for damages, subject the infringing portion of our business to injunction and, regardless of their merits, could be time-consuming and expensive to resolve. We may also have greater potential exposure from warranty claims and product recalls due to problems caused by product design. Although we have product liability insurance coverage, it may not be sufficient to cover the full extent of our product liability, if at all, and may also be subject to the satisfaction of a deductible. A successful product liability claim in excess or outside of our insurance coverage or any material claim for which insurance coverage was denied or limited and for which indemnification was not available could have a material adverse effect on our business, results of operations and/or financial condition.
If our manufacturing processes and products do not comply with applicable statutory and regulatory requirements, or if we manufacture products containing design or manufacturing defects, demand for our products may decline and we may be subject to liability claims.
Our designs, manufacturing processes and facilities need to comply with applicable statutory and regulatory requirements. We may also have the responsibility to ensure that products we design satisfy safety and regulatory standards including those applicable to our customers and to obtain any necessary certifications. In addition, our customers’ products and the manufacturing processes that we use to produce them are often highly complex. As a result, products that we manufacture may at times contain manufacturing or design defects, and our manufacturing processes may be subject to errors or not be in compliance with applicable statutory and regulatory requirements or demands of our customers. Defects in the products we manufacture or design, whether caused by a design, manufacturing or component failure or error, or deficiencies in our manufacturing processes, may result in delayed shipments to customers, replacement costs or reduced or canceled customer orders. If these defects or deficiencies are significant, our business reputation may also be damaged. The failure of the products
17
that we manufacture or our manufacturing processes and facilities to comply with applicable statutory and regulatory requirements may subject us to legal fines or penalties and, in some cases, require us to shut down or incur considerable expense to correct a manufacturing process or facility. In addition, these defects may result in liability claims against us or expose us to liability to pay for the recall of a product or to indemnify our customers for the costs of any such claims or recalls which they face as a result of using items manufactured by us in their products. Even if our customers are responsible for the defects, they may not assume, or may not have resources to assume, responsibility for any costs or liabilities arising from these defects, which could expose us to additional liability claims.
Compliance or the failure to comply with regulations and governmental policies could cause us to incur significant expense.
We are subject to a variety of local and foreign laws and regulations including those relating to labor and health and safety concerns and import/export duties and customs. Such laws may require us to pay mandated compensation in the event of workplace accidents and penalties in the event of incorrect payments of duties or customs. Additionally, we may need to obtain and maintain licenses and permits to conduct business in various jurisdictions. If we or the businesses or companies we acquire have failed or fail in the future to comply with such laws and regulations, then we could incur liabilities and fines and our operations could be suspended. Such laws and regulations could also restrict our ability to modify or expand our facilities, could require us to acquire costly equipment, or could impose other significant expenditures.
If our products are subject to warranty claims, our business reputation may be damaged and we may incur significant costs.
We generally provide warranties to our customers for defects in materials and workmanship and where our products do not conform to specifications. A successful claim for damages arising as a result of such defects or deficiencies may affect our business reputation. In addition, a successful claim for which we are not insured, where the damages exceed insurance coverage, where we cannot recover from our vendors to the extent their materials or workmanship were defective, or any material claim for which insurance coverage is denied or limited and for which indemnification is not available, could have a material adverse effect on our business, operating results and financial condition. In addition, as we pursue new end-markets, warranty requirements will vary and we may be less effective in pricing our products to appropriately capture the warranty costs.
We are or may be required to obtain and maintain quality or product certifications for certain markets.
In some countries, our customers require or prefer that we obtain certain certifications for our products and testing facilities with regard to specifications/quality standards. For example, we are required to obtain American Railroad Association approval for certain of our products. Consequently, we need to obtain and maintain the relevant certifications so that our customers are able to sell their products, which are manufactured by us, in these countries. If we are unable to meet and maintain the requirements needed to secure or renew such certifications, we may not be able to sell our products to certain customers and our financial results may be adversely affected.
Our income tax returns are subject to current tax legislation and review by taxing authorities, and the final determination of our tax liability with respect to changes in tax legislation, tax audits and any related litigation could adversely affect our financial results.
Although we believe that our tax estimates are reasonable and that we prepare our tax filings in accordance with all applicable current tax laws, the final determination with respect to any tax audits and changes in tax legislation, and any related litigation, could be materially different from our estimates or from our historical income tax provisions and accruals. The results of an audit, tax reform or litigation could have a material effect on operating results and/or cash flows in the periods for which that determination is made. In addition, future period earnings may be adversely impacted by litigation costs, settlements, penalties, and/or interest assessments. We are undergoing tax audits in various jurisdictions and we regularly assess the likelihood of an adverse outcome resulting from such examinations to determine the adequacy of our tax reserves.
Failure of our customers to pay the amounts owed to us in a timely manner may adversely affect our financial condition and operating results.
We generally provide payment terms ranging from 30 to 50 days. As a result, we generate significant accounts receivable from sales to our customers, representing 37.0% and 34.9% of current assets as of December 31, 2016 and December 31, 2015, respectively. Accounts receivable from sales to customers were $77.8 million and $79.1 million as of December 31, 2016 and December 31, 2015, respectively. As of December 31, 2016, the largest amount owed by a single customer was approximately 12% of total accounts receivable, and we had two such customers owing that percentage. As of December 31, 2016, our allowance for doubtful accounts was approximately $3.4 million. If any of our significant customers have insufficient liquidity, we could encounter significant delays or defaults in payments owed to us by such customers, and we may need to extend our payment terms or restructure the receivables owed to us, which could have a significant adverse effect on our financial condition. Any deterioration in the financial condition of our customers will increase the risk of uncollectible receivables. Global economic uncertainty could also affect our customers’ ability to pay our receivables in a timely manner or
18
at all or result in customers going into bankruptcy or reorganization proceedings, which could also affect our ability to collect our receivables.
Regulations related to conflict minerals may force us to incur additional expenses and affect the manufacturing and sale of our products.
The Dodd-Frank Wall Street Reform and Consumer Protection Act (the “Dodd-Frank Act”), signed into law on July 21, 2010, includes Section 1502, pursuant to which the SEC adopted additional disclosure requirements related to certain minerals sourced from the Democratic Republic of Congo and surrounding countries, or “conflict minerals,” for which such conflict minerals are necessary to the functionality of a product manufactured, or contracted to be manufactured, by an SEC reporting company. The metals covered by the final rules are commonly referred to as “3TG” and include tin, tantalum, tungsten and gold. Implementation of the new disclosure requirements could affect the sourcing and availability of some of the minerals used in the manufacture of our products. Our supply chain is complex, and if we are not able to conclusively verify the origins for all conflict minerals used in our products or that our products are “conflict free,” we may face reputational challenges with our customers or investors. Furthermore, we may also encounter challenges to satisfy customers who require that our products be certified as “conflict free,” which could place us at a competitive disadvantage if we are unable to do so. Additionally, as there may be only a limited number of suppliers offering “conflict free” metals, we cannot be sure that we will be able to obtain necessary metals from such suppliers in sufficient quantities or at competitive prices. We could incur significant costs related to the compliance process, including potential difficulty or added costs in satisfying the disclosure requirements. Our first report thereon is expected to be required in 2017.
Our failure to comply with environmental laws could adversely affect our business and financial condition.
We are subject to various federal, state, local and foreign environmental laws and regulations, including regulations governing the use, storage, discharge and disposal of hazardous substances used in our manufacturing processes.
We are also subject to laws and regulations governing the recyclability of products, the materials that may be included in products, and our obligations to dispose of these products after end-users have finished with them. Additionally, we may be exposed to liability to our customers relating to the materials that may be included in the components that we procure for our customers’ products. Any violation or alleged violation by us of environmental laws could subject us to significant costs, fines or other penalties.
We are also required to comply with an increasing number of product environmental compliance regulations focused on the restriction of certain hazardous substances. Non-compliance could result in significant costs and penalties.
In addition, increasing governmental focus on climate change may result in new environmental regulations that may negatively affect us, our suppliers and our customers by requiring us to incur additional direct costs to comply with new environmental regulations, as well as additional indirect costs as a result of our customers or suppliers passing on additional compliance costs. These costs may adversely affect our operations and financial condition.
Environmental liabilities that may arise in the future could be material to us.
Our operations, facilities and properties are subject to extensive and evolving laws and regulations pertaining to air emissions, wastewater discharges, the handling and disposal of solid and hazardous materials and wastes, the remediation of contamination, and otherwise relating to health, safety and the protection of the environment. As a result, we are involved from time to time in administrative or legal proceedings relating to environmental and health and safety matters, and have in the past and will continue to incur capital costs and other expenditures relating to such matters. We also cannot be certain that identification of presently unidentified environmental conditions, more vigorous enforcement by regulatory authorities or other unanticipated events will not arise in the future and give rise to additional environmental liabilities, compliance costs and/or penalties that could be material. Further, environmental laws and regulations are constantly evolving and it is impossible to predict accurately the effect they may have upon our financial condition, results of operations or cash flows.
Changes in laws or regulations, or a failure to comply with any laws and regulations, may adversely affect our business, investments and results of operations.
We are subject to laws and regulations enacted by national, regional and local governments, including non-U.S. governments. In particular, we are required to comply with certain SEC and other legal requirements. Compliance with, and monitoring of, applicable laws and regulations may be difficult, time consuming and costly. Those laws and regulations and their interpretation and application may also change from time to time and those changes could have a material adverse effect on our business, investments and results of operations. In addition, a failure to comply with applicable laws or regulations, as interpreted and applied, could have a material adverse effect on our business and results of operations.
19
Pursuant to the Jumpstart Our Business Startups Act of 2012 (the “JOBS Act”), our independent registered public accounting firm will not be required to attest to the effectiveness of our internal control over financial reporting pursuant to Section 404 of the Sarbanes-Oxley Act for so long as we are an “emerging growth company.”
Section 404 of the Sarbanes-Oxley Act requires annual management assessments of the effectiveness of our internal control over financial reporting, and generally requires in the same report a report by our independent registered public accounting firm on the effectiveness of our internal control over financial reporting. We are required to provide management’s attestation on internal controls, however, under the JOBS Act, our independent registered public accounting firm will not be required to attest to the effectiveness of our internal control over financial reporting pursuant to Section 404 of the Sarbanes-Oxley Act until we are no longer an “emerging growth company”. We will be an “emerging growth company” until the earlier of (1) the last day of the fiscal year (a) following August 14, 2018, the fifth anniversary of our initial public offering, (b) in which we have total annual gross revenue of at least $1.0 billion or (c) in which we are deemed to be a large accelerated filer, which means the market value of our common stock that is held by non-affiliates exceeds $700 million as of the last business day of our prior second fiscal quarter, and (2) the date on which we have issued more than $1.0 billion in non-convertible debt during the prior three-year period.
We may encounter difficulties in completing or integrating acquisitions, which could adversely affect our operating results.
We expect to expand our presence in new end markets, expand our capabilities and acquire new customers, some of which may occur through acquisitions. These transactions may involve acquisitions of entire companies, portions of companies, the entry into joint ventures and acquisitions of businesses or selected assets. Potential challenges related to our acquisitions and joint ventures include:
• | paying an excessive price for acquisitions and incurring higher than expected acquisition costs; |
• | difficulty in integrating acquired operations, systems, assets and businesses; |
• | difficulty in implementing financial and management controls, reporting systems and procedures; |
• | difficulty in maintaining customer, supplier, employee or other favorable business relationships of acquired operations and restructuring or terminating unfavorable relationships; |
• | ensuring sufficient due diligence prior to an acquisition and addressing unforeseen liabilities of acquired businesses; |
• | making acquisitions in new end markets, geographies or technologies where our knowledge or experience is limited; |
• | failing to realize the benefits from goodwill and intangible assets resulting from acquisitions which may result in write-downs; |
• | failing to achieve anticipated business volumes; and |
• | making acquisitions which force us to divest other businesses. |
Any of these factors could prevent us from realizing the anticipated benefits of an acquisition, including additional revenue, operational synergies and economies of scale. Our failure to realize the anticipated benefits of acquisitions could adversely affect our business and operating results.
Acquisitions, expansions or infrastructure investments may require us to increase our level of indebtedness or issue additional equity.
Should we desire to undertake significant additional expansion activities, make substantial investments in our infrastructure or consummate significant additional acquisition opportunities, our capital needs would increase and we may need to increase available borrowings under our credit facilities or access public or private debt and equity markets. There can be no assurance, however, that we will be successful in raising additional debt or equity on terms that we would consider acceptable.
An increase in the level of indebtedness could, among other things:
• | make it difficult for us to obtain financing in the future for working capital, capital expenditures, debt service requirements, acquisitions or other purposes; |
• | limit our flexibility in planning for or reacting to changes in our business; |
• | affect our ability to pay dividends; |
• | make us more vulnerable in the event of a downturn in our business; and |
20
• | affect certain financial covenants with which we must comply in connection with our credit facilities. |
Additionally, a further equity issuance could dilute the ownership interest of existing stockholders.
Risk Factors Relating to Our Indebtedness
We have a substantial amount of indebtedness, which may limit our operating flexibility and could adversely affect our results of operations and financial condition.
We have approximately $437.6 million of indebtedness as of December 31, 2016, consisting of $413.0 million in term loans, $23.3 million in borrowings under existing non-U.S. debt agreements, and $1.3 million of capital leases.
Our indebtedness could have important consequences to our investors, including, but not limited to:
• | increasing our vulnerability to, and reducing our flexibility to respond to, general adverse economic and industry conditions; |
• | requiring the dedication of a substantial portion of our cash flow from operations to the payment of principal of, and interest on, our indebtedness, thereby reducing the availability of such cash flow to fund working capital, capital expenditures, acquisitions, joint ventures or other general corporate purposes; |
• | limiting our flexibility in planning for, or reacting to, changes in our business, the competitive environment and the industry in which we operate; |
• | placing us at a competitive disadvantage as compared to our competitors that are not as highly leveraged; and |
• | limiting our ability to borrow additional funds and increasing the cost of any such borrowing. |
A breach of a covenant or restriction contained in our U.S. credit facility (the “Senior Secured Credit Facilities”) could result in a default that could in turn permit the affected lenders to accelerate the repayment of principal and accrued interest on our outstanding loans and terminate their commitments to lend additional funds. If the lenders under such indebtedness accelerate the repayment of our borrowings, we cannot assure you that we will have sufficient assets to repay those borrowings as well as other indebtedness.
To the extent that our access to credit is restricted because of our own performance or conditions in the capital markets generally, our financial condition would be materially adversely affected. Our level of indebtedness may make it difficult to service our debt and may adversely affect our ability to obtain additional financing, use operating cash flow in other areas of our business or otherwise adversely affect our operations.
Our Senior Secured Credit Facilities contain restrictive covenants that may impair our ability to conduct business.
The Senior Secured Credit Facilities contain a number of customary affirmative and negative covenants that, among other things, limit or restrict the ability of Jason Incorporated and its Restricted Subsidiaries (as defined in the Senior Secured Credit Facilities) to: incur additional indebtedness (including guaranty obligations); incur liens; engage in mergers, consolidations, liquidations and dissolutions; sell assets; pay dividends and make other payments in respect of capital stock; make acquisitions, investments, loans and advances; pay and modify the terms of certain indebtedness; engage in certain transactions with affiliates; enter into negative pledge clauses and clauses restricting subsidiary distributions; and change its line of business, in each case, subject to certain limited exceptions. In addition, under the revolving loan portion of our Senior Secured Credit Facilities, if the aggregate outstanding amount of all revolving loans, swingline loans and certain letter of credit obligations exceeds 25% of the revolving credit commitments at the end of any fiscal quarter, Jason Incorporated and its Restricted Subsidiaries will be required to not exceed a specified consolidated first lien leverage ratio. As a result of these covenants and restrictions, we are limited in how we conduct our business and we may be unable to raise additional debt or other financing to compete effectively or to take advantage of new business opportunities. The terms of any future indebtedness we may incur could include more restrictive covenants. Failure to comply with such restrictive covenants may lead to default and acceleration under our Senior Secured Credit Facilities and may impair our ability to conduct business. We may not be able to maintain compliance with these covenants in the future and, if we fail to do so, we may not be able to obtain waivers from the lenders and/or amend the covenants, which may adversely affect our financial condition.
Upon the occurrence of an event of default under our Senior Secured Credit Facilities, the lenders could elect to accelerate payments due and terminate all commitments to extend further credit. Consequently, we may not have sufficient assets to repay the Senior Secured Credit Facilities, as well as other secured and unsecured indebtedness.
Upon the occurrence of an event of default under our Senior Secured Credit Facilities, the lenders thereunder could elect to declare all amounts outstanding under the Senior Secured Credit Facilities to be immediately due and payable and terminate all commitments to extend further credit. If we were unable to repay those amounts, the lenders under the Senior Secured Credit Facilities could proceed against the collateral granted to them to secure that indebtedness. The Company has pledged a significant portion of our assets as collateral under the Senior Secured Credit Facilities. If the lenders under our
21
Senior Secured Credit Facilities accelerate the repayment of borrowings, we cannot assure you that we will have sufficient assets to repay the Senior Secured Credit Facilities, as well as other secured and unsecured indebtedness.
An adverse change in the interest rates for our borrowings could adversely affect our financial condition.
We pay interest on outstanding borrowings under our Senior Secured Credit Facilities at interest rates that fluctuate based upon changes in certain short term prevailing interest rates. An adverse change in these rates could have a material adverse effect on our financial position, results of operations and cash flows and our ability to borrow money in the future. At times, we will enter into interest rate swaps to hedge some of this risk. If the duration of interest rate swaps exceeds one month, we will have to mark-to-market the value of such swaps which could cause us to recognize losses.
Risk Factors Relating to Our Securities and Capital Structure
General Securities and Capital Structure Risk Factors
The market price of our securities may decline.
Fluctuations in the price of our securities could contribute to the loss of all or part of your investment. Prior to the announcement of the Business Combination, trading in our common stock and warrants had been limited. There is also currently no market for our Series A Preferred Stock and it is unclear whether one will develop. If an active market for our securities develops and continues, the trading price of our securities could be volatile and subject to wide fluctuations in response to various factors, some of which are beyond our control. Any of the factors listed below could have a material adverse effect on your investment and our securities may trade at prices significantly below the price you paid for them. In such circumstances, the trading price of our securities may not recover and may experience a further decline.
Factors affecting the trading price of our securities may include:
• | actual or anticipated fluctuations in our financial results or the financial results of companies perceived to be similar to us; |
• | changes in the market’s expectations about our operating results; |
• | success of competitors; |
• | our operating results failing to meet the expectation of securities analysts or investors in a particular period; |
• | changes in financial estimates and recommendations by securities analysts concerning the Company or its markets in general; |
• | operating and stock price performance of other companies that investors deem comparable to the Company; |
• | our ability to market new and enhanced products on a timely basis; |
• | changes in laws and regulations affecting our business; |
• | commencement of, or involvement in, litigation involving the Company; |
• | changes in the Company’s capital structure, such as future issuances of securities or the incurrence of additional debt; |
• | the volume of securities available for public sale; |
• | any major change in our board or management; |
• | sales of substantial amounts of our securities by our directors, executive officers or significant shareholders or the perception that such sales could occur; and |
• | general economic and political conditions such as recession; interest rate, fuel price, and international currency fluctuations; and acts of war or terrorism. |
As of December 31, 2016, there were 24,802,196 shares of our common stock issued and outstanding. While our common shares trade on Nasdaq, our stock is thinly traded (approximately 0.2%, or 42,810 shares, of our stock traded on an average daily basis during the year ended December 31, 2016), and you may have difficulty in selling your shares quickly.
In addition, the market price of our common stock could also be affected by possible sales of our common stock by investors who view the Series A Preferred Stock as a more attractive means of equity participation in us and by hedging or arbitrage trading activity involving our common stock. The hedging or arbitrage could, in turn, affect the trading price of the Series A Preferred Stock or any common stock that holders receive upon conversion of the Series A Preferred Stock.
Many of the factors listed above are beyond our control. In addition, broad market and industry factors may materially harm the market price of our securities irrespective of our operating performance. The stock market in general, and Nasdaq,
22
have experienced price and volume fluctuations that have often been unrelated or disproportionate to the operating performance of the particular companies affected. The trading prices and valuations of these stocks, and of our common stock and warrants which trade on Nasdaq, may not be predictable. A loss of investor confidence in the market for retail stocks or the stocks of other companies which investors perceive to be similar to the Company could depress the price of our securities regardless of our business, prospects, financial conditions or results of operations. A decline in the market price of our securities also could adversely affect our ability to issue additional securities and our ability to obtain additional financing in the future.
Additionally, if our common stock and warrants are not listed on, or become delisted from, Nasdaq for any reason, and are quoted on the OTC Bulletin Board, an inter-dealer automated quotation system for equity securities that is not a national securities exchange, the liquidity and price of our securities may be more limited than if we were quoted or listed on Nasdaq or another national securities exchange. You may be unable to sell your securities unless a market can be established or sustained.
Our business and/or reputation could be negatively affected as a result of actions of activist shareholders, and such activism could impact the trading value of our securities.
Certain of our shareholders have made, and may in the future make strategic proposals, suggestions, or requests for changes concerning the operation of our business, our business strategy, corporate governance considerations, or other matters that may not be fully aligned with our own. Responding to actions by activist shareholders can be costly and time-consuming, disrupt our operations and divert the attention of management and our employees. Perceived uncertainties as to our future direction may result in the loss of potential business opportunities, damage to our reputation, and may make it more difficult to attract and retain qualified directors, personnel and business partners. These actions could also cause our stock price to experience periods of volatility.
Our largest shareholder has significant influence over our management and affairs and could exercise this influence against other shareholders’ best interests.
At February 23, 2017, Mr. Jeffry N. Quinn, our Chairman and largest shareholder, beneficially owned approximately 15.5% of our outstanding shares of common stock, and our other executive officers and directors collectively beneficially owned an additional 2.1% of our outstanding shares of common stock. As a result, pursuant to our bylaws and applicable laws and regulations, Mr. Quinn and our other executive officers and directors are able to exercise significant influence over our company, including, but not limited to, any shareholder approvals for the election of our directors and, indirectly, the selection of our senior management, the amount of dividend payments, if any, our annual budget, increases or decreases in our share capital, new securities issuance, mergers and acquisitions and any amendments to our bylaws. Furthermore, this concentration of ownership may delay or prevent a change of control or discourage a potential acquirer from making a tender offer or otherwise attempting to obtain control of us, which could decrease the market price of our shares.
A significant number of additional shares of our common stock may be issued upon the exercise or conversion of existing securities, which issuances would substantially dilute existing shareholders and may depress the market price of our common stock.
As of February 23, 2017, there were 25,886,203 shares of our common stock outstanding. In addition, (i) 13,993,773 shares of common stock can be issued upon the exercise of outstanding warrants, (ii) 5,536,760 shares of common stock can be issued upon conversion of our Series A Preferred Stock, which includes 1,810,679 shares of common stock potentially issuable upon conversion of additional shares of Series A Preferred Stock received as dividends over the next five years and assumes that the conversion ratio is not adjusted, and (iii) 2,808,827 shares of common stock are available for future issuance under our 2014 Omnibus Incentive Plan. The issuance of shares of common stock would substantially dilute the proportionate ownership and voting power of existing security holders, and their issuance, or the possibility of their issuance, may depress the market price of our common stock.
Anti-takeover provisions contained in our certificate of incorporation and bylaws, our Shareholder Rights Agreement, the increased conversion rate triggered by a “fundamental change”, as well as provisions of Delaware law, could impair a takeover attempt.
The Company’s second amended and restated certificate of incorporation (the “certificate of incorporation”) and bylaws contain provisions that could have the effect of delaying or preventing changes in control or changes in our management without the consent of our Board of Directors. These provisions include:
• | no cumulative voting in the election of directors, which limits the ability of minority shareholders to elect director candidates; |
• | the exclusive right of our Board of Directors to elect a director to fill a vacancy created by the expansion of the Board of Directors or the resignation, death, or removal of a director, which prevents shareholders from being able to fill vacancies on our Board of Directors; |
23
• | the ability of our Board of Directors to determine whether to issue shares of our preferred stock and to determine the price and other terms of those shares, including preferences and voting rights, without shareholder approval, which could be used to significantly dilute the ownership of a hostile acquirer; |
• | a prohibition on shareholder action by written consent, which forces shareholder action to be taken at an annual or special meeting of our shareholders; |
• | the requirement that an annual meeting of shareholders may be called only by the chairman of the Board of Directors, the chief executive officer, or the Board of Directors, which may delay the ability of our shareholders to force consideration of a proposal or to take action, including the removal of directors; |
• | limiting the liability of, and providing indemnification to, our directors and officers; |
• | controlling the procedures for the conduct and scheduling of shareholder meetings; |
• | providing that directors may be removed prior to the expiration of their terms by shareholders only for cause; and |
• | advance notice procedures that shareholders must comply with in order to nominate candidates to our Board of Directors or to propose matters to be acted upon at a shareholders’ meeting, which may discourage or deter a potential acquirer from conducting a solicitation of proxies to elect the acquirer’s own slate of directors or otherwise attempting to obtain control of the Company. |
These provisions, alone or together, could delay hostile takeovers and changes in control of the Company or changes in our Board of Directors and management.
The Company’s Board of Directors adopted a Shareholder Rights Agreement on September 12, 2016 that, in general terms, works by imposing a significant penalty upon any person or group which acquires 30% or more of the Company’s outstanding common stock without the approval of the Company’s Board of Directors. The existence of this Shareholder Rights Agreement could discourage a potential acquirer, including potential acquirers that otherwise seek a transaction with us that would be attractive to you. In addition, the increased conversion rate of the Series A Preferred Stock into shares of our common stock that would be triggered by a “fundamental change” (as defined in the Certificate of Designations, Preferences, Rights and Limitations of the Series A Preferred Stock (the “Certificate of Designations”)) could also discourage a potential acquirer.
As a Delaware corporation, we are also subject to provisions of Delaware law, including Section 203 of the Delaware General Corporation Law, which prevents some shareholders holding more than 15% of our outstanding common stock from engaging in certain business combinations without approval of the holders of substantially all of our outstanding common stock.
Any provision of our certificate of incorporation, bylaws, Certificate of Designations or Delaware law, as well as our Shareholder Rights Agreement, that has the effect of delaying or deterring a change in control could limit the opportunity for our security holders to receive a premium for their securities and could also affect the price that some investors are willing to pay for our securities.
Our only significant asset is our indirect ownership of 100% of Jason Incorporated and such ownership may not be sufficient to pay dividends or make distributions or loans to enable us to pay any dividends on our common stock or preferred stock or satisfy our other financial obligations.
As of February 23, 2017, we have no direct operations and no significant assets other than the indirect ownership of 100% of Jason Incorporated. We will depend on Jason Incorporated for distributions, loans and other payments to generate the funds necessary to meet our financial obligations, including our expenses as a publicly traded company, and to pay any dividends with respect to our preferred stock and common stock. Legal and contractual restrictions in agreements governing our senior secured credit facilities and future indebtedness of Jason Incorporated, as well as the financial condition and operating requirements of Jason Incorporated, and the fact that we may be required to obtain the consent from the other shareholders of Jason Incorporated, may limit our ability to obtain cash from Jason Incorporated. The earnings from, or other available assets of, Jason Incorporated may not be sufficient to pay dividends or make distributions or loans to enable us to pay any dividends on our common stock or satisfy its other financial obligations. In addition, the terms of our Series A Preferred Stock may from time to time prevent us from paying cash dividends on our common stock.
24
Series A Preferred Stock Risk Factors
We are not obligated to pay dividends on the Series A Preferred Stock if prohibited by law, the terms of our financing agreements and may limit our ability to pay such dividends and will not be able to pay cash dividends if we have insufficient cash to do so.
Under Delaware law, dividends on capital stock may only be paid from “surplus” or, if there is no “surplus,” from the corporation’s net profits for the then-current or the preceding fiscal year. Unless we operate profitably, our ability to pay dividends on the Series A Preferred Stock would require the availability of adequate “surplus,” which is defined as the excess, if any, of our net assets (total assets less total liabilities) over our capital.
Financing agreements, whether ours or those of our subsidiaries and whether in place now or in the future, may contain restrictions on our ability to pay cash dividends on our capital stock, including the Series A Preferred Stock. These limitations may cause us to be unable to pay dividends on the Series A Preferred Stock unless we can refinance amounts outstanding under those agreements. Since we are not obligated to declare or pay cash dividends, we do not intend to do so to the extent we are restricted by any of our financing agreements.
The dividends payable by us on the Series A Preferred Stock may exceed our current and accumulated earnings and profits, as calculated for U.S. federal income tax purposes. If that occurs, it will result in the amount of the dividends that exceed such earnings and profits being treated for U.S. federal income tax purposes first as a return of capital to the extent of the beneficial owner’s adjusted tax basis in the Series A Preferred Stock, and the excess, if any, over such adjusted tax basis as capital gain. Such treatment will generally be unfavorable for corporate beneficial owners and may also be unfavorable to certain other beneficial owners.
Further, even if adequate surplus is available to pay dividends on the Series A Preferred Stock, we may not have sufficient cash to pay cash dividends on the Series A Preferred Stock. We may elect to pay dividends on the Series A Preferred Stock in shares of additional Series A Preferred Stock; however, our ability to pay dividends in shares of our Series A Preferred Stock may be limited by the number of shares of Series A Preferred Stock we are authorized to issue under our certificate of incorporation. As of January 1, 2017 we had issued 45,899 shares of our Series A Preferred Stock out of 100,000 authorized shares.
The Series A Preferred Stock does not have an established trading market, which may negatively affect its market value and the ability to transfer or sell such shares.
The shares of Series A Preferred Stock do not have an established trading market. Since the Series A Preferred Stock has no stated maturity date, investors seeking liquidity will be limited to selling their shares in the secondary market or converting their shares and selling in the secondary market. We do not intend to list the Series A Preferred Stock on any securities exchange. We cannot assure you that an active trading market in the Series A Preferred Stock will develop or, even if it develops, we cannot assure you that it will last. In either case, the trading price of the Series A Preferred Stock could be adversely affected and the ability of a holder of Series A Preferred Stock to transfer shares of Series A Preferred Stock will be limited. We are not aware of any entity making a market in the shares of our Series A Preferred Stock which we anticipate may further limit liquidity.
The conversion rate of the Series A Preferred Stock may not be adjusted for all dilutive events.
The number of shares of our common stock that a holder of Series A Preferred Stock is entitled to receive upon conversion of the Series A Preferred Stock is subject to adjustment for certain specified events, including, but not limited to, the issuance of certain stock dividends on our common stock, the issuance of certain rights or warrants, subdivisions, combinations, distributions of capital stock, indebtedness, or assets, cash dividends and certain issuer tender or exchange offers, as set forth in the Certificate of Designations. However, the conversion rate may not be adjusted for other events, such as the exercise of stock options or other equity awards held by our employees or offerings of our common stock or securities convertible into common stock (other than those set forth in the Certificate of Designations) for cash or in connection with acquisitions, which may adversely affect the market price of our common stock. Further, if any of these other events adversely affects the market price of our common stock, we expect it to also adversely affect the market price of our Series A Preferred Stock. In addition, the terms of our Series A Preferred Stock do not restrict our ability to offer common stock or securities convertible into common stock in the future or to engage in other transactions that could dilute our common stock. We have no obligation to consider the interests of the holders of our Series A Preferred Stock in engaging in any such offering or transaction. If we issue additional shares of common stock, those issuances may materially and adversely affect the market price of our common stock and, in turn, those issuances may adversely affect the trading price of the Series A Preferred Stock.
Series A Preferred Stock holders may be adversely affected if a “fundamental change” occurs
If a “fundamental change” (as defined in the Certificate of Designations) occurs, we will under certain circumstances increase the conversion rate by a number of additional shares of our common stock for shares of Series A Preferred Stock
25
converted in connection with such fundamental change as described in the Certificate of Designations. While this feature is designed to, among other things, compensate holders of Series A Preferred Stock for lost option time value of their shares of Series A Preferred Stock as a result of the fundamental change, it may not adequately compensate holders of Series A Preferred Stock for their loss as a result of such transaction. In addition, the conversion rate as adjusted will not exceed the $1,000 liquidation preference, divided by 66 2/3% of $10.49, the closing sale price of our common stock on June 30, 2014. However, if the adjustment is based on an amount per share that is less than the floor of 66 2/3% of $10.49, holders will likely receive a number of shares of common stock worth less than the $1,000 liquidation preference per share of Series A Preferred Stock, plus any accumulated and unpaid dividends thereon. Holders of our Series A Preferred Stock will have no claim against the Company for the difference between the value of the consideration received upon a conversion in connection with a fundamental change and the $1,000 liquidation preference per share of Series A Preferred Stock, plus any accumulated and unpaid dividends thereon.
These provisions will not afford protection to holders of Series A Preferred Stock in the event of other transactions that could adversely affect the value of the Series A Preferred Stock. For example, transactions such as leveraged recapitalizations, refinancings, restructurings, or acquisitions initiated by us may not constitute a fundamental change. In the event of any such transaction, holders would not have the protection afforded by the provisions applicable to a fundamental change even though each of these transactions could increase the amount of our indebtedness, or otherwise adversely affect our capital structure or any credit ratings, thereby adversely affecting the holders of Series A Preferred Stock.
In addition, holders of Series A Preferred Stock will have no additional rights upon a fundamental change, and will have no right not to convert the Series A Preferred Stock into shares of our common stock.
Our obligation to satisfy the additional shares requirement could be considered a penalty, in which case the enforceability thereof would be subject to general principles of reasonableness and equitable remedies.
We have reserved a number of shares of our common stock for issuance upon the conversion of the Series A Preferred Stock equal to the aggregate conversion rate, which, under limited circumstances, is less than the maximum number of shares of common stock that we might be required to issue upon such conversion.
On issuance of the Series A Preferred Stock, we reserved, and are obligated under the terms of the Series A Preferred Stock to keep reserved at all times, a number of shares of our common stock equal to the aggregate liquidation preference divided by the closing sale price of our common stock on the date of the closing of our issuance of the Series A Preferred Stock. This is less than the maximum number of shares of our common stock issuable upon conversion of the Series A Preferred Stock in connection with a fundamental change where we could, depending on the stock price at the time, be required to issue upon conversion of the Series A Preferred Stock, shares of common stock representing the $1,000 liquidation preference per share divided by 66 2/3% of $10.49, the closing sale price of our common stock on June 30, 2014. In that circumstance, we would not have reserved the full amount of shares of our common stock issuable upon conversion of the Series A Preferred Stock. While we may satisfy our obligation to issue shares upon conversion of the Series A Preferred Stock by utilizing authorized, unreserved and unissued shares of common stock, if any, or by redesignating reserved shares or purchasing shares in the open market, there can be no assurance that we would be able to do so at that time.
We may issue additional series of preferred stock that rank equally to the Series A Preferred Stock as to dividend payments and liquidation preference and these future issuances may adversely affect the market price for our common stock.
Neither our Certificate of Incorporation nor the Certificate of Designations prohibits us from issuing additional series of preferred stock that would rank equally to the Series A Preferred Stock as to dividend payments and liquidation preference. Our certificate of incorporation provides that we have the authority to issue up to 5,000,000 shares of preferred stock, including up to 100,000 shares of Series A Preferred Stock. The issuances of other series of preferred stock could have the effect of reducing the amounts available to the Series A Preferred Stock in the event of our liquidation, winding-up or dissolution. It may also reduce cash dividend payments on the Series A Preferred Stock if we do not have sufficient funds to pay dividends on all Series A Preferred Stock outstanding and outstanding parity preferred stock.
Additional issuances and sales of preferred stock, or the perception that such issuances and sales could occur, may cause prevailing market prices for our common stock to decline and may adversely affect our ability to raise additional capital in the financial markets at times and prices favorable to us.
Holders of our Series A Preferred Stock have no voting rights except under limited circumstances.
Except with respect to certain material and adverse changes to the Series A Preferred Stock as described in the Certificate of Designations, holders of Series A Preferred Stock do not have voting rights and will have no right to vote for any members of our Board of Directors, except as may be required by Delaware law.
26
Holders of our Series A Preferred Stock may be subject to tax if we make or fail to make certain adjustments to the conversion rate of the Series A Preferred Stock even though the holders of Series A Preferred Stock do not receive a corresponding cash distribution.
The conversion rate of the Series A Preferred Stock is subject to adjustment in certain circumstances, including the payment of cash dividends. If the conversion rate is adjusted as a result of a distribution that is taxable to our common shareholders, such as a cash dividend, holders of Series A Preferred Stock may be deemed to have received a dividend subject to U.S. federal income tax without the receipt of any cash. In addition, a failure to adjust (or to adjust adequately) the conversion rate after an event that increases a holder of Series A Preferred Stock’s proportionate interest in us could be treated as a deemed taxable dividend to the holder of Series A Preferred Stock. If a “fundamental change” (as defined in the Certificate of Designations) occurs, under some circumstances, we will increase the conversion rate for shares of Series A Preferred Stock converted in connection with such fundamental change. Such increase may also be treated as a distribution subject to U.S. federal income tax as a dividend. If a holder of Series A Preferred Stock is a non-U.S. holder, any deemed dividend may be subject to U.S. federal withholding tax at a 30% rate, or such lower rate as may be specified by an applicable treaty, which may be set off against subsequent payments on the Series A Preferred Stock.
Warrants Risk Factors
There is no guarantee that the warrants will ever be in the money, and they may expire worthless and the terms of our warrants may be amended.
The exercise price for our warrants is $12.00 per share. There is no guarantee that the warrants will ever be in the money prior to their expiration, and as such, the warrants may expire worthless.
In addition, the warrant agreement between Continental Stock Transfer & Trust Company, as warrant agent, and us provides that the terms of the warrants may be amended without the consent of any holder to cure any ambiguity or correct any defective provision, but requires the approval by the holders of at least 65% of the then outstanding warrants originally issued as part of units in our initial public offering (the “Public Warrants”) to make any change that adversely affects the interests of the registered holders. Accordingly, we may amend the terms of the warrants in a manner adverse to a holder if holders of at least 65% of the then outstanding Public Warrants approve of such amendment. Although our ability to amend the terms of the warrants with the consent of at least 65% of the then outstanding Public Warrants is unlimited, examples of such amendments could be amendments to, among other things, increase the exercise price of the warrants, shorten the exercise period or decrease the number of shares of our common stock purchasable upon exercise of a warrant.
We may redeem the Public Warrants prior to their exercise at a time that is disadvantageous to warrantholders, thereby making their warrants worthless.
We have the ability to redeem the outstanding Public Warrants at any time after they become exercisable and prior to their expiration at a price of $0.01 per warrant, provided that (i) the last reported sale price of our common stock equals or exceeds $18.00 per share for any 20 trading days within the 30 trading-day period ending on the third business day before we send the notice of such redemption and (ii) on the date we give notice of redemption and during the entire period thereafter until the time the warrants are redeemed, there is an effective registration statement under the Securities Act of 1933 covering the shares of our common stock issuable upon exercise of the Public Warrants and a current prospectus relating to them is available. Redemption of the outstanding Public Warrants could force holders of Public Warrants:
• | to exercise their warrants and pay the exercise price therefore at a time when it may be disadvantageous for them to do so; |
• | to sell their warrants at the then-current market price when they might otherwise wish to hold their warrants; or |
• | to accept the nominal redemption price which, at the time the outstanding warrants are called for redemption, is likely to be substantially less than the market value of their warrants. |
ITEM 1B. UNRESOLVED STAFF COMMENTS
None.
27
ITEM 2. PROPERTIES
Our corporate headquarters is located at 833 E. Michigan Street, Suite 900, Milwaukee, Wisconsin with approximately 19,000 square feet of office space that we lease, the term of which expires on May 1, 2027. Our executive offices are located at this facility, along with our treasury, finance, insurance, legal, information technology, human resources, tax, business development and administration of employee benefits.
As of December 31, 2016, Jason Industries owned or leased the following additional facilities:
Number of Locations | Square Footage | ||||||||||||||||||||
Manufacturing | Warehouse | Sales / Distribution / Admin | Total | Owned | Leased | Total | |||||||||||||||
Seating | 6 | 2 | 2 | 10 | 200,000 | 661,000 | 861,000 | ||||||||||||||
Finishing | 17 | — | 4 | 21 | 524,000 | 566,000 | 1,090,000 | ||||||||||||||
Acoustics | 8 | 4 | 2 | 14 | 226,000 | 1,158,000 | 1,384,000 | ||||||||||||||
Components | 3 | — | — | 3 | 172,000 | 221,000 | 393,000 | ||||||||||||||
34 | 6 | 8 | 48 | 1,122,000 | 2,606,000 | 3,728,000 | |||||||||||||||
We consider our facilities suitable and adequate for the purposes for which they are used and do not anticipate difficulty in renewing existing leases as they expire or in finding alternative facilities. Our largest facilities are located in the United States, Mexico and Germany. We also maintain a presence in the United Kingdom, Romania, Portugal, Spain, Singapore, Brazil, France, India, China, Taiwan and Sweden. See Note 10 “Leases” in the notes to the consolidated financial statements for information regarding our lease commitments.
ITEM 3. LEGAL PROCEEDINGS
From time to time, the Company is subject to litigation incidental to its business, as well as other litigation of a non-material nature in the ordinary course of business. See Note 17, “Commitments and Contingencies” under the heading “Litigation Matters” in the notes to the consolidated financial statements for further information.
ITEM 4. MINE SAFETY DISCLOSURES
Not applicable.
28
PART II
ITEM 5. MARKET FOR REGISTRANT’S COMMON EQUITY, RELATED STOCKHOLDER MATTERS AND ISSUER PURCHASES OF EQUITY SECURITIES
The Company’s common stock and warrants are currently quoted on Nasdaq under the symbols “JASN” and “JASNW,” respectively. Through June 30, 2014, our common stock, warrants and units were quoted under the symbols “QPAC,” “QPACW,” and “QPACU,” respectively. Upon the consummation of the Business Combination, we separated our units, which were sold in our initial public offering, into their component securities of one share of common stock and one warrant, and the units ceased public trading. There is no established trading market for the Series A Preferred Stock.
Common Stock and Warrants Prices
The following table sets forth for the periods indicated, the reported high and low sales prices for our common stock and warrants.
Common Stock | Warrants | ||||||||||||||
High | Low | High | Low | ||||||||||||
2016: | |||||||||||||||
First Quarter | $ | 4.23 | $ | 2.77 | $ | 0.20 | $ | 0.04 | |||||||
Second Quarter | $ | 4.20 | $ | 3.52 | $ | 0.35 | $ | 0.11 | |||||||
Third Quarter | $ | 3.90 | $ | 1.87 | $ | 0.29 | $ | 0.06 | |||||||
Fourth Quarter | $ | 2.37 | $ | 1.41 | $ | 0.10 | $ | 0.04 | |||||||
2015: | |||||||||||||||
First Quarter | $ | 10.04 | $ | 6.56 | $ | 1.31 | $ | 0.68 | |||||||
Second Quarter | $ | 7.88 | $ | 6.45 | $ | 0.95 | $ | 0.51 | |||||||
Third Quarter | $ | 7.49 | $ | 4.53 | $ | 0.58 | $ | 0.18 | |||||||
Fourth Quarter | $ | 5.10 | $ | 2.90 | $ | 0.46 | $ | 0.06 | |||||||
Holders
As of December 31, 2016, there were 24,802,196 shares of common stock outstanding, held of record by 75 holders, and 45,000 shares of Series A Preferred Stock outstanding, held of record by 9 holders. On January 1, 2017, an additional 899 shares of Series A Preferred Stock were issued to the 9 holders of record. In addition, 13,993,773 shares of common stock are issuable upon exercise of 13,993,773 warrants, held of record by 7 holders. The number of record holders of our common stock, Series A Preferred Stock and warrants does not include DTC participants or beneficial owners holding shares through nominee names.
Dividends
The Company paid the following dividends on the Series A Preferred Stock during the year ended December 31, 2016:
Payment Date | Record Date | Amount Per Share | Total Dividends Paid | |||
January 1, 2016 | November 15, 2015 | $20.00 | $900 | |||
April 1, 2016 | February 15, 2016 | $20.00 | $900 | |||
July 1, 2016 | May 15, 2016 | $20.00 | $900 | |||
October 1, 2016 | August 15, 2016 | $20.00 | $900 | |||
On December 15, 2016, the Company announced a $20.00 per share dividend on its Series A Preferred Stock to be paid in additional shares of Series A Preferred Stock on January 1, 2017 to holders of record on November 15, 2016. As of December 31, 2016, the Company has recorded the 899 additional Series A Preferred Stock shares declared from the dividend for $0.9 million within preferred stock in the consolidated balance sheets.
The Company has not paid any dividends on its common stock to date. It is the present intention of the Company to retain any earnings for use in its business operations and, accordingly, the Company does not anticipate the Board of Directors declaring any dividends in the foreseeable future on our common stock. In addition, certain of our loan agreements restrict the payment of dividends and the terms of our Series A Preferred Stock may from time to time prevent us from paying cash dividends on our common stock.
29
Recent Issuer Purchases of Equity Securities
The following table contains detail related to the repurchase of common stock based on the date of trade during the three months ended December 31, 2016:
2016 Fiscal Month | Total Number of Shares Purchased (a) | Average Price Paid per Share | Total Number of Shares Purchased as Part of Publicly Plans or Programs Announced (b) | Maximum Number of Shares that May Yet Be Purchased Under the Plans or Programs | ||||
October 1 to November 4 | — | $— | — | N/A | ||||
November 5 to December 2 | — | — | — | N/A | ||||
December 3 to December 31 | 2,625 | 1.51 | — | N/A | ||||
Total | 2,625 | $1.51 | — | |||||
(a) Represents shares of common stock that employees surrendered to satisfy withholding taxes in connection with the vesting of restricted stock unit awards. The 2014 Omnibus Incentive Plan and the award agreements permit participants to satisfy all or a portion of the statutory federal, state and local withholding tax obligations arising in connection with plan awards by electing to (1) have the Company reduce the number of shares otherwise deliverable or (2) deliver shares already owned, in each case having a value equal to the amount to be withheld. During the year ended December 31, 2016, the Company withheld 43,806 shares that employees presented to the Company to satisfy withholding taxes in connection with the vesting of restricted stock unit awards.
(b) The Company is not currently participating in a share repurchase program. In February 2015, the Board of Directors authorized the purchase of up to $5.0 million of outstanding warrants. Management is authorized to effect purchases from time to time in the open market or through privately negotiated transactions. There is no expiration date to this authority. No warrants were repurchased during the year ended December 31, 2016.
Warrant Repurchases
On May 6, 2014, the Company commenced a tender offer to purchase up to 9,200,000 of its outstanding warrants subject to certain conditions, including the consummation of the Business Combination. On July 18, 2014, the tender offer expired and a total of 4,406,227 warrants were validly tendered at a purchase price of $1.50 per warrant, for a total purchase price of approximately $6.6 million.
Comparative Share Performance Graph
The following information in this Item 5 is not deemed to be “soliciting material” or to be “filed” with the SEC or subject to Regulation 14A or 14C under the Securities Exchange Act of 1934 or to the liabilities of Section 18 of the Securities Exchange Act of 1934, and will not be deemed to be incorporated by reference into any filing under the Securities Act of 1933 or the Securities Exchange Act of 1934, except to the extent the Company specifically incorporates it by reference into such a filing.
The following graph shows a comparison of cumulative total shareholder return, calculated on a dividend reinvested basis, for (1) the Company’s common stock, (2) the Standard & Poor’s SmallCap 600 Index, and (3) the Dow Jones U.S. Diversified Industrials Index, for the period October 18, 2013 (the first day our common shares were traded following our initial public offering) through December 31, 2016. The graph assumes the value of the investment in our common stock and each index was $100.00 on October 18, 2013 and that all dividends were reinvested. Note that historic stock price performance is not necessarily indicative of future stock price performance.
30
10/18/2013 | 12/31/2013 | 12/31/2014 | 12/31/2015 | 12/31/2016 | ||||||||||||||||
Jason Industries, Inc. | $ | 100.00 | $ | 102.02 | $ | 99.49 | $ | 38.18 | $ | 18.18 | ||||||||||
S&P SmallCap 600 | $ | 100.00 | $ | 109.83 | $ | 116.15 | $ | 113.86 | $ | 144.10 | ||||||||||
Dow Jones US Diversified Industrials | $ | 100.00 | $ | 116.29 | $ | 117.51 | $ | 132.60 | $ | 147.12 | ||||||||||
31
ITEM 6. SELECTED FINANCIAL DATA
The selected financial data for the year ended December 31, 2016, the year ended December 31, 2015, the period June 30, 2014 through December 31, 2014, and the period January 1, 2014 through June 29, 2014 have been derived from Jason Industries’ audited consolidated financial statements, including the notes thereto, appearing elsewhere in this Annual Report on Form 10-K. The selected financial data for the years ended December 31, 2013 and 2012, have been derived from Jason’s historical consolidated financial statements not included herein.
Upon completion of the Business Combination on June 30, 2014 (the “Closing Date”), the Company was identified as the acquirer for accounting purposes, and Jason is the acquiree and accounting predecessor. The Company’s financial statement presentation distinguishes Jason as the “Predecessor” for periods prior to the Closing Date. The Company was subsequently re-established as Jason Industries, Inc. and is the “Successor” for periods after the Closing Date, which includes consolidation of Jason subsequent to the Business Combination on June 30, 2014. The acquisition was accounted for as a business combination using the acquisition method of accounting, and the Successor financial statements reflect a new basis of accounting that is based on the fair value of net assets acquired. See Note 2 of the audited consolidated financial statements included elsewhere in this Annual Report on Form 10-K for further discussion of the Business Combination. As a result of the application of the acquisition method of accounting as of the effective time of the acquisition, the financial statements for the Predecessor period and for the Successor period are presented on a different basis and, therefore, are not comparable.
The historical results presented below are not necessarily indicative of the results to be expected for any future period. This information should be read in conjunction with “Risk Factors,” “Management’s Discussion and Analysis of Financial Condition and Results of Operations,” and the Company’s consolidated financial statements and the related notes included elsewhere in this Annual Report on Form 10-K.
32
Successor | Predecessor | |||||||||||||||||||||||
Year Ended December 31, | June 30, 2014 Through December 31, 2014 | January 1, 2014 Through June 29, 2014 | Year Ended December 31, | |||||||||||||||||||||
(in thousands, except per share data) | 2016 | 2015 | 2013 | 2012 | ||||||||||||||||||||
Statement of Operations Data: | ||||||||||||||||||||||||
Net sales | $ | 705,519 | $ | 708,366 | $ | 325,335 | $ | 377,151 | $ | 680,845 | $ | 655,020 | ||||||||||||
Cost of goods sold | 573,917 | 561,076 | 270,676 | 294,175 | 527,371 | 515,154 | ||||||||||||||||||
Gross profit | 131,602 | 147,290 | 54,659 | 82,976 | 153,474 | 139,866 | ||||||||||||||||||
Selling and administrative expenses | 113,797 | 129,371 | 57,183 | 54,974 | 108,889 | 98,111 | ||||||||||||||||||
Newcomerstown fire (gain) loss - net | — | — | — | — | (12,483 | ) | 4,736 | |||||||||||||||||
Impairment charges | 63,285 | 94,126 | — | — | — | 544 | ||||||||||||||||||
Loss on disposals of property, plant and equipment - net | 880 | 109 | 57 | 338 | 22 | 472 | ||||||||||||||||||
Restructuring | 7,232 | 3,800 | 1,131 | 2,554 | 2,950 | 1,631 | ||||||||||||||||||
Transaction-related expenses | — | 886 | 2,533 | 27,783 | 1,073 | 1,028 | ||||||||||||||||||
Multiemployer pension plan withdrawal (gain) loss | — | — | — | — | (696 | ) | 3,395 | |||||||||||||||||
Operating (loss) income | (53,592 | ) | (81,002 | ) | (6,245 | ) | (2,673 | ) | 53,719 | 29,949 | ||||||||||||||
Interest expense | (31,843 | ) | (31,835 | ) | (16,172 | ) | (7,301 | ) | (20,716 | ) | (18,612 | ) | ||||||||||||
Equity income | 681 | 884 | 381 | 831 | 2,345 | 1,510 | ||||||||||||||||||
Gain from sale of joint ventures | — | — | — | 3,508 | — | — | ||||||||||||||||||
Gain from involuntary conversion of property, plant and equipment | — | — | — | — | 6,351 | 6,103 | ||||||||||||||||||
Other income - net | 900 | 97 | 167 | 107 | 636 | 543 | ||||||||||||||||||
(Loss) income before income taxes | (83,854 | ) | (111,856 | ) | (21,869 | ) | (5,528 | ) | 42,335 | 19,493 | ||||||||||||||
Tax (benefit) provision | (6,157 | ) | (22,255 | ) | (7,889 | ) | (573 | ) | 18,247 | 4,828 | ||||||||||||||
Net (loss) income | $ | (77,697 | ) | $ | (89,601 | ) | $ | (13,980 | ) | $ | (4,955 | ) | $ | 24,088 | $ | 14,665 | ||||||||
Less net loss attributable to noncontrolling interests | (10,818 | ) | (15,143 | ) | (2,362 | ) | — | — | — | |||||||||||||||
Net (loss) income attributable to Jason Industries | $ | (66,879 | ) | $ | (74,458 | ) | $ | (11,618 | ) | $ | (4,955 | ) | $ | 24,088 | $ | 14,665 | ||||||||
Accretion of preferred stock dividends and redemption premium | 3,600 | 3,600 | 1,810 | — | 2,405 | 6,312 | ||||||||||||||||||
Net (loss) income available to common shareholders of Jason Industries | $ | (70,479 | ) | $ | (78,058 | ) | $ | (13,428 | ) | $ | (4,955 | ) | $ | 21,683 | $ | 8,353 | ||||||||
(Loss) earnings per share: Basic and diluted | $ | (3.13 | ) | $ | (3.53 | ) | $ | (0.61 | ) | $ | (4,955.00 | ) | $ | 21,683.00 | $ | 8,353.00 | ||||||||
Weighted-average shares outstanding: | ||||||||||||||||||||||||
Basic and diluted | 22,507 | 22,145 | 21,991 | 1 | 1 | 1 | ||||||||||||||||||
Cash dividends paid per common share | $ | — | $ | — | $ | — | $ | — | $ | 43,055 | $ | — | ||||||||||||
Successor | Predecessor | |||||||||||||||||||
As of December 31, | As of December 31, | |||||||||||||||||||
(in thousands) | 2016 | 2015 | 2014 | 2013 | 2012 | |||||||||||||||
Consolidated Balance Sheet Data: | ||||||||||||||||||||
Cash and cash equivalents | $ | 40,861 | $ | 35,944 | $ | 62,279 | $ | 16,318 | $ | 29,557 | ||||||||||
Total assets | 584,331 | 697,092 | 788,733 | 420,330 | 429,616 | |||||||||||||||
Long-term debt | 416,945 | 426,150 | 404,635 | 233,144 | 190,353 | |||||||||||||||
Total liabilities | 587,117 | 612,098 | 606,058 | 389,858 | 334,690 | |||||||||||||||
Redeemable preferred stock | — | — | — | — | 46,010 | |||||||||||||||
Total stockholders’ equity | (2,786 | ) | 84,994 | 182,675 | 30,472 | 48,916 | ||||||||||||||
33
ITEM 7. MANAGEMENT’S DISCUSSION AND ANALYSIS OF FINANCIAL CONDITION AND RESULTS OF OPERATIONS
The following discussion and analysis of financial condition and results of operations of the Company should be read in conjunction with the consolidated financial statements for the years ended December 31, 2016 and December 31, 2015 and the periods June 30, 2014 through December 31, 2014 and January 1, 2014 through June 29, 2014, including the notes thereto, included elsewhere in this Annual Report on Form 10-K. The Company’s actual results may not be indicative of future performance. This discussion and analysis contains forward-looking statements and involves numerous risks and uncertainties, including, but not limited to, those discussed in “Cautionary Note Regarding Forward-Looking Statements” and “Risk Factors” included in Part I, Item IA or in other parts of this Annual Report on Form 10-K. Actual results may differ materially from those contained in any forward-looking statements.
This Management’s Discussion and Analysis of Financial Condition and Results of Operations (“MD&A”) contains certain financial measures, in particular EBITDA and Adjusted EBITDA, which are not presented in accordance with accounting principles generally accepted in the United States of America (“GAAP”). These non-GAAP financial measures are being presented because management believes that they provide readers with additional insight into the Company’s operational performance relative to earlier periods and relative to its competitors. EBITDA and Adjusted EBITDA are key measures used by the Company to evaluate its performance. The Company does not intend for these non-GAAP financial measures to be a substitute for any GAAP financial information. Readers of this MD&A should use these non-GAAP financial measures only in conjunction with the comparable GAAP financial measures. Reconciliations of EBITDA and Adjusted EBITDA to net income, the most comparable GAAP measure, are provided in this MD&A.
On June 30, 2014, the Company (formerly known as Quinpario Acquisition Corp.) and Jason completed the Business Combination in which JPHI, a majority owned subsidiary of the Company, acquired 100 percent of the capital stock of Jason from its then-current owners, Saw Mill Capital, LLC, Falcon Investment Advisors, LLC and other investors. In connection with the closing of the Business Combination, the Company changed its name to Jason Industries, Inc., and commenced trading of its common stock and warrants under the symbols, “JASN” and “JASNW”, respectively, on NASDAQ. The Business Combination is further described in Note 2 to the Company’s consolidated financial statements included herein.
Fiscal Year
The Company’s fiscal year ends on December 31. Throughout the year, the Company reports its results using a fiscal calendar whereby each three month quarterly reporting period is approximately thirteen weeks in length and ends on a Friday. The exceptions are the first quarter, which begins on January 1, and the fourth quarter, which ends on December 31. For 2016, the Company’s fiscal quarters were comprised of the three months ended April 1, July 1, September 30 and December 31. In 2015, the Company’s fiscal quarters were comprised of the three months ended March 27, June 26, September 25 and December 31.
The application of acquisition accounting for the Business Combination significantly affected certain assets, liabilities, and expenses. As a result, financial information as of December 31, 2016 and 2015; the years ended December 31, 2016 and 2015; and in the period from June 30, 2014 through December 31, 2014 is not comparable to Jason Industries’ predecessor financial information. Therefore, we did not combine certain financial information in the period June 30, 2014 through December 31, 2014 with our predecessor financial information in the period January 1, 2014 through June 29, 2014 for comparison to other periods. We have combined our net sales and Adjusted EBITDA in the period June 30, 2014 through December 31, 2014 with our predecessor net sales and Adjusted EBITDA in the period January 1, 2014 through June 29, 2014. Net sales and Adjusted EBITDA were not affected by acquisition accounting. See Note 2 to the consolidated financial statements for additional information on acquisition accounting for the Business Combination.
Overview
Jason Industries is a global industrial manufacturing company with significant market share positions in each of its four businesses: seating, finishing, acoustics and components. Jason Incorporated was founded in 1985 and today the Company provides critical components and manufacturing solutions to customers across a wide range of end markets, industries and geographies through its global network of 34 manufacturing facilities and 14 sales offices, warehouses and joint venture facilities throughout the United States and 14 foreign countries. The Company has embedded relationships with long standing customers, superior scale and resources and specialized capabilities to design and manufacture specialized products on which our customers rely.
The Company focuses on markets with sustainable growth characteristics and where it is, or has the opportunity to become, the industry leader. The Company’s seating segment supplies seating solutions to equipment manufacturers in the motorcycle, lawn and turf care, industrial, agricultural, construction and power sports end markets. The finishing segment focuses on the production of industrial brushes, buffing wheels, buffing compounds, and abrasives that are used in a broad range of industrial and infrastructure applications. The acoustics segment manufactures engineered non-woven, fiber-based
34
acoustical products for the automotive industry. The components segment is a diversified manufacturer of expanded and perforated metal components and subassemblies for smart utility meters.
On May 29, 2015, the Company acquired all of the outstanding shares of DRONCO GmbH (“DRONCO”). DRONCO is a leading European manufacturer of bonded abrasives. These abrasives are being manufactured and distributed by the finishing segment. The Company paid cash consideration of $34.4 million, net of cash acquired, and, pursuant to the transaction, assumed certain liabilities. The DRONCO acquisition expanded the finishing segment’s product portfolio and advances its entry to adjacent abrasives markets.
During each of the years ended December 31, 2016, 2015 and 2014, approximately 30% of the Company’s sales were generated by the Company’s operations located outside of the U.S. As a diversified, global business, the Company’s operations are affected by worldwide, regional and industry-specific economic and political factors. The Company’s geographic and industry diversity, as well as the wide range of its products, help mitigate the impact of industry or economic fluctuations. Given the broad range of products manufactured and industries and geographies served, management does not use any indices other than general economic trends to predict the overall outlook for the Company. The Company’s individual businesses monitor key competitors and customers, including, to the extent possible, their sales, to gauge relative performance and the outlook for the future.
General Market Conditions and Trends; Business Performance and Outlook
Demand for the Company’s products was mixed in 2016 when compared with 2015, with higher demand in the acoustics segment, offset by lower demand in the seating, finishing, and components segments. Demand was mixed in 2015 when compared with 2014, with higher demand in the seating segment and lower demand in the finishing and components segments.
The seating segment is principally impacted by demand from U.S.-based original equipment manufacturers serving the motorcycle, lawn and turf care, construction, agricultural and power sports market segments. In recent years, power sports production and the lawn and turf care equipment market have rebounded, and global construction activity has improved. Management believes that, in the near term, the power sports and construction equipment industries will continue to show stability, while the lawn and turf care industry will experience normal seasonal demand, and the motorcycle and agricultural equipment industry will soften. However, if such industries weaken (or, in the case of motorcycle and agricultural equipment, soften more than anticipated), there could be reduced demand for the seating segment’s products, which would have a material negative impact on the seating segment’s net sales and/or income from continuing operations.
Demand in the Company’s finishing segment is largely dependent upon overall industrial production levels in the markets it serves. Management believes that gross domestic product (“GDP”) and industrial production levels in the Company’s served markets will continue to grow modestly in the near term. However, if there is no growth, or if GDP or production levels do not increase or shrink, there could be reduced demand for the finishing segment’s products, which would have a material negative impact on the finishing segment’s net sales and/or income from continuing operations.
Demand for products manufactured by the Company’s acoustics segment is primarily influenced by production levels in the North American automobile industry. Management believes that North American automotive industry production, which has increased over the last three years, will cycle down over the next three years. If such industry weakens more than anticipated, there could be reduced demand for the acoustics segment’s products, which would have a material negative impact on the acoustics segment’s net sales and/or income from continuing operations.
Sales levels for the components segment are dependent upon new railcar and smart utility production levels in the U.S., as well as general U.S. industrial production levels. Railcar production declined significantly in 2016 and management believes this decline will persist into 2017 as part of a cyclical decline. Management believes the demand for smart meter assemblies for the electric utility industry will remain at current levels and U.S. GDP and industrial production will grow modestly. However, if the North American rail industry declines more rapidly or smart meter assemblies are weaker than anticipated, customers in-source production, and/or U.S. GDP is flat or shrinks, there could be reduced demand for the components segment’s products, which would have a material negative impact on the components segment’s net sales and/or income from continuing operations.
The Company expects overall market conditions to remain challenging due to macro-economic uncertainties and monetary and fiscal policies of countries where we do business. While individual businesses and end markets continue to experience volatility, the Company expects to benefit as general economic conditions in North America and Western Europe are expected to experience modest growth. Regarding economic conditions, as discussed above, we expect the following in the near term:
• | modest global GDP growth; |
• | continued strength in key sectors such as the power sport and construction industries |
35
• | slowing demand in the North American automotive industry; |
• | lower demand in the motorcycle and agricultural equipment industries; |
• | significantly declining demand in the North American rail industry; |
• | normal seasonal demand in the lawn and turf care market; and |
• | flat demand for smart meter assemblies for the electric utility industry. |
Strategic Initiatives
The Company’s strategic initiatives support an overall capital allocation strategy that focuses on decreasing leverage through maximizing earnings and free cash flow. On March 1, 2016, the Company announced a global cost reduction and restructuring program designed to expand Adjusted EBITDA margins. To achieve this target, our strategic initiatives include:
Margin Expansion - The Company is focused on creating operational effectiveness at each of its business segments through deployment of lean principles and implementation of continuous operational improvement initiatives. While many of these activities have focused on implementing shop floor improvements, we have also targeted our selling and administrative functions in order to reduce the cost of serving our customers. The Company is also focused on improving profitability through an active evaluation of customer pricing and margins and a reduction in the number of parts and product variations that are produced. While these initiatives may result in lower overall sales, they are focused on creating shareholder value through higher margins and profitability, as well as lower inventory levels and working capital requirements.
Continued footprint rationalization - The Company serves its customers through a global network of manufacturing facilities, sales offices, warehouses and joint venture facilities throughout the United States and 14 foreign countries. The Company’s geographic footprint has evolved over time with a focus on maximizing geographic coverage while optimizing costs. Over the past several years, the Company has closed several facilities in higher cost, mature markets and replaced them with facilities in higher growth, lower cost regions such as Mexico, India and Eastern Europe. In 2016, the Company wound down operations of the finishing segment facility in Sao Bernardo do Campo, Brazil, and the components facility in Buffalo Grove, Ill. The Company believes that geographic proximity to existing and potential customers provides logistical efficiencies, as well as important strategic and cost advantages, and has also taken steps to realign its footprint within the United States. The Company anticipates that costs associated with any future rationalization activities, as well as the capital required for any new facilities, will be funded by cash generated from operating activities.
Product Innovation - During the past four years, the Company’s research and development activities have placed more focus on developing new products that are of higher value to our customers, thereby providing customers with a better value proposition. The Company believes that developing new and innovative products will allow it to deepen its value-added relationships with customers, open new opportunities for revenue generation, enhance pricing power and improve margins. This strategy has been particularly effective in the Company’s acoustics segment where new fiber based products have been developed to capitalize on industry trends requiring quieter automobiles and products that meet end of vehicle life recycling standards and lower weight.
Acquisitions - The Company uses acquisitions to increase revenues with existing customers and to expand revenues to both new markets and customers. The Company intends to only pursue an acquisition if it is accretive to EBITDA (earnings before interest, income taxes, depreciation and amortization) margins post-synergies, has a strategic focus that aligns with our core strategy and generates the appropriate estimated return on investment as part of our capital resource and allocation process.
Factors that Affect Operating Results
The Company’s results of operations and financial performance are influenced by a number of factors, including the timing of new product introductions, general economic conditions and customer buying behavior. The Company’s business is complex, with multiple segments serving a broad range of industries worldwide. The Company has manufacturing and sales facilities around the world, and it operates in numerous regulatory and governmental environments. Comparability of future results could be impacted by any number of unforeseen issues.
Key Events
In addition to the factors described above, the following strategic and operational events, which occurred during the years ended December 31, 2016, 2015 and 2014, affected the Company’s results of operations:
Impairment charges. In the fourth quarter of 2016, the Company performed its annual budgeting and strategic planning process, including a re-assessment of the Company’s capital allocation priorities and a review of the short and long-term growth expectations of each business.
36
In performing the first step of the annual goodwill impairment test in the fourth quarter of 2016, the Company determined that the estimated fair values of the acoustics and components reporting units were lower than the carrying values of the respective reporting units, requiring further analysis under the second step of the impairment test. The decline in the estimated fair value of the acoustics reporting unit was primarily due to lower long-term revenue growth expectations resulting from this strategic review of capital allocation and investment priorities as compared to the Company’s prior growth plan for the business. The fair value of the acoustics reporting unit was also negatively impacted by a projected cyclical decline in the North American automotive industry end-market. The decline in the estimated fair value of the components reporting unit was primarily due to lower long-term revenue expectations resulting from the annual budgeting and strategic planning process as compared to the Company’s prior plan for the business, primarily due to projected longer-term weakness in the rail end-market.
In performing the second step of the impairment testing, the Company performed a theoretical purchase price allocation for the acoustics and components reporting units to determine the implied fair values of goodwill which were compared to the recorded amounts of goodwill for each reporting unit. Upon completion of the second step of the goodwill impairment test, the Company recorded non-cash goodwill impairment charges of $63.0 million, representing full goodwill impairments of $29.8 million and $33.2 million in the acoustics and components reporting units, respectively.
In the remaining reporting unit with a goodwill balance, finishing, the percentage by which estimated fair value exceeded carrying value was approximately 18%. The finishing reporting unit includes $42.2 million of goodwill and $38.7 million of amortizable intangible assets as of December 31, 2016. The forecasted financial results of the finishing reporting unit are dependent upon revenue growth, adjusted EBITDA margin expansion, and the funding of capital expenditures supporting restructuring and cost reduction initiatives. The assumptions that have the most significant impact on determination of the finishing reporting unit fair value are the revenue growth rate, including 3 percent in the terminal year, adjusted EBITDA margin expansion from current levels to 18 percent over the next five years, and the weighted average cost of capital (discount rate), or 12.1%. A change in either of these assumptions, individually or in the aggregate, or future financial performance that is below management expectations may result in the carrying value of this reporting unit exceeding its fair value, and goodwill and amortizable intangible assets could be impaired.
In connection with the evaluation of the goodwill impairment in the acoustics and components reporting units, the Company assessed tangible and intangible assets for impairment prior to performing the first step of the goodwill impairment test. As a result of this analysis, the undiscounted future cash flows of each asset group within the reporting units exceeded the recorded carrying values of the net assets within each asset group, and as such, no non-cash impairment charges resulted from such assessment.
In the fourth quarter of 2015, the Company determined that the estimated fair value of the seating reporting unit was lower than the carrying value of the reporting unit, requiring further analysis under the second step of the impairment test. The Company performed a theoretical purchase price allocation for the seating reporting unit to determine the implied fair value of goodwill which was compared to the recorded amount of goodwill. Upon completion of the second step of the goodwill impairment test, the Company recorded a non-cash goodwill impairment charge of $58.8 million, representing a complete impairment of goodwill in the seating reporting unit. The decline in the estimated fair value of the seating reporting unit was primarily due to lower long-term growth expectations resulting from projected long-term weakness in agriculture and heavy industry endmarkets, and a strategic shift in capital allocation and investment priorities.
In connection with the evaluation of the goodwill impairment in the seating reporting unit, the Company assessed tangible and intangible assets for impairment prior to performing the first step of the goodwill impairment test. As a result of this analysis, non-cash impairment charges of $27.7 million, $6.8 million, and $0.8 million were recorded for customer relationship, trademarks, and patents intangible assets, respectively, in the seating reporting unit during the fourth quarter of 2015.
Total non-cash impairment charges of $94.1 million were recorded in the fourth quarter of 2015 as a result of these analyses. These charges are recorded as impairment charges in the consolidated statements of operations.
In connection with the goodwill impairment tests in 2016 and 2015, the Company engaged a third-party valuation firm to assist management with determining fair value estimates for the reporting units in the first step of the goodwill impairment test, and in estimating fair values of tangible and intangible assets used in the second step of the goodwill impairment test. In connection with obtaining an independent third-party valuation, management provided certain information and assumptions that were utilized in the fair value calculation. Significant assumptions used in determining reporting unit fair value include forecasted cash flows, revenue growth rates, adjusted EBITDA margins, weighted average cost of capital (discount rate), assumed tax treatment of a future sale of the reporting unit, terminal growth rates, capital expenditures, sales and EBITDA multiples used in the market approach, and the weighting of the income and market approaches. The fair value of the reporting units is determined using a weighted average of an income approach primarily based on the Company’s three year strategic plan and a market approach based on implied valuation multiples of public company peer groups for each reporting unit. Both
37
approaches are generally deemed equally relevant in determining reporting unit enterprise value, and as a result, weightings of 50 percent were used for each. This fair value determination was categorized as Level 3 in the fair value hierarchy.
Acquisitions. During the first quarter of 2015, the Company acquired certain assets of Herold Partco Manufacturing, Inc. for $0.4 million. Herold Partco Manufacturing, Inc. is a Cleveland-based manufacturer of industrial brushes. These brushes are now manufactured and distributed by the finishing segment and sold under the Osborn brand name.
During the second quarter of 2015, the Company acquired all of the outstanding shares of DRONCO. DRONCO is a European manufacturer of bonded abrasives. These abrasives are being manufactured and distributed by the finishing segment. The Company paid cash consideration of $34.4 million net of cash acquired, and, pursuant to the transaction, assumed certain liabilities.
Business Combination. On June 30, 2014, the Company and Jason completed the Business Combination in which JPHI, a majority owned subsidiary of the Company, acquired 100 percent of the capital stock of Jason from its then-current owners, Saw Mill Capital, LLC, Falcon Investment Advisors, LLC and other investors. In connection with the closing of the Business Combination, the Company changed its name to Jason Industries, Inc., and commenced trading of its common stock and warrants on Nasdaq. The Business Combination is further described in Note 2 to the Company’s consolidated financial statements included herein.
The Company’s 2014 results for the period January 1, 2014 through June 29, 2014 and the period June 30, 2014 through December 31, 2014, were impacted by approximately $27.8 million and $1.2 million, respectively, of transaction expenses directly related to the Business Combination. See Note 2 to the Company’s consolidated financial statements included herein for further discussion of the Business Combination.
Sale of Joint Ventures. During the first quarter of 2014, the Company completed the sale of its 50% equity interest in two of its joint ventures for a total of $11.5 million. The Company recorded a $3.5 million gain on the sale of the joint ventures, which is reported separately on the consolidated statements of operations.
Key Financial Definitions
Net sales. Net sales reflect the Company’s sales of its products net of allowances for returns and discounts. Several factors affect net sales in any period, including general economic conditions, weather conditions, the timing of acquisitions and the purchasing habits of its customers.
Cost of goods sold. Cost of goods sold includes all costs of manufacturing the products the Company sells. Such costs include direct and indirect materials, direct and indirect labor costs, including fringe benefits, supplies, utilities, depreciation, facility rent, insurance, pension benefits and other manufacturing related costs. The largest component of cost of goods sold is the cost of materials, which typically represents approximately 60% of net sales. Fluctuations in cost of goods sold are caused primarily by changes in sales levels, changes in the mix of products sold, productivity of labor, and changes in the cost of raw materials. In addition, following acquisitions, cost of goods sold will be impacted by step-ups in the value of inventories required in connection with the accounting for acquired businesses.
Selling and administrative expenses. Selling and administrative expenses primarily include the cost associated with the Company’s sales and marketing, finance, human resources, and administration, engineering and technical services functions. Certain corporate level administrative expenses such as payroll and benefits, travel, marketing, accounting, auditing and legal fees and certain other expenses are kept within its corporate results and not allocated to its business segments.
Impairment charges. As required by GAAP, when certain conditions or events occur, the Company recognizes impairment losses to reduce the carrying value of goodwill, other intangible assets and property, plant and equipment to their estimated fair values. During the year ended December 31, 2016, the Company recognized impairment charges primarily related to goodwill in the acoustics and components segments.
Loss on disposals of fixed assets-net. In the ordinary course of business, the Company disposes of fixed assets that are no longer required in its day to day operations with the intent of generating cash from those sales.
Restructuring. In the past several years, the Company has made changes to its worldwide manufacturing footprint to reduce its fixed cost base. These actions have resulted in employee severance and other related charges, changes in its operating cost structure, movement of manufacturing operations and product lines between facilities, exit costs for consolidation and closure of plant facilities, employee relocation and lease termination costs, and impairment charges. It is likely that the Company will incur such costs in future periods as well. These operational changes and restructuring costs affect comparability between periods and segments.
Transaction-related expenses. Transaction-related expenses primarily consist of professional service fees related to the Business Combination and other related transactions, as well as the Company’s acquisition and divestiture activities. During the period January 1, 2014 through June 29, 2014, these transaction-related expenses included recognition of share-based
38
compensation expense triggered upon a change in control, success-based investment banking fees, and other professional fees incurred in connection with the Business Combination.
Interest expense. Interest expense consists of interest paid to the Company’s lenders under its worldwide credit facilities and amortization of deferred financing costs.
Equity income. The Company maintains non-controlling interests in Asian joint ventures that are part of its finishing segment and records a proportional share in the earnings of these joint ventures as required by GAAP. The amount of equity income recorded is dependent upon the underlying financial results of the joint ventures. During the first quarter of 2014, the Company completed the sale of its equity interests in two of its joint ventures.
Gain from sale of joint ventures. During the first quarter of 2014, Jason completed the sale of its 50% equity interests in two Asian joint ventures for a total of $11.5 million and recorded a gain from sale of $3.5 million.
Other income-net. Other income is principally comprised of royalty income received from non-U.S. licensees, rental income from subleasing activities and public subsidies received in certain foreign locations.
Tax benefit. The Company’s tax (benefit) provision is impacted by a number of factors, including the amount of taxable earnings derived in foreign jurisdictions with tax rates that are different than the U.S. federal statutory rate, state tax rates in the jurisdictions where the Company does business, tax minimization planning and its ability to utilize various tax credits and net operating loss carryforwards. Income tax expense also includes the impact of provision to return adjustments, changes in valuation allowances and changes in reserve requirements for unrecognized tax benefits.
Accretion of preferred stock dividends and redemption premium. The Company records accretion of preferred stock dividends to reflect cumulative dividends on its preferred stock. The accretion amounts are subtracted from net income to arrive at the net income available to common shareholders for the purposes of calculating the Company’s net income per share available to common shareholders.
General Factors Affecting the Results of Continuing Operations
Foreign exchange. The Company has a significant portion of its operations outside of the U.S. As such, the results of the Company’s operations are based on currencies other than the U.S. dollar. Changes in foreign currency exchange rates influence its financial results, and therefore the ability to compare results between periods and segments.
Seasonality. The Company’s seating segment is subject to seasonal variation due to the markets it serves and the stocking requirements of its customers. The peak season has historically been during the period from November through May. Sales during these months are typically greater due to the shipments required to fill the inventory at retail stores and customer warehouses. There are, however, variations in the seasonal demands from year to year depending on weather, customer inventory levels, and model year changes. This seasonality and annual variations of this seasonality could impact the ability to compare results between time periods.
39
Consolidated Results of Operations
The following table sets forth our consolidated results of operations:
Successor | Predecessor | |||||||||||||||
Year Ended December 31, 2016 | Year Ended December 31, 2015 | June 30, 2014 Through December 31, 2014 | January 1, 2014 Through June 29, 2014 | |||||||||||||
(in thousands) | ||||||||||||||||
Net sales | $ | 705,519 | $ | 708,366 | $ | 325,335 | $ | 377,151 | ||||||||
Cost of goods sold | 573,917 | 561,076 | 270,676 | 294,175 | ||||||||||||
Gross profit | 131,602 | 147,290 | 54,659 | 82,976 | ||||||||||||
Selling and administrative expenses | 113,797 | 129,371 | 57,183 | 54,974 | ||||||||||||
Impairment charges | 63,285 | 94,126 | — | — | ||||||||||||
Loss on disposals of property, plant and equipment - net | 880 | 109 | 57 | 338 | ||||||||||||
Restructuring | 7,232 | 3,800 | 1,131 | 2,554 | ||||||||||||
Transaction-related expenses | — | 886 | 2,533 | 27,783 | ||||||||||||
Operating loss | (53,592 | ) | (81,002 | ) | (6,245 | ) | (2,673 | ) | ||||||||
Interest expense | (31,843 | ) | (31,835 | ) | (16,172 | ) | (7,301 | ) | ||||||||
Equity income | 681 | 884 | 381 | 831 | ||||||||||||
Gain from sale of joint ventures | — | — | — | 3,508 | ||||||||||||
Other income - net | 900 | 97 | 167 | 107 | ||||||||||||
Loss before income taxes | (83,854 | ) | (111,856 | ) | (21,869 | ) | (5,528 | ) | ||||||||
Tax benefit | (6,157 | ) | (22,255 | ) | (7,889 | ) | (573 | ) | ||||||||
Net loss | $ | (77,697 | ) | $ | (89,601 | ) | $ | (13,980 | ) | $ | (4,955 | ) | ||||
Less net loss attributable to noncontrolling interests | (10,818 | ) | (15,143 | ) | (2,362 | ) | — | |||||||||
Net loss attributable to Jason Industries | $ | (66,879 | ) | $ | (74,458 | ) | $ | (11,618 | ) | $ | (4,955 | ) | ||||
Accretion of preferred stock dividends and redemption premium | 3,600 | 3,600 | 1,810 | — | ||||||||||||
Net loss available to common shareholders of Jason Industries | $ | (70,479 | ) | $ | (78,058 | ) | $ | (13,428 | ) | $ | (4,955 | ) | ||||
Other financial data: (1)
Successor | Successor | |||||||||||||
(in thousands, except percentages) | Year Ended December 31, 2016 | Year Ended December 31, 2015 | Increase/(Decrease) | |||||||||||
$ | % | |||||||||||||
Consolidated | ||||||||||||||
Net sales | $ | 705,519 | $ | 708,366 | $ | (2,847 | ) | (0.4)% | ||||||
Adjusted EBITDA | 64,160 | 81,164 | (17,004 | ) | (21.0 | ) | ||||||||
Adjusted EBITDA % of net sales | 9.1 | % | 11.5 | % | (240) bps | |||||||||
Successor | Successor | Predecessor | Combined | ||||||||||||||||||||
Year Ended December 31, 2015 | June 30, 2014 Through December 31, 2014 | January 1, 2014 Through June 29, 2014 | Year Ended December 31, 2014 | Increase/(Decrease) | |||||||||||||||||||
(in thousands, except percentages) | $ | % | |||||||||||||||||||||
Consolidated | |||||||||||||||||||||||
Net sales | $ | 708,366 | $ | 325,335 | $ | 377,151 | $ | 702,486 | $ | 5,880 | 0.8 | % | |||||||||||
Adjusted EBITDA | 81,164 | 32,449 | 45,399 | 77,848 | 3,316 | 4.3 | |||||||||||||||||
Adjusted EBITDA % of net sales | 11.5 | % | 10.0 | % | 12.0 | % | 11.1 | % | 40 bps | ||||||||||||||
(1) | Adjusted EBITDA and Adjusted EBITDA as a % of net sales are financial measures that are not presented in accordance with GAAP. See “Key Measures the Company Uses to Evaluate Its Performance” below for our definition of Adjusted EBITDA and a reconciliation of Adjusted EBITDA to net income. |
40
Year ended December 31, 2016 (Successor) and the year ended December 31, 2015 (Successor)
Net sales. Net sales were $705.5 million for the year ended December 31, 2016, a decrease of $2.8 million, or 0.4%, compared with $708.4 million for the year ended December 31, 2015, reflecting decreased net sales in the components segment of $24.5 million and the seating segment of $15.7 million, partially offset by increased net sales in the acoustics segment of $31.9 million and the finishing segment of $5.5 million. See further discussion of segment results below.
On May 29, 2015, the Company acquired DRONCO. DRONCO’S results of operations are included within the finishing segment and the Company’s consolidated results of operations since the date of acquisition. For the years ended December 31, 2016 and 2015, $38.5 million and $24.1 million, respectively, of net sales from DRONCO were included in the Company’s consolidated statements of operations. See Note 3 to the consolidated financial statements for further discussion of the DRONCO acquisition.
Changes in foreign currency exchange rates compared with the U.S. dollar had a net negative impact of $3.9 million on consolidated net sales during the year ended December 31, 2016 compared with 2015, negatively impacting the finishing, seating, and acoustics segments’ net sales by $3.1 million, $0.7 million and $0.1 million, respectively. This was due principally to the strengthening of the U.S. dollar against the Euro and Mexican Peso during the year ended December 31, 2016.
Cost of goods sold. Cost of goods sold was $573.9 million for the year ended December 31, 2016, compared with $561.1 million for the year ended December 31, 2015. The increase in cost of goods sold was due to increased net sales in the acoustics and finishing segments, higher labor and material usage costs in the acoustics segment related to new platforms and operational inefficiencies, and sales mix within the seating segment. The increase was partially offset by decreased net sales in the seating and components segments, favorable raw material costs in the acoustics and components segments, and a $2.9 million favorable impact related to foreign currency exchange rates.
Gross profit. For the reasons described above, gross profit was $131.6 million for the year ended December 31, 2016, compared with $147.3 million for the year ended December 31, 2015.
Selling and administrative expenses. Selling and administrative expenses were $113.8 million for the year ended December 31, 2016, compared with $129.4 million for the year ended December 31, 2015.
The decrease was primarily due to reduced selling and administrative expenses resulting from the Company’s global cost reduction and restructuring program announced on March 1, 2016 of $7.3 million for the year ended December 31, 2016, decreased incentive compensation of $2.2 million for the year ended December 31, 2016, cost savings of $2.1 million from other spending controls within the seating, acoustics and components segments, and $5.9 million of severance and other expenses incurred in 2015 related to the transitions of the Company’s then Chief Executive Officer (“CEO”) and Chief Financial Officer (“CFO”). In addition, share-based compensation expense for the year ended December 31, 2016 decreased $8.7 million compared with the year ended December 31, 2015 due to a decrease in assumed vesting of Adjusted EBITDA Vesting Awards, a decrease in restricted stock units (“RSUs”) expense from accelerated vesting in 2015 related to the transition of the Company’s then CEO and CFO, and a decrease in Stock Price Vesting Awards expense due to completion of the service periods for the awards.
The decreases are partially offset by increased corporate expenses of $5.9 million, including $2.8 million of professional fees associated with supply chain consulting for the year ended December 31, 2016 and increased compensation expenses related to investments in management resources and talent, and $2.9 million of increased expenses at DRONCO related to the timing of the acquisition in May 2015 which resulted in five incremental months of expense in 2016. See further discussion of corporate expenses and segment results in the “Segment Financial Data” section below.
Impairment charges. Non-cash impairment charges for the year ended December 31, 2016 were $63.3 million, primarily relating to charges of $29.8 million and $33.2 million for the impairment of goodwill in the acoustics and components segments, respectively. See “Factors that Affect Operating Results - Key Events” in this MD&A and Note 8 “Goodwill and Other Intangible Assets” of the accompanying consolidated financial statements for further information.
Loss on disposals of property, plant and equipment—net. For the year ended December 31, 2016, the Company recognized a net loss on disposals of property, plant and equipment-net of $0.9 million, compared with $0.1 million for the year ended December 31, 2015. The loss on disposals of property, plant and equipment-net for the year ended December 31, 2016 relates primarily to a loss of $0.6 million on the sale of a seating segment facility. Changes in the level of property, plant and equipment disposals are dependent upon a number of factors, including changes in the level of asset sales, operational restructuring activities, and capital expenditure levels.
Restructuring. Restructuring costs were $7.2 million for the year ended December 31, 2016 compared to $3.8 million for the year ended December 31, 2015. During 2016, such costs related to severance actions in all segments resulting from the global cost reduction and restructuring program announced on March 1, 2016, including costs related to the closure of the components segment’s facility in Buffalo Grove, Illinois and the wind down of the finishing segment’s facility in São Bernardo
41
do Campo, Brazil. Included within the restructuring costs for the wind down of the Brazil facility are charges related to a loss contingency for certain employment matter claims. See Note 17 “Commitments and Contingencies” of the accompanying consolidated financial statements for further information.
During 2015, such costs related to the final closure of the acoustics segment’s Norwalk, Ohio facility, closure of the finishing segment’s Brooklyn Heights, Ohio office, closure of the components segment’s facility in China, and winding down of the finishing segment’s machine business in Sweden.
Transaction-related expenses. Transaction-related expenses were insignificant for the year ended December 31, 2016, compared with $0.9 million for the year ended December 31, 2015. During 2015, transaction-related expenses primarily consisted of professional service fees associated with the 2015 acquisition of DRONCO.
Interest expense. Interest expense was $31.8 million for both the year ended December 31, 2016 and 2015. See “Senior Secured Credit Facilities” in the Liquidity and Capital Resources section of this MD&A for further discussion.
Equity income. Equity income was $0.7 million for the year ended December 31, 2016, compared with $0.9 million for the year ended December 31, 2015.
Other income —net. Other income was $0.9 million for the year ended December 31, 2016, compared with $0.1 million for the year ended December 31, 2015. During 2016, other income-net consisted of certain rental and royalty income streams as well as other one-time transactions within our finishing segment.
Loss before income taxes. For the reasons described above, loss before income taxes was $83.9 million for year ended December 31, 2016 compared with $111.9 million for the year ended December 31, 2015.
Tax benefit. The tax benefit was $6.2 million for the year ended December 31, 2016, compared with $22.3 million for the year ended December 31, 2015. The effective tax rate for the year ended December 31, 2016 was 7.3%, compared with 19.9% for the year ended December 31, 2015. The Company’s tax benefit is impacted by a number of factors, including, among others, the amount of taxable income or loss at the U.S. federal statutory rate, the amount of taxable earnings derived in foreign jurisdictions that all have tax rates lower than the U.S. federal statutory rate (primarily in Germany and Mexico), permanent items, state tax rates in jurisdictions where we do business and the ability to utilize various tax credits and net operating loss carry forwards to reduce income tax expense. The income tax benefit also includes the impact of provision to return adjustments, adjustments to valuation allowances and reserve requirements for unrecognized tax positions.
The 2016 effective tax rate of 7.3% differs from the U.S. federal statutory rate of 35.0% due primarily to the impact of non-deductible impairment charges recorded for the components and acoustics segments, the change in assertion regarding permanent reinvestment of earnings in our non-majority joint venture holding and increases in valuation allowances, partially offset by state tax benefits, the impact of lower foreign tax rates when compared to the U.S. federal statutory tax rate (primarily in Germany and Mexico) and a reduction in the reserve for uncertain tax positions as a result of the lapsing of the statute of limitations in one of the Company’s non U.S. tax jurisdictions. The change in assertion at the joint venture was driven by several factors. Prior to the second quarter of 2016, the Company had the ability and intent to block the payment of distributions; the Company changed its stance in the second quarter of 2016 to be open to joint venture distributions. This change coincided with the a re-evaluation of the joint venture partners during that quarter of the willingness and ability of the entity to distribute excess cash balances given the maturity, stability and revised growth expectations of the joint venture operations. The impact of this change in assertion was to reduce the income tax benefit for the year ended December 31, 2016 by $2.9 million.
The 2015 effective tax rate of 19.9% differs from the U.S. federal statutory rate of 35.0% due primarily to the impact of non-deductible impairment charges recorded for the seating segment, partially offset by state tax benefits and the impact of lower foreign tax rates when compared to the U.S. federal statutory tax rate.
See Note 14 in the consolidated financial statements for a complete reconciliation of the U.S. statutory tax rate to the effective tax rate and more information on tax events in 2016 and 2015 affecting each year’s respective tax rates.
Net loss. For the reasons described above, net loss was $77.7 million for the year ended December 31, 2016 compared with $89.6 million for the year ended December 31, 2015.
Net loss attributable to noncontrolling interests. Net loss attributable to noncontrolling interests was $10.8 million for the year ended December 31, 2016, compared with $15.1 million for the year ended December 31, 2015. Noncontrolling interests represent the Rollover Participants interest in JPHI. See Notes 2, 11 and 19 to the consolidated financial statements for further discussion.
Adjusted EBITDA. For the year ended December 31, 2016, Adjusted EBITDA was $64.2 million, or 9.1% of net sales, a decrease of $17.0 million, or 21.0%, compared with $81.2 million, or 11.5% of net sales, in the year ended December 31, 2015. The decrease reflects decreased Adjusted EBITDA in the components segment of $6.7 million, the seating segment of
42
$3.6 million, the finishing segment of $1.6 million and the acoustics segment of $0.3 million, and higher corporate expenses of $4.8 million. See “Segment Financial Data” within Item 7, “Management’s Discussion and Analysis,” for further discussion on Adjusted EBITDA for each segment.
Changes in foreign currency exchange rates compared with the U.S dollar had a negative impact of $0.6 million on consolidated Adjusted EBITDA for the year ended December 31, 2016 compared with year ended December 31, 2015, negatively impacting both the finishing segment’s and corporate’s Adjusted EBITDA by $0.3 million.
Other Comprehensive Loss. Other comprehensive loss was $6.5 million for the year ended December 31, 2016 compared with $11.3 million for the year ended December 31, 2015. The change was driven by the impact of foreign currency translation adjustments, the net change in unrealized gains (losses) on cash flow hedges and employee retirement plan adjustments. Foreign currency translation adjustments are based on fluctuations in the value of foreign currencies (primarily the Euro and Mexican Peso) against the U.S. Dollar each period.
Employee retirement plan adjustments was a loss of $0.6 million for the year ended December 31, 2016, compared with a gain of $0.5 million for the year ended December 31, 2015. The employee retirement plan adjustments are based on actuarial valuations using a December 31 measurement date that include key assumptions regarding discount rates, expected returns on plan assets, retirement and mortality rates, future compensation increases, and health care cost trend rates. The employee retirement plan loss for the year ended December 31, 2016 primarily related to actuarial losses recognized in a UK pension plan within our finishing segment related to decreasing discount rates. The employee retirement plan gain for the year ended December 31, 2015 primarily related to actuarial gains recognized in a UK pension plan in our finishing segment and a US plan in our components segment related to decreasing discount rates.
The net change in unrealized losses on cash flow hedges is based on the changes in current interest rates and market expectations of the timing and amount of future interest rate changes. In the fourth quarter of 2015, the Company entered into the forward starting interest rate swap agreements discussed in Note 9, “Debt and Hedging Instruments”. Subsequent to entering into these arrangements, actual interest rate increases have been lower and have occurred later than expected, thereby, resulting in losses associated with these hedging instruments.
Year Ended December 31, 2015 (Successor), and the periods June 30, 2014 through December 31, 2014 (Successor), January 1, 2014 through June 29, 2014 (Predecessor)
Net sales. Net sales were $708.4 million for the year ended December 31, 2015, an increase of 5.9 million, or 0.8%, compared with $702.5 million in the combined year ended December 31, 2014, reflecting increased net sales in the seating segment of $4.9 million and increased net sales in the finishing segment of $3.8 million, partially offset by decreased net sales in the components segment of $2.1 million and decreased net sales in the acoustics segment of $0.7 million. See below for a further discussion of segment results below. Changes in consolidated sales levels throughout our segments in both periods are principally the result of changes in volume as net price changes were not significant.
On May 29, 2015, The Company acquired DRONCO. DRONCO’S results of operations are included within the finishing segment and the Company’s consolidated results of operations since the date of acquisition. Net sales from DRONCO were $24.1 million during the year ended December 31, 2015. See Note 3 to the consolidated financial statements for further discussion of the DRONCO acquisition.
Changes in foreign currency exchange rates compared with the U.S. dollar had a net negative impact of $25.2 million on consolidated net sales during the year ended December 31, 2015 compared with 2014, negatively impacting the finishing, acoustics, and seating segments’ net sales by $18.9 million, $5.2 million, and $1.1 million, respectively. This change was due principally to changes in exchange rates of the U.S. dollar against the Euro during the year ended December 31, 2015.
Cost of goods sold. Cost of goods sold was $561.1 million for the year ended December 31, 2015, compared with $270.7 million for the period June 30, 2014 through December 31, 2014, and was $294.2 million for the period January 1, 2014 through June 29, 2014. The decrease during the year ended December 31, 2015 compared to the combined year ended December 31, 2014 was primarily attributable to improved operational efficiencies in the acoustics segment, favorable product mix and material pricing in the acoustics and components segments, and a $18.2 million favorable impact related to foreign currency exchange rates, partially offset by operational inefficiencies in the seating segment and $7.4 million of incremental depreciation expense resulting from recognizing property, plant, and equipment at fair value in acquisition accounting for the Business Combination.
Gross profit. For the reasons described above, gross profit was $147.3 million for the year ended December 31, 2015, compared with $54.7 million for the period June 30, 2014 through December 31, 2014 and $83.0 million for the period January 1, 2014 through June 29, 2014.
Selling and administrative expenses. Selling and administrative expenses were $129.4 million for the year ended December 31, 2015, compared with $57.2 million for the period June 30, 2014 through December 31, 2014 and $55.0 million
43
for the period January 1, 2014 through June 29, 2014. For the year ended December 31, 2015, the Company incurred $8.0 million of share based compensation expense, which includes $2.9 million of expense due to accelerated vesting of restricted stock units related to the transitions of the Company’s then CEO and CFO, compared with $4.1 million of share-based compensation expense during the period June 30, 2014 through December 31, 2014. Selling and administrative expenses for the year ended December 31, 2015 include $0.5 million and $4.1 million of incremental depreciation and amortization expense, respectively, compared with 2014 primarily resulting from recognizing property, plant, and equipment and identifiable intangible assets at fair value in acquisition accounting for the Business Combination. During the year ended December 31, 2015, selling and administrative expenses included $5.9 million of severance and other expenses related to the transitions of the Company’s then CEO and CFO.
Impairment charges. Non-cash impairment charges for the year ended December 31, 2015 were $94.1 million, which includes charges of $58.8 million, $27.7 million, $6.8 million, and $0.8 million related to impairment of goodwill, customer relationships, trademarks, and patents intangible assets, respectively, in the seating segment. See “Factors that Affect Operating Results - Key Events” in this MD&A and Note 8 “Goodwill and Other Intangible Assets” of the accompanying consolidated financial statements for further information.
Loss on disposals of fixed assets—net. For the year ended December 31, 2015, the Company recognized a net loss on disposals of fixed assets of $0.1 million, compared with $0.1 million for the period June 30, 2014 through December 31, 2014 and $0.3 million for the period January 1, 2014 through June 29, 2014. Changes in the level of fixed asset disposals are dependent upon a number of factors, including changes in the level of asset sales, operational restructuring activities, and capital expenditure levels.
Restructuring. Restructuring costs were $3.8 million for the year ended December 31, 2015 compared to $1.1 million for the period June 30, 2014 through December 31, 2013 and $2.6 million for the period January 1, 2014 through June 29, 2014. The charge in the year ended December 31, 2015 was primarily due to the final closure costs associated with the acoustics segment manufacturing facility in Norwalk, closure of the finishing segment’s Brooklyn Heights, Ohio office, closure of the components segment’s facility in China, and the winding down of the finishing segment’s machine business in Sweden. During 2014, such costs primarily related to the closure of the acoustics segment’s Norwalk, Ohio facility.
Transaction-related expenses. For the year ended December 31, 2015, transaction-related expenses were $0.9 million compared with $2.5 million for the period June 30, 2014 through December 31, 2014 and $27.8 million for the period January 1, 2014 through June 29, 2014. Transaction-related expenses primarily consisted of professional service fees associated with the acquisition of DRONCO in 2015, compared with transaction related expenses related to the Business Combination in 2014.
Interest expense. Interest expense was $31.8 million for the year ended December 31, 2015, compared with $16.2 million for the period June 30, 2014 through December 31, 2014 and $7.3 million for the period January 1, 2014 through June 29, 2014. Interest expense in 2015 reflects the Company’s new level of debt following the consummation of the Business Combination, as well as increased foreign debt related to the Company’s acquisition of DRONCO. See “Senior Secured Credit Facilities” in the Liquidity and Capital Resources section of this MD&A for further discussion.
Equity income. Equity income was $0.9 million for the year ended December 31, 2015 compared with $0.4 million for the period June 30, 2014 through December 31, 2014 and $0.8 million for the period January 1, 2014 through June 29, 2014.
Gain from sale of joint ventures. During the first quarter of 2014, Jason completed the sale of its 50% equity interests in two Asian joint ventures for a total of $11.5 million and recorded a gain on sale of $3.5 million.
Other income —net. Other income was $0.1 million for the year ended December 31, 2015 compared with $0.2 million for the period June 30, 2014 through December 31, 2014 and $0.1 million for the period January 1, 2014 through June 29, 2014.
Loss before income taxes. For the reasons described above, loss before income taxes was $111.9 million for the year ended December 31, 2015 compared with $21.9 million for the period June 30, 2014 through December 31, 2014 and $5.5 million for the period January 1, 2014 through June 29, 2014.
Tax benefit. The tax benefit was $22.3 million for the year ended December 31, 2015 compared with $7.9 million for the period June 30, 2014 through December 31, 2014 and $0.6 million for the period January 1, 2014 through June 29, 2014. The Company’s tax benefit is impacted by a number of factors, including, among others, the amount of taxable income or loss at the U.S. federal statutory rate, the amount of taxable earnings derived in foreign jurisdictions that all have tax rates lower than the U.S. federal statutory rate (primarily in Germany and Mexico), permanent items, state tax rates in jurisdictions where we do business and the ability to utilize various tax credits and net operating loss carry forwards to reduce income tax expense. The income tax benefit also includes the impact of provision to return adjustments, adjustments to valuation allowances and reserve requirements for unrecognized tax positions.
44
The 2015 effective tax rate of 19.9% differs from the U.S. federal statutory rate of 35.0% due primarily to the impact of non-deductible impairment charges recorded for the seating segment, partially offset by state tax benefits and the impact of lower foreign tax rates when compared to the U.S. federal statutory tax rate (primarily in Germany and Mexico).
The effective tax rate for the predecessor period January 1, 2014 through June 29, 2014 of 10.4% differs from the U.S. federal statutory rate of 35.0% due primarily to non-deductible transaction costs related to the acquisition of DRONCO and the U.S. taxation of foreign earnings related to the sale of a non-majority owned joint venture. The impact of these items was partially offset by a reduction in the reserve for uncertain tax positions and lower foreign tax rates when compared to the U.S. federal statutory rate (primarily in Germany and Mexico). The effective tax rate for the successor period June 30, 2014 through December 31, 2014 of 36.1% differs from the U.S. federal statutory rate of 35.0% due primarily to the impact of an increase in the reserve for uncertain tax positions, partially offset by state tax benefits and the impact of lower foreign tax rates when compared to the U.S. federal statutory tax rate (primarily in Germany and Mexico).
See Note 14 in the consolidated financial statements for a complete reconciliation of the U.S. statutory tax rate to the effective tax rate and more information on tax events in 2015 and combined 2014 affecting each year’s respective tax rates.
Net loss. For the reasons described above, net loss was $89.6 million for the year ended December 31, 2015 compared with $14.0 million for the period June 30, 2014 through December 31, 2014 and $5.0 million for the period January 1, 2014 through June 29, 2014.
Net loss attributable to noncontrolling interests. Net loss attributable to noncontrolling interests was $15.1 million for the year ended December 31, 2015. Net loss attributable to noncontrolling interests was $2.4 million for the period June 30, 2014 through December 31, 2014. Noncontrolling interests represent the Rollover Participants interest in JPHI. See Note 2 to the consolidated financial statements for further discussion.
Adjusted EBITDA. For the year ended December 31, 2015, Adjusted EBITDA was $81.2 million, or 11.5% of net sales, an increase of $3.3 million, or 4.3%, compared with $77.8 million, or 11.1% of net sales, in the year ended December 31, 2014, reflecting increased Adjusted EBITDA of $8.9 million and $3.7 million in the acoustics and components segments, respectively, offset by decreased Adjusted EBITDA of $6.2 million, $2.6 million, and $0.5 million in the seating, corporate, and finishing segments, respectively.
Changes in foreign currency exchange rates compared with the U.S dollar had a negative impact of $2.7 million on consolidated Adjusted EBITDA compared with 2014, negatively impacting the finishing, acoustics, and seating segments’ Adjusted EBITDA by $2.3 million, $0.4 million, and $0.1 million, respectively.
Other Comprehensive Loss. Other comprehensive loss was $11.3 million for the year ended December 31, 2015, compared with $14.5 million for the period June 30, 2014 through December 31, 2014 and $1.7 million for the period January 1, 2014 through June 29, 2014. The change was driven by the impact of foreign currency translation adjustments, the net change in unrealized gains (losses) on cash flow hedges and employee retirement plan adjustments. Foreign currency translation adjustments are based on fluctuations in the value of foreign currencies (primarily the Euro and Mexican Peso) against the U.S. Dollar each period.
Employee retirement plan adjustments resulted in a gain of $0.5 million for the year ended December 31, 2015, compared with a loss of $1.7 million for the period June 30, 2014 through December 31, 2014 and a loss of $0.7 million for the period January 1, 2014 through June 29, 2014. The employee retirement plan adjustments are based on actuarial valuations using a December 31 measurement date that include key assumptions regarding discount rates, expected returns on plan assets, retirement and mortality rates, future compensation increases, and health care cost trend rates. The employee retirement plan gain for the year ended December 31, 2015 primarily related to actuarial gains recognized in a UK pension plan in our finishing segment and a US plan in our components segment related to increasing discount rates. The employee retirement plan losses in 2014 primarily related to actuarial losses recognized in both a UK and Germany pension plan in our finishing segment and a US plan in our components segment related to decreasing discount rates.
The net change in unrealized losses on cash flow hedges is based on the changes in current interest rates and market expectations of the timing and amount of future interest rate changes. In the fourth quarter of 2015, the Company entered into the forward starting interest rate swap agreements discussed in Note 9, “Debt and Hedging Instruments”. Subsequent to entering into these arrangements, actual interest rate increases have been lower and have occurred later than expected, thereby, resulting in losses associated with these hedging instruments.
Key Measures the Company Uses to Evaluate Its Performance
EBITDA and Adjusted EBITDA. The Company uses “Adjusted EBITDA” as the primary measure of profit or loss for the purposes of assessing the operating performance of its segments. The Company defines EBITDA as net income (loss) before interest expense, income tax provision (benefit), depreciation and amortization. The Company defines Adjusted EBITDA as EBITDA, excluding the impact of operational restructuring charges and non-cash or non-operational losses or
45
gains, including goodwill and long-lived asset impairment charges, gains or losses on disposal of property, plant and equipment, integration and other operational restructuring charges, transactional legal fees, other professional fees, purchase accounting adjustments, and non-cash share based compensation expense.
Management believes that Adjusted EBITDA provides a clear picture of the Company’s operating results by eliminating expenses and income that are not reflective of the underlying business performance. The Company uses this metric to facilitate a comparison of the Company’s operating performance on a consistent basis from period to period and to analyze the factors and trends affecting its segments. The Company’s internal plans, budgets and forecasts use Adjusted EBITDA as a key metric and the Company uses this measure to evaluate its operating performance and segment operating performance and to determine the level of incentive compensation paid to its employees.
The Senior Secured Credit Facilities (defined in Note 9 and below) definition of EBITDA excludes income of partially owned affiliates, unless such earnings have been received in cash.
Set forth below is a reconciliation of Adjusted EBITDA to net loss (in thousands) (unaudited):
Successor | Predecessor | |||||||||||||||
Year Ended December 31, 2016 | Year Ended December 31, 2015 | June 30, 2014 Through December 31, 2014 | January 1, 2014 Through June 29, 2014 | |||||||||||||
Net loss | (77,697 | ) | $ | (89,601 | ) | $ | (13,980 | ) | $ | (4,955 | ) | |||||
Tax benefit | (6,157 | ) | (22,255 | ) | (7,889 | ) | (573 | ) | ||||||||
Interest expense | 31,843 | 31,835 | 16,172 | 7,301 | ||||||||||||
Depreciation and amortization | 43,546 | 45,248 | 20,375 | 12,852 | ||||||||||||
EBITDA | (8,465 | ) | (34,773 | ) | 14,678 | 14,625 | ||||||||||
Adjustments: | ||||||||||||||||
Impairment charges(1) | 63,285 | 94,126 | — | — | ||||||||||||
Restructuring(2) | 7,232 | 3,800 | 1,131 | 2,554 | ||||||||||||
Transaction-related expenses(3) | — | 886 | 2,533 | 27,783 | ||||||||||||
Integration and other restructuring costs(4) | 1,980 | 9,047 | 9,921 | 3,040 | ||||||||||||
Sponsor fees(5) | — | — | — | 567 | ||||||||||||
Gain from sale of joint ventures(6) | — | — | — | (3,508 | ) | |||||||||||
Share-based compensation(7) | (752 | ) | 7,969 | 4,129 | — | |||||||||||
Loss on disposals of property, plant and equipment - net (8) | 880 | 109 | 57 | 338 | ||||||||||||
Total adjustments | 72,625 | 115,937 | 17,771 | 30,774 | ||||||||||||
Adjusted EBITDA | $ | 64,160 | $ | 81,164 | $ | 32,449 | $ | 45,399 | ||||||||
(1) | Charges for the year ended December 31, 2016, primarily relate to non-cash impairment of goodwill of $29.8 million and $33.2 million in the acoustics and components segments, respectively. Charges for the year ended December 31, 2015, represents non-cash impairment charges of $58.8 million, $27.7 million, $6.8 million, and $0.8 million related to impairment of goodwill, customer relationships, trademarks and patents intangible assets, respectively, in the seating segment. See “Factors that Affect Operating Results - Key Events” in this MD&A and Note 8 “Goodwill and Other Intangible Assets” of the accompanying consolidated financial statements for further information. |
(2) | Restructuring includes costs associated with exit or disposal activities as defined by GAAP related to facility consolidation, including one-time employee termination benefits, costs to close facilities and relocate employees, and costs to terminate contracts other than capital leases. See Note 5, “Restructuring Costs” of the accompanying consolidated financial statements for further information. |
(3) | Transaction-related expenses primarily consist of professional service fees related to the DRONCO acquisition, the Business Combination and other related transactions, as well as the Company’s acquisition and divestiture activities. |
(4) | In 2016, integration and other restructuring costs includes costs associated with the start-up of new acoustics segment facilities in Warrensburg, Missouri and Richmond, Indiana. Additionally, integration and other restructuring costs in 2016 includes a $0.6 million reversal of a reserve related to the Newcomerstown fire recorded in acquisition accounting for the business combination in 2014 and $0.7 million of charges recorded to reduce inventory balances to estimated net realizable value. Such costs are not included in restructuring for GAAP purposes. In 2015, integration and other restructuring costs also includes $5.9 million of severance and expenses related to the transitions of the Company’s then CEO and CFO, partially offset by a $0.8 million gain resulting from termination of an unfavorable lease recorded in acquisition accounting for the Business Combination. During |
46
the period June 30, 2014 through December 31, 2014, integration and other restructuring costs includes $5.8 million of increased inventory costs recognized in cost of goods sold resulting from recording inventory at fair value in acquisition accounting for the Business Combination.
(5) | Represents fees and expenses paid by Jason to Saw Mill Capital LLC and Falcon Investment Advisors, LLC under the Management Services Agreement, dated September 21, 2010. See Note 18, “Related Party Transactions” of the accompanying consolidated financial statements for further information. |
(6) | Represents the gain on sale of the 50% equity interests in two joint ventures that was completed during the first quarter of 2014. See Note 4 “Sale of Joint Ventures” of the accompanying consolidated financial statements for further information. |
(7) | Represents non-cash share based compensation expense for awards under the Company’s 2014 Omnibus Incentive Plan. During 2016, share based compensation included $2.5 million of income due to a decrease in assumed vesting levels of Adjusted EBITDA Vesting Awards. In 2015, share based compensation included $2.9 million of expense due to accelerated vesting of restricted stock units related to the transitions of the Company’s then CEO and CFO. See Note 12, “Share Based Compensation “ of the accompanying consolidated financial statements for further information. |
(8) | Loss on disposals of property, plant and equipment - net for the year ended December 31, 2016 includes a loss of $0.6 million on sale of a seating segment facility. Prior year amounts in this line item have been reclassified from the calculation of EBITDA to adjustments to adjusted EBITDA to conform with the current year’s presentation. |
Adjusted EBITDA percentage of sales. Adjusted EBITDA as a percentage of sales is an important metric that the Company uses to evaluate its operational effectiveness and business segments.
Segment Financial Data
The table below presents the Company’s net sales, Adjusted EBITDA and Adjusted EBITDA as a percentage of net sales for each of its reportable segments for the years ended December 31, 2016 and 2015. The Company uses Adjusted EBITDA as the primary measure of profit or loss for purposes of assessing the operating performance of its segments. See “Key Measures the Company Uses to Evaluate Its Performance” above for our definition of Adjusted EBITDA and a reconciliation of the Company’s consolidated Adjusted EBITDA to net loss, which is the most comparable GAAP measure.
Successor | Successor | |||||||||||||
Year Ended December 31, 2016 | Year Ended December 31, 2015 | Increase/(Decrease) | ||||||||||||
(in thousands, except percentages) | $ | % | ||||||||||||
Seating | ||||||||||||||
Net sales | $ | 161,050 | $ | 176,792 | $ | (15,742 | ) | (8.9 | )% | |||||
Adjusted EBITDA | 16,122 | 19,766 | (3,644 | ) | (18.4 | ) | ||||||||
Adjusted EBITDA % of net sales | 10.0 | % | 11.2 | % | (120) bps | |||||||||
Finishing | ||||||||||||||
Net sales | $ | 196,883 | $ | 191,394 | $ | 5,489 | 2.9 | % | ||||||
Adjusted EBITDA | 24,200 | 25,799 | (1,599 | ) | (6.2 | ) | ||||||||
Adjusted EBITDA % of net sales | 12.3 | % | 13.5 | % | (120) bps | |||||||||
Acoustics | ||||||||||||||
Net sales | $ | 249,919 | $ | 218,047 | $ | 31,872 | 14.6 | % | ||||||
Adjusted EBITDA | 27,202 | 27,515 | (313 | ) | (1.1 | ) | ||||||||
Adjusted EBITDA % of net sales | 10.9 | % | 12.6 | % | (170) bps | |||||||||
Components | ||||||||||||||
Net sales | $ | 97,667 | $ | 122,133 | $ | (24,466 | ) | (20.0 | )% | |||||
Adjusted EBITDA | 14,249 | 20,943 | (6,694 | ) | (32.0 | ) | ||||||||
Adjusted EBITDA % of net sales | 14.6 | % | 17.1 | % | (250) bps | |||||||||
Corporate | ||||||||||||||
Adjusted EBITDA | $ | (17,613 | ) | $ | (12,859 | ) | $ | (4,754 | ) | (37.0 | )% | |||
Consolidated | ||||||||||||||
Net sales | $ | 705,519 | $ | 708,366 | $ | (2,847 | ) | (0.4 | )% | |||||
Adjusted EBITDA | 64,160 | 81,164 | (17,004 | ) | (21.0 | ) | ||||||||
Adjusted EBITDA % of net sales | 9.1 | % | 11.5 | % | (240) bps | |||||||||
47
The table below presents the Company’s net sales, Adjusted EBITDA and Adjusted EBITDA as a percentage of net sales for each of its reportable segments for the years ended December 31, 2015 and 2014.
Successor | Successor | Predecessor | Combined | ||||||||||||||||||||
Year Ended December 31, 2015 | June 30, 2014 Through December 31, 2014 | January 1, 2014 Through June 29, 2014 | Year Ended December 31, 2014 | Increase/(Decrease) | |||||||||||||||||||
(in thousands, except percentages) | $ | % | |||||||||||||||||||||
Seating | |||||||||||||||||||||||
Net sales | $ | 176,792 | $ | 67,033 | $ | 104,878 | $ | 171,911 | $ | 4,881 | 2.8 | % | |||||||||||
Adjusted EBITDA | 19,766 | 8,337 | 17,668 | 26,005 | (6,239 | ) | (24.0 | ) | |||||||||||||||
Adjusted EBITDA % of net sales | 11.2 | % | 12.4 | % | 16.8 | % | 15.1 | % | (390) bps | ||||||||||||||
Finishing | |||||||||||||||||||||||
Net sales | $ | 191,394 | $ | 90,895 | $ | 96,692 | $ | 187,587 | $ | 3,807 | 2.0 | % | |||||||||||
Adjusted EBITDA | 25,799 | 12,542 | 13,732 | 26,274 | (475 | ) | (1.8 | ) | |||||||||||||||
Adjusted EBITDA % of net sales | 13.5 | % | 13.8 | % | 14.2 | % | 14.0 | % | (50) bps | ||||||||||||||
Acoustics | |||||||||||||||||||||||
Net sales | $ | 218,047 | $ | 108,807 | $ | 109,930 | $ | 218,737 | $ | (690 | ) | (0.3 | )% | ||||||||||
Adjusted EBITDA | 27,515 | 8,912 | 9,676 | 18,588 | 8,927 | 48.0 | |||||||||||||||||
Adjusted EBITDA % of net sales | 12.6 | % | 8.2 | % | 8.8 | % | 8.5 | % | 410 bps | ||||||||||||||
Components | |||||||||||||||||||||||
Net sales | $ | 122,133 | $ | 58,600 | $ | 65,651 | $ | 124,251 | $ | (2,118 | ) | (1.7 | )% | ||||||||||
Adjusted EBITDA | 20,943 | 6,921 | 10,324 | 17,245 | 3,698 | 21.4 | |||||||||||||||||
Adjusted EBITDA % of net sales | 17.1 | % | 11.8 | % | 15.7 | % | 13.9 | % | 320 bps | ||||||||||||||
Corporate | |||||||||||||||||||||||
Adjusted EBITDA | $ | (12,859 | ) | $ | (4,263 | ) | $ | (6,001 | ) | $ | (10,264 | ) | $ | (2,595 | ) | (25.3 | )% | ||||||
Consolidated | |||||||||||||||||||||||
Net sales | $ | 708,366 | $ | 325,335 | $ | 377,151 | $ | 702,486 | $ | 5,880 | 0.8 | % | |||||||||||
Adjusted EBITDA | 81,164 | 32,449 | 45,399 | 77,848 | 3,316 | 4.3 | |||||||||||||||||
Adjusted EBITDA % of net sales | 11.5 | % | 10.0 | % | 12.0 | % | 11.1 | % | 40 bps | ||||||||||||||
Seating Segment | ||||||||||||||
Successor | Successor | |||||||||||||
Year Ended December 31, 2016 | Year Ended December 31, 2015 | Increase/(Decrease) | ||||||||||||
(in thousands, except percentages) | $ | % | ||||||||||||
Net sales | $ | 161,050 | $ | 176,792 | $ | (15,742 | ) | (8.9 | )% | |||||
Adjusted EBITDA | 16,122 | 19,766 | (3,644 | ) | (18.4 | ) | ||||||||
Adjusted EBITDA % of net sales | 10.0 | % | 11.2 | % | (120) bps | |||||||||
For the year ended December 31, 2016, net sales were $161.1 million, a decrease of $15.7 million, or (8.9)%, compared with $176.8 million for the year ended December 31, 2015. On a constant currency basis (net negative currency impact of $0.7 million for the year ended December 31, 2016), revenues decreased by $15.0 million for the year ended December 31, 2016. The decrease in net sales is primarily due to decreases in volume in the motorcycle, turf care and construction markets as well as lower pricing, partially offset by a volume increase in the power sports market.
For the year ended December 31, 2016, Adjusted EBITDA was $16.1 million (10.0% of net sales), a decrease of $3.6 million, or 18.4%, compared to $19.8 million (11.2% of net sales) for the year ended December 31, 2015. Changes in foreign currency exchange rates did not significantly impact Adjusted EBITDA. The decrease in Adjusted EBITDA was primarily due to lower sales volumes, lower pricing, unfavorable sales mix with lower margin generating products and operational inefficiencies resulting in higher material usage and lower labor productivity. The decrease was partially offset by savings in selling and administrative expenses resulting from the Company’s global cost reduction program and other spend controls.
48
Successor | Successor | Predecessor | Combined | ||||||||||||||||||||
Year Ended December 31, 2015 | June 30, 2014 Through December 31, 2014 | January 1, 2014 Through June 29, 2014 | Year Ended December 31, 2014 | Increase/(Decrease) | |||||||||||||||||||
(in thousands, except percentages) | $ | % | |||||||||||||||||||||
Net sales | $ | 176,792 | $ | 67,033 | $ | 104,878 | $ | 171,911 | $ | 4,881 | 2.8 | % | |||||||||||
Adjusted EBITDA | 19,766 | 8,337 | 17,668 | 26,005 | (6,239 | ) | (24.0 | ) | |||||||||||||||
Adjusted EBITDA % of net sales | 11.2 | % | 12.4 | % | 16.8 | % | 15.1 | % | (390) bps | ||||||||||||||
For the year ended December 31, 2015, net sales were $176.8 million, an increase of $4.9 million, or 2.8%, compared with $171.9 million for the combined year ended December 31, 2014. On a constant currency basis (net negative currency impact of $1.1 million for the year ended December 31, 2015), revenues increased by $6.0 million for the year ended December 31, 2015. The increase in net sales is primarily due to increases in volume in the motorcycle, power sports, and construction and agriculture markets, partially offset by lower net sales to customers in the turf care market.
For the year ended December 31, 2015, Adjusted EBITDA was $19.8 million (11.2% of net sales), a decrease of $6.2 million, or 24.0%, compared to $26.0 million (15.1% of net sales) for the combined year ended December 31, 2014. Adjusted EBITDA decreased primarily due to operational inefficiencies including higher material usage and labor, higher material and freight costs, a $1.0 million charge for increased excess obsolete inventory reserves, and higher selling and administrative costs, partially offset by an increase in net sales.
Finishing Segment | ||||||||||||||
Successor | Successor | |||||||||||||
Year Ended December 31, 2016 | Year Ended December 31, 2015 | Increase/(Decrease) | ||||||||||||
(in thousands, except percentages) | $ | % | ||||||||||||
Net sales | $ | 196,883 | $ | 191,394 | $ | 5,489 | 2.9 | % | ||||||
Adjusted EBITDA | 24,200 | 25,799 | (1,599 | ) | (6.2 | ) | ||||||||
Adjusted EBITDA % of net sales | 12.3 | % | 13.5 | % | (120) bps | |||||||||
For the year ended December 31, 2016, net sales were $196.9 million, an increase of $5.5 million or 2.9%, compared with $191.4 million for the year ended December 31, 2015. On a constant currency basis (net negative currency impact of $3.1 million for the year ended December 31, 2016), revenues increased by $8.6 million for the year ended December 31, 2016. The increase in net sales resulted from the May 2015 acquisition of DRONCO, which had net sales of $38.5 million during the year ended December 31, 2016 compared to $24.1 million during the year ended December 31, 2015, partially offset by lower volumes in industrial end markets globally.
Adjusted EBITDA decreased $1.6 million, or 6.2%, for the year ended December 31, 2016 to $24.2 million (12.3% of net sales) compared to $25.8 million (13.5% of net sales) for the year ended December 31, 2015. On a constant currency basis (net negative currency impact of $0.3 million for the year ended December 31, 2016), Adjusted EBITDA decreased by $1.3 million for the year ended December 31, 2016. The decrease in Adjusted EBITDA for the year ended December 31, 2016 primarily resulted from lower sales volumes in industrial end markets, unfavorable product mix when compared with 2015 and operational inefficiencies resulting in higher labor costs and material usage, partially offset by savings in selling and administrative expenses resulting from the Company’s global cost reduction program. The decrease in Adjusted EBITDA as a percentage of net sales for the year ended December 31, 2016 was additionally impacted by lower Adjusted EBITDA margins related to DRONCO.
Successor | Successor | Predecessor | Combined | ||||||||||||||||||||
Year Ended December 31, 2015 | June 30, 2014 Through December 31, 2014 | January 1, 2014 Through June 29, 2014 | Year Ended December 31, 2014 | Increase/(Decrease) | |||||||||||||||||||
(in thousands, except percentages) | $ | % | |||||||||||||||||||||
Net sales | $ | 191,394 | $ | 90,895 | $ | 96,692 | $ | 187,587 | $ | 3,807 | 2.0 | % | |||||||||||
Adjusted EBITDA | 25,799 | 12,542 | 13,732 | 26,274 | (475 | ) | (1.8 | ) | |||||||||||||||
Adjusted EBITDA % of net sales | 13.5 | % | 13.8 | % | 14.2 | % | 14.0 | % | (50) bps | ||||||||||||||
For the year ended December 31, 2015, net sales were $191.4 million, an increase of $3.8 million or 2.0%, compared to $187.6 million for the combined year ended December 31, 2014. On a constant currency basis (net negative currency impact of $18.9 million for the year ended December 31, 2015), revenues increased by $22.7 million for the year ended December 31, 2015. The increase in net sales excluding the impact of foreign currency primarily resulted from the acquisition of DRONCO, which had net sales of $24.1 million during the year ended December 31, 2015 from the date of acquisition. Excluding the impact of foreign currency and the acquisition of DRONCO, net sales decreased $1.4 million, primarily due to lower volumes in general industrial end markets in North America and Europe.
49
For the year ended December 31, 2015, Adjusted EBITDA was $25.8 million (13.5% of net sales), a decrease of $0.5 million or 1.8%, compared to $26.3 million (14.0% of net sales) for the combined year ended December 31, 2014. On a constant currency basis (net negative currency impact of $2.3 million for the year December 31, 2015), Adjusted EBITDA increased by $1.8 million for the year ended December 31, 2015. The decrease in Adjusted EBITDA as a percentage of net sales for the year ended December 31, 2015 primarily resulted from lower Adjusted EBITDA margins related to DRONCO, unfavorable product mix in 2015, and lower equity income from Asian joint ventures. Adjusted EBITDA as a percentage of net sales was also unfavorably impacted by $1.2 million of transaction gains in 2014 related to U.S. Dollar accounts held in European entities that did not recur in 2015.
Acoustics Segment | ||||||||||||||
Successor | Successor | |||||||||||||
Year Ended December 31, 2016 | Year Ended December 31, 2015 | Increase/(Decrease) | ||||||||||||
(in thousands, except percentages) | $ | % | ||||||||||||
Net sales | $ | 249,919 | $ | 218,047 | $ | 31,872 | 14.6 | % | ||||||
Adjusted EBITDA | 27,202 | 27,515 | (313 | ) | (1.1 | ) | ||||||||
Adjusted EBITDA % of net sales | 10.9 | % | 12.6 | % | (170) bps | |||||||||
For the year ended December 31, 2016, net sales were $249.9 million, an increase of $31.9 million, or 14.6%, compared with $218.0 million for the year ended December 31, 2015. On a constant currency basis (net negative currency impact of $0.1 million for the year ended December 31, 2016), revenues increased by $32.0 million for the year ended December 31, 2016. The increase in net sales for the year ended December 31, 2016 was due to higher volumes resulting from new platform awards with higher content per vehicle in North America and additional sales volume resulting from a competitor bankruptcy, partially offset by lower pricing on existing platforms.
For the year ended December 31, 2016, Adjusted EBITDA was $27.2 million (10.9% of net sales), compared to $27.5 million (12.6% of net sales) for the year ended December 31, 2015. Changes in foreign currency exchange rates did not significantly impact Adjusted EBITDA. The decrease in Adjusted EBITDA for the year ended December 31, 2016 was primarily due to operational inefficiencies resulting in higher labor costs and material usage and lower pricing on existing platforms, partially offset by higher volumes on new platforms, lower raw material costs and savings in selling and administrative expenses resulting from the Company’s global cost reduction program, lower incentive compensation expense and other spend controls.
Successor | Successor | Predecessor | Combined | ||||||||||||||||||||
Year Ended December 31, 2015 | June 30, 2014 Through December 31, 2014 | January 1, 2014 Through June 29, 2014 | Year Ended December 31, 2014 | Increase/(Decrease) | |||||||||||||||||||
(in thousands, except percentages) | $ | % | |||||||||||||||||||||
Net sales | $ | 218,047 | $ | 108,807 | $ | 109,930 | $ | 218,737 | $ | (690 | ) | (0.3 | )% | ||||||||||
Adjusted EBITDA | 27,515 | 8,912 | 9,676 | 18,588 | 8,927 | 48.0 | |||||||||||||||||
Adjusted EBITDA % of net sales | 12.6 | % | 8.2 | % | 8.8 | % | 8.5 | % | 410 bps | ||||||||||||||
For the year ended December 31, 2015, net sales were $218.0 million, a decrease of $0.7 million, or 0.3%, compared to $218.7 million for the combined year ended December 31, 2014. On a constant currency basis (net negative currency impact of $5.2 million for the year ended December 31, 2015), revenues increased by $4.5 million for the year ended December 31, 2015. The increase in net sales (on a constant currency basis) for the year ended December 31, 2015 was primarily due to higher volumes on new platforms launched in the fourth quarter of 2015, partially offset by unfavorable changes in the mix of North American vehicles produced compared with 2014 and short-term automotive assembly plant shut downs in 2015.
For the year ended December 31, 2015, Adjusted EBITDA was $27.5 million (12.6% of net sales), compared to $18.6 million (8.5% of net sales) for the combined year ended December 31, 2014. The increases in Adjusted EBITDA and Adjusted EBITDA as a percentage of net sales for the year ended December 31, 2015 were primarily due to improved operational efficiencies resulting in lower direct labor, raw material usage, and overhead, as well as lower material costs, partially offset by higher selling and administrative expenses.
50
Components Segment | ||||||||||||||
Successor | Successor | |||||||||||||
Year Ended December 31, 2016 | Year Ended December 31, 2015 | Increase/(Decrease) | ||||||||||||
(in thousands, except percentages) | $ | % | ||||||||||||
Net sales | $ | 97,667 | $ | 122,133 | $ | (24,466 | ) | (20.0 | )% | |||||
Adjusted EBITDA | 14,249 | 20,943 | (6,694 | ) | (32.0 | ) | ||||||||
Adjusted EBITDA % of net sales | 14.6 | % | 17.1 | % | (250) bps | |||||||||
For the year ended December 31, 2016, net sales were $97.7 million, a decrease of $24.5 million, or 20.0%, compared with $122.1 million for the year ended December 31, 2015. The decrease was primarily due to lower sales volumes of rail, general industrial, perforated, and expanded metal products and lower pricing of metal products resulting from lower raw material costs.
For the year ended December 31, 2016, Adjusted EBITDA was $14.2 million (14.6% of net sales), compared with $20.9 million (17.1% of net sales) for the year ended December 31, 2015. The decrease in Adjusted EBITDA of $6.7 million was primarily due to lower sales volumes and lower labor productivity on the decreased sales volumes, partially offset by lower raw material pricing and savings in selling and administrative expenses resulting from the Company’s global cost reduction program and other spend controls.
Successor | Successor | Predecessor | Combined | ||||||||||||||||||||
Year Ended December 31, 2015 | June 30, 2014 Through December 31, 2014 | January 1, 2014 Through June 29, 2014 | Year Ended December 31, 2014 | Increase/(Decrease) | |||||||||||||||||||
(in thousands, except percentages) | $ | % | |||||||||||||||||||||
Net sales | $ | 122,133 | $ | 58,600 | $ | 65,651 | $ | 124,251 | $ | (2,118 | ) | (1.7 | )% | ||||||||||
Adjusted EBITDA | 20,943 | 6,921 | 10,324 | 17,245 | 3,698 | 21.4 | |||||||||||||||||
Adjusted EBITDA % of net sales | 17.1 | % | 11.8 | % | 15.7 | % | 13.9 | % | 320 bps | ||||||||||||||
For the year ended December 31, 2015, net sales were $122.1 million, a decrease of $2.1 million, or 1.7%, compared to $124.3 million for the combined year ended December 31, 2014. During the year ended December 31, 2015, the net sales decrease was primarily due to lower volumes and pricing of smart utility meters and general industrial metal products, partially offset by increases in sales volumes of rail car metal components.
For the year ended December 31, 2015, Adjusted EBITDA was $20.9 million (17.1% of net sales), compared with $17.2 million (13.9% of net sales) for the combined year ended December 31, 2014. The increase in Adjusted EBITDA and Adjusted EBITDA as a percentage of net sales during the year ended December 31, 2015 was primarily due to improved operating efficiencies resulting in lower material usage, favorable mix of higher margin products, and lower raw material pricing compared with the prior year end, partially offset by a decrease in smart utility meter sales volumes and pricing and higher selling and administrative expenses.
Corporate | ||||||||||||||
Successor | Successor | |||||||||||||
Year Ended December 31, 2016 | Year Ended December 31, 2015 | Increase/(Decrease) | ||||||||||||
(in thousands, except percentages) | $ | % | ||||||||||||
Adjusted EBITDA | $ | (17,613 | ) | $ | (12,859 | ) | $ | (4,754 | ) | (37.0 | )% | |||
Corporate expense is principally comprised of the costs of corporate operations, including the compensation and benefits of the Company’s executive team and personnel responsible for treasury, finance, insurance, legal, information technology, corporate development, human resources, tax planning and the administration of employee benefits. Corporate expense also includes third party legal, audit, tax and other professional fees and expenses, board of directors compensation and expenses, and the operating costs of the corporate office.
The increase of $4.8 million in corporate expense for the year ended December 31, 2016 primarily resulted from $2.8 million of increased third-party professional fees associated with investments in manufacturing and supply chain improvement initiatives, as well as increased compensation expenses related to investments in management resources and talent, offset by reduced incentive compensation expense.
51
Successor | Successor | Predecessor | Combined | ||||||||||||||||||||
Year Ended December 31, 2015 | June 30, 2014 Through December 31, 2014 | January 1, 2014 Through June 29, 2014 | Year Ended December 31, 2014 | Increase/(Decrease) | |||||||||||||||||||
(in thousands, except percentages) | $ | % | |||||||||||||||||||||
Adjusted EBITDA | $ | (12,859 | ) | $ | (4,263 | ) | $ | (6,001 | ) | $ | (10,264 | ) | $ | (2,595 | ) | (25.3 | )% | ||||||
The increase of $2.6 million in corporate expense for the year ended December 31, 2015 primarily resulted from increased third-party professional fees associated with investments in strategic initiatives and operational improvement initiatives. Increased costs associated with the transition to the Company becoming a public company on June 30, 2014 impacted the first half of 2015, including additional personnel costs, board of director compensation and expenses, third party professional fees and public filing-related expenses.
Quarterly Results of Operations (unaudited)
The following tables presenting our quarterly results of operations should be read in conjunction with the consolidated financial statements and related notes included in Item 8 of this Annual Report on Form 10-K. We have prepared the unaudited information on the same basis as our audited consolidated financial statements. Our operating results for any quarter are not necessarily indicative of results for any future quarters or for a full year.
The following table presents our unaudited quarterly results of operations for the eight quarters in fiscal 2016 and fiscal 2015. This table includes all adjustments, consisting only of normal recurring adjustments, that we consider necessary for fair statement of our consolidated financial position and operating results for the quarters presented.
Successor | |||||||||||||||||||
1Q | 2Q | 3Q | 4Q | Full Year | |||||||||||||||
(in thousands, except percentages) | 2016 | 2016 | 2016 | 2016 | 2016 | ||||||||||||||
Net sales | $ | 190,974 | $ | 185,687 | $ | 170,108 | $ | 158,750 | $ | 705,519 | |||||||||
Gross profit | 37,891 | 37,156 | 30,979 | 25,576 | 131,602 | ||||||||||||||
Net loss | (3,016 | ) | (2,370 | ) | (2,452 | ) | (69,859 | ) | (77,697 | ) | |||||||||
Less net loss attributable to noncontrolling interests | (510 | ) | (400 | ) | (415 | ) | (9,493 | ) | (10,818 | ) | |||||||||
Net loss attributable to Jason Industries | (2,506 | ) | (1,970 | ) | (2,037 | ) | (60,366 | ) | (66,879 | ) | |||||||||
Accretion of preferred stock dividends and redemption premium | 900 | 900 | 900 | 900 | 3,600 | ||||||||||||||
Net loss available to common shareholders of Jason Industries | $ | (3,406 | ) | $ | (2,870 | ) | $ | (2,937 | ) | $ | (61,266 | ) | $ | (70,479 | ) | ||||
Net loss per share available to common shareholders of Jason Industries: | |||||||||||||||||||
Basic and diluted | $ | (0.15 | ) | $ | (0.13 | ) | $ | (0.13 | ) | $ | (2.69 | ) | $ | (3.13 | ) | ||||
Weighted average number of common shares outstanding: | |||||||||||||||||||
Basic and diluted | 22,388 | 22,395 | 22,499 | 22,758 | 22,507 | ||||||||||||||
Successor | |||||||||||||||||||
1Q | 2Q | 3Q | 4Q | Full Year | |||||||||||||||
(in thousands, except percentages) | 2015 | 2015 | 2015 | 2015 | 2015 | ||||||||||||||
Net sales | $ | 175,836 | $ | 187,578 | $ | 171,174 | $ | 173,778 | $ | 708,366 | |||||||||
Gross profit | 38,947 | 41,624 | 35,441 | 31,278 | 147,290 | ||||||||||||||
Net loss | (894 | ) | (865 | ) | (3,176 | ) | (84,666 | ) | (89,601 | ) | |||||||||
Less net loss attributable to noncontrolling interests | (151 | ) | (146 | ) | (537 | ) | (14,309 | ) | (15,143 | ) | |||||||||
Net loss attributable to Jason Industries | (743 | ) | (719 | ) | (2,639 | ) | (70,357 | ) | (74,458 | ) | |||||||||
Accretion of preferred stock dividends and redemption premium | 900 | 900 | 900 | 900 | 3,600 | ||||||||||||||
Net loss available to common shareholders of Jason Industries | $ | (1,643 | ) | $ | (1,619 | ) | $ | (3,539 | ) | $ | (71,257 | ) | $ | (78,058 | ) | ||||
Net loss per share available to common shareholders of Jason Industries: | |||||||||||||||||||
Basic and diluted | $ | (0.07 | ) | $ | (0.07 | ) | $ | (0.16 | ) | $ | (3.20 | ) | $ | (3.53 | ) | ||||
Weighted average number of common shares outstanding: | |||||||||||||||||||
Basic and diluted | 21,991 | 22,011 | 22,161 | 22,289 | 22,145 | ||||||||||||||
52
Liquidity and Capital Resources
Background
The Company’s primary sources of liquidity are cash generated from its operations, available cash and borrowings under its U.S. and foreign credit facilities. As of December 31, 2016, the Company had $40.9 million of available cash, $35.0 million of additional borrowings available under the revolving credit facility portion of its U.S. credit agreement, and $13.4 million available under short-term revolving loan facilities that the Company maintains outside the U.S. As of December 31, 2016, available borrowings under its U.S. revolving credit facility were reduced by outstanding letters of credit of $5.0 million. Included in the Company’s consolidated cash balance of $40.9 million at December 31, 2016, is cash of $19.0 million held at the Company’s non-U.S. operations. These funds, with some restrictions and tax implications, are available for repatriation as deemed necessary or advisable by the Company. The Company’s U.S. credit agreement and foreign revolving loan facilities are available for working capital requirements, capital expenditures and other general corporate purposes. We believe our existing cash on hand, expected future cash flows from operating activities, and additional borrowings available under our U.S. and foreign credit facilities will provide sufficient resources to fund ongoing operating requirements as well as future capital expenditures, debt service requirements, and investments in future growth to create value for our shareholders.
As of December 31, 2015, the Company had $35.9 million of available cash, $35.4 million of additional borrowings available under the revolving credit facility portion of its U.S. credit agreement, and $10.8 million available under short-term revolving loan facilities that the Company maintains outside the U.S. As of December 31, 2015, available borrowings under its U.S. revolving credit facility were reduced by outstanding letters of credit of $4.6 million. Included in the Company’s consolidated cash balance of $35.9 million at December 31, 2015, was $21.4 million of cash held at Jason’s non-U.S. operations.
Indebtedness
In connection with the consummation of the Business Combination, all indebtedness under Jason’s previous credit agreement was repaid in full and the Company entered into the New Credit Agreements (defined below). Non-U.S. debt was not repaid in connection with the Business Combination. See the section entitled “Senior Secured Credit Facilities” for further information on the New Credit Agreements.
As of December 31, 2016, the Company’s total outstanding indebtedness of $425.1 million was comprised of aggregate term loans outstanding under its Senior Secured Credit Facilities of $400.5 million (net of a debt discount of $5.0 million and deferred financing costs of $7.5 million), various foreign bank term loans and revolving loan facilities of $23.3 million and capital lease obligations of $1.3 million. No amounts were outstanding under the revolving credit facility portion of the Senior Secured Credit Facilities as of December 31, 2016.
As of December 31, 2015, the Company’s total outstanding indebtedness of $432.3 million was comprised of aggregate term loans outstanding under its Senior Secured Credit Facilities of $401.0 million (net of a debt discount of $6.0 million and deferred financing costs of $9.1 million), various foreign bank term loans and revolving loan facilities of $29.7 million and capital lease obligations of $1.6 million. No amounts were outstanding under the revolving credit facility portion of the Senior Secured Credit Facilities as of December 31, 2015.
The Company maintains various bank term loan and revolving loan facilities outside the U.S. for local operating and investing needs. Borrowings under these facilities totaled $23.3 million as of December 31, 2016, including borrowings of $21.5 million incurred by the Company’s subsidiaries in Germany, and borrowings totaling $29.7 million as of December 31, 2015, including borrowings of $27.6 million incurred by the Company’s subsidiaries in Germany.
In connection with the acquisition of DRONCO, the Company assumed $11.0 million of debt comprised of term loan borrowings totaling $8.5 million and revolving line of credit borrowings totaling $2.5 million. Borrowings bear interest at fixed and variable rates ranging from 2.3% to 4.6% and are subject to repayment in varying amounts through 2030. During 2015, the Company entered into a new $13.5 million term loan in Germany. Borrowings bear interest at a fixed rate of 2.25% and are subject to repayment in equal quarterly payments of approximately $0.4 million beginning September 30, 2017 through June 30, 2025. Certain of the Company’s foreign borrowings contain financial covenants requiring maintenance of a minimum equity ratio and maximum leverage ratio, among others. The Company was in compliance with these covenants as of December 31, 2016.
Senior Secured Credit Facilities
General. In connection with the consummation of the Business Combination on June 30, 2014, Jason Incorporated, as the borrower, entered into (i) the First Lien Credit Agreement, dated as of June 30, 2014, with Jason Partners Holdings Inc., Jason Holdings, Inc. I, a wholly-owned subsidiary of Jason Partners Holdings Inc. (“Intermediate Holdings”), Deutsche Bank AG New York Branch, as administrative agent (the “First Lien Administrative Agent”), the subsidiary guarantors party thereto
53
and the several banks and other financial institutions or entities from time to time party thereto (the “New First Lien Credit Agreement”) and (ii) the Second Lien Credit Agreement, dated as of June 30, 2014, with Jason Partners Holdings Inc., Intermediate Holdings, Deutsche Bank AG New York Branch, as administrative agent (the “Second Lien Administrative Agent”), the subsidiary guarantors party thereto and the several banks and other financial institutions or entities from time to time party thereto (the “New Second Lien Credit Agreement” and, together with the First Lien Credit Agreement, the “New Credit Agreements”).
The New First Lien Credit Agreement provides for (i) term loans in an aggregate principal amount of $310.0 million (the “First Lien Term Facility” and the loans thereunder the “First Lien Term Loans”), of which $303.0 million is outstanding as of December 31, 2016, and (ii) a revolving loan of up to $40.0 million (including revolving loans, a $10.0 million swingline loan sublimit, and a $12.5 million letter of credit sublimit) (the “Revolving Credit Facility”), in each case under the new first lien senior secured loan facilities (the “First Lien Credit Facilities”). The New Second Lien Credit Agreement provides for term loans in an aggregate principal amount of $110.0 million under the new second lien senior secured term loan facility (the “Second Lien Term Facility” and the loans thereunder the “Second Lien Term Loans” and, the Second Lien Term Facility together with the First Lien Credit Facilities, the “Senior Secured Credit Facilities”). Substantially concurrently with the consummation of the Business Combination, the full amount of the first lien term loans and second lien term loans were drawn, and no revolving loans were drawn.
The First Lien Term Loans mature in 2021, the Revolving Credit Facility matures in 2019, and the Second Lien Term Loans mature in 2022. The principal amount of the First Lien Term Loans amortizes in quarterly installments equal to 0.25% of the original principal amount of the First Lien Term Loans, with the balance payable at maturity. Neither the Revolving Credit Facility nor the Second Lien Term Loans amortize, however each is repayable in full at maturity.
Security Interests. In connection with the Senior Secured Credit Facilities, Jason Partners Holdings Inc., Intermediate Holdings, Jason Incorporated and certain of Jason Incorporated’s subsidiaries (the “Subsidiary Guarantors”), entered into a (i) First Lien Security Agreement (the “First Lien Security Agreement”), dated as of June 30, 2014, in favor of the First Lien Administrative Agent and (ii) a Second Lien Security Agreement (the “Second Lien Security Agreement”, together with the First Lien Security Agreement, the “Security Agreements”), dated as of June 30, 2014, in favor of the Second Lien Administrative Agent. Pursuant to the Security Agreements, amounts borrowed under the Senior Secured Credit Facilities and any swap agreements and cash management arrangements provided by any lender party to the Senior Secured Credit Facilities or any of its affiliates are secured (i) with respect to the First Lien Credit Facilities, on a first priority basis and (ii) with respect to the Second Lien Term Facility, on a second priority basis, by a perfected security interest in substantially all of Jason Incorporated’s, Jason Partners Holdings Inc.’s, Intermediate Holdings’ and each Subsidiary Guarantor’s tangible and intangible assets (subject to certain exceptions), including U.S. registered intellectual property and all of the capital stock of each of Jason Incorporated’s direct and indirect wholly-owned material Restricted Subsidiaries (as defined in the New Credit Agreements) (limited, in the case of foreign subsidiaries, to 65% of the capital stock of first tier foreign subsidiaries). In addition, pursuant to the New Credit Agreements, Jason Partners Holdings Inc., Intermediate Holdings and the Subsidiary Guarantors guaranteed amounts borrowed under the Senior Secured Credit Facilities.
Interest Rate and Fees. At our election, the interest rate per annum applicable to the loans under the Senior Secured Credit Facilities is based on a fluctuating rate of interest determined by reference to either (i) a base rate determined by reference to the higher of (a) the “prime rate” of Deutsche Bank AG New York Branch, (b) the federal funds effective rate plus 0.50% and (c) the Eurocurrency rate applicable for an interest period of one month plus 1.00%, plus an applicable margin equal to (x) 3.50% in the case of the First Lien Term Loans, (y) 2.25% in the case of the Revolving Credit Facility or (z) 7.00% in the case of the Second Lien Term Loans or (ii) a Eurocurrency rate determined by reference to the London Interbank Offered Rate (“LIBOR”), adjusted for statutory reserve requirements, plus an applicable margin equal to (x) 4.50% in the case of the First Lien Term Loans, (y) 3.25% in the case of the Revolving Credit Facility or (z) 8.00% in the case of the Second Lien Term Loans. Borrowings under the First Lien Term Facility and Second Lien Term Facility are subject to a floor of 1.00% in the case of Eurocurrency loans. The applicable margin for loans under the Revolving Credit Facility may be subject to adjustment based upon Jason Incorporated’s consolidated first lien net leverage ratio.
Interest Rate Hedge Contracts. The Company is exposed to certain financial risks relating to fluctuations in interest rates. To manage exposure to such fluctuations, the Company entered into forward starting interest rate swap agreements (“Swaps”) in 2015 with notional values totaling $210.0 million at December 31, 2016 and December 31, 2015. The Swaps have been designated by the Company as cash flow hedges, and effectively fix the variable portion of interest rates on variable rate term loan borrowings at a rate of approximately 2.08% prior to financing spreads and related fees. The Swaps had a forward start date of December 30, 2016 and have an expiration date of June 30, 2020. As such, for the years ended December 31, 2016 and December 31, 2015, there was no interest expense recognized. The Company expects to recognize interest expense of $2.0 million related to the Swaps in 2017.
The fair values of the Company’s Swaps are recorded on the consolidated balance sheets with the corresponding offset recorded as a component of accumulated other comprehensive income (loss). The fair value of the Swaps totaled $2.0 million at
54
December 31, 2016 and $0.3 million at December 31, 2015, respectively. As of December 31, 2016, $1.9 million was recorded in other current liabilities and $0.1 million was recorded in other long-term liabilities in the consolidated balance sheets. As of December 31, 2015, $0.3 million was recorded in other long-term liabilities in the consolidated balance sheets.
Mandatory Prepayment. Subject to certain exceptions, the Senior Secured Credit Facilities are subject to mandatory prepayments in amounts equal to: (1) a percentage of the net cash proceeds from any non-ordinary course sale or other disposition of assets (including as a result of casualty or condemnation) by Jason Incorporated or any of its Restricted Subsidiaries (as defined in the New Credit Agreements) in excess of a certain amount and subject to customary reinvestment provisions and certain other exceptions; (2) 100% of the net cash proceeds from the issuance or incurrence of debt by Jason Incorporated or any of its Restricted Subsidiaries (other than indebtedness permitted by the Senior Secured Credit Facilities); and (3) 75% (with step-downs to 50%, 25% and 0% based upon achievement of specified consolidated first lien net leverage ratios under the First Lien Credit Facilities and specified consolidated total net leverage ratios under the Second Lien Term Facility) of annual excess cash flow, as defined, of Jason Incorporated and its Restricted Subsidiaries. With respect to the Second Lien Term Facility, any prepayments made on or after the second anniversary of the Closing Date, but prior to the third anniversary of the Closing Date, will be subject to a 1.00% prepayment premium. Other than the prepayment premiums and penalties described above and the payment of customary “breakage” costs, Jason Incorporated may voluntarily prepay outstanding loans at any time. Based on the provisions above, at December 31, 2016 a mandatory excess cash flow prepayment of $1.9 million was included within the current portion of long-term debt in the consolidated balance sheets.
Covenants. The Senior Secured Credit Facilities contain a number of customary affirmative and negative covenants that, among other things, limit or restrict the ability of Jason Incorporated and its Restricted Subsidiaries to: incur additional indebtedness (including guarantee obligations); incur liens; engage in mergers, consolidations, liquidations and dissolutions; sell assets; pay dividends and make other payments in respect of capital stock; make acquisitions, investments, loans and advances; pay and modify the terms of certain indebtedness; engage in certain transactions with affiliates; enter into negative pledge clauses and clauses restricting subsidiary distributions; and change its line of business, in each case, subject to certain limited exceptions.
In addition, under the Revolving Credit Facility, if the aggregate outstanding amount of all revolving loans, swingline loans and certain letter of credit obligations exceed 25 percent, or $10.0 million, of the revolving credit commitments at the end of any fiscal quarter, Jason Incorporated and its Restricted Subsidiaries will be required to not exceed a consolidated first lien net leverage ratio, currently specified at 5.25 to 1.00, with a periodic decrease to 4.50 to 1.00 on December 31, 2017 and remaining at that level thereafter. If such outstanding amounts do not exceed 25 percent of the revolving credit commitments at the end of any fiscal quarter, no financial covenants are applicable. As of December 31, 2016 the consolidated first lien net leverage ratio was 4.02 to 1.00 on a pro forma trailing twelve-month basis calculated in accordance with the respective provisions of the New Credit Agreements which exclude the Second Lien Term Loans from the calculation of net debt (numerator) and allow the inclusion of certain pro forma adjustments and exclusion of certain specified or nonrecurring costs and expenses in calculating Adjusted EBITDA (denominator). The aggregate outstanding amount of all revolving loans, swingline loans and certain letters of credit was less than 25 percent of revolving credit commitments at December 31, 2016. As of December 31, 2016, the Company was in compliance with the financial covenants contained in its credit agreements.
Events of Default. The Senior Secured Credit Facilities contain customary events of default, including nonpayment of principal, interest, fees or other amounts; material inaccuracy of a representation or warranty when made; violation of a covenant; cross-default to material indebtedness; bankruptcy events; inability to pay debts or attachment; material unsatisfied judgments; actual or asserted invalidity of any security document; and a change of control. Failure to comply with these provisions of the Senior Secured Credit Facilities (subject to certain grace periods) could, absent a waiver or an amendment from the lenders under such agreement, restrict the availability of the Revolving Credit Facility and permit the acceleration of all outstanding borrowings under the New Credit Agreements.
Series A Preferred Stock
Holders of the 45,899 shares of Series A Preferred Stock are entitled to receive, when, as and if declared by the Company’s Board of Directors, cumulative dividends at the rate of 8.0% per annum (the dividend rate) on the $1,000 liquidation preference per share of the Series A Preferred Stock, payable quarterly in arrears on each dividend payment date. Dividends shall be paid in cash or, at the Company’s option, in additional shares of Series A Preferred Stock or a combination thereof, and are payable on January 1, April 1, July 1, and October 1 of each year, commencing on the first such date after the date of the first issuance of the Series A Preferred Stock.
On January 1, 2016, the Company paid a dividend of $20.00 per share to holders of record on November 15, 2015, totaling $0.9 million. On April 1, 2016, the Company paid a dividend of $20.00 per share to holders of record on February 15, 2016, totaling $0.9 million. On July 1, 2016, the Company paid a dividend on the Series A Preferred Stock of $20.00 per share to holders of record on May 15, 2016, totaling $0.9 million. On October 1, 2016, the Company paid a dividend on the Series A Preferred Stock of $20.00 per share to holders of record on August 15, 2016, totaling $0.9 million. On December 15, 2016, the
55
Company announced a $20.00 per share dividend on its Series A Preferred Stock to be paid in additional shares of Series A Preferred Stock on January 1, 2017 to holders of record on November 15, 2016. As of December 31, 2016, the Company has recorded the 899 additional Series A Preferred Stock shares declared from the dividend for $0.9 million within preferred stock in the consolidated balance sheets.
Seasonality and Working Capital
The Company uses net operating working capital (“NOWC”), a non-GAAP measure, as a percentage of the previous twelve months of net sales as a key indicator of working capital management. The Company defines this metric as the sum of trade accounts receivable and inventories less trade accounts payable as a percentage of net sales. NOWC as a percentage of trailing twelve month net sales was 12.8% as of December 31, 2016 and 14.5% as of December 31, 2015. Set forth below is a table summarizing NOWC as of December 31, 2016 and December 31, 2015.
Successor | |||||||
(in thousands) | December 31, 2016 | December 31, 2015 | |||||
Accounts receivable—net | 77,837 | 79,088 | |||||
Inventories | 73,601 | 80,432 | |||||
Accounts payable | (61,160 | ) | (56,838 | ) | |||
NOWC | $ | 90,278 | $ | 102,682 | |||
In overall dollar terms, the Company’s NOWC is generally lower at the end of the calendar year due to reduced sales activity around the holiday season. NOWC generally peaks at the end of the first quarter as the Company experiences high seasonal demand from certain customers, particularly those serving the motor sports, lawn and garden equipment and small engine markets to fill the supply chain for the spring season. There are, however, variations in the seasonal demands from year to year depending on weather, customer inventory levels, and model year changes. The Company historically generates approximately 52-55% of sales in the first half of the year.
Short-Term and Long-Term Liquidity Requirements
The Company’s ability to make principal and interest payments on borrowings under its U.S. and foreign credit facilities and its ability to fund planned capital expenditures will depend on its ability to generate cash in the future, which, to a certain extent, is subject to general economic, financial, competitive, regulatory and other conditions. Based on its current level of operations, the Company believes that its existing cash balances and expected cash flows from operations will be sufficient to meet its operating requirements for at least the next 12 months from the date of filing. However, the Company may require borrowings under its credit facilities and alternative forms of financings or investments to achieve its longer-term strategic plans.
Historically, the Company’s capital expenditures have ranged between 2% and 3% of annual sales with year to year fluctuations caused by the nature and timing of specific capital projects. Capital expenditures totaled $19.8 million, or 2.8% of annual sales, for the year ended December 31, 2016. Capital expenditures for 2017 are expected to be approximately $17 million. The Company finances its annual capital requirements with funds generated from operations.
Warrant Repurchase
On May 6, 2014, Jason commenced a tender offer to purchase up to 9,200,000 of the Public Warrants at a purchase price of $0.75 per warrant, which was subsequently increased to $1.00 per warrant on June 18, 2014 and $1.50 per warrant on July 7, 2014, subject to certain conditions, including the consummation of the Business Combination. The warrant tender offer expired on July 18, 2014 and a total of 4.4 million warrants were validly tendered and not properly withdrawn for a total purchase price of approximately $6.6 million.
In February 2015, our Board of Directors authorized the purchase of up to $5 million of our outstanding warrants. Management is authorized to effect purchases from time to time in the open market or through privately negotiated transactions. There is no expiration date to this authority. No warrants were repurchased during the year ended December 31, 2016.
56
Consolidated Condensed Statements of Cash Flows for the Years Ended December 31, 2016 and December 31, 2015, the Period June 30, 2014 through December 31, 2014 (Successor), and the Period January 1, 2014 Through June 29, 2014 (Predecessor)
Successor | Predecessor | |||||||||||||||
Year Ended December 31, 2016 | Year Ended December 31, 2015 | June 30, 2014 Through December 31, 2014 | January 1, 2014 Through June 29, 2014 | |||||||||||||
(in thousands) | ||||||||||||||||
Cash flows provided by (used in) operating activities | $ | 35,117 | $ | 39,034 | $ | (7,606 | ) | $ | 4,241 | |||||||
Cash flows (used in) provided by investing activities | (16,453 | ) | (67,564 | ) | (505,004 | ) | 138 | |||||||||
Cash flows (used in) provided by financing activities | (12,843 | ) | 5,206 | 400,702 | 6,896 | |||||||||||
Effect of exchange rate changes on cash and cash equivalents | (904 | ) | (3,011 | ) | (2,890 | ) | (122 | ) | ||||||||
Net increase (decrease) in cash and cash equivalents | 4,917 | (26,335 | ) | (114,798 | ) | 11,153 | ||||||||||
Cash and cash equivalents, beginning of period | 35,944 | 62,279 | 177,077 | 16,318 | ||||||||||||
Cash and cash equivalents, end of period | $ | 40,861 | $ | 35,944 | $ | 62,279 | $ | 27,471 | ||||||||
Depreciation and amortization | $ | 43,546 | $ | 45,248 | $ | 20,375 | $ | 12,852 | ||||||||
Capital expenditures | $ | 19,780 | $ | 32,786 | $ | 15,359 | $ | 10,998 | ||||||||
Cash paid during the year for interest | $ | 28,717 | $ | 28,969 | $ | 15,399 | $ | 9,994 | ||||||||
Cash paid during the year for income taxes, net of refunds | $ | 7,163 | $ | 4,349 | $ | 2,682 | $ | 5,038 | ||||||||
Year Ended December 31, 2016 and Year Ended December 31, 2015
Cash Flows Provided by Operating Activities
Cash flows provided by operating activities totaled $35.1 million for the year ended December 31, 2016 compared to $39.0 million for the year ended December 31, 2015. The cash flows provided by operating activities were primarily the result of the net loss of $77.7 million adjusted for non-cash items of $30.6 million related to depreciation, $12.9 million related to amortization of intangible assets, $3.0 million related to amortization of deferred financing costs and debt discounts, $63.3 million of impairment charges, and $0.9 million of losses on disposal of property, plant and equipment, as well as $2.1 million of cash dividends received from joint ventures. These changes were partially offset by $0.7 million in equity income, changes in deferred taxes of $14.0 million, and $0.8 million of share-based compensation. As compared to net loss adjusted for non-cash items and the dividends received from joint ventures for the year ended December 31, 2015, this resulted in decreased cash flows provided by operating activities of $12.1 million. Changes in working capital increased operating cash flow by $15.4 million for the year ended December 31, 2016 compared to $7.3 million for the year ended December 31, 2015, driven by business levels and working capital reduction actions across business segments.
Cash Flows Used in Investing Activities
Cash flows used in investing activities totaled $16.5 million for the year ended December 31, 2016 compared to $67.6 million for the year ended December 31, 2015. The decrease in cash flows used in investing activities was primarily the result of the acquisition of DRONCO in 2015 for $34.4 million, net of cash acquired, compared with cash proceeds of $3.4 million from the sale of property, plant, and equipment (mostly due to sale of a building in the seating segment) in 2016, as well as decreased capital expenditures.
Cash Flows (Used in) Provided by Financing Activities
Cash flows used in financing activities were $12.8 million for the year ended December 31, 2016 compared to cash flows provided by financing activities of $5.2 million for the year ended December 31, 2015. The change in cash flows was primarily due to increased payments on other long-term debt and lower proceeds from borrowings, as additional debt was acquired in 2015 with the acquisition of DRONCO.
Depreciation and Amortization
Depreciation and amortization totaled $43.5 million for the year ended December 31, 2016, compared with $45.2 million for the year ended December 31, 2015. Depreciation and amortization is slightly lower for the year ended December 31, 2016 as a result of lower amortization due to the impairment of certain seating segment intangible assets during the fourth quarter of 2015, partially offset by higher depreciation due to capital expenditures and the acquisition of DRONCO.
Capital Expenditures
Capital expenditures for property, plant, and equipment totaled $19.8 million for the year ended December 31, 2016, compared with $32.8 million for the year ended December 31, 2015. Capital expenditures were lower in 2016 compared with 2015 primarily due to an acoustics manufacturing facility in Richmond, Indiana completed in 2015.
57
Cash Paid for Interest
Cash paid for interest totaled $28.7 million for the year ended December 31, 2016 and $29.0 million for the year ended December 31, 2015.
Cash Paid for Income Taxes
Cash paid for income taxes net of refunds totaled $7.2 million for the year ended December 31, 2016 and $4.3 million for the year ended December 31, 2015.
Year Ended December 31, 2015 (Successor) and the Period June 30, 2014 through December 31, 2014 (Successor) and the Period January 1, 2014 Through June 29, 2014 (Predecessor)
Cash Flows Provided by (Used in) Operating Activities
Cash flows provided by operating activities totaled $39.0 million for the year ended December 31, 2015 primarily due to the net loss of $89.6 million adjusted for non-cash items of $31.2 million related to depreciation, $14.1 million related to amortization of intangible assets, $94.1 million of impairment charges, $8.0 million of share-based compensation, $3.0 million related to amortization of deferred financing costs and debt discounts, partially offset by changes in deferred taxes of $28.2 million. Changes in working capital increased operating cash flow by $7.3 million during the year ended December 31, 2015.
In the period June 30, 2014 through December 31, 2014, cash flows used in operating activities were $7.6 million. The cash flows used in operating activities were significantly impacted by (i) a net loss of $14.0 million and (ii) payments of $9.8 million of accrued transaction costs and professional fees incurred by Quinpario Acquisition Corp. related to the Business Combination and other potential acquisitions that were not consummated and were paid upon consummation of the Business Combination, (iii) partially offset by a net increase in cash due to changes in working capital of $0.3 million.
In the period January 1, 2014 through June 29, 2014, cash flows provided by operating activities were $4.2 million. The cash flows provided by operating activities were significantly impacted by (i) a net loss of $5.0 million and (ii) increases of $16.8 million of accrued transaction costs and professional fees incurred by Jason related to the Business Combination and paid upon consummation of the Business Combination, (iii) partially offset by a net decrease in cash due to changes in working capital of $19.4 million.
Cash Flows (Used in) Provided by Investing Activities
Cash flows used in investing activities totaled $67.6 million for the year ended December 31, 2015, and were primarily the result of the acquisition of DRONCO in 2015 for $34.4 million, net of cash acquired, and capital expenditures of $32.8 million.
In the period June 30, 2014 through December 31, 2014, cash flows used in investing activities were $505.0 million. The cash flows used in investing activities were primarily the result of the acquisition of Jason for $489.2 million, net of $11.0 million of cash acquired, and capital expenditures for the acquisition of property, plant, and equipment of $15.4 million.
In the period January 1, 2014 through June 29, 2014, cash flows provided by investing activities were $0.1 million. The cash flows provided by investing activities were primarily the result of $11.5 million of proceeds from the sale of two of the Company’s joint ventures in Asia, partially offset by capital expenditures for the acquisition of property, plant, and equipment of $11.0 million.
Cash Flows Provided by Financing Activities
Cash flows provided by financing activities were $5.2 million for the year ended December 31, 2015 primarily due to proceeds from foreign debt, net of payments on long-term debt and preferred stock dividends.
In the period June 30, 2014 through December 31, 2014, cash flows provided by financing activities were$400.7 million. The cash flows provided by financing activities were primarily the result of (i) net proceeds from the First Lien Term Loans and Second Lien Term Loans on our new Senior Secured Credit Facility of $412.5 million and (ii) net proceeds from issuance of preferred stock of $42.5 million, partially offset by (iii) common stock redemptions of $26.1 million, (iv) debt issuance costs of $13.1 million, (v) payments for warrants tendered of $6.6 million, (vi) payments of deferred underwriters fees of $5.2 million related to the Company’s initial public offering, and (vii) payments of preferred stock dividends of $0.9 million.
In the period January 1, 2014 through June 29, 2014, cash flows provided by financing activities were $6.9 million. The cash flows provided by financing activities were primarily the result of net proceeds from U.S. revolving loans of $11.0 million, partially offset by net payments of other long-term debt of $2.5 million and U.S. term loan payments of $1.2 million.
58
Depreciation and Amortization
Depreciation and amortization totaled $45.2 million for the year ended December 31, 2015, compared with $20.4 million and $12.9 million for the period June 30, 2014 through December 31, 2014 and the period January 1, 2014 through June 29, 2014, respectively. Depreciation and amortization are significantly higher for the year ended December 31, 2015 as compared to the prior periods as a result of the Company recognizing property, plant, and equipment and identifiable assets at fair value in acquisition accounting for the Business Combination.
Capital Expenditures
Capital expenditures for property, plant, and equipment totaled $32.8 million for the year ended December 31, 2015, compared with $15.4 million and $11.0 million for the period June 30, 2014 through December 31, 2014 and the period January 1, 2014 through June 29, 2014, respectively. Capital expenditures increased during 2015 due to construction of a new acoustics manufacturing facility in Richmond, Indiana.
Cash Paid for Interest
Cash paid for interest totaled $29.0 million, $15.4 million, and $10.0 million for the year ended December 31, 2015, the period June 30, 2014 through December 31, 2014 and the period January 1, 2014 through June 29, 2014, respectively.
Cash Paid for Income Taxes
Cash paid for income taxes net of refunds totaled $4.3 million, $2.7 million, and $5.0 million for the year ended December 31, 2015, the period June 30, 2014 through December 31, 2014 and the period January 1, 2014 through June 29, 2014, respectively.
Commitments and Contractual Obligations
The following table presents the Company’s commitments and contractual obligations as of December 31, 2016, as well as its long-term obligations (in thousands):
Payments Due by Period | ||||||||||||||||||||
Total | 2017 | 2018-2019 | 2020-2021 | Thereafter | ||||||||||||||||
Long-term debt obligations under U.S. credit agreement | $ | 413,025 | $ | 5,027 | $ | 6,200 | $ | 293,725 | $ | 108,073 | ||||||||||
Other long-term debt obligations | 23,303 | 2,719 | 7,025 | 4,892 | 8,667 | |||||||||||||||
Interest payments on long-term debt obligations(1) | 144,796 | 29,954 | 59,589 | 49,374 | 5,879 | |||||||||||||||
Capital lease obligations(2) | 1,301 | 433 | 600 | 268 | — | |||||||||||||||
Operating lease obligations(3) | 50,567 | 9,557 | 15,499 | 13,102 | 12,409 | |||||||||||||||
Purchase obligations(4) | 4,568 | 4,568 | — | — | — | |||||||||||||||
Multiemployer and UK pension obligations(5) | 3,575 | 369 | 738 | 738 | 1,730 | |||||||||||||||
Total before other long-term liabilities | $ | 641,135 | $ | 52,627 | $ | 89,651 | $ | 362,099 | $ | 136,758 | ||||||||||
Other long-term liabilities(6) | 16,306 | |||||||||||||||||||
Total | $ | 657,441 | ||||||||||||||||||
(1) | Amounts represent the expected cash payments of interest expense on all long-term debt obligations and were calculated using interest rates in place as of December 31, 2016 and assuming that the underlying debt obligations will be repaid in accordance with their terms. |
(2) | Amounts represent the expected cash payments of capital lease obligations. |
(3) | Operating leases represent the minimum rental commitments under non-cancelable operating leases. |
(4) | The Company routinely issues purchase orders to numerous vendors for inventory and other supplies. These purchase orders are generally cancelable with reasonable notice to the vendor, and as such, are excluded from the obligations table. |
(5) | Represent contributions required with respect to the former Morton multiemployer pension plan as a result of the withdrawal from the plan and required contributions to the pension plan in the UK. |
(6) | Other long-term liabilities primarily consist of obligations for uncertain tax positions, pension obligations, postretirement health and other benefits, insurance accruals and other accruals. Other than payments required with respect to the former Morton multiemployer pension plan and a pension plan in the UK, the Company is unable to determine the ultimate timing of these liabilities and, therefore, no payment amounts were included in the “payments due by period” portion of the contractual obligations table. |
59
Off-Balance Sheet Arrangements
The Company leases certain machinery, transportation equipment and office, warehouse and manufacturing facilities under various operating lease agreements. Under most arrangements, the Company pays the property taxes, insurance, maintenance and expenses related to the leased property. See Note 10, “Lease Obligations”, in the notes to the consolidated financial statements and the “Contractual Obligations” table above for further information.
The Company had outstanding letters of credit totaling $5.0 million, $4.6 million, and $4.0 million as of December 31, 2016, 2015 and 2014, respectively, the majority of which secure self-insured workers compensation liabilities.
Critical Accounting Policies and Estimates
The preparation of financial statements in conformity with GAAP requires management to make estimates and assumptions that affect the reported amounts of assets and liabilities at the date of the financial statements and the reported amounts of revenues and expenses during the reporting period. The Company evaluates its estimates on an ongoing basis, based on historical experience and on various other assumptions that are believed to be reasonable under the circumstances. The following policies are considered by management to be the most critical in understanding the judgments that are involved in the preparation of our consolidated financial statements and the uncertainties that could impact our results of operations, financial position and cash flows. Application of these accounting policies involves the exercise of judgment and use of assumptions as to future uncertainties and, as a result, actual results could differ from these estimates. Although the Company has listed a number of accounting policies below which it believes to be the most critical, the Company also believes that all of its accounting policies are important to the reader. Therefore, please see Note 1, “Summary of Significant Accounting Policies”, of the accompanying consolidated financial statements of the Company appearing elsewhere in this Annual Report.
Goodwill, Other Intangible Assets and Other Long-Lived Assets: The Company’s goodwill, other intangible assets and tangible fixed assets are held at historical cost, net of depreciation and amortization, less any provision for impairment. Intangible and tangible assets with determinable lives are amortized or depreciated on a straight line basis over estimated useful lives as follows:
Intangible Assets | ||
Goodwill | No amortization | |
Patents | Amortized over 7 years | |
Customer relationships | Amortized over 10 to 15 years | |
Trademarks and other intangible assets | Amortized over 5 to 18 years | |
Tangible Assets | ||
Land | No depreciation | |
Buildings and improvements | Depreciated over 2 to 40 years | |
Machinery and equipment | Depreciated over 2 to 10 years | |
Goodwill reflects the cost of an acquisition in excess of the aggregate fair value assigned to identifiable net assets acquired. Goodwill is assessed for impairment at least annually and as triggering events or indicators of potential impairment occur. The Company performs its annual impairment test in the fourth quarter of its fiscal year. Goodwill has been assigned to reporting units for purposes of impairment testing based upon the relative fair value of the asset to each reporting unit.
Impairment of goodwill is measured according to a two-step approach. In the first step, the fair value of a reporting unit is compared to the carrying value of the reporting unit, including goodwill. The estimated fair value represents the amount at which a reporting unit could be bought or sold in a current transaction between willing parties on an arms-length basis. In estimating the fair value, the Company uses a discounted cash flow model, which is dependent on a number of assumptions including estimated future revenues and expenses, weighted average cost of capital, capital expenditures and other variables. The Company also uses a market approach in which guideline public company comparables are used in determining an estimated fair value for each reporting unit.
If the carrying amount exceeds the fair value, the second step of the goodwill impairment test is performed to measure the amount of the impairment loss, if any. In the second step, the implied value of the goodwill is estimated as the fair value of the reporting unit less the fair value of all other tangible and identifiable intangible assets of the reporting unit. If the carrying amount of the goodwill exceeds the implied fair value of the goodwill, an impairment loss is recognized in an amount equal to that excess, not to exceed the carrying amount of the goodwill. The Company is subject to financial statement risk in the event that goodwill becomes impaired.
60
In the fourth quarter of 2016, the Company performed its annual budgeting and strategic planning process, including a re-assessment of the Company’s capital allocation priorities and a review of the short and long-term growth expectations of each business.
In performing the first step of the annual goodwill impairment test in the fourth quarter of 2016, the Company determined that the estimated fair values of the acoustics and components reporting units were lower than the carrying values of the respective reporting units, requiring further analysis under the second step of the impairment test. The decline in the estimated fair value of the acoustics reporting unit was primarily due to lower long-term revenue growth expectations resulting from this strategic review of capital allocation and investment priorities as compared to the Company’s prior growth plan for the business. The fair value of the acoustics reporting unit was also negatively impacted by a projected cyclical decline in the North American automotive industry end-market. The decline in the estimated fair value of the components reporting unit was primarily due to lower long-term revenue expectations resulting from the annual budgeting and strategic planning process as compared to the Company’s prior plan for the business, primarily due to projected longer-term weakness in the rail end-market.
In performing the second step of the impairment testing, the Company performed a theoretical purchase price allocation for the acoustics and components reporting units to determine the implied fair values of goodwill which were compared to the recorded amounts of goodwill for each reporting unit. Upon completion of the second step of the goodwill impairment test, the Company recorded non-cash goodwill impairment charges of $63.0 million, representing full goodwill impairments of $29.8 million and $33.2 million in the acoustics and components reporting units, respectively.
In the remaining reporting unit with a goodwill balance, finishing, the percentage by which estimated fair value exceeded carrying value was approximately 18%. The finishing reporting unit includes $42.2 million of goodwill and $38.7 million of amortizable intangible assets as of December 31, 2016. The forecasted financial results of the finishing reporting unit are dependent upon revenue growth, adjusted EBITDA margin expansion, and the funding of capital expenditures supporting restructuring and cost reduction initiatives. The assumptions that have the most significant impact on determination of the finishing reporting unit fair value are the revenue growth rate, including 3 percent in the terminal year, adjusted EBITDA margin expansion from current levels to 18 percent over the next five years, and the weighted average cost of capital (discount rate), or 12.1%. A change in any of these assumptions, individually or in the aggregate, or future financial performance that is below management expectations may result in the carrying value of this reporting unit exceeding its fair value, and goodwill and amortizable intangible assets could be impaired.
In connection with our goodwill impairment test, the Company engaged a third-party valuation firm to assist management with determining fair value estimates for the reporting units in the first step of the goodwill impairment test, and in estimating fair values of tangible and intangible assets used in the second step of the goodwill impairment test. In connection with obtaining an independent third-party valuation, management provided certain information and assumptions that were utilized in the fair value calculation. Significant assumptions used in determining reporting unit fair value include forecasted cash flows, revenue growth rates, adjusted EBITDA margins, weighted average cost of capital (discount rate), assumed tax treatment of a future sale of the reporting unit, terminal growth rates, capital expenditures, sales and EBITDA multiples used in the market approach, and the weighting of the income and market approaches. The fair value of the reporting units is determined using a weighted average of an income approach primarily based on the Company’s three year strategic plan and a market approach based on implied valuation multiples of public company peer groups for each reporting unit. Both approaches are generally deemed equally relevant in determining reporting unit enterprise value, and as a result, weightings of 50 percent were used for each. This fair value determination was categorized as Level 3 in the fair value hierarchy.
The Company also reviews other intangible assets and tangible fixed assets for impairment when events or changes in business circumstances indicate that the carrying amount of the assets may not be fully recoverable. If such indicators are present, the Company performs undiscounted cash flow analyses to determine if an impairment exists. If an impairment is determined to exist, any related impairment loss is calculated based on fair value.
A considerable amount of management judgment and assumptions is required in performing the impairment tests, principally in determining the fair value of each reporting unit and the specifically identifiable intangible and tangible assets. While the Company believes its judgments and assumptions are reasonable, different assumptions could change the estimated fair values and, therefore, additional impairment charges could be required.
Employee Benefit Plans: The Company provides a range of benefits to employees and certain former employees, including in some cases pensions and postretirement health care, although the majority of these plans are frozen to new participation. The Company recognizes pension and post-retirement benefit income and expense and assets and obligations that are based on actuarial valuations using a December 31 measurement date and that include key assumptions regarding discount rates, expected returns on plan assets, retirement and mortality rates, future compensation increases, and health care cost trend rates. The approach the Company uses to determine the annual assumptions is as follows:
• | Discount Rate: The Company’s discount rate assumptions are based on the interest rate of high-quality corporate bonds, with appropriate consideration of our plans’ participants’ demographics and benefit payment terms. |
61
• | Expected Return on Plan Assets: The Company’s expected return on plan assets assumptions are based on our expectation of the long-term average rate of return on assets in the pension funds, which is reflective of the current and projected asset mix of the funds and considers the historical returns earned on the funds. |
• | Compensation Increase: The Company’s compensation increase assumptions reflect our long-term actual experience, the near-term outlook and assumed inflation. |
• | Retirement and Mortality Rates: The Company’s retirement and mortality rate assumptions are based primarily on actual plan experience and mortality tables. |
• | Health Care Cost Trend Rates: The Company’s health care cost trend rate assumptions are based primarily on actual plan experience and mortality inflation. |
The Company reviews actuarial assumptions on an annual basis and makes modifications based on current rates and trends when appropriate. As required by GAAP, the effects of the modifications are recorded currently or amortized over future periods. Based on information provided by independent actuaries and other relevant sources, the Company believes that the assumptions used are reasonable; however, changes in these assumptions could impact our financial position, results of operations or cash flows. See Note 15, “Employee Benefit Plans”, of the accompanying consolidated financial statements for further discussion.
Income Taxes: The Company is subject to income taxes in the United States and numerous foreign jurisdictions. Significant judgment is required in determining our worldwide provision for income taxes and recording the related deferred tax assets and liabilities. The Company assesses its income tax positions and records tax liabilities for all years subject to examination based upon management’s evaluation of the facts and circumstances and information available at the reporting dates. For those income tax positions where it is more-likely-than-not that a tax benefit will be sustained upon the conclusion of an examination, the Company has recorded the largest amount of tax benefit having a cumulatively greater than 50% likelihood of being realized upon ultimate settlement with the applicable taxing authority assuming that it has full knowledge of all relevant information. For those tax positions that do not meet the more-likely-than-not threshold regarding the ultimate realization of the related tax benefit, no tax benefit has been recorded in the financial statements. The Company recognizes deferred tax assets and liabilities for the future tax consequences attributable to differences between financial statement carrying amounts of existing assets and liabilities and their respective tax bases, net operating losses, tax credits and other carryforwards. Deferred tax assets and liabilities are measured using enacted tax rates expected to apply to taxable income in the years in which those temporary differences are expected to be recovered or settled. The Company regularly reviews its deferred tax assets for recoverability and establishes a valuation allowance based on historical losses, projected future taxable income and the expected timing of the reversals of existing temporary differences. As a result of this review, the Company has established valuation allowances against certain of our deferred tax assets relating to foreign and state net operating loss and credit carryforwards. Future tax authority rulings and changes in tax laws, changes in projected levels of taxable income and future tax planning strategies could affect the actual effective tax rate and tax balances recorded. See Note 14, “Income Taxes”, of the accompanying consolidated financial statements for further discussion.
Use of Estimates: The Company records reserves or allowances for returns and discounts, doubtful accounts, inventory, incurred but not reported medical claims, environmental matters, warranty claims, workers compensation claims, product and non-product litigation and incentive compensation. These reserves require the use of estimates and judgment. The Company bases its estimates on historical experience and on various other assumptions that are believed to be reasonable under the circumstances. The Company believes that such estimates are made on a consistent basis and with appropriate assumptions and methods. However, actual results may differ from these estimates.
New Accounting Pronouncements
See Note 1, “Summary of Significant Accounting Policies,” under the heading “Recently issued accounting standards,” of the accompanying consolidated financial statements.
ITEM 7A. QUANTITATIVE AND QUALITATIVE DISCLOSURES ABOUT MARKET RISK
The Company is exposed to market risk from changes in foreign currency exchange rates and interest rates and, to a lesser extent, commodities. To reduce such risks, the Company selectively uses financial instruments and other proactive management techniques. All hedging transactions are authorized and executed pursuant to clearly defined policies and procedures, which strictly prohibit the use of financial instruments for trading or speculative purposes.
Currency Risk: The Company has manufacturing, sales and distribution operations around the world; therefore, exchange rates impact the U.S. Dollar (“USD”) value of our reported earnings, our investments in our foreign subsidiaries and the intercompany transactions with these subsidiaries. Approximately $212.9 million, or 30%, of our sales originated in a currency other than the U.S. dollar for the year ended December 31, 2016. As a result, fluctuations in the value of foreign currencies against the USD, particularly the Euro, may have a material impact on our reported results. Revenues and expenses
62
denominated in foreign currencies are translated into USD using average exchange rates in effect during the period. Consequently, as the value of the USD changes relative to the currencies of our major markets, our reported results vary. For the year ended December 31, 2016, sales denominated in Euros approximated $130 million. Therefore, with a 10% increase or decrease in the value of the Euro in relation to the USD, our translated net sales (assuming all other factors are unchanged) would increase or decrease by $13.0 million, respectively, and our net loss would increase or decrease by approximately $1.4 million, respectively. The net assets and liabilities of our non-U.S. subsidiaries, which totaled approximately $93.1 million as of December 31, 2016, are translated into USD at the exchange rates in effect at the end of the period. The resulting translation adjustments are recorded in shareholders’ equity as cumulative translation adjustments. The translation adjustments recorded in other comprehensive income at December 31, 2016 resulted in a decrease to shareholders’ equity of $27.4 million. Transactional foreign currency exchange exposure results primarily from the purchase of products, services or equipment from affiliates or third party suppliers where the purchase value is significant, denominated in another currency and to be settled over an extended period, and from the repayment of intercompany loans between subsidiaries using different currencies. The Company periodically identifies areas where it does not have naturally offsetting currency positions and then may purchase hedging instruments to protect against potential currency exposures. As of December 31, 2016, the Company did not have any significant foreign currency hedging instruments in place nor did it have any significant sales or purchase commitments in currencies outside of the functional currencies of the operations responsible for satisfying such commitments. All long-term debt is held in the functional currencies of the operations that are responsible for the repayment of such obligations. As of December 31, 2016, long-term debt denominated in currencies other than the USD totaled $23.8 million.
Interest Rate Risk: The Company utilizes a combination of short-term and long-term debt to finance our operations and is exposed to interest rate risk on our outstanding floating rate debt instruments, which bear interest at rates that fluctuate with changes in certain short-term prevailing interest rates. Borrowings under U.S. credit facilities bear interest at rates tied to either the “prime rate” of Deutsche Bank AG New York Branch, the federal funds effective rate, the Eurocurrency rate, or a Eurocurrency rate determined by reference to LIBOR, subject to an established floor. Applicable interest rates have been substantially lower than the designated floor in our Senior Secured Credit Facilities; therefore, interest rates have not been subject to change. However, if interest rates were to exceed the established floor, a 25 basis point increase or decrease in the applicable interest rates on our variable rate debt would increase or decrease interest expense by approximately $1 million.
As of December 31, 2016, the Company has entered into various interest rate swaps in order to mitigate a portion of the variable rate interest exposure. The Company is counterparty to certain interest rate swaps with a total notional amount of $210.0 million entered into in November 2015 in order to mitigate a portion of the variable rate interest exposure. These swaps are scheduled to mature in June 2020. Under the terms of the agreement, the Company swapped one month LIBOR rates for a fixed interest rate, resulting in the payment of a fixed LIBOR rate of 2.08% on a notional amount of $210.0 million.
Commodity risk: The Company sources a wide variety of materials and components from a network of global suppliers. While such materials are generally available from numerous suppliers, commodity raw materials, such as steel, aluminum, copper, fiber, foam chemicals, plastic resin, vinyl and cotton sheeting are subject to price fluctuations, which could have a negative impact on our results. The Company strives to pass along such commodity price increases to customers to avoid profit margin erosion and utilizes value analysis and value engineering (“VAVE”) initiatives to further mitigate the impact of commodity raw material price fluctuations as improved efficiencies across all locations are achieved. As of December 31, 2016, the Company did not have any commodity hedging instruments in place.
63
ITEM 8. FINANCIAL STATEMENTS AND SUPPLEMENTARY DATA
See “Quarterly Results of Operations (unaudited)” under “Consolidated Results of Operations” in Item 7, “Management’s Discussion and Analysis of Financial Condition and Results of Operations,” for selected quarterly financial data.
Index to Consolidated Financial Statements | ||
As of December 31, 2016 and 2015 (Successor), for the years ended December 31, 2016 and December 31, 2015, and for the periods June 30, 2014 through December 31, 2014 (Successor) and January 1, 2014 through June 29, 2014 (Predecessor) | Page | |
Index to Financial Statement Schedules | ||
64
Report of Independent Registered Public Accounting Firm
To the Board of Directors and Shareholders of Jason Industries, Inc.
In our opinion, the accompanying consolidated balance sheets as of December 31, 2016 and 2015 and the related consolidated statements of operations, comprehensive loss, shareholders’ (deficit) equity and cash flows for each of the two years in the period ended December 31, 2016 and for the period from June 30, 2014 through December 31, 2014 present fairly, in all material respects, the financial position of Jason Industries, Inc. and its subsidiaries (Successor) as of December 31, 2016 and 2015, and the results of their operations and their cash flows for each of the two years in the period ended December 31, 2016 and for the period from June 30, 2014 through December 31, 2014 in conformity with accounting principles generally accepted in the United States of America. In addition, in our opinion, the financial statement schedule for each of the two years in the period ended December 31, 2016 and for the period from June 30, 2014 through December 31, 2014 listed in the accompanying index presents fairly, in all material respects, the information set forth therein when read in conjunction with the related consolidated financial statements. These financial statements and financial statement schedule are the responsibility of the Company’s management. Our responsibility is to express an opinion on these financial statements and financial statement schedule based on our audits. We conducted our audits of these financial statements in accordance with the standards of the Public Company Accounting Oversight Board (United States). Those standards require that we plan and perform the audit to obtain reasonable assurance about whether the financial statements are free of material misstatement. An audit includes examining, on a test basis, evidence supporting the amounts and disclosures in the financial statements, assessing the accounting principles used and significant estimates made by management, and evaluating the overall financial statement presentation. We believe that our audits provide a reasonable basis for our opinion.
As discussed in Note 1 to the consolidated financial statements, the Company changed the manner in which it classifies debt issuance costs in 2016.
/s/ PricewaterhouseCoopers LLP
Milwaukee, Wisconsin
March 2, 2017
65
Report of Independent Registered Public Accounting Firm
To the Board of Directors and Shareholders of Jason Industries, Inc.
In our opinion, the accompanying consolidated statements of operations, comprehensive loss, shareholders’ (deficit) equity and cash flows for the period from January 1, 2014 through June 29, 2014 present fairly, in all material respects, the results of operations and cash flows of Jason Partners Holdings Inc. and its subsidiaries (Predecessor) for the period from January 1, 2014 through June 29, 2014 in conformity with accounting principles generally accepted in the United States of America. In addition, in our opinion, the financial statement schedule for the period from January 1, 2014 through June 29, 2014 listed in the accompanying index presents fairly, in all material respects, the information set forth therein when read in conjunction with the related consolidated financial statements. These financial statements and financial statement schedule are the responsibility of the Company’s management. Our responsibility is to express an opinion on these financial statements and financial statement schedule based on our audit. We conducted our audit of these financial statements in accordance with the standards of the Public Company Accounting Oversight Board (United States). Those standards require that we plan and perform the audit to obtain reasonable assurance about whether the financial statements are free of material misstatement. An audit includes examining, on a test basis, evidence supporting the amounts and disclosures in the financial statements, assessing the accounting principles used and significant estimates made by management, and evaluating the overall financial statement presentation. We believe that our audit provides a reasonable basis for our opinion.
/s/ PricewaterhouseCoopers LLP
Milwaukee, Wisconsin
March 11, 2015
66
Jason Industries, Inc. Consolidated Statements of Operations (In thousands, except per share amounts) | ||||||||||||||||
Successor | Predecessor | |||||||||||||||
Year Ended December 31, 2016 | Year Ended December 31, 2015 | June 30, 2014 Through December 31, 2014 | January 1, 2014 Through June 29, 2014 | |||||||||||||
Net sales | $ | 705,519 | $ | 708,366 | $ | 325,335 | $ | 377,151 | ||||||||
Cost of goods sold | 573,917 | 561,076 | 270,676 | 294,175 | ||||||||||||
Gross profit | 131,602 | 147,290 | 54,659 | 82,976 | ||||||||||||
Selling and administrative expenses | 113,797 | 129,371 | 57,183 | 54,974 | ||||||||||||
Impairment charges | 63,285 | 94,126 | — | — | ||||||||||||
Loss on disposals of property, plant and equipment - net | 880 | 109 | 57 | 338 | ||||||||||||
Restructuring | 7,232 | 3,800 | 1,131 | 2,554 | ||||||||||||
Transaction-related expenses | — | 886 | 2,533 | 27,783 | ||||||||||||
Operating loss | (53,592 | ) | (81,002 | ) | (6,245 | ) | (2,673 | ) | ||||||||
Interest expense | (31,843 | ) | (31,835 | ) | (16,172 | ) | (7,301 | ) | ||||||||
Equity income | 681 | 884 | 381 | 831 | ||||||||||||
Gain from sale of joint ventures | — | — | — | 3,508 | ||||||||||||
Other income - net | 900 | 97 | 167 | 107 | ||||||||||||
Loss before income taxes | (83,854 | ) | (111,856 | ) | (21,869 | ) | (5,528 | ) | ||||||||
Tax benefit | (6,157 | ) | (22,255 | ) | (7,889 | ) | (573 | ) | ||||||||
Net loss | $ | (77,697 | ) | $ | (89,601 | ) | $ | (13,980 | ) | $ | (4,955 | ) | ||||
Less net loss attributable to noncontrolling interests | (10,818 | ) | (15,143 | ) | (2,362 | ) | — | |||||||||
Net loss attributable to Jason Industries | $ | (66,879 | ) | $ | (74,458 | ) | $ | (11,618 | ) | $ | (4,955 | ) | ||||
Accretion of preferred stock dividends and redemption premium | 3,600 | 3,600 | 1,810 | — | ||||||||||||
Net loss available to common shareholders of Jason Industries | $ | (70,479 | ) | $ | (78,058 | ) | $ | (13,428 | ) | $ | (4,955 | ) | ||||
Net loss per share available to common shareholders of Jason Industries: | ||||||||||||||||
Basic and diluted | $ | (3.13 | ) | $ | (3.53 | ) | $ | (0.61 | ) | $ | (4,955 | ) | ||||
Weighted average number of common shares outstanding: | ||||||||||||||||
Basic and diluted | 22,507 | 22,145 | 21,991 | 1 | ||||||||||||
Cash dividends paid per common share | $ | — | $ | — | $ | — | $ | — | ||||||||
The accompanying notes are an integral part of these consolidated financial statements.
67
Jason Industries, Inc. Consolidated Statements of Comprehensive Loss (In thousands) | ||||||||||||||||
Successor | Predecessor | |||||||||||||||
Year Ended December 31, 2016 | Year Ended December 31, 2015 | June 30, 2014 Through December 31, 2014 | January 1, 2014 Through June 29, 2014 | |||||||||||||
Net loss | $ | (77,697 | ) | $ | (89,601 | ) | $ | (13,980 | ) | $ | (4,955 | ) | ||||
Other comprehensive loss: | ||||||||||||||||
Employee retirement plan adjustments, net of tax benefit (expense) of $95, $18, ($706), and ($105), respectively | (624 | ) | 461 | (1,726 | ) | (687 | ) | |||||||||
Cumulative foreign currency translation adjustments associated with joint ventures sold | — | — | — | (591 | ) | |||||||||||
Foreign currency translation adjustments | (4,787 | ) | (11,560 | ) | (12,792 | ) | (465 | ) | ||||||||
Net change in unrealized losses on cash flow hedges, net of tax benefit of $659 and $126, respectively | (1,064 | ) | (202 | ) | — | — | ||||||||||
Total other comprehensive loss | (6,475 | ) | (11,301 | ) | (14,518 | ) | (1,743 | ) | ||||||||
Comprehensive loss | (84,172 | ) | (100,902 | ) | (28,498 | ) | (6,698 | ) | ||||||||
Less: Comprehensive loss attributable to noncontrolling interests | (11,870 | ) | (17,053 | ) | (4,815 | ) | — | |||||||||
Comprehensive loss attributable to Jason Industries | $ | (72,302 | ) | $ | (83,849 | ) | $ | (23,683 | ) | $ | (6,698 | ) | ||||
The accompanying notes are an integral part of these consolidated financial statements.
68
Jason Industries, Inc. Consolidated Balance Sheets (In thousands, except share and per share amounts) | |||||||
Successor | |||||||
December 31, 2016 | December 31, 2015 | ||||||
Assets | |||||||
Current assets | |||||||
Cash and cash equivalents | $ | 40,861 | $ | 35,944 | |||
Accounts receivable - net of allowances for doubtful accounts of $3,392 and $2,524 at 2016 and 2015, respectively | 77,837 | 79,088 | |||||
Inventories - net | 73,601 | 80,432 | |||||
Other current assets | 17,866 | 30,903 | |||||
Total current assets | 210,165 | 226,367 | |||||
Property, plant and equipment - net | 178,318 | 196,150 | |||||
Goodwill | 42,157 | 106,170 | |||||
Other intangible assets - net | 144,258 | 157,915 | |||||
Other assets - net | 9,433 | 10,490 | |||||
Total assets | $ | 584,331 | $ | 697,092 | |||
Liabilities and Shareholders' (Deficit) Equity | |||||||
Current liabilities | |||||||
Current portion of long-term debt | $ | 8,179 | $ | 6,186 | |||
Accounts payable | 61,160 | 56,838 | |||||
Accrued compensation and employee benefits | 13,207 | 18,750 | |||||
Accrued interest | 191 | 75 | |||||
Other current liabilities | 24,807 | 28,733 | |||||
Total current liabilities | 107,544 | 110,582 | |||||
Long-term debt | 416,945 | 426,150 | |||||
Deferred income taxes | 42,747 | 57,247 | |||||
Other long-term liabilities | 19,881 | 18,119 | |||||
Total liabilities | 587,117 | 612,098 | |||||
Commitments and Contingencies (Note 17) | |||||||
Shareholders' (Deficit) Equity | |||||||
Preferred stock, $0.0001 par value (5,000,000 shares authorized, 45,899 shares issued and outstanding at December 31, 2016, including 899 shares declared on December 15, 2016 and issued on January 1, 2017, and 45,000 shares issued and outstanding at December 31, 2015) | $ | 45,899 | $ | 45,000 | |||
Jason Industries (Successor) common stock, $0.0001 par value (120,000,000 shares authorized, 24,802,196 shares issued and outstanding at December 31, 2016 and 22,295,003 shares issued and outstanding at December 31, 2015) | 2 | 2 | |||||
Additional paid-in capital | 144,666 | 143,533 | |||||
Retained deficit | (162,876 | ) | (95,997 | ) | |||
Accumulated other comprehensive loss | (30,372 | ) | (21,456 | ) | |||
Shareholders' (deficit) equity attributable to Jason Industries | (2,681 | ) | 71,082 | ||||
Noncontrolling interests | (105 | ) | 13,912 | ||||
Total shareholders' (deficit) equity | (2,786 | ) | 84,994 | ||||
Total liabilities and shareholders' (deficit) equity | $ | 584,331 | $ | 697,092 | |||
The accompanying notes are an integral part of these consolidated financial statements.
69
Jason Industries, Inc. Consolidated Statements of Shareholders’ (Deficit) Equity (In thousands) | |||||||||||||||||||||||||||||||||||||
Preferred Stock | Common Stock | Additional Paid-In Capital | Retained (Deficit) Earnings | Accumulated Other Comprehensive Loss | Shareholders' (Deficit) Equity Attributable to Jason Industries, Inc. | Noncontrolling Interests | Total Shareholders’ (Deficit) Equity | ||||||||||||||||||||||||||||||
Shares | Amount | Shares | Amount | ||||||||||||||||||||||||||||||||||
Balance at December 31, 2013, Predecessor | — | $ | — | — | $ | — | $ | 25,358 | $ | 4,640 | $ | 474 | $ | 30,472 | $ | — | $ | 30,472 | |||||||||||||||||||
Share-based compensation | — | — | — | — | 7,661 | — | — | 7,661 | — | 7,661 | |||||||||||||||||||||||||||
Net loss | — | — | — | — | — | (4,955 | ) | — | (4,955 | ) | — | (4,955 | ) | ||||||||||||||||||||||||
Employee retirement plan adjustments, net of tax | — | — | — | — | — | — | (687 | ) | (687 | ) | — | (687 | ) | ||||||||||||||||||||||||
Foreign currency translation adjustments | — | — | — | — | — | — | (1,056 | ) | (1,056 | ) | — | (1,056 | ) | ||||||||||||||||||||||||
Balance at June 29, 2014, Predecessor | — | — | — | — | 33,019 | (315 | ) | (1,269 | ) | 31,435 | — | 31,435 | |||||||||||||||||||||||||
Elimination of predecessor common stock, additional paid-in capital, retained (deficit), and accumulated other comprehensive (loss) | — | — | — | — | (33,019 | ) | 315 | 1,269 | (31,435 | ) | — | (31,435 | ) | ||||||||||||||||||||||||
Adjustment to reflect Jason Industries common stock, additional contributed capital, and retained (deficit) (1) | — | — | 21,991 | 2 | 147,102 | (9,921 | ) | — | 137,183 | — | 137,183 | ||||||||||||||||||||||||||
Noncontrolling interests in JPHI Holdings, Inc. | — | — | — | — | — | — | — | — | 35,780 | 35,780 | |||||||||||||||||||||||||||
Issuance of series A convertible perpetual preferred stock | 45 | 45,000 | — | — | (2,500 | ) | — | — | 42,500 | — | 42,500 | ||||||||||||||||||||||||||
Balance at June 30, 2014, Successor | 45 | 45,000 | 21,991 | 2 | 144,602 | (9,921 | ) | — | 179,683 | 35,780 | 215,463 | ||||||||||||||||||||||||||
Warrant tender | — | — | — | — | (6,609 | ) | — | — | (6,609 | ) | — | (6,609 | ) | ||||||||||||||||||||||||
Dividends declared | — | — | — | — | (1,810 | ) | — | — | (1,810 | ) | — | (1,810 | ) | ||||||||||||||||||||||||
Share-based compensation | — | — | — | — | 4,129 | — | — | 4,129 | — | 4,129 | |||||||||||||||||||||||||||
Net loss | — | — | — | — | — | (11,618 | ) | — | (11,618 | ) | (2,362 | ) | (13,980 | ) | |||||||||||||||||||||||
Employee retirement plan adjustments, net of tax | — | — | — | — | — | — | (1,434 | ) | (1,434 | ) | (292 | ) | (1,726 | ) | |||||||||||||||||||||||
Foreign currency translation adjustments | — | — | — | — | — | — | (10,631 | ) | (10,631 | ) | (2,161 | ) | (12,792 | ) | |||||||||||||||||||||||
Balance at December 31, 2014, Successor | 45 | 45,000 | 21,991 | 2 | 140,312 | (21,539 | ) | (12,065 | ) | 151,710 | 30,965 | 182,675 | |||||||||||||||||||||||||
Dividends declared | — | — | — | — | (3,600 | ) | — | — | (3,600 | ) | — | (3,600 | ) | ||||||||||||||||||||||||
Share-based compensation | — | — | 515 | — | 7,969 | — | — | 7,969 | — | 7,969 | |||||||||||||||||||||||||||
Tax withholding related to vesting of restricted stock units | — | — | (211 | ) | — | (1,148 | ) | — | — | (1,148 | ) | — | (1,148 | ) | |||||||||||||||||||||||
Net loss | — | — | — | — | — | (74,458 | ) | (74,458 | ) | (15,143 | ) | (89,601 | ) | ||||||||||||||||||||||||
Employee retirement plan adjustments, net of tax | — | — | — | — | — | — | 383 | 383 | 78 | 461 | |||||||||||||||||||||||||||
Foreign currency translation adjustments | — | — | — | — | — | — | (9,606 | ) | (9,606 | ) | (1,954 | ) | (11,560 | ) | |||||||||||||||||||||||
Net changes in unrealized losses on cash flow hedges | — | — | — | — | — | — | (168 | ) | (168 | ) | (34 | ) | (202 | ) | |||||||||||||||||||||||
Balance at December 31, 2015, Successor | 45 | 45,000 | 22,295 | 2 | 143,533 | (95,997 | ) | (21,456 | ) | 71,082 | 13,912 | 84,994 | |||||||||||||||||||||||||
Dividends declared | 1 | 899 | — | — | (3,600 | ) | — | — | (2,701 | ) | — | (2,701 | ) | ||||||||||||||||||||||||
Share-based compensation | — | — | 149 | — | (752 | ) | — | — | (752 | ) | — | (752 | ) | ||||||||||||||||||||||||
Tax withholding related to vesting of restricted stock units | — | — | (44 | ) | — | (155 | ) | — | — | (155 | ) | — | (155 | ) | |||||||||||||||||||||||
Net loss | — | — | — | — | — | (66,879 | ) | — | (66,879 | ) | (10,818 | ) | (77,697 | ) | |||||||||||||||||||||||
Employee retirement plan adjustments, net of tax | — | — | — | — | — | — | (540 | ) | (540 | ) | (84 | ) | (624 | ) | |||||||||||||||||||||||
Foreign currency translation adjustments | — | — | — | — | — | — | (4,013 | ) | (4,013 | ) | (774 | ) | (4,787 | ) | |||||||||||||||||||||||
Net changes in unrealized losses on cash flow hedges, net of tax | — | — | — | — | — | — | (870 | ) | (870 | ) | (194 | ) | (1,064 | ) | |||||||||||||||||||||||
Exchange of common stock of JPHI Holdings, Inc. for common stock of Jason Industries, Inc. | — | — | 2,402 | — | 5,640 | — | (3,493 | ) | 2,147 | (2,147 | ) | — | |||||||||||||||||||||||||
Balance at December 31, 2016, Successor | 46 | $ | 45,899 | 24,802 | $ | 2 | $ | 144,666 | $ | (162,876 | ) | $ | (30,372 | ) | $ | (2,681 | ) | $ | (105 | ) | $ | (2,786 | ) | ||||||||||||||
(1) Adjustment to reflect Jason Industries common stock, additional paid-in capital, and retained deficit is net of common stock redeemed on June 30, 2014, which reduced additional paid in capital by $26,101 (See Note 11).
The accompanying notes are an integral part of these consolidated financial statements.
70
Jason Industries, Inc. Consolidated Statements of Cash Flows (In thousands) | ||||||||||||||||
Successor | Predecessor | |||||||||||||||
Year Ended December 31, 2016 | Year Ended December 31, 2015 | June 30, 2014 Through December 31, 2014 | January 1, 2014 Through June 29, 2014 | |||||||||||||
Cash flows from operating activities | ||||||||||||||||
Net loss | $ | (77,697 | ) | $ | (89,601 | ) | $ | (13,980 | ) | $ | (4,955 | ) | ||||
Adjustments to reconcile net loss to net cash provided by (used in) operating activities: | ||||||||||||||||
Depreciation | 30,625 | 31,160 | 13,180 | 10,125 | ||||||||||||
Amortization of intangible assets | 12,921 | 14,088 | 7,195 | 2,727 | ||||||||||||
Amortization of deferred financing costs and debt discount | 3,008 | 3,008 | 1,508 | 426 | ||||||||||||
Impairment charges | 63,285 | 94,126 | — | — | ||||||||||||
Equity income | (681 | ) | (884 | ) | (381 | ) | (831 | ) | ||||||||
Deferred income taxes | (13,973 | ) | (28,223 | ) | (9,784 | ) | (5,156 | ) | ||||||||
Loss on disposals of property, plant and equipment - net | 880 | 109 | 57 | 338 | ||||||||||||
Gain from sale of joint ventures | — | — | — | (3,508 | ) | |||||||||||
Dividends from joint ventures | 2,068 | — | — | — | ||||||||||||
Share-based compensation | (752 | ) | 7,969 | 4,129 | 7,661 | |||||||||||
Net increase (decrease) in cash due to changes in: | ||||||||||||||||
Accounts receivable | (85 | ) | 1,954 | 15,015 | (20,632 | ) | ||||||||||
Inventories | 5,862 | 5,034 | 556 | (5,602 | ) | |||||||||||
Other current assets | 7,346 | (3,820 | ) | (5,067 | ) | (1,860 | ) | |||||||||
Accounts payable | 5,886 | (1,473 | ) | (7,332 | ) | 7,266 | ||||||||||
Accrued compensation and employee benefits | (5,449 | ) | 4,169 | (6,428 | ) | 5,535 | ||||||||||
Accrued interest | 117 | (121 | ) | 127 | (2,634 | ) | ||||||||||
Accrued income taxes | 2,263 | 487 | (705 | ) | (706 | ) | ||||||||||
Accrued transaction costs | — | — | (9,821 | ) | 16,807 | |||||||||||
Other - net | (507 | ) | 1,052 | 4,125 | (760 | ) | ||||||||||
Total adjustments | 112,814 | 128,635 | 6,374 | 9,196 | ||||||||||||
Net cash provided by (used in) operating activities | 35,117 | 39,034 | (7,606 | ) | 4,241 | |||||||||||
Cash flows from investing activities | ||||||||||||||||
Acquisition of Jason, net of cash acquired | — | — | (489,169 | ) | — | |||||||||||
Proceeds from disposals of property, plant and equipment | 3,413 | 232 | 89 | 159 | ||||||||||||
Proceeds from sale of joint ventures | — | — | — | 11,500 | ||||||||||||
Payments for property, plant and equipment | (19,780 | ) | (32,786 | ) | (15,359 | ) | (10,998 | ) | ||||||||
Acquisitions of business, net of cash acquired | — | (34,763 | ) | — | — | |||||||||||
Acquisitions of patents | (86 | ) | (247 | ) | (121 | ) | (33 | ) | ||||||||
Other investing activities | — | — | (444 | ) | (490 | ) | ||||||||||
Net cash (used in) provided by investing activities | (16,453 | ) | (67,564 | ) | (505,004 | ) | 138 | |||||||||
Cash flows from financing activities | ||||||||||||||||
Payment of capitalized debt issuance costs | — | $ | — | $ | (13,104 | ) | $ | (444 | ) | |||||||
Payments of deferred underwriters fees | — | — | (5,175 | ) | — | |||||||||||
Redemption of redeemable common stock | — | — | (26,101 | ) | — | |||||||||||
Proceeds on issuance of preferred stock | — | — | 45,000 | — | ||||||||||||
Payments of preferred stock issuance costs | — | — | (2,500 | ) | — | |||||||||||
Warrant tender offer | — | — | (6,609 | ) | — | |||||||||||
Payments of 2013 U.S. term loan | — | — | — | (1,175 | ) | |||||||||||
Proceeds from First Lien and Second Lien term loans | — | — | 412,477 | — | ||||||||||||
Payments of First Lien term loan | (3,100 | ) | (3,100 | ) | (775 | ) | — | |||||||||
Proceeds from U.S. revolving loans | — | — | — | 64,725 | ||||||||||||
Payments of U.S. revolving loans | — | — | — | (53,725 | ) | |||||||||||
Proceeds from other long-term debt | 10,150 | 19,282 | 3,043 | 1,383 | ||||||||||||
Payments of other long-term debt | (16,138 | ) | (6,228 | ) | (4,644 | ) | (3,868 | ) | ||||||||
Payments of preferred stock dividends | (3,600 | ) | (3,600 | ) | (910 | ) | — | |||||||||
Other financing activities - net | (155 | ) | (1,148 | ) | — | — | ||||||||||
Net cash (used in) provided by financing activities | (12,843 | ) | 5,206 | 400,702 | 6,896 | |||||||||||
Effect of exchange rate changes on cash and cash equivalents | (904 | ) | (3,011 | ) | (2,890 | ) | (122 | ) | ||||||||
Net increase (decrease) in cash and cash equivalents | 4,917 | (26,335 | ) | (114,798 | ) | 11,153 | ||||||||||
Cash and cash equivalents, beginning of period | 35,944 | 62,279 | 177,077 | 16,318 | ||||||||||||
Cash and cash equivalents, end of period | $ | 40,861 | $ | 35,944 | $ | 62,279 | $ | 27,471 | ||||||||
Supplemental disclosure of cash flow information | ||||||||||||||||
Cash paid during the year for: | ||||||||||||||||
Interest | $ | 28,717 | $ | 28,969 | $ | 15,399 | $ | 9,994 | ||||||||
Income taxes, net of refunds | $ | 7,163 | $ | 4,349 | $ | 2,682 | $ | 5,038 | ||||||||
Non-cash investing activities | ||||||||||||||||
Property, plant and equipment acquired through additional liabilities | $ | 1,891 | $ | 1,765 | $ | 1,750 | $ | 810 | ||||||||
Non-cash financing activities: | ||||||||||||||||
Accretion of preferred stock dividends | $ | 1 | $ | 900 | $ | 900 | $ | — | ||||||||
Non-cash preferred stock created from dividends declared | $ | 899 | $ | — | $ | — | $ | — | ||||||||
Noncontrolling interest contribution of Jason Partners Holdings, Inc. to JPHI Holdings, Inc. | $ | — | $ | — | $ | 35,780 | $ | — | ||||||||
Exchange of common stock of JPHI Holdings, Inc. for common stock of Jason Industries, Inc. | $ | (2,147 | ) | $ | — | $ | — | $ | — | |||||||
71
Jason Industries, Inc.
Notes to Consolidated Financial Statements
(In thousands, except share and per share amounts)
1. | Summary of Significant Accounting Policies |
Description of business: Jason Industries, Inc. and its subsidiaries (collectively, the “Company”) is a global industrial manufacturing company with four reportable segments: seating, finishing, acoustics and components. The segments have operations within the United States and 14 foreign countries. The Company’s seating segment supplies seating solutions to equipment manufacturers in the motorcycle, lawn and turf care, industrial, agricultural, construction and power sports end markets. The finishing segment focuses on the production of industrial brushes, buffing wheels, buffing compounds, and abrasives that are used in a broad range of industrial and infrastructure applications. The acoustics segment manufactures engineered non-woven, fiber-based acoustical products for the automotive industry. The components segment is a diversified manufacturer of expanded and perforated metal components, slip resistant surfaces and subassemblies for smart utility meters.
The Company was originally incorporated in Delaware on May 31, 2013 as a blank check company, formed for the purpose of effecting a merger, capital stock exchange, asset acquisition, stock purchase, reorganization or similar business combination. On June 30, 2014 (the “Closing Date”), the Company consummated its business combination with Jason Partners Holdings Inc. (“Jason”) pursuant to the stock purchase agreement, dated as of March 16, 2014, which provided for the acquisition of all of the capital stock of Jason by the Company (the “Business Combination”). In connection with the closing of the Business Combination, the Company changed its name from Quinpario Acquisition Corp. to Jason Industries, Inc. and commenced trading of its common stock and warrants under the symbols, “JASN” and “JASNW”, respectively, on Nasdaq. See Note 2 for a further discussion of the Business Combination.
Prior to the consummation of the Business Combination, the Company’s efforts were limited to organizational activities, its initial public offering, and the search for suitable business acquisition transactions.
Basis of presentation: As a result of the Business Combination, the Company was identified as the acquirer for accounting purposes, and Jason is the acquiree and accounting predecessor. The Company’s financial statement presentation distinguishes a “Predecessor” for Jason for periods prior to the Closing Date. The Company was subsequently re-established as Jason Industries, Inc. and is the “Successor” for periods after the Closing Date, which includes consolidation of Jason subsequent to the Business Combination on June 30, 2014. The acquisition was accounted for as a business combination using the acquisition method of accounting, and the Successor financial statements reflect a new basis of accounting that is based on the fair value of net assets acquired. See Note 2 for further discussion of the Business Combination. As a result of the application of the acquisition method of accounting as of the effective date of the acquisition, the financial statements for the Predecessor period and for the Successor period are presented on a different basis and, therefore, are not comparable.
The Company’s fiscal year ends on December 31. Throughout the year, the Company reports its results using a fiscal calendar whereby each three month quarterly reporting period is approximately thirteen weeks in length and ends on a Friday. The exceptions are the first quarter, which begins on January 1, and the fourth quarter, which ends on December 31. For 2016, the Company’s fiscal quarters were comprised of the three months ended April 1, July 1, September 30, and December 31. In 2015, the Company’s fiscal quarters were comprised of the three months ended March 27, June 26, September 25 and December 31.
Principles of consolidation: The consolidated financial statements included herein have been prepared in accordance with accounting principles generally accepted in the United States of America (“GAAP”) pursuant to the rules and regulations of the Securities and Exchange Commission. The consolidated financial statements include the accounts of all wholly-owned subsidiaries. All significant intercompany transactions and balances have been eliminated. Investments in partially owned affiliates are accounted for using the equity method when the Company’s interest is between 20% and 50% and the Company does not have a controlling interest, yet maintains significant influence.
Cash and cash equivalents: The Company considers all highly liquid investments with an original maturity of three months or less at the date of purchase to be cash equivalents. At December 31, 2016 and 2015, book overdrafts of approximately $5.5 million and $7.6 million, respectively, are included in accounts payable within the accompanying consolidated balance sheets. These amounts are held in accounts in which the Company has no right of offset with other cash balances.
Accounts receivable: The Company evaluates collectability of its receivables and establishes the allowance for doubtful accounts based on a combination of specific customer circumstances and historical write-off experience. Credit is extended to customers based upon an evaluation of their financial position. Generally, advance payment is not required. Credit losses are provided for in the consolidated financial statements and consistently have been within management’s expectations.
72
Jason Industries, Inc.
Notes to Consolidated Financial Statements
(In thousands, except share and per share amounts)
Inventories: Inventories are comprised of material, direct labor and manufacturing overhead, and are valued at the lower of cost or market and adjusted for the value of inventory that is estimated to be excess, obsolete or otherwise unmarketable. The estimation of excess, obsolete and unmarketable inventory is based on a variety of factors, including material or product age, estimated usage and estimated market demand. The first-in, first-out (“FIFO”) method is used to determine cost for all of the Company’s inventories.
Property, plant and equipment: Property, plant and equipment are stated at cost. Depreciation generally occurs using the straight-line method over 2 to 40 years for buildings and improvements and 2 to 10 years for machinery and equipment.
Leasehold improvements are amortized over the lesser of the term of the respective leases and the useful life of the related improvement using the straight-line method. The Company uses accelerated depreciation methods for income tax purposes. Expenditures which substantially increase value or extend useful lives are capitalized. Expenditures for maintenance and repairs are charged to operations as incurred. The Company records gains and losses on the disposition or retirement of property, plant and equipment based on the net book value and any proceeds received.
Long-lived assets: Long-lived assets to be held and used are reviewed for impairment whenever events or changes in circumstances indicate that the carrying amount may not be recoverable based upon an estimate of the related future undiscounted cash flows. When required, impairment losses on assets to be held and used are recognized based on the fair value of the asset as compared to its carrying value. Long-lived assets to be disposed of by sale are reported at the lower of carrying amount or fair value less cost to sell. The Company conducts its long-lived asset impairment reviews at the lowest level in which identifiable cash flows are largely independent of cash flows of other assets and liabilities.
Amortization is recorded for other intangible assets with determinable lives. Patents, customer relationships, and trademarks and other intangible assets are amortized on a straight-line basis over their estimated useful lives of 7 years, 10 to 15 years, and 5 to 18 years, respectively.
Goodwill: Goodwill reflects the cost of an acquisition in excess of the aggregate fair value assigned to identifiable net assets acquired. Goodwill is assessed for impairment at least annually and as triggering events or indicators of potential impairment occur. The Company performs its annual impairment test in the fourth quarter of its fiscal year. Goodwill has been assigned to reporting units for purposes of impairment testing based upon the relative fair value of the asset to each reporting unit.
Impairment of goodwill is measured according to a two-step approach. In the first step, the fair value of a reporting unit is compared to the carrying value of the reporting unit, including goodwill. The estimated fair value represents the amount at which a reporting unit could be bought or sold in a current transaction between willing parties on an arms-length basis. In estimating the fair value, the Company uses a discounted cash flow model, which is dependent on a number of assumptions including estimated future revenues and expenses, weighted average cost of capital, capital expenditures and other variables. The Company also uses a market approach in which guideline public company comparables are used in determining an estimated fair value for each reporting unit.
If the carrying amount exceeds the fair value, the second step of the goodwill impairment test is performed to measure the amount of the impairment loss, if any. In the second step, the implied value of the goodwill is estimated as the fair value of the reporting unit less the fair value of all other tangible and identifiable intangible assets of the reporting unit. If the carrying amount of the goodwill exceeds the implied fair value of the goodwill, an impairment loss is recognized in an amount equal to that excess, not to exceed the carrying amount of the goodwill. The Company is subject to financial statement risk in the event that goodwill becomes impaired. See Note 8 for further discussion regarding the results of the Company’s goodwill impairment testing.
Investments in partially-owned affiliates: The Company has investments in joint ventures located in Asia. These joint ventures are part of the finishing segment and are accounted for using the equity method of accounting. As of December 31, 2016 and 2015, the Company’s investment in these joint ventures was $4.8 million and $7.4 million, respectively, and is included in other assets-net in the consolidated balance sheets. Equity income is presented separately on the consolidated statements of operations. See Note 4 for further discussion of the sale of two of the Company’s joint ventures during 2014.
Income taxes: The provision for income taxes includes federal, state, local and foreign taxes on income. Deferred taxes are recorded for the expected future tax consequences of temporary differences between the financial statement carrying amounts and the tax bases of assets and liabilities, and net operating loss and credit carryforwards available to offset future taxable income. Future tax benefits are recognized to the extent that realization of those benefits is considered to be more likely than not. A valuation allowance is provided for net deferred tax assets when it is more likely than not that the Company will not realize the benefit of such net assets. The Company recognizes interest and penalties related to unrecognized tax benefits in income tax expense.
73
Jason Industries, Inc.
Notes to Consolidated Financial Statements
(In thousands, except share and per share amounts)
Share-based payments: The Company recognizes expense related to share-based payment transactions in which it receives employee services in exchange for equity instruments of the Company that may be settled by the issuance of such equity instruments. Share-based compensation cost for restricted stock units (“RSUs”) is measured based on the closing fair market value of the Company’s common stock on the date of grant. The Company recognizes share-based compensation cost over the award’s requisite service period on a straight-line basis for time-based RSUs and on a graded basis for RSUs that are contingent on the achievement of performance conditions. Forfeitures are recognized within compensation expense in the period the forfeitures are incurred. The Company recognizes a tax (provision)/benefit from share-based compensation (income)/expense in the consolidated statements of operations in the period the share-based compensation (income)/expense is incurred. See Note 12 for further information regarding share-based compensation.
Fair value of financial instruments: Current accounting guidance defines fair value as the exchange price that would be received for an asset or paid to transfer a liability (an exit price) in the principal or most advantageous market for the asset or liability in an orderly transaction between market participants. It also specifies a fair value hierarchy based upon the observability of inputs used in valuation techniques. Observable inputs (highest level) reflect market data obtained from independent sources, while unobservable inputs (lowest level) reflect internally developed market assumptions. In accordance with the guidance, fair value measurements are classified under the following hierarchy:
•Level 1 — Quoted prices for identical instruments in active markets.
• | Level 2 — Quoted prices for similar instruments in active markets; quoted prices for identical or similar instruments in markets that are not active; and model-derived valuations in which all significant inputs or significant value-drivers are observable in active markets. |
• | Level 3 — Model-derived valuations in which one or more significant inputs or significant value-drivers are unobservable. |
Fair value measurements are classified according to the lowest level input or value-driver that is significant to the valuation. A measurement may therefore be classified within Level 3 even though there may be significant inputs that are readily observable.
The carrying amounts within the accompanying consolidated balance sheets for cash and cash equivalents, accounts receivable and accounts payable approximate fair value due to the short-term maturity of these instruments. The Company assessed the amounts recorded under revolving loans, if any, and long-term debt and determined that the fair value of total debt was approximately $365.8 million and $403.3 million as of December 31, 2016 and 2015, respectively. The Company considers the inputs related to these estimations to be Level 2 fair value measurements as they are primarily based on quoted prices for the Company’s Senior Secured Credit Facility.
The valuation of the Company’s derivative financial instruments is determined using widely accepted valuation techniques, including discounted cash flow analysis on the expected cash flows of each derivative. This analysis reflects the contractual terms of the derivatives, including the period to maturity, and uses observable market-based inputs, including interest rate curves. The Company has determined that the majority of the inputs used to value its derivatives fall within Level 2 of the fair value hierarchy and therefore the Company’s derivatives are classified within Level 2. See Note 9 for further information regarding derivatives held by the Company.
Employee Benefit Plans: The Company recognizes pension and post-retirement benefit income and expense and assets and obligations that are based on actuarial valuations using a December 31 measurement date and that include key assumptions regarding discount rates, expected returns on plan assets, retirement and mortality rates, future compensation increases, and health care cost trend rates. The Company reviews actuarial assumptions on an annual basis and makes modifications based on current rates and trends when appropriate. As required by GAAP, the effects of the modifications are recorded currently or amortized over future periods.
Derivative financial instruments: The Company recognizes all derivative financial instruments in the consolidated financial statements at fair value regardless of the purpose or intent for holding the instrument. Changes in the fair value of derivative financial instruments are either recognized periodically in income or in equity as a component of comprehensive income (loss) depending on whether the derivative financial instrument qualifies for hedge accounting, and if so, whether it qualifies as a fair value hedge or cash flow hedge. Generally, changes in fair values of derivatives accounted for as fair value hedges are recorded in income along with the portions of the changes in the fair values of the hedged items that relate to the hedged risks. Changes in fair values of derivatives accounted for as cash flow hedges, to the extent they are effective as hedges, are recorded in other comprehensive income (loss), net of deferred income taxes. Changes in fair value of derivatives not qualifying as hedges are reported in income. Cash flows from derivatives that are accounted for as cash flow or fair value hedges are included in the consolidated statements of cash flows in the same category as the item being hedged. The
74
Jason Industries, Inc.
Notes to Consolidated Financial Statements
(In thousands, except share and per share amounts)
Company’s policy is to enter into derivatives with creditworthy institutions and not to enter into such derivatives for speculative purposes. See Note 9 for further information regarding derivatives held by the Company.
Foreign currency translation: Assets and liabilities of the Company’s foreign subsidiaries, whose respective functional currencies are other than the U.S. dollar, are translated at year-end exchange rates while revenues and expenses are translated at average exchange rates. Resultant gains and losses are reflected within accumulated other comprehensive loss within the accompanying consolidated statements of shareholders’ equity.
Other comprehensive income (loss): Other comprehensive income (loss) includes disclosure of financial information that historically has not been recognized in the calculation of net income. The Company’s other comprehensive income (loss) includes the change in unrecognized prior service costs on pension and other postretirement obligations, foreign currency translation, and fair value adjustments related to derivative instruments.
Pre-production costs related to long-term supply arrangements: The Company’s policy for engineering, research and development, and other design and development costs related to products that will be sold under long-term supply arrangements requires such costs to be expensed as incurred. Costs for molds, dies, and other tools used to manufacture products that will be sold under long-term supply arrangements are capitalized if the Company has title to the assets or when customer reimbursement is assured.
Product warranties: The Company offers warranties on the sales of certain of its products and records accruals for estimated future claims. Such accruals are established based on an evaluation of historical warranty experience and management’s estimate of level of future claims.
Revenue recognition: Revenue is recognized from product sales at the time that title and risks and rewards of ownership are transferred to the customer, generally upon shipment. The Company records allowances for discounts, rebates, and product returns at the time of sale as a reduction of revenue as such allowances can be reliably estimated based on historical experience and known trends.
Shipping and handling fees and costs: The Company classifies all amounts invoiced to customers related to shipping and handling as sales. Expenses for transportation of products to customers are recorded as a component of cost of goods sold.
Research and development costs: Research and development costs consist of engineering and development resources and are expensed as incurred. Such costs incurred in the development of new products or significant improvements to existing products were $4.2 million in the year ended December 31, 2016, $5.0 million in the year ended December 31, 2015, $2.1 million in the period June 30, 2014 through December 31, 2014, and $2.7 million in the period January 1, 2014 through June 29, 2014, and are included in selling and administrative expenses on the consolidated statements of operations.
Advertising costs: Advertising costs are charged to selling and administrative expenses as incurred and were $1.9 million in the year ended December 31, 2016, $2.7 million in the year ended December 31, 2015, $1.2 million in the period June 30, 2014 through December 31, 2014, and $1.3 million in the period January 1, 2014 through June 29, 2014.
Transaction-related expenses: The Company incurs transaction-related expenses primarily consisting of professional service fees and costs related to business acquisition activities, including the Business Combination in 2014. The Company recognized transaction-related expenses of $0.0 million in the year ended December 31, 2016, $0.9 million in the year ended December 31, 2015, $2.5 million in the period June 30, 2014 through December 31, 2014 and $27.8 million in the period January 1, 2014 through June 29, 2014. The transaction-related expenses were recognized as incurred in accordance with the applicable accounting guidance.
Use of estimates: The preparation of financial statements in conformity with GAAP requires management to make estimates and assumptions that affect the reported amounts of assets and liabilities and disclosure of contingent assets and liabilities at the date of the financial statements, and the reported amounts of revenues and expenses during the reporting period. Actual results could differ from those estimates.
Concentration risks: The Company’s operations are geographically dispersed and it has a diverse customer base. Management believes bad debt losses resulting from default by a single customer, or defaults by customers in any depressed region or business sector, would not have a material effect on the Company’s financial position, results of operations or cash flows.
During the years ended December 31, 2016, 2015 and 2014 the Company had no individual customers at or above 10% of consolidated net sales. At December 31, 2016, two customers accounted for greater than 10% of the Company’s consolidated accounts receivable balance; these customers each accounted for 12% of the consolidated balance and both customers are served by the acoustics segment. At December 31, 2015, one customer served by the acoustics segment
75
Jason Industries, Inc.
Notes to Consolidated Financial Statements
(In thousands, except share and per share amounts)
accounted for greater than 10% of the Company’s consolidated accounts receivable balance, accounting for 15% of the consolidated balance.
Reclassification: Certain prior period amounts within operating activities in the statements of cash flows have been reclassified to Accrued income taxes from Other-net to conform with the current period presentation. Other reclassifications related to the adoption of recently issued accounting standards are discussed below.
Recently issued accounting standards
Accounting standards adopted in the current fiscal period
In August 2014, the the Financial Accounting Standards Board (“FASB”) issued Accounting Standards Update (“ASU”) 2014-15, “Disclosure of Uncertainties about an Entity’s Ability to Continue as a Going Concern” (“ASU 2014-15”). ASU 2014-15 provides guidance on determining when and how reporting entities must disclose going-concern uncertainties in their financial statements. The standard requires management to perform interim and annual assessments of an entity’s ability to continue as a going concern within one year of the date of issuance of the entity’s financial statements (or within one year after the date on which the financial statements are available to be issued, when applicable). Further, an entity must provide certain disclosures if there is substantial doubt about the entity’s ability to continue as a going concern. ASU 2014-15 is effective for annual periods ending after December 15, 2016, and interim periods thereafter. The adoption of this guidance did not have an impact on the Company’s consolidated financial statements.
In February 2015, the FASB issued ASU 2015-02, “Consolidation (Topic 810): Amendments to the Consolidation Analysis” (“ASU 2015-02”), which amends existing consolidation guidance for reporting organizations such as limited partnerships and other similar entities that are required to evaluate whether they should consolidate certain legal entities. This guidance is effective for fiscal years beginning after December 15, 2015, including interim periods within that reporting period. The adoption of this guidance did not have an impact on the Company’s consolidated financial statements.
In April 2015, the FASB issued ASU 2015-03, “Simplifying the Presentation of Debt Issuance Costs” (“ASU 2015-03”). This standard requires the presentation of debt issuance costs in the balance sheet as a deduction from the carrying amount of the related debt liability instead of as a deferred charge. The standard does not affect the recognition and measurement of debt issuance costs; therefore, the amortization of such costs continues to be reported as interest expense. This guidance is applied on a retrospective basis to all prior periods. The Company adopted ASU 2015-03 effective April 1, 2016. Accordingly, $9.1 million of debt issuance costs, previously included within other long-term assets, have been reclassified as a reduction of long-term debt in the December 31, 2015 consolidated balance sheet.
In August 2015, the FASB issued ASU 2015-15, “Presentation and Subsequent Measurement of Debt Issuance Costs Associated with Line of Credit Arrangements” (“ASU 2015-15”). ASU 2015-15 indicates that previously issued guidance did not address presentation or subsequent measurement of debt issuance costs related to line of credit arrangements. Given the absence of authoritative guidance, the Securities and Exchange Commission (“SEC”) staff has indicated that they would not object to an entity deferring and presenting debt issuance costs as assets and amortizing the deferred costs ratably over the term of the line of credit arrangement, regardless of whether there are any outstanding borrowings on the line of credit arrangement. The Company adopted ASU 2015-15 effective April 1, 2016. There was no impact to previously reported consolidated statements of operations, consolidated statements of comprehensive loss, consolidated balance sheets, or consolidated statements of cash flows as a result of the adoption of this standard.
In September 2015, the FASB issued ASU 2015-16, “Simplifying the Accounting for Measurement Period Adjustments” (“ASU 2015-16”). ASU 2015-16 requires an acquirer to recognize adjustments to provisional amounts that are identified during the measurement period in the reporting period in which the adjustment amounts are determined. ASU 2015-16 is effective for interim and annual periods beginning after December 15, 2015. The adoption of this guidance did not have an impact on the Company’s consolidated financial statements.
In March 2016, the FASB issued ASU 2016-09, “Compensation-Stock Compensation (Topic 718): Improvements to Employee Share-Based Payment Accounting” (“ASU 2016-09”). This standard simplifies several aspects of the accounting for share-based payment award transactions, including recognition of income tax consequences of stock compensation, classification of awards as either equity or liabilities, accounting for forfeitures, and classification on the statement of cash flows. For public entities, ASU 2016-09 is effective for fiscal years, and interim periods within those fiscal years, beginning after December 15, 2016, with early adoption permissible in any interim or annual period. The Company early adopted ASU 2016-09 effective April 1, 2016. As a result of the adoption, there was an impact of $1.1 million to the consolidated statement of cash flows for the year ended December 31, 2015 which resulted in the minimum tax withholding requirements for share vesting to be reclassified from other-net within cash flows from operating activities to other financing activities-net within cash
76
Jason Industries, Inc.
Notes to Consolidated Financial Statements
(In thousands, except share and per share amounts)
flows from financing activities. There was no impact to previously reported consolidated statements of operations, consolidated statements of comprehensive loss, or consolidated balance sheets.
Accounting standards to be adopted in future fiscal periods
In May 2014, the FASB issued ASU 2014-09, “Revenue From Contracts With Customers” (“ASU 2014-09”). ASU 2014-09 outlines a single comprehensive model for entities to use in accounting for revenue arising from contracts with customers and supersedes most current revenue recognition guidance, including industry-specific guidance. The standard is based on the principle that an entity should recognize revenue to depict the transfer of goods or services to customers in an amount that reflects the consideration to which the entity expects to be entitled in exchange for those goods or services. ASU 2014-09 also requires additional disclosure about the nature, amount, timing and uncertainty of revenue and cash flows arising from customer contracts, including significant judgments and changes in judgments and assets recognized from costs incurred to fulfill a contract. Entities have the option of using either a full retrospective or a modified retrospective approach for the adoption of the new standard. On July 9, 2015, the FASB voted to defer the effective date of ASU 2014-09 by one year to December 15, 2017, for interim and annual reporting periods beginning after that date and permitted early adoption of the standard, but not before the original effective date of December 15, 2016. The ASU becomes effective for the Company at the beginning of its 2018 fiscal year. In 2016 and 2017, the FASB issued several ASU’s related to ASU 2014-09, which simplify and provide additional guidance to companies for implementation of the standard. The Company is evaluating the recently issued guidance on practical expedients in order to select a transition method, and we currently anticipate adopting the standard in 2018. The Company is also assessing the impact that ASU 2014-09 will have on its consolidated financial statements and disclosures. This evaluation includes completing an inventory of revenue streams by like contracts to allow for ease of implementation, monitoring developments for the manufacturing industry, and evaluating potential changes to our business processes, systems, and controls to support the recognition and disclosure under the new standard.
In July 2015, the FASB issued ASU 2015-11, “Simplifying the Measurement of Inventory” (“ASU 2015-11”). Under ASU 2015-11, inventory will be measured at the “lower of cost and net realizable value” and options that currently exist for “market value” will be eliminated. ASU 2015-11 defines net realizable value as the “estimated selling prices in the ordinary course of business, less reasonably predictable costs of completion, disposal, and transportation.” No other changes were made to the current guidance on inventory measurement. ASU 2015-11 is effective for interim and annual periods beginning after December 15, 2016. Early adoption is permitted and should be applied prospectively. The Company intends to adopt this standard at the beginning of its 2017 fiscal year and has determined that this standard will not have a significant impact on its consolidated financial statements.
In January 2016, the FASB issued ASU 2016-01, “Financial Instruments - Overall (Subtopic 825-10): Recognition and Measurement of Financial Assets and Financial Liabilities” (“ASU 2016-01”). The updated guidance enhances the reporting model for financial instruments, which includes amendments to address aspects of recognition, measurement, presentation and disclosure. The amendment to the standard is effective for interim and annual periods beginning after December 15, 2017. The Company is currently assessing the impact that this standard will have on its consolidated financial statements.
In February 2016, the FASB issued ASU 2016-02, “Leases (Topic 842)” (“ASU 2016-02”). ASU 2016-02 establishes new accounting and disclosure requirements for leases. This standard requires lessees to classify most leases as either finance or operating leases and to initially recognize a lease liability and right-of-use asset. Entities may elect to account for certain short-term leases (with a term of 12 months or less) using a method similar to the current operating lease model. The statements of operations will include, for finance leases, separate recognition of interest on the lease liability and amortization of the right-of use asset and for operating leases, a single lease cost, calculated so that the cost of the lease is allocated over the lease term on a straight-line basis. ASU 2016-02 is effective for annual reporting periods beginning after December 15, 2018, including interim periods within those annual reporting periods, with early adoption permitted. This standard must be applied using a modified retrospective approach, which requires recognition and measurement of leases at the beginning of the earliest period presented, with certain practical expedients available. The Company is currently working to complete an inventory of all of its lease contracts and currently intends to adopt the standard in the first quarter of fiscal 2019. The Company expects this ASU to have a material impact on its consolidated financial statements upon recognition of the lease liability and right-of-use asset for lease contracts which are currently accounted for as operating leases.
In August 2016, the FASB issued ASU 2016-15, “Statement of Cash Flows (Topic 230), Classification of Certain Cash Receipts and Cash Payments” (“ASU 2016-15”), which provides guidance on eight specific cash flow classification issues. ASU 2016-15 is effective for annual reporting periods beginning after December 15, 2017, with early adoption permitted. The Company currently intends to adopt this standard at the beginning of its 2018 fiscal year and has determined that this standard will not have a significant impact on its consolidated financial statements.
77
Jason Industries, Inc.
Notes to Consolidated Financial Statements
(In thousands, except share and per share amounts)
In October 2016, the FASB issued ASU 2016-16, “Income Taxes (Topic 740): Intra-Entity Transfers of Assets Other Than Inventory” (“ASU 2016-16”). ASU 2016-16 will require companies to recognize the income tax effects of intercompany sales and transfers of assets other than inventory in the period in which the transfer occurs. The guidance is effective for annual periods beginning after December 15, 2017 and requires companies to apply a modified retrospective approach with a cumulative catch-up adjustment to opening retained earnings in the period of adoption. Early adoption is permitted. The Company is currently assessing the impact that this standard will have on its consolidated financial statements.
In January 2017, the FASB issued ASU 2017-04, “Intangibles—Goodwill and Other (Topic 350): Simplifying the Test for Goodwill Impairment” (“ASU 2017-04”). ASU 2017-04 eliminates Step 2 from the goodwill impairment test. Instead, an entity should perform its annual or interim goodwill impairment test by comparing the fair value of a reporting unit with its carrying amount and recognize an impairment charge for the amount by which the carrying amount exceeds the reporting unit's fair value, not to exceed the total amount of goodwill allocated to the reporting unit. ASU 2017-04 is effective for annual periods beginning after December 15, 2019. Early adoption is permitted for goodwill impairment tests performed on testing dates after January 1, 2017. The Company is currently evaluating the planned timing of adoption of this standard. The impact of this standard on its consolidated financial statements is dependent upon the results of future tests for goodwill impairment.
2. | Consummation of Business Combination |
On June 30, 2014, the Company and Jason completed the Business Combination in which JPHI Holdings Inc. (“JPHI”), a majority owned subsidiary of the Company, acquired 100 percent of the capital stock of Jason. The purchase price of $536.0 million was funded by the cash proceeds from the Company’s initial public offering, new debt, the issuance of 45,000 shares of 8% Series A Convertible Perpetual Preferred Stock (the “Series A Preferred Stock”) and $35.8 million of rollover equity invested by Jason’s former owners and management of Jason (collectively the “Rollover Participants”). For the period January 1, 2014 through June 29, 2014 and the period June 30, 2014 through December 31, 2014, the Company incurred approximately $27.8 million and $1.2 million, respectively, of transaction expenses directly related to the Business Combination.
Following the consummation of the Business Combination, Jason became an indirect majority-owned subsidiary of the Company, with the Company then owning approximately 83.1 percent of JPHI and the Rollover Participants then owning a noncontrolling interest of approximately 16.9 percent of JPHI. The Rollover Participants received 3,485,623 shares of JPHI, which are exchangeable on a one-for-one basis for shares of common stock of the Company.
In connection with the consummation of the Business Combination, all indebtedness under Jason’s U.S. credit facility was repaid in full, and the Company replaced Jason’s existing credit agreement with a new $460.0 million senior secured credit facility. See Note 9 for further discussion of the senior secured credit facility.
The following unaudited pro forma combined financial information presents the Company’s results as though Jason and the Company had combined at January 1, 2014. Pro forma net earnings attributable to common shareholders were adjusted to exclude $38.4 million of transaction-related expenses incurred for the year ended December 31, 2014. The unaudited pro forma condensed consolidated financial information has been prepared using the acquisition method of accounting in accordance with GAAP.
(Unaudited pro forma) | ||||
December 31, 2014 | ||||
Net sales | $ | 702,486 | ||
Net loss attributable to common shareholders of Jason Industries | $ | (9,683 | ) | |
3. | Acquisitions |
DRONCO GmbH (“DRONCO”)
On May 29, 2015, the Company acquired all of the outstanding shares of DRONCO. DRONCO is a European manufacturer of bonded abrasives. These abrasives are being manufactured and distributed by the finishing segment. The Company paid cash consideration of $34.4 million, net of cash acquired, and, pursuant to the transaction, assumed certain liabilities. The related purchase agreement includes customary representations, warranties and covenants between the named parties.
For the year ended December 31, 2016, the Company had no acquisition-related costs. For the year ended December 31, 2015, the Company recognized $0.9 million of acquisition-related costs related to DRONCO and these costs are included in
78
Jason Industries, Inc.
Notes to Consolidated Financial Statements
(In thousands, except share and per share amounts)
the consolidated statements of operations as “Transaction-related expenses”. For the years ended December 31, 2016 and 2015, $38.5 million and $24.1 million, respectively, of net sales from DRONCO were included in the Company’s consolidated statements of operations.
Pro forma historical results of operations related to the acquisition of DRONCO have not been presented as they are not material to the Company’s consolidated statements of operations.
Herold Partco
On March 25, 2015, the Company acquired Herold Partco Manufacturing, Inc. for $0.4 million. Herold Partco Manufacturing, Inc. is a Cleveland-based manufacturer of industrial brushes. These brushes are now manufactured and distributed by the finishing segment and sold under the Osborn brand name. The acquisition of Herold Partco Manufacturing, Inc. was not material to the Company’s consolidated financial statements.
4. | Sale of Joint Ventures |
At December 31, 2013, the Company had agreed to terms to sell its interest in two of its joint ventures. During the predecessor period, the Company completed the sale of these joint ventures for a total of $11.5 million. The sale of one of the joint ventures for $7.5 million was completed in January 2014, and the sale of the second joint venture for $4.0 million was completed in March 2014. The Company recorded a $3.5 million gain on the sale of the joint ventures, which is reported separately on the consolidated statements of operations. The gain includes the recognition of $0.6 million of cumulative translation adjustments which had been recorded in accumulated other comprehensive loss. The $0.6 million is reported separately in the consolidated statements of comprehensive loss. Terms of the sale included a supply agreement that allowed the Company to purchase product at established prices over the agreement’s three-year term.
5. | Restructuring Costs |
On March 1, 2016, as part of a strategic review of organizational structure and operations, the Company announced a global cost reduction and restructuring program (the “2016 program”). The 2016 program, as used herein, refers to costs related to various restructuring activities across business segments. This includes entering into severance and termination agreements with employees and footprint rationalization activities, including exit and relocation costs for the consolidation and closure of plant facilities and lease termination costs. These activities were ongoing during 2016 and are expected to be completed in 2017.
In 2014 and 2015, the Company incurred certain restructuring costs related to changes to its worldwide manufacturing footprint. These actions resulted in charges relating to employee severance and other related charges, such as exit costs for the consolidation and closure of plant facilities, employee relocation and lease termination costs. These costs related to decisions that preceded the 2016 program and are therefore not considered to be part of such plan. During the period from January 1, 2014 through June 29, 2014, the Company incurred $0.6 million in severance costs, $0.7 million in lease termination costs and $1.3 million in other costs. During the period from June 30, 2014 through December 31, 2014, the Company incurred $0.8 million in severance costs and $0.3 million in other costs. For the year ended December 31, 2015, the Company incurred $1.6 million in severance costs, $1.2 million in lease termination costs and $1.0 million in other costs. The Company did not incur any material charges related to the 2014 or 2015 restructuring activities for the year ended December 31, 2016, and no additional costs are expected for such restructuring activities.
The following table presents the restructuring costs recognized by the Company under the 2016 program by reportable segment. The 2016 program began in the first quarter of 2016 and as such, the restructuring charges for the year ended December 31, 2016 represent the cumulative charges incurred since the inception of the 2016 program. The other costs incurred under the 2016 program primarily include charges related to the closure of the Buffalo Grove facility within the components segment and a loss contingency for certain employment matter claims associated with the wind down of the finishing segment’s facility in São Bernardo do Campo, Brazil. See further discussion within Note 17, “Commitments and Contingencies”. Based on the announced restructuring actions to date, the Company expects to incur a total of approximately $10 million under the 2016 program. These restructuring costs are presented separately on the consolidated statements of operations.
79
Jason Industries, Inc.
Notes to Consolidated Financial Statements
(In thousands, except share and per share amounts)
2016 Program | Seating | Finishing | Acoustics | Components | Corporate | Total | ||||||||||||||||||
Restructuring charges - year ended December 31, 2016 (Successor): | ||||||||||||||||||||||||
Severance costs | $ | 76 | $ | 3,287 | $ | 977 | $ | 378 | $ | 597 | $ | 5,315 | ||||||||||||
Lease termination costs | — | 344 | — | — | — | 344 | ||||||||||||||||||
Other costs | — | 1,003 | 56 | 514 | — | 1,573 | ||||||||||||||||||
Total | $ | 76 | $ | 4,634 | $ | 1,033 | $ | 892 | $ | 597 | $ | 7,232 | ||||||||||||
In addition to the restructuring costs described above, the Company also incurred approximately $1.4 million of additional charges related to the wind down of the finishing segment’s Brazil location, which included $0.7 million of accelerated depreciation of property, plant and equipment - net and $0.7 million of charges to reduce inventory balances, respectively, to decrease such balances to their estimated net realizable values. These costs were presented within cost of goods sold within the consolidated statements of operations.
The following table represents the restructuring liabilities, including both the 2016 program and previous activities:
Severance costs | Lease termination costs | Other costs | Total | ||||||||||||
Balance - December 31, 2015, Successor | $ | 594 | $ | 1,038 | $ | — | $ | 1,632 | |||||||
Current period restructuring charges | 5,315 | 344 | 1,573 | 7,232 | |||||||||||
Cash payments | (4,621 | ) | (1,035 | ) | (514 | ) | (6,170 | ) | |||||||
Foreign currency impact | (7 | ) | (14 | ) | 26 | 5 | |||||||||
Balance - December 31, 2016, Successor | $ | 1,281 | $ | 333 | $ | 1,085 | $ | 2,699 | |||||||
The following table presents the classification of the restructuring liabilities on the consolidated balance sheets. At December 31, 2016, the accrual for lease termination costs relates to restructuring costs associated with a 2016 lease termination in the finishing segment. At December 31, 2015, the accrual for lease termination costs relates to the closure of the Norwalk facility in the acoustics segment. At December 31, 2016, the accrual for other costs of $1.1 million primarily relates to a loss contingency for certain employment matter claims within the finishing segment due to the closure of the Brazil location.
Successor | |||||||||||||||||||||||||||||||
December 31, 2016 | December 31, 2015 | ||||||||||||||||||||||||||||||
Severance costs | Lease termination costs | Other costs | Total | Severance costs | Lease termination costs | Other costs | Total | ||||||||||||||||||||||||
Restructuring liabilities: | |||||||||||||||||||||||||||||||
Recorded in other current liabilities | $ | 1,281 | $ | 333 | $ | 1,085 | $ | 2,699 | $ | 594 | $ | 744 | $ | — | $ | 1,338 | |||||||||||||||
Recorded in other long-term liabilities | — | — | — | — | — | 294 | — | 294 | |||||||||||||||||||||||
Total restructuring liabilities | $ | 1,281 | $ | 333 | $ | 1,085 | $ | 2,699 | $ | 594 | $ | 1,038 | $ | — | $ | 1,632 | |||||||||||||||
6. | Inventories |
Inventories at December 31, 2016 and December 31, 2015 consisted of the following:
Successor | |||||||
December 31, 2016 | December 31, 2015 | ||||||
Raw material | $ | 37,222 | $ | 40,310 | |||
Work-in-process | 4,175 | 4,809 | |||||
Finished goods | 32,204 | 35,313 | |||||
Total inventories | $ | 73,601 | $ | 80,432 | |||
80
Jason Industries, Inc.
Notes to Consolidated Financial Statements
(In thousands, except share and per share amounts)
7. | Property, Plant and Equipment |
Property, plant and equipment at December 31, 2016 and December 31, 2015 consisted of the following:
Successor | |||||||
December 31, 2016 | December 31, 2015 | ||||||
Land and improvements | $ | 9,631 | $ | 10,908 | |||
Buildings and improvements | 41,928 | 41,082 | |||||
Machinery and equipment | 191,770 | 164,843 | |||||
Construction-in-progress | 5,473 | 23,571 | |||||
248,802 | 240,404 | ||||||
Less: Accumulated depreciation | (70,484 | ) | (44,254 | ) | |||
Property, plant and equipment, net | $ | 178,318 | $ | 196,150 | |||
8. | Goodwill and Other Intangible Assets |
Goodwill
Changes in the carrying amount of goodwill by reporting segment was as follows:
Seating | Finishing | Acoustics | Components | Total | |||||||||||||||
Balance as of December 31, 2014 (Successor) | $ | 58,831 | $ | 34,608 | $ | 30,176 | $ | 33,183 | $ | 156,798 | |||||||||
Acquisition of business | — | 10,506 | — | — | 10,506 | ||||||||||||||
Goodwill impairment | (58,831 | ) | — | — | — | (58,831 | ) | ||||||||||||
Foreign currency impact | — | (1,885 | ) | (418 | ) | — | (2,303 | ) | |||||||||||
Balance as of December 31, 2015 (Successor) | $ | — | $ | 43,229 | $ | 29,758 | $ | 33,183 | $ | 106,170 | |||||||||
Goodwill impairment | — | (253 | ) | (29,849 | ) | (33,183 | ) | (63,285 | ) | ||||||||||
Foreign currency impact | — | (819 | ) | 91 | — | (728 | ) | ||||||||||||
Balance as of December 31, 2016 (Successor) | $ | — | $ | 42,157 | $ | — | $ | — | $ | 42,157 | |||||||||
In the fourth quarter of 2016, the Company performed its annual budgeting and strategic planning process, including a re-assessment of the Company’s capital allocation priorities and a review of the short and long-term growth expectations of each business.
In performing the first step of the annual goodwill impairment test in the fourth quarter of 2016, the Company determined that the estimated fair values of the acoustics and components reporting units were lower than the carrying values of the respective reporting units, requiring further analysis under the second step of the impairment test. The decline in the estimated fair value of the acoustics reporting unit was primarily due to lower long-term revenue growth expectations resulting from this strategic review of capital allocation and investment priorities as compared to the Company’s prior growth plan for the business. The fair value of the acoustics reporting unit was also negatively impacted by a projected cyclical decline in the North American automotive industry end-market. The decline in the estimated fair value of the components reporting unit was primarily due to lower long-term revenue expectations resulting from the annual budgeting and strategic planning process as compared to the Company’s prior plan for the business, primarily due to projected longer-term weakness in the rail end-market.
In performing the second step of the impairment testing, the Company performed a theoretical purchase price allocation for the acoustics and components reporting units to determine the implied fair values of goodwill which were compared to the recorded amounts of goodwill for each reporting unit. Upon completion of the second step of the goodwill impairment test, the Company recorded non-cash goodwill impairment charges of $63.0 million, representing full goodwill impairments of $29.8 million and $33.2 million in the acoustics and components reporting units, respectively. The goodwill impairment charges are recorded as impairment charges in the consolidated statements of operations.
In the remaining reporting unit with a goodwill balance, finishing, the percentage by which estimated fair value exceeded carrying value was approximately 18%. The finishing reporting unit includes $42.2 million of goodwill and $38.7 million of amortizable intangible assets as of December 31, 2016. The forecasted financial results of the finishing reporting unit are dependent upon revenue growth, adjusted EBITDA margin expansion, and the funding of capital expenditures supporting restructuring and cost reduction initiatives. The assumptions that have the most significant impact on determination of the finishing reporting unit fair value are the revenue growth rate, including 3 percent in the terminal year, adjusted EBITDA margin expansion from current levels to 18 percent over the next five years, and the weighted average cost of capital (discount
81
Jason Industries, Inc.
Notes to Consolidated Financial Statements
(In thousands, except share and per share amounts)
rate), or 12.1%. A change in any of these assumptions, individually or in the aggregate, or future financial performance that is below management expectations may result in the carrying value of this reporting unit exceeding its fair value, and goodwill and amortizable intangible assets could be impaired.
In the fourth quarter of 2015, the Company determined that the estimated fair value of the seating reporting unit was lower than the carrying value of the reporting unit, requiring further analysis under the second step of the impairment test. The decline in the estimated fair value of the seating reporting unit was primarily due to lower long-term growth expectations resulting from projected long-term weakness in agriculture and heavy industry end-markets, and a strategic shift in capital allocation and investment priorities.
The Company performed a theoretical purchase price allocation for the seating reporting unit to determine the implied fair value of goodwill which was compared to the recorded amount of goodwill. Upon completion of the second step of the goodwill impairment test the Company recorded a non-cash goodwill impairment charge of $58.8 million, representing a complete impairment of goodwill in the seating reporting unit. The goodwill impairment charge is recorded as impairment charges in the consolidated statements of operations.
In connection with the goodwill impairment tests in 2016 and 2015, the Company engaged a third-party valuation firm to assist management with determining fair value estimates for the reporting units in the first step of the goodwill impairment test, and in estimating fair values of tangible and intangible assets used in the second step of the goodwill impairment test. In connection with obtaining an independent third-party valuation, management provided certain information and assumptions that were utilized in the fair value calculation. Significant assumptions used in determining reporting unit fair value include forecasted cash flows, revenue growth rates, adjusted EBITDA margins, weighted average cost of capital (discount rate), assumed tax treatment of a future sale of the reporting unit, terminal growth rates, capital expenditures, sales and EBITDA multiples used in the market approach, and the weighting of the income and market approaches. The fair value of the reporting units is determined using a weighted average of an income approach primarily based on the Company’s three year strategic plan and a market approach based on implied valuation multiples of public company peer groups for each reporting unit. Both approaches are generally deemed equally relevant in determining reporting unit enterprise value, and as a result, weightings of 50 percent were used for each. This fair value determination was categorized as Level 3 in the fair value hierarchy.
At December 31, 2016, goodwill included $122.1 million of accumulated impairment losses, primarily due to $58.8 million related to the seating reporting unit, $29.8 million related to the acoustics reporting unit, and $33.2 million related to the components reporting unit. At December 31, 2015, goodwill included $58.8 million of accumulated impairment losses wholly related to the seating reporting unit.
Other Intangible Assets
The Company’s other amortizable intangible assets consisted of the following:
Successor | |||||||||||||||||||||||
December 31, 2016 | December 31, 2015 | ||||||||||||||||||||||
Gross Carrying Amount | Accumulated Amortization | Net | Gross Carrying Amount | Accumulated Amortization | Net | ||||||||||||||||||
Patents | $ | 1,880 | $ | (366 | ) | $ | 1,514 | $ | 1,800 | $ | (62 | ) | $ | 1,738 | |||||||||
Customer relationships | 110,090 | (16,630 | ) | 93,460 | 110,722 | (8,745 | ) | 101,977 | |||||||||||||||
Trademarks and other intangibles | 57,744 | (8,460 | ) | 49,284 | 58,962 | (4,762 | ) | 54,200 | |||||||||||||||
Total amortized other intangible assets | $ | 169,714 | $ | (25,456 | ) | $ | 144,258 | $ | 171,484 | $ | (13,569 | ) | $ | 157,915 | |||||||||
In connection with the evaluation of the goodwill impairment in the acoustics and components reporting units in 2016, the Company assessed tangible and intangible assets for impairment prior to performing the second step of the goodwill impairment test. As a result of this analysis, it was determined that there were no impairment charges to record related to these assets.
In connection with the evaluation of the goodwill impairment in the seating reporting unit in 2015, the Company assessed tangible and intangible assets for impairment prior to performing the second step of the goodwill impairment test. As a result of this analysis, non-cash impairment charges of $27.7 million, $6.8 million, and $0.8 million were recorded for customer relationship, trademarks, and patents intangible assets, respectively, in the seating reporting unit during the fourth quarter of 2015. These intangible asset impairment charges are recorded as impairment charges in the consolidated statements of operations.
82
Jason Industries, Inc.
Notes to Consolidated Financial Statements
(In thousands, except share and per share amounts)
The approximate weighted average remaining useful lives of the Company’s intangible assets at December 31, 2016 are as follows: patents - 4.6 years; customer relationships - 11.9 years; and trademarks and other intangibles - 12.6 years.
Amortization of intangible assets approximated $12.9 million, $14.1 million, $7.2 million, and $2.7 million for the year ended December 31, 2016, the year ended December 31, 2015, the period June 30, 2014 through December 31, 2014, and the period January 1, 2014 through June 29, 2014, respectively. Excluding the impact of any future acquisitions, the Company anticipates the annual amortization for each of the next five years and thereafter to be the following:
2017 | $ | 12,263 | |
2018 | 12,239 | ||
2019 | 12,239 | ||
2020 | 12,239 | ||
2021 | 12,100 | ||
Thereafter | 83,178 | ||
$ | 144,258 | ||
9. | Debt and Hedging Instruments |
The Company’s debt consisted of the following:
Successor | |||||||
December 31, 2016 | December 31, 2015 | ||||||
First Lien Term Loans | $ | 303,025 | $ | 306,125 | |||
Second Lien Term Loans | 110,000 | 110,000 | |||||
Debt discount on Term Loans | (5,002 | ) | (6,010 | ) | |||
Deferred issuance costs on Term Loans | (7,503 | ) | (9,087 | ) | |||
Foreign debt | 23,303 | 29,731 | |||||
Capital lease obligations | 1,301 | 1,577 | |||||
Total debt | 425,124 | 432,336 | |||||
Less: Current portion | (8,179 | ) | (6,186 | ) | |||
Total long-term debt | $ | 416,945 | $ | 426,150 | |||
Senior Secured Credit Facilities (Successor)
In connection with the consummation of the Business Combination, all indebtedness under Jason’s U.S. credit facility was repaid in full. Jason Incorporated (“Jason Inc”), an indirect majority-owned subsidiary of the Company, as the borrower, replaced Jason’s existing credit agreement with a new $460.0 million U.S. credit facility (the “Senior Secured Credit Facilities”). The new facility included (i) term loans in an aggregate principal amount of $310.0 million (“First Lien Term Loans”) maturing in 2021, of which $303.0 million is outstanding as of December 31, 2016, (ii) term loans in an aggregate principal amount of $110.0 million (“Second Lien Term Loans”) maturing in 2022, and (iii) a revolving loan of up to $40.0 million (“Revolving Credit Facility”) maturing in 2019. Upon the consummation of the Business Combination, the full amount of the First Lien Term Loans and Second Lien Term Loans were drawn, and no revolving loans were drawn. The Company capitalized debt issuance costs of $13.5 million in connection with the refinancing, of which $7.5 million related to the First Lien Term Loans and Second Lien Term Loans and $1.0 million related to the Revolving Credit Facility as of December 31, 2016. Debt issuance costs related to the First Lien Term Loans and Second Lien Term Loans are recorded in total long-term debt, and debt issuance costs related to the Revolving Credit Facility are recorded in other long-term assets. These costs are amortized into interest expense over the life of the respective borrowings on a straight-line basis.
The principal amount of the First Lien Term Loans amortizes in quarterly installments equal to $0.8 million, with the balance payable at maturity. At the Company’s election, the interest rate per annum applicable to the loans under the Senior Secured Credit Facilities is based on a fluctuating rate of interest determined by reference to either (i) a base rate determined by reference to the higher of (a) the “prime rate” of Deutsche Bank AG New York Branch, (b) the federal funds effective rate plus 0.50% and (c) the Eurocurrency rate applicable for an interest period of one month plus 1.00%, plus an applicable margin equal to (x) 3.50% in the case of the First Lien Term Loans, (y) 2.25% in the case of the Revolving Credit Facility or (z) 7.00% in the case of the Second Lien Term Loans or (ii) a Eurocurrency rate determined by reference to London Interbank Offered Rate (“LIBOR”), adjusted for statutory reserve requirements, plus an applicable margin equal to (x) 4.50% in the case of the First Lien Term Loans, (y) 3.25% in the case of the Revolving Credit Facility or (z) 8.00% in the case of the Second Lien Term
83
Jason Industries, Inc.
Notes to Consolidated Financial Statements
(In thousands, except share and per share amounts)
Loans. Borrowings under the First Lien Term Facility and Second Lien Term Facility are subject to a floor of 1.00% in the case of Eurocurrency loans. The applicable margin for loans under the Revolving Credit Facility may be subject to adjustment based upon a consolidated first lien net leverage ratio.
At December 31, 2016, the interest rates on the outstanding balances of the First Lien Term Loans and Second Lien Term Loans were 5.5% and 9.0%, respectively. At December 31, 2016, the Company had a total of $35.0 million of availability for additional borrowings under the Revolving Credit Facility as the Company had no outstanding borrowings and letters of credit outstanding of $5.0 million, which reduce availability under the facility.
Under the Revolving Credit Facility, if the aggregate outstanding amount of all revolving loans, swingline loans and certain letter of credit obligations exceeds 25 percent, or $10.0 million, of the revolving credit commitments at the end of any fiscal quarter, Jason Incorporated and its restricted subsidiaries will be required to not exceed a consolidated first lien net leverage ratio, currently specified at 5.25 to 1.00, with a periodic decrease to 4.50 to 1.00 on December 31, 2017 and remaining at that level thereafter. If such outstanding amounts do not exceed 25 percent of the revolving credit commitments at the end of any fiscal quarter, no financial covenants are applicable. The Company did not draw on its revolver during 2016.
Under the Senior Secured Credit Facilities, the Company is subject to mandatory prepayments if certain requirements are met. At December 31, 2016, a mandatory prepayment of $1.9 million under the Senior Secured Credit Facilities was included within the current portion of long-term debt in the consolidated balance sheets. The mandatory prepayment is in excess of regular current installments due.
Foreign debt
The Company has the following foreign debt obligations, including various overdraft facilities and term loans:
Successor | |||||||
December 31, 2016 | December 31, 2015 | ||||||
Germany | $ | 21,469 | $ | 27,622 | |||
Mexico | 850 | 1,450 | |||||
India | 834 | 16 | |||||
Brazil | 49 | 407 | |||||
Other | 101 | 236 | |||||
Total foreign debt | $ | 23,303 | $ | 29,731 | |||
These various foreign loans are comprised of individual outstanding obligations ranging from approximately $0.1 million to $12.6 million and $0.1 million to $13.1 million as of December 31, 2016 and December 31, 2015, respectively. Certain of the Company’s foreign borrowings contain financial covenants requiring maintenance of a minimum equity ratio and maximum leverage ratio, among others. The Company was in compliance with these covenants as of December 31, 2016.
In connection with the acquisition of DRONCO (a Germany entity), the Company assumed $11.0 million of debt comprised of term loan borrowings totaling $8.5 million and revolving line of credit borrowings totaling $2.5 million. Borrowings bear interest at fixed and variable rates ranging from 2.3% to 4.6% and are subject to repayment in varying amounts through 2030. During 2015, the Company entered into a new $13.5 million term loan in Germany. Borrowings bear interest at a fixed rate of 2.25% and are subject to repayment in equal quarterly payments of approximately $0.4 million beginning September 30, 2017 through June 30, 2025.
Future annual maturities of long-term debt outstanding at December 31, 2016 are as follows:
2017 | $ | 8,179 | ||
2018 | 6,202 | |||
2019 | 7,623 | |||
2020 | 5,799 | |||
2021 | 293,086 | |||
Thereafter | 116,740 | |||
Total future annual maturities of long term debt outstanding | 437,629 | |||
Less: Debt discounts on Term Loans | (5,002 | ) | ||
Less: Deferred issuance costs on Term Loans | (7,503 | ) | ||
Total debt | $ | 425,124 | ||
84
Jason Industries, Inc.
Notes to Consolidated Financial Statements
(In thousands, except share and per share amounts)
Interest Rate Hedge Contracts
The Company is exposed to certain financial risks relating to fluctuations in interest rates. To manage exposure to such fluctuations, the Company entered into forward starting interest rate swap agreements (“Swaps”) in 2015 with notional values totaling $210.0 million at December 31, 2016 and December 31, 2015. The Swaps have been designated by the Company as cash flow hedges in accordance with ASC 815, and effectively fix the variable portion of interest rates on variable rate term loan borrowings at a rate of approximately 2.08% prior to financing spreads and related fees. The Swaps had a forward start date of December 30, 2016 and have an expiration date of June 30, 2020. As such, for the years ended December 31, 2016 and December 31, 2015, there was no interest expense recognized. The Company expects to recognize interest expense of $2.0 million related to the Swaps in 2017.
The fair values of the Company’s Swaps are recorded on the consolidated balance sheets with the corresponding offset recorded as a component of accumulated other comprehensive loss. The fair value of the Swaps totaled $2.0 million at December 31, 2016 and $0.3 million at December 31, 2015, respectively. See the amounts recorded on the consolidated balance sheets within the table below:
Successor | |||||||
December 31, 2016 | December 31, 2015 | ||||||
Interest rate swaps: | |||||||
Recorded in other current liabilities | $ | 1,916 | $ | — | |||
Recorded in other long-term liabilities | 133 | 324 | |||||
Total derivatives designated as hedging instruments | $ | 2,049 | $ | 324 | |||
10. | Lease Obligations |
The Company leases machinery, transportation equipment and office, warehouse and manufacturing facilities under agreements which are accounted for as operating leases. Many of the leases include provisions that enable the Company to renew the lease, and certain leases are subject to various escalation clauses.
Future minimum lease payments required under long-term operating leases in effect at December 31, 2016 are as follows:
2017 | $ | 9,557 | ||
2018 | 8,147 | |||
2019 | 7,352 | |||
2020 | 6,962 | |||
2021 | 6,140 | |||
Thereafter | 12,409 | |||
$ | 50,567 | |||
Total rental expense under operating leases was $13.1 million, $9.8 million, $4.9 million, and $4.8 million for the year ended December 31, 2016, the year ended December 31, 2015, the period June 30, 2014 through December 31, 2014 and the period January 1, 2014 through June 29, 2014, respectively.
11. | Shareholders' (Deficit) Equity |
On June 30, 2014, the Company held a special meeting in lieu of the 2014 Annual Meeting of the Shareholders (the “Special Meeting”) where the Business Combination was approved by the Company’s shareholders. At the Special Meeting, 21,870,040 shares of the Company’s common stock were voted in favor of the proposal to approve the Business Combination and no shares of the Company’s common stock were voted against that proposal. In connection with the closing, the Company redeemed a total of 2,542,667 shares of its common stock pursuant to the terms of the Company’s amended and restated certificate of incorporation, resulting in a total payment to redeeming shareholders of $26.1 million.
At the Special Meeting, the Company’s shareholders approved and adopted a proposal to increase the number of authorized shares of the Company’s common stock and preferred stock from 44,000,000, consisting of 43,000,000 shares of common stock, and 1,000,000 shares of preferred stock, to 125,000,000 shares, consisting of 120,000,000 shares of common stock, and 5,000,000 shares of preferred stock.
85
Jason Industries, Inc.
Notes to Consolidated Financial Statements
(In thousands, except share and per share amounts)
At December 31, 2016, the Company had authorized for issuance 120,000,000 shares of $0.0001 par value common stock, of which 24,802,196 shares were issued and outstanding, and had authorized for issuance 5,000,000 shares of $0.0001 par value preferred stock, of which 45,899 shares were issued and outstanding, including 899 shares declared as a dividend on December 15, 2016 and issued on January 1, 2017.
Series A Preferred Stock
In connection with the consummation of the Business Combination, the Company issued 45,000 shares of Series A Preferred Stock with offering proceeds of $45.0 million and offering costs of $2.5 million. Holders of the Series A Preferred Stock are entitled to cumulative dividends at an 8.0% dividend rate per annum payable quarterly on January 1, April 1, July 1, and October 1 of each year in cash or by delivery of Series A Preferred Stock shares. Holders of the Series A Preferred Stock have the option to convert each share of Series A Preferred Stock initially into approximately 81.18 shares of the Company’s common stock, subject to certain adjustments in the conversion rate.
The Company paid the following dividends on the Series A Preferred Stock during the years ended December 31, 2016 and 2015 and the period from June 30, 2014 through December 31, 2014:
Payment Date | Record Date | Amount Per Share | Total Dividends Paid | |||
October 1, 2014 | August 15, 2014 | $20.22 | $910 | |||
January 1, 2015 | November 15, 2014 | $20.00 | $900 | |||
April 1, 2015 | February 15, 2015 | $20.00 | $900 | |||
July 1, 2015 | May 15, 2015 | $20.00 | $900 | |||
October 1, 2015 | August 15, 2015 | $20.00 | $900 | |||
January 1, 2016 | November 15, 2015 | $20.00 | $900 | |||
April 1, 2016 | February 15, 2016 | $20.00 | $900 | |||
July 1, 2016 | May 15, 2016 | $20.00 | $900 | |||
October 1, 2016 | August 15, 2016 | $20.00 | $900 | |||
On December 15, 2016, the Company announced a $20.00 per share dividend on its Series A Preferred Stock to be paid in additional shares of Series A Preferred Stock on January 1, 2017 to holders of record on November 15, 2016. As of December 31, 2016, the Company has recorded the 899 additional Series A Preferred Stock shares declared for the dividend of $0.9 million within preferred stock in the consolidated balance sheets.
Shareholder Rights Agreement
On September 12, 2016, the Company’s Board of Directors adopted a Shareholder Rights Agreement (the “Rights Agreement”) between the Company and Continental Stock Transfer & Trust Company, as rights agent. Pursuant to the Rights Agreement, the Company declared a dividend of one preferred share purchase right (a “Right”) for each outstanding share of the Company’s common stock, payable to the shareholders of record on September 16, 2016. New Rights will accompany any new shares of common stock issued after September 16, 2016. The Rights trade with and are inseparable from our common stock and will not be evidenced by separate certificates unless they become exercisable. The Rights will expire on March 12, 2018.
In general terms, the Rights Agreement works by imposing a significant penalty upon any person or group which acquires 30% or more of the Company’s outstanding common stock without the approval of the Company’s Board of Directors.
Each Right will allow its holder to purchase from the Company one one-thousandth of a share of Series A Junior Participating Preferred Stock for $10.00, subject to adjustment as set forth in the Rights Agreement, once the Rights become exercisable. Per the Rights Agreement, the Rights will not be exercisable until the earlier of (1) 10 days after the public announcement that a person or group has become an Acquiring Person (as defined in the Rights Agreement) by obtaining beneficial ownership of 30% or more of the Company’s outstanding common stock or (2) 10 business days (or such later date as the Company’s Board of Directors shall determine) following the commencement of a tender offer or exchange offer that would result in a person or group becoming an Acquiring Person.
Warrant Tender Offer
On May 6, 2014, Jason commenced a tender offer to purchase up to 9,200,000 of its outstanding warrants subject to certain conditions, including the consummation of the Business Combination. On July 18, 2014, the tender offer expired and a
86
Jason Industries, Inc.
Notes to Consolidated Financial Statements
(In thousands, except share and per share amounts)
total of 4,406,227 warrants were validly tendered at a purchase price of $1.50 per warrant, for a total purchase price of $6.6 million.
After completion of the warrant tender offer, 13,993,773 warrants remain outstanding as of December 31, 2016. Each outstanding warrant entitles the registered holder to purchase one share of the Company’s common stock at a price of $12.00 per share, subject to adjustment, at any time commencing on July 30, 2014. The warrants will expire on June 30, 2019, or earlier upon redemption.
In February 2015, the Company’s Board of Directors authorized the purchase of up to $5.0 million of the Company’s outstanding warrants. Management is authorized to effect purchases from time to time in the open market or through privately negotiated transactions. There is no expiration date to this authority. No warrants were repurchased during the years ended December 31, 2016 and 2015.
Exchange of common stock of JPHI Holdings, Inc. for common stock of Jason Industries, Inc.
Following the consummation of the Business Combination, Jason became an indirect majority-owned subsidiary of the Company, with the Company then owning approximately 83.1 percent of JPHI and the Rollover Participants then owning a noncontrolling interest of approximately 16.9 percent of JPHI. The Rollover Participants received 3,485,623 shares of JPHI, which are exchangeable on a one-for-one basis for shares of common stock of the Company.
In November and December 2016, certain Rollover Participants exchanged 2,401,616 shares of JPHI stock for Company common stock, which decreased the noncontrolling interest to 6.0 percent. The decrease to the noncontrolling interest as a result of the exchange resulted in an increase in both accumulated other comprehensive loss and additional paid-in capital to reflect the Company’s increased ownership in JPHI. As of December 31, 2016, 1,084,007 shares of JPHI stock were still held by the Rollover Participants.
Accumulated Other Comprehensive Loss
The changes in the components of accumulated other comprehensive loss, net of taxes, were as follows:
Employee retirement plan adjustments | Foreign currency translation adjustments | Net unrealized gains (losses) on cash flow hedges | Total | ||||||||||||
Balance at December 31, 2013, Predecessor | $ | (156 | ) | $ | 630 | $ | — | $ | 474 | ||||||
Other comprehensive loss before reclassifications | (792 | ) | (465 | ) | — | (1,257 | ) | ||||||||
Amount reclassified from accumulated other comprehensive income | 105 | — | — | 105 | |||||||||||
Cumulative foreign currency translation adjustments associated with joint ventures sold | — | (591 | ) | — | (591 | ) | |||||||||
Balance at June 29, 2014, Predecessor | (843 | ) | (426 | ) | — | (1,269 | ) | ||||||||
Elimination of predecessor accumulated other comprehensive income | 843 | 426 | — | 1,269 | |||||||||||
Other comprehensive loss before reclassifications | (1,434 | ) | (10,631 | ) | (12,065 | ) | |||||||||
Balance at December 31, 2014, Successor | (1,434 | ) | (10,631 | ) | — | (12,065 | ) | ||||||||
Other comprehensive loss before reclassifications | 398 | (9,606 | ) | (273 | ) | (9,481 | ) | ||||||||
Amount reclassified from accumulated other comprehensive income | (15 | ) | — | 105 | 90 | ||||||||||
Balance at December 31, 2015, Successor | (1,051 | ) | (20,237 | ) | (168 | ) | (21,456 | ) | |||||||
Other comprehensive loss before reclassifications | (545 | ) | (4,013 | ) | (870 | ) | (5,428 | ) | |||||||
Amount reclassified from accumulated other comprehensive income | 5 | — | — | 5 | |||||||||||
Exchange of common stock of JPHI Holdings, Inc. for common stock of Jason Industries, Inc. | (186 | ) | (3,154 | ) | (153 | ) | (3,493 | ) | |||||||
Balance at December 31, 2016, Successor | $ | (1,777 | ) | $ | (27,404 | ) | $ | (1,191 | ) | $ | (30,372 | ) | |||
12. | Share Based Compensation |
The Company recognizes compensation expense based on estimated grant date fair values for all share-based awards issued to employees and directors, including restricted stock units and performance share units, which are restricted stock units with vesting conditions contingent upon achieving certain performance goals. The Company estimates the fair value of share-based awards based on assumptions as of the grant date. The Company recognizes these compensation costs for only those awards expected to vest, on a straight-line basis over the requisite service period of the award, which is generally the vesting
87
Jason Industries, Inc.
Notes to Consolidated Financial Statements
(In thousands, except share and per share amounts)
term of three years for restricted stock awards and the performance period for performance share units. Forfeitures are recognized within compensation expense in the period the forfeitures are incurred.
2014 Omnibus Incentive Plan
In connection with the approval of the Business Combination, the 2014 Omnibus Incentive Plan (the “2014 Plan”) was approved by shareholders to provide incentives to key employees of the Company and its subsidiaries. Awards under the 2014 Plan are generally not restricted to any specific form or structure and could include, without limitation, stock options, stock appreciation rights, restricted stock awards and RSUs, performance awards, other stock-based awards, and other cash-based awards. There were 3,473,435 shares of common stock reserved and authorized for issuance under the 2014 Plan. At December 31, 2016, there were 677,434 shares of common stock authorized and available for grant under the 2014 Plan.
Share Based Compensation Expense
Upon completion of the Business Combination, the Compensation Committee of the Company’s Board of Directors approved an initial grant under the 2014 Plan to certain executive officers, senior management employees, and the Board of Directors.
The Company recognized the following share based compensation (income) expense:
Successor | |||||||||||
Year Ended December 31, 2016 | Year Ended December 31, 2015 | June 30, 2014 Through December 31, 2014 | |||||||||
Restricted Stock Units | $ | 1,300 | $ | 2,689 | $ | 1,570 | |||||
Adjusted EBITDA Vesting Awards | (2,399 | ) | 899 | 1,416 | |||||||
Stock Price Vesting Awards | 101 | 1,319 | 1,140 | ||||||||
ROIC Vesting Awards | — | — | — | ||||||||
Subtotal | (998 | ) | 4,907 | 4,126 | |||||||
Impact of accelerated vesting (1) | 246 | 3,062 | — | ||||||||
Total share-based compensation (income) expense | $ | (752 | ) | $ | 7,969 | $ | 4,126 | ||||
Total income tax (provision) benefit recognized | $ | (294 | ) | $ | 3,041 | $ | 1,348 | ||||
(1) For the year ended December 31, 2015, primarily represents the impact of the acceleration of certain vesting schedules for RSUs and stock price vesting awards related to the transition of the Company’s former CEO and CFO.
As of December 31, 2016, $1.2 million of total unrecognized compensation expense related to share-based compensation plans is expected to be recognized over a weighted-average period of 1.4 years. The total unrecognized share-based compensation expense to be recognized in future periods as of December 31, 2016 does not consider the effect of share-based awards that may be issued in subsequent periods.
General Terms of Awards
The Compensation Committee of the Board of Directors has discretion to establish the terms and conditions for grants, including the number of shares, vesting and required service or other performance criteria. RSU and performance share unit awards are subject to forfeiture upon termination of employment prior to vesting, subject in some cases to early vesting, or continued eligibility for vesting, upon specified events, including death or permanent disability of the grantee, termination of the grantee’s employment under certain circumstances or a change in control of the Company. Dividend equivalents on common stock, if any, are accrued for RSUs and performance share units granted to employees and paid in the form of cash or stock depending on the form of the dividend, at the same time that the shares of common stock underlying the unit are delivered to the employee. All RSUs and performance share units granted to employees are payable in shares of common stock and are classified as equity awards.
The rights granted to the recipient of employee RSU awards generally vest annually in equal installments on the anniversary of the grant date over the restriction or vesting period, which is generally three years. Vested RSUs are payable in common stock within a thirty day period following the vesting date. The Company records compensation expense of RSU awards based on the fair value of the awards at the date of grant ratably over the period during which the restrictions lapse.
Performance share unit awards based on cumulative and average performance metrics are payable at the end of their respective performance period in common stock. The number of share units awarded can range from zero to 150% depending
88
Jason Industries, Inc.
Notes to Consolidated Financial Statements
(In thousands, except share and per share amounts)
on achievement of a targeted performance metric, and are payable in common stock within a thirty day period following the end of the performance period. The Company expenses the cost of the performance-based share unit awards based on the fair value of the awards at the date of grant and the estimated achievement of the performance metric, ratably over the performance period of three years.
Performance share unit awards based on achievement of certain established stock price targets are payable in common stock if the last sales price of the Company’s common stock equals or exceeds established stock price targets in any twenty trading days within a thirty trading day period during the performance period. The Company expenses the cost of the stock price-based performance share unit awards based on the fair value of the awards at the date of grant ratably over the derived service period of the award.
The Company also issues RSUs as share-based compensation for members of the Board of Directors. Director RSUs vest one year from the date of grant. In the event of termination of a member’s service on the Board of Directors prior to a vesting date, all unvested RSUs of such holder will be forfeited. Vested RSUs are deferred and then delivered to members of the Board of Directors six months following the termination of their directorship. All awards granted are payable in shares of common stock or cash payment equal to the fair market value of the shares at the discretion of our Compensation Committee, and are classified as equity awards due to their expected settlement in common stock. Compensation expense for these awards is measured based upon the fair value of the awards at the date of grant. Dividend equivalents on common stock are accrued for RSUs awarded to the Board of Directors and paid in the form of cash or stock depending on the form of the dividend, at the same time that the shares of common stock underlying the RSU are delivered to a member of the Board of Directors following the termination of their directorship.
Restricted Stock Units
The following table summarizes RSU activity:
Successor | ||||||||||||||||||||
For the Year Ended December 31, 2016 | For the Year Ended December 31, 2015 | June 30, 2014 Through December 31, 2014 | ||||||||||||||||||
Shares (thousands) | Weighted-Average Grant Date Fair Value | Shares (thousands) | Weighted-Average Grant Date Fair Value | Shares (thousands) | Weighted-Average Grant Date Fair Value | |||||||||||||||
Outstanding at beginning of period | 401 | $ | 8.70 | 762 | $ | 10.50 | — | $ | — | |||||||||||
Granted | 375 | 3.75 | 216 | 6.39 | 762 | 10.50 | ||||||||||||||
Vested | (211 | ) | 7.62 | (582 | ) | 10.50 | — | — | ||||||||||||
Deferred | 62 | 4.24 | 67 | 10.55 | — | — | ||||||||||||||
Forfeited | (73 | ) | 9.04 | (62 | ) | 7.84 | — | — | ||||||||||||
Outstanding at end of period | 554 | $ | 5.22 | 401 | $ | 8.70 | 762 | $ | 10.50 | |||||||||||
As of December 31, 2016, there was $1.2 million of unrecognized share-based compensation expense related to 424,533 RSU awards, with a weighted-average grant date fair value of $4.52, that are expected to vest over a weighted-average period of 1.4 years. Included within the total 553,645 RSU awards outstanding as of December 31, 2016 are 129,112 RSU awards for members of our Board of Directors which have vested and issuance of the shares has been deferred, with a weighted-average grant date fair value of $7.53. The total fair values of shares vested during the years ended December 31, 2016 and 2015 were $0.7 million and $3.4 million, respectively. The fair values of these awards were determined based on the Company’s stock price on the grant date.
In connection with the vesting of RSUs previously issued by the Company, a number of shares sufficient to fund statutory minimum tax withholding requirements was withheld from the total shares issued or released to the award holder (under the terms of the 2014 Plan, the shares are considered to have been issued and are not added back to the pool of shares available for grant). During the years ended December 31, 2016 and 2015, 43,806 and 210,869 shares, respectively, were withheld to satisfy the requirement. The withholding is treated as a reduction in additional paid-in capital in the accompanying consolidated statements of shareholders’ equity.
89
Jason Industries, Inc.
Notes to Consolidated Financial Statements
(In thousands, except share and per share amounts)
Performance Share Units
Adjusted EBITDA Vesting Awards
The following table summarizes adjusted EBITDA vesting awards activity:
Successor | ||||||||||||||||||||
For the Year Ended December 31, 2016 | For the Year Ended December 31, 2015 | June 30, 2014 Through December 31, 2014 | ||||||||||||||||||
Shares (thousands) | Weighted-Average Grant Date Fair Value | Shares (thousands) | Weighted-Average Grant Date Fair Value | Shares (thousands) | Weighted-Average Grant Date Fair Value | |||||||||||||||
Outstanding at beginning of period | 871 | $ | 9.81 | 1,216 | $ | 10.49 | — | $ | — | |||||||||||
Granted | — | — | 142 | 6.33 | 1,216 | 10.49 | ||||||||||||||
Vested | — | — | — | — | — | — | ||||||||||||||
Forfeited | (148 | ) | 10.49 | (487 | ) | 10.49 | — | — | ||||||||||||
Outstanding at end of period | 723 | $ | 9.67 | 871 | $ | 9.81 | 1,216 | $ | 10.49 | |||||||||||
There were no adjusted EBITDA vesting performance share unit awards granted during the year ended December 31, 2016. During the year ended December 31, 2015, 142,238 performance share unit awards were granted to certain executive officers with the same performance targets and vesting period as the awards granted during 2014. During the period June 30, 2014 through December 31, 2014, 1,215,704 performance share unit awards were granted to certain executive officers and senior management employees, payable upon the achievement of certain established cumulative adjusted EBITDA performance targets over a three year performance period. The performance period for the shares awarded during the period June 30, 2014 through December 31, 2014 is July 1, 2014 through June 30, 2017. Distributions under these awards are payable at the end of the performance period in common stock. The total potential payouts for awards granted during the period June 30, 2014 through December 31, 2014 range from zero to 723,318 shares, should certain performance targets be achieved. These awards are subject to forfeiture upon termination of employment prior to vesting, subject in some cases to early vesting or continued eligibility for vesting upon specified events, including death, permanent disability or retirement of the grantee or a change in control of the Company.
During the second quarter of 2016, the Company lowered its estimated vesting of the performance share unit awards from 62.5% of target, or 301,382 shares, to an estimated vesting payout of 0%, or 0 shares, resulting in $2.4 million of share-based compensation income due to declines in profitability. As of December 31, 2016, there was no unrecognized compensation expense related to Adjusted EBITDA based vesting performance share unit awards expected to be recognized in subsequent periods.
Stock Price Vesting Awards
The following table summarizes stock price vesting awards activity:
Successor | ||||||||||||||||||||
For the Year Ended December 31, 2016 | For the Year Ended December 31, 2015 | June 30, 2014 Through December 31, 2014 | ||||||||||||||||||
Shares (thousands) | Weighted-Average Grant Date Fair Value | Shares (thousands) | Weighted-Average Grant Date Fair Value | Shares (thousands) | Weighted-Average Grant Date Fair Value | |||||||||||||||
Nonvested balance - beginning | 878 | $ | 3.27 | 810 | $ | 3.54 | — | $ | — | |||||||||||
Granted | — | — | 95 | 1.08 | 810 | 3.54 | ||||||||||||||
Vested | — | — | — | — | — | — | ||||||||||||||
Forfeited | (537 | ) | 3.54 | (27 | ) | 3.54 | — | — | ||||||||||||
Nonvested balance - end | 341 | $ | 2.85 | 878 | $ | 3.27 | 810 | $ | 3.54 | |||||||||||
There were no stock price vesting performance share unit awards granted during the year ended December 31, 2016. During the year ended December 31, 2015, 94,825 performance share unit awards were granted to certain executive officers with the same established stock price targets and vesting period as the awards granted during 2014. During the period June 30, 2014 through December 31, 2014, 810,469 performance share unit awards were granted to certain executive officers and senior management employees and are payable upon the achievement of certain established stock price targets for the Company’s common stock during a three year performance period. The performance period for the shares awarded during the period June 30, 2014 through December 31, 2014 is July 1, 2014 through June 30, 2017. Distributions under these awards are payable in
90
Jason Industries, Inc.
Notes to Consolidated Financial Statements
(In thousands, except share and per share amounts)
common stock when the last sales price of the Company’s common stock equals or exceeds established stock price targets in any twenty trading days within a thirty trading day period during the performance period.
As of December 31, 2016, there was an immaterial amount of unrecognized compensation expense related to stock price based performance share unit awards, which is expected to be recognized over a weighted average period of 0.4 years.
The following summarizes the assumptions used in the Monte Carlo option pricing model to value stock price vesting awards:
Successor | |||||
For the Year Ended December 31, 2015 | June 30, 2014 Through December 31, 2014 | ||||
Risk-free interest rate | 0.24% - 1.33% | 0.88 | % | ||
Weighted average volatility | 27 | % | 17 | % | |
Dividend yield | — | — | |||
The expected volatility was derived from the closing market price of the Company’s exchange traded warrants to purchase common stock as of the grant date using the Black-Scholes option pricing model.
ROIC Vesting Awards
The following table summarizes stock price vesting awards activity:
Successor | ||||||
For the Year Ended December 31, 2016 | ||||||
Shares (thousands) | Weighted-Average Grant Date Fair Value | |||||
Nonvested balance - beginning | — | $ | — | |||
Granted | 599 | 3.62 | ||||
Vested | — | — | ||||
Forfeited | (86 | ) | 3.46 | |||
Nonvested balance - end | 513 | $ | 3.65 | |||
During the year ended December 31, 2016, 599,336 performance share unit awards were granted to certain executive officers and senior management employees, payable upon the achievement of an average return on invested capital (“ROIC”) performance target during a three year measurement period ending on December 31, 2018. Performance share unit awards based on ROIC performance metrics are payable at the end of their respective performance period in common stock. The total potential payouts for awards granted during the year ended December 31, 2016 range from zero to 513,086 shares, should certain performance targets be achieved. These awards are subject to forfeiture upon termination of employment prior to vesting, subject in some cases to early vesting or continued eligibility for vesting upon specified events, including death, permanent disability or retirement of the grantee or a change in control of the Company.
Compensation expense for ROIC based performance share unit awards outstanding during the year ended December 31, 2016 is currently being recognized based on an estimated payout of 0% of target, or 0 shares. During the fourth quarter of 2016, the Company lowered its estimated vesting of the performance share unit awards from 100% of target, or 342,057 shares, to an estimated vesting payout of 0%. As of December 31, 2016, there was no unrecognized compensation expense related to ROIC based vesting performance share unit awards expected to be recognized in subsequent periods.
Share Based Compensation (Predecessor)
Prior to the consummation of the Business Combination, Jason Partners Holdings LLC, the former parent company of Jason, had granted various classes of its common units to certain executives and directors of Jason. In accordance with ASC 718, Compensation - Stock Compensation, compensation cost related to the units granted was recognized in Jason’s financial statements over the vesting period. Upon consummation of the Business Combination, all unvested units became fully vested and Jason recognized $7.6 million of compensation expense during the predecessor period. During the predecessor period from January 1, 2014 through June 29, 2014, Jason recognized $7.7 million of stock-based compensation expense, and the related income tax benefit was $2.5 million.
91
Jason Industries, Inc.
Notes to Consolidated Financial Statements
(In thousands, except share and per share amounts)
13. | Earnings per Share |
Basic income (loss) per share is calculated by dividing net income (loss) available to Jason Industries’ common shareholders by the weighted average number of common shares outstanding for the period. In computing dilutive income (loss) per share, basic income (loss) per share is adjusted for the assumed issuance of all potentially diluted share-based awards, including public warrants, RSUs, performance share units, convertible preferred stock, and Rollover Shares of JPHI convertible into shares of Jason Industries. Such Rollover Shares were contributed by former owners and management of Jason Partners Holdings Inc. prior to the Company’s acquisition of JPHI. Public warrants (“warrants”) consist of warrants to purchase shares of Jason Industries common stock which are quoted on Nasdaq under the symbol “JASNW.”
The reconciliation of the numerator and denominator of the basic and diluted loss per share calculation and the anti-dilutive shares is as follows:
Successor | Predecessor | |||||||||||||||
Year Ended December 31, 2016 | Year Ended December 31, 2015 | June 30, 2014 Through December 31, 2014 | January 1, 2014 Through June 29, 2014 | |||||||||||||
Net loss per share available to Jason Industries common shareholders | ||||||||||||||||
Basic and diluted loss per share | $ | (3.13 | ) | $ | (3.53 | ) | $ | (0.61 | ) | $ | (4,955 | ) | ||||
Numerator: | ||||||||||||||||
Net loss available to common shareholders of Jason Industries | $ | (70,479 | ) | $ | (78,058 | ) | $ | (13,428 | ) | $ | (4,955 | ) | ||||
Denominator: | ||||||||||||||||
Basic and diluted weighted-average shares outstanding | 22,507 | 22,145 | 21,991 | 1 | ||||||||||||
Weighted average number of anti-dilutive shares excluded from denominator: | ||||||||||||||||
Warrants to purchase Jason Industries common stock | 13,994 | 13,994 | 13,994 | — | ||||||||||||
Conversion of Series A 8% Perpetual Convertible Preferred (1) | 3,656 | 3,653 | 3,653 | — | ||||||||||||
Conversion of JPHI Rollover Shares convertible to Jason Industries common stock (2) | 3,427 | 3,486 | 3,486 | — | ||||||||||||
Restricted stock units | 503 | 589 | 762 | — | ||||||||||||
Performance share units | 1,917 | 1,540 | 2,026 | — | ||||||||||||
Total | 23,497 | 23,262 | 23,921 | — | ||||||||||||
(1) | Includes the impact of 899 additional Series A Preferred Stock shares from a stock dividend declared on December 15, 2016 paid in additional shares of Series A Preferred Stock on January 1, 2017. The Company included the preferred stock within the consolidated balance sheets as of the declaration date. |
(2) | Includes the impact of the exchange by certain Rollover Participants of their JPHI stock for Company common stock in the fourth quarter of 2016. |
Warrants are considered anti-dilutive and excluded when the exercise price exceeds the average market value of the Company’s common stock price during the applicable period. Performance share units are considered anti-dilutive if the performance targets upon which the issuance of the shares is contingent have not been achieved and the respective performance period has not been completed as of the end of the current period. Due to losses available to the Company’s common shareholders for each of the periods presented, potentially dilutive shares are excluded from the diluted net loss per share calculation because they were anti-dilutive under the treasury stock method, in accordance with Accounting Standards Codification Topic 260.
92
Jason Industries, Inc.
Notes to Consolidated Financial Statements
(In thousands, except share and per share amounts)
14. | Income Taxes |
The consolidated loss before income taxes consisted of the following:
Successor | Predecessor | |||||||||||||||
Year Ended December 31, 2016 | Year Ended December 31, 2015 | June 30, 2014 Through December 31, 2014 | January 1, 2014 Through June 29, 2014 | |||||||||||||
Domestic | $ | (93,639 | ) | $ | (126,334 | ) | $ | (26,273 | ) | $ | (19,647 | ) | ||||
Foreign | 9,785 | 14,478 | 4,404 | 14,119 | ||||||||||||
Loss before income taxes | $ | (83,854 | ) | $ | (111,856 | ) | $ | (21,869 | ) | $ | (5,528 | ) | ||||
The consolidated benefit for income taxes included within the consolidated statements of operations consisted of the following:
Successor | Predecessor | |||||||||||||||
Year Ended December 31, 2016 | Year Ended December 31, 2015 | June 30, 2014 Through December 31, 2014 | January 1, 2014 Through June 29, 2014 | |||||||||||||
Current | ||||||||||||||||
Federal | $ | — | $ | 161 | $ | (469 | ) | $ | 1,157 | |||||||
State | 57 | 104 | 103 | 102 | ||||||||||||
Foreign | 7,759 | 5,703 | 2,261 | 3,278 | ||||||||||||
Total current income tax provision | 7,816 | 5,968 | 1,895 | 4,537 | ||||||||||||
Deferred | ||||||||||||||||
Federal | (9,059 | ) | (24,548 | ) | (8,023 | ) | (4,618 | ) | ||||||||
State | (1,781 | ) | (3,196 | ) | (1,584 | ) | (598 | ) | ||||||||
Foreign | (3,133 | ) | (479 | ) | (177 | ) | 106 | |||||||||
Total deferred income tax benefit | (13,973 | ) | (28,223 | ) | (9,784 | ) | (5,110 | ) | ||||||||
Total income tax benefit | $ | (6,157 | ) | $ | (22,255 | ) | $ | (7,889 | ) | $ | (573 | ) | ||||
The income tax benefit recognized in the accompanying consolidated statements of operations differs from the amounts computed by applying the Federal income tax rate to loss before income tax benefit. A reconciliation of income taxes at the Federal statutory rate to the effective tax rate is summarized as follows:
Successor | Predecessor | |||||||||||
Year Ended December 31, 2016 | Year Ended December 31, 2015 | June 30, 2014 Through December 31, 2014 | January 1, 2014 Through June 29, 2014 | |||||||||
Tax at Federal statutory rate of 35% | 35.0 | % | 35.0 | % | 35.0 | % | 35.0 | % | ||||
State taxes - net of Federal benefit | 1.5 | 2.7 | 3.9 | 8.0 | ||||||||
Research and development incentives | 0.5 | 0.4 | 1.5 | 2.1 | ||||||||
Manufacturer's deduction | — | — | — | (0.8 | ) | |||||||
Foreign rate differential | 1.1 | 0.8 | 1.2 | 23.3 | ||||||||
Non-deductible transaction costs | — | — | — | (45.3 | ) | |||||||
Valuation allowances | (1.8 | ) | 0.2 | 0.8 | (8.5 | ) | ||||||
Tax rate change | 0.6 | (1.0 | ) | 0.4 | (1.5 | ) | ||||||
Decrease (increase) in tax reserves | 1.0 | (0.2 | ) | (2.0 | ) | 19.0 | ||||||
Stock compensation expense | (0.6 | ) | (0.7 | ) | (0.9 | ) | (7.6 | ) | ||||
U.S. taxation of foreign earnings(1) | (3.6 | ) | (0.5 | ) | — | (11.9 | ) | |||||
Non-deductible meals and entertainment | (0.1 | ) | (0.1 | ) | (0.4 | ) | (0.7 | ) | ||||
Non-deductible impairment charges(2) | (25.7 | ) | (16.2 | ) | — | — | ||||||
Other | (0.6 | ) | (0.5 | ) | (3.4 | ) | (0.7 | ) | ||||
Effective tax rate | 7.3 | % | 19.9 | % | 36.1 | % | 10.4 | % | ||||
93
Jason Industries, Inc.
Notes to Consolidated Financial Statements
(In thousands, except share and per share amounts)
(1) | During the year ended December 31, 2016, the U.S. taxation of foreign earnings includes the recognition of a deferred tax liability for foreign earnings of the Company’s non-majority owned joint venture holding that are no longer considered permanently reinvested. |
(2) | During the years ended December 31, 2016 and 2015, the non-deductible impairment charges are related to the impairment of goodwill and other intangible assets. |
The Company’s temporary differences which gave rise to deferred tax assets and liabilities were as follows:
Successor | |||||||
December 31, 2016 | December 31, 2015 | ||||||
Deferred tax assets | |||||||
Accrued expenses and reserves | $ | 3,832 | $ | 2,692 | |||
Postretirement and postemployment benefits | 2,662 | 3,031 | |||||
Employee benefits | 2,844 | 7,373 | |||||
Inventories | 2,710 | 2,826 | |||||
Other assets | 3,310 | 2,647 | |||||
Operating loss and credit carryforwards | 22,510 | 12,219 | |||||
Gross deferred tax assets | 37,868 | 30,788 | |||||
Less valuation allowance | (4,879 | ) | (3,703 | ) | |||
Deferred tax assets | 32,989 | 27,085 | |||||
Deferred tax liabilities | |||||||
Property, plant and equipment | (25,993 | ) | (32,551 | ) | |||
Intangible assets and other liabilities | (46,376 | ) | (51,374 | ) | |||
Foreign investments | (2,109 | ) | (259 | ) | |||
Deferred tax liabilities | (74,478 | ) | (84,184 | ) | |||
Net deferred tax liability | $ | (41,489 | ) | $ | (57,099 | ) | |
Amounts recognized in the statement of financial position consist of: | |||||||
Other assets - net | $ | 1,258 | $ | 430 | |||
Deferred income taxes | (42,747 | ) | (57,529 | ) | |||
Net amount recognized | $ | (41,489 | ) | $ | (57,099 | ) | |
At December 31, 2016, the Company has U.S. federal and state net operating loss carryforwards, which expire at various dates through 2036, approximating $41.2 million and $94.2 million, respectively. In addition, the Company has U.S. state tax credit carryforwards of $1.5 million which expire between 2017 and 2031. The Company’s foreign net operating loss carryforwards total approximately $19.3 million (at December 31, 2016 exchange rates). The majority of these foreign net operating loss carryforwards are available for an indefinite period.
Valuation allowances totaling $4.9 million and $3.7 million as of December 31, 2016 and 2015, respectively, have been established for deferred income tax assets primarily related to certain subsidiary loss carryforwards that may not be realized. Realization of the net deferred income tax assets is dependent on generating sufficient taxable income prior to their expiration. Although realization is not assured, management believes it is more-likely-than-not that the net deferred income tax assets will be realized. The amount of the net deferred income tax assets considered realizable, however, could change in the near term if future taxable income during the carryforward period fluctuates.
94
Jason Industries, Inc.
Notes to Consolidated Financial Statements
(In thousands, except share and per share amounts)
Changes in the Company’s gross liability for unrecognized tax benefits, excluding interest and penalties, are as follows for the years ended December 31, 2016, 2015 and 2014:
Successor | Predecessor | |||||||||||||||
Year Ended December 31, 2016 | Year Ended December 31, 2015 | June 30, 2014 Through December 31, 2014 | January 1, 2014 Through June 29, 2014 | |||||||||||||
Balance at beginning of period | $ | 2,928 | $ | 2,743 | $ | 2,020 | $ | 3,691 | ||||||||
Additions (reductions) based on tax positions related to current year | 126 | (28 | ) | 357 | 204 | |||||||||||
Additions based on tax positions related to prior years | — | 55 | — | 271 | ||||||||||||
Additions recognized in acquisition accounting | — | 323 | 508 | — | ||||||||||||
Reductions in tax positions - settlements | — | (111 | ) | (106 | ) | (1,684 | ) | |||||||||
Reductions related to lapses of statute of limitations | (1,173 | ) | (54 | ) | (36 | ) | (462 | ) | ||||||||
Balance at end of period | $ | 1,881 | $ | 2,928 | $ | 2,743 | $ | 2,020 | ||||||||
Of the $1.9 million, $2.9 million, and $2.7 million of unrecognized tax benefits as of December 31, 2016, 2015 and 2014, respectively, approximately $1.6 million, $1.9 million, and $1.0 million, respectively, would impact the effective income tax rate if recognized. The Company recognizes accrued interest and penalties related to unrecognized tax benefits as part of its income tax provision. During the years ended December 31, 2016 and 2015, the Company had an immaterial amount of interest and penalties that were recognized as a component of the income tax provision. During the period June 30, 2014 through December 31, 2014 and the period January 1, 2014 through June 29, 2014 the Company did not have any interest or penalties that were recognized as a component of the income tax provision.
At December 31, 2016 and 2015, the Company has an immaterial amount of accrued interest and penalties related to taxes included within the consolidated balance sheet. During the next twelve months, the Company believes it is reasonably possible that the total amount of unrecognized tax benefits could decrease by $0.1 million.
The Company, along with its subsidiaries, files returns in the U.S. Federal and various state and foreign jurisdictions. With certain exceptions, the Company is subject to examination by U.S. Federal and state taxing authorities for the taxable years in the following table. The Company does not expect the results of these examinations to have a material impact on the Company.
Tax Jurisdiction | Open Tax Years | |
Brazil | 2012 - 2016 | |
France | 2012 - 2016 | |
Germany | 2012 - 2016 | |
Mexico | 2011 - 2016 | |
Sweden | 2011 - 2016 | |
United Kingdom | 2015 - 2016 | |
United States (federal) | 2013 - 2016 | |
United States (state and local) | 2012 - 2016 | |
The cumulative undistributed earnings of all wholly-owned non-U.S. subsidiaries totaled $50.1 million as of December 31, 2016. The Company has not provided any deferred taxes on these undistributed earnings as it considers the undistributed earnings to be permanently reinvested. If all such undistributed earnings were remitted, an additional income tax provision of approximately $14.4 million would have been necessary as of December 31, 2016.
During the second quarter of 2016, the Company changed its assertion regarding the permanent reinvestment of earnings of its non-majority owned joint venture holding. Such change in assertion was driven by several factors. Prior to the second quarter of 2016, the Company had the ability and intent to block the payment of distributions; the Company changed its stance in the second quarter of 2016 to be open to joint venture distributions. This change coincided with the a re-evaluation of the joint venture partners during that quarter of the willingness and ability of the entity to distribute excess cash balances given the maturity, stability and revised growth expectations of the joint venture operations. The impact of this change in assertion was to reduce the income tax benefit for the year ended December 31, 2016 by $2.9 million.
95
Jason Industries, Inc.
Notes to Consolidated Financial Statements
(In thousands, except share and per share amounts)
15. | Employee Benefit Plans |
Defined contribution plans
The Company maintains a 401(k) Plan for substantially all full time U.S. employees (the “401(k) Plan”). Company contributions are allocated to accounts set aside for each employee’s retirement. Employees generally may contribute up to 50% of their compensation to individual accounts within the 401(k) Plan. During 2015, employer contributions changed to 50% on the first 6% of employee’s eligible annual cash compensation, subject to Internal Revenue Service limitations. Prior to the change during 2015, base contributions to employee accounts were equal to 1% of each employee’s eligible annual cash compensation, subject to Internal Revenue Service limitations, and the Company could elect to match up to 75% of the first 6% of each employee’s contribution to the 401(k) Plan, subject to Internal Revenue Service limitations. Expense recognized related to the 401(k) Plan totaled approximately $2.4 million, $1.7 million, $0.6 million, and $1.4 million for the year ended December 31, 2016, the year ended December 31, 2015, the period June 30, 2014 through December 31, 2014, and the period January 1, 2014 through June 29, 2014, respectively.
Defined benefit pension plans
The Company maintains defined benefit pension plans covering union and certain other employees. These plans are frozen to new participation.
The table that follows contains the accumulated benefit obligation and reconciliations of the changes in projected benefit obligation, the changes in plan assets and funded status:
U.S. Plans | Non-U.S. Plans | ||||||||||||||
Successor | Successor | ||||||||||||||
Year Ended December 31, 2016 | Year Ended December 31, 2015 | Year Ended December 31, 2016 | Year Ended December 31, 2015 | ||||||||||||
Accumulated benefit obligation | $ | 10,626 | $ | 10,824 | $ | 13,162 | $ | 12,988 | |||||||
Change in projected benefit obligation | |||||||||||||||
Projected benefit obligation at beginning of year | $ | 10,824 | $ | 11,508 | $ | 12,988 | $ | 14,548 | |||||||
Service cost | — | — | 155 | 125 | |||||||||||
Interest cost | 425 | 410 | 391 | 384 | |||||||||||
Actuarial loss (gain) | 70 | (419 | ) | 1,842 | (430 | ) | |||||||||
Benefits paid | (693 | ) | (675 | ) | (506 | ) | (596 | ) | |||||||
Other | — | — | 7 | — | |||||||||||
Currency translation adjustment | — | — | (1,345 | ) | (1,043 | ) | |||||||||
Projected benefit obligation at end of year | $ | 10,626 | $ | 10,824 | $ | 13,532 | $ | 12,988 | |||||||
Change in plan assets | |||||||||||||||
Fair value of plan assets at beginning of year | 8,985 | 10,019 | 6,393 | 6,691 | |||||||||||
Actual return on plan assets | 906 | (319 | ) | 940 | 94 | ||||||||||
Employer and employee contributions | 145 | — | 497 | 517 | |||||||||||
Benefits paid | (693 | ) | (675 | ) | (510 | ) | (581 | ) | |||||||
Other | (61 | ) | (40 | ) | — | — | |||||||||
Currency translation adjustment | — | — | (1,004 | ) | (328 | ) | |||||||||
Fair value of plan assets at end of year | $ | 9,282 | $ | 8,985 | $ | 6,316 | $ | 6,393 | |||||||
Funded Status | $ | (1,344 | ) | $ | (1,839 | ) | $ | (7,216 | ) | $ | (6,595 | ) | |||
Weighted-average assumptions | |||||||||||||||
Discount rates | 3.71%-3.90% | 3.87%-4.15% | 1.70%-2.60% | 2.20%-3.70% | |||||||||||
Rate of compensation increase | N/A | N/A | 2.00%-3.90% | 2.00%-3.60% | |||||||||||
Amounts recognized in the statement of financial position consist of: | |||||||||||||||
Non-current assets | 1,409 | 837 | — | — | |||||||||||
Other current liabilities | — | — | (65 | ) | (68 | ) | |||||||||
Other long-term liabilities | (2,753 | ) | (2,676 | ) | (7,151 | ) | (6,527 | ) | |||||||
Net amount recognized | $ | (1,344 | ) | $ | (1,839 | ) | $ | (7,216 | ) | $ | (6,595 | ) | |||
96
Jason Industries, Inc.
Notes to Consolidated Financial Statements
(In thousands, except share and per share amounts)
The following table contains the components of net periodic benefit cost:
U.S. Plans | Non-U.S. Plans | ||||||||||||||||||||||||||||||||
Successor | Predecessor | Successor | Predecessor | ||||||||||||||||||||||||||||||
Year Ended December 31, 2016 | Year Ended December 31, 2015 | June 30, 2014 Through December 31, 2014 | January 1, 2014 Through June 29, 2014 | Year Ended December 31, 2016 | Year Ended December 31, 2015 | June 30, 2014 Through December 31, 2014 | January 1, 2014 Through June 29, 2014 | ||||||||||||||||||||||||||
Components of Net Periodic Benefit Cost | |||||||||||||||||||||||||||||||||
Service cost | $ | — | $ | — | $ | — | $ | — | $ | 155 | $ | 125 | $ | 93 | $ | 85 | |||||||||||||||||
Interest cost | 425 | 410 | 207 | 226 | 391 | 384 | 243 | 285 | |||||||||||||||||||||||||
Expected return on plan assets | (513 | ) | (580 | ) | (311 | ) | (319 | ) | (253 | ) | (255 | ) | (6 | ) | (166 | ) | |||||||||||||||||
Amortization of actuarial gain/loss | 27 | — | — | — | 7 | — | — | 130 | |||||||||||||||||||||||||
Recognized net actuarial loss/ settlements/curtailments | — | — | — | (2 | ) | — | — | — | (20 | ) | |||||||||||||||||||||||
Net periodic (benefit) cost | $ | (61 | ) | $ | (170 | ) | $ | (104 | ) | $ | (95 | ) | $ | 300 | $ | 254 | $ | 330 | $ | 314 | |||||||||||||
Weighted-average assumptions | |||||||||||||||||||||||||||||||||
Discount rates | 3.87%-4.15% | 3.52%-3.75% | 3.73%-4.00% | 4.50% | 2.20%-3.70% | 2.10%-3.50% | 2.80%-4.30% | 3.50%-4.60% | |||||||||||||||||||||||||
Rate of compensation increase | N/A | N/A | N/A | N/A | 2.00%-3.60% | 2.00%-3.70% | 2.00%-3.90% | 2.00%-4.00% | |||||||||||||||||||||||||
Expected long-term rates or return | 5.50%-7.00% | 5.00%-8.00% | 5.25%-8.00% | 5.25%-8.00% | 4.00%-4.20% | 3.90%-4.50% | 4.50%-4.90% | 4.50%-5.20% | |||||||||||||||||||||||||
The expected return on plan assets is based on the Company’s expectation of the long-term average rate of return of the capital markets in which the plans invest. The expected return reflects the target asset allocations and considers the historical returns earned for each asset category. The Company determines the discount rate assumptions by referencing high-quality long-term bond rates that are matched to the duration of our benefit obligations, with appropriate consideration of local market factors, participant demographics and benefit payment terms.
The net amounts recognized in accumulated other comprehensive loss related to the Company’s defined benefit pension plans consisted of the following:
Successor | Predecessor | |||||||||||||||
Year Ended December 31, 2016 | Year Ended December 31, 2015 | June 30, 2014 Through December 31, 2014 | January 1, 2014 Through June 29, 2014 | |||||||||||||
Unrecognized loss | $ | 1,994 | $ | 1,364 | $ | 1,441 | $ | 606 | ||||||||
In the next fiscal year, $0.1 million of unrecognized loss within accumulated other comprehensive loss is expected to be recognized as a component of net periodic benefit cost.
The Company’s investment policies employ an approach whereby a mix of equities and fixed income investments are used to maximize the long-term return on plan assets for a prudent level of risk. The investment portfolio primarily contains a diversified blend of equity and fixed income investments. Equity investments are diversified across domestic and non-domestic stocks, and investment and market risk are measured and monitored on an ongoing basis. The Company’s actual asset allocations are in line with target allocations and the Company does not have concentration within individual or similar investments that would pose a significant concentration risk to the Company.
97
Jason Industries, Inc.
Notes to Consolidated Financial Statements
(In thousands, except share and per share amounts)
The Company’s pension plan asset allocations by asset category at December 31, 2016 and 2015 are as follows:
Successor | |||||||||||
U.S. Plans | Non-U.S. Plans | ||||||||||
2016 | 2015 | 2016 | 2015 | ||||||||
Equity securities | 56.0 | % | 52.2 | % | 45.5 | % | 45.9 | % | |||
Debt securities | 35.1 | % | 40.9 | % | 50.7 | % | 50.2 | % | |||
Other | 8.9 | % | 6.9 | % | 3.8 | % | 3.9 | % | |||
The fair values of pension plan assets by asset category at December 31, 2016 and 2015 are as follows:
Total as of December 31, 2016 | Level 1 | Level 2 | Level 3 | ||||||||||||
Cash and cash equivalents | $ | 842 | $ | 842 | $ | — | $ | — | |||||||
Accrued dividends | 3 | 3 | — | — | |||||||||||
Global equities | 8,066 | 8,066 | — | — | |||||||||||
Fixed income securities | 6,461 | — | 6,461 | — | |||||||||||
Group annuity/insurance contracts | 226 | — | — | 226 | |||||||||||
Total | $ | 15,598 | $ | 8,911 | $ | 6,461 | $ | 226 | |||||||
Total as of December 31, 2015 | Level 1 | Level 2 | Level 3 | ||||||||||||
Cash and cash equivalents | $ | 635 | $ | 635 | $ | — | $ | — | |||||||
Accrued dividends | 3 | 3 | — | — | |||||||||||
Global equities | 7,626 | 7,626 | — | — | |||||||||||
Fixed income securities | 6,879 | — | 6,879 | — | |||||||||||
Group annuity/insurance contracts | 235 | — | — | 235 | |||||||||||
Total | $ | 15,378 | $ | 8,264 | $ | 6,879 | $ | 235 | |||||||
The fair value measurement of plan assets using significant unobservable inputs (Level 3) changed during 2016 due to the following:
Beginning balance, December 31, 2015 (Successor) | $ | 235 | |
Actual return on assets related to assets still held | 11 | ||
Purchases, sales and settlements | (20 | ) | |
Ending balance, December 31, 2016 (Successor) | $ | 226 | |
No assets were transferred between levels of the fair value hierarchy during the years ended December 31, 2016 and December 31, 2015.
Quoted market prices are used to value investments when available. Investments in securities traded on exchanges are valued at the last reported sale prices on the last business day of the year or, if not available, the last reported bid prices.
The Company’s cash contributions to its defined benefit pension plans in 2017 are estimated to be approximately $0.8 million. Estimated projected benefit payments from the plans as of December 31, 2016 are as follows:
2017 | $ | 1,205 | |
2018 | 1,172 | ||
2019 | 1,132 | ||
2020 | 1,310 | ||
2021 | 1,272 | ||
2022-2026 | 6,288 | ||
Multiemployer plan
Morton hourly union employees were covered under the National Shopmen Pension Fund (EIN 52-6122274, plan number 001), a union-sponsored and trusteed multiemployer plan which required the Company to contribute a negotiated amount per hour worked by the employees covered by the plan. The Company made the decision to withdraw from this plan in
98
Jason Industries, Inc.
Notes to Consolidated Financial Statements
(In thousands, except share and per share amounts)
August 2012. The withdrawal amount was finalized during 2013. As of December 31, 2016, a liability of $1.7 million is recorded within other long-term liabilities and a liability of $0.2 million is recorded within other current liabilities on the consolidated balance sheets. As of December 31, 2015, $2.1 million is recorded within other long-term liabilities on the consolidated balance sheets. The total liability will be paid in equal monthly installments through April 2026, and interest expense will be incurred associated with the discounting of this liability through that date.
Postretirement health care and life insurance plans
The Company also provides postretirement health care benefits and life insurance coverage to certain eligible former employees at one of its segments. The costs of retiree health care benefits and life insurance coverage are accrued over the employee benefit period.
The table that follows contains the accumulated benefit obligation and reconciliations of the changes in projected benefit obligation, the changes in plan assets and funded status:
Successor | |||||||
Year Ended December 31, 2016 | Year Ended December 31, 2015 | ||||||
Accumulated benefit obligation | $ | 1,972 | $ | 2,094 | |||
Change in projected benefit obligation | |||||||
Projected benefit obligation at beginning of year | $ | 2,094 | $ | 2,808 | |||
Interest cost | 76 | 92 | |||||
Actuarial gain | (37 | ) | (634 | ) | |||
Benefits paid | (161 | ) | (172 | ) | |||
Curtailment | — | — | |||||
Projected benefit obligation at end of year | $ | 1,972 | $ | 2,094 | |||
Change in plan assets | |||||||
Employer contributions | $ | 161 | $ | 172 | |||
Benefits paid | (161 | ) | (172 | ) | |||
Fair value of plan assets at end of year | $ | — | $ | — | |||
Funded Status | $ | (1,972 | ) | $ | (2,094 | ) | |
Weighted-average assumptions | |||||||
Discount rates | 3.64 | % | 3.82 | % | |||
Amounts recognized in the statement of financial position consist of: | |||||||
Other current liabilities | $ | (208 | ) | $ | (211 | ) | |
Other long-term liabilities | (1,764 | ) | (1,883 | ) | |||
Net amount recognized | $ | (1,972 | ) | $ | (2,094 | ) | |
The assumed health care cost trend rate used in measuring the accumulated postretirement benefit obligation was a blended rate of 5.50% and 5.70% at December 31, 2016 and December 31, 2015, respectively. It was assumed that these rates will decline by 1% to 2% every 5 years for the next 15 years. An increase or decrease in the medical trend rate of 1% would increase or decrease the accumulated postretirement benefit obligation by approximately $0.1 million and $0.1 million, respectively.
99
Jason Industries, Inc.
Notes to Consolidated Financial Statements
(In thousands, except share and per share amounts)
The table that follows contains the components of net periodic benefit costs:
Successor | Predecessor | |||||||||||||||
Year Ended December 31, 2016 | Year Ended December 31, 2015 | June 30, 2014 Through December 31, 2014 | January 1, 2014 Through June 29, 2014 | |||||||||||||
Components of net periodic benefit cost | ||||||||||||||||
Interest cost | $ | 76 | $ | 92 | $ | 44 | $ | 54 | ||||||||
Amortization of the net loss from earlier periods | (13 | ) | 1 | — | 5 | |||||||||||
Net periodic benefit cost | $ | 63 | $ | 93 | $ | 44 | $ | 59 | ||||||||
Weighted-average assumptions | ||||||||||||||||
Discount rates | 3.82 | % | 3.82 | % | 3.44 | % | 4.25 | % | ||||||||
The net amounts recognized in accumulated other comprehensive loss related to the Company’s other postretirement healthcare and life insurance plans consisted of the following:
Successor | Predecessor | |||||||||||||||
Year Ended December 31, 2016 | Year Ended December 31, 2015 | June 30, 2014 Through December 31, 2014 | January 1, 2014 Through June 29, 2014 | |||||||||||||
Unrecognized (gain) loss | $ | (217 | ) | $ | (214 | ) | $ | 174 | $ | 240 | ||||||
The Company’s cash contributions to its postretirement benefit plan in 2017 are not yet determined but are expected to equal the projected benefits from the plan. Estimated projected benefit payments from the plan at December 31, 2016 are as follows:
2017 | $ | 212 | |
2018 | 199 | ||
2019 | 187 | ||
2020 | 175 | ||
2021 | 163 | ||
2022-2026 | 665 | ||
16. | Business Segments, Geographic and Customer Information |
The Company identifies its segments using the “management approach,” which designates the internal organization that is used by management for making operating decisions and assessing performance as the source of the Company’s reportable segments.
The Company is a global manufacturer of a broad range of industrial products and is organized into four reportable segments: seating, finishing, acoustics and components. The Company’s seating segment supplies seating solutions to equipment manufacturers in the motorcycle, lawn and turf care, industrial, agricultural, construction and power sports end markets. The finishing segment focuses on the production of industrial brushes, buffing wheels, buffing compounds, and abrasives that are used in a broad range of industrial and infrastructure applications. The acoustics segment manufactures engineered non-woven, fiber-based acoustical products for the automotive industry. The components segment is a diversified manufacturer of expanded and perforated metal components, slip-resistant walking surfaces and subassemblies for smart utility meters.
100
Jason Industries, Inc.
Notes to Consolidated Financial Statements
(In thousands, except share and per share amounts)
Net sales relating to the Company’s reportable segments are as follows:
Successor | Predecessor | |||||||||||||||
Year Ended December 31, 2016 | Year Ended December 31, 2015 | June 30, 2014 Through December 31, 2014 | January 1, 2014 Through June 29, 2014 | |||||||||||||
Net sales | ||||||||||||||||
Seating | $ | 161,050 | $ | 176,792 | $ | 67,033 | $ | 104,878 | ||||||||
Finishing | 196,883 | 191,394 | 90,895 | 96,692 | ||||||||||||
Acoustics | 249,919 | 218,047 | 108,807 | 109,930 | ||||||||||||
Components | 97,667 | 122,133 | 58,600 | 65,651 | ||||||||||||
$ | 705,519 | $ | 708,366 | $ | 325,335 | $ | 377,151 | |||||||||
The Company uses “Adjusted EBITDA” as the primary measure of profit or loss for the purposes of assessing the operating performance of its segments. The Company defines EBITDA as net income (loss) before interest expense, income tax provision (benefit), depreciation and amortization. The Company defines Adjusted EBITDA as EBITDA, excluding the impact of operational restructuring charges and non-cash or non-operational losses or gains, including goodwill and long-lived asset impairment charges, gains or losses on disposal of property, plant and equipment, integration and other operational restructuring charges, transactional legal fees, other professional fees, purchase accounting adjustments, and non-cash share based compensation expense.
Management believes that Adjusted EBITDA provides a clear picture of the Company’s operating results by eliminating expenses and income that are not reflective of the underlying business performance. Certain corporate-level administrative expenses such as payroll and benefits, incentive compensation, travel, marketing, accounting, auditing and legal fees and certain other expenses are kept within its corporate results and are not allocated to its business segments. Shared expenses across the Company that directly relate to the performance of our four reportable segments are allocated to the segments. Adjusted EBITDA is used to facilitate a comparison of the Company’s operating performance on a consistent basis from period to period and to analyze the factors and trends affecting its segments. The Company’s internal plans, budgets and forecasts use Adjusted EBITDA as a key metric. In addition, this measure is used to evaluate its operating performance and segment operating performance and to determine the level of incentive compensation paid to its employees.
As the Company uses Adjusted EBITDA as its primary measure of segment performance, GAAP requires the Company to include this measure in its discussion of segment operating results. The Company must also reconcile segment Adjusted EBITDA to operating results presented on a GAAP basis.
101
Jason Industries, Inc.
Notes to Consolidated Financial Statements
(In thousands, except share and per share amounts)
Adjusted EBITDA information relating to the Company’s reportable segments is presented below followed by a reconciliation of total segment Adjusted EBITDA to consolidated income before taxes:
Successor | Predecessor | |||||||||||||||
Year Ended December 31, 2016 | Year Ended December 31, 2015 | June 30, 2014 Through December 31, 2014 | January 1, 2014 Through June 29, 2014 | |||||||||||||
Segment Adjusted EBITDA | ||||||||||||||||
Seating | $ | 16,122 | $ | 19,766 | $ | 8,337 | $ | 17,668 | ||||||||
Finishing | 24,200 | 25,799 | 12,542 | 13,732 | ||||||||||||
Acoustics | 27,202 | 27,515 | 8,912 | 9,676 | ||||||||||||
Components | 14,249 | 20,943 | 6,921 | 10,324 | ||||||||||||
$ | 81,773 | $ | 94,023 | $ | 36,712 | $ | 51,400 | |||||||||
Interest expense | (1,561 | ) | (1,870 | ) | (1,022 | ) | (1,269 | ) | ||||||||
Depreciation and amortization | (43,202 | ) | (44,938 | ) | (20,291 | ) | (12,796 | ) | ||||||||
Impairment charges | (63,285 | ) | (94,126 | ) | — | — | ||||||||||
Loss on disposal of property, plant and equipment - net | (869 | ) | (109 | ) | (57 | ) | (336 | ) | ||||||||
Restructuring | (6,634 | ) | (3,800 | ) | (1,131 | ) | (2,554 | ) | ||||||||
Transaction-related expenses | — | (789 | ) | (27 | ) | (242 | ) | |||||||||
Integration and other restructuring costs | (1,621 | ) | (2,713 | ) | (9,921 | ) | (2,575 | ) | ||||||||
Gain from sale of joint ventures | — | — | — | 3,508 | ||||||||||||
Total segment (loss) income before income taxes | (35,399 | ) | (54,322 | ) | 4,263 | 35,136 | ||||||||||
Corporate general and administrative expenses | (17,613 | ) | (12,860 | ) | (4,263 | ) | (7,032 | ) | ||||||||
Corporate interest expense | (30,282 | ) | (29,965 | ) | (15,150 | ) | (6,032 | ) | ||||||||
Corporate depreciation | (344 | ) | (310 | ) | (84 | ) | (57 | ) | ||||||||
Corporate restructuring | (598 | ) | — | — | — | |||||||||||
Corporate transaction-related expenses | — | (97 | ) | (2,506 | ) | (27,541 | ) | |||||||||
Corporate integration and other restructuring | (359 | ) | (6,333 | ) | — | — | ||||||||||
Corporate loss on disposal of property, plant and equipment | (11 | ) | — | — | (2 | ) | ||||||||||
Corporate share based compensation | 752 | (7,969 | ) | (4,129 | ) | — | ||||||||||
Loss before income taxes | $ | (83,854 | ) | $ | (111,856 | ) | $ | (21,869 | ) | $ | (5,528 | ) | ||||
Other financial information relating to the Company’s reportable segments is as follows at December 31, 2016 and 2015, for the years ended December 31, 2016 and 2015, and for the periods June 30, 2014 through December 31, 2014 and January 1, 2014 through June 29, 2014, respectively:
Successor | Predecessor | |||||||||||||||
Year Ended December 31, 2016 | Year Ended December 31, 2015 | June 30, 2014 Through December 31, 2014 | January 1, 2014 Through June 29, 2014 | |||||||||||||
Depreciation and amortization | ||||||||||||||||
Seating | $ | 8,894 | $ | 13,693 | $ | 6,900 | $ | 3,571 | ||||||||
Finishing | 13,198 | 11,407 | 4,711 | 2,824 | ||||||||||||
Acoustics | 11,283 | 11,251 | 4,859 | 2,838 | ||||||||||||
Components | 9,827 | 8,587 | 3,821 | 3,562 | ||||||||||||
Corporate | 344 | 310 | 84 | 57 | ||||||||||||
$ | 43,546 | $ | 45,248 | $ | 20,375 | $ | 12,852 | |||||||||
102
Jason Industries, Inc.
Notes to Consolidated Financial Statements
(In thousands, except share and per share amounts)
Successor | Predecessor | |||||||||||||||
Year Ended December 31, 2016 | Year Ended December 31, 2015 | June 30, 2014 Through December 31, 2014 | January 1, 2014 Through June 29, 2014 | |||||||||||||
Capital expenditures | ||||||||||||||||
Seating | $ | 3,602 | $ | 3,804 | $ | 2,115 | $ | 1,060 | ||||||||
Finishing | 5,943 | 9,090 | 3,990 | 3,151 | ||||||||||||
Acoustics | 6,058 | 14,881 | 6,063 | 4,098 | ||||||||||||
Components | 2,950 | 4,875 | 3,037 | 2,671 | ||||||||||||
General Corporate | 1,227 | 136 | 154 | 18 | ||||||||||||
$ | 19,780 | $ | 32,786 | $ | 15,359 | $ | 10,998 | |||||||||
Successor | |||||||
December 31, 2016 | December 31, 2015 | ||||||
Assets | |||||||
Seating | $ | 105,184 | $ | 119,019 | |||
Finishing | 233,045 | 248,210 | |||||
Acoustics | 172,769 | 206,117 | |||||
Components | 81,450 | 124,480 | |||||
Total segments | 592,448 | 697,826 | |||||
Corporate and eliminations | (8,117 | ) | (734 | ) | |||
Consolidated | $ | 584,331 | $ | 697,092 | |||
Net sales and long-lived asset information by geographic area are as follows at December 31, 2016 and 2015, for the years ended December 31, 2016 and 2015, and for the periods June 30, 2014 through December 31, 2014 and January 1, 2014 through June 29, 2014, respectively:
Successor | Predecessor | |||||||||||||||
Year Ended December 31, 2016 | Year Ended December 31, 2015 | June 30, 2014 Through December 31, 2014 | January 1, 2014 Through June 29, 2014 | |||||||||||||
Net sales by region | ||||||||||||||||
United States | $ | 492,667 | $ | 510,526 | $ | 231,920 | $ | 273,868 | ||||||||
Europe | 154,307 | 138,578 | 62,263 | 70,813 | ||||||||||||
Mexico | 49,594 | 48,242 | 23,728 | 25,258 | ||||||||||||
Other | 8,951 | 11,020 | 7,424 | 7,212 | ||||||||||||
$ | 705,519 | $ | 708,366 | $ | 325,335 | $ | 377,151 | |||||||||
Successor | |||||||
December 31, 2016 | December 31, 2015 | ||||||
Long-lived assets | |||||||
United States | $ | 219,591 | $ | 245,307 | |||
Europe | 85,133 | 94,804 | |||||
Mexico | 13,734 | 10,434 | |||||
Other | 4,118 | 3,520 | |||||
$ | 322,576 | $ | 354,065 | ||||
Net sales attributed to geographic locations are based on the locations producing the external sales. Long-lived assets by geographic location consist of the net book values of property, plant and equipment and amortizable intangible assets.
17. | Commitments and Contingencies |
Litigation Matters
On December 22, 2016, JMB Capital Partners Master Fund, L.P. (“Plaintiff”), filed a complaint in the Supreme Court of the State of New York, County of New York, captioned JMB Capital Partners Master Fund, L.P. v. Jason Industries, Inc., et al., Index No. 656692/2016. The complaint names the Company and Jeffry N. Quinn as defendants (“Defendants”) and asserts claims for breach of representations and warranties, fraudulent inducement, negligent misrepresentation, conversion, unjust
103
Jason Industries, Inc.
Notes to Consolidated Financial Statements
(In thousands, except share and per share amounts)
enrichment and breach of the implied covenant of good faith and fair dealing. The claims arise out of alleged misrepresentations made in connection with the sale of Series A Preferred Stock to Plaintiff pursuant to a Subscription Agreement executed on May 14, 2014. Plaintiff seeks compensatory damages, rescission of the Subscription Agreement, consequential and punitive damages, attorneys’ fees, pre-judgment and post-judgment interest, costs of suit, and other equitable relief. The parties have entered into a briefing schedule relating to Defendants’ anticipated motion to dismiss. The Company believes that this action lacks merit and intends to defend the case vigorously. As of December 31, 2016, the Company has not recorded a loss contingency related to this case, as the risk of loss is not perceived to be probable based on facts of the case known to date. As this case is in the early stages, no range of loss can be reasonably estimated at this time, however, an unfavorable outcome in the matter could have a material adverse effect on the Company’s financial condition or cash flows. The Company will continue to evaluate the status of the case and would record a reserve for losses at the time when it is both probable that a loss has been incurred and the amount of loss is reasonably estimable.
In the third quarter of 2016, the Company received notification of certain employment matter claims filed in Brazil related to hiring practices within the Company’s finishing division. The Company is actively investigating and defending such claims and has gathered additional information to assess the total potential exposure related to this matter, including the potential of additional claims. In the opinion of management, the resolution of this contingency will not have a material adverse effect on the Company’s financial condition, results of operations, or cash flows.
In addition to the cases noted above, the Company is a party to various legal proceedings that have arisen in the normal course of its business. These legal proceedings typically include product liability, labor, and employment claims. The Company has recorded reserves for loss contingencies based on the specific circumstances of each case. Such reserves are recorded when it is probable that a loss has been incurred as of the balance sheet date, can be reasonably estimated and is not covered by insurance. In the opinion of management, the resolution of these contingencies will not have a material adverse effect on the Company’s financial condition, results of operations, or cash flows.
Environmental Matters
At December 31, 2016 and December 31, 2015, the Company held reserves of $1.0 million for environmental matters at one location. The ultimate cost of any remediation required will depend on the results of future investigation. Based upon available information, the Company believes that it has obtained and is in substantial compliance with those material environmental permits and approvals necessary to conduct its business. Based on the facts presently known, the Company does not expect environmental costs to have a material adverse effect on its financial condition, results of operations or cash flows.
18. | Related Party Transactions |
Jason was part of a Management Services Agreement with Saw Mill Capital LLC (“Saw Mill”) and Falcon Investment Advisors, LLC (“FIA”, together with Saw Mill, the “Service Providers”), affiliates of Jason’s majority shareholders, which terminated upon consummation of the Business Combination. Management fees and related expenses paid to the Service Providers under this agreement were approximately $0.6 million for the predecessor period ended June 29, 2014. In addition, during the period January 1, 2014 through June 29, 2014 the Company incurred sale transaction fees of $5.4 million which were paid to the Service Providers on June 30, 2014 upon completion of the Business Combination.
19. | Subsequent Events |
Seating segment headquarters lease
In January of 2017, the Company signed a 10 year lease for approximately 50,000 square feet of office space for the seating segment’s headquarters which commences in March 2017 and expires in July 2027. The Company will pay approximately $3.5 million in minimum lease payments over the life of the lease.
Exchange of common stock of JPHI Holdings, Inc. for common stock of Jason Industries, Inc.
In the first quarter of 2017, certain Rollover Participants exchanged 1,084,007 shares of JPHI stock for Company. common stock, which decreased the noncontrolling interest to 0.0 percent. As of February 23, 2017, 0 shares of JPHI stock were still held by Rollover Participants.
104
ITEM 9. CHANGES IN AND DISAGREEMENTS WITH ACCOUNTANTS ON ACCOUNTING AND FINANCIAL DISCLOSURES
None.
ITEM 9A. CONTROLS AND PROCEDURES
Disclosure Controls and Procedures
Disclosure controls and procedures are controls and other procedures that are designed to ensure that information required to be disclosed in our reports filed or submitted under the Securities Exchange Act of 1934, as amended (the “Exchange Act”) is recorded, processed, summarized and reported within the time periods specified in the SEC’s rules and forms. Disclosure controls and procedures include, without limitation, controls and procedures designed to ensure that information required to be disclosed in company reports filed or submitted under the Exchange Act is accumulated and communicated to management, including our Chief Executive Officer and Chief Financial Officer, to allow timely decisions regarding required disclosure.
As required by Rules 13a-15 and 15d-15 under the Exchange Act, our Chief Executive Officer and Chief Financial Officer carried out an evaluation of the effectiveness of the design and operation of our disclosure controls and procedures as of December 31, 2016. Based upon their evaluation, our Chief Executive Officer and Chief Financial Officer concluded that our disclosure controls and procedures (as defined in Rules 13a-15(e) and 15d-15(e) under the Exchange Act) were effective.
Management’s Report on Internal Control Over Financial Reporting
The Company’s management is responsible for establishing and maintaining adequate internal control over financial reporting, as such term is defined in Rule 13a-15(f) of the Exchange Act. The Company’s internal control over financial reporting is designed to provide reasonable assurance regarding the reliability of financial reporting and the preparation of published financial statements in accordance with generally accepted accounting principles. A company’s internal control over financial reporting includes those policies and procedures that (i) pertain to the maintenance of records that, in reasonable detail, accurately and fairly reflect the transactions and dispositions of the assets of the company; (ii) provide reasonable assurance that transactions are recorded as necessary to permit preparation of financial statements in accordance with generally accepted accounting principles, and that receipts and expenditures of the company are being made only in accordance with authorizations of management and directors of the company; and (iii) provide reasonable assurance regarding prevention or timely detection of unauthorized acquisition, use, or disposition of the company’s assets that could have a material effect on the financial statements.
Because of its inherent limitations, internal control over financial reporting may not prevent or detect misstatements. Also, projections of any evaluation of effectiveness to future periods are subject to the risk that controls may become inadequate because of changes in conditions, or that the degree or compliance with the policies or procedures may deteriorate.
Management assessed the effectiveness of our internal control over financial reporting as of the end of the period covered by this Annual Report on Form 10-K. In making this assessment, management used the criteria set forth by the Committee of Sponsoring Organizations of the Treadway Commission (“COSO”) in Internal Control – Integrated Framework (2013). Based on management's assessment and those criteria, management concluded that our internal control over financial reporting was effective as of December 31, 2016.
Changes in Internal Control over Financial Reporting
During the most recently completed fiscal quarter, there has been no change in our internal control over financial reporting that has materially affected, or is reasonably likely to materially affect, our internal control over financial reporting.
ITEM 9B. OTHER INFORMATION
None.
105
PART III
ITEM 10. DIRECTORS, EXECUTIVE OFFICERS AND CORPORATE GOVERNANCE
Information regarding our executive officers is included in Part I of this Annual Report on Form 10-K as permitted by SEC rules.
The information required by this Item is set forth under the headings “Questions and Answers about the Company,” “Proposals to be Voted On–Proposal 1: Election of Directors,” “Corporate Governance Principles and Board Matters–Audit Committee,” “Corporate Governance and Nominating Committee,” and “Section 16(a) Beneficial Ownership Reporting Compliance” in the Company’s 2017 Proxy Statement to be filed with the SEC within 120 days after December 31, 2016 in connection with the solicitation of proxies for the Company’s 2017 annual meeting of shareholders (“Proxy Statement”) and is incorporated herein by reference.
The Company has adopted a code of ethics that applies to its senior executive team, including but not limited to, the Company’s Chief Executive Officer, Chief Financial Officer, General Counsel, Vice President of Finance and Treasurer, Corporate Controller, and the Senior Vice Presidents and General Managers, Vice Presidents of Finance, and Controllers of the Company’s business units, and other persons holdings positions with similar responsibilities at business units. The code of ethics is posted on the Company’s website and is available free of charge at www.jasoninc.com. The Company intends to satisfy the requirements under Item 5.05 of Form 8-K regarding disclosure of amendments to, or waivers from, previsions of its code of ethics that apply to senior executives by posting such information on the Company’s website.
ITEM 11. EXECUTIVE COMPENSATION
The information required by this Item is set forth under the headings “Corporate Governance Principles and Board Matters–Compensation Committee Interlocks and Insider Participation,” “Executive Compensation,” and “Compensation Committee Report” in the Proxy Statement and is incorporated herein by reference.
ITEM 12. SECURITY OWNERSHIP OF CERTAIN BENEFICIAL OWNERS AND MANAGEMENT AND RELATED STOCKHOLDER MATTERS
The information required by this Item is set forth under the heading “Security Ownership of Certain Beneficial Owners and Management” in the Proxy Statement and is incorporated herein by reference.
Equity Compensation Plan Information
The following table gives information about the Company’s common stock authorized for issuance under the Company’s equity compensation plans as of December 31, 2016.
Number of securities to be issued upon exercise of outstanding options, warrants and rights (1) | Weighted-average exercise price of outstanding options, warrants and rights | Number of securities remaining available for future issuance under equity compensation plans (excluding securities reflected in column (a)) | |||||||||
Plan category | (a) | (b) | (c) | ||||||||
Equity compensation plans approved by security holders | 2,131,393 | $ | — | 677,434 | (2) | ||||||
Equity compensation plans not approved by security holders | — | $ | — | — | |||||||
Total | 2,131,393 | — | 677,434 | ||||||||
(1) Column (a) of the table above includes 2,131,393 unvested restricted stock units outstanding under the Jason Industries, Inc. 2014 Omnibus Incentive Plan.
(2) Represents shares available for future issuance under the Jason Industries, Inc. 2014 Omnibus Incentive Plan.
ITEM 13. CERTAIN RELATIONSHIPS AND RELATED TRANSACTIONS, AND DIRECTOR INDEPENDENCE
The information required by this Item is set forth under the headings “Questions and Answers about the Company,” “Proposals to be Voted On–Proposal 1: Election of Directors” and “Certain Relationships and Related Transactions” in the Proxy Statement and is incorporated herein by reference.
ITEM 14. PRINCIPAL ACCOUNTING FEES AND SERVICES
The information required by this Item is set forth under the heading “Proposals to be Voted On–Proposal 3: Ratification of Selection of Independent Registered Public Accounting Firm–Principal Accountant Fees and Services” in the Proxy Statement and is incorporated herein by reference.
106
PART IV
ITEM 15. EXHIBITS AND FINANCIAL STATEMENTS SCHEDULES
(a) Documents filed as part of this report
(1) All financial statements
Index to Consolidated Financial Statements | ||
As of December 31, 2016 and 2015 (Successor), for the years ended December 31, 2016 and December 31, 2015, and for the periods June 30, 2014 through December 31, 2014 (Successor) and the period from January 1, 2014 through June 29, 2014 (Predecessor) | Page | |
(2) Financial Statement schedules
Index to Financial Statement schedules | ||
For the years ended December 31, 2016 and December 31, 2015, the period from June 30, 2014 through December 31, 2014 and the period from January 1, 2014 through June 29, 2014 | Page | |
All other financial statement schedules have been omitted, since the required information is not applicable or is not present in amounts sufficient to require submission of the schedule, or because the information required is included in the consolidated financial statements and notes thereto included in this Form 10-K.
(3) Exhibits required by Item 601 of Regulation S-K
The information required by this Section (a)(3) of Item 15 is set forth on the exhibit index that follows the Signatures page of this Form 10-K.
107
SCHEDULE II. CONSOLIDATED VALUATION AND QUALIFYING ACCOUNTS
(in thousands)
Balance at beginning of year | Charge to Costs and Expenses | Utilization of Reserves | Other (1) (2) | Balance at end of year | ||||||||||||||||
Year Ended December 31, 2016 (Successor) | ||||||||||||||||||||
Allowance for doubtful accounts | $ | 2,524 | $ | 597 | $ | 218 | $ | 53 | $ | 3,392 | ||||||||||
Deferred tax valuation allowances | $ | 3,703 | $ | 1,469 | $ | — | $ | (293 | ) | $ | 4,879 | |||||||||
Year Ended December 31, 2015 (Successor) | ||||||||||||||||||||
Allowance for doubtful accounts | $ | 2,415 | $ | 590 | $ | (374 | ) | $ | (107 | ) | $ | 2,524 | ||||||||
Deferred tax valuation allowances | $ | 3,898 | $ | (243 | ) | $ | — | $ | 48 | $ | 3,703 | |||||||||
June 30, 2014 through December 31, 2014 (Successor) | ||||||||||||||||||||
Allowance for doubtful accounts | $ | 2,459 | $ | 123 | $ | (152 | ) | $ | (15 | ) | $ | 2,415 | ||||||||
Deferred tax valuation allowances | $ | 4,958 | $ | (173 | ) | $ | — | $ | (887 | ) | $ | 3,898 | ||||||||
January 1, 2014 through June 29, 2014 (Predecessor) | ||||||||||||||||||||
Allowance for doubtful accounts | $ | 2,227 | $ | 112 | $ | 19 | $ | 101 | $ | 2,459 | ||||||||||
Deferred tax valuation allowances | $ | 4,347 | $ | 472 | $ | — | $ | 139 | $ | 4,958 | ||||||||||
(1) The amounts included in the “other” column primarily relate to the impact of foreign currency exchange rates.
(2) The successor period ended December 31, 2014 included an adjustment to the deferred tax valuation allowance in the “other” column in the amount of ($655) thousand related to acquisition accounting.
108
SIGNATURES
Pursuant to the requirements of Section 13 or 15(d) of the Securities Exchange Act of 1934, the registrant has duly caused this report to be signed on its behalf by the undersigned, thereunto duly authorized.
JASON INDUSTRIES, INC. | |
Dated: March 2, 2017 | /s/ Brian K. Kobylinski |
Brian K. Kobylinski President and Chief Executive Officer (Principal Executive Officer) | |
Dated: March 2, 2017 | /s/ Sarah C. Lauber | |
Sarah C. Lauber Senior Vice President and Chief Financial Officer (Principal Financial and Accounting Officer) | ||
Pursuant to the requirements of the Securities Exchange Act of 1934, this report has been signed below by the following persons on behalf of the registrant and in the capacities and on the dates indicated:
Signature | Title | Date | ||
/s/ Brian K. Kobylinski | President and Chief Executive Officer | Dated: March 2, 2017 | ||
Brian K. Kobylinski | (Principal Executive Officer) | |||
/s/ Sarah C. Lauber | Senior Vice President and Chief Financial Officer | Dated: March 2, 2017 | ||
Sarah C. Lauber | (Principal Financial and Accounting Officer) | |||
/s/ Jeffry N. Quinn | Chairman of the Board of Directors | Dated: March 2, 2017 | ||
Jeffry N. Quinn | ||||
/s/ James P. Heffernan | Director | Dated: March 2, 2017 | ||
James P. Heffernan | ||||
/s/ Edgar G. Hotard | Director | Dated: March 2, 2017 | ||
Edgar G. Hotard | ||||
/s/ James E. Hyman | Director | Dated: March 2, 2017 | ||
James E. Hyman | ||||
/s/ Mitchell I. Quain | Director | Dated: March 2, 2017 | ||
Mitchell I. Quain | ||||
/s/ Dr. John Rutledge | Director | Dated: March 2, 2017 | ||
Dr. John Rutledge | ||||
/s/ James M. Sullivan | Director | Dated: March 2, 2017 | ||
James M. Sullivan | ||||
109
EXHIBIT INDEX
Exhibit Number | Description | |
2.1 | Stock Purchase Agreement, dated as of March 16, 2014, by and among Jason Partners Holdings Inc., Jason Partners Holdings LLC, Quinpario Acquisition Corp. and JPHI Holdings Inc. (incorporated herein by reference to Exhibit 2.1 to the Registrant’s Form 8-K, filed with the Securities and Exchange Commission (the “Commission”) on March 18, 2014 (File No. 1-36051)).* | |
2.2 | Notarial Deed, dated as of May 29, 2015, by and among Jason GmbH, CMP German Opportunity Fund II (SCA) SICAR and Dr. Markus Lieck, as notary (incorporated herein by reference to Exhibit 2.1 to the Registrant’s Form 8-K, filed with the Commission on June 1, 2015 (File No. 1-36051)). | |
2.3 | Share Purchase Agreement, dated as of May 29, 2015, by and between Jason GmbH and CMP German Opportunity Fund II (SCA) SICAR (incorporated herein by reference to Exhibit 2.2 to the Registrant’s Form 8-K, filed with the Commission on June 1, 2015 (File No. 1-36051)). * | |
3.1 | Second Amended and Restated Certificate of Incorporation of the Company (incorporated herein by reference to Exhibit 4.2 to the Registrant’s Registration Statement on Form S-8, filed with the Commission on July 3, 2014 (File No. 333-197250)). | |
3.2 | Certificate of Designations, Preferences, Rights and Limitations of 8.0% Series A Convertible Perpetual Preferred Stock (incorporated herein by reference to Exhibit A to Exhibit 10.11 to the Registrant’s Form 10-Q, filed with the Commission on May 15, 2014 (File No. 1-36051)). | |
3.3 | Certificate of Designations, Preferences and Rights of Series A Junior Participating Preferred Stock to the Second Amended and Restated Articles of Incorporation of Jason Industries, Inc., dated as of September 12, 2016 (incorporated herein by reference to Exhibit A to Exhibit 4 to the Registrant’s Form 8-K, filed with the SEC on September 12, 2016 (File No. 1-36051)). | |
3.4 | Bylaws of the Company (incorporated herein by reference to Exhibit 4.1 to the Registrant’s Registration Statement on Form S-8, filed with the Commission on July 3, 2014 (File No. 333-197250)). | |
4.1 | Specimen Common Stock Certificate (incorporated herein by reference to Exhibit 4.2 to the Registrant’s Registration Statement on Form S-1, filed with the Commission on August 1, 2013 (File No. 333-189432)). | |
4.2 | Specimen Warrant Certificate (incorporated herein by reference to Exhibit A to Exhibit 4.4 to the Registrant’s Form 8-K, filed with the Commission on August 14, 2013 (File No. 1-36051)). | |
4.3 | Warrant Agreement between Continental Stock Transfer & Trust Company and the Company, dated as of August 8, 2013 (incorporated herein by reference to Exhibit 4.4 to the Registrant’s Form 8-K, filed with the Commission on August 14, 2013 (File No. 1-36051)). | |
4.4 | Registration Rights Agreement among the Company, Quinpario Partners I, LLC and the other security holders named therein, dated August 8, 2013 (incorporated herein by reference to Exhibit 10.2 to the Registrant’s Form 8-K, filed with the Commission on August 14, 2013 (File No. 1-36051)). | |
4.5 | Amendment No.1 to Registration Rights Agreement among the Company, Quinpario Partners I, LLC and the other security holders named therein, dated July 14, 2014 (incorporated herein by reference to Exhibit 4.6 to the Registrant’s Registration Statement on Form S-1, filed with the Commission on July 15, 2014, as amended (File No. 333-197412)). | |
4.6 | Form of Registration Rights Agreement by and between the Company and the persons named therein (incorporated herein by reference to Exhibit 10.12 to the Registrant’s Form 10-Q, filed with the Commission on May 15, 2014 (File No. 1-36051)). | |
4.7 | Rights Agreement, dated as of September 12, 2016, by and between Jason Industries, Inc. and Continental Stock Transfer & Trust Company, as the Rights Agent (incorporated herein by reference to Exhibit 4 to the Registrant’s Form 8-K, filed with the SEC on September 12, 2016 (File No. 1-36051)). | |
10.1 | Investor Rights Agreement by and between the Company, JPHI Holdings Inc. and certain stockholders of the Company, dated as of June 30, 2014 (incorporated herein by reference to Exhibit 10.5 to the Registrant’s Form 8-K, filed with the Commission on July 7, 2014 (File No. 1-36051)). | |
10.2 | Jason Industries, Inc. 2014 Omnibus Incentive Plan (incorporated herein by reference to Exhibit 99.1 to the Registrant’s Registration Statement on Form S-8, filed with the Commission on July 3, 2014 (File No. 333-197250)).** | |
10.3 | Interim Services Agreement dated as of November 8, 2015 between Jason Industries, Inc. and Jeffry N. Quinn (incorporated herein by reference to Exhibit 10.1 to the Registrant’s Current Report on Form 8-K filed with the Commission on November 10, 2015 (File No. 1-36051)).** | |
110
Exhibit Number | Description | |
10.4 | Amendment, dated as of January 20, 2016, to Interim Services Agreement dated as of November 8, 2015 between Jason Industries, Inc. and Jeffry N. Quinn (incorporated herein by reference to Exhibit 10.3 to the Registrant’s Current Report on Form 8-K filed with the Commission on January 25, 2016 (File No. 1-36051)).** | |
10.5 | Business Services Consulting Agreement, dated as of December 1, 2015, between Jason Industries, Inc. and A. Craig Ivey (incorporated herein by reference to Exhibit 10.1 to the Registrant’s Current Report on Form 8-K filed with the Commission on January 25, 2016 (File No. 1-36051)).** | |
10.6 | Employment Agreement between the Company and Srivas Prasad, dated as of June 30, 2014 (incorporated herein by reference to Exhibit 10.10 to the Registrant’s Form 8-K, filed with the Commission on July 7, 2014 (File No. 1-36051)).** | |
10.7 | Amended and Restated Employment Agreement between the Company and John Hengel, dated as of June 30, 2014 (incorporated herein by reference to Exhibit 10.12 to the Registrant’s Form 8-K, filed with the Commission on July 7, 2014 (File No. 1-36051)).** | |
10.8 | Employment Agreement between the Company and Sarah Sutton, dated as of April 6, 2015 (incorporated herein by reference to Exhibit 10.1 to the Registrant’s Form 8-K, filed with the Commission on April 7, 2015 (File No. 1-36051)).** | |
10.9 | Employment Agreement between the Company and Thomas Doerr, dated as of November 9, 2015 (incorporated herein by reference to Exhibit 10.12 to the Registrant’s Form 10-K, filed with the Commission on March 8, 2016 (File No. 1-36051))** | |
10.10 | Employment Agreement between the Company and Brian K. Kobylinski, dated as of April 8, 2016 (incorporated herein by reference to Exhibit 10.3 to the Registrant’s Form 10-Q, filed with the Commission on May 10, 2016 (File No. 1-36051)).** | |
10.11 | Amendment to Employment Agreement between the Company and Brian K. Kobylinski, dated December 1, 2016 (incorporated herein by reference to Exhibit 10.2 to the Registrant’s Form 8-K, filed with the Commission on December 2, 2016 (File No. 1-36051)).** | |
10.12 | First Lien Credit Agreement, dated as of June 30, 2014, by and among Jason Incorporated, Jason Partners Holdings Inc., Jason Holdings, Inc. I, Deutsche Bank AG New York Branch, as administrative agent, the subsidiary guarantors party thereto and the several banks and other financial institutions or entities from time to time party thereto (incorporated herein by reference to Exhibit 10.1 to the Registrant’s Form 8-K, filed with the Commission on July 7, 2014 (File No. 1-36051)). | |
10.13 | Second Lien Credit Agreement, dated as of June 30, 2014, by and among Jason Incorporated, Jason Partners Holdings Inc., Jason Holdings, Inc. I, Deutsche Bank AG New York Branch, as administrative agent, the subsidiary guarantors party thereto and the several banks and other financial institutions or entities from time to time party thereto (incorporated herein by reference to Exhibit 10.2 to the Registrant’s Form 8-K, filed with the Commission on July 7, 2014 (File No. 1-36051)). | |
10.14 | First Lien Security Agreement, dated as of June 30, 2014, by and among Jason Partners Holdings Inc., Jason Holdings, Inc. I, Jason Incorporated and certain of its subsidiaries in favor of Deutsche Bank AG New York Branch (incorporated herein by reference to Exhibit 10.3 to the Registrant’s Form 8-K, filed with the Commission on July 7, 2014 (File No. 1-36051)). | |
10.15 | Second Lien Security Agreement, dated as of June 30, 2014, by and among Jason Partners Holdings Inc., Jason Holdings, Inc. I, Jason Incorporated and certain of its subsidiaries in favor of Deutsche Bank AG New York Branch (incorporated herein by reference to Exhibit 10.4 to the Registrant’s Form 8-K, filed with the Commission on July 7, 2014 (File No. 1-36051)). | |
10.16 | Form of Indemnification Agreement (incorporated herein by reference to Exhibit 10.13 to the Registrant’s Form 8-K, filed with the Commission on July 7, 2014 (File No. 1-36051)). | |
10.17 | Form of Restricted Stock Unit Agreement pursuant to the Jason Industries, Inc. 2014 Omnibus Incentive Plan (Incorporated herein by reference to Exhibit 10.15 to the Registrant’s Form 10-Q, filed with the Commission on November 7, 2014 (File No. 1-36051)).* | |
10.18 | Form of Restricted Stock Unit Agreement pursuant to the Jason Industries, Inc. 2014 Omnibus Incentive Plan (ROIC-Vesting) (incorporated herein by reference to Exhibit 10.1 to the Registrant’s Form 8-K, filed with the Commission on February 3, 2016 (File No. 1-36051)).** | |
10.19 | Form of Non-Employee Director Restricted Stock Unit Agreement pursuant to the Jason Industries, Inc. 2014 Omnibus Incentive Plan (Incorporated herein by reference to Exhibit 10.16 to the Registrant’s Form 10-Q, filed with the Commission on November 7, 2014 (File No. 1-36051)).* | |
10.20 | Form of Restricted Stock Unit Agreement pursuant to the Jason Industries, Inc. 2014 Omnibus Incentive Plan (Time-Vesting) (Incorporated herein by reference to Exhibit 10.1 to the Registrant’s Form 10-Q, filed with the Commission on May 10, 2016 (File No. 1-36051)).** | |
111
Exhibit Number | Description | |
10.21 | Form of Restricted Stock Unit Agreement pursuant to the Jason Industries, Inc. 2014 Omnibus Incentive Plan (Cliff-Vesting) (Incorporated herein by reference to Exhibit 10.2 to the Registrant’s Form 10-Q, filed with the Commission on May 10, 2016 (File No. 1-36051)).** | |
12 | Computation of Ratio of Earnings to Fixed Charges and to Fixed Charges and Preference Dividends. | |
21 | Subsidiaries of Registrant. | |
23 | Consent of PricewaterhouseCoopers LLP. | |
31.1 | Certification of the Principal Executive Officer required by Rule 13a-14(a) and Rule 15d-14(a) under the Securities Exchange Act of 1934, as amended, as adopted pursuant to Section 302 of the Sarbanes Oxley Act of 2002. | |
31.2 | Certification of the Principal Financial Officer required by Rule 13a-14(a) and Rule 15d-14(a) under the Securities Exchange Act of 1934, as amended, as adopted pursuant to Section 302 of the Sarbanes Oxley Act of 2002. | |
32.1 | Certification of the Principal Executive Officer required by 18 U.S.C. Section 1350, as adopted pursuant to Section 906 of the Sarbanes Oxley Act of 2002. | |
32.2 | Certification of the Principal Financial Officer required by 18 U.S.C. Section 1350, as adopted pursuant to Section 906 of the Sarbanes Oxley Act of 2002. | |
101.INS | XBRL Instance Document | |
101.SCH | XBRL Taxonomy Extension Schema Document | |
101.CAL | XBRL Taxonomy Extension Calculation Linkbase Document | |
101.DEF | XBRL Taxonomy Extension Definition Linkbase Document | |
101.LAB | XBRL Taxonomy Extension Labels Linkbase Document | |
101.PRE | XBRL Taxonomy Extension Presentation Linkbase Document | |
* | The disclosure schedules and exhibits to this agreement are not being filed herewith. Jason Industries, Inc. agrees to furnish supplementally a copy of any such schedules and exhibits to the Securities and Exchange Commission upon request. |
** | Represents a management contract or compensatory plan, contract or arrangement. |
112