Attached files
| file | filename |
|---|---|
| EX-99.1 - EXHIBIT 99.1 - Matador Resources Co | mtdr10-k12312016ex991.htm |
| EX-32.2 - EXHIBIT 32.2 - Matador Resources Co | mtdr10-k12312016ex322.htm |
| EX-32.1 - EXHIBIT 32.1 - Matador Resources Co | mtdr10-k12312016ex321.htm |
| EX-31.2 - EXHIBIT 31.2 - Matador Resources Co | mtdr10-k12312016ex312.htm |
| EX-31.1 - EXHIBIT 31.1 - Matador Resources Co | mtdr10-k12312016ex311.htm |
| EX-23.2 - EXHIBIT 23.2 - Matador Resources Co | mtdr10-k12312016ex232.htm |
| EX-23.1 - EXHIBIT 23.1 - Matador Resources Co | mtdr10-k12312016ex231.htm |
| EX-21.1 - EXHIBIT 21.1 - Matador Resources Co | mtdr10-k12312016ex211.htm |
| EX-10.64 - EXHIBIT 10.64 - Matador Resources Co | mtdr10-k12312016ex1064.htm |
| EX-10.63 - EXHIBIT 10.63 - Matador Resources Co | mtdr10-k12312016ex1063.htm |
| EX-10.62 - EXHIBIT 10.62 - Matador Resources Co | mtdr10-k12312016ex1062.htm |
UNITED STATES
SECURITIES AND EXCHANGE COMMISSION
WASHINGTON, D.C. 20549
FORM 10-K
(Mark One)
ý | ANNUAL REPORT PURSUANT TO SECTION 13 OR 15(d) OF THE SECURITIES EXCHANGE ACT OF 1934 |
For the fiscal year ended December 31, 2016
or
¨ | TRANSITION REPORT PURSUANT TO SECTION 13 OR 15(d) OF THE SECURITIES EXCHANGE ACT OF 1934 |
For the transition period from | to | |
Commission file number 001-34574 | ||
Matador Resources Company
(Exact name of registrant as specified in its charter)
Texas | 27-4662601 | |
(State or other jurisdiction of incorporation or organization) | (I.R.S. Employer Identification No.) | |
5400 LBJ Freeway, Suite 1500 Dallas, Texas 75240 | 75240 | |
(Address of principal executive offices) | (Zip Code) | |
Registrant’s telephone number, including area code: (972) 371-5200 | ||
Securities registered pursuant to Section 12(b) of the Act: | ||
Title of each class | Name of each exchange on which registered | |||
Common Stock, par value $0.01 per share | New York Stock Exchange | |||
Securities registered pursuant to Section 12(g) of the Act: None
Indicate by check mark if the registrant is a well-known seasoned issuer, as defined in Rule 405 of the Securities Act.
Yes ý No ¨
Indicate by check mark if the registrant is not required to file reports pursuant to Section 13 or Section 15(d) of the Act.
Yes ¨ No ý
Indicate by check mark whether the registrant (1) has filed all reports required to be filed by Section 13 or 15(d) of the Securities Exchange Act of 1934 during the preceding 12 months (or for such shorter period that the registrant was required to file such reports), and (2) has been subject to such filing requirements for the past 90 days. Yes ý No ¨
Indicate by check mark whether the registrant has submitted electronically and posted on its corporate Website, if any, every Interactive Data File required to be submitted and posted pursuant to Rule 405 of Regulation S-T during the preceding 12 months (or for such shorter period that the registrant was required to submit and post such files). Yes ý No ¨
Indicate by check mark if disclosure of delinquent filers pursuant to Item 405 of Regulation S-K is not contained herein, and will not be contained, to the best of registrant’s knowledge, in definitive proxy or information statements incorporated by reference in Part III of this Form 10-K or any amendment to this Form 10-K. ý
Indicate by check mark whether the registrant is a large accelerated filer, an accelerated filer, a non-accelerated filer, or a smaller reporting company. See definitions of “large accelerated filer,” “accelerated filer” and “smaller reporting company” in Rule 12b-2 of the Exchange Act.
Large accelerated filer | ý | Accelerated filer | ¨ | |||
Non-accelerated filer | ¨ | (Do not check if a smaller reporting company) | Smaller reporting company | ¨ | ||
Indicate by check mark whether the registrant is a shell company (as defined in Rule 12b-2 of the Exchange Act).
Yes ¨ No ý
The aggregate market value of the voting and non-voting common equity of the registrant held by non-affiliates, computed by reference to the price at which the common equity was last sold, as of the last business day of the registrant’s most recently completed second fiscal quarter was $1,625,286,901.
As of February 24, 2017, there were 100,034,559 shares of common stock outstanding.
DOCUMENTS INCORPORATED BY REFERENCE |
The information required by Part III of this Annual Report on Form 10-K, to the extent not set forth herein, is incorporated by reference to the registrant’s definitive proxy statement relating to the 2017 Annual Meeting of Shareholders which will be filed with the Securities and Exchange Commission within 120 days after the end of the fiscal year to which this Annual Report on Form 10-K relates.
MATADOR RESOURCES COMPANY
FORM 10-K
FOR THE FISCAL YEAR ENDED DECEMBER 31, 2016
TABLE OF CONTENTS
Page | ||
PART I | ||
ITEM 1. | ||
ITEM 1A. | ||
ITEM 1B. | ||
ITEM 2. | ||
ITEM 3. | ||
ITEM 4. | ||
PART II | ||
ITEM 5. | ||
ITEM 6. | ||
ITEM 7. | ||
ITEM 7A. | ||
ITEM 8. | ||
ITEM 9. | ||
ITEM 9A. | ||
ITEM 9B. | ||
PART III | ||
ITEM 10. | ||
ITEM 11. | ||
ITEM 12. | ||
ITEM 13. | ||
ITEM 14. | ||
PART IV | ||
ITEM 15. | ||
i
CAUTIONARY NOTE REGARDING FORWARD-LOOKING STATEMENTS
Certain statements in this Annual Report on Form 10-K (this “Annual Report”) constitute “forward-looking statements” within the meaning of Section 27A of the Securities Act of 1933, as amended, or the Securities Act, and Section 21E of the Securities Exchange Act of 1934, as amended, or the Exchange Act. Additionally, forward-looking statements may be made orally or in press releases, conferences, reports, on our website or otherwise, in the future by us or on our behalf. Such statements are generally identifiable by the terminology used such as “anticipate,” “believe,” “continue,” “could,” “estimate,” “expect,” “forecasted,” “hypothetical,” “intend,” “may,” “might,” “plan,” “potential,” “predict,” “project,” “should” or other similar words, although not all forward-looking statements contain such identifying words.
By their very nature, forward-looking statements require us to make assumptions that may not materialize or that may not be accurate. Forward-looking statements are subject to known and unknown risks and uncertainties and other factors that may cause actual results, levels of activity and achievements to differ materially from those expressed or implied by such statements. Such factors include, among others: general economic conditions, changes in oil, natural gas and natural gas liquids prices and the demand for oil, natural gas and natural gas liquids, the success of our drilling program, the timing of planned capital expenditures, the sufficiency of our cash flow from operations together with available borrowing capacity under our credit agreement, uncertainties in estimating proved reserves and forecasting production results, operational factors affecting the commencement or maintenance of producing wells, the condition of the capital markets generally, as well as our ability to access them, the proximity to our properties and capacity of transportation facilities, availability of acquisitions, our ability to integrate acquisitions with our business, weather and environmental conditions, uncertainties regarding environmental regulations or litigation and other legal or regulatory developments affecting our business, and the other factors discussed below and elsewhere in this Annual Report and in other documents that we file with or furnish to the United States Securities and Exchange Commission, or the SEC, all of which are difficult to predict. Forward-looking statements may include statements about:
• | our business strategy; |
• | our reserves; |
• | our technology; |
• | our cash flows and liquidity; |
• | our financial strategy, budget, projections and operating results; |
• | our oil and natural gas realized prices; |
• | the timing and amount of future production of oil and natural gas; |
• | the availability of drilling and production equipment; |
• | the availability of oil field labor; |
• | the amount, nature and timing of capital expenditures, including future exploration and development costs; |
• | the availability and terms of capital; |
• | our drilling of wells; |
• | our ability to negotiate and consummate acquisition and divestiture opportunities; |
• | government regulation and taxation of the oil and natural gas industry; |
• | our marketing of oil and natural gas; |
• | our exploitation projects or property acquisitions; |
• | the integration of acquisitions with our business; |
• | our ability and the ability of our midstream joint venture to construct and operate midstream facilities, including the expansion of our Black River cryogenic natural gas processing plant and the drilling of additional salt water disposal wells; |
• | our costs of exploiting and developing our properties and conducting other operations; |
• | general economic conditions; |
• | competition in the oil and natural gas industry, including in both the exploration and production and midstream segments; |
• | the effectiveness of our risk management and hedging activities; |
• | environmental liabilities; |
• | counterparty credit risk; |
• | developments in oil-producing and natural gas-producing countries; |
• | our future operating results; |
• | estimated future reserves and the present value thereof; and |
• | our plans, objectives, expectations and intentions contained in this Annual Report that are not historical. |
Although we believe that the expectations conveyed by the forward-looking statements in this Annual Report are reasonable based on information available to us on the date hereof, no assurances can be given as to future results, levels of activity, achievements or financial condition.
1
You should not place undue reliance on any forward-looking statement and should recognize that the statements are predictions of future results, which may not occur as anticipated. Actual results could differ materially from those anticipated in the forward-looking statements and from historical results, due to the risks and uncertainties described above, as well as others not now anticipated. The impact of any one factor on a particular forward-looking statement is not determinable with certainty as such factors are interdependent upon other factors. The foregoing statements are not exclusive and further information concerning us, including factors that potentially could materially affect our financial results, may emerge from time to time. We do not intend to update forward-looking statements to reflect actual results or changes in factors or assumptions affecting such forward-looking statements, except as required by law, including the securities laws of the United States and the rules and regulations of the SEC.
PART I
Item 1. Business.
In this Annual Report, references to “we,” “our” or the “Company” refer to Matador Resources Company and its subsidiaries as a whole (unless the context indicates otherwise) and references to “Matador” refer solely to Matador Resources Company. For certain oil and natural gas terms used in this Annual Report, see the “Glossary of Oil and Natural Gas Terms” included in this Annual Report.
General
We are an independent energy company engaged in the exploration, development, production and acquisition of oil and natural gas resources in the United States, with an emphasis on oil and natural gas shale and other unconventional plays. Our current operations are focused primarily on the oil and liquids-rich portion of the Wolfcamp and Bone Spring plays in the Delaware Basin in Southeast New Mexico and West Texas. We also operate in the Eagle Ford shale play in South Texas and the Haynesville shale and Cotton Valley plays in Northwest Louisiana and East Texas. Additionally, we conduct midstream operations primarily, as of February 17, 2017, through our midstream joint venture, San Mateo Midstream, LLC (“San Mateo” or the “Joint Venture”), in support of our exploration, development and production operations and provide natural gas processing, natural gas, oil and salt water gathering services and salt water disposal services to third parties on a limited basis.
We are a Texas corporation founded in July 2003 by Joseph Wm. Foran, Chairman and CEO. Mr. Foran began his career as an oil and natural gas independent in 1983 when he founded Foran Oil Company with $270,000 in contributed capital from 17 friends and family members. Foran Oil Company was later contributed to Matador Petroleum Corporation upon its formation by Mr. Foran in 1988. Mr. Foran served as Chairman and Chief Executive Officer of that company from its inception until it was sold in June 2003 to Tom Brown, Inc., in an all cash transaction for an enterprise value of approximately $388.5 million.
On February 2, 2012, our common stock began trading on the New York Stock Exchange (the “NYSE”) under the symbol “MTDR.” Prior to trading on the NYSE, there was no established public trading market for our common stock.
Our goal is to increase shareholder value by building oil and natural gas reserves, production and cash flows at an attractive rate of return on invested capital. We plan to achieve our goal by, among other items, executing the following business strategies:
• | focus our exploration and development activities primarily on unconventional plays, including the Wolfcamp and Bone Spring plays in the Delaware Basin, the Eagle Ford shale in South Texas and the Haynesville shale and Cotton Valley plays in Northwest Louisiana and East Texas; |
• | identify, evaluate and develop additional oil and natural gas plays as necessary to maintain a balanced portfolio of oil and natural gas properties; |
• | continue to improve operational and cost efficiencies; |
• | identify and develop midstream opportunities that support and enhance our exploration and development activities; |
• | maintain our financial discipline; and |
• | pursue opportunistic acquisitions, divestitures and joint ventures. |
Despite a challenging commodity price environment in 2016, the successful execution of our business strategies led to significant increases in our oil and natural gas production and proved oil and natural gas reserves. We also significantly increased our leasehold position in the Delaware Basin. In addition, we concluded several important financing transactions in 2016, including two equity offerings, an issuance of senior unsecured notes and an increase in the borrowing base under our Credit Agreement (as defined below). These transactions, as well as the formation of the Joint Venture in February 2017, increased our operational flexibility and further strengthened our balance sheet.
2
2016 Highlights
Increased Oil, Natural Gas and Oil Equivalent Production
For the year ended December 31, 2016, we achieved record oil, natural gas and average daily oil equivalent production. In 2016, we produced 5.1 million Bbl of oil, an increase of 13%, as compared to 4.5 million Bbl of oil produced in 2015. We also produced 30.5 Bcf of natural gas, an increase of 10% from 27.7 Bcf of natural gas produced in 2015. Our average daily oil equivalent production for the year ended December 31, 2016 was 27,813 BOE per day, including 13,924 Bbl of oil per day and 83.3 MMcf of natural gas per day, an increase of 12%, as compared to 24,955 BOE per day, including 12,306 Bbl of oil per day and 75.9 MMcf of natural gas per day, for the year ended December 31, 2015. The increase in oil and natural gas production was primarily a result of our ongoing delineation and development operations in the Delaware Basin throughout 2016, which offset declining production in the Eagle Ford and Haynesville shales where we have significantly reduced our operated activity since late 2014 and early 2015. Oil production comprised 50% of our total production (using a conversion ratio of one Bbl of oil per six Mcf of natural gas) for the year ended December 31, 2016, as compared to 49% for the year ended December 31, 2015.
Increased Oil and Oil Equivalent Reserves
At December 31, 2016, our estimated total proved oil and natural gas reserves were 105.8 million BOE, including 57.0 million Bbl of oil and 292.6 Bcf of natural gas, an increase of 24% from December 31, 2015. The associated Standardized Measure and PV-10 of our estimated total proved oil and natural gas reserves increased 9% and 7% to $575.0 million and $581.5 million, respectively, at December 31, 2016, from $529.2 million and $541.6 million, respectively, at December 31, 2015, primarily as a result of our ongoing delineation and development operations in the Delaware Basin. PV-10 is a non-GAAP financial measure. For a reconciliation of PV-10 to Standardized Measure, see “—Estimated Proved Reserves.”
Our proved oil reserves grew 25% to 57.0 million Bbl at December 31, 2016 from 45.6 million Bbl at December 31, 2015. Our proved natural gas reserves increased 24% to 292.6 Bcf at December 31, 2016 from 236.9 Bcf at December 31, 2015. This growth in oil and natural gas reserves was primarily attributable to our ongoing delineation and development operations in the Delaware Basin during 2016.
At December 31, 2016, proved developed reserves included 22.6 million Bbl of oil and 126.8 Bcf of natural gas, and proved undeveloped reserves included 34.4 million Bbl of oil and 165.9 Bcf of natural gas. Proved developed reserves and proved oil reserves comprised 41% and 54%, respectively, of our total proved oil and natural gas reserves at December 31, 2016. Proved developed reserves and proved oil reserves comprised 40% and 54%, respectively, of our total proved oil and natural gas reserves at December 31, 2015.
Operational Highlights
We focus on optimizing the development of our resource base by seeking ways to maximize our recovery per well relative to the cost incurred and to minimize our operating costs per BOE produced. We apply an analytical approach to track and monitor the effectiveness of our drilling and completion techniques and service providers. This allows us to better manage operating costs, the pace of development activities, technical applications, the gathering and marketing of our production and capital allocation. Additionally, we concentrate on our core areas, which allows us to achieve economies of scale and reduce operating costs. Largely as a result of these factors, we believe that we have increased our technical knowledge of drilling, completing and producing Delaware Basin wells, particularly over the past three years, as we continue to apply what we learned from our Eagle Ford shale and Haynesville shale experience. The Delaware Basin will continue to be our primary area of focus in 2017.
We completed and began producing oil and natural gas from 55 gross (37.0 net) wells in the Delaware Basin in 2016, including 40 gross (35.6 net) operated and 15 gross (1.4 net) non-operated wells. We also added to and upgraded our acreage position in the Delaware Basin during 2016. As a result, at December 31, 2016, our total acreage position in the Delaware Basin had increased to approximately 163,700 gross (94,300 net) acres, primarily in Loving County, Texas and Lea and Eddy Counties, New Mexico. Overall, we have been very pleased with the initial performance of the wells we have drilled and completed, or participated in as a non-operator, thus far in our six main asset areas in the Delaware Basin—the Wolf and Jackson Trust asset areas in Loving County, Texas, the Rustler Breaks and Arrowhead asset areas in Eddy County, New Mexico and the Ranger and Twin Lakes asset areas in Lea County, New Mexico. As a result, our Delaware Basin properties have become an increasingly important component of our asset portfolio. Our average daily oil equivalent production from the Delaware Basin increased approximately 145% (2.5-fold) to 15,941 BOE per day (57% of total oil equivalent production), including 10,395 Bbl of oil per day (75% of total oil production) and 33.3 MMcf of natural gas per day (40% of total natural gas production), in 2016, as compared to 6,518 BOE per day (26% of total oil equivalent production), including 4,648 Bbl of oil per day (38% of total oil production) and 11.2 MMcf of natural gas per day (15% of total natural gas production), in 2015. We expect our Delaware Basin production to increase throughout 2017 as we continue the delineation and development of these asset areas.
3
Operational highlights in the Delaware Basin (as further described below in “—Principal Areas of Interest — Exploration and Production Segment—Southeast New Mexico and West Texas — Delaware Basin” and “—Midstream Segment”) in 2016 included:
• | our continued improvement in operational efficiencies throughout the Delaware Basin, particularly in our Rustler Breaks and Wolf asset areas, as we achieved improvements in both drilling times and well costs; |
• | in our Rustler Breaks asset area, the continued delineation and development of previously tested horizons—the Second Bone Spring, the Wolfcamp A-XY and two benches of the Wolfcamp B—and the successful testing of a new, deeper bench of the Wolfcamp B interval, which is sometimes referred to as the Blair Shale; |
• | in our Wolf asset area, continued development of the Wolfcamp A-XY interval as well as the significant improvement in well results in the Second Bone Spring, as compared to our initial tests in that interval; |
• | in our Ranger asset area, the initial results from three wells completed in the Third Bone Spring formation on our Mallon leasehold, which tested at the highest 24-hour initial potential flow rates of any wells we have drilled to date in the Delaware Basin and which illustrate the potential of our northern Delaware Basin acreage position; |
• | a positive test of the Strawn formation in our Twin Lakes asset area from the Olivine State 5-16S-37E TL #1, a vertical well; and |
• | the significant progress made with our midstream operations including the start-up of our Black River cryogenic natural gas processing plant (the “Black River Processing Plant”) and associated natural gas gathering system in our Rustler Breaks asset area, our initial salt water disposal well and facility and associated water gathering lines in our Rustler Breaks asset area and two additional salt water disposal wells and facilities in our Wolf asset area. |
We did not conduct any operated drilling and completion activities on our leasehold properties in South Texas or in Northwest Louisiana and East Texas during 2016, although we did participate in the drilling and completion of 2 gross (less than 0.1 net) non-operated Eagle Ford shale wells and 15 gross (2.1 net) non-operated Haynesville shale wells that began producing in 2016.
Financing Arrangements
On March 11, 2016, we completed a public offering of 7,500,000 shares of our common stock. After deducting offering costs totaling approximately $0.8 million, we received net proceeds of approximately $141.5 million. In late October 2016, the lenders party to our third amended and restated credit agreement (the “Credit Agreement”), under which we had no borrowings outstanding at December 31, 2016, increased our borrowing base from $300.0 million to $400.0 million. On December 9, 2016, we issued $175.0 million of our 6.875% senior unsecured notes due 2023 (the “Additional Notes”) in a private placement. We received net proceeds from the issuance of Additional Notes of $181.5 million, including the issue premium, but after deducting the initial purchasers’ discounts and estimated offering expenses and excluding accrued interest paid by buyers of the Additional Notes. Also on December 9, 2016, we completed a public offering of 6,000,000 shares of our common stock. After deducting offering costs totaling approximately $0.4 million, we received net proceeds of approximately $145.8 million. See Notes 6 and 10 to the consolidated financial statements in this Annual Report for more details on each of the above items.
2017 Recent Developments
Between January 1, 2017 and February 22, 2017, we acquired approximately 13,900 gross (8,200 net) leasehold and mineral acres and approximately 1,000 BOE per day of related production from various lessors and other operators, mostly in and around our existing acreage in the Delaware Basin. Some of this acreage, and a portion of the production, included properties identified at the time of our December 2016 equity and notes offerings. These transactions were pending at the time of those offerings and closed subsequent to December 31, 2016, bringing our total Permian Basin acreage position at February 22, 2017 to 177,600 gross (101,400 net) acres, almost all of which was located in the Delaware Basin. We have incurred capital expenditures of approximately $111 million since January 1, 2017 to acquire leasehold and mineral interests and the related production.
On February 17, 2017, we announced the formation of San Mateo, a strategic joint venture with a subsidiary of Five Point Capital Partners LLC (“Five Point”). The midstream assets contributed to San Mateo include (i) the Black River Processing Plant; (ii) one salt water disposal well and a related commercial salt water disposal facility in the Rustler Breaks asset area; (iii) three salt water disposal wells and related commercial salt water disposal facilities in the Wolf asset area; and (iv) substantially all related oil, natural gas and water gathering systems and pipelines in both the Rustler Breaks and Wolf asset areas (collectively, the “Delaware Midstream Assets”). We received $171.5 million in connection with the formation of the Joint Venture and may earn up to an additional $73.5 million in performance incentives over the next five years. We continue to operate the Delaware Midstream Assets and retain operational control of the Joint Venture. The Company and Five Point own 51% and 49% of the Joint Venture, respectively. San Mateo will continue to provide firm capacity service to us at market rates, while also being a midstream service provider to third parties in and around our Wolf and Rustler Breaks asset areas.
4
Principal Areas of Interest — Exploration and Production Segment
Our focus since inception has been the exploration for oil and natural gas in unconventional plays with an emphasis in recent years on the Wolfcamp and Bone Spring plays in the Delaware Basin in Southeast New Mexico and West Texas, the Eagle Ford shale play in South Texas and the Haynesville shale play in Northwest Louisiana and East Texas. During 2016, we devoted most of our efforts and most of our capital expenditures to our drilling and completion operations in the Wolfcamp and Bone Spring plays in the Delaware Basin, as well as our midstream operations there. Since our inception, our exploration efforts have concentrated primarily on known hydrocarbon-producing basins with well-established production histories offering the potential for multiple-zone completions. We have also sought to balance the risk profile of our asset areas by exploring for more conventional targets as well, although at December 31, 2016, essentially all of our efforts were focused on unconventional plays.
At December 31, 2016, our principal areas of interest consisted of the Wolfcamp and Bone Spring plays in the Delaware Basin in Southeast New Mexico and West Texas, the Eagle Ford shale play in South Texas and the Haynesville shale play, as well as the traditional Cotton Valley and Hosston (Travis Peak) formations, in Northwest Louisiana and East Texas.
The following table presents certain summary data for each of our operating areas as of and for the year ended December 31, 2016.
__________________
Producing | Total Identified | Estimated Net Proved | ||||||||||||||||||||||||
Wells | Drilling Locations (1) | Reserves (2) | Avg. Daily | |||||||||||||||||||||||
Gross | Net | Gross | Net | Gross | Net | % | Production | |||||||||||||||||||
Acreage | Acreage | MBOE (3) | Developed | (BOE/d) (3) | ||||||||||||||||||||||
Southeast New Mexico/West Texas: | ||||||||||||||||||||||||||
Delaware Basin (4) | 163,703 | 94,312 | 312 | 135.1 | 4,162 | 1,660.2 | 79,388 | 35.5 | 15,941 | |||||||||||||||||
South Texas: | ||||||||||||||||||||||||||
Eagle Ford (5) | 30,669 | 27,777 | 136 | 115.1 | 249 | 214.2 | 13,298 | 55.0 | 4,952 | |||||||||||||||||
Northwest Louisiana/East Texas: | ||||||||||||||||||||||||||
Haynesville | 20,105 | 12,452 | 204 | 19.8 | 431 | 103.0 | 12,414 | 61.1 | 6,517 | |||||||||||||||||
Cotton Valley (6) | 21,614 | 19,071 | 81 | 54.2 | 71 | 50.1 | 652 | 100.0 | 403 | |||||||||||||||||
Area Total (7) | 26,062 | 23,278 | 285 | 74.0 | 502 | 153.1 | 13,066 | 63.0 | 6,920 | |||||||||||||||||
Total (8) | 220,434 | 145,367 | 733 | 324.2 | 4,913 | 2,027.5 | 105,752 | 41.4 | 27,813 | |||||||||||||||||
(1) | Identified and engineered drilling locations. These locations have been identified for potential future drilling and were not producing at December 31, 2016. The total net engineered drilling locations are calculated by multiplying the gross engineered drilling locations in an operating area by our working interest participation in such locations. At December 31, 2016, these engineered drilling locations included only 163 gross (90.3 net) locations to which we have assigned proved undeveloped reserves, primarily in the Wolfcamp or Bone Spring plays, but also in the Delaware and Strawn formations in the Delaware Basin, 21 gross (21.0 net) locations to which we have assigned proved undeveloped reserves in the Eagle Ford and 12 gross (4.0 net) locations to which we have assigned proved undeveloped reserves in the Haynesville. |
(2) | These estimates were prepared by our engineering staff and audited by Netherland, Sewell & Associates, Inc., independent reservoir engineers. For additional information regarding our oil and natural gas reserves, see “—Estimated Proved Reserves” and Supplemental Oil and Natural Gas Disclosures included in the unaudited supplementary information in this Annual Report, which is incorporated herein by reference. |
(3) | Estimated using a conversion ratio of one Bbl of oil per six Mcf of natural gas. |
(4) | Includes potential future engineered drilling locations in the Wolfcamp, Bone Spring, Delaware, Strawn and Avalon plays on our acreage in the Delaware Basin at December 31, 2016. |
(5) | Includes one well producing small quantities of oil from the Austin Chalk formation and two wells producing small quantities of natural gas from the San Miguel formation in Zavala County, Texas. |
(6) | Includes the Cotton Valley formation and shallower zones and also includes one well producing from the Frio formation in Orange County, Texas. |
(7) | Some of the same leases cover the net acres shown for both the Haynesville formation and the shallower Cotton Valley formation. Therefore, the sum of the net acreage for both formations is not equal to the total net acreage for Northwest Louisiana and East Texas. This total includes acreage that we are producing from or that we believe to be prospective for these formations. |
(8) | During the year ended December 31, 2016, we released all of our acreage in Wyoming, Utah and Idaho. |
We are active both as an operator and as a co-working interest owner with larger industry participants, including affiliates of EOG Resources, Inc., Royal Dutch Shell plc, Chesapeake Energy Corporation, EP Energy Company, Concho Resources Inc., Devon Energy Corporation, Cimarex Energy Company, BHP Billiton, Mewbourne Oil Company, Occidental Petroleum Corporation, Chevron Corporation and others. At December 31, 2016, we operated the majority of our acreage in the Delaware Basin in Southeast New Mexico and West Texas. In those wells where we are not the operator, our working interests are often relatively small. At December 31, 2016, we also were the operator for approximately 93% of our Eagle Ford acreage and
5
approximately 65% of our Haynesville acreage, including approximately 32% of our acreage in what we believe is the core area of the Haynesville play. A large portion of our acreage in the core area of the Haynesville shale is operated by Chesapeake.
While we do not always have direct access to our operating partners’ drilling plans with respect to future well locations on non-operated properties, we do attempt to maintain ongoing communications with the technical staff of these operators in an effort to understand their drilling plans for purposes of our capital expenditure budget and our booking of any related proved undeveloped well locations and reserves. We review these locations with Netherland, Sewell & Associates, Inc., independent reservoir engineers, on a periodic basis to ensure their concurrence with our estimates of these drilling plans and our approach to booking these reserves.
Southeast New Mexico and West Texas — Delaware Basin
The greater Permian Basin in Southeast New Mexico and West Texas is a mature exploration and production province with extensive developments in a wide variety of petroleum systems resulting in stacked target horizons in many areas. Historically, the majority of development in this basin has focused on relatively conventional reservoir targets, but the combination of advanced formation evaluation, 3-D seismic technology, horizontal drilling and hydraulic fracturing technology is enhancing the development potential of this basin, particularly in the organic rich shales, or source rocks, of the Wolfcamp formation and in the low permeability sand and carbonate reservoirs of the Bone Spring, Avalon and Delaware formations. We believe these formations, which have been typically considered low quality rocks because of their low permeability, are strong candidates for horizontal drilling and advanced hydraulic fracturing techniques.
In the western part of the Permian Basin, also known as the Delaware Basin, the Lower Permian age Bone Spring (also called the Leonardian) and Wolfcamp formations are several thousand feet thick and contain stacked layers of shales, sandstones, limestones and dolomites. These intervals represent a complex and dynamic submarine depositional system that also includes organic rich shales that are the source rocks for oil and natural gas produced in the basin. Historically, production has come from conventional reservoirs; however, we and other industry players have realized that the source rocks also have sufficient porosity and permeability to be commercial reservoirs. In addition, the source rocks are interbedded with reservoir layers that have filled with hydrocarbons, both of which can produce significant volumes of oil and natural gas when connected by horizontal wellbores with multi-stage hydraulic fracture treatments. Particularly in the Delaware Basin, there are multiple horizontal targets in a given area that exist within the several thousand feet of hydrocarbon bearing layers that make up the Bone Spring and Wolfcamp plays. Multiple horizontal drilling and completion targets are being identified and targeted by companies, including us, throughout the vertical section including the Delaware, Avalon, Bone Spring (First, Second and Third Sand) and several intervals within the Wolfcamp shale, often identified as Wolfcamp A through D.
As noted above in “—2016 Highlights—Operational Highlights,” we increased our acreage position in the Delaware Basin during 2016, and as a result, at December 31, 2016, our total acreage position in Southeast New Mexico and West Texas was approximately 163,700 gross (94,300 net) acres, primarily in Loving County, Texas and Lea and Eddy Counties, New Mexico. These acreage totals included approximately 32,700 gross (20,400 net) acres in our Ranger asset area in Lea County, 48,000 gross (17,000 net) acres in our Arrowhead asset area in Eddy County, 25,100 gross (16,500 net) acres in our Rustler Breaks asset area in Eddy County, 13,500 gross (8,400 net) acres in our Wolf and Jackson Trust asset areas in Loving County and 42,900 gross (30,800 net) acres in our Twin Lakes asset area in Lea County at December 31, 2016. We consider the vast majority of our Delaware Basin acreage position to be prospective for oil and liquids-rich targets in the Bone Spring and Wolfcamp formations. Other potential targets on certain portions of our acreage include the Avalon and Delaware formations, as well as the Abo, Strawn, Devonian, Penn Shale, Atoka and Morrow formations. At December 31, 2016, our acreage position in the Delaware Basin was approximately 36% held by existing production. Excluding the Twin Lakes asset area, where we have drilled only one vertical Strawn well, our acreage position in the Delaware Basin was approximately 47% held by existing production at December 31, 2016.
During the year ended December 31, 2016, we continued the delineation and development of our Delaware Basin acreage. We completed and began producing oil and natural gas from 55 gross (37.0 net) wells in the Delaware Basin, including 40 gross (35.6 net) operated wells and 15 gross (1.4 net) non-operated wells, throughout our various asset areas. At December 31, 2016, we had tested a number of different producing horizons at various locations across our acreage position, including the Brushy Canyon, Avalon, two benches of the Second Bone Spring, the Third Bone Spring, three benches of the Wolfcamp A, including the X and Y sands and the more organic, lower section of the Wolfcamp A, three benches of the Wolfcamp B, the Wolfcamp D and the Strawn. Most of our delineation and development efforts have been focused on multiple completion targets between the Second Bone Spring and the Wolfcamp B.
As a result of our ongoing drilling and completion operations in these asset areas, our Delaware Basin production increased significantly in 2016. Our average daily oil equivalent production from the Delaware Basin increased approximately 145% (2.5-fold) to 15,941 BOE per day (57% of total oil equivalent production), including 10,395 Bbl of oil per day (75% of total oil production) and 33.3 MMcf of natural gas per day (40% of total natural gas production), in 2016, as compared to 6,518 BOE per day (26% of total oil equivalent production), including 4,648 Bbl of oil per day (38% of total oil production) and 11.2
6
MMcf of natural gas per day (15% of total natural gas production), in 2015. In addition, our average daily oil equivalent production from the Delaware Basin also grew approximately 138% (2.4-fold) from 8,720 BOE per day in the fourth quarter of 2015 to 20,670 BOE per day in the fourth quarter of 2016.
At December 31, 2016, approximately 75% of our estimated total proved oil and natural gas reserves, or 79.4 million BOE, was attributable to the Delaware Basin, including approximately 46.9 million Bbl of oil and 195.1 Bcf of natural gas, a 68% increase, as compared to 47.1 million BOE for the year ended December 31, 2015. Our Delaware Basin proved reserves at December 31, 2016 comprised approximately 82% of our proved oil reserves and 67% of our proved natural gas reserves, as compared to approximately 69% of our proved oil reserves and 40% of our proved natural gas reserves at December 31, 2015.
At December 31, 2016, we had identified 4,162 gross (1,660.2 net) engineered locations for potential future drilling on our Delaware Basin acreage, primarily in the Wolfcamp or Bone Spring plays, but also including the shallower Avalon and Delaware formations and the deeper Strawn formation. These locations include 2,546 gross (1,478.1 net) locations that we anticipate operating as we hold a working interest of at least 25% in each of these locations. These engineered locations have been identified on a property-by-property basis and take into account criteria such as anticipated geologic conditions and reservoir properties, estimated rates of return, estimated recoveries from our Delaware Basin wells and other nearby wells based on available public data, drilling densities observed on properties of other operators, estimated horizontal lateral lengths, estimated drilling and completion costs, spacing and other rules established by regulatory authorities and surface considerations, among other criteria. Our engineered well locations at December 31, 2016 do not yet include all portions of our acreage position and do not include any horizontal locations in our Twin Lakes asset area in Lea County, New Mexico (other than our upcoming horizontal test of the Wolfcamp D in 2017). Our identified well locations presume that these properties may be developed on 80- to 160-acre well spacing, although we believe that denser well spacing may be possible and that multiple intervals may be prospective at any one surface location. As we explore and develop our Delaware Basin acreage further, we anticipate that we may identify additional locations for future drilling. At December 31, 2016, these potential future drilling locations included only 163 gross (90.3 net) locations in the Delaware Basin, primarily in the Wolfcamp and Bone Spring plays, but also in the Delaware and Strawn formations, to which we have assigned proved undeveloped reserves.
At December 31, 2016 and February 22, 2017, we were operating four drilling rigs in the Delaware Basin—two in the Rustler Breaks asset area, one in the Wolf/Jackson Trust asset areas and one in the Ranger/Arrowhead and Twin Lakes asset areas. We intend to operate four rigs in these asset areas throughout the remainder of 2017, and we expect to add a fifth drilling rig in the Delaware Basin beginning early in the second quarter of 2017. Thereafter, we expect to operate this fifth drilling rig in the Rustler Breaks asset area throughout the remainder of 2017. We are also participating in non-operated wells in the Delaware Basin as these opportunities arise. We have allocated substantially all of our 2017 estimated capital expenditure budget to our drilling and completion program and midstream operations in the Delaware Basin, with the exception of amounts allocated to limited operations in the Eagle Ford and Haynesville shales to maintain and extend leases and to participate in certain non-operated well opportunities.
Rustler Breaks Asset Area
We made significant progress delineating, developing and testing our acreage position in the Rustler Breaks asset area in 2016. The ten Wolfcamp A-XY wells and two Wolfcamp B (Middle) wells completed and placed on production in the Rustler Breaks asset area in 2016 were consistent with or better than the best Wolfcamp A-XY wells and Wolfcamp B (Middle) wells drilled by us in this asset area to date. The Paul 25-24S-28E RB #221H well tested at the highest 24-hour initial potential flow rate of any Wolfcamp A-XY well we have drilled at Rustler Breaks—1,701 BOE per day (74% oil)—and early performance from this well indicates that it may be the best Wolfcamp A-XY well drilled to date at Rustler Breaks. During 2016, we tested our first five wells drilled in the deepest bench of the Wolfcamp B (Blair) at Rustler Breaks. This is the third bench of the Wolfcamp B we have successfully tested at Rustler Breaks. These three target benches of the Wolfcamp B occur starting approximately 300 feet into the 1,000-foot thick Wolfcamp B interval at Rustler Breaks and are each about 200 to 250 feet apart vertically.
The 24-hour initial potential flow rates from the five Wolfcamp B (Blair) wells we completed and placed on production in 2016—the Dr. Scrivner Federal 01-24S-28E RB #228H, the Jimmy Kone 05-24S-28E RB #228H, the Janie Conner 13-24S-28E RB #221H, the Anne Com 15-24S-28E RB #221H (Anne Com #221H) and the Tiger 14-24S-28E RB #227H—were the five highest 24-hour test results we have reported in the Delaware Basin to date (with the exception of the three Mallon wells discussed below) at 2,570 BOE per day, 2,438 BOE per day, 2,384 BOE per day, 2,364 BOE per day and 1,812 BOE per day, respectively, at about 35% oil. These 24-hour initial potential test results compare favorably to those from other wells completed in the Wolfcamp B (Middle), the Tiger 14-24S-28E RB #224H and Janie Conner 13-24S-28E RB #224H wells, which had 24-hour initial potential rates of 1,533 BOE per day (43% oil) and 1,703 BOE per day (59% oil), respectively. The initial oil volumes from these lower Wolfcamp B (Blair) completions were reasonably comparable to or better than those in the Wolfcamp B (Middle), while the initial natural gas volumes were higher. In some instances, the oil rates tested on the lower Wolfcamp B (Blair) wells were close to those tested on the Wolfcamp A-XY wells.
7
In the Rustler Breaks asset area in 2016, we reduced our average drilling time from spud to total depth in the Wolfcamp A-XY by approximately 31% and 16%, as compared to 2014 and 2015, respectively, and in the Wolfcamp B by approximately 50% and 35%, respectively. Our fastest-drilled Wolfcamp A-XY well, the B. Banker 33-23S-28E #226H well, was drilled in 12.5 days from spud to a total depth of 14,350 feet, a decrease of almost 50% from the average drilling time in late 2014, and our fastest-drilled Wolfcamp B well, the Anne Com #221H, was drilled in 17.4 days from spud to a total depth of 15,364 feet, a decrease of 58% from the average drilling time in 2014. These drilling times of 12.5 and 17.4 days were faster than our 2016 drilling objectives of 14 days for the Wolfcamp A-XY and 18 days for the Wolfcamp B, respectively, from spud to total depth. We delivered faster drilling times as a result of our increased knowledge of the geology and our experience with drilling in the Rustler Breaks asset area, as well as improvements in drilling the curve between the vertical and horizontal portions of these wells and continued applications of improved drill bit and bottomhole assembly technologies.
Due in part to these improvements in drilling times, continued innovation by our technical staff and lower oilfield services costs, the costs associated with recent Wolfcamp A-XY and Wolfcamp B wells at Rustler Breaks continued to decline throughout 2016. We were able to drill, complete and equip several wells in the Wolfcamp A-XY for just under $5 million each and in the Wolfcamp B for approximately $5.7 million each in mid-to-late 2016.
All of the Wolfcamp A-XY wells completed and placed on production in the Rustler Breaks asset area in 2016 were stimulated using our Generation 3 Wolfcamp stimulation treatment design, consisting of approximately 40 Bbl of fracturing fluid and 3,000 pounds of primarily 30/50 white sand per completed lateral foot. Similarly, we pumped this Generation 3 Wolfcamp stimulation treatment design in our Wolfcamp B (Blair) completions in the third and fourth quarters of 2016. Prior to this, most of our Wolfcamp A and B completions in the Rustler Breaks asset area used approximately 30 to 40 Bbl of fracturing fluid and 2,000 pounds of primarily 30/50 white sand per completed lateral foot. We also continued to pump diverting agents in most of our stimulation treatments in the Rustler Breaks asset area during the third and fourth quarters of 2016.
Wolf and Jackson Trust Asset Areas
Operational efficiencies continued to improve in the Wolf asset area as well. In 2016, we reduced our average drilling time from spud to total depth in the Wolfcamp A-X and A-Y by approximately 52% and 10% as compared to 2014 and 2015, respectively, and in the Second Bone Spring by approximately 42% as compared to our first well drilled in the Second Bone Spring in 2015. Our fastest-drilled Wolfcamp A well, the Dorothy White 82-TTT-B33 #203H well, was drilled in 17.3 days from spud to a total depth of 15,550 feet, a decrease of 61% from the 2014 average drilling time and faster than our 2016 Wolfcamp A drilling objective of 18 days from spud to total depth in the Wolf asset area. The Barnett 90-TTT-B01 WF #124H (Barnett #124H) well, a Second Bone Spring test, was drilled in approximately 11.5 days (11.2 days normalized to a 5,000-foot lateral length) from spud to total depth, with drilling times being faster than our 2016 year-end drilling target of 13 days for Second Bone Spring wells. In the Barnett #124H and subsequent Second Bone Spring wells drilled in 2016, our drilling engineers were also able to eliminate a second intermediate casing string typically used when drilling the Second Bone Spring in this area. Not only did eliminating this casing string save approximately $650,000 in well costs on each Second Bone Spring well drilled in 2016, but it also provided for larger casing to be set through the lateral, thereby reducing hydraulic horsepower costs during fracturing operations and enhancing the number of artificial lift options available in the future. Total costs to drill, complete and equip Second Bone Spring wells in the Wolf asset area were just over $4 million in mid-to-late 2016.
Well costs associated with recent Wolfcamp A-X and A-Y wells drilled and completed in the Wolf asset area also continued to decline. Costs to drill, complete and equip Wolfcamp A wells ranged between $5 and $6 million, with a number of these wells at or below $5.5 million in mid-to-late 2016. As in the Rustler Breaks asset area, we attribute these cost savings to the innovation and use of new technologies by our drilling, completions and production teams, as well as lower oilfield services costs.
Our Second Bone Spring completions in 2016 represented significant improvements over our initial Second Bone Spring well drilled in the Wolf asset area in 2015. We attribute this improvement in well performance to the increased stimulation treatments pumped in 2016. The 2016 wells were completed using approximately 40 Bbl of fracturing fluid and 2,000 pounds of primarily 20/40 sand per completed lateral foot, compared to our initial Second Bone Spring completion in the Wolf asset area, which used only 20 Bbl of fracturing fluid and about 1,300 pounds of primarily 30/50 sand per completed lateral foot. In particular, we were pleased with the test results observed from the Johnson 44-02S-B53 WF #121H well, which had the highest test rate achieved from any Second Bone Spring well we have drilled to date of 1,167 BOE per day (58% oil).
We did not complete and place on production any new wells in our Jackson Trust asset area in 2016, although we do have several wells planned in our Jackson Trust asset area for 2017.
8
Ranger and Arrowhead Asset Areas
In the Ranger asset area in Lea County, New Mexico, we completed and placed on production the Mallon 27 Federal Com #1H, #2H and #3H wells, each of which are 7,300-foot laterals drilled and completed in the Third Bone Spring sand. These wells were the first operated wells we have drilled on the acreage acquired in our 2015 merger with Harvey E. Yates Company (“HEYCO” and, such merger, the “HEYCO Merger”). In aggregate, these three wells flowed 7,856 BOE per day (91% oil) in their 24-hour initial potential tests. Each well was completed with a 29-stage fracture treatment, including approximately 40 Bbl of fluid and 3,000 pounds of primarily 20/40 white sand per completed lateral foot. At December 31, 2016, these were the largest fracture treatments we have pumped in a Bone Spring completion. The Mallon wells were among the best wells we have drilled to date in the Delaware Basin, and these wells illustrate the potential of our northern Delaware Basin acreage position.
We did not conduct any operated drilling and completion activities in our Arrowhead asset area during 2016, although we did participate in one new, non-operated well on our Arrowhead acreage during the first quarter of 2016. This well, the Yates Petroleum Corporation Baroque “BTQ” Federal Com #1H well, tested at flow rates averaging approximately 1,300 BOE per day (including approximately 1,100 Bbl of oil per day and 1.2 MMcf of natural gas per day) beginning in late March 2016. This well is located in the eastern portion of our Arrowhead asset area in Eddy County, New Mexico. We own a 9.5% working interest in this well, which provides yet another indication of the prospectivity of our northern Delaware Basin acreage.
Twin Lakes Asset Area
In our Twin Lakes asset area in northern Lea County, New Mexico, we drilled an initial data collection well, the Olivine State 5-16S-37E TL #1 (Olivine State #1), during the fourth quarter of 2015. This was a vertical pilot hole drilled for the purpose of collecting whole core and a detailed suite of geophysical logs to assist us in determining the landing target for our initial horizontal test of the Wolfcamp D interval at Twin Lakes. We collected about 400 feet of whole core throughout much of the Wolfcamp D interval, and our geoscience staff, along with third-party vendors, have conducted detailed description and analysis of the core data and well logs. The Olivine State #1 was drilled through the Wolfcamp D and into and through the Strawn formation below. The Strawn interval at about 11,500 feet is a complex carbonate formation that has previously produced significant quantities of oil and natural gas in the Twin Lakes area. Upon drilling through the Strawn interval, our geoscience staff analyzed the well logs taken across the interval and determined that there was the potential for a Strawn test. As a result, the Olivine State #1 was perforated and completed in the Strawn interval with a small acid treatment during the first quarter of 2016. This well flowed 691 BOE per day (84% oil) during a 24-hour initial potential test, consisting of 579 Bbl of oil per day and 0.7 MMcf of natural gas per day, at a flowing surface pressure of 350 psi on a 32/64 inch choke. Given the positive results from this Strawn test, we elected to produce the Olivine State #1 rather than plug back, kick off and drill a horizontal Wolfcamp D test from this vertical wellbore as originally anticipated. We expect to drill a new horizontal well to test the Wolfcamp D interval beginning late in the first quarter of 2017.
South Texas — Eagle Ford Shale and Other Formations
The Eagle Ford shale extends across portions of South Texas from the Mexican border into East Texas forming a band roughly 50 to 100 miles wide and 400 miles long. The Eagle Ford is an organically rich calcareous shale and lies between the deeper Buda limestone and the shallower Austin Chalk formation. Along the entire length of the Eagle Ford trend, the structural dip of the formation is consistently down to the south with relatively few, modestly sized structural perturbations. As a result, depth of burial increases consistently southwards along with the thermal maturity of the formation. Where the Eagle Ford is shallow, it is less thermally mature and therefore more oil prone, and as it gets deeper and becomes more thermally mature, the Eagle Ford is more natural gas prone. The transition between being more oil prone and more natural gas prone includes an interval that typically produces liquids-rich natural gas with condensate.
At December 31, 2016, our properties included approximately 30,700 gross (27,800 net) acres in the Eagle Ford shale play in Atascosa, DeWitt, Gonzales, Karnes, La Salle, Wilson and Zavala Counties in South Texas. We believe that approximately 88% of our Eagle Ford acreage is prospective predominantly for oil or liquids-rich natural gas with condensate. Approximately 85% of our Eagle Ford acreage was held by production at December 31, 2016, and approximately 95% of our Eagle Ford acreage was either held by production at December 31, 2016 or not burdened by lease expirations before 2018.
We did not conduct any operated drilling and completion activities on our leasehold properties in South Texas during the year ended December 31, 2016, although we did participate in the drilling and completion of two gross (less than 0.1 net) non-operated Eagle Ford shale wells that were turned to sales in 2016. In fact, as of December 31, 2016, we had not drilled any operated wells in the Eagle Ford shale since early 2015, when we completed and placed on production 17 gross (17.0 net) operated Eagle Ford shale wells in the first four months of 2015. As a result, our average daily oil equivalent production from the Eagle Ford shale decreased 52% to 4,952 BOE per day, including 3,517 Bbl of oil per day and 8.6 MMcf of natural gas per day, during 2016, as compared to 10,263 BOE per day, including 7,642 Bbl of oil per day and 15.7 MMcf of natural gas per day, during 2015. For the year ended December 31, 2016, 18% of our total daily oil equivalent production was attributable to the Eagle Ford shale. During the year ended December 31, 2015, approximately 41% of our total daily oil equivalent production was attributable to the Eagle Ford shale.
9
At December 31, 2016, approximately 13% of our estimated total proved oil and natural gas reserves, or 13.3 million BOE, was attributable to the Eagle Ford shale, including approximately 10.1 million Bbl of oil and 19.3 Bcf of natural gas. Our Eagle Ford total proved reserves comprised approximately 18% of our proved oil reserves and 7% of our proved natural gas reserves at December 31, 2016, as compared to approximately 31% of our proved oil reserves and 12% of our proved natural gas reserves at December 31, 2015.
At December 31, 2016, we had identified 249 gross (214.2 net) engineered locations for potential future drilling on our Eagle Ford acreage. These locations have been identified on a property-by-property basis and take into account criteria such as anticipated geologic conditions and reservoir properties, estimated rates of return, estimated recoveries from our producing Eagle Ford wells and other nearby wells based on available public data, drilling densities anticipated on our properties and observed on properties of other operators, estimated horizontal lateral lengths, estimated drilling and completion costs, spacing and other rules established by regulatory authorities and surface considerations, among other factors. The identified well locations presume that we will be able to develop our Eagle Ford properties on 40- to 80-acre spacing, depending on the specific property and the wells we have already drilled. We anticipate that any Eagle Ford wells drilled on our acreage in central and northern La Salle, northern Karnes and southern Wilson Counties can be developed on 40- to 50-acre spacing, while other properties, particularly the eastern portion of our acreage in DeWitt County, are more likely to be developed on 80-acre spacing. Approximately 95% of our Eagle Ford acreage was either held by production or not burdened by lease expirations before 2018 at December 31, 2016. At December 31, 2016, these 249 gross (214.2 net) identified drilling locations included only 21 gross (21.0 net) locations to which we have assigned proved undeveloped reserves.
These engineered drilling locations include only a single interval in the lower portion of the Eagle Ford shale. We believe portions of our Eagle Ford acreage may be prospective for an additional target in the lower portion of the Eagle Ford shale and for other intervals in the upper portion of the Eagle Ford shale, from which we would expect to produce predominantly oil and liquids. In addition, we believe portions of our Eagle Ford acreage may also be prospective for the Austin Chalk, Buda and Edwards formations, from which we would expect to produce predominantly oil and liquids. In particular, we own approximately 8,900 gross (8,900 net) contiguous acres on our Glasscock Ranch property in southeast Zavala County, Texas, which are held by production and which we believe may be prospective for the Buda formation. At December 31, 2016, we had not included any future drilling locations in the upper portion of the Eagle Ford shale, in any additional intervals of the lower portion of the Eagle Ford shale or in the Austin Chalk or Buda formations.
Northwest Louisiana and East Texas
We did not conduct any operated drilling and completion activities on our leasehold properties in Northwest Louisiana and East Texas during 2016, although we did participate in the drilling and completion of 15 gross (2.1 net) non-operated Haynesville shale wells that were turned to sales in 2016. These wells included nine gross (1.9 net) Haynesville wells operated by a subsidiary of Chesapeake Energy Corporation (“Chesapeake”) on our Elm Grove acreage in southern Caddo Parish, Louisiana. These nine wells came on production at an average of 13.5 MMcf per day and were drilled and completed for an average of under $7 million. We do not plan to drill any operated Haynesville shale wells in 2017.
At December 31, 2016, we held approximately 26,100 gross (23,300 net) acres in Northwest Louisiana and East Texas, including 20,100 gross (12,500 net) acres in the Haynesville shale play. We operate all of our Cotton Valley and shallower production on our leasehold interests in Northwest Louisiana and East Texas, as well as all of our Haynesville production on the acreage outside of what we believe to be the core area of the Haynesville shale play. We operate approximately 32% of the 13,200 gross (6,400 net) acres that we consider to be in the core area of the Haynesville play.
For the year ended December 31, 2016, approximately 25% of our average daily oil equivalent production, or 6,920 BOE per day, including 12 Bbl of oil per day and 41.4 MMcf of natural gas per day, was attributable to our leasehold interests in Northwest Louisiana and East Texas. Natural gas production from these properties comprised approximately 50% of our daily natural gas production, but oil production from these properties comprised only about 0.1% of our daily oil production during 2016, as compared to approximately 64% of our daily natural gas production and approximately 0.1% of our daily oil production during 2015. During the year ended December 31, 2015, approximately 33% of our average daily oil equivalent production, or 8,174 BOE per day, including 16 Bbl of oil per day and 48.9 MMcf of natural gas per day, was attributable to our properties in Northwest Louisiana and East Texas.
For the year ended December 31, 2016, approximately 47% of our daily natural gas production, or 39.1 MMcf of natural gas per day, was produced from the Haynesville shale, with approximately 3%, or 2.3 MMcf of natural gas per day, produced from the Cotton Valley and other shallower formations on these properties. For the year ended December 31, 2015, approximately 61% of our daily natural gas production, or 46.4 MMcf of natural gas per day, was produced from the Haynesville shale, with approximately 3%, or 2.6 MMcf of natural gas per day, produced from the Cotton Valley and other shallower formations on these properties. At December 31, 2016, approximately 12% of our estimated total proved reserves, or 12.4 million BOE, was attributable to the Haynesville shale with another 1% of our proved reserves, or 0.7 million BOE, attributable to the Cotton Valley and shallower formations underlying this acreage.
10
At December 31, 2016, we had identified and engineered 431 gross (103.0 net) locations for potential future drilling in the Haynesville shale play and 71 gross (50.1 net) locations for potential future drilling in the Cotton Valley formation. These engineered locations have been identified on a property-by-property basis and take into account criteria such as anticipated geologic conditions and reservoir properties, estimated rates of return, estimated recoveries from our producing Haynesville and Cotton Valley wells and other nearby wells based on available public data, drilling densities observed on properties of other operators, including on some of our non-operated properties, estimated horizontal lateral lengths, estimated drilling and completion costs, spacing and other rules established by regulatory authorities and surface conditions, among other criteria. Of the 431 gross (103.0 net) locations identified for future drilling on our Haynesville acreage, 357 gross (50.1 net) locations have been identified within the 13,200 gross (6,400 net) acres that we believe are located in the core area of the Haynesville play. As we explore and develop our Northwest Louisiana and East Texas acreage further, we believe it is possible that we may identify additional locations for future drilling. At December 31, 2016, these potential future drilling locations included only 12 gross (4.0 net) locations in the Haynesville shale (and no locations in the Cotton Valley) to which we have assigned proved undeveloped reserves.
Haynesville and Middle Bossier Shales
The Haynesville shale is an organically rich, overpressured marine shale found below the Cotton Valley and Bossier formations and above the Smackover formation at depths ranging from 10,500 to 13,500 feet across a broad region throughout Northwest Louisiana and East Texas, including principally Bossier, Caddo, DeSoto and Red River Parishes in Louisiana and Harrison, Rusk, Panola and Shelby Counties in Texas. The Haynesville shale produces primarily dry natural gas with almost no associated liquids. The Bossier shale is overpressured and is often divided into lower, middle and upper units. The Middle Bossier shale appears to be productive for natural gas under large portions of DeSoto, Red River and Sabine Parishes in Louisiana and Shelby and Nacogdoches Counties in Texas, where it shares many similar productive characteristics with the deeper Haynesville shale. Although there is some overlap between the Haynesville and Bossier shale plays, the two plays appear quite distinct and a separate horizontal wellbore is typically needed for each formation.
At December 31, 2016, we had approximately 20,100 gross (12,500 net) acres in the Haynesville shale play, primarily in Northwest Louisiana. Based on our analysis of geologic and petrophysical information (including total organic carbon content and maturity, resistivity, porosity and permeability, among other information), well performance data, information available to us related to drilling activity and results from wells drilled across the Haynesville shale play, approximately 13,200 gross (6,400 net) acres are located in what we believe is the core area of the play. We believe the core area of the play includes that area in which the most Haynesville wells have been drilled by operators and from which we anticipate natural gas recoveries would likely exceed 6 Bcf per well. Almost all of our Haynesville acreage is held by production or consists of fee mineral interests that we own and portions of it are also producing from and, we believe, prospective for the Cotton Valley, Hosston (Travis Peak) and other shallower formations. In addition, we believe that approximately 1,200 net acres are prospective for the Middle Bossier shale play. We have never drilled a Middle Bossier shale well, and, although we believe that prospective well locations may exist on this acreage, we have not included any Middle Bossier locations in our engineered drilling locations at December 31, 2016.
Within the acreage that we believe to be in the core area of the Haynesville shale play, we are the operator of approximately 2,100 net acres. We have identified 25 gross (19.6 net) potential additional Haynesville locations that we may drill and operate in the future on this acreage. The remainder of our acreage in the core area of the Haynesville shale play is operated by other companies, including our Elm Grove properties in southern Caddo Parish, Louisiana that are operated by Chesapeake following a sale of a portion of our interests there in July 2008. The working interests in our non-operated Haynesville wells are typically small, ranging from less than 1% to just over 31%.
Cotton Valley, Hosston (Travis Peak) and Other Shallower Formations
Prior to initiating natural gas production from the Haynesville shale in 2009, almost all of our production and reserves in Northwest Louisiana and East Texas was attributable to wells producing from the Cotton Valley formation. We own almost all of the shallow rights from the base of the Cotton Valley formation to the surface under our acreage in Northwest Louisiana and East Texas.
All of the shallow rights underlying our acreage in our Elm Grove properties in Northwest Louisiana, approximately 10,000 gross (9,800 net) acres at December 31, 2016, are held by existing production from the Cotton Valley formation or the Haynesville shale. The Cotton Valley formation was the primary producing zone in the Elm Grove field prior to discovery of the Haynesville shale. The Cotton Valley formation is a low permeability natural gas sand that ranges in thickness from 200 to 300 feet and has porosity ranging from 6% to 10%.
We have identified 71 gross (50.1 net) additional drilling locations for future Cotton Valley horizontal wells on our Elm Grove properties. We did not drill any of these locations in 2016 and do not plan to drill any of these locations in 2017. As long as this leasehold acreage is held by existing production from the vertical Cotton Valley wells or the deeper Haynesville shale
11
wells, however, these Cotton Valley natural gas volumes remain available to be developed by us should natural gas prices improve, drilling and completion costs decline or new technologies be developed that increase expected recoveries.
We also continue to hold the shallow rights primarily by existing production on our Central and Southwest Pine Island, Longwood, Woodlawn and other asset areas in Northwest Louisiana and East Texas. At December 31, 2016, we held an estimated 11,600 gross (9,200 net) leasehold and mineral acres by existing production in these areas.
Southwest Wyoming, Northeast Utah and Southeast Idaho — Meade Peak Shale
During the year ended December 31, 2016, we released all of our leasehold interests in Southwest Wyoming and adjacent areas in Utah and Idaho, which were originally leased as a part of a natural gas shale exploration prospect targeting the Meade Peak shale. As a result, we held no leasehold interests in these areas at December 31, 2016.
Midstream Segment
The midstream segment conducts midstream operations in support of our exploration, development and production operations and provides natural gas processing, natural gas, oil and salt water gathering services and salt water disposal services to third parties on a limited basis. Through the ownership and operation of these facilities, we improve our ability to manage costs and control the timing of bringing on new production, and we enhance the value received for our production. With the exception of a joint venture, which we controlled and which owned salt water disposal assets in Loving County, Texas, all of our midstream operations were wholly-owned by the Company at December 31, 2016. In February 2017, we contributed our Delaware Midstream Assets to San Mateo.
Southeast New Mexico and West Texas — Delaware Basin
In late August 2016, we successfully completed and began operating the Black River Processing Plant in our Rustler Breaks asset area in Eddy County, New Mexico. The Black River Processing Plant has an inlet capacity of approximately 60 MMcf of natural gas per day, which is almost twice the size of the previous cryogenic processing plant we built in our Wolf asset area in Loving County, Texas (the “Wolf Processing Plant”) and subsequently sold to an affiliate of EnLink Midstream Partners, LP (“EnLink”) in October 2015. The Black River Processing Plant and associated gathering system was built to support our ongoing and future development efforts in the Rustler Breaks asset area and to provide us with priority one takeaway and processing services for our Rustler Breaks natural gas production. It may also provide additional income through the gathering and processing of third-party natural gas. We had previously completed the installation and testing of a 12-inch natural gas trunk line and associated gathering lines running throughout the length of our Rustler Breaks acreage position, and these natural gas gathering lines are being used to gather almost all of our natural gas production at Rustler Breaks. In addition, in late December 2016, we placed in service our initial salt water disposal well and associated salt water disposal facility and water gathering pipelines in our Rustler Breaks asset area. We disposed of over 800,000 Bbl of salt water during the well’s first two months of operation.
In our Wolf asset area in Loving County, Texas, we have oil, natural gas and salt water gathering systems that gather our oil, natural gas and water production and a small volume of third-party natural gas. We retained this three-pipeline system following the sale of our wholly-owned subsidiary that owned certain natural gas gathering and processing assets in the Wolf asset area (the “Loving County Processing System”) to EnLink in October 2015. The Loving County Processing System included the Wolf Processing Plant and approximately six miles of high-pressure gathering pipeline that connects our gathering system to the Wolf Processing Plant. We also retained our interest in commercial salt water disposal assets in Loving County. During 2016, we disposed of approximately 10.2 million Bbl of salt water, including disposal of third-party salt water on a commercial basis. At February 22, 2017, San Mateo had capacity to dispose of approximately 50,000 Bbl of salt water per day in the Wolf asset area. San Mateo is in the process of completing its third salt water disposal well and related disposal facility in the Wolf asset area, which is expected to be operational by the end of the first quarter of 2017 and which should increase the total salt water disposal capacity in the Wolf asset area to approximately 75,000 Bbl per day.
South Texas / Northwest Louisiana and East Texas
In South Texas, we own a natural gas gathering system that gathers natural gas production from certain of our operated Eagle Ford leases. In Northwest Louisiana and East Texas, we have midstream assets that gather and treat natural gas from most of our operated leases there and from third parties. We also have four non-commercial salt water disposal wells that dispose of our salt water. Our midstream assets in South Texas and Northwest Louisiana and East Texas are not part of San Mateo.
12
Operating Summary
The following table sets forth certain unaudited production and operating data for the years ended December 31, 2016, 2015 and 2014.
__________________
Year Ended December 31, | |||||||||||||
2016 | 2015 | 2014 | |||||||||||
Unaudited Production Data: | |||||||||||||
Net Production Volumes: | |||||||||||||
Oil (MBbl) | 5,096 | 4,492 | 3,320 | ||||||||||
Natural gas (Bcf) | 30.5 | 27.7 | 15.3 | ||||||||||
Total oil equivalent (MBOE) (1) | 10,180 | 9,109 | 5,870 | ||||||||||
Average daily production (BOE/d) (1) | 27,813 | 24,955 | 16,082 | ||||||||||
Average Sales Prices: | |||||||||||||
Oil, without realized derivatives (per Bbl) | $ | 41.19 | $ | 45.27 | $ | 87.37 | |||||||
Oil, with realized derivatives (per Bbl) | $ | 42.34 | $ | 59.13 | $ | 88.94 | |||||||
Natural gas, without realized derivatives (per Mcf) | $ | 2.66 | $ | 2.71 | $ | 5.08 | |||||||
Natural gas, with realized derivatives (per Mcf) | $ | 2.78 | $ | 3.24 | $ | 5.06 | |||||||
Operating Expenses (per BOE): | |||||||||||||
Production taxes, transportation and processing | $ | 4.23 | $ | 3.91 | (2) | $ | 5.65 | ||||||
Lease operating | $ | 5.52 | $ | 6.01 | (3) | $ | 8.51 | (3) | |||||
Plant and other midstream services operating | $ | 0.53 | $ | 0.38 | $ | 0.24 | |||||||
Depletion, depreciation and amortization | $ | 11.99 | $ | 19.63 | $ | 22.95 | |||||||
General and administrative | $ | 5.41 | $ | 5.50 | $ | 5.48 | |||||||
(1) | Estimated using a conversion ratio of one Bbl of oil per six Mcf of natural gas. |
(2) | $0.01 per BOE reclassified to third-party midstream services revenues due to our midstream business becoming a reportable segment in the third quarter of 2016. |
(3) | $0.38 and $0.24 per BOE reclassified to plant and other midstream services operating expenses for the years ended December 31, 2015 and 2014, respectively, due to our midstream business becoming a reportable segment in the third quarter of 2016. |
The following table sets forth information regarding our production volumes, sales prices and production costs for the year ended December 31, 2016 from our operating areas, which we consider to be distinct fields for purposes of accounting for production.
__________________
Southeast New Mexico/West Texas | South Texas | Northwest Louisiana/East Texas | ||||||||||||||||||
Delaware Basin | Eagle Ford (1) | Haynesville | Cotton Valley (2) | Total | ||||||||||||||||
Annual Net Production Volumes | ||||||||||||||||||||
Oil (MBbl) | 3,805 | 1,286 | — | 5 | 5,096 | |||||||||||||||
Natural gas (Bcf) | 12.2 | 3.1 | 14.3 | 0.9 | 30.5 | |||||||||||||||
Total oil equivalent (MBOE) (3) | 5,834 | 1,813 | 2,385 | 148 | 10,180 | |||||||||||||||
Percentage of total annual net production | 57.3 | % | 17.8 | % | 23.4 | % | 1.5 | % | 100.0 | % | ||||||||||
Average Net Daily Production Volumes | ||||||||||||||||||||
Oil (Bbl/d) | 10,395 | 3,517 | — | 12 | 13,924 | |||||||||||||||
Natural gas (MMcf/d) | 33.3 | 8.6 | 39.1 | 2.3 | 83.3 | |||||||||||||||
Total oil equivalent (BOE/d) | 15,941 | 4,952 | 6,517 | 403 | 27,813 | |||||||||||||||
Average Sales Prices (4) | ||||||||||||||||||||
Oil (per Bbl) | $ | 41.76 | $ | 39.49 | $ | — | $ | 38.78 | $ | 41.19 | ||||||||||
Natural gas (per Mcf) | $ | 3.15 | $ | 3.11 | $ | 2.17 | $ | 2.27 | $ | 2.66 | ||||||||||
Total oil equivalent (per BOE) | $ | 33.81 | $ | 33.46 | $ | 13.04 | $ | 14.39 | $ | 28.60 | ||||||||||
Production Costs (5) | ||||||||||||||||||||
Lease operating, transportation and processing (per BOE) | $ | 7.32 | $ | 12.74 | $ | 4.73 | $ | 17.07 | $ | 7.82 | ||||||||||
(1) | Includes one well producing small volumes of oil from the Austin Chalk formation and two wells producing small quantities of natural gas from the San Miguel formation in Zavala County, Texas. |
13
(2) | Includes the Cotton Valley formation and shallower zones and also includes one well producing from the Frio formation in Orange County, Texas. |
(3) | Estimated using a conversion ratio of one Bbl of oil per six Mcf of natural gas. |
(4) | Excludes impact of derivative settlements. |
(5) | Excludes plant and other midstream services operating expenses, ad valorem taxes and oil and natural gas production taxes. |
The following table sets forth information regarding our production volumes, sales prices and production costs for the year ended December 31, 2015 from our operating areas, which we consider to be distinct fields for purposes of accounting for production.
Southeast New Mexico/West Texas | South Texas | Northwest Louisiana/East Texas | ||||||||||||||||||
Delaware Basin | Eagle Ford (1) | Haynesville | Cotton Valley (2) | Total | ||||||||||||||||
Annual Net Production Volumes | ||||||||||||||||||||
Oil (MBbl) | 1,697 | 2,789 | — | 6 | 4,492 | |||||||||||||||
Natural gas (Bcf) | 4.1 | 5.7 | 16.9 | 1.0 | 27.7 | |||||||||||||||
Total oil equivalent (MBOE) (3) | 2,379 | 3,746 | 2,822 | 162 | 9,109 | |||||||||||||||
Percentage of total annual net production | 26.1 | % | 41.1 | % | 31.0 | % | 1.8 | % | 100.0 | % | ||||||||||
Average Net Daily Production Volumes | ||||||||||||||||||||
Oil (Bbl/d) | 4,648 | 7,642 | — | 16 | 12,306 | |||||||||||||||
Natural gas (MMcf/d) | 11.2 | 15.7 | 46.4 | 2.6 | 75.9 | |||||||||||||||
Total oil equivalent (BOE/d) | 6,518 | 10,263 | 7,731 | 443 | 24,955 | |||||||||||||||
Average Sales Prices (4) | ||||||||||||||||||||
Oil (per Bbl) | $ | 43.54 | $ | 46.33 | $ | — | $ | 43.68 | $ | 45.27 | ||||||||||
Natural gas (per Mcf) | $ | 3.00 | $ | 3.17 | $ | 2.49 | $ | 2.45 | $ | 2.71 | ||||||||||
Total oil equivalent (per BOE) | $ | 36.21 | $ | 39.35 | $ | 14.97 | $ | 15.69 | $ | 30.56 | ||||||||||
Production Costs (5) | ||||||||||||||||||||
Lease operating, transportation and processing (per BOE) (6) | $ | 8.84 | $ | 9.25 | $ | 4.91 | $ | 19.23 | $ | 7.90 | ||||||||||
_________________
(1) | Includes one wells producing small volumes of oil from the Austin Chalk formation and two wells producing small quantities of natural gas from the San Miguel formation in Zavala County, Texas. |
(2) | Includes the Cotton Valley formation and shallower zones and also includes one well producing from the Frio formation in Orange County, Texas. |
(3) | Estimated using a conversion ratio of one Bbl of oil per six Mcf of natural gas. |
(4) | Excludes impact of derivative settlements. |
(5) | Excludes plant and other midstream services operating expenses, ad valorem taxes and oil and natural gas production taxes. |
(6) | Amounts have been adjusted to reflect the reclassification of certain lease operating expenses to plant and other midstream services operating expenses due to our midstream business becoming a reportable segment in the third quarter of 2016. |
14
The following table sets forth information regarding our production volumes, sales prices and production costs for the year ended December 31, 2014 from our operating areas, which we consider to be distinct fields for purposes of accounting for production.
Southeast New Mexico/West Texas | South Texas | Northwest Louisiana/East Texas | ||||||||||||||||||
Delaware Basin | Eagle Ford (1) | Haynesville | Cotton Valley (2) | Total | ||||||||||||||||
Annual Net Production Volumes | ||||||||||||||||||||
Oil (MBbl) | 480 | 2,834 | — | 6 | 3,320 | |||||||||||||||
Natural gas (Bcf) | 1.0 | 6.0 | 7.2 | 1.1 | 15.3 | |||||||||||||||
Total oil equivalent (MBOE) (3) | 653 | 3,833 | 1,201 | 183 | 5,870 | |||||||||||||||
Percentage of total annual net production | 11.1 | % | 65.3 | % | 20.5 | % | 3.1 | % | 100.0 | % | ||||||||||
Average Net Daily Production Volumes | ||||||||||||||||||||
Oil (Bbl/d) | 1,314 | 7,764 | — | 17 | 9,095 | |||||||||||||||
Natural gas (MMcf/d) | 2.9 | 16.4 | 19.7 | 2.9 | 41.9 | |||||||||||||||
Total oil equivalent (BOE/d) | 1,790 | 10,501 | 3,290 | 501 | 16,082 | |||||||||||||||
Average Sales Prices (4) | ||||||||||||||||||||
Oil (per Bbl) | $ | 80.16 | $ | 88.58 | $ | — | $ | 91.24 | $ | 87.37 | ||||||||||
Natural gas (per Mcf) | $ | 4.75 | $ | 6.72 | $ | 3.87 | $ | 4.30 | $ | 5.08 | ||||||||||
Total oil equivalent (per BOE) | $ | 66.41 | $ | 75.99 | $ | 23.27 | $ | 27.92 | $ | 62.64 | ||||||||||
Production Costs (5) | ||||||||||||||||||||
Lease operating, transportation and processing (per BOE) (6) | $ | 13.08 | $ | 10.34 | $ | 8.13 | $ | 17.58 | $ | 10.29 | ||||||||||
_________________
(1) | Includes two wells producing small volumes of oil from the Austin Chalk formation and two wells producing small quantities of natural gas from the San Miguel formation in Zavala County, Texas. |
(2) | Includes the Cotton Valley formation and shallower zones and also includes one well producing from the Frio formation in Orange County, Texas. |
(3) | Estimated using a conversion ratio of one Bbl of oil per six Mcf of natural gas. |
(4) | Excludes impact of derivative settlements. |
(5) | Excludes plant and other midstream services operating expenses, ad valorem taxes and oil and natural gas production taxes. |
(6) | Amounts have been adjusted to reflect the reclassification of certain lease operating expenses to plant and other midstream services operating expenses due to our midstream business becoming a reportable segment in the third quarter of 2016. |
Our total oil equivalent production of approximately 10.2 million BOE for the year ended December 31, 2016 increased 12% from our total oil equivalent production of approximately 9.1 million BOE for the year ended December 31, 2015. This increased production was primarily due to our delineation and development operations in the Delaware Basin, which offset declining production in the Eagle Ford and Haynesville shales where we have not drilled any new operated wells since the second quarter of 2015. Our average daily oil equivalent production for the year ended December 31, 2016 was 27,813 BOE per day, as compared to 24,955 BOE per day for the year ended December 31, 2015. Our average daily oil production for the year ended December 31, 2016 was 13,924 Bbl of oil per day, an increase of 13% from 12,306 Bbl of oil per day for the year ended December 31, 2015. Our average daily natural gas production for the year ended December 31, 2016 was 83.3 MMcf of natural gas per day, an increase of 10% from 75.9 MMcf of natural gas per day for the year ended December 31, 2015.
Our total oil equivalent production of approximately 9.1 million BOE for the year ended December 31, 2015 increased 55% from our total oil equivalent production of approximately 5.9 million BOE for the year ended December 31, 2014. This increased production was primarily due to our delineation and development operations in the Delaware Basin and new, non-operated Haynesville shale wells completed and placed on production on our Elm Grove properties in Northwest Louisiana during the latter half of 2014 and into 2015, as well as from newly drilled and completed wells in the Eagle Ford shale in early 2015. Our average daily oil equivalent production for the year ended December 31, 2015 was 24,955 BOE per day, as compared to 16,082 BOE per day for the year ended December 31, 2014. Our average daily oil production for the year ended December 31, 2015 was 12,306 Bbl of oil per day, an increase of 35% from 9,095 Bbl of oil per day for the year ended December 31, 2014. Our average daily natural gas production for the year ended December 31, 2015 was 75.9 MMcf of natural gas per day, an increase of 81% from 41.9 MMcf of natural gas per day for the year ended December 31, 2014.
15
Producing Wells
The following table sets forth information relating to producing wells at December 31, 2016. Wells are classified as oil wells or natural gas wells according to their predominant production stream. We had an approximate average working interest of 72% in all wells that we operated at December 31, 2016. For wells where we are not the operator, our working interests range from less than 1% to as much as just over 50%, and average approximately 10%. In the table below, gross wells are the total number of producing wells in which we own a working interest and net wells represent the total of our fractional working interests owned in the gross wells.
Oil Wells | Natural Gas Wells | Total Wells | ||||||||||||||||
Gross | Net | Gross | Net | Gross | Net | |||||||||||||
Southeast New Mexico/West Texas: | ||||||||||||||||||
Delaware Basin (1) | 261 | 116.0 | 51 | 19.1 | 312 | 135.1 | ||||||||||||
South Texas: | ||||||||||||||||||
Eagle Ford (2) | 132 | 111.1 | 4 | 4.0 | 136 | 115.1 | ||||||||||||
Northwest Louisiana/East Texas: | ||||||||||||||||||
Haynesville | — | — | 204 | 19.8 | 204 | 19.8 | ||||||||||||
Cotton Valley (3) | 2 | 2.0 | 79 | 52.2 | 81 | 54.2 | ||||||||||||
Area Total | 2 | 2.0 | 283 | 72.0 | 285 | 74.0 | ||||||||||||
Total | 395 | 229.1 | 338 | 95.1 | 733 | 324.2 | ||||||||||||
(1) | Includes 176 gross (50.5 net) wells acquired in February 2015 as part of the HEYCO Merger. |
(2) | Includes one well producing small volumes of oil from the Austin Chalk formation and two wells producing small quantities of natural gas from the San Miguel formation in Zavala County, Texas. |
(3) | Includes the Cotton Valley formation and shallower zones and also includes one well producing from the Frio formation in Orange County, Texas. |
Estimated Proved Reserves
The following table sets forth our estimated proved oil and natural gas reserves at December 31, 2016, 2015 and 2014. Our production and proved reserves are reported in two streams: oil and natural gas, including both dry and liquids-rich natural gas. Where we produce liquids-rich natural gas, such as in the Delaware Basin and the Eagle Ford shale, the economic value of the natural gas liquids associated with the natural gas is included in the estimated wellhead natural gas price on those properties where the natural gas liquids are extracted and sold. The reserves estimates were based on evaluations prepared by our engineering staff and have been audited for their reasonableness by Netherland, Sewell & Associates, Inc., independent reservoir engineers. These reserves estimates were prepared in accordance with the SEC’s rules for oil and natural gas reserves reporting. The estimated reserves shown are for proved reserves only and do not include any unproved reserves classified as probable or possible reserves that might exist for our properties, nor do they include any consideration that could be attributable to interests in unproved and unevaluated acreage beyond those tracts for which proved reserves have been estimated. Proved oil and natural gas reserves are the estimated quantities of crude oil and natural gas that geological and engineering data demonstrate with reasonable certainty to be recoverable in future years from known reservoirs under existing economic and operating conditions.
16
At December 31, (1) | ||||||||||||
2016 | 2015 | 2014 | ||||||||||
Estimated Proved Reserves Data: (2) | ||||||||||||
Estimated proved reserves: | ||||||||||||
Oil (MBbl) | 56,977 | 45,644 | 24,184 | |||||||||
Natural Gas (Bcf) (3) | 292.6 | 236.9 | 267.1 | |||||||||
Total (MBOE) (4) | 105,752 | 85,127 | 68,693 | |||||||||
Estimated proved developed reserves: | ||||||||||||
Oil (MBbl) | 22,604 | 17,129 | 14,053 | |||||||||
Natural Gas (Bcf) (3) | 126.8 | 101.4 | 102.8 | |||||||||
Total (MBOE) (4) | 43,731 | 34,037 | 31,185 | |||||||||
Percent developed | 41.4 | % | 40.0 | % | 45.4 | % | ||||||
Estimated proved undeveloped reserves: | ||||||||||||
Oil (MBbl) | 34,373 | 28,515 | 10,131 | |||||||||
Natural Gas (Bcf) (3) | 165.9 | 135.5 | 164.3 | |||||||||
Total (MBOE) (4) | 62,021 | 51,090 | 37,508 | |||||||||
Standardized Measure (5) (in millions) | $ | 575.0 | $ | 529.2 | $ | 913.3 | ||||||
PV-10 (6) (in millions) | $ | 581.5 | $ | 541.6 | $ | 1,043.4 | ||||||
(1) | Numbers in table may not total due to rounding. |
(2) | Our estimated proved reserves, Standardized Measure and PV-10 were determined using index prices for oil and natural gas, without giving effect to derivative transactions, and were held constant throughout the life of the properties. The unweighted arithmetic averages of the first-day-of-the-month prices for the 12 months ended December 31, 2016 were $39.25 per Bbl for oil and $2.48 per MMBtu for natural gas, for the 12 months ended December 31, 2015 were $46.79 per Bbl for oil and $2.59 per MMBtu for natural gas, and for the 12 months ended December 31, 2014 were $91.48 per Bbl for oil and $4.35 per MMBtu for natural gas. These prices were adjusted by lease for quality, energy content, regional price differentials, transportation fees, marketing deductions and other factors affecting the price received at the wellhead. We report our proved reserves in two streams, oil and natural gas, and the economic value of the natural gas liquids associated with the natural gas is included in the estimated wellhead natural gas price on those properties where the natural gas liquids are extracted and sold. |
(3) | Primarily as a result of substantially lower natural gas prices in 2015, we removed approximately 64.3 Bcf (10.7 million BOE) of previously classified proved undeveloped natural gas reserves from our total proved reserves in 2015, most of which were attributable to non-operated properties in the Haynesville shale. |
(4) | Estimated using a conversion ratio of one Bbl of oil per six Mcf of natural gas. Primarily as a result of the lower weighted average oil and natural gas prices used to estimate proved oil and natural gas reserves in 2016, we removed approximately 11.6 million BOE of previously classified proved undeveloped reserves from our total proved reserves in 2016. |
(5) | Standardized Measure represents the present value of estimated future net cash flows from proved reserves, less estimated future development, production, plugging and abandonment costs and income tax expenses, discounted at 10% per annum to reflect the timing of future cash flows. Standardized Measure is not an estimate of the fair market value of our properties. |
(6) | PV-10 is a non-GAAP financial measure and generally differs from Standardized Measure, the most directly comparable GAAP financial measure, because it does not include the effects of income taxes on future net revenues. PV-10 is not an estimate of the fair market value of our properties. We and others in the industry use PV-10 as a measure to compare the relative size and value of proved reserves held by companies and of the potential return on investment related to the companies’ properties without regard to the specific tax characteristics of such entities. Our PV-10 at December 31, 2016, 2015 and 2014 may be reconciled to our Standardized Measure of discounted future net cash flows at such dates by reducing our PV-10 by the discounted future income taxes associated with such reserves. The discounted future income taxes at December 31, 2016, 2015 and 2014 were, in millions, $6.5, $12.4 and $130.1, respectively. |
Our estimated total proved oil and natural gas reserves increased 24% from 85.1 million BOE at December 31, 2015 to 105.8 million BOE at December 31, 2016. We added 42.0 million BOE in proved oil and natural gas reserves through extensions and discoveries throughout 2016, approximately 4.1 times our 2016 annual production of 10.2 million BOE. Our proved oil reserves grew 25% from approximately 45.6 million Bbl at December 31, 2015 to approximately 57.0 million Bbl at December 31, 2016. Our proved natural gas reserves increased 24% from 236.9 Bcf at December 31, 2015 to 292.6 Bcf at December 31, 2016. This increase in proved oil and natural gas reserves was primarily a result of our delineation and development operations in the Delaware Basin during 2016. We incurred approximately 11.2 million BOE in net downward revisions to our proved reserves during 2016 as a result of the reclassification of certain proved undeveloped reserves to contingent resources, primarily due to the lower oil and natural gas prices used to estimate proved reserves at December 31, 2016, as compared to December 31, 2015. These contingent resources may be reclassified to proved undeveloped reserves in future periods should the oil and natural gas prices used to estimate proved oil and natural gas reserves improve from the prices at December 31, 2016. Our proved reserves to production ratio at December 31, 2016 was 10.4, an increase of 11% from 9.4 at December 31, 2015.
17
The Standardized Measure of our total proved oil and natural gas reserves increased 9% from $529.2 million at December 31, 2015 to $575.0 million at December 31, 2016. The PV-10 of our total proved oil and natural gas reserves increased 7% from $541.6 million at December 31, 2015 to $581.5 million at December 31, 2016. The increase in our Standardized Measure and PV-10 are primarily a result of our delineation and development operations in the Delaware Basin during 2016, which was partially impacted by the lower weighted average oil and natural gas prices used to estimate proved reserves at December 31, 2016, as compared to December 31, 2015. The unweighted arithmetic averages of first-day-of-the-month oil and natural gas prices used to estimate proved reserves at December 31, 2016 were $39.25 per Bbl and $2.48 per MMBtu, a decrease of 17% and 4%, respectively, as compared to average oil and natural gas prices of $46.79 per Bbl and $2.59 per MMBtu used to estimate proved reserves at December 31, 2015. Our total proved reserves were made up of approximately 54% oil and 46% natural gas at December 31, 2016 and December 31, 2015.
Our proved developed oil and natural gas reserves increased 28% from 34.0 million BOE at December 31, 2015 to 43.7 million BOE at December 31, 2016 due primarily to our delineation and development operations in the Delaware Basin. Our proved developed oil reserves increased 32% from 17.1 million Bbl at December 31, 2015 to 22.6 million Bbl at December 31, 2016. Our proved developed natural gas reserves increased 25% from 101.4 Bcf at December 31, 2015 to 126.8 Bcf at December 31, 2016.
The following table summarizes changes in our estimated proved developed reserves at December 31, 2016.
__________________
Proved Developed Reserves | |||
(MBOE) (1) | |||
As of December 31, 2015 | 34,037 | ||
Extensions and discoveries | 12,583 | ||
Revisions of prior estimates | 408 | ||
Production | (10,180 | ) | |
Conversion of proved undeveloped to proved developed | 6,883 | ||
As of December 31, 2016 | 43,731 | ||
(1) | Estimated using a conversion ratio of one Bbl of oil per six Mcf of natural gas. |
Our proved undeveloped oil and natural gas reserves increased from 51.1 million BOE at December 31, 2015 to 62.0 million BOE at December 31, 2016. Our proved undeveloped oil and natural gas reserves increased from 28.5 million Bbl and 135.5 Bcf, respectively, at December 31, 2015 to 34.4 million Bbl and 165.9 Bcf, respectively, at December 31, 2016, primarily as a result of our delineation and development operations in the Delaware Basin.
At December 31, 2016, we had no proved undeveloped reserves in our estimates that remained undeveloped for five years or more following their initial booking, and we currently have plans to use anticipated capital resources to develop the proved undeveloped reserves remaining as of December 31, 2016 within five years of booking these reserves.
The following table summarizes changes in our estimated proved undeveloped reserves at December 31, 2016.
__________________
Proved Undeveloped Reserves | |||
(MBOE) (1) | |||
As of December 31, 2015 | 51,090 | ||
Extensions and discoveries | 29,408 | ||
Revisions of prior estimates | (11,594 | ) | |
Conversion of proved undeveloped to proved developed | (6,883 | ) | |
As of December 31, 2016 | 62,021 | ||
(1) | Estimated using a conversion ratio of one Bbl of oil per six Mcf of natural gas. |
18
The following table sets forth, since 2013, proved undeveloped reserves converted to proved developed reserves during each year and the investments associated with these conversions (dollars in thousands).
__________________
Investment in Conversion of Proved Undeveloped Reserves to Proved Developed Reserves | |||||||||||||
Proved Undeveloped Reserves Converted to Proved Developed Reserves | |||||||||||||
Oil | Natural Gas | Total | |||||||||||
(MBbl) | (Bcf) | (MBOE) (1) | |||||||||||
2013 | 2,944 | 8.3 | 4,334 | $ | 115,699 | ||||||||
2014 | 3,780 | 44.7 | 11,223 | 201,950 | |||||||||
2015 | 2,854 | 23.4 | 6,747 | 104,989 | |||||||||
2016 | 4,705 | 13.1 | 6,883 | 94,579 | |||||||||
Total | 14,283 | 89.5 | 29,187 | $ | 517,217 | ||||||||
(1) | Estimated using a conversion ratio of one Bbl of oil per six Mcf of natural gas. |
The following table sets forth additional summary information by operating area with respect to our estimated net proved reserves at December 31, 2016.
__________________
Net Proved Reserves (1) | |||||||||||||||||
Oil | Natural Gas | Oil Equivalent | Standardized Measure (2) | PV-10 (3) | |||||||||||||
(MBbl) | (Bcf) | (MBOE) (4) | (in millions) | (in millions) | |||||||||||||
Southeast New Mexico/West Texas: | |||||||||||||||||
Delaware Basin | 46,873 | 195.1 | 79,388 | $ | 446.0 | $ | 451.0 | ||||||||||
South Texas: | |||||||||||||||||
Eagle Ford (5) | 10,066 | 19.3 | 13,298 | 85.6 | 86.6 | ||||||||||||
Northwest Louisiana/East Texas: | |||||||||||||||||
Haynesville | — | 74.5 | 12,414 | 41.5 | 42.0 | ||||||||||||
Cotton Valley (6) | 38 | 3.7 | 652 | 1.9 | 1.9 | ||||||||||||
Area Total | 38 | 78.2 | 13,066 | 43.4 | 43.9 | ||||||||||||
Total | 56,977 | 292.6 | 105,752 | $ | 575.0 | $ | 581.5 | ||||||||||
(1) | Numbers in table may not total due to rounding. |
(2) | Standardized Measure represents the present value of estimated future net cash flows from proved reserves, less estimated future development, production, plugging and abandonment costs and income tax expenses, discounted at 10% per annum to reflect the timing of future cash flows. Standardized Measure is not an estimate of the fair market value of our properties. |
(3) | PV-10 is a non-GAAP financial measure and generally differs from Standardized Measure, the most directly comparable GAAP financial measure, because it does not include the effects of income taxes on future net revenues. PV-10 is not an estimate of the fair market value of our properties. We and others in the industry use PV-10 as a measure to compare the relative size and value of proved reserves held by companies and of the potential return on investment related to the companies’ properties without regard to the specific tax characteristics of such entities. Our PV-10 at December 31, 2016 may be reconciled to our Standardized Measure of discounted future net cash flows at such date by reducing our PV-10 by the discounted future income taxes associated with such reserves. The discounted future income taxes at December 31, 2016 were approximately $6.5 million. |
(4) | Estimated using a conversion ratio of one Bbl of oil per six Mcf of natural gas. |
(5) | Includes one well producing small volumes of oil from the Austin Chalk formation and two wells producing small quantities of natural gas from the San Miguel formation in Zavala County, Texas. |
(6) | Includes the Cotton Valley formation and shallower zones and also includes one well producing from the Frio formation in Orange County, Texas. |
Technology Used to Establish Reserves
Under current SEC rules, proved reserves are those quantities of oil and natural gas, which, by analysis of geoscience and engineering data, can be estimated with reasonable certainty to be economically producible from a given date forward, from known reservoirs and under existing economic conditions, operating methods and government regulations. The term “reasonable certainty” implies a high degree of confidence that the quantities of oil and/or natural gas actually recovered will equal or exceed the estimate. Reasonable certainty can be established using techniques that have been proven effective by actual production from projects in the same reservoir or an analogous reservoir or by other evidence using reliable technology that establishes reasonable certainty. Reliable technology is a grouping of one or more technologies (including computational
19
methods) that have been field tested and have been demonstrated to provide reasonably certain results with consistency and repeatability in the formation being evaluated or in an analogous formation.
In order to establish reasonable certainty with respect to our estimated proved reserves, we used technologies that have been demonstrated to yield results with consistency and repeatability. The technologies and technical data used in the estimation of our proved reserves include, but are not limited to, electric logs, radioactivity logs, core analyses, geologic maps and available pressure and production data, seismic data and well test data. Reserves for proved developed producing wells were estimated using production performance and material balance methods. Certain new producing properties with little production history were forecast using a combination of production performance and analogy to offset production. Non-producing reserves estimates for both developed and undeveloped properties were forecast using either volumetric and/or analogy methods.
Internal Control Over Reserves Estimation Process
We maintain an internal staff of petroleum engineers and geoscience professionals to ensure the integrity, accuracy and timeliness of the data used in our reserves estimation process. Our Senior Vice President of Reservoir Engineering and Chief Technology Officer is primarily responsible for overseeing the preparation of our reserves estimates. He received his Bachelor and Master of Science degrees in Petroleum Engineering from Texas A&M University, is a Licensed Professional Engineer in the State of Texas and has over 39 years of industry experience. Following the preparation of our reserves estimates, these estimates are audited for their reasonableness by Netherland, Sewell & Associates, Inc., independent reservoir engineers. The Operations and Engineering Committee of our Board of Directors reviews the reserves report and our reserves estimation process, and the results of the reserves report and the independent audit of our reserves are reviewed by other members of our Board of Directors, including members of our Audit Committee.
Acreage Summary
The following table sets forth the approximate acreage in which we held a leasehold, mineral or other interest at December 31, 2016.
__________________
Developed Acres | Undeveloped Acres | Total Acres | ||||||||||||||||
Gross | Net | Gross | Net | Gross | Net | |||||||||||||
Southeast New Mexico/West Texas: | ||||||||||||||||||
Delaware Basin | 79,087 | 33,699 | 84,616 | 60,613 | 163,703 | 94,312 | ||||||||||||
South Texas: | ||||||||||||||||||
Eagle Ford | 26,402 | 23,682 | 4,267 | 4,095 | 30,669 | 27,777 | ||||||||||||
Northwest Louisiana/East Texas: | ||||||||||||||||||
Haynesville | 16,739 | 9,088 | 3,366 | 3,364 | 20,105 | 12,452 | ||||||||||||
Cotton Valley | 18,108 | 16,078 | 3,506 | 2,993 | 21,614 | 19,071 | ||||||||||||
Area Total (1) | 22,030 | 19,761 | 4,032 | 3,517 | 26,062 | 23,278 | ||||||||||||
Total (2) | 127,519 | 77,142 | 92,915 | 68,225 | 220,434 | 145,367 | ||||||||||||
(1) | Some of the same leases cover the gross and net acreage shown for both the Haynesville formation and the shallower Cotton Valley formation. Therefore, the sum of the gross and net acreage for both formations is not equal to the total gross and net acreage for Northwest Louisiana and East Texas. |
(2) | During the year ended December 31, 2016, we released all of our acreage in Wyoming, Utah and Idaho. |
Undeveloped Acreage Expiration
The following table sets forth the approximate number of gross and net undeveloped acres at December 31, 2016 that will expire over the next three years by operating area unless production is established within the spacing units covering the acreage prior to the expiration dates, the existing leases are renewed prior to expiration or continued operations maintain the leases beyond the expiration of each respective primary term. Undeveloped acreage expiring in 2020 and beyond represents an immaterial amount of our overall undeveloped acreage.
20
Acres | Acres | Acres | ||||||||||||||||
Expiring 2017 | Expiring 2018 | Expiring 2019 | ||||||||||||||||
Gross | Net | Gross | Net | Gross | Net | |||||||||||||
Southeast New Mexico/West Texas: | ||||||||||||||||||
Delaware Basin (1) | 17,604 | 7,987 | 39,704 | 25,294 | 15,404 | 9,086 | ||||||||||||
South Texas: | ||||||||||||||||||
Eagle Ford | 1,435 | 1,375 | 896 | 753 | 204 | 156 | ||||||||||||
Northwest Louisiana/East Texas: | ||||||||||||||||||
Haynesville | — | — | — | — | 326 | 324 | ||||||||||||
Cotton Valley | — | — | — | — | — | — | ||||||||||||
Area Total (2) | — | — | — | — | 326 | 324 | ||||||||||||
Total | 19,039 | 9,362 | 40,600 | 26,047 | 15,934 | 9,566 | ||||||||||||
(1) | Approximately 54% of the acreage expiring in the next three years is associated with our Twin Lakes asset area in northern Lea County, New Mexico. Most of these leases can be extended for an additional two years, should we choose to do so, by paying an additional lease bonus. We also expect to hold or extend portions of the remaining expiring acreage outside of our Twin Lakes asset area in 2017 through our 2017 drilling activities or by paying an additional lease bonus, where applicable. |
(2) | Some of the same leases cover the gross and net acreage shown for both the Haynesville formation and the shallower Cotton Valley formation. Therefore, the sum of the gross and net acreage for both formations is not equal to the total gross and net acreage for Northwest Louisiana and East Texas. |
Many of the leases comprising the acreage set forth in the table above will expire at the end of their respective primary terms unless operations are conducted to maintain the respective leases in effect beyond the expiration of the primary term or production from the acreage has been established prior to such date, in which event the lease will remain in effect until the cessation of production in commercial quantities in most cases. We also have options to extend some of our leases through payment of additional lease bonus payments prior to the expiration of the primary term of the leases. In addition, we may attempt to secure a new lease upon the expiration of certain of our acreage; however, there may be third-party leases that become effective immediately if our leases expire at the end of their respective terms and production has not been established prior to such date or operations are not conducted to maintain the leases in effect beyond the primary term. As of December 31, 2016, our leases are primarily fee and state leases with primary terms of three to five years and federal leases with primary terms of 10 years. We believe that our lease terms are similar to our competitors’ lease terms as they relate to both primary term and royalty interests.
Drilling Results
The following table summarizes our drilling activity for the years ended December 31, 2016, 2015 and 2014.
Year Ended December 31, | ||||||||||||||||||
2016 | 2015 | 2014 | ||||||||||||||||
Gross | Net | Gross | Net | Gross | Net | |||||||||||||
Development Wells | ||||||||||||||||||
Productive | 44 | 23.5 | 53 | 26.7 | 89 | 39.9 | ||||||||||||
Dry | — | — | — | — | — | — | ||||||||||||
Exploration Wells | ||||||||||||||||||
Productive | 28 | 15.6 | 28 | 17.5 | 12 | 10.6 | ||||||||||||
Dry | — | — | — | — | — | — | ||||||||||||
Total Wells | ||||||||||||||||||
Productive | 72 | 39.1 | 81 | 44.2 | 101 | 50.5 | ||||||||||||
Dry | — | — | — | — | — | — | ||||||||||||
Marketing and Customers
Our crude oil is generally sold under short-term, extendable and cancellable agreements with unaffiliated purchasers based on published price bulletins reflecting an established field posting price. As a consequence, the prices we receive for crude oil and a portion of our heavier liquids move up and down in direct correlation with the oil market as it reacts to supply and demand factors. The prices of the remaining lighter liquids move up and down independently of any relationship between the crude oil and natural gas markets. Transportation costs related to moving crude oil and liquids are also deducted from the price received for crude oil and liquids.
21
Our natural gas is sold under both long-term and short-term natural gas purchase agreements. Natural gas produced by us is sold at various delivery points at or near producing wells to both unaffiliated independent marketing companies and unaffiliated midstream companies. The prices we receive are based on various pipeline indices less any associated fees. When there is an opportunity to do so, we may have our natural gas processed at our or third parties’ processing facilities to extract liquid hydrocarbons from the natural gas. We are then paid for the extracted liquids based on either a negotiated percentage of the proceeds that are generated from the sale of the liquids, or other negotiated pricing arrangements using then-current market pricing less fixed rate processing, transportation and fractionation fees.
The prices we receive for our oil and natural gas production fluctuate widely. Factors that, directly or indirectly, cause price fluctuations include the level of demand for oil and natural gas, the actions of OPEC, weather conditions, hurricanes in the Gulf Coast region, oil and natural gas storage levels, domestic and foreign governmental regulations, price and availability of alternative fuels, political conditions in oil and natural gas producing regions, the domestic and foreign supply of oil and natural gas, the price of foreign imports and overall economic conditions. Decreases in these commodity prices adversely affect the carrying value of our proved reserves and our revenues, profitability and cash flows. Short-term disruptions of our oil and natural gas production occur from time to time due to downstream pipeline system failure, capacity issues and scheduled maintenance, as well as maintenance and repairs involving our own well operations. These situations, if they occur, curtail our production capabilities and ability to maintain a steady source of revenue. See “Risk Factors — Our Success Is Dependent on the Prices of Oil and Natural Gas. Low Oil or Natural Gas Prices and the Substantial Volatility in These Prices May Adversely Affect Our Financial Condition and Our Ability to Meet Our Capital Expenditure Requirements and Financial Obligations.”
For the years ended December 31, 2016, 2015 and 2014, we had three significant purchasers that accounted for approximately 48%, 59% and 68%, respectively, of our total oil, natural gas and natural gas liquids revenues. Due to the nature of the markets for oil, natural gas and natural gas liquids, we do not believe that the loss of any one of these purchasers would have a material adverse impact on our financial condition, results of operations or cash flows for any significant period of time.
Title to Properties
We endeavor to assure that title to our properties is in accordance with standards generally accepted in the oil and natural gas industry. Some of our acreage will be obtained through farmout agreements, term assignments and other contractual arrangements with third parties, the terms of which often will require the drilling of wells or the undertaking of other exploratory or development activities in order to retain our interests in the acreage. Our title to these contractual interests will be contingent upon our satisfactory fulfillment of these obligations. Our properties are also subject to customary royalty interests, liens incident to financing arrangements, operating agreements, taxes and other burdens that we believe will not materially interfere with the use and operation of or affect the value of these properties. We intend to maintain our leasehold interests by conducting operations, making lease rental payments or producing oil and natural gas from wells in paying quantities, where required, prior to expiration of various time periods to avoid lease termination. See “Risk Factors — We May Incur Losses or Costs as a Result of Title Deficiencies in the Properties in Which We Invest.”
We believe that we have satisfactory title to all of our material assets. Although title to these properties is subject to customary encumbrances, such as customary interests generally retained in connection with the acquisition of real property, customary royalty interests and contract terms and restrictions, liens for current taxes and other burdens, easements, restrictions and minor encumbrances customary in the oil and natural gas industry, we believe that none of these liens, restrictions, easements, burdens or encumbrances will materially interfere with the use and operation of these properties in the conduct of our business. In addition, we believe that we have obtained sufficient right-of-way grants and permits from public authorities and private parties for us to operate our business.
Seasonality
Generally, but not always, the demand and price levels for natural gas increase during winter months and decrease during summer months. To lessen seasonal demand fluctuations, pipelines, utilities, local distribution companies and industrial users utilize natural gas storage facilities and forward purchase some of their anticipated winter requirements during the summer. However, increased summertime demand for electricity can place increased demand on storage volumes. Demand for oil and heating oil is also generally higher in the winter and the summer driving season, although oil prices are impacted more significantly by global supply and demand. Seasonal anomalies, such as mild winters, sometimes lessen these fluctuations. Certain of our drilling, completion and other operations are also subject to seasonal limitations where equipment may not be available during periods of peak demand or where weather conditions and events result in delayed operations. See “Risk Factors — Because Our Reserves and Production Are Concentrated in a Few Core Areas, Problems in Production and Markets Relating to a Particular Area Could Have a Material Impact on Our Business.”
22
Competition
The oil and natural gas industry is highly competitive. We compete with major and independent oil and natural gas companies for exploration opportunities, acreage and property acquisitions, as well as drilling rig contracts and other equipment and labor required to drill, operate and develop our properties. We also compete with public and private midstream companies for natural gas gathering, processing and compression opportunities, as well as salt water disposal activities in the areas in which we operate.
Many of our competitors have substantially greater financial resources, staffs, facilities and other resources. In addition, larger competitors may be able to absorb the burden of any changes in federal, state and local laws and regulations more easily than we can, which would adversely affect our competitive position. These competitors may be willing and able to pay more for drilling rigs, leasehold and mineral acreage, productive oil and natural gas properties or midstream facilities and may be able to identify, evaluate, bid for and purchase a greater number of properties and prospects than we can. Our competitors may also be able to afford to purchase and operate their own drilling rigs and hydraulic fracturing equipment.
Our ability to drill and explore for oil and natural gas, to acquire properties and to provide competitive midstream services will depend upon our ability to conduct operations, to evaluate and select suitable properties and to consummate transactions in this highly competitive environment. We have been conducting field operations since 2004 while many of our competitors may have a longer history of operations. Additionally, most of our competitors have demonstrated the ability to operate through industry cycles.
The oil and natural gas industry also competes with other energy-related industries in supplying the energy and fuel requirements of industrial, commercial and individual consumers. See “Risk Factors — Competition in the Oil and Natural Gas Industry Is Intense, Making It More Difficult for Us to Acquire Properties, Market Oil and Natural Gas and Secure Trained Personnel.”
Regulation
Oil and Natural Gas Regulation
Our oil and natural gas exploration, development, production, midstream and related operations are subject to extensive federal, state and local laws, rules and regulations. Failure to comply with these laws, rules and regulations can result in substantial monetary penalties or delay or suspension of operations. The regulatory burden on the oil and natural gas industry increases our cost of doing business and affects our profitability. Because these laws, rules and regulations are frequently amended or reinterpreted and new laws, rules and regulations are promulgated, we are unable to predict the future cost or impact of complying with the laws, rules and regulations to which we are, or will become, subject. Our competitors in the oil and natural gas industry are generally subject to the same regulatory requirements and restrictions that affect our operations. We cannot predict the impact of future government regulation on our properties or operations.
Texas, New Mexico, Louisiana and many other states require permits for drilling operations, drilling bonds and reports concerning operations and impose other requirements relating to the exploration, development and production of oil and natural gas. Many states also have statutes or regulations addressing conservation of oil and natural gas and other matters, including provisions for the unitization or pooling of oil and natural gas properties, the establishment of maximum rates of production from wells, the regulation of well spacing, the surface use and restoration of properties upon which wells are drilled, the prohibition or restriction on venting or flaring natural gas, the sourcing and disposal of water used in the drilling and completion process and the plugging and abandonment of wells. Many states restrict production to the market demand for oil and natural gas. Some states have enacted statutes prescribing ceiling prices for natural gas sold within their boundaries. Additionally, some regulatory agencies have, from time to time, imposed price controls and limitations on production by restricting the rate of flow of oil and natural gas wells below natural production capacity in order to conserve supplies of oil and natural gas. Moreover, each state generally imposes a production or severance tax with respect to the production and sale of oil, natural gas and natural gas liquids within its jurisdiction.
Some of our oil and natural gas leases are issued by agencies of the federal government, as well as agencies of the states in which we operate. These leases contain various restrictions on access and development and other requirements that may impede our ability to conduct operations on the acreage represented by these leases.
Our sales of natural gas, as well as the revenues we receive from our sales, are affected by the availability, terms and costs of transportation. The rates, terms and conditions applicable to the interstate transportation of natural gas by pipelines are regulated by the Federal Energy Regulatory Commission, or FERC, under the Natural Gas Act of 1938, or the NGA, as well as under Section 311 of the Natural Gas Policy Act of 1978, or the NGPA. Since 1985, FERC has implemented regulations intended to increase competition within the natural gas industry by making natural gas transportation more accessible to natural gas buyers and sellers on an open-access, non-discriminatory basis. The natural gas industry has historically, however, been heavily regulated, and we can give no assurance that the current less stringent regulatory approach of FERC will continue.
23
In 2005, Congress enacted the Domenici-Barton Energy Policy Act of 2005, or the Energy Policy Act. The Energy Policy Act, among other things, amended the NGA to prohibit market manipulation by any entity, to direct FERC to facilitate transparency in the market for the sale or transportation of natural gas in interstate commerce and to significantly increase the penalties for violations of the NGA, the NGPA or FERC rules, regulations or orders thereunder. FERC has promulgated regulations to implement the Energy Policy Act. Should we violate the anti-market manipulation laws and related regulations, in addition to FERC-imposed penalties, we may also be subject to third-party damage claims.
Intrastate natural gas transportation is subject to regulation by state regulatory agencies. The basis for intrastate regulation of natural gas transportation and the degree of regulatory oversight and scrutiny given to intrastate natural gas pipeline rates and services varies from state to state. Because these regulations will apply to all intrastate natural gas shippers within the same state on a comparable basis, we believe that the regulation in any states in which we operate will not affect our operations in any way that is materially different from our competitors that are similarly situated.
Natural gas gathering facilities are exempt from the jurisdiction of FERC under section 1(b) of the NGA, and intrastate crude oil gathering facilities are also exempt from FERC’s jurisdiction under the Interstate Commerce Act. We believe that the natural gas pipelines in our gathering systems meet the traditional tests FERC has used to establish a pipeline’s status as a gatherer not subject to FERC jurisdiction, and that the crude oil pipelines in our gathering systems meet the traditional tests FERC has used to establish a pipeline’s status as an intrastate facility not subject to FERC jurisdiction. State regulation of gathering facilities generally includes various safety, environmental and, in some circumstances, nondiscriminatory take requirements or complaint-based rate regulation.
The price we receive from the sale of oil and natural gas liquids will be affected by the availability, terms and cost of transportation of the products to market. Under rules adopted by FERC, interstate oil pipelines can change rates based on an inflation index, though other rate mechanisms may be used in specific circumstances. Intrastate oil pipeline transportation rates are subject to regulation by state regulatory commissions, which varies from state to state. We are not able to predict with certainty the effects, if any, of these regulations on our operations.
In 2007, the Energy Independence & Security Act of 2007, or the EISA, went into effect. The EISA, among other things, prohibits market manipulation by any person in connection with the purchase or sale of crude oil, gasoline or petroleum distillates at wholesale in contravention of such rules and regulations that the Federal Trade Commission may prescribe, directs the Federal Trade Commission to enforce the regulations and establishes penalties for violations thereunder.
The Pipeline and Hazardous Materials Safety Administration, or PHMSA, imposes pipeline safety requirements on regulated pipelines and gathering lines pursuant to its authority under the Natural Gas Pipeline Safety Act and the Hazardous Liquid Pipeline Safety Act, as amended. In recent years, pursuant to these laws and, in addition, the Pipeline Safety, Regulatory Certainty, and Job Creation Act of 2011, PHMSA has expanded its regulation of gathering lines, subjecting previously unregulated pipelines to requirements regarding damage prevention, corrosion control, public education programs, maximum allowable operating pressure limits and other requirements. Certain of our natural gas gathering lines are federally “regulated gathering lines” subject to PHMSA requirements. On April 8, 2016, PHMSA published a notice of proposed rulemaking (NPRM) that would amend existing integrity management requirements, expand assessment and repair requirements in areas with medium population densities and extend regulatory requirements to onshore natural gas gathering lines that are currently exempt. On January 13, 2017, PHMSA issued, but has yet to publish, a similar proposed rule for hazardous liquids (i.e., oil) pipelines and gathering lines. In addition, states have adopted regulations, similar to existing PHMSA regulations, for intrastate gathering and transmission lines.
Additional expansion of pipeline safety requirements or our operations could subject us to more stringent or costly safety standards, which could result in increased operating costs or operational delays.
U.S. Federal and State Taxation
The federal, state and local governments in the areas in which we operate impose taxes on the oil and natural gas products we sell and, for many of our wells, sales and use taxes on significant portions of our drilling and operating costs. Many states have raised state taxes on energy sources or state taxes associated with the extraction of hydrocarbons, and additional increases may occur. In addition, from time to time there has been a significant amount of discussion by legislators and presidential administrations concerning a variety of energy tax proposals, including proposals that would eliminate allowing small U.S. oil and natural gas companies to deduct intangible drilling costs as incurred and percentage depletion. Changes to tax laws could adversely affect our business and our financial results. See “Risk Factors — We Are Subject to Federal, State and Local Taxes, and May Become Subject to New Taxes or Have Eliminated or Reduced Certain Federal Income Tax Deductions Currently Available with Respect to Oil and Natural Gas Exploration and Production Activities as a Result of Future Legislation, Which Could Adversely Affect Our Business, Financial Condition, Results of Operations and Cash Flows.”
24
Hydraulic Fracturing Policies and Procedures
We use hydraulic fracturing as a means to maximize the recovery of oil and natural gas in almost every well that we drill and complete. Our engineers responsible for these operations attend specialized hydraulic fracturing training programs taught by industry professionals. Although average drilling and completion costs for each area will vary, as will the cost of each well within a given area, on average approximately one-half to two-thirds of the total well costs for our horizontal wells are attributable to overall completion activities, which are primarily focused on hydraulic fracture treatment operations. These costs are treated in the same way as all other costs of drilling and completion of our wells and are included in and funded through our normal capital expenditure budget. A change to any federal and state laws and regulations governing hydraulic fracturing could impact these costs and adversely affect our business and financial results. See “Risk Factors — Federal and State Legislation and Regulatory Initiatives Relating to Hydraulic Fracturing Could Result in Increased Costs and Additional Operating Restrictions or Delays.”
The protection of groundwater quality is important to us. We believe that we follow all state and federal regulations and apply industry standard practices for groundwater protection in our operations. These measures are subject to close supervision by state and federal regulators (including the Bureau of Land Management, or the BLM, with respect to federal acreage).
Although rare, if and when the cement and steel casing used in well construction requires remediation, we deal with these problems by evaluating the issue and running diagnostic tools, including cement bond logs and temperature logs, and conducting pressure testing, followed by pumping remedial cement jobs and taking other appropriate remedial measures.
The vast majority of hydraulic fracturing treatments are made up of water and sand or other kinds of man-made propping agents. We use major hydraulic fracturing service companies who track and report chemical additives that are used in fracturing operations as required by the appropriate governmental agencies. These service companies fracture stimulate thousands of wells each year for the industry and invest millions of dollars to protect the environment through rigorous safety procedures, and also work to develop more environmentally friendly fracturing fluids. We also follow safety procedures and monitor all aspects of our fracturing operations in an attempt to ensure environmental protection. We do not pump any diesel in the fluid systems of any of our fracture stimulation procedures.
While current fracture stimulation procedures utilize a significant amount of water, we typically recover less than 10% of this fracture stimulation water before produced salt water becomes a significant portion of the fluids produced. All produced water, including fracture stimulation water, is disposed of in permitted and regulated disposal facilities in a way that is designed to avoid any impact to surface waters. Since mid-2015, we have also been recycling a portion of our produced salt water in certain of our Delaware Basin asset areas. Recycling produced salt water mitigates the need for salt water disposal and also provides cost savings to us.
Environmental Regulation
The exploration, development, production, gathering and processing of oil and natural gas, including the operation of salt water injection and disposal wells, are subject to various federal, state and local environmental laws and regulations. These laws and regulations can increase the costs of planning, designing, drilling, completing and operating oil and natural gas wells, midstream facilities and salt water injection and disposal wells. Our activities are subject to a variety of environmental laws and regulations, including but not limited to: the Oil Pollution Act of 1990, or the OPA 90, the Clean Water Act, or the CWA, the Comprehensive Environmental Response, Compensation and Liability Act, or CERCLA, the Resource Conservation and Recovery Act, or RCRA, the Clean Air Act, or the CAA, the Safe Drinking Water Act, or the SDWA, and the Occupational Safety and Health Act, or OSHA, as well as comparable state statutes and regulations. We are also subject to regulations governing the handling, transportation, storage and disposal of wastes generated by our activities and naturally occurring radioactive materials, or NORM, that may result from our oil and natural gas operations. Administrative, civil and criminal fines and penalties may be imposed for noncompliance with these environmental laws and regulations. Additionally, these laws and regulations require the acquisition of permits or other governmental authorizations before undertaking some activities, limit or prohibit other activities because of protected wetlands, areas or species and require investigation and cleanup of pollution. We expect to remain in compliance in all material respects with currently applicable environmental laws and regulations and do not expect that these laws and regulations will have a material adverse impact on us.
The OPA 90 and its regulations impose requirements on “responsible parties” related to the prevention of crude oil spills and liability for damages resulting from oil spills into or upon navigable waters, adjoining shorelines or in the exclusive economic zone of the United States. A “responsible party” under the OPA 90 may include the owner or operator of an onshore facility. The OPA 90 subjects responsible parties to strict, joint and several financial liability for removal costs and other damages, including natural resource damages, caused by an oil spill that is covered by the statute. Failure to comply with the OPA 90 may subject a responsible party to civil or criminal enforcement action.
The CWA and comparable state laws impose restrictions and strict controls regarding the discharge of produced waters, fill materials and other materials into navigable waters. These controls have become more stringent over the years, and it is
25
possible that additional restrictions will be imposed in the future. Permits are required to discharge pollutants into certain state and federal waters and to conduct construction activities in those waters and wetlands. The CWA and comparable state statutes provide for civil, criminal and administrative penalties for any unauthorized discharges of oil and other pollutants and impose liability for the costs of removal or remediation of contamination resulting from such discharges.
CERCLA, also known as the “Superfund” law, imposes liability, without regard to fault or the legality of the original conduct, on various classes of persons that are considered to have contributed to the release of a “hazardous substance” into the environment. These persons include the owner or operator of the site where the release occurred and companies that disposed of, or arranged for the disposal of, the hazardous substances found at the site. Persons who are responsible for releases of hazardous substances under CERCLA may be subject to joint and several liability for the costs of cleaning up the hazardous substances and for damages to natural resources. In addition, it is not uncommon for neighboring landowners and other third parties to file claims for personal injury and property damage allegedly caused by hazardous substances released into the environment. Although CERCLA generally exempts petroleum from the definition of hazardous substances, our operations may, and in all likelihood will, involve the use or handling of materials that may be classified as hazardous substances under CERCLA.
RCRA and comparable state and local statutes govern the management, including treatment, storage and disposal, of both hazardous and nonhazardous solid wastes. We generate hazardous and nonhazardous solid waste in connection with our routine operations. At present, RCRA includes a statutory exemption that allows many wastes associated with crude oil and natural gas exploration and production to be classified as nonhazardous waste. A similar exemption is contained in many of the state counterparts to RCRA. Not all of the wastes we generate fall within these exemptions. At various times in the past, proposals have been made to amend RCRA to eliminate the exemption applicable to crude oil and natural gas exploration and production wastes. Repeal or modifications of this exemption by administrative, legislative or judicial process, or through changes in applicable state statutes, would increase the volume of hazardous waste we are required to manage and dispose of and would cause us, as well as our competitors, to incur increased operating expenses. Hazardous wastes are subject to more stringent and costly disposal requirements than nonhazardous wastes.
The CAA, as amended, and comparable state laws restrict the emission of air pollutants from many sources, including oil and natural gas production. These laws and any implementing regulations impose stringent air permit requirements and require us to obtain pre-approval for the construction or modification of certain projects or facilities expected to produce air emissions, or to use specific equipment or technologies to control emissions. See “Risk Factors — New Regulations on All Emissions from Our Operations Could Cause Us to Incur Significant Costs.” Federal and state regulatory agencies can impose administrative, civil and criminal penalties for non-compliance with air permits or other requirements of the federal CAA and associated state laws and regulations.
Changes in environmental laws and regulations occur frequently, and any changes that result in more stringent and costly waste handling, storage, transport, disposal, cleanup or operating requirements could materially adversely affect our operations and financial condition, as well as those of the oil and natural gas industry in general. For instance, recent scientific studies have suggested that emissions of certain gases, commonly referred to as “greenhouse gases,” and including carbon dioxide and methane, may be contributing to the warming of the Earth’s atmosphere. Based on these findings, the Environmental Protection Agency, or the EPA, has begun adopting and implementing a comprehensive suite of regulations to restrict emissions of greenhouse gases under existing provisions of the CAA. Legislative and regulatory initiatives related to climate change and greenhouse gas emissions could, and in all likelihood would, require us to incur increased operating costs adversely affecting our profits and could adversely affect demand for the oil and natural gas we produce, depressing the prices we receive for oil and natural gas. See “Risk Factors — Legislation or Regulations Restricting Emissions of Greenhouse Gases Could Result in Increased Operating Costs and Reduced Demand for the Oil, Natural Gas and Natural Gas Liquids We Produce while the Physical Effects of Climate Change Could Disrupt Our Production and Cause Us to Incur Significant Costs in Preparing for or Responding to Those Effects” and “Risk Factors — New Regulations on All Emissions from Our Operations Could Cause Us to Incur Significant Costs.”
Underground injection is the subsurface placement of fluid through a well, such as the reinjection of brine produced and separated from oil and natural gas production. In our industry, underground injection not only allows us to economically dispose of produced water, but if injected into an oil bearing zone, it can increase the oil production from such zone. The SDWA establishes a regulatory framework for underground injection, the primary objective of which is to ensure the mechanical integrity of the injection apparatus and to prevent migration of fluids from the injection zone into underground sources of drinking water. The disposal of hazardous waste by underground injection is subject to stricter requirements than the disposal of produced water. As of December 31, 2016, we owned and operated twelve underground injection wells and we expect to own and operate similar wells in the future. Failure to obtain, or abide by, the requirements for the issuance of necessary permits could subject us to civil and/or criminal enforcement actions and penalties. In addition, in some instances, the operation of underground injection wells has been alleged to cause earthquakes (induced seismicity) as a result of flawed well design or operation. This has resulted in stricter regulatory requirements in some jurisdictions relating to the location and
26
operation of underground injection wells. We do not expect these developments to have a material adverse effect on our business, financial condition, results of operations and cash flows.
Our activities involve the use of hydraulic fracturing. For more information on our hydraulic fracturing operations, see “— Hydraulic Fracturing Policies and Procedures.” Recently, there has been increasing regulatory scrutiny of hydraulic fracturing, which is generally exempted from federal regulation as underground injection (unless diesel is a component of the fracturing fluid) under the SDWA. The process of hydraulic fracturing is typically regulated by state oil and natural gas commissions. Some states and localities have placed additional regulatory burdens upon hydraulic fracturing activities and, in some areas, severely restricted or prohibited those activities. If the exemption for hydraulic fracturing is removed from the SDWA, or if other legislation is enacted at the federal, state or local level imposing any restrictions on the use of hydraulic fracturing, this could have a significant impact on our financial condition, results of operations and cash flows. Additional burdens upon hydraulic fracturing, such as reporting or permitting requirements, will result in additional expense and delay in our operations. Restrictions on hydraulic fracturing could also reduce the amount of oil and natural gas that we are ultimately able to produce from our reserves. See “Risk Factors — Federal and State Legislation and Regulatory Initiatives Relating to Hydraulic Fracturing Could Result in Increased Costs and Additional Operating Restrictions or Delays.”
Oil and natural gas exploration and production, operations and other activities have been conducted at some of our properties by previous owners and operators. Materials from these operations remain on some of the properties, and, in some instances, require remediation. In addition, we occasionally must agree to indemnify sellers of producing properties from whom we acquire the properties against some of the liability for environmental claims associated with the properties. While we do not believe that costs we incur for compliance with environmental regulations and remediating previously or currently owned or operated properties will be material, we cannot provide any assurances that these costs will not result in material expenditures that adversely affect our profitability.
Additionally, in the course of our routine oil and natural gas operations, surface spills and leaks, including casing leaks, of oil or other materials may occur, and we may incur costs for waste handling and environmental compliance. It is also possible that our oil and natural gas operations may require us to manage NORM. NORM is present in varying concentrations in sub-surface formations, including hydrocarbon reservoirs, and may become concentrated in scale, film and sludge in equipment that comes in contact with crude oil and natural gas production and processing streams. Some states, including Texas, have enacted regulations governing the handling, treatment, storage and disposal of NORM. Moreover, we will be able to control directly the operations of only those wells we operate. Despite our lack of control over wells owned partly by us but operated by others, the failure of the operator to comply with the applicable environmental regulations may, in certain circumstances, be attributable to us.
We are subject to the requirements of OSHA and comparable state statutes. The OSHA Hazard Communication Standard, the “community right-to-know” regulations under Title III of the federal Superfund Amendments and Reauthorization Act and similar state statutes require us to organize information about hazardous materials used, released or produced in our operations. Certain of this information must be provided to employees, state and local governmental authorities and local citizens. We are also subject to the requirements and reporting set forth in OSHA workplace standards.
The Endangered Species Act, or ESA, was established to protect endangered and threatened species. Pursuant to the ESA, if a species is listed as threatened or endangered, restrictions may be imposed on activities adversely affecting that species’ habitat. Similar protections are offered to migratory birds under the Migratory Bird Treaty Act. The U.S. Fish and Wildlife Service must also designate the species’ critical habitat and suitable habitat as part of the effort to ensure survival of the species. A critical habitat or suitable habitat designation could result in material restrictions on land use and may materially impact oil and natural gas development. Our oil and natural gas operations in certain of our operating areas could also be adversely affected by seasonal or permanent restrictions on drilling activity designed to protect certain wildlife in the Delaware Basin. See “Risk Factors—We Are Subject to Government Regulation and Liability, Including Complex Environmental Laws, Which Could Require Significant Expenditures.” Our ability to maximize production from our leases may be adversely impacted by these restrictions.
We have not in the past been, and do not anticipate in the near future to be, required to expend amounts that are material in relation to our total capital expenditures as a result of environmental laws and regulations, but since these laws and regulations are periodically amended, we are unable to predict the ultimate cost of compliance. We have no assurance that more stringent laws and regulations protecting the environment will not be adopted or that we will not otherwise incur material expenses in connection with environmental laws and regulations in the future. See “Risk Factors — We Are Subject to Government Regulation and Liability, Including Complex Environmental Laws, Which Could Require Significant Expenditures.”
The clear trend in environmental regulation is to place more restrictions and limitations on activities that may affect the environment. Any changes in environmental laws and regulations or re-interpretation of enforcement policies that result in more stringent and costly permitting, emissions control, waste handling, storage, transport, disposal or remediation
27
requirements could have a material adverse effect on our operations and financial condition. We may be unable to pass on such increased compliance costs to our customers. Moreover, accidental releases or spills may occur in the course of our operations, and we have no assurance that we will not incur significant costs and liabilities as a result of such releases or spills, including any third-party claims for damage to property, natural resources or persons.
We maintain insurance against some, but not all, potential risks and losses associated with our industry and operations. We do not currently carry business interruption insurance. For some risks, we may not obtain insurance if we believe the cost of available insurance is excessive relative to the risks presented. In addition, pollution and environmental risks generally are not fully insurable. If a significant accident or other event occurs and is not fully covered by insurance, it could materially adversely affect our financial condition, results of operations and cash flows.
Office Lease
Our corporate headquarters are located at One Lincoln Centre, 5400 LBJ Freeway, Suite 1500, Dallas, Texas 75240. See Note 13 to the consolidated financial statements in this Annual Report for more details regarding our office lease. Such information is incorporated herein by reference.
Employees
At December 31, 2016, we had 165 full-time employees. We believe that our relationships with our employees are satisfactory. No employee is covered by a collective bargaining agreement. From time to time, we use the services of independent consultants and contractors to perform various professional services, particularly in the areas of geology and geophysics, land, production operations, construction, design, well site surveillance and supervision, permitting and environmental assessment and legal and income tax preparation and accounting services. Independent contractors, at our request, drill all of our wells and usually perform field and on-site production operation services for us, including midstream services, facilities construction, pumping, maintenance, dispatching, inspection and testing. If significant opportunities for company growth arise and require additional management and professional expertise, we will seek to employ qualified individuals to fill positions where that expertise is necessary to develop those opportunities.
Available Information
Our Internet website address is www.matadorresources.com. We make available, free of charge, through our website, our Annual Reports on Form 10-K, Quarterly Reports on Form 10-Q, Current Reports on Form 8-K and amendments to those reports, as soon as reasonably practicable after providing such reports to the SEC. Also, the charters of our Audit Committee, Compensation Committee, Corporate Governance Committee, Executive Committee and Nominating Committee, and our Code of Ethics and Business Conduct for Officers, Directors and Employees, are available through our website, and we also intend to disclose any amendments to our Code of Ethics and Business Conduct, or waivers to such code on behalf of our Chief Executive Officer, Chief Financial Officer or Chief Accounting Officer, on our website. All of these corporate governance materials are available free of charge and in print to any shareholder who provides a written request to the Corporate Secretary at One Lincoln Centre, 5400 LBJ Freeway, Suite 1500, Dallas, Texas 75240. The contents of our website are not intended to be incorporated by reference into this Annual Report or any other report or document we file and any reference to our website is intended to be an inactive textual reference only.
Item 1A. Risk Factors.
Risks Related to the Oil and Natural Gas Industry and Our Business
Our Success Is Dependent on the Prices of Oil and Natural Gas. Continued Low Oil and Natural Gas Prices and the Continued Volatility in These Prices May Adversely Affect Our Financial Condition and Our Ability to Meet Our Capital Expenditure Requirements and Financial Obligations.
The prices we receive for our oil and natural gas heavily influence our revenue, profitability, cash flow available for capital expenditures, access to capital, borrowing capacity under our Credit Agreement and future rate of growth. Oil and natural gas are commodities and, therefore, their prices are subject to wide fluctuations in response to relatively minor changes in supply and demand. Historically, the markets for oil and natural gas have been volatile and will likely continue to be volatile in the future. During 2016, the average price of oil was $43.40 per Bbl, based upon the NYMEX West Texas Intermediate oil futures contract price for the earliest delivery date, and the average price of natural gas was $2.55 per MMBtu, based upon the NYMEX Henry Hub natural gas futures contract price for the earliest delivery date. Starting in February and March of 2016, respectively, oil and natural gas prices began to increase from their most recent lows. Oil prices increased 106% from $26.21 per Bbl in mid-February 2016 to $54.06 per Bbl in late December 2016, and natural gas prices increased 140% from $1.64 per MMBtu in early March 2016 to $3.93 per MMBtu in late December 2016.
28
Further, because we use the full-cost method of accounting, we perform a ceiling test quarterly that may be impacted by declining prices of oil and natural gas. Significant price declines caused us to recognize full-cost ceiling impairments in each of the quarters of 2015 and in the first two quarters of 2016, and should prices decline again, we may recognize further full-cost ceiling impairments. Such full-cost ceiling impairments reduce the book value of our net tangible assets, retained earnings and shareholders’ equity but do not impact our cash flows from operations, liquidity or capital resources. See “—We May Be Required to Write Down the Carrying Value of Our Proved Properties under Accounting Rules and These Write-Downs Could Adversely Affect Our Financial Condition.”
The prices we receive for our production, and the levels of our production, depend on numerous factors. These factors include, but are not limited to, the following:
• | the domestic and foreign supply of, and demand for, oil and natural gas; |
• | the actions of the Organization of Petroleum Exporting Countries, or OPEC, and state-controlled oil companies relating to oil price and production controls; |
• | the prices and availability of competitors’ supplies of oil and natural gas; |
• | the price and quantity of foreign imports; |
• | the impact of U.S. dollar exchange rates on oil and natural gas prices; |
• | domestic and foreign governmental regulations and taxes; |
• | speculative trading of oil and natural gas futures contracts; |
• | the availability, proximity and capacity of gathering, processing and transportation systems for natural gas; |
• | the availability of refining capacity; |
• | the prices and availability of alternative fuel sources; |
• | weather conditions and natural disasters; |
• | political conditions in or affecting oil and natural gas producing regions or countries, including the United States, Middle East, South America and Russia; |
• | the continued threat of terrorism and the impact of military action and civil unrest; |
• | public pressure on, and legislative and regulatory interest within, federal, state and local governments to stop, significantly limit or regulate hydraulic fracturing activities; |
• | the level of global oil and natural gas inventories and exploration and production activity; |
• | the impact of energy conservation efforts; |
• | technological advances affecting energy consumption; and |
• | overall worldwide economic conditions. |
These factors make it difficult to predict future commodity price movements with any certainty. Substantially all of our oil and natural gas sales are made in the spot market or pursuant to contracts based on spot market prices and are not pursuant to long-term fixed price contracts. Further, oil prices and natural gas prices do not necessarily fluctuate in direct relation to each other.
Declines in oil or natural gas prices not only reduce our revenue, but could also reduce the amount of oil and natural gas that we can produce economically and could reduce the amount we may borrow under our Credit Agreement. Should oil or natural gas prices decrease to economically unattractive levels and remain at economically unattractive levels for an extended period of time, we may elect in the future to delay some of our exploration and development plans for our prospects, or to cease exploration or development activities on certain prospects due to the anticipated unfavorable economics from such activities, each of which could have a material adverse effect on our business, financial condition, results of operations and reserves. In addition, such declines in commodity prices could cause a reduction in our borrowing base. If the borrowing base were to be less than the outstanding borrowings under our Credit Agreement at any time, we would be required to provide additional collateral satisfactory in nature and value to the lenders to increase the borrowing base to an amount sufficient to cover such excess or repay the deficit in equal installments over a period of six months.
29
Our Exploration, Development, Exploitation and Midstream Projects Require Substantial Capital Expenditures That May Exceed Our Cash Flows from Operations and Potential Borrowings, and We May Be Unable to Obtain Needed Capital on Satisfactory Terms, Which Could Adversely Affect Our Future Growth.
Our exploration, development, exploitation and midstream activities are capital intensive. Our cash, operating cash flows, contributions from our joint venture partners and potential future borrowings under our Credit Agreement or otherwise may not be sufficient to fund all of our future acquisitions or future capital expenditures. The rate of our future growth is dependent, at least in part, on our ability to access capital at rates and on terms we determine to be acceptable.
We may sell additional equity securities or issue additional debt securities to raise capital. If we succeed in selling additional equity securities or securities convertible into equity securities to raise funds or make acquisitions, the ownership of our existing shareholders would be diluted, and new investors may demand rights, preferences or privileges senior to those of existing shareholders. If we raise additional capital through the issuance of new debt securities or additional indebtedness, we may become subject to additional covenants that restrict our business activities.
Our cash flows from operations and access to capital are subject to a number of variables, including:
• | our estimated proved oil and natural gas reserves; |
• | the amount of oil and natural gas we produce from existing wells; |
• | the prices at which we sell our production; |
• | the costs of developing and producing our oil and natural gas reserves; |
• | the costs of constructing, operating and maintaining our midstream facilities; |
• | our ability to acquire, locate and produce new reserves; |
• | the ability and willingness of banks to lend to us; and |
• | our ability to access the equity and debt capital markets. |
In addition, the possible occurrence of future events, such as further decreases in the prices of oil and natural gas, or extended periods of such decreased prices, terrorist attacks, wars or combat peace-keeping missions, financial market disruptions, general economic recessions, oil and natural gas industry recessions, large company bankruptcies, accounting scandals, overstated reserves estimates by major public oil companies and disruptions in the financial and capital markets, has caused financial institutions, credit rating agencies and the public to more closely review the financial statements, capital structures and earnings of public companies, including energy companies. Such events have constrained the capital available to the energy industry in the past, and such events or similar events could adversely affect our access to funding for our operations in the future.
If our revenues decrease as a result of lower oil and natural gas prices, operating difficulties, declines in reserves or the value thereof or for any other reason, we may have limited ability to obtain the capital necessary to sustain our operations at current levels, further develop and exploit our current properties or invest in certain exploration opportunities. Alternatively, to fund acquisitions, increase our rate of growth, develop our properties or pay for higher service costs, we may decide to alter or increase our capitalization substantially through the issuance of debt or equity securities, the sale of production payments, the sale or joint venture of midstream assets or oil and natural gas producing assets or acreage, the borrowing of funds or otherwise to meet any increase in capital spending. If we are unable to raise additional capital from available sources at acceptable terms, our business, financial condition and future results of operations could be adversely affected.
Drilling for and Producing Oil and Natural Gas Are Highly Speculative and Involve a High Degree of Operational and Financial Risk, with Many Uncertainties That Could Adversely Affect Our Business.
Exploring for and developing hydrocarbon reserves involves a high degree of operational and financial risk, which precludes us from definitively predicting the costs involved and time required to reach certain objectives. Our drilling locations are in various stages of evaluation, ranging from locations that are ready to drill to locations that will require substantial additional interpretation before they can be drilled. The budgeted costs of planning, drilling, completing and operating wells are often exceeded and such costs can increase significantly due to various complications that may arise during drilling, completion and operation. Before a well is spud, we may incur significant geological, geophysical and land costs, including seismic costs, which are incurred whether or not a well eventually produces commercial quantities of hydrocarbons, or is drilled at all. Exploration wells bear a much greater risk of loss than development wells. The analogies we draw from available data from other wells, more fully explored locations or producing fields may not be applicable to our drilling locations. If our actual drilling and development costs are significantly more than our estimated costs, we may not be able to continue our operations as proposed and could be forced to modify our drilling plans accordingly.
30
If we decide to drill a certain location, there is a risk that no commercially productive oil or natural gas reservoirs will be found or produced. We may drill or participate in new wells that are not productive. We may drill or participate in wells that are productive, but that do not produce sufficient net revenues to return a profit after drilling, operating and other costs. There is no way to affirmatively determine in advance of drilling and testing whether any particular location will yield oil or natural gas in sufficient quantities to recover exploration, drilling and completion costs or to be economically viable. Even if sufficient amounts of oil or natural gas exist, we may damage the potentially productive hydrocarbon-bearing formation or experience mechanical difficulties while drilling or completing the well, resulting in a reduction in production and reserves from, or abandonment of, the well. The productivity and profitability of a well may be negatively affected by a number of additional factors, including the following:
• | general economic and industry conditions, including the prices received for oil and natural gas; |
• | shortages of, or delays in, obtaining equipment, including hydraulic fracturing equipment, and qualified personnel; |
• | potential drainage of oil and natural gas from our properties by adjacent operators; |
• | loss of or damage to oilfield development and service tools; |
• | accidents, equipment failures or mechanical problems; |
• | title defects of the underlying properties; |
• | increases in severance taxes; |
• | adverse weather conditions that delay drilling activities or cause producing wells to be shut in; |
• | domestic and foreign governmental regulations; and |
• | proximity to and capacity of gathering, processing and transportation facilities. |
Furthermore, our exploration and production operations involve using some of the latest drilling and completion techniques developed by us and our service providers. For example, risks that we face while drilling and completing horizontal wells include, but are not limited to, the following:
• | landing our wellbore in the desired drilling zone; |
• | staying in the desired drilling zone while drilling horizontally through the formation; |
• | running our casing the entire length of the wellbore; |
• | fracture stimulating the planned number of stages; and |
• | being able to run tools and other equipment consistently through the horizontal wellbore. |
If we do not drill productive and profitable wells in the future, our business, financial condition, results of operations, cash flows and reserves could be materially and adversely affected.
The Borrowing Base under Our Credit Agreement Is Subject to Periodic Redetermination.
The borrowing base under the Credit Agreement is determined semi-annually as of May 1 and November 1 by the lenders based primarily on the estimated value of our proved oil and natural gas reserves at December 31 and June 30 of each year, respectively. Both we and the lenders may request an unscheduled redetermination of the borrowing base once each between scheduled redetermination dates. In addition, our lenders have the flexibility to reduce our borrowing base due to a variety of factors, some of which may be beyond our control. As of February 22, 2017, our borrowing base was $400.0 million, and we had no outstanding borrowings under, and approximately $0.8 million in outstanding letters of credit issued pursuant to, the Credit Agreement. We could be required to repay a portion of any outstanding bank debt to the extent that, after a redetermination, our outstanding borrowings at such time exceeded the redetermined borrowing base. We may not have sufficient funds to make such repayments, which could result in a default under the terms of the Credit Agreement and an acceleration of the loans thereunder requiring us to negotiate renewals, arrange new financing or sell significant assets, all of which could have a material adverse effect on our business and financial results.
The Terms of the Agreements Governing Our Outstanding Indebtedness May Restrict Our Current and Future Operations, Particularly Our Ability to Respond to Changes in Business or to Take Certain Actions.
Our Credit Agreement and the indenture governing our senior notes contain, and any future indebtedness we incur will likely contain, a number of restrictive covenants that impose significant operating and financial restrictions, including restrictions on our ability to engage in acts that may be in our best long-term interest. One or more of these agreements include covenants that, among other things, restrict our ability to:
• | incur or guarantee additional debt or issue certain types of preferred stock; |
31
• | pay dividends on capital stock or redeem, repurchase or retire our capital stock or subordinated indebtedness; |
• | transfer or sell assets; |
• | make certain investments; |
• | create certain liens; |
• | enter into agreements that restrict dividends or other payments from our Restricted Subsidiaries (as defined in the indenture) to us; |
• | consolidate, merge or transfer all or substantially all of our assets; |
• | engage in transactions with affiliates; and |
• | create unrestricted subsidiaries. |
A breach of any of these covenants could result in an event of default under our Credit Agreement and the indenture governing our outstanding senior notes. For example, our Credit Agreement requires us to maintain a debt to EBITDA ratio, which is defined as total debt outstanding divided by a rolling four quarter EBITDA calculation, of 4.25 or less. Low oil and natural gas prices or any decline in the prices of oil or natural gas may adversely impact our EBITDA, cash flows and debt levels, and therefore our ability to comply with this covenant. Upon the occurrence of such an event of default, all amounts outstanding under the applicable debt agreements could be declared to be immediately due and payable and all applicable commitments to extend further credit could be terminated. If indebtedness under our Credit Agreement or indenture is accelerated, there can be no assurance that we will have sufficient assets to repay such indebtedness. The operating and financial restrictions and covenants in these debt agreements and any future financing agreements could adversely affect our ability to finance future operations or capital needs or to engage in other business activities.
We May Not Be Able to Generate Sufficient Cash to Service All of Our Indebtedness and May Be Forced to Take Other Actions to Satisfy Our Obligations under Applicable Debt Instruments, Which May Not Be Successful.
Our ability to make scheduled payments on or to refinance our indebtedness obligations depends on our financial condition and operating performance, which are subject to prevailing economic and competitive conditions and certain financial, business and other factors beyond our control. We may not be able to maintain a level of cash flows from operating activities sufficient to permit us to pay the principal, premium, if any, and interest on our indebtedness.
If our cash flows and capital resources are insufficient to fund debt service obligations, we may be forced to reduce or delay investments and capital expenditures, sell assets, seek additional capital or restructure or refinance indebtedness. Our ability to restructure or refinance indebtedness will depend on the condition of the capital markets and our financial condition at such time. Any refinancing of indebtedness could be at higher interest rates and may require us to comply with more onerous covenants, which could further restrict business operations. The terms of existing or future debt instruments may restrict us from adopting some of these alternatives. In addition, any failure to make payments of interest and principal on outstanding indebtedness on a timely basis would likely result in a reduction of our credit rating, which could harm our ability to incur additional indebtedness. In the absence of sufficient cash flows and capital resources, we could face substantial liquidity problems and might be required to dispose of material assets or operations to meet debt service and other obligations. Our Credit Agreement and the indenture governing our outstanding senior notes currently restrict our ability to dispose of assets and our use of the proceeds from such disposition. We may not be able to consummate those dispositions, and the proceeds of any such disposition may not be adequate to meet any debt service obligations then due. These alternative measures may not be successful and may not permit us to meet scheduled debt service obligations, which could have a material adverse effect on our financial condition and results of operations.
We May Incur Additional Indebtedness, Which Could Reduce Our Financial Flexibility, Increase Interest Expense and Adversely Impact Our Operations and Our Unit Costs.
At February 22, 2017, we had available borrowings of approximately $399.2 million under our Credit Agreement (after giving effect to outstanding letters of credit). Our borrowing base is determined semi-annually by our lenders based primarily on the estimated value of our existing and future oil and natural gas reserves, but both we and our lenders can request one unscheduled redetermination between scheduled redetermination dates. Our Credit Agreement is secured by our interests in the majority of our oil and natural gas properties, and contains covenants restricting our ability to incur additional indebtedness, sell assets, pay dividends and make certain investments. Since the borrowing base is subject to periodic redeterminations, if a redetermination resulted in a lower borrowing base, we could be required to provide additional collateral satisfactory in nature and value to the lenders to increase the borrowing base to an amount sufficient to cover such excess or repay the deficit in equal installments over a period of six months. If we are required to do so, we may not have sufficient funds to fully make such repayments.
32
In the future, subject to the restrictions in the indenture governing our outstanding senior notes and in other instruments governing our other outstanding indebtedness (including our Credit Agreement), we may incur significant amounts of additional indebtedness, including under our Credit Agreement or through the issuance of additional notes, in order to fund acquisitions, develop our properties or invest in certain exploration opportunities. Interest rates on such future indebtedness may be higher than current levels, causing our financing costs to increase accordingly.
A high level of indebtedness could affect our operations in several ways, including the following:
• | requiring a significant portion of our cash flows to be used for servicing our indebtedness; |
• | increasing our vulnerability to general adverse economic and industry conditions; |
• | placing us at a competitive disadvantage compared to our competitors that are less leveraged and, therefore, may be able to take advantage of opportunities that our level of indebtedness may prevent us from pursuing; |
• | restricting our ability to obtain additional financing in the future for working capital, capital expenditures, acquisitions and general corporate or other purposes; and |
• | increasing the risk that we may default on our debt obligations. |
Our Credit Rating May Be Downgraded, Which Could Reduce Our Financial Flexibility, Increase Interest Expense and Adversely Impact Our Operations.
As of February 22, 2017, our corporate credit rating from Standard & Poor’s Rating Services was “B” and our corporate credit rating from Moody’s Investors Service was “B2.” We cannot assure you that our credit ratings will remain in effect for any given period of time or that a rating will not be lowered or withdrawn entirely by a rating agency if, in its judgment, circumstances so warrant. Any future downgrade could increase the cost of any indebtedness incurred in the future.
Any increase in our financing costs resulting from a credit rating downgrade could adversely affect our ability to obtain additional financing in the future for working capital, capital expenditures, acquisitions and general corporate or other purposes. If a credit rating downgrade were to occur at a time when we were experiencing significant working capital requirements or otherwise lacked liquidity, our results of operations could be materially adversely affected.
Our Operations Are Subject to Operational Hazards and Unforeseen Interruptions for Which We May Not Be Adequately Insured.
There are numerous operational hazards inherent in oil and natural gas exploration, development, production, gathering and processing, including:
• | natural disasters; |
• | adverse weather conditions; |
• | loss of drilling fluid circulation; |
• | blowouts where oil or natural gas flows uncontrolled at a wellhead; |
• | cratering or collapse of the formation; |
• | pipe or cement leaks, failures or casing collapses; |
• | damage to pipelines, processing plants and disposal wells and associated facilities; |
• | fires or explosions; |
• | releases of hazardous substances or other waste materials that cause environmental damage; |
• | pressures or irregularities in formations; and |
• | equipment failures or accidents. |
In addition, there is an inherent risk of incurring significant environmental costs and liabilities in the performance of our operations and services, some of which may be material, due to our handling of petroleum hydrocarbons and wastes, our emissions to air and water, the underground injection or other disposal of wastes, the use of hydraulic fracturing fluids and historical industry operations and waste disposal practices. Any of these or other similar occurrences could result in the disruption or impairment of our operations, substantial repair costs, personal injury or loss of human life, significant damage to property, environmental pollution and substantial revenue losses. The location of our wells, gathering systems, pipelines and other facilities near populated areas, including residential areas, commercial business centers and industrial sites, could significantly increase the level of damages resulting from these risks.
33
Insurance against all operational risks is not available to us. We are not fully insured against all risks, including development and completion risks that are generally not recoverable from third parties or insurance. Pollution and environmental risks generally are not fully insurable. In addition, we may elect not to obtain insurance if we believe that the cost of available insurance is excessive relative to the perceived risks presented. Losses could, therefore, occur for uninsurable or uninsured risks or in amounts in excess of existing insurance coverage. Moreover, insurance may not be available in the future at commercially reasonable prices or on commercially reasonable terms. Changes in the insurance markets due to various factors may make it more difficult for us to obtain certain types of coverage in the future. As a result, we may not be able to obtain the levels or types of insurance we would otherwise have obtained prior to these market changes, and the insurance coverage we do obtain may not cover certain hazards or all potential losses that are currently covered, and may be subject to large deductibles. Losses and liabilities from uninsured and underinsured events and delays in the payment of insurance proceeds could have a material adverse effect on our business, financial condition, results of operations and cash flows.
Because Our Reserves and Production Are Concentrated in a Few Core Areas, Problems in Production and Markets Relating to a Particular Area Could Have a Material Impact on Our Business.
Almost all of our current oil and natural gas production and our proved reserves are attributable to our properties in the Delaware Basin in Southeast New Mexico and West Texas, the Eagle Ford shale in South Texas and the Haynesville shale in Northwest Louisiana and East Texas. In 2015 and 2016, the vast majority of our capital expenditures have been allocated to the Delaware Basin. As a result, for the year ended December 31, 2016, approximately 57% of our total oil and natural gas production, including approximately 75% of our average daily oil production, was attributable to our properties in the Delaware Basin and approximately 18% of our total oil and natural gas production, including approximately 25% of our average daily oil production, was attributable to our properties in the Eagle Ford shale. At December 31, 2016, approximately 75% of our total proved oil and natural gas reserves were attributable to our properties in the Delaware Basin. We expect that a significant portion of our operations in 2017 will be in the Delaware Basin.
The industry focus on the Delaware Basin may adversely impact our ability to transport and process our oil and natural gas production due to significant competition for gathering systems, pipelines, processing facilities and oil and condensate trucking operations. For example, infrastructure constraints have in the past required, and may in the future require, us to flare natural gas occasionally, decreasing the volumes sold from our wells. Due to the concentration of our operations, we may be disproportionately exposed to the impact of delays or interruptions of production from our wells in our operating areas caused by transportation capacity constraints or interruptions, curtailment of production, availability of equipment, facilities, personnel or services, significant governmental regulation, natural disasters, adverse weather conditions or plant closures for scheduled maintenance.
Our operations may also be adversely affected by weather conditions and events such as hurricanes, tropical storms and inclement winter weather, resulting in delays in drilling and completions, damage to facilities and equipment and the inability to receive equipment or access personnel and products at affected job sites in a timely manner. For example, in recent years the Delaware Basin has experienced periods of severe winter weather that impacted many operators. In particular, the weather conditions and freezing temperatures have resulted in power outages, curtailments in trucking, delays in drilling and completion of wells and other production constraints. In recent years, certain areas of the Delaware Basin have also experienced periods of severe flooding that impacted our operations as well as many other operators in the area, resulting in delays in drilling, completing and initiating production on certain wells. As we continue to focus our operations on the Delaware Basin, we may increasingly face these and other challenges posed by severe weather.
Due to the concentrated nature of our portfolio of properties, a number of our properties could experience any of the same conditions at the same time, resulting in a relatively greater impact on our results of operations than they might have on other companies that have a more diversified portfolio of properties. For example, our operations in the Delaware Basin are subject to particular restrictions on drilling activities based on environmental sensitivities and requirements and potash mining operations. Such delays, interruptions or restrictions could have a material adverse effect on our financial condition, results of operations and cash flows.
The Unavailability or High Cost of Drilling Rigs, Completion Equipment and Services, Supplies and Personnel, Including Hydraulic Fracturing Equipment and Personnel, Could Adversely Affect Our Ability to Establish and Execute Exploration and Development Plans within Budget and on a Timely Basis, Which Could Have a Material Adverse Effect on Our Financial Condition, Results of Operations and Cash Flows.
Shortages or the high cost of drilling rigs, completion equipment and services, personnel or supplies, including sand and other proppants, could delay or adversely affect our operations. When drilling activity in the United States increases, associated costs typically also increase, including those costs related to drilling rigs, equipment, supplies, including sand and other proppants, and personnel and the services and products of other industry vendors. These costs may increase, and necessary equipment, supplies and services may become unavailable to us at economical prices. Should this increase in costs occur, we
34
may delay drilling activities, which may limit our ability to establish and replace reserves, or we may incur these higher costs, which may negatively affect our business, financial condition, results of operations and cash flows. In addition, should low oil or natural gas prices continue or should oil and natural gas prices decline further, third-party service providers may face financial difficulties and be unable to provide services. A reduction in the number of service providers available to us may negatively impact our ability to retain qualified service providers, or obtain such services at costs acceptable to us.
In addition, the demand for hydraulic fracturing services from time to time exceeds the availability of fracturing equipment and crews across the industry and in certain operating areas in particular. The accelerated wear and tear of hydraulic fracturing equipment due to its deployment in unconventional oil and natural gas fields characterized by longer lateral lengths and larger numbers of fracturing stages could further amplify such an equipment and crew shortage. If demand for fracturing services were to increase or the supply of fracturing equipment and crews were to decrease, higher costs or delays in procuring these services could result, which could adversely affect our business, financial condition, results of operations and cash flows.
If We Are Unable to Acquire Adequate Supplies of Water for Our Drilling and Hydraulic Fracturing Operations or Are Unable to Dispose of the Water We Use at a Reasonable Cost and Pursuant to Applicable Environmental Rules, Our Ability to Produce Oil and Natural Gas Commercially and in Commercial Quantities Could Be Impaired.
We use a substantial amount of water in our drilling and hydraulic fracturing operations. Our inability to obtain sufficient amounts of water at reasonable prices, or treat and dispose of water after drilling and hydraulic fracturing, could adversely impact our operations. In recent years, Southeast New Mexico and West Texas have experienced severe drought. As a result, we may experience difficulty in securing the necessary volumes of water for our operations. Moreover, the imposition of new environmental initiatives and regulations could include restrictions on our ability to conduct certain operations such as hydraulic fracturing or disposal of waste, including, but not limited to, produced water, drilling fluids and other wastes associated with the exploration, development and production of oil and natural gas. Furthermore, future environmental regulations and permitting requirements governing the withdrawal, storage and use of surface water or groundwater necessary for hydraulic fracturing of wells could increase operating costs and cause delays, interruptions or termination of operations, the extent of which cannot be predicted, all of which could have an adverse effect on our business, financial condition, results of operations and cash flows.
Unless We Replace Our Oil and Natural Gas Reserves, Our Reserves and Production Will Decline, Which Would Adversely Affect Our Business, Financial Condition, Results of Operations and Cash Flows.
The rate of production from our oil and natural gas properties declines as our reserves are depleted. Our future oil and natural gas reserves and production and, therefore, our income and cash flow, are highly dependent on our success in efficiently developing and exploiting our current reserves and economically finding or acquiring additional oil and natural gas producing properties. We are currently focusing primarily on increasing our production and reserves from the Delaware Basin, an area in which our competitors have been active. As a result of this activity, we may have difficulty expanding our current production or acquiring new properties in this area and may experience such difficulty in other areas in the future. During periods of low oil and/or natural gas prices, existing reserves may no longer be economic, and it will become more difficult to raise the capital necessary to finance expansion activities. If we are unable to replace our current and future production, our reserves will decrease, and our business, financial condition, results of operations and cash flows would be adversely affected.
Our Oil and Natural Gas Reserves Are Estimated and May Not Reflect the Actual Volumes of Oil and Natural Gas We Will Recover, and Significant Inaccuracies in These Reserves Estimates or Underlying Assumptions Will Materially Affect the Quantities and Present Value of Our Reserves.
The process of estimating accumulations of oil and natural gas is complex and inexact, due to numerous inherent uncertainties. This process relies on interpretations of available geological, geophysical, engineering and production data. The extent, quality and reliability of this technical data can vary. This process also requires certain economic assumptions related to, among other things, oil and natural gas prices, drilling and operating expenses, capital expenditures, taxes and availability of funds. The accuracy of a reserves estimate is a function of:
• | the quality and quantity of available data; |
• | the interpretation of that data; |
• | the judgment of the persons preparing the estimate; and |
• | the accuracy of the assumptions used. |
The accuracy of any estimates of proved oil and natural gas reserves generally increases with the length of production history. Due to the limited production history of many of our properties, the estimates of future production associated with these properties may be subject to greater variance to actual production than would be the case with properties having a longer production history. As our wells produce over time and more data becomes available, the estimated proved reserves will be
35
redetermined on at least an annual basis and may be adjusted to reflect new information based upon our actual production history, results of exploration and development, prevailing oil and natural gas prices and other factors.
Actual future production, oil and natural gas prices, revenues, taxes, development expenditures, operating expenses and quantities of recoverable oil and natural gas most likely will vary from our estimates. It is possible that future production declines in our wells may be greater than we have estimated. Any significant variance from our estimates could materially affect the quantities and present value of our reserves.
The Calculated Present Value of Future Net Revenues from Our Proved Oil and Natural Gas Reserves Will Not Necessarily Be the Same as the Current Market Value of Our Estimated Oil and Natural Gas Reserves.
It should not be assumed that the present value of future net cash flows included in this Annual Report is the current market value of our estimated proved oil and natural gas reserves. As required by SEC rules and regulations, the estimated discounted future net cash flows from proved oil and natural gas reserves are based on current costs held constant over time without escalation and on commodity prices using an unweighted arithmetic average of first-day-of-the-month index prices, appropriately adjusted, for the 12-month period immediately preceding the date of the estimate. Actual future prices and costs may be materially higher or lower than the prices and costs used for these estimates and will be affected by factors such as:
• | actual prices we receive for oil and natural gas; |
• | actual costs and timing of development and production expenditures; |
• | the amount and timing of actual production; and |
• | changes in governmental regulations or taxation. |
In addition, the 10% discount factor that is required to be used to calculate discounted future net revenues for reporting purposes under U.S. generally accepted accounting principles, or GAAP, is not necessarily the most appropriate discount factor based on the cost of capital in effect from time to time and risks associated with our business and the oil and natural gas industry in general.
Approximately 59% of Our Total Proved Reserves at December 31, 2016 Consisted of Undeveloped and Developed Non-Producing Reserves, and Those Reserves May Not Ultimately Be Developed or Produced.
At December 31, 2016, approximately 59% of our total proved reserves were undeveloped and less than 1% of our total proved reserves were developed non-producing. Our undeveloped and/or developed non-producing reserves may never be developed or produced or such reserves may not be developed or produced within the time periods we have projected or at the costs we have estimated. Delays in the development of our reserves or increases in costs to drill and develop such reserves would reduce the present value of our estimated proved undeveloped reserves and future net revenues estimated for such reserves, resulting in some projects becoming uneconomical and reducing our total proved reserves. In addition, delays in the development of reserves or declines in the oil and/or natural gas prices used to estimate proved reserves in the future could cause us to have to reclassify a portion of our proved reserves as unproved reserves. Any reduction in our proved reserves caused by the reclassification of undeveloped or developed non-producing reserves could materially affect our business, financial condition, results of operations and cash flows.
Our Identified Drilling Locations Are Scheduled over Several Years, Making Them Susceptible to Uncertainties That Could Materially Alter the Occurrence or Timing of Their Drilling.
Our management team has identified and scheduled drilling locations in our operating areas over a multi-year period. Our ability to drill and develop these locations depends on a number of factors, including oil and natural gas prices, assessment of risks, costs, drilling results, reservoir heterogeneities, the availability of equipment and capital, approval by regulators, lease terms and seasonal conditions. The final determination on whether to drill any of these locations will be dependent upon the factors described elsewhere in this Annual Report as well as, to some degree, the results of our drilling activities with respect to our established drilling locations. Because of these uncertainties, we do not know if the drilling locations we have identified will be drilled within our expected timeframe, or at all, or if we will be able to economically produce hydrocarbons from these or any other potential drilling locations. Our actual drilling activities may be materially different from our current expectations, which could adversely affect our business, financial condition, results of operations and cash flows.
Certain of Our Unproved and Unevaluated Acreage Is Subject to Leases That Will Expire over the Next Several Years Unless Production Is Established on Units Containing the Acreage.
At December 31, 2016, we had leasehold interests in approximately 44,975 net acres across all of our areas of interest that are not currently held by production and are subject to leases with primary or renewed terms that expire prior to 2020. Unless we establish and maintain production, generally in paying quantities, on units containing these leases during their terms or we renew such leases, these leases will expire. The cost to renew such leases may increase significantly, and we may not be able to renew such leases on commercially reasonable terms or at all. In addition, on certain portions of our acreage, third-party
36
leases may have been taken and could become immediately effective if our leases expire. If our leases expire or we are unable to renew such leases, we will lose our right to develop the related properties. As such, our actual drilling activities may materially differ from our current expectations, which could adversely affect our business, financial condition, results of operations and cash flows.
The 2-D and 3-D Seismic Data and Other Advanced Technologies We Use Cannot Eliminate Exploration Risk, Which Could Limit Our Ability to Replace and Grow Our Reserves and Materially and Adversely Affect Our Results of Operations and Cash Flows.
We employ visualization and 2-D and 3-D seismic images to assist us in exploration and development activities where applicable. These techniques only assist geoscientists in identifying subsurface structures and hydrocarbon indicators and do not allow the interpreter to know conclusively if hydrocarbons are present or economically producible. We could incur losses by drilling unproductive wells based on these technologies. Furthermore, seismic and geological data can be expensive to license or obtain and we may not be able to license or obtain such data at an acceptable cost. Poor results from our exploration activities could limit our ability to replace and grow reserves and adversely affect our business, financial condition, results of operations and cash flows.
Competition in the Oil and Natural Gas Industry Is Intense, Making It More Difficult for Us to Acquire Properties, Market Oil and Natural Gas, Provide Midstream Services and Secure Trained Personnel.
Competition is intense in virtually all facets of our business. Our ability to acquire additional prospects and to find and develop reserves in the future will depend on our ability to evaluate and select suitable properties and to consummate transactions in a highly competitive environment for acquiring properties, marketing oil and natural gas and securing trained personnel. Similarly, our midstream business, and particularly the success of the Joint Venture, depends in part on our ability to compete with other midstream service companies to attract third-party customers to our midstream facilities. Also, there is substantial competition for capital available for investment in the oil and natural gas industry. Many of our competitors possess and employ financial, technical and personnel resources substantially greater than ours. Those companies may be able to pay more for productive oil and natural gas properties and exploratory prospects and to evaluate, bid for and purchase a greater number of properties and prospects than our financial or personnel resources permit. In addition, other companies may be able to offer better compensation packages to attract and retain qualified personnel than we are able to offer. The cost to attract and retain qualified personnel has increased in recent years due to competition and may increase substantially in the future. We may not be able to compete successfully in the future in acquiring prospective reserves, developing reserves, developing midstream assets, marketing hydrocarbons, attracting and retaining quality personnel and raising additional capital, which could have a material adverse effect on our business, financial condition, results of operations and cash flows.
Our Competitors May Use Superior Technology and Data Resources That We May Be Unable to Afford or That Would Require a Costly Investment by Us in Order to Compete with Them More Effectively.
Our industry is subject to rapid and significant advancements in technology, including the introduction of new products, equipment and services using new technologies and databases. As our competitors use or develop new technologies, we may be placed at a competitive disadvantage, and competitive pressures may force us to implement new technologies at a substantial cost. In addition, many of our competitors will have greater financial, technical and personnel resources that allow them to enjoy technological advantages and may in the future allow them to implement new technologies before we can. We cannot be certain that we will be able to implement technologies on a timely basis or at a cost that is acceptable to us. One or more of the technologies that we will use or that we may implement in the future may become obsolete, and our operations may be adversely affected.
Strategic Relationships upon Which We May Rely Are Subject to Change, Which May Diminish Our Ability to Conduct Our Operations.
Our ability to explore, develop and produce oil and natural gas resources successfully, acquire oil and natural gas interests and acreage and conduct our midstream activities depends on our developing and maintaining close working relationships with industry participants and on our ability to select and evaluate suitable acquisition opportunities in a highly competitive environment. These relationships are subject to change and, if they do, our ability to grow may be impaired.
To develop our business, we endeavor to use the business relationships of our management, board and special board advisors to enter into strategic relationships, which may take the form of contractual arrangements with other oil and natural gas companies and service companies, including those that supply equipment and other resources that we expect to use in our business, as well as midstream companies and certain financial institutions. We may not be able to establish these strategic relationships, or if established, we may not be able to maintain them. In addition, the dynamics of our relationships with strategic partners may require us to incur expenses or undertake activities we would not otherwise be inclined to incur in order to fulfill our obligations to these partners or maintain our relationships. If our strategic relationships are not established or maintained, our business prospects may be limited, which could diminish our ability to conduct our operations.
37
The Marketability of Our Production Is Dependent upon Oil and Natural Gas Gathering, Processing and Transportation Facilities, and the Unavailability of Satisfactory Oil and Natural Gas Gathering, Processing and Transportation Arrangements Could Have a Material Adverse Effect on Our Revenue.
The unavailability of satisfactory oil, natural gas and natural gas liquids gathering, processing and transportation arrangements may hinder our access to oil, natural gas and natural gas liquids markets or delay production from our wells. The availability of a ready market for our oil, natural gas and natural gas liquids production depends on a number of factors, including the demand for, and supply of, oil, natural gas and natural gas liquids and the proximity of reserves to pipelines and terminal facilities. Our ability to market our production depends in substantial part on the availability and capacity of gathering systems, pipelines, processing facilities and oil and condensate trucking operations. Such systems and operations include those of the Joint Venture, as well as other systems and operations owned and operated by third parties. The continuing operation of, and our continuing access to, third-party systems and operations is outside our control. Regardless of who operates the midstream systems or operations upon which we rely, our failure to obtain these services on acceptable terms could materially harm our business. In addition, certain of these gathering systems, pipelines and processing facilities, particularly in the Delaware Basin, may be outdated or in need of repair and subject to higher rates of line loss, failure and breakdown. Furthermore, such facilities may become unavailable because of testing, turnarounds, line repair, maintenance, reduced operating pressure, lack of operating capacity, regulatory requirements and curtailments of receipt or deliveries due to insufficient capacity or because of damage from severe weather conditions or other operational issues.
We may be required to shut in wells for lack of a market or because of inadequate or unavailable pipelines, gathering systems, processing facilities or trucking capacity. If that were to occur, we would be unable to realize revenue from those wells until production arrangements were made to deliver our production to market. Furthermore, if we were required to shut in wells we might also be obligated to pay shut-in royalties to certain mineral interest owners in order to maintain our leases. In addition, if we are unable to market our production we may be required to flare natural gas occasionally, which would decrease the volumes sold from our wells.
The disruption of our or third-party facilities due to maintenance, weather or other factors could negatively impact our ability to market and deliver our oil, natural gas and natural gas liquids. If our costs to access and transport on these pipelines significantly increase, our profitability could be reduced. Third parties control when or if their facilities are restored and what prices will be charged. In the past, we have experienced pipeline and natural gas processing interruptions and capacity and infrastructure constraints associated with natural gas production, which has, among other things, required us to flare natural gas occasionally. While we have entered into natural gas processing and transportation agreements covering the anticipated natural gas production from a significant portion of our Delaware Basin acreage in Southeast New Mexico and West Texas and our Eagle Ford shale acreage in South Texas, no assurance can be given that these agreements will alleviate these issues completely, and we may be required to pay deficiency payments under such agreements if we do not meet the gathering, disposal or processing commitments, as applicable. We may experience similar interruptions and processing capacity constraints as we continue to explore and develop our Wolfcamp, Bone Spring and other liquids-rich plays in the Delaware Basin in 2017. If we were required to shut in our production or flare our natural gas for long periods of time due to pipeline interruptions or lack of processing facilities or capacity of these facilities, it could have a material adverse effect on our business, financial condition, results of operations and cash flows.
Financial Difficulties Encountered by Our Oil and Natural Gas Purchasers, Third-Party Operators or Other Third Parties Could Decrease Our Cash Flows from Operations and Adversely Affect the Exploration and Development of Our Prospects and Assets.
We derive most of our revenues from the sale of our oil, natural gas and natural gas liquids to unaffiliated third-party purchasers, independent marketing companies and midstream companies. We are also subject to credit risk due to the concentration of our oil and natural gas receivables with several significant customers. We cannot predict the extent to which counterparties’ businesses would be impacted if oil and natural gas prices decline, such prices remain depressed for a sustained period of time or other conditions in our industry were to deteriorate. Any delays in payments from our purchasers caused by financial problems encountered by them will have an immediate negative effect on our results of operations and cash flows.
Liquidity and cash flow problems encountered by our working interest co-owners or the third-party operators of our non-operated properties may prevent or delay the drilling of a well or the development of a project. Our working interest co-owners may be unwilling or unable to pay their share of the costs of projects as they become due. In the case of a farmout party, we would have to find a new farmout party or obtain alternative funding in order to complete the exploration and development of the prospects subject to a farmout agreement. In the case of a working interest owner, we could be required to pay the working interest owner’s share of the project costs. If we are not able to obtain the capital necessary to fund either of these contingencies or find a new farmout party, our results of operations and cash flows could be negatively affected.
38
Our Natural Gas Processing Operations Are Subject to Operational Risks, Which Could Result in Significant Damages and the Loss of Revenue.
The Joint Venture owns, and we operate, the Black River Processing Plant. There are significant risks associated with the operation of cryogenic natural gas processing plants. Natural gas and natural gas liquids are volatile and explosive and may include carcinogens. Damage to or improper operation of a cryogenic natural gas processing plant could result in an explosion or the discharge of toxic gases, which could result in significant damage claims, interrupt a revenue source and prevent us from processing some or all of the natural gas produced from our wells located in the Rustler Breaks asset area. Furthermore, if we were unable to process such natural gas, we may be forced to flare natural gas from, or shut in, the affected wells for an indefinite period of time.
We Have Entered into Certain Long-Term Contracts That Require Us to Pay Fees to Our Service Providers Based on Minimum Volumes Regardless of Actual Volume Throughput and That May Limit Our Ability to Use Other Service Providers.
In connection with the sale of the Loving County Processing System in October 2015, we entered into a 15-year fixed-fee natural gas gathering and processing agreement covering the anticipated natural gas production from a significant portion of our acreage in the Wolf asset area in the Delaware Basin (the “Wolf Gathering Agreement”). In addition, in connection with the formation of the Joint Venture, we entered into certain 15-year fixed-fee natural gas, oil and salt water gathering agreements and salt water disposal agreements covering the Rustler Breaks and Wolf asset areas and a natural gas processing agreement covering the Rustler Breaks asset area (collectively, the “Joint Venture Agreements”). We are also subject to a firm natural gas processing and transportation agreement covering the anticipated natural gas production from a significant portion of our Eagle Ford shale acreage in South Texas, which agreement expires in September 2017. In each of these agreements we have provided certain minimum volume commitments. Lower commodity prices may lead to reductions in our drilling program, which may result in insufficient production to fulfill our obligations under these agreements. These agreements obligate us to pay fees on minimum volumes to our service providers (including the Joint Venture) regardless of actual throughput. As of December 31, 2016, our long-term contractual obligations under agreements with minimum volume commitments totaled approximately $12.9 million over the term of the agreements (excluding the Joint Venture Agreements, which were entered into in 2017). If we have insufficient production to meet the minimum volumes, our cash flow from operations will be reduced, which may require us to reduce or delay our planned investments and capital expenditures or seek alternative means of financing, all of which may have a material adverse effect on our results of operations.
Pursuant to the Wolf Gathering Agreement and the Joint Venture Agreements, we have dedicated our current and future leasehold interests in the Wolf and Rustler Breaks asset areas to EnLink or the Joint Venture, as applicable. As a result, we will be limited in our ability to use other gathering, processing, disposal and transportation service providers in the Wolf and Rustler Breaks asset areas, even if such service providers are able to offer us more favorable pricing or more efficient service.
Gathering, Processing and Transportation Services Are Subject to Complex Federal, State and Other Laws that Could Adversely Affect the Cost, Manner or Feasibility of Conducting Our Business.
The operations of our midstream business, including the Joint Venture, and the operations of the third parties on whom we rely for gathering, processing and transportation services, are subject to complex and stringent laws and regulations that require obtaining and maintaining numerous permits, approvals and certifications from various federal, state and local government authorities. Substantial costs may be incurred in order to comply with existing laws and regulations. If existing laws and regulations governing such services are revised or reinterpreted, or if new laws and regulations become applicable to operations, these changes may affect the costs that we pay for such services or the results of our midstream business, including the Joint Venture. Similarly, a failure to comply with such laws and regulations by us or the parties on whom we rely could have a material adverse effect on our business, financial condition, results of operations and cash flows. See “Business — Regulation.”
We Have Limited Control over Activities on Properties We Do Not Operate.
We are not the operator on some of our properties, particularly in the Haynesville shale. As a result of our sale of certain assets to Chesapeake in 2008, we do not operate one of our most significant natural gas assets in the Haynesville shale. We also have other non-operated acreage positions in Northwest Louisiana, South Texas, Southeast New Mexico and West Texas. Because we are not the operator for these properties, our ability to exercise influence over the operations of these properties or their associated costs is limited. Our dependence on the operators and other working interest owners of these projects and our limited ability to influence operations and associated costs, or control the risks, could materially and adversely affect the drilling results, reserves and future cash flows from these properties. The success and timing of our drilling and development activities on properties operated by others therefore depends upon a number of factors, including:
• | timing and amount of capital expenditures; |
• | the operator’s expertise and financial resources; |
39
• | the rate of production of reserves, if any; |
• | approval of other participants in drilling wells; and |
• | selection and implementation or execution of technology. |
In areas where we do not have the right to propose the drilling of wells, we may have limited influence on when, how and at what pace our properties in those areas are developed. Further, the operators of those properties may experience financial problems in the future or may sell their rights to another operator not of our choosing, both of which could limit our ability to develop and monetize the underlying oil or natural gas reserves. In addition, the operators of these properties may elect to curtail the oil or natural gas production or to shut in the wells on these properties during periods of low oil or natural gas prices, and we may receive less than anticipated or no production and associated revenues from these properties until the operator elects to return them to production.
We Conduct a Portion of Our Operations through Joint Ventures, Which Subjects Us to Additional Risks That Could Have a Material Adverse Effect on the Success of These Operations, Our Financial Position, Results of Operations or Cash Flows.
We own and operate substantially all of our midstream assets in the Delaware Basin through the Joint Venture, and we may enter into other joint venture arrangements in the future. The nature of a joint venture requires us to share a portion of control with unaffiliated third parties. If our joint venture partners do not fulfill their contractual and other obligations, the affected joint venture may be unable to operate according to its business plan, and we may be required to increase our level of financial commitment. If we do not timely meet our financial commitments or otherwise comply with our joint venture agreements, our ownership of and rights with respect to the applicable joint venture may be reduced or otherwise adversely affected. Furthermore, there can be no assurance that any joint venture will be successful or generate cash flows at the level we have anticipated, or at all. Differences in views among joint venture participants could also result in delays in business decisions or otherwise, failures to agree on major issues, operational inefficiencies and impasses, litigation or other issues. We provide management functions for the Joint Venture and may provide such services for future joint venture arrangements, which may require additional time and attention of management or require us to hire or contract additional personnel. Third parties may also seek to hold us liable for the joint ventures’ liabilities. These issues or any other difficulties that cause a joint venture to deviate from its original business plan could have a material adverse effect on our financial condition, results of operations and cash flows.
We Do Not Own All of the Land on Which Our Midstream Assets Are Located, Which Could Disrupt Our Operations.
We do not own all of the land on which our midstream assets are located, and we are therefore subject to the possibility of more onerous terms and/or increased costs or royalties to retain necessary land use if we do not have valid rights-of-way or leases or if such rights-of-way or leases lapse or terminate. We sometimes obtain the rights to land owned by third parties and governmental agencies for a specific period of time. Our loss of these rights, through our inability to renew right-of-way contracts, leases or otherwise, could cause us to cease operations on the affected land or find alternative locations for our operations at increased costs, each of which could have a material adverse effect on our business, financial condition, results of operations and cash flows.
Construction of Midstream Projects Subjects Us to Risks of Construction Delays, Cost Over-Runs, Limitations on Our Growth and Negative Effects on Our Financial Condition, Results of Operations, Cash Flows and Liquidity.
From time-to-time we, through the Joint Venture or otherwise, plan and construct midstream projects, some of which will take a number of months before commercial operation, such as the Joint Venture’s expansion of the Black River Processing Plant or the drilling of additional salt water disposal wells and construction of related facilities. These projects are complex and subject to a number of factors beyond our control, including delays from third-party landowners, the permitting process, complying with laws, unavailability of materials, labor disruptions, environmental hazards, financing, accidents, weather and other factors. Any delay in the completion of these projects could have a material adverse effect on our business, results of operations, liquidity and financial condition. The construction of salt water disposal facilities, pipelines and gathering and processing facilities requires the expenditure of significant amounts of capital, which may exceed our estimated costs. Estimating the timing and expenditures related to these development projects is very complex and subject to variables that can significantly increase expected costs. Should the actual costs of these projects exceed our estimates, our liquidity and financial condition could be adversely affected. This level of development activity requires significant effort from our management and technical personnel and places additional requirements on our financial resources and internal financial controls. We may not have the ability to attract and/or retain the necessary number of personnel with the skills required to bring complicated projects to successful conclusions.
40
A Component of Our Growth May Come through Acquisitions, and Our Failure to Identify or Complete Future Acquisitions Successfully Could Reduce Our Earnings and Hamper Our Growth.
We may be unable to identify properties for acquisition or to make acquisitions on terms that we consider economically acceptable. There is intense competition for acquisition opportunities in our industry. Competition for acquisitions may increase the cost of, or cause us to refrain from, completing acquisitions. The pursuit and completion of acquisitions may be dependent upon, among other things, our ability to obtain debt and equity financing and, in some cases, regulatory approvals. Our ability to grow through acquisitions will require us to continue to invest in operations and financial and management information systems and to attract, retain, motivate and effectively manage our employees. In addition, if we are not successful in identifying and acquiring properties, our earnings could be reduced and our growth could be restricted.
In addition, we may be unable to successfully integrate potential acquisitions into our existing operations. The inability to manage the integration of acquisitions effectively could reduce our focus on subsequent acquisitions and current operations, and could negatively impact our results of operations and growth potential. Members of our senior management team may be required to devote considerable amounts of time to the integration process, which will decrease the time they will have to manage our business.
Furthermore, our decision to acquire properties that are substantially different in operating or geologic characteristics or geographic locations from areas with which our staff is familiar may impact our productivity in such areas. Our financial condition, results of operations and cash flows may fluctuate significantly from period to period as a result of the completion of significant acquisitions during particular periods.
We may engage in bidding and negotiation to complete successful acquisitions. We may be required to alter or increase substantially our capitalization to finance these acquisitions through the use of cash on hand, the issuance of debt or equity securities, the sale of production payments, the sale or joint venture of midstream assets or oil and natural gas producing assets or acreage, the borrowing of funds or otherwise. Our Credit Agreement and the indenture governing our outstanding senior notes include covenants limiting our ability to incur additional debt. If we were to proceed with one or more acquisitions involving the issuance of our common stock, our shareholders would suffer dilution of their interests.
We May Purchase Oil and Natural Gas Properties with Liabilities or Risks That We Did Not Know About or That We Did Not Assess Correctly, and, as a Result, We Could Be Subject to Liabilities That Could Adversely Affect Our Results of Operations.
Before acquiring oil and natural gas properties, we assess the potential reserves, future oil and natural gas prices, operating costs, potential environmental liabilities and other factors relating to the properties. However, our review involves many assumptions and estimates, and their accuracy is inherently uncertain. As a result, we may not discover all existing or potential problems associated with the properties we buy. We may not become sufficiently familiar with the properties to assess fully their deficiencies and capabilities. We do not generally perform inspections on every well or property, and we may not be able to observe mechanical and environmental problems even when we conduct an inspection. The seller may not be willing or financially able to give us contractual protection against any identified problems, and we may decide to assume environmental and other liabilities in connection with properties we acquire. If we acquire properties with risks or liabilities we did not know about or that we did not assess correctly, our financial condition, results of operations and cash flows could be adversely affected as we settle claims and incur cleanup costs related to these liabilities.
We May Incur Losses or Costs as a Result of Title Deficiencies in the Properties in Which We Invest.
If an examination of the title history of a property that we have purchased reveals an oil and natural gas lease has been purchased in error from a person who is not the mineral interest owner or if the property has other title deficiencies, our interest would likely be worth less than what we paid or may be worthless. In such an instance, all or part of the amount paid for such oil and natural gas lease as well as all or part of any royalties paid pursuant to the terms of the lease prior to the discovery of the title defect would be lost.
It is not our practice in all acquisitions of oil and natural gas leases, or undivided interests in oil and natural gas leases, to undergo the expense of retaining lawyers to examine the title to the mineral interest to be placed under lease or already placed under lease. Rather, in certain acquisitions we rely upon the judgment of oil and natural gas lease brokers and/or landmen who perform the field work by examining records in the appropriate governmental office before attempting to acquire a lease on a specific mineral interest.
Prior to the drilling of an oil and natural gas well, however, it is standard industry practice for the operator of the well to obtain a preliminary title review of the spacing unit within which the proposed well is to be drilled to ensure there are no obvious deficiencies in title to the well. Frequently, as a result of such examinations, certain curative work must be done to correct deficiencies in the marketability of the title, and such title review and curative work entails expense, which may be significant and difficult to accurately predict. Our failure to cure any title defects may adversely impact our ability to increase production and reserves. In the future, we may suffer a monetary loss from title defects or title failure. Additionally, unproved and unevaluated acreage has greater risk of title defects than developed acreage. If there are any title defects or defects in
41
assignment of leasehold rights in properties in which we hold an interest, we will suffer a financial loss which could adversely affect our financial condition, results of operations and cash flows.
We May Be Required to Write Down the Carrying Value of Our Proved Properties under Accounting Rules and These Write-Downs Could Adversely Affect Our Financial Condition.
There is a risk that we will be required to write down the carrying value of our oil and natural gas properties when oil or natural gas prices are low or are declining. In addition, non-cash write-downs may occur if we have:
• | downward adjustments to our estimated proved reserves; |
• | increases in our estimates of development costs; or |
• | deterioration in our exploration and development results. |
We periodically review the carrying value of our oil and natural gas properties under full-cost accounting rules. Under these rules, the net capitalized costs of oil and natural gas properties less related deferred income taxes may not exceed a cost center ceiling that is calculated by determining the present value, based on constant prices and costs projected forward from a single point in time, of estimated future after-tax net cash flows from proved reserves, discounted at 10%. If the net capitalized costs of our oil and natural gas properties less related deferred income taxes exceed the cost center ceiling, we must charge the amount of this excess to operations in the period in which the excess occurs. We may not reverse write-downs even if prices increase in subsequent periods.
During the first and second and quarters of 2016, our net capitalized costs less related deferred income taxes exceeded the full-cost ceiling. As a result, we recorded impairment charges totaling $158.6 million, exclusive of tax effect, to our net capitalized costs for the year ended December 31, 2016. For further discussion of the full-cost ceiling impairment at December 31, 2016, see “Management’s Discussion and Analysis of Financial Condition and Results of Operations—Expenses.” A write-down does not affect net cash flows from operating activities, liquidity or capital resources, but it does reduce the book value of our net tangible assets, retained earnings and shareholders’ equity, and could lower the value of our common stock.
Hedging Transactions, or the Lack Thereof, May Limit Our Potential Gains and Could Result in Financial Losses.
To manage our exposure to price risk, we, from time to time, enter into hedging arrangements, using primarily “costless collars” or “swaps” with respect to a portion of our future production. Costless collars provide us with downside price protection through the purchase of a put option which is financed through the sale of a call option. Because the call option proceeds are used to offset the cost of the put option, these arrangements are initially “costless” to us. In the case of a costless collar, the put option and the call option have different fixed price components. In a swap contract, a floating price is exchanged for a fixed price over the specified period, providing downside price protection. The goal of these and other hedges is to lock in a range of prices in the case of collars or a fixed price in the case of swaps so as to mitigate price volatility and increase the predictability of cash flows. These transactions limit our potential gains if oil, natural gas or natural gas liquids prices rise above the maximum price established by the call option and may offer protection if prices fall below the minimum price established by the put option only to the extent of the volumes then hedged.
In addition, hedging transactions may expose us to the risk of financial loss in certain other circumstances, including instances in which our production is less than expected or the counterparties to our put and call option or swap contracts fail to perform under the contracts. Disruptions in the financial markets could lead to sudden changes in a counterparty’s liquidity, which could impair its ability to perform under the terms of the contracts. We are unable to predict sudden changes in a counterparty’s creditworthiness or ability to perform under contracts with us. Even if we do accurately predict sudden changes, our ability to mitigate that risk may be limited depending upon market conditions.
Furthermore, there may be times when we have not hedged our production when, in retrospect, it would have been advisable to do so. Decisions as to whether, at what price and what production volumes to hedge are difficult and depend on market conditions and our forecast of future production and oil, natural gas and natural gas liquids prices, and we may not always employ the optimal hedging strategy. We may employ hedging strategies in the future that differ from those that we have used in the past, and neither the continued application of our current strategies nor our use of different hedging strategies may be successful. As of February 22, 2017, we had approximately 70% and 50% of our estimated remaining 2017 oil and natural gas production, respectively, hedged. We currently have no hedges in place for natural gas liquids and no hedges in place for natural gas beyond 2017; however, we have a portion of our anticipated oil volumes hedged in 2018.
42
An Increase in the Differential between the NYMEX or Other Benchmark Prices of Oil and Natural Gas and the Wellhead Price We Receive for Our Production Could Adversely Affect Our Business, Financial Condition, Results of Operations and Cash Flows.
The prices that we receive for our oil and natural gas production sometimes reflect a discount to the relevant benchmark prices, such as NYMEX, that are used for calculating hedge positions. The difference between the benchmark prices and the prices we receive is called a differential. Increases in the differential between the benchmark prices for oil and natural gas and the wellhead prices we receive could adversely affect our business, financial condition, results of operations and cash flows. We do not have, and may not have in the future, any derivative contracts covering the amount of the basis differentials we experience with respect to our production. As such, we will be exposed to any increase in such differentials.
We Are Subject to Government Regulation and Liability, Including Complex Environmental Laws, Which Could Require Significant Expenditures.
The exploration, development, production, gathering, processing, transportation and sale of oil and natural gas in the United States are subject to many federal, state and local laws, rules and regulations, including complex environmental laws and regulations. Matters subject to regulation include discharge permits, drilling bonds, reports concerning operations, the spacing of wells, unitization and pooling of properties, taxation and environmental matters and health and safety criteria addressing worker protection. Under these laws and regulations, we may be required to make large expenditures that could materially adversely affect our financial condition, results of operations and cash flows. In addition to expenditures required in order for us to comply with such laws and regulations, these expenditures could also include payments for:
• | personal injuries; |
• | property damage; |
• | containment and clean-up of oil and other spills; |
• | management and disposal of hazardous materials; |
• | remediation, clean-up costs and natural resource damages; and |
• | other environmental damages. |
We do not believe that full insurance coverage for all potential damages is available at a reasonable cost. Failure to comply with these laws and regulations also may result in the suspension or termination of our operations and subject us to administrative, civil and criminal penalties, injunctive relief and/or the imposition of investigatory or other remedial obligations. Laws, rules and regulations protecting the environment have changed frequently and the changes often include increasingly stringent requirements. These laws, rules and regulations may impose liability on us for environmental damage and disposal of hazardous materials even if we were not negligent or at fault. We may also be found to be liable for the conduct of others or for acts that complied with applicable laws, rules or regulations at the time we performed those acts. These laws, rules and regulations are interpreted and enforced by numerous federal and state agencies. In addition, private parties, including the owners of properties upon which our wells are drilled or facilities are located, or the owners of properties adjacent to or in close proximity to those properties, may also pursue legal actions against us based on alleged non-compliance with certain of these laws, rules and regulations.
Part of the regulatory environment in which we operate includes, in some cases, federal requirements for obtaining environmental assessments, environmental impact statements and/or plans of development before commencing exploration and production activities. Oil and natural gas operations in certain of our operating areas can be adversely affected by seasonal or permanent restrictions on drilling activities designed to protect various wildlife. The designation of previously unprotected species as threatened or endangered species could prohibit drilling in certain of our operating areas, cause us to incur increased costs arising from species protection measures or result in limitations on our exploration and production activities, each of which could have an adverse impact on our ability to develop and produce our reserves.
We Are Subject to Federal, State and Local Taxes, and May Become Subject to New Taxes or Have Eliminated or Reduced Certain Federal Income Tax Deductions Currently Available with Respect to Oil and Natural Gas Exploration and Production Activities as a Result of Future Legislation, Which Could Adversely Affect Our Business, Financial Condition, Results of Operations and Cash Flows.
The federal, state and local governments in the areas in which we operate impose taxes on the oil and natural gas products we sell and, for many of our wells, sales and use taxes on significant portions of our drilling and operating costs. Many states have raised state taxes on energy sources or state taxes associated with the extraction of hydrocarbons, and additional increases may occur. In addition, there has been a significant amount of discussion by legislators and presidential administrations concerning a variety of energy tax proposals.
43
Periodically, legislation is introduced to eliminate certain key U.S. federal income tax preferences currently available to oil and natural gas exploration and production companies. Such changes include, but are not limited to, (i) the repeal of the percentage depletion allowance for certain oil and natural gas properties, (ii) the elimination of current deductions for intangible drilling and development costs, (iii) the elimination of the deduction for certain U.S. production or manufacturing activities and (iv) the increase in the amortization period for geological and geophysical costs paid or incurred in connection with the exploration for, or development of, oil or natural gas within the United States. The passage of any legislation or any other similar change in U.S. federal income tax law could affect certain tax deductions that are currently available with respect to oil and natural gas exploration and production activities and could negatively impact our financial condition, results of operations and cash flows.
Federal and State Legislation and Regulatory Initiatives Relating to Hydraulic Fracturing Could Result in Increased Costs and Additional Operating Restrictions or Delays.
Hydraulic fracturing involves the injection of water, sand or other propping agents and chemicals under pressure into rock formations to stimulate oil and natural gas production. We routinely use hydraulic fracturing to complete wells in order to produce oil, natural gas and natural gas liquids from formations such as the Wolfcamp and Bone Spring plays, the Eagle Ford shale and the Haynesville shale, where we focus our operations. The EPA released the final results of its comprehensive research study on the potential adverse impacts that hydraulic fracturing may have on drinking water resources in December 2016. The EPA concluded that hydraulic fracturing activities can impact drinking water resources under certain circumstances, including large volume spills and inadequate mechanical integrity of wells. The results of the EPA’s study could spur action towards federal legislation and regulation of hydraulic fracturing or similar production operations. In past sessions, Congress has considered, but did not pass, legislation to amend the SDWA, to remove the SDWA’s exemption granted to most hydraulic fracturing operations (other than operations using fluids containing diesel) and to require reporting and disclosure of chemicals used by oil and natural gas companies in the hydraulic fracturing process. The EPA has issued SDWA permitting guidance for hydraulic fracturing operations involving the use of diesel fuel in fracturing fluids in those states where the EPA is the permitting authority. Also at the federal level, the BLM issued final rules to regulate hydraulic fracturing on federal lands in March 2015, although these rules were struck down by a federal court in Wyoming in June 2016. An appeal of the decision is pending.
In addition, a number of states and local regulatory authorities are considering or have implemented more stringent regulatory requirements applicable to hydraulic fracturing, including bans or moratoria on drilling that effectively prohibit further production of oil and natural gas through the use of hydraulic fracturing or similar operations. For example, in December 2014, New York announced a moratorium on high volume fracturing activities combined with horizontal drilling following the issuance of a study regarding the safety of hydraulic fracturing. Certain communities in Colorado have also enacted bans on hydraulic fracturing. These actions are the subject of legal challenges. Texas, New Mexico and Wyoming have adopted regulations that require the disclosure of information regarding the substances used in the hydraulic fracturing process. Moreover, in light of concerns about seismic activity being triggered by the injection of produced waters into underground wells, certain regulators are also considering additional requirements related to seismic safety for hydraulic fracturing activities. A 2015 U.S. Geological Survey report identified areas of increased rates of induced seismicity that could be attributed to fluid injection or oil and natural gas extraction.
The adoption of new laws or regulations imposing reporting or operational obligations on, or otherwise limiting or prohibiting, the hydraulic fracturing process could make it more difficult to complete oil and natural gas wells in unconventional plays. In addition, if hydraulic fracturing becomes regulated at the federal level as a result of federal legislation or regulatory initiatives by the EPA, hydraulic fracturing activities could become subject to additional permitting requirements, and also to attendant permitting delays and potential increases in cost, which could adversely affect our business and results of operations.
Legislation or Regulations Restricting Emissions of Greenhouse Gases Could Result in Increased Operating Costs and Reduced Demand for the Oil, Natural Gas and Natural Gas Liquids We Produce while the Physical Effects of Climate Change Could Disrupt Our Production and Cause Us to Incur Significant Costs in Preparing for or Responding to Those Effects.
The EPA has published its final findings that emissions of carbon dioxide, methane and other greenhouse gases present an endangerment to public health and welfare because emissions of such gases are, according to the EPA, contributing to the warming of the earth’s atmosphere and other climatic changes. Accordingly, the EPA has adopted rules under the CAA for the permitting of greenhouse gas emissions from stationary sources under the Prevention of Significant Deterioration (“PSD”) and Title V permitting programs. The EPA has adopted a multi-tiered approach to this permitting, with the largest sources first subject to permitting. In addition, monitoring of greenhouse gas emissions from petroleum and natural gas systems commenced on January 1, 2011, with the first annual reports required to be filed in 2012. In October 2015, the EPA finalized rules that added new sources to the scope of the greenhouse gas monitoring and reporting requirements. These new sources include gathering and boosting facilities as well as completions and workovers from hydraulically fractured oil and natural gas wells. The revisions also include the addition of well identification reporting requirements for certain facilities. There were attempts
44
at comprehensive federal legislation establishing a cap and trade program, but that legislation did not pass. Further, various states have considered or adopted legislation that seeks to control or reduce emissions of greenhouse gases from a wide range of sources. Finally, in December 2015, the United States joined the international community at the 21st Conference of the Parties of the United Nations Framework Convention on Climate Change in Paris, France. The resulting Paris Agreement calls for the parties to undertake “ambitious efforts” to limit the average global temperature and to conserve and enhance sinks and reservoirs of greenhouse gases. The Paris Agreement, if ratified, establishes a framework for the parties to cooperate and report actions to reduce greenhouse gas emissions. Any future international agreements, federal or state laws or implementing regulations that may be adopted to address greenhouse gas emissions could, and in all likelihood would, require us to incur increased operating costs, adversely affecting our profits, and could adversely affect demand for the oil and natural gas we produce, depressing the prices we receive for oil and natural gas.
In an interpretative guidance on climate change disclosures, the SEC indicated that climate change could have an effect on the severity of weather (including hurricanes and floods), sea levels, the arability of farmland and water availability and quality. If such effects were to occur, there is the potential for our exploration and production operations to be adversely affected. Potential adverse effects could include damages to our facilities from powerful winds or rising waters in low-lying areas, disruption of our production, less efficient or non-routine operating practices necessitated by climate effects and increased costs for insurance coverages in the aftermath of such effects. Significant physical effects of climate change could also have an indirect effect on our financing and operations by disrupting the transportation or process-related services provided by us or other midstream companies, service companies or suppliers with whom we have a business relationship. We may not be able to recover through insurance some or any of the damages, losses or costs that may result from potential physical effects of climate change. In addition, our hydraulic fracturing operations require large amounts of water. See “—If We Are Unable to Acquire Adequate Supplies of Water for Our Drilling and Hydraulic Fracturing Operations or Are Unable to Dispose of the Water We Use at a Reasonable Cost and Pursuant to Applicable Environmental Rules, Our Ability to Produce Oil and Natural Gas Commercially and in Commercial Quantities Could Be Impaired.” Should climate change or other drought conditions occur, our ability to obtain water of a sufficient quality and quantity could be impacted and in turn, our ability to perform hydraulic fracturing operations could be restricted or made more costly.
New Regulations on All Emissions from Our Operations Could Cause Us to Incur Significant Costs.
On April 17, 2012, the EPA issued final rules to subject oil and natural gas operations to regulation under the New Source Performance Standards, or NSPS, and National Emission Standards for Hazardous Air Pollutants, or NESHAPS, programs under the CAA, and to impose new and amended requirements under both programs. The EPA rules include NSPS standards for completions of hydraulically fractured natural gas wells, compressors, controllers, dehydrators, storage tanks, natural gas processing plants and certain other equipment. Further, in May 2016, the EPA issued final NSPS governing methane emissions from the oil and natural gas industry as well as source determination standards for determining when oil and natural gas sources should be aggregated for CAA permitting and compliance purposes. The NSPS for methane extends the 2012 NSPS to completions of hydraulically fractured oil and natural gas wells, equipment leaks, pneumatic pumps and natural gas compressors. These rules have required changes to our operations, including the installation of new equipment to control emissions. The EPA has also announced that it intends to impose methane emission standards for existing sources and has issued information collection requests for oil and natural gas facilities. In November 2016, the Department of the Interior issued final rules relating to the venting, flaring and leaking of natural gas by oil and natural gas producers who operate on federal and Indian lands. The rules limit routine flaring of natural gas, require the payment of royalties on avoidable natural gas losses and require plans or programs relating to natural gas capture and leak detection and repair. These rules are expected to result in an increase to our operating costs and changes in our operations. In addition, several states are pursuing similar measures to regulate emissions of methane from new and existing sources within the oil and natural gas source category. As a result of this continued regulatory focus, future federal and state regulations of the oil and natural gas industry remain a possibility and could result in increased compliance costs on our operations.
A Change in the Jurisdictional Characterization of Some of Our Assets by FERC or a Change in Policy by It May Result in Increased Regulation of Our Assets, Which May Cause Our Revenues to Decline and Operating Expenses to Increase.
Section 1(b) of the NGA exempts natural gas gathering facilities from regulation by FERC under the NGA. We believe that the natural gas pipelines in our gathering systems meet the traditional tests FERC has used to establish a pipeline’s status as a gatherer not subject to FERC regulation. However, the distinction between FERC-regulated transmission services and federally unregulated gathering services is the subject of ongoing litigation, so the classification and regulation of our gathering facilities are subject to change based on future determinations by FERC, the courts or Congress. Similarly, intrastate crude oil pipeline facilities are exempt from regulation by FERC under the Interstate Commerce Act. We believe that the crude oil pipelines in our gathering systems meet the traditional tests FERC has used to establish a pipeline’s status as an intrastate facility not subject to FERC regulation. However, whether a pipeline provides service in interstate commerce or intrastate commerce is highly fact dependent and determined on a case-by-case basis. A change in the jurisdictional characterization of
45
our facilities by FERC, the courts or Congress, a change in policy by FERC or Congress or the expansion of our activities may result in increased regulation of our assets, which may cause our revenues to decline and operating expenses to increase.
Should We Fail to Comply with All Applicable FERC-Administered Statutes, Rules, Regulations and Orders, We Could Be Subject to Substantial Penalties and Fines.
Under the Energy Policy Act, FERC has civil penalty authority under the NGA to impose penalties for current violations of up to $1.0 million per day for each violation and disgorgement of profits associated with any violation. The nature of our gathering facilities is such that we have not yet been regulated by FERC. It is possible, however, that laws, rules and regulations pertaining to those and other matters may be considered or adopted by FERC or Congress from time to time. Failure to comply with those laws, rules and regulations in the future could subject us to civil penalty liability.
The Derivatives Legislation Adopted by Congress Could Have an Adverse Impact on Our Ability to Hedge Risks Associated with Our Business.
On July 21, 2010, President Obama signed into law the Dodd-Frank Wall Street Reform and Consumer Protection Act, or the Dodd-Frank Act, which is intended to modernize and protect the integrity of the U.S. financial system. The Dodd-Frank Act, among other things, establishes federal oversight and regulation of certain derivative products, including commodity hedges of the type we use. The Dodd-Frank Act requires the Commodity Futures Trading Commission, or CFTC, and the SEC to promulgate rules and regulations implementing the Dodd-Frank Act. Although the CFTC has finalized certain regulations, others remain to be finalized or implemented, and it is not possible at this time to predict when, or if, this will be accomplished.
In October 2011, the CFTC issued regulations to set position limits for certain futures and option contracts in the major energy markets and for swaps that are their economic equivalents. The initial position limits rule was vacated by the United States District Court for the District of Columbia in September 2012. However, in November 2013, the CFTC proposed new rules that would place limits on positions in certain core futures and equivalent swaps contracts for or linked to certain physical commodities, subject to exceptions for certain bona fide hedging transactions. As these new position limit rules are not yet final, the impact of those provisions on us is uncertain at this time. The Dodd-Frank Act could also result in additional regulatory requirements on our derivative arrangements, which could include new margin, reporting and clearing requirements. In addition, this legislation could have a substantial impact on our counterparties and may increase the cost of our derivative arrangements in the future.
If these types of commodity hedges become unavailable or uneconomic, our commodity price risk could increase, which would increase the volatility of revenues and may decrease the amount of credit available to us. Any limitations or changes in our use of derivative arrangements could also materially affect our cash flows, which could adversely affect our ability to make capital expenditures.
Finally, the Dodd-Frank Act was intended, in part, to reduce the volatility of oil and natural gas prices, which some legislators attributed to speculative trading in derivatives and commodity instruments related to oil and natural gas. Our revenues could therefore be adversely affected if a consequence of the Dodd-Frank Act and implementing regulations is to lower commodity prices.
Any of these consequences could have a material adverse effect on our business, financial condition and results of operations.
We May Have Difficulty Managing Growth in Our Business, Which Could Have a Material Adverse Effect on Our Business, Financial Condition, Results of Operations and Cash Flows and Our Ability to Execute Our Business Plan in a Timely Fashion.
Because of our size, growth in accordance with our business plans, if achieved, will place a significant strain on our financial, technical, operational and management resources. As and when we expand our activities, including our midstream business, through the Joint Venture or otherwise, there will be additional demands on our financial, technical and management resources. The failure to continue to upgrade our technical, administrative, operating and financial control systems or the occurrence of unexpected expansion difficulties, including the inability to recruit and retain experienced managers, geoscientists, petroleum engineers, landmen, midstream professionals, attorneys and financial and accounting professionals, could have a material adverse effect on our business, financial condition, results of operations and cash flows and our ability to execute our business plan in a timely fashion.
Our Success Depends, to a Large Extent, on Our Ability to Retain Our Key Personnel, Including Our Chairman and Chief Executive Officer, Management and Technical Team, the Members of Our Board of Directors and Our Special Board Advisors, and the Loss of Any Key Personnel, Board Member or Special Board Advisor Could Disrupt Our Business Operations.
Investors in our common stock must rely upon the ability, expertise, judgment and discretion of our management and the success of our technical team in identifying, evaluating and developing prospects and reserves. Our performance and success are dependent to a large extent on the efforts and continued employment of our management and technical personnel, including
46
our Chairman and Chief Executive Officer, Joseph Wm. Foran. We do not believe that they could be quickly replaced with personnel of equal experience and capabilities, and their successors may not be as effective. We have entered into employment agreements with Mr. Foran and other key personnel. However, these employment agreements do not ensure that these individuals will remain in our employment. If Mr. Foran or other key personnel resign or become unable to continue in their present roles and if they are not adequately replaced, our business operations could be adversely affected. With the exception of Mr. Foran, we do not maintain, nor do we plan to obtain, any insurance against the loss of any of these individuals.
We have an active Board of Directors that meets at least quarterly throughout the year and is closely involved in our business and the determination of our operational strategies. Members of our Board of Directors work closely with management to identify potential prospects, acquisitions and areas for further development. Certain of our directors have been involved with us since our inception and have a deep understanding of our operations and culture. If any of our directors resign or become unable to continue in their present role, it may be difficult to find replacements with the same knowledge and experience and, as a result, our operations may be adversely affected.
In addition, our board consults regularly with our special advisors regarding our business and the evaluation, exploration, engineering and development of our prospects. Due to the knowledge and experience of our special advisors, they play a key role in our multi-disciplined approach to making decisions regarding prospects, acquisitions and development. If any of our special advisors resign or become unable to continue in their present role, our operations may be adversely affected.
Information Technology Systems Implementation Issues Could Disrupt Our Internal Operations, Increase Our Costs and Could Have a Material Adverse Effect on Our Financial Results or Our Ability to Report Our Financial Results.
We are currently in the process of implementing new information technology software systems to replace certain of our legacy systems, including our accounting and land systems. As a part of this effort, we are transitioning data and changing certain processes, which will require changes to our internal control over financial reporting. This implementation process may be more expensive, time consuming and resource intensive than planned. Any disruptions that may occur in the implementation or operation of these systems updates or any future systems that we implement could increase our expenses and have a material adverse effect on our ability to report in an accurate and timely manner our financial position, results of operations and cash flows and to otherwise operate our business.
A Cyber Incident Could Occur and Result in Information Theft, Data Corruption, Operational Disruption or Financial Loss.
The oil and natural gas industry is dependent on digital technologies to conduct certain exploration, development, production, gathering, processing and financial activities. We depend on digital technology to, among other things, estimate oil and natural gas reserves quantities, plan, execute and analyze drilling, completion, production, gathering, processing and disposal operations, process and record financial and operating data and communicate with employees, shareholders, royalty owners and other third-party industry participants.
While we have not experienced any material losses due to cyber-attacks, we may suffer such losses in the future. If our systems for protecting against cyber incidents prove to be insufficient, we could be adversely affected by unauthorized access to proprietary information, which could lead to data corruption, communication interruption, exposure of our or third parties’ confidential or proprietary information, operational disruptions or financial loss. As cyber threats continue to evolve, we may be required to expend additional resources to continue to modify and enhance our protective systems or to investigate and remediate any vulnerabilities.
Risks Relating to Our Common Stock
The Price of Our Common Stock Has Fluctuated Substantially and May Fluctuate Substantially in the Future.
Our stock price has experienced volatility and could vary significantly as a result of a number of factors. In 2016, our stock price fluctuated between a high of $27.71 and a low of $11.13. In addition, the trading volume of our common stock may continue to fluctuate and cause significant price variations to occur. In the event of a drop in the market price of our common stock, you could lose a substantial part or all of your investment in our common stock. In addition, the stock markets in general have experienced extreme volatility that has often been unrelated to the operating performance of particular companies. These broad market fluctuations may adversely affect the trading price of our common stock.
Factors that could affect our stock price or result in fluctuations in the market price or trading volume of our common stock include:
• | our actual or anticipated operating and financial performance and drilling locations, including oil and natural gas reserves estimates; |
• | quarterly variations in the rate of growth of our financial indicators, such as net income per share, net income and cash flows, or those of companies that are perceived to be similar to us; |
47
• | changes in revenue, cash flows or earnings estimates or publication of reports by equity research analysts; |
• | speculation in the press or investment community; |
• | announcement or consummation of acquisitions or dispositions by us; |
• | public reaction to our press releases, announcements and filings with the SEC; |
• | sales of our common stock by us or shareholders, or the perception that such sales may occur; |
• | general financial market conditions and oil and natural gas industry market conditions, including fluctuations in the price of oil, natural gas and natural gas liquids; |
• | the realization of any of the risk factors presented in this Annual Report; |
• | the recruitment or departure of key personnel; |
• | commencement of or involvement in litigation; |
• | the success of our exploration and development operations, our midstream business and the marketing of any oil, natural gas and natural gas liquids we produce; |
• | changes in market valuations of companies similar to ours; and |
• | domestic and international economic, legal and regulatory factors unrelated to our performance. |
If We Fail to Maintain Effective Internal Control over Financial Reporting in the Future, Our Ability to Accurately Report Our Financial Results Could Be Adversely Affected.
As a public company with listed equity securities, we are required to comply with laws, regulations and requirements, certain corporate governance provisions of the Sarbanes-Oxley Act of 2002, related regulations of the SEC and the requirements of the NYSE. Complying with these statutes, regulations and requirements is difficult and costly and occupies a significant amount of time of our Board of Directors and management.
Pursuant to the Sarbanes-Oxley Act, we are required to maintain internal control over financial reporting. Our efforts to maintain our internal controls may not be successful, and we may be unable to maintain effective controls over our financial processes and reporting in the future and comply with the certification and reporting obligations under Sections 302 and 404 of the Sarbanes-Oxley Act. Our management does not expect that our internal controls and disclosure controls will prevent all possible error or all fraud. Further, our remediation efforts may not enable us to avoid material weaknesses in the future. Any failure to maintain effective controls could result in material misstatements that are not prevented or detected and corrected on a timely basis, which could potentially subject us to sanction or investigation by the SEC, the NYSE or other regulatory authorities. Ineffective internal controls could also cause investors to lose confidence in our reported financial information and adversely affect our business and our stock price.
We Do Not Presently Intend to Pay Any Cash Dividends on or Repurchase Any Shares of Our Common Stock.
We do not presently intend to pay any cash dividends on or repurchase any shares of our common stock. Any payment of future dividends will be at the discretion of our Board of Directors and will depend on, among other things, our earnings, financial condition, capital requirements, level of indebtedness, statutory and contractual restrictions applicable to the payment of dividends and other considerations that our Board of Directors deems relevant. Cash dividend payments in the future may only be made out of legally available funds and, if we experience substantial losses, such funds may not be available. In addition, certain covenants in our Credit Agreement and the indenture governing our outstanding senior notes may limit our ability to pay dividends or repurchase shares of our common stock. Accordingly, you may have to sell some or all of your common stock in order to generate cash flow from your investment, and there is no guarantee that the price of our common stock will exceed the price you paid.
Future Sales of Shares of Our Common Stock by Existing Shareholders and Future Offerings of Our Common Stock by Us Could Depress the Price of Our Common Stock.
The market price of our common stock could decline as a result of sales of a large number of shares of our common stock in the market, including shares of equity or debt securities convertible into common stock, and the perception that these sales could occur may also depress the market price of our common stock. If our existing shareholders sell, or indicate an intent to sell, substantial amounts of our common stock in the public market, the trading price of our common stock could decline significantly. Sales of our common stock may make it more difficult for us to sell equity securities in the future at a time and at a price that we deem appropriate. These sales could also cause our stock price to decrease and make it more difficult for you to sell shares of our common stock.
48
We may also sell or issue additional shares of common stock or equity or debt securities convertible into common stock in public or private offerings or in connection with acquisitions. We cannot predict the size of future issuances of our common stock or convertible securities or the effect, if any, that future issuances and sales of shares of our common stock or convertible securities would have on the market price of our common stock.
Provisions of Our Certificate of Formation, Bylaws and Texas Law May Have Anti-Takeover Effects That Could Prevent a Change in Control Even if It Might Be Beneficial to Our Shareholders.
Our certificate of formation and bylaws contain certain provisions that may discourage, delay or prevent a merger or acquisition that our shareholders may consider favorable. These provisions include:
• | authorization for our Board of Directors to issue preferred stock without shareholder approval; |
• | a classified Board of Directors so that not all members of our Board of Directors are elected at one time; |
• | the prohibition of cumulative voting in the election of directors; and |
• | a limitation on the ability of shareholders to call special meetings to those owning at least 25% of our outstanding shares of common stock. |
Provisions of Texas law may also discourage, delay or prevent someone from acquiring or merging with us, which may cause the market price of our common stock to decline. Under Texas law, a shareholder who beneficially owns more than 20% of our voting stock, or an affiliated shareholder, cannot acquire us for a period of three years from the date this person became an affiliated shareholder, unless various conditions are met, such as approval of the transaction by our Board of Directors before this person became an affiliated shareholder or approval of the holders of at least two-thirds of our outstanding voting shares not beneficially owned by the affiliated shareholder.
Our Directors and Executive Officers Own a Significant Percentage of Our Equity, Which Could Give Them Influence in Corporate Transactions and Other Matters, and the Interests of Our Directors and Executive Officers Could Differ from Other Shareholders.
As of February 22, 2017, our directors and executive officers beneficially owned approximately 12% of our outstanding common stock. These shareholders could influence or control to some degree the outcome of matters requiring a shareholder vote, including the election of directors, the adoption of any amendment to our certificate of formation or bylaws and the approval of mergers and other significant corporate transactions. Their influence or control of the Company may have the effect of delaying or preventing a change of control of the Company and may adversely affect the voting and other rights of other shareholders. In addition, due to their ownership interest in our common stock, our directors and executive officers may be able to remain entrenched in their positions.
Our Board of Directors Can Authorize the Issuance of Preferred Stock, Which Could Diminish the Rights of Holders of Our Common Stock and Make a Change of Control of the Company More Difficult Even if It Might Benefit Our Shareholders.
Our Board of Directors is authorized to issue shares of preferred stock in one or more series and to fix the voting powers, preferences and other rights and limitations of the preferred stock. Accordingly, we may issue shares of preferred stock with a preference over our common stock with respect to dividends or distributions on liquidation or dissolution, or that may otherwise adversely affect the voting or other rights of the holders of common stock.
Issuances of preferred stock, depending upon the rights, preferences and designations of the preferred stock, may have the effect of delaying, deterring or preventing a change of control of the Company, even if that change of control might benefit our shareholders.
Item 1B. Unresolved Staff Comments.
Not applicable.
Item 2. Properties.
See “Business” for descriptions of our properties. We also have various operating leases for rental of office space and office and field equipment. See Note 13 to the consolidated financial statements in this Annual Report for the future minimum rental payments. Such information is incorporated herein by reference.
Item 3. Legal Proceedings.
49
We are a party to several lawsuits encountered in the ordinary course of our business. While the ultimate outcome and impact to us cannot be predicted with certainty, in the opinion of management, it is remote that these lawsuits will have a material adverse impact on our financial condition, results of operations or cash flows.
Item 4. Mine Safety Disclosures.
Not applicable.
50
PART II
Item 5. Market for Registrant’s Common Equity, Related Stockholder Matters and Issuer Purchases of Equity Securities.
General Market Information
Shares of our common stock are traded on the NYSE under the symbol “MTDR.” Our shares have been traded on the NYSE since February 2, 2012. Prior to trading on the NYSE, there was no established public trading market for our common stock.
On February 24, 2017, we had 100,034,559 shares of common stock outstanding held by approximately 300 record holders, excluding shareholders for whom shares are held in “nominee” or “street” name.
The following table sets forth the high and low sales prices of our common stock as reported by the NYSE for the periods indicated.
2016 | 2015 | |||||||||||||||
High | Low | High | Low | |||||||||||||
First Quarter | $ | 20.94 | $ | 11.13 | $ | 25.08 | $ | 18.28 | ||||||||
Second Quarter | $ | 25.54 | $ | 18.03 | $ | 29.90 | $ | 22.01 | ||||||||
Third Quarter | $ | 24.71 | $ | 18.56 | $ | 26.07 | $ | 19.08 | ||||||||
Fourth Quarter | $ | 27.71 | $ | 20.45 | $ | 28.25 | $ | 18.87 | ||||||||
On February 24, 2017, the last reported sales price of our common stock on the NYSE was $24.42 per share.
Dividend Policy
We do not anticipate declaring or paying any cash dividends to holders of our common stock in the foreseeable future. We currently intend to retain future earnings to finance the expansion of our business. Our future dividend policy is within the discretion of our Board of Directors and will depend upon various factors, including our results of operations, financial condition, capital requirements and investment opportunities. In addition, certain covenants in our Credit Agreement and the indenture governing our outstanding senior notes may limit our ability to pay dividends on our common stock. During the years ended December 31, 2016 and 2015, we did not pay dividends to holders of our common stock.
Equity Compensation Plan Information
The following table presents the securities authorized for issuance under our equity compensation plans as of December 31, 2016.
__________________
Equity Compensation Plan Information | ||||||||||
Plan Category | Number of Shares to be Issued Upon Exercise of Outstanding Options, Warrants and Rights | Weighted-Average Exercise Price of Outstanding Options, Warrants and Rights | Number of Shares Remaining Available for Future Issuance Under Equity Compensation Plans | |||||||
Equity compensation plans approved by security holders(1) (2) | 2,872,954 | $ | 15.59 | 3,963,427 | ||||||
Equity compensation plans not approved by security holders | — | — | — | |||||||
Total | 2,872,954 | $ | 15.59 | 3,963,427 | ||||||
(1) | Our Board of Directors has determined not to make any additional grants of awards under the Matador Resources Company 2003 Stock and Incentive Plan. |
(2) | The Amended and Restated 2012 Long-Term Incentive Plan was adopted by our Board of Directors in April 2015 and approved by our shareholders on June 10, 2015. For a description of our Amended and Restated 2012 Long-Term Incentive Plan, see Note 8 to the consolidated financial statements in this Annual Report. |
51
Share Performance Graph
The following graph compares the cumulative return on a $100 investment in our common stock from February 2, 2012, the date our common stock began trading on the NYSE, through December 31, 2016, to that of the cumulative return on a $100 investment in the Russell 2000 Index and the Russell 2000 Energy Index for the same period. In calculating the cumulative return, reinvestment of dividends, if any, is assumed.
This graph is not “soliciting material,” is not deemed filed with the SEC and is not to be incorporated by reference in any of our filings under the Securities Act or the Exchange Act, whether made before or after the date hereof and irrespective of any general incorporation language in any such filing. This graph is included in accordance with the SEC’s disclosure rules. This historic stock performance is not indicative of future stock performance.
Comparison of Cumulative Total Return Among
Matador Resources Company, the Russell 2000 Index
and the Russell 2000 Energy Index
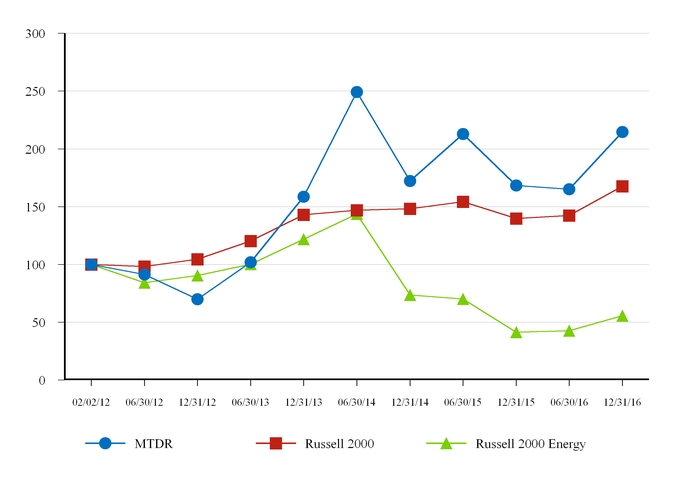
52
Repurchase of Equity by the Company or Affiliates
During the quarter ended December 31, 2016, the Company re-acquired shares of common stock from certain employees in order to satisfy the employees’ tax liability in connection with the vesting of restricted stock.
Period | Total Number of Shares Purchased (1) | Average Price Paid Per Share | Total Number of Shares Purchased as Part of Publicly Announced Plans or Programs | Maximum Number of Shares that May Yet Be Purchased under the Plans or Programs | |||||||||
October 1, 2016 to October 31, 2016 | 1,131 | $ | 23.66 | — | — | ||||||||
November 1, 2016 to November 30, 2016 | 1,288 | 21.45 | — | — | |||||||||
December 1, 2016 to December 31, 2016 | 1,306 | 25.65 | — | — | |||||||||
Total | 3,725 | $ | 23.59 | — | — | ||||||||
_________________
(1) The shares were not re-acquired pursuant to any repurchase plan or program.
53
Item 6. Selected Financial Data.
The following selected financial information is summarized from our results of operations for the five-year period ended December 31, 2016 and selected consolidated balance sheet and cash flow data at December 31, 2016, 2015, 2014, 2013 and 2012. You should read the following selected financial data in conjunction with “Management’s Discussion and Analysis of Financial Condition and Results of Operations” and our consolidated financial statements and related notes thereto included elsewhere in this Annual Report. The financial information included in this Annual Report may not be indicative of our future results of operations, financial condition or cash flows.
Year Ended December 31, | ||||||||||||||||||||
2016 | 2015 | 2014 | 2013 | 2012 | ||||||||||||||||
(In thousands, except per share data) | ||||||||||||||||||||
Statement of operations data: | ||||||||||||||||||||
Revenues | ||||||||||||||||||||
Oil and natural gas revenues | $ | 291,156 | $ | 278,340 | $ | 367,712 | $ | 269,030 | $ | 155,998 | ||||||||||
Third-party midstream services revenue | 5,218 | 1,864 | 1,213 | 207 | 183 | |||||||||||||||
Realized gain (loss) on derivatives | 9,286 | 77,094 | 5,022 | (909 | ) | 13,960 | ||||||||||||||
Unrealized (loss) gain on derivatives | (41,238 | ) | (39,265 | ) | 58,302 | (7,232 | ) | (4,802 | ) | |||||||||||
Total revenues | 264,422 | 318,033 | 432,249 | 261,096 | 165,339 | |||||||||||||||
Expenses | ||||||||||||||||||||
Production taxes, transportation and processing(1) | 43,046 | 35,650 | 33,172 | 20,973 | 11,672 | |||||||||||||||
Lease operating(2) | 56,202 | 54,704 | 49,945 | 37,971 | 27,868 | |||||||||||||||
Plant and other midstream services operating | 5,389 | 3,489 | 1,408 | 749 | 316 | |||||||||||||||
Depletion, depreciation and amortization | 122,048 | 178,847 | 134,737 | 98,395 | 80,454 | |||||||||||||||
Accretion of asset retirement obligations | 1,182 | 734 | 504 | 348 | 256 | |||||||||||||||
Full-cost ceiling impairment | 158,633 | 801,166 | — | 21,229 | 63,475 | |||||||||||||||
General and administrative | 55,089 | 50,105 | 32,152 | 20,779 | 14,543 | |||||||||||||||
Total expenses | 441,589 | 1,124,695 | 251,918 | 200,444 | 198,584 | |||||||||||||||
Operating (loss) income | (177,167 | ) | (806,662 | ) | 180,331 | 60,652 | (33,245 | ) | ||||||||||||
Other income (expense) | ||||||||||||||||||||
Net gain (loss) on asset sales and inventory impairment | 107,277 | 908 | — | (192 | ) | (485 | ) | |||||||||||||
Interest expense | (28,199 | ) | (21,754 | ) | (5,334 | ) | (5,687 | ) | (1,002 | ) | ||||||||||
Other (expense) income(3) | (4 | ) | 616 | 132 | 18 | 42 | ||||||||||||||
Total other income (expense) | 79,074 | (20,230 | ) | (5,202 | ) | (5,861 | ) | (1,445 | ) | |||||||||||
Net (loss) income | (97,057 | ) | (679,524 | ) | 110,754 | 45,094 | (33,261 | ) | ||||||||||||
Net (income) loss attributable to non-controlling interest in subsidiaries | (364 | ) | (261 | ) | 17 | — | — | |||||||||||||
Net (loss) income attributable to Matador Resources Company shareholders | $ | (97,421 | ) | $ | (679,785 | ) | $ | 110,771 | $ | 45,094 | $ | (33,261 | ) | |||||||
Earnings (loss) per common share | ||||||||||||||||||||
Basic | ||||||||||||||||||||
Class A (4) | $ | (1.07 | ) | $ | (8.34 | ) | $ | 1.58 | $ | 0.77 | $ | (0.62 | ) | |||||||
Class B (4) | $ | — | $ | — | $ | — | $ | — | $ | (0.35 | ) | |||||||||
Diluted | ||||||||||||||||||||
Class A (4) | $ | (1.07 | ) | $ | (8.34 | ) | $ | 1.56 | $ | 0.77 | $ | (0.62 | ) | |||||||
Class B (4) | $ | — | $ | — | $ | — | $ | — | $ | (0.35 | ) | |||||||||
Class B dividend declared, per share (4) | $ | — | $ | — | $ | — | $ | — | $ | 0.27 | ||||||||||
__________________
(1) | $0.1 million was reclassified to third-party midstream services revenues for the year ended December 31, 2015 due to our midstream business becoming a reportable segment in the third quarter of 2016. There were no such reclassifications made in any other periods presented. |
(2) | $3.5 million, $1.4 million, $0.7 million and $0.3 million were reclassified to plant and other midstream services operating expenses for the years ended December 31, 2015, 2014, 2013 and 2012, respectively, due to our midstream business becoming a reportable segment in the third quarter of 2016. |
(3) | $1.7 million, $1.2 million, $0.2 million and $0.2 million were reclassified to midstream services revenues for the years ended December 31, 2015, 2014, 2013 and 2012, respectively, due to our midstream business becoming a reportable segment in the third quarter of 2016. |
(4) | Our Class B common stock converted into Class A common stock upon the consummation of our initial public offering on February 7, 2012 and the Class A common stock then became the only class of common stock authorized. The term “Class A common stock” refers to shares of our Class A |
54
common stock prior to the automatic conversion of our Class B common stock into Class A common stock upon the consummation of our initial public offering.
At December 31, | ||||||||||||||||||||
2016 | 2015 | 2014 | 2013 | 2012 | ||||||||||||||||
(In thousands) | ||||||||||||||||||||
Balance sheet data: | ||||||||||||||||||||
Cash and cash equivalents | $ | 212,884 | $ | 16,732 | $ | 8,407 | $ | 6,287 | $ | 2,095 | ||||||||||
Restricted cash | 1,258 | 44,357 | 609 | — | — | |||||||||||||||
Certificates of deposit | — | — | — | — | 230 | |||||||||||||||
Net property and equipment | 1,184,525 | 1,012,406 | 1,322,072 | 845,877 | 591,090 | |||||||||||||||
Total assets | 1,464,665 | 1,140,861 | 1,434,490 | 890,330 | 632,029 | |||||||||||||||
Current liabilities | 169,505 | 136,830 | 142,036 | 100,327 | 96,492 | |||||||||||||||
Long-term liabilities | 603,715 | 515,072 | 425,913 | 221,079 | 156,433 | |||||||||||||||
Total Matador Resources Company shareholders’ equity | $ | 690,125 | $ | 488,003 | $ | 866,408 | $ | 568,924 | $ | 379,104 | ||||||||||
Year Ended December 31, | ||||||||||||||||||||
2016 | 2015 | 2014 | 2013 | 2012 | ||||||||||||||||
(In thousands) | ||||||||||||||||||||
Other financial data: | ||||||||||||||||||||
Net cash provided by operating activities | $ | 134,086 | $ | 208,535 | $ | 251,481 | $ | 179,470 | $ | 124,228 | ||||||||||
Net cash used in investing activities | (405,640 | ) | (425,154 | ) | (570,531 | ) | (366,939 | ) | (306,916 | ) | ||||||||||
Oil and natural gas properties capital expenditures | (379,067 | ) | (432,715 | ) | (560,849 | ) | (363,192 | ) | (300,689 | ) | ||||||||||
Expenditures for other property and equipment | (74,845 | ) | (64,499 | ) | (9,152 | ) | (3,977 | ) | (7,332 | ) | ||||||||||
Net cash provided by financing activities | 467,706 | 224,944 | 321,170 | 191,661 | 174,499 | |||||||||||||||
Adjusted EBITDA (1) | $ | 157,928 | $ | 223,155 | $ | 262,943 | $ | 191,771 | $ | 115,923 | ||||||||||
__________________
(1) | Adjusted EBITDA is a non-GAAP financial measure. For a definition of Adjusted EBITDA and a reconciliation of Adjusted EBITDA to our net income (loss) and net cash provided by operating activities, see “ – Non-GAAP Financial Measures” below. |
Non-GAAP Financial Measures
We define Adjusted EBITDA as earnings before interest expense, income taxes, depletion, depreciation and amortization, accretion of asset retirement obligations, property impairments, unrealized derivative gains and losses, certain other non-cash items and non-cash stock-based compensation expense, and net gain or loss on asset sales and inventory impairment. Adjusted EBITDA is not a measure of net income (loss) or cash flows as determined by GAAP. Adjusted EBITDA is a supplemental non-GAAP financial measure that is used by management and external users of our consolidated financial statements, such as industry analysts, investors, lenders and rating agencies.
Management believes Adjusted EBITDA is necessary because it allows us to evaluate our operating performance and compare the results of operations from period to period without regard to our financing methods or capital structure. We exclude the items listed above from net income (loss) in calculating Adjusted EBITDA, because these amounts can vary substantially from company to company within our industry depending upon accounting methods and book values of assets, capital structures and the method by which certain assets were acquired.
Adjusted EBITDA should not be considered an alternative to, or more meaningful than, net income or cash flows from operating activities as determined in accordance with GAAP or as a primary indicator of our operating performance or liquidity. Certain items excluded from Adjusted EBITDA are significant components of understanding and assessing a company’s financial performance, such as a company’s cost of capital and tax structure. Our Adjusted EBITDA may not be comparable to similarly titled measures of another company because all companies may not calculate Adjusted EBITDA in the same manner.
55
The following table presents our calculation of Adjusted EBITDA and the reconciliation of Adjusted EBITDA to the GAAP financial measures of net income (loss) and net cash provided by operating activities, respectively.
Year Ended December 31, | ||||||||||||||||||||
2016 | 2015 | 2014 | 2013 | 2012 | ||||||||||||||||
(In thousands) | ||||||||||||||||||||
Unaudited Adjusted EBITDA Reconciliation to Net (Loss) Income: | ||||||||||||||||||||
Net (loss) income attributable to Matador Resources Company shareholders | $ | (97,421 | ) | $ | (679,785 | ) | $ | 110,771 | $ | 45,094 | $ | (33,261 | ) | |||||||
Interest expense | 28,199 | 21,754 | 5,334 | 5,687 | 1,002 | |||||||||||||||
Total income tax (benefit) provision | (1,036 | ) | (147,368 | ) | 64,375 | 9,697 | (1,430 | ) | ||||||||||||
Depletion, depreciation and amortization | 122,048 | 178,847 | 134,737 | 98,395 | 80,454 | |||||||||||||||
Accretion of asset retirement obligations | 1,182 | 734 | 504 | 348 | 256 | |||||||||||||||
Full-cost ceiling impairment | 158,633 | 801,166 | — | 21,229 | 63,475 | |||||||||||||||
Unrealized loss (gain) on derivatives | 41,238 | 39,265 | (58,302 | ) | 7,232 | 4,802 | ||||||||||||||
Stock-based compensation expense | 12,362 | 9,450 | 5,524 | 3,897 | 140 | |||||||||||||||
Net (gain) loss on asset sales and inventory impairment | (107,277 | ) | (908 | ) | — | 192 | 485 | |||||||||||||
Adjusted EBITDA | $ | 157,928 | $ | 223,155 | $ | 262,943 | $ | 191,771 | $ | 115,923 | ||||||||||
Year Ended December 31, | ||||||||||||||||||||
2016 | 2015 | 2014 | 2013 | 2012 | ||||||||||||||||
(In thousands) | ||||||||||||||||||||
Unaudited Adjusted EBITDA Reconciliation to Net Cash Provided by Operating Activities: | ||||||||||||||||||||
Net cash provided by operating activities | $ | 134,086 | $ | 208,535 | $ | 251,481 | $ | 179,470 | $ | 124,228 | ||||||||||
Net change in operating assets and liabilities | (1,809 | ) | (8,980 | ) | 5,978 | 6,210 | (9,307 | ) | ||||||||||||
Interest expense, net of non-cash portion | 27,051 | 20,902 | 5,334 | 5,687 | 1,002 | |||||||||||||||
Current income tax (benefit) provision | (1,036 | ) | 2,959 | 133 | 404 | — | ||||||||||||||
Net (income) loss attributable to non-controlling interest in subsidiaries | (364 | ) | (261 | ) | 17 | — | — | |||||||||||||
Adjusted EBITDA | $ | 157,928 | $ | 223,155 | $ | 262,943 | $ | 191,771 | $ | 115,923 | ||||||||||
Item 7. Management’s Discussion and Analysis of Financial Condition and Results of Operations.
The following discussion and analysis of our financial condition and results of operations should be read in conjunction with our consolidated financial statements and related notes appearing elsewhere in this Annual Report. The following discussion contains “forward-looking statements” that reflect our future plans, estimates, beliefs and expected performance. We caution that assumptions, expectations, projections, intentions or beliefs about future events may, and often do, vary from actual results and the differences can be material. Some of the key factors which could cause actual results to vary from our expectations include changes in oil or natural gas prices, the timing of planned capital expenditures, availability under our Credit Agreement borrowing base, uncertainties in estimating proved reserves and forecasting production results, operational factors affecting the commencement or maintenance of producing wells, the condition of the capital markets generally, as well as our ability to access them, the proximity to and capacity of gathering, processing and transportation facilities, availability and integration of acquisitions, uncertainties regarding environmental regulations or litigation and other legal or regulatory developments affecting our business, as well as those factors discussed below and elsewhere in this Annual Report, all of which are difficult to predict. In light of these risks, uncertainties and assumptions, the forward-looking events discussed may not occur. See “Cautionary Note Regarding Forward-Looking Statements.”
Overview
We are an independent energy company founded in July 2003 and engaged in the exploration, development, production and acquisition of oil and natural gas resources in the United States, with an emphasis on oil and natural gas shale and other unconventional plays. Our current operations are focused primarily on the oil and liquids-rich portion of the Wolfcamp and Bone Spring plays in the Delaware Basin in Southeast New Mexico and West Texas. We also operate in the Eagle Ford shale play in South Texas and the Haynesville shale and Cotton Valley plays in Northwest Louisiana and East Texas. Additionally, we conduct midstream operations primarily, as of February 17, 2017, through San Mateo in support of our exploration, development and production operations and provide natural gas processing, natural gas, oil and salt water gathering services and salt water disposal services to third parties on a limited basis.
56
2016 Operational Highlights
During the year ended December 31, 2016, we completed and began producing oil and natural gas from 40 gross (35.6 net) operated and 15 gross (1.4 net) non-operated wells in the Delaware Basin. We did not conduct any operated drilling and completion activities on our leasehold properties in South Texas or in Northwest Louisiana and East Texas during 2016, although we did participate in the drilling and completion of 15 gross (2.1 net) non-operated Haynesville shale wells and two gross (less than 0.1 net) non-operated Eagle Ford shale wells that began producing in 2016.
At January 1, 2016, we were operating three drilling rigs in the Delaware Basin in Southeast New Mexico and West Texas, and we operated these drilling rigs in certain of our various asset areas in the Delaware Basin throughout most of 2016. We contracted a fourth drilling rig in late August 2016 to begin drilling our first salt water disposal well in our Rustler Breaks asset area in Eddy County, New Mexico. After we finished drilling that well, we moved the rig to our Wolf asset area in Loving County, Texas to drill a third salt water disposal well there. In late November 2016, we elected to move this fourth drilling rig back to our Rustler Breaks asset area to begin drilling oil and natural gas wells there. At December 31, 2016 and February 22, 2017 we continued to operate four drilling rigs in the Delaware Basin, including two rigs in our Rustler Breaks asset area, one rig in our Wolf asset area and one rig in our Ranger and Arrowhead asset areas in Lea and Eddy Counties, New Mexico. The vast majority of our 2016 capital expenditures of $454.4 million were directed to the delineation and development of our leasehold position in the Delaware Basin, to the development of certain midstream assets to support our operations there and to the acquisition of additional leasehold interests prospective for the Wolfcamp, Bone Spring and other liquids-rich plays in the Delaware Basin. Our remaining capital expenditures were directed to the installation of pumping units and other facilities on certain of our Eagle Ford shale wells in South Texas and to our participation in several non-operated wells drilled and completed in the Eagle Ford and Haynesville shales throughout 2016, as noted above.
We increased our leasehold position significantly in the Delaware Basin during 2016. At December 31, 2016, we held approximately 163,700 gross (94,300 net) acres in the Permian Basin in Southeast New Mexico and West Texas, primarily in the Delaware Basin in Lea and Eddy Counties, New Mexico and Loving County, Texas. Between January 1, 2017 and February 22, 2017, we acquired approximately 13,900 gross (8,200 net) leasehold and mineral acres and approximately 1,000 BOE per day of related production from various lessors and other operators, mostly in and around our existing acreage in the Delaware Basin. This brought our total Permian Basin acreage position at February 22, 2017 to 177,600 gross (101,400 net) acres, almost all of which was located in the Delaware Basin.
Our oil production, natural gas production and average daily oil equivalent production during 2016 were the best in the Company’s history. Our average daily oil equivalent production for the year ended December 31, 2016 was 27,813 BOE per day, including 13,924 Bbl of oil per day and 83.3 MMcf of natural gas per day, an increase of 12% as compared to 24,955 BOE per day, including 12,306 Bbl of oil per day and 75.9 MMcf of natural gas per day, for the year ended December 31, 2015. Our average daily oil production in 2016 of 13,924 Bbl of oil per day increased 13%, as compared to an average daily oil production of 12,306 Bbl of oil per day in 2015. This increase in oil production was primarily a result of our ongoing delineation and development drilling in the Delaware Basin, which offset declining oil production in the Eagle Ford shale where we have not drilled any new operated wells since the second quarter of 2015. Our average daily natural gas production of 83.3 MMcf per day for the year ended December 31, 2016 increased 10% from 75.9 MMcf per day for the year ended December 31, 2015. This increase in natural gas production was primarily attributable to increased natural gas production associated with our operations in the Delaware Basin and new, non-operated Haynesville shale wells completed and placed on production on our Elm Grove properties in Northwest Louisiana in the latter half of 2015 and into 2016. Oil production comprised 50% of our total production (using a conversion ratio of one Bbl of oil per six Mcf of natural gas) for the year ended December 31, 2016, as compared to 49% for the year ended December 31, 2015.
For the year ended December 31, 2016, our oil and natural gas revenues were $291.2 million, an increase of 5% from oil and natural gas revenues of $278.3 million for the year ended December 31, 2015. Our oil revenues and natural gas revenues increased 3% and 8% to approximately $209.9 million and $81.2 million, respectively, as a result of the increases in oil and natural gas production for the year ended December 31, 2016 as noted above, as compared to $203.4 million and $75.0 million, respectively, for the year ended December 31, 2015. The increase in both oil and natural gas production in 2016 helped to mitigate the impacts of somewhat lower realized weighted average oil and natural gas prices of $41.19 per Bbl and $2.66 per Mcf in 2016, respectively, as compared to $45.27 per Bbl and $2.71 per Mcf in 2015, respectively.
We reported a net loss of approximately $97.4 million, or $1.07 per diluted common share on a GAAP basis for the year ended December 31, 2016, as compared to a net loss of $679.8 million, or $8.34 per diluted common share, for the year ended December 31, 2015. Our net loss and net loss per diluted common share on a GAAP basis were significantly impacted by full-cost ceiling impairments of $158.6 million and $801.2 million for the years ended December 31, 2016 and 2015, respectively, as a result of substantial declines in oil and natural gas prices throughout 2015 and 2016. Adjusted EBITDA for the year ended December 31, 2016 was $157.9 million, as compared to Adjusted EBITDA of $223.2 million reported for the year ended December 31, 2015. This decrease in Adjusted EBITDA resulted, in part, from the lower weighted average oil and natural gas
57
prices realized in 2016, but was primarily attributable to lower realized hedging revenues of $9.3 million in 2016, as compared to $77.1 million in 2015. Adjusted EBITDA is a non-GAAP financial measure. For a definition of Adjusted EBITDA and a reconciliation of Adjusted EBITDA to our net income (loss) and net cash provided by operating activities, see “Selected Financial Data — Non-GAAP Financial Measures.”
At December 31, 2016, our estimated total proved oil and natural gas reserves were 105.8 million BOE, an all-time high for the Company, including 57.0 million Bbl of oil and 292.6 Bcf of natural gas, with a Standardized Measure of $575.0 million and a PV-10 of $581.5 million. At December 31, 2015, our estimated proved oil and natural gas reserves were 85.1 million BOE, including 45.6 million Bbl of oil and 236.9 Bcf of natural gas, with a Standardized Measure of $529.2 million and a PV-10 of $541.6 million. Our estimated total proved reserves of 105.8 million BOE at December 31, 2016 represented a 24% year-over-year increase, as compared to 85.1 million BOE at December 31, 2015. Our estimated proved oil reserves of 57.0 million Bbl at December 31, 2016 increased 25%, as compared to 45.6 million Bbl at December 31, 2015. Our proved oil and natural gas reserves in the Delaware Basin increased 68% to 79.4 million BOE at December 31, 2016, as compared to 47.1 million BOE at December 31, 2015, as a result of our ongoing delineation and development operations in the Delaware Basin. At December 31, 2016, approximately 75% of our total proved oil and natural gas reserves were attributable to our properties in the Delaware Basin. Our proved oil reserves in the Delaware Basin increased 49% to 46.9 million Bbl at December 31, 2016, as compared to 31.4 million Bbl at December 31, 2015. Proved oil reserves comprised 54% of our total proved reserves at both December 31, 2016 and December 31, 2015. These reserves estimates were based on evaluations prepared by our engineering staff and have been audited for their reasonableness and conformance with SEC guidelines by Netherland, Sewell & Associates, Inc., independent reservoir engineers. Standardized Measure represents the present value of estimated future net cash flows from proved reserves, less estimated future development, production, plugging and abandonment costs and income tax expenses, discounted at 10% per annum to reflect the timing of future cash flows. Standardized Measure is not an estimate of the fair market value of our properties. PV-10 is a non-GAAP financial measure. For a reconciliation of PV-10 to Standardized Measure, see “Business — Estimated Proved Reserves.”
2017 Midstream Joint Venture
On February 17, 2017, we announced the formation of San Mateo, a strategic joint venture with a subsidiary of Five Point to operate and expand our Delaware Midstream Assets. We received $171.5 million in connection with the formation of the Joint Venture and may earn up to an additional $73.5 million in performance incentives over the next five years. We continue to operate the Delaware Midstream Assets and retain operational control of the Joint Venture. The Company and Five Point own 51% and 49% of the Joint Venture, respectively. San Mateo will continue to provide firm capacity service to us at market rates, while also being a midstream service provider to third parties in and around our Wolf and Rustler Breaks asset areas.
2017 Capital Expenditure Budget
We expect that development of our Delaware Basin assets will be the primary focus of our operations and capital expenditures in 2017. We plan to operate four contracted drilling rigs in the Delaware Basin during the first quarter of 2017 and expect to add a fifth drilling rig in the Delaware Basin in the second quarter of 2017. Our 2017 estimated capital expenditure budget consists of $370 to $390 million for drilling, completions, facilities and infrastructure and $56 to $64 million for midstream capital expenditures, which represents our 51% share of an estimated 2017 capital expenditure budget of $110 to $125 million for San Mateo. Substantially all of our 2017 estimated capital expenditures will be allocated to the further delineation and development of our growing leasehold position and midstream assets in the Delaware Basin, with the exception of amounts allocated to limited operations in the Eagle Ford and Haynesville shales to maintain and extend leases and to participate in certain non-operated well opportunities. Our 2017 Delaware Basin drilling program will focus on the continued development of the Wolf and Rustler Breaks asset areas and the further delineation and development of the Jackson Trust, Ranger/Arrowhead and Twin Lakes asset areas, although we do anticipate continuing to delineate previously untested zones in the Wolf and Rustler Breaks asset areas during 2017.
We intend to continue acquiring acreage and mineral interests, principally in the Delaware Basin, during 2017. These expenditures are opportunity-specific and per-acre prices can vary significantly based on the prospect. As a result, it is difficult to estimate these 2017 capital expenditures with any degree of certainty; therefore, we have not provided estimated capital expenditures related to acreage and mineral acquisitions for 2017.
At December 31, 2016, we had $212.9 million in cash (excluding restricted cash) and $399.2 million in undrawn borrowing capacity under our Credit Agreement (after giving effect to outstanding letters of credit). As a result, we expect to fund our capital expenditures for 2017 through a combination of cash on hand, operating cash flows, proceeds we received in connection with the formation of the Joint Venture and borrowings under our Credit Agreement (assuming availability under our borrowing base). We may also consider funding a portion of our 2017 capital expenditures through additional credit arrangements, the sale or joint venture of midstream assets or oil and natural gas producing assets or acreage, particularly in our non-core asset areas, as well as potential issuances of equity, debt or convertible securities, none of which may be available on satisfactory terms or at all. The aggregate amount of capital we expend may fluctuate materially based on market conditions,
58
the actual costs to drill, complete and place on production operated or non-operated wells, our drilling results, the actual costs of our midstream activities, other opportunities that may become available to us and our ability to obtain capital.
59
Revenues
Our revenues are derived primarily from the sale of oil, natural gas and natural gas liquids production. Our revenues may vary significantly from period to period as a result of changes in volumes of production sold or changes in oil, natural gas or natural gas liquids prices.
The following table summarizes our revenues and production data for the periods indicated.
Year Ended December 31, | ||||||||||||
2016 | 2015 | 2014 | ||||||||||
Operating Data: | ||||||||||||
Revenues (in thousands): (1) | ||||||||||||
Oil | $ | 209,908 | $ | 203,355 | $ | 290,026 | ||||||
Natural gas | 81,248 | 74,985 | 77,686 | |||||||||
Total oil and natural gas revenues | 291,156 | 278,340 | 367,712 | |||||||||
Third-party midstream services revenues | 5,218 | 1,864 | 1,213 | |||||||||
Realized gain on derivatives | 9,286 | 77,094 | 5,022 | |||||||||
Unrealized (loss) gain on derivatives | (41,238 | ) | (39,265 | ) | 58,302 | |||||||
Total revenues | $ | 264,422 | $ | 318,033 | $ | 432,249 | ||||||
Net Production Volumes: (1) | ||||||||||||
Oil (MBbl) | 5,096 | 4,492 | 3,320 | |||||||||
Natural gas (Bcf) | 30.5 | 27.7 | 15.3 | |||||||||
Total oil equivalent (MBOE) (2) | 10,180 | 9,109 | 5,870 | |||||||||
Average daily production (BOE/d) (2) | 27,813 | 24,955 | 16,082 | |||||||||
Average Sales Prices: | ||||||||||||
Oil, without realized derivatives (per Bbl) | $ | 41.19 | $ | 45.27 | $ | 87.37 | ||||||
Oil, with realized derivatives (per Bbl) | $ | 42.34 | $ | 59.13 | $ | 88.94 | ||||||
Natural gas, without realized derivatives (per Mcf) | $ | 2.66 | $ | 2.71 | $ | 5.08 | ||||||
Natural gas, with realized derivatives (per Mcf) | $ | 2.78 | $ | 3.24 | $ | 5.06 | ||||||
________________
(1) | We report our production volumes in two streams: oil and natural gas, including both dry and liquids-rich natural gas. Revenues associated with natural gas liquids are included with our natural gas revenues. |
(2) | Estimated using a conversion ratio of one Bbl of oil per six Mcf of natural gas. |
Year Ended December 31, 2016 as Compared to Year Ended December 31, 2015
Oil and natural gas revenues. Our oil and natural gas revenues increased $12.8 million to $291.2 million, or an increase of 5%, for the year ended December 31, 2016, as compared to $278.3 million for the year ended December 31, 2015. Our oil revenues increased $6.6 million, or an increase of 3%, to $209.9 million for the year ended December 31, 2016, as compared to $203.4 million for the year ended December 31, 2015. The increase in oil revenues resulted from the 13% increase in our oil production to 5.1 million Bbl of oil for the year ended December 31, 2016, or about 13,924 Bbl of oil per day, as compared to 4.5 million Bbl of oil, or about 12,306 Bbl of oil per day, for the year ended December 31, 2015. This increased oil production was primarily a result of our ongoing delineation and development drilling in the Delaware Basin, which offset declining oil production in the Eagle Ford shale, where we have not drilled any new operated wells since the second quarter of 2015. The increase in oil revenues was partially impacted by a lower weighted average oil price realized for the year ended December 31, 2016 of $41.19 per Bbl, as compared to $45.27 per Bbl realized for the year ended December 31, 2015. Our natural gas revenues increased $6.3 million, or an increase of 8%, to $81.2 million for the year ended December 31, 2016, as compared to $75.0 million for the year ended December 31, 2015. The increase in natural gas revenues resulted from the 10% increase in our natural gas production to 30.5 Bcf for the year ended December 31, 2016, as compared to 27.7 Bcf for the year ended December 31, 2015. The increased natural gas production was primarily attributable to our ongoing delineation and development drilling in the Delaware Basin, which offset declining natural gas production in the Eagle Ford and Haynesville shales where we have significantly reduced our activity since late 2014 and early 2015. The increase in natural gas revenues was partially impacted by a lower weighted average natural gas price realized for the year ended December 31, 2016 of $2.66 per Mcf, as compared to $2.71 per Mcf realized for the year ended December 31, 2015.
Third-party midstream services revenues. During the third quarter of 2016, our midstream operations became a reportable business segment under GAAP. Our third-party midstream services revenues were previously included in other income. Third-party midstream services revenues are primarily those revenues from midstream operations related to third parties, including working interest owners in our operated wells; all midstream services revenues associated with our production are eliminated in consolidation. Our third-party midstream services revenues increased to $5.2 million, or an increase of almost three-fold, for
60
the year ended December 31, 2016, as compared to $1.9 million for the year ended December 31, 2015. This increase was primarily attributable to a significant increase in third-party salt water disposal revenue to approximately $1.6 million for the year ended December 31, 2016, as compared to $0.2 million for the year ended December 31, 2015, due to increased salt water disposal at our facilities in the Wolf asset area in 2016. The remaining increase was primarily attributable to third-party natural gas gathering and processing fees of $3.6 million for the year ended December 31, 2016, as compared to $1.7 million for the year ended December 31, 2015, including natural gas processing at the Black River Processing Plant, which began operating in August 2016.
Realized gain on derivatives. Our realized net gain on derivatives was $9.3 million for the year ended December 31, 2016, as compared to a realized net gain of $77.1 million for the year ended December 31, 2015. We realized net gains of $5.9 million and $3.4 million from our oil and natural gas derivative contracts, respectively, for the year ended December 31, 2016 resulting from oil and natural gas prices that were below the floor prices of certain of our oil and natural gas costless collar contracts. Our realized net gain on derivatives was $77.1 million for the year ended December 31, 2015. We realized net gains of $62.3 million, $12.7 million and $2.2 million from our oil, natural gas and natural gas liquid (“NGL”) derivative contracts, respectively, for the year ended December 31, 2015 resulting from oil and natural gas prices being below the floor prices of most of our oil and natural gas costless collar contracts and NGL prices being below the fixed prices of all of our swap contracts. We realized an average gain of approximately $2.29 per Bbl hedged on all of our open oil costless collar contracts during the year ended December 31, 2016, as compared to an average gain of $22.89 per Bbl hedged for the year ended December 31, 2015. Our oil volumes hedged for the year ended December 31, 2016 were also 6% lower as compared to the year ended December 31, 2015. We realized an average gain of approximately $0.26 per MMBtu hedged on all of our open natural gas costless collar contracts during the year ended December 31, 2016, as compared to an average gain of approximately $0.73 per MMBtu hedged on all of our open natural gas costless collar contracts during the year ended December 31, 2015. Our total natural gas volumes hedged for the year ended December 31, 2016 were also 23% lower than the total natural gas volumes hedged for the year ended December 31, 2015.
Unrealized gain (loss) on derivatives. Our unrealized net loss on derivatives was $41.2 million for the year ended December 31, 2016, as compared to an unrealized net loss of $39.3 million for the year ended December 31, 2015. During the year ended December 31, 2016, the net fair value of our open oil and natural gas derivatives contracts decreased to a net liability of approximately $25.0 million from a net asset of $16.3 million for the year ended December 31, 2015, resulting in an unrealized net loss on derivatives of $41.2 million for the year ended December 31, 2016. During the year ended December 31, 2016, the net fair value of our open oil and natural gas derivative contracts decreased $32.2 million and $9.1 million, respectively, due to the increase in the underlying oil and natural gas futures prices at December 31, 2016, as well as realized gains from oil and natural gas derivative contracts settled during the year ended December 31, 2016.
Year Ended December 31, 2015 as Compared to Year Ended December 31, 2014
Oil and natural gas revenues. Our oil and natural gas revenues decreased $89.4 million to $278.3 million, or a decrease of 24%, for the year ended December 31, 2015, as compared to $367.7 million for the year ended December 31, 2014. Our oil revenues decreased $86.7 million, a decrease of 30%, to $203.4 million for the year ended December 31, 2015, as compared to $290.0 million for the year ended December 31, 2014. The decrease in oil revenues resulted from a significantly lower weighted average oil price realized for the year ended December 31, 2015 of $45.27 per Bbl, as compared to $87.37 per Bbl realized for the year ended December 31, 2014. The lower weighted average oil price was partially mitigated by the 35% increase in our oil production to 4.5 million Bbl of oil for the year ended December 31, 2015, or about 12,306 Bbl of oil per day, as compared to just over 3.3 million Bbl of oil, or about 9,095 Bbl of oil per day, for the year ended December 31, 2014. This increased oil production was primarily a result of newly drilled and completed wells in the Delaware Basin, as well as from newly drilled and completed wells in the Eagle Ford shale in early 2015. Our natural gas revenues decreased $2.7 million, or a decrease of 3%, to $75.0 million for the year ended December 31, 2015, as compared to $77.7 million for the year ended December 31, 2014. The decrease in natural gas revenues resulted from a lower weighted average natural gas price realized for the year ended December 31, 2015 of $2.71 per Mcf, as compared to $5.08 per Mcf realized for the year ended December 31, 2014. The lower weighted average natural gas price was partially mitigated by the 81% increase in our natural gas production to 27.7 Bcf for the year ended December 31, 2015, as compared to 15.3 Bcf for the year ended December 31, 2014. The increased natural gas production was primarily attributable to new, non-operated Haynesville shale wells completed and placed on production on our Elm Grove properties in Northwest Louisiana during the latter half of 2014 and into 2015, but also included increased natural gas production associated with our operations in the Delaware Basin and the Eagle Ford shale.
Third-party midstream services revenues. Our third-party midstream services revenues increased to $1.9 million, or an increase of 54%, for the year ended December 31, 2015, as compared to $1.2 million for the December 31, 2014. The increase was primarily attributable to third-party oil, natural gas and salt water gathering and salt water disposal fees in our Wolf asset area.
61
Realized gain (loss) on derivatives. Our realized net gain on derivatives was $77.1 million for the year ended December 31, 2015, as compared to a realized net gain of $5.0 million for the year ended December 31, 2014. We realized net gains of $62.3 million, $12.7 million and $2.2 million from our oil, natural gas and NGL derivative contracts, respectively, for the year ended December 31, 2015 resulting from oil and natural gas prices being below the floor prices of most of our costless collar contracts and NGL prices being below the fixed prices of all of our swap contracts. Our realized net gain on derivatives was $5.0 million for the year ended December 31, 2014. We realized a net gain from our oil derivative contracts of approximately $5.2 million and a net gain of $0.5 million from our NGL derivative contracts for the year ended December 31, 2014 due to oil prices being below the floor prices of some of our oil costless collar contracts and NGL prices being below the fixed prices of some of our swap contracts, respectively, especially during the latter part of 2014. These gains were partially offset by a net loss of $0.7 million on our natural gas derivative contracts, due to natural gas prices being in excess of the ceiling prices of our natural gas costless collar contracts, especially in the early months of 2014. We realized an average gain of approximately $22.89 per Bbl hedged on all of our open oil costless collar contracts during the year ended December 31, 2015, as compared to an average gain of $2.00 per Bbl hedged for the year ended December 31, 2014. Our oil volumes hedged for the year ended December 31, 2015 were also 5% higher as compared to the year ended December 31, 2014. We realized an average gain of approximately $0.73 per MMBtu hedged on all of our open natural gas costless collar contracts during the year ended December 31, 2015, as compared to an average loss of approximately $0.06 per MMBtu hedged on all of our open natural gas costless collar contracts during the year ended December 31, 2014. Our total natural gas volumes hedged for the year ended December 31, 2015 were also 38% higher than the total natural gas volumes hedged for the year ended December 31, 2014.
Unrealized gain (loss) on derivatives. Our unrealized net loss on derivatives was approximately $39.3 million for the year ended December 31, 2015, as compared to an unrealized net gain of approximately $58.3 million for the year ended December 31, 2014. During the year ended December 31, 2015, the net fair value of our open oil, natural gas and NGL derivatives contracts decreased to approximately $16.3 million from $55.5 million for the year ended December 31, 2014, resulting in an unrealized net loss on derivatives of approximately $39.3 million for the year ended December 31, 2015. During the year ended December 31, 2015, the net fair value of our open oil, natural gas and NGL derivative contracts decreased by $31.9 million, $5.4 million and $1.9 million, respectively, due primarily to the realized gains from oil, natural gas and NGL derivative contracts settled during the year ended December 31, 2015.
62
Expenses
The following table summarizes our operating expenses and other income (expense) for the periods indicated.
Year Ended December 31, | ||||||||||||
2016 | 2015 | 2014 | ||||||||||
(In thousands, except expenses per BOE) | ||||||||||||
Expenses: | ||||||||||||
Production taxes, transportation and processing (1) | $ | 43,046 | $ | 35,650 | $ | 33,172 | ||||||
Lease operating (2) | 56,202 | 54,704 | 49,945 | |||||||||
Plant and other midstream services operating | 5,389 | 3,489 | 1,408 | |||||||||
Depletion, depreciation and amortization | 122,048 | 178,847 | 134,737 | |||||||||
Accretion of asset retirement obligations | 1,182 | 734 | 504 | |||||||||
Full-cost ceiling impairment | 158,633 | 801,166 | — | |||||||||
General and administrative | 55,089 | 50,105 | 32,152 | |||||||||
Total expenses | 441,589 | 1,124,695 | 251,918 | |||||||||
Operating (loss) income | (177,167 | ) | (806,662 | ) | 180,331 | |||||||
Other income (expense): | ||||||||||||
Net gain on asset sales and inventory impairment | 107,277 | 908 | — | |||||||||
Interest expense | (28,199 | ) | (21,754 | ) | (5,334 | ) | ||||||
Other (expense) income(3) | (4 | ) | 616 | 132 | ||||||||
Total other income (expense) | 79,074 | (20,230 | ) | (5,202 | ) | |||||||
(Loss) income before income taxes | (98,093 | ) | (826,892 | ) | 175,129 | |||||||
Total income tax (benefit) provision | (1,036 | ) | (147,368 | ) | 64,375 | |||||||
Net (income) loss attributable to non-controlling interest in subsidiaries | (364 | ) | (261 | ) | 17 | |||||||
Net (loss) income attributable to Matador Resources Company shareholders | $ | (97,421 | ) | $ | (679,785 | ) | $ | 110,771 | ||||
Expenses per BOE: | ||||||||||||
Production taxes, transportation and processing (1) | $ | 4.23 | $ | 3.91 | $ | 5.65 | ||||||
Lease operating (2) | $ | 5.52 | $ | 6.01 | $ | 8.51 | ||||||
Plant and other midstream services operating | $ | 0.53 | $ | 0.38 | $ | 0.24 | ||||||
Depletion, depreciation and amortization | $ | 11.99 | $ | 19.63 | $ | 22.95 | ||||||
General and administrative | $ | 5.41 | $ | 5.50 | $ | 5.48 | ||||||
________________
(1) | $0.1 million, or $0.01 per BOE, was reclassified to third-party midstream revenues for the year ended December 31, 2015, due to our midstream business becoming a reportable segment in the third quarter of 2016. There was no such reclassification made in 2014. |
(2) | $3.5 million, or $0.38 per BOE, and $1.4 million, or $0.24 per BOE, were reclassified to plant and other midstream services operating expenses for the years ended December 31, 2015 and 2014, respectively, due to our midstream business becoming a reportable segment in the third quarter of 2016. |
(3) | $1.7 million and $1.2 million were reclassified to midstream services revenues for the years ended December 31, 2015 and 2014, respectively, due to our midstream business becoming a reportable segment in the third quarter of 2016. |
Year Ended December 31, 2016 as Compared to Year Ended December 31, 2015
Production taxes, transportation and processing. Our production taxes, transportation and processing expenses increased $7.4 million to $43.0 million, an increase of 21%, for the year ended December 31, 2016, as compared to $35.7 million for the year ended December 31, 2015. On a unit-of-production basis, our production taxes, transportation and processing expenses increased 8% to $4.23 per BOE for the year ended December 31, 2016, as compared to $3.91 per BOE for the year ended December 31, 2015. The increase in production taxes, transportation and processing expenses was primarily attributable to higher transportation and processing expenses of $26.5 million for the year ended December 31, 2016, as compared to transportation and processing expenses of $22.4 million for the year ended December 31, 2015. This increase of $4.1 million was primarily due to the increase in natural gas production in the Delaware Basin as a percentage of our total natural gas production for the year ended December 31, 2016, as compared to the year ended December 31, 2015. Natural gas transportation and processing expenses are higher in the Delaware Basin, as compared to the Eagle Ford shale, as the natural gas gathering and processing infrastructure has yet to meet the demand for these services due to the increased drilling activity in the Delaware Basin over the last few years. We have begun to incur lower processing expenses for most of the natural gas produced in our Rustler Breaks asset area in Eddy County, New Mexico due to the start up in late August 2016 of the Black River Processing Plant, and we expect to fully realize the impact of these lower processing expenses once the plant is operational for an entire year.
63
Our production taxes increased $3.4 million to $16.6 million for the year ended December 31, 2016, as compared to $13.2 million for the year ended December 31, 2015, primarily due to the 5% increase in oil and natural gas revenues for the year ended December 31, 2016, as compared to the year ended December 31, 2015. In addition to the increase in production taxes attributable to the 5% increase in oil and natural gas revenues, the production tax rates in New Mexico are higher than production tax rates in Texas. As more of our oil and natural gas production shifts from Texas to New Mexico, we expect to continue to experience increased production tax expenses.
Lease operating expenses. Our lease operating expenses increased $1.5 million to $56.2 million, an increase of 3%, for the year ended December 31, 2016, as compared to $54.7 million for the year ended December 31, 2015. Our lease operating expenses per unit of production decreased 8% to $5.52 per BOE for the year ended December 31, 2016, as compared to $6.01 per BOE for the year ended December 31, 2015. Our total oil and natural gas production increased 12% to approximately 10.2 million BOE for the year ended December 31, 2016 from approximately 9.1 million BOE for the year ended December 31, 2015. The decrease achieved in lease operating expenses on a unit-of-production basis was primarily attributable to several key factors, including (i) decreased field supervisory costs as a number of third-party contractors became full-time employees during the second quarter of 2016, (ii) decreased costs associated with our Eagle Ford operations, including supervisory, salt water disposal and chemical costs and (iii) increased oil equivalent production as compared to the year ended December 31, 2015. This decrease was partially offset by (x) increased salt water disposal costs attributable to increased operations in the Rustler Breaks asset area and (y) increased workover expenses in the Wolf asset area.
Plant and other midstream services operating. Our plant and other midstream services operating expenses increased $1.9 million to $5.4 million, an increase of 54%, for the year ended December 31, 2016, as compared to $3.5 million for the year ended December 31, 2015. This increase was primarily attributable to the expenses associated with our salt water disposal operations of $3.6 million for the year ended December 31, 2016, as compared to $2.2 million for the year ended December 31, 2015. The remaining increase was primarily attributable to expenses associated with the Black River Processing Plant that began operating in August 2016.
Depletion, depreciation and amortization. Our depletion, depreciation and amortization expenses decreased $56.8 million to $122.0 million, a decrease of 32%, for the year ended December 31, 2016, as compared to $178.8 million for the year ended December 31, 2015. On a unit-of-production basis, our depletion, depreciation and amortization expenses decreased 39% to $11.99 per BOE for the year ended December 31, 2016, as compared to $19.63 per BOE for the year ended December 31, 2015. The decrease in our total depletion, depreciation and amortization expenses resulted primarily from (i) higher total proved reserves of 105.8 million BOE, or an increase of 24%, at December 31, 2016, as compared to total proved reserves of 85.1 million BOE at December 31, 2015, (ii) the decreased cost on a unit-of-production basis associated with wells drilled in 2016, as compared to prior periods and (iii) the decrease in unamortized property costs resulting from the full-cost ceiling impairments recorded in 2015 and 2016. This increase in total proved oil and natural gas reserves was primarily attributable to the continued delineation and development of our acreage in the Delaware Basin.
Full-cost ceiling impairment. Due primarily to the continued decline in oil and natural gas prices during the first half of 2016, the net capitalized costs of our oil and natural gas properties less related deferred income taxes exceeded the cost center ceiling. As a result, we recorded an impairment charge of $158.6 million, exclusive of tax effect, for the year ended December 31, 2016 to our net capitalized costs. This charge is reflected in our statement of operations for the year ended December 31, 2016, with the related deferred income tax credit recorded net of a valuation allowance. These full-cost impairment charges for the year ended December 31, 2016 were realized in the first two quarters of the year. Since that time, oil and natural gas prices have improved and as a result, no full-cost ceiling impairment charges were recorded in the third and fourth quarters of 2016.
Due primarily to the sharp decline in oil and natural gas prices during 2015, at December 31, 2015, the net capitalized costs of our oil and natural gas properties less related deferred income taxes exceeded the cost center ceiling. As a result, we recorded an impairment charge of $801.2 million, exclusive of tax effect, to our net capitalized costs. This charge is reflected in our statement of operations for the year ended December 31, 2015, with the related deferred income tax credit recorded net of a valuation allowance.
General and administrative. Our general and administrative expenses increased $5.0 million to $55.1 million, an increase of 10%, for the year ended December 31, 2016, as compared to $50.1 million for the year ended December 31, 2015. The increase in our general and administrative expenses was primarily attributable to increased payroll expenses associated with additional employees joining the Company during the year ended December 31, 2016 to support our increased land, geoscience, drilling, completion, production, midstream, accounting and administration functions as a result of the continued growth of the Company. The remaining increase is largely due to a $2.9 million increase in non-cash stock-based compensation expense to $12.4 million for the year ended December 31, 2016, as compared to $9.5 million for the year ended December 31, 2015. The increase in our non-cash stock-based compensation expense was attributable to the increased expense related to the continued vesting of awards granted from 2012 through 2016. Our general and administrative expenses decreased 2% on a unit-
64
of-production basis to $5.41 per BOE for the year ended December 31, 2016, as compared to $5.50 per BOE for the year ended December 31, 2015.
Net gain on asset sales and inventory impairment. We recorded a net gain of $107.3 million on asset sales and inventory impairment for the year ended December 31, 2016, as compared to $0.9 million for the year ended December 31, 2015. On October 1, 2015, we completed the sale of our wholly-owned subsidiary that owned the Loving County Processing System to EnLink. The Loving County Processing System included the Wolf Processing Plant and approximately six miles of high pressure gathering pipeline that connects our natural gas gathering system to the Wolf Processing Plant.
Pursuant to the terms of the transaction, EnLink paid approximately $143.4 million and we received net proceeds of approximately $139.8 million, after deducting customary purchase price adjustments of approximately $3.6 million. Due to the terms of the Wolf Gathering Agreement, the transaction was accounted for as a sale and leaseback transaction; the carrying value of the net assets sold of approximately $31.0 million was removed from the consolidated balance sheet as of December 31, 2015 and the resulting difference of approximately $108.4 million between the net proceeds received less closing costs of $0.4 million and the basis of the assets sold was recorded as a deferred gain on plant sale and was to be recognized as a gain on asset sales over the 15-year term of the gathering and processing agreement. See Note 13 to the consolidated financial statements in this Annual Report for more information on this agreement.
During the fourth quarter of 2016, EnLink completed construction of another processing plant in Loving County, Texas. Upon completion and successful testing of the new plant, EnLink began processing our natural gas at the new plant. As such, the gathering and processing agreement is no longer considered a lease, and accordingly the Company recognized the remaining unamortized gain on the sale of $107.3 million in the consolidated statement of operations for the year ended December 31, 2016.
Interest expense. For the year ended December 31, 2016, we incurred total interest expense of approximately $31.9 million. We capitalized approximately $3.7 million of our interest expense on certain qualifying projects for the year ended December 31, 2016 and expensed the remaining $28.2 million to operations. For the year ended December 31, 2015, we incurred total interest expense of approximately $25.7 million. We capitalized approximately $3.9 million of our interest expense on certain qualifying projects for the year ended December 31, 2015 and expensed the remaining $21.8 million to operations. The increase in total interest expense of $6.2 million for the year ended December 31, 2016, as compared to the year ended December 31, 2015, was attributable to an increase in both the average debt outstanding and the coupon rate of 6.875% for the senior notes issued in 2015 and late 2016, as compared to the lower effective interest rates incurred on borrowings under our Credit Agreement. In December 2016, we used a portion of the net proceeds from the December 2016 senior notes and equity offerings to repay a total of $120.0 million of outstanding borrowings under our Credit Agreement. At December 31, 2016, we had no outstanding borrowings under our Credit Agreement, $0.8 million in outstanding letters of credit and $575.0 million in outstanding senior notes. Due to the higher coupon rate on the senior notes as compared to the interest rates under the Credit Agreement, we expect to incur increased interest expense in future periods.
Total income tax (benefit) provision. Our deferred tax assets exceeded our deferred tax liabilities at December 31, 2016 due to the deferred tax amounts generated by the full-cost ceiling impairment charges recorded in 2016 and 2015. As a result, we established a valuation allowance against the deferred tax assets beginning in the third quarter of 2015. We retained a full valuation allowance at December 31, 2016 due to uncertainties regarding the future realization of our deferred tax assets. The current tax benefit of $1.0 million for the year ended December 31, 2016 was primarily attributable to a refund due from the Internal Revenue Service. The total income tax expense for the year ended December 31, 2016 differed from amounts computed by applying the U.S. federal statutory tax rate to the pre-tax loss due primarily to the recording of a valuation allowance against the net deferred tax asset position as a result of the full-cost ceiling impairments recorded for the years ended December 31, 2016 and 2015.
Year Ended December 31, 2015 as Compared to Year Ended December 31, 2014
Production taxes, transportation and processing. Our production taxes, transportation and processing expenses increased by $2.5 million to $35.7 million, an increase of 7%, for the year ended December 31, 2015, as compared to $33.2 million for the year ended December 31, 2014. On a unit-of-production basis, however, our production taxes and marketing expenses decreased by 31% to $3.91 per BOE for the year ended December 31, 2015, as compared to $5.65 per BOE for the year ended December 31, 2014. The increase in production taxes, transportation and processing expenses on an absolute basis was primarily attributable to higher natural gas transportation and processing expenses of $22.4 million for the year ended December 31, 2015, as compared to natural gas transportation and processing expenses of $15.2 million for the year ended December 31, 2014, an increase of $7.2 million, due to the 81% increase in our natural gas production to 27.7 Bcf for the year ended December 31, 2015, as compared to 15.3 Bcf of natural gas production for the year ended December 31, 2014. This increase was partially offset by a decrease in our production taxes of $4.8 million to $13.2 million for the year ended December
65
31, 2015, as compared to $18.0 million for the year ended December 31, 2014, primarily due to the 30% decrease in oil revenues for the year ended December 31, 2015, as compared to the year ended December 31, 2014.
Lease operating expenses. Our lease operating expenses increased by $4.8 million to $54.7 million, an increase of 10%, for the year ended December 31, 2015, as compared to $49.9 million for the year ended December 31, 2014. Our lease operating expenses per unit of production decreased 29% to $6.01 per BOE for the year ended December 31, 2015, as compared to $8.51 per BOE for the year ended December 31, 2014. Our total oil and natural gas production increased 55% to approximately 9.1 million BOE for the year ended December 31, 2015 from approximately 5.9 million BOE for the year ended December 31, 2014, including an increase of 35% in oil production to approximately 4.5 million Bbl for the year ended December 31, 2015, as compared to just over 3.3 million Bbl for the year ended December 31, 2014, which would typically result in higher lease operating expenses. Oil production was 49% of total production by volume for the year ended December 31, 2015, as compared to 57% of total production by volume for the year ended December 31, 2014. The decrease achieved in lease operating expenses on a unit-of-production basis was primarily attributable to several key factors, including (i) no clean-out operations on offsetting producing wells as a result of fracturing operations on newly drilled Eagle Ford shale wells as compared to the same period in 2014, (ii) a decrease in salt water disposal costs on a per barrel basis, particularly in the Delaware Basin, (iii) reduced service costs impacting lease operating expenses and (iv) a higher percentage of natural gas production, including a significant increase in Haynesville natural gas production, which typically has lower operating costs due to its lack of associated oil and water production. A joint venture controlled by us drilled, completed and began injecting salt water into a new disposal well in the Wolf asset area in Loving County, Texas in January 2015, which reduced salt water disposal costs in this area. A second salt water disposal well was drilled and tested in the Wolf asset area and began disposing of salt water in the fourth quarter of 2015. At December 31, 2015, this well was operating with temporary facilities, but it became fully operational with permanent facilities in the first quarter of 2016.
Plant and other midstream services operating. Our plant and other midstream services operating expenses increased by $2.1 million to $3.5 million, an increase of 148%, for the year ended December 31, 2015, as compared to $1.4 million for the year ended December 31, 2014. This increase was primarily attributable to the expenses associated with our salt water disposal facilities in our Wolf asset area, which began operations in early 2015.
Depletion, depreciation and amortization. Our depletion, depreciation and amortization expenses increased by $44.1 million to $178.8 million, an increase of 33%, for the year ended December 31, 2015, as compared to $134.7 million for the year ended December 31, 2014. On a unit-of-production basis, however, our depletion, depreciation and amortization expenses decreased 15% to $19.63 per BOE for the year ended December 31, 2015, as compared to $22.95 per BOE for the year ended December 31, 2014. The absolute increase in our depletion, depreciation and amortization expenses reflected an increase of 55% in our total oil and natural gas production to 9.1 million BOE for the year ended December 31, 2015 from 5.9 million BOE for the year ended December 31, 2014. The 15% decrease in the per-unit-of-production depletion, depreciation and amortization expenses resulted from the 24% increase in total proved oil and natural gas reserves from 68.7 million BOE at December 31, 2014 to 85.1 million BOE at December 31, 2015, which reserves were added at a lower cost per BOE, as well as from the decrease in unamortized property costs resulting from the full-cost ceiling impairments recorded in 2015.
Full-cost ceiling impairment. Due primarily to the sharp decline in oil and natural gas prices during 2015, at December 31, 2015, the net capitalized costs of our oil and natural gas properties less related deferred income taxes exceeded the cost center ceiling. As a result, we recorded an impairment charge of $801.2 million, exclusive of tax effect, to our net capitalized costs. This charge is reflected in our statement of operations for the year ended December 31, 2015, with the related deferred income tax credit recorded net of a valuation allowance. No impairment to the net carrying value of our oil and natural gas properties and no corresponding charge resulting from a full-cost ceiling impairment was recorded during the year ended December 31, 2014.
General and administrative. Our general and administrative expenses increased by $18.0 million to $50.1 million, an increase of 56%, for the year ended December 31, 2015, as compared to $32.2 million for the year ended December 31, 2014. The increase in our general and administrative expenses was primarily attributable to increased payroll expenses associated with additional personnel joining the Company during the year ended December 31, 2015 to support our increased land, geoscience, drilling, completion, production, accounting and administration functions, including the addition of 29 new employees in Roswell, New Mexico as a result of the HEYCO Merger in late February 2015. The remaining increase is largely due to a $4.0 million increase in non-cash stock-based compensation expense to $9.5 million for the year ended December 31, 2015, as compared to $5.5 million for the year ended December 31, 2014. The increase in our non-cash stock-based compensation expense was attributable to the increased expense related to the continued vesting of awards granted from 2012 through 2015 of $9.5 million for the year ended December 31, 2015, as compared to $5.3 million for the year ended December 31, 2014. This increase was partially offset by the decreased expense related to our liability-based stock options of $0.1 million for the year ended December 31, 2015, as compared to $0.2 million for the year ended December 31, 2014. This decreased expense related to our liability-based stock options was attributable to the slight decrease in our stock price from $20.23 per
66
share at December 31, 2014 to $19.77 per share at December 31, 2015. Our general and administrative expenses increased by less than 1% on a unit-of-production basis to $5.50 per BOE for the year ended December 31, 2015, as compared to $5.48 per BOE for the year ended December 31, 2014.
Interest expense. For the year ended December 31, 2015, we incurred total interest expense of approximately $25.7 million. We capitalized approximately $3.9 million of our interest expense on certain qualifying projects for the year ended December 31, 2015 and expensed the remaining $21.8 million to operations. For the year ended December 31, 2014, we incurred total interest expense of approximately $8.2 million. We capitalized approximately $2.8 million of our interest expense on certain qualifying projects for the year ended December 31, 2014 and expensed the remaining $5.3 million to operations. The increase in total interest expense of $17.5 million for the year ended December 31, 2015, as compared to the year ended December 31, 2014, was attributable to an increase in both the average debt outstanding and the interest rate of 6.875% under the senior notes in 2015, as compared to the effective interest rate of approximately 3.3% under our Credit Agreement in 2014. In late April 2015, we used a portion of the net proceeds from the April 2015 senior notes and equity offerings to repay a total of $465.0 million of outstanding borrowings under our Credit Agreement. At December 31, 2015, we had no outstanding borrowings under our Credit Agreement, $0.6 million in outstanding letters of credit and $400.0 million in outstanding senior notes.
Total income tax (benefit) provision. At December 31, 2015, our deferred tax assets exceeded our deferred tax liabilities and, as a result, we recorded a valuation allowance of $154.3 million against the deferred tax assets. The total income tax expense for the year ended December 31, 2015 differed from amounts computed by applying the U.S. federal statutory tax rates to the pre-tax loss due primarily to the recording of a valuation allowance against the net deferred tax asset position as a result of the full-cost ceiling impairment recorded for the year ended December 31, 2015. We recorded a total income tax benefit of $147.4 million for the year ended December 31, 2015. The total income tax benefit of $147.4 million for the year ended December 31, 2015 is comprised of a current tax expense of $3.0 million, which represented our estimated alternative minimum tax (“AMT”) liability, and a deferred tax benefit of $150.3 million. For the year ended December 31, 2014, we incurred an estimated AMT liability of $0.1 million, which represented the current portion of the income tax provision. The remaining income tax provision of $64.2 million represented deferred taxes for the year ended December 31, 2014. Our effective tax rate for the year ended December 31, 2014 was 36.8%. Total income tax expense for the year ended December 31, 2014 differed from amounts computed by applying the U.S. federal statutory tax rates to pre-tax income due primarily due to the impact of permanent differences between book and taxable income.
Liquidity and Capital Resources
Our primary use of capital has been, and we expect will continue to be during 2017 and for the foreseeable future, for the acquisition, exploration and development of oil and natural gas properties and for midstream investments. Excluding any possible significant acquisitions, we expect to fund our capital expenditure requirements through 2017 through a combination of cash on hand, operating cash flows, proceeds we received in connection with the formation of the Joint Venture and borrowings under our Credit Agreement (assuming availability under our borrowing base). We continually evaluate other capital sources, including borrowings under additional credit arrangements, the sale or joint venture of midstream assets or oil and natural gas producing assets or acreage, particularly in our non-core asset areas, as well as potential issuances of equity, debt or convertible securities, none of which may be available on satisfactory terms or at all. Our future success in growing proved reserves and production will be highly dependent on our ability to access outside sources of capital and to generate operating cash flows.
At December 31, 2016, we had cash totaling approximately $212.9 million and restricted cash totaling approximately $1.3 million. Restricted cash represents cash held by our less-than-wholly-owned subsidiaries. By contractual agreement, the cash in the accounts held by our less-than-wholly-owned subsidiaries is not to be commingled with other Company cash and is to be used only to fund the capital expenditures and operations of these less-than-wholly-owned subsidiaries.
On October 31, 2016, the lenders party to our Credit Agreement increased our borrowing base from $300.0 million to $400.0 million. At December 31, 2016 and February 22, 2017, the borrowing base under our Credit Agreement remained $400.0 million. At both dates, we had no outstanding borrowings and approximately $0.8 million in outstanding letters of credit under the Credit Agreement, and we had $575.0 million of outstanding senior notes.
On March 11, 2016, we completed a public offering of 7,500,000 shares of common stock (the “March Equity Offering”). After deducting offering costs totaling approximately $0.8 million, we received net proceeds of approximately $141.5 million. We used the net proceeds for general corporate purposes, including to fund a portion of our capital expenditures.
On December 9, 2016, we completed a public offering of 6,000,000 shares of common stock (the “December Equity Offering” and, together with the March Equity Offering, the “2016 Equity Offerings”). After deducting offering costs totaling approximately $0.4 million, we received net proceeds of approximately $145.8 million.
67
On December 9, 2016, we issued $175.0 million of 6.875% senior notes due 2023 (the “Additional Notes”) in a private placement (the “Notes Offering”). The Additional Notes were issued pursuant to the same indenture governing the Company’s original senior notes issued in April 2015 and were issued at 105.5% of par, plus accrued interest from October 15, 2016, resulting in an effective interest rate of 5.5%. We received net proceeds from the Notes Offering of approximately $181.5 million, including the issue premium, but after deducting the initial purchasers’ discounts and estimated offering expenses and excluding accrued interest paid by buyers of the Additional Notes. The Additional Notes are our senior unsecured obligations. The Additional Notes mature on April 15, 2023, and interest is payable semi-annually in arrears on April 15 and October 15 of each year.
We have used a portion of the net proceeds from the Notes Offering and the December Equity Offering to fund the aggregate purchase price for certain leasehold and mineral acquisitions (some of which closed in January and February 2017) and further development of our midstream assets, to repay $120.0 million in outstanding borrowings under our Credit Agreement and for general corporate purposes, including capital expenditures associated with the addition of a fourth drilling rig.
On February 17, 2017, we announced the formation of San Mateo, a strategic joint venture with a subsidiary of Five Point to operate and expand our Delaware Midstream Assets. We received $171.5 million in connection with the formation of the Joint Venture and may earn up to an additional $73.5 million in performance incentives over the next five years. We continue to operate the Delaware Midstream Assets and retain operational control of the Joint Venture. The Company and Five Point own 51% and 49% of the Joint Venture, respectively. San Mateo will continue to provide firm capacity service to us at market rates, while also being a midstream service provider to third parties in and around our Wolf and Rustler Breaks asset areas.
We expect that development of our Delaware Basin assets will be the primary focus of our operations and capital expenditures in 2017. We plan to operate four contracted drilling rigs in the Delaware Basin during the first quarter of 2017 and expect to add a fifth drilling rig in the Delaware Basin in the second quarter of 2017. Our 2017 estimated capital expenditure budget consists of $370 to $390 million for drilling, completions, facilities and infrastructure and $56 to $64 million for midstream capital expenditures, which represents our 51% share of an estimated 2017 capital expenditure budget of $110 to $125 million for San Mateo. Substantially all of our 2017 estimated capital expenditures will be allocated to the further delineation and development of our growing leasehold position and midstream assets in the Delaware Basin, with the exception of amounts allocated to limited operations in the Eagle Ford and Haynesville shales to maintain and extend leases and to participate in certain non-operated well opportunities. Our 2017 Delaware Basin drilling program will focus on the continued development of the Wolf and Rustler Breaks asset areas and the further delineation and development of the Jackson Trust, Ranger/Arrowhead and Twin Lakes asset areas, although we do anticipate continuing to delineate previously untested zones in the Wolf and Rustler Breaks asset areas during 2017.
We intend to continue acquiring acreage and mineral interests, principally in the Delaware Basin, during 2017. These expenditures are opportunity-specific and per-acre prices can vary significantly based on the prospect. As a result, it is difficult to estimate these 2017 capital expenditures with any degree of certainty; therefore, we have not provided estimated capital expenditures related to acreage and mineral acquisitions for 2017.
From January 1 through February 22, 2017, we acquired approximately 13,900 gross (8,200 net) leasehold and mineral acres and approximately 1,000 BOE per day of related production from various lessors and other operators, mostly in and around our existing acreage in the Delaware Basin. As noted above, some of this acreage and a portion of the production included properties identified at the time of the Notes Offering and the December Equity Offering. These transactions were pending at the time of those offerings and closed subsequent to December 31, 2016, bringing our total Permian Basin acreage position at February 22, 2017 to 177,600 gross (101,400 net) acres, almost all of which was located in the Delaware Basin. We have incurred capital expenditures of approximately $111 million since January 1, 2017 to acquire leasehold and mineral interests and the related production.
Our 2017 capital expenditures may be adjusted as business conditions warrant and the amount, timing and allocation of such expenditures is largely discretionary and within our control. The aggregate amount of capital we will expend may fluctuate materially based on market conditions, the actual costs to drill, complete and place on production operated or non-operated wells, our drilling results, the actual costs and scope of our midstream activities, including the expansion of the Black River Processing Plant, the ability of our Joint Venture partner to meet its capital obligations, other opportunities that may become available to us and our ability to obtain capital. When oil or natural gas prices decline, or costs increase significantly, we have the flexibility to defer a significant portion of our capital expenditures until later periods to conserve cash or to focus on projects that we believe have the highest expected returns and potential to generate near-term cash flows. We routinely monitor and adjust our capital expenditures in response to changes in prices, availability of financing, drilling, completion and acquisition costs, industry conditions, the timing of regulatory approvals, the availability of rigs, success or lack of success in our exploration and development activities, contractual obligations, drilling plans for properties we do not operate and other factors both within and outside our control.
68
Exploration and development activities are subject to a number of risks and uncertainties, which could cause these activities to be less successful than we anticipate. A significant portion of our anticipated cash flows from operations for 2017 is expected to come from producing wells and development activities on currently proved properties in the Wolfcamp and Bone Spring plays in the Delaware Basin, the Eagle Ford shale in South Texas and the Haynesville shale in Louisiana. Our existing wells may not produce at the levels we are forecasting and our exploration and development activities in these areas may not be as successful as we anticipate. Additionally, our anticipated cash flows from operations are based upon current expectations of oil and natural gas prices for 2017 and the hedges we currently have in place. We use commodity derivative financial instruments at times to mitigate our exposure to fluctuations in oil, natural gas and natural gas liquids prices and to partially offset reductions in our cash flows from operations resulting from declines in commodity prices. As of February 22, 2017, we had approximately 70% of our anticipated oil production and approximately 50% of our anticipated natural gas production hedged for 2017. We have no hedges in place for natural gas liquids and no hedges in place for natural gas beyond 2017; however, we have a portion of our anticipated oil production volumes hedged in 2018. See Note 8 to the consolidated financial statements in this Annual Report for a summary of our open derivative financial instruments at December 31, 2016. See “Risk Factors — Our Exploration, Development and Exploitation Projects Require Substantial Capital Expenditures That May Exceed Our Cash Flows from Operations and Potential Borrowings, and We May Be Unable to Obtain Needed Capital on Satisfactory Terms, Which Could Adversely Affect Our Future Growth,” “Risk Factors — Drilling for and Producing Oil and Natural Gas Are Highly Speculative and Involve a High Degree of Operational and Financial Risk, with Many Uncertainties That Could Adversely Affect Our Business” and “Risk Factors — Our Identified Drilling Locations Are Scheduled over Several Years, Making Them Susceptible to Uncertainties That Could Materially Alter the Occurrence or Timing of Their Drilling.”
Our cash flows for the years ended December 31, 2016, 2015 and 2014 are presented below.
Year Ended December 31, | ||||||||||||
2016 | 2015 | 2014 | ||||||||||
(In thousands) | ||||||||||||
Net cash provided by operating activities | $ | 134,086 | $ | 208,535 | $ | 251,481 | ||||||
Net cash used in investing activities | (405,640 | ) | (425,154 | ) | (570,531 | ) | ||||||
Net cash provided by financing activities | 467,706 | 224,944 | 321,170 | |||||||||
Net change in cash | $ | 196,152 | $ | 8,325 | $ | 2,120 | ||||||
Cash Flows Provided by Operating Activities
Net cash provided by operating activities decreased $74.4 million to $134.1 million for the year ended December 31, 2016, as compared to net cash provided by operating activities of $208.5 million for the year ended December 31, 2015. Excluding changes in operating assets and liabilities, net cash provided by operating activities decreased to $132.3 million for the year ended December 31, 2016 from $199.6 million for the year ended December 31, 2015. This decrease was primarily attributable to the decrease in our realized gain on derivatives, which declined by $67.8 million to $9.3 million for the year ended December 31, 2016, as compared to $77.1 million for the year ended December 31, 2015. Changes in our operating assets and liabilities between December 31, 2015 and December 31, 2016 also resulted in a net decrease of approximately $7.2 million in net cash provided by operating activities for the year ended December 31, 2016, as compared to the year ended December 31, 2015.
Net cash provided by operating activities decreased by $42.9 million to $208.5 million for the year ended December 31, 2015, as compared to net cash provided by operating activities of $251.5 million for the year ended December 31, 2014. Excluding changes in operating assets and liabilities, net cash provided by operating activities decreased to $199.6 million for the year ended December 31, 2015 from $257.5 million for the year ended December 31, 2014. This decrease was primarily attributable to the decrease in oil revenues from 2014 to 2015, resulting from a significantly lower weighted average oil price realized for the year ended December 31, 2015 of $45.27 per Bbl, as compared to $87.37 per Bbl realized for the year ended December 31, 2014. This decrease was partially offset by the increase of 35% in our oil production to approximately 4.5 million Bbl from just over 3.3 million Bbl during the respective periods. Changes in our operating assets and liabilities between December 31, 2014 and December 31, 2015 also resulted in a net increase of approximately $15.0 million in net cash provided by operating activities for the year ended December 31, 2015, as compared to the year ended December 31, 2014.
Our operating cash flows are sensitive to a number of variables, including changes in our production and the volatility of oil and natural gas prices between reporting periods. Regional and worldwide economic activity, the actions of OPEC, weather, infrastructure capacity to reach markets and other variable factors significantly impact the prices of oil and natural gas. These factors are beyond our control and are difficult to predict. We use commodity derivative financial instruments to mitigate our exposure to fluctuations in oil, natural gas and natural gas liquids prices. In addition, we attempt to avoid long-term service
69
agreements in order to minimize ongoing future commitments. For additional information on the impact of changing prices on our financial condition, see “Quantitative and Qualitative Disclosures About Market Risk.” See also “Risk Factors — Our Success Is Dependent on the Prices of Oil and Natural Gas. Low Oil or Natural Gas Prices and the Substantial Volatility in These Prices May Adversely Affect Our Financial Condition and Our Ability to Meet Our Capital Expenditure Requirements and Financial Obligations.”
Cash Flows Used in Investing Activities
Net cash used in investing activities decreased $19.5 million to $405.6 million for the year ended December 31, 2016 from $425.2 million for the year ended December 31, 2015. This decrease in net cash used in investing activities included (i) a decrease of $53.6 million in oil and natural gas properties capital expenditures for the year ended December 31, 2016, as compared to the year ended December 31, 2015, (ii) an increase of approximately $10.3 million in expenditures for other property and equipment, which includes the construction of the Black River Processing Plant and new pipeline infrastructure, (iii) a decrease in cash used for acquisitions as the HEYCO Merger occurred in 2015, (iv) a reduction in proceeds from sales of assets as the sale of the Loving County Processing System to EnLink occurred in 2015 and (v) a decrease in our restricted cash of $43.7 million attributable to the release from escrow of potential like-kind-exchange funds in connection with the sale of the Loving County Processing System to EnLink. Cash used for oil and natural gas properties capital expenditures for the year ended December 31, 2016 was primarily attributable to our operated and non-operated drilling and completion activities in the Delaware Basin, as well as the acquisition of additional acreage and mineral interests in the Delaware Basin.
Net cash used in investing activities decreased by $145.4 million to $425.2 million for the year ended December 31, 2015 from $570.5 million for the year ended December 31, 2014. This decrease in net cash used in investing activities included (i) a decrease of $128.1 million in our oil and natural gas properties capital expenditures for the year ended December 31, 2015, as compared to the year ended December 31, 2014, (ii) proceeds from the sale of the Loving County Processing System to EnLink of $139.8 million, (iii) an increase of approximately $55.3 million in expenditures for other property and equipment, which includes the Wolf Processing Plant and salt water disposal facilities we constructed in Loving County, Texas as well as initial costs associated with the Black River Processing Plant and new pipeline infrastructure, (iv) cash used in the HEYCO Merger of $24.0 million and (v) an increase in our restricted cash of $43.1 million attributable to the escrow account associated with potential like-kind-exchange transactions in connection with the sale of the Loving County Processing System to EnLink. Cash used for oil and natural gas properties capital expenditures for the year ended December 31, 2015 was primarily attributable to our operated and non-operated drilling and completion activities in the Delaware Basin, as well as to our operated and non-operated drilling activities in the Eagle Ford shale play and certain non-operated drilling activities in the Haynesville shale.
Cash Flows Provided by Financing Activities
Net cash provided by financing activities was $467.7 million for the year ended December 31, 2016, as compared to net cash provided by financing activities of $224.9 million for the year ended December 31, 2015. The net cash provided by financing activities for the year ended December 31, 2016 was primarily attributable to the total proceeds of the 2016 Equity Offerings of $288.5 million, the total proceeds of the Notes Offering of $184.6 million and borrowings under our Credit Agreement of $120.0 million, offset by the costs of the 2016 Equity Offerings of $0.8 million, the costs of the Notes Offering of $2.7 million, the repayment of $120.0 million in borrowings under our Credit Agreement in December 2016 and the payment of $1.9 million in taxes related to net share settlement of stock-based compensation.
Net cash provided by financing activities was $224.9 million for the year ended December 31, 2015, as compared to net cash provided by financing activities of $321.2 million for the year ended December 31, 2014. The net cash provided by financing activities for the year ended December 31, 2015 was primarily attributable to the total proceeds of our April 2015 public equity offering of $188.7 million, total proceeds of our April 2015 notes offering of $400.0 million, borrowings under our Credit Agreement of $125.0 million and capital contributed from the non-controlling interest owners in our less-than-wholly-owned subsidiaries of $0.6 million, offset by the costs of the equity offering of $1.2 million, the costs of the April 2015 notes offering of $9.6 million, the repayment of $477.0 million in borrowings under our Credit Agreement during the period and the payment of $1.6 million in taxes related to net share settlement of stock-based compensation.
Net cash provided by financing activities was $321.2 million for the year ended December 31, 2014. The net cash provided by financing activities for the year ended December 31, 2014 was primarily attributable to the total proceeds from our May 2014 public equity offering of $181.9 million and total borrowings of $320.0 million under our Credit Agreement during the period, offset by the costs of the offering of $0.6 million incurred during the period and by the repayment of $180.0 million in borrowings under our Credit Agreement during the period.
See Note 6 to the consolidated financial statements in this Annual Report for a summary of our debt, including our Credit Agreement and the senior notes.
70
Off-Balance Sheet Arrangements
From time-to-time, we enter into off-balance sheet arrangements and transactions that can give rise to material off-balance sheet obligations of the Company. As of December 31, 2016, the material off-balance sheet arrangements and transactions that we had entered into include (i) operating lease agreements, (ii) non-operated drilling commitments, (iii) termination obligations under drilling rig contracts, (iv) firm transportation, gathering, processing, disposal and fractionation commitments and (v) contractual obligations for which the ultimate settlement amounts are not fixed and determinable, such as derivative contracts that are sensitive to future changes in commodity prices or interest rates, gathering, treating, fractionation and transportation commitments on uncertain volumes of future throughput, open delivery commitments and indemnification obligations following certain divestitures. Other than the off-balance sheet arrangements described above, the Company has no transactions, arrangements or other relationships with unconsolidated entities or other persons that are reasonably likely to materially affect the Company’s liquidity or availability of or requirements for capital resources. See “—Obligations and Commitments” below and Note 13 to the consolidated financial statements in this Annual Report for more information regarding the Company’s off-balance sheet arrangements. Such information is incorporated herein by reference.
Obligations and Commitments
We had the following material contractual obligations and commitments at December 31, 2016.
Payments Due by Period | ||||||||||||||||||||
Total | Less Than 1 Year | 1-3 Years | 3-5 Years | More Than 5 Years | ||||||||||||||||
(In thousands) | ||||||||||||||||||||
Contractual Obligations: | ||||||||||||||||||||
Revolving credit borrowings, including letters of credit (1) | $ | 821 | $ | — | $ | — | $ | 821 | $ | — | ||||||||||
Senior unsecured notes (2) | 575,000 | — | — | — | 575,000 | |||||||||||||||
Office leases | 25,063 | 2,443 | 5,023 | 5,262 | 12,335 | |||||||||||||||
Non-operated drilling commitments (3) | 11,053 | 11,053 | — | — | — | |||||||||||||||
Drilling rig contracts (4) | 46,295 | 26,017 | 20,278 | — | — | |||||||||||||||
Asset retirement obligations | 20,641 | 915 | 982 | 558 | 18,186 | |||||||||||||||
Natural gas processing and transportation agreements (5) | 12,877 | 10,599 | 2,278 | — | — | |||||||||||||||
Total contractual cash obligations | $ | 691,750 | $ | 51,027 | $ | 28,561 | $ | 6,641 | $ | 605,521 | ||||||||||
__________________
(1) | At December 31, 2016, we had no borrowings outstanding under the Credit Agreement and approximately $0.8 million in outstanding letters of credit issued pursuant to the Credit Agreement. The Credit Agreement matures in October 2020. |
(2) | The amounts included in the table above represent principal maturities only. |
(3) | At December 31, 2016, we had outstanding commitments to participate in the drilling and completion of various non-operated wells. Our working interests in these wells are typically small, and certain of these wells were in progress at December 31, 2016. If all of these wells are drilled and completed, we will have minimum outstanding aggregate commitments for our participation in these wells of approximately $11.1 million at December 31, 2016, which we expect to incur within the next year. |
(4) | We do not own or operate our own drilling rigs, but instead we enter into contracts with third parties for such drilling rigs. See Note 13 to the consolidated financial statements in this Annual Report for more information regarding these contractual commitments. |
(5) | Effective September 1, 2012, we entered into a firm five-year natural gas processing and transportation agreement for a significant portion of our operated natural gas production in South Texas. Effective October 1, 2015, we entered into a 15-year fixed-fee natural gas gathering and processing agreement for a significant portion of our operated natural gas production in Loving County, Texas. See Note 13 to the consolidated financial statements in this Annual Report for more information regarding these contractual commitments. |
71
General Outlook and Trends
Our business success and financial results are dependent on many factors beyond our control, such as economic, political and regulatory developments, as well as competition from other sources of energy. Commodity price volatility, in particular, is a significant risk to our business and results of operations. Commodity prices are affected by changes in market supply and demand, which are impacted by overall economic activity, the actions of OPEC, weather, pipeline capacity constraints, inventory storage levels, oil and natural gas price differentials and other factors. Historically, the markets for oil, natural gas and natural gas liquids have been volatile and these markets will likely continue to be volatile in the future. Prices for oil, natural gas and natural gas liquids affect the cash flows available to us for capital expenditures and our ability to borrow and raise additional capital. Declines in oil, natural gas or natural gas liquids prices not only reduce our revenues, but could also reduce the amount of oil, natural gas and/or natural gas liquids that we can produce economically, and as a result, could have an adverse effect on our financial condition, results of operations, cash flows and reserves. From time to time, we use derivative financial instruments to mitigate our exposure to commodity price risk associated with oil, natural gas and natural gas liquids prices. Even so, decisions as to whether, at what price and what production volumes to hedge are difficult and depend on market conditions and our forecast of future production and oil, natural gas and natural gas liquids prices, and we may not always employ the optimal hedging strategy. This, in turn, may affect the liquidity that can be accessed through the borrowing base under our Credit Agreement and through the capital markets. See “Risk Factors — Our Success Is Dependent on the Prices of Oil and Natural Gas. Low Oil or Natural Gas Prices and the Substantial Volatility in These Prices May Adversely Affect Our Financial Condition and Our Ability to Meet Our Capital Expenditure Requirements and Financial Obligations.”
In 2016, oil and natural gas prices remained significantly below their most recent highs in 2014, although commodity prices did begin to improve in the latter half of 2016. Oil prices had increased to $54.06 per Bbl in late December 2016 from $37.04 on December 31, 2015, and natural gas prices had increased to $3.93 per MMBtu in late December 2016 from $2.34 per MMBtu on December 31, 2015. The sharp declines in oil and natural gas prices since late 2014 have impacted our revenues, profitability and cash flows in 2015 and 2016, as compared to 2014, and additional declines in oil and natural gas prices could have an adverse impact on our borrowing capacity, ability to obtain additional capital, revenues, profitability and cash flows. We are uncertain if oil and natural gas prices may continue to rise from their current levels, and in fact, oil and natural gas prices may decrease again in future periods.
For the year ended December 31, 2016, oil prices averaged $43.40 per Bbl, ranging from a high of $54.06 per Bbl in late December to a low of $26.21 per Bbl in mid-February, based upon the NYMEX West Texas Intermediate oil futures contract price for the earliest delivery date. We realized a weighted average oil price of $41.19 per Bbl ($42.34 per Bbl including realized gains from oil derivatives) for our oil production for the year ended December 31, 2016, as compared to $45.27 per Bbl ($59.13 per Bbl including realized gains from oil derivatives) for the year ended December 31, 2015. At February 24, 2017, the NYMEX West Texas Intermediate oil futures contract for the earliest delivery date had remained fairly steady, closing at $53.99 per Bbl, as compared to $32.15 per Bbl at February 24, 2016.
For the year ended December 31, 2016, natural gas prices averaged $2.55 per MMBtu, ranging from a high of approximately $3.93 per MMBtu in late December to a low of approximately $1.64 per MMBtu in early March, based upon the NYMEX Henry Hub natural gas futures contract price for the earliest delivery date. We realized a weighted average natural gas price of $2.66 per Mcf ($2.78 per Mcf including realized gains from natural gas derivatives) for our natural gas production for the year ended December 31, 2016, as compared to $2.71 per Mcf ($3.24 per Mcf including realized gains from natural gas and NGL derivatives) for the year ended December 31, 2015. At February 24, 2017, the NYMEX Henry Hub natural gas futures contract for the earliest delivery date had declined from late December, closing at $2.63 per MMBtu, as compared to $1.78 per MMBtu at February 24, 2016.
We expect that development of our Delaware Basin assets will be the primary focus of our operations and capital expenditures in 2017. We plan to operate four contracted drilling rigs in the Delaware Basin during the first quarter of 2017, with a fifth drilling rig added in the Delaware Basin in the second quarter of 2017. Our 2017 estimated capital expenditure budget consists of $370 to $390 million for drilling, completions, facilities and infrastructure and $56 to $64 million for midstream capital expenditures, which represents our 51% share of an estimated 2017 capital expenditure budget of $110 to $125 million for San Mateo. Substantially all of our 2017 estimated capital expenditures will be allocated to the further delineation and development of our growing leasehold position and midstream assets in the Delaware Basin, with the exception of amounts allocated to limited operations in the Eagle Ford and Haynesville shales to maintain and extend leases and to participate in certain non-operated well opportunities. Our 2017 Delaware Basin drilling program will focus on the continued development of the Wolf and Rustler Breaks asset areas and the further delineation and development of the Jackson Trust, Ranger/Arrowhead and Twin Lakes asset areas, although we do anticipate continuing to delineate previously untested zones in the Wolf and Rustler Breaks asset areas during 2017.
We intend to continue acquiring acreage and mineral interests, principally in the Delaware Basin, during 2017. These expenditures are opportunity-specific and per-acre prices can vary significantly based on the prospect. As a result, it is difficult
72
to estimate these 2017 capital expenditures with any degree of certainty; therefore, we have not provided estimated capital expenditures related to acreage and mineral acquisitions for 2017.
Coinciding with the recent improvements in oil and natural gas prices in late 2016, we have begun to experience price increases from our service providers for some of the products and services we use in our drilling, completion and production operations. If oil and natural gas prices remain at their current levels for a longer period of time or should they increase further, we would anticipate receiving additional price increases for drilling, completion and production products and services, although we can provide no assurances as to the eventual magnitude of these increases.
Like other oil and natural gas producing companies, our properties are subject to natural production declines. By their nature, our oil and natural gas wells will experience rapid initial production declines. We attempt to overcome these production declines by drilling to develop and identify additional reserves, by exploring for new sources of reserves and, at times, by acquisitions. During times of severe oil, natural gas and natural gas liquids price declines, however, drilling additional oil or natural gas wells may not be economical, and we may find it necessary to reduce capital expenditures and curtail drilling operations in order to preserve liquidity. A material reduction in capital expenditures and drilling activities could materially impact our production volumes, revenues, reserves, cash flows and our availability under our Credit Agreement. See “Risk Factors — Our Exploration, Development and Exploitation Projects Require Substantial Capital Expenditures That May Exceed Our Cash Flows from Operations and Potential Borrowings, and We May Be Unable to Obtain Needed Capital on Satisfactory Terms, Which Could Adversely Affect Our Future Growth.”
We strive to focus our efforts on increasing oil and natural gas reserves and production while controlling costs at a level that is appropriate for long-term operations. Our ability to find and develop sufficient quantities of oil and natural gas reserves at economical costs is critical to our long-term success. Future finding and development costs are subject to changes in the costs of acquiring, drilling and completing our prospects.
Critical Accounting Policies and Estimates
The preparation of financial statements in conformity with GAAP requires us to make estimates and assumptions that affect the reported amounts of certain assets, liabilities, revenues and expenses during each reporting period. We believe that our estimates and assumptions are reasonable and reliable, and believe that the actual results will not differ significantly from those reported; however, such estimates and assumptions are subject to a number of risks and uncertainties, and such risks and uncertainties could cause the actual results to differ materially from our estimates. We consider the following to be our most critical accounting policies and estimates involving significant judgment or estimates by our management. See Note 2 to the consolidated financial statements in this Annual Report for further details on our accounting policies at December 31, 2016. Such information is incorporated herein by reference.
Oil and Natural Gas Properties
We use the full-cost method of accounting for our investments in oil and natural gas properties. Under this method of accounting, all costs associated with the acquisition, exploration and development of oil and natural gas properties and reserves, including unproved and unevaluated property costs, are capitalized as incurred and accumulated in a single cost center representing our activities, which are undertaken exclusively in the United States. Such costs include lease acquisition costs, geological and geophysical expenditures, lease rentals on undeveloped properties, costs of drilling both productive and non-productive wells, capitalized interest on qualifying projects and general and administrative expenses directly related to acquisition, exploration and development activities, but do not include any costs related to production, selling or general corporate administrative activities.
Capitalized costs of oil and natural gas properties are amortized using the unit-of-production method based upon production and estimates of proved reserves quantities. Unproved and unevaluated property costs are excluded from the amortization base used to determine depletion. Unproved and unevaluated properties are assessed for possible impairment on a periodic basis based upon changes in operating or economic conditions. This assessment includes consideration of the following factors, among others: the assignment of proved reserves, geological and geophysical evaluations, intent to drill, remaining lease term and drilling activity and results. Upon impairment, the costs of the unproved and unevaluated properties are immediately included in the amortization base. Exploratory dry holes are included in the amortization base immediately upon the determination that the well is not productive.
Sales of oil and natural gas properties are accounted for as adjustments to net capitalized costs with no gain or loss recognized, unless such adjustments would significantly alter the relationship between net capitalized costs and proved reserves of oil and natural gas. All costs related to production activities and maintenance and repairs are expensed as incurred. Significant workovers that increase the properties’ reserves are capitalized.
73
Ceiling Test
The net capitalized costs of oil and natural gas properties are limited to the lower of unamortized costs less related deferred income taxes or the cost center “ceiling.” The cost center ceiling is defined as the sum of:
(a) the present value, discounted at 10%, of future net revenues of proved oil and natural gas reserves, reduced by the estimated costs of developing these reserves, plus
(b) unproved and unevaluated property costs not being amortized, plus
(c) the lower of cost or estimated fair value of unproved and unevaluated properties included in the costs being amortized, if any, less
(d) income tax effects related to the properties involved.
Any excess of our net capitalized costs above the cost center ceiling as described above is charged to operations as a full-cost ceiling impairment. The fair value of our derivative instruments is not included in the ceiling test computation as we do not designate these instruments as hedge instruments for accounting purposes.
The estimated present value of after-tax future net cash flows from proved oil and natural gas reserves is highly dependent upon the quantities of proved reserves, the estimation of which requires substantial judgment. The associated commodity prices and the applicable discount rate used in these estimates are in accordance with guidelines established by the SEC. Under these guidelines, oil and natural gas reserves are estimated using then-current operating and economic conditions, with no provision for price and cost escalations in future periods except by contractual arrangements. Future net revenues are calculated using prices that represent the arithmetic averages of the first-day-of-the-month oil and natural gas prices for the previous 12-month period and a 10% discount factor is used to determine the present value of future net revenues.
Because the cost center ceiling calculation is based on the average of historical prices, which may or may not be representative of future prices, and requires a 10% discount factor, the resulting estimated value may not be indicative of the fair market value of our properties. Any impairment related to the excess of our net capitalized costs above the resulting cost center ceiling should not be viewed as an absolute indicator of a reduction in the ultimate value of the related reserves.
Derivative Financial Instruments
From time to time, we use derivative financial instruments to mitigate our exposure to commodity price risk associated with oil, natural gas and natural gas liquids prices. These instruments typically consist of put and call options in the form of costless (or zero-cost) collars and swap contracts. Costless collars provide us with downside price protection through the purchase of a put option which is financed through the sale of a call option. Because the call option proceeds are used to offset the cost of the put option, these arrangements are initially “costless” to us. In the case of a costless collar, the put option and the call option have different fixed price components. In a swap contract, a floating price is exchanged for a fixed price over a specified period, providing downside price protection.
Prior to settlement, our derivative financial instruments are recorded on the balance sheet as either an asset or a liability measured at fair value. We have elected not to apply hedge accounting for our existing derivative financial instruments, and as a result, we recognize the change in derivative fair value between reporting periods currently in our consolidated statements of operations. Such changes in fair value are reported under Revenues as “Unrealized gain (loss) on derivatives.” Changes in the fair value of these open derivative financial instruments can have a significant impact on our reported results from period to period but do not impact our cash flows from operations, liquidity or capital resources. The fair value of our derivative financial instruments is determined using industry-standard models that consider various inputs including: (i) quoted forward prices for commodities, (ii) time value of money and (iii) current market and contractual prices for the underlying instruments, as well as other relevant economic measures.
Realized gains and realized losses from the settlement of derivative financial instruments do have a direct impact on our cash flow from operations and liquidity. The impact of these settlements is also reported under Revenues as “Realized gain (loss) on derivatives.”
Revenue Recognition
We follow the sales method of accounting for our oil, natural gas and natural gas liquids revenue, whereby we recognize revenue, net of royalties, on all oil, natural gas and natural gas liquids sold to purchasers regardless of whether the sales are proportionate to our ownership in the property. Under this method, revenue is recognized at the time the oil, natural gas and natural gas liquids are produced and sold, and we accrue for revenue earned but not yet received. We recognize midstream services revenues at the time services have been rendered and the price is fixed and determinable.
74
Stock-Based Compensation
We account for stock-based compensation in accordance with ASC 718. Since 2012, all stock option awards have been granted under the 2012 Long-Term Incentive Plan or, for awards granted after June 10, 2015, under the Amended and Restated 2012 Long-Term Incentive Plan, and all of these awards were equity instruments. We did not grant any stock option awards in 2011. Prior to 2011, all stock option awards were granted under our 2003 Stock and Incentive Plan, and since November 22, 2010, these awards have been accounted for as liability instruments. We used the fair value method to measure and recognize the liability associated with our outstanding liability-based stock options and to measure and recognize the equity associated with our equity-based stock options. Stock options typically vest over three or four years, and the associated compensation expense is recognized on a straight-line basis over the vesting period. Restricted stock and restricted stock units typically vest over a period of one to four years, and compensation expense is recognized on a straight line basis over the vesting period. As our shares were not publicly traded prior to February 2, 2012, prior to the beginning of 2016, we estimated the future volatility of our stock using the historical volatility of the common stock of a group of companies we consider to be a representative peer group. Beginning in 2016, we began using our own historical volatility to estimate the future volatility of our stock as we had four years of historical stock prices as a publicly traded company. Management believes that, beginning in 2016, our own average historical volatility rates are the best available indicator of future volatility.
We have adopted the “simplified method” as outlined in Staff Accounting Bulletin Topic 14 for estimating the expected term of awards. The risk free interest rate is the rate for constant yield U.S. Treasury securities with a term to maturity that is consistent with the expected term of the award.
Assumptions are reviewed each time new equity-based option awards are granted and quarterly for outstanding liability-based option awards. The assumptions used may be impacted by actual fluctuations in our stock price, movements in market interest rates and option terms. The use of different assumptions produces a different fair value for equity-based option awards and outstanding liability-based option awards and can significantly impact the amount of stock compensation expense recognized in our consolidated statement of operations. We use the Black Scholes Merton model to determine the fair value of service-based option awards and the Monte Carlo method to determine the fair value of option awards that contain a market condition. The fair value of restricted stock and restricted stock unit awards is recognized based on the fair value of our stock on the date of the grant. See Note 8 to the consolidated financial statements in this Annual Report for further details on our stock-based compensation at December 31, 2016. Such information is incorporated herein by reference.
Income Taxes
We account for income taxes using the asset and liability approach for financial accounting and reporting. The amount of income taxes recorded requires interpretations of complex rules and regulations of federal and state taxing authorities. We have recognized deferred tax assets and liabilities for temporary differences, operating losses and tax carryforwards. We evaluate the probability of realizing the future benefits of our deferred tax assets and provide a valuation allowance for the portion of any deferred tax assets where the likelihood of realizing an income tax benefit in the future does not meet the more likely than not criteria for recognition.
We account for uncertainty in income taxes by recognizing the financial statement benefit of a tax position only after determining that the relevant tax authority would more likely than not sustain the position following an audit. For tax positions meeting the more likely than not threshold, the amount recognized in the financial statements is the benefit that has a greater than 50% likelihood of being realized upon ultimate settlement with the relevant tax authority.
Oil and Natural Gas Reserves Quantities and Standardized Measure of Future Net Revenue
Our engineers and technical staff prepare our estimates of oil and natural gas reserves and associated future net revenues. While the applicable rules allow us to disclose proved, probable and possible reserves, we have elected to present only proved reserves in this Annual Report. The applicable rules define proved reserves as the quantities of oil and natural gas, which, by analysis of geoscience and engineering data, can be estimated with reasonable certainty to be economically producible — from a given date forward, from known reservoirs and under existing economic conditions, operating methods and government regulations — prior to the time at which contracts providing the right to operate expire, unless evidence indicates that renewal is reasonably certain, regardless of whether deterministic or probabilistic methods are used for the estimation. The project to extract the hydrocarbons must have commenced or the operator must be reasonably certain that it will commence the project within a reasonable time.
Our engineers and technical staff must make many subjective assumptions based on their professional judgment in developing reserves estimates. Reserves estimates are updated quarterly and consider recent production levels and other technical information about each well. Estimating oil and natural gas reserves is complex and is inexact because of the numerous uncertainties inherent in the process. The process relies on interpretations of available geological, geophysical, petrophysical, engineering and production data. The extent, quality and reliability of both the data and the associated interpretations can vary. The process also requires certain economic assumptions, including, but not limited to, oil and natural
75
gas prices, development expenditures, operating expenses, capital expenditures and taxes. Actual future production, oil and natural gas prices, revenues, taxes, development expenditures, operating expenses and quantities of recoverable oil and natural gas will most likely vary from our estimates. Accordingly, reserves estimates are generally different from the quantities of oil and natural gas that are ultimately recovered. Any significant variance could materially and adversely affect our future reserves estimates, financial condition, results of operations and cash flows. We cannot predict the amounts or timing of future reserves revisions. If such revisions are significant, they could significantly affect future amortization of capitalized costs and result in an impairment of assets that may be material. See “Risk Factors — Our Oil and Natural Gas Reserves Are Estimated and May Not Reflect the Actual Volumes of Oil and Natural Gas We Will Recover, and Significant Inaccuracies in These Reserves Estimates or Underlying Assumptions Will Materially Affect the Quantities and Present Value of Our Reserves.”
Recent Accounting Pronouncements
See Note 2 to the consolidated financial statements in this Annual Report for a description of recent accounting pronouncements.
Item 7A. Quantitative and Qualitative Disclosures about Market Risk.
We are exposed to a variety of market risks including commodity price risk, interest rate risk and counterparty and customer risk. We address these risks through a program of risk management including the use of derivative financial instruments, but we do not enter into derivative financial instruments for trading purposes.
Commodity price exposure. We are exposed to market risk as the prices of oil, natural gas and natural gas liquids fluctuate as a result of changes in supply and demand and other factors. To partially reduce price risk caused by these market fluctuations, we have entered into derivative financial instruments in the past and expect to enter into derivative financial instruments in the future to cover a significant portion of our anticipated future production.
We typically use costless (or zero-cost) collars and/or swap contracts to manage risks related to changes in oil, natural gas and natural gas liquids prices. Costless collars provide us with downside price protection through the purchase of a put option which is financed through the sale of a call option. Because the call option proceeds are used to offset the cost of the put option, these arrangements are initially “costless” to us. In the case of a costless collar, the put option and the call option have different fixed price components. In a swap contract, a floating price is exchanged for a fixed price over a specified period, providing downside price protection.
We record all derivative financial instruments at fair value. The fair value of our derivative financial instruments is determined using purchase and sale information available for similarly traded securities. At December 31, 2016, Comerica Bank, The Bank of Nova Scotia, BMO Harris Financing (Bank of Montreal), and SunTrust Bank (or affiliates thereof) were the counterparties for all of our derivative instruments. We have considered the credit standing of the counterparties in determining the fair value of our derivative financial instruments.
At December 31, 2016, we had entered into various costless collar contracts to mitigate our exposure to fluctuations in oil and natural gas prices, each with an established price floor and ceiling. For each calculation period, the specified price for determining the realized gain or loss to us pursuant to any oil contract is the arithmetic average of the settlement prices for the NYMEX West Texas Intermediate oil futures contract for the first nearby month corresponding to the calculation period’s calendar month, and for any natural gas contract is the settlement price for the NYMEX Henry Hub natural gas futures contract for the delivery month corresponding to the calculation period’s calendar month for the settlement date of that contract period.
When the settlement price is below the price floor established by one or more of these collars, we receive from our counterparty an amount equal to the difference between the settlement price and the price floor multiplied by the contract oil or natural gas volume. When the settlement price is above the price ceiling established by one or more of these collars, we pay our counterparty an amount equal to the difference between the settlement price and the price ceiling multiplied by the contract oil or natural gas volume.
See Note 11 to the consolidated financial statements in this Annual Report for a summary of our open derivative financial instruments at December 31, 2016. Such information is incorporated herein by reference.
Effect of Recent Derivatives Legislation. On July 21, 2010, President Obama signed into law the Dodd-Frank Wall Street Reform and Consumer Protection Act, or the Dodd-Frank Act, which is intended to modernize and protect the integrity of the U.S. financial system. The Dodd-Frank Act, among other things, establishes federal oversight and regulation of certain derivative products including commodity hedges of the type we use. The Dodd-Frank Act requires the Commodity Futures Trading Commission, or CFTC, and the SEC to promulgate rules and regulations implementing the Dodd-Frank Act. Although the CFTC has finalized certain of these regulations, others remain to be finalized or implemented and it is not possible at this time to predict when this will be accomplished. Based upon the limited assessments we are able to make with respect to the Dodd-Frank Act, there is the possibility that the Dodd-Frank Act could have a substantial and adverse impact on our ability to enter into and maintain these commodity hedges. In particular, the Dodd-Frank Act could result in the implementation of
76
position limits and additional regulatory requirements on our derivative arrangements, which could include new margin, reporting and clearing requirements. In addition, this legislation could have a substantial impact on our counterparties and may increase the cost of our derivative arrangements in the future. See “Risk Factors — The Derivatives Legislation Adopted by Congress Could Have an Adverse Impact on Our Ability to Hedge Risks Associated with Our Business.”
Interest rate risk. We do not and have not used interest rate derivatives to alter interest rate exposure in an attempt to reduce interest rate expense on existing debt since we borrowed under our Credit Agreement for the first time in December 2010. At December 31, 2016 we had no outstanding borrowings under our Credit Agreement and $575.0 million in senior notes outstanding at a coupon rate of 6.875% per annum. If we incur additional indebtedness in the future and at higher interest rates, we may use interest rate derivatives. Interest rate derivatives would be used solely to modify interest rate exposure and not to modify the overall leverage of the debt portfolio.
Counterparty and customer credit risk. Joint interest receivables arise from billing entities which own partial interests in the wells we operate. These entities participate in our wells primarily based on their ownership in leases on which we wish to drill. We have limited ability to control participation in our wells. We are also subject to credit risk due to concentration of our oil and natural gas receivables with several significant customers. The inability or failure of our significant customers to meet their obligations to us or their insolvency or liquidation may adversely affect our financial condition, results of operations and cash flows. In addition, our oil, natural gas and natural gas liquids derivative arrangements expose us to credit risk in the event of nonperformance by our counterparties.
While we do not require our customers to post collateral and we do not have a formal process in place to evaluate and assess the credit standing of our significant customers for oil and natural gas receivables and the counterparties on our derivative instruments, we do evaluate the credit standing of such counterparties as we deem appropriate under the circumstances. This evaluation requires us to conduct the due diligence necessary to determine credit terms and credit limits, which may include (i) reviewing a counterparty’s credit rating, latest financial information and, in the case of a customer with which we have receivables, its historical payment record and the financial ability of its parent company to make payment if the customer cannot and (ii) undertaking the due diligence necessary to determine credit terms and credit limits. The counterparties on our derivative financial instruments in place at February 22, 2017 were Comerica Bank, The Bank of Nova Scotia, BMO Harris Financing (Bank of Montreal), and SunTrust Bank (or affiliates thereof), which are lenders (or affiliates thereof) under our Credit Agreement, and we are likely to enter into any future derivative instruments with such banks or other lenders (or affiliates thereof) party to the Credit Agreement.
Impact of Inflation. Inflation in the United States has been relatively low in recent years and did not have a material impact on our results of operations for the years ended December 31, 2016, 2015 and 2014. Although the impact of inflation has been generally insignificant in recent years, it is still a factor in the U.S. economy and we tend to specifically experience inflationary pressure on the cost of oilfield services and equipment with increases in oil and natural gas prices and with increases in drilling activity in our areas of operations, including the Wolfcamp and Bone Spring plays in the Delaware Basin, the Eagle Ford shale play and the Haynesville shale play. See “Risk Factors — The Unavailability or High Cost of Drilling Rigs, Completion Equipment and Services, Supplies and Personnel, Including Hydraulic Fracturing Equipment and Personnel, Could Adversely Affect Our Ability to Establish and Execute Exploration and Development Plans within Budget and on a Timely Basis, Which Could Have a Material Adverse Effect on Our Financial Condition, Results of Operations and Cash Flows.”
Item 8. Financial Statements and Supplementary Data.
Our financial statements appear at the end of this Annual Report. See the index to the financial statements in Item 15.
Item 9. Changes in and Disagreements with Accountants on Accounting and Financial Disclosure.
Not applicable.
Item 9A. Controls and Procedures.
Evaluation of Disclosure Controls and Procedures
As of the end of the period covered by this Annual Report, we evaluated the effectiveness of the design and operation of the Company’s disclosure controls and procedures (as defined in Rule 13a-15(e) under the Exchange Act) under the supervision and with the participation of our management, including our Chief Executive Officer and our Chief Financial Officer. Based on that evaluation, our Chief Executive Officer and our Chief Financial Officer concluded that the Company’s disclosure controls and procedures were effective as of December 31, 2016 to ensure that (i) information required to be disclosed in the reports it files and submits under the Exchange Act is recorded, processed, summarized and reported within the time periods specified in
77
the SEC’s rules and forms and that (ii) information required to be disclosed under the Exchange Act is accumulated and communicated to the Company’s management, including our Chief Executive Officer and our Chief Financial Officer, as appropriate to allow timely decisions regarding required disclosure.
Changes in Internal Control over Financial Reporting
During the quarter ended December 31, 2016, there were no changes in our internal controls that have materially affected or are reasonably likely to have a material effect on our internal control over financial reporting.
Management’s Report on Internal Control over Financial Reporting
Our management is responsible for establishing and maintaining adequate internal control over financial reporting as defined in Rules 13a-15(f) and 15d-15(f) of the Exchange Act, as amended. Under the supervision and with the participation of our management, including our Chief Executive Officer and our Chief Financial Officer, we assessed the effectiveness of our internal control over financial reporting as of the end of the period covered by this Annual Report based on the framework in 2013 “Internal Control — Integrated Framework” issued by the Committee of Sponsoring Organizations of the Treadway Commission. Based on that assessment, our Chief Executive Officer and our Chief Financial Officer concluded that our internal control over financial reporting was effective to provide reasonable assurance regarding the reliability of our financial reporting and the preparation of our financial statements for external purposes in accordance with U.S. generally accepted accounting principles.
KPMG, our independent registered public accounting firm, has issued an attestation report on our controls over financial reporting as of December 31, 2016 as included herein.
Important Considerations
The effectiveness of our disclosure controls and procedures and our internal control over financial reporting is subject to various inherent limitations, including cost limitations, judgments used in decision making, assumptions about the likelihood of future events, the soundness of our systems, the possibility of human error and the risk of fraud. Moreover, projections of any evaluation of effectiveness to future periods are subject to the risk that controls may become inadequate because of changes in conditions and the risk that the degree of compliance with policies or procedures may deteriorate over time. Because of these limitations, there can be no assurance that any system of disclosure controls and procedures or internal control over financial reporting will be successful in preventing all errors or fraud or in making all material information known in a timely manner to the appropriate levels of management.
78
Report of Independent Registered Public Accounting Firm
The Board of Directors and Shareholders
Matador Resources Company:
We have audited Matador Resources Company’s (the “Company”) internal control over financial reporting as of December 31, 2016 based on criteria established in Internal Control - Integrated Framework (2013) issued by the Committee of Sponsoring Organizations of the Treadway Commission (COSO). The Company’s management is responsible for maintaining effective internal control over financial reporting and for its assessment of the effectiveness of internal control over financial reporting, included in the accompanying Management’s Report on Internal Control Over Financial Reporting. Our responsibility is to express an opinion on the Company’s internal control over financial reporting based on our audit.
We conducted our audit in accordance with the standards of the Public Company Accounting Oversight Board (United States). Those standards require that we plan and perform the audit to obtain reasonable assurance about whether effective internal control over financial reporting was maintained in all material respects. Our audit included obtaining an understanding of internal control over financial reporting, assessing the risk that a material weakness exists, and testing and evaluating the design and operating effectiveness of internal control based on the assessed risk. Our audit also included performing such other procedures as we considered necessary in the circumstances. We believe that our audit provides a reasonable basis for our opinion.
A company’s internal control over financial reporting is a process designed to provide reasonable assurance regarding the reliability of financial reporting and the preparation of financial statements for external purposes in accordance with generally accepted accounting principles. A company’s internal control over financial reporting includes those policies and procedures that (1) pertain to the maintenance of records that, in reasonable detail, accurately and fairly reflect the transactions and dispositions of the assets of the company; (2) provide reasonable assurance that transactions are recorded as necessary to permit preparation of financial statements in accordance with generally accepted accounting principles, and that receipts and expenditures of the company are being made only in accordance with authorizations of management and directors of the company; and (3) provide reasonable assurance regarding prevention or timely detection of unauthorized acquisition, use, or disposition of the company’s assets that could have a material effect on the financial statements.
Because of its inherent limitations, internal control over financial reporting may not prevent or detect misstatements. Also, projections of any evaluation of effectiveness to future periods are subject to the risk that controls may become inadequate because of changes in conditions, or that the degree of compliance with the policies or procedures may deteriorate.
In our opinion, the Company maintained, in all material respects, effective internal control over financial reporting as of December 31, 2016, based on criteria established in Internal Control - Integrated Framework (2013) issued by the Committee of Sponsoring Organizations of the Treadway Commission (COSO).
We also have audited, in accordance with the standards of the Public Company Accounting Oversight Board (United States), the consolidated balance sheets of the Company and subsidiaries as of December 31, 2016, 2015 and 2014, and the related consolidated statements of operations, changes in shareholders’ equity, and cash flows for each of the years in the three-year period ended December 31, 2016, and our report dated March 1, 2017 expressed an unqualified opinion on those consolidated financial statements.
/s/ KPMG LLP
Dallas, Texas
March 1, 2017
79
Item 9B. Other Information.
Not applicable.
PART III
Item 10. Directors, Executive Officers and Corporate Governance.
The information required in response to this Item 10 is incorporated herein by reference to our definitive proxy statement to be filed with the SEC pursuant to Regulation 14A promulgated under the Exchange Act, not later than 120 days after the end of the fiscal year covered by this Annual Report.
Item 11. Executive Compensation.
The information required in response to this Item 11 is incorporated herein by reference to our definitive proxy statement to be filed with the SEC pursuant to Regulation 14A promulgated under the Exchange Act not later than 120 days after the end of the fiscal year covered by this Annual Report.
Item 12. Security Ownership of Certain Beneficial Owners and Management and Related Stockholder Matters.
Certain information regarding securities authorized for issuance under our equity compensation plans is included under the caption “Equity Compensation Plan Information” in Part II, Item 5, above, of this Annual Report and is incorporated by reference herein. Other information required in response to this Item 12 is incorporated herein by reference to our definitive proxy statement to be filed with the SEC pursuant to Regulation 14A promulgated under the Exchange Act not later than 120 days after the end of the fiscal year covered by this Annual Report.
Item 13. Certain Relationships and Related Transactions, and Director Independence.
The information required in response to this Item 13 is incorporated herein by reference to our definitive proxy statement to be filed with the SEC pursuant to Regulation 14A promulgated under the Exchange Act not later than 120 days after the end of the fiscal year covered by this Annual Report.
Item 14. Principal Accounting Fees and Services.
The information required in response to this Item 14 is incorporated herein by reference to our definitive proxy statement to be filed with the SEC pursuant to Regulation 14A promulgated under the Exchange Act not later than 120 days after the end of the fiscal year covered by this Annual Report.
80
PART IV
Item 15. Exhibits and Financial Statement Schedules.
The following documents are filed as part of this Annual Report:
1. Index to Consolidated Financial Statements, Report of Independent Registered Public Accounting Firm, Consolidated Balance Sheets as of December 31, 2016 and 2015, Consolidated Statements of Operations for the Years Ended December 31, 2016, 2015 and 2014, Consolidated Statements of Changes in Shareholders’ Equity for the Years Ended December 31, 2016, 2015 and 2014 and Consolidated Statements of Cash Flows for the Years Ended December 31, 2016, 2015 and 2014.
2. Exhibits: The exhibits required to be filed by this Item 15 are set forth in the Exhibit Index accompanying this Annual Report.
81
EXHIBIT INDEX
Exhibit Number | Description | |
2.1 | Agreement and Plan of Merger, by and among Matador Resources Company (now known as MRC Energy Company), Matador Holdco, Inc. (now known as Matador Resources Company) and Matador Merger Co., dated August 8, 2011 (incorporated by reference to Exhibit 2.1 to our Registration Statement on Form S-1 filed on August 12, 2011). | |
2.2 | Agreement and Plan of Merger, dated as of January 19, 2015, by and among HEYCO Energy Group, Inc., Harvey E. Yates Company, Matador Resources Company and MRC Delaware Resources, LLC (incorporated by reference to Exhibit 2.1 to the Current Report on Form 8-K filed on January 20, 2015).* | |
2.3 | Amendment No. 1 to Agreement and Plan of Merger, dated as of January 26, 2015, by and among HEYCO Energy Group, Inc., Harvey E. Yates Company, Matador Resources Company and MRC Delaware Resources, LLC (incorporated by reference to Exhibit 2.3 to our Annual Report on Form 10-K for the year ended December 31, 2014). | |
2.4 | Amendment No. 2 to Agreement and Plan of Merger, dated as of February 2, 2015, by and among HEYCO Energy Group, Inc., Harvey E. Yates Company, Matador Resources Company and MRC Delaware Resources, LLC (incorporated by reference to Exhibit 2.4 to our Annual Report on Form 10-K for the year ended December 31, 2014). | |
2.5 | Amendment No. 3 to Agreement and Plan of Merger, dated as of February 6, 2015, by and among HEYCO Energy Group, Inc., Harvey E. Yates Company, Matador Resources Company and MRC Delaware Resources, LLC (incorporated by reference to Exhibit 2.5 to our Annual Report on Form 10-K for the year ended December 31, 2014).* | |
2.6 | Amendment No. 4 to Agreement and Plan of Merger, dated as of February 27, 2015, by and among HEYCO Energy Group, Inc., Harvey E. Yates Company, Matador Resources Company and MRC Delaware Resources, LLC (incorporated by reference to Exhibit 2.2 to the Current Report on Form 8-K filed on March 2, 2015).* | |
2.7 | Amendment No. 5 to Agreement and Plan of Merger, dated as of April 15, 2015, by and among HEYCO Energy Group, Inc., Matador Resources Company and MRC Delaware Resources, LLC (incorporated by reference to Exhibit 2.1 to the Current Report on Form 8-K filed on April 15, 2015). | |
2.8 | Amendment No. 6 to Agreement and Plan of Merger, dated as of July 20, 2015, by and among HEYCO Energy Group, Inc., Harvey E. Yates Company, Matador Resources Company and MRC Delaware Resources, LLC (incorporated by reference to Exhibit 2.1 to the Quarterly Report on Form 10-Q for the quarter ended September 30, 2015). | |
2.9 | Amendment No. 7 to Agreement and Plan of Merger, dated as of August 24, 2015, by and among HEYCO Energy Group, Inc., Harvey E. Yates Company, Matador Resources Company and MRC Delaware Resources, LLC (incorporated by reference to Exhibit 2.2 to the Quarterly Report on Form 10-Q for the quarter ended September 30, 2015). | |
2.10 | Amendment No. 8 to Agreement and Plan of Merger, dated as of September 18, 2015, by and among HEYCO Energy Group, Inc., Harvey E. Yates Company, Matador Resources Company and MRC Delaware Resources, LLC (incorporated by reference to Exhibit 2.3 to the Quarterly Report on Form 10-Q for the quarter ended September 30, 2015). | |
2.11 | Amendment No. 9 to Agreement and Plan of Merger, dated as of March 1, 2016, by and among HEYCO Energy Group, Inc., Harvey E. Yates Company, Matador Resources Company and MRC Delaware Resources, LLC (incorporated by reference to Exhibit 2.1 to the Quarterly Report on Form 10-Q for the quarter ended March 31, 2016). | |
2.12 | Subscription and Contribution Agreement, dated as of February 17, 2017, by and among Longwood Midstream Holdings, LLC, FP MMP Holdings LLC and San Mateo Midstream, LLC (incorporated by reference to Exhibit 2.1 to the Current Report on Form 8-K filed on February 24, 2017).* | |
3.1 | Certificate of Merger between Matador Resources Company (now known as MRC Energy Company) and Matador Merger Co. (incorporated by reference to Exhibit 3.4 to our Registration Statement on Form S-1 filed on August 12, 2011). | |
3.2 | Amended and Restated Certificate of Formation of Matador Resources Company (incorporated by reference to Exhibit 3.1 to the Current Report on Form 8-K filed on February 13, 2012). | |
82
3.3 | Certificate of Amendment to the Amended and Restated Certificate of Formation of Matador Resources Company (incorporated by reference to Exhibit 3.2 to the Quarterly Report on Form 10-Q for the quarter ended March 31, 2015). | |
3.4 | Amended and Restated Bylaws of Matador Resources Company, as amended (incorporated by reference to Exhibit 3.1 to the Current Report on Form 8-K filed on December 23, 2016). | |
3.5 | Statement of Resolutions for Series A Convertible Preferred Stock (incorporated by reference to Exhibit 3.1 to the Current Report on Form 8-K filed on March 2, 2015). | |
4.1 | Form of Common Stock Certificate (incorporated by reference to Exhibit 4.1 to Amendment No. 4 to our Registration Statement on Form S-1 filed on January 19, 2012). | |
4.2 | Registration Rights Agreement, dated February 27, 2015, between Matador Resources Company and HEYCO Energy Group, Inc. (incorporated by reference to Exhibit 4.1 to the Current Report on Form 8-K filed on March 2, 2015). | |
4.3 | Voting Agreement, dated February 27, 2015, between Matador Resources Company and HEYCO Energy Group, Inc. (incorporated by reference to Exhibit 4.2 to the Current Report on Form 8-K filed on March 2, 2015). | |
4.4 | Indenture, dated as of April 14, 2015, by and among Matador Resources Company, the subsidiary guarantors party thereto and Wells Fargo Bank, National Association, as trustee (incorporated by reference to Exhibit 4.1 to the Current Report on Form 8-K filed on April 14, 2015). | |
4.5 | First Supplemental Indenture, dated as of October 1, 2015, by and among Matador Resources Company, DLK Wolf Midstream, LLC, the Guarantors named therein and Wells Fargo Bank, National Association, as trustee (incorporated by reference to Exhibit 4.1 to the Current Report on Form 8-K filed on October 5, 2015). | |
4.6 | Second Supplemental Indenture, dated as of November 4, 2015, by and among Matador Resources Company, MRC Permian LKE Company, LLC, the Guarantors named therein and Wells Fargo Bank, National Association, as trustee (incorporated by reference to Exhibit 4.2 to the Quarterly Report on Form 10-Q for the quarter ended September 30, 2015). | |
4.7 | Third Supplemental Indenture, dated as of June 8, 2016, by and among Matador Resources Company, Black River Water Management Company, LLC, the Guarantors named therein and Wells Fargo Bank, National Association, as trustee (incorporated by reference to Exhibit 4.1 to the Current Report on Form 8-K filed on June 14, 2016). | |
4.8 | Registration Rights Agreement, dated as of December 9, 2016, by and among Matador Resources Company, the subsidiary guarantors party thereto and Merrill Lynch, Pierce, Fenner & Smith Incorporated, as representative of the several initial purchasers named therein (incorporated by reference to Exhibit 4.2 to the Current Report on Form 8-K filed on December 9, 2016). | |
4.9 | Fourth Supplemental Indenture, dated as of February 17, 2017, by and among Matador Resources Company, Black River Water Management Company, LLC, DLK Black River Midstream, LLC, Longwood Midstream Holdings, LLC, the Guarantors named therein and Wells Fargo Bank, National Association, as trustee (incorporated by reference to Exhibit 4.1 to the Current Report on Form 8-K filed on February 24, 2017). | |
10.1† | Employment Agreement between Matador Resources Company and Joseph Wm. Foran (incorporated by reference to Exhibit 10.3 to Amendment No. 1 to our Registration Statement on Form S-1 filed on November 14, 2011). | |
10.2† | Employment Agreement between Matador Resources Company and David E. Lancaster (incorporated by reference to Exhibit 10.4 to Amendment No. 1 to our Registration Statement on Form S-1 filed on November 14, 2011). | |
10.3† | Employment Agreement between Matador Resources Company and Matthew Hairford (incorporated by reference to Exhibit 10.5 to Amendment No. 1 to our Registration Statement on Form S-1 filed on November 14, 2011). | |
10.4† | Employment Agreement between Matador Resources Company and Bradley M. Robinson (incorporated by reference to Exhibit 10.6 to Amendment No. 1 to our Registration Statement on Form S-1 filed on November 14, 2011). | |
10.5† | First Amendment to the Employment Agreement between Matador Resources Company and Joseph Wm. Foran (incorporated by reference to Exhibit 10.8 to Amendment No. 1 to our Registration Statement on Form S-1 filed on November 14, 2011). | |
10.6† | First Amendment to the Employment Agreement between Matador Resources Company and David E. Lancaster (incorporated by reference to Exhibit 10.9 to Amendment No. 1 to our Registration Statement on Form S-1 filed on November 14, 2011). | |
83
10.7† | First Amendment to the Employment Agreement between Matador Resources Company and Matthew Hairford (incorporated by reference to Exhibit 10.10 to Amendment No. 1 to our Registration Statement on Form S-1 filed on November 14, 2011). | |
10.8† | First Amendment to the Employment Agreement between Matador Resources Company and Bradley M. Robinson (incorporated by reference to Exhibit 10.11 to Amendment No. 1 to our Registration Statement on Form S-1 filed on November 14, 2011). | |
10.9† | Second Amendment to the Employment Agreement between Matador Resources Company and Joseph Wm. Foran (incorporated by reference to Exhibit 10.12 to Amendment No. 2 to our Registration Statement on Form S-1 filed on December 30, 2011). | |
10.10† | Second Amendment to the Employment Agreement between Matador Resources Company and David E. Lancaster (incorporated by reference to Exhibit 10.13 to Amendment No. 2 to our Registration Statement on Form S-1 filed on December 30, 2011). | |
10.11† | Second Amendment to the Employment Agreement between Matador Resources Company and Matthew Hairford (incorporated by reference to Exhibit 10.14 to Amendment No. 2 to our Registration Statement on Form S-1 filed on December 30, 2011). | |
10.12† | Second Amendment to the Employment Agreement between Matador Resources Company and Bradley M. Robinson (incorporated by reference to Exhibit 10.15 to Amendment No. 2 to our Registration Statement on Form S-1 filed on December 30, 2011). | |
10.13† | Matador Resources Company Amended and Restated Annual Incentive Plan for Management and Key Employees (incorporated by reference to Exhibit 10.1 to the Current Report on Form 8-K filed on June 14, 2016). | |
10.14† | Matador Resources Company (now known as MRC Energy Company) 2003 Stock and Incentive Plan, dated October 23, 2003 (incorporated by reference to Exhibit 10.15 to Amendment No. 1 to our Registration Statement on Form S-1 filed on November 14, 2011). | |
10.15† | First Amendment to Matador Resources Company (now known as MRC Energy Company) 2003 Stock and Incentive Plan, dated January 29, 2004 (incorporated by reference to Exhibit 10.16 to Amendment No. 1 to our Registration Statement on Form S-1 filed on November 14, 2011). | |
10.16† | Second Amendment to Matador Resources Company (now known as MRC Energy Company) 2003 Stock and Incentive Plan, dated February 3, 2005 (incorporated by reference to Exhibit 10.17 to Amendment No. 1 to our Registration Statement on Form S-1 filed on November 14, 2011). | |
10.17† | Third Amendment to Matador Resources Company (now known as MRC Energy Company) 2003 Stock and Incentive Plan, dated February 1, 2006 (incorporated by reference to Exhibit 10.18 to Amendment No. 1 to our Registration Statement on Form S-1 filed on November 14, 2011). | |
10.18† | Fourth Amendment to Matador Resources Company (now known as MRC Energy Company) 2003 Stock and Incentive Plan, dated May 1, 2006 (incorporated by reference to Exhibit 10.19 to Amendment No. 1 to our Registration Statement on Form S-1 filed on November 14, 2011). | |
10.19† | Fifth Amendment to Matador Resources Company (now known as MRC Energy Company) 2003 Stock and Incentive Plan, dated February 13, 2008 (incorporated by reference to Exhibit 10.20 to Amendment No. 1 to our Registration Statement on Form S-1 filed on November 14, 2011). | |
10.20† | Sixth Amendment to Matador Resources Company (now known as MRC Energy Company) 2003 Stock and Incentive Plan, dated August 5, 2008 (incorporated by reference to Exhibit 10.21 to Amendment No. 1 to our Registration Statement on Form S-1 filed on November 14, 2011). | |
10.21† | Seventh Amendment to Matador Resources Company (now known as MRC Energy Company) 2003 Stock and Incentive Plan, dated December 12, 2011 (incorporated by reference to Exhibit 10.26 to Amendment No. 2 to our Registration Statement on Form S-1 filed on December 30, 2011). | |
10.22† | Eighth Amendment to Matador Resources Company (now known as MRC Energy Company) 2003 Stock and Incentive Plan, dated March 8, 2013 (incorporated by reference to Exhibit 10.27 to the Annual Report on Form 10-K for the year ended December 31, 2012). | |
10.23† | Form of Indemnification Agreement between Matador Resources Company and each of the directors and executive officers thereof (incorporated by reference to Exhibit 10.22 to Amendment No. 1 to our Registration Statement on Form S-1 filed on November 14, 2011). | |
10.24 | Purchase, Sale and Participation Agreement, by and between Matador Resources Company (now known as MRC Energy Company) and Orca ICI Development, JV, dated at May 16, 2011 (incorporated by reference to Exhibit 10.25 to Amendment No. 1 to our Registration Statement on Form S-1 filed on November 14, 2011). | |
84
10.25 | First Amendment to Purchase Sale and Participation Agreement, dated as of June 12, 2013, by and between MRC Energy Company and Orca/ICI Development (incorporated by reference to Exhibit 10.3 to the Quarterly Report on Form 10-Q for the quarter ended June 30, 2013). | |
10.26† | Form of Non-Qualified Stock Option Agreement granted pursuant to the Matador Resources Company (now known as MRC Energy Company) 2003 Stock and Incentive Plan (incorporated by reference to Exhibit 10.36 to the Annual Report on Form 10-K for the year ended December 31, 2011). | |
10.27† | Form of Incentive Stock Option Agreement granted pursuant to the Matador Resources Company (now known as MRC Energy Company) 2003 Stock and Incentive Plan (incorporated by reference to Exhibit 10.37 to the Annual Report on Form 10-K for the year ended December 31, 2011). | |
10.28† | Form of Nonqualified Stock Option Agreement relating to the Matador Resources Company 2012 Long-Term Incentive Plan (incorporated by reference to Exhibit 10.38 to the Annual Report on Form 10-K for the year ended December 31, 2011). | |
10.29† | Form of Restricted Stock Unit Award Agreement relating to the Matador Resources Company 2012 Long-Term Incentive Plan (incorporated by reference to Exhibit 10.39 to the Annual Report on Form 10-K for the year ended December 31, 2011). | |
10.30† | Form of Restricted Stock Award Agreement relating to the Matador Resources Company 2012 Long-Term Incentive Plan (incorporated by reference to Exhibit 10.40 to the Annual Report on Form 10-K for the year ended December 31, 2011). | |
10.31† | Form of Nonqualified Stock Option Agreement relating to the Matador Resources Company 2012 Long-Term Incentive Plan for employees without employment agreements (incorporated by reference to Exhibit 10.4 to the Quarterly Report on Form 10-Q for the quarter ended March 31, 2012). | |
10.32† | Form of Restricted Stock Award Agreement relating to the Matador Resources Company 2012 Long-Term Incentive Plan for employees without employment agreements (incorporated by reference to Exhibit 10.6 to the Quarterly Report on Form 10-Q for the quarter ended March 31, 2012). | |
10.33† | Form of Performance Restricted Stock and Restricted Stock Unit Award Agreement relating to the Matador Resources Company 2012 Long-Term Incentive Plan for employees without employment agreements (incorporated by reference to Exhibit 10.7 to the Quarterly Report on Form 10-Q for the quarter ended March 31, 2012). | |
10.34† | Form of Nonqualified Stock Option Agreement relating to the Matador Resources Company 2012 Long-Term Incentive Plan for employees with employment agreements (incorporated by reference to Exhibit 10.8 to the Quarterly Report on Form 10-Q for the quarter ended March 31, 2012). | |
10.35† | Form of Restricted Stock Award Agreement relating to the Matador Resources Company 2012 Long-Term Incentive Plan for employees with employment agreements (incorporated by reference to Exhibit 10.9 to the Quarterly Report on Form 10-Q for the quarter ended March 31, 2012). | |
10.36† | Form of Performance Restricted Stock and Restricted Stock Unit Award Agreement relating to the Matador Resources Company 2012 Long-Term Incentive Plan for employees with employment agreements (incorporated by reference to Exhibit 10.10 to the Quarterly Report on Form 10-Q for the quarter ended March 31, 2012). | |
10.37 | Third Amended and Restated Credit Agreement, dated as of September 28, 2012, by and among MRC Energy Company, as Borrower, the Lending Entities from time to time parties thereto, as Lenders, and Royal Bank of Canada, as Administrative Agent (incorporated by reference to Exhibit 10.1 to the Current Report on Form 8-K filed on October 4, 2012). | |
10.38 | Second Amended and Restated Pledge and Security Agreement, by and among MRC Energy Company, Longwood Gathering and Disposal Systems GP, Inc. and Royal Bank of Canada, as Administrative Agent, dated as of September 28, 2012 (incorporated by reference to Exhibit 10.49 to the Annual Report on Form 10-K for the year ended December 31, 2012). | |
10.39 | Second Amended, Restated and Consolidated Unconditional Guaranty, by and among MRC Permian Company, MRC Rockies Company, Matador Production Company, Longwood Gathering and Disposal Systems GP, Inc., Longwood Gathering and Disposal Systems, LP, Matador Resources Company and Royal Bank of Canada, as Administrative Agent, dated as of September 28, 2012 (incorporated by reference to Exhibit 10.50 to the Annual Report on Form 10-K for the year ended December 31, 2012). | |
10.40 | First Amendment to Third Amended and Restated Credit Agreement dated as of March 11, 2013, by and among MRC Energy Company, as Borrower, the Lenders party thereto and Royal Bank of Canada, as Administrative Agent (incorporated by reference to Exhibit 10.51 to the Annual Report on Form 10-K for the year ended December 31, 2012). | |
85
10.41 | Second Amendment to Third Amended and Restated Credit Agreement dated as of June 4, 2013, by and among MRC Energy Company, as Borrower, the Lenders party thereto and Royal Bank of Canada, as Administrative Agent (incorporated by reference to Exhibit 10.1 to the Current Report on Form 8-K filed June 6, 2013). | |
10.42 | Third Amendment to Third Amended and Restated Credit Agreement, dated as of August 7, 2013, by and among MRC Energy Company, as Borrower, the Lenders party thereto and Royal Bank of Canada, as Administrative Agent (incorporated by reference to Exhibit 10.2 to the Quarterly Report on Form 10-Q for the quarter ended June 30, 2013). | |
10.43 | Fourth Amendment to Third Amended and Restated Credit Agreement, dated as of March 12, 2014, by and among MRC Energy Company, as Borrower, the Lenders party thereto and Royal Bank of Canada, as Administrative Agent (incorporated by reference to Exhibit 10.50 to the Annual Report on Form 10-K for the year ended December 31, 2013). | |
10.44 | Fifth Amendment to Third Amended and Restated Credit Agreement, dated as of September 5, 2014, by and among MRC Energy Company, as Borrower, the Lenders party thereto and Royal Bank of Canada, as Administrative Agent (incorporated by reference to Exhibit 10.1 to the Current Report on Form 8-K filed on September 8, 2014). | |
10.45 | Sixth Amendment to Third Amended and Restated Credit Agreement, dated as of April 14, 2015, by and among MRC Energy Company, as Borrower, the Lenders party thereto and Royal Bank of Canada, as Administrative Agent (incorporated by reference to Exhibit 10.2 to the Current Report on Form 8-K filed on April 14, 2015). | |
10.46 | Seventh Amendment to Third Amended and Restated Credit Agreement, dated as of October 16, 2015, by and among MRC Energy Company, as Borrower, the Lenders party thereto and Royal Bank of Canada, as Administrative Agent (incorporated by reference to Exhibit 10.1 to the Current Report on Form 8-K filed on October 21, 2015). | |
10.47 | Eighth Amendment to Third Amended and Restated Credit Agreement, dated as of October 31, 2016, by and among MRC Energy Company, as Borrower, the Lenders party thereto and Royal Bank of Canada, as Administrative Agent (incorporated by reference to Exhibit 10.1 to the Current Report on Form 8-K filed on November 2, 2016). | |
10.48 | Limited Consent and Ninth Amendment to Third Amended and Restated Credit Agreement, dated as of December 9, 2016, by and among MRC Energy Company, as Borrower, the Lenders party thereto and Royal Bank of Canada, as Administrative Agent (incorporated by reference to Exhibit 10.2 to the Current Report on Form 8-K filed on December 9, 2016). | |
10.49† | Form of Employment Agreement between Matador Resources Company and Craig N. Adams (incorporated by reference to Exhibit 10.51 to the Annual Report on Form 10-K for the year ended December 31, 2013). | |
10.50† | Letter Agreement between Matador Resources Company, David F. Nicklin and David F. Nicklin International Consulting, Inc., dated February 26, 2015 (incorporated by reference to Exhibit 10.51 to our Annual Report on Form 10-K for the year ended December 31, 2014). | |
10.51† | Form of Employment Agreement between Matador Resources Company and Van H. Singleton, II, effective February 5, 2015 (incorporated by reference to Exhibit 10.52 to our Annual Report on Form 10-K for the year ended December 31, 2014). | |
10.52† | Form of Nonqualified Stock Option Agreement relating to the Matador Resources Company 2012 Long-Term Incentive Plan for employees without employment agreements (incorporated by reference to Exhibit 10.54 to our Annual Report on Form 10-K for the year ended December 31, 2014). | |
10.53† | Form of Restricted Stock Award Agreement relating to the Matador Resources Company 2012 Long-Term Incentive Plan for employees without employment agreements (incorporated by reference to Exhibit 10.55 to our Annual Report on Form 10-K for the year ended December 31, 2014). | |
10.54† | Form of Nonqualified Stock Option Agreement relating to the Matador Resources Company Amended and Restated 2012 Long-Term Incentive Plan for employees without employment agreements (incorporated by reference to Exhibit 10.53 to our Annual Report on Form 10-K for the year ended December 31, 2015). | |
10.55† | Form of Restricted Stock Award Agreement relating to the Matador Resources Company Amended and Restated 2012 Long-Term Incentive Plan for employees without employment agreements (incorporated by reference to Exhibit 10.54 to our Annual Report on Form 10-K for the year ended December 31, 2015). | |
10.56† | Amended and Restated Independent Contractor Agreement by and among Matador Resources Company, David F. Nicklin and David F. Nicklin International Consulting, Inc., effective as of April 1, 2015 (incorporated by reference to Exhibit 10.1 to the Current Report on Form 8-K filed on June 11, 2015). | |
86
10.57 | Purchase Agreement, dated as of April 9, 2015, by and among Matador Resources Company, the subsidiary guarantors party thereto and Merrill Lynch, Pierce, Fenner & Smith Incorporated, as representative of the several initial purchasers named therein (incorporated by reference to Exhibit 10.1 to the Current Report on Form 8-K filed on April 14, 2015). | |
10.58† | Amended and Restated 2012 Long-Term Incentive Plan (incorporated by reference to Exhibit 10.2 to the Current Report on Form 8-K filed on June 11, 2015). | |
10.59† | Separation Agreement and Release, dated as of August 31, 2015, by and between Matador Resources Company and Ryan C. London (incorporated by reference to Exhibit 10.2 to the Quarterly Report on Form 10-Q/A for the quarter ended September 30, 2015). | |
10.60† | Matador Resources Company Nonqualified Deferred Compensation Plan for Non-Employee Directors (incorporated by reference to Exhibit 10.59 to our Annual Report on Form 10-K for the year ended December 31, 2015). | |
10.61 | Purchase Agreement, dated as of December 6, 2016, by and among Matador Resources Company, the subsidiary guarantors party thereto and Merrill Lynch, Pierce, Fenner & Smith Incorporated, as representative of the several initial purchasers named therein (incorporated by reference to Exhibit 10.1 to the Current Report on Form 8-K filed on December 9, 2016). | |
10.62† | Form of Restricted Stock Unit Award Agreement relating to the Matador Resources Company 2012 Long-Term Incentive Plan (filed herewith). | |
10.63† | Form of Restricted Stock Unit Award Agreement for deferred delivery relating to the Matador Resources Company 2012 Long-Term Incentive Plan (filed herewith). | |
10.64† | Form of Letter Agreement between Matador Resources Company and certain directors modifying Restricted Stock Unit Award Agreements (filed herewith). | |
21.1 | List of Subsidiaries of Matador Resources Company (filed herewith). | |
23.1 | Consent of KPMG LLP (filed herewith). | |
23.2 | Consent of Netherland, Sewell & Associates, Inc. (filed herewith). | |
31.1 | Certification of Principal Executive Officer pursuant to Section 302 of the Sarbanes-Oxley Act of 2002 (filed herewith). | |
31.2 | Certification of Principal Financial Officer pursuant to Section 302 of the Sarbanes-Oxley Act of 2002 (filed herewith). | |
32.1 | Certification of Principal Executive Officer pursuant to 18 U.S.C. Section 1350, as adopted pursuant to Section 906 of the Sarbanes-Oxley Act of 2002 (furnished herewith). | |
32.2 | Certification of Principal Financial Officer pursuant to 18 U.S.C. Section 1350, as adopted pursuant to Section 906 of the Sarbanes-Oxley Act of 2002 (furnished herewith). | |
99.1 | Audit report of Netherland, Sewell & Associates, Inc. (filed herewith). | |
101 | The following financial information from Matador Resources Company’s Annual Report on Form 10-K for the year ended December 31, 2016, formatted in XBRL (eXtensible Business Reporting Language): (i) the Consolidated Balance Sheets, (ii) the Consolidated Statements of Operations, (iii) the Consolidated Statements of Changes in Shareholders’ Equity, (iv) the Consolidated Statements of Cash Flows and (v) the Notes to Consolidated Financial Statements (submitted electronically herewith). | |
† | Indicates a management contract or compensatory plan or arrangement. | |
* | Pursuant to Item 601(b)(2) of Regulation S-K, the Company agrees to furnish supplementally a copy of any omitted exhibit or schedule to the SEC upon request. | |
87
SIGNATURES
Pursuant to the requirements of Section 13 or 15(d) of the Securities Exchange Act of 1934, the registrant has duly caused this Annual Report to be signed on its behalf by the undersigned, thereunto duly authorized.
MATADOR RESOURCES COMPANY | ||||
March 1, 2017 | By: | /s/ Joseph Wm. Foran | ||
Joseph Wm. Foran | ||||
Chairman and Chief Executive Officer | ||||
88
Pursuant to the requirements of the Securities Exchange Act of 1934, this Annual Report has been signed below by the following persons on behalf of the registrant and in the capacities and on the dates indicated.
Signature | Title | Date | ||
/s/ Joseph Wm. Foran | Chairman and Chief Executive Officer | March 1, 2017 | ||
Joseph Wm. Foran | (Principal Executive Officer) | |||
/s/ David E. Lancaster | Executive Vice President and Chief Financial Officer | March 1, 2017 | ||
David E. Lancaster | (Principal Financial Officer) | |||
/s/ Robert T. Macalik | Vice President and Chief Accounting | March 1, 2017 | ||
Robert T. Macalik | Officer (Principal Accounting Officer) | |||
/s/ Reynald A. Baribault | Director | March 1, 2017 | ||
Reynald A. Baribault | ||||
/s/ R. Gaines Baty | Director | March 1, 2017 | ||
R. Gaines Baty | ||||
/s/ Craig T. Burkert | Director | March 1, 2017 | ||
Craig T. Burkert | ||||
/s/ William M. Byerley | Director | March 1, 2017 | ||
William M. Byerley | ||||
/s/ Joe A. Davis | Director | March 1, 2017 | ||
Joe A. Davis | ||||
/s/ Julia P. Forrester | Director | March 1, 2017 | ||
Julia P. Forrester | ||||
/s/ David M. Laney | Director | March 1, 2017 | ||
David M. Laney | ||||
/s/ Gregory E. Mitchell | Director | March 1, 2017 | ||
Gregory E. Mitchell | ||||
/s/ Steven W. Ohnimus | Director | March 1, 2017 | ||
Steven W. Ohnimus | ||||
/s/ Kenneth L. Stewart | Director | March 1, 2017 | ||
Kenneth L. Stewart | ||||
/s/ George M. Yates | Director | March 1, 2017 | ||
George M. Yates | ||||
89
GLOSSARY OF OIL AND NATURAL GAS TERMS
The following is a description of the meanings of some of the oil and natural gas industry terms used in this Annual Report.
Batch drilling. The process by which multiple horizontal wells are drilled from a single pad. In batch drilling, the surface holes for each well are drilled first and then the production holes, including the horizontal laterals for each well, are drilled.
Bbl. One stock tank barrel, or 42 U.S. gallons liquid volume, used in this Annual Report in reference to crude oil or other liquid hydrocarbons.
Bcf. One billion cubic feet.
BOE. Barrels of oil equivalent, determined using the ratio of one Bbl of crude oil, condensate or natural gas liquids to six Mcf of natural gas.
BOE/d. BOE per day.
Btu or British thermal unit. The quantity of heat required to raise the temperature of one pound of water by one degree Fahrenheit.
Completion. The operations required to establish production of oil or natural gas from a wellbore, usually involving perforations, stimulation and/or installation of permanent equipment in the well, or in the case of a dry hole, the reporting of abandonment to the appropriate agency.
Condensate. Liquid hydrocarbons associated with the production of a primarily natural gas reservoir.
Conventional reservoirs or resources. Natural gas or oil that is produced by a well drilled into a geologic formation in which the reservoir and fluid characteristics permit the natural gas or oil to readily flow to the wellbore.
Coring. The act of taking a core. A core is a solid column of rock, usually from two to four inches in diameter, taken as a sample of an underground formation. It is common practice to take cores from wells in the process of being drilled. A core bit is attached to the end of the drill pipe. The core bit then cuts a column of rock from the formation being penetrated. The core is then removed and tested for evidence of oil or natural gas, and its characteristics (porosity, permeability, etc.) are determined.
Developed acreage. The number of acres that are allocated or assignable to productive wells.
Development well. A well drilled into a proved oil or natural gas reservoir to the depth of a stratigraphic horizon known to be productive.
Dry hole. A well found to be incapable of producing hydrocarbons in sufficient quantities such that proceeds from the sale of such production exceed production-related expenses and taxes.
Exploratory well. A well drilled to find and produce oil or natural gas reserves not classified as proved, to find a new reservoir in a field previously found to be productive of oil or natural gas in another reservoir or to extend a known reservoir.
Farmin or farmout. An agreement under which the owner of a working interest in an oil or natural gas lease assigns the working interest or a portion of the working interest to another party who desires to drill on the leased acreage. Generally, the assignee is required to drill one or more wells in order to earn its interest in the acreage. The assignor usually retains a royalty or reversionary interest in the lease. The interest received by an assignee is a “farmin” while the interest transferred by the assignor is a “farmout.”
Field. An area consisting of a single reservoir or multiple reservoirs all grouped on or related to the same individual geological structural feature and/or stratigraphic condition.
Gross acres or gross wells. The total acres or wells in which a working interest is owned.
Held by production. An oil and natural gas property under lease in which the lease continues to be in force after the primary term of the lease in accordance with its terms as a result of production from the property.
Horizontal drilling or well. A drilling operation in which a portion of the well is drilled horizontally within a productive or potentially productive formation. This operation typically yields a horizontal well that has the ability to produce higher volumes than a vertical well drilled in the same formation. A horizontal well is designed to replace multiple vertical wells, resulting in lower capital expenditures for draining like acreage and limiting surface disruption.
Hydraulic fracturing. The technique of improving a well’s production or injection rates by pumping a mixture of fluids into the formation and rupturing the rock, creating an artificial channel. As part of this technique, sand or other material may also be injected into the formation to prop the channel open, so that fluids or gases may more easily flow from the formation, through the fracture channel and into the wellbore. This technique may also be referred to as fracture stimulation.
90
Liquids. Liquids, or natural gas liquids, are marketable liquid products including ethane, propane, butane, pentane and natural gasoline resulting from the further processing of liquefiable hydrocarbons separated from raw natural gas by a natural gas processing facility.
MBbl. One thousand barrels of crude oil or other liquid hydrocarbons.
MBOE. One thousand BOE.
Mcf. One thousand cubic feet of natural gas.
MMBtu. One million British thermal units.
MMcf. One million cubic feet of natural gas.
NGL. Natural gas liquids.
Net acres or net wells. The sum of the fractional working interest owned in gross acres or wells.
Net revenue interest. The interest that defines the percentage of revenue that an owner of a well receives from the sale of oil, natural gas and/or natural gas liquids that are produced from the well.
NYMEX. New York Mercantile Exchange.
Overriding royalty interest. A fractional interest in the gross production of oil and natural gas under a lease, in addition to the usual royalties paid to the lessor, free of any expense for exploration, drilling, development, operating, marketing and other costs incident to the production and sale of oil and natural gas produced from the lease. It is an interest carved out of the lessee’s working interest, as distinguished from the lessor’s reserved royalty interest.
Pad. The surface constructed to accommodate the drilling, completion and production operations of an oil or natural gas well.
Pad drilling. The process by which multiple horizontal wells are drilled from a single pad. In pad drilling, each well on the pad is drilled to total depth before the next well is initiated.
Permeability. A reference to the ability of oil and/or natural gas to flow through a reservoir.
Petrophysical analysis. The interpretation of well log measurements, obtained from a string of electronic tools inserted into the borehole, and from core measurements, in which rock samples are retrieved from the subsurface, then combining these measurements with other relevant geological and geophysical information to describe the reservoir rock properties.
Play. A set of known or postulated oil and/or natural gas accumulations sharing similar geologic, geographic and temporal properties, such as source rock, migration pathways, timing, trapping mechanism and hydrocarbon type.
Possible reserves. Additional reserves that are less certain to be recognized than probable reserves.
Probable reserves. Additional reserves that are less certain to be recognized than proved reserves but which, in sum with proved reserves, are as likely as not to be recovered.
Producing well, or productive well. A well that is found to be capable of producing hydrocarbons in sufficient quantities such that proceeds from the sale of the well’s production exceed production-related expenses and taxes.
Properties. Natural gas and oil wells, production and related equipment and facilities and oil, natural gas, or other mineral fee, leasehold and related interests.
Prospect. A specific geographic area which, based on supporting geological, geophysical or other data and preliminary economic analysis using reasonably anticipated prices and costs, is considered to have potential for the discovery of commercial hydrocarbons.
Proved developed non-producing. Hydrocarbons in a potentially producing horizon penetrated by a wellbore, the production of which has been postponed pending installation of surface equipment or gathering facilities, or pending the production of hydrocarbons from another formation penetrated by the wellbore. The hydrocarbons are classified as proved developed but non-producing reserves.
Proved developed reserves. Proved reserves that can be expected to be recovered through existing wells and facilities and by existing operating methods.
Proved reserves. Reserves of oil and natural gas that have been proved to a high degree of certainty by analysis of the producing history of a reservoir and/or by volumetric analysis of adequate geological and engineering data.
Proved undeveloped reserves. Proved reserves that are expected to be recovered from new wells on undrilled acreage or from existing wells where a relatively major expenditure is required for recompletion.
91
Recompletion. Completing in the same wellbore to reach a new reservoir after production from the original reservoir has been abandoned.
Repeatability. The potential ability to drill multiple wells within a prospect or trend.
Reservoir. A porous and permeable underground formation containing a natural accumulation of producible oil and/or natural gas that is confined by impermeable rock or water barriers and is individual and separate from other reservoirs.
Royalty interest. An interest in an oil and natural gas lease that gives the owner of the interest the right to receive a portion of the production from the leased acreage (or of the proceeds of the sale thereof), but generally does not require the owner to pay any portion of the costs of drilling or operating the wells on the leased acreage. Royalties may be either landowner’s royalties, which are reserved by the owner of the leased acreage at the time the lease is granted, or overriding royalties, which are usually reserved by an owner of the leasehold in connection with a transfer to a subsequent owner.
2-D seismic. The method by which a cross-section of the earth’s subsurface is created through the interpretation of reflecting seismic data collected along a single source profile.
3-D seismic. The method by which a three-dimensional image of the earth’s subsurface is created through the interpretation of reflection seismic data collected over a surface grid. 3-D seismic surveys allow for a more detailed understanding of the subsurface than do 2-D seismic surveys and contribute significantly to field appraisal, exploitation and production.
Spud. The act of beginning to drill an oil or natural gas well.
Throughput. The volume of product transported or passing through a pipeline, plant or other facility.
Trend. A region of oil and/or natural gas production, the geographic limits of which have not been fully defined, having geological characteristics that have been ascertained through supporting geological, geophysical or other data to contain the potential for oil and/or natural gas reserves in a particular formation or series of formations.
Unconventional resource play. A set of known or postulated oil and or natural gas resources or reserves warranting further exploration which are extracted from (i) low-permeability sandstone and shale formations and (ii) coalbed methane. These plays require the application of advanced technology to extract the oil and natural gas resources.
Undeveloped acreage. Lease acreage on which wells have not been drilled or completed to a point that would permit the production of commercial quantities of oil and natural gas, regardless of whether such acreage contains proved reserves. Undeveloped acreage is usually considered to be all acreage that is not allocated or assignable to productive wells.
Unproved and unevaluated properties. Properties where no drilling or other actions have been undertaken that permit such properties to be classified as proved and to which no proved reserves have been assigned.
Vertical well. A hole drilled vertically into the earth from which oil, natural gas or water flows or is pumped.
Visualization. An exploration technique in which the size and shape of subsurface features are mapped and analyzed based upon information derived from well logs, seismic data and other well information.
Volumetric reserve analysis. A technique used to estimate the amount of recoverable oil and natural gas. It involves calculating the volume of reservoir rock and adjusting that volume for rock porosity, hydrocarbon saturation, formation volume factor and recovery factor.
Walking rig. A drilling rig that is capable of moving from one drilling location to another a short distance away using a series of hydraulic “feet” built into the substructure of the rig.
Wellbore. The hole made by a well.
Working interest. The operating interest that gives the owner the right to drill, produce and conduct operating activities on the property and receive a share of production.
92
Matador Resources Company and Subsidiaries
CONSOLIDATED FINANCIAL STATEMENTS
December 31, 2016, 2015 and 2014
Contents
Consolidated Financial Statements | |
F-1
Report of Independent Registered Public Accounting Firm
The Board of Directors and Shareholders
Matador Resources Company:
We have audited the accompanying consolidated balance sheets of Matador Resources Company and subsidiaries (collectively the “Company”) as of December 31, 2016 and 2015 and the related consolidated statements of operations, changes in shareholders’ equity and cash flows for each of the years in the three-year period ended December 31, 2016. These consolidated financial statements are the responsibility of the Company’s management. Our responsibility is to express an opinion on these consolidated financial statements based on our audits.
We conducted our audits in accordance with the standards of the Public Company Accounting Oversight Board (United States). Those standards require that we plan and perform the audit to obtain reasonable assurance about whether the financial statements are free of material misstatement. An audit includes examining, on a test basis, evidence supporting the amounts and disclosures in the financial statements. An audit also includes assessing the accounting principles used and significant estimates made by management, as well as evaluating the overall financial statement presentation. We believe that our audits provide a reasonable basis for our opinion.
In our opinion, the consolidated financial statements referred to above present fairly, in all material respects, the financial position of Matador Resources Company and subsidiaries as of December 31, 2016 and 2015, and the results of their operations and their cash flows for each of the years in the three-year period ended December 31, 2016, in conformity with U.S. generally accepted accounting principles.
We also have audited, in accordance with the standards of the Public Company Accounting Oversight Board (United States), the Company’s internal control over financial reporting as of December 31, 2016, based on criteria established in Internal Control—Integrated Framework (2013) issued by the Committee of Sponsoring Organizations of the Treadway Commission (COSO), and our report dated March 1, 2017 expressed an unqualified opinion on the effectiveness of the Company’s internal control over financial reporting.
/s/ KPMG LLP
Dallas, Texas
March 1, 2017
F-2
Matador Resources Company and Subsidiaries
CONSOLIDATED BALANCE SHEETS
(In thousands, except par value and share data)
December 31, | ||||||||
2016 | 2015 | |||||||
ASSETS | ||||||||
Current assets | ||||||||
Cash | $ | 212,884 | $ | 16,732 | ||||
Restricted cash | 1,258 | 44,357 | ||||||
Accounts receivable | ||||||||
Oil and natural gas revenues | 34,154 | 16,616 | ||||||
Joint interest billings | 19,347 | 16,999 | ||||||
Other | 5,167 | 10,794 | ||||||
Derivative instruments | — | 16,284 | ||||||
Lease and well equipment inventory | 3,045 | 2,022 | ||||||
Prepaid expenses and other assets | 3,327 | 3,203 | ||||||
Total current assets | 279,182 | 127,007 | ||||||
Property and equipment, at cost | ||||||||
Oil and natural gas properties, full-cost method | ||||||||
Evaluated | 2,408,305 | 2,122,174 | ||||||
Unproved and unevaluated | 479,736 | 387,504 | ||||||
Other property and equipment | 160,795 | 86,387 | ||||||
Less accumulated depletion, depreciation and amortization | (1,864,311 | ) | (1,583,659 | ) | ||||
Net property and equipment | 1,184,525 | 1,012,406 | ||||||
Other assets | 958 | 1,448 | ||||||
Total assets | $ | 1,464,665 | $ | 1,140,861 | ||||
LIABILITIES AND SHAREHOLDERS’ EQUITY | ||||||||
Current liabilities | ||||||||
Accounts payable | $ | 4,674 | $ | 10,966 | ||||
Accrued liabilities | 101,460 | 92,369 | ||||||
Royalties payable | 23,988 | 16,493 | ||||||
Amounts due to affiliates | 8,651 | 5,670 | ||||||
Derivative instruments | 24,203 | — | ||||||
Advances from joint interest owners | 1,700 | 700 | ||||||
Deferred gain on plant sale | — | 4,830 | ||||||
Amounts due to joint ventures | 4,251 | 2,793 | ||||||
Income taxes payable | — | 2,848 | ||||||
Other current liabilities | 578 | 161 | ||||||
Total current liabilities | 169,505 | 136,830 | ||||||
Long-term liabilities | ||||||||
Senior unsecured notes payable | 573,924 | 391,254 | ||||||
Asset retirement obligations | 19,725 | 15,166 | ||||||
Derivative instruments | 751 | — | ||||||
Amounts due to joint ventures | 1,771 | 3,956 | ||||||
Deferred gain on plant sale | — | 102,506 | ||||||
Other long-term liabilities | 7,544 | 2,190 | ||||||
Total long-term liabilities | 603,715 | 515,072 | ||||||
Commitments and contingencies (Note 13) | ||||||||
Shareholders’ equity | ||||||||
Common stock — $0.01 par value, 120,000,000 shares authorized; 99,518,764 and 85,567,021 shares issued; and 99,511,931 and 85,564,435 shares outstanding, respectively | 995 | 856 | ||||||
Additional paid-in capital | 1,325,481 | 1,026,077 | ||||||
Accumulated deficit | (636,351 | ) | (538,930 | ) | ||||
Total Matador Resources Company shareholders’ equity | 690,125 | 488,003 | ||||||
Non-controlling interest in subsidiaries | 1,320 | 956 | ||||||
Total shareholders’ equity | 691,445 | 488,959 | ||||||
Total liabilities and shareholders’ equity | $ | 1,464,665 | $ | 1,140,861 | ||||
The accompanying notes are an integral part of these financial statements.
F-3
Matador Resources Company and Subsidiaries
CONSOLIDATED STATEMENTS OF OPERATIONS
(In thousands, except per share data)
For the Years Ended December 31, | ||||||||||||
2016 | 2015 | 2014 | ||||||||||
Revenues | ||||||||||||
Oil and natural gas revenues | $ | 291,156 | $ | 278,340 | $ | 367,712 | ||||||
Third-party midstream services revenues | 5,218 | 1,864 | 1,213 | |||||||||
Realized gain on derivatives | 9,286 | 77,094 | 5,022 | |||||||||
Unrealized (loss) gain on derivatives | (41,238 | ) | (39,265 | ) | 58,302 | |||||||
Total revenues | 264,422 | 318,033 | 432,249 | |||||||||
Expenses | ||||||||||||
Production taxes, transportation and processing | 43,046 | 35,650 | 33,172 | |||||||||
Lease operating | 56,202 | 54,704 | 49,945 | |||||||||
Plant and other midstream services operating | 5,389 | 3,489 | 1,408 | |||||||||
Depletion, depreciation and amortization | 122,048 | 178,847 | 134,737 | |||||||||
Accretion of asset retirement obligations | 1,182 | 734 | 504 | |||||||||
Full-cost ceiling impairment | 158,633 | 801,166 | — | |||||||||
General and administrative | 55,089 | 50,105 | 32,152 | |||||||||
Total expenses | 441,589 | 1,124,695 | 251,918 | |||||||||
Operating (loss) income | (177,167 | ) | (806,662 | ) | 180,331 | |||||||
Other income (expense) | ||||||||||||
Net gain on asset sales and inventory impairment | 107,277 | 908 | — | |||||||||
Interest expense | (28,199 | ) | (21,754 | ) | (5,334 | ) | ||||||
Other (expense) income | (4 | ) | 616 | 132 | ||||||||
Total other income (expense) | 79,074 | (20,230 | ) | (5,202 | ) | |||||||
(Loss) income before income taxes | (98,093 | ) | (826,892 | ) | 175,129 | |||||||
Income tax provision (benefit) | ||||||||||||
Current | (1,036 | ) | 2,959 | 133 | ||||||||
Deferred | — | (150,327 | ) | 64,242 | ||||||||
Total income tax (benefit) provision | (1,036 | ) | (147,368 | ) | 64,375 | |||||||
Net (loss) income | (97,057 | ) | (679,524 | ) | 110,754 | |||||||
Net (income) loss attributable to non-controlling interest in subsidiaries | (364 | ) | (261 | ) | 17 | |||||||
Net (loss) income attributable to Matador Resources Company shareholders | $ | (97,421 | ) | $ | (679,785 | ) | $ | 110,771 | ||||
Earnings (loss) per common share | ||||||||||||
Basic | $ | (1.07 | ) | $ | (8.34 | ) | $ | 1.58 | ||||
Diluted | $ | (1.07 | ) | $ | (8.34 | ) | $ | 1.56 | ||||
Weighted average common shares outstanding | ||||||||||||
Basic | 91,273 | 81,537 | 70,229 | |||||||||
Diluted | 91,273 | 81,537 | 70,906 | |||||||||
The accompanying notes are an integral part of these financial statements.
F-4
Matador Resources Company and Subsidiaries
CONSOLIDATED STATEMENTS OF CHANGES IN SHAREHOLDERS’ EQUITY
(In thousands)
For the Years Ended December 31, 2016, 2015 and 2014
Total shareholders’ equity attributable to Matador Resources Company | |||||||||||||||||||||||||||||||||||||||||
Additional paid-in capital | Retained earnings (deficit) | Treasury Stock | Non-controlling interest in subsidiaries | Total shareholders’ equity | |||||||||||||||||||||||||||||||||||||
Common Stock | Preferred Stock | ||||||||||||||||||||||||||||||||||||||||
Shares | Amount | Shares | Amount | Shares | Amount | ||||||||||||||||||||||||||||||||||||
Balance at January 1, 2014 | 66,959 | $ | 670 | — | $ | — | $ | 548,935 | $ | 30,084 | 1,306 | $ | (10,765 | ) | $ | 568,924 | $ | — | $ | 568,924 | |||||||||||||||||||||
Issuance of common stock | 7,500 | 75 | — | — | 181,800 | — | — | — | 181,875 | — | 181,875 | ||||||||||||||||||||||||||||||
Cost to issue equity | — | — | — | — | (590 | ) | — | — | — | (590 | ) | — | (590 | ) | |||||||||||||||||||||||||||
Issuance of common stock pursuant to directors’ and advisors’ compensation plan | 30 | — | — | — | 16 | — | — | — | 16 | — | 16 | ||||||||||||||||||||||||||||||
Stock options expense related to equity-based awards | — | — | — | — | 2,279 | — | — | — | 2,279 | — | 2,279 | ||||||||||||||||||||||||||||||
Stock options exercised, net of options forfeited in net share settlements | 8 | — | — | — | 43 | — | — | — | 43 | — | 43 | ||||||||||||||||||||||||||||||
Liability-based stock option awards settled | — | — | — | — | 84 | — | — | — | 84 | — | 84 | ||||||||||||||||||||||||||||||
Restricted stock issued | 212 | 2 | — | — | (2 | ) | — | — | — | — | — | — | |||||||||||||||||||||||||||||
Restricted stock forfeited | — | — | — | — | (17 | ) | — | 60 | — | (17 | ) | — | (17 | ) | |||||||||||||||||||||||||||
Restricted stock and restricted stock units expense | — | — | — | — | 3,023 | — | — | — | 3,023 | — | 3,023 | ||||||||||||||||||||||||||||||
Cancellation of treasury stock | (1,335 | ) | (13 | ) | — | — | (10,752 | ) | — | (1,335 | ) | 10,765 | — | — | — | ||||||||||||||||||||||||||
Capital contributed to less-than-wholly-owned subsidiaries | — | — | — | — | — | — | — | — | — | 150 | 150 | ||||||||||||||||||||||||||||||
Current period net income (loss) | — | — | — | — | — | 110,771 | — | — | 110,771 | (17 | ) | 110,754 | |||||||||||||||||||||||||||||
Balance at December 31, 2014 | 73,374 | 734 | — | — | 724,819 | 140,855 | 31 | — | 866,408 | 133 | 866,541 | ||||||||||||||||||||||||||||||
Issuance of common stock | 10,329 | 104 | — | — | 260,148 | — | — | — | 260,252 | — | 260,252 | ||||||||||||||||||||||||||||||
Issuance of preferred stock | — | — | 150 | 1 | 32,489 | — | — | — | 32,490 | — | 32,490 | ||||||||||||||||||||||||||||||
Cost to issue equity | — | — | — | — | (1,151 | ) | — | — | — | (1,151 | ) | — | (1,151 | ) | |||||||||||||||||||||||||||
Conversion of preferred stock to common stock | 1,500 | 15 | (150 | ) | (1 | ) | (14 | ) | — | — | — | — | — | — | |||||||||||||||||||||||||||
Stock-based compensation expense related to equity-based awards | — | — | — | — | 9,333 | — | — | — | 9,333 | — | 9,333 | ||||||||||||||||||||||||||||||
Stock options exercised, net of options forfeited in net share settlements | 25 | — | — | — | 10 | — | — | — | 10 | — | 10 | ||||||||||||||||||||||||||||||
Liability-based stock option awards settled | 25 | — | — | — | 446 | — | — | — | 446 | — | 446 | ||||||||||||||||||||||||||||||
Restricted stock issued | 429 | 4 | — | — | (4 | ) | — | — | — | — | — | — | |||||||||||||||||||||||||||||
Restricted stock forfeited | — | — | — | — | — | — | 138 | — | — | — | — | ||||||||||||||||||||||||||||||
Vesting of restricted stock units | 52 | 1 | — | — | (1 | ) | — | — | — | — | — | — | |||||||||||||||||||||||||||||
Cancellation of treasury stock | (167 | ) | (2 | ) | — | — | 2 | — | (167 | ) | — | — | — | — | |||||||||||||||||||||||||||
Capital contributed from less-than-wholly-owned subsidiaries | — | — | — | — | — | — | — | — | — | 562 | 562 | ||||||||||||||||||||||||||||||
Current period net (loss) income | — | — | — | — | — | (679,785 | ) | — | — | (679,785 | ) | 261 | (679,524 | ) | |||||||||||||||||||||||||||
Balance at December 31, 2015 | 85,567 | 856 | — | — | 1,026,077 | (538,930 | ) | 2 | — | 488,003 | 956 | 488,959 | |||||||||||||||||||||||||||||
Issuance of common stock pursuant to public offerings | 13,500 | 135 | — | — | 288,375 | — | — | — | 288,510 | — | 288,510 | ||||||||||||||||||||||||||||||
Issuance of common stock pursuant to employee stock compensation plan | 471 | 4 | — | — | (4 | ) | — | — | — | — | — | — | |||||||||||||||||||||||||||||
Issuance of common stock pursuant to directors’ and advisors’ compensation plan | 51 | 1 | — | — | (1 | ) | — | — | — | — | — | — | |||||||||||||||||||||||||||||
Cost to issue equity | — | — | — | — | (1,190 | ) | — | — | — | (1,190 | ) | — | (1,190 | ) | |||||||||||||||||||||||||||
Stock-based compensation expense related to equity-based awards | — | — | — | — | 11,958 | — | — | — | 11,958 | — | 11,958 | ||||||||||||||||||||||||||||||
Stock options exercised, net of options forfeited in net share settlements | 36 | — | — | — | 10 | — | — | — | 10 | — | 10 | ||||||||||||||||||||||||||||||
Liability-based stock option awards settled | 10 | — | — | — | 255 | — | — | — | 255 | — | 255 | ||||||||||||||||||||||||||||||
Restricted stock forfeited | — | — | — | — | — | — | 120 | — | — | — | — | ||||||||||||||||||||||||||||||
Cancellation of treasury stock | (116 | ) | (1 | ) | — | — | 1 | — | (116 | ) | — | — | — | — | |||||||||||||||||||||||||||
Current period net (loss) income | — | — | — | — | — | (97,421 | ) | — | — | (97,421 | ) | 364 | (97,057 | ) | |||||||||||||||||||||||||||
Balance at December 31, 2016 | 99,519 | $ | 995 | — | $ | — | $ | 1,325,481 | $ | (636,351 | ) | 6 | $ | — | $ | 690,125 | $ | 1,320 | $ | 691,445 | |||||||||||||||||||||
The accompanying notes are an integral part of these financial statements.
F-5
Matador Resources Company and Subsidiaries
CONSOLIDATED STATEMENTS OF CASH FLOWS
(In thousands)
For the Years Ended December 31, | ||||||||||||
2016 | 2015 | 2014 | ||||||||||
Operating activities | ||||||||||||
Net (loss) income | $ | (97,057 | ) | $ | (679,524 | ) | $ | 110,754 | ||||
Adjustments to reconcile net (loss) income to net cash provided by operating activities | ||||||||||||
Unrealized loss (gain) on derivatives | 41,238 | 39,265 | (58,302 | ) | ||||||||
Depletion, depreciation and amortization | 122,048 | 178,847 | 134,737 | |||||||||
Accretion of asset retirement obligations | 1,182 | 734 | 504 | |||||||||
Full-cost ceiling impairment | 158,633 | 801,166 | — | |||||||||
Stock-based compensation expense | 12,362 | 9,450 | 5,524 | |||||||||
Deferred income tax (benefit) provision | — | (150,327 | ) | 64,242 | ||||||||
Amortization of debt issuance cost | 1,148 | 852 | — | |||||||||
Net gain on asset sales and inventory impairment | (107,277 | ) | (908 | ) | — | |||||||
Changes in operating assets and liabilities | ||||||||||||
Accounts receivable | (14,259 | ) | 3,633 | (13,318 | ) | |||||||
Lease and well equipment inventory | (700 | ) | (180 | ) | (211 | ) | ||||||
Prepaid expenses | (124 | ) | (544 | ) | (783 | ) | ||||||
Other assets | 490 | (552 | ) | 1,212 | ||||||||
Accounts payable, accrued liabilities and other current liabilities | 6,611 | 1,375 | 607 | |||||||||
Royalties payable | 7,495 | 1,654 | 6,663 | |||||||||
Advances from joint interest owners | 1,000 | 700 | — | |||||||||
Income taxes payable | (2,848 | ) | 2,405 | 39 | ||||||||
Other long-term liabilities | 4,144 | 489 | (187 | ) | ||||||||
Net cash provided by operating activities | 134,086 | 208,535 | 251,481 | |||||||||
Investing activities | ||||||||||||
Proceeds from sale of assets | 5,173 | 139,836 | 79 | |||||||||
Oil and natural gas properties capital expenditures | (379,067 | ) | (432,715 | ) | (560,849 | ) | ||||||
Expenditures for other property and equipment | (74,845 | ) | (64,499 | ) | (9,152 | ) | ||||||
Business combination, net of cash acquired | — | (24,028 | ) | — | ||||||||
Restricted cash | 43,098 | (43,098 | ) | — | ||||||||
Restricted cash in less-than-wholly-owned subsidiaries | 1 | (650 | ) | (609 | ) | |||||||
Net cash used in investing activities | (405,640 | ) | (425,154 | ) | (570,531 | ) | ||||||
Financing activities | ||||||||||||
Repayments of borrowings | (120,000 | ) | (476,982 | ) | (180,000 | ) | ||||||
Borrowings under Credit Agreement | 120,000 | 125,000 | 320,000 | |||||||||
Proceeds from issuance of common stock | 288,510 | 188,720 | 181,875 | |||||||||
Proceeds from issuance of senior unsecured notes | 184,625 | 400,000 | — | |||||||||
Cost to issue equity | (847 | ) | (1,158 | ) | (590 | ) | ||||||
Cost to issue senior unsecured notes | (2,734 | ) | (9,598 | ) | — | |||||||
Proceeds from stock options exercised | 100 | 10 | 43 | |||||||||
Capital commitments from non-controlling interest owners of less-than-wholly-owned subsidiaries | — | 562 | 150 | |||||||||
Taxes paid related to net share settlement of stock-based compensation | (1,948 | ) | (1,610 | ) | (308 | ) | ||||||
Net cash provided by financing activities | 467,706 | 224,944 | 321,170 | |||||||||
Increase in cash | 196,152 | 8,325 | 2,120 | |||||||||
Cash at beginning of year | 16,732 | 8,407 | 6,287 | |||||||||
Cash at end of year | $ | 212,884 | $ | 16,732 | $ | 8,407 | ||||||
Supplemental disclosures of cash flow information (Note 14)
The accompanying notes are an integral part of these financial statements.
F-6
Matador Resources Company and Subsidiaries
NOTES TO CONSOLIDATED FINANCIAL STATEMENTS
December 31, 2016, 2015 and 2014
NOTE 1 — NATURE OF OPERATIONS
Matador Resources Company, a Texas corporation (“Matador” and, collectively with its subsidiaries, the “Company”), is an independent energy company engaged in the exploration, development, production and acquisition of oil and natural gas resources in the United States, with an emphasis on oil and natural gas shale and other unconventional plays. The Company’s current operations are focused primarily on the oil and liquids-rich portion of the Wolfcamp and Bone Spring plays in the Delaware Basin in Southeast New Mexico and West Texas. The Company also operates in the Eagle Ford shale play in South Texas and the Haynesville shale and Cotton Valley plays in Northwest Louisiana and East Texas. Additionally, the Company conducts midstream operations in support of its exploration, development and production operations and provides natural gas processing, natural gas, oil and salt water gathering services and salt water disposal services to third parties on a limited basis.
NOTE 2 — SUMMARY OF SIGNIFICANT ACCOUNTING POLICIES
Basis of Presentation
The consolidated financial statements include the accounts of Matador Resources Company and its wholly-owned and majority-owned subsidiaries. These consolidated financial statements have been prepared in accordance with generally accepted accounting principles in the United States of America (“U.S. GAAP”). Accordingly, the Company consolidates certain subsidiaries that are less-than-wholly-owned and the net income and equity attributable to the non-controlling interest in these subsidiaries have been reported separately. The Company proportionately consolidates certain joint ventures that are less-than-wholly-owned and are involved in oil and natural gas exploration. All intercompany balances and transactions have been eliminated in consolidation.
Reclassifications
Certain reclassifications have been made to the prior years’ financial statements to conform to the current year presentation. These reclassifications had no effect on previously reported results of operations, cash flows or retained earnings. As a result of the growth of the Company’s midstream operations, these operations met the required threshold for segment reporting at December 31, 2016. As a result, $1.8 million and $1.2 million for the years ended December 31, 2015 and 2014, respectively, were reclassified from other income to third-party midstream services revenues. In addition, $3.5 million and $1.4 million related to midstream operating costs for the years ended December 31, 2015 and 2014, respectively, were reclassified from lease operating expenses to plant and other midstream services operating expenses. These reclassifications had no effect on previously reported results of operations, cash flows or retained earnings.
Change in Accounting Principles
During the second quarter of 2016, the Company adopted Accounting Standards Update (“ASU”) 2016-09, Compensation - Stock Compensation (Topic 718), which simplifies several aspects of the accounting for employee share-based payment transactions, including accounting for income tax, forfeitures, statutory tax withholding requirements, classifications of awards as either equity or liability and classification of taxes in the statement of cash flows, requiring either retrospective, modified retrospective or prospective transition. The amended guidance also requires an entity to record excess tax benefits and deficiencies in the income statement. The adoption of this ASU had no impact on any period presented for (i) the Company’s financial position or statements of operations, as the Company currently has a valuation allowance against its net deferred tax assets, or (ii) the Company’s statements of cash flows, as the Company has historically accounted for taxes paid for net share settlement as a financing activity as required under this ASU. In addition, the Company uses historical forfeiture rates to estimate future forfeitures attributable to the service-based vesting requirements not being met and has continued to do so upon adoption of this ASU.
Use of Estimates
The preparation of financial statements in conformity with U.S. GAAP requires management to make estimates and assumptions that affect the amounts reported in the financial statements and accompanying notes. These estimates and assumptions may also affect disclosure of contingent assets and liabilities at the date of the financial statements, purchase price allocations and the reported amounts of revenues and expenses during the reporting period. While the Company believes its estimates are reasonable, changes in facts and assumptions or the discovery of new information may result in revised estimates. Actual results could differ from these estimates.
F-7
Matador Resources Company and Subsidiaries
NOTES TO CONSOLIDATED FINANCIAL STATEMENTS — CONTINUED
December 31, 2016, 2015 and 2014
NOTE 2 — SUMMARY OF SIGNIFICANT ACCOUNTING POLICIES — Continued
The Company’s consolidated financial statements are based on a number of significant estimates, including oil and natural gas revenues, accrued assets and liabilities, stock-based compensation, valuation of derivative instruments, deferred tax assets and liabilities, purchase price allocations and oil and natural gas reserves. The estimates of oil and natural gas reserves quantities and future net cash flows are the basis for the calculations of depletion and impairment of oil and natural gas properties, as well as estimates of asset retirement obligations and certain tax accruals. The Company’s oil and natural gas reserves estimates, which are inherently imprecise and based upon many factors that are beyond the Company’s control, including oil and natural gas prices, are prepared by the Company’s engineering staff in accordance with guidelines established by the Securities and Exchange Commission (“SEC”) and then audited for their reasonableness and conformance with SEC guidelines by Netherland, Sewell & Associates, Inc., independent reservoir engineers.
Restricted Cash
Restricted cash represents a portion of the cash paid for the Loving County Processing System by EnLink (as described in Note 5) directly to a qualified intermediary to facilitate like-kind-exchange transactions for federal income tax purposes as well as cash held by the Company’s less-than-wholly-owned subsidiaries. Not all of the cash deposited with the qualified intermediary was used for like-kind-exchange transactions and, in January 2016, the remaining balance of $42.1 million was returned to the Company by the qualified intermediary to be used for general corporate purposes. By contractual agreement, the cash in the account held by the Company’s less-than-wholly-owned subsidiaries is not to be commingled with other Company cash and is to be used only to fund the capital expenditures and operations of these less-than-wholly-owned subsidiaries.
Accounts Receivable
The Company sells its operated oil, natural gas and natural gas liquids production to various purchasers (see “ —Revenue Recognition” below). Due to the nature of the markets for oil, natural gas and natural gas liquids, the Company does not believe that the loss of any one purchaser would significantly impact operations. In addition, the Company may participate with industry partners in the drilling, completion and operation of oil and natural gas wells. Substantially all of the Company’s accounts receivable are due from either purchasers of oil, natural gas and natural gas liquids or participants in oil and natural gas wells for which the Company serves as the operator. Accounts receivable are due within 30 to 60 days of the production date and 30 days of the billing date and are stated at amounts due from purchasers and industry partners. Amounts are considered past due if they have been outstanding for 60 days or more. No interest is typically charged on past due amounts.
The Company reviews its need for an allowance for doubtful accounts on a periodic basis and determines the allowance, if any, by considering the length of time past due, previous loss history, future net revenues of the debtor’s ownership interest in oil and natural gas properties operated by the Company and the debtor’s ability to pay its obligations, among other things. The Company has no allowance for doubtful accounts related to its accounts receivable for any reporting period presented.
Lease and Well Equipment Inventory
Lease and well equipment inventory is stated at the lower of cost or market and consists entirely of materials or equipment scheduled for use in future well or midstream operations.
Oil and Natural Gas Properties
The Company uses the full-cost method of accounting for its investments in oil and natural gas properties. Under this method of accounting, all costs associated with the acquisition, exploration and development of oil and natural gas properties and reserves, including unproved and unevaluated property costs, are capitalized as incurred and accumulated in a single cost center representing the Company’s activities, which are undertaken exclusively in the United States. Such costs include lease acquisition costs, geological and geophysical expenditures, lease rentals on undeveloped properties, costs of drilling both productive and non-productive wells, capitalized interest on qualifying projects and general and administrative expenses directly related to acquisition, exploration and development activities, but do not include any costs related to production, selling or general corporate administrative activities. The Company capitalized $15.7 million, $6.9 million and $6.4 million of its general and administrative costs in 2016, 2015 and 2014, respectively. The Company capitalized $3.7 million, $3.9 million and $2.8 million of its interest expense for the years ended December 31, 2016, 2015 and 2014, respectively.
Capitalized costs of oil and natural gas properties are amortized using the unit-of-production method based upon production and estimates of proved reserves quantities. Unproved and unevaluated property costs are excluded from the amortization base used to determine depletion. Unproved and unevaluated properties are assessed for possible impairment on a
F-8
Matador Resources Company and Subsidiaries
NOTES TO CONSOLIDATED FINANCIAL STATEMENTS — CONTINUED
December 31, 2016, 2015 and 2014
NOTE 2 — SUMMARY OF SIGNIFICANT ACCOUNTING POLICIES — Continued
periodic basis based upon changes in operating or economic conditions. This assessment includes consideration of the following factors, among others: the assignment of proved reserves, geological and geophysical evaluations, intent to drill, remaining lease term and drilling activity and results. Upon impairment, the costs of the unproved and unevaluated properties are immediately included in the amortization base. Exploratory dry holes are included in the amortization base immediately upon determination that the well is not productive.
Sales of oil and natural gas properties are accounted for as adjustments to net capitalized costs with no gain or loss recognized, unless such adjustments would significantly alter the relationship between net capitalized costs and proved reserves of oil and natural gas. All costs related to production activities and maintenance and repairs are expensed as incurred. Significant workovers that increase the properties’ reserves are capitalized.
Ceiling Test
The net capitalized costs of oil and natural gas properties are limited to the lower of unamortized costs less related deferred income taxes or the cost center “ceiling.” The cost center ceiling is defined as the sum of:
(a) the present value, discounted at 10%, of future net revenues of proved oil and natural gas reserves, reduced by the estimated costs of developing these reserves, plus
(b) unproved and unevaluated property costs not being amortized, plus
(c) the lower of cost or estimated fair value of unproved and unevaluated properties included in the costs being amortized, if any, less
(d) income tax effects related to the properties involved.
Any excess of the Company’s net capitalized costs above the cost center ceiling as described above is charged to operations as a full-cost ceiling impairment. The fair value of the Company’s derivative instruments is not included in the ceiling test computation as the Company does not designate these instruments as hedge instruments for accounting purposes.
The estimated present value of after-tax future net cash flows from proved oil and natural gas reserves is highly dependent upon the quantities of proved reserves, the estimation of which requires substantial judgment. The associated commodity prices and the applicable discount rate used in these estimates are in accordance with guidelines established by the SEC. Under these guidelines, oil and natural gas reserves are estimated using then-current operating and economic conditions, with no provision for price and cost changes in future periods except by contractual arrangements. Future net revenues are calculated using prices that represent the arithmetic averages of the first-day-of-the-month oil and natural gas prices for the previous 12-month period and a 10% discount factor is used to determine the present value of future net revenues. For the period from January through December 2016, these average oil and natural gas prices were $39.25 per Bbl and $2.48 per MMBtu, respectively. For the period from January through December 2015, these average oil and natural gas prices were $46.79 per Bbl and $2.59 per MMBtu, respectively. For the period from January through December 2014, these average oil and natural gas prices were $91.48 per Bbl and $4.35 per MMBtu, respectively. In estimating the present value of after-tax future net cash flows from proved oil and natural gas reserves, the average oil prices were further adjusted by property for quality, transportation and marketing fees and regional price differentials, and the average natural gas prices were further adjusted by property for energy content, transportation and marketing fees and regional price differentials.
During the year ended December 31, 2016, the Company’s net capitalized costs less related deferred income taxes exceeded the full-cost ceiling. As a result, in the first six months of 2016, the Company recorded an impairment charge of $158.6 million, exclusive of tax effect, to its consolidated statement of operations with the related deferred income tax credit recorded net of a valuation allowance (see Note 7).
During the year ended December 31, 2015, the Company’s net capitalized costs less related deferred income taxes exceeded the full-cost ceiling. As a result, throughout 2015, the Company recorded an impairment charge of $801.2 million, exclusive of tax effect, to its consolidated statement of operations for December 31, 2015 with the related deferred income tax credit recorded net of a valuation allowance (see Note 7).
During the year ended December 31, 2014, the Company’s full-cost ceiling exceeded the net capitalized costs less related deferred income taxes. As a result, the Company recorded no impairment to its net capitalized costs during the year ended December 31, 2014.
F-9
Matador Resources Company and Subsidiaries
NOTES TO CONSOLIDATED FINANCIAL STATEMENTS — CONTINUED
December 31, 2016, 2015 and 2014
NOTE 2 — SUMMARY OF SIGNIFICANT ACCOUNTING POLICIES — Continued
As a non-cash item, the full-cost ceiling impairment impacts the accumulated depletion and the net carrying value of the Company’s assets on its consolidated balance sheets, as well as the corresponding shareholders’ equity, but it has no impact on the Company’s net cash flows as reported. Changes in oil and natural gas production rates, oil and natural gas prices, reserves estimates, future development costs and other factors will determine the Company’s actual ceiling test computation and impairment analyses in future periods.
Other Property and Equipment
Other property and equipment are recorded at historical cost and include midstream equipment and facilities, including the Company’s pipelines, processing facilities and salt water disposal systems, and corporate assets, including furniture, fixtures, equipment, land and leasehold improvements. Midstream equipment and facilities are depreciated over a 30-year useful life using the straight-line, mid-month convention method. Leasehold improvements are depreciated over the lesser of their useful lives or the term of the lease. Software, furniture, fixtures and other equipment are depreciated over their useful life (five to 30 years) using the straight-line method. Maintenance and repair costs that do not extend the useful life of the property or equipment are expensed as incurred. See Note 3 for a detail of other property and equipment.
Asset Retirement Obligations
The Company recognizes the fair value of an asset retirement obligation in the period in which it is incurred if a reasonable estimate of fair value can be made. The asset retirement obligation is recorded as a liability at its estimated present value, with an offsetting increase recognized in oil and natural gas properties or support equipment and facilities on the consolidated balance sheets. Periodic accretion of the discounted value of the estimated liability is recorded as an expense in the consolidated statements of operations.
Derivative Financial Instruments
From time to time, the Company uses derivative financial instruments to mitigate its exposure to commodity price risk associated with oil, natural gas and natural gas liquids prices. The Company’s derivative financial instruments are recorded on the consolidated balance sheets as either an asset or a liability measured at fair value. The Company has elected not to apply hedge accounting for its existing derivative financial instruments, and as a result, the Company recognizes the change in derivative fair value between reporting periods currently in its consolidated statements of operations. The fair value of the Company’s derivative financial instruments is determined using industry-standard models that consider various inputs including: (i) quoted forward prices for commodities, (ii) time value of money and (iii) current market and contractual prices for the underlying instruments, as well as other relevant economic measures. Realized gains and realized losses from the settlement of derivative financial instruments and unrealized gains and unrealized losses from valuation changes in the remaining unsettled derivative financial instruments are reported under “Revenues” in the consolidated statements of operations. See Note 11 for additional information about the Company’s derivative instruments.
Revenue Recognition
The Company follows the sales method of accounting for its oil, natural gas and natural gas liquids revenues, whereby it recognizes revenue, net of royalties, on all oil, natural gas and natural gas liquids sold to purchasers regardless of whether the sales are proportionate to its ownership in the property. Under this method, revenue is recognized at the time oil, natural gas and natural gas liquids are produced and sold, and the Company accrues for revenue earned but not yet received. The Company recognizes midstream services revenue at the time services have been rendered and the price is fixed and determinable.
For the year ended December 31, 2016, three significant purchasers accounted for 48% of the Company’s total oil, natural gas and natural gas liquids revenues: Plains Marketing, L.P. (18%), Shell Trading (US) Company (17%) and Occidental Energy Marketing, Inc. (13%). For the year ended December 31, 2015, three significant purchasers accounted for 59% of the Company’s total oil, natural gas and natural gas liquids revenues: Shell Trading (US) Company (33%), Enterprise Crude Oil LLC (14%) and Sequent Energy Management, L.P. (12%). For the year ended December 31, 2014, three significant purchasers accounted for approximately 68% of the Company’s total oil, natural gas and natural gas liquids revenues: Shell Trading (US) Company (45%), Enterprise Crude Oil LLC (12%) and Enterprise Products Operating LLC (11%). Due to the nature of the markets for oil, natural gas and natural gas liquids, the Company does not believe the loss of any one purchaser would have a material adverse impact on the Company’s financial condition, results of operations or cash flows for any significant period of time. At December 31, 2016, 2015 and 2014, approximately 38%, 39% and 44%, respectively, of the Company’s accounts receivable, including joint interest billings, related to these purchasers.
F-10
Matador Resources Company and Subsidiaries
NOTES TO CONSOLIDATED FINANCIAL STATEMENTS — CONTINUED
December 31, 2016, 2015 and 2014
NOTE 2 — SUMMARY OF SIGNIFICANT ACCOUNTING POLICIES — Continued
Stock-Based Compensation
The Company grants common stock, stock options, restricted stock and restricted stock units to members of its Board of Directors and selected employees. All such awards are measured at fair value on the date of grant and are generally recognized as a component of general and administrative expenses in the accompanying statements of operations on a straight-line basis over the awards’ vesting periods. The Company accounts for all outstanding stock options granted under the 2003 Plan (as described and defined in Note 8) as liability instruments as a result of the Company purchasing shares from certain of its employees to assist them in the exercise of outstanding options of the Company’s common stock.
The Company uses the Black Scholes Merton option pricing model to measure the fair value of stock options, the closing stock price on the date of grant to measure restricted stock and restricted stock unit awards and the Monte Carlo simulation method to measure the fair value of performance units.
The Company’s consolidated statements of operations for the years ended December 31, 2016, 2015 and 2014 include a stock-based compensation (non-cash) expense of $12.4 million, $9.5 million and $5.5 million, respectively. This stock-based compensation expense includes common stock issuances and restricted stock units expense totaling $1.0 million, $0.9 million and $0.3 million in 2016, 2015 and 2014, respectively, paid to members of the Board of Directors and advisors as compensation for their services to the Company.
Income Taxes
The Company accounts for income taxes using the asset and liability approach for financial accounting and reporting. The Company evaluates the probability of realizing the future benefits of its deferred tax assets and records a valuation allowance for the portion of any deferred tax assets when it is more likely than not that the benefit from the deferred tax asset will not be realized.
The Company recognizes the tax benefit of an uncertain tax position only if it is more likely than not that the tax position will be sustained upon examination by the taxing authorities based on the technical merits of the position. For tax positions meeting the more likely than not threshold, the amount recognized in the financial statements is the benefit that has a greater than 50% likelihood of being realized upon ultimate settlement with the relevant tax authority. At December 31, 2016, 2015 and 2014, the Company had not established any reserves for, nor recorded any unrecognized tax benefits related to, uncertain tax positions.
When necessary, the Company would include interest assessed by taxing authorities in “Interest expense” and penalties related to income taxes in “Other expense” on its consolidated statements of operations. The Company did not record any interest or penalties related to income taxes for the years ended December 31, 2016, 2015 and 2014.
Allocation of Purchase Price in Business Combinations
As part of the Company’s business strategy, it periodically pursues the acquisition of oil and natural gas properties. The purchase price in a business combination is allocated to the assets acquired and liabilities assumed based on their fair values as of the acquisition date, which may occur many months after the announcement date. Therefore, while the consideration to be paid may be fixed, the fair value of the assets acquired and liabilities assumed is subject to change during the period between the announcement date and the acquisition date. The most significant estimates in the allocation typically relate to the value assigned to proved oil and natural gas reserves and unproved and unevaluated properties. As the allocation of the purchase price is subject to significant estimates and subjective judgments, the accuracy of this assessment is inherently uncertain.
Earnings (Loss) Per Common Share
The Company reports basic earnings (loss) per common share, which excludes the effect of potentially dilutive securities, and diluted earnings (loss) per common share, which includes the effect of all potentially dilutive securities, unless their impact is anti-dilutive.
The following are reconciliations of the numerators and denominators used to compute the Company’s basic and diluted earnings per common share as reported for the years ended December 31, 2016, 2015 and 2014 (in thousands, except per share data).
F-11
Matador Resources Company and Subsidiaries
NOTES TO CONSOLIDATED FINANCIAL STATEMENTS — CONTINUED
December 31, 2016, 2015 and 2014
NOTE 2 — SUMMARY OF SIGNIFICANT ACCOUNTING POLICIES — Continued
Year Ended December 31, | ||||||||||||
2016 | 2015 | 2014 | ||||||||||
Net (loss) income attributable to Matador Resources Company shareholders — numerator | $ | (97,421 | ) | $ | (679,785 | ) | $ | 110,771 | ||||
Weighted average common shares outstanding — denominator | ||||||||||||
Basic | 91,273 | 81,537 | 70,229 | |||||||||
Dilutive effect of options, restricted stock units and preferred shares | — | — | 677 | |||||||||
Diluted weighted average common shares outstanding | 91,273 | 81,537 | 70,906 | |||||||||
Earnings (loss) per common share attributable to Matador Resources Company shareholders | ||||||||||||
Basic | $ | (1.07 | ) | $ | (8.34 | ) | $ | 1.58 | ||||
Diluted | $ | (1.07 | ) | $ | (8.34 | ) | $ | 1.56 | ||||
A total of 2.9 million options to purchase shares of the Company’s common stock and 0.1 million restricted stock units were excluded from the calculations above for the year ended December 31, 2016 because their effects were anti-dilutive. Additionally, 1.0 million restricted shares, which are participating securities, were excluded from the calculations above for the year ended December 31, 2016 as the security holders do not have the obligation to share in the losses of the Company.
A total of 2.4 million options to purchase shares of the Company’s common stock and 0.1 million restricted stock units were excluded from the calculations above for the year ended December 31, 2015 because their effects were anti-dilutive. Additionally, 0.9 million restricted shares, which are participating securities, were excluded from the calculations above for the year ended December 31, 2015 as the security holders do not have the obligation to share in the losses of the Company.
Credit Risk
The Company’s cash is held in financial institutions and at times these amounts exceed the insurance limits of the Federal Deposit Insurance Corporation. Management believes, however, that the Company’s counterparty risks are minimal based on the reputation and history of the institutions selected.
The Company uses derivative financial instruments to mitigate its exposure to oil, natural gas and natural gas liquids price volatility. These transactions expose the Company to potential credit risk from its counterparties. The Company manages counterparty credit risk through established internal derivatives policies that are reviewed on an ongoing basis. Additionally, all of the Company’s commodity derivative contracts at December 31, 2016 were with Comerica Bank, The Bank of Nova Scotia, BMO Harris Financing (Bank of Montreal) and SunTrust Bank (or affiliates thereof), parties that are lenders (or affiliates thereof) under the Company’s Credit Agreement.
Accounts receivable constitute the principal component of additional credit risk to which the Company may be exposed. The Company attempts to minimize credit risk exposure to counterparties by monitoring the financial condition and payment history of its purchasers and joint interest partners.
Recent Accounting Pronouncements
Revenue from Contracts with Customers. In May 2014, the Financial Accounting Standards Board (“FASB”) issued ASU 2014-09, Revenue from Contracts with Customers (Topic 606), which specifies how and when to recognize revenue. This standard requires expanded disclosures surrounding revenue recognition and is intended to improve, and converge with international standards, the financial reporting requirements for revenue from contracts with customers. In August 2015, the FASB issued ASU 2015-14, which defers the effective date of ASU 2014-09 for one year to fiscal years beginning after December 15, 2017. Early adoption is permitted for fiscal years beginning after December 15, 2016. In May 2016, the FASB issued ASU 2016-11, which rescinds guidance from the SEC on accounting for gas balancing arrangements and will eliminate the use of the entitlements method. Entities have the option of using either a full retrospective or modified approach to adopt the new standards. In December 2016, the FASB issued ASU 2016-20, which clarifies disclosure requirements in ASU 2014-09. The Company will adopt the new guidance effective January 1, 2018. The Company is evaluating the new guidance, including (i) identification of revenue streams, (ii) review of contracts and procedures currently in place and (iii) which adoption method it will use.
F-12
Matador Resources Company and Subsidiaries
NOTES TO CONSOLIDATED FINANCIAL STATEMENTS — CONTINUED
December 31, 2016, 2015 and 2014
NOTE 2 — SUMMARY OF SIGNIFICANT ACCOUNTING POLICIES — Continued
Recognition and Measurement of Financial Assets and Financial Liabilities. In January 2016, the FASB issued 2016-01, Recognition and Measurement of Financial Assets and Financial Liabilities, which changes certain guidance related to the recognition, measurement, presentation and disclosure of financial instruments. This update is effective for fiscal years beginning after December 15, 2017, including interim periods within those fiscal years. Early adoption is not permitted for the majority of the update, but is permitted for two of its provisions. We do not anticipate the adoption of this ASU will have a material impact on our consolidated financial statements.
Leases. In February 2016, the FASB issued ASU 2016-02, Leases (Topic 842), which requires the recognition of lease assets and lease liabilities by lessees for those leases classified as operating leases under previous U.S. GAAP. This ASU will become effective for fiscal years beginning after December 15, 2018 with early adoption permitted. Entities are required to recognize and measure leases at the beginning of the earliest period presented using a modified retrospective approach. The modified retrospective approach includes a number of optional practical expedients that entities may elect to apply. These practical expedients relate to the identification and classification of leases that commenced before the effective date, initial direct costs for leases that commenced before the effective date and the ability to use hindsight in evaluating lessee options to extend or terminate a lease or to purchase the underlying asset. The Company is currently evaluating the impact of the adoption of this ASU on its consolidated financial statements.
Statement of Cash Flows. In November 2016, the FASB issued ASU 2016-18, Statement of Cash Flows (Topic 230), which specifies that a statement of cash flows explain the change during the period in the total of cash, cash equivalents, and amounts generally described as restricted cash or restricted cash equivalents. This ASU will become effective for fiscal years beginning after December 15, 2017, and interim periods within those fiscal years. Early adoption is permitted, including adoption in an interim period. The update should be applied using a retrospective transition method to each period presented. The Company believes that the impact of the adoption of this ASU will change the presentation of its beginning and ending cash balances on its Consolidated Statements of Cash Flows and eliminate the presentation of changes in restricted cash balances from investing activities on its Consolidated Statements of Cash Flows.
Clarifying the Definition of a Business. In January 2017, the FASB issued ASU 2017-01, Business Combinations (Topic 805), which specifies the minimum inputs and processes required for an integrated set of assets and activities to meet the definition of a business. This ASU will become effective for fiscal years beginning after December 15, 2017 with early adoption permitted. Entities are required to apply guidance prospectively upon adoption. The Company is currently evaluating the impact of the adoption of this ASU on its consolidated financial statements.
F-13
Matador Resources Company and Subsidiaries
NOTES TO CONSOLIDATED FINANCIAL STATEMENTS — CONTINUED
December 31, 2016, 2015 and 2014
NOTE 3 — PROPERTY AND EQUIPMENT
The following table presents a summary of the Company’s property and equipment balances as of December 31, 2016 and 2015 (in thousands).
December 31, | ||||||||
2016 | 2015 | |||||||
Oil and natural gas properties | ||||||||
Evaluated (subject to amortization) | $ | 2,408,305 | $ | 2,122,174 | ||||
Unproved and unevaluated (not subject to amortization) | 479,736 | 387,504 | ||||||
Total oil and natural gas properties | 2,888,041 | 2,509,678 | ||||||
Accumulated depletion | (1,850,882 | ) | (1,574,040 | ) | ||||
Net oil and natural gas properties | 1,037,159 | 935,638 | ||||||
Other property and equipment | ||||||||
Midstream equipment and facilities | 145,662 | 78,564 | ||||||
Furniture, fixtures and other equipment | 5,487 | 2,918 | ||||||
Software | 3,206 | 2,193 | ||||||
Land | 1,437 | 1,539 | ||||||
Leasehold improvements | 5,003 | 1,173 | ||||||
Total other property and equipment | 160,795 | 86,387 | ||||||
Accumulated depreciation | (13,429 | ) | (9,619 | ) | ||||
Net other property and equipment | 147,366 | 76,768 | ||||||
Net property and equipment | $ | 1,184,525 | $ | 1,012,406 | ||||
The following table provides a breakdown of the Company’s unproved and unevaluated property costs not subject to amortization as of December 31, 2016 and the year in which these costs were incurred (in thousands).
Description | 2016 | 2015 | 2014 | 2013 and prior | Total | |||||||||||||||
Costs incurred for | ||||||||||||||||||||
Property acquisition | $ | 126,857 | $ | 236,507 | $ | 55,258 | $ | 23,654 | $ | 442,276 | ||||||||||
Exploration wells | 19,017 | 3,375 | 34 | — | 22,426 | |||||||||||||||
Development wells | 13,086 | 1,218 | 730 | — | 15,034 | |||||||||||||||
Total | $ | 158,960 | $ | 241,100 | $ | 56,022 | $ | 23,654 | $ | 479,736 | ||||||||||
Property acquisition costs primarily include leasehold costs paid to secure oil and natural gas mineral leases, but may also include broker and legal expenses, geological and geophysical expenses and capitalized internal costs associated with developing oil and natural gas prospects on these properties. Property acquisition costs are transferred into the amortization base on an ongoing basis as these properties are evaluated and proved reserves are established or impairment is determined. Unproved and unevaluated properties are assessed for possible impairment on a periodic basis based upon changes in operating or economic conditions.
Property acquisition costs incurred that remain in unproved and unevaluated property at December 31, 2016 are related primarily to the Company’s leasehold and mineral acquisitions in the Wolfcamp and Bone Spring plays in the Delaware Basin in Southeast New Mexico and West Texas during the past four years. These costs include, in particular, the cost of the acreage acquired as part of the HEYCO Merger (as described and defined in Note 5) in 2015. These costs are associated with acreage for which proved reserves have yet to be assigned. A significant portion of these costs are associated with properties which are held by production or have automatic lease renewal options. As the Company drills wells and assigns proved reserves to these properties or determines that certain portions of this acreage, if any, cannot be assigned proved reserves, portions of these costs are transferred to the amortization base.
Costs excluded from amortization also include those costs associated with exploration and development wells in progress or awaiting completion at year-end. These costs are transferred into the amortization base on an ongoing basis as these wells are completed and proved reserves are established or confirmed. These costs totaled $37.5 million at December 31, 2016. Of this
F-14
Matador Resources Company and Subsidiaries
NOTES TO CONSOLIDATED FINANCIAL STATEMENTS — CONTINUED
December 31, 2016, 2015 and 2014
NOTE 3 — PROPERTY AND EQUIPMENT — Continued
total, $22.4 million was associated with exploration wells and $15.0 million was associated with development wells. The Company anticipates that most of the $37.5 million associated with these wells in progress at December 31, 2016 will be transferred to the amortization base during 2017.
NOTE 4 — ASSET RETIREMENT OBLIGATIONS
In general, the Company’s asset retirement obligations relate to future costs associated with plugging and abandonment of its oil and natural gas wells, removal of pipelines, equipment and facilities from leased acreage and returning such land to its original condition. The amounts recognized are based on numerous estimates and assumptions, including future retirement costs, future recoverable quantities of oil and natural gas, future inflation rates and the Company’s credit-adjusted risk-free interest rate. Revisions to the liability can occur due to changes in these estimates and assumptions or if federal or state regulators enact new plugging and abandonment requirements. At the time of the actual plugging and abandonment of its oil and natural gas wells, the Company includes any gain or loss associated with the operation in the amortization base to the extent the actual costs are different from the estimated liability.
The following table summarizes the changes in the Company’s asset retirement obligations for the years ended December 31, 2016 and 2015 (in thousands).
Year Ended December 31, | ||||||||
2016 | 2015 | |||||||
Beginning asset retirement obligations | $ | 15,420 | $ | 11,951 | ||||
Liabilities incurred during period | 1,791 | 4,508 | ||||||
Liabilities settled during period | (375 | ) | (588 | ) | ||||
Revisions in estimated cash flows | 2,622 | (1,185 | ) | |||||
Accretion expense | 1,182 | 734 | ||||||
Ending asset retirement obligations | 20,640 | 15,420 | ||||||
Less: current asset retirement obligations (1) | (915 | ) | (254 | ) | ||||
Long-term asset retirement obligations | $ | 19,725 | $ | 15,166 | ||||
__________________
(1) | Included in accrued liabilities in the Company’s consolidated balance sheets at December 31, 2016 and 2015. |
NOTE 5 — BUSINESS COMBINATIONS AND DIVESTITURES
Business Combinations
On February 27, 2015, the Company completed a business combination with Harvey E. Yates Company (“HEYCO”), a subsidiary of HEYCO Energy Group, Inc., through a merger of HEYCO with and into a wholly-owned subsidiary of Matador (the “HEYCO Merger”). In the HEYCO Merger, the Company obtained certain oil and natural gas producing properties and undeveloped acreage located in Lea and Eddy Counties, New Mexico, consisting of approximately 58,600 gross (18,200 net) acres strategically located between the Company’s existing acreage in its Ranger and Rustler Breaks asset areas. HEYCO, headquartered in Roswell, New Mexico, was privately-owned prior to the transaction.
As consideration for the business combination, Matador paid approximately $33.6 million in cash and assumed debt obligations and issued 3,300,000 shares of Matador common stock and 150,000 shares of a new series of Matador Series A Convertible Preferred Stock (“Series A Preferred Stock”) to HEYCO Energy Group, Inc. (convertible into ten shares of common stock for each one share of Series A Preferred Stock upon the effectiveness of an amendment to the Company’s Amended and Restated Certificate of Formation to increase the number of authorized shares of common stock; the Series A Preferred Stock converted to common stock on April 6, 2015). Matador incurred an additional $4.5 million for customary purchase price adjustments, including adjusting for production, revenues and operating and capital expenditures from September 1, 2014 to closing. The consideration paid and the liabilities assumed, including deferred tax liabilities of approximately $76.8 million and other liabilities of approximately $4.5 million, represent a total purchase price of $223.5 million. The HEYCO Merger was accounted for using the acquisition method under ASC Topic 805, “Business Combinations,” which requires the assets acquired and liabilities assumed to be recorded at fair value as of the respective acquisition date.
F-15
Matador Resources Company and Subsidiaries
NOTES TO CONSOLIDATED FINANCIAL STATEMENTS — CONTINUED
December 31, 2016, 2015 and 2014
NOTE 5 — BUSINESS COMBINATIONS AND DIVESTITURES — Continued
The majority of the assets acquired in the HEYCO Merger were in the form of non-producing acreage. The producing wells acquired in the HEYCO Merger did not have a material impact on the Company’s revenues or results of operations for the year ended December 31, 2015. During the year ended December 31, 2015, the Company incurred approximately $2.5 million of transaction costs associated with the HEYCO Merger, which were included in “General and administrative” costs in the consolidated statement of operations.
Divestitures
On October 1, 2015, the Company completed the sale of its wholly-owned subsidiary that owned certain natural gas gathering and processing assets in the Delaware Basin in Loving County, Texas (the “Loving County Processing System”) to an affiliate of EnLink Midstream Partners, LP (“EnLink”). The Loving County Processing System included a cryogenic natural gas processing plant with approximately 35 MMcf per day of inlet capacity (the “Wolf Processing Plant”) and approximately six miles of high-pressure gathering pipeline which connects the Company’s gathering system to the Wolf Processing Plant.
Pursuant to the terms of the transaction, EnLink paid approximately $143.4 million and the Company received net proceeds of approximately $139.8 million, after deducting customary purchase price adjustments of approximately $3.6 million. In conjunction with the sale of the Loving County Processing System, the Company dedicated a significant portion of its leasehold interests in Loving County as of the closing date pursuant to a 15-year fixed-fee natural gas gathering and processing agreement and provided a volume commitment in exchange for priority one service. See Note 13 for more information related to this agreement.
Due to the terms of the agreement, the transaction was accounted for as a sale and leaseback transaction; the carrying value of the net assets sold of approximately $31.0 million was removed from the consolidated balance sheet as of December 31, 2015 and the resulting difference of approximately $108.4 million between the net proceeds received less closing costs of $0.4 million and the basis of the assets sold was recorded as deferred gain on plant sale and was to be recognized as a gain on asset sales over the 15-year term of the gathering and processing agreement.
During the fourth quarter of 2016, EnLink completed construction of another processing plant in Loving County, Texas. Upon completion and successful testing of this new plant, as allowed under the gathering and processing agreement, EnLink is now processing the Company’s natural gas produced in this area at the new plant. As such, the gathering and processing agreement the Company entered into with EnLink is no longer considered a lease, and accordingly, the Company recognized the unamortized gain on the sale of $107.3 million in the consolidated statement of operations for the year ended December 31, 2016.
The Company can, at its option and upon mutual agreement with EnLink, dedicate any future leasehold acquisitions in Loving County to EnLink. In addition, the Company retained its natural gas gathering system up to a central delivery point and its other midstream assets in the area, including oil and water gathering systems and salt water disposal wells. On February 17, 2017 these assets were contributed to the Joint Venture (as described and defined in Note 18).
NOTE 6 — DEBT
Credit Agreement
On September 28, 2012, the Company amended and restated its revolving credit agreement with the lenders party thereto (the “Credit Agreement”), which increased the maximum facility amount from $400.0 million to $500.0 million. MRC Energy Company, which is a subsidiary of Matador and directly or indirectly holds the ownership interests in the Company’s other operating subsidiaries, other than its less-than-wholly-owned subsidiaries, is the borrower under the Credit Agreement. Borrowings are secured by mortgages on at least 80% of the Company’s proved oil and natural gas properties and by the equity interests of MRC Energy Company’s wholly-owned subsidiaries, which are also guarantors. In addition, all obligations under the Credit Agreement are guaranteed by Matador, the parent corporation. Various commodity hedging agreements with certain of the lenders under the Credit Agreement (or affiliates thereof) are also secured by the collateral of and guaranteed by certain eligible subsidiaries of MRC Energy Company.
The borrowing base under the Credit Agreement is determined semi-annually as of May 1 and November 1 by the lenders based primarily on the estimated value of the Company’s proved oil and natural gas reserves at December 31 and June 30 of each year, respectively. Both the Company and the lenders may request an unscheduled redetermination of the borrowing base once each between scheduled redetermination dates. On October 31, 2016, the borrowing base was increased from $300.0 million to $400.0 million based on the lenders’ review of the Company’s proved oil and natural gas reserves at June 30, 2016
F-16
Matador Resources Company and Subsidiaries
NOTES TO CONSOLIDATED FINANCIAL STATEMENTS — CONTINUED
December 31, 2016, 2015 and 2014
NOTE 6 — DEBT — Continued
using commodity price estimates prescribed by the lenders. This borrowing base increase was primarily attributable to increases in both the Company’s proved reserves volumes and increases in oil and natural gas prices in the latter part of 2016. All other provisions of the Credit Agreement remained unchanged. This October 2016 redetermination constituted the regularly scheduled November 1 redetermination. The Credit Agreement matures on October 16, 2020.
In the event of a borrowing base increase, the Company is required to pay a fee to the lenders equal to a percentage of the amount of the increase, which is determined based on market conditions at the time of the borrowing base increase. Total deferred loan costs were $1.3 million at December 31, 2016, and these costs are being amortized over the term of the Credit Agreement, which approximates amortization of these costs using the effective interest method. If, upon a redetermination of the borrowing base, the borrowing base were to be less than the outstanding borrowings under the Credit Agreement at any time, the Company would be required to provide additional collateral satisfactory in nature and value to the lenders to increase the borrowing base to an amount sufficient to cover such excess or to repay the deficit in equal installments over a period of six months.
During the year ended December 31, 2016, using a portion of the net proceeds from the December 2016 senior unsecured notes offering and the public offering of our common stock discussed herein, the Company repaid a total of $120.0 million of its outstanding borrowings under the Credit Agreement. At December 31, 2016, the Company had no borrowings outstanding under the Credit Agreement and approximately $0.8 million in outstanding letters of credit issued pursuant to the Credit Agreement. At February 22, 2017, the Company continued to have no borrowings outstanding under the Credit Agreement and approximately $0.8 million in outstanding letters of credit issued pursuant to the Credit Agreement.
Borrowings under the Credit Agreement may be in the form of a base rate loan or a Eurodollar loan. If the Company borrows funds as a base rate loan, such borrowings will bear interest at a rate equal to the higher of (i) the prime rate for such day or (ii) the Federal Funds Effective Rate (as defined in the Credit Agreement) on such day, plus 0.50% or (iii) the daily adjusting LIBOR rate (as defined in the Credit Agreement) plus 1.0% plus, in each case, an amount from 0.50% to 1.50% of such outstanding loan depending on the level of borrowings under the Credit Agreement. If the Company borrows funds as a Eurodollar loan, such borrowings will bear interest at a rate equal to (i) the quotient obtained by dividing (A) the LIBOR rate by (B) a percentage equal to 100% minus the maximum rate during such interest calculation period at which Royal Bank of Canada (“RBC”) is required to maintain reserves on Eurocurrency Liabilities (as defined in Regulation D of the Board of Governors of the Federal Reserve System) plus (ii) an amount from 1.50% to 2.50% of such outstanding loan depending on the level of borrowings under the Credit Agreement. The interest period for Eurodollar borrowings may be one, two, three or six months as designated by the Company.
A commitment fee of 0.375% to 0.50%, depending on the unused availability under the Credit Agreement, is also paid quarterly in arrears. The Company includes this commitment fee, any amortization of deferred financing costs (including origination, borrowing base increase and amendment fees) and annual agency fees, if any, as interest expense and in its interest rate calculations and related disclosures. The Credit Agreement requires the Company to maintain a debt to EBITDA ratio, which is defined as total debt outstanding divided by a rolling four quarter EBITDA calculation, of 4.25 or less.
Subject to certain exceptions, the Credit Agreement contains various covenants that limit the Company’s ability to take certain actions, including, but not limited to, the following:
• | incur indebtedness or grant liens on any of the Company’s assets; |
• | enter into commodity hedging agreements; |
• | declare or pay dividends, distributions or redemptions; |
• | merge or consolidate; |
• | make any loans or investments; |
• | engage in transactions with affiliates; |
• | engage in certain asset dispositions, including a sale of all or substantially all of the Company’s assets; and |
• | take certain actions with respect to the Company’s senior unsecured notes. |
If an event of default exists under the Credit Agreement, the lenders will be able to accelerate the maturity of the borrowings and exercise other rights and remedies. Events of default include, but are not limited to, the following events:
F-17
Matador Resources Company and Subsidiaries
NOTES TO CONSOLIDATED FINANCIAL STATEMENTS — CONTINUED
December 31, 2016, 2015 and 2014
NOTE 6 — DEBT — Continued
• | failure to pay any principal or interest on the outstanding borrowings or any reimbursement obligation under any letter of credit when due or any fees or other amounts within certain grace periods; |
• | failure to perform or otherwise comply with the covenants and obligations in the Credit Agreement or other loan documents, subject, in certain instances, to certain grace periods; |
• | bankruptcy or insolvency events involving the Company or its subsidiaries; and |
• | a change of control, as defined in the Credit Agreement. |
The Company believes that it was in compliance with the terms of the Credit Agreement at December 31, 2016.
Senior Unsecured Notes
On April 14, 2015, Matador issued $400.0 million of 6.875% senior notes due 2023 (the “Original Notes”) in a private placement. The Original Notes are Matador’s senior unsecured obligations, are redeemable as described below and were issued at par value. The net proceeds were used to pay down a portion of the outstanding borrowings under the Credit Agreement and the debt assumed in connection with the HEYCO Merger. The Original Notes mature on April 15, 2023 and interest is payable semi-annually in arrears on April 15 and October 15 of each year.
On October 21, 2015, and pursuant to a registered exchange offer, the Company exchanged all of the privately placed Original Notes for a like principal amount of 6.875% senior notes due 2023 that have been registered under the Securities Act (the “Registered Notes”). The terms of such Registered Notes are substantially the same as the terms of the Original Notes except that the transfer restrictions, registration rights and provisions for additional interest relating to the Original Notes do not apply to the Registered Notes.
On December 9, 2016, Matador issued $175.0 million of 6.875% senior notes due 2023 (the “Additional Notes” and, collectively with the Registered Notes, the “Notes”) in a private placement (the “Notes Offering”). The Additional Notes were issued pursuant to and are governed by the same indenture governing the Original Notes (the “Indenture”). The Additional Notes were issued at 105.5% of par, plus accrued interest from October 15, 2016, resulting in an effective interest rate of 5.5%. We received net proceeds from the Notes Offering of approximately $181.5 million, including the issue premium, but after deducting the initial purchasers’ discounts and estimated offering expenses and excluding accrued interest paid by buyers of the Additional Notes. A portion of the net proceeds of the Notes Offering, along with the proceeds from the December 2016 public offering of our common stock, have been used to partially fund certain acreage acquisitions and midstream asset development, to repay outstanding borrowings under the Credit Agreement and for general corporate purposes, including capital expenditures associated with the addition of a fourth drilling rig. The Notes are our senior unsecured obligations and are redeemable as described below. The Notes mature on April 15, 2023, and interest is payable semi-annually in arrears on April 15 and October 15 of each year.
On or after April 15, 2018, Matador may redeem all or a portion of the Notes at any time or from time to time at the following redemption prices (expressed as percentages of the principal amount) plus accrued and unpaid interest, if any, to the applicable redemption date, if redeemed during the 12-month period beginning on April 15 of the years indicated.
Year | Redemption Price | |
2018 | 105.156% | |
2019 | 103.438% | |
2020 | 101.719% | |
2021 and thereafter | 100.000% | |
At any time prior to April 15, 2018, Matador may redeem up to 35% of the aggregate principal amount of the Notes with net proceeds from certain equity offerings at a redemption price of 106.875% of the principal amount of the Notes, plus accrued and unpaid interest, if any, to the redemption date; provided that (i) at least 65% in aggregate principal amount of the Notes (including any additional notes) originally issued remains outstanding immediately after the occurrence of such redemption (excluding Notes held by Matador and its subsidiaries) and (ii) each such redemption occurs within 180 days of the date of the closing of the related equity offering.
F-18
Matador Resources Company and Subsidiaries
NOTES TO CONSOLIDATED FINANCIAL STATEMENTS — CONTINUED
December 31, 2016, 2015 and 2014
NOTE 6 — DEBT — Continued
In addition, at any time prior to April 15, 2018, Matador may redeem all or part of the Notes at a redemption price equal to the sum of (i) the principal amount thereof, plus (ii) the excess, if any, of (a) the present value at such time of (1) the redemption price of such Notes at April 15, 2018 plus (2) any required interest payments due on such Notes through April 15, 2018 discounted to the redemption date on a semi-annual basis using a discount rate equal to the Treasury Rate (as defined in the Indenture) plus 50 basis points, over (b) the principal amount of such Notes, plus (iii) accrued and unpaid interest, if any, to the redemption date.
Subject to certain exceptions, the Indenture contains various covenants that limit the Company’s ability to take certain actions, including, but not limited to, the following:
• | incur or guarantee additional debt or issue certain types of preferred stock; |
• | pay dividends on capital stock or redeem, repurchase or retire its capital stock or subordinated indebtedness; |
• | transfer or sell assets; |
• | make certain investments; |
• | create certain liens; |
• | enter into agreements that restrict dividends or other payments from its Restricted Subsidiaries (as defined in the Indenture) to the Company; |
• | consolidate, merge or transfer all or substantially all of its assets; |
• | engage in transactions with affiliates; and |
• | create unrestricted subsidiaries. |
In the case of an event of default arising from certain events of bankruptcy or insolvency with respect to Matador, any Restricted Subsidiary that is a Significant Subsidiary (as defined in the Indenture) or any group of Restricted Subsidiaries that, taken together, would constitute a Significant Subsidiary, all outstanding Notes will become due and payable immediately without further action or notice. If any other event of default occurs and is continuing, the trustee or the holders of at least 25% in principal amount of the then outstanding Notes may declare all the Notes to be due and payable immediately. Events of default include, but are not limited to, the following events:
• | default for 30 days in the payment when due of interest on the Notes; |
• | default in the payment when due of the principal of, or premium, if any, on the Notes; |
• | failure by Matador to comply with its obligations to offer to purchase or purchase Notes when required pursuant to the change of control or asset sale provisions of the Indenture or Matador’s failure to comply with the covenant relating to merger, consolidation or sale of assets; |
• | failure by Matador for 180 days after notice to comply with its reporting obligations under the Indenture; |
• | failure by Matador for 60 days after notice to comply with any of the other agreements in the Indenture; |
• | payment defaults and accelerations with respect to other indebtedness of Matador and its Restricted Subsidiaries in the aggregate principal amount of $25.0 million or more; |
• | failure by Matador or any Restricted Subsidiary to pay certain final judgments aggregating in excess of $25.0 million within 60 days; |
• | any subsidiary guarantee by a guarantor ceasing to be in full force and effect, being declared null and void in a judicial proceeding or being denied or disaffirmed by its maker; and |
• | certain events of bankruptcy or insolvency with respect to Matador or any Restricted Subsidiary that is a Significant Subsidiary or any group of Restricted Subsidiaries that, taken together, would constitute a Significant Subsidiary. |
F-19
Matador Resources Company and Subsidiaries
NOTES TO CONSOLIDATED FINANCIAL STATEMENTS — CONTINUED
December 31, 2016, 2015 and 2014
NOTE 7 — INCOME TAXES
Deferred tax assets and liabilities are the result of temporary differences between the financial statement carrying values and the tax bases of assets and liabilities. The Company’s net deferred tax position as of December 31, 2016 and 2015, respectively, is as follows (in thousands).
December 31, | ||||||||
2016 | 2015 | |||||||
Deferred tax assets | ||||||||
Unrealized loss on derivatives | $ | 8,734 | $ | — | ||||
Net operating loss carryforwards | 137,757 | 79,208 | ||||||
Alternative minimum tax carryforward | 8,633 | 9,785 | ||||||
Percentage depletion carryover | 2,595 | 2,442 | ||||||
Property and equipment | 44,391 | 42,757 | ||||||
Deferred gain on sale leaseback transaction | — | 32,831 | ||||||
Other | — | 7,396 | ||||||
Total deferred tax assets | 202,110 | 174,419 | ||||||
Valuation allowance on deferred tax assets | (190,255 | ) | (154,320 | ) | ||||
Total deferred tax assets, net of valuation allowance | 11,855 | 20,099 | ||||||
Deferred tax liabilities | ||||||||
Unrealized gain on derivatives | (3,800 | ) | (5,699 | ) | ||||
Other | (8,055 | ) | (14,400 | ) | ||||
Total deferred tax liabilities | (11,855 | ) | (20,099 | ) | ||||
Net deferred tax liabilities | $ | — | $ | — | ||||
At December 31, 2016, the Company had net operating loss carryforwards of $375.9 million for federal income tax purposes and $6.2 million for state income tax purposes available to offset future taxable income, as limited by the applicable provisions, and which expire at various dates beginning December 31, 2027 for the federal net operating loss carryforwards. The state net operating loss carryforwards began expiring at various dates beginning December 31, 2013 for the State of New Mexico; however, the significant portion of the Company’s state net operating loss carryforwards expire beginning in 2027.
As a result of the net capitalized costs of the Company’s oil and natural gas properties less related deferred income taxes exceeding the full-cost ceiling during the years ended December 31, 2016 and 2015, the Company recorded an impairment charge of $158.6 million and $801.2 million, respectively, exclusive of tax effect, to the net capitalized costs of its oil and natural gas properties. At December 31, 2016 and 2015, the Company’s deferred tax assets exceeded its deferred tax liabilities due to the deferred tax assets generated by the impairment charges recorded in 2015 and 2016. As a result, at December 31, 2016 and 2015, the Company maintained a valuation allowance against the Company’s federal and state deferred tax assets. The valuation allowance will continue to be recognized until the realization of future tax benefits are more likely than not to be utilized.
F-20
Matador Resources Company and Subsidiaries
NOTES TO CONSOLIDATED FINANCIAL STATEMENTS — CONTINUED
December 31, 2016, 2015 and 2014
NOTE 7 — INCOME TAXES — Continued
The current income tax provision for the years ended December 31, 2016, 2015 and 2014, respectively, was comprised of the following (in thousands).
Year Ended December 31, | ||||||||||||
2016 | 2015 | 2014 | ||||||||||
Current income tax provision | ||||||||||||
State income tax | $ | 108 | $ | 371 | $ | — | ||||||
Federal alternative minimum tax | (1,144 | ) | 2,588 | 133 | ||||||||
Net current income tax (benefit) provision | $ | (1,036 | ) | $ | 2,959 | $ | 133 | |||||
Reconciliations of the tax (benefit) expense computed at the statutory federal rate to the Company’s total income tax (benefit) provision for the years ended December 31, 2016, 2015 and 2014, respectively, is as follows (in thousands).
Year Ended December 31, | ||||||||||||
2016 | 2015 | 2014 | ||||||||||
Federal tax (benefit) expense at statutory rate (1) | $ | (34,333 | ) | $ | (289,412 | ) | $ | 61,301 | ||||
State income tax | 539 | (13,215 | ) | 2,707 | ||||||||
Permanent differences (2) | (499 | ) | 698 | 397 | ||||||||
Federal alternative minimum tax | 1,144 | (2,588 | ) | (133 | ) | |||||||
Change in federal valuation allowance | 33,688 | 145,777 | — | |||||||||
Change in state valuation allowance | (539 | ) | 8,413 | (30 | ) | |||||||
Net deferred income tax (benefit) provision | — | (150,327 | ) | 64,242 | ||||||||
Net current income tax (benefit) provision | (1,036 | ) | 2,959 | 133 | ||||||||
Total income tax (benefit) provision | $ | (1,036 | ) | $ | (147,368 | ) | $ | 64,375 | ||||
__________________
(1) | The statutory federal tax rate was 35% for the years ended December 31, 2016, 2015 and 2014. |
(2) | Amount is primarily attributable to stock-based compensation. |
The Company files a United States federal income tax return and several state tax returns, a number of which remain open for examination. The earliest tax year open for examination for the federal, the State of New Mexico and the State of Louisiana tax returns is 2012. The earliest tax year open for examination by the State of Texas is 2009. During the year ended December 31, 2016, the Company’s 2009 and 2010 franchise tax returns were under examination by the State of Texas. This examination has been completed with no additional tax due; however, the examination has not been formally closed. In addition, as of December 31, 2016, the Company’s 2013 federal income tax return was under examination by the Internal Revenue Service. This examination has been completed with no additional tax due; however, the examination has not been formally closed.
The Company has evaluated all tax positions for which the statute of limitations remains open and believes that the material positions taken would more likely than not be sustained by examination. Therefore, at December 31, 2016, the Company had not established any reserves for, nor recorded any unrecognized benefits related to, uncertain tax positions.
F-21
Matador Resources Company and Subsidiaries
NOTES TO CONSOLIDATED FINANCIAL STATEMENTS — CONTINUED
December 31, 2016, 2015 and 2014
NOTE 8 — STOCK-BASED COMPENSATION
Stock Options, Restricted Stock, Restricted Stock Units, Stock and Performance Awards
In 2003, the Company’s Board of Directors and shareholders approved the 2003 Stock and Incentive Plan (the “2003 Plan”). The 2003 Plan, as amended, provided that a maximum of 3,481,569 shares of common stock in the aggregate could be issued pursuant to options or restricted stock grants. The persons eligible to receive awards under the 2003 Plan included employees, directors, contractors or advisors of the Company.
In 2012, the Board of Directors adopted and shareholders approved the 2012 Long-Term Incentive Plan (as subsequently amended and restated, the “2012 Incentive Plan”). As of December 31, 2016, the 2012 Incentive Plan provided for a maximum of 8,700,000 shares of common stock in the aggregate that may be issued by the Company pursuant to grants of stock options, restricted stock, stock appreciation rights, restricted stock units or other performance awards. The persons eligible to receive awards under the 2012 Incentive Plan include employees, directors, contractors or advisors of the Company. The primary purpose of the 2012 Incentive Plan is to attract and retain key employees, key contractors and outside directors and advisors of the Company. With the adoption of the 2012 Incentive Plan, the Company does not plan to make any future awards under the 2003 Plan, but the 2003 Plan will remain in place until all awards outstanding under that plan have been settled.
The 2003 Plan and the 2012 Incentive Plan are administered by the independent members of the Board of Directors, which, upon recommendation of the Compensation Committee of the Board of Directors, determine the number of options, restricted shares or other awards to be granted, the effective dates, the terms of the grants and the vesting periods. The Company typically uses newly issued shares of common stock to satisfy option exercises or restricted share grants. All stock-based compensation awards granted since 2012 have been granted under the 2012 Incentive Plan and are equity-based awards for which the fair value is fixed at the grant date, while all stock-based compensation awards granted prior to January 1, 2012 were granted under the 2003 Plan and are liability-based awards for which the fair value is remeasured at each reporting period.
Stock Options
Historically, stock option awards have been granted to purchase the Company’s common stock at an exercise price equal to the fair market value on the date of grant, a typical vesting period of three or four years and a typical maximum term of five or ten years.
The fair value of stock option awards outstanding under the 2003 Plan was estimated using the following weighted average assumptions at December 31, 2016, 2015 and 2014.
2016 | 2015 | 2014 | ||||
Stock option pricing model | Black Scholes Merton | Black Scholes Merton | Black Scholes Merton | |||
Expected option life | 3.14 years | 0.39 years | 1.51 years | |||
Risk-free interest rate | 1.70% | 0.64% | 0.74% | |||
Volatility | 47.07% | 91.98% | 55.14% | |||
Dividend yield | —% | —% | —% | |||
Estimated forfeiture rate | —% | —% | —% | |||
The weighted average grant date fair value for stock option awards outstanding under the 2012 Incentive Plan was estimated using the following weighted average assumptions during the years ended December 31, 2016, 2015 and 2014.
2016 | 2015 | 2014 | ||||
Stock option pricing model | Black Scholes Merton | Black Scholes Merton | Black Scholes Merton | |||
Expected option life | 3.96 years | 4.00 years | 3.99 years | |||
Risk-free interest rate | 1.08% | 1.15% | 1.21% | |||
Volatility | 45.68% | 56.89% | 51.47% | |||
Dividend yield | —% | —% | —% | |||
Estimated forfeiture rate | 1.16% | 3.21% | 4.28% | |||
Weighted average fair value of stock option awards granted during the year | $5.65 | $9.90 | $9.45 | |||
F-22
Matador Resources Company and Subsidiaries
NOTES TO CONSOLIDATED FINANCIAL STATEMENTS — CONTINUED
December 31, 2016, 2015 and 2014
NOTE 8 — STOCK-BASED COMPENSATION — Continued
The Company estimated the future volatility of its common stock using the historical value of its stock for a period of time commensurate with the expected term of the stock option. The expected term was estimated using the simplified method outlined in Staff Accounting Bulletin Topic 14. The risk-free interest rate is the rate for constant yield U.S. Treasury securities with a term to maturity that is consistent with the expected term of the award.
Summarized information about stock options outstanding at December 31, 2016 under the 2003 Plan and the 2012 Incentive Plan is as follows.
Number of options (in thousands) | Weighted average exercise price | ||||||
Options outstanding at December 31, 2015 | 2,363 | $ | 15.40 | ||||
Options granted | 668 | $ | 15.51 | ||||
Options exercised | (114 | ) | $ | 10.12 | |||
Options forfeited | (28 | ) | $ | 19.73 | |||
Options expired | (2 | ) | $ | 22.66 | |||
Options outstanding at December 31, 2016 | 2,887 | $ | 15.59 | ||||
Options outstanding at December 31, 2016 | Options exercisable at December 31, 2016 | |||||||||||||||
Range of exercise prices | Shares outstanding (in thousands) | Weighted average remaining contractual life | Weighted average exercise price | Shares exercisable (in thousands) | Weighted average exercise price | |||||||||||
$8.18 - $9.55 | 816 | 1.30 | $ | 8.30 | 484 | $ | 8.35 | |||||||||
$10.49 - $17.80 | 925 | 2.87 | $ | 13.55 | 302 | $ | 10.58 | |||||||||
$18.77 - $22.70 | 862 | 3.05 | $ | 21.84 | 65 | $ | 21.21 | |||||||||
$23.40 - $27.33 | 284 | 2.26 | $ | 24.22 | 112 | $ | 23.49 | |||||||||
At December 31, 2016, the aggregate intrinsic value was $29.4 million for outstanding options and $13.6 million for exercisable options, based on the Company’s quoted closing market price of $25.76 per share on that date. The remaining weighted average contractual term of exercisable options at December 31, 2016 was 1.19 years.
The total intrinsic value of options exercised during the years ended December 31, 2016, 2015 and 2014 was $1.6 million, $1.3 million and $0.2 million, respectively. The tax related benefit realized from the exercise of stock options totaled $0.5 million, $0.3 million and $0.1 million for the years ended December 31, 2016, 2015 and 2014, respectively.
During the years ended December 31, 2016, 2015 and 2014, the Company recognized $5.9 million, $4.7 million and $2.5 million, respectively, in stock-based compensation expense attributable to stock options. At December 31, 2016, 2015 and 2014, the Company had recorded $1.4 million, zero and $1.4 million of long-term liabilities and zero, $1.0 million and zero of current liabilities, respectively, related to its outstanding liability-based stock options. The Company did not settle any liability-based awards in cash for the years ended December 31, 2016, 2015 and 2014, respectively.
At December 31, 2016, the total remaining unrecognized compensation expense related to unvested stock options was approximately $6.9 million and the weighted average remaining requisite service period (vesting period) of all unvested stock options was 1.90 years.
The fair value of options vested during 2016, 2015 and 2014 was $3.0 million, $1.3 million and $1.5 million, respectively.
Restricted Stock, Restricted Stock Units and Common Stock
The Company has granted stock, restricted stock and restricted stock unit awards to employees, outside directors and advisors of the Company under the 2003 Plan and the 2012 Incentive Plan. The stock and restricted stock are issued upon grant, with the restrictions, if any, being removed upon vesting. The restricted stock units are issued upon vesting, unless the recipient
F-23
Matador Resources Company and Subsidiaries
NOTES TO CONSOLIDATED FINANCIAL STATEMENTS — CONTINUED
December 31, 2016, 2015 and 2014
NOTE 8 — STOCK-BASED COMPENSATION — Continued
makes an election to defer issuance for a set term after vesting. One current director elected to defer the issuance of his awards in 2015, 2014 and 2013. All awards granted in 2016, 2015 and 2014 were service based awards and vest over the service period, which is one to four years. All restricted stock and restricted stock unit awards outstanding at December 31, 2016 were granted under the 2012 Incentive Plan.
A summary of the non-vested restricted stock and restricted stock units as of December 31, 2016 is presented below (in thousands, except fair value).
Restricted Stock | Restricted Stock Units | |||||||||||||
Non-vested restricted stock and restricted stock units | Shares | Weighted average fair value | Shares | Weighted average fair value | ||||||||||
Non-vested at December 31, 2015 | 854 | $ | 17.64 | 68 | $ | 21.89 | ||||||||
Granted | 472 | $ | 18.55 | 66 | $ | 19.44 | ||||||||
Vested | (225 | ) | $ | 16.05 | (52 | ) | $ | 19.67 | ||||||
Forfeited | (62 | ) | $ | 20.49 | — | — | ||||||||
Non-vested at December 31, 2016 | 1,039 | $ | 18.23 | 82 | $ | 21.32 | ||||||||
At December 31, 2016, the aggregate intrinsic value for the restricted stock and restricted stock units outstanding was $28.9 million as calculated based on the maximum number of shares of restricted stock and restricted stock units vesting, using the Company’s quoted closing market price of $25.76 per share on that date.
During the years ended December 31, 2016, 2015 and 2014, the Company recognized approximately $6.6 million, $4.7 million and $3.0 million, respectively, in stock-based compensation expense attributable to restricted stock and restricted stock units.
At December 31, 2016, the total remaining unrecognized compensation expense related to unvested restricted stock and restricted stock units was approximately $12.5 million and the weighted average remaining requisite service period (vesting period) of all non-vested restricted stock and restricted stock units was 1.8 years.
The fair value of restricted stock and restricted stock units vested during 2016, 2015 and 2014 was $4.6 million, $0.8 million and $0.9 million, respectively.
The total tax benefit recognized for all stock-based compensation was $4.3 million, $3.4 million and $1.9 million for the years ended December 31, 2016, 2015 and 2014, respectively.
In mid-February 2017, the Company granted awards of 228,174 shares of restricted stock and options to purchase 590,128 shares of the Company’s common stock at an exercise price of $27.26 per share to certain of its employees. The fair value of these awards was approximately $12.4 million. All of these awards vest ratably over three years.
In mid-February 2017, the Company also granted awards of 174,561 shares of restricted stock and options to purchase 444,491 shares of the Company’s common stock at an exercise price of $26.86 per share to certain of its employees. The fair value of these awards was approximately $9.3 million. All of these awards vest ratably over three years.
NOTE 9 — EMPLOYEE BENEFIT PLANS
401(k) Plan
All full-time Company employees are eligible to join the Company’s defined contribution retirement plan the first day of the calendar month immediately following their date of employment. Each employee may contribute up to the maximum allowable under the Internal Revenue Code. Each year, the Company makes a contribution to the plan which equals 3% of the employee’s annual compensation, referred to as the Employer’s Safe Harbor Non-Elective Contribution, which totaled approximately $0.7 million, $0.6 million and $0.4 million in 2016, 2015 and 2014, respectively. In addition, each year, the Company may make a discretionary matching contribution, as well as additional contributions. The Company’s discretionary matching contributions totaled $0.9 million, $0.8 million and $0.5 million in 2016, 2015 and 2014, respectively. The Company made no additional discretionary contributions in any reporting period presented.
F-24
Matador Resources Company and Subsidiaries
NOTES TO CONSOLIDATED FINANCIAL STATEMENTS — CONTINUED
December 31, 2016, 2015 and 2014
NOTE 10 — EQUITY
Stock Offerings, Retirement and Issuances
On December 9, 2016, the Company completed a public offering of 6,000,000 shares of its common stock. After deducting offering costs totaling approximately $0.4 million, the Company received net proceeds of approximately $145.8 million. A portion of the net proceeds of the public offering, along with the proceeds from the Notes Offering (see Note 6), have been used to partially fund certain acreage acquisitions and midstream asset development, to repay outstanding borrowings under the Credit Agreement and for general corporate purposes, including capital expenditures associated with the addition of a fourth drilling rig.
On March 11, 2016, the Company completed a public offering of 7,500,000 shares of its common stock. After deducting offering costs totaling approximately $0.8 million, the Company received net proceeds of approximately $141.5 million, which were used for general corporate purposes, including to fund a portion of the Company’s 2016 capital expenditures.
As discussed in Note 5, the Company issued 3,300,000 shares of common stock and 150,000 shares of a new series of Series A Preferred Stock to HEYCO Energy Group, Inc. in connection with the HEYCO Merger. Pursuant to the statement of resolutions, each share of Series A Preferred Stock would automatically convert into ten shares of Matador common stock, subject to customary anti-dilution adjustments, upon the vote and approval by Matador’s shareholders of an amendment to Matador’s Amended and Restated Certificate of Formation to increase the number of shares of authorized Matador common stock.
On April 2, 2015, the shareholders of the Company approved an amendment to the Company’s Amended and Restated Certificate of Formation that authorized an increase in the number of authorized shares of common stock from 80,000,000 shares to 120,000,000 shares. Following such approval, the 150,000 outstanding shares of Series A Preferred Stock converted to 1,500,000 shares of common stock on April 6, 2015. Pursuant to the terms of the HEYCO Merger, 166,667 of the 1,500,000 shares were being held in escrow at December 31, 2016 to satisfy certain conditions under the merger agreement.
On April 21, 2015, the Company completed a public offering of 7,000,000 shares of its common stock. After deducting offering costs totaling approximately $1.2 million, the Company received net proceeds of approximately $187.6 million.
On May 29, 2014, the Company completed a public offering of 7,500,000 shares of its common stock. After deducting direct offering costs totaling approximately $0.6 million, the Company received net proceeds of approximately $181.3 million.
Treasury Stock
On October 27, 2016, October 30, 2015 and October 31, 2014, Matador’s Board of Directors canceled all of the shares of treasury stock outstanding as of September 30, 2016, September 30, 2015 and September 30, 2014, respectively. These shares were restored to the status of authorized but unissued shares of common stock of the Company.
The shares of treasury stock outstanding at December 31, 2016, 2015 and 2014 represent forfeitures of non-vested restricted stock awards and forfeitures of fully vested restricted stock awards due to net share settlements with employees.
NOTE 11 — DERIVATIVE FINANCIAL INSTRUMENTS
From time to time, the Company uses derivative financial instruments to mitigate its exposure to commodity price risk associated with oil, natural gas and natural gas liquids prices. The Company records derivative financial instruments on its consolidated balance sheets as either assets or liabilities measured at fair value. The Company has elected not to apply hedge accounting for its existing derivative financial instruments. As a result, the Company recognizes the change in derivative fair value between reporting periods currently in its consolidated statements of operations as an unrealized gain or loss. The fair value of the Company’s derivative financial instruments is determined using industry-standard models that consider various inputs including: (i) quoted forward prices for commodities, (ii) time value of money and (iii) current market and contractual prices for the underlying instruments, as well as other relevant economic measures. The Company has evaluated and considered the credit standings of its counterparties in determining the fair value of its derivative financial instruments.
The Company typically uses costless (or zero-cost) collars and/or swap contracts to manage risks related to changes in oil, natural gas and natural gas liquids prices. Costless collars provide the Company with downside price protection through the purchase of a put option which is financed through the sale of a call option. Because the call option proceeds are used to offset the cost of the put option, these arrangements are initially “costless” to the Company. In the case of a costless collar, the put option and the call option have different fixed price components. In a swap contract, a floating price is exchanged for a fixed price over a specified period, providing downside price protection.
F-25
Matador Resources Company and Subsidiaries
NOTES TO CONSOLIDATED FINANCIAL STATEMENTS — CONTINUED
December 31, 2016, 2015 and 2014
NOTE 11 — DERIVATIVE FINANCIAL INSTRUMENTS — Continued
At December 31, 2016, we had entered into various costless collar contracts to mitigate our exposure to fluctuations in oil and natural gas prices, each with an established price floor and ceiling. For each calculation period, the specified price for determining the realized gain or loss to us pursuant to any oil contract is the arithmetic average of the settlement prices for the NYMEX West Texas Intermediate oil futures contract for the first nearby month corresponding to the calculation period’s calendar month, and for any natural gas contract is the settlement price for the NYMEX Henry Hub natural gas futures contract for the delivery month corresponding to the calculation period’s calendar month for the settlement date of that contract period.
When the settlement price is below the price floor established by one or more of these collars, the Company receives from the counterparty an amount equal to the difference between the settlement price and the price floor multiplied by the contract oil or natural gas volume. When the settlement price is above the price ceiling established by one or more of these collars, the Company pays to the counterparty an amount equal to the difference between the settlement price and the price ceiling multiplied by the contract oil or natural gas volume. When the settlement price is below the fixed price established by one or more of these swaps, the Company receives from the counterparty an amount equal to the difference between the settlement price and the fixed price multiplied by the contract natural gas liquids volume. When the settlement price is above the fixed price established by one or more of these swaps, the Company pays to the counterparty an amount equal to the difference between the settlement price and the fixed price multiplied by the contract natural gas liquids volume
At December 31, 2016, the Company had various costless collar contracts open and in place to mitigate its exposure to oil and natural gas price volatility, each with a specific term (calculation period), notional quantity (volume hedged) and price floor and ceiling. Each contract is set to expire at varying times during 2017 and 2018.
F-26
Matador Resources Company and Subsidiaries
NOTES TO CONSOLIDATED FINANCIAL STATEMENTS — CONTINUED
December 31, 2016, 2015 and 2014
NOTE 11 — DERIVATIVE FINANCIAL INSTRUMENTS — Continued
The following is a summary of the Company’s open costless collar contracts for oil and natural gas at December 31, 2016.
Notional Quantity (Bbl or MMBtu) | Weighted Average Price Floor ($/Bbl or $/MMBtu) | Weighted Average Price Ceiling ($/Bbl or $/MMBtu) | Fair Value of Liabilities (thousands) | ||||||||||||||
Commodity | Calculation Period | ||||||||||||||||
Oil | 01/01/2017 - 12/31/2017 | 2,760,000 | $ | 41.39 | $ | 51.88 | $ | (18,316 | ) | ||||||||
Oil | 01/01/2018 - 12/31/2018 | 720,000 | $ | 43.75 | $ | 63.90 | (751 | ) | |||||||||
Natural Gas | 01/01/2017 - 12/31/2017 | 16,860,000 | $ | 2.40 | $ | 3.59 | (5,887 | ) | |||||||||
Total open derivative financial instruments | $ | (24,954 | ) | ||||||||||||||
Subsequent to December 31, 2016, the Company entered into various costless collar contracts for oil. The costless collar contracts for oil included approximately 1,890,000 Bbl in 2017 with a weighted average floor price of $50.00 per Bbl and a weighted average ceiling price of $60.75 per Bbl.
From time-to-time we enter into derivative financial instruments with certain counterparties. These derivative financial instruments are subject to master netting arrangements; all but one counterparty allow for cross-commodity master netting provided the settlements dates for the commodities are the same. The Company does not present different types of commodities with the same counterparty on a net basis in its consolidated balance sheets.
The following table presents the gross asset and liability fair values of the Company’s commodity price derivative financial instruments and the location of these balances in the consolidated balance sheets as of December 31, 2016 and December 31, 2015 (in thousands).
Derivative Instruments | Gross amounts recognized | Gross amounts netted in the consolidated balance sheets | Net amounts presented in the consolidated balance sheets | ||||||||
December 31, 2016 | |||||||||||
Current liabilities | $ | (24,203 | ) | $ | — | $ | (24,203 | ) | |||
Other liabilities | (751 | ) | — | (751 | ) | ||||||
Total | $ | (24,954 | ) | $ | — | $ | (24,954 | ) | |||
December 31, 2015 | |||||||||||
Current assets | $ | 16,767 | $ | (483 | ) | $ | 16,284 | ||||
Current liabilities | (483 | ) | 483 | — | |||||||
Total | $ | 16,284 | $ | — | $ | 16,284 | |||||
F-27
Matador Resources Company and Subsidiaries
NOTES TO CONSOLIDATED FINANCIAL STATEMENTS — CONTINUED
December 31, 2016, 2015 and 2014
NOTE 11 — DERIVATIVE FINANCIAL INSTRUMENTS — Continued
The following table summarizes the location and aggregate fair value of all derivative financial instruments recorded in the consolidated statements of operations for the periods presented (in thousands). These derivative financial instruments are not designated as hedging instruments.
Year Ended December 31, | ||||||||||||||
Type of Instrument | Location in Statement of Operations | 2016 | 2015 | 2014 | ||||||||||
Derivative Instrument | ||||||||||||||
Oil | Revenues: Realized gain on derivatives | $ | 5,851 | $ | 62,259 | $ | 5,221 | |||||||
Natural Gas | Revenues: Realized gain (loss) on derivatives | 3,435 | 12,653 | (718 | ) | |||||||||
Natural Gas Liquids (NGL) | Revenues: Realized gain on derivatives | — | 2,182 | 519 | ||||||||||
Realized gain on derivatives | 9,286 | 77,094 | 5,022 | |||||||||||
Oil | Revenues: Unrealized (loss) gain on derivatives | (18,969 | ) | (31,897 | ) | 47,178 | ||||||||
Natural Gas | Revenues: Unrealized (loss) gain on derivatives | (22,269 | ) | (5,440 | ) | 9,087 | ||||||||
Natural Gas Liquids (NGL) | Revenues: Unrealized (loss) gain on derivatives | — | (1,928 | ) | 2,037 | |||||||||
Unrealized (loss) gain on derivatives | (41,238 | ) | (39,265 | ) | 58,302 | |||||||||
Total | $ | (31,952 | ) | $ | 37,829 | $ | 63,324 | |||||||
F-28
Matador Resources Company and Subsidiaries
NOTES TO CONSOLIDATED FINANCIAL STATEMENTS — CONTINUED
December 31, 2016, 2015 and 2014
NOTE 12 — FAIR VALUE MEASUREMENTS
The Company measures and reports certain financial and non-financial assets and liabilities on a fair value basis. Fair value is the price that would be received to sell an asset or paid to transfer a liability in an orderly transaction between market participants at the measurement date (exit price). Fair value measurements are classified and disclosed in one of the following categories.
Level 1 | Unadjusted quoted prices for identical, unrestricted assets or liabilities in active markets. |
Level 2 | Quoted prices in markets that are not active, or inputs which are observable, either directly or indirectly, for substantially the full term of the asset or liability. This category includes those derivative instruments that are valued with industry standard models that consider various inputs including: (i) quoted forward prices for commodities, (ii) time value of money and (iii) current market and contractual prices for the underlying instruments, as well as other relevant economic measures. Substantially all of these inputs are observable in the marketplace throughout the full term of the derivative instrument and can be derived from observable data or supported by observable levels at which transactions are executed in the marketplace. |
Level 3 | Unobservable inputs that are not corroborated by market data which reflect a company’s own market assumptions. |
Financial and non-financial assets and liabilities are classified based on the lowest level of input that is significant to the fair value measurement. The assessment of the significance of a particular input to the fair value measurement requires judgment, which may affect the valuation of the fair value of assets and liabilities and their placement within the fair value hierarchy levels.
At December 31, 2016 and 2015, the carrying values reported on the consolidated balance sheets for accounts receivable, prepaid expenses, accounts payable, accrued liabilities, royalties payable, amounts due to affiliates, advances from joint interest owners, amounts due to joint ventures, income taxes payable and other current liabilities approximate their fair values due to their short-term maturities.
At December 31, 2016 and 2015, the fair value of the Company’s Notes was $605.2 million and $381.0 million, respectively, based on quoted market prices, which represents Level 1 inputs in the fair value hierarchy.
The following tables summarize the valuation of the Company’s financial assets and liabilities that were accounted for at fair value on a recurring basis in accordance with the classifications provided above as of December 31, 2016 and 2015 (in thousands).
Fair Value Measurements at December 31, 2016 using | ||||||||||||||||
Description | ||||||||||||||||
Level 1 | Level 2 | Level 3 | Total | |||||||||||||
Assets (Liabilities) | ||||||||||||||||
Oil and natural gas derivatives | $ | — | $ | (24,954 | ) | $ | — | $ | (24,954 | ) | ||||||
Total | $ | — | $ | (24,954 | ) | $ | — | $ | (24,954 | ) | ||||||
Fair Value Measurements at December 31, 2015 using | ||||||||||||||||
Description | ||||||||||||||||
Level 1 | Level 2 | Level 3 | Total | |||||||||||||
Assets (Liabilities) | ||||||||||||||||
Oil and natural gas derivatives | $ | — | $ | 16,284 | $ | — | $ | 16,284 | ||||||||
Total | $ | — | $ | 16,284 | $ | — | $ | 16,284 | ||||||||
Additional disclosures related to derivative financial instruments are provided in Note 11. For purposes of fair value measurement, the Company determined that derivative financial instruments (e.g., oil, natural gas and NGL derivatives) should be classified as Level 2 in the fair value hierarchy.
Certain assets and liabilities are measured at fair value on a nonrecurring basis, including assets and liabilities acquired in a business combination (see Note 5), lease and well equipment inventory when the market value is determined to be lower than the cost of the inventory and other property and equipment that are reduced to fair value when they are impaired or held for
F-29
Matador Resources Company and Subsidiaries
NOTES TO CONSOLIDATED FINANCIAL STATEMENTS — CONTINUED
December 31, 2016, 2015 and 2014
NOTE 12 — FAIR VALUE MEASUREMENTS — Continued
sale. The Company recorded no impairment to its lease and well equipment inventory or other property and equipment in 2016 and 2015. The Company determined the value of the lease and well equipment inventory using Level 3 inputs and assumptions.
NOTE 13 — COMMITMENTS AND CONTINGENCIES
Office Lease
The Company’s corporate headquarters are located at One Lincoln Centre, 5400 LBJ Freeway, Suite 1500, Dallas, Texas 75240. The lease for the Company’s corporate headquarters expires during 2026. The base rate escalates during the course of the lease; however, the Company recognizes rent expense ratably over the term of the lease.
From time to time, the Company also enters into leases for field offices in locations where it has active field operations. These leases are typically for terms of less than five years and are not considered principal properties.
The following is a schedule of future minimum lease payments required under all office lease agreements as of December 31, 2016 (in thousands).
Year Ending December 31, | Amount | |||
2017 | $ | 2,443 | ||
2018 | 2,495 | |||
2019 | 2,528 | |||
2020 | 2,602 | |||
2021 | 2,660 | |||
Thereafter | 12,335 | |||
Total | $ | 25,063 | ||
Rent expense, including fees for operating expenses and consumption of electricity, was $2.9 million, $1.7 million, and $0.9 million for 2016, 2015 and 2014, respectively.
Natural Gas and NGL Processing and Transportation Commitments
Eagle Ford
Effective September 1, 2012, the Company entered into a firm five-year natural gas processing and transportation agreement whereby the Company committed to transport the anticipated natural gas production from a significant portion of its Eagle Ford acreage in South Texas through the counterparty’s system for processing at the counterparty’s facilities. The agreement also includes firm transportation of the natural gas liquids extracted at the counterparty’s processing plant downstream for fractionation. After processing, the residue natural gas is purchased by the counterparty at the tailgate of its processing plant and further transported under its natural gas transportation agreements. The arrangement contains fixed processing and liquids transportation and fractionation fees, and the revenue the Company receives varies with the quality of natural gas transported to the processing facilities and the contract period.
Under this agreement, if the Company does not meet 80% of the maximum thermal quantity transportation and processing commitments in a contract year, it will be required to pay a deficiency fee per MMBtu of natural gas deficiency. Any quantity in excess of the maximum MMBtu delivered in a contract year can be carried over to the next contract year for purposes of calculating the natural gas deficiency. During certain prior periods, the Company had an immaterial natural gas deficiency, and the counterparty to this agreement waived the deficiency fee. The Company paid approximately $3.0 million and $5.5 million in processing and transportation fees under this agreement during the years ended December 31, 2016 and 2015, respectively. The future undiscounted minimum payment under this agreement as of December 31, 2016 is $1.2 million in 2017.
Delaware Basin
As part of the sale of the Loving County Processing System (see Note 5), the Company entered into a 15-year fixed-fee natural gas gathering and processing agreement whereby the Company committed to deliver the anticipated natural gas production from a significant portion of its Loving County, Texas acreage in West Texas through the counterparty’s gathering system for processing at the counterparty’s facilities. Under this agreement, if the Company does not meet the volume
F-30
Matador Resources Company and Subsidiaries
NOTES TO CONSOLIDATED FINANCIAL STATEMENTS — CONTINUED
December 31, 2016, 2015 and 2014
NOTE 13 — COMMITMENTS AND CONTINGENCIES — Continued
commitment for transportation and processing at the facilities in a contract year, it will be required to pay a deficiency fee per MMBtu of natural gas deficiency. At the end of each year of the agreement, the Company can elect to have the previous year’s actual transportation and processing volumes be the new minimum commitment for each of the remaining years of the contract. As such, the Company has the ability to unilaterally reduce the gathering and processing commitment if the Company’s production in the Loving County area is less than the Company’s currently projected production. If the Company ceased operations in this area at December 31, 2016, the total deficiency fee required to be paid would be approximately $11.7 million. In addition, if the Company elects to reduce the gathering and processing commitment in any year, the Company has the ability to elect to increase the committed volumes in any future year to the originally agreed gathering and processing commitment. Any quantity in excess of the volume commitment delivered in a contract year can be carried over to the next contract year for purposes of calculating the natural gas deficiency. The Company paid approximately $9.8 million and $1.8 million in processing and gathering fees under this agreement during the years ended December 31, 2016 and 2015, respectively. The Company can elect to either sell the residue gas to the counterparty at the tailgate of its processing plants or have the counterparty deliver to the Company the residue gas in-kind to be sold to third parties downstream of the plants.
Other Commitments
The Company does not own or operate its own drilling rigs, but instead enters into contracts with third parties for such drilling rigs. These contracts establish daily rates for the drilling rigs and the term of the Company’s commitment for the drilling services to be provided, which have typically been for two years or less. The Company would incur a termination obligation if the Company elected to terminate a contract and if the drilling contractor were unable to secure replacement work for the contracted drilling rigs or if the drilling contractor were unable to secure replacement work for the contracted drilling rigs at the same daily rates being charged to the Company prior to the end of their respective contract terms. The Company’s undiscounted minimum outstanding aggregate termination obligations under its drilling rig contracts were approximately $46.3 million at December 31, 2016.
At December 31, 2016, the Company had outstanding commitments to participate in the drilling and completion of various non-operated wells. If all of these wells are drilled and completed as proposed, the Company’s minimum outstanding aggregate commitments for its participation in these non-operated wells were approximately $11.1 million at December 31, 2016. The Company expects these costs to be incurred within the next year.
Legal Proceedings
The Company is a party to several lawsuits encountered in the ordinary course of its business. While the ultimate outcome and impact to the Company cannot be predicted with certainty, in the opinion of management, it is remote that these lawsuits will have a material adverse impact on the Company’s financial condition, results of operations or cash flows.
F-31
Matador Resources Company and Subsidiaries
NOTES TO CONSOLIDATED FINANCIAL STATEMENTS — CONTINUED
December 31, 2016, 2015 and 2014
NOTE 14 — SUPPLEMENTAL DISCLOSURES
Accrued Liabilities
The following table summarizes the Company’s current accrued liabilities at December 31, 2016 and 2015 (in thousands).
December 31, | ||||||||
2016 | 2015 | |||||||
Accrued evaluated and unproved and unevaluated property costs | $ | 54,273 | $ | 54,586 | ||||
Accrued support equipment and facilities costs | 15,139 | 17,393 | ||||||
Accrued lease operating expenses | 16,009 | 7,743 | ||||||
Accrued interest on debt | 6,541 | 5,806 | ||||||
Accrued asset retirement obligations | 915 | 254 | ||||||
Accrued partners’ share of joint interest charges | 5,572 | 4,565 | ||||||
Other | 3,011 | 2,022 | ||||||
Total accrued liabilities | $ | 101,460 | $ | 92,369 | ||||
Supplemental Cash Flow Information
The following table provides supplemental disclosures of cash flow information for the years ended December 31, 2016, 2015 and 2014 (in thousands).
Year Ended December 31, | ||||||||||||
2016 | 2015 | 2014 | ||||||||||
Cash paid for income taxes | $ | 2,895 | $ | 506 | $ | 94 | ||||||
Cash paid for interest expense, net of amounts capitalized | 27,464 | 16,154 | 5,269 | |||||||||
Increase in asset retirement obligations related to mineral properties | 3,817 | 2,510 | 3,843 | |||||||||
Increase in asset retirement obligations related to support equipment and facilities | 222 | 383 | 120 | |||||||||
Increase (decrease) in liabilities for oil and natural gas properties capital expenditures | 1,775 | (30,683 | ) | 32,972 | ||||||||
(Decrease) increase in liabilities for support equipment and facilities | (588 | ) | 12,076 | 4,290 | ||||||||
Issuance of restricted stock units for Board and advisor services | 992 | 584 | 444 | |||||||||
Stock-based compensation expense recognized as liability | 569 | 79 | 223 | |||||||||
Increase in liabilities for accrued cost to issue equity | 343 | — | — | |||||||||
Transfer of inventory to oil and natural gas properties | 395 | 615 | 216 | |||||||||
NOTE 15 — SUBSIDIARY GUARANTORS
Matador filed a registration statement on Form S-3 with the SEC in 2013, which became effective on May 9, 2013, and a registration statement on Form S-3 with the SEC in 2014, which became effective upon filing on May 22, 2014, registering, in each case, among other securities, senior and subordinated debt securities and guarantees of debt securities by certain subsidiaries of Matador (the “Shelf Guarantor Subsidiaries”). On April 14, 2015, the Company issued the Original Notes and on December 9, 2016, the Company issued the Additional Notes (see Note 6), which are jointly and severally guaranteed by certain subsidiaries of Matador (the “Notes Guarantor Subsidiaries” and, together with the Shelf Guarantor Subsidiaries, the “Guarantor Subsidiaries”) on a full and unconditional basis (except for customary release provisions). At December 31, 2016, the Guarantor Subsidiaries were 100% owned by Matador, and any subsidiaries of Matador other than the Guarantor Subsidiaries were minor. Matador is a parent holding company and has no independent assets or operations, and there are no significant restrictions on the ability of Matador to obtain funds from the Guarantor Subsidiaries by dividend or loan.
F-32
Matador Resources Company and Subsidiaries
NOTES TO CONSOLIDATED FINANCIAL STATEMENTS — CONTINUED
December 31, 2016, 2015 and 2014
NOTE 16 — RELATED PARTY TRANSACTIONS
In June 2015, the Company entered into two joint ventures to develop certain leasehold interests held by certain affiliates (the “HEYCO Affiliates”) of HEYCO Energy Group, Inc., the former parent company of HEYCO. The HEYCO Affiliates are owned by George M. Yates, who is a member of the Company’s Board of Directors, and certain of his affiliates. Pursuant to the terms of the transaction, the HEYCO Affiliates contributed an aggregate of approximately 1,900 net acres, primarily in the same properties previously held by HEYCO, to the two newly-formed entities in exchange for a 50% interest in each entity. The Company has agreed to contribute an aggregate of approximately $14 million in exchange for the other 50% interest in both entities. As of December 31, 2016, the Company had contributed an aggregate of approximately $2.1 million to the two entities. The Company’s contributions will be used to fund future capital expenditures associated with the interests being acquired as well as to fund acquisitions of other non-operated acreage opportunities.
NOTE 17 — SEGMENT INFORMATION
The Company operates in two business segments: (i) exploration and production and (ii) midstream. The exploration and production segment is engaged in the acquisition, exploration and development of oil and natural gas properties and is currently focused primarily on the oil and liquids-rich portion of the Wolfcamp and Bone Spring plays in the Delaware Basin in Southeast New Mexico and West Texas. The Company also operates in the Eagle Ford shale play in South Texas and the Haynesville shale and Cotton Valley plays in Northwest Louisiana and East Texas. During the third quarter of 2016, our midstream business became a reportable segment under U.S. GAAP. The midstream segment conducts midstream operations in support of the Company’s exploration, development and production operations and provides natural gas processing, natural gas, oil and salt water gathering services and salt water disposal services to third parties on a limited basis.
The following tables present selected financial information for the periods presented regarding the Company’s operating segments on a stand-alone basis, expenses that are not allocated to a segment and the consolidation and elimination entries necessary to arrive at the financial information for the Company on a consolidated basis (in thousands). On a consolidated basis, midstream services revenues consist primarily of those revenues from midstream operations related to third parties, including working interest owners in the Company’s operated wells. All midstream services revenues associated with Company-owned production are eliminated in consolidation. In evaluating the operating results of the exploration and production and midstream segments, the Company does not allocate certain expenses to the individual segments, including general and administrative expenses.
F-33
Matador Resources Company and Subsidiaries
NOTES TO CONSOLIDATED FINANCIAL STATEMENTS — CONTINUED
December 31, 2016, 2015 and 2014
NOTE 17 — SEGMENT INFORMATION — Continued
Exploration and Production | Consolidated Company | ||||||||||||||||||
Midstream | Corporate | Eliminations | |||||||||||||||||
Year Ended December 31, 2016 | |||||||||||||||||||
Oil and natural gas revenues | $ | 289,512 | $ | 1,644 | $ | — | $ | — | $ | 291,156 | |||||||||
Midstream services revenues | — | 18,982 | — | (13,764 | ) | 5,218 | |||||||||||||
Realized gain on derivatives | 9,286 | — | — | — | 9,286 | ||||||||||||||
Unrealized gain on derivatives | (41,238 | ) | — | — | — | (41,238 | ) | ||||||||||||
Expenses (1) | 391,098 | 8,254 | 56,001 | (13,764 | ) | 441,589 | |||||||||||||
Operating (loss) income (2) | $ | (133,538 | ) | $ | 12,372 | $ | (56,001 | ) | $ | — | $ | (177,167 | ) | ||||||
Total Assets | $ | 1,098,525 | $ | 140,459 | $ | 225,681 | $ | — | $ | 1,464,665 | |||||||||
Capital Expenditures | $ | 379,881 | $ | 67,566 | $ | 6,913 | $ | — | $ | 454,360 | |||||||||
_____________________
(1) Expenses include depreciation, depletion and amortization expenses of $118.4 million, $2.7 million and $0.9 million for the exploration and production, midstream and corporate segments, respectively, and full-cost ceiling impairment expense of $158.6 million for the exploration and production segment.
(2) Includes $0.4 million in net income attributable to non-controlling interest in subsidiaries related to the midstream segment.
Exploration and Production | Consolidated Company | ||||||||||||||||||
Midstream | Corporate | Eliminations | |||||||||||||||||
Year Ended December 31, 2015 | |||||||||||||||||||
Oil and natural gas revenues | $ | 277,844 | $ | 496 | $ | — | $ | — | $ | 278,340 | |||||||||
Midstream services revenues | — | 11,485 | — | (9,621 | ) | 1,864 | |||||||||||||
Realized gain on derivatives | 77,094 | — | — | — | 77,094 | ||||||||||||||
Unrealized loss on derivatives | (39,265 | ) | — | — | — | (39,265 | ) | ||||||||||||
Expenses (1) | 1,078,534 | 5,178 | 50,604 | (9,621 | ) | 1,124,695 | |||||||||||||
Operating (loss) income (2) | $ | (762,861 | ) | $ | 6,803 | $ | (50,604 | ) | $ | — | $ | (806,662 | ) | ||||||
Total Assets | $ | 1,000,075 | $ | 75,980 | $ | 64,806 | $ | — | $ | 1,140,861 | |||||||||
Capital Expenditures (3) | $ | 622,642 | $ | 75,009 | $ | 786 | $ | — | $ | 698,437 | |||||||||
_____________________
(1) Expenses include depreciation, depletion and amortization expenses of $176.7 million, $1.6 million and $0.5 million for the exploration and production, midstream and corporate segments, respectively, and full-cost ceiling impairment expense of $801.2 million for the exploration and production segment.
(2) Includes $0.3 million in net income attributable to non-controlling interest in subsidiaries related to the midstream segment.
(3) In October 2015, the Company sold the Wolf Processing Plant to EnLink and the cost basis of $31.0 million for those assets was removed from the total midstream assets.
F-34
Matador Resources Company and Subsidiaries
NOTES TO CONSOLIDATED FINANCIAL STATEMENTS — CONTINUED
December 31, 2016, 2015 and 2014
NOTE 17 — SEGMENT INFORMATION — Continued
Exploration and Production | Consolidated Company | ||||||||||||||||||
Midstream | Corporate | Eliminations | |||||||||||||||||
Year Ended December 31, 2014 | |||||||||||||||||||
Oil and natural gas revenues | $ | 366,191 | $ | 1,521 | $ | — | $ | — | $ | 367,712 | |||||||||
Midstream services revenues | — | 4,929 | — | (3,716 | ) | 1,213 | |||||||||||||
Realized gain on derivatives | 5,022 | — | — | — | 5,022 | ||||||||||||||
Unrealized loss on derivatives | 58,302 | — | — | — | 58,302 | ||||||||||||||
Expenses (1) | 220,374 | 2,703 | 32,557 | (3,716 | ) | 251,918 | |||||||||||||
Operating (loss) income (2) | $ | 209,141 | $ | 3,747 | $ | (32,557 | ) | $ | — | $ | 180,331 | ||||||||
Total Assets | $ | 1,388,261 | $ | 35,100 | $ | 11,129 | $ | — | $ | 1,434,490 | |||||||||
Capital Expenditures | $ | 597,351 | $ | 12,504 | $ | 517 | $ | — | $ | 610,372 | |||||||||
_____________________
(1) Expenses include depreciation, depletion and amortization expenses of $133.1 million, $1.2 million and $0.4 million for the exploration and production, midstream and corporate segments, respectively.
(2) Includes $17,000 in net loss attributable to non-controlling interest in subsidiaries related to the midstream segment.
F-35
Matador Resources Company and Subsidiaries
NOTES TO CONSOLIDATED FINANCIAL STATEMENTS — CONTINUED
December 31, 2016, 2015 and 2014
NOTE 18 — SUBSEQUENT EVENTS
Subsequent to December 31, 2016, the Company acquired approximately 13,900 gross (8,200 net) leased and mineral acres and approximately 1,000 BOE per day of related production from various lessors and other operators, mostly in and around its existing acreage in the Delaware Basin. The cost of these acquisitions was approximately $111 million.
On February 17, 2017, the Company contributed substantially all of its midstream assets located in the Rustler Breaks and Wolf asset areas to San Mateo Midstream, LLC (“San Mateo” or the “Joint Venture”), a joint venture with a subsidiary of Five Point Capital Partners LLC (“Five Point”). The midstream assets contributed to San Mateo include (i) the Black River cryogenic natural gas processing plant in the Rustler Breaks asset area (“Black River Processing Plant”); (ii) one salt water disposal well and a related commercial salt water disposal facility in the Rustler Breaks asset area; (iii) three salt water disposal wells and related commercial salt water disposal facilities in the Wolf asset area; and (iv) substantially all related oil, natural gas and water gathering systems and pipelines in both the Rustler Breaks and Wolf asset areas (collectively, the “Delaware Midstream Assets”). The Company will continue to operate the Delaware Midstream Assets. The Company retained its ownership in certain midstream assets owned in South Texas and Northwest Louisiana, which are not part of the Joint Venture.
The Company and Five Point own 51% and 49% of the Joint Venture, respectively. Five Point provided initial cash consideration of $176.4 million to the Joint Venture in exchange for its 49% interest. Approximately $171.5 million of this cash contribution by Five Point was distributed by the Joint Venture to the Company as a special distribution. The Company may earn an additional $73.5 million in performance incentives over the next five years. The Company contributed the Delaware Midstream Assets and $5.1 million in cash to the Joint Venture in exchange for its 51% interest. The parties to the Joint Venture have also committed to spend up to an additional $140 million in the aggregate to expand the Joint Venture’s midstream operations and asset base.
In connection with the Joint Venture, the Company dedicated its current and future leasehold interests in the Rustler Breaks and Wolf asset areas pursuant to 15-year, fixed-fee natural gas, oil and salt water gathering agreements and salt water disposal agreements, effective as of February 1, 2017. In addition, the Company dedicated its current and future leasehold interests in the Rustler Breaks asset area pursuant to a 15-year, fixed fee natural gas processing agreement (when combined with the gathering and salt water disposal agreements, the “Operational Agreements”). The Joint Venture will provide the Company with firm service under each of the Operational Agreements in exchange for certain minimum volume commitments. The minimum contractual obligation under the Operational Agreements at inception was approximately $273.5 million.
The following unaudited pro forma consolidated financial information is presented to illustrate the effect on the historical operating results and financial position of the Company of (a) the formation of San Mateo and the transactions associated with the Joint Venture and (b) the Company’s acquisition on February 14, 2017 of the remaining non-controlling interest in Fulcrum Delaware Water Resources, LLC (“Fulcrum Delaware Water Resources”) not previously owned by the Company for approximately $2.6 million (collectively, the “Transactions”).
The Unaudited Pro Forma Consolidated Statement of Operations for the year ended December 31, 2016, if presented, would contain an adjustment of $4.5 million to increase the net income attributable to non-controlling interest in subsidiaries from $0.4 million to $4.9 million, which would increase the net loss attributable to Matador Resources Company shareholders from $97.4 million to $102.0 million, and an adjustment of $0.05 per diluted common share to increase the net loss per diluted common share attributable to Matador Resources Company shareholders from $1.07 to $1.12.
The following Unaudited Pro Forma Consolidated Balance Sheet as of December 31, 2016, presented for illustrative purposes, is based on the historical financial statements of the Company as of December 31, 2016, after giving effect to the Transactions as if they had occurred on December 31, 2016.
F-36
Matador Resources Company and Subsidiaries
NOTES TO CONSOLIDATED FINANCIAL STATEMENTS — CONTINUED
December 31, 2016, 2015 and 2014
NOTE 18 — SUBSEQUENT EVENTS — Continued
UNAUDITED PRO FORMA CONSOLIDATED BALANCE SHEET
December 31, 2016 | ||||||||||||
As Reported | Adjustment | Pro Forma | ||||||||||
ASSETS | ||||||||||||
Current assets | ||||||||||||
Cash | $ | 212,884 | $ | 164,340 | (1) | $ | 377,224 | |||||
Restricted cash | 1,258 | 9,407 | (2) | 10,665 | ||||||||
Accounts receivable | — | |||||||||||
Oil and natural gas revenues | 34,154 | — | 34,154 | |||||||||
Joint interest billings | 19,347 | — | 19,347 | |||||||||
Other | 5,167 | — | 5,167 | |||||||||
Lease and well equipment inventory | 3,045 | — | 3,045 | |||||||||
Prepaid expenses and other assets | 3,327 | — | 3,327 | |||||||||
Total current assets | 279,182 | 173,747 | 452,929 | |||||||||
Property and equipment, at cost | ||||||||||||
Oil and natural gas properties, full-cost method | ||||||||||||
Evaluated | 2,408,305 | — | 2,408,305 | |||||||||
Unproved and unevaluated | 479,736 | — | 479,736 | |||||||||
Other property and equipment | 160,795 | — | 160,795 | |||||||||
Less accumulated depletion, depreciation and amortization | (1,864,311 | ) | — | (1,864,311 | ) | |||||||
Net property and equipment | 1,184,525 | — | 1,184,525 | |||||||||
Other assets | 958 | 958 | ||||||||||
Total assets | $ | 1,464,665 | $ | 173,747 | $ | 1,638,412 | ||||||
LIABILITIES AND SHAREHOLDERS’ EQUITY | ||||||||||||
Current liabilities | ||||||||||||
Accounts payable | $ | 4,674 | $ | — | $ | 4,674 | ||||||
Accrued liabilities | 101,460 | — | 101,460 | |||||||||
Royalties payable | 23,988 | — | 23,988 | |||||||||
Amounts due to affiliates | 8,651 | — | 8,651 | |||||||||
Derivative instruments | 24,203 | — | 24,203 | |||||||||
Advances from joint interest owners | 1,700 | — | 1,700 | |||||||||
Amounts due to joint ventures | 4,251 | — | 4,251 | |||||||||
Other current liabilities | 578 | — | 578 | |||||||||
Total current liabilities | 169,505 | — | 169,505 | |||||||||
Long-term liabilities | ||||||||||||
Senior unsecured notes payable | 573,924 | — | 573,924 | |||||||||
Asset retirement obligations | 19,725 | — | 19,725 | |||||||||
Derivative instruments | 751 | — | 751 | |||||||||
Amounts due to joint ventures | 1,771 | — | 1,771 | |||||||||
Other long-term liabilities | 7,544 | — | 7,544 | |||||||||
Total long-term liabilities | 603,715 | — | 603,715 | |||||||||
Commitments and contingencies (Note 13) | ||||||||||||
Shareholders’ equity | ||||||||||||
Common stock — $0.01 par value, 120,000,000 shares authorized; 99,518,764 and 85,567,021 shares issued; and 99,511,931 and 85,564,435 shares outstanding, respectively | 995 | — | 995 | |||||||||
Additional paid-in capital | 1,325,481 | 124,871 | (3) | 1,450,352 | ||||||||
Accumulated deficit | (636,351 | ) | — | (636,351 | ) | |||||||
Total Matador Resources Company shareholders’ equity | 690,125 | 124,871 | 814,996 | |||||||||
Non-controlling interest in subsidiaries | 1,320 | 48,876 | (4) | 50,196 | ||||||||
Total shareholders’ equity | 691,445 | 173,747 | 865,192 | |||||||||
Total liabilities and shareholders’ equity | $ | 1,464,665 | $ | 173,747 | $ | 1,638,412 | ||||||
______________________
(1) | Represents $176.4 million of cash contributed by Five Point in connection with the formation of San Mateo less (i) approximately $2.6 million paid by the Company to acquire the non-controlling interest in Fulcrum Delaware Water Resources that the Company did not previously own and (ii) $10.0 |
F-37
Matador Resources Company and Subsidiaries
NOTES TO CONSOLIDATED FINANCIAL STATEMENTS — CONTINUED
December 31, 2016, 2015 and 2014
NOTE 18 — SUBSEQUENT EVENTS — Continued
million of cash restricted to operations of San Mateo. Also reflects $0.6 million released from restriction upon the purchase of the non-controlling interest in Fulcrum Delaware Water Resources not previously owned by the Company.
(2) | Represents $10.0 million in cash contributed to San Mateo less $0.6 million released from restriction upon the purchase of the non-controlling interest in Fulcrum Delaware Water Resources that the Company did not previously own. |
(3) | Reflects the purchase of the non-controlling interest in Fulcrum Delaware Water Resources that the Company did not previously own and the amount received in connection with the formation of San Mateo. |
(4) | Represents the adjustment required to reflect the purchase of the non-controlling interest in Fulcrum Delaware Water Resources that the Company did not previously own and Five Point’s 49% non-controlling interest in San Mateo. |
F-38
Matador Resources Company and Subsidiaries
UNAUDITED SUPPLEMENTARY INFORMATION
December 31, 2016, 2015 and 2014
SUPPLEMENTAL OIL AND NATURAL GAS DISCLOSURES
Costs Incurred
The following table summarizes costs incurred and capitalized by the Company in the acquisition, exploration and development of oil and natural gas properties for the years ended December 31, 2016, 2015 and 2014 (in thousands).
Year Ended December 31, | ||||||||||||
2016 | 2015 | 2014 | ||||||||||
Property acquisition costs | ||||||||||||
Proved | $ | — | $ | 16,524 | $ | 2,728 | ||||||
Unproved and unevaluated | 108,206 | 253,923 | 78,484 | |||||||||
Exploration costs | 113,562 | 122,495 | 156,178 | |||||||||
Development costs | 158,113 | 229,700 | 359,961 | |||||||||
Total costs incurred (1) | $ | 379,881 | $ | 622,642 | $ | 597,351 | ||||||
__________________
(1) | Excludes midstream-related development and corporate costs of approximately $74.5 million, $75.8 million and $13.0 million for the years ended December 31, 2016, 2015 and 2014, respectively. |
Property acquisition costs are costs incurred to purchase, lease or otherwise acquire oil and natural gas properties, including both unproved and unevaluated leasehold and purchases of reserves in place. For the years ended December 31, 2016, 2015 and 2014, most of the Company’s property acquisition costs resulted from the acquisition of unproved and unevaluated leasehold positions.
Exploration costs are costs incurred in identifying areas of these oil and natural gas properties that may warrant further examination and in examining specific areas that are considered to have prospects of containing oil and natural gas, including costs of drilling exploratory wells, geological and geophysical costs, and costs of carrying and retaining unproved and unevaluated properties. Exploration costs may be incurred before or after acquiring the related oil and natural gas properties.
Development costs are costs incurred to obtain access to proved reserves and to provide facilities for extracting, treating, gathering and storing oil and natural gas. Development costs include the costs of preparing well locations for drilling, drilling and equipping development wells and acquiring, constructing and installing production facilities.
Costs incurred also include new asset retirement obligations established, as well as changes to asset retirement obligations resulting from revisions in cost estimates or abandonment dates. Asset retirement obligations included in the table above were approximately $4.4 million, $3.3 million and $4.0 million for the years ended December 31, 2016, 2015 and 2014, respectively. Capitalized general and administrative expenses that are directly related to acquisition, exploration and development activities are also included in the table above. The Company capitalized $15.7 million, $6.9 million and $6.4 million of these internal costs in 2016, 2015 and 2014, respectively. Capitalized interest expense for qualifying projects is also included in the table above. The Company capitalized $3.7 million, $3.9 million and $2.8 million of its interest expense for the years ended December 31, 2016, 2015 and 2014, respectively.
Oil and Natural Gas Reserves
Proved reserves are estimated quantities of oil and natural gas which geological and engineering data demonstrate with reasonable certainty to be recoverable in future years from known reservoirs using existing economic and operating conditions. Estimating oil and natural gas reserves is complex and inexact because of the numerous uncertainties inherent in the process. The process relies on interpretations of available geological, geophysical, petrophysical, engineering and production data. The extent, quality and reliability of both the data and the associated interpretations of that data can vary. The process also requires certain economic assumptions, including, but not limited to, oil and natural gas prices, drilling, completion and operating expenses, capital expenditures and taxes. Actual future production, oil and natural gas prices, revenues, taxes, development expenditures, operating expenses and quantities of recoverable oil and natural gas most likely will vary from the Company’s estimates.
The Company reports its production and proved reserves in two streams: oil and natural gas, including both dry and liquids-rich natural gas. Where the Company produces liquids-rich natural gas, such as in the Wolfcamp and Bone Spring plays in the Delaware Basin in Southeast New Mexico and West Texas and the Eagle Ford shale in South Texas, the economic value
F-39
Matador Resources Company and Subsidiaries
UNAUDITED SUPPLEMENTARY INFORMATION — CONTINUED
December 31, 2016, 2015 and 2014
SUPPLEMENTAL OIL AND NATURAL GAS DISCLOSURES — Continued
of the natural gas liquids associated with the natural gas is included in the estimated wellhead natural gas price on those properties where the natural gas liquids are extracted and sold. The Company’s oil and natural gas reserves estimates for the years ended December 31, 2016, 2015 and 2014 were prepared by the Company’s engineering staff in accordance with guidelines established by the SEC and then audited for their reasonableness and conformance with SEC guidelines by Netherland, Sewell & Associates, Inc., independent reservoir engineers.
Oil and natural gas reserves are estimated using then-current operating and economic conditions, with no provision for price and cost escalations in future periods except by contractual arrangements. The commodity prices used to estimate oil and natural gas reserves are based on unweighted, arithmetic averages of first-day-of-the-month oil and natural gas prices for the previous 12-month period. For the period from January through December 2016, these average oil and natural gas prices were $39.25 per Bbl and $2.48 per MMBtu, respectively. For the period from January through December 2015, these average oil and natural gas prices were $46.79 per Bbl and $2.59 per MMBtu, respectively. For the period from January through December 2014, these average oil and natural gas prices were $91.48 per Bbl and $4.35 per MMBtu, respectively.
The Company’s net ownership in estimated quantities of proved oil and natural gas reserves and changes in net proved reserves are summarized as follows. All of the Company’s oil and natural gas reserves are attributable to properties located in the United States. The estimated reserves shown below are for proved reserves only and do not include any value for unproved reserves classified as probable or possible reserves that might exist for these properties, nor do they include any consideration that could be attributed to interests in unevaluated acreage beyond those tracts for which reserves have been estimated. In the tables presented throughout this section, natural gas is converted to oil equivalent using the ratio of one Bbl of oil to six Mcf of natural gas.
F-40
Matador Resources Company and Subsidiaries
UNAUDITED SUPPLEMENTARY INFORMATION — CONTINUED
December 31, 2016, 2015 and 2014
SUPPLEMENTAL OIL AND NATURAL GAS DISCLOSURES — Continued
Net Proved Reserves | |||||||||
Oil | Natural Gas | Oil Equivalent | |||||||
(MBbl) | (MMcf) | (MBOE) | |||||||
Total at December 31, 2013 | 16,362 | 212,195 | 51,729 | ||||||
Revisions of prior estimates | (1,196 | ) | 164 | (1,169 | ) | ||||
Purchases of minerals in-place | 10 | 433 | 82 | ||||||
Extensions and discoveries | 12,328 | 69,566 | 23,921 | ||||||
Production | (3,320 | ) | (15,303 | ) | (5,870 | ) | |||
Total at December 31, 2014 | 24,184 | 267,055 | 68,693 | ||||||
Revisions of prior estimates | (2,609 | ) | (75,433 | ) | (15,181 | ) | |||
Purchases of minerals in-place | 1,102 | 2,927 | 1,589 | ||||||
Extensions and discoveries | 27,459 | 70,054 | 39,135 | ||||||
Production | (4,492 | ) | (27,702 | ) | (9,109 | ) | |||
Total at December 31, 2015 | 45,644 | 236,901 | 85,127 | ||||||
Revisions of prior estimates | (6,440 | ) | (28,481 | ) | (11,187 | ) | |||
Extensions and discoveries | 22,869 | 114,730 | 41,992 | ||||||
Production | (5,096 | ) | (30,501 | ) | (10,180 | ) | |||
Total at December 31, 2016 | 56,977 | 292,649 | 105,752 | ||||||
Proved Developed Reserves | |||||||||
December 31, 2013 | 8,258 | 53,458 | 17,168 | ||||||
December 31, 2014 | 14,053 | 102,795 | 31,185 | ||||||
December 31, 2015 | 17,129 | 101,447 | 34,037 | ||||||
December 31, 2016 | 22,604 | 126,759 | 43,731 | ||||||
Proved Undeveloped Reserves | |||||||||
December 31, 2013 | 8,104 | 158,737 | 34,561 | ||||||
December 31, 2014 | 10,131 | 164,260 | 37,508 | ||||||
December 31, 2015 | 28,515 | 135,454 | 51,090 | ||||||
December 31, 2016 | 34,373 | 165,890 | 62,021 | ||||||
The following is a discussion of the changes in the Company’s proved oil and natural gas reserves estimates for the years ended December 31, 2016, 2015 and 2014.
The Company’s proved oil and natural gas reserves increased to 105,752 MBOE at December 31, 2016 from 85,127 MBOE at December 31, 2015. The Company’s proved oil and natural gas reserves increased by 30,805 MBOE and the Company produced 10,180 MBOE during the year ended December 31, 2016, resulting in a net increase of 20,625 MBOE. An increase of 41,992 MBOE in proved oil and natural gas reserves was a result of extensions and discoveries during the year, which was primarily attributable to drilling operations in the Wolfcamp and Bone Spring plays in the Delaware Basin in Southeast New Mexico and West Texas. The Company’s proved oil and natural gas reserves decreased by 11,187 MBOE during 2016 as a result of the reclassification of proved undeveloped reserves to contingent resources, primarily due to the decline in weighted average commodity prices used to estimate proved reserves during 2016, as compared to 2015. The Company anticipates that these contingent resources may be reclassified to proved undeveloped reserves in future periods should the oil and natural gas prices used to estimate proved reserves improve from the prices at December 31, 2016. The Company’s proved developed oil and natural gas reserves increased to 43,731 MBOE at December 31, 2016 from 34,037 MBOE at December 31, 2015, primarily due to proved developed reserves added as a result of drilling operations in the Wolfcamp and Bone Spring plays in the Delaware Basin. At December 31, 2016, the Company’s proved reserves were made up of approximately 54% oil and 46% natural gas and were approximately 41% proved developed and approximately 59% proved undeveloped.
The Company’s proved oil and natural gas reserves increased to 85,127 MBOE at December 31, 2015 from 68,693 MBOE at December 31, 2014. The Company’s proved oil and natural gas reserves increased by 25,543 MBOE and the Company produced 9,109 MBOE during the year ended December 31, 2015, resulting in a net increase of 16,434 MBOE. An
F-41
Matador Resources Company and Subsidiaries
UNAUDITED SUPPLEMENTARY INFORMATION — CONTINUED
December 31, 2016, 2015 and 2014
SUPPLEMENTAL OIL AND NATURAL GAS DISCLOSURES — Continued
increase of 39,135 MBOE in proved oil and natural gas reserves was a result of extensions and discoveries during the year, which was primarily attributable to drilling operations in the Wolfcamp and Bone Spring plays in the Delaware Basin in Southeast New Mexico and West Texas. The Company’s proved oil and natural gas reserves decreased by 15,181 MBOE during the year as a result of revisions to previous estimates, primarily the removal of 1,935 MBbl of proved undeveloped oil reserves in the Eagle Ford shale play in South Texas in 2015, as well as the removal of approximately 64.3 Bcf, or 10,716 MBOE, of proved undeveloped natural gas reserves, primarily in the Haynesville shale in Northwest Louisiana, primarily resulting from the decline in commodity prices during 2015. The Company also purchased minerals in-place with proved reserves of 1,589 MBOE in 2015, primarily as part of the HEYCO Merger. The Company’s proved developed oil and natural gas reserves increased to 34,037 MBOE at December 31, 2015 from 31,185 MBOE at December 31, 2014, primarily due to proved developed reserves added as a result of drilling operations in the Wolfcamp and Bone Spring plays in the Delaware Basin and the Eagle Ford shale plus the conversion of previously undeveloped natural gas reserves in the Haynesville shale to proved developed reserves. At December 31, 2015, the Company’s proved reserves were made up of approximately 54% oil and 46% natural gas and were approximately 40% proved developed and approximately 60% proved undeveloped.
The Company’s proved oil and natural gas reserves increased to 68,693 MBOE at December 31, 2014 from 51,729 MBOE at December 31, 2013. The Company’s proved oil and natural gas reserves increased by 22,834 MBOE and the Company produced 5,870 MBOE during the year ended December 31, 2014, resulting in a net increase of 16,964 MBOE. An increase of 23,921 MBOE in proved oil and natural gas reserves was a result of extensions and discoveries during the year, which was primarily attributable to drilling operations in the Eagle Ford shale play in South Texas and in the Wolfcamp and Bone Spring plays in the Delaware Basin in Southeast New Mexico and West Texas, plus additional proved undeveloped natural gas reserves identified on the Company’s properties in the Haynesville shale. The Company’s proved oil and natural gas reserves decreased by 1,169 MBOE during the year as a result of revisions to previous estimates, primarily downward revisions of proved undeveloped oil reserves on certain of the Company’s undeveloped locations in the Eagle Ford shale play in South Texas in 2014. The Company also purchased minerals in-place with proved reserves of 82 MBOE in 2014. The Company’s proved developed oil and natural gas reserves increased to 31,185 MBOE at December 31, 2014 from 17,168 MBOE at December 31, 2013, primarily due to proved developed reserves added as a result of drilling operations in the Eagle Ford shale and in the Wolfcamp and Bone Spring plays in the Delaware Basin plus the conversion of previously undeveloped natural gas reserves in the Haynesville shale to proved developed reserves. At December 31, 2014, the Company’s proved reserves were made up of approximately 35% oil and 65% natural gas and were approximately 45% proved developed and approximately 55% proved undeveloped.
Standardized Measure of Discounted Future Net Cash Flows and Changes Therein Relating to Proved Oil and Natural Gas Reserves
The standardized measure of discounted future net cash flows relating to proved oil and natural gas reserves is not intended to provide an estimate of the replacement cost or fair market value of the Company’s oil and natural gas properties. An estimate of fair market value would also take into account, among other things, the recovery of reserves not presently classified as proved, anticipated future changes in prices and costs, potential improvements in industry technology and operating practices, the risks inherent in reserves estimates and perhaps different discount rates.
As noted previously, for the period from January through December 2016, the unweighted, arithmetic averages of first-day-of-the-month oil and natural gas prices were $39.25 per Bbl and $2.48 per MMBtu, respectively. For the period from January through December 2015, the comparable average oil and natural gas prices were $46.79 per Bbl and $2.59 per MMBtu, respectively. For the period from January through December 2014, the comparable average oil and natural gas prices were $91.48 per Bbl and $4.35 per MMBtu, respectively.
Future net cash flows were computed by applying these oil and natural gas prices, adjusted for all associated transportation and gathering costs, gravity and energy content, and regional price differentials, to year-end quantities of proved oil and natural gas reserves and accounting for any future production and development costs associated with producing these reserves; neither prices nor costs were escalated with time in these computations.
Future income taxes were computed by applying the statutory tax rate to the excess of future net cash flows relating to proved oil and natural gas reserves less the tax basis of the associated properties. Tax credits and net operating loss carryforwards available to the Company were also considered in the computation of future income taxes. Future net cash flows after income taxes were discounted using a 10% annual discount rate to derive the standardized measure of discounted future net cash flows.
F-42
Matador Resources Company and Subsidiaries
UNAUDITED SUPPLEMENTARY INFORMATION — CONTINUED
December 31, 2016, 2015 and 2014
SUPPLEMENTAL OIL AND NATURAL GAS DISCLOSURES — Continued
The following table presents the standardized measure of discounted future net cash flows relating to proved oil and natural gas reserves for the years ended December 31, 2016, 2015 and 2014 (in thousands).
Year Ended December 31, | ||||||||||||
2016 | 2015 | 2014 | ||||||||||
Future cash inflows | $ | 2,684,877 | $ | 2,461,131 | $ | 3,197,317 | ||||||
Future production costs | (927,725 | ) | (843,117 | ) | (803,662 | ) | ||||||
Future development costs | (630,280 | ) | (615,692 | ) | (553,799 | ) | ||||||
Future income tax expense | (24,742 | ) | (43,956 | ) | (321,088 | ) | ||||||
Future net cash flows | 1,102,130 | 958,366 | 1,518,768 | |||||||||
10% annual discount for estimated timing of cash flows | (527,087 | ) | (429,185 | ) | (605,449 | ) | ||||||
Standardized measure of discounted future net cash flows | $ | 575,043 | $ | 529,181 | $ | 913,319 | ||||||
The following table summarizes the changes in the standardized measure of discounted future net cash flows relating to proved oil and natural gas reserves for the years ended December 31, 2016, 2015 and 2014 (in thousands).
Year Ended December 31, | ||||||||||||
2016 | 2015 | 2014 | ||||||||||
Balance, beginning of period | $ | 529,181 | $ | 913,319 | $ | 578,668 | ||||||
Net change in sales and transfer prices and in production (lifting) costs related to future production | (92,477 | ) | (509,901 | ) | 87,067 | |||||||
Changes in estimated future development costs | (74,142 | ) | (145,861 | ) | (150,447 | ) | ||||||
Sales and transfers of oil and natural gas produced during the period | (191,908 | ) | (184,612 | ) | (283,187 | ) | ||||||
Purchases of reserves in place | — | 16,321 | 1,838 | |||||||||
Net change due to extensions and discoveries | 360,033 | 401,895 | 537,472 | |||||||||
Net change due to revisions in estimates of reserves quantities | (95,917 | ) | (285,823 | ) | (26,263 | ) | ||||||
Previously estimated development costs incurred during the period | 84,519 | 121,543 | 187,459 | |||||||||
Accretion of discount | 51,779 | 82,574 | 65,518 | |||||||||
Other | (1,962 | ) | 2,029 | 5,492 | ||||||||
Net change in income taxes | 5,937 | 117,697 | (90,298 | ) | ||||||||
Standardized measure of discounted future net cash flows | $ | 575,043 | $ | 529,181 | $ | 913,319 | ||||||
F-43
Matador Resources Company and Subsidiaries
UNAUDITED SUPPLEMENTARY INFORMATION — CONTINUED
December 31, 2016, 2015 and 2014
SELECTED QUARTERLY FINANCIAL INFORMATION
The following table presents selected unaudited quarterly financial information for 2016 (in thousands, except per share data).
December 31 | September 30 | June 30 | March 31 | |||||||||||||
2016 | ||||||||||||||||
Oil and natural gas revenues | $ | 94,815 | $ | 83,079 | $ | 69,336 | $ | 43,926 | ||||||||
Third-party midstream services revenues | 2,261 | 1,566 | 918 | 473 | ||||||||||||
Realized (loss) gain on derivatives | (1,127 | ) | 885 | 2,465 | 7,063 | |||||||||||
Unrealized (loss) gain on derivatives | (10,977 | ) | 3,203 | (26,625 | ) | (6,839 | ) | |||||||||
Expenses (1) | 76,753 | 71,879 | 146,705 | 146,252 | ||||||||||||
Other income (expense) (2) | 96,196 | (5,948 | ) | (5,136 | ) | (6,038 | ) | |||||||||
Income (loss) before income taxes | 104,415 | 10,906 | (105,747 | ) | (107,667 | ) | ||||||||||
Income tax provision (benefit) | 105 | (1,141 | ) | — | — | |||||||||||
Net income (loss) | 104,310 | 12,047 | (105,747 | ) | (107,667 | ) | ||||||||||
Net (income) loss attributable to non-controlling interest in subsidiaries | (155 | ) | (116 | ) | (106 | ) | 13 | |||||||||
Net income (loss) attributable to Matador Resources Company shareholders | $ | 104,155 | $ | 11,931 | $ | (105,853 | ) | $ | (107,654 | ) | ||||||
Earnings (loss) per common share | ||||||||||||||||
Basic | $ | 1.10 | $ | 0.13 | $ | (1.15 | ) | $ | (1.26 | ) | ||||||
Diluted | $ | 1.09 | $ | 0.13 | $ | (1.15 | ) | $ | (1.26 | ) | ||||||
__________________
(1) | Expenses for June 30 and March 31, 2016 included full-cost ceiling impairment charges of $78.2 million, and $80.5 million, respectively. |
(2) | Other income (expense) for December 31, 2016 included gain on the sale of the Loving County Processing System of $104.1 million. See Note 5. |
The following table presents selected unaudited quarterly financial information for 2015 (in thousands, except per share data).
December 31 | September 30 | June 30 | March 31 | |||||||||||||
2015 | ||||||||||||||||
Oil and natural gas revenues | $ | 56,212 | $ | 71,815 | $ | 87,848 | $ | 62,465 | ||||||||
Third-party midstream services revenues | 480 | 569 | 464 | 351 | ||||||||||||
Realized gain on derivatives | 24,948 | 19,862 | 13,780 | 18,504 | ||||||||||||
Unrealized (loss) gain on derivatives | (13,909 | ) | 6,733 | (23,532 | ) | (8,557 | ) | |||||||||
Expenses (1) | 290,751 | 367,633 | 319,140 | 147,171 | ||||||||||||
Other expense | 5,599 | 6,665 | 5,786 | 2,180 | ||||||||||||
Loss before income taxes | (228,619 | ) | (275,319 | ) | (246,366 | ) | (76,588 | ) | ||||||||
Income tax provision (benefit) | 1,677 | (33,305 | ) | (89,350 | ) | (26,390 | ) | |||||||||
Net loss | (230,296 | ) | (242,014 | ) | (157,016 | ) | (50,198 | ) | ||||||||
Net income attributable to non-controlling interest in subsidiaries | (105 | ) | (45 | ) | (75 | ) | (36 | ) | ||||||||
Net loss attributable to Matador Resources Company shareholders | $ | (230,401 | ) | $ | (242,059 | ) | $ | (157,091 | ) | $ | (50,234 | ) | ||||
Loss per common share attributable to Matador Resources Company shareholders | ||||||||||||||||
Basic | $ | (2.72 | ) | $ | (2.86 | ) | $ | (1.89 | ) | $ | (0.68 | ) | ||||
Diluted | $ | (2.72 | ) | $ | (2.86 | ) | $ | (1.89 | ) | $ | (0.68 | ) | ||||
__________________
(1) | Expenses for December 31, September 30, June 30 and March 31, 2015 included full-cost ceiling impairment charges of $219.4 million, $285.7 million, $229.0 million and $67.1 million, respectively. |
F-44