Attached files
| file | filename |
|---|---|
| EX-32 - EXHIBIT 32 - Crocs, Inc. | crox-ex32_20161231.htm |
| EX-31.2 - EXHIBIT 31.2 - Crocs, Inc. | crox-ex312_20161231.htm |
| EX-31.1 - EXHIBIT 31.1 - Crocs, Inc. | crox-ex311_20161231.htm |
| EX-23.1 - EXHIBIT 23.1 - Crocs, Inc. | crox-ex231_20161231.htm |
| EX-21 - EXHIBIT 21 - Crocs, Inc. | crox-ex21_20161231.htm |
| EX-10.32 - EXHIBIT 10.32 - Crocs, Inc. | crox-ex1032_20161231.htm |
| EX-10.30 - EXHIBIT 10.30 - Crocs, Inc. | crox-ex1030_20161231.htm |
| EX-10.29 - EXHIBIT 10.29 - Crocs, Inc. | crox-ex1029_20161231.htm |
UNITED STATES
SECURITIES AND EXCHANGE COMMISSION
Washington, D.C. 20549
____________________________________________________________________________
FORM 10-K
ý | ANNUAL REPORT PURSUANT TO SECTION 13 OR 15(d) OF THE SECURITIES EXCHANGE ACT OF 1934 |
For the fiscal year ended December 31, 2016
or
o | TRANSITION REPORT PURSUANT TO SECTION 13 OR 15(d) OF THE SECURITIES EXCHANGE ACT OF 1934 |
For the transition period from to
Commission File No. 0-51754
____________________________________________________________________________
CROCS, INC.
(Exact name of registrant as specified in its charter)
Delaware (State or other jurisdiction of incorporation or organization) | 20-2164234 (I.R.S. Employer Identification No.) | |
7477 East Dry Creek Parkway
Niwot, Colorado 80503
(303) 848-7000
(Address, including zip code and telephone number, including area code, of registrant's principal executive offices)
Securities registered pursuant to Section 12(b) of the Act:
Title of each class: | Name of each exchange on which registered: | |||
Common Stock, par value $0.001 per share | The NASDAQ Global Select Market | |||
Securities registered pursuant to Section 12(g) of the Act: None
____________________________________________________________________________
Indicate by check mark if the registrant is a well-known seasoned issuer, as defined in Rule 405 of the Securities Act. Yes o No ý
Indicate by check mark if the registrant is not required to file reports pursuant to Section 13 or Section 15(d) of the Act. Yes o No ý
Indicate by check mark whether the registrant (1) has filed all reports required to be filed by Section 13 or 15(d) of the Securities Exchange Act of 1934 during the preceding 12 months (or for such shorter period that the registrant was required to file such reports), and (2) has been subject to such filing requirements for the past 90 days. Yes ý No o
Indicate by check mark whether the registrant has submitted electronically and posted on its corporate Web site, if any, every Interactive Data File required to be submitted and posted pursuant to Rule 405 of Regulation S-T (§232.405 of this chapter) during the preceding 12 months (or for such shorter period that the registrant was required to submit and post such files). Yes ý No o
Indicate by check mark if disclosure of delinquent filers pursuant to Item 405 of Regulation S-K (§229.405 of this chapter) is not contained herein, and will not be contained, to the best of the registrant's knowledge, in definitive proxy or information statements incorporated by reference in Part III of the Form 10-K or any amendment to the Form 10-K. ý
Indicate by check mark whether the registrant is a large accelerated filer, an accelerated filer, a non-accelerated filer, or a smaller reporting company. See the definitions of "large accelerated filer", "accelerated filer" and "smaller reporting company" in Rule 12b-2 of the Exchange Act. (Check one):
Large accelerated filer ý | Accelerated filer o | Non-accelerated filer o (do not check if a smaller reporting company) | Smaller reporting company o | |||
Indicate by check mark whether the registrant is a shell company (as defined in Rule 12b-2 of the Act). Yes o No ý
The aggregate market value of the voting common stock held by non-affiliates of the registrant as of June 30, 2016 was $650.6 million. For the purpose of the foregoing calculation only, all directors and executive officers of the registrant and owners of more than 10% of the registrant's common stock are assumed to be affiliates of the registrant. This determination of affiliate status is not necessarily conclusive for any other purpose.
The number of shares of the registrant's common stock outstanding as of February 22, 2017 was 73,690,901
DOCUMENTS INCORPORATED BY REFERENCE
Part III incorporates certain information by reference from the registrant's proxy statement for the 2017 annual meeting of stockholders to be filed no later than 120 days after the end of the registrant's fiscal year ended December 31, 2016.
Cautionary Note Regarding Forward-Looking Statements
This Annual Report on Form 10-K contains “forward-looking statements” within the meaning of Section 27A of the Securities Act of 1933 and Section 21E of the Securities Exchange Act of 1934 (the "Exchange Act"). From time to time, we may also provide oral or written forward-looking statements in other materials we release to the public. Such forward-looking statements are subject to the safe harbor created by the Private Securities Litigation Reform Act of 1995.
Statements that refer to industry trends, projections of our future financial performance, anticipated trends in our business and other characterizations of future events or circumstances are forward-looking statements. These statements, which express management’s current views concerning future events or results, use words like “anticipate,” “assume,” “believe,” “continue,” “estimate,” “expect,” “future,” “intend,” “plan,” “project,” “strive,” and future or conditional tense verbs like “could,” “may,” “might,” “should,” “will,” “would,” and similar expressions or variations. Examples of forward-looking statements include, but are not limited to, statements we make regarding:
• | our belief that we have sufficient liquidity to fund our business operations during the next twelve months; |
• | our expectations regarding our level of capital expenditures in 2017; and |
• | our expectations regarding future trends, expectations and performance of our business. |
Forward-looking statements are subject to risks and uncertainties that may cause actual results to differ materially (both favorably and unfavorably) from future results expressed or implied by such forward-looking statements. These risks and uncertainties include, but are not limited to those described in Part I — Item 1A. Risk Factors of this Annual Report, elsewhere throughout this report, and those described from time to time in our past and future reports filed with the Securities and Exchange Commission (the "SEC"). Caution should be taken not to place undue reliance on any such forward-looking statements. Forward-looking statements speak only as of the date when made and we undertake no obligation to update any forward-looking statement, whether as a result of new information, future events or otherwise.
Crocs, Inc.
Table of Contents to the Annual Report on Form 10-K
For the Year Ended December 31, 2016
1
PART I
ITEM 1. Business
The Company
Crocs, Inc. and its consolidated subsidiaries (collectively the "Company," "we," "our," or "us") are engaged in the design, development, manufacturing, worldwide marketing, distribution and sale of casual lifestyle footwear and accessories for men, women, and children. We strive to be the global leader in the sale of molded footwear featuring comfort, color, and functionality. The Company, a Delaware corporation, is the successor to a Colorado corporation of the same name, and was originally organized in 1999 as a limited liability company. Our products include footwear and accessories that utilize our proprietary closed-cell resin, called Croslite, as well as casual lifestyle footwear that use a range of materials. Our CrosliteTM material enables us to produce innovative, lightweight, non-marking, and odor-resistant footwear. We currently sell our products in more than 90 countries through domestic and international retailers and distributors, and directly to consumers through our company-operated retail stores, outlets, e-commerce store sites, and kiosks.
Since the initial introduction of our original Classic clog designs in 2002, we have expanded our product ranges to include a variety of styles and products. Going forward, we are focusing on our core molded styles, clogs, sandals, flips and slides as well as developing select casual styles. The broad appeal of our footwear has allowed us to market our products through a wide range of distribution channels, our own Crocs single-branded stores including both full price and outlet stores, our own e-commerce sites, traditional multi-branded stores including family footwear stores, sporting goods stores and a variety of specialty and independent retail channels, and third-party e-commerce sites. In select markets we also sell to distributors that are typically granted the rights to distribute our products in a given geographical area.
Products
Our product offerings have grown significantly since we first introduced the single-style clog in six colors in 2002. Recognized across the world for our iconic clog silhouette, we have taken the successful formula of a simple design aesthetic paired with modern comfort and expanded into a wide variety of casual footwear products including sandals, flips and slides, shoes, and boots that meet the needs of the whole family.
At the heart of our brand reside the Classic and Crocband clogs, our most iconic styles for adults and kids - product that embodies our innovation in molding, simplicity of design and all-day comfort. A key differentiating feature of our footwear products is our proprietary closed-cell resin Croslite material, which is uniquely suited for comfort and functionality. For further information on Croslite, see Raw Materials below.
We strive to provide our global consumer with a year-round product assortment featuring fun, comfortable, casual, colorful, and innovative styles. Our collections are designed to meet the needs of the family by focusing on key wearing occasions. Our goal is to deliver product assortments for the family with all of the comfort, features and benefits Crocs is known for.
The unique look and feel of the Classic clog can be experienced throughout our entire product line due to the use and design of Croslite. We have expanded our core molded product line, with the addition of dual density technology, warm lined styles, sandals, flips and slides, shoes and boots. We enjoy highly successful licensing partnerships with Disney, Marvel, Nickelodeon, and Warner Bros., among others, which allows us to bring popular global franchises and characters to life on our product in a fun, exciting way.
We continue to leverage our expertise and innovation in injection molding to create a fresh, distinctive point of view in the casual footwear market and to deliver a winning combination of comfort, style and versatility to our consumer year round.
Sales and Marketing
Each season we focus on presenting a compelling brand story and experience for our new product introductions as well as our on-going core products. Our marketing efforts center on story-telling across diverse wearing occasions and product silhouettes. For the years ended December 31, 2016, 2015, and 2014, total advertising costs were approximately $56.0 million, $58.2 million, and $44.7 million, respectively.
We run our business across three major geographic regions: the Americas, Asia Pacific, and Europe, which are discussed in more detail in Business Segments and Geographic Information below. In developing our market growth and expansion strategies, we prioritize five core markets including: (i) the United States, (ii) Japan, (iii) China, (iv) South Korea and (v) Germany. These countries have been identified as large-scale geographies where we believe the greatest opportunities for growth exist. We are also focusing our marketing efforts on these countries in an effort to increase customer awareness of both our brand and our full product range.
2
We have three primary sales channels: wholesale, which includes distributors, Crocs owned retail, and Crocs e-commerce (discussed in more detail below). Our marketing efforts are aimed at driving business to both our wholesale partners and our company-operated Crocs retail stores and e-commerce sites. Our marketing efforts in the wholesale and retail channels are focused on social and digital outreach to consumers to shop and visual merchandising. Company operated retail stores provide a unique opportunity to engage with consumers at a deeper level by showcasing our full assortment of molded and casual footwear. No single wholesale customer accounted for 10% or more of our revenues for any of the years ended December 31, 2016, 2015, and 2014.
Wholesale Channel
During the years ended December 31, 2016, 2015, and 2014, approximately 52.7%, 54.2% and 55.7% of revenues, respectively, were derived through the wholesale channel which consists of distributors and third-party retailers. Wholesale customers include family footwear retailers, national and regional retail chains, sporting goods stores, independent footwear retailers as well as e-tailers.
Many of our agreements allow us to accept returns from wholesale customers for defective products, on an exception basis, and to extend pricing discounts in lieu of such returns. We also may accept returns from our wholesale customers, on an exception basis, for the purpose of stock re-balancing, to ensure that our products are merchandised in the proper assortments.
Outside the United States, in addition to wholesale customers, we use third-party distributors in select markets where we believe such arrangements are preferable to direct sales. These third-party distributors purchase products pursuant to a price list and are granted the right to resell the products in a defined territory, usually a country or group of countries. Our typical distribution agreements have terms of one to five years, are generally terminable upon 30 days prior notice, and have minimum sales requirements that allow us to terminate or renegotiate the contract if minimum requirements are not met.
Retail Channel
During the years ended December 31, 2016, 2015, and 2014, approximately 34.7%, 34.7%, and 35.5%, respectively, of our revenues were derived from sales through our retail channel. We operate our retail channel through three integrated platforms: full-price retail locations, outlet locations, kiosk and store-in-store locations. Our three types of store platforms enable us to promote the breadth of our product offering in high-traffic, highly visible locations. With the worldwide consumer shift in shopping patterns out of traditional retail to e-commerce, we are focused on carefully managing and reducing our physical retail portfolio. We intend to continue to moderate the pace of our retail expansion in 2017 with a focus on outlet locations as well as enhancing the profitability of existing locations. We opened 83 company-operated stores during the year ended December 31, 2016 and closed 84 company-operated stores. As retail store performance will vary in new and existing markets due to many factors, including maturity of the market and brand recognition, we periodically evaluate the fixed assets and leasehold improvements related to our retail locations for impairment.
Full-Price Retail Locations
Our company-operated full-price retail locations allow us to effectively showcase the full extent of our product ranges to consumers. In addition, our full-price retail locations provide us with the opportunity to interact with our consumers directly. The optimal space for our retail locations is between approximately 1,500 and 1,800 square feet, and is located in high-traffic shopping malls or districts. During the year ended December 31, 2016, we closed 66 stores and opened 19 new full-price retail stores. As of December 31, 2016, 2015, and 2014, we operated 228, 275, and 311 full-price retail stores, respectively.
Outlet Locations
Our company-operated outlet locations allow us to sell discontinued and overstock merchandise directly to consumers at discounted prices. We also sell full-priced products in certain of our outlet stores as well as built for outlet products in certain locations. Outlet locations are similar in size to our full-price retail stores; however, they are generally located within outlet shopping centers. During the year ended December 31, 2016, we closed four outlet locations and opened 50 outlet locations. As of December 31, 2016, 2015, and 2014, we operated 232, 186, and 174 outlet stores, respectively.
Kiosk / Store-in-Store Locations
Our company-operated kiosks and store-in-store locations allow us to market specific product lines with the further flexibility to tailor products to consumer preferences in shopping malls and other high foot traffic areas. With efficient use of retail space, and limited capital investment, we believe that kiosks and store-in-store locations can be an effective vehicle for marketing our products where this business model is applicable. During the year ended December 31, 2016, we closed 14 kiosk and store-in-store locations and opened 14 new kiosk and store-in-store locations. As of December 31, 2016, 2015, and 2014, we operated 98, 98, and 100 kiosks and store-in-stores, respectively.
3
The following table illustrates the net change in 2016 with respect to the number of our company-operated retail locations by reportable operating segment and country:
Company-Operated Retail Locations | December 31, 2015 | Opened | Closed | December 31, 2016 | ||||||||
Americas | ||||||||||||
United States | 179 | 7 | 12 | 174 | ||||||||
Canada | 10 | — | — | 10 | ||||||||
Puerto Rico | 7 | — | 1 | 6 | ||||||||
Total Americas | 196 | 7 | 13 | 190 | ||||||||
Asia Pacific | ||||||||||||
Korea | 84 | 9 | 6 | 87 | ||||||||
Japan | 52 | 1 | 4 | 49 | ||||||||
China | 55 | 43 | 19 | 79 | ||||||||
Hong Kong | 21 | 5 | 9 | 17 | ||||||||
Singapore | 15 | 3 | — | 18 | ||||||||
Australia | 11 | 5 | 8 | 8 | ||||||||
United Arab Emirates | 14 | 1 | 3 | 12 | ||||||||
South Africa | 9 | — | 9 | — | ||||||||
Total Asia Pacific | 261 | 67 | 58 | 270 | ||||||||
Europe | ||||||||||||
Russia | 37 | 2 | 3 | 36 | ||||||||
Germany | 18 | — | — | 18 | ||||||||
Great Britain | 10 | — | 3 | 7 | ||||||||
France | 12 | — | 2 | 10 | ||||||||
Netherlands | 6 | — | 1 | 5 | ||||||||
Finland | 5 | — | 1 | 4 | ||||||||
Spain | 6 | — | 1 | 5 | ||||||||
Austria | — | 7 | 1 | 6 | ||||||||
Other | 8 | — | 1 | 7 | ||||||||
Total Europe | 102 | 9 | 13 | 98 | ||||||||
Total | 559 | 83 | 84 | 558 | ||||||||
_______________________________________________________________________________
E-commerce Channel
As of December 31, 2016, we offered our products through 12 company-operated e-commerce sites worldwide. We also offer our products through third-party e-commerce sites. Revenues from third-party e-commerce sites are reported in our wholesale channel. During the years ended December 31, 2016, 2015, and 2014, approximately 12.6%, 11.1% and 8.8%, respectively, of our revenues were derived from sales through our e-commerce channel. Our e-commerce presence enables us to have increased access to our consumers and provides us with an opportunity to educate them about our products and brand. Improving our e-commerce capabilities is one of our key growth strategies. We will continue to improve our consumer's online experience, and our in stock reliability and will look for new ways to leverage digital technologies to connect with consumers, including mobile optimization of our sites.
Business Segments and Geographic Information
We have three reportable operating segments based on the geographic nature of our operations: Americas, Asia Pacific, and Europe. We also have an "Other businesses" category which aggregates insignificant operating segments that do not meet the reportable operating segment threshold, including manufacturing operations located in Mexico and Italy, and corporate operations. See additional discussion of our segments and geographic information, including results of operations and assets by segment and geography in Note 16 — Operating Segments and Geographic Information in the accompanying notes to the consolidated financial statements included in Part II — Item 8. Financial Statements and Supplementary Data of this Annual Report.
4
Americas
The Americas segment consists of revenues and expenses related primarily to product sales in North and South America. Regional wholesale channel customers consist of a broad range of family footwear, sporting goods and e-tailers as well as independent retailers and distributors. The Americas retail channel sells directly to consumers through 190 company-operated retail store locations in the Americas as well as through e-commerce sites. During the years ended December 31, 2016, 2015, and 2014, revenues from the Americas segment were approximately 45.1%, 43.7%, and 40.9% of our consolidated revenues, respectively. Specifically, revenues from the United States were approximately 37.1%, 35.8%, and 36.3% of our consolidated revenues, respectively, for the years ended December 31, 2016, 2015, and 2014.
Asia Pacific
The Asia Pacific segment consists of revenues and expenses related primarily to product sales throughout Asia, Australia, New Zealand, Africa and the Middle East. The Asia Pacific wholesale channel consists of sales to a broad range of retailers similar to the wholesale channel we have established in the Americas segment, plus distributors in select markets. We also sell products directly to consumers through 270 company-operated retail stores located in Asia as well as through our e-commerce sites. During the years ended December 31, 2016, 2015, and 2014, revenues from our Asia Pacific segment were 38.1%, 39.0%, and 39.6%, of our consolidated revenues, respectively.
Europe
The Europe segment consists of revenues and expenses related primarily to product sales throughout Western Europe, Eastern Europe and Russia. The Europe segment wholesale channel customers consist of a broad range of retailers, similar to the wholesale channel we have established in the Americas segment, plus distributors in select markets. We also sell our products directly to consumers through 98 company-operated retail stores located in Europe as well as through our e-commerce sites. During the years ended December 31, 2016, 2015, and 2014, revenues from the Europe segment were 16.7 %, 17.3%, and 19.5% of our consolidated revenues, respectively.
Distribution and Logistics
On an ongoing basis, we look to enhance our distribution and logistics network to further streamline our supply chain, increase our speed to market, and lower operating costs. During the year ended December 31, 2016, we stored our raw material and finished goods inventories in company-operated warehouse and distribution facilities located in the United States, Mexico, the Netherlands, Japan, Russia, and Italy. We also utilize third-party operated distribution centers located in China, Japan, Hong Kong, Australia, Korea, Singapore, India, Taiwan, the United Arab Emirates, Russia, Brazil, Argentina, Chile, Puerto Rico, and Italy. As of December 31, 2016, our company-operated warehouse and distribution facilities provided us with approximately 0.9 million square feet and our third-party operated distribution facilities provided us with approximately 0.5 million square feet. We also ship a portion of our products directly to our wholesale customers from our internal and third-party manufacturers.
Raw Materials
Croslite, our branded proprietary closed-cell resin, is the primary raw material used in the majority of our footwear and some of our accessories. Croslite is soft, durable, and allows our products to be non-marking and extremely lightweight. Croslite is carefully formulated to create extremely lightweight, odor-resistant, water-resistant and non-marking footwear that conforms to the shape of the foot and increases comfort.
We continue to invest in research and development in order to refine our materials to enhance these properties and to develop new properties for specific applications.
Croslite material is produced by compounding elastomer resins that we or one of our third-party processors purchase from major chemical manufacturers, together with certain other production inputs such as color dyes. We have identified multiple suppliers that produce the elastomer resins used in the Croslite material. We may also in the future identify and utilize materials produced by other suppliers as an alternative to, or in addition to, the elastomer resins we currently use in the production of our proprietary material. All of the other raw materials that we use to produce the Croslite products are readily available for purchase from multiple suppliers.
Since our inception in 2002, we have substantially increased the number of footwear products we offer. Many of these new products are constructed using leather, textile fabrics, or other non-Croslite materials. We, or our third-party manufacturers, obtain these materials from a number of third-party sources and we believe these materials are broadly available. We also outsource the compounding of the Croslite material and continue to purchase a portion of our compounded raw materials from a third-party in Europe.
5
Research, Design and Development
We continue to dedicate significant resources to product design and development as we expand the footwear styles we offer based on opportunities we identify in the marketplace. Our design and development process is highly collaborative and we continually strive to improve our development function so we can bring products to market quickly and at reduced costs, while maintaining product quality. We spent $11.9 million, $14.0 million, and $16.7 million in research, design, and development activities for the years ended December 31, 2016, 2015, and 2014, respectively.
Manufacturing and Sourcing
Our strategy is to maintain a flexible, globally diversified, low-cost manufacturing base. We currently have company-operated production facilities in Mexico and Italy. We also contract with third-party manufacturers to produce certain of our footwear styles or to provide support to our internal production processes.
In the years ended December 31, 2016, 2015, and 2014, we manufactured approximately 14.6%, 11.3%, and 13.9%, respectively, of our footwear products internally. We sourced the remaining footwear production from multiple third-party manufacturers primarily in China, Vietnam, Eastern Europe and South America. During the years ended December 31, 2016, 2015, and 2014, our largest third-party manufacturer in China produced approximately 23.4%, 26.6%, and 27.5%, respectively, of our third-party footwear unit volume. We do not have written supply agreements with our primary third-party manufacturers in Asia.
Intellectual Property and Trademarks
We rely on a combination of trademarks, copyrights, trade secrets, trade dress and patent protections to establish, protect and enforce our intellectual property rights in our product designs, brands, materials, and research and development efforts, although no such methods can afford complete protection. We own or license the material trademarks used in connection with the marketing, distribution, and sale of all of our products, both domestically and internationally, in most countries where our products are currently either sold or manufactured. Our major trademarks include the Crocs logo and the Crocs word mark, both of which are registered or pending registration in the U.S., the European Union, Japan, Taiwan, China, and Canada among other countries. We also have registrations or pending trademark applications for other marks and logos in various countries around the world.
In the U.S., our patents are generally in effect for up to 20 years from the date of filing the patent application. Our trademarks registered within and outside of the U.S. are generally valid as long as they are in use and their registrations are properly maintained and have not been found to become generic. We believe our trademarks and copyrights are crucial to the successful marketing and sale of our products. We will continue to strategically register, both domestically and internationally, the trademarks and copyrights we utilize today and those we develop in the future. We also intend to continue to aggressively police our patents, trademarks and copyrights and pursue those who infringe upon them, both domestically and internationally, as we deem necessary.
We consider the formulations of the materials covered by our trademark Croslite and used to produce our shoes to be a valuable trade secret. Croslite material is manufactured through a process that combines a number of components in various proportions to achieve the properties for which our products are known. We use multiple suppliers to source these components but protect the formula by using exclusive supply agreements for key components, confidentiality agreements with our third-party processors, and by requiring our employees to execute confidentiality agreements concerning the protection of our confidential information. Other than our third-party processors, we are unaware of any third party using our formula in the production of shoes. We believe the comfort and utility of our products depend on the properties achieved from the compounding of Croslite material and constitute a key competitive advantage for us, and we intend to continue to vigorously protect this trade secret.
We also actively combat counterfeiting through monitoring of the global marketplace. We use our employees, sales representatives, distributors, and retailers, as well as outside investigators and attorneys, to police against infringing products by encouraging them to notify us of any suspect products and to assist law enforcement agencies. Our sales representatives and distributors are also educated on our patents, pending patents, trademarks and trade dress to assist in preventing potentially infringing products from obtaining retail shelf space. The laws of certain countries do not protect intellectual property rights to the same extent or in the same manner as do the laws of the U.S., and, therefore, we may have difficulty obtaining legal protection for our intellectual property in certain foreign jurisdictions.
Seasonality
Due to the seasonal nature of our footwear, which is more heavily focused on styles suitable for warm weather, revenues generated during our fourth quarter are typically less than revenues generated during our first three quarters, when the northern hemisphere is experiencing warmer weather. We continue to expand our product line to include more winter oriented styles to reduce the seasonality of our revenues. Our quarterly results of operations may also fluctuate significantly as a result of a variety of other factors, including the timing of new model introductions, or general economic conditions, or consumer confidence. Accordingly,
6
results of operations and cash flows for any one quarter are not necessarily indicative of expected results for any other quarter or for any other year.
Backlog
We receive a significant portion of orders from our wholesale customers and distributors that remain unfilled as of any date and, at that point, represent orders scheduled to be shipped at a future date. We refer to these unfilled orders as backlog, which can be canceled by our customers at any time prior to shipment. Backlog only relates to wholesale and distributor orders for the next season and current season fill-in orders, and excludes potential sales in our retail and e-commerce channels. Backlog as of a particular date is affected by a number of factors, including seasonality, manufacturing schedules and the timing of product shipments. Backlog also is affected by the timing of customers' orders and product availability. Due to these factors and business model differences around the globe, we believe backlog is an imprecise indicator of future revenues that may be achieved in a fiscal period and cannot be relied upon.
Competition
The global casual, athletic and fashion footwear markets are highly competitive. Although we believe that we do not compete directly with any single company with respect to the entire spectrum of our products, we believe portions of our wholesale, retail, and e-commerce businesses compete with companies including, but not limited to, Nike Inc., adidas AG, Under Armour, Inc., Deckers Outdoor Corporation, Skechers USA, Inc., Steve Madden, Ltd., Wolverine World Wide, Inc. and VF Corporation. Our company-operated retail locations also compete with footwear retailers such as Genesco, Inc., Macy's Inc., Dillard's, Inc., Dick's Sporting Goods, Inc., The Finish Line Inc., and Foot Locker, Inc.
The principal elements of competition in these markets include brand awareness, product functionality, design, comfort, quality, pricing, customer service, and marketing and distribution. We believe that our unique footwear designs, our Croslite material, our prices, our expanded product line, and our distribution network continue to position us well in the marketplace. However, a number of companies in the casual footwear industry have greater financial resources, more comprehensive product lines, broader market presence, longer standing relationships with wholesalers, longer operating histories, greater distribution capabilities, stronger brand recognition and greater marketing resources than we have. Furthermore, we face competition from new companies who have been attracted to the market with products similar to ours as the result of the unique design and success of our footwear products.
Foreign Currency Fluctuations on Revenues and Net Income (Loss)
As a global company, we have significant revenues and costs denominated in currencies other than the U.S. Dollar. We are exposed to the risk of gains and losses resulting from changes in exchange rates on monetary assets and liabilities within our international subsidiaries that are denominated in currencies other than the subsidiary’s functional currency. Likewise, our U.S. companies are also exposed to the risk of gains and losses resulting from changes in exchange rates on monetary assets and liabilities that are denominated in a currency other than the U.S. Dollar.
We have experienced, and will continue to experience, changes in international currency rates, impacting both results of operations and the value of assets and liabilities denominated in foreign currencies. We enter into forward foreign exchange contracts to buy or sell various foreign currencies to selectively protect against volatility in the value of non-functional currency denominated monetary assets and liabilities. Changes in the fair value of these forward contracts are recognized in earnings.
Changes in exchange rates have a direct effect on our reported U.S. Dollar consolidated financial statements because we translate the operating results and financial position of our international subsidiaries to U.S. Dollars using current period exchange rates. Specifically, we translate the statements of operations of our foreign subsidiaries into the U.S. Dollar reporting currency using average exchange rates each reporting period. As a result, comparisons of reported results between reporting periods may be impacted significantly by differences in the exchange rates used to translate the operating results of our international subsidiaries.
For example, in our European segment, when the U.S. Dollar strengthens relative to the Euro, our reported U.S. Dollar results are less than if there had been no change in the exchange rate, because more Euros are required to generate the same U.S. Dollar translated amount. Conversely, when the U.S. Dollar weakens relative to the Euro, the reported U.S. Dollar results of our Europe segment are higher compared to a period with a stronger U.S. Dollar relative to the Euro. Similarly, the reported U.S. Dollar results of our Asia Pacific segment, where the functional currencies are primarily the Japanese Yen, Chinese Yuan, Korean Won and the Singapore Dollar, are comparatively lower or higher when the U.S. Dollar strengthens or weakens, respectively, relative to these currencies. See Item 7. Management's Discussion and Analysis of Financial Condition and Results of Operations in Part II of this Form 10-K for a discussion of the impact of the change in foreign exchange rates on our U.S. Dollar consolidated statements of operations for the years ended December 31, 2016 and 2015.
7
Employees
As of December 31, 2016, we had approximately 5,068 full-time, part-time, and seasonal employees, of which approximately 3,390 were engaged in retail-related functions.
Available Information
We file with, or furnish to, the SEC reports, including our Annual Report on Form 10-K, Quarterly Reports on Form 10-Q, Current Reports on Form 8-K and amendments to those reports pursuant to Section 13(a) or 15(d) of the Securities Exchange Act of 1934, as amended . These reports are available free of charge on our corporate website (www.crocs.com) as soon as reasonably practicable after they are electronically filed with or furnished to the SEC. Copies of any materials we file with the SEC can be obtained at www.sec.gov or at the SEC's public reference room at 100 F Street, N.E., Washington, D.C. 20549. Copies of any of these documents will be provided in print to any stockholder who submits a request in writing to Integrated Corporate Relations, 761 Main Avenue, Norwalk, CT 06851. The foregoing website addresses are provided as inactive textual references only. The information provided on our website (or any other website referred to in this report) is not part of this report and is not incorporated by reference as part of this Annual Report on Form 10-K.
8
ITEM 1A. Risk Factors
The reader should carefully consider the following risk factors and all other information presented within this report. The risks set forth below are those that our management believes are applicable to our business and the industry in which we operate. These risks have the potential to have a material adverse effect on our business, results of operations, cash flows, financial condition, liquidity, or access to sources of financing. The risks included here are not exhaustive and there may be additional risks that are not presently material or known. You should carefully consider each of the following risks described below in conjunction with all other information presented in this report. Since we operate in a very competitive and rapidly changing environment, new risk factors emerge from time to time and it is not possible for management to predict all risk factors, nor can it assess the impact of all such risk factors on our business.
Risks Specific to Our Company
Uncertainty about current and future global economic conditions may adversely affect consumer spending and the financial health of our customers and others with whom we do business, which may adversely affect our financial condition, results of operations and cash resources.
Uncertainty about current and future global economic conditions may cause consumers and retailers to defer purchases or cancel purchase orders for our products in response to tighter credit, decreased cash availability, and weakened consumer confidence. Our financial success is sensitive to changes in general economic conditions, both globally and in specific markets, that may adversely affect the demand for our products including recessionary economic cycles, higher interest rates, higher fuel and other energy costs, inflation, increases in commodity prices, higher levels of unemployment, higher consumer debt levels, higher tax rates and other changes in tax laws, or other economic factors. For example, in 2015 and 2014, we experienced difficulty in our Asia Pacific segment primarily due to decreased performance in our China business which resulted in delayed collections of receivables and increased the risk of customer nonpayment. Due to the continued adverse macroeconomic conditions in China during 2016 and 2015, we also experienced volatility in revenues in our Asia Pacific segment. If global economic and financial market conditions deteriorate further or remain weak for an extended period of time, the following factors, among others, could have a material adverse effect on our business and financial results:
• | Changes in foreign currency exchange rates relative to the U.S. Dollar could have a material impact on our reported financial results. |
• | Slower consumer spending may result in our inability to maintain or increase our sales to new and existing customers, cause reduced product orders or product order cancellations from wholesale accounts that are directly impacted by fluctuations in the broader economy, difficulties managing inventories, higher discounts, and lower product margins. |
• | If consumer demand for our products declines, we may not be able to profitably establish new retail stores, or continue to operate existing stores, due to higher fixed costs of the retail business. |
• | A decrease in credit available to our wholesale or retail customers, product suppliers and other service providers, or financial institutions that are counterparties to our credit facility or derivative instruments may result in credit pressures other financial difficulties or insolvency for these parties, with a potential adverse impact on our ability to obtain future financing, our business and our financial results. |
• | If our wholesale customers experience diminished liquidity, we may experience a reduction in product orders, an increase in customer order cancellations, and/or the need to extend customer payment terms which could lead to larger balances and delayed collection of our accounts receivable, reduced cash flows, greater expenses for collection efforts, and increased risk of nonpayment by our wholesalers. |
• | If our manufacturers or other parties in our supply chain experience diminished liquidity, and as a result are unable to fulfill their obligations to us, we may be unable to provide our customers with our products in a timely manner, resulting in lost sales opportunities or a deterioration in our customer relationships. |
China's deteriorating macro-economic environment could adversely affect sales in our Asia Pacific segment which may adversely affect our business financial results.
Current and future global economic conditions may adversely affect consumer spending and the financial health of our customers and others with whom we do business, which may adversely affect our financial condition, results of operations, and cash resources. Macro-economic conditions in China have deteriorated over the past several quarters resulting in softening consumer demand and payment delays from our China distributors which have negatively impacted the sales volumes and cash collections for our China operations. During 2015 we discontinued relationships with several distributors and also changed terms to require cash payment at delivery. During 2015, we increased our allowance for doubtful accounts receivable in China by $23.2 million as a result of a
9
default by several distributors that were unable to make payments to us. If the economic conditions in China continue to decline, we may experience further reductions in consumer demand in the China market resulting in additional losses. As our China operations represent approximately 7% of our total revenues, the impact of declining sales volumes in China could have a material adverse impact on our business and financial results in future periods.
Changes in foreign exchange rates, most significantly but not limited to the Singapore Dollar, Chinese Yuan, Japanese Yen, Korean Won, the Euro and British Pound, could have a material adverse effect on our business and financial results.
As a global company, we have significant revenues and costs denominated in currencies other than the U.S. Dollar (“USD”). We pay the majority of our overseas third-party manufacturers, located primarily in China and Vietnam, in USD. Our ability to sell our products in foreign markets and the USD value of the sales made in foreign currencies can be significantly influenced by changes in exchange rates. A decrease in the value of foreign currencies relative to the USD could result in lower revenues, product price pressures, and increased losses from currency exchange rates. Foreign exchange rate volatility could also disrupt the business of the third-party manufacturers that produce our products by making their purchases of raw materials more expensive and more difficult to finance, as we generally pay our overseas third-party manufacturers in U.S. Dollars. In 2016, we experienced an increase of approximately $3.3 million in our Asia Pacific segment revenues as a result of increases in the value of Asian currencies relative to the U.S. Dollar, and a decrease of approximately $3.2 million in our Europe revenues as a result of decreases in the Euro and Russian Ruble relative to the U.S. Dollar. Strengthening of the USD against Asian and European currencies, and various other global currencies would adversely impact our USD reported results due to the impact on foreign currency translation. While we enter into foreign currency exchange forward contracts as economic cash flow hedges to reduce our exposure to changes in exchange rates, the volatility of foreign currency exchange rates is dependent on many factors that cannot be forecasted with reliable accuracy and as a result our forward contracts may not prove effective in reducing our exposures.
We face significant competition.
The footwear industry is highly competitive. Continued growth in the market for casual footwear has encouraged the entry of new competitors into the marketplace and has increased competition from established companies. Our competitors include most major athletic and non-athletic footwear companies and retailers with their own private label footwear products. A number of our competitors have significantly greater financial resources than us, more comprehensive product lines, a broader market presence, longer standing relationships with wholesalers, a longer operating history, greater distribution capabilities, stronger brand recognition, and spend substantially more than we do on product marketing. Our competitors' greater financial resources and capabilities in these areas may enable them to better withstand periodic downturns in the footwear industry and general economic conditions, compete more effectively on the basis of price and production, and more quickly develop new products. Some of our competitors are offering products that are substantially similar, in design and materials, to our products. In addition, access to offshore manufacturing is also making it easier for new companies to enter the markets in which we compete. If we are unable to compete successfully in the future, our sales and profits may decline, we may lose market share, our business and financial results may deteriorate, and the market price of our common stock would likely fall.
Our business relies significantly on the use of information technology. A significant disruption to our operational technology or failure to protect the integrity and security of customer and employee information could harm our reputation and/or our ability to effectively operate our business.
We rely heavily on the use of information technology systems and networks in our operations and supporting departments including marketing, accounting, finance, and human resources. The future success and growth of our business depend on streamlined processes made available through information systems, global communications, internet activity, and other network processes. We rely exclusively on information services providers worldwide for our information technology functions including network, help desk, hardware and software configuration. Additionally, we rely on internal networks and information systems and other technology, including the internet and third-party hosted services, to support a variety of business processes and activities, including procurement and supply chain, manufacturing, distribution, invoicing and collection of payments. We use information systems for certain human resource activities and to process our employee benefits, as well as to process financial information for internal and external reporting purposes and to comply with various reporting, legal and tax requirements. We also have outsourced a significant portion of work associated with our finance and accounting, human resources and other information technology functions to third-party service providers. Despite our current security measures, our systems, and those of our third-party service providers, we may be vulnerable to information security breaches, acts of vandalism, computer viruses, credit card fraud, phishing, and interruption or loss of valuable business data. Any disruption to these systems or networks could result in product fulfillment delays, key personnel being unable to perform duties or communicate throughout the organization, loss of retail and internet sales, significant costs for data restoration, and other adverse impacts on our business and reputation.
Over the last several years, we have implemented numerous information systems designed to support various areas of our business, including a fully-integrated global accounting, operations, and finance enterprise resource planning system, and warehouse
10
management, order management, retail point-of-sale, and internet point-of-sale systems, as well as various interfaces between these systems and supporting back office systems. Issues in implementing or integrating new systems with our current operations, failure of these systems to operate effectively, problems with transitioning to upgraded or replacement systems, or a breach in security of these systems could cause delays in product fulfillment and reduced efficiency of our operations and require significant additional capital investments, to remediate, and may have an adverse effect on our business and financial results.
We routinely possess sensitive customer and employee information. Hackers and data thieves are increasingly sophisticated and operate large-scale and complex automated attacks. Any breach of our network may result in the loss of valuable business data, misappropriation of our consumers' or employees' personal information, or a disruption of our business. Despite our existing security procedures and controls, if our network becomes compromised, it could give rise to unwanted media attention, materially damage our customer relationships, harm our business, our reputation, and our financial results, which could result in fines or lawsuits, and may increase the costs we incur to protect against such information security breaches, such as increased investment in technology, the costs of compliance with consumer protection laws, and costs resulting from consumer fraud.
We may be unable to successfully execute our long-term growth strategy, maintain or grow our current revenue and profit levels, or accurately forecast geographic demand and supply for our products.
Our ability to maintain our revenue and profit levels or to grow in the future depends on, among other things, the continued success of our efforts to maintain our brand image, our ability to bring compelling and profit enhancing footwear offerings to market, and our ability to expand within our current distribution channels and increase sales of our products into new locations internationally. Successfully executing our long-term growth and profitability strategy will depend on many factors, including:
• | Our ability to strengthen our brand globally into a leading casual lifestyle footwear provider; |
• | Our ability to focus on relevant geographies and markets, product innovation and profitable new growth platforms while maintaining demand for our current offerings; |
• | Our ability to effectively manage our retail stores (including closures of existing stores) while meeting operational and financial targets at the retail store level; |
• | Our ability to accurately forecast the global demand for our products and the timely execution of supply chain strategies to deliver product around the globe efficiently based on that demand; |
• | Our ability to use and protect the Crocs brand and our other intellectual property in new markets and territories; |
• | Our ability to achieve and maintain a strong competitive position in new and existing markets; |
• | Our ability to attract and retain qualified distributors, agents, and to continue to develop direct sales channels; |
• | Our ability to consolidate our distribution and supply chain network to leverage resources and simplify our fulfillment process; and |
• | Our ability to execute a multi-channel advertising and marketing campaign to effectively communicate our message directly to our consumers and employees. |
If we are unable to successfully implement any of the above mentioned strategies and the many other factors mentioned throughout these risk factors, our business may fail to grow, our brand may suffer, and our business and financial results may be adversely impacted.
There can be no assurance that the strategic plans we have begun to implement will be successful.
In July 2014, we announced strategic plans for long-term improvement and growth of our business, which is comprised of four key initiatives: (1) streamlining the global product and marketing portfolio, (2) reducing direct investment in smaller geographic markets, (3) creating a more efficient organizational structure including reducing duplicative and excess overhead which will also enhance the decision making process, and (4) optimizing our retail locations around the world.
While these strategic plans, along with other steps to be taken, are intended to improve and grow our business, there can be no assurance that this will be the case, or that additional steps or accrual of additional material accounting charges will not be required. If additional steps are required, there can be no assurance that they will be properly implemented or will be successful. The initial charges for the strategic plan were incurred in the first quarter of 2014 and continued through 2015. During 2014 and 2015, we closed 172 retail locations, offset in part by 112 new retail locations opened. We completed our restructuring plan in 2015.
We conduct significant business activity outside the U.S. which exposes us to risks of international commerce.
11
A significant portion of our revenues is from foreign sales. Our ability to maintain the current level of operations in our existing international markets is subject to risks associated with international sales operations as well as the difficulties associated with promoting products in unfamiliar cultures. In addition to foreign manufacturing, we operate retail stores and sell our products to retailers outside of the U.S. Foreign manufacturing and sales activities are subject to numerous risks including: tariffs, anti-dumping fines, import and export controls, and other non-tariff barriers such as quotas and local content rules; delays associated with the manufacture, transportation and delivery of products; increased transportation costs due to distance, energy prices, or other factors; delays in the transportation and delivery of goods due to increased security concerns; restrictions on the transfer of funds; restrictions, due to privacy laws, on the handling and transfer of consumer and other personal information; changes in governmental policies and regulations; political unrest, changes in law, terrorism, or war, any of which can interrupt commerce; potential violations of U.S. and foreign anti-corruption and anti-bribery laws by our employees, business partners or agents, despite our policies and procedures relating to compliance with these laws; expropriation and nationalization; difficulties in managing foreign operations effectively and efficiently from the U.S.; difficulties in understanding and complying with local laws, regulations and customs in foreign jurisdictions; longer accounts receivable payment terms and difficulties in collecting foreign accounts receivables; difficulties in enforcing contractual and intellectual property rights; greater risk that our business partners do not comply with our policies and procedures relating to labor, health and safety; and increased accounting and internal control costs. In addition, we are subject to customs laws and regulations with respect to our export and import activity which are complex and vary within legal jurisdictions in which we operate. We cannot assure that there will be not be a control failure around customs enforcement despite the precautions we take. We are currently subject to audits by various customs authorities including the U.S. and Mexico. Any failure to comply with customs laws and regulations could be discovered during a U.S. or foreign government customs audit, or customs authorities may disagree with our tariff treatments, and such actions could result in substantial fines and penalties, which could have an adverse effect on our business and financial results. In addition, changes to U.S. trade laws may adversely impact our operations.
In addition, as a global company, we are subject to foreign and U.S. laws and regulations designed to combat governmental corruption, including the U.S. Foreign Corrupt Practices Act and the U.K. Bribery Act. Violations of these laws and regulations could result in fines and penalties, criminal sanctions against us, our officers, or our employees, prohibitions on the conduct of our business and on our ability to offer our products and services in one or more countries and a materially negative effect on our brands and our operating results. Although we have implemented policies and procedures designed to ensure compliance with these foreign and U.S. laws and regulations, including the U.S. Foreign Corrupt Practices Act and the U.K. Bribery Act, there can be no assurance that our employees, business partners or agents will not violate our policies.
Our success depends substantially on the value of our brand and failure to strengthen and preserve this value, either through our actions or those of our business partners, could have a negative impact on our financial results.
We believe much of our success has been attributable to the strengthening of the Crocs global brand. To be successful in the future, particularly outside of the U.S., where the Crocs global brand is less well-known and perceived differently, we believe we must timely and appropriately respond to changing consumer demand and leverage the value of our brand across all sales channels. We may have difficulty managing our brand image across markets and international borders as certain consumers may perceive our brand image to be out of style, outdated, one-dimensional or otherwise undesirable. Brand value is based in part on consumer perceptions on a variety of subjective qualities. In the past, several footwear companies including ours have experienced periods of rapid growth in revenues and earnings followed by periods of declining sales and losses, and our business may be similarly affected in the future. Business incidents that erode consumer trust, such as perceived product safety issues, whether isolated or recurring, in particular incidents that receive considerable publicity or result in litigation, can significantly reduce brand value and have a negative impact on our business and financial results. Consumer demand for our products and our brand equity could diminish significantly if we fail to preserve the quality of our products, are perceived to act in an unethical or socially irresponsible manner, fail to comply with laws and regulations, or fail to deliver a consistently positive consumer experience in each of our markets. Additionally, counterfeit reproductions of our products or other infringement of our intellectual property rights, including unauthorized uses of our trademarks by third parties, could harm our brand and adversely impact our business.
If our online e-commerce store sites do not function effectively, our business and financial results could be materially adversely affected.
Many of our customers buy our products on our e-commerce store sites as well as third-party e-commerce store sites. Any failure on our part or third-party platform providers to provide effective, reliable, user-friendly e-commerce platforms that offer a wide assortment of our merchandise could place us at a competitive disadvantage, result in the loss of sales, and could have a material adverse impact on our business and financial results. Sales in our e-commerce channel may also divert sales from our retail and wholesale channels.
Opening retail stores globally involves substantial investment, including the construction costs of leasehold improvements, furniture and fixtures, equipment, information systems, inventory and personnel. Operating global retail stores incurs fixed
12
costs. If we are unable to generate sales, operate our retail stores profitably or otherwise fail to meet expectations, we may be unable to reduce such fixed costs and avoid losses or negative cash flows.
Opening and operating additional retail locations requires substantial financial commitments, including fixed costs, and are subject to numerous risks including consumer preferences, location and other factors that we do not control. Declines in revenue and operating performance of our retail locations could cause us to record impairment charges and have a material adverse effect on our business and financial results. During 2016, we opened, closed and operated 19, 66 and 228 retail locations, respectively.
Although we have slowed the expansion of our retail sales channel, we intend to continue to open new retail locations globally. Our ability to open new locations successfully depends on our ability to identify suitable store locations, negotiate acceptable lease terms, hire, train, and retain store personnel and satisfy the fashion preferences in new geographic areas. Many of our retail locations are located in shopping malls and our success depends in part on obtaining prominent locations and the overall ability of the malls to successfully generate and maintain customer traffic. We cannot control the success of individual malls or store closures by other retailers, which may lead to mall vacancies and reduced customer foot traffic. Reduced customer foot traffic could reduce sales at our retail stores or hinder our ability to open retail stores in new markets, which could in turn negatively affect our business and financial results. In addition, some of our retail stores and kiosks occupy street locations that are heavily dependent on customer traffic generated by tourism. Any substantial decrease in tourism resulting from an economic slowdown, political, terrorism, social or military events or otherwise, is likely to adversely affect sales in our existing stores and kiosks. For example, in 2016 we closed our retail locations in Belgium in part as a result of the terrorist attacks in Europe.
We may be required to record impairments of long-lived assets relating to our retail operations.
Impairment testing of our retail stores' long-lived assets requires us to make estimates about our future performance and cash flows that are inherently uncertain. These estimates can be affected by numerous factors, including changes in economic conditions, our results of operations, and competitive conditions in the industry. Due to the fixed-cost structure associated with our retail operations, negative cash flows or the closure of a store could result in write-downs of inventory, impairment of leasehold improvements, impairment of other long-lived assets, severance costs, significant lease termination costs or the loss of working capital, which could adversely impact our business and financial results. For example, during 2016, 2015, and 2014, we recorded impairments of which $2.7 million, $9.6 million and $8.8 million, respectively, related to our retail stores. These impairment charges may increase as we continue to evaluate our retail operations. The recording of additional impairments in the future may have a material adverse impact on our business and financial results.
We depend on key personnel across the globe, the loss of whom would harm our business.
We rely on executives and senior management to drive the financial and operational performance of our business. Turnover of executives and senior management can adversely impact our stock price, our results of operations, and our client relationships and may make recruiting for future management positions more difficult or may require us to offer more generous executive compensation packages to attract top executives. Changes in other key management positions may temporarily affect our financial performance and results of operations as new management becomes familiar with our business. In recent years, we have experienced management turnover. Our future success depends on our ability to identify, attract and retain qualified personnel on a timely basis. In addition, we must successfully integrate any newly hired management personnel within our organization in order to achieve our operating objectives. The key initiatives directed by these executives may take time to implement and yield positive results, if at all. If our new executives do not perform up to expectations, we may experience declines in our financial performance and/or delays in our long-term growth strategy.
As a global company, we also rely on the expertise and knowledge of a limited number of key international personnel in many of our geographic regions. In certain instances, one or two personnel may be the primary knowledge base for business operations in a geographic region. The loss of key international personnel could adversely impact our operations and our client relationships.
If we do not accurately forecast consumer demand, we may have excess inventory to liquidate or have greater difficulty filling our customers' orders, either of which could adversely affect our business.
The footwear industry is subject to cyclical variations, consolidation, contraction and closings, as well as fashion trends, rapid changes in consumer preferences, the effects of weather, general economic conditions and other factors affecting consumer demand. In addition, sales to our wholesale customers are generally subject to rights of cancellation and rescheduling by the customer. These factors make it difficult to forecast consumer demand. If we overestimate demand for our products, we may be forced to liquidate excess inventories at discounted prices resulting in lower gross margins. Conversely, if we underestimate consumer demand, we could have inventory shortages which can result in lower sales, delays in shipments to customers, expedited shipping costs, and adversely affect our relationships with our customers and diminish brand loyalty. A decline in demand for our products, or any failure on our part to satisfy increased demand for our products, could adversely affect our business and financial results.
13
Refining our footwear product line may be difficult and expensive. If we are unable to do so successfully, our brand may be adversely affected and we may not be able to maintain or grow our current revenue and profit levels.
To successfully refine our footwear product line, we must anticipate, understand, and react to the rapidly changing tastes of consumers and provide appealing merchandise in a timely manner. New footwear models that we introduce may not be successful with consumers or our brand may fall out of favor with consumers. If we are unable to anticipate, identify, or react appropriately to changes in consumer preferences, our revenues may decrease, our brand image may suffer, our operating performance may decline, and we may not be able to execute our growth plans.
In producing new footwear models, we may encounter difficulties that we did not anticipate during the product development stage. Our development schedules for new products are difficult to predict and are subject to change in response to consumer preferences and competing products. If we are not able to efficiently manufacture new products in quantities sufficient to support retail and wholesale distribution, we may not be able to recover our investment in the development of new styles and product lines and we would continue to be subject to the risks inherent to having a limited product line. Even if we develop and manufacture new footwear products that consumers find appealing, the ultimate success of a new style may depend on our pricing. We have a limited history of introducing new products in certain target markets; as such, we may set the prices of new styles too high for the market to bear or we may not provide the appropriate level of marketing in order to educate the market and potential consumers about our new products. Achieving market acceptance will require us to exert substantial product development and marketing efforts, which could result in a material increase in our selling, general and administrative expenses and there can be no assurance that we will have the resources necessary to undertake such efforts effectively or that such efforts will be successful. Failure to gain market acceptance for new products could impede our ability to maintain or grow current revenue levels, reduce profits, adversely affect the image of our brands, erode our competitive position and result in long-term harm to our business and financial results.
Our quarterly revenues and operating results are subject to fluctuation as a result of a variety of factors, including seasonal variations, which could increase the volatility of the price of our common stock.
Sales of our products are subject to seasonal variations and are sensitive to weather conditions. A significant portion of our revenues are attributable to footwear styles that are more suitable for fair weather and are derived from sales in the northern hemisphere. We typically experience our highest sales activity during the second and third quarters of the calendar year, when there is warmer weather in the northern hemisphere. While we continue to create new footwear styles that are more suitable for cold weather, the effects of favorable or unfavorable weather on sales can be significant enough to affect our quarterly results which could adversely affect our common stock price. Quarterly results may also fluctuate as a result of other factors, including new style introductions, general economic conditions or changes in consumer preferences. Results for any one quarter are not necessarily indicative of results to be expected for any other quarter or for any year. This could lead to results outside of analyst and investor expectations, which could increase volatility of our stock price.
We depend heavily on third-party manufacturers located outside the U.S.
Third-party manufacturers located in China and Vietnam produced the majority of our footwear products in 2016 and are expected to do so in 2017. We depend on the ability of these manufacturers to finance the production of goods ordered, maintain adequate manufacturing capacity and meet our quality standards. We compete with other companies for the production capacity of our third-party manufacturers, and we do not exert direct control over the manufacturers' operations. As such, from time to time we have experienced delays or inabilities to fulfill customer demand and orders, particularly in China and Vietnam. We cannot guarantee that any third-party manufacturer will have sufficient production capacity, meet our production deadlines or meet our quality standards.
In addition, we do not have supply contracts with many of these third-party manufacturers and any of them may unilaterally terminate their relationship with us at any time or seek to increase the prices they charge us. As a result, we are not assured of an uninterrupted supply of products of an acceptable quality and price from our third-party manufacturers. Foreign manufacturing is subject to additional risks, including transportation delays and interruptions, work stoppages, political instability, expropriation, nationalization, foreign currency fluctuations, changing economic conditions, changes in governmental policies and the imposition of tariffs, import and export controls, and other barriers. We may not be able to offset any interruption or decrease in supply of our products by increasing production in our internal manufacturing facilities due to capacity constraints, and we may not be able to substitute suitable alternative third-party manufacturers in a timely manner or at acceptable prices. Any disruption in the supply of products from our third-party manufacturers may harm our business and could result in a loss of sales and an increase in production costs, which would adversely affect our results of operations. In addition, manufacturing delays or unexpected demand for our products may require us to use faster, more expensive transportation methods, such as aircraft, which could adversely affect our profit margins. The cost of fuel is a significant component in transportation costs. Increases in the price of petroleum products can adversely affect our product margins.
14
In addition, because our footwear products are manufactured outside the U.S., the possibility of adverse changes in trade or political relations between the U.S. and other countries, political instability, increases in labor costs, changes in international trade agreements and tariffs, or adverse weather conditions could significantly interfere with the production and shipment of our products, which would have a material adverse effect on our operations and financial results. For example, the Trump Administration has suggested modifying existing trade agreements and/or imposing tariffs on foreign products. Changes in existing trade agreements, including the North American Free Trade Agreement ("NAFTA"), or the imposition of tariffs on our products could have a material adverse effect on our operations and financial results.
We manufacture a portion of our products which causes us to incur greater fixed costs. Any difficulties or disruptions in our manufacturing operations could adversely affect our sales and results of operations.
We produce a portion of our footwear products at our company-owned internal manufacturing facilities in Mexico and Italy. There are significant fixed costs associated with the ownership and operations of these facilities and, as a result, efficient production of a sufficient volume of products is necessary to enable recovery of these costs. In addition, the manufacture of our products from the Croslite material requires the use of a complex process and we may experience difficulty in producing footwear that meets our high quality control standards. We absorb the manufacturing and disposal costs of products that do not meet our quality standards. Further, significant excess capacity at any of our manufacturing facilities as a result of increased efficiencies in our supply chain process or continued volume declines, could result in under-utilization of our facilities, which could lead to excess fixed overhead costs per unit and reduced product margins. Any increases in our manufacturing costs, lack of operating efficiency or product quality could adversely impact our product margins. Furthermore, our manufacturing capabilities are subject to many of the same risks and challenges faced by our third-party manufacturers, including our ability to scale our production capabilities to meet the needs of our customers. Our manufacturing may also be disrupted for reasons beyond our control, including work stoppages, fires, earthquakes, floods or other natural disasters. Any disruption to our manufacturing operations will hinder our ability to deliver products to our customers in a timely manner and could have a material and adverse effect on our business and financial results.
Our third-party manufacturing operations must comply with labor, trade and other laws; failure to do so may adversely affect us.
We require our third-party manufacturers to meet our quality control standards and footwear industry standards for working conditions and other matters, including compliance with applicable labor, environmental, and other laws; however, we do not control our third-party manufacturers or their respective labor practices. A failure by any of our third-party manufacturers to adhere to quality standards or labor, environmental and other laws could cause us to incur additional costs for our products, generate negative publicity, damage our reputation and the value of our brand, and discourage customers from buying our products. We also require our third-party manufacturers to meet certain product safety standards. A failure by any of our third-party manufacturers to adhere to such product safety standards could lead to a product recall which could result in critical media coverage and harm our business, brand and reputation and cause us to incur additional costs.
In addition, if we or our third-party manufacturers violate U.S. or foreign trade laws or regulations, we may be subject to extra duties, significant monetary penalties, the seizure and the forfeiture of the products we are attempting to import, or the loss of our import privileges. Possible violations of U.S. or foreign laws or regulations could include inadequate record keeping of our imported products, misstatements or errors as to the origin, quota category, classification, marketing or valuation of our imported products, and fraudulent visas or labor violations. The effects of these factors could render our conduct of business in a particular country undesirable or impractical and have a negative impact on our operating results. We cannot predict whether additional U.S. or foreign customs quotas, duties, taxes other charges, or restrictions will be imposed upon the importation of foreign produced products in the future or what effect such actions could have on our business, or results.
Our senior revolving credit facility agreement (the "Credit Agreement") contains financial covenants that require us to maintain certain financial measures, ratios and includes restrictive covenants that limit our ability to take certain actions. A breach of restrictive covenants may cause us to be in default under the facility, and our lenders could foreclose on our assets.
Our Credit Agreement requires us to maintain certain financial covenants. A failure to maintain current revenue levels or an inability to control costs or capital expenditures could negatively impact our ability to meet these financial covenants. If we breach any of these restrictive covenants, the lenders could either refuse to lend funds to us or and accelerate the repayment of any outstanding borrowings under the Credit Agreement. In February 2016, we obtained a waiver to remedy noncompliance with certain coverage ratios in December 2015 and amended our Credit Agreement with more favorable terms. We may not have sufficient assets to repay such indebtedness upon a default or receive a waiver of the default from the lender. If we are unable to repay the indebtedness, the lender could initiate a bankruptcy proceeding or collection proceedings with respect to our assets, all of which secure our indebtedness under the Credit Agreement.
15
The Credit Agreement also contains certain restrictive covenants that limit and in some circumstances prohibit, our ability to, among other things incur additional debt, sell, lease or transfer our assets, pay dividends on our common stock, make capital expenditures and investments, guarantee debt or obligations, create liens, repurchase our common stock, enter into transactions with our affiliates and enter into certain merger, consolidation or other reorganizations transactions. These restrictions could limit our ability to obtain future financing, make acquisitions or needed capital expenditures, withstand the current or future downturns in our business or the economy in general, conduct operations or otherwise take advantage of business opportunities that may arise, any of which could place us at a competitive disadvantage relative to our competitors.
Our financial success may be limited to the strength of our relationships with our wholesale and distribution customers and the success of our wholesalers and distributors.
Our financial success is related to the willingness of our current and prospective wholesale and distributors customers to carry our products. We do not have long-term contracts and sales to our wholesalers and distributors are generally on an order-by-order basis and subject to cancellation and rescheduling. If we cannot fill orders in a timely manner, the sales of our products and our relationships may suffer. Alternatively, if our wholesalers or distributors experience diminished liquidity or other financial issues, we may experience a reduction in product orders, an increase in order cancellations and/or the need to extend payment terms which could lead to larger outstanding balances, delays in collections of accounts receivable, increased expenses associated with collection efforts, increases in bad debt expenses and reduced cash flows if our collection efforts are unsuccessful. For example, we recorded an increase in bad debts expense of approximately $23.2 million in China in 2015, primarily as a result of delayed payments and payment defaults from certain distribution partners in China. Additional problems with our distribution customers, including continued payment delays in the Asia Pacific segment or other segments, may have a material adverse effect on our product sales, financial condition, results of operations and our ability to grow our product line.
We depend on a limited number of suppliers for key production materials, and any disruption in the supply of such materials could interrupt product manufacturing and increase product costs.
We depend on a limited number of sources for the primary materials used to make our footwear. We source the elastomer resins that constitute the primary raw materials used in compounding our Croslite products, which we use to produce our various footwear products, from multiple suppliers. If the suppliers we rely on for elastomer resins were to cease production of these materials, we may not be able to obtain suitable substitute materials in time to avoid interruption of our production schedules. We are also subject to market issues related to supply and demand for our raw materials. We may have to pay substantially higher prices in the future for the elastomer resins or any substitute materials we use, which would increase our production costs and could have an adverse impact on our product margins. If we are unable to obtain suitable elastomer resins or if we are unable to procure sufficient quantities of the Croslite material, we may not be able to meet our production requirements in a timely manner or may need to modify our product characteristics, which could result in less favorable market acceptance, lost potential sales, delays in shipments to customers, strained relationships with customers and diminished brand loyalty.
Failure to adequately protect our trademarks and other intellectual property rights and counterfeiting of our brands could divert sales, damage our brand image and adversely affect our business.
We utilize trademarks, trade names, copyrights, trade secrets, issued and pending patents and trade dress, and designs on nearly all of our products. We believe that having distinctive marks that are readily identifiable trademarks and intellectual property is important to our brand, our success and our competitive position. The laws of some countries, for example, China, do not protect intellectual property rights to the same extent as do U.S. laws. We frequently discover products that are counterfeit reproductions of our products or that otherwise infringe on our intellectual property rights. If we are unsuccessful in challenging another party's products on the basis of trademark or design or utility patent infringement, particularly in some foreign countries, or if we are required to change our name or use a different logo, or it is otherwise found that we infringe on others intellectual property rights, continued sales of such competing products by third parties could harm our brand or we may be forced to cease selling certain products, which could adversely impact our business, financial condition, revenues, and results of operations by resulting in the shift of consumer preference away from our products. If our brands are associated with inferior counterfeit reproductions, the integrity and reputation of our brands could be adversely affected. Furthermore, our efforts to enforce our intellectual property rights are typically met with defenses and counterclaims attacking the validity and enforceability of our intellectual property rights. We may face significant expenses and liability in connection with the protection of our intellectual property, and if we are unable to successfully protect our rights or resolve intellectual property conflicts with others, our business or financial condition could be adversely affected.
We also rely on trade secrets, confidential information, and other unpatented proprietary rights and information related to, among other things, the Croslite material and product development, particularly where we do not believe patent protection is appropriate or obtainable. Using third-party manufacturers and compounding facilities may increase the risk of misappropriation of our trade secrets, confidential information and other unpatented proprietary information. The agreements we use in an effort to protect our
16
intellectual property, confidential information, and other unpatented proprietary information may be ineffective or insufficient to prevent unauthorized use or disclosure of such trade secrets and information. A party to one of these agreements may breach the agreement and we may not have adequate remedies for such breach. As a result, our trade secrets, confidential information, and other unpatented proprietary rights and information may become known to others, including our competitors. Furthermore, our competitors or others may independently develop or discover such trade secrets and information, which would render them less valuable to us.
We have substantial cash requirements in the U.S. However, a majority of our cash is generated and held outside of the U.S. The risks of maintaining significant cash abroad could adversely affect our cash flows in the U.S. business and financial results.
We have substantial cash requirements in the U.S., but the majority of our cash is generated and held abroad. We generally consider unremitted earnings of subsidiaries operating outside the U.S. to be indefinitely reinvested and it is not our current intent to change this position. Cash held outside of the U.S. is primarily used for the ongoing operations of the business in the locations in which the cash is held. Most of the cash held outside of the U.S. could be repatriated to the U.S., but under current law, would be subject to U.S. federal and state income taxes, less applicable foreign tax credits. In some countries, repatriation of certain foreign balances is restricted by local laws and could have adverse tax consequences if we were to move the cash to another country. Certain countries, including China, may have monetary laws which may limit our ability to utilize cash resources in those countries for operations in other countries. These limitations may affect our ability to fully utilize our cash resources for needs in the U.S. or other countries and may adversely affect our liquidity. Since repatriation of such cash is subject to limitations and may be subject to significant taxation, we cannot be certain that we will be able to repatriate such cash on favorable terms or in a timely manner. If we incur operating losses on a continued basis and require cash that is held in international accounts for use in our U.S. operations, a failure to repatriate such cash in a timely and cost-effective manner could adversely affect our business and financial results. Further, U.S. legislative initiatives to reform U.S. tax law could have a material impact on our future tax rate and our repatriation plans.
We are subject to periodic litigation, which could result in unexpected expense of time and resources.
From time to time, we are called upon to defend ourselves against lawsuits relating to our business. Due to the inherent uncertainties of litigation, we cannot accurately predict the ultimate outcome of any such proceedings. We are currently involved in several, potentially adverse legal proceedings. For a detailed discussion of our current material legal proceedings, see Item 3. Legal Proceedings in Part I of this Form 10-K. An unfavorable outcome in any of these proceedings or any future legal proceedings could have an adverse impact on our business, and financial results. In addition, any significant litigation in the future, regardless of its merits, could divert management's attention from our operations and result in substantial legal fees. In the past, securities class action litigation has been brought against us. If our stock price is volatile, we may become involved in this type of litigation in the future. Any litigation could result in substantial costs and a diversion of management's attention and resources that are needed to successfully run our business.
We may fail to meet analyst expectations, which could cause the price of our stock to decline.
Our common stock is traded publicly and various securities analysts follow our financial results and frequently issue reports on us which include information about our historical financial results as well as their estimates of our future performance. These estimates are based on their own opinions and are often different from management's estimates or expectations of our business. If our operating results are below the estimates or expectations of public market analysts and investors, our stock price could decline.
Changes in tax laws and unanticipated tax liabilities and the results of tax audits or litigation could adversely affect our effective income tax rate and profitability.
We are subject to income taxes in the United States and numerous foreign jurisdictions. Our effective income tax rate in the future could be adversely affected by a number of factors, including changes in the mix of earnings in countries with differing statutory tax rates, changes in the valuation of deferred tax assets and liabilities, changes in tax laws, the outcome of income tax audits in various jurisdictions around the world and any repatriation of non-U.S. earnings for which we have not previously provided for U.S. taxes. We regularly assess all of these matters to determine the adequacy of our tax provision, which is subject to significant discretion and we could face significant adverse impact if our assumptions are incorrect and/or face significant cost to defend our practices from international and U.S. tax authorities. We are regularly subject to, and are currently undergoing, audits by tax authorities in the United States and foreign jurisdictions for prior tax years. Please refer to Item 3. Legal Proceedings in Part I of this Form 10-K as well as Note 15 — Commitments and Contingencies in the accompanying notes to the consolidated financial statements for additional details regarding current tax audits. Although we believe our tax estimates are reasonable and we intend to defend our positions through litigation if necessary, the final outcome of tax audits and related litigation is inherently uncertain and could be materially different than that reflected in our historical income tax provisions and accruals. Moreover, we could be
17
subject to assessments of substantial additional taxes and/or fines or penalties relating to ongoing or future audits. The unfavorable resolution of any audits or litigation could have an adverse effect on our financial position and results of operations. Future changes in domestic or international tax laws and regulations could also adversely affect our income tax liabilities. Recent developments, including the European Commission's investigations of local country tax authority rulings and whether those rulings comply with European Union rules on state aid, as well as the Organization for Economic Co-operation and Development's project on Base Erosion and Profit Shifting, may result in changes to long-standing tax principles. Any such changes could adversely affect our effective tax rate or result in higher cash tax liabilities.
Our financial results may be adversely affected if substantial investments in businesses and operations fail to produce expected returns.
From time to time, we may invest in business infrastructure, acquisitions of new businesses, and expansion of existing businesses, such as our retail operations, which require substantial cash investment and management attention. We believe cost effective investments are essential to business growth and profitability; however, significant investments are subject to risks and uncertainties inherent in acquiring or expanding a business. The failure of any significant investment to provide the returns or profitability we expect or the failure to integrate newly acquired businesses could have a material adverse effect on our financial results and divert management attention from more profitable business operations.
If our internal controls are ineffective, our operating results and market confidence in our reported financial information could be adversely affected.
Our internal control over financial reporting may not prevent or detect misstatements because of its inherent limitations, including the possibility of human error, the circumvention or overriding of controls or fraud. Even effective internal controls can provide only reasonable assurance with respect to the preparation and fair presentation of financial statements. If we fail to maintain the adequacy of our internal controls or if we experience difficulties in their implementation, our business and operating results and market confidence in our reported financial information could be harmed, we could incur significant costs to evaluate and remediate weaknesses, and we could fail to meet our financial reporting obligations.
As of December 31, 2015, we identified material weaknesses in our internal control over financial reporting, which led us to conclude that our internal control over financial reporting as of such date was not effective. The material weaknesses identified were related to controls over the period end closing procedures and inventory monitoring, which we believe have been remediated as of December 31, 2016 as further explained in Item 9A. Controls and Procedures in Part II of this Form 10-K.
The existence of a material weakness precludes management from concluding that our internal control over financial reporting is effective and precludes our independent auditors from issuing an unqualified opinion that our internal controls are effective. In addition, a material weakness could cause investors to lose confidence in our financial reporting and may negatively affect the price of our common stock. We also can make no assurances that we will be able to remediate any future internal control deficiencies timely and in a cost effective manner. Moreover, effective internal controls are necessary to produce reliable financial reports and to prevent fraud. If we are unable to satisfactorily remediate future deficiencies or if we discover other deficiencies in our internal control over financial reporting, such deficiencies may lead to misstatements in our financial statements or otherwise negatively impact our business, financial results and reputation.
Natural disasters could negatively impact our operating results and financial condition.
Natural disasters such as earthquakes, hurricanes, tsunamis or other adverse weather and climate conditions, whether occurring in the U.S. or abroad, and the consequences and effects thereof, including damage to our supply chain, manufacturing or distribution centers, retail locations, energy shortages, and public health issues, could disrupt our operations or the operations of our vendors other suppliers, or customers, or result in economic instability that may negatively impact our operating results and financial condition. Additionally, certain catastrophes are not covered by our general insurance policies, which could result in significant unrecoverable losses.
Our restated certificate of incorporation, amended and restated bylaws and Delaware law contain provisions that could discourage a third party from acquiring us and consequently decrease the market value of an investment in our stock.
Our restated certificate of incorporation, amended and restated bylaws, and Delaware corporate law each contain provisions that could delay, defer, or prevent a change in control of us or changes in our management. These provisions could discourage proxy contests and make it more difficult for our stockholders to elect directors and take other corporate actions, which may prevent a change of control or changes in our management that a stockholder might consider favorable. In addition, Section 203 of the Delaware General Corporation Law may discourage, delay, or prevent a change in control of us. Any delay or prevention of a change of control or change in management that stockholders might otherwise consider to be favorable could cause the market price of our common stock to decline.
18
Risks Specific to Our Capital Stock
The issuance of 200,000 shares of our Series A Convertible Preferred Stock ("Series A") to Blackstone Capital Partners VI L.P. ("Blackstone") in 2014 and certain of its permitted transferees reduces the relative voting power of holders of our common stock, may dilute the ownership of such holders, and may adversely affect the market price of our common stock.
On January 27, 2014, we issued 200,000 shares of Series A Preferred Stock to Blackstone and certain of its permitted transferees (collectively, the "Blackstone Purchasers") pursuant to an Investment Agreement between us and Blackstone, dated December 28, 2013 (as amended, the "Investment Agreement"). The Blackstone Purchasers currently own all of the outstanding shares of Series A Preferred Stock, and based on the number of shares of our common stock outstanding as of December 31, 2016, the Blackstone Purchasers collectively own Series A Preferred Stock convertible into approximately 15.8% of our common stock. As holders of our Series A Preferred Stock are entitled to vote, on an as-converted basis, together with holders of our common stock as a single class on all matters submitted to a vote of our common stockholders, the issuance of the Series A Preferred Stock to the Blackstone Purchasers has effectively reduced the relative voting power of the holders of our common stock.
In addition, conversion of the Series A Preferred Stock to common stock will dilute the ownership interest of existing holders of our common stock, and any sales in the public market of the common stock issuable upon conversion of the Series A Preferred Stock could adversely affect prevailing market prices of our common stock. We have granted the Blackstone Purchasers registration rights in respect of the shares of Series A Preferred Stock and any shares of common stock issued upon conversion of the Series A Preferred Stock. These registration rights would facilitate the resale of such securities into the public market, and any such resale would increase the number of shares of our common stock available for public trading. Sales by the Blackstone Purchasers of a substantial number of shares of our common stock in the public market, or the perception that such sales might occur, could have a material adverse effect on the price of our common stock.
We are required to pay regular dividends on the Series A issued to Blackstone in 2014, which ranks senior to our common stock, and we may be required under certain circumstances to repurchase the outstanding shares of Series A Preferred Stock; such obligations could adversely affect our liquidity and financial condition.
The Series A Preferred Stock ranks senior to our common stock with respect to dividend rights, and holders of Series A Preferred Stock are entitled to quarterly cumulative cash dividends at a rate of 6% per annum of the stated value of $1,000 per share. If we fail to make timely dividend payments, the dividend rate will increase to 8% per annum until such time as all accrued but unpaid dividends have been paid in full. In addition, the holders of our Series A Preferred Stock have certain redemption rights, including upon certain change in control events involving us, which, if exercised, could require us to repurchase all of the outstanding shares of Series A Preferred Stock at 100% or more of the stated value of the shares, plus all accrued but unpaid dividends. Our obligations to pay regular dividends to the holders of our Series A Preferred Stock or any required repurchase of the outstanding shares of Series A Preferred Stock could impact our liquidity and reduce the amount of cash flows available for working capital, capital expenditures, growth opportunities, acquisitions, and other general corporate purposes. Our obligations to the holders of Series A Preferred Stock could also limit our ability to obtain additional financing or increase our borrowing costs, which could have an adverse effect on our business and financial results.
Blackstone may exercise significant influence over us, including through its ability to elect up to two members of our Board of Directors.
As of December 31, 2016, the shares of Series A Preferred Stock owned by the Blackstone Purchasers represent approximately 15.8% of the voting rights of our common stock, on an as-converted basis, so the Blackstone Purchasers will have the ability to significantly influence the outcome of any matter submitted for the vote of our stockholders. In addition, the Certificate of Designations of the Series A Preferred Stock grants certain consent rights to the holders of Series A Preferred Stock in respect of certain actions by the Company, including the issuance of pari passu or senior equity securities of the Company, certain amendments to our certificate of incorporation or bylaws, any increase in the size of our Board of Directors (the "Board") above eight members, the payment of certain distributions to our stockholders, and the origination or refinancing of a certain level of indebtedness. The Blackstone Purchasers may have interests that diverge from, or even conflict with, those of our other stockholders. For example, Blackstone and its affiliates may have an interest in directly or indirectly pursuing acquisitions, divestitures, financings or other transactions that, in their judgment, could enhance their other equity investments, even though such transactions might involve risks to us. Blackstone and its affiliates are in the business of making or advising on investments in companies, including businesses that may directly or indirectly compete with certain portions of our business. They may also pursue acquisition opportunities that may be complementary to our business, and, as a result, those acquisition opportunities may not be available to us.
In addition, the Investment Agreement grants Blackstone certain rights to designate directors to serve on our Board. For so long as the Blackstone Purchasers (i) beneficially own at least 95% of the Series A Preferred Stock or the as-converted common stock purchased pursuant to the Investment Agreement or (ii) maintain beneficial ownership of at least 12.5% of our outstanding common stock (the "Two-Director Threshold"), Blackstone will have the right to designate for nomination two directors to our Board. For
19
so long as the Blackstone Purchasers beneficially own shares of Series A Preferred Stock or the as-converted common stock purchased pursuant to the Investment Agreement that represent less than the Two-Director Threshold but more than 25% of the number of shares of the as-converted common stock purchased pursuant to the Investment Agreement, Blackstone will have the right to designate for nomination one director to our Board. The directors designated by Blackstone are entitled to serve on Board committees, subject to applicable law and stock exchange rules.
20
ITEM 1B. Unresolved Staff Comments
None.
ITEM 2. Properties
Our principal executive and administrative offices are located at 7477 East Dry Creek Parkway, Niwot, Colorado 80503. We lease all of our domestic and international facilities. We currently enter into short-term and long-term leases for kiosk, manufacturing, office, retail, and warehouse space. The terms of our leases include fixed monthly rents and/or contingent rents based on percentage of revenues for certain of our retail locations, and expire at various dates through the year 2033. The general location, use and approximate size of our principal properties, and the reportable operating segment are given below.
Location | Reportable Operating Segment | Use | Approximate Square Feet | Expiration (1) | |||||
Ontario, California | Americas | Warehouse | 339,000 | Mar 2019 | |||||
Shenzen, China | Asia Pacific | Warehouse/offices | 266,000 | Jun 2017 | |||||
Rotterdam, the Netherlands | Europe | Warehouse | 174,000 | Dec 2021 | |||||
Leon, Mexico | Americas, Other Businesses | Manufacturing/warehouse/offices | 166,000 | Mar 2019 | |||||
Narita, Japan | Asia Pacific | Warehouse | 156,000 | Apr 2019 | |||||
Niwot, Colorado | Americas | Corporate headquarters and regional offices | 98,000 | Jun 2021 | |||||
Padova, Italy | Americas, Other Businesses | Manufacturing/warehouse/offices | 45,000 | Sep 2018 | |||||
Hoofddorf, the Netherlands | Europe | Regional offices | 31,000 | May 2020 | |||||
Singapore | Asia Pacific | Regional offices | 17,000 | Dec 2018 | |||||
Westwood, Massachusetts | Americas | Global Commercial Center | 16,000 | Sep 2021 | |||||
Tokyo, Japan | Asia Pacific | Regional offices | 14,000 | Oct 2018 | |||||
Shanghai, China | Asia Pacific | Regional offices | 13,000 | Jul 2018 | |||||
Bhiwandi, India | Asia Pacific | Warehouse | 11,000 | Oct 2017 | |||||
Moscow, Russia (2) | Europe | Warehouse/offices | 11,000 | Dec 2016 | |||||
_______________________________________________________________________________
(1) Expiration of the initial or existing lease term, excluding optional renewals.
(2) On month-to-month renewal after December 2016.
In addition to the principal properties listed above, we maintain sales offices in the United States, Canada, South America, Hong Kong, Australia, Korea, China, the United Arab Emirates, India and Europe. We also lease more than 550 retail, outlet and kiosk/store in store locations worldwide. See Item 1. Business of this Form 10-K for further discussion regarding global company-operated stores.
21
ITEM 3. Legal Proceedings
The Company is currently subject to an audit by U.S. Customs & Border Protection (“CBP”) in respect of the period from 2006 to 2010. In October 2013, CBP issued the final audit report. In that report CBP projects that unpaid duties totaling approximately $12.4 million are due for the period under review and recommends collection of the duties due. The Company responded that these projections are erroneous and provided arguments that demonstrate the amount due in connection with this matter is considerably less than the projection. Additionally, on December 12, 2014, we made an offer to settle CBP’s potential claims and paid $3.5 million. In 2016, after discussions with CBP's local counsel, we increased our settlement offer to $7.0 million and paid an additional $3.5 million in the quarterly period ended December 31, 2016. The revised offer is subject to formal acceptance by the CBP. At this time, it is not possible to determine how long this process will take or to predict whether a negotiated settlement can be reached. Likewise, if a settlement cannot be reached, it is not possible to predict with any certainty whether CBP will seek to assert a claim for penalties in addition to any unpaid duties, but such an assertion is a possibility.
We are currently subject to an audit by the Brazilian Federal Tax Authorities related to imports of footwear from China between 2010 and 2014. On January 13, 2015, we were notified about the issuance of assessments totaling approximately $4.5 million for the period January 2010 through May 2011. The Company has disputed these assessments and asserted defenses to the claims. On February 25, 2015, we received additional assessments totaling approximately $10.2 million related to the remainder of the audit period. We have also disputed these assessments and asserted defenses and filed appeals to these claims. On May 11, 2016, we were notified of a decision rejecting the defense filed against the first assessment covering the period of January 2010 through May 2011. We filed an appeal against that decision on June 8, 2016. It is anticipated that this matter will take up to two or more years to be resolved. It is not possible at this time to predict the outcome of this matter.
For all other claims and other disputes, where we are able to estimate possible losses or a range of possible losses, we estimate that as of December 31, 2016, it is reasonably possible that losses associated with these claims and other disputes could potentially exceed amounts accrued by us by up to $0.4 million.
In the aggregate, the Company has accrued $7.4 million associated with our estimated obligations related to legal claims, which is reported in the consolidated balance sheet in 'Accrued expenses and other liabilities'.
Although the Company is subject to other litigation from time to time in the ordinary course of business, including employment, intellectual property and product liability claims, the Company is not party to any other pending legal proceedings that we believe would reasonably have a material adverse impact on our business and financial results.
22
ITEM 4. Mine Safety Disclosures
Not applicable.
23
PART II
ITEM 5. Market for Registrant's Common Equity, Related Stockholder Matters and Issuer Purchases of Equity Securities
Market Information
Our common stock is listed on the NASDAQ Global Select Market and trades under the stock symbol "CROX". The following table shows the high and low sales prices of our common stock for the periods indicated.
2016 | High | Low | ||||||
First quarter | $ | 10.16 | $ | 8.09 | ||||
Second quarter | 11.50 | 7.63 | ||||||
Third quarter | 12.54 | 8.02 | ||||||
Fourth quarter | 8.99 | 6.70 | ||||||
2015 | High | Low | ||||||
First quarter | $ | 12.78 | $ | 10.25 | ||||
Second quarter | 16.05 | 11.55 | ||||||
Third quarter | 15.86 | 12.52 | ||||||
Fourth quarter | 12.30 | 9.26 | ||||||
Performance Graph
The following performance graph illustrates a five-year comparison of cumulative total return of our common stock, the NASDAQ Composite Index and the Dow Jones U.S. Footwear Index from December 31, 2011 through December 31, 2016. The graph assumes an investment of $100.00 on December 31, 2011 and assumes the reinvestment of all dividends and other distributions.
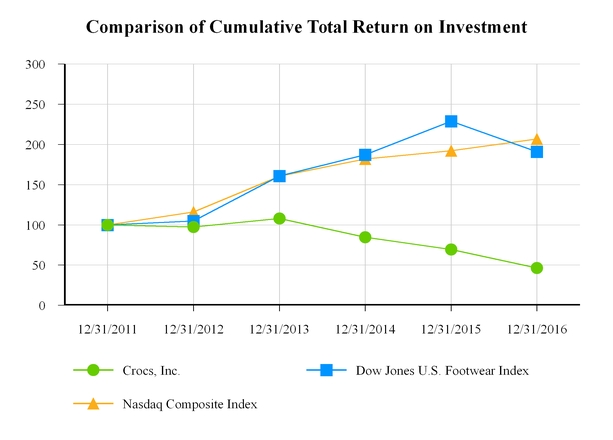
24
12/31/2012 | 12/31/2013 | 12/31/2014 | 12/31/2015 | 12/31/2016 | |||||||||||||||
Crocs, Inc. | $ | 97.43 | $ | 107.79 | $ | 84.56 | $ | 69.33 | $ | 46.45 | |||||||||
Dow Jones U.S. Footwear Index | 104.78 | 160.80 | 187.09 | 228.72 | 190.92 | ||||||||||||||
Nasdaq Composite Index | 115.91 | 160.32 | 181.80 | 192.21 | 206.63 | ||||||||||||||
The Dow Jones U.S. Footwear Index is a sector index and includes companies in the major line of business in which we compete. This index does not encompass all of our competitors or all of our product categories and lines of business. The Dow Jones U.S. Footwear Index consists of Crocs, Inc., NIKE, Inc., Deckers Outdoor Corporation., Iconix Brand Group, Inc., Skechers U.S.A., Inc., Steven Madden Ltd. and Wolverine World Wide, Inc., among other companies. As Crocs, Inc. is part of the Dow Jones U.S. Footwear Index, the price and returns of our stock have an effect on this index. The Nasdaq Composite Index is a market capitalization-weighted index and consists of more than 3,000 common equities, including Crocs, Inc. The stock performance shown on the performance graph above is not necessarily indicative of future performance. We do not make or endorse any predictions as to future stock performance.
Holders
The approximate number of stockholders of record of our common stock was 84 as of February 22, 2017.
Dividends
We have never declared or paid cash dividends on our common stock, and we do not anticipate paying any cash dividends on our common stock in the foreseeable future. Our financing arrangements contain certain restrictions on our ability to pay cash dividends on our common stock. In addition, the Certificate of Designations governing the Series A Convertible Preferred Stock that we issued in January 2014 restricts us from declaring and paying certain dividends on our common stock if we fail to pay all accumulated and unpaid regular dividends and/or declared and unpaid participating dividends to which the preferred holders are entitled. Any future determination to declare cash dividends on our common stock will be made at the discretion of our Board, subject to compliance with covenants under any then-existing financing agreements and the terms of the Certificate of Designations.
Purchases of Equity Securities by the Issuer
On December 26, 2013, our Board approved the repurchase of up to $350 million of our common stock, which was announced on December 30, 2013. We did not purchase any shares of our common stock during the twelve months ended December 31, 2016. As of December 31, 2016, authorization to repurchase up to approximately $118.7 million of our shares remained available. The number, price, structure and timing of repurchases, if any, may be made at our sole discretion, subject to limitations in our Credit Agreement. We may transact repurchases on the open market or in privately negotiated transactions. The repurchase authorization does not expire and we have no obligation to repurchase any additional common shares. The Board may suspend, modify, or terminate the repurchase authorization at any time without prior notice.
25
ITEM 6. Selected Financial Data
The following table presents selected historical financial data for each of our last five years. The information in this table should be read in conjunction with our consolidated financial statements and accompanying notes presented in Item 8. Financial Statements and Supplementary Data, and Item 7. Management's Discussion and Analysis of Financial Conditions and Results of Operations in Part II of this Form 10-K.
Year Ended December 31, | |||||||||||||||||||
2016 | 2015 | 2014 | 2013 | 2012 | |||||||||||||||
(in thousands, except per share data) | |||||||||||||||||||
Revenues | $ | 1,036,273 | $ | 1,090,630 | $ | 1,198,223 | $ | 1,192,680 | $ | 1,123,301 | |||||||||
Cost of sales | 536,109 | 579,825 | 603,893 | 569,482 | 515,324 | ||||||||||||||
Restructuring charges | — | — | 3,985 | — | — | ||||||||||||||
Gross profit | 500,164 | 510,805 | 590,345 | 623,198 | 607,977 | ||||||||||||||
Gross margin % | 48.3 | % | 46.8 | % | 49.3 | % | 52.3 | % | 54.1 | % | |||||||||
Selling, general and administrative expenses | 503,174 | 559,095 | 565,712 | 549,154 | 460,393 | ||||||||||||||
Selling, general and administrative expenses as a % of revenues | 48.6 | % | 51.3 | % | 47.2 | % | 46.0 | % | 41.0 | % | |||||||||
Restructuring charges | — | 8,728 | 20,532 | — | — | ||||||||||||||
Asset impairments (1) | 3,144 | 15,306 | 8,827 | 10,949 | 1,410 | ||||||||||||||
Income (loss) from operations | (6,154 | ) | (72,324 | ) | (4,726 | ) | 63,095 | 146,174 | |||||||||||
Income (loss) before income taxes | (7,213 | ) | (74,744 | ) | (8,549 | ) | 59,959 | 145,548 | |||||||||||
Income tax (expense) benefit | (9,281 | ) | (8,452 | ) | 3,623 | (49,539 | ) | (14,205 | ) | ||||||||||
Net income (loss) | (16,494 | ) | (83,196 | ) | (4,926 | ) | 10,420 | 131,343 | |||||||||||
Dividends on Series A convertible preferred stock | (12,000 | ) | (11,833 | ) | (11,301 | ) | — | — | |||||||||||
Dividend equivalents on Series A convertible preferred shares related to redemption value accretion and beneficial conversion feature | (3,244 | ) | (2,978 | ) | (2,735 | ) | — | — | |||||||||||
Net income (loss) attributable to common stockholders | $ | (31,738 | ) | $ | (98,007 | ) | $ | (18,962 | ) | $ | 10,420 | $ | 131,343 | ||||||
Net income (loss) per share | |||||||||||||||||||
Basic income (loss) per share | $ | (0.43 | ) | $ | (1.30 | ) | $ | (0.22 | ) | $ | 0.12 | $ | 1.46 | ||||||
Diluted income (loss) per share | $ | (0.43 | ) | $ | (1.30 | ) | $ | (0.22 | ) | $ | 0.12 | $ | 1.44 | ||||||
Weighted average common shares | |||||||||||||||||||
Basic shares | 73,371 | 75,604 | 85,140 | 87,989 | 89,571 | ||||||||||||||
Diluted shares | 73,371 | 75,604 | 85,140 | 89,089 | 90,588 | ||||||||||||||
Cash provided by (used in) operating activities | $ | 39,754 | $ | 9,698 | $ | (11,651 | ) | $ | 83,464 | $ | 128,356 | ||||||||
Cash used in investing activities | 18,657 | (18,627 | ) | (57,992 | ) | (69,758 | ) | (65,943 | ) | ||||||||||
Cash provided by (used in) financing activities (2) | (16,443 | ) | (101,260 | ) | 23,431 | (1,161 | ) | (16,625 | ) | ||||||||||
(1) Asset impairments consist primarily of long-lived assets of closed retail locations in all years, and $0.4 million of goodwill in 2016.
(2) Cash used in financing activities includes approximately $85.9 million and $145.9 million including commissions used to repurchase the Company's common shares during 2015 and 2014, respectively.
26
As of December 31, | |||||||||||||||||||
2016 | 2015 | 2014 | 2013 | 2012 | |||||||||||||||
(in thousands) | |||||||||||||||||||
Cash and cash equivalents | $ | 147,565 | $ | 143,341 | $ | 267,512 | $ | 317,144 | $ | 294,348 | |||||||||
Inventories | 147,029 | 168,192 | 171,012 | 162,341 | 164,804 | ||||||||||||||
Working capital | 276,335 | 278,852 | 441,523 | 453,149 | 455,177 | ||||||||||||||
Total assets | 566,390 | 608,020 | 806,931 | 875,159 | 829,638 | ||||||||||||||
Long-term liabilities | 17,966 | 19,294 | 27,849 | 63,487 | 54,300 | ||||||||||||||
Total stockholders' equity | 220,383 | 245,972 | 452,518 | 624,744 | 617,400 | ||||||||||||||
27
ITEM 7. Management's Discussion and Analysis of Financial Condition and Results of Operations
Business Overview
Crocs, Inc. and its consolidated subsidiaries (collectively, the “Company,” “Crocs,” “we,” “our,” or “us”) are engaged in the design, development, manufacturing, worldwide marketing, distribution and sale of casual lifestyle footwear and accessories for men, women, and children. The broad appeal of our footwear has allowed us to market our products through a wide range of distribution channels, our own Crocs single-branded stores including both full price and outlet stores, our own e-commerce sites, traditional multi-branded stores including family footwear stores, sporting goods stores and a variety of specialty and independent retail channels, and third-party e-commerce sites. In select markets we also sell to distributors that are typically granted the rights to distribute our products in a given geographical area.
Known or Anticipated Trends
Based on our recent operating results and current perspectives on our operating environment, we anticipate certain trends to impact our operating results:
• | Softening of the global economy and a cautious retail environment may continue to negatively affect customer purchasing trends. |
• | Foreign exchange rates may continue to unfavorably impact revenues from our foreign operations for the foreseeable future. |
• | Consumers spending preferences continue to shift toward e-commerce and away from brick and mortar stores. This has resulted in continued sales growth in our e-commerce channel, which has been largely offset by declining foot traffic in our retail locations. |
Use of Non-GAAP Financial Measures
In addition to financial measures presented on the basis of accounting principles generally accepted in the United States of America (“U.S. GAAP”), we present “non-GAAP selling, general, and administrative expenses”, which is a non-GAAP financial measure, within this Management's Discussion and Analysis of Financial Condition and Results of Operation (“MD&A”). Adjusted results exclude the impact of items that management believes affect the comparability or underlying business trends in our consolidated financial statements in the periods presented.
We also present certain information related to our current period results of operations in this MD&A through “constant currency”, which is a non-GAAP financial measure and should be viewed as a supplement to our results of operations and presentation of reportable operating segments under U.S. GAAP. Constant currency represents current period results that have been recast using prior year average foreign exchange rates for the comparative period to enhance the visibility of the underlying business trends excluding the impact of foreign currency exchange rate fluctuations.
Management uses adjusted results to assist in comparing business trends from period to period on a consistent non-GAAP basis in communications with the Board, stockholders, analysts, and investors concerning our financial performance. We believe that these non-GAAP measures are useful to investors and other users of our consolidated financial statements as an additional tool to evaluate operating performance. We believe they also provide a useful baseline for analyzing trends in our operations. Investors should not consider these non-GAAP measures in isolation from, or as a substitute for, financial information prepared in accordance with U.S. GAAP. Please refer to our ‘Results of Operations’ within this section for a reconciliation of adjusted selling, general and administrative expenses to U.S. GAAP selling, general and administrative expenses.
2016 Financial Highlights
During the year ended December 31, 2016, we experienced a decrease in our revenues of 5.0% compared to the year ended December 31, 2015. The decrease in 2016 revenues as compared to 2015 revenues was due to: (i) lower sales volumes, including store closures, which reduced revenues by $46.3 million, or 4.2%; (ii) lower average selling prices which decreased revenues by $4.7 million, or 0.5%; and (iii) unfavorable changes in exchange rates which reduced revenues by $3.4 million or 0.3%.
The following are significant developments in our business during the year ended December 31, 2016:
28
• | We sold 56.1 million pairs of shoes worldwide, a decrease of 4.2% from 58.6 million compared to 2015. |
• | Gross profit decreased $10.6 million, or 2.1%, to $500.2 million. However, our gross profit percentage increased 150 basis points to 48.3% compared to 46.8% in 2015, in spite of unfavorable exchange rates which reduced our gross profit by $2.2 million, or 1.5%. |
• | Selling, general and administrative ("SG&A") expenses decreased $55.9 million, or 10.0%, to $503.2 million compared to the same period in 2015. This change was primarily driven by decreased sales, building and bad debt expense. |
• | We incurred $3.1 million in asset impairments during 2016, which included $2.7 million related to certain underperforming retail locations in our Americas, Europe, and Asia Pacific segments, and $0.4 million of goodwill in a retail business within our Europe segment. |
• | Net loss attributable to common stockholders decreased $66.3 million to a net loss of $31.7 million compared to a net loss of $98.0 million for 2015. Net loss per share was $0.43 during the year ended December 31, 2016 compared to net loss per share of $1.30 during the year ended December 31, 2015. The decrease in our net loss is primarily the result of decreased asset impairment charges, restructuring charges and SG&A expenses. |
• | We continued to focus on improving the efficiency and effectiveness of our operations, including continuing to shift the mix of our retail business from full-price retail to outlet stores. During the year ended December 31, 2016, we opened 50 outlet stores and closed 66 full-price stores. In total, during the year ended December 31, 2016 we opened 83 stores and closed 84 stores. |
• | We continued to focus on simplifying our product line and disciplined inventory management and reduced our inventory by $21.2 million or 12.6% from $168.2 million to $147.0 million. |
• | During 2016, we did not repurchase any shares. |
Future Outlook
We intend to continue our strategic plans for long-term improvement and growth of the business, which comprise these key initiatives:
(1) developing powerful product stories supported with effective marketing,
(2) driving global cohesive brand positioning,
(3) increasing working marketing spend,
(4) enhancing engagement with key wholesale accounts,
(5) gaining greater strategic and economic leverage from our direct-to-consumer assets,
(6) prioritizing investment in larger-scale geographies,
(7) streamlining the cost structure by reducing duplication & complexity across regional offices & the corporate center, and
(8) investing to drive supply chain effectiveness and reliability.
We believe these changes will better position Crocs to adapt to changing consumer demands and global economic developments. We are focusing on our core molded footwear heritage by narrowing our product line with an emphasis on higher margin units, as well as developing innovative new casual lifestyle footwear platforms. By streamlining the product portfolio and reducing non-core product development, we believe we will create a more powerful consumer connection to the brand.
We are refining our business model around the world, prioritizing direct investment in larger-scale geographies to focus our resources on the markets with the largest growth prospects, moving away from direct investment in the retail and wholesale businesses in smaller markets and transferring significant commercial responsibilities to distributors and third party agents. Further, we intend to expand our engagement with leading wholesale accounts in select markets to drive sales growth, optimize product placement and enhance brand reputation.
29
Additionally, we addressed the declining collection rates we experienced in 2015 from our China operations by limiting or terminating our relationship with distributors who we have identified as being a significant credit risk. In 2015, we recorded bad debts expense of $23.2 million associated with our China operations. As of December 31, 2016, we have terminated our relationship with multiple distributors in China and we expanded our relationship with existing business partners who are in a stronger financial position and who have a proven track record. We have also implemented a more restrictive credit policy for several China distributors to reduce our exposure in that market. For the year ended December 31, 2016, our bad debt expense related to our China operations was lower by $22.1 million compared to the year ended December 31, 2015. We are unable to predict future economic conditions in China, but if economic conditions in China continue to decline, we may experience further declines in consumer demand in our China markets. As our China operations represents 7% of our total revenues, the net impact of declining sales volumes in China could have a material adverse impact on our financial results in future periods.
30
Results of Operations
Comparison of the Years Ended December 31, 2016 to 2015
Year Ended December 31, | Change | |||||||||||||
2016 | 2015 | $ | % | |||||||||||
(in thousands, except per share data and average selling price) | ||||||||||||||
Revenues | $ | 1,036,273 | $ | 1,090,630 | $ | (54,357 | ) | (5.0 | )% | |||||
Cost of sales | 536,109 | 579,825 | (43,716 | ) | (7.5 | )% | ||||||||
Gross profit | 500,164 | 510,805 | (10,641 | ) | (2.1 | )% | ||||||||
Selling, general and administrative expenses | 503,174 | 559,095 | (55,921 | ) | (10.0 | )% | ||||||||
Restructuring charges | — | 8,728 | (8,728 | ) | (100.0 | )% | ||||||||
Asset impairments | 3,144 | 15,306 | (12,162 | ) | (79.5 | )% | ||||||||
Loss from operations | (6,154 | ) | (72,324 | ) | 66,170 | (91.5 | )% | |||||||
Foreign currency loss, net | (2,454 | ) | (3,332 | ) | 878 | (26.4 | )% | |||||||
Interest income | 692 | 967 | (275 | ) | (28.4 | )% | ||||||||
Interest expense | (836 | ) | (969 | ) | 133 | (13.7 | )% | |||||||
Other income, net | 1,539 | 914 | 625 | 68.4 | % | |||||||||
Income (loss) before income taxes | (7,213 | ) | (74,744 | ) | 67,531 | (90.3 | )% | |||||||
Income tax expense | (9,281 | ) | (8,452 | ) | (829 | ) | 9.8 | % | ||||||
Net loss | $ | (16,494 | ) | $ | (83,196 | ) | $ | 66,702 | (80.2 | )% | ||||
Dividends on Series A convertible preferred stock | (12,000 | ) | (11,833 | ) | (167 | ) | 1.4 | % | ||||||
Dividend equivalents on Series A convertible preferred shares related to redemption value accretion and beneficial conversion feature | (3,244 | ) | (2,978 | ) | $ | (266 | ) | 8.9 | % | |||||
Net loss attributable to common stockholders | $ | (31,738 | ) | $ | (98,007 | ) | $ | 66,269 | (67.6 | )% | ||||
Net loss per common share: | ||||||||||||||
Basic | $ | (0.43 | ) | $ | (1.30 | ) | $ | 0.87 | (66.9 | )% | ||||
Diluted | $ | (0.43 | ) | $ | (1.30 | ) | $ | 0.87 | (66.9 | )% | ||||
Gross profit | 48.3 | % | 46.8 | % | 143 | bps | 3.1 | % | ||||||
Operating loss | (0.6 | )% | (6.6 | )% | 600 | bps | 6.1 | % | ||||||
Footwear unit sales | 56,097 | 57,763 | (1,666 | ) | (3.7 | )% | ||||||||
Average footwear selling price | $ | 18.21 | $ | 18.53 | $ | (0.32 | ) | (1.7 | )% | |||||
Revenues. During the year ended December 31, 2016, revenue decreased 5.0% compared to the same period in 2015. The decrease in revenue is due to the net impact of (i) a $46.3 million, or 4.2%, decrease associated with lower sales volumes, (ii) a $4.7 million or 0.5% decrease associated with lower average selling prices per pair, and (iii) a $3.4 million or 0.3% decrease associated with unfavorable changes in foreign currency rates.
During the year ended December 31, 2016, revenues from our wholesale channel decreased $45.0 million, or 7.6%, compared to the same period in 2015. The decrease in wholesale channel revenue is driven primarily by a $23.4 million decrease in our Asia Pacific segment due to lower average selling prices related to a lower priced product mix, the unfavorable impact of foreign currency translation, and store closures.
During the year ended December 31, 2016, revenues from our retail channel decreased $18.9 million, or 5.0%, compared to the same period in 2015, primarily driven by the Asia Pacific segment, which decreased $11.3 million primarily as a result of a lower average selling prices related to a lower priced product mix and the unfavorable impact of foreign currency translation.
During the year ended December 31, 2016, revenues from our e-commerce channel increased $9.5 million, or 7.9%, compared to the same period in 2015, primarily driven by increased sales volumes in all segments, partially offset by the unfavorable impact of foreign currency translation and lower average selling prices, also in all segments. Our e-commerce sales totaled approximately 12.6% and 11.1% of our consolidated net sales during the year ended December 31, 2016 and 2015, respectively. We continue to
31
benefit from our online presence through e-commerce sites worldwide enabling us to have increased access to our consumers in a low cost, attractive manner and providing us with an opportunity to educate them about our products and brand.
Cost of sales. During the year ended December 31, 2016, cost of sales decreased $43.7 million, or 7.5%, compared to the same period in 2015. The decrease in cost of sales was primarily due to the net impact of: (i) a $24.6 million, or 4.2% decrease, due to lower sales volumes, (ii) an $18.6 million, or 3.2%, decrease due to a lower average cost per unit sold, and (iii) a $0.5 million, or 0.1%, decrease due to the impact of foreign currency translation. The impact of sales volumes on cost of sales was reduced by approximately $1.6 million as a result of the sale of our South Africa operations, which was completed on April 15, 2016.
Gross profit. During the year ended December 31, 2016, gross profit decreased $10.6 million, or 2.1%, and gross margin increased 143 basis points to 48.3% compared to the same period in 2015. The decrease in gross profit is primarily due to the net impact of: (i) a $21.6 million, or 4.2%, decrease due to lower sales volumes, (ii) a $14.0 million, or 2.7%, increase due to the combined impact of a lower average cost of sales per unit partially offset by a lower average selling price, and (iii) a $3.0 million, or 0.6%, decrease due to the unfavorable impact of foreign currency translation. Gross profit declined by approximately $1.0 million as a result of the sale of our South Africa operations, which was completed on April 15, 2016.
SG&A. SG&A decreased $55.9 million, or 10.0%, during the year ended December 31, 2016 compared to the same period in 2015. This change was primarily driven by (i) bad debt expense decrease of $22.8 million, (ii) an $8.7 million decrease in rent expenses associated with contingent rents and closed retail stores partially offset by (iii) $4.3 million increase in outside services expense. During the year ended December 31, 2016, our bad debt expense was $3.2 million compared to $26.0 million in the same period in the prior year. Substantially all of this decrease in bad debt expense is due to stricter credit collection policies from our China operations, which is included in our Asia Pacific segment.
During the year ended December 31, 2016 and 2015, our bad debt expense was $3.2 million and $26.0 million, respectively. Of the $3.2 million expense recorded during the year ended December 31, 2016, immaterial amounts related to our China operations. The decrease in bad debt expense associated with our China operations is primarily due to the implementation of a more restrictive credit policy for several China distributors in 2016, to reduce our exposure in that market.
In addition to these fluctuations, we have identified certain SG&A expenses that affect the comparability or underlying business trends in our consolidated financial statements. The following table summarizes these expenses and describes the additional drivers of the decrease above by reconciling our U.S. GAAP SG&A to non-GAAP SG&A.
Year Ended December 31, | ||||||||
2016 | 2015 | |||||||
(in thousands) | ||||||||
Selling general and administrative expenses reconciliation: | ||||||||
U.S. GAAP SG&A expenses | $ | 503,174 | $ | 559,095 | ||||
Reorganization charges (1) | (458 | ) | (8,391 | ) | ||||
Customs audit settlements (2) | (354 | ) | — | |||||
ERP implementation and other contract termination fees(3) | (1,361 | ) | (12,569 | ) | ||||
Improper disbursements and related legal fees (4) | — | (7,895 | ) | |||||
Bad debt expense related to South Africa (5) | — | (613 | ) | |||||
Total adjustments | (2,173 | ) | (29,468 | ) | ||||
Non-GAAP Selling, general and administrative expenses | $ | 501,001 | $ | 529,627 | ||||
_________________________________________________________________
(1) Relates to severance expenses, bonuses, store closure costs, consulting fees, and other expenses related to restructuring and reorganization activities and our investment agreement with Blackstone.
(2) Amount paid in partial settlement of a customs audit.
(3) Represents operating expenses incurred in 2015 related to the implementation of our enterprise resource planning system ("ERP") and the termination of certain information technology, royalty and other contracts. Expense in 2016 relates to early lease termination costs.
(4) Represents legal expenses related to invalid disbursements that occurred in 2015 and California wage settlements.
(5) Represents certain bad debt and impairment expenses in 2015 related to the sales of operations in South Africa.
Restructuring charges. During 2015, we incurred $8.7 million of restructuring charges related to the 2014 plan to create efficiencies and close global retail locations. The Company concluded its restructuring efforts on December 31, 2015.
32
Asset impairment charges. During the years ended December 31, 2016 and 2015, we incurred $2.7 million and $15.3 million, respectively, in retail asset impairment charges related to certain underperforming retail locations, primarily in our Americas segment, that were unlikely to generate sufficient cash flows to fully recover the carrying value of the stores’ assets over their remaining economic life. In addition, we incurred $0.4 million in goodwill impairment charges.
Foreign currency loss, net. ‘Foreign currency loss, net’ consists of foreign currency gains and losses from the re-measurement and settlement of monetary assets and liabilities denominated in non-functional currencies and foreign currency derivative instruments. During the year December 31, 2016, we recognized a net loss of $2.5 million compared to a net loss of $3.3 million on foreign currency transactions during the year ended December 31, 2015.
Income tax expense. During the year ended December 31, 2016, we recognized income tax expense of $9.3 million on pre-tax book loss of $7.2 million, representing an effective tax rate of (128.7)%, compared to income tax expense of $8.5 million on pre-tax book loss of $74.7 million in 2015, which represented an effective tax rate of (11.3)%. Generally, our effective tax rate has varied dramatically during 2016 and in recent years due to differences in our profitability level and relative operating earnings across multiple jurisdictions, and is most notably impacted by the significant amount of operating losses that cannot be benefitted for tax purposes.
The following are some of our key jurisdictions and the income tax expense for each in 2016 and 2015, respectively:
For the Year Ended December 31, 2016 | |||||||||||||||||||||||||||||||
United States | Netherlands | Japan | Canada | China | Korea | Other | Total | ||||||||||||||||||||||||
(in thousands) | |||||||||||||||||||||||||||||||
Book income (loss) | $ | (55,617 | ) | $ | 39,184 | $ | (5,229 | ) | $ | 740 | $ | 821 | $ | 2,529 | $ | 10,359 | $ | (7,213 | ) | ||||||||||||
Income tax expense (benefit) | 437 | 4,711 | — | 361 | (473 | ) | 511 | 3,734 | 9,281 | ||||||||||||||||||||||
Effective tax rate | (0.8 | )% | 12.0 | % | — | % | 48.8 | % | (57.6 | )% | 20.2 | % | 36.0 | % | (128.7 | )% | |||||||||||||||
For the Year Ended December 31, 2015 | |||||||||||||||||||||||||||||||
United States | Netherlands | Japan | Canada | China | Korea | Other | Total | ||||||||||||||||||||||||
(in thousands) | |||||||||||||||||||||||||||||||
Book income (loss) | $ | (83,537 | ) | $ | 25,988 | $ | (69 | ) | $ | (850 | ) | $ | (21,572 | ) | $ | 4,141 | $ | 1,155 | $ | (74,744 | ) | ||||||||||
Income tax expense (benefit) | (3,345 | ) | 4,262 | 2,345 | (391 | ) | 4,433 | 1,081 | 67 | 8,452 | |||||||||||||||||||||
Effective tax rate | 4.0 | % | 16.4 | % | (3,398.6 | )% | 46.0 | % | (20.5 | )% | 26.1 | % | 5.8 | % | (11.3 | )% | |||||||||||||||
The differences in total tax expense and effective rate variances in the table above resulted primarily from the following factors. We incurred significant changes in many of the key jurisdictions in book income/loss (U.S. losses of $55.6 million in 2016 versus $83.5 million in 2015, Netherlands income of $39.2 million in 2016 versus $26.0 million in 2015, Japanese losses of $5.2 million in 2016 versus $0.1 million in 2015, Chinese income of $0.8 million in 2016 versus losses of $21.6 million in 2015). Additionally, differences in the Netherlands income tax rate relates to consistent withholding tax expense year over year, compared with increased operating income in that jurisdiction during the same period. In 2016, the Company recorded a taxable loss position in Japan with no corresponding tax benefit realized as a result of a valuation allowance. In 2015, the total tax provision in Japan was impacted by the settlement of uncertain tax positions which resulted in a benefit of approximately $3.6 million which was more than offset by the accrual of expense for an increased valuation allowance of $4.8 million. While there are effective tax rate differences in China related to differences in operating losses, we also incurred additional tax expense in 2015 of approximately $9.5 million due to increased valuation allowances established during 2015 which are unlikely to recur.
The tax effect of non-deductible/non-taxable items changed from a $2.2 million tax benefit in 2015, which is a favorable rate impact of 2.9%, to a $2.7 million tax expense in 2016, which is an unfavorable rate impact of 37.4%. The expense recognized in 2016 primarily relates to non-deductible executive and foreign share-based compensation. We anticipate that these expenses will recur in the foreseeable future.
33
The change in the 'Effect of rate differences' line of the rate reconciliation table in Note 13 — Income Taxes is principally driven by differences in pre-tax book income between the periods compared, and the source of this income, which is subject to different jurisdictional tax rates. During 2016, the effect of rate differences resulted in a $12.6 million tax benefit compared to a $3.7 million tax benefit in 2015. The primary reason for this incremental benefit results from increased foreign book earnings included in consolidated results. During 2016, foreign book income before taxes was $48.4 million as compared with $8.8 million in 2015, all of which is subject to tax at rates lower than the U.S. statutory rate. Further, we employ a tax planning strategy that directly impacts the total tax expense directly attributable to the level of foreign earnings in the specific jurisdictions. However, we note that the impact on the effective tax rate is different due to higher book earnings recorded in 2016 compared to 2015. The relative impact of this has existed in the recent past; however, there is no assurance that this circumstance will be recurring beyond 2019. Through at least 2019, we will continue to have an equivalent favorable impact on the tax provision and effective tax rate based on the specific foreign earnings. We currently do not anticipate significant near-term changes to our overall tax strategies, meaning that relative income tax benefits provided from the expected U.S. federal tax rate are anticipated to recur in the foreseeable future. The amount of this tax benefit, if any, is subject to continued profitability in various foreign jurisdictions.
The impact of the 'U.S. tax on foreign earnings' line of the rate reconciliation table includes the impact of foreign inclusions and the tax expense accrued on undistributed foreign earnings net of the related foreign tax credits. During 2016, inclusions for these items resulted in $23.1 million of tax expense, reflecting an unfavorable impact of 320.6 % on the total provision. During 2015, inclusions for these items resulted in $82.3 million of tax expense, reflecting an unfavorable impact of 110.0 % on the total provision. Foreign inclusions are primarily related to business results and cash repatriations during a specific period as well as the accrual on foreign earnings. During 2016, we provided for U.S. income taxes on an additional $50 million of current year undistributed foreign earnings, for a combined total of $178 million of undistributed foreign earnings for which U.S. tax has been accrued, representing a total deferred tax liability of approximately $32.4 million. We further note that actual cash repatriations decreased from approximately $127.3 million in 2015 to approximately $37 million in 2016 (and note that no withholding tax is due with respect to the repatriation of these earnings to the U.S. and none has been provided for). Furthermore during 2015, there was a $24.6 million tax charge recognized for the accrual of unremitted foreign earnings as compared to a $7.9 million tax charge in 2016 for unremitted foreign earnings. As of 2016, we anticipate continued repatriation of foreign earnings to the extent of the $178 million currently accrued. We will also continue to assess various cash needs in the U.S. and abroad, which could result in the prospective accrual and repatriation of some or all future current year earnings on an annual basis.
We continue to evaluate the realizability of our deferred tax assets. As such, additional valuation allowances of $34.3 million were recorded on deferred tax assets are not anticipated to be realized. This is in addition to the $56.6 million accrued on deferred tax assets during 2015. Furthermore, the change in the valuation allowance reflected on the cumulative schedule of deferred tax assets includes $18.3 million, which does not impact the tax provision because this amount reflects the cumulative impact of unrecorded tax attributes related to the adoption in 2016 of new US GAAP guidance related to income tax effect of share-based compensation and changes in cumulative translation adjustment. The specific circumstances regarding management's assertion of the realizability of certain deferred tax assets is discussed as part of the disclosures in Note 13 — Income Taxes. We maintain total valuation allowances of approximately $90.9 million as of December 31, 2016, which may be reduced in the future depending upon the achieved or sustained profitability of certain entities.
During both 2015 and 2016, we recorded tax expense for audits settled during the year of $1.2 million and $0.3 million, respectively. The amount included in settlements during 2016 is net against total uncertain tax position releases during the same period relating to the same positions. Furthermore, the uncertain tax benefits line item in 2016 includes net accruals related to current year positions recorded, and is consistent with amounts accrued during prior years. We have released a significant portion of historical uncertain tax benefits based on effective and actual settlements. As such, there is not currently an expectation that uncertain tax positions will significantly impact our tax expense on an ongoing basis.
We incur state income tax losses during the period due to net operating losses recorded in the U.S., as well as applicable state modifications related to the taxability of foreign dividends. The tax provision benefit of these losses are offset by a valuation allowance. We are subject to certain minimal state income taxes.
34
Revenues by Channel
Year Ended December 31, | Change | Constant Currency Change (1) | |||||||||||||||||||
2016 | 2015 | $ | % | $ | % | ||||||||||||||||
(in thousands) | |||||||||||||||||||||
Wholesale: | |||||||||||||||||||||
Americas | $ | 202,211 | $ | 210,887 | $ | (8,676 | ) | (4.1 | )% | $ | (5,555 | ) | (2.6 | )% | |||||||
Asia Pacific | 232,541 | 255,897 | (23,356 | ) | (9.1 | )% | (26,408 | ) | (10.3 | )% | |||||||||||
Europe | 110,511 | 123,131 | (12,620 | ) | (10.2 | )% | (11,441 | ) | (9.3 | )% | |||||||||||
Other businesses | 745 | 1,096 | (351 | ) | (32.0 | )% | (352 | ) | (32.1 | )% | |||||||||||
Total wholesale | 546,008 | 591,011 | (45,003 | ) | (7.6 | )% | (43,756 | ) | (7.3 | )% | |||||||||||
Retail: | |||||||||||||||||||||
Americas | 191,855 | 197,306 | (5,451 | ) | (2.8 | )% | (5,168 | ) | (2.6 | )% | |||||||||||
Asia Pacific | 125,037 | 136,320 | (11,283 | ) | (8.3 | )% | (12,077 | ) | (8.9 | )% | |||||||||||
Europe | 42,712 | 44,873 | (2,161 | ) | (4.8 | )% | (189 | ) | (0.4 | )% | |||||||||||
Total retail | 359,604 | 378,499 | (18,895 | ) | (5.0 | )% | (17,434 | ) | (4.6 | )% | |||||||||||
E-commerce: | |||||||||||||||||||||
Americas | 72,940 | 68,017 | 4,923 | 7.2 | % | 5,088 | 7.5 | % | |||||||||||||
Asia Pacific | 37,500 | 32,274 | 5,226 | 16.2 | % | 5,741 | 17.8 | % | |||||||||||||
Europe | 20,221 | 20,829 | (608 | ) | (2.9 | )% | (578 | ) | (2.8 | )% | |||||||||||
Total e-commerce | 130,661 | 121,120 | 9,541 | 7.9 | % | 10,251 | 8.5 | % | |||||||||||||
Total revenues | $ | 1,036,273 | $ | 1,090,630 | $ | (54,357 | ) | (5.0 | )% | $ | (50,939 | ) | (4.7 | )% | |||||||
_________________________________________________________________
(1) | Reflects year over year change as if the current period results were in “constant currency,” which is a non-GAAP financial measure. See “Use of Non-GAAP Financial Measures” above for more information. |
Wholesale channel revenues. During the year ended December 31, 2016, revenues from our wholesale channel decreased $45.0 million, or 7.6%, compared to the same period in 2015. The decrease in wholesale channel revenues was due to the net impact of: (i) a $42.0 million, or 7.1%, decrease in sales volumes, (ii) a $3.6 million, or 1.0%, decrease due to a lower average selling price, and (iii) a $1.5 million, or 0.4%, decrease due to the unfavorable impact of foreign currency translation. Sales volumes for the year ended December 31, 2016 were negatively impacted by approximately $8.4 million as a result of the sale of our South Africa operations, which was completed on April 15, 2016.
Retail channel revenues. During the year ended December 31, 2016, revenues from our retail channel decreased $18.9 million, or 5.0%, compared to the same period in 2015. The decrease in retail channel revenues was due to the net impact of: (i) a $13.8 million, or 3.7%, decrease in sales volumes, (ii) a $3.6 million, or 1.0%, decrease due to a lower average selling price, and (iii) a $1.5 million, or 0.4%, decrease due to the unfavorable impact of foreign currency translation.
E-commerce channel revenues. During the year ended December 31, 2016, revenues from our e-commerce channel increased $9.5 million, or 7.9%, compared to the same period in 2015. The increase in e-commerce revenues was due to the net impact of: (i) a $30.2 million, or 24.9%, increase in sales volumes (primarily due to increased sales volumes in the Americas and Asia Pacific segments), (ii) a $20.0 million, or 16.4%, decrease due to a lower average selling price, and (iii) a $0.7 million, or 0.6%, decrease due to the unfavorable impact of foreign currency translation.
Future change in the average selling price per unit will be impacted by: (i) the mix of products sold, (ii) the sales channel (as we generally realize higher sales prices from our retail and e-commerce channels as compared to our wholesale channel), and (iii) the level of sales discounts and incentives we offer our customers.
35
Reportable Operating Segments
The following table sets forth information related to our reportable operating business segments for the years ended December 31, 2016 and 2015:
Year Ended December 31, | Change | Constant Currency Change (3) | |||||||||||||||||||
2016 | 2015 | $ | % | $ | % | ||||||||||||||||
(in thousands, except % data) | |||||||||||||||||||||
Revenues: | |||||||||||||||||||||
Americas | $ | 467,006 | $ | 476,210 | $ | (9,204 | ) | (1.9 | )% | $ | (3,569 | ) | (0.7 | )% | |||||||
Asia Pacific | 395,078 | 424,491 | (29,413 | ) | (6.9 | ) | 3,331 | 0.8 | |||||||||||||
Europe | 173,444 | 188,833 | (15,389 | ) | (8.1 | ) | (3,181 | ) | (1.7 | ) | |||||||||||
Total segment revenues | 1,035,528 | 1,089,534 | (54,006 | ) | (5.0 | ) | (3,419 | ) | (0.3 | ) | |||||||||||
Other businesses | 745 | 1,096 | (351 | ) | (32.0 | ) | 1 | 0.1 | |||||||||||||
Total consolidated revenues | $ | 1,036,273 | $ | 1,090,630 | $ | (54,357 | ) | (5.0 | )% | $ | (3,418 | ) | (0.3 | )% | |||||||
Operating income: | |||||||||||||||||||||
Americas | $ | 58,844 | $ | 49,422 | $ | 9,422 | 19.1 | % | $ | (1,372 | ) | (2.8 | ) | ||||||||
Asia Pacific | 78,907 | 48,447 | 30,460 | 62.9 | 1,378 | 2.8 | |||||||||||||||
Europe | 17,757 | 15,629 | 2,128 | 13.6 | (249 | ) | (1.6 | ) | |||||||||||||
Total segment operating income | 155,508 | 113,498 | 42,010 | 37.0 | (243 | ) | (0.2 | ) | |||||||||||||
Reconciliation of total segment operating income to income before income taxes: | |||||||||||||||||||||
Other businesses | (26,935 | ) | (30,092 | ) | 3,157 | (10.5 | ) | 3,006 | (10.0 | ) | |||||||||||
Unallocated corporate and other (1) | (134,727 | ) | (155,730 | ) | 21,003 | (13.5 | ) | 23,341 | (15.0 | ) | |||||||||||
Total consolidated operating income (loss) | $ | (6,154 | ) | $ | (72,324 | ) | $ | 66,170 | (91.5 | ) | $ | 26,104 | (36.1 | ) | |||||||
Foreign currency transaction gain (loss), net | (2,454 | ) | (3,332 | ) | 878 | (26.4 | ) | ||||||||||||||
Interest income | 692 | 967 | (275 | ) | (28.4 | ) | |||||||||||||||
Interest expense | (836 | ) | (969 | ) | 133 | (13.7 | ) | ||||||||||||||
Other income (expense), net | 1,539 | 914 | 625 | 68.4 | |||||||||||||||||
Income (loss) before income taxes | $ | (7,213 | ) | $ | (74,744 | ) | $ | 67,531 | (90.3 | )% | |||||||||||
_________________________________________________________________
(1) | Revenues for the year ended December 31, 2016 were negatively impacted by approximately $8.4 million as a result of the sale of our South Africa operations, which was completed on April 15, 2016. |
36
Americas Operating Segment
Revenues. During the year ended December 31, 2016, revenues for our Americas segment decreased $9.2 million, or 1.9%, compared to the same period in 2015. The decrease in the Americas segment revenues was due to the net impact of: (i) a $13.6 million, or 2.9%, decrease related to lower sales volumes, (ii) an $8.0 million, or 1.7%, increase related to an increase in the average sales price, and (iii) a $3.6 million, or 0.7%, decrease due to the unfavorable impact of foreign currency translation.
Future changes in the average sales price per unit in any of our operating segments will be impacted by: (i) the mix of products sold, (ii) the sales channel (as we generally realize higher sales prices from our retail and e-commerce channels as compared to our wholesale channel), and (iii) the level of sales discounts and incentives we offer our customers.
Cost of Sales. During the year ended December 31, 2016, cost of sales for our Americas segment decreased $10.2 million, or 4.0%, compared to the same period in 2015. The decrease in the Americas segment cost of sales was due to the net impact of: (i) a $7.2 million, or 2.9%, decrease due to lower sales volumes, (ii) a $1.3 million, or 0.5%, decrease due to lower average costs per unit sold, and (iii) a $1.6 million, or 0.6%, decrease due to the impact of foreign currency translation.
Gross Profit. During the year ended December 31, 2016, gross profit for the Americas segment increased $1.0 million, or 0.4%, and gross margin increased 115 basis points to 48.3% compared to the same period in 2015. The increase in the Americas segment gross profit is due to the net impact of: (i) an $6.4 million, or 2.9%, decrease due to lower sales volumes, (ii) an $9.3 million, or 4.2%, increase due to the combined impact of a higher average sales price and a lower average cost of sales per unit, and (iii) a $2.0 million, or 0.9%, decrease due to the impact of foreign currency translation.
SG&A. During the year ended December 31, 2016, SG&A for our Americas segment decreased $1.7 million, or 1.0%, compared to the same period in 2015.
Asia Pacific Operating Segment
Revenues. During the year ended December 31, 2016, revenues for our Asia Pacific segment decreased $29.4 million, or 6.9%, compared to the same period in 2015. The decrease in the Asia Pacific segment revenues was due to the net impact of: (i) a $2.4 million, or 0.6%, decrease due to lower sales volumes, (ii) a $30.3 million, or 7.1%, decrease in the average sales price and (iii)
a $3.3 million, or 0.8%, increase due to the favorable impact of foreign currency translation. Sales volumes for the year ended December 31, 2016 were negatively impacted by approximately $8.4 million as a result of the sale of our South Africa operations, which was completed on April 15, 2016.
Cost of Sales. During the year ended December 31, 2016, cost of sales for our Asia Pacific segment decreased $20.9 million, or 10.8%, compared to the same period in 2015. The decrease in the Asia Pacific segment cost of sales was due to the net impact of: (i) a $1.1 million, or 0.6%, decrease due to lower sales volumes, (ii) a $21.6 million, or 11.2%, decrease due to lower average costs per unit sold, and (iii) a $1.5 million, or 1.5%, increase due to the impact of foreign currency translation. The impact of sales volumes on cost of sales includes approximately $8.5 million as a result of the sale of our South Africa operations, which was completed on April 15, 2016.
Gross Profit. During the year ended December 31, 2016, gross profit for the Asia Pacific segment decreased $8.5 million, or 3.7%, and gross margin increase 190 basis points to 56.3% compared to the same period in 2015. The decrease in the Asia Pacific segment gross profit is due to the net impact of: (i) a $1.3 million, or 0.6%, decrease due to lower sales volumes, (ii) a $8.8 million, or 3.7%, decrease due to a lower average sales prices in excess of a lower average cost per unit, and (iii) a $1.5 million, or 0.6%, increase due to the impact of foreign currency translation. Gross profit declined by approximately $0.1 million as a result of the sale of our South Africa operations, which was completed on April 15, 2016.
SG&A. During the year ended December 31, 2016, SG&A for our Asia Pacific segment decreased $29.6 million, or 17.2%, compared to the same period in 2015. The decrease in SG&A was primarily due to the net impact of: (i) a $25.4 million decrease associated with bad debt expense, (ii) a $5.5 million increase associated with services, (iii) a $6.3 million decrease in sales expense, (iv) a $5.0 million decrease in rent expense, and (v) other items that are individually insignificant.
37
Europe Operating Segment
Revenues. During the year ended December 31, 2016, revenues for our Europe segment decreased $15.4 million, or 8.1%, compared to the same period in 2015. The decrease in the Europe segment revenues was due to the net impact of: (i) a $22.8 million, or 12.1%, decrease due to lower sales volumes, (ii) a $10.6 million, or 5.7%, increase due to a higher average sales price, and (iii) a $3.2 million, or 1.7%, decrease due to the impact of foreign currency translation.
Cost of Sales. During the year ended December 31, 2016, cost of sales for our Europe segment decreased $11.2 million, or 11.3%, compared to the same period in 2015. The decrease in the Europe segment cost of sales was mainly due to the net impact of: (i) a $12.0 million, or 12.1%, decrease due to lower sales volumes, (ii) a $2.3 million or 2.3%, increase due to higher average cost per unit sold and (iii) a $1.5 million, or 1.5%, decrease due to the impact of foreign currency translation.
Gross Profit. During the year ended December 31, 2016, gross profit for the Europe segment decreased $4.2 million, or 4.7%, and gross margin increased 180 basis points to 48.9% compared to the same period in 2015. The decrease in the Europe segment gross profit is due to the net impact of: (i) a $10.8 million, or 12.1%, decrease due to lower sales volumes, (ii) a $8.3 million, or 9.3%, increase due to a higher average sales price in excess of higher costs per unit, and (iii) a $1.7 million, or 1.9%, decrease due to the impact of foreign currency translation.
SG&A. During the year ended December 31, 2016, SG&A for our Europe segment decreased $2.6 million, or 3.8%, compared to the same period in 2015. The decrease in SG&A was primarily due to the net impact of: (i) a $2.0 increase in bad debt expense, (ii) a $0.9 million decrease in rent expense, and (iv) other items that are individually insignificant.
The changes in the number of our company-operated retail locations by reportable operating segment and type of store were:
December 31, 2015 | Opened | Closed | December 31, 2016 | ||||||||
Company-operated retail locations | |||||||||||
Type | |||||||||||
Kiosk/store in store | 98 | 14 | 14 | 98 | |||||||
Retail stores | 275 | 19 | 66 | 228 | |||||||
Outlet stores | 186 | 50 | 4 | 232 | |||||||
Total | 559 | 83 | 84 | 558 | |||||||
Operating segment | |||||||||||
Americas | 196 | 7 | 13 | 190 | |||||||
Asia Pacific | 261 | 67 | 58 | 270 | |||||||
Europe | 102 | 9 | 13 | 98 | |||||||
Total | 559 | 83 | 84 | 558 | |||||||
Comparable retail store sales and Direct to Consumer store sales by reportable operating segment are as follows:
Constant Currency (2) | |||||
Year Ended December 31, 2016 | Year Ended December 31, 2015 | ||||
Comparable store sales (retail only) (1) | |||||
Americas | (2.3 | )% | (3.2 | )% | |
Asia Pacific | (5.9 | )% | (4.5 | )% | |
Europe | 1.9 | % | 3.0 | % | |
Global | (3.0 | )% | (2.8 | )% | |
38
Constant Currency (2) | |||||
Year Ended December 31, 2016 | Year Ended December 31, 2015 | ||||
DTC comparable store sales (includes retail and e-commerce) (1) | |||||
Americas | 0.3 | % | 3.3 | % | |
Asia Pacific | (0.4 | )% | 3.0 | % | |
Europe | 0.2 | % | 7.8 | % | |
Global | 0.1 | % | 3.9 | % | |
_______________________________________________________________________________
(1) | Comparable store status is determined on a monthly basis. Comparable store sales includes revenues of stores that have been in operation for more than twelve months. Stores in which selling square footage has changed more than 15% as a result of a remodel, expansion or reduction are excluded until the thirteenth month in which they have comparable prior year revenues. Temporarily closed stores are excluded from the comparable store sales calculation during the month of closure. Location closures in excess of three months are excluded until the thirteenth month post re-opening. E-commerce revenues are based on same site sales period over period. |
(2) | Reflects quarter over quarter change on a “constant currency” basis, which is a non-GAAP financial measure that restates current period results using prior year foreign exchange rates for the comparative period to enhance visibility of the underlying business trends, excluding the impact of foreign currency. |
Comparable store sales (retail only) decreased 3.0% on a global basis for the year ended December 31, 2016, compared to a decrease of 2.8% for the year ended December 31, 2015. Direct to Consumer (DTC) comparable store sales, which includes retail and e-commerce, increased 0.1% on a global basis for the year ended December 31, 2016, compared to an increase of 3.9% for the year ended December 31, 2015.
Impact on revenues due to foreign exchange rate fluctuations. Changes in average foreign currency exchange rates used to translate revenue from our functional currencies to our reporting currency during the year ended December 31, 2016 resulted in a $3.4 million decrease in revenue compared to the same period in 2015.
Gross profit. During the year ended December 31, 2016, gross profit decreased $10.6 million, or 2.1%, compared to the same period in 2015. The decrease in gross profit was primarily attributable to the 5.0% decrease in revenue partially offset by the gross margin increase of 150 basis points compared to the same period in 2015 due to a lower selling price.
Impact on gross profit due to foreign exchange rate fluctuations. Changes in average foreign currency exchange rates used to translate revenue and costs of sales from our functional currencies to our reporting currency during the year ended December 31, 2016 decreased our gross profit by $2.1 million, or 0.4%, compared to the same period in 2015.
39
Comparison of the Years Ended December 31, 2015 to 2014
Year Ended December 31, | Change | |||||||||||||
2015 | 2014 | $ | % | |||||||||||
(in thousands, except per share data and average selling price) | ||||||||||||||
Revenues | $ | 1,090,630 | $ | 1,198,223 | $ | (107,593 | ) | (9.0 | )% | |||||
Cost of sales | 579,825 | 603,893 | (24,068 | ) | (4.0 | ) | ||||||||
Restructuring charges | — | 3,985 | (3,985 | ) | (100.0 | ) | ||||||||
Gross profit | 510,805 | 590,345 | (79,540 | ) | (13.5 | ) | ||||||||
Selling, general and administrative expenses | 559,095 | 565,712 | (6,617 | ) | (1.2 | ) | ||||||||
Restructuring charges | 8,728 | 20,532 | (11,804 | ) | (57.5 | ) | ||||||||
Asset impairments | 15,306 | 8,827 | 6,479 | 73.4 | ||||||||||
Loss from operations | (72,324 | ) | (4,726 | ) | (67,598 | ) | 1,430.3 | |||||||
Foreign currency loss, net | (3,332 | ) | (4,885 | ) | 1,553 | (31.8 | ) | |||||||
Interest income | 967 | 1,664 | (697 | ) | (41.9 | ) | ||||||||
Interest expense | (969 | ) | (806 | ) | (163 | ) | 20.2 | |||||||
Other income, net | 914 | 204 | 710 | 348.0 | ||||||||||
Loss before income taxes | (74,744 | ) | (8,549 | ) | (66,195 | ) | 774.3 | |||||||
Income tax (expense) benefit | (8,452 | ) | 3,623 | (12,075 | ) | (333.3 | ) | |||||||
Net loss | $ | (83,196 | ) | $ | (4,926 | ) | $ | (78,270 | ) | 1,588.9 | % | |||
Dividends on Series A convertible preferred stock | (11,833 | ) | (11,301 | ) | (532 | ) | 4.7 | |||||||
Dividend equivalents on Series A convertible preferred shares related to redemption value accretion and beneficial conversion feature | (2,978 | ) | (2,735 | ) | (243 | ) | 8.9 | |||||||
Net loss attributable to common stockholders | $ | (98,007 | ) | $ | (18,962 | ) | $ | (79,045 | ) | 416.9 | % | |||
Net income (loss) per common share: | ||||||||||||||
Basic | $ | (1.30 | ) | $ | (0.22 | ) | $ | (1.08 | ) | 490.9 | % | |||
Diluted | $ | (1.30 | ) | $ | (0.22 | ) | $ | (1.08 | ) | 490.9 | % | |||
Gross margin | 46.8 | % | 49.3 | % | (250 | ) | (5.1 | )% | ||||||
Operating margin | (6.6 | )% | (0.4 | )% | (620 | ) | 1,550.0 | % | ||||||
Footwear unit sales | 57,763 | 55,700 | 2,063 | 3.7 | % | |||||||||
Average footwear selling price | $ | 18.53 | $ | 20.92 | $ | (2.39 | ) | (11.4 | )% | |||||
Revenues. During the year ended December 31, 2015, revenues declined $107.6 million, or 9.0%, compared to the same period in 2014. The decrease in revenues is due to the net impact of (i) a $85.3 million, or 7.1%, decrease associated with foreign currency exchange rate adjustments associated with a strong U.S. Dollar, (ii) a $37.8 million, or 3.1%, increase associated with higher sales volumes, and (iii) a $34.4 million, or 2.9%, decrease associated with store closures, partially offset by (iv) a $25.7 million, or 2.1%, decrease associated with a lower average selling price due to changes in product mix.
During the year ended December 31, 2015, revenues from our wholesale channel decreased $76.6 million, or 11.5%, compared to the same period in 2014. The decrease in wholesale channel revenue is driven primarily by a $52.1 million unfavorable impact related to foreign currency translation, primarily in our Europe segment, a $30.5 million unfavorable impact due to lower average sales prices related to a lower priced product style mix, primarily in our Americas segment, partially offset by higher sales volume in our Americas and Europe segments.
During the year ended December 31, 2015, revenues from our retail channel decreased $47.3 million, or 11.1%, compared to the same period in 2014, primarily driven by the Asia Pacific segment, which decreased $23.1 million primarily as a result of a lower average selling price related to a lower priced product mix, the unfavorable impact of foreign currency translation, and store closures. Additionally we experienced a $15.4 million decrease in the Europe segment largely associated with the impact of store closures.
During the year ended December 31, 2015, revenues from our e-commerce channel increased $16.3 million, or 15.6%, compared to the same period in 2014, primarily driven by increased sales volumes in all segments, partially offset by the unfavorable impact
40
of foreign currency translation and lower average sales prices, also in all segments. Our e-commerce sales totaled approximately 11.1% and 8.7% of our consolidated net sales during the year ended December 31, 2015 and 2014, respectively. We continue to benefit from our online presence through web stores worldwide enabling us to have increased access to our customers in a low cost, attractive manner and providing us with an opportunity to educate them about our products and brand.
Cost of sales. Cost of sales, including restructuring charges, decreased $28.1 million, or 4.8%, for the year ended December 31, 2015, as compared to the prior year. The net decrease in cost of sales is due to: (i) a $44.4 million, or 7.4%, decrease due to the impact of foreign currency translation, (ii) a $24.0 million, or 3.9%, increase due to a higher average costs, (iii) a $22.8 million, or 3.8%, decrease associated with store closures, (iv) a $19.1 million, or 3.2%, increase due to higher sales volumes, and (v) a $4.0 million, or 0.7%, decrease associated with lower restructuring charges in cost of sales (these restructuring efforts were completed as of December 31, 2015).
Gross Profit. Gross profit decreased $79.5 million, or 13.5%, for the year ended December 31, 2015, as compared to the prior year. The net decrease in gross profit is primarily due to the impact of: (i) a $49.7 million, or 8.4%, decrease associated with lower average selling price and higher costs of sales, (ii) a $40.9 million, or 6.9%, decrease associated with the unfavorable impact of foreign currency translation, (iii) a $18.7 million, or 3.2%, increase associated with higher sales volumes (iv) an $11.6 million, or 2.0%, decrease associated with store closures, and (v) a $4.0 million, or 0.6%, increase associated with lower restructuring charges in cost of sales (these restructuring efforts were completed as of December 31, 2015). For the year ended December 31, 2015 we realized a gross profit margin of 46.8%.
SG&A. SG&A expenses decreased $6.6 million, or 1.2%, during the year ended December 31, 2015 compared to the same period in 2014. This change was primarily driven by wage and salary decreases of $22.1 million, and a $17.0 million decrease in building expenses partially offset by a $13.6 million increase in marketing expenses, and a $13.6 million increase in bad debt expense, largely associated with our Asia Pacific operations relating to China. During the year ended December 31, 2015, our bad debt expense was $25.7 million compared to $12.1 million in the same period in the prior year. Substantially all of this increase in bad debt expense is due to lower collections from our China operations, which is included in our Asia Pacific segment.
We believe declining collections from our China operations is associated with deteriorating macro-economic conditions in China resulting in declining customer demand and the deteriorating working capital position of our distributors. We are unable to predict future economic conditions in China, but if economic conditions in China continue to decline, we may experience further reductions in consumer demand in our China markets. As our China operations represent approximately 8% of our total revenue in 2015, the net impact of declining sales volumes in China could have a material adverse impact on our financial results in future periods.
In addition to these fluctuations, we have identified certain selling, general and administrative expenses that affect the comparability or underlying business trends in our consolidated financial statements. The following table summarizes these expenses and describes the additional drivers of the increase above by reconciling our GAAP selling, general and administrative expenses to non-GAAP selling, general and administrative expenses:
Year Ended December 31, | |||||||
2015 | 2014 | ||||||
(in thousands) | |||||||
Selling, general and administrative expenses reconciliation: | |||||||
GAAP selling, general and administrative expenses | $ | 559,095 | $ | 565,712 | |||
ERP implementation and other contract termination fees(1) | (12,569 | ) | (13,268 | ) | |||
Reorganization charges(2) | (8,391 | ) | (8,872 | ) | |||
Legal settlements and disbursement(3) | (7,895 | ) | (2,646 | ) | |||
Bad debt expense related to South Africa(4) | (613 | ) | — | ||||
Non-GAAP selling, general and administrative expenses | $ | 529,627 | $ | 540,926 | |||
_______________________________________________________________________________
(1) | This represents operating expenses related to the implementation of our new enterprise resource planning ("ERP") system and the termination of certain IT contracts for better alignment with strategic initiatives as well as fees associated with the termination of certain royalty and other contracts. |
(2) | This relates to severance expenses, bonuses, store closure costs, consulting fees and other expenses related to recent restructuring and reorganization activities and our investment agreement with Blackstone. |
41
(3) | Expenses in 2015 relate primarily to legal expenses for matters surrounding disbursements to invalid vendors and California wage settlements. Expenses in 2014 relate primarily to other legal settlements. |
(4) | Bad debt and impairment expenses were incurred in 2015 relating to the planned sale of operations in South Africa. |
Impact on Selling, General, and Administrative Expenses due to Foreign Exchange Rate Fluctuations. Changes in average foreign currency exchange rates used to translate expenses from our functional currencies to our reporting currency during the year ended December 31, 2015, negatively impacted, or increased, selling, general and administrative expenses by approximately $35.6 million compared to 2014.
Restructuring charges. During the years ended December 31, 2015 and 2014, we recorded $8.7 million and $24.5 million, respectively, in restructuring charges. These restructuring charges arose primarily as a result of our strategic plans for long-term improvement and growth of the business. Restructuring charges for the years ended December 31, 2015 and 2014 consisted of:
• | $5.5 million and $12.5 million in severance costs during the years ended December 31, 2015 and 2014, respectively; |
• | $2.6 million and $4.2 million in contract termination costs primarily related to the early termination of operating leases during the years ended December 31, 2015 and 2014, respectively; and |
• | $0.6 million and $7.8 million in other restructuring charges primarily related to expenses to exiting stores and legal fees during the years ended December 31, 2015 and included the write-off of obsolete inventory and store exiting and legal fees for the year ended December 31, 2014. |
Asset impairments. During the year ended December 31, 2015 and 2014, we incurred $15.3 million and $8.8 million, respectively, in asset impairment charges. For the year ended December 31, 2015, $9.6 million of this amount related to certain underperforming retail locations, primarily in our Americas and Europe segments, which were unlikely to generate sufficient cash flows to fully recover the carrying value of the stores' assets over their remaining economic life and $5.7 million related to the impairment of our South Africa asset group that is currently held for sale.
Foreign currency loss, net. Foreign currency loss, net is comprised of foreign currency gains and losses from the re-measurement and settlement of monetary assets and liabilities denominated in non-functional currencies and the impact of certain foreign currency derivative instruments. During the year ended December 31, 2015 and 2014, the effect of foreign currency transactions was a net loss of $3.3 million and $4.9 million, respectively.
Income Taxes: The following are some of our key jurisdictions and the income tax expense for each in 2015,
For the Year Ended December 31, 2015 | |||||||||||||||||||||||||||||||
United States | Netherlands | Japan | Canada (1) | China | Korea | Other | Total | ||||||||||||||||||||||||
(in thousands) | |||||||||||||||||||||||||||||||
Book income (loss) | $ | (83,537 | ) | $ | 25,988 | $ | (69 | ) | $ | (850 | ) | $ | (21,572 | ) | $ | 4,141 | $ | 1,155 | $ | (74,744 | ) | ||||||||||
Income tax expense (benefit) | (3,345 | ) | 4,262 | 2,345 | (391 | ) | 4,433 | 1,081 | 67 | 8,452 | |||||||||||||||||||||
Effective tax rate | 4.0 | % | 16.4 | % | (3,398.6 | )% | 46.0 | % | (20.5 | )% | 26.1 | % | 5.8 | % | (11.3 | )% | |||||||||||||||
(1) | Primarily driven by a $2.9 million net benefit related to a tax settlement with the Canada Revenue Agency. The principal drivers impacting the rate other than the overall profitability or loss of the Company disclosed in our rate reconciliation table in Note 13 — Income Taxes includes: |
The differences in total tax expense and effective rate difference in the table above resulted primarily from the following factors. In the U.S. and Japan, the Company incurred significant changes in book income/loss (U.S. losses of $84 million in 2015 versus $34 million in 2014, and Japanese losses of $69 thousand in 2015 versus income of $9.6 million in 2014). In addition, in the U.S. in 2014, the Company received a net benefit of $10.7 million related the settlement of a tax audit and the release of related uncertain tax positions. While the operating losses in the U.S. can differ in future years based upon the Company’s performance and risk factors for the business, the benefits associated with the audit settlement and release of uncertain tax positions are not likely to recur in the future. Tax expense in Canada was also impacted materially by the net impact of $9.8 million related to the settlement of a tax audit and release of related uncertain tax positions, which is not likely to recur in the future. While there are effective rate differences in China related to differences in operating losses, the Company also incurred additional tax expense of approximately
42
$9.5 million due to increased valuation allowances established during 2015. The increase in valuation allowances or potential release of such allowances will depend upon the increase in future taxable income of the Company’s China operations. The total tax expense, and associated effective tax rate, for Japan was also impacted in 2015 by the settlement of uncertain tax positions which resulted in a benefit of approximately $3.6 million which is not likely to recur in the future, and the accrual of expense for an increased valuation allowance of $4.8 million due to the ongoing operating losses in that jurisdiction. Lastly, the difference in the Netherlands effective tax rate relates to consistent withholding tax expense year over year, compared with decreased operating income in that jurisdiction in 2015.
43
Revenues by Channel
The following table summarizes our total revenue by channel for the years ended December 31, 2015 and 2014:
Years Ended December 31, | Change | Constant Currency Change(1) | |||||||||||||||||||
2015 | 2014 | $ | % | $ | % | ||||||||||||||||
(in thousands) | |||||||||||||||||||||
Wholesale: | |||||||||||||||||||||
Americas | $ | 210,887 | $ | 228,615 | $ | (17,728 | ) | (7.8 | )% | $ | (10,241 | ) | (4.5 | )% | |||||||
Asia Pacific | 255,897 | 290,610 | (34,713 | ) | (11.9 | ) | (16,194 | ) | (5.6 | ) | |||||||||||
Europe | 123,131 | 147,561 | (24,430 | ) | (16.6 | ) | 1,886 | 1.3 | |||||||||||||
Other businesses | 1,096 | 794 | 302 | 38.0 | 194 | 24.4 | |||||||||||||||
Total wholesale | 591,011 | 667,580 | (76,569 | ) | (11.5 | ) | (24,355 | ) | (3.6 | ) | |||||||||||
Retail: | |||||||||||||||||||||
Americas | 197,306 | 206,053 | (8,747 | ) | (4.2 | ) | (6,652 | ) | (3.2 | ) | |||||||||||
Asia Pacific | 136,320 | 159,464 | (23,144 | ) | (14.5 | ) | (11,552 | ) | (7.2 | ) | |||||||||||
Europe | 44,873 | 60,309 | (15,436 | ) | (25.6 | ) | (3,012 | ) | (5.0 | ) | |||||||||||
Total retail | 378,499 | 425,826 | (47,327 | ) | (11.1 | ) | (21,216 | ) | (5.0 | ) | |||||||||||
E-commerce: | |||||||||||||||||||||
Americas | 68,017 | 55,247 | 12,770 | 23.1 | 13,434 | 24.3 | |||||||||||||||
Asia Pacific | 32,274 | 23,836 | 8,438 | 35.4 | 10,256 | 43.0 | |||||||||||||||
Europe | 20,829 | 25,734 | (4,905 | ) | (19.1 | ) | (380 | ) | (1.5 | ) | |||||||||||
Total e-commerce | 121,120 | 104,817 | 16,303 | 15.6 | 23,310 | 22.2 | |||||||||||||||
Total revenues | $ | 1,090,630 | $ | 1,198,223 | $ | (107,593 | ) | (9.0 | )% | $ | (22,261 | ) | (1.9 | )% | |||||||
_______________________________________________________________________________
(1) | Reflects year over year change as if the current period results were in "constant currency," which is a non-GAAP financial measure. See "Use of Non-GAAP Financial Measures" above for more information. |
Wholesale channel revenues. During the year ended December 31, 2015, revenues from our wholesale channel decreased $76.6 million, or 11.5%, compared to the same period in 2014. The decrease in wholesale channel revenues was due to the net impact of: (i) an $8.7 million, or 1.3%, increase in sales volumes, (ii) a $33.0 million, or 5.0%, decrease due to a lower average sales price, and (iii) a $52.2 million, or 7.8%, decrease due to the unfavorable impact of foreign currency translation.
Retail channel revenues. During the year ended December 31, 2015, revenues from our retail channel decreased $47.3 million, or 11.1%, compared to the same period in 2014. The decrease in retail channel revenues was due to the net impact of: (i) a $7.0 million, or 1.6%, decrease in sales volumes, (ii) a $14.2 million, or 3.4%, decrease due to a lower average sales price, and (iii) a $26.1 million, or 6.1%, decrease due to the favorable impact of foreign currency translation.
E-commerce channel revenues. During the year ended December 31, 2015, revenues from our e-commerce channel increased $16.3 million, or 15.6%, compared to the same period in 2014. The increase in e-commerce revenues was due to the net impact of: (i) a $47.4 million, or 45.2%, increase in sales volumes (primarily due to increased sales volumes in the Americas and Asia Pacific segments), (ii) a $24.1 million, or 22.9%, decrease due to a lower average sales price, and (iii) a $7.0 million, or 6.7%, decrease associated with the unfavorable impact of foreign currency translation.
44
Reportable Operating Segments
The following table sets forth information related to our reportable operating business segments for the years ended December 31, 2015 and 2014:
Year Ended December 31, | Change | Constant Currency Change(3) | ||||||||||||||||||||
2015 | 2014 | $ | % | $ | % | |||||||||||||||||
(in thousands, except % data) | ||||||||||||||||||||||
Revenues: | ||||||||||||||||||||||
Americas | $ | 476,210 | $ | 489,915 | $ | (13,705 | ) | (2.8 | )% | $ | (3,459 | ) | (0.7 | )% | ||||||||
Asia Pacific | 424,491 | 473,910 | (49,419 | ) | (10.4 | ) | (17,490 | ) | (3.7 | ) | ||||||||||||
Europe | 188,833 | 233,604 | (44,771 | ) | (19.2 | ) | (1,506 | ) | (0.6 | ) | ||||||||||||
Total segment revenues | 1,089,534 | 1,197,429 | (107,895 | ) | (9.0 | ) | (22,455 | ) | (1.9 | ) | ||||||||||||
Other businesses | 1,096 | 794 | 302 | 38.0 | 194 | 24.4 | ||||||||||||||||
Total consolidated revenues | $ | 1,090,630 | $ | 1,198,223 | $ | (107,593 | ) | (9.0 | )% | $ | (22,261 | ) | (1.9 | )% | ||||||||
Operating income: | ||||||||||||||||||||||
Americas | $ | 49,422 | $ | 48,347 | $ | 1,075 | 2.2 | % | $ | 1,251 | 2.6 | % | ||||||||||
Asia Pacific | 48,447 | 75,135 | (26,688 | ) | (35.5 | ) | (20,730 | ) | (27.6 | ) | ||||||||||||
Europe | 15,629 | 24,517 | (8,888 | ) | (36.3 | ) | (2,507 | ) | (10.2 | ) | ||||||||||||
Total segment operating income | 113,498 | 147,999 | (34,501 | ) | (23.3 | ) | (21,986 | ) | (14.9 | ) | ||||||||||||
Reconciliation of total segment operating income to income before income taxes: | ||||||||||||||||||||||
Other businesses(1) | (30,092 | ) | (19,400 | ) | (10,692 | ) | 55.1 | (13,410 | ) | 69.1 | ||||||||||||
Intersegment eliminations | — | (1,498 | ) | 1,498 | (100.0 | ) | — | — | ||||||||||||||
Unallocated corporate and other(2) | (155,730 | ) | (131,827 | ) | (23,903 | ) | 18.1 | (36,917 | ) | 28.0 | ||||||||||||
Total consolidated operating income (loss) | $ | (72,324 | ) | $ | (4,726 | ) | $ | (67,598 | ) | $ | 1,430.3 | $ | (72,313 | ) | 1,530.1 | % | ||||||
Foreign currency loss, net | (3,332 | ) | (4,885 | ) | 1,553 | (31.8 | ) | |||||||||||||||
Interest income | 967 | 1,664 | (697 | ) | (41.9 | ) | ||||||||||||||||
Interest expense | (969 | ) | (806 | ) | (163 | ) | 20.2 | |||||||||||||||
Other income (expense), net | 914 | 204 | 710 | 348.0 | ||||||||||||||||||
Income (loss) before income taxes | $ | (74,744 | ) | $ | (8,549 | ) | $ | (66,195 | ) | 774.3 | % | |||||||||||
_______________________________________________________________________________
(1) | During the year ended December 31, 2015, operating losses of Other businesses increased $10.7 million compared to 2014, primarily due to a $12.0 million decrease in gross margin. |
(2) | Includes a corporate component consisting primarily of corporate support and administrative functions, costs associated with share-based compensation, research and development, brand marketing, legal, depreciation on corporate and other assets not allocated to operating segments and other corporate costs. For the year ended December 31, 2015, 'Unallocated corporate and other' operating losses increased $23.9 million compared to the same period in 2014, primarily due to an increase in administrative expenses. |
(3) | Reflects year over year change as if the current period results were in "constant currency," which is a non-GAAP financial measure. See "Use of Non-GAAP Financial Measures" above for more information. |
45
Americas Operating Segment
Revenues. During the year ended December 31, 2015, revenues for our Americas segment decreased $13.7 million, or 2.8%, compared to the same period in 2014. The decrease in the Americas segment revenues was due to the net impact of: (i) a $17.8 million, or 3.6%, increase related to higher sales volumes, (ii) a $21.3 million, or 4.3%, decrease related to a lower average sales price, and (iii) a $10.2 million, or 2.1%, decrease due to the unfavorable impact of foreign currency translation.
Future changes in the average sales price per unit in any of our operating segments will be impacted by: (i) the mix of products sold, (ii) the sales channel (as we generally realize higher sales prices from our retail and e-commerce channels as compared to our wholesale channel), and (iii) the level of sales discounts and incentives we offer our customers.
Cost of Sales (including restructuring charge). During the year ended December 31, 2015, cost of sales for our Americas segment decreased $4.0 million, or 1.6%, compared to the same period in 2014. The net decrease in cost of sales was due to: (i) a $9.2 million, or 3.6%, increase due to higher sales volumes, (ii) a $6.2 million, or 2.4%, decrease due to lower average costs per unit sold, (iii) a $5.8 million, or 2.3%, decrease due to the impact of foreign currency translation, and (iv) a $1.2 million, or 0.4%, decrease associated with lower restructuring charges recorded in cost of sales (these restructuring efforts were completed as of December 31, 2015).
Gross Profit. The combined impact of the decrease in the Americas segment revenues and cost of sales resulted in a $9.7 million, or 4.2%, decrease in gross profit during the year ended December 31, 2015 compared to the same period in 2014. The net decrease in the Americas segment gross profit was due to: (i) a $15.1 million, or 6.4%, decrease due to the combined impact of a lower average sale price partially offset by a lower average cost per unit sold, (ii) an $8.6 million, or 3.7%, increase due to higher sales volumes, (iii) a $4.4 million, or 1.9%, decrease due to the impact of foreign currency translation, and (iv) a $1.2 million, or 0.4%, increase due to lower restructuring costs recorded in cost of sales.
SG&A. During the year ended December 31, 2015, SG&A for the Americas segment decreased $12.3 million, or 6.9%, compared to the same period in 2014. This net decrease is primarily due to: (i) a $7.3 million, or 4.1%, decrease in compensation expense, (ii) a $4.2 million, or 2.3%, decrease in rent expense, (iii) a $1.2 million, or 0.7%, decrease in contract labor, and (iv) and other items that are individually insignificant.
Restructuring Charges. Restructuring charges for the Americas segment decreased $1.7 million as compared to the prior year as the majority of our restructure efforts were completed in 2014.
Asset Impairment Charges. Asset impairment charges for the Americas segment increased $3.2 million for the year ended December 31, 2015 as compared to the same period in 2014. This increase is largely due to the impairment of certain retail locations that experienced declining sales volumes.
Income from Operations. The $1.1 million, or 2.2%, increase in income from operations for the Americas segment is due to the net impact of: (i) a $9.7 million decrease in gross profit, as discussed above, (ii) a $12.3 million decrease in SG&A, as discussed above, (iii) a $1.7 million decrease in restructure charges, as discussed above, and (iv) a $3.2 million increase in asset impairment charges, as discussed above.
Asia Pacific Operating Segment
Revenues. During the year ended December 31, 2015, revenues for our Asia Pacific segment decreased $49.4 million, or 10.4%, compared to the same period in 2014. The decrease in the Asia Pacific segment revenues was due to the net impact of: (i) an $11.0 million, or 2.3%, increase due to higher sales volumes, (ii) a $28.5 million, or 6.0%, decrease in the average sales price and (iii) a $31.9 million, or 6.7%, decrease due to the unfavorable impact of foreign currency translation.
Cost of Sales. During the year ended December 31, 2015, cost of sales for our Asia Pacific segment decreased $21.7 million, or 8.9%, compared to the same period in 2014. The decrease in the Asia Pacific segment cost of sales was due to the net impact of: (i) a $4.9 million, or 2.3%, increase due to higher sales volumes, (ii) a $9.6 million, or 4.5%, decrease due to lower average costs per unit sold, (iii) a $14.2 million, or 6.7%, decrease due to the impact of foreign currency translation, and (iv) a $2.8 million, or 1.3%, decrease associated with lower restructuring charges recorded in cost of sales (these restructuring efforts were completed as of December 31, 2015).
Gross Profit. During the year ended December 31, 2015, gross profit for the Asia Pacific segment decreased $27.7 million, or 10.7%, and gross margin decreased 18 basis points compared to the same period in 2014 to 54.4%. The decrease in the Asia Pacific
46
segment gross profit is due to the net impact of: (i) a $6.1 million, or 2.4%, increase due to higher sales volumes, (ii) a $16.1 million, or 6.3%, decrease due to a lower average sales prices in excess of a lower average cost per unit, and (iii) a $17.7 million, or 6.8%, decrease due to the impact of foreign currency translation.
SG&A. During the year ended December 31, 2015, SG&A for our Asia Pacific segment decreased $3.6 million, or 2.0%, compared to the same period in 2014. The decrease in SG&A was primarily due to the net impact of: (i) a $10.0 million decrease associated with salaries and wages, (ii) a $14.3 million increase associated with bad debt expense.
Restructuring Charges. Restructuring charges for the Asia Pacific segment were $3.5 million for the year ended December 31, 2015 compared to $3.5 million in the same period of 2014.
Asset Impairment Charges. Asset impairment charges for the Asia Pacific segment were $6.5 million for the year ended December 31, 2015, compared to $2.8 million in the same period of 2014, primarily due the impairments associated with the sale of the South Africa operations.
Our Asia Pacific operating segment continues to perform poorly primarily due to adverse macro-economic conditions and overall weakness in China's economy. The macro-economic environment in China has deteriorated over the past several quarters which has decreased revenue from our China operations by 53.0%, for the year ended December 31, 2015 as compared to the same period in 2014. We have also experienced significant declines in collection rates from our China operations due to the adverse macro-economic environment and the deteriorating working capital position of our distributors. The impact of these declines became apparent in September 2015, when multiple China distributors defaulted on their payment obligations. As a result, we have reassessed the collectability of our accounts receivable balances, for our China operations, and we concluded a significant increase in reserves is required. Accordingly, we have increased our China allowance for doubtful accounts by an additional $23.2 million, resulting in total allowances for our China operations of $30.3 million as of December 31, 2015. Our net accounts receivable balance for our China operations as of December 31, 2015 is $5.1 million.
If the economic conditions in China continue to decline, we may experience further reductions in consumer demand in our China markets which could result in additional declines. As our China operations represent approximately 8% of our total revenue, declining sales volumes in China could have a material adverse impact on our financial results in future periods.
Europe Operating Segment
Revenues. During the year ended December 31, 2015, revenues for our Europe segment decreased $44.8 million, or 19.2%, compared to the same period in 2015. The decrease in the Europe segment revenues was due to the net impact of: (i) an $8.2 million, or 3.5%, increase due to higher sales volumes, (ii) a $9.7 million, or 4.2%, decrease due to a lower average sales price, and (iii) a $43.3 million, or 18.5%, decrease due to the impact of foreign currency translation.
Cost of Sales. During the year ended December 31, 2015, cost of sales for our Europe segment decreased $16.4 million, or 14.1%, compared to the same period in 2015. The decrease in the Europe segment cost of sales was due to the net impact of: (i) a $4.1 million, or 3.5%, increase due to higher sales volumes, (ii) a $2.7 million or 2.3%, decrease due to lower average cost per unit sold and (iii) a $17.9 million, or 15.4% decrease due to the impact of foreign currency translation.
Gross Profit. During the year ended December 31, 2015, gross profit for our Europe segment decreased $28.4 million, or 24.2%, and gross margin decreased 311 basis points compared to the same period in 2015, to 47.2%. The decrease in the Europe segment gross profit is due to the net impact of: (i) a $4.1 million, or 3.5%, increase due to higher sales volumes, (ii) a $7.1 million, or 6.1%, decrease due to a lower average sales price in excess of the decrease in costs per unit, and (iii) a $25.4 million, or 21.6%, decrease due to the impact of foreign currency translation.
SG&A. During the year ended December 31, 2015, SG&A for our Europe segment decreased $17.9 million, or 20.6%, compared to the same period in 2014. The decrease in SG&A was primarily due to the net impact of: (i) a $9.5 million decrease associated with salaries and wages, (ii) a $6.7 million decrease associated with building expenses, and (iii) a $2.2 million decrease in services expense.
Restructuring Charges. Restructuring charges for our Europe segment were $2.8 million for the year ended December 31, 2015, compared to $4.0 million in the same period of 2014.
Asset Impairment Charges. Asset impairment charges for our Europe segment were $1.6 million for the year ended December 31, 2015, compared to $2.0 million in the same period of 2014.
47
The changes in the number of our company-operated retail locations by reportable operating segment and type of store were:
December 31, 2014 | Opened | Closed | December 31, 2015 | ||||||||
Company-operated retail locations | |||||||||||
Type | |||||||||||
Kiosk/store in store | 100 | 11 | 13 | 98 | |||||||
Retail stores | 311 | 15 | 51 | 275 | |||||||
Outlet stores | 174 | 16 | 4 | 186 | |||||||
Total | 585 | 42 | 68 | 559 | |||||||
Operating segment | |||||||||||
Americas | 210 | 4 | 18 | 196 | |||||||
Asia Pacific | 258 | 36 | 33 | 261 | |||||||
Europe | 117 | 2 | 17 | 102 | |||||||
Total | 585 | 42 | 68 | 559 | |||||||
Comparable retail store sales and Direct to Consumer store sales by reportable operating segment are as follows:
Constant Currency(2) Year Ended December 31, 2015 | Constant Currency(2) Year Ended December 31, 2014 | ||||
Comparable store sales (retail only)(1) | |||||
Americas | (3.2 | )% | (4.4 | )% | |
Asia Pacific | (4.5 | )% | (4.7 | )% | |
Europe | 3.0 | % | 0.7 | % | |
Global | (2.8 | )% | (3.7 | )% | |
Constant Currency(2) Year Ended December 31, 2015 | Constant Currency(2) Year Ended December 31, 2014 | ||||
DTC comparable store sales (includes retail and e-commerce)(1) | |||||
Americas | 3.3 | % | (3.8 | )% | |
Asia Pacific | 3.0 | % | 0.6 | % | |
Europe | 7.8 | % | (0.6 | )% | |
Global | 3.9 | % | (1.9 | )% | |
_______________________________________________________________________________
(1) | Comparable store status is determined on a monthly basis. Comparable store sales includes the revenues of stores that have been in operation for more than twelve months. Stores in which selling square footage has changed more than 15% as a result of a remodel, expansion or reduction are excluded until the thirteenth month in which they have comparable prior year sales. Temporarily closed stores are excluded from the comparable store sales calculation during the month of closure. Location closures in excess of three months are excluded until the thirteenth month post re-opening. E-commerce revenues are based on same site sales period over period. |
(2) | Reflects quarter over quarter change on a “constant currency” basis, which is a non-GAAP financial measure that restates current period results using prior year foreign exchange rates for the comparative period to enhance visibility of the underlying business trends, excluding the impact of foreign currency. |
Comparable store sales decreased 2.8% on a global basis for the year ended December 31, 2015, compared to a decrease of 3.7% for the year ended December 31, 2014. Comparable store sales for our direct to consumer customers, which includes retail and ecommerce, increased 3.9% on a global basis for the year ended December 31, 2015, compared to a decrease of 1.9% for the year ended December 31, 2014.
48
Impact on revenues due to foreign exchange rate fluctuations. Changes in average foreign currency exchange rates used to translate revenue from our functional currencies to our reporting currency during the year ended December 31, 2015 resulted in an $85.3 million decrease in revenue compared to the same period in 2014.
Gross profit. During the year ended December 31, 2015, gross profit decreased $79.5 million, or 13.5%, compared to the same period in 2014, and was primarily attributable to the 9.0% decrease in revenue partially offset by a decrease of $24.1 million, or 4.0% to cost of sales compared to the same period in 2014 primarily due to foreign currency translation. Gross margin percentage decreased 250 basis points compared to the same period in 2014.
Impact on gross profit due to foreign exchange rate fluctuations. Changes in average foreign currency exchange rates used to translate revenue and costs of sales from our functional currencies to our reporting currency during the year ended December 31, 2015 decreased our gross profit by $41.7 million, or 7.1%, compared to the same period in 2014.
Liquidity and Capital Resources
Cash and cash equivalents were $147.6 million at December 31, 2016, compared to $143.3 million at December 31, 2015. Cash and cash equivalents increased during 2016 by $4.2 million compared to a decrease of $124.2 million during 2015. We did not make any repurchases of our common stock during 2016 compared to repurchases of $85.9 million during 2015. The remaining increase in cash and cash equivalents in 2016 primarily resulted from increases of $30.1 million in net loss adjusted for non-cash items and working capital items, $13.5 million from the effects of exchange rates and $1.1 million of other financing activities.
Year Ended December 31, 2016 Compared to Year Ended December 31, 2015
Cash Flows
Years Ended December 31, | |||||||||||
2016 | 2015 | Change | |||||||||
(in thousands) | |||||||||||
Cash provided by (used in) operating activities | $ | 39,754 | $ | 9,698 | $ | 30,056 | |||||
Cash used in investing activities | (18,657 | ) | (18,627 | ) | (30 | ) | |||||
Cash used in financing activities | (16,443 | ) | (101,260 | ) | 84,817 | ||||||
Effect of exchange rate changes on cash | (430 | ) | (13,982 | ) | 13,552 | ||||||
Net increase (decrease) in cash and cash equivalents | $ | 4,224 | $ | (124,171 | ) | $ | 128,395 | ||||
Net Cash Provided by Operating Activities. Cash provided by operating activities increased to $39.8 million during 2016 compared to $9.7 million during 2015. The $30.1 million net increase in cash provided by operating activities resulted from the net effects of a $13.8 million increase in cash from net loss adjusted for non-cash items, and improved cash from operating assets of $16.3 million, primarily in working capital. The $13.8 million increase in cash from net loss adjusted for non-cash items include a $66.7 million improvement in net loss, partially offset by a $52.9 million decrease in non-cash items, which consist of: (i) a $22.8 million decrease from the prior year in non-cash expense associated with doubtful accounts, primarily in Asia; (ii) a $15.3 million decrease from the prior year in asset impairments related to closed retail locations and inventory reserves; (iii) an $8.2 million increase in net unrealized foreign currency gains; and (iv) a $6.7 million decrease from other non-cash items.
Improvements in cash from operating acitivites of $16.3 million include: (i) reductions in accounts receivable of $18.0 million; (ii) reductions in inventories of $29.0 million due to increased inventory management efforts; offset in part by decreases in accounts payable and accrued expenses of $29.6 million; and (iv) other working capital items that decreased cash from operations by $1.1 million.
Net Cash Used in Investing Activities. Net cash used in investing activities was $18.7 million during 2016 compared to $18.6 million during 2015. The $3.7 million increase in capital expenditures, primarily associated with enhancements to our information technology infrastructure, was offset by proceeds received of approximately $2.4 million on the sale of our South Africa business and $1.2 million of other investing activities.
Net Cash Used in Financing Activities. Net cash used in financing activities decreased to $16.4 million during 2016 compared to $101.3 million during 2015. The decrease of $84.9 million was primarily attributable to the net impact of: (i) we made no repurchases of our common shares during 2016 as compared to repurchases of $85.9 million during 2015; (ii) a $1.4 million decrease in cash received in 2016 from issuances of common stock associated with our stock compensation plans compared to 2015; and (iii) other cash used in financing activities related to net borrowings and repayments associated with our Senior Revolving Credit Facility.
49
Year Ended December 31, 2015 Compared to Year Ended December 31, 2014
Years Ended December 31, | |||||||||||
2015 | 2014 | Change | |||||||||
(in thousands) | |||||||||||
Cash provided by (used in) operating activities | $ | 9,698 | $ | (11,651 | ) | $ | 21,349 | ||||
Cash used in investing activities | (18,627 | ) | (57,992 | ) | 39,365 | ||||||
Cash provided by (used in) financing activities | (101,260 | ) | 23,431 | (124,691 | ) | ||||||
Effect of exchange rate changes on cash | (13,982 | ) | (3,420 | ) | (10,562 | ) | |||||
Net increase (decrease) in cash and cash equivalents | $ | (124,171 | ) | $ | (49,632 | ) | $ | (74,539 | ) | ||
During the year ended December 31, 2015, cash and cash equivalents decreased $124.2 million to $143.3 million, compared to a decrease of $49.6 million during December 31, 2014. The primary drivers of this decrease were the repurchase of $85.9 million of our common stock including related commissions under our publicly-announced repurchase plan, strategic reinvestments into the business including $5.8 million in capital spend primarily related to our ERP system implementation, dividend payments of $11.9 million on our Series A Preferred Stock, of which $3.0 million was recorded as dividends payable and prepaid dividends as of December 31, 2016, and debt payments, including principal and interest, of $3.0 million related to long-term bank borrowings.
Cash provided by operations was $9.7 million for the year ended December 31, 2015 compared to cash used in operations of $11.7 million for the year ended December 31, 2014. This increase was primarily driven by the change in working capital accounts year over year which accounted for $36.4 million of our cash provided by operating activities. During the year ended December 31, 2016, we paid $19.9 million in cash related to taxes that were accrued for as of December 31, 2014, which accounted for half of this change.
As of December 31, 2015, accounts receivable, net decreased $17.6 million compared to December 31, 2014. During the year ended December 31, 2015, we recorded a reserve for doubtful accounts of $23.2 million in our Asia Pacific segment primarily as a result of delayed payments from our partner stores in China. As of December 31, 2015, other long-term assets decreased by approximately $4.3 million primarily due to the decrease in derivative instruments recorded on our balance sheet, as no such instruments were outstanding as of December 31, 2015. As of December 31, 2015, accounts payable increased $20.4 million compared to December 31, 2014. As a result of the January 2015 implementation of our new ERP system, we accelerated payments of our outstanding payables in late 2014 to accommodate the transition. Accrued expenses and other liabilities increased $11.6 million compared to December 31, 2014 primarily due to an accrued loss on our South Africa operations held for sale as of December 31, 2015.
Sources of Liquidity
Our primary sources of liquidity are cash flows generated from our operations, our cash and cash equivalents and available borrowing capacity under our Senior Revolving Credit Facility.
The following table presents the total availability under our credit facilities as of December 31 2016:
December 31, 2016 | ||||||||||||
Borrowing | Borrowings | Remaining | ||||||||||
Description | Capacity | Outstanding | Availability | |||||||||
(in thousands) | ||||||||||||
Senior Revolving Credit Facility(1) | $ | 80,000 | $ | 1,253 | $ | 78,747 | ||||||
Asia Revolving Credit Facility(2) | 8,625 | — | — | |||||||||
_________________________________________________________________
(1) | Borrowing capacity is subject to certain financial covenants as further described in Note 9 — Revolving Credit Facility and Bank Borrowings. Outstanding amount represents letters of credit. The term of this facility expires in February 2021. |
(2) | Borrowing capacity is the U.S. Dollar equivalent of 60 million Chinese Renminbi and has been suspended as more fully described in Note 9 — Revolving Credit Facility and Bank Borrowings. The term of this facility expires in February 2021. |
50
The Senior Revolving Credit Facility is with a single lender, PNC Bank. We have no reason to believe that the lender would be unable to fulfill its obligation to provide financing in accordance with the terms of the Senior Revolving Credit Facility in the event of our election to borrow funds.
We also have notes payable obligations totaling $2.4 million as of December 31, 2016, which represent funds borrowed to finance the purchase and implementation of our ERP system under a Master IPA agreement that expires in February 2021, and certain insurance coverage premiums.
Repatriation of Cash
As we are a global business, we have cash balances which are located in various countries and are denominated in various currencies. Fluctuations in foreign currency exchange rates impact our results of operations and cash positions. Future fluctuations in foreign currencies may have a material impact on our cash flows and capital resources. Cash balances held in foreign countries may have additional restrictions and covenants associated with them which could adversely impact our liquidity and our ability to timely access and transfer cash balances between entities.
We generally consider unremitted earnings of subsidiaries operating outside of the U.S. to be indefinitely reinvested; however, our Board has approved a foreign cash repatriation strategy. As part of this strategy, we repatriated approximately $37 million during the year ended December 31, 2016 for which income taxes have already been accrued or paid. Further cash repatriation will depend on future cash requirements in the U.S. We maintain approximately $178 million of foreign earnings for which tax has previously been provided, and which has not been repatriated at this time.
Most of the cash balances held outside of the U.S. could be repatriated to the U.S., but under current law, would be subject to U.S. federal and state income taxes less applicable foreign tax credits. In some countries, repatriation of certain foreign balances is restricted by local laws and could have adverse tax consequences if we were to move the cash to another country. Certain countries have monetary laws which may limit our ability to utilize cash resources in those countries for operations in other countries. These limitations may affect our ability to fully utilize our cash resources for needs in the U.S. or other countries and could adversely affect our liquidity. As of December 31, 2016, we held $121.9 million of our total $147.6 million in cash in international locations. This cash is primarily used for the ongoing operations of the business in the locations in which the cash is held. Of the $121.9 million, $.3 million could potentially be restricted, as described above. If the remaining $121.6 million were to be immediately repatriated to the U.S., no additional tax expense would be incurred as all amounts are currently provided for in the statement of operations.
Sale of Preferred Stock
On January 27, 2014, we sold 200,000 shares of the Company's Series A Convertible Preferred Stock ("Series A Preferred") for $182.2 million of net proceeds. The Series A Preferred has a par value of $0.001 per share, with a liquidation value of $200.0 million, or $1,000 per share, and an aggregate purchase price of $198.0 million, or $990.00 per share. We are obligated to pay cash dividends of $3 million each quarter to the Holders of Series A Preferred in cash as well as any dividends declared or paid on our common stock. More information regarding the Series A Preferred is included in Note10 — Equity.
Our sources of liquidity are used to fund our ongoing cash requirements, including our working capital, global retail, distribution and e-commerce development and construction, investments in our infrastructure including technology, payments of dividends, repayments of debt and borrowings, settlements of contingent liabilities (including uncertain tax positions), and other ongoing corporate activities. We believe that our existing sources of liquidity, including cash on hand, accounts receivable and borrowing capacity under our Senior Revolving Credit Facility will be sufficient to meet our liquidity needs over the next year as well as the foreseeable future.
Contractual Obligations
In December 2011, the Company renewed and amended its supply agreement with Finproject S.p.A. (formerly known as Finproject s.r.l.), which provides the Company the right to purchase certain raw materials used to manufacture its products. The supply agreement requires that the Company meet minimum purchase requirements throughout the term of the agreement, which renews annually on January 1st unless terminated by either party. Historically, the minimum purchase requirements have not been onerous and the Company does not expect them to become onerous in the future. Depending on the material purchased, pricing is based either on contracted price or is subject to quarterly reviews and fluctuates based on order volume, currency fluctuations, and raw material prices. Pursuant to the agreement, the Company guarantees the payment for certain third-party manufacturer purchases of these raw materials up to a maximum potential amount of €3.5 million (approximately $3.7 million as of December 31, 2016).
The following table summarizes aggregate information about our significant contractual cash obligations as of December 31, 2016:
51
Total | Less than 1 Year | 1 - 3 Years | 3 - 5 Years | More than 5 Years | |||||||||||||||
(in thousands) | |||||||||||||||||||
Operating lease obligations(1) | $ | 310,555 | 68,241 | 134,519 | 29,230 | 78,565 | |||||||||||||
Inventory purchase obligations with third-party manufacturers(2) | 125,987 | 125,987 | — | — | — | ||||||||||||||
Dividends payable(3) | 60,866 | 12,000 | 24,000 | 24,000 | 866 | ||||||||||||||
Other contracts(4) | 39,872 | 27,442 | 10,083 | 2,347 | — | ||||||||||||||
Debt obligations(5)(8) | 2,329 | 2,329 | — | — | — | ||||||||||||||
Minimum licensing royalties(6) | 6,403 | 4,023 | 2,374 | 6 | — | ||||||||||||||
Capital lease obligations(7) | 49 | 9 | 29 | 11 | — | ||||||||||||||
Total | $ | 546,061 | $ | 240,031 | $ | 171,005 | $ | 55,594 | $ | 79,431 | |||||||||
_______________________________________________________________________________
(1) | Our operating lease obligations consist of leases for retail stores, offices, warehouses, vehicles, and equipment expiring at various dates through 2033. This balance represents the minimum cash commitment under contract to various third parties for operating lease obligations including the effect of rent escalation clauses and deferred rent and minimum sublease rentals due in the future under non-cancelable subleases. This balance does not include certain contingent rent clauses that may require additional rental amounts based on sales volume, inventories, etc. as these amounts are not determinable for future periods. |
(2) | Our inventory purchase obligations with third-party manufacturers consist of open purchase orders for footwear products and include an immaterial amount of purchase commitments with certain third-party manufacturers for yet-to-be-received finished product where title passes to us upon receipt. All purchase obligations with third-party manufacturers are expected to be paid within one year. |
(3) | Dividends payable are associated with our Series A Preferred Stock at a rate of 6.0% of the stated value of the stock. The amounts represent expected dividend payments over the eight year redemption accretion period. |
(4) | Other contracts consist of various agreements with third-party providers, primarily for IT and financial services, distribution and logistics service providers, and other agreements. |
(5) | Our current debt obligations consist of five separate notes issued under our agreement with PNC to finance the purchase and implementation of our new ERP system, which bear interest rates ranging from 2.45% to 2.79% and maturities ranging from September 2016 to September 2017. We will continue to finance the ERP implementation on an as needed basis through this agreement. Interest rates and payment terms are subject to change as further financing occurs. |
(6) | Our minimum licensing royalties consist of usage-based payments for the right to use various licenses, trademarks and copyrights in the production of our footwear and accessories. Royalty obligations are based on minimum guarantees under contract; however, may include additional royalty obligations based on sales volume that are not determinable for future periods. |
(7) | Our capital lease obligations consist of leases for office equipment expiring at various dates through 2020. This balance represents the minimum cash commitment under contract to various third-parties for capital lease obligations. |
(8) | Amounts include anticipated interest payments. |
Excluded from the table above is a $4.8 million liability for unrecognized tax benefits as of December 31, 2016, as we cannot make a reliable estimate of the period in which the liability will be settled, if ever.
Off-Balance Sheet Arrangements
In accordance with generally accepted accounting principles, our operating leases are not reflected in our consolidated balance sheets. See Part II—Item 8, Financial Statements and Supplementary Data, Note 15 — Commitments and Contingencies for further discussion of these off-balance sheet arrangements (as defined in Item 303(a)(4)(ii) of Regulation S-K). As of December 31, 2016, we did not have any other material off-balance sheet arrangements other than certain operating leases and other commitments.
52
Critical Accounting Policies and Estimates
General
Our discussion and analysis of financial condition and results of operations, outside of discussions regarding constant currency and non-GAAP financial measures, is based on the consolidated financial statements which have been prepared in accordance with GAAP. The preparation of these financial statements requires us to make estimates and judgments that affect the reported amounts of assets, liabilities and contingencies as of the date of the financial statements and the reported amounts of revenues and expenses during the reporting periods. We evaluate our assumptions and estimates on an on-going basis.
An accounting policy is considered to be critical if it is important to our results of operations, financial condition, and cash flows, and requires significant judgment and estimates on the part of management in its application. Our estimates are often based on historical experience, complex judgments, assessments of probability, and assumptions that management believes to be reasonable, but that are inherently uncertain and unpredictable. We believe that the following discussion represents those accounting policies that are the most critical to the reporting of our financial condition and results of operations. For a discussion of our significant accounting policies, see Note 1 — Basis of Presentation and Significant Accounting Policies to the accompanying consolidated financial statements.
Reserves for Uncollectible Accounts Receivable
We make ongoing estimates related to the collectibility of our accounts receivable and maintain a reserve for estimated losses resulting from the inability of our customers to make required payments. Our estimates are based on a variety of factors, including the length of time receivables are past due, economic trends and conditions affecting our customer base, significant non-recurring events and historical write-off experience. Specific provisions are recorded for individual receivables when we become aware of a customer's inability or unwillingness to meet its financial obligations. Because we cannot predict future changes in the financial stability of our customers, actual future losses from uncollectible accounts may differ from our estimates and we may experience changes in the amount of reserves we recognize for accounts receivable that we deem uncollectible. If the financial condition of our customers were to deteriorate, resulting in their inability to make payments, a larger reserve might be required. In the event we determine that a smaller or larger reserve is appropriate, we would record a credit or a charge, respectively, to 'Selling, general and administrative expenses' in our consolidated statement of operations in the period in which we made such a determination.
See Note 12 — Allowances to the accompanying consolidated financial statements for an analysis of the activity in our allowance for doubtful accounts.
Sales Returns, Allowances and Discounts
A significant area of judgment affecting reported revenues and net income involves estimating reserves for sales returns, allowances and discounts, which represent the portion of revenues not expected to be realized. Wholesale revenues are reduced by estimates of returns, allowance, discounts and contractual discounts to major customers. We also accept returns at our sole discretion from our wholesalers and distributors to rebalance stock and to ensure that our products are merchandised in the proper assortments, and may provide markdown allowances at our sole discretion to key wholesalers and distributors to facilitate sales of slower moving products. We also record reductions to revenues for estimated customer credits as a result of price markdowns in certain markets. Retail revenues, including e-commerce store sales, are also reduced by an estimate of returns.
Our estimated sales returns and allowances are based on customer return history and actual outstanding returns yet to be received. Changes to our estimates for customer returns, allowances and discounts may be caused by many factors, including, but not limited to whether customers accept our new styles, customer inventory levels, shipping delays or errors, known or suspected product defects, the seasonal nature of our products and macroeconomic factors affecting our customers. Historically, actual amounts of customer returns, allowances and discounts have not differed significantly from our estimates. A hypothetical 1% increase in our reserves for returns, allowances and discounts as of December 31, 2016 would have decreased our 2016 revenues by approximately $7.2 million.
See Note 12 — Allowances to the accompanying consolidated financial statements for an analysis of the activity in our sales returns, allowances and discounts.
Inventory Valuation
Our products are sold through wholesale distribution channels department stores, sporting goods stores, distributors, national, regional and independent retailers. We also sell directly to consumers through wholly-owned full-service retail stores, kiosks, outlet stores and e-commerce store sites. Substantially all of our inventories are finished goods, which are stated at the lower of cost or market, with cost determined using the moving average cost method.
53
We estimate the market value of inventory based on an analysis of historical sales trends of our individual product lines, the impact of market trends and economic conditions, and a forecast of future demand, giving consideration to the value of current orders in-house for future sales of inventory, as well as plans to sell discontinued or end of life inventory through our outlet stores, among other off-price channels. Estimates may differ from actual results due to the quantity, quality, and mix of products in inventory, consumer and retailer preferences, and market conditions. If the estimated market value is less than its carrying value, the carrying value is adjusted to the market value and the difference is recorded in 'Cost of sales' in our consolidated statements of operations. Reserves for the risk of physical loss of inventory are estimated based on historical experience and are adjusted based upon physical inventory counts, and recorded within 'Cost of sales' in our consolidated statements of operations. The ultimate results achieved in selling excess and discontinued products in future periods may differ significantly from our estimates. A hypothetical 1% increase in the level of our inventory reserves as of December 31, 2016 would have decreased our 2016 gross profit by approximately $0.1 million.
See Note 3 — Inventories to the accompanying consolidated financial statements for a discussion of our inventory reserves.
Impairment of Other Long-Lived Assets
Property and equipment along with other long-lived assets are evaluated for impairment periodically whenever events or changes in circumstances indicate that their carrying values may not be fully recoverable. Testing of long-lived assets for impairment is at the level of an asset group, which is the is the lowest level for which identifiable cash flows are largely independent of the cash flows of other assets and liabilities. In our retail business, the asset group for impairment testing is each individual retail store. In evaluating long-lived assets for recoverability, we use our best estimate of future cash flows expected to result from the use of the asset and its eventual disposition, where applicable. To the extent that estimated future undiscounted net cash flows attributable to the asset are less than its carrying value, an impairment loss is recognized equal to the difference between the carrying value of such asset and its fair value. Assets to be disposed of and for which there is a committed plan of disposal are reported at the lower of carrying value or fair value, less costs to sell.
In determining future cash flows, we take various factors into account, including the remaining useful life of each asset group, forecasted growth rates, pricing, working capital, capital expenditures, and other cash needs specific to the asset group. Additional considerations when assessing impairment include changes in our strategic operational and financial decisions, global and regional economic conditions, demand for our product and other corporate initiatives which may eliminate or significantly decrease the realization of future benefits from our long-lived assets. Since the determination of future cash flows is an estimate of future performance, future impairments may arise in the event that future cash flows do not meet expectations.
During 2016, 2015, and 2014, we recorded non-cash impairment of $2.7 million, $15.3 million, and $8.8 million, respectively, to reduce the net carrying value of certain long-lived assets, primarily related to underperforming company owned retail stores, to their estimated fair values. See Note 4 — Property and Equipment to the accompanying consolidated financial statements for further information related to long-lived asset impairments.
Stock-Based Compensation
Stock Options
Stock options are granted to employees and non-employee directors with exercise prices equal to the fair market value of our common stock on the date of grant. We use the Black-Scholes option-pricing model to estimate the grant date fair value of stock options, which requires the use of assumptions, including the expected term of the option, expected volatility of our stock price, our expected dividend yield, and the risk-free interest rate, among others. These assumptions reflect our best estimates, however; they involve inherent uncertainties including market conditions and employee behavior that are generally outside of our control. Generally, once stock option values are determined, accounting practices do not permit them to be changed, even if the estimates used are different from actual results. We expense all stock-based compensation awarded to employees and non-employee directors based on the grant date fair value of the awards over the requisite service period, adjusted for forfeitures.
Restricted Stock Awards and Units ("RSUs")
We grant restricted shares of our common stock to our non-employee directors, and service-based RSUs to certain executives, as well as to certain non-executive employees. In addition, we grant performance-based RSUs to certain executives. The fair values of restricted stock shares and RSUs are based on the fair value of our unrestricted common stock, adjusted to reflect the absence of dividends for those restricted securities that are not entitled to dividend equivalents prior to vesting. Compensation expense for performance-based RSUs is recognized over the employees' requisite service period when attainment of the performance goals is deemed probable, which involves judgment as to achievement of certain performance metrics.
54
Our performance-based RSU awards vest based upon attainment of certain performance conditions, including earnings levels, revenue and cash flow targets, and certification by our Compensation Committee. The fair value of these awards is estimated using a Monte Carlo simulation valuation model prepared by an independent third party. This pricing model utilizes multiple input variables that determine the probability of satisfying each performance condition stipulated in the terms of the award to estimate its grant date fair value. Compensation expense, net of forfeitures, is updated for the Company's expected performance level against each related goal at the end of each reporting period.
Sensitivity
The assumptions used in calculating the grant date fair values of stock-based compensation awards represent our best estimates. In addition, judgment is required in estimating the number of stock-based awards that will vest upon achievement of performance conditions. If actual results differ significantly from our estimates and assumptions, if we change the assumptions used to estimate the grant date fair value for future stock-based award grants, or if there are changes in market conditions, stock-based compensation expense and, therefore, our results of operations could be materially impacted. A hypothetical 1% change in our stock-based compensation expense would have affected our 2016 net income by approximately $0.1 million.
See Note 11 — Stock Compensation to the accompanying consolidated financial statements for further information related to stock-based compensation.
Contingencies and Legal Proceedings
We are periodically exposed to various contingencies in the ordinary course of conducting our business, including certain litigation, contractual disputes, employee relations matters, various tax or other governmental audits, and trademark and intellectual property matters and disputes. We record a liability for such contingencies to the extent that we conclude their occurrence is probable and the related losses are estimable. In addition, if it is reasonably possible that an unfavorable settlement of a contingency could exceed the established liability, we disclose the estimated impact on our liquidity, financial condition, and results of operations, if practicable. Management considers many factors in making these assessments. As the ultimate resolution of contingencies is inherently unpredictable, these assessments can involve a series of complex judgments about future events including, but not limited to, court rulings, negotiations between affected parties, and governmental actions. As a result, the accounting for loss contingencies relies heavily on management's judgment in developing the related estimates and assumptions. See Note 15 —Commitments and Contingencies in the accompanying notes to the audited consolidated financial statements for additional information regarding our contingencies and legal proceedings.
Income Taxes
We account for income taxes using the asset and liability method which requires the recognition of deferred tax assets and liabilities for the expected future tax consequences of temporary differences between the carrying amounts and the tax bases of other assets and liabilities. We provide for income taxes at the current and future enacted tax rates and laws applicable in each taxing jurisdiction. We use a two-step approach for recognizing and measuring tax benefits taken or expected to be taken in a tax return and disclosures regarding uncertainties in income tax positions. The impact of an uncertain tax position that is more likely than not of being sustained upon examination by the relevant taxing authority must be recognized at the largest amount that is more likely than not to be sustained. No portion of an uncertain tax position will be recognized if the position has less than a 50% likelihood of being sustained. Interest expense is recognized on the full amount of deferred benefits for uncertain tax positions. While the validity of any tax position is a matter of tax law, the body of statutory, regulatory and interpretive guidance on the application of the law is complex and often ambiguous. We recognize interest and penalties related to unrecognized tax benefits within the “Income tax expense” line in the accompanying consolidated statement of operations. Accrued interest and penalties are included within the related tax liability line in the consolidated balance sheets.
Our annual tax rate is based on our income, statutory tax rates, and tax planning opportunities available to us in the various jurisdictions in which we operate. Significant judgment is required in determining our annual tax expense and in evaluating our tax positions. Tax laws require items to be included in our tax returns at different times than when these items are reflected in the consolidated financial statements. As a result, the annual tax rate reflected in our consolidated financial statements is different than that reported in our tax return (our cash tax rate). Some of these differences are permanent, such as expenses that are not deductible in our tax return, and some differences reverse over time, such as depreciation expense. These timing differences create deferred tax assets and liabilities. Deferred tax assets and liabilities are determined based on temporary differences between the financial reporting and tax basis of assets and liabilities. The tax rates used to determine deferred tax assets or liabilities are the enacted tax rates in effect for the year in which the differences are expected to reverse. Based on an evaluation of all available information, we recognize future tax benefits, such as net operating loss carryforwards, to the extent that realizing these benefits is considered more likely than not.
55
We evaluate our ability to realize the tax benefits associated with deferred tax assets by analyzing our forecasted taxable income using both historical and projected future operating results, the reversal of existing temporary differences, taxable income in prior carry back years (if permitted) and the availability of tax planning strategies. A valuation allowance is required to be established unless management determines that it is more likely than not that we will ultimately realize the tax benefit associated with a deferred tax asset. Undistributed earnings of a subsidiary are accounted for as a temporary difference, except that deferred tax liabilities are not recorded for undistributed earnings of a foreign subsidiary that are deemed to be indefinitely reinvested in the foreign jurisdiction. We determine on a regular basis the amount of undistributed earnings that will be indefinitely reinvested in our non-U.S. operations. This assessment is based on the cash flow projections and operational and fiscal objectives of each of our U.S. and foreign subsidiaries. U.S. income and foreign withholding taxes have not been provided on approximately $208.1 million of cumulative undistributed foreign earnings of the non-US subsidiaries as of December 31, 2016. These historical earnings are indefinitely reinvested outside of the United States.
Should we change our plans, we would be required to record a significant amount of deferred tax liabilities. The amount of unrecognized deferred U.S. income tax liability on the unremitted earnings has not been determined because the hypothetical calculation is not practicable.
See Note 13 — Income Taxes in the accompanying notes to the consolidated financial statements for additional information regarding our income taxes.
Recent Accounting Pronouncements. See Note 2 — Recent Accounting Pronouncements in the accompanying notes to the consolidated financial statements for recently adopted and issued accounting pronouncements.
56
ITEM 7A. Quantitative and Qualitative Disclosures About Market Risk
Interest Rate Risk
We centrally manage our debt and investment portfolios considering investment opportunities and risks, tax consequences and overall financing strategies. Our exposure to market risk includes interest rate fluctuations in connection with our revolving credit facility and certain financial instruments. In addition to the revolving credit facility, we have incurred indebtedness related to the implementation of our enterprise resource planning software ("ERP") system. Borrowings under these debt instruments bear fixed interest rates and therefore, do not have the potential for market risk.
Borrowings under the revolving credit facility bear interest at a variable rate. For domestic rate loans, including swing loans, the interest rate is equal to a daily base rate plus a margin ranging from 0.50% to 0.75% based on certain conditions. For domestic London Interbank Borrowing Rate ("LIBOR") rate loans, the interest rate is equal to a LIBOR rate plus a margin ranging from 1.50% to 1.75% based on certain conditions.
Borrowings under the revolving credit facility are therefore subject to risk based upon prevailing market interest rates. Interest rates fluctuate as a result of many factors, including governmental monetary and tax policies, domestic and international economic and political considerations and other factors that are beyond our control. As of December 31, 2016 and 2015, there were no borrowings outstanding under the revolving credit facility.
We additionally hold cash equivalents including certificate of deposits, time deposits and money market funds. Interest income generated from these cash equivalents will fluctuate with the general level of interest rates. As of December 31, 2016, we held $3.4 million in cash equivalents subject to variable interest rates. The effects of an increase or decrease of 10% in prevailing market interest rates earned on these investments on interest income during the year ended December 31, 2016, is not significant to our consolidated results of operations, financial condition or cash flows.
Foreign Currency Exchange Risk
As a global company, we have significant revenues and costs denominated in currencies other than the U.S. Dollar. We are exposed to the risk of gains and losses resulting from changes in exchange rates on monetary assets and liabilities within our international subsidiaries that are denominated in currencies other than the subsidiary’s functional currency. Likewise, our U.S. companies are also exposed to the risk of gains and losses resulting changes in exchange rates on monetary assets and liabilities that are denominated in a currency other than the U.S. Dollar.
We have experienced and will continue to experience changes in international currency rates, impacting both results of operations and the value of assets and liabilities denominated in foreign currencies. We enter into forward foreign exchange contracts to buy or sell various foreign currencies to selectively protect against volatility in the value of non-functional currency denominated monetary assets and liabilities. Changes in the fair value of these forward contracts are recognized in earnings. As of December 31, 2016, the U.S. Dollar notional value of our outstanding foreign currency forward exchange contracts was approximately $328.2 million. The net fair value of these contracts at December 31, 2016 was a liability $0.2 million.
We perform a sensitivity analysis to determine the effects that market risk exposures may have on the fair values of our forward foreign currency exchange contracts. To perform the sensitivity analysis, we assess the risk of loss in fair values from the effect of hypothetical changes in foreign currency exchange rates. This analysis assumes a like movement by the foreign currencies in our hedge portfolio against the U.S. Dollar. As of December 31, 2016, a 10% appreciation in the value of the U.S. Dollar would result in a net increase in the fair value of our derivative portfolio of approximately $5.5 million.
Effects of Changes in Exchange Rates on Translated Results of International Subsidiaries
Changes in exchange rates have a direct effect on our reported U.S. dollar consolidated financial statements because we translate the operating results and financial position of our international subsidiaries to U.S. dollars using current period exchange rates. Specifically, we translate the statements of operations of our foreign subsidiaries into the U.S. dollar reporting currency using average exchange rates each reporting period. As a result, comparisons of reported results between reporting periods may be impacted significantly due to differences in the exchange rates used in translate the operating results of our international subsidiaries.
For example, in our European segment, when the U.S. Dollar strengthens relative to the Euro, our reported U.S. Dollar results are lower than if there had been no change in the exchange rate, because more Euros are required to generate the same U.S. Dollar translated amount. Conversely, when the U.S. Dollar weakens relative to the Euro, the reported U.S. Dollar results of our Europe segment are higher compared to a period with a stronger U.S. Dollar relative to the Euro. Similarly, the reported U.S. Dollar results of our Asia Pacific segment, where the functional currencies are primarily the Japanese Yen, Chinese Yuan, Korean Won and the
57
Singapore Dollar, are comparatively lower or higher when the U.S. Dollar strengthens or weakens, respectively, relative to these currencies.
An increase of 1% of the value of the U.S. Dollar relative to foreign currencies would have increased our loss before taxes during the year ended December 31, 2016 by approximately $0.8 million. The volatility of the exchange rates is dependent on many factors that cannot be forecasted with reliable accuracy. See Item 7. Management's Discussion and Analysis of Financial Condition and Results of Operations in Part II of this Form 10-K for a discussion of the impact of the change in foreign exchange rates on our U.S Dollar consolidated statement of operations for the years ended December 31, 2016 and 2015.
58
ITEM 8. Financial Statements and Supplementary Data
The consolidated financial statements and supplementary data are as set forth in the index to consolidated financial statements on page F-1.
59
ITEM 9. Changes in and Disagreements with Accountants on Accounting and Financial Disclosure
None.
60
ITEM 9A. Controls and Procedures
Evaluation of Disclosure Controls and Procedures
Under the supervision and with the participation of our management, including our Chief Executive Officer and Chief Financial Officer, we conducted an evaluation of our disclosure controls and procedures as such item is defined under Rule 13a-15(e) under the Securities Exchange Act of 1934, as amended ("Exchange Act"). Based on this evaluation, our Chief Executive Officer and Chief Financial Officer concluded that our disclosure controls and procedures were effective as of December 31, 2016, to provide reasonable assurance that information required to be disclosed in our reports under the Exchange Act is recorded, processed, summarized and reported within the time periods specified in the SEC rules and forms and that such information is accumulated and communicated to our management, including our Chief Executive Officer and Chief Financial Officer, as appropriate, to allow timely decisions regarding required disclosure. Management necessarily applies its judgment in assessing the costs and benefits of such controls and procedures that, by their nature, can only provide reasonable assurance regarding management's control objectives.
Management's Annual Report on Internal Control over Financial Reporting
Our management is responsible for establishing and maintaining effective internal control over financial reporting as such term is defined in Exchange Act Rule 13a-15(f). Our internal control over financial reporting is a process designed to provide reasonable assurance regarding the reliability of financial reporting and the preparation of financial statements for external purposes in accordance with U.S. generally accepted accounting principles. A company's internal control over financial reporting includes those policies and procedures that (i) pertain to the maintenance of records that, in reasonable detail, accurately and fairly reflect the transactions and dispositions of the assets of the company; (ii) provide reasonable assurance that transactions are recorded as necessary to permit preparation of financial statements in accordance with generally accepted accounting principles, and that receipts and expenditures of the company are being made only in accordance with authorizations of management and directors of the company; and (iii) provide reasonable assurance regarding prevention or timely detection of unauthorized acquisition, use, or disposition of the company's assets that could have a material effect on the financial statements.
Because of the inherent limitations, internal control over financial reporting may not prevent or detect misstatements. Also, projections of any evaluation of effectiveness to future periods are subject to the risk that controls may become ineffective due to changes in conditions, or that the degree of compliance with the policies or procedures may deteriorate. Our Chief Executive Officer and Chief Financial Officer, with assistance from other members of management, assessed the effectiveness of our internal control over financial reporting as of December 31, 2016, based on the framework and criteria established in Internal Control—Integrated Framework issued by the Committee of Sponsoring Organizations of the Treadway Commission. Based on its evaluation, management has concluded that our internal control over financial reporting was effective as of December 31, 2016.
Our independent registered public accounting firm has audited the effectiveness of our internal control over financial reporting as of December 31, 2016, as stated in the report which appears herein.
Changes in Internal Controls over Financial Reporting
During 2016, the Company completed a number of initiatives designed to remediate certain material weaknesses with respect to internal controls over the Company's financial close process and inventory. Specifically, management completed the following with respect to its internal controls.
Financial Close Process.
The Company implemented internal control procedures over the financial close process, including: (i) added internal control review and documentation procedures that ensure that all manual journal entries, including deferred income tax and period end adjusting entries, are properly documented and reviewed by competent personnel; (ii) global account reconciliation procedures that ensure all key accounts are properly reconciled on a timely basis, documented and reviewed by competent personnel; (iii) hired personnel with the requisite skills in income taxes and accounting; (iv) improved the organizational structure of our tax and accounting departments; and (v) provided training to global accounting process owners on policies and controls over account analysis, documentation, review, and approval of manual journal entries, and data integrity procedures.
Inventory Accounting Controls.
The Company implemented internal control procedures over inventory accounting controls, including: (i) additional procedures to ensure all inventory physical observations and counts are performed timely, all resulting adjustments are recorded and appropriately documented in our inventory management system; (ii) additional inventory reconciliation procedures to ensure our inventory management system is appropriately reconciled to the general ledger on a regular basis; (iii) improvements to our analysis
61
of inventory cost absorption to ensure the proper valuation; (iv) provided training to our supply chain personnel to ensure appropriate understanding of our inventory policies and procedures including the importance of timely and accurate recording; and (v) hired additional personnel to our inventory management team to implement and maintain our inventory accounting controls.
As described above in “Management’s Annual Report on Internal Control Over Financial Reporting”, the Company concluded that its internal control over financial reporting was effective as of December 31, 2016 based, in part, on the effectiveness of the changed and new controls implemented during 2016 as described above.
Other than the changes described above, there have been no changes in our internal controls over financial reporting (as defined in Rule 13(a)-15(f) of the Exchange Act) during the year ended December 31, 2016 that have materially affected, or are reasonably likely to materially affect, our internal controls over financial reporting.
62
ITEM 9B. Other Information
None.
63
REPORT OF INDEPENDENT REGISTERED PUBLIC ACCOUNTING FIRM
To the Board of Directors and Stockholders of
Crocs, Inc.
Niwot, Colorado
We have audited the internal control over financial reporting of Crocs, Inc. and subsidiaries (the "Company") as of December 31, 2016, based on criteria established in Internal Control - Integrated Framework (2013) issued by the Committee of Sponsoring Organizations of the Treadway Commission. The Company's management is responsible for maintaining effective internal control over financial reporting and for its assessment of the effectiveness of internal control over financial reporting, included in the accompanying “Management's Report on Internal Control Over Financial Reporting”. Our responsibility is to express an opinion on the Company's internal control over financial reporting based on our audit.
We conducted our audit in accordance with the standards of the Public Company Accounting Oversight Board (United States). Those standards require that we plan and perform the audit to obtain reasonable assurance about whether effective internal control over financial reporting was maintained in all material respects. Our audit included obtaining an understanding of internal control over financial reporting, assessing the risk that a material weakness exists, testing and evaluating the design and operating effectiveness of internal control based on the assessed risk, and performing such other procedures as we considered necessary in the circumstances. We believe that our audit provides a reasonable basis for our opinion.
A company's internal control over financial reporting is a process designed by, or under the supervision of, the company's principal executive and principal financial officers, or persons performing similar functions, and effected by the company's board of directors, management, and other personnel to provide reasonable assurance regarding the reliability of financial reporting and the preparation of financial statements for external purposes in accordance with generally accepted accounting principles. A company's internal control over financial reporting includes those policies and procedures that (1) pertain to the maintenance of records that, in reasonable detail, accurately and fairly reflect the transactions and dispositions of the assets of the company; (2) provide reasonable assurance that transactions are recorded as necessary to permit preparation of financial statements in accordance with generally accepted accounting principles, and that receipts and expenditures of the company are being made only in accordance with authorizations of management and directors of the company; and (3) provide reasonable assurance regarding prevention or timely detection of unauthorized acquisition, use, or disposition of the company's assets that could have a material effect on the financial statements.
Because of the inherent limitations of internal control over financial reporting, including the possibility of collusion or improper management override of controls, material misstatements due to error or fraud may not be prevented or detected on a timely basis. Also, projections of any evaluation of the effectiveness of the internal control over financial reporting to future periods are subject to the risk that the controls may become inadequate because of changes in conditions, or that the degree of compliance with the policies or procedures may deteriorate.
In our opinion, the Company maintained, in all material respects, effective internal control over financial reporting as of December 31, 2016, based on the criteria established in Internal Control - Integrated Framework (2013) issued by the Committee of Sponsoring Organizations of the Treadway Commission.
We have also audited, in accordance with the standards of the Public Company Accounting Oversight Board (United States), the consolidated financial statements as of and for the year ended December 31, 2016 of the Company and our report dated March 1, 2017 expressed an unqualified opinion on those financial statements and included an explanatory paragraph regarding a change in the method of accounting for share-based payments due to the adoption of Accounting Standards Update (ASU) 2016-09, Improvements to Employee Share-Based Payment Accounting.
/s/ DELOITTE & TOUCHE LLP
Denver, CO
March 1, 2017
64
PART III
ITEM 10. Directors, Executive Officers and Corporate Governance
The information required by this item is incorporated herein by reference to our definitive proxy statement for the 2017 Annual Meeting of Stockholders to be filed with the SEC within 120 days after December 31, 2016.
Code of Ethics
We have a written code of ethics in place that applies to all our employees, including our principal executive officer, principal financial officer, principal accounting officer and controller. A copy of our business code of conduct and ethics policy is available on our website: www.crocs.com. We are required to disclose certain changes to, or waivers from, our code of ethics for our senior financial officers. We intend to use our website as a method of disseminating any change to, or waiver from, our business code of conduct and ethics policy as permitted by applicable SEC rules.
ITEM 11. Executive Compensation
The information required by this item is incorporated herein by reference to our definitive proxy statement for the 2017 Annual Meeting of Stockholders to be filed with the SEC within 120 days after December 31, 2016.
ITEM 12. Security Ownership of Certain Beneficial Owners and Management and Related Stockholder Matters
The information required by this item is incorporated herein by reference to our definitive proxy statement for the 2017 Annual Meeting of Stockholders to be filed with the SEC within 120 days after December 31, 2016, with the exception of those items listed below.
Securities Authorized for Issuance under Equity Compensation Plans
As shown in the table below, we reserved 3.8 million shares of common stock for future issuance pursuant to exercise of outstanding awards under equity compensation plans as of December 31, 2016.
Plan Category | Number of Securities to be Issued on Exercise of Outstanding Options and Rights(3) | Weighted Average Exercise Price of Outstanding Options(2) | Number of Securities Remaining Available for Future Issuance Under Plans, Excluding Securities Available in First Column | ||||||
Equity compensation plans approved by stockholders(1) | 3,750,449 | $ | 16.90 | 6,720,218 | |||||
Equity compensation plans not approved by stockholders | — | — | — | ||||||
Total | 3,750,449 | $ | 16.90 | 6,720,218 | |||||
_______________________________________________________________________________
(1) | On June 8, 2015, the Company's stockholders approved the Crocs, Inc. 2015 Equity Incentive Plan (the "Plan"). The number of shares available for issuance under the Plan (subject to changes in capitalization) consist of (i) 7.0 million newly available shares; (ii) 1.2 million shares available for issuance under the 2007 Plan as of June 8, 2015; and (iii) 2007 Plan shares associated with outstanding options or awards that are canceled or forfeited after June 8, 2015. The Plan provides for the grant of incentive and non-qualified stock options, stock appreciation rights, restricted stock, restricted stock units, performance units, and other stock-based awards. The Plan replaces the Company's 2007 Equity Incentive Plan (As Amended and Restated), and no further awards will be made under the 2007 Plan. The Plan became effective immediately upon stockholder approval. |
(2) | The weighted-average exercise price of outstanding options pertains only to 0.5 million shares issuable on the exercise of outstanding options and rights. |
(3) | At target performance. |
65
ITEM 13. Certain Relationships and Related Transactions and Director Independence
The information required by this item is incorporated herein by reference to our definitive proxy statement for the 2017 Annual Meeting of Stockholders to be filed with the SEC within 120 days after December 31, 2016.
ITEM 14. Principal Accountant Fees and Services
The information required by this item is incorporated herein by reference to our definitive proxy statement for the 2017 Annual Meeting of Stockholders to be filed with the SEC within 120 days after December 31, 2016.
PART IV
ITEM 15. Exhibits and Financial Statement Schedules
(1) Financial Statements
The financial statements filed as part of this report are listed on the index to the consolidated financial statements on page F-1.
(2) Financial Statement Schedules
All financial statement schedules have been omitted because they are not required, are not applicable or the information is included in the consolidated financial statements or notes thereto.
66
(3) Exhibit list
Exhibit Number | Description | ||
3.1 | Restated Certificate of Incorporation of Crocs, Inc. (incorporated herein by reference to Exhibit 4.1 to Crocs, Inc.'s Registration Statement on Form S-8, filed on March 9, 2006 (File No. 333-132312)). | ||
3.2 | Certificate of Amendment to Restated Certificate of Incorporation of Crocs, Inc. (incorporated herein by reference to Exhibit 3.1 to Crocs, Inc.'s Current Report on Form 8-K, filed on July 12, 2007). | ||
3.3 | Amended and Restated Bylaws of Crocs, Inc. (incorporated herein by reference to Exhibit 4.2 to Crocs, Inc.'s Registration Statement on Form S-8, filed on March 9, 2006 (File No. 333-132312)). | ||
3.4 | Certificate of Designations of Series A Convertible Preferred Stock of Crocs, Inc. (incorporated herein by reference to Exhibit 3.1 to Crocs, Inc.'s Current Report on Form 8-K, filed on January 27, 2014). | ||
4.1 | Specimen Common Stock Certificate (incorporated herein by reference to Exhibit 4.2 to Crocs, Inc.'s Registration Statement on Form S-1/A, filed on January 19, 2006 (File No. 333-127526)). | ||
10.1 | * | Form of Indemnification Agreement between Crocs, Inc. and each of its directors and executive officers (incorporated herein by reference to Exhibit 10.1 to Crocs, Inc.'s Registration Statement on Form S-1, filed on August 15, 2005 (File No. 333-127526)). | |
10.2 | * | Crocs, Inc. 2005 Equity Incentive Plan (the "2005 Plan") (incorporated herein by reference to Exhibit 10.2 to Crocs, Inc.'s Registration Statement on Form S-1, filed on August 15, 2005 (File No. 333-127526) ). | |
10.3 | * | Amendment No. 1 to the 2005 Plan (incorporated herein by reference to Exhibit 10.2.2 to Crocs, Inc.'s Registration Statement on Form S-1/A, filed on January 19, 2006 (File No. 333-127526)). | |
10.4 | * | Form of Notice of Grant of Stock Option under the 2005 Plan (incorporated herein by reference to Exhibit 10.3 to Crocs, Inc.'s Registration Statement on Form S-1, filed on August 15, 2005 (File No. 333-127526)). | |
10.5 | * | Form of Notice of Grant of Stock Option for Non-Exempt Employees under the 2005 Plan (incorporated herein by reference to Exhibit 10.4 to Crocs, Inc.'s Registration Statement on Form S-1, filed on August 15, 2005 (File No. 333-127526)). | |
10.6 | * | Form of Stock Purchase Agreement under the 2005 Plan (incorporated herein by reference to Exhibit 10.5 to Crocs, Inc.'s Registration Statement on Form S-1, filed on August 15, 2005 (File No. 333-127526)). | |
10.7 | * | Form of Stock Option Agreement under the 2005 Plan (incorporated herein by reference to Exhibit 10.6 to Crocs, Inc.'s Registration Statement on Form S-1, filed on August 15, 2005 (File No. 333-127526)). | |
10.8 | * | Form of Restricted Stock Award Grant Notice under the 2005 Plan (incorporated herein by reference to Exhibit 10.7 to Crocs, Inc.'s Registration Statement on Form S-1, filed on August 15, 2005 (File No. 333-127526) ). | |
10.9 | * | Form of Restricted Stock Award Agreement under the 2005 Plan (incorporated herein by reference to Exhibit 10.8 to Crocs, Inc.'s Registration Statement on Form S-1, filed on August 15, 2005 (File No. 333-127526)). | |
10.10 | * | Form of Non Statutory Stock Option Agreement under the 2005 Plan (incorporated herein by reference to Exhibit 10.9 to Crocs, Inc.'s Registration Statement on Form S-1, filed on August 15, 2005 (File No. 333-127526) ). | |
10.11 | * | Crocs, Inc. Amended and Restated 2007 Senior Executive Deferred Compensation Plan (incorporated herein by reference to Exhibit 10.15 to Crocs, Inc.'s Annual Report on Form 10-K, filed on March 17, 2009). | |
67
Exhibit Number | Description | ||
10.12 | * | Crocs, Inc. 2007 Equity Incentive Plan (As Amended and Restated) (the "2007 Plan") (incorporated herein by reference to Exhibit 10.1 to Crocs, Inc.'s Current Report on Form 8-K, filed on July 1, 2011). | |
10.13 | * | Form of Incentive Stock Option Agreement under the 2007 Plan (incorporated herein by reference to Exhibit 10.1 to Crocs, Inc.'s Quarterly Report on Form 10-Q, filed on November 14, 2007). | |
10.14 | * | Form of Non-Statutory Option Agreement under the 2007 Plan (incorporated herein by reference to Exhibit 10.2 to Crocs, Inc.'s Quarterly Report on Form 10-Q, filed on November 14, 2007). | |
10.15 | * | Form of Non-Statutory Stock Option Agreement for Non-Employee Directors under the 2007 Plan (incorporated herein by reference to Exhibit 10.3 to Crocs, Inc.'s Quarterly Report on Form 10-Q, filed on November 14, 2007). | |
10.16 | * | Form of Restricted Stock Option Agreement under the 2007 Plan (incorporated herein by reference to Exhibit 10.2 to Crocs, Inc.'s Quarterly Report on Form 10-Q, filed on November 14, 2007). | |
10.17 | * | 2008 Cash Incentive Plan (As Amended and Restated Effective June 4, 2012) (incorporated herein by reference to Exhibit 10.1 to Crocs, Inc.'s Current Report on Form 8-K, filed on June 7, 2012). | |
10.18 | * | Crocs, Inc. 2015 Equity Incentive Plan (incorporated by reference to Exhibit 10.1 to Crocs, Inc.'s Current Report on Form 8-K, filed on June 9, 2015). | |
10.19 | Amended and Restated Credit Agreement, dated December 16, 2011, among Crocs, Inc., Crocs Retail, Inc., Ocean Minded, Inc., Jibbitz, LLC, Bite, Inc., the lenders named therein and PNC Bank, National Association, as a lender and administrative agent for the lenders (the "Amended and Restated Credit Agreement") (incorporated herein by reference to Crocs, Inc.'s Current Report on Form 8-K, filed on December 19, 2011). | ||
10.20 | First Amendment to the Amended and Restated Credit Agreement, dated December 10, 2012, among Crocs, Inc., Crocs Retail, Inc., Ocean Minded, Inc., Jibbitz, LLC, Bite, Inc., the lenders named therein and PNC Bank, National Association, as a lender and administrative agent (incorporated herein by reference to Crocs, Inc.'s Current Report on Form 8-K, filed on December 11, 2012). | ||
10.21 | Second Amendment to Amended and Restated Credit Agreement, dated June 12, 2013, among Crocs, Inc., Crocs Retail, Inc., Ocean Minded, Inc., Jibbitz, LLC, Bite, Inc., the lenders named therein and PNC Bank, National Association, as a lender and administrative agent (incorporated herein by reference to Exhibit 10.2 to Crocs, Inc.'s Quarterly Report on Form 10-Q, filed on July 30, 2013). | ||
10.22 | Third Amendment to Amended and Restated Credit Agreement, dated December 27, 2013, among Crocs, Inc., Crocs Retail, Inc., Ocean Minded, Inc., Jibbitz, LLC, Bite, Inc., the lenders named therein and PNC Bank, National Association, as a lender and administrative agent (incorporated herein by reference to Exhibit 10.1 to Crocs, Inc.'s Current Report on Form 8-K, filed on December 30, 2013). | ||
10.23 | Fourth Amendment to Amended and Restated Credit Agreement, dated March 27, 2014, among Crocs, Inc., Crocs Retail, Inc., Ocean Minded, Inc., Jibbitz, LLC, Bite, Inc., the lenders named therein and PNC Bank, National Association, as a lender and administrative agent (incorporated herein by reference to Exhibit 10.2 to Crocs, Inc.'s Quarterly Report on Form 10-Q, filed on May 1, 2014). | ||
10.24 | Fifth Amendment to Amended and Restated Credit Agreement, dated September 26, 2014, among Crocs, Inc., Crocs Retail, Inc., Ocean Minded, Inc., Jibbitz, LLC, Bite, Inc., the lenders named therein and PNC Bank, National Association, as a lender and administrative agent (incorporated herein by reference to Exhibit 10.2 to Crocs, Inc.'s Quarterly Report on Form 10-Q, filed on October 29, 2014) | ||
10.25 | Sixth Amendment to Amended and Restated Credit Agreement, dated April 2, 2015, among Crocs, Inc., Crocs Retail, LLC, Ocean Minded, Inc., Jibbitz, LLC, Bite, Inc., the lenders named therein, and PNC Bank, National Association, as a lender and administrative agent (incorporated herein by reference to Exhibit 10.1 to Crocs, Inc.'s Quarterly Report on Form 10-Q, filed on August 7, 2015). | ||
68
Exhibit Number | Description | ||
10.26 | Seventh Amendment to Amended and Restated Credit Agreement, dated April 21, 2015, among Crocs, Inc., Crocs Retail, LLC, Ocean Minded, Inc., Jibbitz, LLC, Bite, Inc., the lenders named therein, and PNC Bank, National Association, as a lender and administrative agent (incorporated herein by reference to Exhibit 10.2 to Crocs, Inc.'s Quarterly Report on Form 10-Q, filed on August 7, 2015). | ||
10.27 | Eighth Amendment to Amended and Restated Credit Agreement, dated September 1, 2015, among Crocs, Inc., Crocs Retail, LLC, Ocean Minded, Inc., Jibbitz, LLC, Bite, Inc., the lenders named therein, and PNC Bank, National Association, as a lender and administrative agent (incorporated herein by reference to Exhibit 10.1 to Crocs, Inc.'s Quarterly Report on Form 10-Q, filed on November 9, 2015). | ||
10.28 | Ninth Amendment to Amended and Restated Credit Agreement, dated November 3, 2015, among Crocs, Inc., Crocs Retail, LLC, Ocean Minded, Inc., Jibbitz, LLC, Bite, Inc., the lenders named therein, and PNC Bank, National Association, as a lender and administrative agent (incorporated herein by reference to Exhibit 10.2 to Crocs, Inc.'s Quarterly Report on Form 10-Q, filed on November 9, 2015). | ||
10.29 | Tenth Amendment to Amended and Restated Credit Agreement, dated December 24, 2015, among Crocs, Inc., Crocs Retail, LLC, Ocean Minded, Inc., Jibbitz, LLC, Bite, Inc., the lenders named therein, and PNC Bank, National Association, as a lender and administrative agent (incorporated herein by reference to Exhibit 10.30 to Crocs, Inc.'s Annual Report on Form 10-K, filed February 29, 2016).. | ||
10.30 | Eleventh Amendment to Amended and Restated Credit Agreement, dated February 18, 2016, among Crocs, Inc., Crocs Retail, LLC, Ocean Minded, Inc., Jibbitz, LLC, Bite, Inc., and PNC Bank, National Association, as a lender and administrative agent. (incorporated herein by reference to Exhibit 10.1 to Crocs Inc.'s Quarterly Report on Form 10-Q, filed on August 5, 2016). | ||
10.31 | Twelfth Amendment to Amended and Restated Credit Agreement, dated June 13, 2016, among Crocs, Inc., Crocs Retail, LLC, Ocean Minded, Inc., Jibbitz, LLC, Bite, Inc., the lenders named therein, and PNC Bank, National Association, as a lender and administrative agent (incorporated herein by reference to Exhibit 10.1 to Crocs, Inc.'s Quarterly Report on Form 10-Q, filed on August 5, 2016). | ||
10.32 | † | Thirteenth Amendment to Amended and Restated Credit Agreement, dated November 22, 2016, among Crocs, Inc., Crocs Retail, LLC, Ocean Minded, Inc., Jibbitz, LLC, Bite, Inc., the lenders named therein, and PNC Bank, National Association, as a lender and administrative agent. | |
10.33 | * | Crocs, Inc. Change of Control Plan (as Amended and Restated) (incorporated herein by reference to Exhibit 10.1 to Crocs, Inc.'s Quarterly Report on Form 10-Q, filed on May 1, 2014). | |
10.34 | Investment Agreement, dated December 28, 2013, between Crocs, Inc. and Blackstone Capital Partners VI L.P. (incorporated herein by reference to Exhibit 10.1 to Crocs, Inc.'s Current Report on Form 8-K, filed on December 30, 2013). | ||
10.35 | First Amendment to Investment Agreement, dated January 27, 2014, between Crocs, Inc. and Blackstone Capital Partners VI L.P. (incorporated herein by reference to Exhibit 10.1 to Crocs, Inc.'s Current Report on Form 8-K, filed on January 27, 2014). | ||
10.36 | * | Form of Severance Agreement (incorporated herein by reference to Exhibit 10.1 to Crocs, Inc.'s Quarterly Report on Form 10-Q, filed on July 30, 2014). | |
10.37 | Registration Rights Agreement, dated January 27, 2014 (incorporated herein by reference to Exhibit 10.2 to Crocs, Inc.'s Current Report on Form 8-K, filed on January 27, 2014). | ||
10.38 | * | Employment Agreement, dated May 18, 2009, between Crocs, Inc. and Daniel P. Hart (incorporated herein by reference to Exhibit 10.1 to Crocs, Inc.'s Quarterly Report on Form 10-Q, filed on August 5, 2010). | |
69
Exhibit Number | Description | ||
10.39 | * | Employment Offer Letter, dated May 13, 2014, between Crocs, Inc. and Andrew Rees (incorporated herein by reference to Exhibit 10.1 to Crocs, Inc.'s Current Report on Form 8-K, filed on May 14, 2014). | |
10.40 | * | Employment Offer Letter, dated December 15, 2014, between Crocs, Inc. and Gregg Ribatt (incorporated herein by reference to Exhibit 10.1 to Crocs, Inc.'s Current Report on Form 8-K, filed on December 15, 2014). | |
10.41 | * | Employment Offer Letter, dated November 4, 2015, between Crocs, Inc. and Carrie Teffner (incorporated herein by reference to Exhibit 10.1 to Crocs, Inc.'s Current Report on Form 8-K, filed on November 5, 2015). | |
21 | † | Subsidiaries of the registrant. | |
23.1 | † | Consent of Deloitte & Touche LLP. | |
31.1 | † | Certification of the Chief Executive Officer pursuant to Rule 13a-14(a) or Rule 15d-14(a) of the Securities Exchange Act of 1934 as adopted pursuant to Section 302 of the Sarbanes-Oxley Act. | |
31.2 | † | Certification of the Chief Financial Officer pursuant to Rule 13a-14(a) or Rule 15d-14(a) of the Securities Exchange Act of 1934 as adopted pursuant to Section 302 of the Sarbanes- Oxley Act. | |
32 | † | Certification of the Chief Executive Officer and Chief Financial Officer pursuant to 18 U.S.C. Section 1350 as adopted pursuant to Section 906 of the Sarbanes-Oxley Act. | |
101.INS | † | XBRL Instance Document | |
101.SCH | † | XBRL Taxonomy Extension Schema Document | |
101.CAL | † | XBRL Taxonomy Extension Calculation Linkbase Document | |
101.DEF | † | XBRL Taxonomy Extension Definition Linkbase Document | |
101.LAB | † | XBRL Taxonomy Extension Label Linkbase Document | |
101.PRE | † | XBRL Taxonomy Extension Presentation Linkbase Document | |
_______________________________________________________________________________
* | Compensatory plan or arrangement. |
† | Filed herewith. |
70
Item 16. Form 10–K Summary.
None.
71
SIGNATURES
Pursuant to the requirements of Section 13 or 15(d) of the Securities Exchange Act of 1934, the registrant has duly caused this report to be signed on its behalf by the undersigned, thereunto duly authorized, as of March 1, 2017.
CROCS, INC. a Delaware Corporation | |||
By: | /s/ GREGG S. RIBATT | ||
Name: | Gregg S. Ribatt | ||
Title: | Chief Executive Officer | ||
Pursuant to the requirements of the Securities Exchange Act of 1934, this report has been signed below by the following persons on behalf of the registrant and in the capacities and on the dates indicated.
Signature | Title | Date | ||
/s/ GREGG S. RIBATT | Chief Executive Officer and Director (Principal Executive Officer) | March 1, 2017 | ||
Gregg S. Ribatt | ||||
/s/ CARRIE W. TEFFNER | Executive Vice President and Chief Financial Officer (Principal Financial and Accounting Officer) | March 1, 2017 | ||
Carrie W. Teffner | ||||
/s/ IAN M. BICKLEY | Director | March 1, 2017 | ||
Ian M. Bickley | ||||
/s/ RONALD L. FRASCH | Director | March 1, 2017 | ||
Ronald L. Frasch | ||||
/s/ JASON K. GIORDANO | Director | March 1, 2017 | ||
Jason K. Giordano | ||||
/s/ PRAKASH A. MELWANI | Director | March 1, 2017 | ||
Prakash A. Melwani | ||||
/s/ THOMAS J. SMACH | Chairman of the Board | March 1, 2017 | ||
Thomas J. Smach | ||||
/s/ DOUGLAS J TREFF | Director | March 1, 2017 | ||
Douglas J. Treff | ||||
/s/ DOREEN A. WRIGHT | Director | March 1, 2017 | ||
Doreen A. Wright | ||||
72
INDEX TO THE CONSOLIDATED FINANCIAL STATEMENTS
Financial Statements: | |
Report of Independent Registered Public Accounting Firm | |
Consolidated Statements of Operations for the Years Ended December 31, 2016, 2015, and 2014 | |
Consolidated Statements of Comprehensive Loss for the Years Ended December 31, 2016, 2015, and 2014 | |
Consolidated Balance Sheets as of December 31, 2016 and 2015 | |
Consolidated Statements of Stockholders' Equity for the Years Ended December 31, 2016, 2015, and 2014 | |
Consolidated Statements of Cash Flows for the Years Ended December 31, 2016, 2015, and 2014 | |
Notes to Consolidated Financial Statements | |
F-1
REPORT OF INDEPENDENT REGISTERED PUBLIC ACCOUNTING FIRM
To the Board of Directors and Stockholders of
Crocs, Inc.
Niwot, Colorado
We have audited the accompanying consolidated balance sheets of Crocs, Inc. and subsidiaries (the "Company") as of December 31, 2016 and 2015, and the related consolidated statements of operations, comprehensive loss, stockholders' equity, and cash flows for each of the three years in the period ended December 31, 2016. These financial statements are the responsibility of the Company's management. Our responsibility is to express an opinion on these financial statements based on our audits.
We conducted our audits in accordance with the standards of the Public Company Accounting Oversight Board (United States). Those standards require that we plan and perform the audit to obtain reasonable assurance about whether the financial statements are free of material misstatement. An audit includes examining, on a test basis, evidence supporting the amounts and disclosures in the financial statements. An audit also includes assessing the accounting principles used and significant estimates made by management, as well as evaluating the overall financial statement presentation. We believe that our audits provide a reasonable basis for our opinion.
In our opinion, such consolidated financial statements present fairly, in all material respects, the financial position of Crocs, Inc. and subsidiaries as of December 31, 2016 and 2015, and the results of their operations and their cash flows for each of the three years in the period ended December 31, 2016, in conformity with accounting principles generally accepted in the United States of America.
As discussed in Note 2 to the consolidated financial statements, the Company has changed its method of accounting for share-based payments for the year ended December 31, 2016 due to the adoption of Accounting Standards Update (ASU) 2016-09, Improvements to Employee Share-Based Payment Accounting.
We have also audited, in accordance with the standards of the Public Company Accounting Oversight Board (United States), the Company's internal control over financial reporting as of December 31, 2016, based on the criteria established in Internal Control - Integrated Framework (2013) issued by the Committee of Sponsoring Organizations of the Treadway Commission and our report dated March 1, 2017 expressed an unqualified opinion on the Company's internal control over financial reporting.
/s/ DELOITTE & TOUCHE LLP
Denver, Colorado
March 1, 2017
F-2
CROCS, INC. AND SUBSIDIARIES
CONSOLIDATED STATEMENTS OF OPERATIONS
(in thousands, except per share data)
Year Ended December 31, | |||||||||||
2016 | 2015 | 2014 | |||||||||
Revenues | $ | 1,036,273 | $ | 1,090,630 | $ | 1,198,223 | |||||
Cost of sales | 536,109 | 579,825 | 603,893 | ||||||||
Restructuring charges | — | — | 3,985 | ||||||||
Gross profit | 500,164 | 510,805 | 590,345 | ||||||||
Selling, general and administrative expenses | 503,174 | 559,095 | 565,712 | ||||||||
Restructuring charges | — | 8,728 | 20,532 | ||||||||
Asset impairments | 3,144 | 15,306 | 8,827 | ||||||||
Loss from operations | (6,154 | ) | (72,324 | ) | (4,726 | ) | |||||
Foreign currency loss, net | (2,454 | ) | (3,332 | ) | (4,885 | ) | |||||
Interest income | 692 | 967 | 1,664 | ||||||||
Interest expense | (836 | ) | (969 | ) | (806 | ) | |||||
Other income, net | 1,539 | 914 | 204 | ||||||||
Loss before income taxes | (7,213 | ) | (74,744 | ) | (8,549 | ) | |||||
Income tax (expense) benefit | (9,281 | ) | (8,452 | ) | 3,623 | ||||||
Net loss | (16,494 | ) | (83,196 | ) | (4,926 | ) | |||||
Dividends on Series A convertible preferred stock | (12,000 | ) | (11,833 | ) | (11,301 | ) | |||||
Dividend equivalents on Series A convertible preferred shares related to redemption value accretion and beneficial conversion feature | (3,244 | ) | (2,978 | ) | (2,735 | ) | |||||
Net loss attributable to common stockholders | $ | (31,738 | ) | $ | (98,007 | ) | $ | (18,962 | ) | ||
Net loss per common share | |||||||||||
Basic | $ | (0.43 | ) | $ | (1.30 | ) | $ | (0.22 | ) | ||
Diluted | $ | (0.43 | ) | $ | (1.30 | ) | $ | (0.22 | ) | ||
The accompanying notes are an integral part of these consolidated financial statements.
F-3
CROCS, INC. AND SUBSIDIARIES
CONSOLIDATED STATEMENTS OF COMPREHENSIVE LOSS
(in thousands)
Year Ended December 31, | |||||||||||
2016 | 2015 | 2014 | |||||||||
Net loss | $ | (16,494 | ) | $ | (83,196 | ) | $ | (4,926 | ) | ||
Other comprehensive loss: | |||||||||||
Foreign currency translation loss, net | (4,683 | ) | (32,561 | ) | (33,004 | ) | |||||
Total comprehensive loss | $ | (21,177 | ) | $ | (115,757 | ) | $ | (37,930 | ) | ||
The accompanying notes are an integral part of these consolidated financial statements.
F-4
CROCS, INC. AND SUBSIDIARIES
CONSOLIDATED BALANCE SHEETS
(in thousands, except par value)
December 31, | |||||||
2016 | 2015 | ||||||
ASSETS | |||||||
Current assets: | |||||||
Cash and cash equivalents | $ | 147,565 | $ | 143,341 | |||
Accounts receivable, net of allowances of $48,138 and $49,364, respectively | 78,297 | 83,616 | |||||
Inventories | 147,029 | 168,192 | |||||
Income tax receivable | 2,995 | 10,233 | |||||
Other receivables | 14,642 | 14,233 | |||||
Restricted cash - current | 2,534 | 2,554 | |||||
Prepaid expenses and other assets | 32,413 | 23,780 | |||||
Total current assets | 425,475 | 445,949 | |||||
Property and equipment, net | 44,090 | 49,490 | |||||
Intangible assets, net | 72,700 | 82,297 | |||||
Goodwill | 1,480 | 1,973 | |||||
Deferred taxes, net | 6,825 | 6,608 | |||||
Restricted cash | 2,547 | 3,551 | |||||
Other assets | 13,273 | 18,152 | |||||
Total assets | $ | 566,390 | $ | 608,020 | |||
LIABILITIES AND STOCKHOLDERS' EQUITY | |||||||
Current liabilities: | |||||||
Accounts payable | $ | 61,927 | $ | 63,336 | |||
Accrued expenses and other liabilities | 78,282 | 92,573 | |||||
Income taxes payable | 6,593 | 6,416 | |||||
Current portion of long-term borrowings and capital lease obligations | 2,338 | 4,772 | |||||
Total current liabilities | 149,140 | 167,097 | |||||
Long-term income tax payable | 4,464 | 4,547 | |||||
Long-term borrowings and capital lease obligations | 40 | 1,627 | |||||
Other liabilities | 13,462 | 13,120 | |||||
Total liabilities | 167,106 | 186,391 | |||||
Commitments and contingencies | |||||||
Series A convertible preferred stock, 1.0 million authorized, 0.2 million shares outstanding, liquidation preference $203 million | 178,901 | 175,657 | |||||
Stockholders' equity: | |||||||
Preferred stock, par value $0.001 per share, 4.0 million shares authorized, none outstanding | |||||||
Common stock, par value $0.001 per share, 93.9 million and 93.1 million issued, 73.6 million and 72.9 million shares outstanding, respectively | 94 | 94 | |||||
Treasury stock, at cost, 20.3 million and 20.2 million shares, respectively | (284,237 | ) | (283,913 | ) | |||
Additional paid-in capital | 364,397 | 353,241 | |||||
Retained earnings | 195,725 | 227,463 | |||||
Accumulated other comprehensive loss | (55,596 | ) | (50,913 | ) | |||
Total stockholders' equity | 220,383 | 245,972 | |||||
Total liabilities and stockholders' equity | $ | 566,390 | $ | 608,020 | |||
The accompanying notes are an integral part of these consolidated financial statements.
F-5
CROCS, INC. AND SUBSIDIARIES
CONSOLIDATED STATEMENTS OF STOCKHOLDERS' EQUITY
(in thousands)
Common Stock | Treasury Stock | Additional Paid in Capital | Retained Earnings | Accumulated Other Comprehensive (Loss) | Total Stock Holders' Equity | ||||||||||||||||||||||||
Shares | Amount | Shares | Amount | ||||||||||||||||||||||||||
Balance—December 31, 2013 | 88,450 | $ | 92 | 3,212 | $ | (55,964 | ) | $ | 321,532 | $ | 344,432 | $ | 14,652 | $ | 624,744 | ||||||||||||||
Share-based compensation | (144 | ) | — | — | — | 12,767 | — | — | 12,767 | ||||||||||||||||||||
Exercises of stock options and issuance of restricted stock awards | 800 | — | 7 | 1,398 | (843 | ) | — | — | 555 | ||||||||||||||||||||
Repurchases of common stock | (10,590 | ) | — | 10,590 | (145,858 | ) | — | — | — | (145,858 | ) | ||||||||||||||||||
Series A preferred dividends | — | — | — | — | — | (11,301 | ) | — | (11,301 | ) | |||||||||||||||||||
Series A preferred accretion | — | — | — | — | — | (2,735 | ) | — | (2,735 | ) | |||||||||||||||||||
Series A preferred beneficial conversion | — | — | — | — | 12,276 | — | — | 12,276 | |||||||||||||||||||||
Net loss | — | — | — | — | — | (4,926 | ) | — | (4,926 | ) | |||||||||||||||||||
Other comprehensive loss | — | — | — | — | — | — | (33,004 | ) | (33,004 | ) | |||||||||||||||||||
Balance—December 31, 2014 | 78,516 | $ | 92 | 13,809 | $ | (200,424 | ) | $ | 345,732 | $ | 325,470 | $ | (18,352 | ) | $ | 452,518 | |||||||||||||
Share-based compensation | — | — | — | — | 11,186 | — | — | 11,186 | |||||||||||||||||||||
Tax shortfall from share-based plans | — | — | — | — | (2,841 | ) | — | — | (2,841 | ) | |||||||||||||||||||
Exercises of stock options and issuance of restricted stock awards | 810 | 2 | (34 | ) | 2,437 | (836 | ) | — | — | 1,603 | |||||||||||||||||||
Repurchases of common stock | (6,475 | ) | — | 6,475 | (85,926 | ) | — | — | — | (85,926 | ) | ||||||||||||||||||
Series A preferred dividends | — | — | — | — | — | (11,833 | ) | — | (11,833 | ) | |||||||||||||||||||
Series A preferred accretion | — | — | — | — | — | (2,978 | ) | — | (2,978 | ) | |||||||||||||||||||
Net loss | — | — | — | — | — | (83,196 | ) | — | (83,196 | ) | |||||||||||||||||||
Other comprehensive loss | — | — | — | — | — | — | (32,561 | ) | (32,561 | ) | |||||||||||||||||||
Balance—December 31, 2015 | 72,851 | $ | 94 | 20,250 | $ | (283,913 | ) | $ | 353,241 | $ | 227,463 | $ | (50,913 | ) | $ | 245,972 | |||||||||||||
Share-based compensation | — | — | — | — | 10,736 | — | — | 10,736 | |||||||||||||||||||||
Exercises of stock options and issuance of restricted stock awards | 749 | — | 37 | (324 | ) | 420 | — | — | 96 | ||||||||||||||||||||
Series A preferred dividends | — | — | — | — | — | (12,000 | ) | — | (12,000 | ) | |||||||||||||||||||
Series A preferred accretion | — | — | — | — | — | (3,244 | ) | — | (3,244 | ) | |||||||||||||||||||
Net loss | — | — | — | — | — | (16,494 | ) | — | (16,494 | ) | |||||||||||||||||||
Other comprehensive loss | — | — | — | — | — | — | (4,683 | ) | (4,683 | ) | |||||||||||||||||||
Balance—December 31, 2016 | 73,600 | $ | 94 | 20,287 | $ | (284,237 | ) | $ | 364,397 | $ | 195,725 | $ | (55,596 | ) | $ | 220,383 | |||||||||||||
The accompanying notes are an integral part of these consolidated financial statements.
F-6
CROCS, INC. AND SUBSIDIARIES
CONSOLIDATED STATEMENTS OF CASH FLOWS
(in thousands)
December 31, | |||||||||||
2016 | 2015 | 2014 | |||||||||
Cash flows from operating activities: | |||||||||||
Net income (loss) | $ | (16,494 | ) | $ | (83,196 | ) | $ | (4,926 | ) | ||
Adjustments to reconcile net income to net cash provided by (used in) operating activities: | |||||||||||
Depreciation and amortization | 34,043 | 35,993 | 37,413 | ||||||||
Unrealized (gain) loss on foreign exchange, net | (9,027 | ) | (814 | ) | (11,100 | ) | |||||
Deferred income taxes | (388 | ) | 289 | 829 | |||||||
Asset impairment charges | 3,144 | 15,306 | 8,827 | ||||||||
Provision for doubtful accounts, net | 3,230 | 25,997 | 12,087 | ||||||||
Share-based compensation | 10,736 | 11,236 | 12,503 | ||||||||
Inventory write-down charges | — | 3,108 | 7,490 | ||||||||
Non-cash restructuring charges | — | — | 6,413 | ||||||||
Other non-cash items | 503 | 4,029 | 534 | ||||||||
Changes in operating assets and liabilities: | |||||||||||
Accounts receivable, net of allowances | 2,408 | (15,604 | ) | (15,288 | ) | ||||||
Inventories | 20,371 | (8,586 | ) | (31,251 | ) | ||||||
Prepaid expenses and other assets | (4,532 | ) | 1,755 | 21,698 | |||||||
Accounts payable | (1,354 | ) | 23,260 | (12,106 | ) | ||||||
Accrued expenses and other liabilities | 3,836 | 8,765 | (15,824 | ) | |||||||
Accrued restructuring | (952 | ) | (3,677 | ) | 4,859 | ||||||
Income taxes | (5,770 | ) | (8,163 | ) | (33,809 | ) | |||||
Cash provided by (used in) operating activities | 39,754 | 9,698 | (11,651 | ) | |||||||
Cash flows from investing activities: | |||||||||||
Cash paid for purchases of property and equipment | (13,233 | ) | (12,826 | ) | (15,991 | ) | |||||
Proceeds from disposal of property and equipment | 2,438 | (2 | ) | 236 | |||||||
Cash paid for intangible assets | (8,961 | ) | (5,660 | ) | (41,035 | ) | |||||
Change in restricted cash | 1,199 | (139 | ) | (1,202 | ) | ||||||
Other | (100 | ) | — | — | |||||||
Cash used in investing activities | (18,657 | ) | (18,627 | ) | (57,992 | ) | |||||
Cash flows from financing activities: | |||||||||||
Proceeds from preferred stock offering, net of issuance costs of $15.8 million | — | — | 182,220 | ||||||||
Dividends—Series A preferred stock | (12,000 | ) | (11,900 | ) | (8,234 | ) | |||||
Proceeds from bank borrowings | 31,582 | — | — | ||||||||
Repayment of bank borrowings and capital lease obligations | (35,640 | ) | (5,290 | ) | (5,177 | ) | |||||
Deferred debt issuance costs | (481 | ) | 191 | (75 | ) | ||||||
Issuances of common stock | 420 | 1,864 | 1,342 | ||||||||
Purchase of treasury stock, net of issuances | — | (85,926 | ) | (145,858 | ) | ||||||
Repurchase of common stock for tax withholding | (324 | ) | (261 | ) | (787 | ) | |||||
Excess tax benefit from share-based compensation | — | 62 | — | ||||||||
Cash provided by (used in) financing activities | (16,443 | ) | (101,260 | ) | 23,431 | ||||||
Effect of exchange rate changes on cash | (430 | ) | (13,982 | ) | (3,420 | ) | |||||
Net increase (decrease) in cash and cash equivalents | 4,224 | (124,171 | ) | (49,632 | ) | ||||||
Cash and cash equivalents—beginning of period | 143,341 | 267,512 | 317,144 | ||||||||
Cash and cash equivalents—end of period | $ | 147,565 | $ | 143,341 | $ | 267,512 | |||||
Supplemental disclosure of cash flow information—cash paid during the period for: | |||||||||||
Interest, net of capitalized interest | $ | 653 | $ | 917 | $ | 616 | |||||
Income taxes | 12,344 | 19,923 | 33,655 | ||||||||
Supplemental disclosure of non-cash investing and financing activities: | |||||||||||
Assets acquired under capitalized leases | 39 | 20 | — | ||||||||
Accrued purchases of property and equipment | 2,195 | 851 | 771 | ||||||||
Accrued purchases of intangibles | 533 | — | 2,988 | ||||||||
Intrinsic value of beneficial conversion feature—Series A preferred stock | — | — | 12,276 | ||||||||
Accrued dividends | 3,000 | 3,000 | 3,067 | ||||||||
Accretion of dividend equivalents | 3,244 | 2,978 | 2,735 | ||||||||
Change in assets held for sale | 2,428 | (1,595 | ) | — | |||||||
Vendor financed insurance premiums | 2,082 | — | — | ||||||||
The accompanying notes are an integral part of these consolidated financial statements.
F-7
CROCS, INC. AND SUBSIDIARIES
NOTES TO CONSOLIDATED FINANCIAL STATEMENTS
NOTES TO CONSOLIDATED FINANCIAL STATEMENTS
1. BASIS OF PRESENTATION & SUMMARY OF SIGNIFICANT ACCOUNTING POLICIES
Unless otherwise noted in this report, any description of "we," "us" or "our" includes Crocs, Inc. ("Crocs" or the "Company,") and its wholly-owned subsidiaries within our reportable operating segments and Corporate. The Company is engaged in the design, development, manufacturing, worldwide marketing and distribution of casual lifestyle footwear and accessories for men, women, and children. We strive to be the global leader in the sale of molded footwear featuring fun, comfort, color, and functionality. Our reportable operating segments include: the Americas, operating in North and South America; Asia Pacific, operating throughout Asia, Australia, New Zealand, Africa and the Middle East; and Europe, operating throughout Europe and Russia.
Basis of Presentation and Consolidation
The Company's consolidated financial statements include its accounts and those of its wholly-owned subsidiaries. The consolidated financial statements have been prepared in accordance with accounting principles generally accepted in the United States of America (“U.S. GAAP”). All intercompany accounts and transactions have been eliminated in consolidation.
Use of Estimates
Our consolidated financial statements are prepared in accordance with U.S. GAAP. These accounting principles require us to make certain estimates, judgments and assumptions. We believe that the estimates, judgments and assumptions used to determine certain amounts that affect the financial statements are reasonable, based on information available at the time they are made. Management believes that the estimates, judgments, and assumptions made when accounting for items and matters such as, but not limited to, the allowance for doubtful accounts, customer rebates, sales returns, impairment assessments and charges, recoverability of assets (including deferred tax assets), uncertain tax positions, share-based compensation expense, the assessment of lower of cost or market on inventory, useful lives assigned to long-lived assets, depreciation, and provisions for contingencies are reasonable based on information available at the time they are made. Management also makes estimates in the assessments of potential losses in relation to tax matters and threatened or pending legal proceedings (see Note 15 — Commitments and Contingencies and Note 17 — Legal Proceedings).To the extent there are differences between these estimates and actual results, our consolidated financial statements may be materially affected.
Reclassification Adjustments
The Company has reclassified certain amounts on the consolidated balance sheets, statements of stockholders' equity, Note 5 — Goodwill and Intangible Assets, Net, Note 6 — Accrued Expenses and Other Current Liabilities, and Note 8 — Derivative Instruments to conform to current period presentation.
Transactions with Affiliates
The Company receives inventory count services from RGIS, LLC (“RGIS”), a wholly owned subsidiary of Blackstone Capital Partners VI L.P. (“Blackstone”). Blackstone and certain of its permitted transferees currently beneficially owns all the outstanding shares of the Company’s series A convertible preferred stock (“Series A Preferred Stock”), which is convertible into approximately 15.8% of the Company’s common stock as of December 31, 2016. Two Blackstone representatives also serve on the Company’s board of directors (the “Board”). During 2016 and 2015 the Company paid $0.4 million and $0.5 million, respectively, to RGIS for services. Expenses related to these services provided are reported in ‘Selling, general and administrative expenses’ in the consolidated statement of operations.
The Company receives cyber security and consulting services from Optiv, Inc. ("Optiv"), a subsidiary of Blackstone. The Company also receives workforce management services from Kronos Incorporated ("Kronos"), a subsidiary of Blackstone. During 2016 and 2015, the Company paid $0.2 million in each year to Kronos, and $0.2 million in each year to Optiv for services. Expenses related to these services are reported in ‘Selling, general and administrative expenses’ in the consolidated statement of operations.
Revenue Recognition
Revenue is recognized when persuasive evidence of an arrangement exists, the significant risks and rewards of ownership, including title and risk of loss, are transferred to the customer or distributor, the collection of the related receivables is probable, and the sales price is fixed or determinable. Title passes on shipment or on receipt by the customer depending on the country in which the sale occurs and the agreement terms with the customer. Sales of products are for cash or otherwise agreed upon credit terms. The
F-8
CROCS, INC. AND SUBSIDIARIES
NOTES TO CONSOLIDATED FINANCIAL STATEMENTS (Continued)
1. BASIS OF PRESENTATION & SUMMARY OF SIGNIFICANT ACCOUNTING POLICIES (Continued)
estimated costs of sales incentives, discounts, returns, price promotions, rebates, loyalty and coupon programs are reported as a reduction of revenues.
Shipping and Handling Costs and Fees
Shipping and handling costs are expensed as incurred and are included in 'Cost of sales' in our consolidated statements of operations. Shipping and handling fees billed to customers are included in revenues.
Taxes Assessed by Governmental Authorities
Taxes assessed by governmental authorities that are directly imposed on a revenue transaction, including value added tax, are recorded on a net basis and are therefore excluded from revenues.
Cost of Sales
Our cost of sales includes costs we incur to make and ship our footwear. These costs include our raw materials, both direct and indirect labor, shipping and handling including freight costs, utilities, maintenance costs, depreciation, packaging, and other manufacturing overheads and costs.
Research, Design and Development
We continue to dedicate significant resources to product design and development as we expand the footwear styles we offer based on opportunities we identify in the marketplace. Our design and development process is highly collaborative and we continually strive to improve our development function so we can bring products to market quickly and at reduced costs, while maintaining product quality. We spent $11.9 million, $14.0 million, and $16.7 million in research, design, and development activities for the years ended December 31, 2016, 2015, and 2014, respectively. Research and development costs are expensed as incurred and are included in 'Selling, general and administrative expenses' in our consolidated statements of operations.
Selling, General and Administrative Expenses
Our selling, general and administrative expenses include media advertising (television, radio, print, social, digital), tactical advertising (signs, banners, point-of-sale materials) and promotional costs. Production costs of advertising and promotional materials are expensed when the advertising is first run. Advertising expense was $56.0 million, $58.2 million and $44.7 million for 2016, 2015 and 2014, respectively. Prepaid advertising costs of $4.5 million and $0.0 million, were included in other current assets in the consolidated balance sheets at December 31, 2016 and December 31, 2015, respectively.
Selling, general and administrative expenses also include costs for our marketing and sales organizations, and other functions including finance, legal, human resources and information technology, which consist primarily of labor and outside services, bad debt expense, legal costs, amortization of intangible assets, as well as certain depreciation costs related to non-production equipment and share-based compensation.
Interest Expense
Our interest expense is associated with borrowings to finance our operations. We capitalize interest cost as a part of the original cost of acquiring certain fixed assets if the cost of the capital expenditure and the expected time to complete the project are considered significant. No interest expense was capitalized in 2016 and 2015. Interest expense of $0.4 million was capitalized in 2014.
Other Income, net
Other income, net primarily includes gains and losses associated with activities not directly related to making and selling footwear, as well as certain gains or losses on sales of non-operating assets.
Foreign Currency Loss, net
Foreign currency loss, net includes realized and unrealized foreign exchange gains and losses resulting from remeasurement and settlement of foreign-denominated monetary assets and liabilities, and realized and unrealized gains and losses on forward foreign
F-9
CROCS, INC. AND SUBSIDIARIES
NOTES TO CONSOLIDATED FINANCIAL STATEMENTS (Continued)
1. BASIS OF PRESENTATION & SUMMARY OF SIGNIFICANT ACCOUNTING POLICIES (Continued)
exchange derivative contracts. Realized foreign exchange gains and losses are reported in the operating segment in which they occur; however, foreign exchange gains and losses on intercompany balances are reported within the Corporate segment. The initial recording of foreign denominated transactions is based on the nature of the transaction, with the unrealized or realized foreign exchange gains or losses resulting from the subsequent remeasurement of the monetary asset or liability, and its ultimate settlement, classified in other income, net.
Income Taxes
Deferred income taxes are provided for the expected future tax consequences of temporary differences between the financial reporting basis and the tax basis of our assets and liabilities. We provide for taxes that may be payable if undistributed earnings of overseas subsidiaries were to be remitted to the U.S., except for those earnings that we consider to be permanently reinvested. We record provisions for income taxes at the current and future enacted tax rates and laws applicable in each taxing jurisdiction. We use a two-step approach for recognizing and measuring tax benefits taken or expected to be taken in a tax return and disclosures regarding uncertainties in income tax positions. Interest, penalties and offsetting positions related to unrecognized tax benefits are recognized as a component of income tax expense. Our deferred tax valuation allowances are primarily the result of uncertainties regarding the future realization of recorded tax benefits on tax loss carryforwards from operations in various jurisdictions. These valuation allowances are primarily related to deferred tax assets generated from net operating losses. See Note 13 — Income Taxes for further discussion.
Accumulated Other Comprehensive Loss
Other comprehensive loss ("OCI") represents losses for the reporting period which are excluded from net loss and recognized directly within accumulated other comprehensive loss ("AOCI") as a component of equity. These amounts are expected to be reclassified out of AOCI in the future, at which point they will be recognized within the consolidated statement of operations as a component of net income (loss). Our AOCI consists solely of gains and losses resulting from translation of assets and liabilities of our foreign subsidiaries which are denominated in currencies other than the Company's US Dollar reporting currency. Foreign currency reclassification adjustments are reported within 'Foreign currency loss, net' on our consolidated statements of operations.
Cash and Cash Equivalents
Cash and cash equivalents represent cash and short-term, highly liquid investments with maturities of three months or less at the date of purchase. The Company reports receivables from credit card companies, if expected to be received within five days, in cash and cash equivalents.
Restricted Cash
Restricted cash primarily consists of funds to secure certain retail stores, certain customs requirements and other contractual arrangements.
Accounts Receivable, Net
Accounts receivable are recorded at invoiced amounts, net of reserves and allowances. The Company reduces the carrying value for estimated uncollectible accounts based on a variety of factors including the length of time receivables are past due, economic trends and conditions affecting the Company's customer base and historical collection experience. Specific provisions are recorded for individual receivables when the Company becomes aware of a customer's inability to meet its financial obligations. The Company write-off the accounts receivable to the reserves when it is deemed uncollectable or, in certain jurisdictions, when legally able to do so. See Note 12 — Allowances for further discussion related to provisions for doubtful accounts, sale returns and allowances, and reserve for unapplied rebates.
Inventory Valuation
Inventories are valued at the lower of cost or market. Inventory cost is determined primarily using the moving average cost method. We regularly evaluate inventory for possible impairment and estimate inventory market value based on several subjective assumptions including estimated future demand and market conditions, as well as other observable factors such as current sell-through of the Company's products, recent changes in product demand, global and regional economic conditions, historical experience selling through liquidation and price discounted channels, and the amount of inventory on hand. If the estimated inventory market value is less than its carrying value, the carrying value is adjusted to market value and the resulting impairment charge is recorded in 'Cost of sales' in the consolidated statements of operations. See Note 3 — Inventories for further discussion.
F-10
CROCS, INC. AND SUBSIDIARIES
NOTES TO CONSOLIDATED FINANCIAL STATEMENTS (Continued)
1. BASIS OF PRESENTATION & SUMMARY OF SIGNIFICANT ACCOUNTING POLICIES (Continued)
Property and Equipment, Net
Property, equipment, furniture, and fixtures are stated at original cost, less accumulated depreciation. Depreciation is provided using the straight-line method over the estimated useful asset lives, which are reviewed periodically and have the following ranges: machinery and equipment: 2 - 5 years; furniture, fixtures and other: 2 - 10 years. Leasehold improvements are stated at cost and amortized on the straight-line basis over their estimated economic useful lives or the lease term, whichever is shorter. Costs of enhancements or modifications that substantially extend the capacity or useful life of an asset are capitalized and depreciated accordingly. Ordinary repairs and maintenance are expensed as incurred. Depreciation of manufacturing assets is included in cost of sales in our consolidated statements of operations. Depreciation related to corporate, non-product and non-manufacturing assets is included in 'Selling, general and administrative expenses' in our consolidated statements of operations. When property is retired or otherwise disposed of, the cost and accumulated depreciation are removed from our consolidated balance sheets and the resulting gain or loss, if any, is reflected in 'Loss from operations' on our consolidated statements of operations.
Properties held under capital lease are depreciated using the straight-line method over the estimated useful life or the lease term, whichever is shorter.
Assets and Liabilities Held for Sale
The Company classifies a disposal group to be sold as held for sale when management approves and commits to a formal plan to actively market a disposal group and expects the sale to close within twelve months. Upon classifying a disposal group as held for sale, the disposal group is recorded at the lower of its carrying amount or its estimated fair value, reduced for selling costs. In determining the fair value of a disposal group, the Company considers both the net book value of the disposal group as a whole and the impact of any related foreign currency translation adjustments recorded within stockholders' equity. Any losses are recognized as asset impairment charges in the consolidated statement of operations. Depreciation expense is no longer recorded for any assets within a disposal group that is classified as held for sale.
The fair value of a disposal group less any selling costs is assessed each reporting period it remains classified as held for sale and any subsequent changes are reported as an adjustment to the carrying value of the disposal group, as long as the new carrying value does not exceed the carrying value of the disposal group at the time it was initially classified as held for sale.
Goodwill and Other Intangible Assets, Net
Goodwill is allocated to the reporting unit in which the business that created the goodwill resides. A reporting unit is a reportable operating segment, or a business unit one level below a reportable operating segment, for which discrete financial information is prepared and regularly reviewed by segment management. The operations in each of the specific regions within our Americas, Asia Pacific and Europe reportable operating segments are considered components based on the availability of discrete financial information and the regular review by segment management and the Company's Chief Operating Decision Maker. We evaluate the carrying value of our goodwill and indefinite-lived intangible assets for impairment at the reporting unit level at least annually or when an interim triggering event occurs that would indicate that impairment may have taken place. Our annual test is performed as of the last day of our fiscal fourth quarter. We continuously monitor the performance of our other definite-lived intangible assets and evaluate for impairment when evidence exists that certain events or changes in circumstances indicate that the carrying amount of these assets may not be recoverable. Significant judgments and assumptions are required in such impairment evaluations. Definite-lived intangible assets are stated at cost less accumulated amortization. Amortization is recorded using the straight-line method over the estimated lives of the assets.
Direct costs of acquiring or developing internal-use computer software, including costs of employees, are capitalized and classified within properties. Software maintenance and training costs are expensed in the period incurred. Initial costs associated with internally-developed-and-used software are expensed until it is determined that the project has reached the application development stage, after which subsequent additions, modifications or upgrades are capitalized to the extent that they add functionality. The Company's capitalized software consists primarily of enterprise resource system software, warehouse management software, and point of sale software. Amortization is provided using the straight-line method over the estimated useful asset lives, which are reviewed periodically and range from 5 - 7 years. Amortization of capitalized software used in manufacturing activities is included in 'Cost of sales' in our consolidated statements of operations. Amortization related to corporate, non-product, and non-manufacturing assets, such as the Company's global information systems, is included in 'Selling, general, and administrative expenses' in our consolidated statements of operations.
F-11
CROCS, INC. AND SUBSIDIARIES
NOTES TO CONSOLIDATED FINANCIAL STATEMENTS (Continued)
1. BASIS OF PRESENTATION & SUMMARY OF SIGNIFICANT ACCOUNTING POLICIES (Continued)
Impairment of Long-Lived Assets
Long-lived assets to be held and used are evaluated for impairment when events or circumstances indicate the carrying value of a long-lived asset or asset group is less than the undiscounted cash flows from its use and eventual disposition over its remaining economic life. Indicators of potential impairment include: (i) a significant decrease in its market price, (ii) a significant adverse change in the extent or manner in which it is being used or in its physical condition, (iii) a significant adverse change in legal factors or business climate that could affect its value, including an adverse action or assessment by a regulator, (iv) an accumulation of costs significantly in excess of the amount originally expected for its acquisition or construction, (v) its current period operating or cash flow losses combined with historical operating or cash flow losses or a forecast of its cash flows demonstrate continuing losses associated with its use, and (vi) a current expectation that, more likely than not, it will be sold or otherwise disposed of significantly before the end of its previously estimated useful life.
The Company assesses recoverability by comparing the sum of projected undiscounted cash flows from the use and eventual disposition over the remaining economic life of a long-lived asset or asset group to its carrying value, and records a loss from impairment if the carrying value is less than its undiscounted cash flows. An asset group is the lowest level of assets and liabilities for which identifiable cash flows are largely independent of the cash flows of other assets and liabilities. For assets involved in Crocs' retail business, the asset group is at the retail store level. Assets or asset groups to be abandoned or from which no future benefit is expected, are written down to zero in the period it is determined they will no longer be used and are removed entirely from service. See Note 4 — Property and Equipment for a discussion of impairment losses recorded during the periods presented.
Beneficial Conversion Feature
The Company's Series A Convertible Preferred Stock ("Series A Preferred") included a beneficial conversion feature, which is a conversion right with an effective strike price less than the market price of the underlying stock at the commitment date. The Company recognized the beneficial conversion feature by allocating the intrinsic value of the conversion option, which is the number of shares of common stock available upon conversion multiplied by the difference between the effective conversion price per share and the fair value of common stock per share on the commitment date, to additional paid-in capital. Accretion expense is recorded over the eight years from the date of issuance through the redemption date utilizing the effective interest method.
Share-based Compensation
The Company's share-based compensation plans provides for stock options, restricted stock, and stock performance awards to be granted to plan participants, which includes certain officers, employees and members of the Company's Board of Directors (the "Board"). The grant date fair value of awards granted under these plans is amortized over the vesting period using the straight-line method. The grant date fair value of stock options is calculated using a Black Scholes option pricing model, which requires estimates for expected volatility, expected dividends, the risk-free interest rate, and the term of the option. The grant date fair value of RSU's and RSA's is based on the closing market price of our common stock on the grant date, adjusted for dividend rights during the vesting period. If any of the assumptions used in these models or the anticipated number of shares to be awarded change significantly, share-based compensation expense may differ materially in the future from that recorded in the current period. Share-based compensation expense associated with manufacturing and retail employees is included in 'Cost of sales' in our consolidated statements of operations. Share-based compensation expense associated with selling, marketing and administrative employees is included 'Selling, general and administrative expenses' in our consolidated statements of operations. Share-based compensation directly associated with the construction or implementation of long-term projects is capitalized as part of the cost of the assets and amortized over their expected useful lives beginning on the asset in service date.
The Company changed its method of accounting for forfeitures of stock based compensation as further discussed in Note 2 — Recent Accounting Pronouncements. See also Note 11— Stock Compensation for additional information related to share-based compensation.
Earnings per Share
Basic and diluted earnings per common share ("EPS") is presented using the two-class method, which is an earnings allocation formula that determines earnings per share for common stock and any participating securities according to dividend rights and participation rights in undistributed earnings. Under the two-class method, EPS is computed by dividing the sum of distributed and undistributed earnings attributable to common stockholders by the weighted average number of shares of common stock outstanding during the period. A participating security is a security that may participate in undistributed earnings with common stock had those earnings been distributed in any form. The Company's Series A Preferred stock is a participating security because
F-12
CROCS, INC. AND SUBSIDIARIES
NOTES TO CONSOLIDATED FINANCIAL STATEMENTS (Continued)
1. BASIS OF PRESENTATION & SUMMARY OF SIGNIFICANT ACCOUNTING POLICIES (Continued)
the holders are entitled to receive any and all dividends declared or paid on common stock on an as-converted basis. In addition, the Company's unvested restricted stock and restricted stock unit awards are participating securities because they include non-forfeitable rights to dividends. Participating securities are included in the computation of EPS pursuant to the two-class method on a pro-rata, if-converted basis. Diluted EPS reflects the potential dilution from securities that could share in the Company's earnings. In addition, the dilutive effect of each participating security, if any, is calculated using the more dilutive of the two-class method described above. This method assumes the if-converted method, which assumes conversion to common stock as of the beginning of the reporting date for any security that is more dilutive upon conversion. Anti-dilutive securities are excluded from diluted EPS. See Note 14 — Earnings Per Share for further discussion.
Derivative Foreign Currency Contracts
The Company enters into derivative financial instruments to mitigate the potential impact of foreign currency exchange rate risk, including foreign currency forward contracts and option contracts. The Company's derivative financial instruments are used to mitigate foreign currency risk and are not used for trading or speculative purposes. The fair value of the derivative financial instruments is reported either as assets or liabilities in our consolidated balance sheets. Changes in the fair value of our foreign currency derivatives not designated or effective as hedges are recorded in 'Foreign currency loss, net' in our consolidated statements of operations. The Company did not designate any derivative instruments for hedge accounting during any of the periods presented. See Note 8 — Derivative Financial Instruments for further discussion.
Foreign Currency Translation and Foreign Currency Transactions
The financial position and operating results of the Company's foreign operations are reported using their respective local currency as the functional currency. Local currency assets and liabilities are translated to U.S. Dollars at the rates of exchange in effect on the balance sheet date, and local currency revenues and expenses are translated to U.S. Dollars at average monthly rates of exchange in effect during the period. The resulting translation gains or losses are included in the consolidated statements of comprehensive income as a component of other comprehensive income (loss) and in the consolidated statements of equity within accumulated other comprehensive income (loss).
The Company also recognizes gains and losses on both third-party and intercompany transactions that are denominated in a currency other than the respective entity's functional currency. Foreign currency transaction gains and losses are recognized in earnings and reported in 'Foreign currency loss, net' in the consolidated statements of operations.
Fair Value
Fair value is the price that would be received from the sale of an asset or transfer of a liability in an orderly transaction between market participants, in the principal or most advantageous market in which a hypothetical sale or transfer would take place, and considers assumptions that market participants would use when pricing the asset or liability, such as inherent risk, transfer restrictions, and risk of non-performance.
U.S. GAAP guidance for fair value includes a hierarchy that prioritizes fair value measurements based on the types of inputs used for the various valuation techniques (market approach, income approach and cost approach). Our financial assets and liabilities are measured using inputs from the three levels of the fair value hierarchy.
The three levels of the fair value hierarchy are as follows:
Level 1—Inputs are unadjusted quoted prices in active markets for identical assets or liabilities in active markets;
Level 2—Inputs include quoted prices for similar assets or liabilities in active markets, quoted prices for identical or similar instruments in markets that are less active and inputs other than quoted market prices that are observable for the asset or liability (i.e., interest rates, yield curves, etc.), and inputs that are derived principally from, or corroborated by, observable market data by correlation or other means (market corroborated inputs); and
Level 3—Unobservable inputs for which there is little or no market data, that reflect the assumptions that we believe market participants would use in pricing the asset or liability. We develop these inputs based on the best information available, including our own data.
We categorize fair value measurements within the fair value hierarchy based upon the lowest level of the most significant inputs used to determine fair value. See Note 7 — Fair Value Measurements for further discussion related to fair value measurements.
F-13
CROCS, INC. AND SUBSIDIARIES
NOTES TO CONSOLIDATED FINANCIAL STATEMENTS (Continued)
2. RECENT ACCOUNTING PRONOUNCEMENTS
New Accounting Pronouncements Adopted
Stock Compensation
In March 2016, the Financial Accounting Standards Board ("FASB") issued authoritative guidance intended to simplify and improve several aspects of the accounting for share-based payment transactions. The guidance includes amendments that require excess tax benefits or deficiencies resulting from share-based payments be recognized in the income statement as a component of the provision for income taxes, whereas previously these were recognized within additional paid-in-capital. Further, the new guidance provides an accounting policy election to account for forfeitures as they occur. The new standard also amends the presentation of employee share-based payment-related items in the statement of cash flows by requiring that: (i) excess tax benefits be classified as cash inflows provided by operating activities, and (ii) cash paid to taxing authorities arising from the withholding of shares from employees be classified as cash outflows used in financing activities. We early adopted this guidance during the quarter ended December 31, 2016. The provisions of the new guidance have been adopted as of January 1, 2016, which is the beginning of the annual period that includes the interim period of adoption.
The adoption of this guidance had no effect on our income tax expense or additional paid-in-capital as a result of the change in accounting for excess tax benefits or deficiencies for the three months or the year ended December 31, 2016 because the Company did not recognize any excess tax benefits during 2016. As permitted by this standard, the Company has elected to account for forfeitures as they occur when calculating share-based compensation expense (previously the Company had estimated forfeitures). The effect of this election on share-based compensation expense reported in 2016 was not significant. The adoption of this guidance did not have an impact on either net cash provided by operating activities or on net cash provided by financing activities because the Company had no recognizable excess tax benefits during 2016, and cash paid to taxing authorities arising from the withholding of shares from employees was reported within cash from financing activities, consistent with the adopted guidance.
The adoption of this guidance resulted in an increase to retained earnings for cumulative foreign tax credit and state net operating loss carryforward deferred tax assets attributable to excess tax benefits, not previously recognized as they did not reduce income taxes payable. The cumulative adjustment was fully offset by a valuation allowance for the same amount; thus the net effect of both adjustments was zero.
Deferred Tax Assets and Liabilities
In November 2015, the Financial Accounting Standards Board ("FASB") issued authoritative guidance simplifying the presentation of deferred taxes by requiring all deferred tax assets and liabilities to be classified as non-current on the balance sheet. We have early adopted this guidance on a prospective basis, effective December 31, 2015. Adoption of this guidance resulted in the reclassification of our current deferred tax assets and liabilities to non-current in our consolidated balance sheet as of December 31, 2015. No prior periods were retrospectively adjusted. See Note 13 — Income Taxes for further information related to the early adoption of this guidance.
Debt Issuance Costs
In April 2015, the FASB issued authoritative guidance intended to simplify the presentation of debt issuance costs. These amendments require that debt issuance costs be presented as a direct deduction from the carrying amount of the related debt liabilities, consistent with the presentation of debt discounts. This results in the elimination of debt issuance costs as an asset and reduces the carrying value of our debt liabilities. In August 2015, the FASB issued an announcement in stating that debt issuance costs related to line-of-credit arrangements may be reported as an asset and amortized pro rata over the term of the line-of-credit arrangement. We early adopted this guidance effective for our quarter ended March 2016, and have elected to continue to present our debt issuance costs associated with our line-of-credit arrangements as assets. The adoption of this guidance had no effect on our financial position.
New Accounting Pronouncements Not Yet Adopted
Inventory Measurement
In July 2015, FASB issued authoritative guidance intended to simplify the measurement of inventory. The amendment requires entities to measure in-scope inventory at the lower of cost or net realizable value, and replaces the current requirement to measure in-scope inventory at the lower of cost or market, which considers replacement cost, net realizable value, and net realizable value less an approximate normal profit margin. This guidance is effective for annual reporting periods, and interim periods within those
F-14
CROCS, INC. AND SUBSIDIARIES
NOTES TO CONSOLIDATED FINANCIAL STATEMENTS (Continued)
2. RECENT ACCOUNTING PRONOUNCEMENTS (Continued)
annual periods, beginning after December 15, 2016. The amendment should be applied prospectively with early adoption permitted. We do not expect this guidance to have a material effect on our financial position or results of operations upon adoption.
Statement of Cash Flows - Classification
In August 2016, the FASB issued authoritative guidance intended to clarify how entities should classify certain cash receipts and cash payments on the statement of cash flows. The amendment addresses eight specific cash flow issues with the objective of reducing the existing diversity in practice. These updates are effective for annual reporting periods beginning after December 15, 2017, and interim periods within those annual periods, with early adoption permitted. The guidance should be applied retrospectively unless it is impractical to do so; in which case, the guidance should be applied prospectively as of the earliest date practicable. We do not anticipate that this guidance will have an impact on our consolidated financial statements.
Prepaid Stored-Value Products
In March 2016, the FASB issued guidance related to the recognition of breakage for certain prepaid stored-value products. This update aligns recognition of the financial liabilities related to prepaid stored-value products (for example, prepaid gift cards), with Topic 606, Revenue from Contracts with Customers, for non-financial liabilities. In general, certain of these liabilities may be extinguished proportionally in earnings as redemptions occur, or when redemption is remote if issuers are not entitled to the unredeemed stored value. This standard is effective for annual periods (including interim periods) beginning after December 15, 2017, with early adoption permitted. At adoption, this update will be applied either using a modified retrospective transition method by means of a cumulative-effect adjustment to retained earnings as of the beginning of the fiscal year in which the guidance is effective or retrospectively to each period presented. The Company is currently assessing the adoption method and the impact that adopting this new accounting standard will have on its consolidated financial statements.
Leases
In February 2016, the FASB issued authoritative guidance intended to increase transparency and comparability among organizations by recognizing lease assets and liabilities on the balance sheet and disclosing key information about leasing arrangements. Under the new guidance, lessees will be required to recognize a right-of-use asset and a lease liability, measured on a discounted basis, at the commencement date for all leases with terms greater than twelve months. Additionally, this guidance will require disclosures to help investors and other financial statement users to better understand the amount, timing, and uncertainty of cash flows arising from leases, including qualitative and quantitative requirements. The guidance should be applied under a modified retrospective transition approach for leases existing at the beginning of the earliest comparative period presented in the adoption-period financial statements. Any leases that expire before the initial application date will not require any accounting adjustment. This guidance is effective for annual reporting periods beginning after December 15, 2018, including interim periods within those annual periods, with early adoption permitted.
The Company will adopt this guidance beginning with the quarterly reporting period ending March 31, 2019. The Company is evaluating the full impact this guidance will have on its consolidated financial statements, but expects that adoption will result in significant increases in lease related assets and liabilities on our consolidated balance sheet.
Revenue Recognition
In May 2014, the FASB issued authoritative guidance related to new accounting requirements for the recognition of revenue from contracts with customers. The core principle of the guidance is that an entity should recognize revenue to depict the transfer of promised goods or services to customers in an amount that reflects the consideration to which the entity expects to be entitled to in exchange for the goods or services. Subsequent to the release of this guidance, the FASB has issued additional updates intended to provide interpretive clarifications and to reduce the cost and complexity of applying the new revenue recognition standard both at transition and on an ongoing basis. The new standard and related amendments are effective for annual reporting periods beginning after December 15, 2017, and interim periods within those annual periods. Upon adoption of the new standard, the use of either a full retrospective or cumulative effect transition method is permitted.
In December 2016 the Company established an implementation team (“team”) and engaged external advisers to develop a multi-phase plan to assess the company’s business and contracts, as well as any changes to accounting policies, processes or systems necessary to adopt the requirements of the new standard. The team is in the process of reviewing its contracts and assessing how adoption of the new standard will affect its consolidated financial statements and disclosures upon adoption, as well as the adoption method. The Company expects to complete its evaluation of the impact of the accounting and disclosure changes on its business processes, controls and systems during the first half of 2017. The Company will provide additional information regarding expected effects on its consolidated financial statements and disclosures, and the transition method in its Quarterly Reports during 2017.
F-15
CROCS, INC. AND SUBSIDIARIES
NOTES TO CONSOLIDATED FINANCIAL STATEMENTS (Continued)
2. RECENT ACCOUNTING PRONOUNCEMENTS (Continued)
Other new pronouncements issued but not effective until after December 31, 2016 are not expected to have a material impact on the Company’s consolidated financial statements.
3. INVENTORIES
The following table summarizes inventories by major classification:
December 31, | |||||||
2016 | 2015 | ||||||
(in thousands) | |||||||
Finished goods | $ | 142,333 | $ | 162,341 | |||
Work-in-progress | 654 | 918 | |||||
Raw materials | 4,042 | 4,933 | |||||
Total inventories | $ | 147,029 | $ | 168,192 | |||
The Company recorded approximately $0.0 million, $3.1 million, and $11.5 million of inventory write-downs during the years ended December 31, 2016, 2015 and 2014, respectively, related to certain obsolete raw materials, footwear, and accessories. The write-downs for 2016 and 2015 are reported in 'Cost of sales' in the consolidated statement of operations. In 2014, write-downs of $7.5 million and $4.0 million are reported within 'Cost of sales' and 'Restructuring charges', respectively, in the consolidated statement of operations.
4. PROPERTY AND EQUIPMENT
Property and equipment, net consists of the following:
December 31, | |||||||
2016 | 2015 | ||||||
(in thousands) | |||||||
Machinery and equipment | $ | 33,163 | $ | 36,864 | |||
Leasehold improvements | 73,363 | 81,593 | |||||
Furniture, fixtures and other | 19,358 | 23,576 | |||||
Other (1) | — | 1,595 | |||||
Construction-in-progress | 6,809 | 3,512 | |||||
Property and equipment | 132,693 | 147,140 | |||||
Less: Accumulated depreciation | (88,603 | ) | (97,650 | ) | |||
Property and equipment, net | $ | 44,090 | $ | 49,490 | |||
____________________________________________________________________________
(1) | Represents the South Africa disposal group, sold in April 2016. |
During the years ended December 31, 2016, 2015, and 2014, depreciation expense was $15.1 million, $16.3 million, and $23.2 million, respectively, of which $1.8 million, $1.8 million, and $1.7 million, respectively, was recorded in 'Cost of sales', with the remaining amounts recorded in 'Selling, general and administrative expenses' in the consolidated statements of operations.
The Company recognized a loss on disposals of property and equipment of $0.5 million, $1.4 million and $0.0 million for the year ended December 31, 2016, 2015, and 2014, which is included in 'Selling, general and administrative expenses' in the consolidated statement of operations.
F-16
CROCS, INC. AND SUBSIDIARIES
NOTES TO CONSOLIDATED FINANCIAL STATEMENTS (Continued)
4. PROPERTY AND EQUIPMENT (Continued)
The Company is contractually obligated to restore certain retail and office facilities back to their original condition as specified in the related lease agreements. The estimated fair value of these liabilities is recorded at lease inception along with a related asset at inception of the leases. At December 31, 2016 and 2015 liabilities for asset retirement obligations were $2.8 million and $2.0 million, respectively. Asset retirement obligations are reported in "Other liabilities' in the consolidated balance sheets.
Asset Impairments
During the years ended December 31, 2016, 2015, and 2014, the Company recorded impairments of $2.7 million, $9.6 million, and $8.8 million, respectively, for underperforming retail stores. During the year ended December 31, 2015, additional impairment of $5.7 million related to the South Africa disposal group was recorded. Long-lived asset impairments by reportable operating segment, were:
Year Ended December 31, | ||||||||||||||||||||
2016 | 2015 | 2014 | ||||||||||||||||||
Asset Impairment | Number of Stores | Asset Impairment | Number of Stores | Asset Impairment | Number of Stores | |||||||||||||||
(in thousands, except store count data) | ||||||||||||||||||||
Americas | $ | 1,703 | 12 | $ | 7,237 | 27 | $ | 4,001 | 36 | |||||||||||
Asia Pacific (1) | 672 | 21 | 6,450 | 36 | 2,807 | 14 | ||||||||||||||
Europe | 338 | 9 | 1,584 | 21 | 2,019 | 27 | ||||||||||||||
Total | $ | 2,713 | 42 | $ | 15,271 | 84 | $ | 8,827 | 77 | |||||||||||
_______________________________________________________________________________
(1) In 2015, the Company recorded impairment of nine retail stores in South Africa of $5.7 million.
5. GOODWILL AND INTANGIBLE ASSETS, NET
Goodwill
All goodwill is in the Europe segment. The changes in goodwill for the years ended December 31, 2016 and 2015 were:
Goodwill | |||||
(in thousands) | |||||
Gross goodwill at January 1, 2015 | $ | 2,382 | |||
Accumulated impairments | (338 | ) | |||
Net goodwill at January 1, 2015 | 2,044 | ||||
Foreign currency translation | (71 | ) | |||
Net goodwill at December 31, 2015 | 1,973 | ||||
Foreign currency translation | (62 | ) | |||
Impairment (1) | (431 | ) | |||
Net goodwill at December 31, 2016 (2) | $ | 1,480 | |||
_______________________________________________________________________________
(1) | During the year ended we recognized impairment of goodwill in our Belgian retail business, due to declining business performance. |
(2) | In December 2016, the Company completed its purchase accounting for the June 2016 acquisition of operations in Austria and concluded the acquisition did not result in goodwill. |
For further information related to the goodwill impairment, see Note 7 — Fair Value Measurements.
F-17
CROCS, INC. AND SUBSIDIARIES
NOTES TO CONSOLIDATED FINANCIAL STATEMENTS (Continued)
5. GOODWILL & INTANGIBLE ASSETS (Continued)
Intangible Assets, Net
Other intangible assets consist of the following:
December 31, 2016 | December 31, 2015 | ||||||||||||||||||||||||
Useful Life | Gross | Accum. Amortiz. | Net | Gross | Accum. Amortiz. | Net | |||||||||||||||||||
(Years) | (in thousands) | ||||||||||||||||||||||||
Intangible assets subject to amortization: | |||||||||||||||||||||||||
Capitalized software (1) | 2 - 7 | $ | 142,358 | $ | (74,530 | ) | $ | 67,828 | $ | 162,700 | $ | (82,596 | ) | $ | 80,104 | ||||||||||
Patents, copyrights and trademarks | 6 - 25 | 6,438 | (5,471 | ) | 967 | 6,892 | (5,135 | ) | 1,757 | ||||||||||||||||
Other | * | 2,855 | (2,855 | ) | — | 8,290 | (8,151 | ) | 139 | ||||||||||||||||
Intangibles not subject to amortization: | |||||||||||||||||||||||||
In progress (2) | 3,616 | — | 3,616 | — | — | — | |||||||||||||||||||
Trademarks and other (3) | 289 | — | 289 | 297 | — | 297 | |||||||||||||||||||
Total | $ | 155,556 | $ | (82,856 | ) | $ | 72,700 | $ | 178,179 | $ | (95,882 | ) | $ | 82,297 | |||||||||||
______________________________________________________________________________
(1) | Gross carrying amount at December 31, 2016 includes $0.8 million of software held under a capital lease classified as capitalized software as of December 31, 2016, and $4.1 million as of December 31, 2015. Accumulated amortization includes $0.8 million and $3.1 million for software held under a capital lease as of December 31, 2016, and December 31, 2015, respectively, and is amortized using the straight-line method over the useful life. |
(2) Primarily capitalized software project costs under development.
(3) Change due to foreign currency translation.
As of December 31, 2016, estimated future annual amortization expense of intangible assets is:
Amortization | |||
(in thousands) | |||
2017 | $ | 17,812 | |
2018 | 15,819 | ||
2019 | 13,452 | ||
2020 | 10,698 | ||
2021 | 10,366 | ||
Thereafter | 648 | ||
Total | $ | 68,795 | |
During the years ended December 31, 2016, 2015, and 2014, total amortization expense was $19.0 million, $19.7 million and $14.2 million, of which $5.1 million, $5.8 million and $4.9 million, respectively, was reported in 'Cost of sales', with the remainder in 'Selling, general and administrative expenses' in the consolidated statements of operations. At December 31, 2016, the weighted average remaining useful life of intangibles subject to amortization was approximately 6.5 years.
F-18
CROCS, INC. AND SUBSIDIARIES
NOTES TO CONSOLIDATED FINANCIAL STATEMENTS (Continued)
6. ACCRUED EXPENSES AND OTHER CURRENT LIABILITIES
Accrued expenses and other current liabilities consist of the following:
December 31, | |||||||
2016 | 2015 | ||||||
(in thousands) | |||||||
Accrued compensation and benefits | $ | 20,898 | $ | 20,973 | |||
Fulfillment, freight and duties | 14,572 | 14,776 | |||||
Professional services | 10,900 | 15,019 | |||||
Accrued rent and occupancy | 7,335 | 7,639 | |||||
Deferred revenue and royalties | 7,475 | 1,430 | |||||
Sales/use and value-added taxes | 4,978 | 7,018 | |||||
Accrued loss on disposal group (1) | — | 6,743 | |||||
Other (2) | 12,124 | 18,975 | |||||
Total accrued expenses and other current liabilities | $ | 78,282 | $ | 92,573 | |||
_______________________________________________________________________________
(1) | Accrued loss on the South Africa disposal group, primarily a reclassification of the cumulative translation adjustment. |
(2) | Includes current liabilities related to derivatives, Series A preferred stock dividends, legal, other accrued expenses and, in 2015, restructuring. |
7. FAIR VALUE MEASUREMENTS
Recurring Fair Value Measurements
U.S. GAAP for fair value establishes a hierarchy that prioritizes fair value measurements based on the types of inputs used for the various valuation techniques (market approach, income approach and cost approach). The Company utilizes a combination of market and income approaches to value derivative instruments. The Company’s financial assets and liabilities are measured using inputs from the three levels of the fair value hierarchy. The three levels of the hierarchy are as follows:
Level 1 | Unadjusted quoted prices in active markets for identical assets and liabilities. | |||
Level 2 | Unadjusted quoted prices in active markets for similar assets and liabilities; or | |||
Unadjusted quoted prices for identical or similar assets or liabilities in markets that are not active; or | ||||
Inputs other than quoted prices that are observable for the asset or liability. | ||||
Level 3 | Unobservable inputs for the asset or liability. | |||
The financial assets and liabilities that are measured and recorded at fair value on a recurring basis consist of the Company's derivative instruments. The Company's derivative instruments are forward foreign currency exchange contracts. The Company manages credit risk of its derivative instruments on the basis of its net exposure with its counterparty and has elected to measure the fair value in the same manner. All of the Company's derivative instruments are classified as Level 2 and are reported within 'Accrued expenses and other liabilities' in the consolidated balance sheets. There were no transfers between Level 1 or Level 2, nor were there any outstanding derivative instruments classified as Level 3 as of December 31, 2016 and 2015. The fair value of the Company's derivative instruments was $0.2 million and $0.1 million at December 31, 2016 and 2015, respectively. See Note 8 — Derivative Financial Instruments for more information.
The carrying amounts of the Company's cash and cash equivalents, accounts receivable, accounts payable and current accrued liabilities approximate their fair value as recorded due to the short-term maturity of these instruments, which approximates fair value.
The Company's borrowing instruments are recorded at their carrying values in the consolidated balance sheets, which may differ from their respective fair values. The fair values of the Company's notes payable outstanding approximate their carrying values at December, 31, 2016 based on interest rates currently available to the Company for similar borrowings.
F-19
CROCS, INC. AND SUBSIDIARIES
NOTES TO CONSOLIDATED FINANCIAL STATEMENTS (Continued)
7. FAIR VALUE MEASUREMENTS (Continued)
December 31, 2016 | December 31, 2015 | ||||||||||||||
Carrying Value | Fair Value | Carrying Value | Fair Value | ||||||||||||
(in thousands) | |||||||||||||||
Notes payable and capital lease obligations | $ | 2,378 | $ | 2,378 | $ | 6,399 | $ | 6,399 | |||||||
Non-Financial Assets and Liabilities
The Company's non-financial assets, which primarily consist of property and equipment, goodwill and other intangible assets, are not required to be carried at fair value on a recurring basis and are reported at carrying value. However, on a periodic basis or whenever events or changes in circumstances indicate that their carrying value may not be fully recoverable (and at least annually for goodwill and indefinite-lived intangible assets), non-financial instruments are assessed for impairment and, if applicable, written down to and recorded at fair value,
During 2016, 2015 and 2014 the Company recorded non-cash impairments to reduce the carrying values of certain retail store assets to their fair values. These impairments were recorded in 'Asset impairments' on the Company's consolidated statements of operations. In 2016, the Company recorded a non-cash impairment to the carrying value of goodwill in its European segment. The fair values of these assets were determined based on Level 3 measurements, including estimates of the amount and timing of future cash flows based upon historical experience, expected market conditions, and management's plans.
December 31, | |||||||||||
2016 | 2015 | 2014 | |||||||||
(in thousands) | |||||||||||
Retail store asset impairment | $ | 2,713 | $ | 15,306 | $ | 8,827 | |||||
Goodwill impairment | 431 | — | — | ||||||||
The Company's remaining goodwill is reported within its European segment. The results of the Company's most recent quantitative impairment test for the remaining goodwill indicated that the fair value of the reporting unit exceeded its carrying value. See Note 4 — Property and Equipment, net and Note 5 — Goodwill and Intangible Assets, net for additional information.
8. DERIVATIVE FINANCIAL INSTRUMENTS
The Company transacts business in various foreign countries and is therefore exposed to foreign currency exchange rate risk that impacts the reported U.S. Dollar amounts of revenues, costs, and certain foreign currency monetary assets and liabilities. In order to manage exposure to fluctuations in foreign currency and to reduce the volatility in cash flows and earnings caused by fluctuations in foreign exchange rates, the Company enters into forward contracts to buy and sell foreign currency. By policy, the Company does not enter into these contracts for trading purposes or speculation.
Counterparty default risk is considered low because the forward contracts that the Company enters into are over-the-counter instruments transacted with highly-rated financial institutions. The Company was not required and did not post collateral as of December 31, 2016 and 2015.
The Company's derivative instruments are recorded at fair value as a derivative asset or liability in the consolidated balance sheets. The Company reports derivative instruments with the same counterparty on a net basis when a master netting arrangement is in place. Changes in fair value are recognized within 'Foreign currency loss, net' in the consolidated statements of operations. For purposes of the cash flow statement, the Company classifies cash flows from derivative instruments at settlement in the same category as the cash flows from the related hedged items, generally within 'Cash provided by (used in) operating activities'.
Results of Derivative Activities
The fair values of derivative assets and liabilities, which are reported within 'Accrued expenses and other liabilities' in the consolidated balance sheets were:
F-20
CROCS, INC. AND SUBSIDIARIES
NOTES TO CONSOLIDATED FINANCIAL STATEMENTS (Continued)
8. DERIVATIVE FINANCIAL INSTRUMENTS (Continued)
December 31, 2016 | December 31, 2015 | ||||||||||||||
Derivative Assets | Derivative Liabilities | Derivative Assets | Derivative Liabilities | ||||||||||||
(in thousands) | |||||||||||||||
Forward foreign exchange contracts | |||||||||||||||
Level 1 | $ | — | $ | — | $ | — | $ | — | |||||||
Level 2 | 6,541 | (6,698 | ) | — | (55 | ) | |||||||||
Level 3 | — | — | — | — | |||||||||||
6,541 | (6,698 | ) | — | (55 | ) | ||||||||||
Netting of counterparty contracts | (6,541 | ) | 6,541 | — | — | ||||||||||
Foreign exchange derivative liabilities | $ | — | $ | (157 | ) | $ | — | $ | (55 | ) | |||||
The notional amounts of outstanding foreign currency forward exchange contracts shown below report the total U.S. Dollar equivalent position of all contracts for each foreign currency position.
December 31, 2016 | December 31, 2015 | ||||||||||||||
Notional | Fair Value | Notional | Fair Value | ||||||||||||
Singapore Dollar | $ | 94,763 | $ | (2,611 | ) | $ | — | $ | — | ||||||
Japanese Yen | 87,171 | 4,180 | 98,390 | — | |||||||||||
Euro | 71,228 | (1,441 | ) | 34,219 | — | ||||||||||
British Pound Sterling | 14,332 | (660 | ) | 21,859 | — | ||||||||||
Other currencies | 60,727 | 375 | 39,923 | (55 | ) | ||||||||||
$ | 328,221 | $ | (157 | ) | $ | 194,391 | $ | (55 | ) | ||||||
Latest maturity date | January 2017 | January 2016 | |||||||||||||
Amounts reported within 'Foreign currency loss, net' in the consolidated statements of operations include both realized and unrealized gains/losses from foreign currency transactions and derivative contracts, and are as follows:
Year Ended December 31, | |||||||||||
2016 | 2015 | 2014 | |||||||||
(in thousands) | |||||||||||
Foreign currency transaction gain (loss) | $ | 10,814 | $ | 3,980 | $ | (1,097 | ) | ||||
Foreign currency loss on foreign currency forward contracts | (13,268 | ) | (7,312 | ) | (3,788 | ) | |||||
Foreign currency loss, net | $ | (2,454 | ) | $ | (3,332 | ) | $ | (4,885 | ) | ||
9. REVOLVING CREDIT FACILITY AND BANK BORROWINGS
The Company's borrowings consist of:
December 31, | ||||||||
2016 | 2015 | |||||||
(in thousands) | ||||||||
Notes payable | $ | 2,329 | $ | 6,375 | ||||
Capital lease obligations | 49 | 24 | ||||||
Total notes payable and capital lease obligations | 2,378 | 6,399 | ||||||
Less: short term notes payable and capital lease obligations | 2,338 | 4,772 | ||||||
Total long-term notes payable and capital lease obligations | $ | 40 | $ | 1,627 | ||||
F-21
CROCS, INC. AND SUBSIDIARIES
NOTES TO CONSOLIDATED FINANCIAL STATEMENTS (Continued)
9. REVOLVING CREDIT FACILITY AND BANK BORROWINGS (Continued)
Senior Revolving Credit Facility
The Company's Senior Revolving Credit Facility (the "Facility"), as amended, provides for borrowings of up to $80 million through February 2021. Borrowings under the Facility for domestic base rate loans, including swing loans, bear interest a daily base rate plus a margin ranging from 0.50% to 0.75%. Domestic London Interbank Borrowing Rate ("LIBOR") loans bear interest equal to a LIBOR rate plus a margin ranging from 1.50% to 1.75%. The Facility has financial covenants that restrict the amount available under the Facility, including limitations on: (i) stock repurchases to $50.0 million per year, subject to certain restrictions; and (ii) capital expenditures and commitments to $50.0 million per year. The Facility also requires the Company to meet certain financial covenant ratios, including a minimum fixed charge coverage ratio of 1.10 to 1.00, and a maximum leverage ratio to 2.00 to 1.00.
On November 22, 2016 the Company entered into the Thirteenth Amendment to the Facility, which slightly modified the definition of Consolidated EBITDA to be more favorable to the Company.
On June 13, 2016, the Company entered into the Twelfth Amendment to the Facility, which increased the borrowing capacity available from $75.0 million to $80.0 million. In addition, financial covenants were amended to become applicable when the average borrowings under the Facility exceed 25% of the total borrowing capacity, over a 30-day period, commencing 15 days prior to the last day of each fiscal quarter.
As of December 31, 2016, the Company had no borrowings under the Facility. The Company was in compliance with each of the covenants under the Facility as of December 31, 2016 as follows: (i) fixed charge coverage ratio (adjusted EBITDA plus fixed charges before tax for a rolling four quarters divided by fixed charges before tax plus interest for a rolling four quarters) was 1.98 to 1.00 (ii) leverage ratio (consolidated indebtedness divided by adjusted EBITDA for a rolling four quarters) was 0.26 to 1.00, (iii) stock repurchases were zero, and (iv) capital expenditures and commitments were $23.9 million.
At December 31, 2016 the Company had outstanding letters of credit of $1.3 million, which reduce the amounts available for borrowing under the terms of the Facility. As of December 31, 2016 and 2015, the Company had $78.7 million and $73.7 million, respectively, of available borrowing capacity.
Asia Revolving Credit Facility
On August 28, 2015, a wholly-owned subsidiary of the Company entered into a revolving credit facility agreement (the "Asia Facility") with HSBC Bank (China) Company Limited, Shanghai Branch ("HSBC"). The Asia Facility enables the Company to borrow uncommitted dual currency revolving loan facilities up to 40.0 million Chinese Renminbi ("RMB"), or $5.8 million, with a combined facility limit of RMB 60.0 million or $8.6 million through February 2021. For loans denominated in U.S. dollars, the interest rate is 2.1% per annum plus LIBOR for three months or any other period as may be determined by HSBC at the end of each three month interest period.
For RMB loans, interest equals the one year benchmark lending rate effective on the loan draw-down date set forth by the People’s Bank of China plus 10%, payable on the maturity date of the related loan. The Asia Facility may be canceled or suspended at any time at the discretion of the lender and contains provisions requiring the Company to maintain compliance with certain restrictive covenants. As of December 31, 2016 and 2015, the Asia Facility remained suspended at the discretion of HSBC and the Company had no outstanding borrowings or borrowings available. The Asia Revolving Credit Facility will mature on February 18, 2021.
F-22
CROCS, INC. AND SUBSIDIARIES
NOTES TO CONSOLIDATED FINANCIAL STATEMENTS (Continued)
9. REVOLVING CREDIT FACILITY AND BANK BORROWINGS (Continued)
Notes Payable
The Company financed the cost of its enterprise software system, which began in October 2012 and was substantially completed in early 2015 through a series of notes payable. In addition the Company financed certain insurance coverage premiums. The Company pays fixed interest at rates ranging from 1.85% to 2.79%.
The maturities of the Company's debt and capital lease obligations were:
December 31, 2016 | |||
(in thousands) | |||
2017 | $ | 2,338 | |
2018 | 13 | ||
2019 | 12 | ||
2020 | 15 | ||
Total principal debt maturities | 2,378 | ||
Current portion | 2,338 | ||
Non-current portion | $ | 40 | |
10. EQUITY
Common Stock
The Company has one class of common stock with a par value of $0.001 per share. There are 250 million shares of common stock authorized for issuance. Holders of common stock are entitled to one vote per share voting together as a single class on all matters presented to the stockholders for their approval, except with respect to the election and removal of directors or as otherwise required by applicable law.
Common Stock Repurchase Program
On December 26, 2013, the Board of Directors approved and authorized a program to repurchase up to $350 million of our common stock. The number, price and timing of the repurchases are at the Company’s sole discretion, subject to certain restrictions on repurchases under the Company's Revolving Credit Facility, and may be made depending on market conditions, liquidity needs or other factors. The Company’s Board of Directors may suspend, modify or terminate the program at any time without prior notice. Share repurchases may be made in the open market or in privately negotiated transactions. The repurchase authorization does not have an expiration date and does not obligate the Company to acquire any amount of its common stock. Under Delaware state law, these shares are not retired, and the issuer has the right to resell any of the shares repurchased.
The Company did not repurchase any of its common stock during 2016. During 2015, the Company repurchased 6.5 million shares for $85.9 million including commissions. During 2014, the Company repurchased 10.6 million shares for $145.9 million including commissions. As of December 31, 2016, the Company had authorization to repurchase approximately $118.7 million of its common stock.
Preferred Stock
The Company has authorized and available for issuance 4 million shares of preferred stock. None of these preferred shares are issued or outstanding as of December 31, 2016 and 2015.
Series A Convertible Preferred Stock
The Company is authorized to issue up to 1.0 million shares of Series A convertible preferred stock ("Series A Preferred stock"), par value $0.001 per share, of which 0.2 million shares have been issued to the Blackstone Purchasers. The Series A Preferred stock has a stated value of $1,000 per share. Holders of Series A Preferred stock are entitled to receive dividends declared or paid
F-23
CROCS, INC. AND SUBSIDIARIES
NOTES TO CONSOLIDATED FINANCIAL STATEMENTS (Continued)
10. EQUITY (CONTINUED)
on the Company's common stock and are entitled to vote together with the holders of the Company's common stock as a single class, in each case, on an as-converted basis. Holders of Series A Preferred stock also have certain limited special approval rights, including with respect to the issuance of pari passu or senior equity securities of the Company.
Participation Rights and Dividends
The Series A preferred stock ranks senior to the Company's common stock with respect to rights to preferred dividends, liquidation, winding-up, and dissolution. Holders of Series A preferred stock are entitled to cumulative dividends payable quarterly in cash at a rate of 6% per annum. If the Company fails to make timely dividend payments, the dividend rate will increase to 8% per annum until such time as all accrued but unpaid dividends have been paid in full. As of December 31, 2016 and 2015, the Company had accrued preferred dividends of $3.0 million at each balance sheet date which are reported within "Accrued expenses and other liabilities' in the consolidated balance sheets. These accrued dividends were each paid in cash on January 3, 2017 and January 4, 2016.
Conversion Right
The Series A preferred stock is convertible at the option of the holders at any time into shares of common stock at a conversion price of $14.50 per share, subject to adjustment for customary anti-dilution provisions. Anytime on or after January 27, 2017, provided the closing price of the Company's common stock has been equal to or greater than $29.00 for 20 consecutive trading days, the Company may elect to convert all or a portion of the Series A preferred stock into an equivalent number of shares of common stock. At December 31, 2016, had the Company been entitled to exercise its conversion right, the Series A preferred stock would have been convertible into 13,793,100 shares of common stock.
Redemption Rights of the Company and Blackstone
The Company has the option to redeem the Series A preferred stock anytime on or after January 27, 2022 for 100% of the stated redemption value of $200 million plus all accrued and unpaid dividends.
Blackstone has the option to redeem the Series A preferred stock any time after January 27, 2022 or upon a change in control. Further, upon certain change of control events, Blackstone can require the Company to repurchase the Series A preferred stock at 101% of the redemption value plus all accrued and unpaid dividends. The Series A preferred stock is reported as temporary or mezzanine equity in the consolidated balance sheets. The carrying value of the Series A preferred stock is accreted up to its $200 million redemption value on a straight-line basis through the redemption date.
11. STOCK COMPENSATION
Equity Incentive Plans
The Company's 2015 Equity Incentive Plan (the "2015 Plan") provides for the issuance of common stock in connection with the grant of non-qualified stock options, incentive stock options, restricted stock, restricted stock units, stock appreciation rights, performance units, common stock, or any other share-based award to eligible employees, consultants, and members of the Board. The Company also had two predecessor plans, the 2005 Equity Incentive Plan (the "2005 Plan") and the 2007 Equity Incentive Plan (the "2007 Plan"). Shares of common stock reserved and authorized for issuance at December 31, 2016 under all plans were 9,969,331 shares, subject to adjustment for future stock splits, stock dividends, and similar changes in capitalization.
F-24
CROCS, INC. AND SUBSIDIARIES
NOTES TO CONSOLIDATED FINANCIAL STATEMENTS (Continued)
11. STOCK COMPENSATION (Continued)
Stock Option Activity
Stock option activity for the years ended December 31, 2016, 2015, and 2014 was:
Shares | Weighted Average Exercise Price | Weighted Average Remaining Contractual Life (Years) | Aggregate Intrinsic Value | |||||||||
(in thousands, except exercise price and years) | ||||||||||||
Outstanding as of January 1, 2014 | 2,105 | $ | 13.34 | 4.86 | $ | 10,790 | ||||||
Granted | 119 | 14.22 | ||||||||||
Exercised | (266 | ) | 5.05 | |||||||||
Forfeited or expired | (262 | ) | 21.02 | |||||||||
Outstanding as of December 31, 2014 | 1,696 | $ | 13.52 | 3.88 | $ | 4,435 | ||||||
Granted | 35 | 13.52 | ||||||||||
Exercised | (285 | ) | 6.54 | |||||||||
Forfeited or expired | (150 | ) | 21.82 | |||||||||
Outstanding as of December 31, 2015 | 1,296 | $ | 14.09 | 2.83 | $ | 1,261 | ||||||
Granted | — | — | ||||||||||
Exercised | (104 | ) | 4.04 | |||||||||
Forfeited or expired | (674 | ) | 13.47 | |||||||||
Outstanding as of December 31, 2016 | 518 | $ | 16.90 | 3.99 | $ | 186,184 | ||||||
Exercisable at December 31, 2016 | 447 | $ | 17.37 | 3.48 | $ | 186,184 | ||||||
Vested and expected to vest at December 31, 2016 | 518 | $ | 16.90 | 3.97 | $ | 186,184 | ||||||
No stock options were granted during 2016. During the years ended December 31, 2015 and 2014 stock options were valued using a Black Scholes option pricing model using the following assumptions:
Year Ended December 31, | |||
2015 | 2014 | ||
Expected volatility | 43% | 44% - 50% | |
Dividend yield | — | — | |
Risk-free interest rate | 1.50% - 1.72% | 1.41% - 1.71% | |
Expected life (in years) | 4.00 | 4.00 | |
The weighted average grant date fair value of stock options granted during the years ended December 31, 2015 and 2014 was approximately $4.74, and $5.35, respectively. The aggregate intrinsic value of stock options exercised during the years ended December 31, 2016, 2015, and 2014 was $0.5 million, $1.7 million, and $2.7 million, respectively. During the years ended December 31, 2016, 2015, and 2014 the Company received $0.4 million, $1.9 million and $1.3 million cash in connection with the exercise of stock options. The total grant date fair value of stock options vested during the years ended December 31, 2016, 2015, and 2014 was $0.3 million, $0.7 million, and $0.8 million, respectively.
As of December 31, 2016, the Company had $0.3 million of total unrecognized share-based compensation expense related to unvested options, which is expected to be amortized over the remaining weighted average period of 1.81 years.
Stock options under both the 2005 Plan and the 2007 Plan generally vest ratably over four years with the first vesting occurring one year from the date of grant, followed by monthly vesting for the remaining three years.
F-25
CROCS, INC. AND SUBSIDIARIES
NOTES TO CONSOLIDATED FINANCIAL STATEMENTS (Continued)
11. STOCK COMPENSATION (Continued)
Restricted Stock Awards and Units
From time to time, restricted stock awards ("RSAs") and restricted stock units ("RSUs") are granted to employees. RSAs and RSUs generally vest over three years, depending on the terms of the grant. Holders of unvested RSAs have the same rights as those of common stockholders including voting rights and non-forfeitable dividend rights. However, ownership of unvested RSAs cannot be transferred until vested. Holders of unvested RSUs have a contractual right to receive a share of common stock upon vesting. RSUs have dividend equivalent rights which accrue over the term of the award and are paid if and when the RSUs vest, but RSU holders have no voting rights. The Company grants time-based RSUs and performance-based RSUs.
Time-based RSUs are typically granted on an annual basis to certain executive and non-executive employees and vest on a straight-line basis in three annual installments, beginning one year after the grant date. During the years ended December 31, 2016, 2015, and 2014, the Board approved grants of 0.4 million, 0.4 million, and 0.3 million RSUs to certain non-executives.
During the years ended December 31, 2016, 2015, and 2014, the Board approved the grant of 1.2 million, 1.5 million, and 0.9 million, respectively, RSUs to certain executives as part of a performance incentive program.
Performance-based RSUs are granted on an annual basis to certain executive employees and consist of a time-based and performance-based component. Under the time-based component, RSUs vest at the end of each of the three years beginning one year from the grant date. The performance targets and vesting conditions for performance-based RSU's are based on achievement of multiple weighted performance goals, and vest upon certification of the compensation committee plus an additional service period.
RSA and RSU activity during the years ended December 31, 2016, 2015, and 2014 was:
Restricted Stock Awards | Restricted Stock Units | ||||||||||||
Shares | Weighted Average Grant Date Fair Value | Units | Weighted Average Grant Date Fair Value | ||||||||||
Unvested at January 1, 2014 | 210,490 | $ | 13.43 | 1,965,667 | $ | 16.50 | |||||||
Granted | 9,973 | 15.04 | 1,749,993 | 16.05 | |||||||||
Vested | (68,420 | ) | 15.03 | (541,888 | ) | 17.64 | |||||||
Forfeited | (144,555 | ) | 12.67 | (1,176,301 | ) | 16.51 | |||||||
Unvested at December 31, 2014 | 7,488 | $ | 15.61 | 1,997,471 | $ | 15.78 | |||||||
Granted | 15,987 | 15.01 | 2,866,562 | 10.14 | |||||||||
Vested | (15,480 | ) | 15.30 | (505,025 | ) | 16.20 | |||||||
Forfeited | (1,328 | ) | 15.00 | (1,270,630 | ) | 14.14 | |||||||
Unvested at December 31, 2015 | 6,667 | $ | 15.00 | 3,088,378 | $ | 10.75 | |||||||
Granted | 22,860 | 10.28 | 2,312,121 | 9.16 | |||||||||
Vested | (18,097 | ) | 12.02 | (612,370 | ) | 13.05 | |||||||
Forfeited | — | — | (932,761 | ) | 11.26 | ||||||||
Unvested at December 31, 2016 | 11,430 | $ | 10.28 | 3,855,368 | $ | 10.31 | |||||||
RSAs vested during the years ended December 31, 2016, 2015, and 2014 consisted entirely of time-based awards. RSUs vested during the year ended December 31, 2016 consisted of 31,396 performance-based awards and 599,071 time-based awards. RSUs vested during the year ended December 31, 2015 consisted of 67,893 performance-based awards and 437,132 time-based awards. RSUs vested during the year ended December 31, 2014 consisted of 30,946 performance-based awards and 510,942 time-based awards.
The total grant date fair value of RSAs vested during the years ended December 31, 2016, 2015, and 2014 was $0.2 million, $0.2 million, and $1.0 million, respectively. As of December 31, 2016, there was $0.1 million of total unrecognized share-based compensation expense related to non-vested restricted stock awards, all of which was related to time-based awards. As of December 31, 2016, unvested RSAs are expected to amortize over a remaining weighted average period of 0.43 years.
F-26
CROCS, INC. AND SUBSIDIARIES
NOTES TO CONSOLIDATED FINANCIAL STATEMENTS (Continued)
11. STOCK COMPENSATION (Continued)
The total grant date fair value of RSUs vested during the years ended December 31, 2016, 2015, and 2014 was $8.0 million, $8.2 million and $9.6 million, respectively. As of December 31, 2016, there was $14.2 million of total unrecognized share-based compensation expense related to unvested restricted stock units, of which $2.6 million is related to performance-based awards and $11.6 million is related to time-based awards. As of December 31, 2016, unvested RSUs are expected to amortize over a remaining weighted average period of 1.63 years, which consists of a remaining weighted average period of 1.56 years related to performance-based awards and a remaining weighted average period of 1.71 years related to time-based awards.
Share-based Compensation Expense
During the years ended December 31, 2016, 2015, and 2014, the Company recorded $10.7 million, $11.2 million, and $12.7 million, respectively, of pre-tax share-based compensation expense, of which $0.5 million, $0.5 million and $0.8 million is reported within 'Cost of sales', and $10.2 million, $10.7 million and $11.8 million, respectively in 'Selling, general and administrative expense in the consolidated statements of operations. During 2014, $0.2 million of share compensation cost related to the Company's enterprise resource planning system was included in capitalized software cost.
12. ALLOWANCES
Changes in the allowance for doubtful accounts, the reserve for sales returns and allowances, and unapplied rebates were:
Allowance for doubtful accounts | Reserve for sales returns and allowances | Reserve for unapplied rebates | Total | ||||||||||||
(in thousands) | |||||||||||||||
Beginning balance at January 1, 2014 | $ | 3,656 | $ | 5,410 | $ | 1,447 | $ | 10,513 | |||||||
Reduction in revenues | — | 69,834 | 5,397 | 75,231 | |||||||||||
Expense | 12,087 | — | — | 12,087 | |||||||||||
Recoveries, applied amounts, and write-offs | (2,134 | ) | (68,030 | ) | 4,725 | (65,439 | ) | ||||||||
Ending balance at December 31, 2014 | 13,609 | 7,214 | 11,569 | 32,392 | |||||||||||
Reduction in revenues | — | 71,649 | 11,106 | 82,755 | |||||||||||
Expense | 26,225 | — | — | 26,225 | |||||||||||
Recoveries, applied amounts, and write-offs | (3,466 | ) | (74,224 | ) | (14,318 | ) | (92,008 | ) | |||||||
Ending balance at December 31, 2015 | 36,368 | 4,639 | 8,357 | 49,364 | |||||||||||
Reduction in revenues | — | 72,995 | 9,036 | 82,031 | |||||||||||
Expense | 6,079 | — | — | 6,079 | |||||||||||
Recoveries, applied amounts, and write-offs | (9,591 | ) | (71,513 | ) | (8,232 | ) | (89,336 | ) | |||||||
Ending balance at December 31, 2016 | $ | 32,856 | $ | 6,121 | $ | 9,161 | $ | 48,138 | |||||||
During the year ended December 31, 2015, multiple China distributors defaulted on their payment obligations and, as a result, the Company recorded a $23.2 million charge in 2015 to increase the China allowance for doubtful accounts to $30.3 million at December 31, 2015. In addition to the allowance for doubtful accounts of $30.3 million, the Company also maintained China reserves for sales returns and allowances and unapplied rebates, bringing the total China allowances to $36.4 million as of December 31, 2015. As of December 31, 2015, China operations accounted for $41.6 million of the Company's gross receivables, of which $38.2 million were past due. Our net accounts receivable balance for our China operations as of December 31, 2015 was $5.1 million.
The Company addressed the declining collection rates experienced in 2015 from our China operations by limiting or terminating its relationship with certain distributors. Beginning in late 2015, the Company implemented a more restrictive credit policy for several China distributors and also expanded its relationship with other, financially stronger existing business partners.
F-27
CROCS, INC. AND SUBSIDIARIES
NOTES TO CONSOLIDATED FINANCIAL STATEMENTS (Continued)
12. ALLOWANCES (Continued)
Changes in the China allowance for doubtful accounts, the reserve for sales returns and allowances, and unapplied rebates were:
Allowance for doubtful accounts | Reserve for sales returns and allowances | Reserve for unapplied rebates | Total | |||||||||||||
China Operations | (in thousands) | |||||||||||||||
Beginning balance at January 1, 2014 | $ | 24 | $ | 225 | $ | 1,051 | $ | 1,300 | ||||||||
Reduction in revenue | — | 6,921 | — | 6,921 | ||||||||||||
Expense | 8,552 | — | — | 8,552 | ||||||||||||
Recoveries, applied amounts, and write-offs | (136 | ) | (3,103 | ) | 7,572 | 4,333 | ||||||||||
Ending balance at December 31, 2014 | 8,440 | 4,043 | 8,623 | 21,106 | ||||||||||||
Reduction in revenue | — | 7,769 | 3,511 | 11,280 | ||||||||||||
Expense | 23,163 | — | — | 23,163 | ||||||||||||
Recoveries, applied amounts, and write-offs | (1,315 | ) | (11,618 | ) | (6,172 | ) | (19,105 | ) | ||||||||
Ending balance at December 31, 2015 | 30,288 | 194 | 5,962 | 36,444 | ||||||||||||
Reduction in revenue | — | 9,243 | 1,380 | 10,623 | ||||||||||||
Expense | 1,097 | — | — | 1,097 | ||||||||||||
Recoveries, applied amounts, and write-offs | (5,752 | ) | (8,575 | ) | (1,013 | ) | (15,340 | ) | ||||||||
Ending balance at December 31, 2016 | $ | 25,633 | $ | 862 | $ | 6,329 | $ | 32,824 | ||||||||
F-28
CROCS, INC. AND SUBSIDIARIES
NOTES TO CONSOLIDATED FINANCIAL STATEMENTS (Continued)
13. INCOME TAXES
The following table sets forth income before taxes and the expense for income taxes for the years ended December 31, 2016, 2015, and 2014:
Year Ended December 31, | |||||||||||
2016 | 2015 | 2014 | |||||||||
(in thousands) | |||||||||||
Income (loss) before taxes: | |||||||||||
U.S. | $ | (55,617 | ) | $ | (83,537 | ) | $ | (34,622 | ) | ||
Foreign | 48,404 | 8,793 | 26,073 | ||||||||
Total income (loss) before taxes | $ | (7,213 | ) | $ | (74,744 | ) | $ | (8,549 | ) | ||
Income tax expense: | |||||||||||
Current income taxes | |||||||||||
U.S. federal | $ | 49 | $ | 480 | $ | (12,049 | ) | ||||
U.S. state | 126 | 195 | (23 | ) | |||||||
Foreign | 9,494 | 7,488 | 7,620 | ||||||||
Total current income taxes | 9,669 | 8,163 | (4,452 | ) | |||||||
Deferred income taxes: | |||||||||||
U.S. federal | 263 | (3,902 | ) | 400 | |||||||
U.S. state | — | (118 | ) | 236 | |||||||
Foreign | (651 | ) | 4,309 | 193 | |||||||
Total deferred income taxes | (388 | ) | 289 | 829 | |||||||
Total income tax expense (benefit) | $ | 9,281 | $ | 8,452 | $ | (3,623 | ) | ||||
The increase in tax expense for 2016 versus 2015 was driven by the income tax effects on the pretax results in countries where the Company records a provision.
F-29
CROCS, INC. AND SUBSIDIARIES
NOTES TO CONSOLIDATED FINANCIAL STATEMENTS (Continued)
13. INCOME TAXES (Continued)
The following table sets forth income reconciliations of the statutory federal income tax rate to actual rates based on income or loss before income taxes for the years ended December 2016, 2015, and 2014:
December 31, | ||||||||||||||||||||
2016 | 2015 | 2014 | ||||||||||||||||||
(in thousands) | ||||||||||||||||||||
Federal income tax rate | $ | (2,524 | ) | 35.0 | % | $ | (26,160 | ) | 35.0 | % | $ | (2,992 | ) | 35.0 | % | |||||
State income tax rate, net of federal benefit | (202 | ) | 2.8 | (543 | ) | 0.7 | 2,598 | (30.4 | ) | |||||||||||
Effect of rate differences | (12,624 | ) | 175.0 | (3,678 | ) | 4.9 | (3,362 | ) | 39.3 | |||||||||||
Non-deductible / Non-taxable items | 2,694 | (37.4 | ) | (2,181 | ) | 2.9 | (9,904 | ) | 115.8 | |||||||||||
Change in valuation allowance | 16,041 | (222.4 | ) | 10,892 | (14.5 | ) | 5,370 | (62.8 | ) | |||||||||||
U.S. tax on foreign earnings | 23,130 | (320.6 | ) | 82,311 | (110.0 | ) | 17,196 | (201.2 | ) | |||||||||||
Foreign tax credits | (18,581 | ) | 257.6 | (49,432 | ) | 66.1 | (11,026 | ) | 129.0 | |||||||||||
Uncertain tax positions | 19 | (0.3 | ) | (3,952 | ) | 5.3 | (25,172 | ) | 294.4 | |||||||||||
Audit settlements | 253 | (3.5 | ) | 1,167 | (1.6 | ) | 13,448 | (157.3 | ) | |||||||||||
Stock Compensation Windfall / Shortfall | 2,120 | (29.4 | ) | — | — | — | — | |||||||||||||
Deferred income tax account adjustments | (842 | ) | 11.7 | — | — | 8,679 | (101.5 | ) | ||||||||||||
Write-off of income tax receivable | — | — | — | — | 1,577 | (18.4 | ) | |||||||||||||
Other | (203 | ) | 2.8 | 28 | (0.1 | ) | (35 | ) | 0.5 | |||||||||||
Effective income tax rate | $ | 9,281 | (128.7 | )% | $ | 8,452 | (11.3 | )% | $ | (3,623 | ) | 42.4 | % | |||||||
The 2015 and 2014 amounts have been recast to reflect the pertinent amounts on the rows that were added this year.
The following table sets forth deferred income tax assets and liabilities as of December 2016 and 2015:
December 31, | |||||||
2016 | 2015 | ||||||
(in thousands) | |||||||
Non-current deferred tax assets: | |||||||
Stock compensation expense | $ | 4,597 | $ | 7,142 | |||
Long-term accrued expenses | 26,127 | 26,114 | |||||
Net operating loss and charitable contribution carryovers | 36,424 | 22,518 | |||||
Intangible assets | 3,654 | 4,725 | |||||
Future uncertain tax position offset | 396 | 456 | |||||
Unrealized loss on foreign currency | — | 466 | |||||
Foreign tax credit | 69,586 | 27,109 | |||||
Other | 5,481 | 5,548 | |||||
Valuation allowance | (90,900 | ) | (56,572 | ) | |||
Total non-current deferred tax assets | $ | 55,365 | $ | 37,506 | |||
Non-current deferred tax liabilities: | |||||||
Intangible assets | $ | (41 | ) | $ | (24,572 | ) | |
Unremitted earnings of foreign subsidiary | (32,427 | ) | (6,432 | ) | |||
Property and equipment | (16,072 | ) | — | ||||
Total non-current deferred tax liabilities | $ | (48,540 | ) | $ | (31,004 | ) | |
F-30
CROCS, INC. AND SUBSIDIARIES
NOTES TO CONSOLIDATED FINANCIAL STATEMENTS (Continued)
13. INCOME TAXES (Continued)
We annually receive cash from our foreign subsidiaries’ current year earnings. Separately, while we have accrued U.S. federal income tax on substantially all current year foreign earnings from 2010-2016, we treat all other accumulated foreign subsidiary earnings through December 31, 2016, as indefinitely reinvested under the accounting guidance, and accordingly have not provided for any U.S. or foreign tax thereon. In order to arrive at this conclusion, we considered factors including, but not limited to, past experience, domestic cash requirements, and cash requirements to satisfy the ongoing operations, capital expenditures and other financial obligations of our foreign subsidiaries. As of December 31, 2016, U.S. federal income tax expense on approximately $178 million of undistributed earnings and profits attributable to foreign subsidiaries have been accrued. Furthermore, as of December 31, 2016, U.S. income and foreign withholding taxes have not been provided on for approximately $208.1 million of unremitted earnings of subsidiaries operating outside of the U.S. as these amounts are considered to be indefinitely reinvested. These earnings are estimated to represent the excess of the financial reporting over the tax basis in Crocs' investments in those subsidiaries. These earnings, which are considered to be indefinitely reinvested, would become subject to U.S. income tax if they were remitted to the U.S. The amount of unrecognized deferred U.S. federal income tax liability on the unremitted earnings has not been determined because the hypothetical calculation is not practicable.
The Company adopted ASU 2016-09 during the year, which caused an increase in tax attributes recorded for provision purposes. As the net impact of these difference was recorded to retained earnings as a cumulative change, and subsequently valued, there was no net impact to the Company’s financial statements.
During 2016, Crocs received a Private Letter Ruling from the IRS related to a request to claim bonus depreciation for tax years 2011-2013. As such, the Company filed amended tax returns for those periods and subsequently recorded additional deferred tax liabilities associated with our basis differences in fixed assets. This increase was offset against incremental deferred tax assets related to foreign tax credits.
During 2016, we recorded additional tax loss carryforwards in certain European, South American and Asian jurisdictions in the aggregate of $18.2 million, primarily driven by operational losses recognized based on local statutory accounting requirements. As the carryforwards were generated in jurisdictions where we have historically had book losses or do not have strong future projections related to those operations, we concluded that it was more likely than not that the net operating losses would not be realized, and thus recorded a full valuation allowance on the associated deferred tax assets. As such, as of December 31, 2016, Crocs maintains a valuation allowance of $90.9 million. The recognition of these deferred tax assets and fully offsetting valuation allowance resulted in a zero net impact to the consolidated statement of operations, balance sheet and statement of cash flows.
The following table sets forth a reconciliation of the beginning and ending amount of unrecognized tax benefits during the years ended December 31, 2016, 2015 and 2014:
December 31, | |||||||||||
2016 | 2015 | 2014 | |||||||||
(in thousands) | |||||||||||
Unrecognized tax benefit—January 1 | $ | 4,957 | $ | 8,444 | $ | 31,616 | |||||
Gross increases—tax positions in prior period | 646 | 643 | 7 | ||||||||
Gross decreases—tax positions in prior period | (664 | ) | (385 | ) | (3,711 | ) | |||||
Gross increases—tax positions in current period | 245 | 549 | 904 | ||||||||
Settlements | (238 | ) | (4,126 | ) | (20,210 | ) | |||||
Lapse of statute of limitations | (196 | ) | (168 | ) | (162 | ) | |||||
Unrecognized tax benefit—December 31 | $ | 4,750 | $ | 4,957 | $ | 8,444 | |||||
The Company recorded net expense of $0.3 million related to increases in 2016 unrecognized tax benefits combined with amounts effectively settled under audit. Unrecognized tax benefits as of December 31, 2016, relate to tax years that are currently open, and amounts may differ from those to be determined upon closing of the positions. Annual tax provisions include amounts considered sufficient to pay assessments that may result from examination of prior year tax returns; however, the amount ultimately paid upon resolution of issues may differ materially from the amount accrued. Given the uncertainty regarding the timing of the resolution, settlement, and closure of any audits, it is reasonably possible that the balance of gross unrecognized tax benefits could significantly change in the next 12 months. However, given the number of years remaining that are subject to examination, Crocs is unable to estimate the full range of possible adjustments to the balance of gross unrecognized tax benefits.
F-31
CROCS, INC. AND SUBSIDIARIES
NOTES TO CONSOLIDATED FINANCIAL STATEMENTS (Continued)
13. INCOME TAXES (Continued)
As it relates to the impact of uncertain tax positions on the rate reconciliation, the primary impact includes audit settlements, net increases in position changes (both are noted as part of the tax position tabular disclosure), and accrued interest expense. The gross impact of positions effectively settled are disclosed separately as audit settlements. The net benefit related to 2014 audit settlements is not expected to recur in future periods. Note that the interest component, while carried as a liability on the balance sheet and recorded as a component of tax expense, is excluded from the tabular disclosure pursuant to the guidance under ASC 740-10-50.
Interest and penalties related to income tax liabilities are included in income tax expense in the consolidated statement of operations. For the years ended December 31, 2016, 2015 and 2014, Crocs recorded approximately $0.2 million, $0.2 million and $0.8 million, respectively, of penalties and interest. During the year ended December 31, 2016, Crocs released $0.1 million of interest from settlements, lapse of statutes, and change in certainty. The cumulative accrued balance of penalties and interest was $0.6 million, $0.5 million and $0.9 million, as of December 31, 2016, 2015 and 2014, respectively.
Unrecognized tax benefits of $4.8 million, $5.0 million and $8.4 million as of December 31, 2016, 2015 and 2014, respectively, if recognized, would reduce the annual effective tax rate offset by deferred tax assets recorded for uncertain tax positions.
The following table sets forth the tax years subject to examination for the major jurisdictions where we conduct business as of December 31, 2016:
Netherlands | 2009 to 2016 |
Canada | 2009 to 2016 |
Japan | 2010 to 2016 |
China | 2008 to 2016 |
Singapore | 2012 to 2016 |
United States | 2010 to 2016 |
State income tax returns are generally subject to examination for a period of three to five years after filing of the respective return. The state impact of any federal changes remains subject to examination by various state jurisdictions for a period up to two years after formal notification to the states. As such, U.S. state income tax returns for the Company are generally subject to examination for the years 2011 to 2016.
The Company has recorded deferred tax assets related to U.S. federal tax carryforwards, including foreign tax credits and net operating losses, which expire at various dates between 2020 and 2036 of $57.3 million and $21.9 million at December 31, 2016, and December 31, 2015, respectively. The Company has recorded deferred tax assets related to U.S. state tax net operating loss carryforwards which expire at various dates between 2017 and 2036 of $9.4 million and $7.0 million at December 31, 2016, and December 31, 2015, respectively. The Company has recorded deferred tax assets related to foreign tax carryforwards, including foreign tax credits and net operating losses, which expire starting in 2020 and some that do not expire of $39.3 million and $20.7 million as of December 31, 2016, and December 31, 2015, respectively. The significant increase in tax carryforwards is primarily driven by $17.7 million of U.S. tax carryforwards recorded during 2016 which were previously unrecorded stock compensation windfall attributes and from current year net operating losses and foreign tax credit generation.
F-32
CROCS, INC. AND SUBSIDIARIES
NOTES TO CONSOLIDATED FINANCIAL STATEMENTS (Continued)
14. EARNINGS PER SHARE
Basic and diluted earnings (loss) per share ("EPS") for the years ended December 31, 2016, 2015, and 2014 were:
Year Ended December 31, | |||||||||||
2016 | 2015 | 2014 | |||||||||
(in thousands) | |||||||||||
Numerator | |||||||||||
Net loss attributable to common stockholders—basic and diluted | $ | (31,738 | ) | $ | (98,007 | ) | $ | (18,962 | ) | ||
Denominator | |||||||||||
Weighted average common shares outstanding—basic and diluted | 73,371 | 75,604 | 85,140 | ||||||||
Net loss attributable per common share: | |||||||||||
Basic | $ | (0.43 | ) | $ | (1.30 | ) | $ | (0.22 | ) | ||
Diluted | $ | (0.43 | ) | $ | (1.30 | ) | $ | (0.22 | ) | ||
Diluted EPS is calculated using the two-class method for options and RSUs and the if-converted method for Series A preferred stock. For the years ended December 31, 2016, 2015, and 2014, 2.2 million, 2.1 million, and 2.0 million options and RSUs, respectively, were excluded from the calculation of diluted EPS under the two-class method because the effect was anti-dilutive. The Series A preferred shares were excluded in the calculation of diluted EPS under the if-converted method because the effect on was anti-dilutive. If converted, Series A preferred stock would represent approximately 15.8% of the Company's common stock outstanding, or 13.8 million additional common shares as of December 31, 2016.
15. COMMITMENTS AND CONTINGENCIES
Rental Commitments and Contingencies
The Company rents space for its retail stores, offices, warehouses, vehicles, and equipment under operating leases expiring at various dates through 2033. Certain leases contain rent escalation clauses. Rent expense for leases with escalations or rent holidays is recognized on a straight-line basis over the lease term beginning on the lease inception date. Certain leases also provide for contingent rents, which are generally determined as a percent of sales in excess of specified levels. A contingent rent liability is recognized together with the corresponding rent expense when specified levels have been achieved or when the Company determines that achieving the specified levels during the period is probable.
Deferred rent is included in the consolidated balance sheets in 'Accrued expenses and other current liabilities'. Future minimum lease payments under operating leases were as follows:
Year ending December 31, | December 31, 2016 | |||
(in thousands) | ||||
2017 | $ | 68,241 | ||
2018 | 56,125 | |||
2019 | 42,702 | |||
2020 | 35,692 | |||
2021 | 29,230 | |||
Thereafter | 78,565 | |||
Total minimum lease payments | $ | 310,555 | ||
Minimum sublease rentals of $0.2 million under non-cancelable subleases and contingent rentals, which may be paid under certain retail leases on a basis of percentage of sales in excess of stipulated amounts, are excluded from the commitment schedule.
F-33
CROCS, INC. AND SUBSIDIARIES
NOTES TO CONSOLIDATED FINANCIAL STATEMENTS (Continued)
15. LEGAL PROCEEDINGS (Continued)
Rent expense under operating leases was:
Year Ended December 31, | |||||||||||
2016 | 2015 | 2014 | |||||||||
(in thousands) | |||||||||||
Minimum rentals | $ | 88,182 | $ | 96,579 | $ | 108,466 | |||||
Contingent rentals | 14,596 | 14,929 | 16,875 | ||||||||
Less: Sublease rentals | (187 | ) | (322 | ) | (868 | ) | |||||
Total rent expense | $ | 102,591 | $ | 111,186 | $ | 124,473 | |||||
_______________________________________________________________________________
Minimum rentals include all lease payments, fixed and variable common area maintenance, parking and storage fees, which were approximately $10.2 million, $9.1 million, and $9.6 million during the years ended December 31, 2016, 2015, and 2014, respectively.
Purchase Commitments
In December 2011, the Company renewed and amended its supply agreement with Finproject S.p.A. (formerly known as Finproject s.r.l.), which provides the Company the right to purchase certain raw materials used to manufacture its products. The supply agreement requires that the Company meet minimum purchase requirements throughout the term of the agreement, which renews annually on January 1st unless terminated by either party. Historically, the minimum purchase requirements have not been onerous and the Company does not expect them to become onerous in the future. Depending on the material purchased, pricing is based either on contracted price or is subject to quarterly reviews and fluctuates based on order volume, currency fluctuations, and raw material prices. Pursuant to the agreement, the Company guarantees the payment for certain third-party manufacturer purchases of these raw materials up to a maximum potential amount of €3.5 million (approximately $3.7 million as of December 31, 2016).
As of December 31, 2016 and 2015, the Company had firm purchase commitments with other certain third-party manufacturers of $125.9 million and $158.2 million, respectively.
Government Tax Audits
The Company is regularly subject to, and is currently undergoing, audits by tax authorities in the United States and several foreign jurisdictions for prior tax years.
Other
During its normal course of business, the Company may make certain indemnities, commitments and guarantees under which it may be required to make payments in relation to certain matters. The Company cannot determine a range of estimated future payments and has not recorded any liability for indemnities, commitments and guarantees in the accompanying consolidated balance sheets.
See Note 17 — Legal Proceedings for further details regarding potential loss contingencies related to government tax audits and other current legal proceedings.
16. OPERATING SEGMENTS AND GEOGRAPHIC INFORMATION
The Company has three reportable operating segments based on the geographic nature of our operations: Americas, Asia Pacific, and Europe. We also have an 'Other businesses' category which aggregates insignificant operating segments that do not meet the reportable segment threshold, including manufacturing operations located in Mexico and Italy, and corporate operations.
Each of the reportable operating segments derives its revenues from the sale of footwear and accessories to external customers as well as inter-segment sales. Revenues of the Other businesses category are primarily made up of inter-segment sales. The remaining revenues for 'Other businesses' represent non-footwear product sales to external customers. Inter-segment sales are not included in the measurement of segment operating income and are eliminated when reporting total consolidated revenues.
F-34
CROCS, INC. AND SUBSIDIARIES
NOTES TO CONSOLIDATED FINANCIAL STATEMENTS (Continued)
16. OPERATING SEGMENTS AND GEOGRAPHIC INFORMATION (Continued)
Segment performance is evaluated based on segment results without allocating corporate expenses, or indirect general, administrative, and other expenses. Segment profits or losses include adjustments to eliminate inter-segment sales. As such, reconciling items for segment operating income represent unallocated corporate and other expenses as well as inter-segment eliminations.
Year Ended December 31, | |||||||||||
2016 | 2015 | 2014 | |||||||||
(in thousands) | |||||||||||
Revenues: | |||||||||||
Americas | $ | 467,006 | $ | 476,210 | $ | 489,915 | |||||
Asia Pacific | 395,078 | 424,491 | 473,910 | ||||||||
Europe | 173,444 | 188,833 | 233,604 | ||||||||
Total segment revenues | 1,035,528 | 1,089,534 | 1,197,429 | ||||||||
Other businesses | 745 | 1,096 | 794 | ||||||||
Total consolidated revenues | $ | 1,036,273 | $ | 1,090,630 | $ | 1,198,223 | |||||
Operating income: | |||||||||||
Americas (1) | $ | 58,844 | $ | 49,422 | $ | 48,347 | |||||
Asia Pacific (2) | 78,907 | 48,447 | 75,135 | ||||||||
Europe (3) | 17,757 | 15,629 | 24,517 | ||||||||
Total segment operating income | 155,508 | 113,498 | 147,999 | ||||||||
Reconciliation of total segment operating income to income before income taxes: | |||||||||||
Other businesses | (26,935 | ) | (30,092 | ) | (19,400 | ) | |||||
Intersegment eliminations | — | — | (1,498 | ) | |||||||
Unallocated corporate and other(4) | (134,727 | ) | (155,730 | ) | (131,827 | ) | |||||
Total consolidated operating income (loss) | (6,154 | ) | (72,324 | ) | (4,726 | ) | |||||
Foreign currency transaction loss, net | (2,454 | ) | (3,332 | ) | (4,885 | ) | |||||
Interest income | 692 | 967 | 1,664 | ||||||||
Interest expense | (836 | ) | (969 | ) | (806 | ) | |||||
Other income (expense), net | 1,539 | 914 | 204 | ||||||||
Income (loss) before income taxes | $ | (7,213 | ) | $ | (74,744 | ) | $ | (8,549 | ) | ||
Depreciation and amortization: | |||||||||||
Americas | $ | 5,787 | $ | 7,401 | $ | 11,670 | |||||
Asia Pacific | 4,264 | 3,913 | 6,724 | ||||||||
Europe | 2,133 | 2,229 | 3,761 | ||||||||
Total segment depreciation and amortization | 12,184 | 13,543 | 22,155 | ||||||||
Other businesses | 6,830 | 7,634 | 5,900 | ||||||||
Unallocated corporate and other(4) | 15,029 | 14,816 | 9,358 | ||||||||
Total consolidated depreciation and amortization | $ | 34,043 | $ | 35,993 | $ | 37,413 | |||||
Cash paid for Property Plant and Equipment | |||||||||||
Americas | $ | 6,851 | $ | 6,611 | $ | 6,807 | |||||
Europe | 1,388 | 1,510 | 3,061 | ||||||||
Asia Pacific | 4,994 | 4,705 | 6,123 | ||||||||
Total cash paid for Property Plant and Equipment | $ | 13,233 | $ | 12,826 | $ | 15,991 | |||||
Cash paid for Intangible Assets | |||||||||||
Americas | $ | 8,961 | $ | 5,459 | $ | 40,532 | |||||
F-35
CROCS, INC. AND SUBSIDIARIES
NOTES TO CONSOLIDATED FINANCIAL STATEMENTS (Continued)
16. OPERATING SEGMENTS AND GEOGRAPHIC INFORMATION (Continued)
Europe | — | 201 | 208 | ||||||||
Asia | — | — | 295 | ||||||||
Total cash paid for Intangible Assets | $ | 8,961 | $ | 5,660 | $ | 41,035 | |||||
_______________________________________________________________________________
(1) | Includes $1.7 million, $7.2 million, and $4.0 million for the years ended December 31, 2016, 2015, and 2014 respectively, of asset impairment charges related to 12, 27, and 36 underperforming retail locations, respectively. |
(2) | Includes $0.7 million, $0.7 million, and $2.8 million for the years ended December 31, 2016, 2015, and 2014, respectively, of asset impairment charges related to 21, 27, and 14 underperforming retail locations, respectively. Additionally in the year ended December 31, 2015, the company recorded $5.7 million in impairment charges related to South Africa assets, pertaining to 9 retail locations, classified as available for sale. |
(3) | Includes $0.3 million, $1.6 million, and $2.0 million for the years ended December 31, 2016, 2015, and 2014 of asset impairment charges related to 9, 21, and 27 underperforming retail locations. Additionally in the year ended December 31, 2016, the Company recorded $0.4 million in impairment charges related to goodwill in our European retail business. |
(4) | Includes a corporate component consisting primarily of corporate support and administrative functions, costs associated with share-based compensation, research and development, marketing, legal, restructuring, depreciation and amortization of corporate and other assets not allocated to operating segments, and similar costs of certain corporate holding companies. |
The following table sets forth asset information related to reportable operating segments:
December 31, | |||||||
2016 | 2015 | ||||||
(in thousands) | |||||||
Assets (1) | |||||||
Americas | $ | 128,071 | $ | 148,104 | |||
Asia Pacific | 144,037 | 169,865 | |||||
Europe | 69,306 | 46,137 | |||||
Total segment current assets | 341,414 | 364,106 | |||||
Supply Chain | 12,343 | 14,778 | |||||
Corporate(2) | 19,134 | 16,265 | |||||
Income tax receivable | 2,995 | 10,233 | |||||
Other receivables | 14,642 | 14,233 | |||||
Restricted cash - current | 2,534 | 2,554 | |||||
Prepaid expenses and other current assets | 32,413 | 23,780 | |||||
Total current assets | 425,475 | 445,949 | |||||
Property and Equipment, net | 44,090 | 49,490 | |||||
Intangible assets, net | 72,700 | 82,297 | |||||
Goodwill | 1,480 | 1,973 | |||||
Deferred tax assets, net | 6,825 | 6,608 | |||||
Restricted cash | 2,547 | 3,551 | |||||
Other assets | 13,273 | 18,152 | |||||
Total consolidated assets | $ | 566,390 | $ | 608,020 | |||
_______________________________________________________________________________
(1) | Assets by segment include cash and equivalents, net accounts receivable, and inventory. |
(2) | Corporate assets primarily consist of cash and equivalents and inventory. |
F-36
CROCS, INC. AND SUBSIDIARIES
NOTES TO CONSOLIDATED FINANCIAL STATEMENTS (Continued)
16. OPERATING SEGMENTS AND GEOGRAPHIC INFORMATION (Continued)
There were no customers who represented 10% or more of consolidated revenues during the years ended December 31, 2016, 2015 and 2014. The following table sets forth certain geographical information regarding Crocs' revenues during the years ended December 31, 2016, 2015 and 2014:
Year Ended December 31, | |||||||||||
2016 | 2015 | 2014 | |||||||||
(in thousands) | |||||||||||
Location | |||||||||||
United States | $ | 384,939 | $ | 392,463 | $ | 435,154 | |||||
International(1) | 651,334 | 698,167 | 763,069 | ||||||||
Total revenues | $ | 1,036,273 | $ | 1,090,630 | $ | 1,198,223 | |||||
_______________________________________________________________________________
(1) | For the years ended December 31, 2015 and 2014, no individual country represented more than 10% of consolidated revenues. For the year ended December 31, 2016, sales in Japan represented 10.6% of consolidated revenues. |
The following table sets forth geographical information regarding property and equipment assets:
December 31, | |||||||
2016 | 2015 | ||||||
(in thousands) | |||||||
Location | |||||||
United States | $ | 29,420 | $ | 32,954 | |||
International | 14,670 | 16,536 | |||||
Total long-lived assets | $ | 44,090 | $ | 49,490 | |||
Not more than 10% of long-lived assets resided in any individual foreign country in 2016 or 2015.
17. LEGAL PROCEEDINGS
The Company is currently undergoing an audit by U.S. Customs & Border Protection ("CBP") in respect of the period from 2006 to 2010. In October 2013, CBP issued the final audit report. In that report CBP projects that unpaid duties totaling approximately $12.4 million are due for the period under review and recommends collection of the duties due. The Company responded that these projections are erroneous and provided arguments that demonstrate the amount due in connection with this matter is considerably less than the projection. Additionally, on December 12, 2014, The Company made an offer to settle CBP's potential claims and paid $3.5 million. In 2016, after discussions with CBP's local counsel, the Company increased its settlement offer to $7 million and paid an additional $3.5 million during the quarterly period ending December 31, 2016. The revised offer is still subject to formal acceptance by CBP. It is not possible to determine whether the Company and CBP will reach a negotiated settlement or when such a settlement might occur. If a settlement cannot be reached, it is not possible to predict with any certainty whether CBP will seek to assert a claim for penalties in addition to any unpaid duties, but such an assertion is a possibility.
The Company is currently subject to an audit by the Brazilian Federal Tax Authorities related to imports of footwear from China between 2010 and 2014. On January 13, 2015, the Company was notified about the issuance of assessments totaling approximately $4.5 million for the period January 2010 through May 2011. The Company has disputed these assessments and asserted defenses to the claims. On February 25, 2015, the Company received additional assessments totaling approximately $10.2 million related to the remainder of the audit period. The Company has also disputed these assessments and asserted defenses and filed an appeal to these claims. On May 11, 2016, the Company was notified of a decision rejecting the defense filed against the first assessment covering the period of January 2010 through May 2011. The Company filed an appeal of that decision on June 8, 2016. It is anticipated that this matter will take up to two or more years to be resolved. It is not possible at this time to predict the outcome of this matter.
For all other claims and other disputes, where the Company is able to estimate possible losses or a range of possible losses, the Company estimates that as of December 31, 2016, it is reasonably possible that losses associated with these claims and other disputes could potentially exceed amounts accrued by the Company by up to $0.4 million.
F-37
CROCS, INC. AND SUBSIDIARIES
NOTES TO CONSOLIDATED FINANCIAL STATEMENTS (Continued)
15. LEGAL PROCEEDINGS (Continued)
In the aggregate, the Company has accrued $7.4 million associated with our estimated obligations related to legal claims, which is reported in the consolidated balance sheet in 'Accrued expenses and other liabilities'.
The Company is subject to other litigation from time to time in the ordinary course of business, including employment, intellectual property and product liability claims. The Company is not party to any other pending legal proceedings that it believes would reasonably have a material adverse impact on its business, financial position, results of operations or cash flows.
18. EMPLOYEE BENEFIT PLAN
Defined Contribution Plan
The Company sponsors a qualified defined contribution benefit plan (the "Plan"), covering substantially all of its U.S. employees. The Plan includes a savings plan feature under Section 401(k) of the Internal Revenue Code. The Company makes matching contributions to the plans equal to 100% of the first 3%, and up to 50% of the next 2% of salary contributed by an eligible employee. Participants are vested 100% in the Company's matching contributions when made. Contributions made by the Company under the Plan were $5.8 million, $6.0 million and $7.1 million for the years ended December 31, 2016, 2015, and 2014, respectively, and are recorded in 'Selling, general and administrative expenses' in the consolidated statements of operations.
19. UNAUDITED QUARTERLY CONSOLIDATED FINANCIAL INFORMATION
For the Quarter Ended | |||||||||||||||
March 31, 2016 | June 30, 2016 | September 30, 2016 | December 31, 2016 | ||||||||||||
(in thousands, except per share data) | |||||||||||||||
Revenues | $ | 279,140 | $ | 323,828 | $ | 245,888 | $ | 187,417 | |||||||
Gross profit | 129,366 | 169,640 | 122,434 | 78,724 | |||||||||||
Asset impairment charges | 193 | 572 | 930 | 1,449 | |||||||||||
Income (loss) from operations | 14,243 | 20,605 | (1,215 | ) | (39,787 | ) | |||||||||
Net income (loss) | 10,146 | 15,537 | (1,533 | ) | (40,644 | ) | |||||||||
Net income (loss) attributable to common shareholders | 6,361 | 11,735 | (5,352 | ) | (44,482 | ) | |||||||||
Basic income (loss) per common share | $ | 0.07 | $ | 0.13 | $ | (0.07 | ) | $ | (0.60 | ) | |||||
Diluted income (loss) per common share | $ | 0.07 | $ | 0.13 | $ | (0.07 | ) | $ | (0.60 | ) | |||||
For the Quarter Ended | |||||||||||||||
March 31, 2015 | June 30, 2015 | September 30, 2015 | December 31, 2015 | ||||||||||||
(in thousands, except per share data) | |||||||||||||||
Revenues | $ | 262,193 | $ | 345,671 | $ | 274,088 | $ | 208,678 | |||||||
Gross profit | 127,370 | 189,870 | 120,821 | 72,744 | |||||||||||
Restructuring | 3,663 | 2,810 | 981 | 1,274 | |||||||||||
Asset impairment charges | — | 2,075 | 5,460 | 7,771 | |||||||||||
Income (loss) from operations | (2,362 | ) | 16,349 | (20,730 | ) | (65,581 | ) | ||||||||
Net income (loss) | (2,425 | ) | 13,426 | (24,024 | ) | (70,173 | ) | ||||||||
Net income (loss) attributable to common shareholders | (5,979 | ) | 9,690 | (27,776 | ) | (73,942 | ) | ||||||||
Basic income (loss) per common share | $ | (0.08 | ) | $ | 0.11 | $ | (0.37 | ) | $ | (1.01 | ) | ||||
Diluted income (loss) per common share | $ | (0.08 | ) | $ | 0.11 | $ | (0.37 | ) | $ | (1.01 | ) | ||||
F-38
CROCS, INC. AND SUBSIDIARIES
NOTES TO CONSOLIDATED FINANCIAL STATEMENTS (Continued)
19. UNAUDITED QUARTERLY CONSOLIDATED FINANCIAL INFORMATION (Continued)
During the three months ended December 31, 2016 we identified the following factors affecting the comparability of information between periods:
• | Due to the seasonal nature of our products, we experience decreased revenues in the fourth quarter of the year relative to the other quarters. For the quarter ended December 31, 2016 revenue decreased 10.2% as compared to the same quarter of the prior year which was primarily driven by a decrease in sales in the Wholesale and Retail segments. |
• | Gross margin as a percent of revenue remained relatively constant across periods. For the three months ended December 31, 2016 gross margins decreased by 7.8% as compared to the three months ended September 30, 2016 which is typical in the fourth quarter as a result of product mix coupled with traditionally higher year end promotion activities related to the liquidation of current year product lines remaining in inventory. Of the 7.8% decrease in gross margin, 2.3% of the shortfall was due to an increase in royalty expense related to clarification of new and existing agreements, which resulted in a change in estimates for royalties. |
• | Our Income from operations for the quarter ended June 30, 2016 was negatively impacted by an increase of $18.3M in marketing expense related to the Spring/Summer line advertising campaigns. SG&A, otherwise, remained relatively constant across the quarters, with some fluctuation between periods in relation to contingent rent expense that is driven by sales. |
During the three months ended December 31, 2015 we identified the following factors affecting the comparability of information between periods:
• | Due to the seasonal nature of our products, we experience decreased revenues in the fourth quarter of the year relative to the other quarters. For the quarter ended December 31, 2015 revenue increased 1.0% as compared to the same quarter of the prior year. |
• | Revenue and gross profit are typically negatively impacted by an increase in sales returns and allowances in the quarter ended December 31, 2015 due to traditionally higher year end promotion activities related to the liquidation of current year product lines remaining in inventory. For the three months ended December 31, 2015 revenue and gross profit decreased by $8.7 million, relative to the first three quarters of 2015, due to an increase in sales discounts. |
• | Revenue and gross profit for the three months ended December 31, 2015 decreased by an additional $6.0 million due to higher sales returns and allowances, as a percent of gross revenue, as compared to the first three quarters of 2015. This increase in sales returns and allowances is consistent with the fourth quarter of prior years. |
• | Our Income from operations for the quarter ended December 31, 2015 was also negatively impacted by asset impairment charges of $7.8 million, of which $5.7 million related to the impairment of our South Africa asset group with the remaining impairment being related to certain underperforming retail locations. See Note 4 — Property and Equipment for additional information. |
• | Our net income for the quarter ended December 31, 2015 was negatively impacted by a tax expense of $4.7 million primarily associated with an increase in valuation allowances on deferred tax assets which management determined were not likely to be realized in future periods. See Note 13 — Income taxes for additional information. |
20. RESTRUCTURING ACTIVITIES
On July 21, 2014, Crocs announced strategic plans for long-term improvement and growth of the business. These plans comprise four key initiatives including: (1) streamlining the global product and marketing portfolio, (2) reducing direct investment in smaller geographic markets, (3) creating a more efficient organizational structure by reducing excess overhead and enhancing the decision making process, and (4) closing retail locations around the world. The initial effects of these plans were incurred in 2014 and were continued throughout 2015. During the years ended December 31, 2015 and 2014, the Company recorded restructuring charges of $8.7 million and $24.5 million, respectively. As of December 31, 2015, Crocs concluded its restructuring efforts.
F-39
CROCS, INC. AND SUBSIDIARIES
NOTES TO CONSOLIDATED FINANCIAL STATEMENTS (Continued)
20. RESTRUCTURING ACTIVITIES (Continued)
The following table summarizes restructuring activity during the years ended December 31, 2015 and 2014:
Year Ended December 31, | |||||||
2015 | 2014 | ||||||
(in thousands) | |||||||
Severance costs | $ | 5,472 | $ | 12,500 | |||
Lease / contract exit and related costs | 2,623 | 4,251 | |||||
Other(1) | 633 | 7,766 | |||||
Total restructuring charges | $ | 8,728 | $ | 24,517 | |||
_______________________________________________________________________________
(1) | The amounts in 'Other' consist of various asset and inventory impairment charges prompted by the aforementioned restructuring plan, legal fees and facility maintenance fees. |
The following table summarizes the Company's total restructuring charges incurred during the years ended December 31, 2015 and 2014 by reportable segment:
Year Ended December 31, | |||||||
2015 | 2014 | ||||||
(in thousands) | |||||||
Americas | $ | 890 | $ | 4,259 | |||
Asia Pacific | 3,542 | 7,422 | |||||
Europe | 2,824 | 3,934 | |||||
Corporate | 1,472 | 8,902 | |||||
Total restructuring charges | $ | 8,728 | $ | 24,517 | |||
The following table summarizes the Company's accrued restructuring balance and associated activity from December 31, 2014 through December 31, 2015:
December 31, 2014 | Additions | Cash Payments | Adjustments(2) | December 31, 2015 | |||||||||||||||
(in thousands) | |||||||||||||||||||
Severance costs | $ | 3,154 | $ | 5,472 | $ | (8,000 | ) | $ | — | $ | 626 | ||||||||
Lease/ contract exit and related costs | 1,401 | 2,623 | (3,807 | ) | (217 | ) | — | ||||||||||||
Other(1) | 304 | 633 | (595 | ) | — | 342 | |||||||||||||
Total accrued restructuring | $ | 4,859 | $ | 8,728 | $ | (12,402 | ) | $ | (217 | ) | $ | 968 | |||||||
_______________________________________________________________________________
(1) Includes expenses related to exiting stores and legal fees.
(2) Represents reversal of prior year accrual as a result of subleasing an exited facility at a better than anticipated rate.
As of December 31, 2014, Crocs had a liability of approximately $4.9 million related to locations already closed and reductions in workforce in accrued restructuring on the consolidated balance sheet. As of December 31, 2015, the liability had reduced to $1.0 million, which was subsequently paid in 2016.
F-40