Attached files
| file | filename |
|---|---|
| 8-K - 8-K - COVANTA HOLDING CORP | a8kq42016revisedearnings.htm |

NYSE: CVA February 27, 2017
Fourth Quarter 2016
Earnings Conference Call
Exhibit 99.2
Updated based on 8-k filed February 27, 2017

February 27, 2017 2
Cautionary Statements
All information included in this earnings presentation is based on continuing operations, unless otherwise noted.
Forward-Looking Statements
Certain statements in this press release constitute “forward-looking” statements as defined in Section 27A of the Securities Act of 1933 (the “Securities Act”), Section 21E of
the Securities Exchange Act of 1934 (the “Exchange Act”), the Private Securities Litigation Reform Act of 1995 (the “PSLRA”) or in releases made by the Securities and
Exchange Commission (“SEC”), all as may be amended from time to time. Such forward-looking statements involve known and unknown risks, uncertainties and other
important factors that could cause the actual results, performance or achievements of Covanta Holding Corporation and its subsidiaries (“Covanta”) or industry results, to
differ materially from any future results, performance or achievements expressed or implied by such forward-looking statements. Statements that are not historical fact are
forward-looking statements. Forward-looking statements can be identified by, among other things, the use of forward-looking language, such as the words “plan,” “believe,”
“expect,” “anticipate,” “intend,” “estimate,” “project,” “may,” “will,” “would,” “could,” “should,” “seeks,” or “scheduled to,” or other similar words, or the negative of these terms or
other variations of these terms or comparable language, or by discussion of strategy or intentions. These cautionary statements are being made pursuant to the Securities
Act, the Exchange Act and the PSLRA with the intention of obtaining the benefits of the “safe harbor” provisions of such laws. Covanta cautions investors that any forward-
looking statements made by us are not guarantees or indicative of future performance. Important assumptions and other important factors that could cause actual results to
differ materially from those forward-looking statements with respect to Covanta, include, but are not limited to, the risk that Covanta may not successfully grow its business
as expected or close its announced or planned acquisitions or projects in development, and those factors, risks and uncertainties that are described in periodic securities
filings by Covanta with the SEC. Although we believe that our plans, intentions and expectations reflected in or suggested by such forward-looking statements are
reasonable, actual results could differ materially from a projection or assumption in any of our forward-looking statements. Our future financial condition and results of
operations, as well as any forward-looking statements, are subject to change and inherent risks and uncertainties. The forward-looking statements contained in this press
release are made only as of the date hereof and we do not have, or undertake, any obligation to update or revise any forward-looking statements whether as a result of new
information, subsequent events or otherwise, unless otherwise required by law.
Note: All estimates with respect to 2017 and future periods are as of February 15, 2017. Covanta does not have or undertake any obligation to update or revise any forward-
looking statements whether as a result of new information, subsequent events or otherwise, unless otherwise required by law.
Non-GAAP Financial Measures
We use a number of different financial measures, both United States generally accepted accounting principles (“GAAP”) and non-GAAP, in assessing the overall
performance of our business. The non-GAAP financial measures of Adjusted EBITDA, Free Cash Flow and Adjusted EPS, as described and used in this earnings
presentation, are not intended as a substitute or as an alternative to net income, cash flow provided by operating activities or diluted earnings per share as indicators of our
performance or liquidity or any other measures of performance or liquidity derived in accordance with GAAP. In addition, our non-GAAP financial measures may be different
from non-GAAP measures used by other companies, limiting their usefulness for comparison purposes. The presentations of Adjusted EBITDA, Free Cash Flow and
Adjusted EPS are intended to enhance the usefulness of our financial information by providing measures which management internally use to assess and evaluate the
overall performance of its business and those of possible acquisition candidates, and highlight trends in the overall business. Please refer to the appendix of this
presentation for reconciliations of non-GAAP financial measures.

February 27, 2017 3
2016 Summary
(in millions, except per share amounts) FY 2015 FY 2016
FY 2017
Guidance (1)
Revenue $1,645 $1,699 N/A
Adjusted EBITDA $428 $410 $400 - $440
Cash flow provided by operating activities $249 $282 N/A
Free Cash Flow $147 $172 $100 - $150
Diluted EPS $0.51 $(0.03) N/A
Adjusted EPS $0.07 $(0.06) N/A
(Unaudited)
• Strong end of year performance – in line with guidance ranges
• Dublin on target for full operations by the start of Q4 2017
• Completed China sale and repatriated funds to pay down debt
• Meaningful progress on multiple organic growth initiatives
▪ Environmental Solutions business expansion and record profiled waste revenue
▪ Record metal recovery volumes
▪ Continuous Improvement efforts contributing as expected
1) Guidance as of February 15, 2017.

February 27, 2017 4
Waste Update
(in millions, except price) 2015A 2016A 2017E
Waste & Service Revenue:
EfW Waste Processing $929 $962 $975 - $1,005
Environmental Services (1) 56 99 100 - 110
Municipal Services (2) 159 186 ~200
Other (3) 38 36 ~30
Intercompany (4) (78) (96) ~ (90)
Total $1,104 $1,187 $1,215 - $1,255
EfW Tons: (5)
Contracted (6) 17.2 17.4
Uncontracted 2.2 2.2
Total 19.4 19.5 19.5 - 19.7
EfW Revenue per Ton: (7)
Contracted $45.60 $46.48
Uncontracted $65.26 $71.63
Average $47.83 $49.26 $50.00 - $51.00
• Client and new business activity:
▪ Extended waste contracts with clients at Indianapolis
and Huntsville
▪ Expanding CES footprint and service offerings
• 2016 waste and service revenue vs. 2015:
▪ EfW same store price up $24 million (2.5%);
volume up $2 million (0.2%)
▪ EfW profiled waste up 15% year-over-year
• Trends and outlook:
▪ Continued mix shift to profiled waste
▪ Contractual price escalations running at ~1%
▪ Dublin facility to contribute ~150,000 tons at over
$100 per ton in Q4
1) Includes the operation of material processing facilities and related services.
2) Consists of transfer stations and transportation component of NYC MTS contract.
3) Includes waste brokerage, debt service and other revenue unrelated to EfW waste processing.
4) Elimination of intercompany transactions primarily relating to transfer stations.
(Unaudited)
5) Excludes liquid waste.
6) Includes contracts at transfer stations from which waste is internalized.
7) Calculated for EfW waste processing revenue presented above.
Note: certain amounts may not total due to rounding.

February 27, 2017 5
Energy Update
(in millions, except price) 2015A 2016A 2017E
Energy Revenue:
EfW Energy Sales $308 $321 $280 - $300
EfW Capacity 38 40 ~40
Other (1) 75 9 -
Total $421 $370 $320 - $340
EfW MWh Sold:
Contracted 3.0 3.1 2.3 - 2.5
Hedged 1.4 1.9 ~2.5
Market 1.4 1.0 ~1.4
Total 5.8 6.1 6.2 - 6.4
EfW Revenue per MWh: (2)
Contracted $65.56 $65.98 $66 - $67
Hedged $45.64 $42.77 ~ $36
Market $33.18 $31.35 $24 - $36
Average $53.17 $52.70 $44.00 - $48.00
• 2016 energy revenue drivers vs. 2015:
▪ Same store revenue down 1.2%
◦ Volume down $5 million driven by Plymouth
turbine downtime (insured event)
▪ Service to tip fee contract transitions (increasing
revenue share), net of PPA expirations increased
energy revenue by $20 million
• Trends and outlook: 2017 outlook reflects impact of
power contract transitions and lower priced hedges
▪ Hedging activity:
◦ 2017 U.S. market exposure hedged to ~1.4 MWh
◦ Actively hedging 2018 exposure
▪ Natural gas storage and supply benefiting 2017
market prices year-over-year
▪ Dublin facility to contribute ~85k MWh at a blended
rate of ~ $65/MWh in Q4
1) Includes China and Biomass in 2015 and 2016.
2) Excludes capacity revenue.
Note: certain amounts may not total due to rounding.
(Unaudited)

February 27, 2017 6
Recycled Metals Update
($ in millions, except price;
tons in thousands) 2015A 2016A 2017E
Metals Revenue:
Ferrous $38 $38 $35 - $45
Non-Ferrous 23 23 30 - 35
Total $61 $61 $65 - $80
Tons Recovered:
Ferrous 353 401 395 - 400
Non-Ferrous 32 36 35 - 40
Tons Sold:
Ferrous 330 345 325 - 335
Non-Ferrous 32 36 25 - 30
Revenue per Ton Sold:
Ferrous $116 $111 $110 - $140
Non-Ferrous $721 $632 $1,100 - $1,200
Average HMS index price (1) $217 $197 $200 - $250
Average Old Cast Aluminum (2) $0.63 $0.57 $0.55 - $0.61
• 2016 revenue drivers vs. 2015:
▪ Volume benefiting from enhanced recovery
◦ Ferrous same store +1.5% driven by higher
recovery (+14%) partially offset by processing
◦ Non-ferrous up 11%
▪ Lower overall realized sale prices
◦ Ferrous down 3%
◦ Non-ferrous down 12%
• Market trends and outlook:
▪ Reduced Q4 2016 inventory, increasing tons sold
▪ HMS Index averaged $268/ton in Jan/Feb showing
dramatic year-over-year improvement, but expect
softening through 2017
▪ Centralized non-ferrous processing to drive
improved price realization beginning Q2
◦ Up to 70% of total company non-ferrous to be
processed
1) 2016 and 2015 average #1 Heavy Melt Steel composite index ($ / gross ton) as published by American Metal Market.
2) 2016 and 2015 average Old Cast Aluminum Scrap ($ / pound) calculated using the high price as published by American Metal Market.
(Unaudited)
February 27, 2017 7
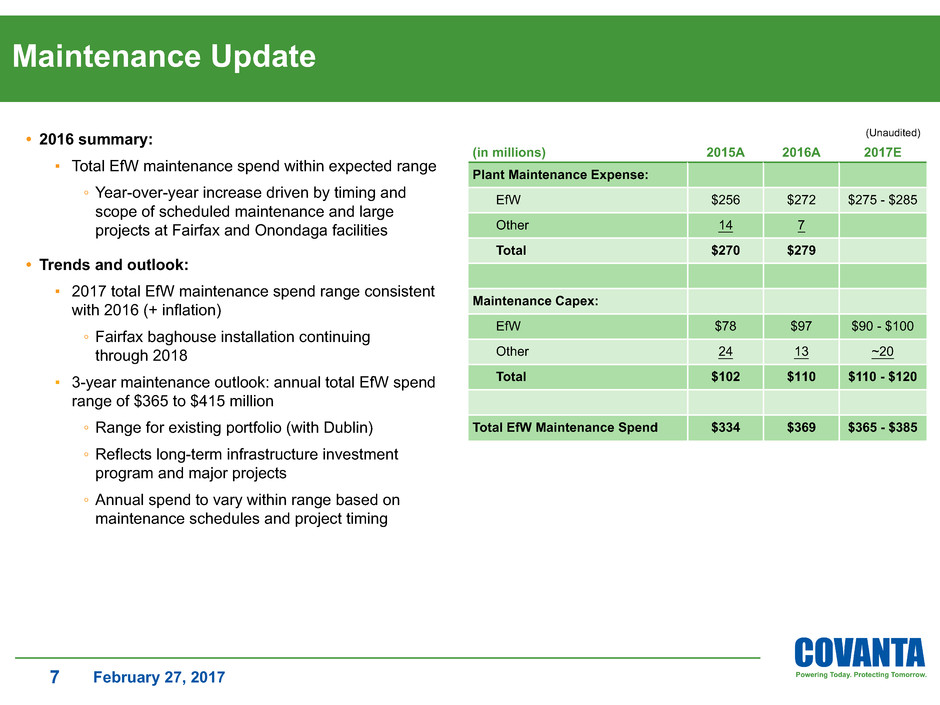
Maintenance Update
• 2016 summary:
▪ Total EfW maintenance spend within expected range
◦ Year-over-year increase driven by timing and
scope of scheduled maintenance and large
projects at Fairfax and Onondaga facilities
• Trends and outlook:
▪ 2017 total EfW maintenance spend range consistent
with 2016 (+ inflation)
◦ Fairfax baghouse installation continuing
through 2018
▪ 3-year maintenance outlook: annual total EfW spend
range of $365 to $415 million
◦ Range for existing portfolio (with Dublin)
◦ Reflects long-term infrastructure investment
program and major projects
◦ Annual spend to vary within range based on
maintenance schedules and project timing
(in millions) 2015A 2016A 2017E
Plant Maintenance Expense:
EfW $256 $272 $275 - $285
Other 14 7
Total $270 $279
Maintenance Capex:
EfW $78 $97 $90 - $100
Other 24 13 ~20
Total $102 $110 $110 - $120
Total EfW Maintenance Spend $334 $369 $365 - $385
(Unaudited)

February 27, 2017 8
Maintenance: Historical Trend and Outlook
Total EfW Maintenance Spend (Expense + Capex):

February 27, 2017 9
▪ Waste contracts predominantly at market, with long-term upside on re-contracting
▪ Majority of remaining energy contract headwind concentrated in 2017, with an incremental $5 to $10 million in 2018
▪ Dublin on target for full commercial operations by start of Q4 2017
▪ Active UK development effort building project pipeline
▪ NYC MTS contract – E. 91st Street start-up targeted for 2018
Long-term Business and Strategic Outlook
▪ Long-term target: sustainably grow core business Adjusted EBITDA at 3-5% annually (ex. commodity prices)
▪ Multiple growth drivers from existing asset base, including:
◦ Continuous Improvement
◦ Expansion of Covanta Environmental Solutions, with double-digit growth in profiled waste
◦ Metals recovery and processing
◦ Total ash processing opportunity
◦ Positive long-term waste market dynamics
▪ Leveraged to long-term recovery in energy and metals markets
Outlook for meaningful growth in 2018 and beyond
Organic Growth
New Investments
Contract Transitions

February 27, 2017 10
Financial Overview

February 27, 2017 11
Revenue: 2016 vs. 2015
1) Driven by waste and service revenue, energy and metals volume, metals processing and construction activity.
(1)

February 27, 2017 12
Adjusted EBITDA: 2016 vs. 2015
1) Driven by waste and service revenue, energy and metals volume, metals processing, plant operating costs, construction activity and overhead.
(1)
February 27, 2017 13
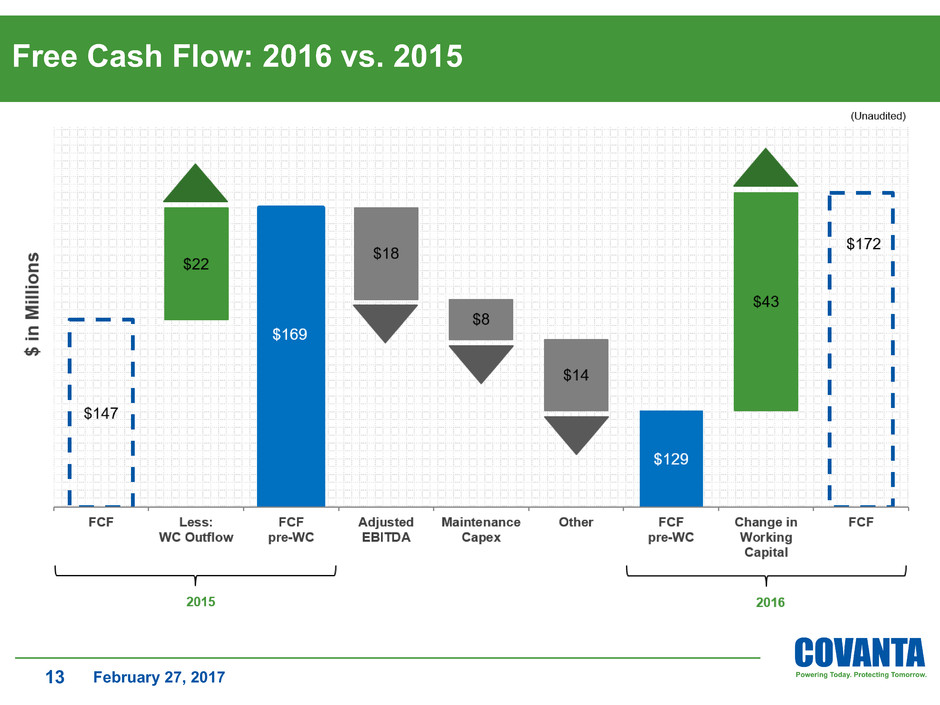
Free Cash Flow: 2016 vs. 2015

February 27, 2017 14
Growth Investment Outlook
Growth Investments (Unaudited, in millions)
FY 2015
Actual
FY 2016
Actual
FY 2017
Outlook
Organic growth investments (1) $34 $46 ~ $25
New York City contract 30 3 –
Essex County EfW emissions control system (2) 26 33 ~5
Acquisitions 72 9 ~6
Subtotal: Corporate funded $162 $91 ~ $35
Dublin facility construction 184 162 ~100
Total growth investments $346 $253 ~ $135
1) Organic growth programs are focused primarily on growing waste, energy and metal revenue and/or reducing operating costs.
2) Classified as growth investment because cost is reflected in overall economic benefit of contract restructuring completed in 2013.
Note: certain amounts may not total due to rounding.
• Remaining Dublin investment to be funded entirely with project financing – no impact on domestic capital allocation
• Acquisitions to be targeted on an opportunistic basis – potential additional activity not reflected in FY 2017 outlook
February 27, 2017 15
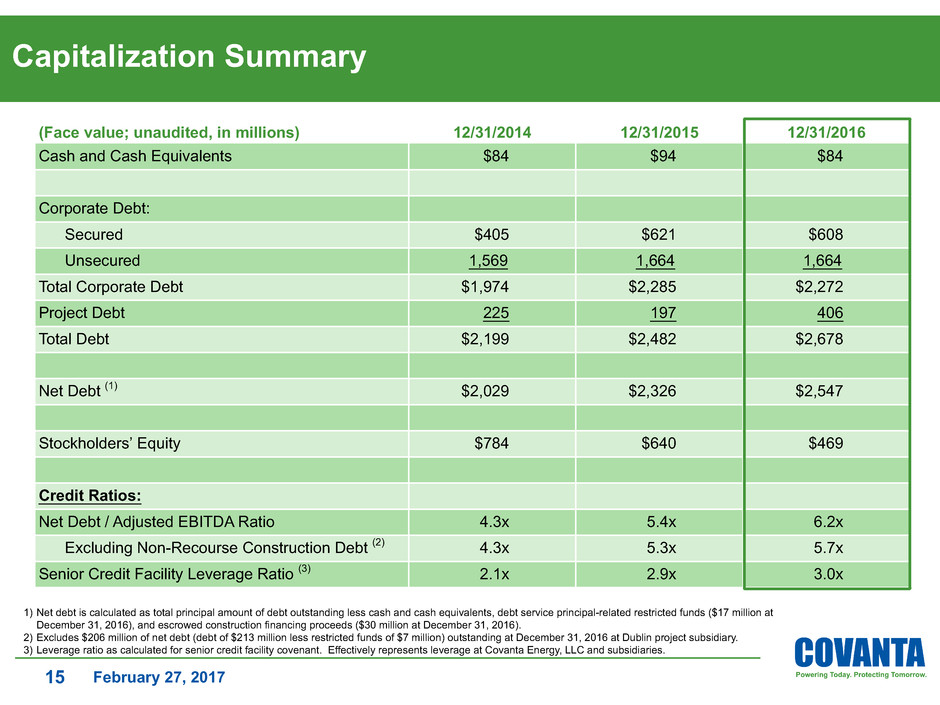
Capitalization Summary
1) Net debt is calculated as total principal amount of debt outstanding less cash and cash equivalents, debt service principal-related restricted funds ($17 million at
December 31, 2016), and escrowed construction financing proceeds ($30 million at December 31, 2016).
2) Excludes $206 million of net debt (debt of $213 million less restricted funds of $7 million) outstanding at December 31, 2016 at Dublin project subsidiary.
3) Leverage ratio as calculated for senior credit facility covenant. Effectively represents leverage at Covanta Energy, LLC and subsidiaries.
(Face value; unaudited, in millions) 12/31/2014 12/31/2015 12/31/2016
Cash and Cash Equivalents $84 $94 $84
Corporate Debt:
Secured $405 $621 $608
Unsecured 1,569 1,664 1,664
Total Corporate Debt $1,974 $2,285 $2,272
Project Debt 225 197 406
Total Debt $2,199 $2,482 $2,678
Net Debt (1) $2,029 $2,326 $2,547
Stockholders’ Equity $784 $640 $469
Credit Ratios:
Net Debt / Adjusted EBITDA Ratio 4.3x 5.4x 6.2x
Excluding Non-Recourse Construction Debt (2) 4.3x 5.3x 5.7x
Senior Credit Facility Leverage Ratio (3) 2.1x 2.9x 3.0x

February 27, 2017 16
Adjusted EBITDA: 2017E vs. 2016
1) Driven by waste and service revenue, energy and metals volume, metals processing, plant operating costs, construction activity and overhead.
(1)

February 27, 2017 17
Free Cash Flow: 2017E vs. 2016
February 27, 2017 18
Appendix
February 27, 2017 19
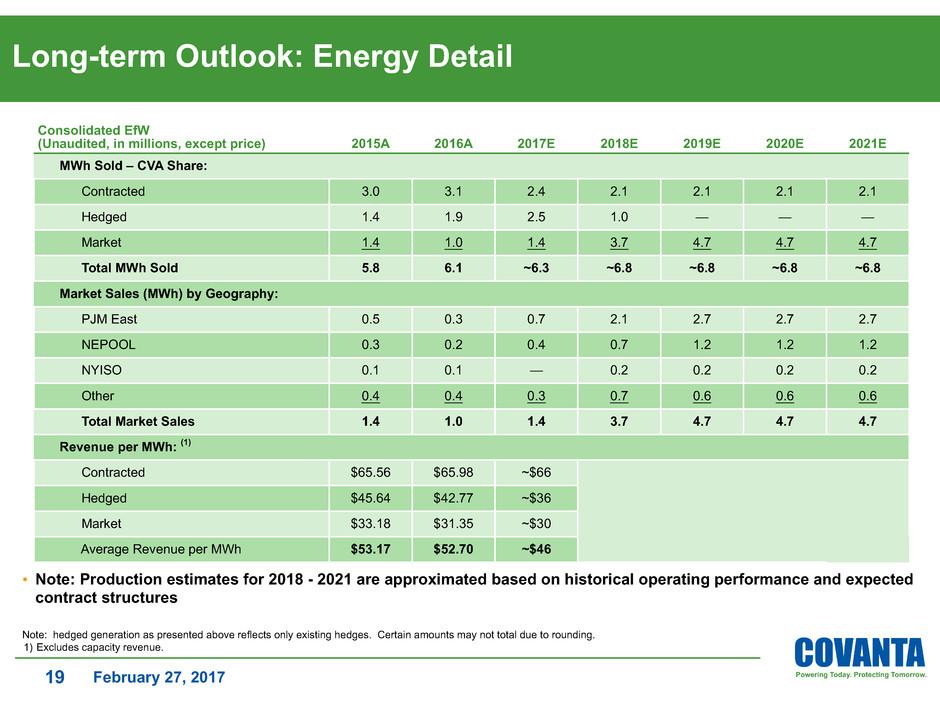
Long-term Outlook: Energy Detail
Consolidated EfW
(Unaudited, in millions, except price) 2015A 2016A 2017E 2018E 2019E 2020E 2021E
MWh Sold – CVA Share:
Contracted 3.0 3.1 2.4 2.1 2.1 2.1 2.1
Hedged 1.4 1.9 2.5 1.0 — — —
Market 1.4 1.0 1.4 3.7 4.7 4.7 4.7
Total MWh Sold 5.8 6.1 ~6.3 ~6.8 ~6.8 ~6.8 ~6.8
Market Sales (MWh) by Geography:
PJM East 0.5 0.3 0.7 2.1 2.7 2.7 2.7
NEPOOL 0.3 0.2 0.4 0.7 1.2 1.2 1.2
NYISO 0.1 0.1 — 0.2 0.2 0.2 0.2
Other 0.4 0.4 0.3 0.7 0.6 0.6 0.6
Total Market Sales 1.4 1.0 1.4 3.7 4.7 4.7 4.7
Revenue per MWh: (1)
Contracted $65.56 $65.98 ~$66
Hedged $45.64 $42.77 ~$36
Market $33.18 $31.35 ~$30
Average Revenue per MWh $53.17 $52.70 ~$46
Note: hedged generation as presented above reflects only existing hedges. Certain amounts may not total due to rounding.
1) Excludes capacity revenue.
• Note: Production estimates for 2018 - 2021 are approximated based on historical operating performance and expected
contract structures
February 27, 2017 20
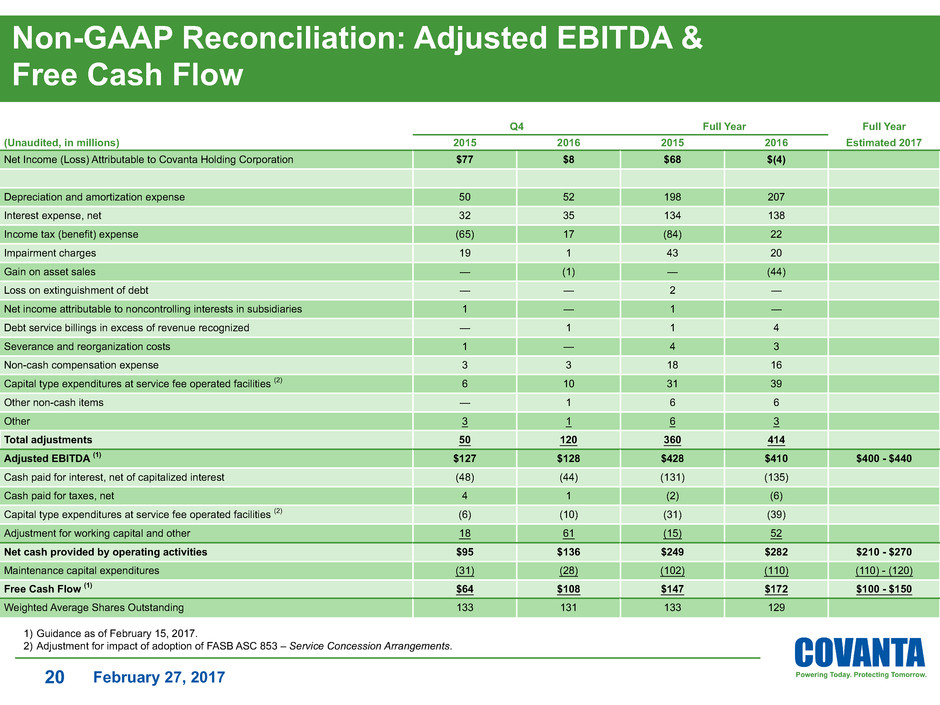
Non-GAAP Reconciliation: Adjusted EBITDA &
Free Cash Flow
Q4 Full Year Full Year
(Unaudited, in millions) 2015 2016 2015 2016 Estimated 2017
Net Income (Loss) Attributable to Covanta Holding Corporation $77 $8 $68 $(4)
Depreciation and amortization expense 50 52 198 207
Interest expense, net 32 35 134 138
Income tax (benefit) expense (65) 17 (84) 22
Impairment charges 19 1 43 20
Gain on asset sales — (1) — (44)
Loss on extinguishment of debt — — 2 —
Net income attributable to noncontrolling interests in subsidiaries 1 — 1 —
Debt service billings in excess of revenue recognized — 1 1 4
Severance and reorganization costs 1 — 4 3
Non-cash compensation expense 3 3 18 16
Capital type expenditures at service fee operated facilities (2) 6 10 31 39
Other non-cash items — 1 6 6
Other 3 1 6 3
Total adjustments 50 120 360 414
Adjusted EBITDA (1) $127 $128 $428 $410 $400 - $440
Cash paid for interest, net of capitalized interest (48) (44) (131) (135)
Cash paid for taxes, net 4 1 (2) (6)
Capital type expenditures at service fee operated facilities (2) (6) (10) (31) (39)
Adjustment for working capital and other 18 61 (15) 52
Net cash provided by operating activities $95 $136 $249 $282 $210 - $270
Maintenance capital expenditures (31) (28) (102) (110) (110) - (120)
Free Cash Flow (1) $64 $108 $147 $172 $100 - $150
Weighted Average Shares Outstanding 133 131 133 129
1) Guidance as of February 15, 2017.
2) Adjustment for impact of adoption of FASB ASC 853 – Service Concession Arrangements.

February 27, 2017 21
Non-GAAP Reconciliation: Adjusted EBITDA
Full Year
(Unaudited, in millions) 2014 2015 2016
Net (Loss) Income Attributable to Covanta Holding Corporation $(2) $68 $(4)
Operating Loss related to insurance subsidiaries 2 — —
Depreciation and amortization expense 211 198 207
Interest expense, net 147 134 138
Income tax expense (benefit) 15 (84) 22
Impairment charges — 43 20
Gain on asset sales 64 — (44)
Loss on extinguishment of debt 2 2 —
Net income attributable to noncontrolling interests in subsidiaries 1 1 —
Debt service billings in excess of revenue recognized 2 1 4
Severance and reorganization costs 9 4 3
Non-cash compensation expense 17 18 16
Capital type expenditures at service fee operated facilities (1) — 31 39
Other non-cash items 6 6 6
Other — 6 3
Total adjustments 476 360 414
Adjusted EBITDA $474 $428 $410
Note: Adjusted EBITDA results provided to reconcile the denominator of the Net Debt / Adjusted EBITDA ratios on slide 15.
1) Adjustment for impact of adoption of FASB ASC 853 – Service Concession Arrangements.

February 27, 2017 22
Non-GAAP Reconciliation: Adjusted EPS
Q4 YTD
(Unaudited, in millions, except per share amounts) 2015 2016 2015 2016
Diluted Earnings Per Share $0.58 $0.06 $0.51 $(0.03)
Reconciling Items (0.55) 0.11 (0.44) (0.03)
Adjusted EPS $0.03 $0.17 $0.07 $(0.06)
Reconciling Items
Impairment charges $19 $1 $43 $20
Gain on asset sales — (1) — (44)
Severance and reorganization costs — — 7 2
Loss on extinguishment of debt — — 2 —
Effect on income of derivative instruments not designated as hedging instruments (3) — (6) 2
Effect of foreign exchange loss on indebtedness 1 — 3 (1)
Other 1 — 1 —
Total Reconciling Items, pre-tax 18 — 50 (21)
Pro forma income tax impact (2) — (20) 2
Impact of IRS audit settlement (93) — (93) —
Adjustment to uncertain tax positions — 14 — 14
Tax liability related to expected gain on sale of China assets 4 — 4 —
Grantor trust activity (1) — — 1
Total Reconciling Items, net of tax $(74) $14 $(59) $(4)
Diluted Earnings Per Share Impact $(0.55) $0.11 $(0.44) $(0.03)
Weighted Average Shares Outstanding 133 131 133 129
February 27, 2017 23
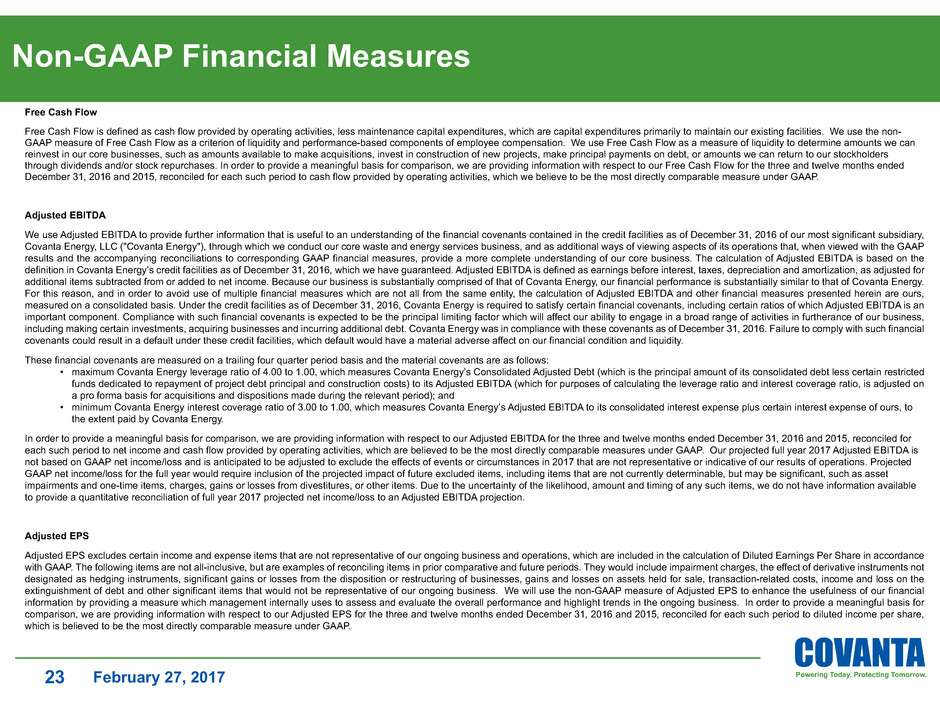
Non-GAAP Financial Measures
Free Cash Flow
Free Cash Flow is defined as cash flow provided by operating activities, less maintenance capital expenditures, which are capital expenditures primarily to maintain our existing facilities. We use the non-
GAAP measure of Free Cash Flow as a criterion of liquidity and performance-based components of employee compensation. We use Free Cash Flow as a measure of liquidity to determine amounts we can
reinvest in our core businesses, such as amounts available to make acquisitions, invest in construction of new projects, make principal payments on debt, or amounts we can return to our stockholders
through dividends and/or stock repurchases. In order to provide a meaningful basis for comparison, we are providing information with respect to our Free Cash Flow for the three and twelve months ended
December 31, 2016 and 2015, reconciled for each such period to cash flow provided by operating activities, which we believe to be the most directly comparable measure under GAAP.
Adjusted EBITDA
We use Adjusted EBITDA to provide further information that is useful to an understanding of the financial covenants contained in the credit facilities as of December 31, 2016 of our most significant subsidiary,
Covanta Energy, LLC ("Covanta Energy"), through which we conduct our core waste and energy services business, and as additional ways of viewing aspects of its operations that, when viewed with the GAAP
results and the accompanying reconciliations to corresponding GAAP financial measures, provide a more complete understanding of our core business. The calculation of Adjusted EBITDA is based on the
definition in Covanta Energy’s credit facilities as of December 31, 2016, which we have guaranteed. Adjusted EBITDA is defined as earnings before interest, taxes, depreciation and amortization, as adjusted for
additional items subtracted from or added to net income. Because our business is substantially comprised of that of Covanta Energy, our financial performance is substantially similar to that of Covanta Energy.
For this reason, and in order to avoid use of multiple financial measures which are not all from the same entity, the calculation of Adjusted EBITDA and other financial measures presented herein are ours,
measured on a consolidated basis. Under the credit facilities as of December 31, 2016, Covanta Energy is required to satisfy certain financial covenants, including certain ratios of which Adjusted EBITDA is an
important component. Compliance with such financial covenants is expected to be the principal limiting factor which will affect our ability to engage in a broad range of activities in furtherance of our business,
including making certain investments, acquiring businesses and incurring additional debt. Covanta Energy was in compliance with these covenants as of December 31, 2016. Failure to comply with such financial
covenants could result in a default under these credit facilities, which default would have a material adverse affect on our financial condition and liquidity.
These financial covenants are measured on a trailing four quarter period basis and the material covenants are as follows:
• maximum Covanta Energy leverage ratio of 4.00 to 1.00, which measures Covanta Energy’s Consolidated Adjusted Debt (which is the principal amount of its consolidated debt less certain restricted
funds dedicated to repayment of project debt principal and construction costs) to its Adjusted EBITDA (which for purposes of calculating the leverage ratio and interest coverage ratio, is adjusted on
a pro forma basis for acquisitions and dispositions made during the relevant period); and
• minimum Covanta Energy interest coverage ratio of 3.00 to 1.00, which measures Covanta Energy’s Adjusted EBITDA to its consolidated interest expense plus certain interest expense of ours, to
the extent paid by Covanta Energy.
In order to provide a meaningful basis for comparison, we are providing information with respect to our Adjusted EBITDA for the three and twelve months ended December 31, 2016 and 2015, reconciled for
each such period to net income and cash flow provided by operating activities, which are believed to be the most directly comparable measures under GAAP. Our projected full year 2017 Adjusted EBITDA is
not based on GAAP net income/loss and is anticipated to be adjusted to exclude the effects of events or circumstances in 2017 that are not representative or indicative of our results of operations. Projected
GAAP net income/loss for the full year would require inclusion of the projected impact of future excluded items, including items that are not currently determinable, but may be significant, such as asset
impairments and one-time items, charges, gains or losses from divestitures, or other items. Due to the uncertainty of the likelihood, amount and timing of any such items, we do not have information available
to provide a quantitative reconciliation of full year 2017 projected net income/loss to an Adjusted EBITDA projection.
Adjusted EPS
Adjusted EPS excludes certain income and expense items that are not representative of our ongoing business and operations, which are included in the calculation of Diluted Earnings Per Share in accordance
with GAAP. The following items are not all-inclusive, but are examples of reconciling items in prior comparative and future periods. They would include impairment charges, the effect of derivative instruments not
designated as hedging instruments, significant gains or losses from the disposition or restructuring of businesses, gains and losses on assets held for sale, transaction-related costs, income and loss on the
extinguishment of debt and other significant items that would not be representative of our ongoing business. We will use the non-GAAP measure of Adjusted EPS to enhance the usefulness of our financial
information by providing a measure which management internally uses to assess and evaluate the overall performance and highlight trends in the ongoing business. In order to provide a meaningful basis for
comparison, we are providing information with respect to our Adjusted EPS for the three and twelve months ended December 31, 2016 and 2015, reconciled for each such period to diluted income per share,
which is believed to be the most directly comparable measure under GAAP.
