Attached files
| file | filename |
|---|---|
| EX-32 - EXHIBIT 32 - COVANTA HOLDING CORP | ex32-123116x10k.htm |
| EX-31.2 - EXHIBIT 31.2 - COVANTA HOLDING CORP | ex312-123116x10k.htm |
| EX-31.2 - EXHIBIT 31.2 - COVANTA HOLDING CORP | ex311-123116x10k.htm |
| EX-23.1 - EXHIBIT 23.1 - COVANTA HOLDING CORP | ex231-123116x10k.htm |
| EX-21.1 - EXHIBIT 21.1 - COVANTA HOLDING CORP | ex211-123116x10k.htm |
| EX-12.1 - EXHIBIT 12.1 - COVANTA HOLDING CORP | ex121-123116x10k.htm |
| EX-10.35 - EXHIBIT 10.35 - COVANTA HOLDING CORP | ex1035-1231x16x10k.htm |
| EX-10.34 - EXHIBIT 10.34 - COVANTA HOLDING CORP | ex1034-123116x10k.htm |
| EX-10.28 - EXHIBIT 10.28 - COVANTA HOLDING CORP | ex1028-123116x10k.htm |
UNITED STATES SECURITIES AND EXCHANGE COMMISSION
Washington, D.C. 20549
Form 10-K
þ | ANNUAL REPORT PURSUANT TO SECTION 13 OR 15(d) OF THE SECURITIES EXCHANGE ACT OF 1934 |
For the fiscal year ended December 31, 2016
or
¨ | TRANSITION REPORT PURSUANT TO SECTION 13 OR 15(d) OF THE SECURITIES EXCHANGE ACT OF 1934 |
For the transition period from to
Commission file number 1-06732
COVANTA HOLDING CORPORATION
(Exact name of registrant as specified in its charter)
Delaware | 95-6021257 | |
(State or Other Jurisdiction of Incorporation or Organization) | (I.R.S. Employer Identification Number) | |
445 South Street, Morristown, NJ | 07960 | |
(Address of Principal Executive Office) | (Zip Code) | |
Registrant’s telephone number, including area code: (862) 345-5000
Securities registered pursuant to Section 12(b) of the Act:
Title of Each Class | Name of Each Exchange on Which Registered | |
Common Stock, $0.10 par value per share | New York Stock Exchange | |
Securities registered pursuant to Section 12(g) of the Act: None
Indicate by check mark if the registrant is a well-known seasoned issuer, as defined in Rule 405 of the Securities Act. Yes þ No ¨
Indicate by check mark if the registrant is not required to file reports pursuant to Section 13 or Section 15(d) of the Exchange Act. Yes ¨ No þ
Indicate by check mark whether the registrant (1) has filed all reports required to be filed by Section 13 or 15(d) of the Securities Exchange Act of 1934 during the preceding 12 months (or for such shorter period that the registrant was required to file such reports), and (2) has been subject to such filing requirements for the past 90 days. Yes þ No ¨
Indicate by check mark whether the registrant has submitted electronically and posted on its corporate Website, if any, every Interactive Data File required to be submitted and posted pursuant to Rule 405 of Regulation S-T during the preceding 12 months (or for such shorter period that the registrant was required to submit and post such files). Yes þ No ¨
Indicate by check mark if disclosure of delinquent filers pursuant to Item 405 of Regulation S-K is not contained herein, and will not be contained, to the best of registrant’s knowledge, in definitive proxy or information statements incorporated by reference in Part III of this Form 10-K or any amendment to this Form10-K. þ
Indicate by check mark whether the registrant is a large accelerated filer, an accelerated filer, a non-accelerated filer, or a smaller reporting company. See the definitions of “large accelerated filer,” “accelerated filer” and “smaller reporting company” in Rule 12b-2 of the Exchange Act. (Check one):
Large accelerated filer þ | Accelerated filer ¨ | Non-accelerated filer ¨ | Smaller reporting company ¨ |
(Do not check if a smaller reporting company) | |||
Indicate by check mark whether the registrant is a shell company (as defined in Rule 12b-2 of the Exchange Act). Yes ¨ No þ
As of June 30, 2016, the aggregate market value of the registrant’s common stock held by non-affiliates of the registrant was $1.9 billion. The aggregate market value was computed by using the closing price of the common stock as of that date on the New York Stock Exchange. (For purposes of calculating this amount only, all directors and executive officers of the registrant have been treated as affiliates.)
Indicate the number of shares outstanding of each of the registrant’s classes of common stock, as of the latest practicable date.
Class | Outstanding at February 17, 2017 | |
Common Stock, $0.10 par value | 130,401,036 | |
Documents Incorporated By Reference:
Part of Form 10-K of Covanta Holding Corporation | Documents Incorporated by Reference | |
Part III | Portions of the Proxy Statement to be filed with the Securities and Exchange Commission in connection with the 2017 Annual Meeting of Stockholders. | |
TABLE OF CONTENTS
Page | ||||
2
CAUTIONARY NOTE REGARDING FORWARD-LOOKING STATEMENTS
Certain statements in this Annual Report on Form 10-K may constitute “forward-looking” statements as defined in Section 27A of the Securities Act of 1933 (the “Securities Act”), Section 21E of the Securities Exchange Act of 1934 (the “Exchange Act”), the Private Securities Litigation Reform Act of 1995 (the “PSLRA”) or in releases made by the Securities and Exchange Commission (“SEC”), all as may be amended from time to time. Such forward-looking statements involve known and unknown risks, uncertainties and other important factors that could cause the actual results, performance or achievements of Covanta Holding Corporation and its subsidiaries (“Covanta”) or industry results, to differ materially from any future results, performance or achievements expressed or implied by such forward-looking statements. Statements that are not historical fact are forward-looking statements. Forward-looking statements can be identified by, among other things, the use of forward-looking language, such as the words “plan,” “believe,” “expect,” “anticipate,” “intend,” “estimate,” “project,” “may,” “will,” “would,” “could,” “should,” “seeks,” or “scheduled to,” or other similar words, or the negative of these terms or other variations of these terms or comparable language, or by discussion of strategy or intentions. These cautionary statements are being made pursuant to the Securities Act, the Exchange Act and the PSLRA with the intention of obtaining the benefits of the “safe harbor” provisions of such laws. Covanta cautions investors that any forward-looking statements made by us are not guarantees or indicative of future performance. Important factors, risks and uncertainties that could cause actual results to differ materially from those forward-looking statements include, but are not limited to:
• | seasonal or long-term fluctuations in the prices of energy, waste disposal, scrap metal and commodities; |
• | our ability to renew or replace expiring contracts at comparable prices and with other acceptable terms; |
• | adoption of new laws and regulations in the United States and abroad, including energy laws, environmental laws, tax laws, labor laws and healthcare laws; |
• | failure to maintain historical performance levels at our facilities and our ability to retain the rights to operate facilities we do not own; |
• | our ability to avoid adverse publicity or reputational damage relating to our business; |
• | advances in technology; |
• | difficulties in the operation of our facilities, including fuel supply and energy delivery interruptions, failure to obtain regulatory approvals, equipment failures, labor disputes and work stoppages, and weather interference and catastrophic events; |
• | difficulties in the financing, development and construction of new projects and expansions, including increased construction costs and delays; |
• | limits of insurance coverage; |
• | our ability to avoid defaults under our long-term contracts; |
• | performance of third parties under our contracts and such third parties' observance of laws and regulations; |
• | concentration of suppliers and customers; |
• | geographic concentration of facilities; |
• | increased competitiveness in the energy and waste industries; |
• | changes in foreign currency exchange rates; |
• | limitations imposed by our existing indebtedness and our ability to perform our financial obligations and guarantees and to refinance our existing indebtedness; |
• | exposure to counterparty credit risk and instability of financial institutions in connection with financing transactions; |
• | the scalability of our business; |
• | our ability to attract and retain talented people; |
• | failures of disclosure controls and procedures and internal controls over financial reporting; |
• | our ability to utilize net operating loss carryforwards; |
• | general economic conditions in the United States and abroad, including the availability of credit and debt financing; |
• | restrictions in our certificate of incorporation and debt documents regarding strategic alternatives; and |
• | other risks and uncertainties affecting our businesses described in Item 1A. Risk Factors of this Annual Report on Form 10-K and in other filings by Covanta with the SEC. |
Although we believe that our plans, intentions and expectations reflected in or suggested by such forward-looking statements are reasonable, actual results could differ materially from a projection or assumption in any of our forward-looking statements. Our future financial condition and results of operations, as well as any forward-looking statements, are subject to change and inherent risks and uncertainties. The forward-looking statements contained in this Annual Report on Form 10-K are made only as of the date hereof and we do not have, or undertake, any obligation to update or revise any forward-looking statements whether as a result of new information, subsequent events or otherwise, unless otherwise required by law.
3
AVAILABILITY OF INFORMATION
You may read and copy any materials Covanta files with the SEC at the SEC’s Public Reference Room at 100 F Street, N.E., Room 1580, Washington, D.C. 20549. Copies of such materials also can be obtained free of charge at the SEC’s website, www.sec.gov, or by mail from the Public Reference Room of the SEC, at prescribed rates. Please call the SEC at 1-800-SEC-0330 for further information on the operation of the Public Reference Room. Covanta’s SEC filings are also available to the public, free of charge, on its corporate website, www.covanta.com as soon as reasonably practicable after Covanta electronically files such material with, or furnishes it to, the SEC. Covanta’s common stock is traded on the New York Stock Exchange. Material filed by Covanta can be inspected at the offices of the New York Stock Exchange at 20 Broad Street, New York, N.Y. 10005.
4
PART I
Item 1. BUSINESS
The terms “we,” “our,” “ours,” “us,” “Covanta” and “Company” refer to Covanta Holding Corporation and its subsidiaries and the term “Covanta Energy” refers to our subsidiary Covanta Energy, LLC and its subsidiaries.
About Covanta Holding Corporation
We are organized as a holding company, which was incorporated in Delaware on April 16, 1992. We conduct all of our operations through subsidiaries, which are engaged predominantly in the businesses of waste and energy services. We have one reportable segment, North America, which is comprised of waste and energy services operations located primarily in the United States and Canada. Outside of North America, we are currently constructing an energy-from-waste facility in Dublin, Ireland, which we own and will operate upon completion. We hold interests in an energy-from-waste facility in Italy and an infrastructure business in China which is engaged in energy-from-waste operations. Additional information about our reportable segment and our operations by geographic area is contained in Item 8. Financial Statements And Supplementary Data — Note 6. Financial Information by Business Segments.
During 2016, we divested the majority of our investments in China. For additional information see Item 8. Financial Statements And Supplementary Data — Note 4. Dispositions, Assets Held for Sale and Discontinued Operations.
Our Energy-from-Waste Business
Our mission is to provide sustainable waste and energy solutions. We seek to do this through a variety of service offerings, including our core business of owning and operating infrastructure for the conversion of waste to energy (known as “energy-from-waste” or “EfW”).
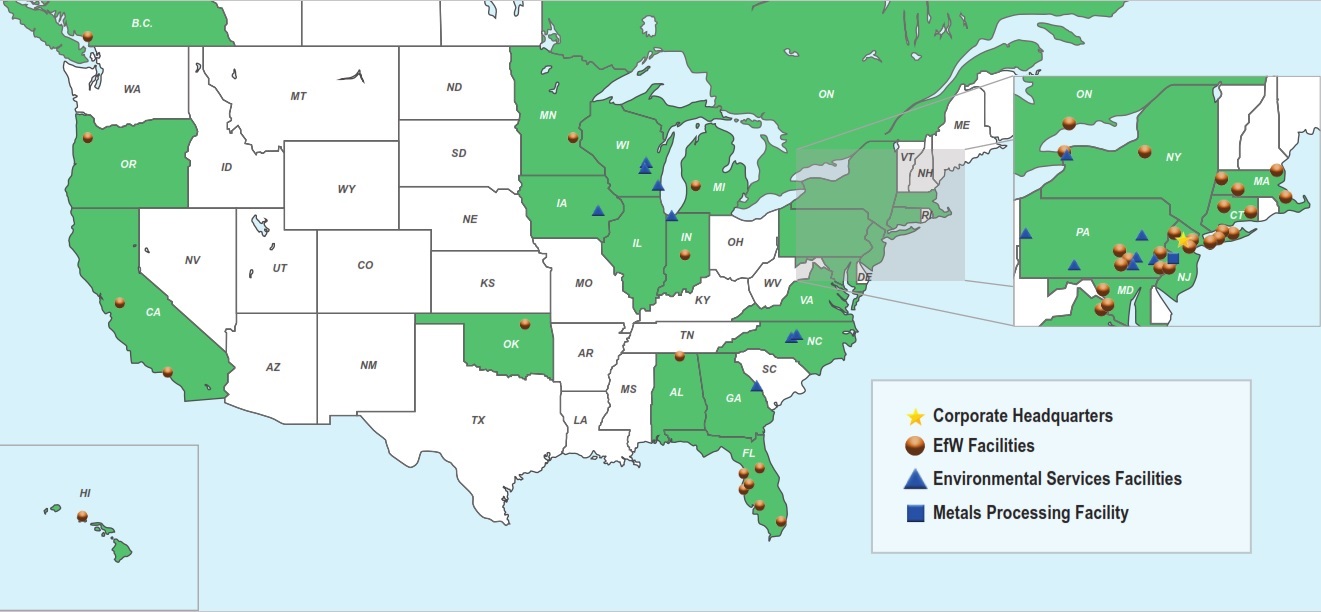
Our EfW facilities earn revenue from both the disposal of waste and the generation of electricity, generally under long-term contracts, as well as from the sale of metals recovered during the EfW process. Our facilities process approximately 20 million tons of solid waste annually, equivalent to 8% of post-recycled municipal solid waste (“MSW”) generated in the United States. We operate and/or have ownership positions in 42 EfW facilities, which are primarily located in North America, and 5 additional energy generation facilities, including other renewable energy production facilities in North America (wood biomass and hydroelectric). In total, these assets produce approximately 10 million megawatt hours (“MWh”) of baseload electricity annually. We also operate waste management infrastructure, including 17 waste transfer stations, 15 environmental services facilities, 4 landfills (primarily for ash disposal) and one metals processing facility, all of which are complementary to our core EfW business.
Energy-from-waste serves two key markets as both a sustainable waste management solution that is environmentally superior to landfilling and as a source of clean energy that reduces overall greenhouse gas emissions. Energy-from-waste is considered renewable under the laws of many states and under federal law. Our facilities are critical infrastructure assets that allow our customers, which are principally municipal entities, to provide an essential public service through sustainable practices.
Energy-from-waste facilities produce energy through the combustion of non-hazardous MSW in specially-designed power plants. Most of our facilities are “mass-burn” facilities, which combust the MSW on an as-received basis without any pre-processing such as shredding, sorting or sizing. The process reduces the waste to an inert ash while extracting ferrous and non-ferrous metals for recycling. In addition to our mass-burn facilities, we own and/or operate additional facilities that use other processes or technologies, such as refuse-derived fuel facilities which process waste prior to combustion and a gasification technology, in which waste is heated to create gases that are then combusted.
Environmental Benefits of Energy-from-Waste
We believe that EfW offers solutions to public sector leaders around the world for addressing two key issues: sustainable management of waste and renewable energy generation. We believe that the environmental benefits of EfW, as an alternative to landfilling, are clear and compelling: by processing municipal solid waste in EfW facilities, we reduce greenhouse gas (“GHG”) emissions, lower the risk of groundwater contamination, and conserve land. Increased use of EfW facilities can reduce GHG emissions, as the methane emitted by landfills is over 80 times more potent than carbon dioxide (“CO2”) over a 20-year period. At the same time, EfW generates clean, reliable energy from a renewable fuel source, thus reducing dependence on fossil fuels, the combustion of which is itself a major contributor of GHG emissions. The United States Environmental Protection Agency (“EPA”), using lifecycle tools such as its own Municipal Solid Waste Decision Support Tool, has found that, on average, approximately one ton of CO2-equivalent is reduced relative to landfilling for every ton of waste processed. Compared with fossil fuel based generation, each ton of waste processed eliminates the need to consume approximately one barrel of oil or one-quarter ton of coal, in order to generate the equivalent amount of electricity. We believe EfW is also an important component of business and community efforts to divert post-recycled waste from landfills as part of their zero-waste and zero-waste-to-landfill initiatives. As public planners and commercial and industrial companies address their needs for more environmentally sustainable waste management and energy generation in the years ahead, we believe that EfW will be an increasingly attractive alternative.
5
Other Environmental Services Offerings
In addition to our core EfW business, we offer a variety of sustainable waste management solutions in response to customer demand, including onsite clean-up services, wastewater treatment, transportation and logistics, recycling and depackaging. Together with our processing of non-hazardous "profiled waste" for purposes of assured destruction or sustainability goals in our EfW facilities, we offer these services under our Covanta Environmental Solutions brand. Through acquisitions, we have expanded our network of facilities to enable us to provide a range of services to industrial customers for the treatment, recycling and/or disposal of their non-hazardous materials. These businesses are highly synergistic with our existing profiled waste business, offer us the opportunity to expand the geographical sourcing of our waste streams and expand our presence in the environmental services sector, allowing us to drive higher margin profiled waste volumes into our EfW facilities and access additional revenue growth opportunities.
STRATEGY
Each of our service offerings responds to customer demand for sustainable waste management services that are superior to landfilling according to the “waste hierarchy" and assists our customers in meeting their own zero-waste, zero-waste-to-landfill and other sustainability goals. As indicated above, each of our service offerings is focused on providing cost effective and sustainable solutions that leverage our extensive network of EfW facilities and transfer stations in North America.
We intend to pursue our mission through the following key strategies:
• | Preserve and grow the value of our existing portfolio. We intend to maximize the long-term value of our existing portfolio of facilities by continuously improving safety, health and environmental performance, working to provide superior customer service, continuing to operate at our historic production levels, maintaining our facilities in optimal condition, extending waste and service contracts, and conducting our business more efficiently. We intend to achieve organic growth by expanding our customer base, service offerings and metal recovery, adding waste, service or energy contracts, investing in and enhancing the capabilities of our existing assets, and deploying new or improved technologies, systems, processes and controls, all targeted at increasing revenue or reducing costs. |
• | Expand through acquisitions and/or development in selected attractive markets. We seek to grow our portfolio primarily through acquisitions, competitive bids for new contracts, and development of new facilities or businesses where we believe that market and regulatory conditions will enable us to utilize our skills and/or invest our capital at attractive risk-adjusted rates of return. We focus these efforts in markets where we currently have projects in operation or under construction, and in other markets with strong economic fundamentals and predictable legal and policy support. In addition to our focus on EfW and related waste sourcing activities, we are seeking to expand our environmental service offerings through both organic growth and acquisitions. |
We believe that our approach to these opportunities is highly-disciplined, both with regard to our required rates of return on invested capital and the manner in which potential acquired businesses or new projects will be structured and financed.
• | Develop and commercialize new technology. We believe that our efforts to protect and expand our business will be enhanced by the development of additional technologies in such fields as recycling, alternative waste treatment processes, gasification, combustion controls, emission controls and residue recovery, reuse or disposal. We have advanced our research and development efforts in some of these areas relevant to our EfW business, and have patents and patents pending for advances in controlling emissions. |
• | Advocate for public policy favorable to EfW and other sustainable waste solutions. We seek to educate policymakers and regulators about the environmental and economic benefits of energy-from-waste and advocate for policies and regulations that appropriately reflect these benefits. Our business is highly regulated, and as such we believe that it is critically important for us, as an industry leader, to play an active role in the debates surrounding potential policy developments that could impact our business. |
• | Maintain a focus on sustainability. Providing sustainable waste, materials, and energy services to our customers is the cornerstone of our business. Our corporate culture is focused on the triple bottom line of sustainability (people, planet, prosperity) in support of our mission. In addition to robust financial reporting, we are committed to transparently reporting our environmental, social and governance standards, policies, and performance, including through our corporate sustainability report. We seek to continuously improve our performance across these aspects to remain an industry leader. |
• | Allocate capital efficiently for long-term shareholder value. We plan to allocate capital to maximize shareholder value by: investing in our existing businesses to maintain and enhance assets; investing in strategic acquisitions or development projects that offer attractive returns on invested capital and further our strategic goals; maintaining a strong balance sheet; and consistently returning capital to our shareholders. |
6
EXECUTION ON STRATEGY
Consistent with our strategy, we have executed on the following during 2016:
New Business Development
• | We acquired two environmental services businesses which will further expand our presence in this sector and allow us to direct additional non-hazardous profiled waste volumes into our EfW facilities. |
• | Construction is progressing on the Dublin EfW facility, a 600,000 metric ton-per-year, 58 megawatt facility in Dublin, Ireland. During 2016, 90% of the facility’s waste processing capacity was secured under long-term contracts with leading waste and recycling collection companies in Ireland. We expect the facility to begin commercial operations in late 2017. For information on the funding of project construction, see Item 8. Financial Statements And Supplementary Data — Note 11. Consolidated Debt |
• | The Durham York facility commenced commercial operations in January 2016 under a 20-year service fee contract. Construction of the municipally-owned 140,000 tonne-per-year EfW facility located in the Durham Region of Canada was completed in 2015. |
Existing Business
• | We extended our waste services agreement with the City of Huntsville to September 2020, and our waste disposal agreement with the City of Indianapolis to December 2025. Both were extended under terms similar to the existing agreements. |
• | Construction of a state-of-the-art particulate emissions control system at our Essex County EfW facility was completed. The total cost of the project totaled approximately $90 million, of which $33 million was incurred in 2016. |
Asset Reallocation
We completed the exchange of our project ownership interests in China for a 15% ownership interest in Chongqing Sanfeng Environmental Industrial Group, Co., Ltd ("Sanfeng Environment") and subsequently sold approximately 90% of our ownership interest in Sanfeng Environment to a third-party, a subsidiary of CITIC Limited, a leading Chinese industrial conglomerate and investment company. As a result, during the year ended December 31, 2016, we received pre-tax proceeds of $105 million and recorded a pre-tax gain of $41 million. For additional information on these activities, see Item 8. Financial Statements And Supplementary Data — Note 4. Dispositions, Assets Held for Sale and Discontinued Operations.
Continuous Improvement
In 2016, we advanced our continuous improvement initiative utilizing Lean Six Sigma methodologies. The focus of this data-driven effort is on achieving stable operations at high performance levels, improved process efficiency and standardization across all of our facilities. We have established a team that includes external experts and internal top performers. This effort advances beyond previous efficiency initiatives, and enhances and complements the outage optimization efforts that we have undertaken over the past several years.
Sustainability Goals
In our corporate Sustainability Report we outlined a series of sustainability goals that are aligned with our business goals and mission. Set in the areas of safety and health, environment, materials management, human resources, finance, governance, and community affairs, each goal has an assigned champion on our senior leadership team to ensure their full integration into our business. We believe attaining these goals help us respond to our customers’ increasing interest in sustainability and the sustainable solutions we provide, mitigate certain risks, and gain a competitive advantage in business development opportunities.
Capital Allocation
Our key capital allocation activities in 2016 included the following:
• | $150 million capital returned to shareholders, including $132 million declared in dividends and $18 million for common share repurchases; |
• | $162 million towards construction of the Dublin EfW facility, of which $155 million was funded by limited recourse project subsidiary financing; and |
• | $91 million for other growth investments, including $33 million towards the Essex County facility emissions control system upgrade, $9 million to acquire environmental services businesses, $3 million related to our New York City transportation and disposal contract, and $46 million for various organic growth investments, including metals recovery projects, investments related to our profiled waste and environmental services businesses, and continuous improvement projects. |
7
NORTH AMERICA SEGMENT
Energy-from-Waste Projects
Our EfW projects generate revenue from three main sources: (1) fees charged for operating projects or processing waste received; (2) the sale of electricity and/or steam; and (3) the sale of ferrous and non-ferrous metals that are recovered from the waste stream as part of the EfW process. We may also generate additional revenue from the construction, expansion or upgrade of a facility, when a municipal client owns the facility. Our customers for waste services or facility operations are principally municipal entities, though we also market disposal capacity at certain facilities to commercial customers. Our facilities primarily sell electricity, either to utilities at contracted rates or, in situations where a contract is not in place, at prevailing market rates in regional markets (primarily PJM, NEPOOL and NYISO in the Northeastern United States), and in some cases sell steam directly to industrial users.
We also operate and/or have ownership positions in environmental services businesses, transfer stations and landfills (primarily for ash disposal) that are ancillary and complementary to our EfW projects and generate additional revenue from disposal or service fees.
EfW Contract Structures
Most of our EfW projects were developed and structured contractually as part of competitive procurement processes conducted by municipal entities. As a result, many of these projects have common features. However, each contractual agreement is different, reflecting the specific needs and concerns of a client community, applicable regulatory requirements and/or other factors.
Our EfW projects can generally be divided into three categories, based on the applicable contract structure at a project: (1) “Tip Fee” projects; (2) “Service Fee” projects that we own; and (3) “Service Fee” projects that we do not own but operate on behalf of a municipal owner. Notwithstanding distinctions among these general classifications in contract structures, in all cases we focus on a consistent set of performance indicators to optimize service to customers and operating results:(i) boiler availability; (ii) turbine availability; (iii) safety and environmental performance measures; (iv) tons processed; (v) steam sold; (vi) megawatt hours sold; and (vii) recycled metal tons sold.
The following summarizes the typical contractual and economic characteristics of the three project structures in the North America segment:
Tip Fee | Service Fee (Owned) | Service Fee (Operated) | ||||
Number of facilities: | 20 | 4 | 17 | |||
Client(s): | Host community and municipal and commercial waste customers | Host community, with limited merchant capacity in some cases | Dedicated to host community exclusively | |||
Waste or service revenue: | Per ton “tipping fee” | Fixed fee, with performance incentives and inflation escalation | ||||
Energy revenue: | Covanta retains 100% | Share with client (Covanta retains approximately 20% on average) | ||||
Metals revenue: | Covanta retains 100% | Share with client (Covanta typically retains approximately 50%) | ||||
Operating costs: | Covanta responsible for all operating costs | Pass through certain costs to municipal client (e.g. ash disposal) | ||||
Project debt service: | Covanta project subsidiary responsible | Paid by client explicitly as part of service fee | Client responsible for debt service | |||
After service contract expiration: | N/A | Covanta owns the facility; clients have certain rights set forth in contracts; facility converts to Tip Fee or remains Service Fee with new terms | Client owns the facility; extend with Covanta or tender for new contract | |||
We are principally responsible for capital costs in facilities that we own; however, client communities may have a contractual obligation to fund a portion of certain capital costs, particularly if required by a change in law. We also may be required to participate in capital improvements for non-owned facilities that we operate, which would be accounted for as operating expense. In contracts with our client communities, we agree to operate the facility and meet minimum performance standards. Typically, these include waste processing, energy efficiency standards, energy production and environmental standards. Unexcused failure to meet these requirements or satisfy the other material terms of our agreement, may result in damages charged to us or, if the breach is substantial, continuing and unremedied, termination of the applicable agreement. If one or more contracts were terminated for our default, these contractual damages may be material to our cash flow and financial condition. To date, we have not incurred material liabilities under such performance guarantees.
8
Contracted and Merchant Revenue
We generated 78% of our waste and service revenue in the North America segment in 2016 under contracts at set rates, while 22% was generated at prevailing market prices. Our waste disposal / service and energy contracts expire at various times between 2017 and 2038. As our contracts expire, we become subject to greater market risk in maintaining and enhancing our revenue. To date, we have been successful in extending the substantial majority of our existing contracts to operate EfW facilities owned by municipal clients. We project 2017 contracted waste and service revenue in North America segment to approximate 2016 levels.
As our waste service agreements at facilities that we own or lease expire, we intend to seek replacement or additional contracts, and because project debt on these facilities will be paid off at such time, we expect to be able to offer rates that will attract sufficient quantities of waste while providing acceptable revenue to us. The expiration of existing energy contracts at these facilities will require us to sell our output either into the local electricity grid at prevailing rates or pursuant to new contracts. We expect that multi-year contracts for waste supply at these facilities will continue to be available on acceptable terms in the marketplace, at least for a substantial portion of facility capacity, as municipalities continue to value long-term committed and sustainable waste disposal capacity. We also expect that an increasing portion of system capacity will be contracted on a shorter-term basis, and so we will have more frequent exposure to waste market risk. We expect that multi-year contracts for energy sales will generally be less available than in the past, thereby increasing our exposure to energy market prices upon expiration. As our existing contracts have expired and our exposure to market energy prices has increased, we entered into hedging arrangements in order to mitigate our exposure to near-term (one to three years) revenue fluctuations in energy markets, and we expect to continue to do so in the future. Our efforts in this regard will involve only mitigation of price volatility for the energy we produce in order to limit our energy revenue "at risk", and will not involve speculative energy trading.
See Item 1A. Risk Factors — Our results of operations may be adversely affected by market conditions existing at the time our contracts expire.
Over time, we will seek to renew, extend or sign new waste and service contracts and pursue opportunities with commercial customers and municipalities that are not necessarily stakeholders in our facilities in order to maintain a significant majority of our waste and service revenue (and EfW fuel supply) under multi-year contracts.
In addition, we are currently focused on expanding our environmental service offerings through both organic growth and acquisitions. The acquisitions will allow us to establish a presence in the environmental services sector, expand the geographical sourcing of our waste streams and drive non-hazardous profiled waste volumes into our EfW facilities. These acquired businesses typically accept waste under short-term contractual arrangements.
We currently operate EfW projects in 16 states and two Canadian provinces. The following map illustrates our EfW, environmental services, and metals processing facility locations in North America:
9
Summary information regarding our North America segment energy-from-waste assets is provided in the following table:
Design Capacity | Contract Expiration Dates (1) | |||||||||||||||
Location | Waste Processing (TPD) | Gross Electric (MW) | Nature of Interest | Waste Service | Energy | |||||||||||
TIP FEE STRUCTURES | ||||||||||||||||
1. | Southeast Connecticut (2) | Connecticut | 689 | 17.0 | Owner/Operator | 2017 | 2017 | |||||||||
2. | Fairfax County (5) | Virginia | 3,000 | 93.0 | Owner/Operator | 2021 | N/A | |||||||||
3. | Southeast Massachusetts (3) | Massachusetts | 2,700 | 78.0 | Owner/Operator | N/A | 2017 | |||||||||
4. | Delaware Valley (5) | Pennsylvania | 2,688 | 87.0 | Owner/Operator | 2035 | N/A | |||||||||
5. | Hempstead | New York | 2,505 | 72.0 | Owner/Operator | 2034 | 2027 | |||||||||
6. | Indianapolis (4) | Indiana | 2,362 | 6.5 | Owner/Operator | 2025 | 2028 | |||||||||
7. | Niagara (4) | New York | 2,250 | 50.0 | Owner/Operator | 2035 | 2017-2024 | |||||||||
8. | Essex County (5) | New Jersey | 2,277 | 66.0 | Owner/Operator | 2032 | N/A | |||||||||
9. | Haverhill (5) | Massachusetts | 1,650 | 44.6 | Owner/Operator | N/A | N/A | |||||||||
10. | Union County (5) | New Jersey | 1,440 | 42.1 | Lessee/Operator | 2031 | N/A | |||||||||
11. | Plymouth (5) | Pennsylvania | 1,216 | 32.0 | Owner/Operator | N/A | N/A | |||||||||
12. | Tulsa (4)(5) | Oklahoma | 1,125 | 16.8 | Owner/Operator | 2022 | 2019 | |||||||||
13. | Camden (5) | New Jersey | 1,050 | 21.0 | Owner/Operator | N/A | N/A | |||||||||
14. | Alexandria/Arlington (5) | Virginia | 975 | 22.0 | Owner/Operator | N/A | 2023 | |||||||||
15. | Stanislaus County | California | 800 | 22.4 | Owner/Operator | 2027 | N/A | |||||||||
16. | Bristol (5) | Connecticut | 650 | 16.3 | Owner/Operator | 2034 | N/A | |||||||||
17. | Lake County | Florida | 528 | 14.5 | Owner/Operator | N/A | 2024 | |||||||||
18. | Warren County (5) | New Jersey | 450 | 13.5 | Owner/Operator | N/A | N/A | |||||||||
19. | Springfield (5) | Massachusetts | 400 | 9.4 | Owner/Operator | 2024 | N/A | |||||||||
20. | Pittsfield (4) | Massachusetts | 240 | 0.9 | Owner/Operator | N/A | 2020 | |||||||||
SERVICE FEE (OWNED) STRUCTURES | ||||||||||||||||
21. | Onondaga County | New York | 990 | 39.2 | Owner/Operator | 2035 | 2025 | |||||||||
22. | Huntington | New York | 750 | 24.3 | Owner/Operator | 2019 | 2027 | |||||||||
23. | Babylon | New York | 750 | 16.8 | Owner/Operator | 2019 | 2027 | |||||||||
24. | Marion County | Oregon | 550 | 13.1 | Owner/Operator | 2019 | 2017 | |||||||||
SERVICE FEE (OPERATED) STRUCTURES | ||||||||||||||||
25. | Pinellas County | Florida | 3,150 | 75.0 | Operator | 2024 | 2024 | |||||||||
26. | Miami-Dade County (3)(5) | Florida | 3,000 | 77.0 | Operator | 2023 | N/A | |||||||||
27. | Honolulu (3)(6) | Hawaii | 2,950 | 90.0 | Operator | 2032 | 2033 | |||||||||
28. | Lee County (6) | Florida | 1,836 | 57.3 | Operator | 2024 | N/A | |||||||||
29. | Montgomery County (5)(6) | Maryland | 1,800 | 63.4 | Operator | 2021 | N/A | |||||||||
30. | Hillsborough County | Florida | 1,800 | 46.5 | Operator | 2029 | 2025 | |||||||||
31. | Long Beach | California | 1,380 | 36.0 | Operator | 2024 | 2018 | |||||||||
32. | York County (5) | Pennsylvania | 1,344 | 42.0 | Operator | 2035 | N/A | |||||||||
33. | Hennepin County | Minnesota | 1,212 | 38.7 | Operator | 2018 | 2018 | |||||||||
34. | Lancaster County (5) | Pennsylvania | 1,200 | 33.1 | Operator | 2017 | N/A | |||||||||
35. | Pasco County | Florida | 1,050 | 29.7 | Operator | 2024 | 2024 | |||||||||
36. | Harrisburg (5) | Pennsylvania | 800 | 20.8 | Operator | 2017 | 2033 | |||||||||
37. | Burnaby | British Columbia | 800 | 23.9 | Operator | 2025 | 2025 | |||||||||
38. | Huntsville (4) | Alabama | 690 | — | Operator | 2020 | N/A | |||||||||
39. | Kent County | Michigan | 625 | 16.8 | Operator | 2023 | 2023 | |||||||||
40. | MacArthur | New York | 486 | 12.0 | Operator | 2030 | 2027 | |||||||||
41. | Durham-York | Durham Region, Canada | 480 | 17.4 | Operator | 2036 | N/A | |||||||||
SUBTOTAL | 55,949 | 1,481.0 | ||||||||||||||
10
(1) | Expiration dates are for significant contracts; expiration dates refer to contracts with the host client communities (if any) or other contracts representing at least 40% of facility waste capacity. "N/A" denotes that no contract represents greater than 40% of facility capacity. |
(2) | This facility transitioned from a service fee (owned) to a tip fee contract effective February 2017. |
(3) | These facilities use a refuse-derived fuel technology. |
(4) | These facilities have been designed to export steam for sale. See table below for the equivalent electric output. The equivalent electric output is part of, not in addition to, the design capacity megawatts ("MW") listed in the table above. |
Facility | Equivalent Electric Output (MW) | |
Niagara | 66 | |
Indianapolis | 52 | |
Tulsa | 25 | |
Huntsville | 15 | |
Pittsfield | 5 | |
At our Niagara EfW Facility, we export steam to local customers under various agreements which expire between 2017 and 2024.
(5) | These facilities either sell electricity into the regional power pool at prevailing market rates or have contractual arrangements to sell electricity at prevailing market rates. |
(6) | The client has a termination option under the service agreement. |
Other Waste Management Infrastructure and Operations
In conjunction with our EfW business, we also own and/or operate 17 transfer stations, 15 environmental services facilities, one regional metals recycling facility, and 4 landfills (primarily utilized for ash disposal). We utilize these assets to supplement and more efficiently manage the waste supply, ash disposal requirements, and metals processing activities at our EfW operations, and in some cases to expand our environmental solutions service offerings. Recent acquisitions will expand our presence in the environmental services sector and allow us to direct additional non-hazardous waste volumes into our EfW facilities. These businesses are highly synergistic with our existing profiled waste business and offer us the opportunity to expand the geographical sourcing of our waste streams and to provide additional environmental solutions and services to our clients.
Biomass Projects
Currently, our two California biomass facilities are in economic dispatch. If market conditions improve, we may re-start one or both these facilities. In each of the years ending December 31, 2016, 2015, and 2014, revenue from our biomass projects represented less than 1%, 3% and 4%, respectively, of our North America segment revenue.
OTHER PROJECTS
Outside the North America segment, we currently own one EfW project under construction in Ireland and have an equity interest in an EfW project in Italy. We intend to pursue additional international EfW projects where the regulatory and market environments are attractive. Ownership and operation of facilities in foreign countries potentially involves greater political and financial uncertainties than we experience in the United States, as described below and discussed in Item 1A. Risk Factors.
Summary information regarding our other EfW projects is provided in the following table:
Design Capacity | Contract Expiration Dates | |||||||||||||||
Location | Waste Processing (Metric TPD) | Gross Electric (MW) | Nature of Interest | |||||||||||||
Waste Service | Energy | |||||||||||||||
ENERGY-FROM-WASTE | ||||||||||||||||
TIP FEE STRUCTURES | ||||||||||||||||
1. | Dublin (1) | Ireland | 1,800 | 58 | 100% Owner/Operator (Under Construction) | 2062 | N/A | |||||||||
2. | Trezzo | Italy | 500 | 18 | 13% Owner/JV Operator | 2023 | 2023 | |||||||||
SUBTOTAL | 2,300 | 76 | ||||||||||||||
(1) | We expect operations to commence in late 2017. We will operate the facility under a 45-year public-private-partnership agreement, after which ownership of the facility will transfer to City of Dublin. Waste supply contracts have been entered into with private waste haulers. |
11
MARKETS, COMPETITION AND BUSINESS CONDITIONS
Waste Services
Post-recycled municipal solid waste generation in the United States is approximately 250 million tons per year, of which the EfW industry processes approximately 12% (of which we process approximately two-thirds).
EfW is an important part of the waste management infrastructure of the United States, particularly in regions with high population density but limited availability of land for landfilling, with nearly 80 facilities currently in operation that collectively process approximately 30 million tons of post-recycled solid waste and serve the needs of over 30 million people and produce enough electricity for the equivalent of 1.3 million homes. The use of EfW is even more prevalent in Western Europe and many countries in Asia, such as Japan. Nearly 1,600 EfW facilities are in use today around the world, with a capacity to process approximately 230 million tons of waste per year. In the waste management hierarchies of the United States EPA and the European Union, EfW is designated as a superior solution to landfilling.
Renewable Energy
Public policy in the United States, at both the state and national levels, has developed over the past several years in support of increased generation of renewable energy as a means of combating the potential effects of climate change, as well as increasing domestic energy security. Today in the United States, approximately 13% of electricity is generated from renewable sources, approximately half of which is hydroelectric power.
EfW contributes approximately 5% of the nation’s non-hydroelectric renewable power. EfW is designated as renewable energy in 31 states, the District of Columbia, and Puerto Rico, as well as in several federal statutes and policies. Unlike most other renewable resources, EfW generation can serve base-load demand and is more often located near population centers where demand is greatest, minimizing the need for expensive incremental transmission infrastructure.
General Business Conditions
Economic - Changes in the economy affect the demand for goods and services generally, which affects overall volumes of waste requiring management and the pricing at which we can attract waste to fill available capacity. We receive the majority of our revenue under short- and long-term contracts, which limits our exposure to price volatility, but with adjustments intended to reflect changes in our costs. Where our revenue is received under other arrangements and depending upon the revenue source, we have varying amounts of exposure to price volatility.
The largest component of our revenue is waste revenue, which has generally been subject to less price volatility than our revenue derived from the sale of energy and metals. Waste markets tend to be affected, both with respect to volume and price, by local and regional economic activity, as well as state and local waste management policies.
At the same time, United States natural gas market prices influence electricity and steam pricing in regions where we operate, and thus affect our revenue for the portion of the energy we sell that is not under fixed-price contracts. Energy markets tend to be affected by regional supply and demand, as well as national economic activity and regulations.
At our biomass facilities, lower energy prices combined with higher fuel prices have caused us to economically dispatch operations, pending improved market conditions.
12
The following are various published pricing indices relating to the U.S. economic drivers that are relevant to those aspects of our business where we have market exposure; however, there is not a precise correlation between our results and changes in these metrics.
As of December 31, | ||||||||||||||||
2016 | 2015 | 2014 | 2013 | |||||||||||||
Consumer Price Index (1) | 2.1 | % | 0.7 | % | 0.8 | % | 1.5 | % | ||||||||
PJM Pricing (Electricity) (2) | $ | 24.85 | $ | 36.00 | $ | 56.99 | $ | 41.93 | ||||||||
NE ISO Pricing (Electricity) (3) | $ | 29.74 | $ | 42.93 | $ | 64.58 | $ | 56.43 | ||||||||
Henry Hub Pricing (Natural Gas) (4) | $ | 2.52 | $ | 2.60 | $ | 4.33 | $ | 3.72 | ||||||||
#1 HMS Pricing (Ferrous Metals) (5) | $ | 197 | $ | 217 | $ | 355 | $ | 344 | ||||||||
Scrap Metals - Old Cast Aluminum Scrap (6) | $ | 0.57 | $ | 0.63 | $ | 0.75 | $ | 0.73 | ||||||||
(1) | Represents the year-over-year percent change in the Headline CPI number. The Consumer Price Index (CPI-U) data is provided by the U.S. Department of Labor Bureau of Labor Statistics. |
(2) | Average price per MWh for full year. Pricing for the PJM PSEG Zone is provided by the PJM ISO. |
(3) | Average price per MWh for full year. Pricing for the Mass Hub Zone is provided by the NE ISO. |
(4) | Average price per MMBtu for full year. The Henry Hub Pricing data is provided by the Natural Gas Weekly Update, Energy Information Administration, Washington, DC. |
(5) | Average price per gross ton for full year. The #1 Heavy Melt Steel ("HMS") composite index ($/gross ton) price is published by American Metal Market. |
(6) | Average price per pound for full year. Calculated using the high price of Old Cast Aluminum Scrap ($/lb) published by American Metal Market. |
Seasonal - Our quarterly operating income within the same fiscal year typically differs substantially due to seasonal factors, primarily as a result of the timing of scheduled plant maintenance. We conduct scheduled maintenance periodically each year, which requires that individual boiler and/or turbine units temporarily cease operations. During these scheduled maintenance periods, we incur material repair and maintenance expense and receive less revenue until the boiler and/or turbine units resume operations. This scheduled maintenance usually occurs during periods of off-peak electric demand and/or lower waste volumes, which can vary regionally. The scheduled maintenance period in the first half of the year (primarily first quarter and early second quarter) is typically the most extensive, while the third quarter scheduled maintenance period is the least extensive. Given these factors, we normally experience our lowest operating income from our projects during the first half of each year.
Our operating income may also be affected by seasonal weather extremes during summers and winters. Increased demand for electricity and natural gas during unusually hot or cold periods may affect certain operating expense and may trigger material price increases for a portion of the electricity and steam we sell.
Performance - Our EfW facilities have historically demonstrated consistent reliability; our average boiler availability was 91% in 2016. We have historically met our operating obligations without experiencing material unexpected service interruptions or incurring material increases in costs. In addition, with respect to many of our contracts, we generally have limited our exposure for risks not within our control. Across our fleet of facilities, we operate and maintain a large number of combustion units, turbine generators, and air-cooled condensers, among other systems. On an ongoing basis, we assess the effectiveness of our preventative maintenance programs, and implement adjustments to those programs in order to improve facility safety, reliability and performance. These assessments are tailored to each facility's particular technologies, age, historical performance and other factors. As our facilities age, we expect that the scope of work required to maintain our portfolio of facilities will increase in order to replace or extend the useful life of facility components and to ensure that historical levels of safe, reliable performance continue. For additional information about such risks and damages that we may owe for unexcused operating performance failures, see Item 1A. Risk Factors - Operation of our businesses involves significant risks, which could have an adverse effect on our cash flows and results of operations. In monitoring and assessing the ongoing operating and financial performance of our businesses, we focus on certain key factors: tons of waste processed, electricity and steam sold, boiler availability, plant operating expense and safety and environmental performance.
Waste, Energy and Metals Markets - We compete in waste markets that are highly competitive. In the United States, the market for waste management is almost entirely price-driven and is greatly influenced by economic factors within regional waste markets. These factors include:
• | regional population and overall waste production rates; |
• | the number of waste disposal sites (including principally landfills, other EfW facilities and transfer stations) in existence or in the planning or permitting process; |
• | the available disposal capacity (in terms of tons of waste per day) that can be offered by other regional disposal sites; |
• | the extent to which local governments seek to control transportation and/or disposal of waste within their jurisdictions; |
13
• | the extent to which local governments and businesses continue to value sustainable approaches to handling of wastes; and |
• | the availability and cost of transportation options (e.g., rail, inter-modal, trucking) to provide access to more distant disposal sites, thereby affecting the size of the waste market itself. |
In the waste market of our North America segment, waste service providers seek to obtain waste supplies for their facilities by competing on price (usually on a per-ton basis) with other service providers. At our service fee EfW facilities, we typically do not compete in this market because we do not have the contractual right to solicit merchant waste. At these facilities, the client community is responsible for obtaining the waste, if necessary by competing on price to obtain the tons of waste it has contractually promised to deliver to us. At our EfW facilities governed by tip fee contracts and our waste procurement services businesses, we are responsible for obtaining waste supply, and therefore, actively compete in these markets to enter into spot, medium- and long-term contracts. These EfW projects are generally in densely-populated areas, with high waste generation rates and numerous large and small participants in the regional market. Our waste operations are largely concentrated in the northeastern United States. See Item 1A. Risk Factors — Our waste operations are concentrated in one region and expose us to regional economic or market declines for additional information concerning this geographic concentration. Certain of our competitors in these markets are vertically-integrated waste companies, which include waste collection operations, and thus have the ability to control supplies of waste, which may restrict our ability to offer services at attractive prices. Our business does not include traditional waste collection operations.
If a long-term contract expires and is not renewed or extended by a client community, our percentage of contracted processing capacity will decrease and we will need to compete in the regional market for waste supply at the facilities we own, from both municipal and commercial services. At that point, we will compete on price with landfills, transfer stations, other EfW facilities and other waste technologies that are then offering disposal or other services in the region.
Our sustainable service offerings seek to respond to increasing customer demand for environmentally preferred waste handling and disposal, as well as specific business risk mitigation requirements for certain materials. For these services, we compete with many large and small companies offering these services, in local and regional waste markets that are similarly influenced by the factors noted above which affect the broader waste markets.
We currently sell the majority of our electricity and other energy product output pursuant to contracts, and for this portion of our energy output we do not compete on price. As these contracts expire, we will sell an increasing portion of our energy output into competitive energy markets or pursuant to short-term contracts and, as such, generally expect to have a growing exposure to energy market price volatility.
We have entered into hedging arrangements in order to mitigate our exposure to this volatility, and we expect to continue to do so in the future. Our efforts in this regard will involve only mitigation of price volatility for the energy we produce, and will not involve speculative energy trading.
For the portion of our portfolio that is exposed to electricity markets, we expect prices will be driven by several factors including natural gas supply/demand conditions, regional electricity supply/demand factors, regional transmission and natural gas supply capacity and system conditions, weather conditions, and emerging environmental regulations. All of these factors will have national and regional impacts that affect electricity and steam prices.
Electricity and steam prices in the markets where the majority of our facilities are located are heavily impacted by movements in natural gas prices. The substantial increase in unconventional or shale gas supply has created downward pressure on gas prices relative to historical levels and therefore prices for the electricity we sell that is not under contract. However, when demand for gas is high during certain seasons or weather conditions, the gas pipeline system has been limited in its ability to transport enough gas to certain regions, such as New England and California. As result, gas prices can experience short-term spikes, and electricity prices follow.
Several long-term trends are expected to affect U.S. natural gas prices; including shale gas production, storage capacity, liquefied natural gas ("LNG") exports, regulation, coal plant retirements, as well as industrial, transportation and residential demand. Furthermore, regional natural gas prices, especially in the Northeast are expected to be affected by changes in regional production and transportation capacity.
We generally enter into short-term contracts for sales of recovered ferrous and non-ferrous metals with processors and end-users (i.e., mills). We compete with other suppliers who are generally not in the EfW industry and whose product may be less costly to process than metals from EfW sources. In addition, third parties to whom we sell our metals are often not well-capitalized, which creates greater credit and performance risk to us than we typically experience in our other lines of business. Because of these and other factors, and because we expect to continue to enhance our metals recovery activities, we generally expect to have a growing exposure to metals market volatility. We also have enhanced our focus on mitigating commercial risks associated with metals recovery and revenue generation.
14
Technology, Research and Development
In our EfW business, we own and/or operate EfW facilities that utilize various technologies from several different vendors, including mass-burn combustion technologies and refuse-derived fuel technologies which include pre-combustion waste processing not required with a mass-burn design. As we continue our efforts to develop and/or acquire additional EfW projects internationally, we will consider mass-burn combustion and other technologies that best fit the needs of the local environment of a particular project.
In addition, we will continue to consider technologies better suited than mass-burn combustion for smaller scale applications, including gasification technologies.
We believe that all forms of EfW technologies offer an environmentally superior solution to post-recycled waste management and energy challenges faced by leaders around the world, and that our efforts to expand our business will be enhanced by the development of additional technologies in such fields as emission controls, residue disposal, alternative waste treatment processes, gasification, and combustion controls. We have advanced our research and development efforts in these areas, and have developed new and cost-effective technologies that represented major advances in controlling NOx emissions. These technologies, for which patents have been granted, have been tested at existing facilities and we are now operating and/or installing such systems at a number of our facilities. We intend to maintain a focus on research and development of technologies in these and other areas that we believe will enhance our competitive position, and offer new technical solutions to waste and energy problems that augment and complement our business.
A number of other companies are similarly engaged in new technology development focused on extracting energy from waste materials through a variety of technical approaches, including: gasification, pyrolysis or other combustion designs; converting waste to fuels or other commodities; or processing waste to enable co-firing in larger power plants or industrial boilers. Firms engaged in these activities generally are less well-capitalized than Covanta, although some engage in joint ventures with larger and more well-capitalized companies. To date, we believe such efforts have not produced technologies that offer economically attractive alternatives in the absence of policy support.
REGULATION OF BUSINESS
Regulations Affecting Our North America Segment
Environmental Regulations — General
Our business activities in the United States are extensively regulated pursuant to federal, state and local environmental laws. Federal laws, such as the Clean Air Act and Clean Water Act, and their state counterparts, govern discharges of pollutants to air and water. Other federal, state and local laws comprehensively govern the generation, transportation, storage, treatment and disposal of solid and hazardous waste and also regulate the storage and handling of chemicals and petroleum products (such laws and regulations are referred to collectively as the “Environmental Regulatory Laws”).
Other federal, state and local laws, such as the Comprehensive Environmental Response Compensation and Liability Act (commonly known as “CERCLA” and collectively referred to with such other laws as the “Environmental Remediation Laws”) make us potentially liable on a joint and several basis for any onsite or offsite environmental contamination which may be associated with our activities and the activities at our sites. These include landfills we have owned, operated or leased, or at which there has been disposal of residue or other waste generated, handled or processed by our facilities. Some state and local laws also impose liabilities for injury to persons or property caused by site contamination. Some service agreements provide us with indemnification from certain liabilities.
The Environmental Regulatory Laws prohibit disposal of regulated hazardous waste at our municipal solid waste facilities. The service agreements recognize the potential for inadvertent and improper deliveries of hazardous waste and specify procedures for dealing with hazardous waste that is delivered to a facility. Under some service agreements, we are responsible for some costs related to hazardous waste deliveries. We have not incurred material hazardous waste disposal costs to date.
The Environmental Regulatory Laws also require that many permits be obtained before the commencement of construction and operation of any waste or renewable energy project, and further require that permits be maintained throughout the operating life of the facility. We can provide no assurance that all required permits will be issued or re-issued, and the process of obtaining such permits can often cause lengthy delays, including delays caused by third-party appeals challenging permit issuance. Our failure to meet conditions of these permits or of the Environmental Regulatory Laws can subject us to regulatory enforcement actions by the appropriate governmental authority, which could include fines, penalties, damages or other sanctions, such as orders requiring certain remedial actions or limiting or prohibiting operation. See Item 1A. Risk Factors — Compliance with environmental laws, including changes to such laws, could adversely affect our results of operations. To date, we have not incurred material penalties, been required to incur material capital costs or additional expense, or been subjected to material restrictions on our operations as a result of violations of Environmental Regulatory Laws or permit requirements.
15
Although our operations are occasionally subject to proceedings and orders pertaining to emissions into the environment and other environmental violations, which may result in fines, penalties, damages or other sanctions, we believe that we are in compliance with existing Environmental Regulatory and Remediation Laws. We may be identified, along with other entities, as being among parties potentially responsible for contribution to costs associated with the correction and remediation of environmental conditions at disposal sites subject to CERCLA and/or analogous state Environmental Remediation Laws. Our ultimate liability in connection with such environmental claims will depend on many factors, including our volumetric share of waste, the total cost of remediation, and the financial viability of other companies that have also sent waste to a given site and, in the case of divested operations, our contractual arrangement with the purchaser of such operations.
The Environmental Regulatory Laws may change. New technology may be required or stricter standards may be established for the control of discharges of air or water pollutants, for storage and handling of petroleum products or chemicals, or for solid or hazardous waste or ash handling and disposal. Thus, as new technology is developed and proven, we may be required to incorporate it into new facilities or make major modifications to existing facilities. This new technology may be more expensive than the technology we use currently.
Environmental Regulations — Recent Developments
Maximum Achievable Control Technology ("MACT") Rules — EPA is authorized under the Clean Air Act to issue rules periodically which tighten air emission requirements to achievable standards, as determined under a specified regulatory framework. EPA is required to establish these MACT rules for a variety of industries, including new and existing municipal waste combustion (“MWC”) units, industrial boilers and solid waste incinerators. All of our facilities comply with all applicable MACT rules currently in effect.
EPA is currently conducting a combined Risk and Technology Review for the large MWC source category and will subsequently propose revised MWC MACT rules. While the scope of and timing for implementation of these rules is uncertain, the revised MWC MACT rules are expected to lower existing MWC MACT emission limits for most, if not all, regulated air pollutants emitted by our facilities, and may require capital improvements and/or increased operating costs. We are unable at this time, to estimate the magnitude of such costs, which may be material, or to determine the potential impact on the profitability of our MWC facilities.
In some cases, the costs incurred to meet the revised MACT rules at facilities may be recovered from municipal clients and other users of our facilities through increased fees permitted to be charged under applicable contracts; however, to the extent we incur costs at other of our facilities to meet the applicable MACT rules, such costs are not subject to contractual recovery and instead will be borne directly by the affected facilities.
Revised Ground Level Ozone Standards — On October 26, 2015, EPA published a final rule to revise and strengthen the National Ambient Air Quality Standards for ground-level ozone or “smog”. Once implemented by EPA and affected states, this rule could impact changes to our existing air permits that we may pursue in the future.
Energy Regulations
Our businesses are subject to the provisions of federal, state and local energy laws applicable to the development, ownership and operation of facilities located in the United States. The Federal Energy Regulatory Commission (“FERC”), among other things, regulates the transmission and the wholesale sale of electricity in interstate commerce under the authority of the Federal Power Act (“FPA”). In addition, under existing regulations, FERC determines whether an entity owning a generation facility is an Exempt Wholesale Generator (“EWG”), as defined in the Public Utility Holding Company Act of 2005 (“PUHCA 2005”). FERC also determines whether a generation facility meets the ownership and technical criteria of a Qualifying Facility (cogeneration facilities and other facilities making use of non-fossil fuel power sources, such as waste, which meet certain size and other applicable requirements, referred to as “QFs”), under the Public Utility Regulatory Policies Act of 1978, as amended (“PURPA”). Each of our United States generating facilities has either been determined by FERC to qualify as a QF or is otherwise exempt, or the subsidiary owning the facility has been determined to be an EWG.
Federal Power Act — The FPA gives FERC exclusive rate-making jurisdiction over the wholesale sale of electricity and transmission of electricity in interstate commerce. Under the FPA, FERC, with certain exceptions, regulates the owners of facilities used for the wholesale sale of electricity or transmission of electricity in interstate commerce as public utilities. The FPA also gives FERC jurisdiction to review certain transactions and numerous other activities of public utilities. Most of our QFs are currently exempt from FERC’s rate regulation under the FPA because (i) the QF is 20 MW or smaller; (ii) its sales are made pursuant to a state regulatory authority’s implementation of PURPA; (iii) the QF is owned by a municipality or subdivision thereof; or (iv) its sales are made pursuant to a contract executed on or before March 17, 2006. Our QFs that are not exempt, or that lose these exemptions from rate regulation, are or would be required to obtain market-based rate authority from FERC or otherwise make sales pursuant to rates on file with FERC.
Under the FPA, public utilities are required to obtain FERC’s acceptance of their rate schedules for the wholesale sale of electricity. Our generating companies in the United States that are not otherwise exempt from FERC’s rate regulation have sales of electricity pursuant to market-based rates or other rates authorized by FERC. With respect to our generating companies with market-based
16
rate authorization, FERC has the right to suspend, revoke or revise that authority and require our sales of energy to be made on a cost-of-service basis if FERC subsequently determines that we can exercise market power, create barriers to entry, or engage in abusive affiliate transactions. In addition, amongst other requirements, our market-based rate sellers are subject to certain market behavior and market manipulation rules and, if any of our subsidiaries were deemed to have violated any one of those rules, such subsidiary could be subject to potential disgorgement of profits associated with the violation and/or suspension or revocation of market-based rate authority, as well as criminal and civil penalties. If the market-based rate authority for one (or more) of our subsidiaries was revoked or it was not able to obtain market-based rate authority when necessary, and it was required to sell energy on a cost-of-service basis, it could become subject to the full accounting, record keeping and reporting requirements of FERC. Even where FERC has granted market-based rate authority, FERC may impose various market mitigation measures, including price caps, bidding rules and operating restrictions where it determines that potential market power might exist and that the public interest requires such potential market power to be mitigated. A loss of, or an inability to obtain, market-based rate authority could have a material adverse impact on our business. We can offer no assurance that FERC will not revisit its policies at some future time with the effect of limiting market-based rate authority, regulatory waivers, and blanket authorizations.
Under the Energy Policy Act of 2005 (“EPAct 2005”), FERC has approved the North American Electric Reliability Corporation, or “NERC,” to address the development and enforcement of mandatory reliability standards for the wholesale electric power system. Certain of our subsidiaries are responsible for complying with the standards in the regions in which we operate. NERC also has the ability to assess financial penalties for non-compliance. In addition to complying with NERC requirements, certain of our subsidiaries must comply with the requirements of the regional reliability council for the region in which that entity is located. Compliance with these reliability standards may require significant additional costs, and noncompliance could subject us to regulatory enforcement actions, fines, and increased compliance costs.
Public Utility Holding Company Act of 2005 — PUHCA 2005 provides FERC with certain authority over and access to books and records of public utility holding companies not otherwise exempt by virtue of their ownership of EWGs, QFs, and Foreign Utility Companies, as defined in PUHCA 2005. We are a public utility holding company, but because all of our generating facilities have QF status, are otherwise exempt, or are owned through EWGs, we are exempt from the accounting, record retention, and reporting requirements of PUHCA 2005.
Public Utility Regulatory Policies Act — PURPA was passed in 1978 in large part to promote increased energy efficiency and development of independent power producers. PURPA created QFs to further both goals, and FERC is primarily charged with administering PURPA as it applies to QFs. FERC has promulgated regulations that exempt QFs from compliance with certain provisions of the FPA, PUHCA 2005, and certain state laws regulating the rates charged by, or the financial and organizational activities of, electric utilities. The exemptions afforded by PURPA to QFs from regulation under the FPA and most aspects of state electric utility regulation are of great importance to us and our competitors in the EfW and independent power industries.
PURPA also initially included a requirement that utilities must buy and sell power to QFs. Among other things, EPAct 2005 eliminated the obligation imposed on utilities to purchase power from QFs at an avoided cost rate where the QF has non-discriminatory access to wholesale energy markets having certain characteristics, including nondiscriminatory transmission and interconnection services. In addition, FERC has established a regulatory presumption that QFs with a capacity greater than 20 MW have non-discriminatory access to wholesale energy markets in most geographic regions in which we operate. As a result, many of our expansion, renewal and development projects must rely on competitive energy markets rather than PURPA’s historic avoided cost rates in establishing and maintaining their viability.
Recent Policy Debate Regarding Climate Change and Renewable Energy
The public and political debate over GHG emissions (principally CO2 and methane) and their contribution to climate change continues both internationally and domestically. Any resulting regulations could in the future affect our business. As is the case with all combustion, our facilities emit CO2, however EfW is recognized as creating net reductions in GHG emissions and is otherwise environmentally beneficial, because it:
• | avoids CO2 emissions from fossil fuel power plants; |
• | avoids methane emissions from landfills; and |
• | avoids GHG emissions from mining and processing metal because it recovers and recycles metals from waste. |
In addition, EfW facilities are a domestic source of energy, preserve land, and are typically located close to the source of the waste and thus typically reduce fossil fuel consumption and air emissions associated with long-haul transportation of waste to landfills.
For policy makers at the local level who make decisions on sustainable waste management alternatives, we believe that using EfW instead of landfilling will result in significantly lower net GHG emissions, while also introducing more control over the cost of waste management and supply of local electrical power. We are actively engaged in encouraging policy makers at state and federal levels to enact legislation that supports EfW as a superior choice for communities to avoid both the environmental harm caused by landfilling waste, and reduce local reliance on fossil fuels as a source of energy.
17
Many of these same policy considerations apply equally to other renewable technologies. The extent to which such potential legislation and policy initiatives will affect our business will depend in part on whether EfW and our other renewable technologies are included within the range of clean technologies that could benefit from such legislation.
In October 2015, EPA published two new rules regulating greenhouse gas emissions. The first rule, the Clean Power Plan, regulates existing fossil fuel fired electric generating units. The second regulation sets greenhouse gas emissions standards for new power plants. While it is not clear whether these rules will be implemented by the Trump administration, our facilities are not regulated entities under either of these rules. Under the rules, states are required to develop plans for implementing the requirements; however, in February 2016, the Supreme Court stayed implementation of the Clean Power Plan pending judicial review. Depending on the outcome of the judicial review, decisions by the Trump administration and the specific details of the state plans, implementation of the Clean Power Plan may create additional demand for our power and new MWC capacity may benefit from certain credits; implementation scope and schedule is uncertain as a result of court challenges. We cannot predict at this time the magnitude of the potential impact to our business of these rules, if any. We continue to closely follow developments in this area.
In addition to the new EPA rules, several initiatives have been developed at the state or regional levels, and some initiatives exist in regions where we have projects. For example:
• | The Regional Greenhouse Gas Initiative (“RGGI”) is an operating regional “cap-and-trade” program focused on fossil fuel-fired electric generators which does not directly affect EfW facilities. We operate one fossil-fuel fired boiler at our Niagara facility included in the RGGI program. |
• | California's Global Warming Solutions Act of 2006 ("AB 32"), seeks to reduce GHG emissions in California to 1990 levels by 2020. AB 32 includes an economy-wide “cap-and-trade” program, which could impact our California EfW facilities, but not our biomass facilities. Regulatory amendments in 2013 and 2014 excluded EfW facilities from the cap-and-trade program through the end of 2015 and proposed amendments to the program would exclude EfW through the end of 2017. The future treatment of EfW facilities under this program is uncertain at this time. |
• | The province of Ontario, Canada has developed a greenhouse gas cap and trade program under which EfW facilities, including the Durham-York facility, do not incur a compliance obligation under the program through the end of 2020. We cannot predict at this time the treatment of EfW facilities after 2020. |
International Climate Change Policies
Certain international markets in which we compete have recently adopted regulatory or policy frameworks that encourage EfW projects as important components of GHG emission reduction strategies, as well as waste management planning and practice.
The European Union
The European Union has adopted legislation which requires member states to reduce the utilization of and reliance upon landfill disposal. The legislation emanating from the European Union is primarily in the form of “Directives,” which are binding on the member states but must be transposed through national enabling legislation to implement their practical requirements, a process which can result in significant variance between the legislative schemes introduced by member states. Certain Directives notably affect the regulation of EfW facilities across the European Union. These include (1) Directive 2010/75/EU on industrial emissions (the "Industrial Emissions Directive") which consolidated and replaced seven existing Directives, including Directive 96/61/EC concerning integrated pollution prevention and control (known as the “IPPC Directive”) which governed emissions to air, land and water from certain large industrial installations, and Directive 2000/76/EC concerning the incineration of waste (known as the Waste Incineration Directive), which imposed limits on emissions to air or water from the incineration and co-incineration of waste; (2) Directive 1999/31/EC concerning the landfill of waste (known as the “Landfill Directive”) which imposes operational and technical controls on landfills and restricts, on a reducing scale, the amount of biodegradable municipal waste which member states may dispose of to landfill; and (3) Directive 2008/98/EC on waste (known as the revised “Waste Framework Directive”) which enshrines the waste hierarchy to divert waste from landfill and underpins a preference for efficient energy-from-waste for the recovery of value from residual wastes.
In December 2015, the European Commission adopted the Circular Economy Package which sets targets for waste reduction, further restrictions on landfilling, and increased recycling. To implement these targets and other measures, the Circular Economy Package contains proposals to amend several of the Directives described above. We cannot predict at this time the final outcome of this process.
18
China
China currently has a favorable regulatory environment for the development of EfW projects. The Ministry of Housing and Urban-Rural Development of the People’s Republic of China has set a goal to increase the volume of waste disposed of by EfW facilities from 1% (2005 estimate) to 30% by 2030. The Chinese central government has further called for an increase in EfW output generation from 200 MW (2005 estimate) to three gigawatts by 2020. Energy-from-waste and municipal waste disposal services are designated by the Chinese central government as “encouraged industries” for foreign investment. According to the latest Catalogue of Industries for Guiding Foreign Investment, the EfW industry remains within the “encouraged industries” for foreign investment. China also has various promotional laws and policies in place to promote EfW and municipal waste disposal projects including exemptions and reductions of corporate income tax, value added tax refunds, prioritized commercial bank loans, state subsidies for loan interest, and a guaranteed subsidized price at RMB 0.65/KWh for the sale of electricity, as long as certain statutory conditions are met.
Employee Health and Welfare
We are subject to numerous regulations enacted to protect and promote worker health and welfare through the implementation and enforcement of standards designed to prevent illness, injury and death in the workplace. The primary law relating to employee health and welfare applicable to our business in the United States is the Occupational Safety and Health Act of 1970 ("OSHA"), which establishes certain employer responsibilities including maintenance of a workplace free of recognized hazards likely to cause illness, death or serious injury, compliance with standards promulgated by OSHA, and assorted reporting and record keeping obligations, as well as disclosure and procedural requirements. Various OSHA standards apply to certain aspects of our operations.
Employee health and welfare laws governing our business in foreign jurisdictions include the Workplace Health and Safety Directive and the Directive concerning ionizing radiation in the European Union, and various provisions of the Canada Labour Code and related regulations in Canada.
EMPLOYEES
As of December 31, 2016, we employed approximately 3,600 full-time employees worldwide, the majority of which were employed in the United States. Of our employees in the United States and Canada, approximately 7% are represented by organized labor. Currently, we are party to 10 collective bargaining agreements: three expire in 2017; one expires in 2018, two expire in 2019 and four are currently in negotiations. We consider relations with our employees to be good.
19
EXECUTIVE OFFICERS OF THE REGISTRANT
A list of our executive officers and their business experience follows. Ages shown are as of February 1, 2017.
Name and Title | Age | Experience |
Stephen J. Jones President and Chief Executive Officer | 55 | President and Chief Executive Officer since 2015. Prior to joining Covanta, Mr. Jones was employed by Air Products and Chemicals, Inc. (“Air Products”), a global supplier of industrial gases, equipment and services from 1992 through 2014. Mr. Jones served as Senior Vice President and General Manager, Tonnage Gases, Equipment and Energy, from 2009 through 2014. Mr. Jones also served as Air Products’ China President from 2011 through 2014 at Air Products’ office in Shanghai. He was also a member of Air Products’ Corporate Executive Committee from 2007 through 2014. Mr. Jones joined Air Products in 1992 as an attorney in the Law Group representing various business areas and functions and in 2007 he was appointed Senior Vice President, General Counsel and Secretary. |
Michael J. de Castro Executive Vice President, Supply Chain | 54 | Executive Vice President, Supply Chain since 2015. Prior to joining Covanta, Mr. de Castro was employed by Air Products beginning in 2006, serving in various operational capacities including Director, Global Operations Americas. Mr. de Castro left Air Products in 2010 to become Chief Executive Officer of Interstate Waste Services ("IWS"). In 2013, he returned to Air Products, serving as Director, Global Operations Strategic Development and most recently as Fulfillment Director in the Performance Materials Division. Prior to his tenure at IWS and Air Products, Mr. de Castro held a variety of positions at American Ref-Fuel Company for 16 years, culminating with the role of Vice President, Operations. |
Bradford J. Helgeson Executive Vice President and Chief Financial Officer | 40 | Executive Vice President and Chief Financial Officer since 2013. Mr. Helgeson served as Vice President and Treasurer from 2007 to 2013. Prior to joining Covanta in 2007, Mr. Helgeson was Vice President, Finance and Treasurer at Waste Services, Inc., a publicly-traded environmental services company with operations in the United States and Canada, from 2004 to 2007. Prior to these roles, Mr. Helgeson held positions in the investment banking departments at Lehman Brothers from 2000 to 2004 and at Donaldson, Lufkin & Jenrette from 1998 to 2000, where he worked on a wide range of capital markets and merger and acquisition transactions for industrial companies, with a particular focus in the environmental services sector. |
Matthew R. Mulcahy Executive Vice President and Head of Corporate Development | 53 | Executive Vice President and Head of Corporate Development since 2017. Mr. Mulcahy served as Senior Vice President and Head of Corporate Development for Covanta from 2012 to 2016 and Senior Vice President of Business Development from 2007 through 2011. From 2003 to 2007, Mr. Mulcahy served as Vice President of Covanta Secure Service and TransRiver Marketing, a Covanta subsidiary. From 2000 to 2003, Mr. Mulcahy was Covanta’s Vice President, Project Implementation. Mr. Mulcahy joined Covanta in 1990. |
Timothy J. Simpson Executive Vice President, General Counsel and Secretary | 58 | Executive Vice President, General Counsel and Secretary since 2007. Mr. Simpson served as Senior Vice President, General Counsel and Secretary from 2004 to 2007. Previously, he served as Senior Vice President, General Counsel and Secretary of Covanta Energy from March 2004 to October 2004. From 2001 to March 2004, Mr. Simpson served as Vice President, Associate General Counsel and Assistant Secretary. Mr. Simpson joined Covanta in 1992. |
Paul E. Stauder President, Covanta Environmental Solutions | 51 | President of Covanta Environmental Solutions, a subsidiary of Covanta Energy, since 2015. Mr. Stauder served as Senior Vice President of Business Management for Covanta Energy from 2008 to 2014, with primary responsibility for all commercial and client aspects of Covanta’s EFW facilities. Prior to that role, Mr. Stauder served in a number of positions with Covanta Energy, including Regional Vice President, overseeing EfW plants and independent power plants. Mr. Stauder joined Covanta in 1997. |
20
Derek W. Veenhof Executive Vice President, Sustainable Solutions | 50 | Executive Vice President - Sustainable Solutions since 2013. Mr. Veenhof served as Senior Vice President of Covanta 4Recovery L.P., from 2011 to 2013. From 2007 to 2011, Mr. Veenhof served as Vice President of TransRiver Marketing, a Covanta Energy subsidiary, and managed contract efforts in recycling and waste. From 2002 to 2006, Mr. Veenhof was Covanta Energy’s New York Metro Area Manager responsible for waste contract negotiations, business operations and business marketing and development for the Metro NY, NJ and Philadelphia market areas. |
Michael A. Wright Senior Vice President and Chief Human Resources Officer | 54 | Senior Vice President and Chief Human Resources Officer since 2009. Mr. Wright served as President of The Wright Group, Inc., a boutique human capital consulting firm from 2008 to 2009, prior to which Mr. Wright spent 25 years serving in a variety of positions at the Altria family of companies (Kraft and Philip Morris), including Vice President-Human Resources & Technology for Altria Corporate Services, Inc. from 2006 to 2008. |
Item 1A. RISK FACTORS
The following risk factors could have a material adverse effect on our business, financial condition and results of operations.
Exposure to energy, waste disposal, recycled metal and commodity prices may affect our results of operations.
Some of the electricity and steam we sell and all of the recycled metals we sell, are subject to market price volatility. Changes in the market prices for electricity and steam in particular can be affected by changes in natural gas prices, weather conditions and other market variables, while recycled metals prices are affected by general economic conditions and global demand for construction, goods and services. Similarly, the portion of waste processing capacity which is not under contract may be subject to volatility, principally as a result of general economic activity and waste generation rates, as well as the availability of alternative disposal sites and the cost to transport waste to alternative disposal. Volatility with respect to these all of these revenue categories could adversely impact our businesses’ profitability and financial performance. We may not be successful in our efforts to mitigate our exposure to price swings relating to these revenue streams.
We may experience volatility in the market prices and availability of commodities we purchase, such as reagents, chemicals and fuel. Any price increase, delivery disruption or reduction in the availability of such supplies could affect our ability to operate the facilities and impair our cash flow and profitability. We may not be successful in our efforts to mitigate our exposure to supply and price swings for these commodities.
Weakness in the economy may have an adverse effect on our revenue, cash flow and our ability to grow our business.
Our business is directly affected by economic slowdowns and general reduction in demand for goods and services. A weak economy generally results in reduced overall demand for waste disposal, recycled metal and energy production. Under such conditions, the pricing we are able to charge for our waste management services, and for our energy and recycled metals, may decline and/or experience increased volatility. In addition, many of our customers are municipalities and public authorities which may be adversely affected in an economic downturn due to reduced tax revenue. Consequently, some of these entities could be unable to pay amounts owed to us or renew contracts with us for similar volumes or at previous or increased rates.
Furthermore, lower prices for waste disposal and energy production, particularly in the absence of energy policies which encourage renewable technologies such as EfW, may also make it more difficult for us to sell waste and energy services at prices sufficient to allow us to grow our business through developing and building new projects. These factors could have a material adverse effect on our profitability and cash flow.
Compliance with environmental laws, including changes to such laws, could adversely affect our results of operations.
Our waste and energy services businesses are subject to extensive environmental laws and regulations by federal, state, local and foreign authorities, primarily relating to air, waste (including residual ash from combustion) and water. Costs relating to compliance with these laws and regulations are material to our business. If our businesses fail to comply with these regulations, our cash flow and profitability could be adversely affected, and we could be subject to civil or criminal liability, damages and fines.
In addition, lawsuits or enforcement actions by federal, state, local and/or foreign regulatory agencies may materially increase our costs. Stricter environmental regulation of air emissions, solid waste handling or combustion, residual ash handling and disposal, and waste water discharge could materially affect our cash flow and profitability. Certain environmental laws make us potentially liable on a joint and several basis for the remediation of contamination at or emanating from properties or facilities we currently or formerly owned or operated or properties to which we arranged for the disposal of hazardous substances. Such liability is not limited to the cleanup of contamination we actually caused. We cannot provide any assurance that we will not incur liability relating
21
to the remediation of contamination, including contamination we did not cause. For additional information on environmental regulation, see Item 1. Business — Regulation of Business.
Existing environmental laws and regulations have been and could be revised or reinterpreted, and future changes in environmental laws and regulations are expected to occur. This may materially increase the amount we must invest to bring our facilities into compliance, impose additional expense on our operations, limit our ability to operate at capacity, or at all, or otherwise impose structural changes to markets which would adversely affect our competitive positioning in those markets.
Significant developments stemming from the recent U.S. presidential election could have a material adverse effect on us.
The Trump Administration has called for substantial change to fiscal and tax policies, regulatory oversight of businesses, and greater restrictions on free trade including significant increases on tariffs on goods imported into the United States, including from China. Proposals espoused by President Trump may result in changes to social, political, regulatory and economic conditions in the United States or in laws and policies affecting the development and investment in countries where we currently conduct business. In addition, these changes could result in negative sentiments towards the United States among non-U.S. customers and among non-U.S. employees or prospective employees. We cannot predict the impact, if any, of these changes to our business. However, it is possible that these changes could adversely affect our business. It is likely that some policies adopted by the new administration will benefit us and others will negatively affect us. Until we know what changes are enacted, we will not know whether in total we benefit from, or are negatively affected by, the changes.
Contracts to provide new services or services through new or different methods involves significant risks, which could have an adverse effect on our cash flows and results of operations.
As we enter into contracts to provide new services or services through new or different methods, such as our waste transportation and disposal contract with New York City or our acquired environmental services businesses, we may face additional operating risks. These may include:
• | performance by multiple contractors critical to our ability to perform under our new customer agreements; |
• | logistics associated with transportation of waste via barge, rail or other methods with which we have limited experience; |
• | reliance on joint venture parties or technology providers with whom we have limited experience; and |
• | risks associated with providing new materials handling or treatment services. |
Operation of our businesses involves significant risks, which could have an adverse effect on our cash flows and results of operations.
The operation of our businesses involves many risks, including:
• | supply or transportation interruptions; |
• | the breakdown, failure or unplanned maintenance or repair of equipment or processes; |
• | difficulty or inability to find suitable replacement parts for equipment; |
• | the unavailability of sufficient quantities of waste or fuel; |
• | fluctuations in the heating value of the waste we use for fuel at our EfW facilities; |
• | failure or inadequate performance by subcontractors; |
• | disruption in the transmission of electricity generated; |
• | labor disputes and work stoppages; |
• | unforeseen engineering and environmental problems; |
• | unanticipated cost overruns; |
• | weather interferences and catastrophic events including fires, explosions, earthquakes, droughts, pandemics and acts of terrorism; and |
• | the exercise of the power of eminent domain. |
We cannot predict the impact of these risks on our business or operations. One or more of these risks, if they were to occur, could prevent us from meeting our obligations under our operating contracts and have an adverse effect on our cash flows and results of operations.
Our results of operations may be adversely affected by market conditions existing at the time our contracts expire.
For the EfW facilities that we own or lease, the contracts pursuant to which we provide waste services and sell energy output expire on various dates between 2017 and 2038. Expiration of these contracts subjects us to greater market risk in entering into new or replacement contracts at pricing levels that may not generate comparable revenue. We cannot assure you that we will be able to enter into renewal or replacement contracts on favorable terms, or at all. We also expect that medium- and long-term contracts for sales of energy may be less available than in the past, and so after expiration of existing contracts we expect to sell our energy output either in short-term transactions or on a spot basis or pursuant to new contracts which may subject us to greater market risk in maintaining and enhancing revenue. As a result, following the expiration of our existing long-term contracts, we
22
may have more exposure on a relative basis to market risk, and therefore revenue fluctuations, in energy markets than in waste markets.
Where we have leasehold interests, we cannot assure you that market conditions prevailing when such interests expire will allow us to enter into an extension or that the terms available in the market at the time will be favorable to us.
Changes in public policies and legislative initiatives could materially affect our business and prospects.
There has been substantial debate recently in the United States and abroad in the context of environmental and energy policies affecting climate change, the outcome of which could have a positive or negative influence on our existing business and our prospects for growing our business. Congress has considered proposed legislation which is designed to increase the proportion of the nation’s electricity that is generated from technologies considered “clean” or “renewable”, through mandatory generation levels, tax incentives, and other means. Congress has also considered enacting legislation which sets declining limits on greenhouse gas emissions, and requires generators to purchase rights to emit in excess of such limits, and allows such rights to be traded. For those sources of greenhouse gas emissions that are unable to meet the required limitations, such legislation could impose substantial financial burdens. The EPA has proposed rules which require states to develop plans to reduce carbon emissions from the energy sector, through a variety of methods generally subject to state discretion. While it is unclear if the Trump administration will proceed with any of these Federal initiatives, our business and future prospects could be adversely affected if renewable technologies we use were either (i) disfavored in any new laws or regulations pursued by the Trump administration, or (ii) not included among those technologies identified in any final laws or regulations as favoring renewable technologies, or not included in the state plans to reduce carbon emissions, and therefore not entitled to the benefits of such laws, regulations, or plans.
Our revenue and cash flows may decline if we are not successful in retaining rights or such rights terminate to operate facilities after our contracts expire.
We operate some facilities owned by municipal clients, under long-term contracts. If, when existing contracts expire, we are unable to reach agreement with our municipal clients on the terms under which they would extend our operating contracts, this may adversely affect our revenue, cash flow and profitability. We cannot assure that we will be able to enter into such contracts or that the terms available in the market at the time will be favorable to us.
At a limited number of facilities we operate that are owned by municipal clients, our clients have certain rights to terminate such contracts without cause. If any such terminations were to occur, this may adversely affect our revenue, cash flow and profitability. We cannot assure that such contract terminations will not occur in the future.
Our revenue and cash flows may be subject to greater volatility if we extend or renew our contracts under tip fee structures more often than service fee structures.
Our revenue and cash flows may be subject to greater volatility if we extend or renew our contracts under tip fee structures more often than under service fee structures. Due to the nature of tip fee structures, if that were to occur, we may be exposed to greater performance and price risk on the energy we sell.
Some of our EfW projects involve greater risk of exposure to performance levels which, if not satisfied, could result in materially lower revenue.
At our EfW facilities where tip fee structures exist, we receive 100% of the energy revenue they generate. As a result, if we are unable to operate these facilities at their historical performance levels for any reason, our revenue from energy sales could materially decrease.
Our substantial indebtedness could adversely affect our business, financial condition and results of operations and our ability to meet our payment obligations under our indebtedness.
The level of our consolidated indebtedness could have significant consequences on our future operations, including:
• | making it difficult for us to meet our payment and other obligations under our outstanding indebtedness; |
• | limiting our ability to obtain additional financing to fund working capital, capital expenditures, new projects, acquisitions and other general corporate purposes; |
• | subjecting us to the risk of increased sensitivity to interest rate increases on indebtedness under our credit facilities; |
• | limiting our flexibility in planning for, or reacting to, and increasing our vulnerability to, changes in our business, the industries in which we operate and the general economy; and |
• | placing us at a competitive disadvantage compared to our competitors that have less debt or are less leveraged. |
Any of the above-listed factors could have an adverse effect on our business, financial condition and results of operations and our ability to meet our payment obligations under our consolidated debt, and the price of our common stock.
23
We cannot assure you that our cash flow from operations will be sufficient to service our indebtedness, which could have a material adverse effect on our financial condition.
Our ability to meet our obligations under our indebtedness depends on our ability to receive dividends and distributions from our subsidiaries in the future. This, in turn, is subject to many factors, some of which are beyond our control, including the following:
• | the continued operation and maintenance of our facilities, consistent with historical performance levels; |
• | maintenance or enhancement of revenue from renewals or replacement of existing contracts and from new contracts to expand existing facilities or operate additional facilities; |
• | market conditions affecting waste disposal and energy pricing, as well as competition from other companies for contract renewals, expansions and additional contracts, particularly after our existing contracts expire; |
• | the continued availability of the benefits of our net operating loss carryforwards; and |
• | general economic, financial, competitive, legislative, regulatory and other factors. |
We cannot assure you that our business will generate cash flow from operations, or that future borrowings will be available to us under our credit facilities or otherwise, in an amount sufficient to enable us to meet our payment obligations under our outstanding indebtedness and to fund other liquidity needs. If we are not able to generate sufficient cash flow to service our debt obligations, we may need to refinance or restructure our debt, sell assets, reduce or delay capital investments, or seek to raise additional capital. If we are unable to implement one or more of these alternatives, we may not be able to meet our payment obligations under our outstanding indebtedness, which could have a material and adverse effect on our financial condition.
Our credit facilities and the indentures for our other corporate debt contain covenant restrictions that may limit our ability to operate our business.
Our credit facilities and the indentures for our other corporate debt contain operating and financial restrictions and covenants that impose operating and financial restrictions on us and require us to meet certain financial tests. Complying with these covenant restrictions may limit our ability to engage in certain transactions or activities, including incurring additional indebtedness, making certain investments, and distributions, and selling certain assets.
As a result of these covenant restrictions, our ability to respond to changes in business and economic conditions and to obtain additional financing, if needed, may be restricted, and we may be prevented from engaging in transactions that might otherwise be beneficial to us.
Our ability to comply with these covenants is dependent on our future performance, which will be subject to many factors, some of which are beyond our control, including prevailing economic conditions. In addition, the failure to comply with these covenants may result in a default under our credit facilities and other corporate debt. Upon the occurrence of such an event of default, the lenders under our credit facilities could elect to declare all amounts outstanding under such credit facilities, together with accrued interest, to be immediately due and payable. If the lenders accelerate the payment of the indebtedness under our credit facilities, we cannot assure you that the assets securing such indebtedness would be sufficient to repay in full that indebtedness and our other indebtedness, which could have a material and adverse effect on our financial condition.
Development and construction of new projects and expansions may not commence as anticipated, or at all.
Development and construction involves many risks including:
• | difficulties in identifying, obtaining and permitting suitable sites for new projects; |
• | the inaccuracy of our assumptions with respect to the cost of and schedule for completing construction; |
• | difficulty, delays or inability to obtain financing for a project on acceptable terms; |
• | delays in deliveries of, or increases in the prices of, equipment sourced from other countries; |
• | the unavailability of sufficient quantities of waste or other fuels for startup; |
• | permitting and other regulatory issues, license revocation and changes in legal requirements; |
• | labor disputes and work stoppages; |
• | unforeseen engineering and environmental problems; |
• | interruption of existing operations; |
• | unanticipated cost overruns or delays; and |
• | weather interferences and catastrophic events including fires, explosions, earthquakes, droughts, pandemics and acts of terrorism. |
In addition, new facilities have no operating history and may employ recently developed technology and equipment. A new facility may be unable to fund principal and interest payments under its debt service obligations or may operate at a loss. In certain situations, if a facility fails to achieve commercial operation, at certain levels or at all, termination rights in the agreements governing the facilities financing may be triggered, rendering all of the facility’s debt immediately due and payable. As a result, the facility may be rendered insolvent and we may lose our interest in the facility.
24
Construction activities may cost more and take longer than we estimate.
The design and construction of new projects or expansions requires us to contract for services from engineering and construction firms, and make substantial purchases of equipment such as boilers, turbine generators and other components that require large quantities of steel to fabricate. These are complex projects that include many factors and conditions which may adversely affect our ability to successfully compete for new projects, or construct and complete such projects on time and within budget.
Changes in climate conditions could materially affect our business and prospects.
Significant changes in weather patterns and volatility could have a negative influence on our existing business and our prospects for growing our business. Such changes may cause episodic events (such as floods or storms) that are difficult to predict or prepare for, or longer-term trends (such as droughts or sea-level rise). These or other meteorological changes could lead to increased operating costs, capital expense, disruptions in facility operations or supply chains, changes in waste generation and interruptions in waste deliveries, limited availability of water for plant cooling operations, and changes in energy pricing, among other effects.
Dislocations in credit and capital markets and increased capital constraints on banks may make it more difficult for us to borrow money or raise capital needed to finance the construction of new projects, expand existing projects, acquire certain businesses and refinance our existing debt.
Our business is capital intensive, and we seek to finance a significant portion of our existing assets, as well as our investments in new assets, with debt capital to the extent that we believe such financing is prudent and accretive to stockholder value.
As of December 31, 2016, we had approximately $2.6 billion in long-term debt and project debt. Prolonged instability or deterioration in the bank credit and/or debt and equity capital markets may adversely affect our ability to obtain refinancing of our existing debt on favorable terms, or at all. Such circumstances could adversely affect our business, financial condition, and/or the share price of our common stock.
We intend to grow our business through the development of new projects, the expansion and/or enhancement of existing facilities, and opportunistic acquisitions of projects or businesses. Such investments may be large enough to require capital in excess of our cash on hand and availability under our existing credit facilities. Prolonged instability or deterioration in the credit markets may adversely impact our access to capital on terms that we find acceptable, thereby impacting our ability to execute our strategy to grow our business.
Our reputation could be adversely affected if we are unable to operate our businesses in compliance with laws, or if our efforts to grow our business results in adverse publicity.
If we encounter regulatory compliance issues in the course of operating our businesses, we may experience adverse publicity, which may intensify if such non-compliance results in civil or criminal liability. This adverse publicity may harm our reputation, and result in difficulties in attracting new customers, or retaining existing customers.
With respect to our efforts to grow and maintain our business globally, we sometimes experience opposition from advocacy groups or others intended to halt our development or on-going business. Such opposition is often intended to discourage third parties from doing business with us and may be based on misleading, inaccurate, incomplete or inflammatory assertions. Our reputation may be adversely affected as a result of adverse publicity resulting from such opposition. Such damage to our reputation could adversely affect our ability to grow and maintain our business.
Changes in technology may have a material adverse effect on our profitability.
Our company and others have recognized the value of the traditional waste stream as a potential resource. Research and development activities are ongoing to provide alternative and more efficient technologies to manage waste, produce or extract by-products from waste, or to produce power. We and many other companies are pursuing these technologies, and capital is being invested to find new approaches to waste management, waste treatment, and renewable power generation. It is possible that this deployment of capital may lead to advances in these or other technologies which will reduce the cost of waste management or power production to a level below our costs and/or provide new or alternative methods of waste management or energy generation that become more accepted than those we currently utilize. Unless we are able to participate in these advances, any of these changes could have a material adverse effect on our revenue, profitability and the value of our existing facilities.
Our ability to optimize our operations depends in part on our ability to compete for and obtain fuel for our facilities, and our failure to do so may adversely affect our financial results.
Our EfW facilities depend on solid waste for fuel, which provides a source of revenue. For some of our EfW facilities, the availability of solid waste to us, as well as the tipping fee that we charge to attract solid waste to our facilities, depends upon competition from a number of sources such as other EfW facilities, landfills and transfer stations competing for waste in the market area. In addition, we may need to obtain waste on a competitive basis as our long-term contracts expire at our owned facilities. There has been consolidation, and there may be further consolidation, in the solid waste industry that would reduce the number of solid waste collectors or haulers that are competing for disposal facilities or enable such collectors or haulers to use wholesale
25
purchasing to negotiate favorable below-market rates. The consolidation in the solid waste industry has resulted in companies with vertically integrated collection activities and disposal facilities. Such consolidation may result in economies of scale for those companies, as well as the use of disposal capacity at facilities owned by such companies or by affiliated companies. Such activities can affect both the availability of waste to us for processing at some of our EfW facilities and market pricing, which could materially and adversely affect our results of operations.
Exposure to foreign currency fluctuations may affect our results from operations or construction costs of facilities we develop in international markets.
We have sought to participate in projects where the host country has allowed the convertibility of its currency into U.S. dollars and repatriation of earnings, capital and profits subject to compliance with local regulatory requirements. As and if we grow our business in other countries and enter new international markets, we expect to invest substantial amounts in foreign currencies to pay for the construction costs of facilities we develop, or for the cost to acquire existing businesses or assets. Currency volatility in those markets, as well as the effectiveness of any currency hedging strategies we may implement, may impact the amount we are required to invest in new projects, as well as our reported results.
Our growth could strain our resources and cause our business to suffer.
We have made and may continue to plan and execute acquisitions and take other actions to grow our base business. Acquisitions present significant challenges and risks relating to the integration of the business into the company. If we make acquisitions, it could place a strain on our management systems, infrastructure and resources, as well as present new or different risks to our business. We expect that we will need to continually evaluate and maintain our financial and managerial controls, reporting systems and procedures. We will also need to expand, train and manage our workforce worldwide. We can provide no assurances that the company will manage acquisitions successfully.
Our ability to successfully manage organizational, process and cost-efficiency initiatives could strain our resources and affect our profitability.
We have made and may continue to undertake organizational, process and cost efficiency changes intended to improve our business. These changes, which may include implementation of new systems and processes, staff adjustments and reassignments of responsibilities, are important to our business success. Failure or delay in implementing these actions, or ineffective implementation could strain our resources and systems, resulting in disruption to our business and/or adversely affecting our results.
Our businesses generate their revenue primarily under long-term contracts and must avoid defaults under those contracts in order to service their debt and avoid material liability to contract counterparties.
We must satisfy performance and other obligations under contracts governing EfW facilities. These contracts typically require us to meet certain performance criteria relating to amounts of waste processed, energy generation rates per ton of waste processed, residue quantity and environmental standards. Our failure to satisfy these criteria may subject us to termination of operating contracts. If such a termination were to occur, we would lose the cash flow related to the projects and incur material termination damage liability, which may be guaranteed by us. In circumstances where the contract has been terminated due to our default, we may not have sufficient sources of cash to pay such damages. We cannot assure you that we will be able to continue to perform our respective obligations under such contracts in order to avoid such contract terminations, or damages related to any such contract termination, or that if we could not avoid such terminations that we would have the cash resources to pay amounts that may then become due.
We have provided guarantees and financial support in connection with our projects.
We are obligated to guarantee or provide financial support for our projects in one or more of the following forms:
• | support agreements in connection with construction, service or operating agreement-related obligations; |
• | direct guarantees of certain debt relating to our facilities; |
• | contingent obligations to pay lease payment installments in connection with certain of our facilities; |
• | agreements to arrange financing for projects under development; |
• | contingent credit support for damages arising from performance failures; |
• | environmental indemnities; and |
• | contingent capital and credit support to finance costs, in most cases in connection with a corresponding increase in service fees, relating to uncontrollable circumstances. |
Many of these contingent obligations cannot readily be quantified, but, if we were required to provide this support, it could materially and adversely affect our cash flow, results of operations and financial condition.
26
Our businesses depend on performance by third parties under contractual arrangements.
Our waste and energy services businesses depend on a limited number of third parties to, among other things, purchase the electric and steam energy produced by our facilities, supply and deliver the waste and other goods and services necessary for the operation of our energy facilities, and purchase the metals we recover. The viability of our facilities depends significantly upon the performance by third parties in accordance with long-term and short-term contracts, and such performance depends on factors which may be beyond our control. If those third parties do not perform their obligations, or are excused from performing their obligations because of nonperformance by our waste and energy services businesses or other parties to the contracts, or due to force majeure events or changes in laws or regulations, our businesses may not be able to secure alternate arrangements on substantially the same terms, or at all. In addition, the bankruptcy or financial stability of third parties with whom we do business could result in nonpayment or nonperformance of that party’s obligations to us. The economic slowdown and disruptions in credit markets have strained resources of these third parties, and could make it difficult for them to honor their obligations to us.
We are subject to counterparty and market risk with respect to transactions with financial and other institutions.
Following the expiration of our initial contracts to sell electricity from our projects, we expect to have on a relative basis more exposure to market risk, and therefore revenue fluctuations, in energy markets than in waste markets. Consequently, we may enter into futures, forward contracts, swaps or options with financial institutions to hedge our exposure to market risk in energy markets. We can provide no assurances as to the financial stability or viability of these financial and other institutions.
Concentration of suppliers and customers may expose us to heightened financial exposure.
Our waste and energy services businesses often rely on single suppliers and single customers at our facilities, exposing such facilities to financial risks if any supplier or customer should fail to perform its obligations.
For example, our businesses often rely on a single supplier to provide waste, fuel, water and other services required to operate a facility and on a single customer or a few customers to purchase all or a significant portion of a facility’s output. The financial performance of these facilities depends on such customers and suppliers continuing to perform their obligations under their long-term agreements. A facility’s financial results could be materially and adversely affected if any one customer or supplier fails to fulfill its contractual obligations and we are unable to find other customers or suppliers to produce the same level of profitability. We cannot assure you that such performance failures by third parties will not occur, or that if they do occur, such failures will not adversely affect the cash flows or profitability of our businesses.
In addition, we rely on the municipal clients as a source not only of waste for fuel, but also of revenue from the fees for waste services we provide. Because our contracts with municipal clients are generally long-term, we may be adversely affected if the credit quality of one or more of our municipal clients were to decline materially.
Our waste operations are concentrated in one region and expose us to regional economic or market declines.
The majority of our waste disposal facilities are located in the northeastern United States, primarily along the Washington, D.C. to Boston, Massachusetts corridor. Adverse economic developments in this region could affect regional waste generation rates and demand for waste management services provided by us. Adverse market developments caused by additional waste processing capacity in this region could adversely affect waste disposal pricing. Either of these developments could have a material adverse effect on our profitability and cash generation.
Exposure to international economic and political factors may materially and adversely affect our international businesses.
Our international operations expose us to political, legal, tax, currency, inflation, convertibility and repatriation risks, as well as potential constraints on the development and operation of potential business, any of which can limit the benefits to us of an international project.
The financing, development and operation of projects outside the United States can entail significant political and financial risks, which vary by country, including:
• | changes in law or regulations; |
• | changes in electricity pricing; |
• | changes in foreign tax laws and regulations; |
• | changes in United States federal, state and local laws, including tax laws, related to foreign operations; |
• | compliance with United States federal, state and local foreign corrupt practices laws; |
• | changes in government policies or personnel; |
• | changes in general economic conditions affecting each country, including conditions in financial markets; |
• | changes in labor relations in operations outside the United States; |
• | political, economic or military instability and civil unrest; |
• | expropriation and confiscation of assets and facilities; and |
• | credit quality of entities that purchase our power. |
27
The legal and financial environment in foreign countries in which we currently own assets or projects could also make it more difficult for us to enforce our rights under agreements relating to such projects.
Any or all of the risks identified above with respect to our international projects could adversely affect our profitability and cash generation. As a result, these risks may have a material adverse effect on our business, consolidated financial condition and results of operations.
Our reputation could be adversely affected if our businesses, or third parties with whom we have a relationship, were to fail to comply with United States or foreign anti-corruption laws or regulations.
Some of our projects and new business may be conducted in countries where corruption has historically penetrated the economy to a greater extent than in the United States. It is our policy to comply, and to require our local partners and those with whom we do business to comply, with all applicable anti-bribery laws, such as the U.S. Foreign Corrupt Practices Act, and with applicable local laws of the foreign countries in which we operate. Our reputation may be adversely affected if we were reported to be associated with corrupt practices or if we or our local partners failed to comply with such laws. Such damage to our reputation could adversely affect our ability to grow our business.
Energy regulation could adversely affect our revenue and costs of operations.
Our waste and energy services businesses are subject to extensive energy regulations by federal, state and foreign authorities. We cannot predict whether the federal, state or foreign governments will modify or adopt new legislation or regulations relating to the solid waste or energy industries. The economics, including the costs, of operating our facilities may be adversely affected by any changes in these regulations or in their interpretation or implementation or any future inability to comply with existing or future regulations or requirements.
If our businesses lose existing exemptions under the Federal Power Act, the economics and operations of our energy projects could be adversely affected, including as a result of rate regulation by the Federal Energy Regulatory Commission with respect to our output of electricity, which could result in lower prices for sales of electricity and increased compliance costs. In addition, depending on the terms of the project’s power purchase agreement, a loss of our exemptions could allow the power purchaser to cease taking and paying for electricity under existing contracts. Such results could cause the loss of some or all contract revenue or otherwise impair the value of a project and could trigger defaults under provisions of the applicable project contracts and financing agreements. Defaults under such financing agreements could render the underlying debt immediately due and payable. Under such circumstances, we cannot assure you that revenue received, the costs incurred, or both, in connection with the project could be recovered through sales to other purchasers.
Failure to obtain regulatory approvals could adversely affect our operations.
Our waste and energy services businesses are continually in the process of obtaining or renewing federal, state, local and foreign approvals required to operate our facilities. While we believe our businesses currently have all necessary operating approvals, we may not always be able to obtain all required regulatory approvals, and we may not be able to obtain any necessary modifications to existing regulatory approvals or maintain all required regulatory approvals. If there is a delay in obtaining any required regulatory approvals or if we fail to obtain and comply with any required regulatory approvals, the operation of our facilities or the sale of electricity to third parties could be prevented, made subject to additional regulation or subject our businesses to additional costs or a decrease in revenue.
The energy industry is becoming increasingly competitive, and we might not successfully respond to these changes.
We may not be able to respond in a timely or effective manner to the changes resulting in increased competition in the energy industry in global markets. These changes may include deregulation of the electric utility industry in some markets, privatization of the electric utility industry in other markets and increasing competition in all markets. To the extent competitive pressures increase and the pricing and sale of electricity assumes more characteristics of a commodity business, the economics of our business may be subject to greater volatility and we might not successfully respond to these changes.
Future impairment charges could have a material adverse impact on our financial condition and results of operations.
In accordance with accounting guidance, we evaluate long-lived assets for impairment whenever events or changes in circumstances, such as significant adverse changes in regulation, business climate or market conditions, could potentially indicate the carrying amount may not be recoverable. Significant reductions in our expected revenue or cash flows for an extended period of time resulting from such events could result in future asset impairment charges, which could have a material adverse impact on our financial condition and results of operations.
28
Security breaches and other disruptions to our information technology infrastructure could interfere with our operations, compromise information belonging to us and our customers, suppliers or employees, and expose us to liability that could adversely impact our business and reputation.
In the ordinary course of business, we rely on information technology networks and systems to process, transmit and store electronic information, and to manage or support a variety of business processes and activities. Despite security measures and business continuity plans, interruptions and breaches of computer and communications systems, including computer viruses, "hacking" and "cyber-attacks," power outages, telecommunication or utility facilities, system failures, natural disasters or other catastrophic events that could impair our ability to conduct business and communicate internally and with our customers, or result in the theft of trade secrets or other misappropriation of assets, or otherwise compromise privacy of sensitive information belonging to us, our customers or other business partners. Any such events could result in legal claims or proceedings, liability or penalties under privacy laws, disruption in revenue from operations, and damage to our reputation, which could adversely affect our business.
We cannot be certain that our NOLs will continue to be available to offset our federal tax liability.
As of December 31, 2016, we had $288 million of net operating loss carryforwards (“NOLs”). NOLs offset our consolidated taxable income and will expire in various amounts, if not used, between 2028 and 2033 The NOLs are also used to offset income from certain grantor trusts that were established as part of the reorganization in 1990 of certain of our subsidiaries engaged in the insurance business and are administered by state regulatory agencies. As the administration of these grantor trusts concludes, taxable income could result, utilizing a portion of our NOLs and accelerating the date on which we may be otherwise obligated to pay incremental cash taxes.
Our insurance and contractual protections may not always cover lost revenue, increased expense or contractual liabilities.
Although our businesses maintain insurance, obtain warranties from vendors, require contractors to meet certain performance levels and, in some cases, pass risks we cannot control to the service recipient or output purchaser, the proceeds of such insurance, warranties, performance guarantees or risk sharing arrangements may not be adequate to cover lost revenue, increased expense or contractual liabilities.
We depend on our senior management and key personnel and we may have difficulty attracting and retaining qualified professionals.
Our future operating results depend to a large extent upon the continued contributions of key senior managers and personnel. In addition, we are dependent on our ability to attract, train, retain and motivate highly skilled employees. However, there is significant competition for employees with the requisite level of experience and qualifications. If we cannot attract, train, retain and motivate qualified personnel, we may be unable to compete effectively and our growth may be limited, which could have a material adverse effect on our business, results of operations, financial condition and prospects and our ability to fulfill our debt obligations.
Our controls and procedures may not prevent or detect all errors or acts of fraud.
Any disclosure controls and procedures or internal controls and procedures, no matter how well conceived and operated, can provide only reasonable, not absolute, assurance that the objectives of the control system are met. Further, the design of a control system must consider the benefits of controls relative to their costs. Inherent limitations within a control system include the realities that judgments in decision-making can be faulty, and that breakdowns can occur because of simple error or mistake. Additionally, controls can be circumvented by the individual acts of some persons, by collusion of two or more people, or by an unauthorized override of the controls. While the design of any system of controls is to provide reasonable assurance of the effectiveness of disclosure controls, such design is also based in part upon certain assumptions about the likelihood of future events, and such assumptions, while reasonable, may not take into account all potential future conditions. Accordingly, because of the inherent limitations in a cost effective control system, misstatements due to error or fraud may occur and may not be prevented or detected.
Failure to maintain an effective system of internal controls over financial reporting may have an adverse effect on our stock price.
We have in the past discovered, and may potentially in the future discover, areas of internal control over financial reporting that may require improvement. If we are unable to assert that our internal control over financial reporting is effective now or in any future period, or if our independent auditors are unable to express an opinion on the effectiveness of our internal controls, we could lose investor confidence in the accuracy and completeness of our financial reports, which could have an adverse effect on our stock price.
Provisions of our certificate of incorporation, our credit facilities and our other corporate debt could discourage an acquisition of us by a third party.
Certain provisions of our credit facilities and our other corporate debt could make it more difficult or more expensive for a third party to acquire us. Upon the occurrence of certain transactions constituting a fundamental change, holders of our credit facilities
29
and our other corporate debt will have the right to require Covanta Holding or Covanta Energy, as the case may be, to repurchase their corporate debt or repay the facilities, as applicable. In addition, provisions of our certificate of incorporation and bylaws, each as amended, could make it more difficult for a third party to acquire control of us. For example, our certificate of incorporation authorizes our board of directors to issue preferred stock without requiring any stockholder approval, and preferred stock could be issued as a defensive measure in response to a takeover proposal. All these provisions could make it more difficult for a third party to acquire us or discourage a third party from acquiring us even if an acquisition might be in the best interest of our stockholders.
Item 1B. UNRESOLVED STAFF COMMENTS
None.
Item 2. PROPERTIES
We lease approximately 250,000 square feet of office space throughout North America, including 104,000 square feet for our headquarters in Morristown, New Jersey. In addition, we own 83 acres of undeveloped land in California. As of December 31, 2016, we owned, had equity investments in and/or operated 83 facilities in the North America segment consisting of 41 EfW operations, 4 landfills (primarily for ash disposal), 17 transfer stations, 15 environmental services facilities, 2 wood waste (biomass) energy projects, 2 water (hydroelectric) energy projects, one landfill gas project and one regional metals recycling facility. Principal projects are described above under Item 1. Business — North America Segment. Projects in the North America segment that we own or lease are conducted at properties, which we also own or lease, aggregating approximately 1,712 acres, of which 1,393 acres are owned and 319 acres are leased.
We operate projects outside of our North America segment and have offices located in Dublin, Ireland and Shanghai, China, where we lease office space of approximately 6,180 square feet. As of December 31, 2016, we are the part owner/operator of two international projects with businesses conducted at properties that are either leased or have land rights aggregating to 12 acres. Principal projects are described above under Item 1. Business — Other Projects.
Item 3. LEGAL PROCEEDINGS
For information regarding legal proceedings, see Item 8. Financial Statements And Supplementary Data — Note 18. Commitments and Contingencies, which information is incorporated herein by reference.
Item 4. MINE SAFETY DISCLOSURES
Not applicable.
30
PART II
Item 5. | MARKET FOR THE REGISTRANT'S COMMON EQUITY, RELATED STOCKHOLDER MATTERS AND ISSUER PURCHASES OF EQUITY SECURITIES |
Our common stock is traded on the New York Stock Exchange under the symbol “CVA”. On February 17, 2017, there were approximately 746 holders of record of our common stock. On February 17, 2017, the closing price of our common stock on the New York Stock Exchange was $16.00 per share. The following table sets forth the high and low stock prices of our common stock for the last two years.
2016 | 2015 | |||||||||||||||||||||||
High | Low | Dividend Declared | High | Low | Dividend Declared | |||||||||||||||||||
First Quarter | $ | 17.75 | $ | 12.48 | $ | 0.25 | $ | 23.04 | $ | 19.25 | $ | 0.25 | ||||||||||||
Second Quarter | $ | 17.22 | $ | 15.52 | $ | 0.25 | $ | 22.85 | $ | 19.99 | $ | 0.25 | ||||||||||||
Third Quarter | $ | 17.16 | $ | 14.43 | $ | 0.25 | $ | 21.80 | $ | 17.08 | $ | 0.25 | ||||||||||||
Fourth Quarter | $ | 15.95 | $ | 13.45 | $ | 0.25 | $ | 18.36 | $ | 13.69 | $ | 0.25 | ||||||||||||
Under current financing arrangements, there are restrictions on the ability of our subsidiaries to transfer funds to us in the form of cash dividends, loans or advances that could limit the future payment of dividends on our common stock. However, given our strong cash generation, we anticipate returning additional capital to our shareholders. See Item 7. Management’s Discussion and Analysis of Financial Condition and Results of Operations — Liquidity and Capital Resources and Item 8. Financial Statements and Supplementary Data — Note 5. Equity and Earnings Per Share ("EPS") for additional information on the restrictions under our financing arrangements and our dividend payments. See Item 12. Security Ownership of Certain Beneficial Owners and Management and Related Stockholder Matters regarding securities authorized for issuance under equity compensation plans.
Share Repurchases
Under our share repurchase program, common stock repurchases may be made in the open market, in privately negotiated transactions from time to time, or by other available methods, at management’s discretion in accordance with applicable federal securities laws. The timing and amounts of any repurchases will depend on many factors, including our capital structure, the market price of our common stock and overall market conditions, and whether any restrictions then exist under our policies relating to trading in compliance with securities laws. As of December 31, 2016, the amount remaining under our currently authorized share repurchase program was $66 million.
31
Performance Measurement Comparison
The following performance graph sets forth a comparison of the yearly percentage change in the Company’s cumulative total stockholder return on common stock with the Standard and Poor’s Midcap 400 Index*, the Dow Jones US Conventional Electricity Index**, and the Dow Jones US Waste & Disposal Services Index**. The foregoing cumulative total returns are computed assuming (a) an initial investment of $100, and (b) the reinvestment of dividends at the frequency which dividends were paid during the applicable years. The graph above reflects comparative information for the five fiscal years beginning with the close of trading on December 31, 2011 and ending December 31, 2016.
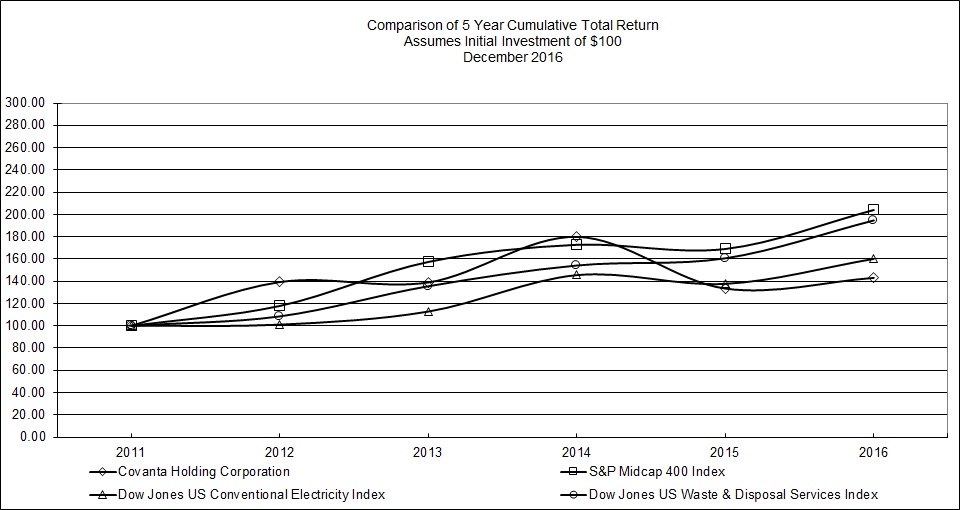
The stockholder return reflected above is not necessarily indicative of future performance.
* The Standard and Poor’s Midcap 400 Index is a capitalization-weighted index designed to measure performance of the broad domestic economy through changes in the aggregate market value of the component stocks representing all major industries. Copyright 2017 Standard and Poor’s, Inc. All Rights Reserved. Used with permission.
** The Dow Jones US Waste & Disposal Services Index and the Dow Jones US Conventional Electricity Index are maintained by Dow Jones & Company, Inc. As described by Dow Jones, the Dow Jones US Waste & Services Index consists of providers of pollution control and environmental services for the management, recovery and disposal of solid and hazardous waste materials, such as landfills and recycling centers. The Dow Jones US Conventional Electricity Index consists of companies generating and distributing electricity through the burning of fossil fuels such as coal, petroleum and natural gas, and through nuclear energy. Copyright 2017 Dow Jones & Company. All Rights Reserved. Used with permission.
32
Item 6. SELECTED FINANCIAL DATA
The selected financial information presented below should be read in conjunction with Item 7. Management's Discussion and Analysis of Financial Condition and Results of Operations and Item 8. Financial Statements and Supplementary Data.
For the Years Ended December 31, | ||||||||||||||||||||
2016 | 2015 | 2014 | 2013 | 2012 | ||||||||||||||||
(In millions, except per share amounts) | ||||||||||||||||||||
Statements of Operations Data: | ||||||||||||||||||||
Operating revenue | $ | 1,699 | $ | 1,645 | $ | 1,682 | $ | 1,630 | $ | 1,643 | ||||||||||
Operating expense | $ | 1,590 | $ | 1,536 | $ | 1,528 | $ | 1,395 | $ | 1,339 | ||||||||||
Operating income (1) | $ | 109 | $ | 109 | $ | 154 | $ | 235 | $ | 304 | ||||||||||
(Loss) income from continuing operations | $ | (4 | ) | $ | 69 | $ | (1 | ) | $ | 42 | $ | 138 | ||||||||
Loss from discontinued operations, net of taxes | $ | — | $ | — | $ | — | $ | (52 | ) | $ | (20 | ) | ||||||||
Net (loss) income | $ | (4 | ) | $ | 69 | $ | (1 | ) | $ | (10 | ) | $ | 118 | |||||||
Net (loss) income attributable to Covanta Holding Corporation stockholders: | ||||||||||||||||||||
Continuing operations | $ | (4 | ) | $ | 68 | $ | (2 | ) | $ | 43 | $ | 136 | ||||||||
Discontinued operations | $ | — | $ | — | $ | — | $ | (52 | ) | $ | (20 | ) | ||||||||
Basic (Loss) Earnings per share attributable to Covanta Holding Corporation: | ||||||||||||||||||||
Continuing operations | $ | (0.03 | ) | $ | 0.52 | $ | (0.01 | ) | $ | 0.33 | $ | 1.03 | ||||||||
Discontinued operations | — | — | — | (0.40 | ) | (0.15 | ) | |||||||||||||
Covanta Holding Corporation | $ | (0.03 | ) | $ | 0.52 | $ | (0.01 | ) | $ | (0.07 | ) | $ | 0.88 | |||||||
Diluted (Loss) Earnings per share attributable to Covanta Holding Corporation: | ||||||||||||||||||||
Continuing operations | $ | (0.03 | ) | $ | 0.51 | $ | (0.01 | ) | $ | 0.33 | $ | 1.02 | ||||||||
Discontinued operations | — | — | — | (0.40 | ) | (0.15 | ) | |||||||||||||
Covanta Holding Corporation | $ | (0.03 | ) | $ | 0.51 | $ | (0.01 | ) | $ | (0.07 | ) | $ | 0.87 | |||||||
Cash dividend declared per share | $ | 1.00 | $ | 1.00 | $ | 0.86 | $ | 0.66 | $ | 0.60 | ||||||||||
Weighted average common shares outstanding: | ||||||||||||||||||||
Basic | 129 | 132 | 130 | 129 | 132 | |||||||||||||||
Diluted | 129 | 133 | 130 | 130 | 133 | |||||||||||||||
As of December 31, | ||||||||||||||||||||
2016 | 2015 | 2014 | 2013 | 2012 | ||||||||||||||||
(In millions) | ||||||||||||||||||||
Balance Sheet Data: (1) | ||||||||||||||||||||
Cash and cash equivalents | $ | 84 | $ | 94 | $ | 84 | $ | 190 | $ | 233 | ||||||||||
Property, plant and equipment, net | $ | 3,024 | $ | 2,690 | $ | 2,607 | $ | 2,579 | $ | 2,509 | ||||||||||
Total assets | $ | 4,284 | $ | 4,234 | $ | 4,178 | $ | 4,357 | $ | 4,501 | ||||||||||
Long-term debt (incl. current portion) | $ | 2,252 | $ | 2,263 | $ | 1,948 | $ | 2,062 | $ | 1,988 | ||||||||||
Project debt (incl. current portion) | $ | 383 | $ | 198 | $ | 222 | $ | 212 | $ | 293 | ||||||||||
Total liabilities | $ | 3,815 | $ | 3,594 | $ | 3,394 | $ | 3,451 | $ | 3,452 | ||||||||||
Total Covanta Holding Corporation stockholders' equity | $ | 469 | $ | 638 | $ | 782 | $ | 902 | $ | 1,042 | ||||||||||
(1) | As revised for the years ended December 31, 2015 and prior. See Item 8. Financial Statements and Supplementary Data - Note 1. Organization and Summary of Significant Accounting Policies - Reclassifications and Accounting Pronouncements Recently Adopted. |
33
Item 7. | MANAGEMENT’S DISCUSSION AND ANALYSIS OF FINANCIAL CONDITION AND RESULTS OF OPERATIONS |
The terms “we,” “our,” “ours,” “us,” “Covanta” and “Company” refer to Covanta Holding Corporation and its subsidiaries; the term “Covanta Energy” refers to our subsidiary Covanta Energy, LLC and its subsidiaries.
OVERVIEW
Covanta is one of the world’s largest owners and operators of infrastructure for the conversion of waste to energy (known as “energy-from-waste” or “EfW”), as well as other waste disposal and renewable energy production businesses. Energy-from-waste serves two key markets as both a sustainable waste management solution that is environmentally superior to landfilling and as a source of clean energy that reduces overall greenhouse gas ("GHG") emissions. Energy-from-waste is also considered renewable under the laws of many states and under federal law. Our facilities are critical infrastructure assets that allow our customers, which are principally municipal entities, to provide an essential public service. For a discussion of our facilities, the energy-from-waste process and the environmental benefits of energy-from-waste, see Item 1. Business.
We have one reportable segment, North America, which is comprised of waste and energy services operations located primarily in the United States and Canada. Additional information about our reportable segment is contained in Item. 1. Business and Item 8. Financial Statements And Supplementary Data — Note 6. Financial Information by Business Segments.
For a discussion of key strategies and the execution thereof in 2016, see Item 1. Business — Strategy and Execution on Strategy.
General Business Conditions
See Item 1. Business — Markets, Competition and Business Conditions for a discussion of factors affecting business conditions and financial results.
RESULTS OF OPERATIONS
The following general discussions should be read in conjunction with the consolidated financial statements, the notes to the consolidated financial statements and other financial information appearing and referred to elsewhere in this report. Additional detail relating to changes in operating revenue and operating expense and the quantification of specific factors affecting or causing such changes, is provided in the segment discussion below.
The comparability of the information provided below with respect to our revenue, expense and certain other items for periods during each of the years presented was affected by several factors. As outlined in Item 8. Financial Statements And Supplementary Data — Note 1. Organization and Summary of Significant Accounting Policies and Note 3. New Business and Asset Management, our business development initiatives and acquisitions resulted in various transactions, which are reflected in comparative revenue and expense. These factors must be taken into account in developing meaningful comparisons between the periods compared below.
The Results of Operations discussion below compares our revenue, expense and certain other items during each of the years presented for continuing operations.
The following terms used within the Results of Operations discussion are defined as follows:
• | “Organic growth”: reflects the performance of the business on a comparable period-over-period basis, excluding the impacts of transactions and contract transitions. |
• | “Transactions”: includes the impacts of acquisitions, divestitures, and the addition or loss of operating contracts. |
• | “Contract transitions”: includes the impact of the expiration of: (a) long-term major waste and service contracts, most typically representing the transition to a new contract structure, and (b) long-term energy contracts. |
34
RESULTS OF OPERATIONS — OPERATING INCOME
Year Ended December 31, 2016 vs. Year Ended December 31, 2015
For the Years Ended December 31, | |||||||||||
Consolidated: | 2016 | 2015 | Variance Increase (Decrease) | ||||||||
(In millions) | |||||||||||
OPERATING REVENUE: | |||||||||||
Waste and service revenue | $ | 1,187 | $ | 1,104 | $ | 83 | |||||
Energy revenue | 370 | 421 | (51 | ) | |||||||
Recycled metals revenue | 61 | 61 | — | ||||||||
Other operating revenue | 81 | 59 | 22 | ||||||||
Total operating revenue | 1,699 | 1,645 | 54 | ||||||||
OPERATING EXPENSE: | |||||||||||
Plant operating expense | 1,177 | 1,129 | 48 | ||||||||
Other operating expense | 86 | 73 | 13 | ||||||||
General and administrative expense | 100 | 93 | 7 | ||||||||
Depreciation and amortization expense | 207 | 198 | 9 | ||||||||
Impairment charges | 20 | 43 | (23 | ) | |||||||
Total operating expense | 1,590 | 1,536 | 54 | ||||||||
Operating income | $ | 109 | $ | 109 | $ | — | |||||
Operating Revenue
Waste and Service Revenue
Consolidated (in millions): | For the Years Ended December 31, | |||||||||||
2016 | 2015 | Variance | ||||||||||
EfW waste and service revenue | $ | 962 | $ | 929 | $ | 33 | ||||||
Environmental services | 99 | 56 | 43 | |||||||||
Municipal services | 186 | 159 | 27 | |||||||||
Other revenue | 36 | 38 | (2 | ) | ||||||||
Intercompany | (96 | ) | (78 | ) | (18 | ) | ||||||
Total waste and service revenue | $ | 1,187 | $ | 1,104 | 83 | |||||||
EfW Facilities - Tons Received (1) (in millions): | For the Years Ended December 31, | ||||||||
2016 | 2015 | Variance | |||||||
Contracted | 17.4 | 17.2 | 0.2 | ||||||
Uncontracted | 2.2 | 2.2 | — | ||||||
Total Tons | 19.5 | 19.4 | 0.1 | ||||||
(1) Includes solid tons only. Does not include contribution from China investments. Certain amounts may not total due to rounding.
Waste and service revenue increased by $83 million year-over-year, driven by organic growth of $35 million and net contribution from transactions of $52 million, partially offset by a decline of $5 million related to contract transitions. Within organic growth, EfW waste processing revenue increased $24 million (2.5%) due to price and $2 million (0.2%) due to volume, and environmental services revenue increased by $12 million as a result of increased activity at newly acquired environmental services businesses. Transactions impacting revenue in the period included environmental services acquisitions ($30 million), a full year of operations under the New York City MTS contract, and commencement of operations at the Durham-York EfW facility.
35
Energy Revenue
Consolidated (1) (in millions): | For the Years Ended December 31, | |||||||||||
2016 | 2015 | Variance | ||||||||||
EfW energy sales | $ | 321 | $ | 308 | $ | 13 | ||||||
EfW capacity | 40 | 38 | 2 | |||||||||
Other revenue | 9 | 75 | (66 | ) | ||||||||
Total energy revenue | $ | 370 | $ | 421 | (51 | ) | ||||||
(1) Covanta share only. EfW excludes contribution from China investments. Represents the sale of electricity and steam based upon output delivered and capacity provided. Certain amounts may not total due to rounding.
Years Ended December 31, | |||||||||||||||||||||||||||
Total EfW (in millions): | 2016 | 2015 | Variance | ||||||||||||||||||||||||
Revenue (1) | Volume(1), (2) | % of Total Volume | Revenue (1) | Volume(1), (2) | % of Total Volume | Revenue | Volume | ||||||||||||||||||||
At Market | $ | 33 | 1.0 | 17 | % | $ | 46 | 1.4 | 24 | % | $ | (13 | ) | (0.4 | ) | ||||||||||||
Contracted | 245 | 3.1 | 51 | % | 238 | 3.0 | 53 | % | 7 | 0.1 | |||||||||||||||||
Hedged | 83 | 1.9 | 32 | % | 62 | 1.4 | 23 | % | 21 | 0.5 | |||||||||||||||||
Total EfW | $ | 361 | 6.0 | 100 | % | $ | 346 | 5.8 | 100 | % | 15 | 0.2 | |||||||||||||||
(1) Covanta share only. EfW excludes China. Represents the sale of electricity and steam based upon output delivered and capacity provided.
(2) Steam converted to MWh at an assumed average rate of 11 klbs of steam / MWh.
Certain amounts may not total due to rounding.
Energy revenue decreased by $51 million year-over-year, driven by a $66 million decline from transactions (including $36 million related to economically dispatching biomass facilities and $29 million resulting from the exchange of our ownership interest in a facility in China, both in the first quarter of 2016), $5 million from lower production at EfW facilities (primarily related to turbine generator downtime at our Plymouth facility) and a $6 million decline related to the expiration of certain long-term energy contracts. These declines were partially offset by higher revenue following waste and service contract transitions (as a result of increased share of energy revenue).
Recycled Metal Revenue
Recycled Metal Revenue (in millions): | For the Quarters Ended | ||||||
2016 | 2015 | ||||||
March 31, | $ | 13 | $ | 16 | |||
June 30, | 17 | 17 | |||||
September 30, | 14 | 16 | |||||
December 31, | 17 | 12 | |||||
Total for the Year Ended December 31, | $ | 61 | $ | 61 | |||
Years Ended December 31, | |||||||||||||||||||
Metal Revenue (in millions) | Tons Sold (in thousands) (1) | Tons Recovered (in thousands) | |||||||||||||||||
2016 | 2015 | 2016 | 2015 | 2016 | 2015 | ||||||||||||||
Ferrous Metal | $ | 38 | $ | 38 | 345 | 330 | 401 | 353 | |||||||||||
Non-Ferrous Metal | 23 | 23 | 36 | 32 | 36 | 32 | |||||||||||||
Total | $ | 61 | $ | 61 | |||||||||||||||
(1) | Represents the portion of total volume that is equivalent to Covanta’s share of revenue under applicable client revenue sharing arrangements. |
36
Recycled metals revenue was flat year-over-year, with higher metal recovery and the benefit of processing on realized sales prices for ferrous scrap offset by lower market prices.
Other Operating Revenue
Other operating revenue increased by $22 million for the twelve month comparative period primarily due to higher construction revenue.
Operating Expense
Plant Operating Expense
Consolidated (in millions): | For the Years Ended December 31, | |||||||||||
2016 | 2015 | Variance | ||||||||||
Plant maintenance (1) | $ | 279 | $ | 270 | $ | 9 | ||||||
All other | 898 | 859 | 39 | |||||||||
Plant operating expense | $ | 1,177 | $ | 1,129 | 48 | |||||||
(1) | Plant maintenance costs include our internal maintenance team and non-facility employee costs for facility scheduled and unscheduled maintenance and repair expense. |
Plant operating expenses increased by $48 million for the twelve month comparable period, driven primarily by higher incentive compensation expense ($24 million), increased EfW plant maintenance expense ($17 million), escalation in wages and benefits ($16 million), the start-up of our centralized metals processing facility ($4 million), other organic cost increases ($5 million) and the impact of contract transitions ($4 million), partially offset by transactions, as noted above, reducing plant operating expenses by $22 million on a net basis.
Other Operating Expense
Other operating expenses increased by $13 million for the twelve month comparable period primarily due to higher construction expense, partially offset by increased insurance recoveries.
For additional information, see Item 8. Financial Statements And Supplementary Data - Note 14.Supplementary Information - Other Operating Expenses.
General and Administrative Expense
Consolidated general and administrative expenses increased for the twelve month comparative period by $7 million primarily due to an increase in incentive compensation.
Impairment Charges
During the year ended December 31, 2016, we recorded non-cash impairment charges of $20 million, pre-tax, of which $13 million related to the previously planned closure of our Pittsfield EfW facility which is now expected to continue operating, and $3 million, pre-tax, related to our Tartech investment. During the year ended December 31, 2015, we recorded non-cash impairment charges totaling $43 million related to our biomass facilities. For additional information, see Item 8. Financial Statements And Supplementary Data — Note 14. Supplementary Information — Impairment Charges.
37
RESULTS OF OPERATIONS — OPERATING INCOME
Year Ended December 31, 2015 vs. Year Ended December 31, 2014
For the Years Ended December 31, | |||||||||||
Consolidated: | 2015 | 2014 | Variance Increase (Decrease) | ||||||||
(In millions) | |||||||||||
OPERATING REVENUE: | |||||||||||
Waste and service revenue | $ | 1,104 | $ | 1,032 | $ | 72 | |||||
Energy revenue | 421 | 460 | (39 | ) | |||||||
Recycled metals revenue | 61 | 93 | (32 | ) | |||||||
Other operating revenue | 59 | 97 | (38 | ) | |||||||
Total operating revenue | 1,645 | 1,682 | (37 | ) | |||||||
OPERATING EXPENSE: | |||||||||||
Plant operating expense | 1,129 | 1,055 | 74 | ||||||||
Other operating expense | 73 | 101 | (28 | ) | |||||||
General and administrative expense | 93 | 97 | (4 | ) | |||||||
Depreciation and amortization expense | 198 | 211 | (13 | ) | |||||||
Impairment charges | 43 | 64 | (21 | ) | |||||||
Total operating expense | 1,536 | 1,528 | 8 | ||||||||
Operating income | $ | 109 | $ | 154 | $ | (45 | ) | ||||
Operating Revenue
Waste and Service Revenue
Consolidated (in millions): | For the Years Ended December 31, | |||||||||||
2015 | 2014 | Variance | ||||||||||
EfW waste and service revenue | $ | 929 | $ | 933 | $ | (4 | ) | |||||
Environmental services | 56 | 9 | 47 | |||||||||
Municipal services | 159 | 93 | 66 | |||||||||
Other revenue | 38 | 47 | (9 | ) | ||||||||
Intercompany | (78 | ) | (50 | ) | (28 | ) | ||||||
Total waste and service revenue | $ | 1,104 | $ | 1,032 | 72 | |||||||
North America Segment - EfW Facilities - Tons Received (1) (in millions): | For the Years Ended December 31, | |||||||
2015 | 2014 | Variance | ||||||
Contracted | 17.2 | 16.0 | 1.2 | |||||
Uncontracted | 2.2 | 2.7 | (0.5) | |||||
Total Tons | 19.4 | 18.7 | 0.7 | |||||
(1) Includes solid tons only. Does not include contribution from China investments. Certain amounts may not total due to rounding.
Waste and service revenue increased by $72 million year-over-year, driven by organic growth of $13 million and net contribution from transactions of $85 million, partially offset by a decline of $26 million related to contract transitions. Within organic growth, EfW waste processing revenue increased $11 million (1.1%) due to price and $1 million (0.1%) due to volume. Transactions impacting revenue in the period included environmental services acquisitions ($27 million) and the start-up of the NYC MTS contract.
38
Energy Revenue
Consolidated (1) (in millions): | For the Years Ended December 31, | |||||||||||
2015 | 2014 | Variance | ||||||||||
EfW energy sales | $ | 308 | $ | 325 | $ | (17 | ) | |||||
EfW capacity | 38 | 32 | 6 | |||||||||
Other revenue | 75 | 103 | (28 | ) | ||||||||
Total energy revenue | $ | 421 | $ | 460 | (39 | ) | ||||||
(1) Covanta share only. EfW excludes contribution from China investments. Represents the sale of electricity and steam based upon output delivered and capacity provided. Certain amounts may not total due to rounding.
Years Ended December 31, | |||||||||||||||||||||||||||
2015 | 2014 | Variance | |||||||||||||||||||||||||
Total EfW (in millions): | Revenue (1) | Volume(1), (2) | % of Total Volume | Revenue (1) | Volume(1), (2) | % of Total Volume | Revenue | Volume | |||||||||||||||||||
At Market | $ | 46 | 1.4 | 24 | % | $ | 52 | 1.1 | 19 | % | $ | (6 | ) | 0.3 | |||||||||||||
Contracted | 238 | 3.0 | 53 | % | 247 | 3.2 | 56 | % | (9 | ) | (0.2 | ) | |||||||||||||||
Hedged | 62 | 1.4 | 23 | % | 59 | 1.4 | 25 | % | 3 | — | |||||||||||||||||
Total EfW | $ | 346 | 5.8 | 100 | % | $ | 358 | 5.6 | 100 | % | (12 | ) | 0.2 | ||||||||||||||
(1) Covanta share only. EfW excludes China. Represents the sale of electricity and steam based upon output delivered and capacity provided.
(2) Steam converted to MWh at an assumed average rate of 11 klbs of steam / MWh.
Certain amounts may not total due to rounding.
Energy revenue decreased by $39 million year-over-year, driven by a $26 million decline for biomass facilities primarily due to lower market pricing and economically dispatching a biomass facility, a $21 million decline in pricing at EfW facilities, a $4 million decline in production at EfW facilities, partially offset by higher revenue following waste and service contract transitions (as a result of increased share of energy revenue) and a $3 million contribution from transactions.
Recycled Metal Revenue
Recycled Metal Revenue (in millions): | For the Quarters Ended | |||||||
2015 | 2014 | |||||||
March 31, | $ | 16 | $ | 21 | ||||
June 30, | 17 | 25 | ||||||
September 30, | 16 | 26 | ||||||
December 31, | 12 | 21 | ||||||
Total for the year ended December 31, | $ | 61 | $ | 93 | ||||
Years Ended December 31, | |||||||||||||||||||
Metal Revenue (in millions) | Tons Sold (in thousands) (1) | Tons Recovered (in thousands) | |||||||||||||||||
2015 | 2014 | 2015 | 2014 | 2015 | 2014 | ||||||||||||||
Ferrous Metal | $ | 38 | $ | 65 | 330 | 340 | 353 | 327 | |||||||||||
Non-Ferrous Metal | 23 | 28 | 32 | 30 | 32 | 30 | |||||||||||||
Total | $ | 61 | $ | 93 | |||||||||||||||
(1) | Represents the portion of total volume that is equivalent to Covanta’s share of revenue under applicable client revenue sharing arrangements. |
39
Recycled metals revenue were $32 million lower year-over-year, driven principally by a decline in recycled metal market pricing.
Other Operating Revenue
The decrease of $38 million on a consolidated basis in other operating revenue for the twelve month comparative period was primarily due to lower construction revenue.
Operating Expense
Plant Operating Expense
Consolidated (in millions): | For the Years Ended December 31, | |||||||||||
2015 | 2014 | Variance | ||||||||||
Plant maintenance (1) | $ | 270 | $ | 245 | $ | 25 | ||||||
All other | 859 | 810 | 49 | |||||||||
Plant operating expense | $ | 1,129 | $ | 1,055 | 74 | |||||||
(1) | Plant maintenance costs include our internal maintenance team and non-facility employee costs for facility scheduled and unscheduled maintenance and repair expense. |
For the twelve month comparative period, plant operating expense on both a consolidated and North America segment basis increased by $74 million.
Plant operating expenses increased by $74 million for the twelve month comparable period, driven by an increase in plant maintenance of $31 million due to the adoption of the service concession arrangement accounting guidance, an increase of $31 million due to newly acquired environmental services business, $23 million from the start-up of the New York City MTS contract, $9 million from additional costs related to transfer stations, an $8 million impact from contract transitions, a $7 million increase in transportation costs related to our metals operations, partially offset by lower incentive compensation of $26 million and a $16 million decrease due to economically dispatching a biomass facility.
Other Operating Expense
Other operating expense decreased by $28 million due to lower construction expense and the sale of our insurance business at the end of 2014.
Impairment charges
During the year ended December 31, 2015, we recorded non-cash impairment charges totaling $43 million related to our biomass facilities. During the year ended December 31, 2014, we recorded non-cash impairment charges totaling $64 million consisting of $14 million related to the sale of our insurance business, $34 million related to our California biomass facility assets, and $16 million related to contract intangibles. For additional information, see Item 8. Financial Statements And Supplementary Data — Note 14. Supplementary Information — Impairment charges.
40
CONSOLIDATED RESULTS OF OPERATIONS — NON-OPERATING INCOME ITEMS
Years Ended December 31, 2016, 2015 and 2014
Other Expense:
For the Years Ended December 31, | Variance Increase (Decrease) | |||||||||||||||||||
2016 | 2015 | 2014 | 2016 vs 2015 | 2015 vs 2014 | ||||||||||||||||
(In millions) | ||||||||||||||||||||
CONSOLIDATED RESULTS OF OPERATIONS: | ||||||||||||||||||||
Investment income | $ | 1 | $ | — | $ | 1 | $ | 1 | $ | (1 | ) | |||||||||
Interest expense | (139 | ) | (134 | ) | (135 | ) | (5 | ) | 1 | |||||||||||
Non-cash convertible debt related expense | — | — | (13 | ) | — | 13 | ||||||||||||||
Gain on asset sales | 44 | — | — | 44 | — | |||||||||||||||
Loss on extinguishment of debt | — | (2 | ) | (2 | ) | 2 | — | |||||||||||||
Other expense, net | (1 | ) | (1 | ) | (1 | ) | — | — | ||||||||||||
Total other expense | $ | (95 | ) | $ | (137 | ) | $ | (150 | ) | 42 | 13 | |||||||||
Interest expense increased for the year ended December 31, 2016 compared to the year ended December 31, 2015 due to higher levels of borrowing under our Revolving Credit Facility.
Non-cash convertible debt related expense decreased for the year ended December 31, 2015 compared to the year ended December 31, 2014, due to the maturity of the 3.25% Cash Convertible Senior Notes in June 2014.
Gain on assets sales for the year ended December 31, 2016, is primarily due to the sale of our interests in China. For additional information see Item 8. Financial Statements And Supplementary Data — Note 4. Dispositions, Assets Held for Sale and Discontinued Operations.
Loss on extinguishment of debt is comprised of the write-off of deferred financing costs in connection with refinancing of previously existing financing arrangements.
Income Tax Expense:
For the Years Ended December 31, | Variance Increase (Decrease) | |||||||||||||||||||
2016 | 2015 | 2014 | 2016 vs 2015 | 2015 vs 2014 | ||||||||||||||||
(In millions, except percentages) | ||||||||||||||||||||
CONSOLIDATED RESULTS OF OPERATIONS: | ||||||||||||||||||||
Income tax expense (benefit) | $ | 22 | $ | (84 | ) | $ | 15 | $ | 106 | $ | (99 | ) | ||||||||
Effective income tax rate | 150 | % | 302 | % | 388 | % | ||||||||||||||
The decrease in effective tax rate for the year ended December 31, 2016, compared to the year ended December 31, 2015 is primarily due to the combined effects of (i) the recognition of tax benefit due to the resolution of the IRS audit in 2015 and (ii) the fact that the Company turned from pre-tax loss in 2015 to pre-tax income in 2016. The decrease in the effective tax rate for the year ended December 31, 2015, compared to the year ended December 31, 2014 was primarily due to the recognition of tax benefit due to the resolution of the IRS audit in 2015 and non-recurring adjustments from the prior year.
41
Net (Loss) Income Attributable to Covanta Holding Corporation and Earnings Per Share:
For the Years Ended December 31, | Variance Increase (Decrease) | |||||||||||||||||||
2016 | 2015 | 2014 | 2016 vs 2015 | 2015 vs 2014 | ||||||||||||||||
(In millions, except per share amounts) | ||||||||||||||||||||
CONSOLIDATED RESULTS OF OPERATIONS: | ||||||||||||||||||||
Net (Loss) Income Attributable to Covanta Holding Corporation | $ | (4 | ) | $ | 68 | $ | (2 | ) | $ | (72 | ) | $ | 70 | |||||||
(Loss) Earnings Per Share Attributable to Covanta Holding Corporation stockholders: | ||||||||||||||||||||
Weighted Average Shares: | ||||||||||||||||||||
Basic: | 129 | 132 | 130 | (3 | ) | 2 | ||||||||||||||
Diluted: | 129 | 133 | 130 | (4 | ) | 3 | ||||||||||||||
(Loss) Earnings Per Share: | ||||||||||||||||||||
Basic: | $ | (0.03 | ) | $ | 0.52 | $ | (0.01 | ) | $ | (0.55 | ) | $ | 0.53 | |||||||
Diluted: | $ | (0.03 | ) | $ | 0.51 | $ | (0.01 | ) | $ | (0.54 | ) | $ | 0.52 | |||||||
Cash Dividend Declared Per Share (1) | $ | 1.00 | $ | 1.00 | $ | 0.86 | $ | — | $ | 0.14 | ||||||||||
(1) | For information on dividends declared to shareholders and share repurchases, see Liquidity and Capital Resources below. |
42
Supplementary Financial Information — Adjusted Earnings Per Share (“Adjusted EPS”) (Non-GAAP Discussion)
We use a number of different financial measures, both United States generally accepted accounting principles (“GAAP”) and non-GAAP, in assessing the overall performance of our business. To supplement our results prepared in accordance with GAAP, we use the measure of Adjusted EPS, which is a non-GAAP financial measure as defined by the Securities and Exchange Commission (“SEC”). The non-GAAP financial measure of Adjusted EPS is not intended as a substitute or as an alternative to diluted earnings per share as an indicator of our performance or any other measure of performance derived in accordance with GAAP. In addition, our non-GAAP financial measures may be different from non-GAAP financial measures used by other companies, limiting their usefulness for comparison purposes. We use the non-GAAP financial measure of Adjusted EPS to enhance the usefulness of our financial information by providing a measure which management internally uses to assess and evaluate the overall performance and highlight trends in the ongoing business.
Adjusted EPS excludes certain income and expense items that are not representative of our ongoing business and operations, which are included in the calculation of diluted earnings per share in accordance with GAAP. The following items are not all-inclusive, but are examples of reconciling items in prior comparative and future periods. They would include the results of operations of our insurance subsidiaries, impairment charges, the effect of derivative instruments not designated as hedging instruments, significant gains or losses from the disposition or restructuring of businesses, gains and losses on assets held for sale, transaction-related costs, income and loss on the extinguishment of debt and other significant items that would not be representative of our ongoing business.
In order to provide a meaningful basis for comparison, we are providing information with respect to our Adjusted EPS for the years ended December 31, 2016, 2015 and 2014, respectively, reconciled for each such period to diluted earnings per share, which is believed to be the most directly comparable measure under GAAP (in millions, except per share amounts):
Years Ended December 31, | ||||||||||||
2016 | 2015 | 2014 | ||||||||||
Diluted (Loss) Earnings Per Share from Continuing Operations | $ | (0.03 | ) | $ | 0.51 | $ | (0.01 | ) | ||||
Reconciling items (1) | (0.03 | ) | (0.44 | ) | 0.40 | |||||||
Adjusted EPS | $ | (0.06 | ) | $ | 0.07 | $ | 0.39 | |||||
(1) Additional information is provided in the Reconciling Items table below.
43
Years Ended December 31, | ||||||||||||
2016 | 2015 | 2014 | ||||||||||
Reconciling Items | ||||||||||||
Operating loss related to insurance subsidiaries | $ | — | $ | — | $ | 2 | ||||||
Impairment charges (a) | 20 | 43 | 64 | |||||||||
Severance and reorganization costs (b) | 2 | 7 | 9 | |||||||||
Gain on asset sales (c) | (44 | ) | — | — | ||||||||
Loss on extinguishment of debt | — | 2 | 2 | |||||||||
Effect on income of derivative instruments not designated as hedging instruments | 2 | (6 | ) | |||||||||
Effect of foreign exchange (gain) loss on indebtedness | (1 | ) | 3 | 1 | ||||||||
Other | — | 1 | 1 | |||||||||
Total reconciling items, pre-tax | (21 | ) | 50 | 79 | ||||||||
Pro forma income tax impact (d) | 2 | (20 | ) | (32 | ) | |||||||
Impact of IRS audit settlement (e) | — | (93 | ) | — | ||||||||
Adjustment to uncertain tax positions | 14 | — | — | |||||||||
Tax liability related to expected gain on sale of China assets (c) (e) | — | 4 | — | |||||||||
ARC purchase accounting adjustment tax impact | — | — | 4 | |||||||||
Grantor trust activity | 1 | — | 1 | |||||||||
Total Continuing Operations Reconciling Items, net of tax | $ | (4 | ) | $ | (59 | ) | $ | 52 | ||||
Diluted (Loss) Earnings Per Share Impact | $ | (0.03 | ) | $ | (0.44 | ) | $ | 0.40 | ||||
Weighted Average Diluted Shares Outstanding | 129 | 133 | 130 | |||||||||
(a) | For additional information, see Item 8. Financial Statements And Supplementary Information — Note 14. Supplementary Information - Impairment charges. |
(b) | The year ended December 31, 2015 included $6 million of costs incurred in connection with separation agreements related to the departure of two executive officers of which $4 million relates to non-cash compensation. The year ended December 31, 2014 included certain costs incurred in connection with cost savings initiatives. |
(c) | Gain on assets sales for the year ended December 31, 2016, is primarily due to the sale of our interests in China. For additional information see Item 8. Financial Statements And Supplementary Data — Note 4. Dispositions, Assets Held for Sale and Discontinued Operations. |
(d) | We calculate the federal and state tax impact of each item using the statutory federal tax rate and applicable blended state rate. |
(e) | For additional information, see Item 8. Financial Statements And Supplementary Data — Note 15. Income Taxes. |
44
Supplementary Financial Information — Adjusted EBITDA (Non-GAAP Discussion)
To supplement our results prepared in accordance with GAAP, we use the measure of Adjusted EBITDA, which is a non-GAAP financial measure as defined by the SEC. This non-GAAP financial measure is described below, and is not intended as a substitute and should not be considered in isolation from measures of financial performance prepared in accordance with GAAP. In addition, our use of non-GAAP financial measures may be different from non-GAAP financial measures used by other companies, limiting their usefulness for comparison purposes. The presentation of Adjusted EBITDA is intended to enhance the usefulness of our financial information by providing a measure which management internally uses to assess and evaluate the overall performance of its business and those of possible acquisition candidates, and highlight trends in the overall business.
We use Adjusted EBITDA to provide further information that is useful to an understanding of the financial covenants contained in the credit facilities of our most significant subsidiary, Covanta Energy, and as additional ways of viewing aspects of its operations that, when viewed with the GAAP results and the accompanying reconciliations to corresponding GAAP financial measures, provide a more complete understanding of our core business. The calculation of Adjusted EBITDA is based on the definition in Covanta Energy’s Credit Facilities (as defined and described below under Liquidity and Capital Resources), which we have guaranteed. Adjusted EBITDA is defined as earnings before interest, taxes, depreciation and amortization, as adjusted for additional items subtracted from or added to net income. Because our business is substantially comprised of that of Covanta Energy, our financial performance is substantially similar to that of Covanta Energy. For this reason, and in order to avoid use of multiple financial measures, which are not all from the same entity, the calculation of Adjusted EBITDA and other financial measures presented herein are measured on a consolidated basis, less the results of operations of our insurance subsidiaries in 2014, prior to their sale in the fourth quarter of 2014. Under the Credit Facilities, Covanta Energy is required to satisfy certain financial covenants, including certain ratios of which Adjusted EBITDA is an important component. Compliance with such financial covenants is expected to be the principal limiting factor that will affect our ability to engage in a broad range of activities in furtherance of our business, including making certain investments, acquiring businesses and incurring additional debt. Covanta Energy was in compliance with these covenants as of December 31, 2016. Failure to comply with such financial covenants could result in a default under the Credit Facilities, which default would have a material adverse effect on our financial condition and liquidity.
Adjusted EBITDA should not be considered as an alternative to net income or cash flow provided by operating activities as indicators of our performance or liquidity or any other measures of performance or liquidity derived in accordance with GAAP.
In order to provide a meaningful basis for comparison, we are providing information with respect to our Adjusted EBITDA for the years ended December 31, 2016, 2015 and 2014, respectively, reconciled for each such period to net income and cash flow provided by operating activities from continuing operations, which are believed to be the most directly comparable measures under GAAP. The following is a reconciliation of Net (Loss) Income to Adjusted EBITDA (in millions):
45
Years Ended December 31, | ||||||||||||
Adjusted EBITDA | 2016 | 2015 | 2014 | |||||||||
Net (Loss) Income Attributable to Covanta Holding Corporation | $ | (4 | ) | $ | 68 | $ | (2 | ) | ||||
Operating loss related to insurance subsidiaries | — | — | 2 | |||||||||
Depreciation and amortization expense | 207 | 198 | 211 | |||||||||
Interest expense, net | 138 | 134 | 134 | |||||||||
Non-cash convertible debt related expense | — | — | 13 | |||||||||
Income tax expense (benefit) | 22 | (84 | ) | 15 | ||||||||
Impairment charges (a) | 20 | 43 | 64 | |||||||||
Gain on asset sales (a) | (44 | ) | — | — | ||||||||
Loss on extinguishment of debt | — | 2 | 2 | |||||||||
Net income attributable to noncontrolling interests in subsidiaries | — | 1 | 1 | |||||||||
Other adjustments: | ||||||||||||
Capital-type expenditures at service fee operated facilities (b) | 39 | 31 | — | |||||||||
Debt service billing in excess of revenue recognized | 4 | 1 | 2 | |||||||||
Severance and reorganization costs (a) | 3 | 4 | 9 | |||||||||
Non-cash compensation expense (c) | 16 | 18 | 17 | |||||||||
Other non-cash items | 6 | 6 | 5 | |||||||||
Other (d) | 3 | 6 | 1 | |||||||||
Total adjustments | 414 | 360 | 476 | |||||||||
Adjusted EBITDA | $ | 410 | $ | 428 | $ | 474 | ||||||
(a) For additional information, see Adjusted EPS above.
(b) Adjustment for impact of adoption of FASB ASC 853 - Service Concession Arrangements in order to provide comparability to prior period results. These type of expenditures at our service fee operated facilities were historically capitalized prior to adoption of this new accounting standard effective January 1, 2015.
(c) The year ended December 31, 2015 includes $4 million of costs incurred in connection with separation agreements related to the departure of two executive officers.
(d) Includes certain other items that are added back under the definition of Adjusted EBITDA in Covanta Energy LLC's credit agreement.
46
The following is a reconciliation of cash flow provided by operating activities from continuing operations to Adjusted EBITDA (in millions):
Years Ended December 31, | ||||||||||||
2016 | 2015 | 2014 | ||||||||||
Cash flow provided by operating activities from continuing operations | $ | 282 | $ | 249 | $ | 340 | ||||||
Cash paid for interest, net of capitalized interest | 135 | 131 | 119 | |||||||||
Cash paid for taxes | 6 | 2 | 11 | |||||||||
Capital type expenditures at service fee operated facilities (a) | 39 | 31 | — | |||||||||
Adjustment for working capital and other | (52 | ) | 15 | 4 | ||||||||
Adjusted EBITDA | $ | 410 | $ | 428 | $ | 474 | ||||||
(a) See Adjusted EBITDA - Note (c) above.
For additional discussion related to management’s use of non-GAAP measures, see Liquidity and Capital Resources — Supplementary Financial Information — Free Cash Flow (Non-GAAP Discussion) below.
BUSINESS OUTLOOK
In 2017 and beyond, we expect that our financial results will be affected by several factors, including: market prices, contract transitions, new contracts, new project development and construction, acquisitions, and the organic growth of earnings and cash flow generated by our existing assets. In order to drive organic growth, we will be focused on growing our environmental services and profiled waste businesses, enhanced metals recovery and centralized processing, ash management, continuous improvement using Lean Six Sigma concepts, and managing facility production and operating costs.
In 2017, the following specific factors are expected to impact our financial results as compared to 2016 (as measured by Adjusted EBITDA):
Positive factors include:
•Contribution from the organic growth initiatives discussed above;
•The commencement of commercial operations of our Dublin EfW facility, which is anticipated in late 2017; and
•Approximately $10 million from favorable waste and service contract transitions.
Negative factors include:
•Approximately $25 million of mark-to-market on the expiration of long-term power purchase agreements; and
•$0 to $20 million lower anticipated market prices for electricity as compared to our hedged prices in 2016.
LIQUIDITY AND CAPITAL RESOURCES
Our principal sources of liquidity are our cash and cash equivalents, cash flow generated from our ongoing operations, and available capacity under our Revolving Credit Facility, which we believe will allow us to meet our liquidity needs. For additional information regarding our credit facilities and other debt, see Item 8. Financial Statements And Supplementary Date - Note 11. Consolidated Debt.
In 2017, we expect to generate net cash from operating activities which may not alone meet all of our cash requirements for both capital expenditures to maintain our existing assets and for ongoing dividends to shareholders, in which case we would utilize our Revolving Credit Facility on an interim basis. See Results of Operations - Business Outlook above for discussion of the factors impacting our 2017 business outlook. We intend to utilize debt financing as the primary means to fund investments in the growth of our business in 2017, including completing the construction of the Dublin EfW facility (utilizing non-recourse project financing arranged in 2014) and other investments in our organic growth initiatives (utilizing borrowings under our Revolving Credit Facility).
We have substantial indebtedness, including $1.1 billion that will mature through 2020. We generally intend to refinance these instruments prior to maturity with like-kind financing in the bank and/or debt capital markets in order to maintain a capital structure comprised primarily of long-term debt, which we believe appropriately matches the long-term nature of our assets and contracts.
The loan documentation governing the Credit Facilities contains various affirmative and negative covenants, as well as financial maintenance covenants (financial ratios), that limit our ability to engage in certain types of transactions. We were in compliance with all of the covenants under the Credit Facilities as of December 31, 2016. Further, we do not anticipate our existing debt covenants to restrict our ability to undertake additional financing.
47
As of December 31, 2016, Covanta Energy had $1.2 billion in senior secured credit facilities, which includes a $1.0 billion Revolving Credit Facility expiring between 2019 and 2020. As of December 31, 2016, our available liquidity was as follows (in millions):
As of December 31, 2016 | |||
Cash | $ | 84 | |
Available borrowing capacity under Revolving Credit Facility | 501 | ||
Total available liquidity | $ | 585 | |
In addition, as of December 31, 2016, we had restricted cash of $110 million, of which $17 million was designated for future payment of project debt principal. Restricted funds held in trust are primarily amounts received and held by third-party trustees relating to certain projects we own. We generally do not control these accounts and these funds may be used only for specified purposes. For additional information on restricted funds held in trust, see Item 8. Financial Statements And Supplementary Data — Note 1. Organization and Summary of Significant Accounting Policies - Restricted Funds Held in Trust.
We typically receive cash distributions from our North America segment projects on a monthly basis. The frequency and predictability of which differs depending upon various factors, including, whether a project is domestic or international, and whether a project has been able to operate at its historical levels of production. The timing of our receipt of cash from construction projects for public sector clients is generally based upon our reaching completion milestones as set forth in the applicable contracts, and the timing and size of these milestone payments can result in material working capital variability between periods.
Our primary future cash requirements will be to fund capital expenditures to maintain our existing businesses, service our debt, invest in the growth of our business, and return capital to our shareholders. We believe that our liquidity position and ongoing cash flow from operations will be sufficient to finance these requirements.
The following summarizes our key financing activities completed during the year ended December 31, 2016:
• | We received pre-tax proceeds of $105 million from the sale of our ownership interests in China, utilizing approximately $95 million of the proceeds to repay borrowings under our Revolving Credit Facility. |
• | We extended the lease term related to our Union County EfW facility through 2053. Due primarily to the length of the extension, we recorded a lease liability of $104 million, calculated utilizing an incremental borrowing rate of 5.0%. |
• | In December 2016, at our option, we redeemed $30 million of 6.45% tax-exempt project bonds due 2022 related to our Southeastern Connecticut EfW facility. |
• | During 2016, we utilized €147 million of the €250 million Dublin Senior Term Loan to fund construction costs of the Dublin EfW facility. |
Share Repurchases and Dividends
For additional information on share repurchases and dividends, see Item 5. Market for Registrant's Common Equity, Related Stockholder Matters and Issuer Purchases of Equity Securities and Item 8. Financial Statements And Supplementary Data — Note 5. Equity and Earnings Per Share ("EPS").
Sources and Uses of Cash Flow from Continuing Operations
Year Ended December 31, 2016 vs. Year Ended December 31, 2015
Net cash provided by operating activities from continuing operations for the year ended December 31, 2016 increased $33 million from the prior year period. The increase was primarily due to lower employee bonus payments paid in 2016 related to 2015 company performance.
Net cash used in investing activities from continuing operations for the year ended December 31, 2016 decreased $194 million from the prior year period. The net decrease was primarily due to proceeds received from the sale of our interests in China of $105 million in 2016, as well as reduced acquisition activity by $63 million as compared to the prior year.
Net cash provided by financing activities from continuing operations for the year ended December 31, 2016 decreased $248 million from the prior year period primarily due to a reduction in net direct borrowings under our Revolving Credit Facility totaling $208 million, and a reduction in net proceeds from long-term debt borrowings totaling $97 million, partially offset by increased borrowings under Dublin project financing of $73 million as compared to the prior year.
Year Ended December 31, 2015 vs. Year Ended December 31, 2014
Net cash provided by operating activities from continuing operations for the year ended December 31, 2015 decreased $91 million from the prior year period. The decrease was primarily due to a decrease in working capital coupled with lower operating
48
results, including the adoption of service concession guidance, which resulted in a $31 million increase in plant operating expenses. In prior years, such amounts would have been classified as investing activities. For additional information, see Item 8. Financial Statements And Supplementary Information — Note 1. Organization and Summary of Significant Accounting Policies - Accounting Pronouncements Recently Adopted.
Net cash used in investing activities from continuing operations for the year ended December 31, 2015 increased $216 million from the prior year period. The increase was primarily due to higher capital investment of $160 million primarily related to construction of the Dublin EfW facility, offset by the impact of the change due to the adoption of accounting guidance discussed above and a $59 million increase from the acquisition of four environmental services businesses in the current year as compared to one in the prior year.
Net cash provided by financing activities from continuing operations for the year ended December 31, 2015 increased $418 million from the prior year period due to increased net borrowings under our Revolving Credit Facility of $168 million, the issuance of New Jersey Series tax-exempt bonds of $90 million, and borrowings under Dublin EfW facility project financing arrangements totaling $148 million and a net decrease in repayment of other long term debt of approximately $150 million, partially offset by a $48 million decrease in proceeds from capital leases, a $33 million increase in cash used to repay project debt and a $62 million increase in cash used for cash dividends and common stock repurchases in the current year.
Supplementary Financial Information — Free Cash Flow (Non-GAAP Discussion)
To supplement our results prepared in accordance with GAAP, we use the measure of Free Cash Flow, which is a non-GAAP measure as defined by the SEC. This non-GAAP financial measure is not intended as a substitute and should not be considered in isolation from measures of liquidity prepared in accordance with GAAP. In addition, our use of Free Cash Flow may be different from similarly identified non-GAAP measures used by other companies, limiting its usefulness for comparison purposes. The presentation of Free Cash Flow is intended to enhance the usefulness of our financial information by providing measures which management internally uses to assess and evaluate the overall performance of its business and those of possible acquisition candidates, and highlight trends in the overall business.
We use the non-GAAP financial measure of Free Cash Flow as a criterion of liquidity and performance-based components of employee compensation. Free Cash Flow is defined as cash flow provided by operating activities, excluding the cash flow provided by or used in our insurance subsidiaries, less maintenance capital expenditures, which are capital expenditures primarily to maintain our existing facilities. We use Free Cash Flow as a measure of liquidity to determine amounts we can reinvest in our core businesses, such as amounts available to make acquisitions, invest in construction of new projects, make principal payments on debt, or return capital to our shareholders through dividends and/or stock repurchases. For additional discussion related to management’s use of non-GAAP measures, see Results of Operations — Supplementary Financial Information — Adjusted EBITDA (Non-GAAP Discussion) above.
In order to provide a meaningful basis for comparison, we are providing information with respect to our Free Cash Flow for the years ended December 31, 2016, 2015 and 2014, reconciled for each such period to cash flow provided by operating activities from continuing operations, which we believe to be the most directly comparable measure under GAAP.
49
The following is a reconciliation of Free Cash Flow and its primary uses (in millions):
Years Ended December 31, | ||||||||||||
2016 | 2015 | 2014 | ||||||||||
Cash flow provided by operating activities of continuing operations | $ | 282 | $ | 249 | $ | 340 | ||||||
Plus: Cash flow used in operating activities from insurance activities | — | — | 1 | |||||||||
Less: Maintenance capital expenditures (a) | (110 | ) | (102 | ) | (101 | ) | ||||||
Free Cash Flow | $ | 172 | $ | 147 | $ | 240 | ||||||
Uses of Free Cash Flow | ||||||||||||
Investments: | ||||||||||||
Growth investments (b) | $ | (253 | ) | $ | (346 | ) | $ | (143 | ) | |||
Other investing activities, net (c) | 4 | — | 12 | |||||||||
Total investments | $ | (249 | ) | $ | (346 | ) | $ | (131 | ) | |||
Return of capital to shareholders: | ||||||||||||
Cash dividends paid to shareholders | $ | (131 | ) | $ | (133 | ) | $ | (101 | ) | |||
Common stock repurchased | (20 | ) | (30 | ) | — | |||||||
Total return of capital to shareholders | $ | (151 | ) | $ | (163 | ) | $ | (101 | ) | |||
Capital raising activities: | ||||||||||||
Net proceeds from issuance of corporate debt (d) | $ | — | $ | 98 | $ | 405 | ||||||
Net proceeds from issuance of project debt (e) | — | 15 | — | |||||||||
Net proceeds from Dublin financing | 159 | 85 | — | |||||||||
Net proceeds from equipment financing capital lease (f) | — | 15 | 63 | |||||||||
Net proceeds from the exercise of options for common stock | — | — | 10 | |||||||||
Change in restricted funds held in trust | 29 | — | (3 | ) | ||||||||
Other financing activities, net | (6 | ) | 5 | (3 | ) | |||||||
Deferred financing costs | (6 | ) | (7 | ) | (29 | ) | ||||||
Proceeds from sale of China assets | 105 | — | — | |||||||||
Net proceeds from capital raising activities | $ | 281 | $ | 211 | $ | 443 | ||||||
Debt repayments: | ||||||||||||
Net cash used for scheduled principal payments on corporate debt | $ | (4 | ) | $ | (1 | ) | $ | (462 | ) | |||
Payments related to Cash Conversion Option (g) | — | — | (83 | ) | ||||||||
Proceeds from the settlement of Note Hedge (g) | — | — | 83 | |||||||||
Net cash used for principal payments on project debt (h) | (52 | ) | (38 | ) | (29 | ) | ||||||
Payment of equipment financing capital lease (f) | (4 | ) | (4 | ) | (1 | ) | ||||||
Voluntary prepayment of corporate debt | — | — | (95 | ) | ||||||||
Total debt repayments | $ | (60 | ) | $ | (43 | ) | $ | (587 | ) | |||
Borrowing activities - Revolving Credit Facility, net | $ | (5 | ) | $ | 203 | $ | 35 | |||||
Effect of exchange rate changes on cash and cash equivalents | $ | — | $ | (4 | ) | $ | (5 | ) | ||||
Net change in cash and cash equivalents from continuing operations | $ | (12 | ) | $ | 5 | $ | (106 | ) | ||||
(a) | Purchases of property, plant and equipment are also referred to as capital expenditures. Capital expenditures that primarily maintain existing facilities are classified as maintenance capital expenditures. Growth investments include investments in growth opportunities, including organic growth initiatives, technology, business development, and other similar expenditures. The following table provides the components of total purchases of property, plant and equipment: |
50
Years Ended December 31, | ||||||||||||
2016 | 2015 | 2014 | ||||||||||
Maintenance capital expenditures | $ | (110 | ) | $ | (102 | ) | $ | (101 | ) | |||
Capital expenditures associated with construction of Dublin EfW facility | (162 | ) | (184 | ) | (14 | ) | ||||||
Capital expenditures associated with organic growth initiatives | (46 | ) | (34 | ) | (25 | ) | ||||||
Capital expenditures associated with the New York City MTS contract | (3 | ) | (30 | ) | (59 | ) | ||||||
Capital expenditures associated with Essex County EfW emissions control system | (33 | ) | (26 | ) | (17 | ) | ||||||
Total capital expenditures associated with growth investments | (244 | ) | (274 | ) | (115 | ) | ||||||
Capital expenditures associated with property insurance events | (5 | ) | — | — | ||||||||
Total purchases of property, plant and equipment | $ | (359 | ) | $ | (376 | ) | $ | (216 | ) | |||
(b) | Growth investments include investments in growth opportunities, including organic growth initiatives, technology, business development, and other similar expenditures. |
Years Ended December 31, | ||||||||||||
2016 | 2015 | 2014 | ||||||||||
Capital expenditures associated with growth investments | $ | (244 | ) | $ | (274 | ) | $ | (115 | ) | |||
Investments in connection with the Dublin EfW facility, net of capital expenditures | — | — | (14 | ) | ||||||||
Other organic growth investments | — | — | (1 | ) | ||||||||
Acquisitions, net of cash acquired | (9 | ) | (72 | ) | (13 | ) | ||||||
Total growth investments | $ | (253 | ) | $ | (346 | ) | $ | (143 | ) | |||
(c) | Other investing activities include net payments from the purchase/sale of investment securities. |
(d) | Excludes borrowings under the Revolving Credit Facility. Calculated as follows: |
Years Ended December 31, | ||||||||||||
2016 | 2015 | 2014 | ||||||||||
Proceeds from borrowings on long-term debt | $ | — | $ | 294 | $ | 412 | ||||||
Refinanced long-term debt | — | (195 | ) | — | ||||||||
Less: Financing costs related to issuance of long-term debt | — | (1 | ) | (7 | ) | |||||||
Net proceeds from issuance of corporate debt | $ | — | $ | 98 | $ | 405 | ||||||
(e) During the third quarter in 2014, we received proceeds from a Junior Term Loan related to our Dublin project:
Years Ended December 31, | ||||||||||||
2016 | 2015 | 2014 | ||||||||||
Proceeds from borrowings on project debt | $ | — | $ | 59 | $ | 63 | ||||||
Refinanced project debt | — | (42 | ) | — | ||||||||
Change in restricted funds held in trust | — | — | — | |||||||||
Less: Funding into escrow | (63 | ) | ||||||||||
Less: Financing cost related to the issuance of project debt | — | $ | (2 | ) | ||||||||
Net proceeds from issuance of project debt | $ | — | $ | 15 | $ | — | ||||||
(f) During 2015 and 2014, we financed $15 million and $63 million for equipment related to our New York City MTS contract.
(g) The $460 million of 3.25% Cash Convertible Senior Notes matured on June 1, 2014. Upon maturity, we were required to pay $83 million to satisfy the obligation under the Cash Conversion Option in addition to the principal amount of the 3.25% Notes. We cash-settled the Note Hedge for $83 million effectively offsetting our liability under the Cash Conversion Option.
51
(h) | Calculated as follows: |
Years Ended December 31, | ||||||||||||
2016 | 2015 | 2014 | ||||||||||
Total principal payments on project debt | $ | (51 | ) | $ | (43 | ) | $ | (52 | ) | |||
Decrease in related restricted funds held in trust | (1 | ) | 5 | 23 | ||||||||
Net cash used for principal payments on project debt | $ | (52 | ) | $ | (38 | ) | $ | (29 | ) | |||
Available Sources of Liquidity
Cash and Cash Equivalents
Cash and cash equivalents include all cash balances and highly liquid investments having maturities of three months or less from the date of purchase. These short-term investments are stated at cost, which approximates fair value. Balances held by our international subsidiaries are not generally available for near-term liquidity in our domestic operations.
As of December 31, | |||||||
2016 | 2015 | ||||||
(in millions) | |||||||
Domestic | $ | 18 | $ | 44 | |||
International | 66 | 50 | |||||
Total Cash and Cash Equivalents | $ | 84 | $ | 94 | |||
Credit Facilities
Effective April 2015, we amended and restated Covanta Energy’s senior secured credit facilities, which consist of a $1.0 billion revolving credit facility, expiring 2019 through 2020, (the “Revolving Credit Facility”) and a $196 million term loan due 2020 (the “Term Loan”) (collectively referred to as the "Credit Facilities"). For a detailed description of the terms of the Credit Facilities, see Item 8. Financial Statements And Supplementary Data — Note 11. Consolidated Debt.
Consolidated Debt
The face value of our consolidated debt is as follows (in millions):
As of December 31, | |||||||
2016 | 2015 | ||||||
Corporate Debt: | |||||||
Revolving Credit Facility | $ | 343 | $ | 348 | |||
Term Loan due 2019 | 196 | 200 | |||||
7.25% Senior Notes due 2020 | 400 | 400 | |||||
6.375% Senior Notes due 2022 | 400 | 400 | |||||
5.875% Senior Notes due 2024 | 400 | 400 | |||||
4.00% - 5.25% Tax-Exempt Bonds due 2024 - 2045 | 464 | 464 | |||||
3.48% - 4.52% Equipment Leases due 2020 - 2027 | 69 | 73 | |||||
Total corporate debt (including current portion) | $ | 2,272 | $ | 2,285 | |||
Project Debt: | |||||||
Domestic project debt - service fee facilities | $ | 78 | $ | 117 | |||
Domestic project debt - tip fee facilities | 16 | 23 | |||||
Union capital lease | 99 | — | |||||
Dublin Senior Term Loan due 2021 | 155 | — | |||||
Dublin Junior Term Loan due 2022 | 58 | 57 | |||||
Total project debt (including current portion) | $ | 406 | $ | 197 | |||
Total Debt Outstanding | $ | 2,678 | $ | 2,482 | |||
52
As of December 31, 2016, the maturities of debt, excluding premiums and deferred financing costs are as follows (in millions):
2017 | 2018 | 2019 | 2020 | 2021 | Thereafter | Total | ||||||||||||||||||||||
Revolving Credit Facility | $ | — | $ | — | $ | — | $ | 343 | $ | — | $ | — | $ | 343 | ||||||||||||||
Term Loan | 5 | 5 | 5 | 181 | — | — | 196 | |||||||||||||||||||||
Senior Notes | — | — | — | 400 | — | 800 | 1,200 | |||||||||||||||||||||
Tax-Exempt Bonds | — | — | — | — | — | 464 | 464 | |||||||||||||||||||||
Equipment Leases | 5 | 5 | 5 | 5 | 5 | 44 | 69 | |||||||||||||||||||||
Project Debt | 22 | 31 | 26 | 17 | 144 | 166 | 406 | |||||||||||||||||||||
Total | $ | 32 | $ | 41 | $ | 36 | $ | 946 | $ | 149 | $ | 1,474 | $ | 2,678 | ||||||||||||||
For a detailed description of the terms of the debt instruments noted in the table above, see Item 8. Financial Statements And Supplementary Data — Note 11. Consolidated Debt. The loan documentation governing the Credit Facilities contains various affirmative and negative covenants, as well as financial maintenance covenants, that limit our ability to engage in certain types of transactions. We were in compliance with all of the affirmative and negative covenants under the Credit Facilities as of December 31, 2016.
Dublin Project Financing
The investment in the Dublin EfW facility is expected to total approximately €500 million, which will be funded with a combination of third party non-recourse project financing (€375 million) and the contribution of approximately €125 million of project equity by our subsidiary, Covanta Energy, which has been fully funded as of December 31, 2015. For additional information on the project financing terms, see Item 8. Financial Statements And Supplementary Data — Note 11. Consolidated Debt. We entered into interest rate swap agreements in order to hedge our exposure to adverse variable interest rate fluctuations under the Dublin Senior Term Loan. For additional information, see Item 8. Financial Statements And Supplementary Data — Note 13. Derivative Instruments.
Project Debt
Financing for the construction of our existing energy-from-waste projects in the North America segment was generally raised through tax-exempt and taxable municipal revenue bonds issued by or on behalf of the municipal client. In the case of facilities owned by a subsidiary of ours, the municipal issuers of the bond loaned the bond proceeds to our subsidiary to pay for facility construction. Financing for international projects in which we have an ownership or operating interest is generally raised through commercial loans from local lenders; financing arranged through international banks; and/or bonds issued to institutional investors. In most international projects, the instruments defining the rights of debt holders generally provide that the project subsidiary may not make distributions to its parent until periodic debt service obligations are satisfied and other financial covenants are complied with. For additional information on project debt, see Item 8. Financial Statements And Supplementary Data — Note 11. Consolidated Debt.
53
Capital Requirements
The following table summarizes our gross contractual obligations including project debt, leases and other obligations as of December 31, 2016 (in millions):
Total | Payments Due by Period | |||||||||||||||||||
2017 | 2018 and 2019 | 2020 and 2021 | 2022 and Beyond | |||||||||||||||||
RECORDED LIABILITIES: | ||||||||||||||||||||
Project debt | $ | 406 | $ | 22 | $ | 57 | $ | 161 | $ | 166 | ||||||||||
Term Loan (1) | 196 | 5 | 10 | 181 | — | |||||||||||||||
Revolving Credit Facility (1) | 343 | — | — | 343 | — | |||||||||||||||
7.25% Senior Notes (2) | 400 | — | — | 400 | — | |||||||||||||||
6.375% Senior Notes (3) | 400 | — | — | — | 400 | |||||||||||||||
5.875% Senior Notes (4) | 400 | — | — | — | 400 | |||||||||||||||
Tax-exempt bonds due 2024-2045 (5) | 464 | — | — | — | 464 | |||||||||||||||
Equipment leases (6) | 69 | 5 | 10 | 10 | 44 | |||||||||||||||
Total debt obligations | 2,678 | 32 | 77 | 1,095 | 1,474 | |||||||||||||||
Less: Non-recourse debt (7) | (475 | ) | (27 | ) | (67 | ) | (171 | ) | (210 | ) | ||||||||||
Total recourse debt | $ | 2,203 | $ | 5 | $ | 10 | $ | 924 | $ | 1,264 | ||||||||||
Dublin Convertible Preferred (8) | $ | 117 | $ | — | $ | — | $ | 10 | $ | 107 | ||||||||||
Uncertainty in income tax obligations (9) | $ | 43 | $ | 1 | $ | 13 | $ | 3 | $ | 26 | ||||||||||
OTHER: | ||||||||||||||||||||
Interest payments (10) | $ | 1,304 | $ | 149 | $ | 293 | $ | 215 | $ | 647 | ||||||||||
Less: Non-recourse interest payments | (184 | ) | (20 | ) | (34 | ) | (31 | ) | (99 | ) | ||||||||||
Total recourse interest payments | $ | 1,120 | $ | 129 | $ | 259 | $ | 184 | $ | 548 | ||||||||||
Dublin future obligations (11) | $ | 108 | $ | — | $ | 8 | $ | 100 | $ | — | ||||||||||
Interest related to Dublin future obligations (11) | $ | 48 | $ | 10 | $ | 21 | $ | 17 | $ | — | ||||||||||
Purchase obligations (12) | $ | 33 | $ | — | $ | 33 | $ | — | $ | — | ||||||||||
Operating leases | $ | 57 | $ | 8 | $ | 13 | $ | 12 | $ | 24 | ||||||||||
Retirement plan obligations (13) | $ | 4 | $ | 1 | $ | 1 | $ | 1 | $ | 1 | ||||||||||
Total obligations | $ | 3,733 | $ | 154 | $ | 358 | $ | 1,251 | $ | 1,970 | ||||||||||
(1) | Interest payments on the Term Loan and letter of credit fees are estimated based on current LIBOR rates and are estimated assuming scheduled principal repayments. See Item 8. Financial Statements And Supplementary Data — Note 11. Consolidated Debt. |
(2) | Interest on the 7.25% Notes is payable semi-annually in arrears on June 1 and December 1 of each year, commencing on June 1, 2011 and will mature on December 1, 2020 unless earlier redeemed or repurchased. See Item 8. Financial Statements And Supplementary Data — Note 11. Consolidated Debt. |
(3) | Interest on the 6.375% Notes is payable semi-annually in arrears on April 1 and October 1 of each year, commencing on October 1, 2012 and will mature on October 1, 2022 unless earlier redeemed or repurchased. See Item 8. Financial Statements And Supplementary Data — Note 11. Consolidated Debt. |
(4) | Interest on the 5.875% Notes is payable semi-annually in arrears on March 1 and September 1 of each year, commencing on September 1, 2014 and will mature on March 21, 2024 unless earlier redeemed or repurchased. See Item 8. Financial Statements And Supplementary Data — Note 11. Consolidated Debt. |
(5) | The tax-exempt bonds bear interest between 4% and 5.25%. Interest on the $335 million of tax-exempt bonds issued in 2012, is payable semi-annually on May 1 and November 1 of each year, commencing on May 1, 2013. Interest on the $130 million of tax-exempt bonds issued in 2015, is payable semi-annually on January 1 and July 1 of each year, commencing on January 1, 2016. For a detailed description of the terms of the Tax-Exempt bonds, see Item 8. Financial Statements And Supplementary Data — Note 11. Consolidated Debt. |
(6) | The original lease terms range from 10 years to 12 years and the fixed interest rates range from 3.48% to 4.52%. |
(7) | Payment obligations for the project debt and equipment leases associated with owned energy-from-waste facilities are limited recourse to operating subsidiaries and non-recourse to us, subject to operating performance guarantees and commitments. |
(8) | The Stakeholder Loan accrues dividends at a fixed rate of 13.50% per annum. The dividends are payable 50% in cash and 50% accrued to the principal balance on a monthly basis prior to the operational commencement date, and payable 100% in cash semi-annually thereafter, |
54
subject to available project cash flows after debt service. See Item 8. Financial Statements And Supplementary Data — Note 11. Consolidated Debt - Dublin Convertible Preferred.
(9) | Accounting for uncertainty in income tax obligations is based upon the expected date of settlement taking into account all of our administrative rights including possible litigation. |
(10) | Interest payments represent accruals for cash interest payments. Excludes interest payments on Dublin Senior Term Loan. |
(11) | Projected obligations relating to our Dublin Senior Term Loan. See Item 8. Financial Statements And Supplementary Data — Note 11. Consolidated Debt. |
(12) | Purchase obligations relate to capital commitments related to our New York City waste transport and disposal contract. See Item 8. Financial Statements And Supplementary Data — Note 3. New Business and Asset Management for additional information. |
(13) | Retirement plan obligations are based on actuarial estimates for the non-qualified pension plan obligations and post-retirement plan obligations only as of December 31, 2016. In 2012, the qualified pension plan was terminated and final settlement occurred in 2013. See Item 8. Financial Statements And Supplementary Data — Note 16. Employee Benefit Plans. |
Other Commitments
Other commitments as of December 31, 2016 were as follows (in millions):
Commitments Expiring by Period | |||||||||||
Total | Less Than One Year | More Than One Year | |||||||||
Letters of credit issued under the Revolving Credit Facility | $ | 156 | $ | — | $ | 156 | |||||
Letters of credit - other | 61 | — | 61 | ||||||||
Surety bonds | 158 | — | 158 | ||||||||
Total other commitments — net | $ | 375 | $ | — | $ | 375 | |||||
For additional information on other commitments, see Item 8. Financial Statements And Supplementary Data — Note 18. Commitments and Contingencies - Other Matters.
New York City Waste Transport and Disposal Contract
In August 2013, New York City awarded us a contract to handle waste transport and disposal from two marine transfer stations located in Queens and Manhattan. Service for the Queens marine transfer station began in early 2015, service for the Manhattan marine transfer station is expected to follow pending notice to proceed to be issued by New York City, which is anticipated in 2018. As of December 31, 2016, we expect to incur approximately $33 million of additional capital expenditures, primarily for transportation equipment.
Other Factors Affecting Liquidity
We may from time to time engage in construction activity for public sector clients, either for new projects or expansions of existing projects. We historically receive payments for this activity based upon completion of milestones as set forth in the applicable contracts, and the timing and size of these milestone payments can result in material working capital variability between periods. This variability can in turn result in meaningful swings between periods in our Cash Flow from Operations and Free Cash Flow (which we use as a non-GAAP liquidity measure). For additional information related to Cash Flow from Operations see Liquidity and Capital Resources — Sources and Uses of Cash Flow from Continuing Operations and Liquidity and Capital Resources — Supplementary Financial Information — Free Cash Flow (Non-GAAP Discussion) above.
Our capital structure includes multiple debt securities and credit facilities, each with different maturity dates. As and when we refinance each element of our capital structure, we may consider utilizing the same or different types of debt securities and credit facilities, depending upon market conditions and general business requirements. Our selection of the same or different refinancing structures could materially increase or decrease our annual cash interest expense in future periods.
Insurance Coverage
We periodically review our insurance programs to ensure that our coverage is appropriate for the risks attendant to our business. We have obtained insurance for our employees, assets and operations that provide coverage for what we believe are probable maximum losses, subject to self-insured retentions, policy limits and premium costs which we believe to be appropriate. However, the insurance obtained does not cover us for all possible losses, and coverage available in the market may change over time.
Off-Balance Sheet Arrangements
We are party to a lease arrangement at our Union County, New Jersey energy-from-waste facility in which we lease the facility from the Union County Utilities Authority, referred to as the “UCUA.” We guarantee a portion of the rent due under the lease, which is sufficient to allow UCUA to make debt service payments due on the tax exempt bonds issued by it to finance the construction of the facility and which are scheduled to mature in 2031.
55
We are also a party to various lease arrangements pursuant to which we lease rolling stock in connection with our operating activities, as well as lease certain office space and equipment. Rent payable under these arrangements is not material to our financial position. We generally use operating lease treatment for all of the foregoing arrangements. A summary of our operating lease obligations is contained in Item 8. Financial Statements And Supplementary Data — Note 10. Operating Leases.
As described above under Other Commitments, we have issued or are party to performance guarantees and related contractual obligations undertaken mainly pursuant to agreements to construct and/or operate certain energy-from-waste facilities. To date, we have not incurred material liabilities under our guarantees.
We have investments in several investees and joint ventures that are accounted for under the equity and cost methods and therefore we do not consolidate the financial information of those companies. See Item 8. Financial Statements And Supplementary Data — Note 9. Equity Method Investments for additional information regarding these investments.
56
DISCUSSION OF CRITICAL ACCOUNTING POLICIES AND ESTIMATES
In preparing our consolidated financial statements in accordance with GAAP, we are required to use judgment in making estimates and assumptions that affect the amounts reported in our consolidated financial statements and related notes. We base our estimates on historical experience and on various other assumptions that are believed to be reasonable under the circumstances. These estimates form the basis for making judgments about the carrying value of assets and liabilities that are not readily apparent from other sources. Many of our critical accounting policies are subject to significant judgments and uncertainties that could potentially result in materially different results under different conditions and assumptions. Future events rarely develop exactly as forecast, and the best estimates routinely require adjustment.
Policy | Judgments and estimates | Effect if actual results differ from assumptions | ||
Revenue and Expense Recognition (Construction Contracts) Construction contracts are typically signed in conjunction with agreements to operate a newly constructed project. Upon completion of the construction element of these contracts, we recognize service revenue over the term of the service element of the contract. Revenue under existing fixed-price construction contracts are recognized using the percentage-of-completion method, measured by the cost-to-cost method. If we enter new contracts that contain multiple element arrangements, the revenue will be allocated between construction revenue and other project revenue (waste disposal revenue and electricity and steam sales) based on the relative fair value of each element provided the delivered elements have value to customers on a standalone basis. Amounts allocated to each element are based on its objectively determined fair value, such as the sales price for the product or service when it is sold separately or competitor prices for similar products or services. | We estimate our total construction costs for the contract throughout the project. As the project progresses, revisions to our estimated costs may be necessary. Given the unique nature of our business, we are likely to use our best estimate of selling price in allocating revenue between construction, and other project revenue (waste and service revenue, and electricity and steam sales). This allocation would be performed at the inception of the new contracts and when a material modification occurs. | If a revision to our estimated construction costs is required, the amount of revenue and the related operating income recognized will also fluctuate. The allocation of revenue will impact the timing of revenue recognized for each unit, where the amount allocated to construction will be recognized in earlier periods followed by the remainder over the service period. Any subsequent modification to the contracts that are considered material could result in a change in the amount and timing of revenue to be recognized. | ||
Purchase Accounting We allocate acquisition purchase prices to identified tangible and intangible assets acquired and liabilities assumed based on their estimated fair values at the dates of acquisition, with any residual amounts allocated to goodwill. The fair value estimates used reflect our best estimates for the highest and best use by market participants. | These estimates are subject to uncertainties and contingencies. For example, we used the discounted cash flow method to estimate the value of many of our assets, which entailed developing projections of future cash flows. | If the cash flows from the acquired net assets differ significantly from our estimates, the amounts recorded could be subject to impairments. Furthermore, to the extent we change our initial estimates of the remaining useful life of the assets or liabilities, future depreciation and amortization expense could be impacted. | ||
57
Policy | Judgments and estimates | Effect if actual results differ from assumptions | ||
Long-lived Assets and Intangible Assets Our long-lived assets include property, plant and equipment; waste, service and energy contracts; amortizable intangible assets; and other assets. We evaluate the recoverability of the long-lived assets when there are indicators of possible impairment. Such indicators may include a decline in market, new regulation, recurring or expected operating losses, change in business strategy, or other changes that would impact the use or benefit received from the assets. The assessment is performed by grouping the long-lived assets at the lowest level of identifiable cash flows for the related assets or group of assets (such as the facility level). Initially the carrying value of the asset or asset group is compared to its undiscounted expected future cash flows. If the carrying value is in excess of the undiscounted cash flows, the carrying value is then compared to the fair value. Fair value may be estimated based upon the discounted cash flows, market or replacement cost methods based on the assumptions of a third-party market participant. Impairment is recognized if the fair value is less than the carrying value. | Our judgments regarding the existence of impairment indicators are based on regulatory factors, market conditions, anticipated cash flows and operational performance of our assets. When determining the fair value of our asset groupings and intangible assets for impairment assessments, we make assumptions regarding their fair values which are dependent on estimates of future cash flows, discount rates, and other factors. | Future events or change in circumstances may occur that require another assessment in future periods based on cash flows and discount rates in effect at that time. | ||
Goodwill As of December 31, 2016, we had $302 million of goodwill recorded in our North America reportable segment, which is comprised of two reporting units (see Note 8. Other Intangible Assets and Goodwill). We evaluate our goodwill annually and when indications of impairment exist. We have the option to perform our initial assessment over the possible impairment of goodwill either qualitatively or quantitatively. Under the qualitative assessment, consideration is given to both external factors (including macroeconomic and industry conditions) and our own internal factors (including internal costs, recent financial performance, management, business strategy, customers, and stock price). During the fourth quarter of 2016 we performed the required annual impairment review of our recorded goodwill. We determined that there was no indication of impairment as the fair value of our reporting units exceeded their carrying values. | Our judgments regarding the existence of impairment indicators are based on regulatory factors, market conditions, anticipated cash flows and operational performance of our assets. When determining the fair value of our reporting unit for impairment assessments, we make assumptions regarding the fair value which is dependent on estimates of future cash flows, discount rates, and other factors. | The impairment assessment of goodwill performed in the periods presented resulted in the conclusion that the fair value was not less than the carrying value. In future years, if there is a significant change in the estimated cash flows, discount rates or other factors that cause the fair values to significantly decrease, there could be impairments which could materially impact our results of operations. | ||
58
Policy | Judgments and estimates | Effect if actual results differ from assumptions | ||
Insurance Reserves and Self-Insurance for Employee Benefit Plans We retain a substantial portion of the risk related to certain general liability, workers’ compensation and medical claims. However, we maintain stop-loss coverage to limit the exposure related to employee benefit plans and liability insurance over retained risks. Liabilities associated with these losses include estimates of both claims filed and losses incurred but not yet reported ("IBNR"). We use actuarial methods which consider a number of factors to estimate our ultimate cost of losses. Our insurance reserves and medical liability accrual was $16 million and $14 million as of December 31, 2016 and 2015, respectively. | We believe that the amounts accrued are adequate; however, our liabilities could be significantly affected if future occurrences or loss developments differ from our estimates of both claims filed and losses incurred but not yet reported. | A 1% change in average claim costs would impact our self-insurance expense by less than $1 million. | ||
Deferred Tax Assets As described in Item 8. Financial Statements And Supplementary Data — Note 15. Income Taxes, we have recorded a deferred tax asset related to our NOLs. The NOLs will expire in various amounts beginning on December 31, 2028 through December 31, 2033, if not used. Deferred tax assets are reduced by a valuation allowance if, based on available evidence, it is more likely than not that some portion or all of the deferred tax assets will not be realized. | We estimated that we had gross NOLs of approximately $288 million for federal income tax purposes and $291 million for state income tax purposes as of the end of 2016. We also estimated our tax credits as approximately $54 million and our deferred tax assets are offset by a valuation allowance of approximately $71 million. The amount recorded was calculated based upon future taxable income arising from (a) the reversal of temporary differences during the period the NOLs are available and (b) future operating income expected, to the extent it is reasonably predictable. Judgment is involved in assessing whether a valuation allowance is required on our deferred tax assets. | To the extent our estimation of the reversal of temporary differences and operating income generated differs from actual results, we could be required to adjust the carrying amount of the deferred tax assets. | ||
RECENT ACCOUNTING PRONOUNCEMENTS
See Item 8. Financial Statements And Supplementary Data — Note 2. Recent Accounting Pronouncements for a summary of new accounting pronouncements.
Item 7A. QUANTITATIVE AND QUALITATIVE DISCLOSURES ABOUT MARKET RISK
In the normal course of business, our subsidiaries are party to financial instruments that are subject to market risks arising from changes in commodity prices, interest rates, foreign currency exchange rates, and derivative instruments. Our use of derivative instruments is very limited and we do not enter into derivative instruments for trading purposes. The following analysis provides quantitative information regarding our exposure to financial instruments with market risks. We use a sensitivity model to evaluate the fair value or cash flows of financial instruments with exposure to market risk that assumes instantaneous, parallel shifts in exchange rates and interest rate yield curves. There are certain limitations inherent in the sensitivity analysis presented, primarily due to the assumption that exchange rates change in a parallel manner and that interest rates change instantaneously. In addition, the fair value estimates presented herein are based on pertinent information available to us as of December 31, 2016. Further information is included in Item 8. Financial Statements And Supplementary Data — Note 12. Financial Instruments and Note 13. Derivative Instruments.
59
Commodity Price Risk
Energy Price Risk
In contrast to our waste disposal agreements, as a result of structural and regulatory changes in the energy markets over time, we expect that multi-year contracts for energy sales will generally be less available than in the past, thereby increasing our exposure to energy market price volatility upon expiration. As our historic energy contracts have expired and our service fee contracts have transitioned to tip fee contracts, our exposure to market energy prices has increased. We expect this trend to continue. In order to mitigate our exposure to near-term (one to three years) revenue fluctuations in energy markets, we enter into hedging arrangements and we expect to do so in the future. Our efforts in this regard will involve only mitigation of price volatility for the energy we produce, and will not involve speculative energy trading. In connection with this hedging strategy, we have entered into swap agreements with various financial institutions to hedge our exposure to market risk. As of December 31, 2016, the net fair value of the energy derivatives of $2 million pre-tax, was recorded as a $3 million current asset and a $1 million current liability and as a component of Accumulated Other Comprehensive Income (“AOCI”).
Recycled Metals Price Risk
We recover and sell ferrous and non-ferrous metals, with pricing linked to related commodity indices. Therefore, our metals revenue is completely exposed to market price fluctuations. A 10% change in the current market rates would impact recycled metals revenue by approximately $3 million and $4 million for ferrous and non-ferrous, respectively. We are currently unable to mitigate this exposure effectively either via long-term pricing contracts or with hedging instruments as there are limited options to enter into such arrangements for this segment of the market.
Waste Price Risk
We have some protection against fluctuations in fuel (municipal waste) price risk in our North America segment energy-from-waste business because approximately 78% of our municipal waste is provided under multi-year contracts where we are paid for our fuel at fixed rates. At our tip fee energy-from-waste facilities, differing amounts of waste processing capacity are not subject to long-term contracts and, therefore, we are partially exposed to the risk of market fluctuations in the waste disposal fees we may charge for fuel. At service fee facilities, waste disposal fees generally increase annually due to annual contract price escalations intended to reflect changes in our costs. Declines in waste disposal fees at our energy-from-waste facilities are mitigated through internalizing waste disposal by utilizing our network of transfer stations located throughout the northeast United States and by increasing our profiled waste volumes, which we can sell at a higher price than municipal solid waste.
We expect that multi-year contracts for waste supply at facilities we own or lease will continue to be available on acceptable terms in the marketplace, at least for a substantial portion of facility capacity, as municipalities continue to value long-term committed and sustainable waste disposal capacity. We also expect that an increasing portion of system capacity will be contracted on a shorter-term basis, and so we will have more frequent exposure to waste market risk.
Interest Rate Risk
Outstanding loan balances under the Credit Facilities bear interest at floating rates, which are calculated as either interest at a reserve adjusted British Bankers Association Interest Settlement Rate, commonly referred to as “LIBOR,” the “prime rate” or the Federal Funds rate plus 0.5% per annum, plus a borrowing margin. For details as to the various election options under the Credit Facility, see Item 8. Financial Statements And Supplementary Data — Note 11. Consolidated Debt. As of December 31, 2016, the outstanding balance of the Term Loan was $195 million. We have not entered into any interest rate hedging arrangements against this balance. A hypothetical increase of 1% in the underlying December 31, 2016 market interest rates would result in a potential reduction to twelve-month future earnings of approximately $2 million, pre-tax. For details, see Item 8. Financial Statements And Supplementary Data — Note 11. Consolidated Debt.
In order to hedge the risk of adverse variable interest rate fluctuations associated with the Dublin Project Senior Term Loan, we have entered into floating to fixed rate swap agreements, denominated in Euros for the full €250 million loan amount with various financial institutions that terminate between 2017 and 2021. This interest rate swap is designated as a cash flow hedge, which is recorded at fair value as a noncurrent liability with changes in fair value recorded as a component of AOCI. As of December 31, 2016, the fair value of the interest rate swap derivative of $20 million pre-tax, was recorded as a noncurrent liability. For additional information, see Item 8. Financial Statements And Supplementary Data — Note 13. Derivative Instruments.
Foreign Currency Exchange Rate Risk
We have operations in various foreign markets, including China, Canada, Ireland and Italy. As and to the extent we grow our international business, we expect to invest in foreign currencies to pay either for the construction costs of facilities we develop, or for the cost to acquire existing businesses or assets. Currency volatility in those markets, as well as the effectiveness of any currency hedging strategies we may implement, may impact both the amount we are required to invest in new projects as well as our financial returns on these projects and our reported results. We have mitigated our currency risks in certain cases by structuring our project contracts so that our revenue adjust in line with corresponding changes in the relevant currency rates. In such cases,
60
only that portion of our working capital investment and associated project debt, if any, that are denominated in a currency other than the project entity’s functional currency are exposed to currency risks. As of December 31, 2016, the fair value of the foreign currency derivatives of zero pre-tax, was recorded as a current asset. For additional information, see Item 8. Financial Statements And Supplementary Data — Note 13. Derivative Instruments.
As of December 31, 2016, we also had equity investments in foreign subsidiaries and projects. See Item 8. Financial Statements And Supplementary Data — Note 9. Equity Method Investments for further discussion.
61
Item 8. FINANCIAL STATEMENTS AND SUPPLEMENTARY DATA
Page | |
Consolidated Statements of Operations for the Years Ended December 31, 2016, 2015, and 2014 | |
Consolidated Statements of Comprehensive (Loss) Income for the Years Ended December 31, 2016, 2015, and 2014 | |
Consolidated Balance Sheets as of December 31, 2016 and 2015 | |
Consolidated Statements of Cash Flow for the Years Ended December 31, 2016, 2015, and 2014 | |
Consolidated Statements of Equity for the Years Ended December 31, 2016, 2015 and 2014 | |
Note 4. Dispositions, Assets Held for Sale and Discontinued Operations | |
62
Report of Independent Registered Public Accounting Firm
The Board of Directors and Stockholders of Covanta Holding Corporation
We have audited the accompanying consolidated balance sheets of Covanta Holding Corporation (the “Company”) as of December 31, 2016 and 2015, and the related consolidated statements of operations, comprehensive (loss) income, equity, and cash flows for each of the three years in the period ended December 31, 2016. Our audits also included the financial statement schedule listed in the Index at Item 8. These financial statements and schedule are the responsibility of the Company’s management. Our responsibility is to express an opinion on these financial statements and schedule based on our audits.
We conducted our audits in accordance with the standards of the Public Company Accounting Oversight Board (United States). Those standards require that we plan and perform the audit to obtain reasonable assurance about whether the financial statements are free of material misstatement. An audit includes examining, on a test basis, evidence supporting the amounts and disclosures in the financial statements. An audit also includes assessing the accounting principles used and significant estimates made by management, as well as evaluating the overall financial statement presentation. We believe that our audits provide a reasonable basis for our opinion.
In our opinion, the financial statements referred to above present fairly, in all material respects, the consolidated financial position of Covanta Holding Corporation at December 31, 2016 and 2015, and the consolidated results of its operations and its cash flows for each of the three years in the period ended December 31, 2016, in conformity with U.S. generally accepted accounting principles. Also, in our opinion, the related financial statement schedule, when considered in relation to the basic financial statements taken as a whole, presents fairly in all material respects the information set forth therein.
As discussed in Note 1 to the consolidated financial statements, the Company changed its method of accounting for service concession arrangements as a result of the adoption of the amendments to the Financial Accounting Standards Board Accounting (FASB) Standards Codification resulting from Accounting Standards Update (ASU) No. 2014-05, “Service Concession Arrangements,” effective January 1, 2015. As discussed in Note 1 to the consolidated financial statements, the Company changed the classification of all deferred tax assets and liabilities to noncurrent on the consolidated balance sheet as a result of the adoption of the amendments to the FASB Accounting Standards Codification resulting from ASU No. 2015-17, “Balance Sheet Classification of Deferred Taxes,” effective December 31, 2015. As discussed in Note 1 to the consolidated financial statements, the Company changed the classification of its debt issuance costs to be presented as a direct reduction from the carrying amount of the related liability on the consolidated balance sheet as a result of the adoption and the amendments to the FASB Accounting Standards Codification resulting in ASU No. 2015-03, “Simplifying the Presentation of Debt Issuance Costs”, effective January 1, 2016.
We also have audited, in accordance with the standards of the Public Company Accounting Oversight Board (United States), Covanta Holding Corporation's internal control over financial reporting as of December 31, 2016, based on criteria established in Internal Control-Integrated Framework issued by the Committee of Sponsoring Organizations of the Treadway Commission (2013 Framework) and our report dated February 28, 2017 expressed an adverse opinion thereon.
/s/ Ernst & Young LLP
MetroPark, New Jersey
February 28, 2017
63
COVANTA HOLDING CORPORATION AND SUBSIDIARIES
CONSOLIDATED STATEMENTS OF OPERATIONS
For the Years Ended December 31, | ||||||||||||
2016 | 2015 | 2014 | ||||||||||
(In millions, except per share amounts) | ||||||||||||
OPERATING REVENUE: | ||||||||||||
Waste and service revenue | $ | 1,187 | $ | 1,104 | $ | 1,032 | ||||||
Energy revenue | 370 | 421 | 460 | |||||||||
Recycled metals revenue | 61 | 61 | 93 | |||||||||
Other operating revenue | 81 | 59 | 97 | |||||||||
Total operating revenue | 1,699 | 1,645 | 1,682 | |||||||||
OPERATING EXPENSE: | ||||||||||||
Plant operating expense | 1,177 | 1,129 | 1,055 | |||||||||
Other operating expense, net | 86 | 73 | 101 | |||||||||
General and administrative expense | 100 | 93 | 97 | |||||||||
Depreciation and amortization expense | 207 | 198 | 211 | |||||||||
Impairment charges | 20 | 43 | 64 | |||||||||
Total operating expense | 1,590 | 1,536 | 1,528 | |||||||||
Operating income | 109 | 109 | 154 | |||||||||
Other income (expense): | ||||||||||||
Investment income | 1 | — | 1 | |||||||||
Interest expense | (139 | ) | (134 | ) | (135 | ) | ||||||
Non-cash convertible debt related expense | — | — | (13 | ) | ||||||||
Gain on asset sales | 44 | — | — | |||||||||
Loss on extinguishment of debt | — | (2 | ) | (2 | ) | |||||||
Other expense, net | (1 | ) | (1 | ) | (1 | ) | ||||||
Total other expense | (95 | ) | (137 | ) | (150 | ) | ||||||
Income (loss) before income tax (expense) benefit and equity in net income from unconsolidated investments | 14 | (28 | ) | 4 | ||||||||
Income tax (expense) benefit | (22 | ) | 84 | (15 | ) | |||||||
Equity in net income from unconsolidated investments | 4 | 13 | 10 | |||||||||
NET (LOSS) INCOME | (4 | ) | 69 | (1 | ) | |||||||
Less: Net income attributable to noncontrolling interests in subsidiaries | — | 1 | 1 | |||||||||
NET (LOSS) INCOME ATTRIBUTABLE TO COVANTA HOLDING CORPORATION | $ | (4 | ) | $ | 68 | $ | (2 | ) | ||||
Weighted Average Common Shares Outstanding | ||||||||||||
Basic | 129 | 132 | 130 | |||||||||
Diluted | 129 | 133 | 130 | |||||||||
(Loss) Income Per Share Attributable to Covanta Holding Corporation Stockholders: | ||||||||||||
Basic | $ | (0.03 | ) | $ | 0.52 | $ | (0.01 | ) | ||||
Diluted | $ | (0.03 | ) | $ | 0.51 | $ | (0.01 | ) | ||||
Cash Dividend Declared Per Share: | $ | 1.00 | $ | 1.00 | $ | 0.86 | ||||||
The accompanying notes are an integral part of the consolidated financial statements.
64
COVANTA HOLDING CORPORATION AND SUBSIDIARIES
CONSOLIDATED STATEMENTS OF COMPREHENSIVE (LOSS) INCOME
For the Years Ended December 31, | ||||||||||||
2016 | 2015 | 2014 | ||||||||||
(In millions) | ||||||||||||
Net (loss) income | $ | (4 | ) | $ | 69 | $ | (1 | ) | ||||
Foreign currency translation | (7 | ) | (22 | ) | (12 | ) | ||||||
Net unrealized (loss) gain on derivative instruments, net of tax (benefit) expense of $(8), $7, and $2, respectively | (21 | ) | 10 | (7 | ) | |||||||
Net unrealized loss on available for sale securities | — | — | (1 | ) | ||||||||
Other comprehensive loss attributable to Covanta Holding Corporation | (28 | ) | (12 | ) | (20 | ) | ||||||
Comprehensive (loss) income | (32 | ) | 57 | (21 | ) | |||||||
Less: Net income attributable to noncontrolling interests in subsidiaries | — | 1 | 1 | |||||||||
Comprehensive (loss) income attributable to Covanta Holding Corporation | $ | (32 | ) | $ | 56 | $ | (22 | ) | ||||
The accompanying notes are an integral part of the consolidated financial statements.
65
COVANTA HOLDING CORPORATION AND SUBSIDIARIES
CONSOLIDATED BALANCE SHEETS
As of December 31, | |||||||
2016 | 2015 | ||||||
(In millions, except per share amounts) | |||||||
ASSETS | |||||||
Current: | |||||||
Cash and cash equivalents | $ | 84 | $ | 94 | |||
Restricted funds held in trust | 56 | 77 | |||||
Receivables (less allowances of $9 million and $7 million, respectively) | 332 | 312 | |||||
Prepaid expenses and other current assets | 72 | 117 | |||||
Assets held for sale | — | 97 | |||||
Total Current Assets | 544 | 697 | |||||
Property, plant and equipment, net | 3,024 | 2,690 | |||||
Restricted funds held in trust | 54 | 83 | |||||
Waste, service and energy contracts, net | 263 | 284 | |||||
Other intangible assets, net | 34 | 38 | |||||
Goodwill | 302 | 301 | |||||
Other assets | 63 | 141 | |||||
Total Assets | $ | 4,284 | $ | 4,234 | |||
LIABILITIES AND EQUITY | |||||||
Current: | |||||||
Current portion of long-term debt | $ | 9 | $ | 8 | |||
Current portion of project debt | 22 | 16 | |||||
Accounts payable | 98 | 90 | |||||
Accrued expenses and other current liabilities | 289 | 234 | |||||
Liabilities held for sale | — | 23 | |||||
Total Current Liabilities | 418 | 371 | |||||
Long-term debt | 2,243 | 2,255 | |||||
Project debt | 361 | 182 | |||||
Deferred income taxes | 617 | 595 | |||||
Waste and service contracts, net | 7 | 13 | |||||
Other liabilities | 169 | 178 | |||||
Total Liabilities | 3,815 | 3,594 | |||||
Commitments and Contingencies (Note 18) | |||||||
Equity: | |||||||
Covanta Holding Corporation stockholders' equity: | |||||||
Preferred stock ($0.10 par value; authorized 10 shares; none issued and outstanding) | — | — | |||||
Common stock ($0.10 par value; authorized 250 shares; issued 136 shares, outstanding 130 and 131, respectively) | 14 | 14 | |||||
Additional paid-in capital | 807 | 801 | |||||
Accumulated other comprehensive loss | (62 | ) | (34 | ) | |||
Accumulated deficit | (289 | ) | (143 | ) | |||
Treasury stock, at par | (1 | ) | — | ||||
Total Covanta Holding Corporation stockholders' equity | 469 | 638 | |||||
Noncontrolling interests in subsidiaries | — | 2 | |||||
Total Equity | 469 | 640 | |||||
Total Liabilities and Equity | $ | 4,284 | $ | 4,234 | |||
The accompanying notes are an integral part of the consolidated financial statements.
66
COVANTA HOLDING CORPORATION AND SUBSIDIARIES
CONSOLIDATED STATEMENTS OF CASH FLOW
For the Years Ended December 31, | |||||||||||
2016 | 2015 | 2014 | |||||||||
OPERATING ACTIVITIES: | (In millions) | ||||||||||
Net (loss) income | $ | (4 | ) | $ | 69 | $ | (1 | ) | |||
Adjustments to reconcile net (loss) income to net cash provided by operating activities: | |||||||||||
Depreciation and amortization expense | 207 | 198 | 211 | ||||||||
Amortization of long-term debt deferred financing costs | 6 | 8 | 8 | ||||||||
Gain on asset sales | (44 | ) | — | — | |||||||
Impairment charges | 20 | 43 | 64 | ||||||||
Amortization of debt premium and discount | 1 | — | (1 | ) | |||||||
Loss on extinguishment of debt | — | 2 | 2 | ||||||||
Non-cash convertible debt related expense | — | — | 13 | ||||||||
Provision for doubtful accounts | 2 | 1 | 4 | ||||||||
Stock-based compensation expense | 16 | 18 | 17 | ||||||||
Equity in net income from unconsolidated investments | (4 | ) | (13 | ) | (10 | ) | |||||
Dividends from unconsolidated investments | 2 | 5 | 11 | ||||||||
Deferred income taxes | 21 | (11 | ) | 4 | |||||||
IRS audit settlement | — | (93 | ) | — | |||||||
Change in restricted funds held in trust | 22 | 28 | 11 | ||||||||
Other, net | (6 | ) | 16 | 2 | |||||||
Change in operating assets and liabilities, net of effects of acquisitions: | |||||||||||
Receivables | (19 | ) | (12 | ) | (40 | ) | |||||
Debt services billings in excess of revenue recognized | (1 | ) | 5 | 17 | |||||||
Accounts payable and accrued expenses | 45 | (8 | ) | 57 | |||||||
Deferred revenue | (2 | ) | (5 | ) | (22 | ) | |||||
Other, net | 20 | (2 | ) | (7 | ) | ||||||
Total adjustments for continuing operations | 286 | 180 | 341 | ||||||||
Net cash provided by operating activities from continuing operations | 282 | 249 | 340 | ||||||||
Net cash provided by operating activities from discontinued operations | — | — | 1 | ||||||||
Net cash provided by operating activities | 282 | 249 | 341 | ||||||||
INVESTING ACTIVITIES: | |||||||||||
Purchase of property, plant and equipment | (359 | ) | (376 | ) | (216 | ) | |||||
Acquisition of businesses, net of cash acquired | (9 | ) | (72 | ) | (13 | ) | |||||
Acquisition of noncontrolling interests in subsidiaries | — | — | (12 | ) | |||||||
Purchase of investment securities | — | — | (4 | ) | |||||||
Proceeds from asset sales | 109 | — | — | ||||||||
Property insurance proceeds | 3 | 1 | 2 | ||||||||
Proceeds from the sale of investment securities | — | — | 6 | ||||||||
Proceeds from available-for-sale marketable securities | — | — | 11 | ||||||||
Other, net | 2 | (1 | ) | (6 | ) | ||||||
Net cash used in investing activities from continuing operations | (254 | ) | (448 | ) | (232 | ) | |||||
Net cash provided by investing activities from discontinued operations | — | — | 3 | ||||||||
Net cash used in investing activities | (254 | ) | (448 | ) | (229 | ) | |||||
67
COVANTA HOLDING CORPORATION AND SUBSIDIARIES
CONSOLIDATED STATEMENTS OF CASH FLOW – (Continued)
For the Years Ended December 31, | |||||||||||
2016 | 2015 | 2014 | |||||||||
(In millions) | |||||||||||
FINANCING ACTIVITIES: | |||||||||||
Proceeds from borrowings on long-term debt | — | 294 | 412 | ||||||||
Proceeds from borrowings on revolving credit facility | 744 | 895 | 531 | ||||||||
Proceeds from equipment financing capital lease | — | 15 | 63 | ||||||||
Proceeds from borrowings on project debt | — | 59 | 63 | ||||||||
Proceeds from borrowings on Dublin project financing | 159 | 86 | — | ||||||||
Proceeds from the exercise of options for common stock, net | — | — | 10 | ||||||||
Proceeds from settlement of Note Hedge | — | — | (83 | ) | |||||||
Payments related to Cash Conversion Option | — | — | 83 | ||||||||
Principal payments on long-term debt | (4 | ) | (196 | ) | (557 | ) | |||||
Payments of borrowings on revolving credit facility | (749 | ) | (692 | ) | (496 | ) | |||||
Payments of equipment financing capital lease | (4 | ) | (4 | ) | (1 | ) | |||||
Principal payments on project debt | (51 | ) | (85 | ) | (52 | ) | |||||
Payments of deferred financing costs | (6 | ) | (11 | ) | (36 | ) | |||||
Cash dividends paid to stockholders | (131 | ) | (133 | ) | (101 | ) | |||||
Common stock repurchased | (20 | ) | (30 | ) | — | ||||||
Change in restricted funds held in trust | 28 | 5 | (43 | ) | |||||||
Other, net | (6 | ) | 5 | (3 | ) | ||||||
Net cash (used in) provided by financing activities from continuing operations | (40 | ) | 208 | (210 | ) | ||||||
Net cash used in financing activities from discontinued operations | — | — | (6 | ) | |||||||
Net cash (used in) provided by financing activities | (40 | ) | 208 | (216 | ) | ||||||
Effect of exchange rate changes on cash and cash equivalents | — | (4 | ) | (5 | ) | ||||||
Net (decrease) increase in cash and cash equivalents | (12 | ) | 5 | (109 | ) | ||||||
Cash and cash equivalents at beginning of period | 96 | 91 | 200 | ||||||||
Cash and cash equivalents at end of period | 84 | 96 | 91 | ||||||||
Less: Cash and cash equivalents of assets held for sale and discontinued operations at end of period | — | 2 | 7 | ||||||||
Cash and cash equivalents of continuing operations at end of period | $ | 84 | $ | 94 | $ | 84 | |||||
Cash Paid for Interest and Income Taxes: | |||||||||||
Interest | $ | 150 | $ | 141 | $ | 121 | |||||
Income taxes, net of refunds | $ | 6 | $ | 2 | $ | 11 | |||||
The accompanying notes are an integral part of the consolidated financial statements.
68
COVANTA HOLDING CORPORATION AND SUBSIDIARIES
CONSOLIDATED STATEMENTS OF EQUITY
Covanta Holding Corporation Stockholders’ Equity | Noncontrolling Interests in Subsidiaries | Total | ||||||||||||||||||||||||||||||||
Common Stock | Additional Paid-In Capital | Accumulated Other Comprehensive Loss | Accumulated Earnings (Deficit) | Treasury Stock | ||||||||||||||||||||||||||||||
Shares | Amount | Shares | Amount | |||||||||||||||||||||||||||||||
(In millions) | ||||||||||||||||||||||||||||||||||
Balance as of December 31, 2013 | 136 | $ | 14 | $ | 790 | $ | (2 | ) | $ | 101 | 6 | $ | (1 | ) | $ | 4 | $ | 906 | ||||||||||||||||
Stock-based compensation expense | 17 | 17 | ||||||||||||||||||||||||||||||||
Dividend declared | (114 | ) | (114 | ) | ||||||||||||||||||||||||||||||
Shares repurchased for tax withholdings for vested stock awards | (4 | ) | (4 | ) | ||||||||||||||||||||||||||||||
Exercise of options to purchase common stock | 10 | (1 | ) | 10 | ||||||||||||||||||||||||||||||
Exercise of warrants | (1 | ) | 1 | 1 | ||||||||||||||||||||||||||||||
Shares issued in non-vested stock award | (1 | ) | — | |||||||||||||||||||||||||||||||
Other | 1 | 1 | ||||||||||||||||||||||||||||||||
Acquisition of noncontrolling interests in subsidiaries | (9 | ) | (3 | ) | (12 | ) | ||||||||||||||||||||||||||||
Comprehensive (loss) income, net of income taxes | (20 | ) | (2 | ) | 1 | (21 | ) | |||||||||||||||||||||||||||
Balance as of December 31, 2014 | 136 | $ | 14 | $ | 805 | $ | (22 | ) | $ | (15 | ) | 3 | $ | — | $ | 2 | $ | 784 | ||||||||||||||||
Opening retained earnings adjustment | (45 | ) | (45 | ) | ||||||||||||||||||||||||||||||
Stock-based compensation expense | 18 | 18 | ||||||||||||||||||||||||||||||||
Dividend declared | (133 | ) | (133 | ) | ||||||||||||||||||||||||||||||
Common stock repurchased | (13 | ) | (19 | ) | 2 | (32 | ) | |||||||||||||||||||||||||||
Shares repurchased for tax withholdings for vested stock awards | (5 | ) | (5 | ) | ||||||||||||||||||||||||||||||
Distribution to partners of noncontrolling interest of subsidiaries | (1 | ) | (1 | ) | ||||||||||||||||||||||||||||||
Other | 1 | 1 | ||||||||||||||||||||||||||||||||
Adjustment for acquisition of noncontrolling interests in subsidiaries | (4 | ) | (4 | ) | ||||||||||||||||||||||||||||||
Comprehensive (loss) income, net of income taxes | (12 | ) | 68 | 1 | 57 | |||||||||||||||||||||||||||||
Balance as of December 31, 2015 | 136 | $ | 14 | $ | 801 | $ | (34 | ) | $ | (143 | ) | 5 | $ | — | $ | 2 | $ | 640 | ||||||||||||||||
Stock-based compensation expense | 16 | 16 | ||||||||||||||||||||||||||||||||
Dividend declared | (132 | ) | (132 | ) | ||||||||||||||||||||||||||||||
Common stock repurchased | (6 | ) | (11 | ) | 1 | (1 | ) | (18 | ) | |||||||||||||||||||||||||
Shares repurchased for tax withholdings for vested stock awards | (4 | ) | (4 | ) | ||||||||||||||||||||||||||||||
Exchange of China equity investments | (2 | ) | (2 | ) | ||||||||||||||||||||||||||||||
Other | 1 | 1 | ||||||||||||||||||||||||||||||||
Comprehensive loss, net of income taxes | (28 | ) | (4 | ) | — | (32 | ) | |||||||||||||||||||||||||||
Balance as of December 31, 2016 | 136 | $ | 14 | $ | 807 | $ | (62 | ) | $ | (289 | ) | 6 | $ | (1 | ) | $ | — | $ | 469 | |||||||||||||||
The accompanying notes are an integral part of the consolidated financial statements.
69
COVANTA HOLDING CORPORATION AND SUBSIDIARIES
NOTES TO CONSOLIDATED FINANCIAL STATEMENTS
NOTE 1. ORGANIZATION AND SUMMARY OF SIGNIFICANT ACCOUNTING POLICIES
The terms “we,” “our,” “ours,” “us” and “Company” refer to Covanta Holding Corporation and its subsidiaries; the term “Covanta Energy” refers to our subsidiary Covanta Energy, LLC and its subsidiaries.
Organization
Covanta is one of the world’s largest owners and operators of infrastructure for the conversion of waste to energy (known as “energy-from-waste” or “EfW”), and also owns and operates related waste transport and disposal and other renewable energy production businesses. EfW serves two key markets as both a sustainable waste management solution that is environmentally superior to landfilling and as a source of clean energy that reduces overall greenhouse gas emissions and is considered renewable under the laws of many states and under federal law. Our facilities are critical infrastructure assets that allow our customers, which are principally municipal entities, to provide an essential public service.
Our EfW facilities earn revenue from both the disposal of waste and the generation of electricity and/or steam, generally under contracts, as well as from the sale of metal recovered during the EfW process. We process approximately 20 million tons of solid waste annually. We operate and/or have ownership positions in 42 energy-from-waste facilities, which are primarily located in North America, and 5 additional energy generation facilities, including other renewable energy production facilities in North America (wood biomass and hydroelectric). In total, these assets produce approximately 10 million megawatt hours (“MWh”) of baseload electricity annually. We also operate a waste management infrastructure that is complementary to our core EfW business.
We have one reportable segment, North America, which is comprised of waste and energy services operations located primarily in the United States and Canada. We are currently constructing an EfW facility in Dublin, Ireland, which we own and will operate upon completion. We hold interests in an energy-from-waste facility in Italy and an infrastructure business in China which is engaged in energy-from-waste operations. For additional information on our reportable segment, see Note 6. Financial Information by Business Segments.
During 2016, we divested the majority of our investments in China. For additional information see Note 4. Dispositions, Assets Held for Sale and Discontinued Operations.
Summary of Significant Accounting Policies
The financial statements and accompanying notes are prepared in accordance with accounting principles generally accepted in the United States of America ("GAAP"). The following is a description of our significant accounting policies.
Principles of Consolidation
The consolidated financial statements reflect the results of our operations, cash flows and financial position of our majority-owned or controlled subsidiaries. All intercompany accounts and transactions have been eliminated.
Equity and Cost Method Investments
Investments in unconsolidated entities over which we have significant influence are accounted for under the equity method of accounting. Investments in entities in which we do not have the ability to exert significant influence over the investees’ operating and financing activities are accounted for under the cost method of accounting. Cost-method investments are carried at historical cost unless indicators of impairment are identified. We monitor investments for other-than-temporary declines in value and make reductions when appropriate. For additional information on equity method investments, see Note 9. Equity Method Investments. For additional information on our cost method investment in China, see Note 4. Dispositions, Assets Held for Sale and Discontinued Operations.
Revenue Recognition
Our revenue is generated from the fees we earn for: waste disposal, operating energy-from-waste and independent power facilities, servicing project debt, and for waste transportation and processing; from the sale of electricity and steam; from the sale of recycled ferrous and non-ferrous metal; and from construction services. The fees charged for our services are generally defined in our service agreements and vary based on contract-specific terms. We generally recognize revenue as services are performed or products are delivered. For example, revenue typically is recognized as waste is received or processed at our facilities, metals are shipped from our sites or as kilowatts are delivered to a customer by an EfW facility or independent power production plant.
Revenue under existing fixed-price or cost-plus construction contracts is recognized using the percentage-of-completion method, measured by the cost-to-cost method. If an arrangement involves multiple deliverables, the delivered items are considered separate units of accounting if the items have value on a stand-alone basis. Amounts allocated to each element are based on its objectively determined fair value, such as the sales price for the product or service when it is sold separately or competitor prices for similar products or services.
70
COVANTA HOLDING CORPORATION AND SUBSIDIARIES
NOTES TO CONSOLIDATED FINANCIAL STATEMENTS - (Continued)
Plant Operating Expense
Plant operating expense includes facility employee costs, expense for materials and parts for facility scheduled and unscheduled maintenance and repair expense, which includes costs related to our internal maintenance team and non-facility employee costs. Plant operating expense also includes hauling and disposal expenses, fuel costs, chemicals and reagents, operating lease expense, and other facility operating related expense.
Pass Through Costs
Pass through costs are costs for which we receive a direct contractually committed reimbursement from the municipal client that sponsors an EfW project. These costs generally include utility charges, insurance premiums, ash residue transportation and disposal, and certain chemical costs. These costs are recorded net of municipal client reimbursements in our consolidated financial statements. Total pass through costs for the years ended December 31, 2016, 2015 and 2014 were $41 million, $52 million, and $59 million, respectively.
Income Taxes
Deferred income taxes are based on the difference between the financial reporting and tax basis of assets and liabilities. The deferred income tax provision represents the change during the reporting period in the deferred tax assets and deferred tax liabilities, net of the effect of acquisitions and dispositions. Deferred tax assets include tax losses and credit carryforwards and are reduced by a valuation allowance if, based on available evidence, it is more likely than not that some portion or all of the deferred tax assets will not be realized.
We file a consolidated federal income tax return for each of the periods covered by the consolidated financial statements, which include all eligible United States subsidiary companies. Foreign subsidiaries are taxed according to regulations existing in the countries in which they do business. Our federal consolidated income tax return also includes the taxable results of certain grantor trusts, which are excluded from our consolidated financial statements; however, certain related tax attributes are recorded in our consolidated financial statements since they are part of our federal tax return. For additional information, see Note 15. Income Taxes.
Stock-Based Compensation
Stock-based compensation for share-based awards to employees is accounted for as compensation expense based on their grant date fair values. For additional information, see Note 17. Stock-Based Award Plans.
Cash and Cash Equivalents
Cash and cash equivalents include all cash balances and highly liquid investments having maturities of three months or less from the date of purchase. These short-term investments are stated at cost, which approximates fair value. Balances held by our international subsidiaries are not generally available for near-term liquidity in our domestic operations.
Accounts Receivable and Allowance for Doubtful Accounts
Accounts receivable consist of amounts due to us from normal business activities. Allowances for doubtful accounts are the estimated losses from the inability of customers to make required payments. We use historical experience, as well as current market information, in determining the estimate.
Restricted Funds Held in Trust
Restricted funds held in trust are primarily amounts received and held by third party trustees relating to certain projects we own. We generally do not control these accounts and these funds may be used only for specified purposes. These funds include debt service reserves for payment of principal and interest on project debt. Revenue funds are comprised of deposits of revenue received with respect to projects prior to their disbursement. Other funds include escrowed debt proceeds, amounts held in trust for operations, maintenance, environmental obligations, operating lease reserves in accordance with agreements with our clients, and amounts held for future scheduled distributions. Such funds are invested principally in money market funds, bank deposits and certificates of deposit, United States treasury bills and notes, United States government agency securities, and high-quality municipal bonds.
71
COVANTA HOLDING CORPORATION AND SUBSIDIARIES
NOTES TO CONSOLIDATED FINANCIAL STATEMENTS - (Continued)
Restricted fund balances are as follows (in millions):
As of December 31, | ||||||||||||||||
2016 | 2015 | |||||||||||||||
Current | Noncurrent | Current | Noncurrent | |||||||||||||
Debt service funds - principal | $ | 10 | $ | 7 | $ | 9 | $ | 8 | ||||||||
Debt service funds - interest | 1 | — | 1 | — | ||||||||||||
Total debt service funds | 11 | 7 | 10 | 8 | ||||||||||||
Revenue funds | 3 | — | 4 | — | ||||||||||||
Other funds | 42 | 47 | 63 | 75 | ||||||||||||
Total | $ | 56 | $ | 54 | $ | 77 | $ | 83 | ||||||||
Deferred Revenue
Deferred revenue included in Accrued expenses and other current liabilities on our consolidated balance sheet consisted of the following (in millions):
As of December 31, | ||||||||
2016 | 2015 | |||||||
Advance billings to municipalities | $ | 5 | $ | 6 | ||||
Other | 11 | 7 | ||||||
Total | $ | 16 | $ | 13 | ||||
Advance billings to certain customers are billed one or two months prior to performance of service and are recognized as income in the period the service is provided.
Property, Plant and Equipment
Property, plant, and equipment acquired in business acquisitions is recorded at our estimate of fair value on the date of the acquisition. Additions, improvements and major expenditures are capitalized if they increase the original capacity or extend the remaining useful life of the original asset more than one year. Maintenance repairs and minor expenditures are expensed in the period incurred. Depreciation is computed using the straight-line method over the estimated useful lives of the assets, which generally range from three years for computer equipment to 50 years for certain infrastructure components of energy-from-waste facilities. Property, plant and equipment at our service fee operated facilities are not recognized on our balance sheet due to the adoption of the service concession arrangements guidance described in greater detail within the Accounting Pronouncements Recently Adopted discussion below. Any additions, improvements and major expenditures for which we are responsible at our service fee operated facilities are expensed in the period incurred. Our leasehold improvements are depreciated over the life of the lease term or the asset life, whichever is shorter. Upon retirement or disposal of assets, the cost and related accumulated depreciation are removed from the consolidated balance sheets and any gain or loss is reflected in the consolidated statements of operations.
Property, plant and equipment consisted of the following (in millions):
As of December 31, | ||||||||
2016 | 2015 | |||||||
Land | $ | 29 | $ | 22 | ||||
Facilities and equipment | 4,188 | 3,885 | ||||||
Landfills (primarily for ash disposal) | 63 | 64 | ||||||
Construction in progress | 433 | 266 | ||||||
Total | 4,713 | 4,237 | ||||||
Less: accumulated depreciation and amortization | (1,689 | ) | (1,547 | ) | ||||
Property, plant, and equipment — net | $ | 3,024 | $ | 2,690 | ||||
Depreciation and amortization expense related to property, plant and equipment was $185 million, $177 million, and $191 million, for the years ended December 31, 2016, 2015 and 2014, respectively. Non-cash investing activities related to capital expenditures for growth projects totaled $41 million and $26 million as of December 31, 2016 and 2015, respectively and were recorded in accrued expenses and other current liabilities on our consolidated balance sheet.
Property, plant and equipment is evaluated for impairment whenever events or changes in circumstances indicate their carrying value may not be recoverable over their estimated useful life. In reviewing for recoverability, we compare the carrying amount of
72
COVANTA HOLDING CORPORATION AND SUBSIDIARIES
NOTES TO CONSOLIDATED FINANCIAL STATEMENTS - (Continued)
the relevant assets to their estimated undiscounted future cash flows. When the estimated undiscounted future cash flows are less than the assets carrying amount, the carrying amount is compared to the assets fair value. If the assets fair value is less than the carrying amount an impairment charge is recognized to reduce the assets carrying amount to its fair value. For additional information, see Note 14. Supplementary Information - Impairment Charges.
Asset Retirement Obligations
We recognize a liability for asset retirement obligations when it is incurred, which is generally upon acquisition, construction, or development. Our liabilities include closure and post-closure costs for landfill cells and site restoration for certain energy-from-waste and power producing sites. We principally determine the liability using internal estimates of the costs using current information, assumptions, and interest rates, but also use independent appraisals as appropriate to estimate costs. When a new liability for asset retirement obligation is recorded, we capitalize the cost of the liability by increasing the carrying amount of the related long-lived asset. The liability is accreted to its present value each period and the capitalized cost is depreciated over the useful life of the related asset. We recognize period-to-period changes in the liability resulting from revisions to the timing or the amount of the original estimate of the undiscounted cash flows.
Current and noncurrent asset retirement obligations are included in Accrued expenses and other current liabilities and Other liabilities, respectively, on our consolidated balance sheet. Our asset retirement obligation is presented as follows (in millions):
As of December 31, | ||||||||
2016 | 2015 | |||||||
Beginning of period asset retirement obligation | $ | 30 | $ | 28 | ||||
Accretion expense | 2 | 2 | ||||||
Net change (1) | (7 | ) | — | |||||
End of period asset retirement obligation | 25 | 30 | ||||||
Less: current portion | — | (3 | ) | |||||
Noncurrent asset retirement obligation | $ | 25 | $ | 27 | ||||
(1) | Comprised primarily of expenditures and settlements of the asset retirement obligation liability, net revisions based on current estimates of the liability and revised expected cash flows and life of the liability. |
Intangible Assets and Liabilities
Our waste, service and energy contracts are intangible assets related to long-term operating contracts at acquired facilities. These intangible assets and liabilities, as well as lease interest and other finite and indefinite-lived intangible assets, are recorded at their estimated fair market values upon acquisition based primarily upon discounted cash flows in accordance with accounting standards related to business combinations. See Note 7. Amortization of Waste, Service and Energy Contracts and Note 8. Other Intangible Assets and Goodwill.
Intangible assets with finite lives are evaluated for impairment whenever events or changes in circumstances indicate their carrying value may not be recoverable over their estimated useful life. In reviewing for recoverability, we compare the carrying amount of the relevant assets to their estimated undiscounted future cash flows. When the estimated undiscounted future cash flows are less than the assets carrying amount, the carrying amount is compared to the assets fair value. If the assets fair value is less than the carrying amount an impairment charge is recognized to reduce the assets carrying amount to its fair value. As of December 31, 2016, there were no indicators of impairment identified.
Goodwill
Goodwill is the excess of our purchase cost over the fair value of the net assets of acquired businesses. We do not amortize goodwill, but we assess our goodwill for impairment at least annually. We assess whether a goodwill impairment exists using both qualitative and quantitative assessments. When we elect to perform a qualitative assessment, it involves determining whether events or circumstances exist that indicate it is more likely than not that the fair value of a reporting unit is less than its carrying amount, including goodwill. If based on this qualitative assessment we determine it is more likely than not that the fair value of a reporting unit is less than its carrying amount, or if we did not elect to perform the qualitative assessment we will perform a quantitative assessment.
A quantitative assessment of goodwill requires a comparison of the estimated fair value of the reporting unit to which the goodwill has been assigned to its carrying value. All goodwill is related to the North America reportable segment, which is comprised of two reporting units. A reporting unit is defined as an operating segment or a component of an operating segment to the extent discrete financial information is available that is reviewed by segment management. If the carrying value of the reporting unit exceeds the fair value, the reporting unit’s goodwill is compared to its implied value of goodwill. If the carrying value of the
73
COVANTA HOLDING CORPORATION AND SUBSIDIARIES
NOTES TO CONSOLIDATED FINANCIAL STATEMENTS - (Continued)
reporting unit’s goodwill exceeds the implied value, an impairment charge is recognized to reduce the carrying value to the implied value.
There were no impairment charges recognized related to our evaluation of goodwill for the years ended December 31, 2016, 2015 and 2014.
Business Combinations
We recognize the assets acquired and liabilities assumed in a business combination at fair value including any noncontrolling interest of the acquired entity; recognize any goodwill acquired; establish the acquisition-date fair value based on the highest and best use by market participants for the asset as the measurement objective; and disclose information needed to evaluate and understand the nature and financial effect of the business combination. We expense transaction costs directly associated to the acquisition as incurred; capitalize in-process research and development costs, if any; and record a liability for contingent consideration at the measurement date with subsequent remeasurement recognized in the results of operations. Any costs for business restructuring and exit activities related to the acquired company are included in the post-combination results of operations. Tax adjustments related to previously recorded business combinations, if any, are recognized in the results of operations.
Accumulated Other Comprehensive Income ("AOCI")
AOCI, in the consolidated statements of equity, includes unrealized gains and losses excluded from the consolidated statements of operations. These unrealized gains and losses consisted of the following (in millions):
As of December 31, | ||||||||
2016 | 2015 | |||||||
Foreign currency translation | $ | (41 | ) | $ | (34 | ) | ||
Pension and other postretirement plan unrecognized net gain | 2 | 2 | ||||||
Net unrealized loss on derivatives | (23 | ) | (2 | ) | ||||
Accumulated other comprehensive loss | $ | (62 | ) | $ | (34 | ) | ||
The changes in accumulated other comprehensive (loss) income are as follows (in millions):
Foreign Currency Translation | Pension and Other Postretirement Plan Unrecognized Net Gain | Net Unrealized Loss on Derivatives | Total | ||||||||||||
Balance December 31, 2014 | $ | (12 | ) | $ | 2 | $ | (12 | ) | $ | (22 | ) | ||||
Other comprehensive (loss) income before reclassifications | (22 | ) | — | 10 | (12 | ) | |||||||||
Amounts reclassified from accumulated other comprehensive loss | — | — | — | — | |||||||||||
Net current period comprehensive (loss) income | (22 | ) | — | 10 | (12 | ) | |||||||||
Balance December 31, 2015 | $ | (34 | ) | $ | 2 | $ | (2 | ) | $ | (34 | ) | ||||
Other comprehensive loss before reclassifications | (2 | ) | — | (21 | ) | (23 | ) | ||||||||
Amounts reclassified from accumulated other comprehensive loss | (5 | ) | — | — | (5 | ) | |||||||||
Net current period comprehensive loss | (7 | ) | — | (21 | ) | (28 | ) | ||||||||
Balance December 31, 2016 | $ | (41 | ) | $ | 2 | $ | (23 | ) | $ | (62 | ) | ||||
74
COVANTA HOLDING CORPORATION AND SUBSIDIARIES
NOTES TO CONSOLIDATED FINANCIAL STATEMENTS - (Continued)
Amount Reclassified from Accumulated Other Comprehensive Income | ||||||
Accumulated Other Comprehensive Income Component | Year Ended December 31, 2016 | Affected Line Item in the Consolidated Statement of Operations | ||||
Foreign currency translation | $ | 5 | Gain on asset sales (1) | |||
5 | Total before tax | |||||
— | Tax benefit | |||||
Total reclassifications | $ | 5 | Net of tax | |||
(1) For additional information see, Note 4. Dispositions, Assets Held for Sale and Discontinued Operations.
Derivative Instruments
We recognize derivative instruments on the balance sheet at their fair value. The cash conversion option and note hedge were derivative instruments that were recorded at fair value quarterly with changes in fair value recognized in our consolidated statements of operations as non-cash convertible debt related expense. We have entered into swap agreements with various financial institutions to hedge our exposure to energy price risk and interest rate risk. Changes in the fair value of the energy derivatives and the interest rate swap are recognized as a component of AOCI. For additional information, see Note 13. Derivative Instruments.
Foreign Currency Translation
For foreign operations, assets and liabilities are translated at year-end exchange rates and revenue and expense are translated at the average exchange rates during the year. Unrealized gains and losses resulting from foreign currency translation are included in the consolidated statements of equity as a component of AOCI. Currency transaction gains and losses are recorded in other operating expense in the consolidated statements of operations.
Pension and Postretirement Benefit Obligations
Our pension and other postretirement benefit plans are accounted for based on actuarially-determined estimates. For additional information, see Note 16. Employee Benefit Plans.
Share Repurchases
Under our share repurchase program, common stock repurchases may be made, from time to time, in the open market, in privately negotiated transactions, or by other available methods, at management’s discretion and in accordance with applicable federal securities laws. The timing and amounts of any repurchases will depend on many factors, including our capital structure, the market price of our common stock and overall market conditions, and whether any restrictions then exist under our policies relating to trading in compliance with securities laws. Purchase price over par value for share repurchases are allocated to additional paid-in capital up to the weighted average amount per share recorded at the time of initial issuance of our common stock, with any excess recorded as a reduction to retained earnings. For additional information, see Note 5. Equity and Earnings Per Share ("EPS").
Use of Estimates
The preparation of financial statements requires us to make estimates and assumptions that affect the reported amounts of assets or liabilities and disclosure of contingent assets and liabilities at the date of the consolidated financial statements and the reported amounts of revenue and expense during the reporting period. Actual results could differ from those estimates. Significant estimates include: useful lives of long-lived assets, asset retirement obligations, construction expense estimates, unbilled service receivables, fair value of financial instruments, fair value of the reporting units for goodwill impairment analysis, fair value of long-lived assets for impairment analysis, renewable energy credits, stock-based compensation, purchase accounting allocations, cash flows and taxable income from future operations, deferred taxes, allowances for uncollectible receivables, and liabilities related to employee medical benefit obligations, workers’ compensation, severance and certain litigation.
Reclassifications
Certain amounts have been reclassified in our prior period consolidated balance sheet to conform to current year presentation and such amounts were not material to current and prior periods. During the year ended December 31, 2016, we concluded that it was appropriate to include Net interest expense on project debt within Interest expense, net on our consolidated statement of operations because such amounts were deemed immaterial. Previously, Net interest expense on project debt was reported separately, as a component of Operating expense. For the years ended December 31, 2015 and 2014, Net interest expense on project debt of $9 million and $10 million, respectively, was reclassified to Interest expense, net on our consolidated statement of operations and as a result, Operating income increased accordingly for those periods.
75
COVANTA HOLDING CORPORATION AND SUBSIDIARIES
NOTES TO CONSOLIDATED FINANCIAL STATEMENTS - (Continued)
Change in Estimate
Revenue under our Durham York construction contract is recognized using the percentage-of-completion method, measured by the cost-to-cost method. We evaluate the estimate of our total construction costs for the contract throughout the life of the project and make revisions to our estimated costs as necessary. During the year ended December 31, 2015, we reduced our overall profit estimate related to this construction project by $20 million. The project was completed in 2015 and no further significant construction expenses were incurred related to this project. We are currently seeking to resolve outstanding disputes with our primary contractor for the Durham-York construction project, for additional information see Note 18. Commitments and Contingencies.
Accounting Pronouncements Recently Adopted
Effective January 1, 2016, we adopted guidance concerning the presentation of debt issuance costs, which are required to be presented as a direct reduction from the carrying amount of the related debt liability. We adopted this guidance retrospectively, which resulted in a reduction in our December 31, 2015 current and non-current asset balances of $5 million and $20 million, respectively, along with a corresponding reduction in current and long-term debt balances. The December 31, 2015 balance sheet includes certain costs for Dublin project financing within current assets for debt that has not yet been drawn down. For additional information, see Note 11. Consolidated Debt.
Effective January 1, 2015, we were required to adopt guidance concerning service concession arrangements. The amendment applies to an operating entity of a service concession arrangement entered into with a public-sector entity grantor when the arrangement meets certain conditions. The amendments specify that such an arrangement may not be accounted for as a lease nor should the infrastructure used in a service concession arrangement be recognized as property, plant and equipment by the operating entity. Instead, the operating entity should refer to other guidance to account for the arrangement, such as Topic 605 of the Accounting Standard Codification - Revenue Recognition. We adopted this guidance using a modified retrospective approach which requires the cumulative effect of applying this guidance to arrangements existing at the beginning of the period of adoption be recognized as an adjustment to retained earnings. As a result, accumulated deficit as of January 1, 2015 as originally reported of $15 million increased by $45 million ($75 million reduction of property, plant and equipment, net of tax of $30 million) to $60 million.
The adoption of this guidance had the following effect on our consolidated statement of operations for the year ended December 31, 2015 (in millions, except per share amounts):
Increase (Decrease) | ||||
Plant operating expense | $ | 31 | ||
Depreciation and amortization | $ | (22 | ) | |
Income tax expense | $ | (4 | ) | |
Net income attributable to Covanta Holding Corporation | $ | (5 | ) | |
Basic and Diluted income per share | $ | (0.04 | ) | |
Effective December 31, 2015, we early adopted the guidance, on a prospective basis, concerning simplified presentation of deferred income taxes by requiring that deferred tax assets and liabilities be classified as non-current in the statement of financial position. Adoption of this guidance resulted in reclassification of our net current deferred tax asset of $67 million to the net non-current deferred tax asset in our consolidated balance sheet as of December 31, 2015.
NOTE 2. RECENT ACCOUNTING PRONOUNCEMENTS
In January of 2017, the Financial Accounting Standards Board ("FASB") issued guidance clarifying the definition of a business to assist entities when determining whether an integrated set of assets and activities meets the definition of a business. The update provides that when substantially all the fair value of the assets acquired is concentrated in a single identifiable asset or a group of similar identifiable assets, the set is not a business. The guidance is effective for fiscal years beginning after December 15, 2017, including interim periods within those fiscal years. The adoption of this new guidance is not expected to have a material impact on our consolidated financial statements.
In January of 2017, the FASB issued updated guidance to eliminate the requirement to calculate the implied fair value of goodwill to measure a goodwill impairment charge (Step 2). As a result, an impairment charge will equal the amount by which a reporting unit’s carrying amount exceeds its fair value, not to exceed the amount of goodwill allocated to the reporting unit. An entity still has the option to perform the qualitative assessment for a reporting unit to determine if the quantitative impairment test is necessary. The amendment should be applied on a prospective basis. The guidance is effective for goodwill impairment tests in fiscal years beginning after December 15, 2019. Early adoption is permitted for goodwill impairment tests performed after January 1, 2017. The impact of this guidance for the Company will depend on the outcomes of future goodwill impairment tests.
76
COVANTA HOLDING CORPORATION AND SUBSIDIARIES
NOTES TO CONSOLIDATED FINANCIAL STATEMENTS - (Continued)
In November of 2016, the FASB issued guidance requiring that a statement of cash flows explain the change during the period in the total of cash, cash equivalents, and amounts generally described as restricted cash or restricted cash equivalents. The guidance is required to be adopted in the first quarter of 2018 on a retrospective basis. Adoption of this guidance will eliminate the disclosure of Change in restricted funds held in trust, which we currently include in Net cash provided by operating and Net cash provided by financing activities on our consolidated statement of cash flows.
In October 2016, the FASB issued guidance requiring comprehensive recognition of current and deferred income taxes on intra-entity asset transfers other than inventory, which was previously prohibited. The guidance now requires us to recognize the tax expense from the intra-entity transfer of an asset when the transfer occurs, even though the pre-tax effects of that transaction are eliminated in consolidation. We are required to adopt this guidance in the first quarter of 2018 on a modified retrospective basis through a cumulative-effect adjustment to retained earnings as of the beginning of the period of adoption. Early adoption is permitted. We are currently evaluating the impact this guidance will have on our consolidated financial statements.
In August 2016, the FASB issued updated guidance on eight specific cash flow issues with regard to how cash receipts and cash payments are presented and classified in the statement of cash flows in order to clarify existing guidance and reduce diversity in practice. The guidance is required to be adopted in the first quarter of 2018 on a retrospective basis, unless it is impracticable to apply, in which case it should be applied prospectively as of the earliest date practicable. Early adoption is permitted. We are currently evaluating the impact this guidance will have on our consolidated statement of cash flows.
In March 2016, the FASB issued amended guidance relating to employee share-based compensation. Under the new guidance we are required to recognize the tax effects of stock compensation as income tax expense or benefit in the income statement and treat the tax effects of exercised or vested awards as discrete items in the reporting period in which they occur. Excess tax benefits are required to be classified as operating activities, and shares we withhold on behalf of employees for tax purposes are required to be classified as financing activities. We may make an accounting policy election to continue to estimate the number of awards that are expected to vest or account for forfeitures when they occur. The threshold to qualify for equity classification permits withholding up to the maximum statutory tax rates. This guidance is required to be adopted in the first quarter of 2017. We are currently evaluating the impact this guidance will have on our consolidated financial statements.
In February 2016, the FASB issued amended guidance for lease arrangements in order to increase transparency and comparability by providing additional information to users of financial statements regarding an entity's leasing activities. The revised guidance seeks to achieve this objective by requiring reporting entities to recognize lease assets and lease liabilities on the balance sheet for substantially all lease arrangements. The guidance, which is required to be adopted in the first quarter of 2019, will be applied on a modified retrospective basis beginning with the earliest period presented. Early adoption is permitted. We are currently evaluating the impact of adopting this guidance on our consolidated financial statements.
In January 2016, the FASB issued accounting guidance that would require equity investments not accounted for as an equity method investment or that result in consolidation to be recorded at their fair value with changes in fair value recognized in our consolidated statements of operations. Those equity investments that do not have a readily determinable fair value may be measured at cost less impairment, if any, plus or minus changes resulting from observable price changes. This standard is required to be adopted in the first quarter of 2018, with early adoption prohibited. We are currently evaluating the impact this guidance will have on our consolidated financial statements and related disclosures.
In May 2014, the FASB issued Accounting Standards update 2014-09, “Revenue from Contracts with Customers.” The standard is based on the principle that revenue is recognized in an amount expected to be collected and to which the entity expects to be entitled in exchange for the transfer of goods or services. In addition, the standard requires disclosure of the nature, amount, timing, and certainty of revenue arising from contracts with customers. In August 2015, the FASB deferred the effective date by one year to January 1, 2018, while providing the option to early adopt the standard on the original effective date of January 1, 2017. Covanta will adopt the standard on January 1, 2018, as required. The standard can be adopted either retrospectively or as a cumulative-effect adjustment as of the date of adoption. We are currently determining the impacts of the standard on our consolidated financial statements and are evaluating the options with respect to our transition method. Our implementation approach includes performing a detailed review of key contracts representative of the services that we provide and assessing the conformance of historical accounting policies and practices with the standard. Because the standard may impact our business processes, systems and controls, we have initiated the development of a comprehensive change management project plan to guide the implementation.
NOTE 3. NEW BUSINESS AND ASSET MANAGEMENT
The acquisitions in the section below are not material to our consolidated financial statements individually or in the aggregate and therefore, disclosures of pro forma financial information have not been presented. The results of operations reflect the period of ownership of the acquired businesses, business development projects and dispositions.
77
COVANTA HOLDING CORPORATION AND SUBSIDIARIES
NOTES TO CONSOLIDATED FINANCIAL STATEMENTS - (Continued)
Environmental Services Acquisitions
During 2016, we acquired two environmental services business, in separate transactions, for a total of $9 million. During 2015, we acquired four environmental services businesses (one of which was accounted for as an asset purchase), in separate transactions, for a total of $69 million. During 2014, we acquired one environmental services business for $13 million.
These acquisitions expand our Covanta Environmental Solutions capabilities and client service offerings, and allow us to direct additional non-hazardous profiled waste volumes into our EfW facilities, and therefore are highly synergistic with our existing business.
Pittsfield EfW Facility
In March 2016, we exercised an early termination option available under the steam sale agreement at our Pittsfield EfW facility that would have been effective in March 2017. Upon termination of the steam agreement, we intended to cease operations at the Pittsfield facility. As a result, during the first quarter of 2016, we recorded a non-cash impairment charge of $13 million, pre-tax, which was calculated based on the estimated cash flows for this facility during its remaining operations utilizing Level 3 inputs. For more information regarding fair value measurements, see Note 12. Financial Instruments.
In October 2016, we withdrew our termination notice. The City of Pittsfield has agreed to fund certain upgrades to the facility and the State of Massachusetts will provide energy tax credits, both of which will serve to improve the economics of the facility. In addition, we will continue to sell steam generated by the facility under an amended agreement.
Dublin EfW Facility
In 2014, we entered into agreements to build, own and operate the Dublin EfW facility, a 600,000 metric ton-per-year, 58 megawatt facility in Dublin, Ireland. The project will source residential, commercial and profiled waste from Dublin and the surrounding areas and will sell electricity into the local electricity grid, with over 50% of the facility’s generation expected to qualify for preferential pricing under Ireland’s renewable feed-in tariff. We commenced construction of the facility in the fourth quarter of 2014, with operational commencement expected in late-2017. We will operate the facility under a 45-year public-private-partnership, after which ownership of the facility will transfer to the City of Dublin. Our total investment in the project is expected to be approximately €500 million, funded by project equity (approximately €125 million) and third party non-recourse project financing (€375 million). For additional information related to funding for this project, see Note 11. Consolidated Debt - Dublin Project Financing.
New York City Waste Transport and Disposal Contract
In 2013, New York City's Department of Sanitation awarded us a contract to handle waste transport and disposal from two marine transfer stations located in Queens and Manhattan. We are utilizing capacity at existing facilities for the disposal of an estimated 800,000 tons per year of municipal solid waste. Service for the Queens marine transfer station began in early 2015, with service for the Manhattan marine transfer station expected to follow pending notice to proceed to be issued by New York City, which is anticipated in 2018. The contract is for 20 years, effective from the commencement of operations at the Queens marine transfer station in March 2015, with options for New York City to extend the term for two additional five-year periods, and requires waste to be transported using a multi-modal approach. We have acquired equipment, including barges, railcars, containers, and intermodal equipment to support this contract. We expect that our total initial investment will be approximately $150 million, including the cost to acquire equipment of approximately $114 million and approximately $36 million of enhancements to existing facilities that will be part of the network of assets supporting this contract. During the years ended December 31, 2016, 2015 and 2014, we invested $3 million, $31 million and $59 million, respectively, in property, plant and equipment relating to this contract. Since 2013, we have invested a total of $115 million in property, plant and equipment relating to this contract.
Pinellas County Energy-from-Waste Facility
In 2014, we entered into a ten-year service fee contract to operate an existing 3,150 ton-per-day energy-from-waste facility located in Pinellas County, Florida, and we assumed operations of the facility in December of 2014. In addition to the annual service fee, during the initial few years of the contract we will complete a number of projects to improve operations of the facility. Our client will pay for these projects, for which we will record construction revenue and expense.
Durham-York Energy-from-Waste Facility
During 2011, we began construction of a municipally-owned 140,000 metric ton-per-year greenfield EfW facility located in Durham Region of Canada and owned by our municipal clients, the Durham and York Regions. We built the facility under the terms of a fixed-price construction contract totaling C$250 million. The project entered commercial operations in January 2016 under a 20-year service fee contract. We are currently seeking to resolve outstanding disputes with our primary contractor for the Durham-York construction project, for additional information see Note 18. Commitments and Contingencies.
78
COVANTA HOLDING CORPORATION AND SUBSIDIARIES
NOTES TO CONSOLIDATED FINANCIAL STATEMENTS - (Continued)
NOTE 4. DISPOSITIONS, ASSETS HELD FOR SALE AND DISCONTINUED OPERATIONS
Dispositions
China Investments
Our interests in China included an 85% ownership of an EfW facility located in Jiangsu Province ("Taixing"), a 49% equity interest in an EfW facility located in Sichuan Province and a 40% equity interest in Chongqing Sanfeng Covanta Environmental Industry Co., a company located in the Chongqing Municipality that is engaged in the business of providing design and engineering, procurement, construction services and equipment sales for EfW facilities in China, as well as operating services for EfW facilities. During 2016, we completed the exchange of our project ownership interests in China for a 15% ownership interest in Chongqing Sanfeng Environmental Industrial Group, Co., Ltd ("Sanfeng Environment") and subsequently sold approximately 90% of that interest to a third-party, a subsidiary of CITIC Limited, a leading Chinese industrial conglomerate and investment company. As a result, during the year ended December 31, 2016, we recorded a pre-tax gain of $41 million. We received pre-tax proceeds of $105 million. The gain resulted from the excess of pre-tax proceeds over the cost-method book value of $70 million, plus $5 million of realized gains on the related cumulative foreign currency translation adjustment, that were reclassified out of other comprehensive income. Subsequent to completing the exchange, Sanfeng Environment has made certain claims for indemnification under the agreement related to the condition of the facility in Taixing. To the extent that any payment is made related to these claims, such amount could reduce the gain as recorded in a future period.
In connection with these transactions, we entered into foreign currency exchange collars and forwards to hedge against rate fluctuations that impacted the cash proceeds in U.S. dollar terms. For more information, see Note 13. Derivative Instruments.
As of December 31, 2016, our remaining cost-method investment in Sanfeng Environment totaled $7 million and was included in our consolidated balance sheet as a component of "Other assets". There were no impairment indicators related to our cost-method investment during the year ended December 31, 2016.
Insurance Business
During 2014, we sold our insurance subsidiary and recorded a non-cash impairment charge of $14 million comprised of the write-down of the carrying amount in excess of the realizable fair value of $12 million, plus $2 million in disposal costs.
Assets Held for Sale Summary
During the second quarter of 2015, we determined that the assets and liabilities associated with our interests in China met the criteria for classification as Assets Held for Sale, but did not meet the criteria for classification as Discontinued Operations. In making this determination, we evaluated our consolidated subsidiary, Taixing, as well as our Sanfeng and Chengdu equity method investments as a single disposal group under the applicable accounting guidance.
The assets and liabilities associated with our China investments are presented in our consolidated balance sheets as current "Assets Held for Sale” and current "Liabilities Held for Sale.” The following table sets forth the assets and liabilities of the Assets Held for Sale included in the consolidated balance sheets as of the dates indicated (in millions):
As of December 31, | ||||||||
2016 | 2015 | |||||||
Cash and cash equivalents | $ | — | $ | 2 | ||||
Receivables | — | 3 | ||||||
Prepaid expenses and other current assets | — | 1 | ||||||
Property, plant and equipment, net | — | 49 | ||||||
Other noncurrent assets | — | 42 | ||||||
Assets held for sale | $ | — | $ | 97 | ||||
Current portion of project debt | $ | — | $ | 3 | ||||
Accounts payable | — | 3 | ||||||
Accrued expenses and other current liabilities | — | 5 | ||||||
Project debt | — | 12 | ||||||
Liabilities held for sale | $ | — | $ | 23 | ||||
79
COVANTA HOLDING CORPORATION AND SUBSIDIARIES
NOTES TO CONSOLIDATED FINANCIAL STATEMENTS - (Continued)
Discontinued Operations Summary
During the fourth quarter of 2013, assets related to our development activities in the United Kingdom met the criteria to be presented in discontinued operations. The results of operations of these businesses for the year ended December 31, 2014 was comprised of Other operating revenue of $1 million and Other operating expense of $1 million. The cash flows of these businesses for the year ended December 31, 2014 were presented separately in our consolidated statements of cash flows.
NOTE 5. EQUITY AND EARNINGS PER SHARE ("EPS")
Equity
In May 2014, the stockholders of the Company approved the Covanta Holding Corporation 2014 Equity Award Plan. For additional information, see Note 17. Stock-Based Award Plans.
During the year ended December 31, 2016, we granted awards of 761,426 shares of restricted stock, 888,144 of restricted stock units and withheld 210,438 shares of our common stock in connection with tax withholdings for vested stock awards. For information related to stock-based award plans, see Note 17. Stock-Based Award Plans.
During the years ended December 31, 2016, 2015 and 2014 common shares repurchased and dividends declared were as follows (in millions, except per share amounts):
For the Years Ended December 31, | |||||||||||
2016 | 2015 | 2014 | |||||||||
Total repurchases | $ | 18 | $ | 32 | $ | — | |||||
Shares repurchased | 1.2 | 2.1 | — | ||||||||
Weighted average cost per share | $ | 15.29 | $ | 15.33 | $ | — | |||||
Dividends declared | $ | 132 | $ | 133 | $ | 114 | |||||
Per share | $ | 1.00 | $ | 1.00 | $ | 0.86 | |||||
As of December 31, 2016, there were 136 million shares of common stock issued of which 130 million shares were outstanding; the remaining 6 million shares of common stock issued but not outstanding were held as treasury stock. As of December 31, 2016, there were 4 million shares of common stock available for future issuance under equity plans.
As of December 31, 2016, there were 10 million shares of preferred stock authorized, with none issued or outstanding. The preferred stock may be divided into a number of series as defined by our Board of Directors. The Board of Directors are authorized to fix the rights, powers, preferences, privileges and restrictions granted to and imposed upon the preferred stock upon issuance.
Earnings Per Share
We calculate basic earnings per share ("EPS") using net earnings for the period and the weighted average number of outstanding shares of our common stock, par value $0.10 per share, during the period. Basic weighted average shares outstanding have decreased due to share repurchases. Diluted earnings per share computations, as calculated under the treasury stock method, include the weighted average number of shares of additional outstanding common stock issuable for stock options, restricted stock awards and restricted stock units whether or not currently exercisable. Diluted earnings per share does not include securities if their effect was anti-dilutive. Basic and diluted weighted average shares outstanding were as follows (in millions):
For the Years Ended December 31, | ||||||||
2016 | 2015 | 2014 | ||||||
Basic weighted average common shares outstanding | 129 | 132 | 130 | |||||
Dilutive effect of restricted stock and restricted stock units (1) | — | 1 | — | |||||
Diluted weighted average common shares outstanding | 129 | 133 | 130 | |||||
(1) Excludes the following securities because their inclusion would have been anti-dilutive (in millions):
80
COVANTA HOLDING CORPORATION AND SUBSIDIARIES
NOTES TO CONSOLIDATED FINANCIAL STATEMENTS - (Continued)
For the Years Ended December 31, | ||||||||
2016 | 2015 | 2014 | ||||||
Stock options | 1 | 1 | 1 | |||||
Restricted stock | 1 | — | 1 | |||||
Restricted stock units | 1 | — | — | |||||
Warrants | — | — | 25 | |||||
In 2009, we issued warrants in connection with the issuance of 3.25% Cash Convertible Senior Notes that matured on June 1, 2014. The warrants were exercisable only at expiration in equal tranches over a 60 day period that began on September 2, 2014 and ended on November 26, 2014. The warrants were net share settled, which means that, with respect to any exercise date, we delivered to the warrant holders a number of shares for each warrant equal to the excess of the volume-weighted average price of our common stock on each exercise date over the then effective strike price of the warrants, divided by such volume-weighted average price of our common stock, with a cash payment in lieu of fractional shares. During the year ended December 31, 2014, 1,430,870 shares of our common stock were issued in connection with warrant exercises. For additional information see Note 11. Consolidated Debt - 3.25% Cash Convertible Senior Notes due 2014.
81
COVANTA HOLDING CORPORATION AND SUBSIDIARIES
NOTES TO CONSOLIDATED FINANCIAL STATEMENTS - (Continued)
NOTE 6. FINANCIAL INFORMATION BY BUSINESS SEGMENTS
We have one reportable segment, North America, which is comprised of waste and energy services operations located primarily in the United States and Canada. The results of our reportable segment are as follows (in millions):
North America | All Other (1) | Total | |||||||||
Year Ended December 31, 2016: | |||||||||||
Operating revenue | $ | 1,692 | $ | 7 | $ | 1,699 | |||||
Depreciation and amortization expense | $ | 207 | $ | — | $ | 207 | |||||
Impairment charges | $ | 20 | $ | — | $ | 20 | |||||
Operating income (loss) | $ | 116 | $ | (7 | ) | $ | 109 | ||||
Interest expense, net | $ | 66 | $ | 72 | $ | 138 | |||||
Gain on asset sales | $ | 3 | $ | 41 | $ | 44 | |||||
Equity in net income from unconsolidated investments | $ | 1 | $ | 3 | $ | 4 | |||||
As of December 31, 2016: | |||||||||||
Total assets | $ | 3,794 | $ | 490 | $ | 4,284 | |||||
Capital additions | $ | 188 | $ | 171 | $ | 359 | |||||
Year Ended December 31, 2015: | |||||||||||
Operating revenue | $ | 1,607 | $ | 38 | $ | 1,645 | |||||
Depreciation and amortization expense | $ | 197 | $ | 1 | $ | 198 | |||||
Impairment charges | $ | 43 | $ | — | $ | 43 | |||||
Operating income | $ | 108 | $ | 1 | $ | 109 | |||||
Interest expense, net | $ | 60 | $ | 74 | $ | 134 | |||||
Equity in net income from unconsolidated investments | $ | — | $ | 13 | $ | 13 | |||||
As of December 31, 2015: | |||||||||||
Total assets | $ | 3,838 | $ | 396 | $ | 4,234 | |||||
Capital additions | $ | 175 | $ | 201 | $ | 376 | |||||
Year Ended December 31, 2014: | |||||||||||
Operating revenue | $ | 1,641 | $ | 41 | $ | 1,682 | |||||
Depreciation and amortization expense | $ | 208 | $ | 3 | $ | 211 | |||||
Impairment charges | $ | 50 | $ | 14 | $ | 64 | |||||
Operating income (loss) | $ | 168 | $ | (14 | ) | $ | 154 | ||||
Interest expense, net | $ | 63 | $ | 84 | $ | 147 | |||||
Equity in net income from unconsolidated investments | $ | — | $ | 10 | $ | 10 | |||||
As of December 31, 2014: | |||||||||||
Total assets | $ | 3,882 | $ | 297 | $ | 4,179 | |||||
Capital additions | $ | 188 | $ | 28 | $ | 216 | |||||
(1) | All other is comprised of the financial results of our insurance subsidiaries’ operations through the date of disposal and our international assets. |
Our operations are principally located in the United States. See the list of projects for the North America segment in Item 1. Business. A summary of operating revenue and total assets by geographic area is as follows (in millions):
United States | Other | Total | ||||||||||
Operating Revenue: | ||||||||||||
Year Ended December 31, 2016 | $ | 1,677 | $ | 22 | $ | 1,699 | ||||||
Year Ended December 31, 2015 | $ | 1,589 | $ | 56 | $ | 1,645 | ||||||
Year Ended December 31, 2014 | $ | 1,567 | $ | 115 | $ | 1,682 | ||||||
82
COVANTA HOLDING CORPORATION AND SUBSIDIARIES
NOTES TO CONSOLIDATED FINANCIAL STATEMENTS - (Continued)
United States | Assets Held for Sale | Other | Total | |||||||||||||
Total Assets: | ||||||||||||||||
As of December 31, 2016 | $ | 3,763 | $ | — | $ | 521 | $ | 4,284 | ||||||||
As of December 31, 2015 | $ | 3,847 | $ | 97 | $ | 290 | $ | 4,234 | ||||||||
As of December 31, 2014 | $ | 3,802 | $ | 96 | $ | 281 | $ | 4,179 | ||||||||
NOTE 7. AMORTIZATION OF WASTE, SERVICE AND ENERGY CONTRACTS
Waste, Service and Energy Contracts
Our waste, service and energy contracts are intangible assets and liabilities relating to long-term operating contracts at acquired facilities and are recorded upon acquisition at their estimated fair market values based upon discounted cash flows. Intangible assets and liabilities are amortized using the straight line method over their useful lives. Waste, service and energy contracts consisted of the following (in millions):
As of December 31, 2016 | As of December 31, 2015 | |||||||||||||||||||||||||
Remaining Weighted Average Useful Life | Gross Carrying Amount | Accumulated Amortization | Net | Gross Carrying Amount | Accumulated Amortization | Net | ||||||||||||||||||||
Waste, service and energy contracts (asset) | 22 years | $ | 526 | $ | 263 | $ | 263 | $ | 531 | $ | 247 | $ | 284 | |||||||||||||
Waste and service contracts (liability) | 3 years | $ | (131 | ) | $ | (124 | ) | $ | (7 | ) | $ | (131 | ) | $ | (118 | ) | $ | (13 | ) | |||||||
The following table details the amount of the actual/estimated amortization expense and contra-expense associated with these intangible assets and liabilities as of December 31, 2016 included or expected to be included in our consolidated statements of operations for each of the years indicated (in millions):
Waste, Service and Energy Contracts (Amortization Expense) | Waste and Service Contracts (Contra-Expense) | ||||||
Year ended December 31, 2016 | $ | 21 | $ | (6 | ) | ||
2017 | 14 | (2 | ) | ||||
2018 | 13 | (2 | ) | ||||
2019 | 13 | (2 | ) | ||||
2020 | 13 | (1 | ) | ||||
2021 | 13 | — | |||||
Thereafter | 197 | — | |||||
Total | $ | 263 | $ | (7 | ) | ||
The weighted average number of years prior to the next renewal period for contracts that we have an intangible recorded is 6 years.
During the year ended December 31, 2014, we recorded non-cash impairment charges totaling $16 million related to service contract intangibles that were recorded upon acquisition in 2009. See Note 14. Supplementary Information - Impairment charges discussion for additional information.
83
COVANTA HOLDING CORPORATION AND SUBSIDIARIES
NOTES TO CONSOLIDATED FINANCIAL STATEMENTS - (Continued)
NOTE 8. OTHER INTANGIBLE ASSETS AND GOODWILL
Other Intangible Assets
Other intangible assets consisted of the following (in millions):
As of December 31, 2016 | As of December 31, 2015 | |||||||||||||||||||||||
Remaining Weighted Average Useful Life | Gross Carrying Amount | Accumulated Amortization | Net | Gross Carrying Amount | Accumulated Amortization | Net | ||||||||||||||||||
Customer relationships and other | 8 years | $ | 43 | $ | 13 | $ | 30 | $ | 40 | $ | 6 | $ | 34 | |||||||||||
Other intangibles | Indefinite | 4 | — | 4 | 4 | — | 4 | |||||||||||||||||
Other intangible assets, net | $ | 47 | $ | 13 | $ | 34 | $ | 44 | $ | 6 | $ | 38 | ||||||||||||
The following table details the amount of the estimated amortization expense associated with other intangible assets as of December 31, 2016 expected to be included in our statements of operations for each of the years indicated (in millions):
2017 | 2018 | 2019 | 2020 | 2021 | Thereafter | Total | ||||||||||||||||||||||
Annual remaining amortization | $ | 5 | $ | 5 | $ | 5 | $ | 4 | $ | 3 | $ | 8 | $ | 30 | ||||||||||||||
Amortization expense related to other intangible assets was $6 million, $2 million and $1 million for the years ended December 31, 2016, 2015 and 2014, respectively.
Goodwill
Goodwill represents the total consideration paid in excess of the fair value of the net tangible and identifiable intangible assets acquired and the liabilities assumed in acquisitions. Goodwill has an indefinite life and is not amortized but is reviewed for impairment under the provisions of accounting standards for goodwill. All goodwill is related to the North America reporting segment, which is comprised of two reporting units. We performed the required annual impairment review of our recorded goodwill for our reporting units as of October 1, 2016 and determined that the fair value of our reporting units was not less than their relative carrying values. As of December 31, 2016, goodwill of approximately $56 million was deductible for federal income tax purposes.
The following table details the changes in carrying value of goodwill (in millions):
Total | |||
Balance as of December 31, 2014 | $ | 274 | |
Goodwill related to acquisitions | 27 | ||
Balance as of December 31, 2015 | 301 | ||
Goodwill related to acquisitions | 1 | ||
Balance as of December 31, 2016 | $ | 302 | |
NOTE 9. EQUITY METHOD INVESTMENTS
Our subsidiaries are parties to agreements through which we have equity investments in several operating projects. The joint venture agreements generally provide for the sharing of operational control as well as voting percentages. We record our share of earnings from our equity investees in equity in net income from unconsolidated investments in our consolidated statements of operations.
84
COVANTA HOLDING CORPORATION AND SUBSIDIARIES
NOTES TO CONSOLIDATED FINANCIAL STATEMENTS - (Continued)
As of December 31, 2016 and 2015, investments in investees and joint ventures accounted for under the equity method, included in Other assets on our consolidated balance sheet, were as follows (dollars in millions):
Ownership Interest as of December 31, 2016 | 2016 | Ownership Interest as of December 31, 2015 | 2015 | |||||||||
South Fork Plant (U.S.) | 50% | $ | — | 50% | $ | — | ||||||
Koma Kulshan Plant (U.S.) | 50% | 4 | 50% | 5 | ||||||||
TARTECH (U.S.) (1) | 50% | 1 | 50% | 5 | ||||||||
Ambiente 2000 (Italy) | 40% | — | 40% | — | ||||||||
Total investments in investees and joint ventures | $ | 5 | $ | 10 | ||||||||
Investments in investees and joint ventures classified as held for sale: (2) | ||||||||||||
Sanfeng (China) | —% | — | 40% | $ | 17 | |||||||
Chengdu (China) | —% | — | 49% | 22 | ||||||||
Total investments in investees and joint ventures classified as held for sale | $ | — | $ | 39 | ||||||||
(1) | During 2016, we recorded a net impairment of our investment in this joint venture, see Note 14. Supplementary Information for additional information. |
(2) | During 2016, we divested the majority of our investments in China, see Note 4. Dispositions, Assets Held for Sale and Discontinued Operations for additional information. |
NOTE 10. OPERATING LEASES
Leases are primarily operating leases for leaseholds on EfW facilities, as well as for trucks and automobiles, office space and machinery and equipment. Some of these operating leases have renewal options. Expense under operating leases was $19 million, $16 million, and $15 million, for the years ended December 31, 2016, 2015 and 2014, respectively.
The following is a schedule, by year, of future minimum rental payments required under operating leases that have initial or remaining non-cancelable lease terms in excess of one year as of December 31, 2016 (in millions):
2017 | 2018 | 2019 | 2020 | 2021 | Thereafter | Total | ||||||||||||||||||||||
Future Minimum Rental Payments | $ | 8 | $ | 7 | $ | 6 | $ | 6 | $ | 6 | $ | 24 | $ | 57 | ||||||||||||||
85
COVANTA HOLDING CORPORATION AND SUBSIDIARIES
NOTES TO CONSOLIDATED FINANCIAL STATEMENTS - (Continued)
NOTE 11. CONSOLIDATED DEBT
Consolidated debt is as follows (in millions):
As of December 31, | ||||||||
2016 | 2015 | |||||||
LONG-TERM DEBT: | ||||||||
Revolving Credit Facility (2.98% - 3.23%)(1) | $ | 343 | $ | 348 | ||||
Term Loan, net (2.48%)(1) | 195 | 200 | ||||||
Credit Facilities Sub-total | $ | 538 | $ | 548 | ||||
7.25% Senior Notes due 2020 | $ | 400 | $ | 400 | ||||
6.375% Senior Notes due 2022 | 400 | 400 | ||||||
5.875% Senior Notes due 2024 | 400 | 400 | ||||||
Less: deferred financing costs related to senior notes | (14 | ) | (16 | ) | ||||
Senior Notes Sub-total | $ | 1,186 | $ | 1,184 | ||||
4.00% - 5.25% Tax-Exempt Bonds due from 2024 to 2045 | $ | 464 | $ | 464 | ||||
Less: deferred financing costs related to tax-exempt bonds | (5 | ) | (6 | ) | ||||
Tax-Exempt Bonds Sub-total | $ | 459 | $ | 458 | ||||
3.48% - 4.52% Equipment financing capital leases due 2020 through 2027 | $ | 69 | $ | 73 | ||||
Total long-term debt | $ | 2,252 | $ | 2,263 | ||||
Less: current portion | (9 | ) | (8 | ) | ||||
Noncurrent long-term debt | $ | 2,243 | $ | 2,255 | ||||
PROJECT DEBT: | ||||||||
North America project debt | ||||||||
4.00 - 5.00% North America Project Debt related to Service Fee structures due 2017 through 2035 | $ | 78 | $ | 117 | ||||
Union capital lease due 2017 through 2053 | 99 | — | ||||||
5.248% - 6.20% North America Project Debt related to Tip Fee structures due 2017 through 2020 | 16 | 23 | ||||||
Unamortized debt premium, net | 4 | 5 | ||||||
Less: deferred financing costs related to North America project debt | (1 | ) | (1 | ) | ||||
Total North America project debt | $ | 196 | $ | 144 | ||||
Other project debt: | ||||||||
Dublin senior loan due 2021 (5.72% - 6.41%)(2) | $ | 155 | $ | — | ||||
Debt discount related to Dublin senior loan | (6 | ) | — | |||||
Less: deferred financing costs related to Dublin senior loan | (18 | ) | — | |||||
Dublin senior loan, net | $ | 131 | $ | — | ||||
Dublin junior loan due 2022 (9.23% - 9.73%) | $ | 58 | $ | 57 | ||||
Debt discount related to Dublin junior loan | (1 | ) | (1 | ) | ||||
Less: deferred financing costs related to Dublin junior loan | (1 | ) | (2 | ) | ||||
Dublin junior loan, net | $ | 56 | $ | 54 | ||||
Total other project debt, net | 187 | 54 | ||||||
Total project debt | 383 | 198 | ||||||
Less: Current portion, includes $1 and $1 of net unamortized premium | (22 | ) | (16 | ) | ||||
Noncurrent project debt | $ | 361 | $ | 182 | ||||
TOTAL CONSOLIDATED DEBT | $ | 2,635 | $ | 2,461 | ||||
Less: Current debt | (31 | ) | (24 | ) | ||||
TOTAL NONCURRENT CONSOLIDATED DEBT | $ | 2,604 | $ | 2,437 | ||||
(1) Eurodollar rates only; excludes base rate borrowings. | ||||||||
(2) Reflects hedged fixed rates. | ||||||||
86
COVANTA HOLDING CORPORATION AND SUBSIDIARIES
NOTES TO CONSOLIDATED FINANCIAL STATEMENTS - (Continued)
Credit Facilities
Our subsidiary, Covanta Energy, has $1.2 billion in senior secured credit facilities consisting of a $1.0 billion revolving credit facility expiring 2019 through 2020 (the “Revolving Credit Facility”) and a $196 million term loan due 2020 (the “Term Loan”) (collectively referred to as the "Credit Facilities").
The Revolving Credit Facility is available for the issuance of letters of credit of up to $600 million, provides for a $50 million sub-limit for the issuance of swing line loans (a loan that can be requested in US Dollars on a same day basis for a short drawing period); and is available in US Dollars, Euros, Pounds Sterling, Canadian Dollars and certain other currencies to be agreed upon, in each case for either borrowings or for the issuance of letters of credit. The proceeds under the Revolving Credit Facility are available for working capital and general corporate purposes of Covanta Energy and its subsidiaries.
We have the option to establish additional term loan commitments and/or increase the size of the Revolving Credit Facility (collectively, the “Incremental Facilities”), subject to the satisfaction of certain conditions and obtaining sufficient lender commitments, in an amount up to the greater of $500 million and the amount that, after giving effect to the incurrence of such Incremental Facilities, would not result in a leverage ratio, as defined in the credit agreement governing our Credit Facilities (the “Credit Agreement”), exceeding 2.75:1.00.
Availability under Revolving Credit Facility
As of December 31, 2016, we had availability under the Revolving Credit Facility as follows (in millions):
Total Facility Commitment | Expiring (1) | Direct Borrowings as of December 31, 2016 | Outstanding Letters of Credit as of December 31, 2016 | Availability as of December 31, 2016 | |||||||||||||
Revolving Credit Facility | $ | 1,000 | 2020 | $ | 343 | $ | 156 | $ | 501 | ||||||||
(1) The Tranche B commitment of $50 million expires in March 2019.
During the year ended December 31, 2016, we made aggregate cumulative direct borrowings of $744 million under the Revolving Credit Facility, and repaid $749 million prior to the end of the year.
Repayment Terms
As of December 31, 2016, the Term Loan has mandatory principal payments of $5 million in each year from 2017 through 2019 and $181 million in 2020. The Credit Facilities are pre-payable at our option at any time.
Interest and Fees
Borrowings under the Credit Facilities bear interest, at our option, at either a base rate or a Eurodollar rate plus an applicable margin determined by a pricing grid based on Covanta Energy’s leverage ratio. Base rate is defined as the higher of (i) the Federal Funds Effective Rate plus 0.50%, (ii) the rate the administrative agent announces from time to time as its per annum “prime rate” or (iii) the London Interbank Offered Rate (“LIBOR”), or a comparable or successor rate, plus 1.00%. Base rate borrowings under the Revolving Credit Facility bear interest at the base rate plus an applicable margin ranging from 0.75% to 1.75%. Eurodollar borrowings under the Revolving Credit Facility bear interest at LIBOR plus an applicable margin ranging from 1.75% to 2.75%. Fees for issuances of letters of credit include fronting fees equal to 0.15% per annum and a participation fee for the lenders equal to the applicable interest margin for LIBOR rate borrowings. We will incur an unused commitment fee ranging from 0.30% to 0.50% on the unused amount of commitments under the Revolving Credit Facility.
Base rate borrowings under the Term Loan bear interest at the base rate plus an applicable margin ranging from 0.75% to 1.00%. Eurodollar borrowings under the Term Loan bear interest at LIBOR plus an applicable margin ranging from 1.75% to 2.00%.
Guarantees and Securitization
The Credit Facilities are guaranteed by us and by certain of our subsidiaries. The subsidiaries that are party to the Credit Facilities agreed to secure all of the obligations under the Credit Facilities by granting, for the benefit of secured parties, a first priority lien on substantially all of their assets, to the extent permitted by existing contractual obligations. The Credit Facilities are also secured by a pledge of substantially all of the capital stock of each of our domestic subsidiaries and 65% of substantially all the capital stock of each of our directly-owned foreign subsidiaries, in each case to the extent not otherwise pledged.
87
COVANTA HOLDING CORPORATION AND SUBSIDIARIES
NOTES TO CONSOLIDATED FINANCIAL STATEMENTS - (Continued)
Credit Agreement Covenants
The loan documentation governing the Credit Facilities contains various affirmative and negative covenants, as well as financial maintenance covenants, that limit our ability to engage in certain types of transactions. We were in compliance with all of the affirmative and negative covenants under the Credit Facilities as of December 31, 2016.
The negative covenants of the Credit Facilities limit our and our restricted subsidiaries’ ability to, among other things:
• | incur additional indebtedness (including guarantee obligations); |
• | create certain liens against or security interests over certain property; |
• | pay dividends on, redeem, or repurchase our capital stock or make other restricted junior payments; |
• | enter into agreements that restrict the ability of our subsidiaries to make distributions or other payments to us; |
• | make investments; |
• | consolidate, merge or transfer all or substantially all of our assets and the assets of our subsidiaries on a consolidated basis; |
• | dispose of certain assets; and |
• | make certain acquisitions. |
The financial maintenance covenants of the Credit Facilities, which are measured on a trailing four quarter period basis, include the following:
• | a maximum Leverage Ratio of 4.00 to 1.00 for the trailing four quarter period, which measures the principal amount of Covanta Energy’s consolidated debt less certain restricted funds dedicated to repayment of project debt principal and construction costs (“Consolidated Adjusted Debt”) to its adjusted earnings before interest, taxes, depreciation and amortization, as calculated in the Credit Agreement (“Adjusted EBITDA”). The definition of Adjusted EBITDA in the Credit Facilities excludes certain non-recurring and non-cash charges. |
• | a minimum Interest Coverage Ratio of 3.00 to 1.00, which measures Covanta Energy’s Adjusted EBITDA to its consolidated interest expense plus certain interest expense of ours, to the extent paid by Covanta Energy as calculated in the Credit Agreement. |
Senior Notes and Debentures
7.25% Senior Notes due 2020 (the “7.25% Notes”)
In 2010, we sold $400 million aggregate principal amount of 7.25% Senior Notes due 2020. Interest on the 7.25% Notes is payable semi-annually on June 1 and December 1 of each year, commencing on June 1, 2011 and the 7.25% Notes will mature on December 1, 2020 unless earlier redeemed or repurchased.
At our option, the 7.25% Notes are subject to redemption at any time, in whole or in part, at the redemption prices set forth in the indenture, together with accrued and unpaid interest, if any, to the date of redemption.
The 7.25% Notes are senior unsecured obligations, ranking equally in right of payment with any of the future senior unsecured indebtedness of Covanta Holding Corporation. The 7.25% Notes are effectively junior to our existing and future secured indebtedness, including any guarantee of indebtedness under the Credit Facilities. The 7.25% Notes are not guaranteed by any of our subsidiaries and are effectively subordinated to all existing and future indebtedness and other liabilities of our subsidiaries.
The indenture for the 7.25% Notes may limit our ability and the ability of certain of our subsidiaries to:
• | incur additional indebtedness; |
• | pay dividends or make other distributions or repurchase or redeem their capital stock; |
• | prepay, redeem or repurchase certain debt; |
• | make loans and investments; |
• | sell restricted assets; |
• | incur liens; |
• | enter into transactions with affiliates; |
• | alter the businesses they conduct; |
• | enter into agreements restricting our subsidiaries’ ability to pay dividends; and |
• | consolidate, merge or sell all or substantially all of their assets. |
If and for so long as the 7.25% Notes have an investment grade rating and no default under the indenture has occurred, certain of the covenants will be suspended.
If we sell certain of our assets or experience specific kinds of changes in control, we must offer to purchase the 7.25% Notes. The occurrence of specific kinds of changes in control will be a triggering event requiring us to offer to purchase from the holders
88
COVANTA HOLDING CORPORATION AND SUBSIDIARIES
NOTES TO CONSOLIDATED FINANCIAL STATEMENTS - (Continued)
all or a portion of the 7.25% Notes at a price equal to 101% of their principal amount, together with accrued and unpaid interest, if any, to the date of purchase. In addition, certain asset dispositions will be triggering events that may require us to use the proceeds from those asset dispositions to make an offer to purchase the 7.25% Notes at 100% of their principal amount, together with accrued and unpaid interest, if any, to the date of purchase if such proceeds are not otherwise used within 365 days to repay indebtedness or to invest or commit to invest such proceeds in additional assets related to our business or capital stock of a restricted subsidiary.
6.375% Senior Notes due 2022 (the “6.375% Notes”)
In March 2012, we sold $400 million aggregate principal amount of 6.375% Senior Notes due 2022. Interest on the 6.375% Notes is payable semi-annually on April 1 and October 1 of each year, commencing on October 1, 2012, and the 6.375% Notes will mature on October 1, 2022 unless earlier redeemed or repurchased. Net proceeds from the sale of the 6.375% Notes were $392 million, consisting of gross proceeds of $400 million net of $8 million in offering expenses. We used a portion of the net proceeds of the 6.375% Notes offering to repay a portion of the amounts outstanding under Covanta Energy’s previously existing term loan.
At our option, the 6.375% Notes are subject to redemption at any time on or after April 1, 2017, in whole or in part, at the redemption prices set forth in the indenture, together with accrued and unpaid interest, if any, to the date of redemption. In addition, at any time prior to April 1, 2017, we may redeem some or all of the 6.375% Notes at a price equal to 100% of their principal amount, plus accrued and unpaid interest, plus a “make-whole premium”.
Other terms and conditions of the 6.375% Notes, including guarantees and security, covenants, and repurchase requirements in the case of certain asset sales or a change of control, are substantially similar to those described above under 7.25% Notes.
5.875% Senior Notes due 2024 (the "5.875% Notes")
In March 2014, we sold $400 million aggregate principal amount of 5.875% Senior Notes due March 2024. Interest on the 5.875% Notes is payable semi-annually on March 1 and September 1 of each year, commencing on September 1, 2014, and the 5.875% Notes will mature on March 1, 2024 unless earlier redeemed or repurchased. Net proceeds from the sale of the 5.875% Notes were approximately $393 million, consisting of gross proceeds of $400 million net of approximately $7 million in offering expenses. We used the net proceeds of the 5.875% Notes offering in part for the repayment of the 3.25% Cash Convertible Notes at maturity on June 1, 2014.
The 5.875% Notes are subject to redemption at our option, at any time on or after March 1, 2019, in whole or in part, at the redemption prices set forth in the prospectus supplement, plus accrued and unpaid interest. At any time prior to March 1, 2017, we may redeem up to 35% of the original principal amount of the 5.875% Notes with the proceeds of certain equity offerings at a redemption price of 105.875% of the principal amount of the 5.875% Notes plus accrued and unpaid interest. At any time prior to March 1, 2019, we may also redeem the 5.875% Notes, in whole but not in part, at a price equal to 100% of the principal amount of the 5.875% Notes, plus accrued and unpaid interest and a “make-whole premium.”
Other terms and conditions of the 5.875% Notes, including guarantees and security, covenants, and repurchase requirements in the case of certain asset sales or a change of control, are substantially similar to those described above under 7.25% Notes.
3.25% Cash Convertible Senior Notes due 2014 (the “3.25% Notes”)
In 2009, we issued $460 million aggregate principal amount of the 3.25% Notes due in 2014 in a private transaction exempt from registration under the Securities Act of 1933, as amended. We used the net proceeds from the offering for general corporate purposes, including capital expenditures, permitted investments or permitted acquisitions. On June 1, 2014, we repaid the $460 million 3.25% Notes utilizing net proceeds from the March 2014 5.875% Notes issuance.
During the period from March 1, 2014 to May 30, 2014, and under certain additional limited circumstances, the 3.25% Notes were cash convertible by holders thereof (the "Cash Conversion Option"). The conversion rate was 64.6669 shares of our common stock (which represented a conversion price of approximately $15.46 per share) for the period from March 17, 2014 through March 21, 2014, and 65.3501 shares of our common stock (which represented a conversion price of approximately $15.30 per share), as adjusted for the dividend paid on April 2, 2014, for the period from March 24, 2014 to May 30, 2014. We did not deliver common stock (or any other securities) upon conversion. Upon maturity, we were required to pay $83 million to satisfy the obligation under the Cash Conversion Option in addition to the principal amount of the 3.25% Notes.
In connection with the issuance of 3.25% Notes offering, we entered into privately negotiated cash convertible note hedge transactions (the “Note Hedge”) with affiliates of certain of the initial purchasers of the 3.25% Notes which we cash-settled for $83 million upon maturity of the 3.25% Notes and effectively offset our liability under the Cash Conversion Option.
In connection with the issuance of the 3.25% Notes, we also sold warrants, correlating to the number of shares underlying the 3.25% Notes. The warrants were exercisable only at expiration in equal tranches over a 60 day period which began on September
89
COVANTA HOLDING CORPORATION AND SUBSIDIARIES
NOTES TO CONSOLIDATED FINANCIAL STATEMENTS - (Continued)
2, 2014 and ended on November 26, 2014. During the year ended December 31, 2014, 1,430,870 shares of our common stock were issued in connection with warrant exercises.
4.00% - 5.25% Tax-Exempt Bonds due from 2024-2045 ("Tax-Exempt Bonds")
In November 2012, we issued tax-exempt corporate bonds totaling $335 million. Proceeds from the offerings were utilized to refinance tax-exempt project debt at our Haverhill, Niagara and SEMASS facilities, as well as to fund certain capital expenditures in Massachusetts. Approximately $7 million of financing costs were incurred, of which $3 million was expensed and $4 million will be recognized over the term of the debt.
In August 2015, we issued two new series of fixed rate tax-exempt corporate bonds totaling $130 million. Proceeds from the offerings were utilized to refinance tax-exempt project debt at our Delaware Valley facility and to fund certain capital improvements at our Essex County facility. Financing costs were not material.
Details of the issues and the use of proceeds are as follows (dollars in millions):
Series | Amount | Maturity | Coupon | Use of Proceeds | ||||||
Massachusetts Series 2012A | $ | 20 | 2027 | 4.875% | New proceeds for qualifying capital expenditures in Massachusetts | |||||
Massachusetts Series 2012B | 67 | 2042 | 4.875% | Redeem SEMASS project debt | ||||||
Massachusetts Series 2012C | 82 | 2042 | 5.25% | Redeem Haverhill project debt | ||||||
Niagara Series 2012A | 130 | 2042 | 5.25% | Redeem Niagara project debt | ||||||
Niagara Series 2012B | 35 | 2024 | 4.00% | Redeem Niagara project debt | ||||||
New Jersey Series 2015A | 90 | 2045 | 5.25% | Finance qualifying expenditures at Essex County facility | ||||||
Pennsylvania Series 2015A | 40 | 2043 | 5.00% | Refinance outstanding tax-exempt debt | ||||||
$ | 464 | |||||||||
We entered into a loan agreement with the Massachusetts Development Finance Agency under which they issued the Resource Recovery Revenue Bonds (the “Massachusetts Series” bonds in the table above) and loaned the proceeds of the Massachusetts Series bonds to us for the purposes of (i) financing qualifying capital expenditures at certain solid waste disposal facilities in Massachusetts and (ii) redeeming the outstanding principal balance of the SEMASS and Haverhill project debt.
We entered into a loan agreement with the Niagara Area Development Corporation under which they issued the Solid Waste Disposal Facility Refunding Revenue Bonds (the “Niagara Series” bonds in the table above) and loaned the proceeds of the Niagara Series bonds to us for the purpose of redeeming the outstanding principal balance of the Niagara project debt.
The Massachusetts Series bonds and the Niagara Series bonds are obligations of Covanta Holding Corporation, are guaranteed by Covanta Energy; and are not secured by project assets. Principal and interest on the Massachusetts Series bonds and the Niagara Series bonds are payable from the repayments we make to the Massachusetts Development Finance Agency and Niagara Area Development Corporation, respectively, pursuant to the respective loan agreements.
The Massachusetts Series bonds and the Niagara Series bonds bear interest at the interest rates per annum set forth in the table above, payable semi-annually on May 1 and November 1 of each year, commencing on May 1, 2013.
We entered into a loan agreement with the Essex County Improvement Authority under which they issued the Solid Waste Disposal Revenue Bonds (the “New Jersey Series” bonds in the table above) and loaned the proceeds to us for the purposes of financing capital improvements at our Essex County facility, including a new emissions control system. Interest on the bonds is paid semi-annually on January 1 and July 1 of each year beginning on January 1, 2016. Interest expense incurred during the construction period will be capitalized.
We entered into a loan agreement with the Delaware County Industrial Development Authority under which they issued the Refunding Revenue Bonds (the “Pennsylvania Series” bonds in the table above) and loaned the proceeds to us for the purpose of redeeming the outstanding $34 million principal amount of the Variable Rate Bonds and of refinancing $6 million of project debt due on July 1, 2015 at our Delaware Valley facility. See Variable Rate Tax-Exempt Demand Bonds due 2043 below. Interest on the bonds is paid semi-annually on January 1 and July 1 of each year beginning on January 1, 2016.
Each of the loan agreements contains customary events of default, including failure to make any payments when due, failure to perform its covenants under the respective loan agreement, and the bankruptcy or insolvency. Additionally, each of the loan agreements contains cross-default provisions that relate to our other indebtedness. Upon the occurrence of an event of default, the unpaid balance of the loan under the applicable loan agreement will become due and payable immediately.
90
COVANTA HOLDING CORPORATION AND SUBSIDIARIES
NOTES TO CONSOLIDATED FINANCIAL STATEMENTS - (Continued)
The Massachusetts Series bonds and the Niagara Series bonds contain certain terms including mandatory redemption requirements in the event that (i) the respective loan agreement is determined to be invalid, or (ii) the respective bonds are determined to be taxable. In the event of a mandatory redemption of the bonds, we will have an obligation under each respective loan agreement to prepay the respective loan in order to fund the redemption.
Tax-Exempt Variable Rate Demand Bonds due 2043 ("Variable Rate Bonds")
In July 2013 and 2014, we issued $22 million and $12 million, respectively of tax-exempt corporate variable-rate demand bonds, which were secured by a letter of credit issued under our Revolving Credit Facility and had a maturity date of July 1, 2043. Proceeds from the offering were utilized to refinance project debt at our Delaware Valley facility due through July 1, 2014.
In August 2015, we refinanced the $34 million of outstanding Variable Rate Bonds with a portion of the net proceeds of the $40 million Pennsylvania Series 2015A bonds due 2043. See 4.00% - 5.25% Tax-Exempt Bonds due from 2024-2045 above.
Union County EfW Capital Lease Arrangement
In June 2016, we extended the lease term related to the Union County EfW facility through 2053, which resulted in capital lease treatment for the revised lease. We recorded a lease liability of $104 million, calculated utilizing an incremental borrowing rate of 5.0% which is included in long-term project debt on our consolidated balance sheet. The lease includes certain periods of contingent rentals based upon plant performance as either a share of revenue or a share of plant profits. These contingent payments have been excluded from the calculation of the lease liability and instead will be treated as a period expense when incurred. As of December 31, 2016, the outstanding borrowings under the capital lease have mandatory amortization payments remaining as follows (in millions):
2017 | 2018 | 2019 | 2020 | 2021 | Thereafter | |||||||||||||||||||
Annual Remaining Amortization | $ | 5 | $ | 5 | $ | 5 | $ | 6 | $ | 6 | $ | 72 | ||||||||||||
Equipment Financing Capital Lease Arrangements
In 2014, we entered into equipment financing capital lease arrangements to finance the purchase of barges, railcars, containers and intermodal equipment related to our New York City contract. The lease terms range from 10 years to 12 years and the fixed interest rates range from 3.48% to 4.52%. The outstanding borrowings under the equipment financing capital lease arrangements were $69 million as of December 31, 2016, and have mandatory amortization payments remaining as follows (in millions):
2017 | 2018 | 2019 | 2020 | 2021 | Thereafter | |||||||||||||||||||
Annual Remaining Amortization | $ | 5 | $ | 5 | $ | 5 | $ | 5 | $ | 5 | $ | 44 | ||||||||||||
Depreciation associated with these capital lease arrangements is included in Depreciation and amortization expense on our consolidated statement of operations. For additional information see Note 1. Organization and Summary of Significant Accounting Policies - Property, Plant and Equipment.
PROJECT DEBT
The maturities of long-term project debt as of December 31, 2016 are as follows (in millions):
2017 | 2018 | 2019 | 2020 | 2021 | Thereafter | Total | Less: Current Portion | Total Noncurrent Project Debt | ||||||||||||||||||||||||||||
Debt | $ | 22 | $ | 31 | $ | 26 | $ | 17 | $ | 144 | $ | 166 | $ | 406 | $ | (22 | ) | $ | 384 | |||||||||||||||||
Premium and deferred financing costs | (5 | ) | (5 | ) | (5 | ) | (5 | ) | (4 | ) | 1 | (23 | ) | — | (23 | ) | ||||||||||||||||||||
Total | $ | 17 | $ | 26 | $ | 21 | $ | 12 | $ | 140 | $ | 167 | $ | 383 | $ | (22 | ) | $ | 361 | |||||||||||||||||
Project debt associated with the financing of energy-from-waste facilities is arranged by municipal entities through the issuance of tax-exempt and taxable revenue bonds or other borrowings. For those facilities we own, that project debt is recorded as a liability on our consolidated financial statements. Generally, debt service for project debt related to Service Fee structures is the primary responsibility of municipal entities, whereas debt service for project debt related to Tip Fee structures is paid by our project subsidiary from project revenue expected to be sufficient to cover such expense.
91
COVANTA HOLDING CORPORATION AND SUBSIDIARIES
NOTES TO CONSOLIDATED FINANCIAL STATEMENTS - (Continued)
Payment obligations for our project debt associated with energy-from-waste facilities are generally limited recourse to the operating subsidiary and non-recourse to us, subject to operating performance guarantees and commitments. These obligations are typically secured by the revenue pledged under the respective indentures and by a mortgage lien and a security interest in the respective energy-from-waste facility and related assets. As of December 31, 2016, such revenue bonds were collateralized by property, plant and equipment with a net carrying value of $669 million and restricted funds held in trust of approximately $84 million.
In April 2015, in connection with a long-term service fee contract extension at our Onondaga County facility, our Onondaga County client refinanced $42 million of outstanding project debt with $54 million of new tax-exempt bonds issued with a $5 million premium. The incremental proceeds were used to establish a $15 million restricted cash fund to be used toward facility projects and to satisfy $2 million in transaction costs which will be deferred and amortized over the term of the bonds. The bonds bear interest from 4.00% to 5.00% and have scheduled annual payments with final maturity on May 1, 2035. Consistent with other service fee projects we own and have project debt in place, the client community will pay us debt service revenue equivalent to the principal and interest on the bonds.
Dublin Project Financing
During 2014, we executed agreements for project financing totaling €375 million to fund a majority of the construction costs of the Dublin EfW facility. The project financing package includes: (i) €300 million of project debt under a credit facility agreement with various lenders (the “Dublin Credit Agreement”), which consists of a €250 million senior secured term loan (the “Dublin Senior Term Loan”) and a €50 million second lien term loan (the “Dublin Junior Term Loan”), and (ii) a €75 million convertible preferred investment (the “Dublin Convertible Preferred”), which was committed by a leading global energy infrastructure investor. For additional information related to this project, see Note 3. New Business and Asset Management.
Dublin Senior Term Loan due 2021
As of December 31, 2016, $155 million (€147 million) of the €250 million Dublin Senior Term Loan has been drawn and is included in project debt on our consolidated balance sheet. The remainder of the Dublin Senior Term Loan is expected to be drawn over the course of 2017 to fund remaining construction costs. Key commercial terms of the Dublin Senior Term Loan include:
• | Final maturity on September 30, 2021 (approximately four years after the anticipated operational commencement date of the facility). |
• | Scheduled repayments will be made semi-annually according to a 15-year amortization profile, beginning in 2018. The loan is pre-payable at our option following operational commencement. |
• | Borrowings will bear interest at the Euro Interbank Offered Rate ("EURIBOR") plus an applicable margin, which will range from 4.00% to 4.50% according to a pre-determined schedule. Interest on outstanding borrowings will be payable in cash monthly prior to the operational commencement date of the facility, and payable in cash semi-annually after the operational commencement date, based on the prevailing one and six month EURIBOR rates, respectively. Undrawn commitments will accrue commitment fees at a rate of 2.25% per annum. We entered into interest rate swap agreements in order to hedge our exposure to adverse variable interest rate fluctuations under the Dublin Senior Term Loan. For additional information, see Note 13. Derivative Instruments. |
• | The Dublin Senior Term Loan is a senior obligation of the project company and certain other related subsidiaries, all of which are wholly-owned by us, and is secured by a first priority lien on substantially all of the project-related assets. The Dublin Senior Term Loan is non-recourse to us and our subsidiary Covanta Energy. See Note 18. Commitments and Contingencies for a description of the commitments of Covanta Energy related to the Dublin project financing. |
• | The Dublin Credit Agreement contains positive, negative and financial maintenance covenants that are customary for a project financing of this type. Our ability to service the Dublin Junior Term Loan and the Dublin Convertible Preferred and to make cash distributions to common equity following the operational commencement date is subject to ongoing compliance with these covenants, including maintaining a minimum debt service coverage ratio and loan life coverage ratio on the Dublin Senior Term Loan. |
Dublin Junior Term Loan due 2022
The €50 million Dublin Junior Term Loan was funded into an escrow account in September 2014 and was utilized in 2015 to fund construction costs as our initial equity investment into the project and the Dublin Convertible Preferred were fully utilized. As of December 31, 2016, $58 million (€55 million), inclusive of interest accrued to the balance of the loan, is included in project debt on our consolidated balance sheet. Key commercial terms of the Dublin Junior Term Loan include:
• | Final maturity on March 31, 2022 (six months after the maturity of the Dublin Senior Term Loan). |
92
COVANTA HOLDING CORPORATION AND SUBSIDIARIES
NOTES TO CONSOLIDATED FINANCIAL STATEMENTS - (Continued)
• | Scheduled repayments will be made semi-annually according to a 15-year amortization profile, beginning in 2018. The loan is pre-payable at our option following operational commencement. |
• | Borrowings bear interest at a fixed rate of 5.23% during the first six months of the loan, and thereafter at fixed rates ranging from 9.23% to 9.73% according to a pre-determined schedule. Interest on outstanding borrowings is payable semi-annually and will be payable 50% in cash and 50% accrued to the balance of the loan prior to the operational commencement date of the facility, and payable 100% in cash after the operational commencement date. |
• | The Dublin Junior Term Loan is a junior obligation of the project company and certain other related subsidiaries, all of which are wholly-owned by us, and is secured by a second priority lien on substantially all of the project-related assets and a first priority lien on the assets of the top tier project holding company. The Dublin Junior Term Loan is non-recourse to us and our subsidiary Covanta Energy. |
• | Under the Dublin Credit Agreement, our ability to service the Dublin Convertible Preferred and to make cash distributions to common equity is subject to ongoing compliance with the covenants under the agreement, including maintaining a minimum debt service coverage ratio and loan life coverage ratio on the Dublin Junior Term Loan. |
Dublin Convertible Preferred
The €75 million Dublin Convertible Preferred was utilized to fund construction costs in 2015 after our initial equity investment into the project was fully utilized. As of December 31, 2016, the Dublin convertible preferred instrument of $87 million, (€83 million) inclusive of dividends accrued to the balance, was included in other noncurrent liabilities in our consolidated balance sheet. The instrument has: (i) a liquidation preference equal to par value of the investment, (ii) a preferred claim on project cash flows during operations (after debt service) to pay a fixed dividend rate and repay principal according to an amortization schedule, and (iii) an option to convert loan principal into a common equity interest in the project.
The Dublin Convertible Preferred is structured as a shareholder loan (the “Stakeholder Loan”) with the concurrent issuance of warrants (the “Stakeholder Warrants”). Key commercial terms of the Dublin Convertible Preferred include:
• | The Stakeholder Loan will accrue dividends at a fixed rate of 13.50% per annum. The dividends are payable 50% in cash and 50% accrued to the principal balance on a monthly basis prior to the operational commencement date, and payable 100% in cash semi-annually thereafter, subject to available project cash flows after debt service. |
• | Scheduled repayments of principal of the Stakeholder Loan will be made semi-annually according to a 13-year amortization profile beginning in 2020 (two years after the operational commencement date), with a final repayment date of September 30, 2032, all subject to available project cash flows after debt service. |
• | Voluntary prepayments are not permitted during the first five years of the Stakeholder Loan, after which the principal is pre-payable at our option in increments of 33% of the aggregate outstanding principal balance per year. |
• | The Stakeholder Loan is mandatorily pre-payable at the option of the Stakeholder Loan holder(s) under certain circumstances in the event of a refinancing of the Dublin Senior Term Loan and/or the Dublin Junior Term Loan. |
• | The Stakeholder Warrants are exercisable into ordinary shares of our subsidiary holding company that owns 100% of the project company on five conversion dates, scheduled at six month intervals, beginning on the operational commencement date, or upon a refinancing of the Dublin Credit Agreement. The warrants contain customary anti-dilution protection and are exercisable on a cashless basis at a specified conversion price on each conversion date, representing a set premium to the original subscription price for common shares (i.e., Covanta’s subscription price) that increases over time. The number of shares that can potentially be issued upon exercise is limited to a maximum of 24.99% of the outstanding shares. |
• | The Dublin Convertible Preferred holder(s) is entitled to nominate two out of five voting board members of the project subsidiary holding company. The right to nominate board members will be reduced with future reductions in the outstanding principal amount of the Stakeholder Loan and/or number of common shares held following conversion of the Stakeholder Warrants. |
Financing Costs
All deferred financing costs are amortized to interest expense over the life of the related debt using the effective interest method. For each of the years ended December 31, 2016, 2015 and 2014 amortization of deferred financing costs included as a component of interest expense totaled $6 million, $8 million and $8 million, respectively.
Capitalized Interest
93
COVANTA HOLDING CORPORATION AND SUBSIDIARIES
NOTES TO CONSOLIDATED FINANCIAL STATEMENTS - (Continued)
Interest expense paid and costs amortized to interest expense related to project financing are capitalized during the construction and start-up phase of the project. During the years ended December 31, 2016, 2015 and 2014, interest expense of $26 million, $10 million and $2 million, respectively, was capitalized.
NOTE 12. FINANCIAL INSTRUMENTS
Fair Value Measurements
Authoritative guidance associated with fair value measurements provides a framework for measuring fair value and establishes a fair value hierarchy that prioritizes the inputs used to measure fair value, giving the highest priority to unadjusted quoted prices in active markets for identical assets or liabilities (Level 1 inputs), then significant other observable inputs (Level 2 inputs) and the lowest priority to significant unobservable inputs (Level 3 inputs). The following methods and assumptions were used to estimate the fair value of each class of financial instruments:
• | For cash and cash equivalents, restricted funds, and marketable securities, the carrying value of these amounts is a reasonable estimate of their fair value. The fair value of restricted funds held in trust is based on quoted market prices of the investments held by the trustee. |
• | Fair values for long-term debt and project debt are determined using quoted market prices. |
• | The fair value for interest rate swaps were determined by obtaining quotes from two counterparties (one is a holder of the long position and the other is in the short) and extrapolating those across the long and short notional amounts. The fair value of the interest rate swaps was adjusted to reflect counterparty risk of non-performance, and was based on the counterparty’s credit spread in the credit derivatives market. |
• | The fair values of our energy hedges were determined using the spread between our fixed price and the forward curve information available within the market. |
• | The fair value of our foreign currency hedge was determined by obtaining quotes from two counterparties and is based on market accepted option pricing methodology which utilizes inputs such as the currency spot rate as of the balance sheet date, the strike price of the options and volatility. |
The estimated fair value amounts have been determined using available market information and appropriate valuation methodologies. However, considerable judgment is required in interpreting market data to develop estimates of fair value. Accordingly, the estimates presented herein are not necessarily indicative of the amounts that we would realize in a current market exchange. The fair-value estimates presented herein are based on pertinent information available to us as of December 31, 2016. Such amounts have not been comprehensively revalued for purposes of these financial statements since December 31, 2016, and current estimates of fair value may differ significantly from the amounts presented herein.
94
COVANTA HOLDING CORPORATION AND SUBSIDIARIES
NOTES TO CONSOLIDATED FINANCIAL STATEMENTS - (Continued)
The following financial instruments are recorded at their estimated fair value. The following table presents information about the recurring fair value measurement of our assets and liabilities as of December 31, 2016 and 2015:
As of December 31, | ||||||||||
Financial Instruments Recorded at Fair Value on a Recurring Basis: | Fair Value Measurement Level | 2016 | 2015 | |||||||
(In millions) | ||||||||||
Assets: | ||||||||||
Cash and cash equivalents: | ||||||||||
Bank deposits and certificates of deposit | 1 | $ | 79 | $ | 89 | |||||
Money market funds | 1 | 5 | 5 | |||||||
Total cash and cash equivalents: | 84 | 94 | ||||||||
Restricted funds held in trust: | ||||||||||
Bank deposits and certificates of deposit | 1 | 12 | 9 | |||||||
Money market funds | 1 | 36 | 66 | |||||||
U.S. Treasury/agency obligations (1) | 1 | 14 | 18 | |||||||
State and municipal obligations | 1 | 46 | 59 | |||||||
Commercial paper/guaranteed investment contracts/repurchase agreements | 1 | 2 | 8 | |||||||
Total restricted funds held in trust: | 110 | 160 | ||||||||
Investments: | ||||||||||
Mutual and bond funds (2) | 1 | 2 | 2 | |||||||
Derivative asset — energy hedges (3) | 2 | 3 | 21 | |||||||
Total assets: | $ | 199 | $ | 277 | ||||||
Liabilities: | ||||||||||
Derivative liability — energy hedges (4) | 2 | $ | 1 | $ | — | |||||
Derivative liability — interest rate swaps (4) (5) | 2 | 20 | 14 | |||||||
Total liabilities: | $ | 21 | $ | 14 | ||||||
The following financial instruments are recorded at their carrying amount (in millions):
As of December 31, 2016 | As of December 31, 2015 | |||||||||||||||
Financial Instruments Recorded at Carrying Amount: | Carrying Amount | Estimated Fair Value | Carrying Amount | Estimated Fair Value | ||||||||||||
Assets: | ||||||||||||||||
Accounts receivables (6) | $ | 333 | $ | 333 | $ | 314 | $ | 314 | ||||||||
Liabilities: | ||||||||||||||||
Long-term debt | $ | 2,252 | $ | 2,237 | $ | 2,263 | $ | 2,244 | ||||||||
Project debt | $ | 383 | $ | 387 | $ | 198 | $ | 206 | ||||||||
(1) | The U.S. Treasury/agency obligations in restricted funds held in trust are primarily comprised of Federal Home Loan Mortgage Corporation securities at fair value. |
(2) | Included in other noncurrent assets in the consolidated balance sheets. |
(3) | Included in prepaid expenses and other current assets in the consolidated balance sheets. |
(4) | Included in accrued expenses and other current liabilities in the consolidated balance sheets. |
(5) | Included in other noncurrent liabilities in the consolidated balance sheets. |
(6) | Includes $1 million and $2 million of noncurrent receivables in other noncurrent assets in the consolidated balance sheets as of December 31, 2016 and 2015. |
In addition to the recurring fair value measurements, certain assets are measured at fair value on a non-recurring basis when an indication of impairment is identified and the assets fair value is determined to be less than its carrying value. See Note 14. Supplementary Information - Impairment Charges for additional information.
95
COVANTA HOLDING CORPORATION AND SUBSIDIARIES
NOTES TO CONSOLIDATED FINANCIAL STATEMENTS - (Continued)
NOTE 13. DERIVATIVE INSTRUMENTS
The following disclosures summarize the fair value of derivative instruments not designated as hedging instruments in the consolidated balance sheets and the effect of changes in fair value related to those derivative instruments not designated as hedging instruments on the consolidated statements of operations (in millions):
Derivative Instruments Not Designated As Hedging Instruments | Fair Value as of December 31, | |||||||||
Balance Sheet Location | 2016 | 2015 | ||||||||
Asset Derivatives: | ||||||||||
Foreign currency hedges | Prepaid expenses and other current assets | $ | — | $ | 6 | |||||
Amount of Gain (Loss) Recognized In Income on Derivatives | ||||||||||||||
Effect on Income of Derivative Instruments Not Designated As Hedging Instruments | Location of Gain or (Loss) Recognized in Income on Derivatives | For the Years Ended December 31, | ||||||||||||
2016 | 2015 | 2014 | ||||||||||||
Foreign currency hedge | Other expense, net | $ | (2 | ) | $ | 6 | $ | — | ||||||
Note hedge | Non-cash convertible debt related expense | — | — | 5 | ||||||||||
Cash conversion option | Non-cash convertible debt related expense | — | — | (5 | ) | |||||||||
Effect on income of derivative instruments not designated as hedging instruments | $ | (2 | ) | $ | 6 | $ | — | |||||||
Foreign Currency Hedge
In order to hedge the risk of adverse foreign currency exchange rate fluctuations impacting the expected sale proceeds from our equity transfer agreement in China (See Note 4. Dispositions, Assets Held for Sale and Discontinued Operations), we entered into a foreign currency exchange collar with two financial institutions covering approximately $100 million of notional to protect against further rate fluctuations pending the sale of our ownership interest to CITIC, which was completed during September 2016. The foreign currency hedge is accounted for as a derivative instrument and, as such, was recorded at fair value quarterly with any change in fair value recognized in our consolidated statements of operations as other expense, net. During the twelve months ended December 31, 2016, cash provided by foreign currency exchange settlements totaled $5 million and was included in net cash used in investing activities on our condensed consolidated statement of cash flows.
As of December 31, 2016, we received $105 million of gross sale proceeds relating to the aforementioned sale of our ownership interests to CITIC and therefore, settled or canceled remaining foreign currency exchange derivatives related to this hedged transaction, resulting in a current asset balance of zero. As of December 31, 2015, the fair value of the foreign currency exchange derivatives of $6 million, pre-tax, was recorded as a current asset.
We have also entered into foreign currency forwards to manage foreign currency exchange rate fluctuations associated with a series of fixed payments to be made by an international subsidiary through the end of 2017. This foreign currency forward is accounted for as a derivative instrument at fair value in our consolidated balance sheet with any changes in fair value recognized in our consolidated statements of operations as "Other expense, net." This derivative instrument was not material to our consolidated statement of operations nor was it material to our condensed consolidated balance sheet as of December 31, 2016.
Cash Conversion Option, Note Hedge and Contingent Interest features related to the 3.25% Cash Convertible Senior Notes
The cash conversion option was a derivative instrument which was recorded at fair value quarterly with any change in fair value being recognized in our consolidated statements of operations as non-cash convertible debt related expense. The note hedge was accounted for as a derivative instrument and, as such, was recorded at fair value quarterly with any change in fair value being recognized in our consolidated statements of operations as non-cash convertible debt related expense.
The 3.25% Notes matured on June 1, 2014. Upon maturity, we were required to pay $83 million to satisfy the obligation under the cash conversion option in addition to the principal amount of the 3.25% Notes. The note hedge settled for $83 million and effectively offset our exposure to the cash payments in excess of the principal amount made under the cash conversion option. The income recognized as a result of changes in the credit valuation adjustment related to the note hedge was not material.
96
COVANTA HOLDING CORPORATION AND SUBSIDIARIES
NOTES TO CONSOLIDATED FINANCIAL STATEMENTS - (Continued)
Energy Price Risk
Following the expiration of certain long-term energy sales contracts, we may have exposure to market risk, and therefore revenue fluctuations, in energy markets. We have entered into contractual arrangements that will mitigate our exposure to short-term volatility through a variety of hedging techniques, and will continue to do so in the future. Our efforts in this regard will involve only mitigation of price volatility for the energy we produce, and will not involve taking positions (either long or short) on energy prices in excess of our physical generation. The amount of energy generation for which we have hedged under agreements with various financial institutions is indicated in the following table (in millions):
Calendar Year | Hedged MWh | |
2017 | 2.4 | |
2018 | 1.0 | |
Total | 3.4 | |
As of December 31, 2016, the net fair value of the energy derivatives of $2 million, pre-tax, was recorded as a $3 million current asset and a $1 million noncurrent liability and as a component of AOCI. As of December 31, 2016, the amount of hedge ineffectiveness was not material. The net fair value energy derivative balance of $2 million includes a natural gas hedge transaction of 1.3 million British Thermal Units to mitigate exposure to short-term volatility in certain contracted steam prices during the 2017 calendar year. As of December 31, 2015, the fair value of the energy derivatives of $21 million, pre-tax, was recorded as a current asset and as a component of AOCI. The change in fair value was recorded as a component of comprehensive income.
During the twelve months ended December 31, 2016, cash provided by and used in energy derivative settlements of $32 million and zero, respectively, was included in net cash provided by operating activities on our consolidated statement of cash flows. During the twelve months ended December 31, 2015, cash provided by and used in energy derivative settlements of $17 million and $7 million, respectively, was included in the change in net cash provided by operating activities on our consolidated statement of cash flows.
Interest Rate Swaps
In order to hedge the risk of adverse variable interest rate fluctuations associated with the Dublin senior term loan, we have entered into floating to fixed rate swap agreements with various financial institutions maturing between 2017 and 2021, denominated in Euros, for the full €250 million loan amount. This interest rate swap is designated as a cash flow hedge which is recorded at fair value with changes in fair value recorded as a component of AOCI. As of December 31, 2016, the fair value of the interest rate swap derivative of $20 million, pre-tax, was recorded as a $2 million and $18 million current and noncurrent liability, respectively. There was an immaterial amount of ineffectiveness recorded during the quarter recognized in our consolidated statements of operations as interest expense. As of December 31, 2015, the fair value of the interest rate swap derivative of $14 million, pre-tax, was recorded as a noncurrent liability.
NOTE 14. SUPPLEMENTARY INFORMATION
Other Operating Expense, net
Plymouth Energy-from-Waste Facility
In May 2016, our Plymouth energy-from-waste facility experienced a turbine generator failure. Damage to the turbine generator was extensive and operations at the facility were suspended promptly to assess the cause and extent of damage. The facility is capable of processing waste without utilizing the turbine generator to generate electricity, and we resumed waste processing operations in early June. The facility resumed generating electricity early in the first quarter of 2017, after the generator and other damaged equipment were replaced. The cost of replacement and business interruption losses were insured under the terms of applicable insurance policies, subject to deductibles. During the year ended December 31, 2106, we recorded insurance recoveries in our consolidated statements of operations, related to this matter, as follows (in millions):
Insurance recoveries for repair and reconstruction costs (net of write-down of assets, reduction to Other operating expense, net) | $ | 5 | |
Insurance recoveries for business interruption and clean-up costs, net of costs incurred (reduction to Plant operating expense) | $ | 3 | |
97
COVANTA HOLDING CORPORATION AND SUBSIDIARIES
NOTES TO CONSOLIDATED FINANCIAL STATEMENTS - (Continued)
Impairment Charges
The components of impairment charges are as follows (in millions):
For the Years Ended December 31, | |||||||||||
2016 | 2015 | 2014 | |||||||||
North America segment: | |||||||||||
Impairment charges related to tangible and intangible assets (1) | $ | 16 | $ | — | $ | 16 | |||||
Impairment charges related to biomass facilities and biomass equity investment (2) | — | 43 | 34 | ||||||||
Impairment charges - other | 4 | — | — | ||||||||
North America segment sub-total: | 20 | 43 | 50 | ||||||||
Other: | |||||||||||
Impairment charge related to insurance business (3) | — | — | 14 | ||||||||
Total impairment charges | $ | 20 | $ | 43 | $ | 64 | |||||
(1) | Impairment charges related to tangible and intangible assets are related to the following: |
• | During the year ended December 31, 2016, we recorded a non-cash impairment charge of $13 million, pre-tax, related to the previously planned closure of our Pittsfield EfW facility which is now expected to continue operating. For additional information see Note 3. New Business and Asset Management. We also recorded a non-cash impairment charge of $3 million, pre-tax, related to a joint-venture project, see Tartech Investment discussion below. |
• | On June 30, 2014, our service agreement with the Dutchess County Resource Recovery Agency under which we operated the Hudson Valley EfW facility expired. In 2014, we recorded a $9 million non-cash impairment charge of the intangible asset that was recorded upon acquisition in 2009 based on the expected cash flows over the remaining life of the contract utilizing Level 3 inputs. |
• | On April 3, 2014, the Montgomery County (PA) Commissioners (the “County”) unanimously voted to dissolve the Waste System Authority of Eastern Montgomery County (the “WSA”). The Abington transfer station was constructed by the County and subsequently deeded to the WSA, which was responsible for its operation. We operated the transfer station through the end of the current contract, which expired on December 31, 2014. However, due to the dissolution of the WSA, it was not able to renew our current contract to operate the Abington transfer station. During the year ended December 31, 2014, we recorded a non-cash impairment charge of $7 million of the service contract intangible with the WSA that was recorded upon acquisition in 2009 based on the expected cash flows over the remaining life of the contract utilizing Level 3 inputs. |
(2) | Impairments related to our biomass assets are as follows: |
• | During the year ended 2015, we identified indicators of impairment associated with our biomass facilities, primarily due to a decline in energy market pricing. As a result of these developments, we recorded a non-cash impairment charge of $43 million, pre-tax, which was calculated based on a range of potential outcomes utilizing various estimated cash flows for these facilities utilizing Level 3 inputs. |
• | During year ended December 31, 2014, we identified indicators of impairment associated with our California Biomass facilities, primarily that we were unsuccessful in securing new long-term power purchase agreements to replace the current power purchase agreements, which were approaching the end of their terms. Based on expected cash flows utilizing Level 3 inputs, we recorded a non-cash impairment charge of $34 million to reduce the carrying value of the California Biomass assets to their estimated fair value. |
(3) | During 2014, we sold our insurance subsidiaries and recorded a non-cash impairment of $14 million comprised of the write-down of the carrying amount in excess of the realizable fair value of $12 million, plus $2 million in disposal costs. |
Tartech Investment
We are party to a joint venture that was formed to recover and recycle metals from EfW ash monofills in North America. During the year ended December 31, 2016, due to operational difficulties and the decline in the scrap metal market, a valuation of the entity was conducted. As a result, we recorded a net impairment of our investment in this joint venture of $3 million, pre-tax, which represents our portion of the carrying value of the entity in excess of the fair value. Such amount was calculated based on the estimated liquidation value of the tangible equipment utilizing Level 3 inputs. For more information regarding fair value measurements, see Note 12. Financial Instruments.
98
COVANTA HOLDING CORPORATION AND SUBSIDIARIES
NOTES TO CONSOLIDATED FINANCIAL STATEMENTS - (Continued)
Non-Cash Convertible Debt Related Expense
The components of non-cash convertible debt related expense are as follows (in millions):
For the Years Ended December 31, | |||||||||||
2016 | 2015 | 2014 | |||||||||
Debt discount accretion related to the 3.25% Notes | $ | — | $ | — | $ | 13 | |||||
Fair value changes related to the cash convertible note hedge | — | — | (5 | ) | |||||||
Fair value changes related to the cash conversion option derivative | — | — | 5 | ||||||||
Total non-cash convertible debt related expense | $ | — | $ | — | $ | 13 | |||||
Selected Supplementary Balance Sheet Information
Selected supplementary balance sheet information is as follows (in millions):
As of December 31, | |||||||
2016 | 2015 | ||||||
Prepaid expenses | $ | 28 | $ | 37 | |||
Hedge receivables | 3 | 25 | |||||
Spare parts | 21 | 17 | |||||
Renewable energy credits | 3 | 15 | |||||
Other | 17 | 23 | |||||
Total prepaid expenses and other current assets | $ | 72 | $ | 117 | |||
Operating expenses, payroll and related expenses | $ | 164 | $ | 114 | |||
Deferred revenue | 16 | 13 | |||||
Accrued liabilities to client communities | 19 | 22 | |||||
Interest payable | 30 | 24 | |||||
Dividends payable | 35 | 34 | |||||
Other | 25 | 27 | |||||
Total accrued expenses and other current liabilities | $ | 289 | $ | 234 | |||
NOTE 15. INCOME TAXES
We file a federal consolidated income tax return with our eligible subsidiaries. Our federal consolidated income tax return also includes the taxable results of certain grantor trusts described below. The components of income tax expense were as follows (in millions):
For the Years Ended December 31, | ||||||||||||
2016 | 2015 | 2014 | ||||||||||
Current: | ||||||||||||
Federal | $ | (2 | ) | $ | (91 | ) | $ | (1 | ) | |||
State | 6 | 16 | 4 | |||||||||
Foreign | (2 | ) | 2 | 3 | ||||||||
Total current | 2 | (73 | ) | 6 | ||||||||
Deferred: | ||||||||||||
Federal | 28 | 7 | (4 | ) | ||||||||
State | (9 | ) | (11 | ) | 16 | |||||||
Foreign | 1 | (7 | ) | (3 | ) | |||||||
Total deferred | 20 | (11 | ) | 9 | ||||||||
Total income tax expense (benefit) | $ | 22 | $ | (84 | ) | $ | 15 | |||||
99
COVANTA HOLDING CORPORATION AND SUBSIDIARIES
NOTES TO CONSOLIDATED FINANCIAL STATEMENTS - (Continued)
Domestic and foreign pre-tax income (loss) was as follows (in millions):
For the Years Ended December 31, | ||||||||||||
2016 | 2015 | 2014 | ||||||||||
Domestic | $ | 26 | $ | 6 | $ | 14 | ||||||
Foreign | (12 | ) | (34 | ) | (10 | ) | ||||||
Total | $ | 14 | $ | (28 | ) | $ | 4 | |||||
The effective income tax rate was 150%, 302%, and 388% for the years ended December 31, 2016, 2015 and 2014, respectively. The decrease in effective tax rate for the year ended December 31, 2016, compared to the year ended December 31, 2015 is primarily due to the combined effects of (i) the recognition of tax benefit due to the resolution of the IRS audit in 2015 and (ii) the fact that the Company turned from pre-tax loss in 2015 to pre-tax income in 2016, offset by the uncertain tax positions recorded in 2016. The decrease in the effective tax rate for the year ended December 31, 2015, compared to the year ended December 31, 2014 was primarily due to the recognition of tax benefit due to the resolution of the IRS audit in 2015 and non-recurring adjustments from the prior year.
A reconciliation of our income tax expense (benefit) at the federal statutory income tax rate of 35% to income tax expense (benefit) at the effective tax rate is as follows (in millions):
For the Years Ended December 31, | ||||||||||||
2016 | 2015 | 2014 | ||||||||||
Income tax expense (benefit) at the federal statutory rate | $ | 5 | $ | (10 | ) | $ | 1 | |||||
State and other tax expense | 1 | 1 | 8 | |||||||||
Tax rate differential on foreign earnings | 4 | 8 | 5 | |||||||||
Permanent differences | 4 | 4 | 4 | |||||||||
Production tax credits/R&E tax credits | — | (3 | ) | (4 | ) | |||||||
State ITC credit | (4 | ) | — | — | ||||||||
Change in valuation allowance | 2 | (7 | ) | 3 | ||||||||
Liability for uncertain tax positions | 16 | (82 | ) | 5 | ||||||||
Adjustment to deferred tax | (5 | ) | 4 | (9 | ) | |||||||
Other | (1 | ) | 1 | 2 | ||||||||
Total income tax expense (benefit) | $ | 22 | $ | (84 | ) | $ | 15 | |||||
We had consolidated federal NOLs estimated to be approximately $288 million for federal income tax purposes as of the end of 2016. These consolidated federal NOLs will expire, if not used, in the following amounts in the following years (in millions):
Amount of Carryforward Expiring | |||
2028 | $ | 64 | |
2030 | 29 | ||
2031 | 1 | ||
2032 | 1 | ||
2033 | 193 | ||
$ | 288 | ||
In addition to the consolidated federal NOLs, as of December 31, 2016, we had state NOL carryforwards of approximately $291 million, which expire between 2028 and 2035, net foreign NOL carryforwards of approximately $227 million expiring between 2017 and 2036. The federal tax credit carryforwards include production tax credits of $47 million expiring between 2024 and 2036, and minimum tax credits of $7 million with no expiration. Additionally, we had state income tax credit of $1 million. The corresponding deferred tax assets are offset by a valuation allowance of approximately $71 million.
100
COVANTA HOLDING CORPORATION AND SUBSIDIARIES
NOTES TO CONSOLIDATED FINANCIAL STATEMENTS - (Continued)
The tax effects of temporary differences that give rise to the deferred tax assets and liabilities are presented as follows (in millions):
As of December 31, | ||||||||
2016 | 2015 | |||||||
Deferred tax assets: | ||||||||
Capital loss carryforward | $ | — | $ | 3 | ||||
Net operating loss carryforwards | 143 | 157 | ||||||
Accrued expenses | 20 | 24 | ||||||
Prepaid and other costs | 71 | 36 | ||||||
Deferred tax assets attributable to pass-through entities | 17 | 17 | ||||||
Retirement benefits | 3 | — | ||||||
Other | 4 | 4 | ||||||
AMT and other credit carryforwards | 55 | 67 | ||||||
Total gross deferred tax asset | 313 | 308 | ||||||
Less: valuation allowance | (71 | ) | (73 | ) | ||||
Total deferred tax asset | 242 | 235 | ||||||
Deferred tax liabilities: | ||||||||
Unbilled accounts receivable | 3 | 4 | ||||||
Property, plant and equipment | 780 | 725 | ||||||
Intangible assets | 36 | 18 | ||||||
Deferred tax liabilities attributable to pass-through entities | 22 | 26 | ||||||
Deferred gain on convertible debt | 13 | 20 | ||||||
Swap income | — | 2 | ||||||
Prepaid expenses | — | 23 | ||||||
Other, net | 5 | 11 | ||||||
Total gross deferred tax liability | 859 | 829 | ||||||
Net deferred tax liability | $ | 617 | $ | 594 | ||||
Cumulative undistributed foreign earnings for which United States taxes were not provided were included in consolidated retained earnings in the amount of approximately $257 million and $264 million as of December 31, 2016 and 2015, respectively. Such amounts are considered permanently invested, therefore no provision for U.S. income taxes has been accrued. Determination of the unrecognized deferred tax liability for these undistributed foreign earnings is not practicable.
Deferred tax assets relating to employee stock based compensation deductions were reduced to reflect exercises of non-qualified stock option grants and vesting of restricted stock. Some exercises of non-qualified stock option grants and vesting of restricted stock resulted in tax deductions in excess of previously recorded benefits resulting in a "windfall". Although these additional deductions were reported on the corporate tax returns and increased NOLs, these related tax benefits were not recognized for financial reporting purposes. These windfalls will not be recognized until the related deductions result in a reduction of taxes payable and cash tax payments. Accordingly, since the tax benefit does not reduce our current taxes payable, these tax benefits were not reflected in deferred tax assets for financial reporting purposes as of December 31, 2016 and 2015. Such benefits included in NOLs but not reflected in deferred tax assets were approximately $26 million as of both December 31, 2016 and 2015.
101
COVANTA HOLDING CORPORATION AND SUBSIDIARIES
NOTES TO CONSOLIDATED FINANCIAL STATEMENTS - (Continued)
A reconciliation of the beginning and ending amount of unrecognized tax benefits is as follows (in millions):
Balance at December 31, 2013 | $ | 128 | |
Additions based on tax positions related to the current year | 8 | ||
Additions for tax positions of prior years | — | ||
Reductions for lapse in applicable statute of limitations | (3 | ) | |
Reductions for tax positions of prior years | — | ||
Balance at December 31, 2014 | 133 | ||
Additions based on tax positions related to the current year | 12 | ||
Additions for tax positions of prior years | — | ||
Reductions for lapse in applicable statute of limitations | — | ||
Reductions for tax positions of prior years | (109 | ) | |
Balance at December 31, 2015 | 36 | ||
Additions based on tax positions related to the current year | 16 | ||
Additions for tax positions of prior years | 4 | ||
Reductions for lapse in applicable statute of limitations | (3 | ) | |
Reductions for tax positions of prior years | (4 | ) | |
Payment | (6 | ) | |
Balance at December 31, 2016 | $ | 43 | |
The uncertain tax positions, exclusive of interest and penalties, were $43 million and $36 million as of December 31, 2016 and 2015, respectively, which also represent potential tax benefits that if recognized, would impact the effective tax rate.
We record interest accrued on liabilities for uncertain tax positions and penalties as part of the tax provision. As of December 31, 2016 and 2015, we had accrued interest and penalties associated with liabilities for uncertain tax positions of $3 million and $1 million, respectively. We continue to reflect interest accrued and penalties on uncertain tax positions as part of the tax provision.
Audits for federal income tax returns are closed for the years through 2009. However, the Internal Revenue Service ("IRS") can audit the NOL's generated during those years in the years that the NOL's are utilized.
State income tax returns are generally subject to examination for a period of three to six years after the filing of the respective tax return. The state impact of any federal changes remains subject to examination by various states for a period of up to one year after formal notification to the states. We have various state income tax returns in the process of examination, administrative appeals or litigation.
Our NOLs predominantly arose from our predecessor insurance entities, formerly named Mission Insurance Group, Inc., (“Mission”). These Mission insurance entities have been in state insolvency proceedings in California and Missouri since the late 1980's. The amount of NOLs available to us will be reduced by any taxable income or increased by any taxable losses generated by current members of our consolidated tax group, which include grantor trusts associated with the Mission insurance entities.
While we cannot predict what amounts, if any, may be includable in taxable income as a result of the final administration of these grantor trusts, substantial actions toward such final administration have been taken and we believe that neither arrangements with the California Commissioner of Insurance nor the final administration by the Missouri Director will result in a material reduction in available NOLs.
NOTE 16. EMPLOYEE BENEFIT PLANS
We sponsor various retirement plans covering the majority of our employees and retirees in the United States, as well as other postretirement benefit plans for a small number of retirees in the United States that include healthcare benefits and life insurance coverage. Employees in the United States not participating in our retirement plans generally participate in retirement plans offered by collective bargaining units of which these employees are members. The majority of our international employees participate in defined benefit or defined contribution retirement plans as required or available in accordance with local laws.
102
COVANTA HOLDING CORPORATION AND SUBSIDIARIES
NOTES TO CONSOLIDATED FINANCIAL STATEMENTS - (Continued)
Defined Contribution Plans
Substantially all of our employees in the United States are eligible to participate in the defined contribution plans we sponsor. The defined contribution plans allow employees to contribute a portion of their compensation on a pre-tax basis in accordance with specified guidelines. We match a percentage of employee contributions up to certain limits. We also provide a company contribution to the defined contribution plans for eligible employees. Our costs related to defined contribution plans were $17 million, $16 million and $16 million for the years ended December 31, 2016, 2015 and 2014, respectively.
Pension and Postretirement Benefit Obligations
In 2012, the IRS approved our plan to terminate the qualified defined benefit pension plan. During 2013, $35 million of annuity contracts were purchased on behalf of participants who elected an annuity option and we recorded a pre-tax defined benefit pension plan settlement gain of $6 million, which was recorded as other operating income in our consolidated statements of operations. Such annuity purchase concluded the termination of the defined benefit pension plan, accordingly, we have no future obligations related to the qualified defined benefit pension plan.
The discount rate for the non-qualified pension plans was 4.10%, 4.35% and 4.05% for the years ended December 31, 2016, 2015 and 2014, respectively.
For the other postretirement benefit plan, an annual rate of increase of 7.0% in the per capita cost of health care benefits was assumed for 2016 for covered employees. An average increase of 7.0% was assumed for 2017. The average increase was then projected to gradually decline to 5.0% in 2022 and remain at that level. In general, assumed health care cost trend rates have a significant effect on the amounts reported for the health care plan. A one-percentage point change (either increase or decrease) in the assumed health care trend rate would have an immaterial (approximately $0.2 million) effect on either total service and interest cost components or postretirement benefit obligations.
For the pension plans with accumulated benefit obligations in excess of plan assets, the projected benefit obligation, accumulated benefit obligation, and fair value of plan assets were $1 million, $1 million and $0, respectively, as of December 31, 2016 and $4 million, $4 million, and $0, respectively, as of December 31, 2015.
As of December 31, 2016, we estimate that the future benefits payable over the next ten years for the retirement and postretirement plans in place are $1 million for pension benefits, $2 million for other benefits (net of Medicare Part D subsidy) and $0 million for attributable to Medicare Part D subsidy.
Pension costs for our defined benefit plans and other post-retirement benefit plans were not material.
103
COVANTA HOLDING CORPORATION AND SUBSIDIARIES
NOTES TO CONSOLIDATED FINANCIAL STATEMENTS - (Continued)
Obligation and Funded Status
The following table is a reconciliation of the changes in the benefit obligations and fair value of assets for our non-qualified defined benefit pension plan and other postretirement benefit plan, the funded status (using a December 31 measurement date) of the plans and the related amounts recognized in our consolidated balance sheets (in millions, except percentages as noted):
Non-qualified Pension Benefits | Other Benefits | |||||||||||||||
For the Years Ended December 31, | For the Years Ended December 31, | |||||||||||||||
2016 | 2015 | 2016 | 2015 | |||||||||||||
Change in benefit obligation: | ||||||||||||||||
Benefit obligation at beginning of year | $ | 4 | $ | 4 | $ | 4 | $ | 5 | ||||||||
Actuarial gain | — | — | (1 | ) | (1 | ) | ||||||||||
Benefits paid | (3 | ) | — | — | — | |||||||||||
Benefit obligation at end of year | $ | 1 | $ | 4 | $ | 3 | $ | 4 | ||||||||
Change in plan assets: | ||||||||||||||||
Plan assets at fair value at beginning of year | $ | — | $ | — | $ | — | $ | — | ||||||||
Contributions | 3 | — | — | — | ||||||||||||
Benefits paid | (3 | ) | — | — | — | |||||||||||
Plan assets at fair value at end of year | $ | — | $ | — | $ | — | $ | — | ||||||||
Reconciliation of accrued benefit liability and net amount recognized: | ||||||||||||||||
Funded status of the plan | $ | (1 | ) | $ | (4 | ) | $ | (3 | ) | $ | (4 | ) | ||||
Unrecognized net gain | — | — | — | — | ||||||||||||
Net amount recognized | $ | (1 | ) | $ | (4 | ) | $ | (3 | ) | $ | (4 | ) | ||||
Accumulated other comprehensive income recognized: | ||||||||||||||||
Net actuarial gain | $ | — | $ | — | $ | (4 | ) | $ | (4 | ) | ||||||
Net prior service cost | (1 | ) | (1 | ) | — | — | ||||||||||
Total as of December 31, | $ | (1 | ) | $ | (1 | ) | $ | (4 | ) | $ | (4 | ) | ||||
Weighted average assumptions used to determine net periodic benefit expense for years ending December 31: | ||||||||||||||||
Discount rate | 4.35 | % | 4.05 | % | 3.75 | % | 3.50 | % | ||||||||
Weighted average assumptions used to determine projected benefit obligations as of December 31: | ||||||||||||||||
Discount rate | 4.10 | % | 4.35 | % | 3.55 | % | 3.75 | % | ||||||||
NOTE 17. STOCK-BASED AWARD PLANS
Stock-Based Award Plans
In May 2014, the stockholders of the Company approved the Covanta Holding Corporation 2014 Equity Award Plan (the “Plan”) to provide incentive compensation to non-employee directors, officers and employees, and to consolidate the two previously existing equity compensation plans into a single plan: the Company’s Equity Award Plan for Employees and Officers (the “Former Employee Plan”) and the Company’s Equity Award Plan for Directors (the “Former Director Plan,” and together with the Former Employee Plan, the “Former Plans”). Shares that were available for issuance under the Former Plans will be available for issuance under the Plan. The stockholders of the Company also approved the authorization of 6 million new shares of our common stock for issuance under the Plan.
The purpose of the Plan is to promote our interests (including our subsidiaries and affiliates) and our stockholders’ interests by using equity interests to attract, retain and motivate our management, non-employee directors and other eligible persons and to encourage and reward their contributions to our performance and profitability. The Plan provides for awards to be made in the form of (a) shares of restricted stock, (b) restricted stock units, (c) incentive stock options, (d) non-qualified stock options, (e) stock appreciation rights, (f) performance awards, or (g) other stock-based awards which relate to or serve a similar function to the awards described above. Awards may be made on a standalone, combination or tandem basis.
104
COVANTA HOLDING CORPORATION AND SUBSIDIARIES
NOTES TO CONSOLIDATED FINANCIAL STATEMENTS - (Continued)
Stock-Based Compensation
We recognize compensation costs using the graded vesting attribution method over the requisite service period of the award, which is generally three to five years. We recognize compensation expense based on the number of stock options, restricted stock awards and restricted stock units expected to vest by using an estimate of expected forfeitures. We review the forfeiture rates at least annually and revise compensation expense, if necessary. During 2016, the average forfeiture rates were 12% for restricted stock awards and 15% for restricted stock units. Stock-based compensation expense is as follows (in millions, except for weighted average years):
As of December 31, 2016 | ||||||||||||||||||
Total Compensation Expense for the Years Ended December 31, | Unrecognized stock-based compensation expense | Weighted-average years to be recognized | ||||||||||||||||
2016 | 2015 | 2014 | ||||||||||||||||
Restricted Stock Awards | $ | 10 | $ | 11 | $ | 11 | $ | 7 | 1.4 | |||||||||
Restricted Stock Units | $ | 6 | $ | 6 | $ | 6 | $ | 8 | 2.1 | |||||||||
Restricted Stock Awards
Restricted stock awards that have been issued to employees typically vest over a three-year period. Restricted stock awards are stock-based awards for which the employee or director does not have a vested right to the stock (“nonvested”) until the requisite service period has been rendered or the required financial performance factor has been reached for each pre-determined vesting date. Stock-based compensation expense for each financial performance factor is recognized beginning in the period when management has determined it is probable the financial performance factor will be achieved for the respective vesting period. The fair value of shares vested during the year was $9 million.
Restricted stock awards to employees are subject to forfeiture if the employee is not employed on the vesting date. Restricted stock awards issued to directors are not subject to forfeiture in the event a director ceases to be a member of the Board of Directors, except in limited circumstances. Restricted stock awards will be expensed over the requisite service period, subject to an estimated forfeiture rate. Prior to vesting, restricted stock awards have all of the rights of common stock (other than the right to sell or otherwise transfer, when issued). We calculate the fair value of share-based stock awards based on the closing price on the date the award was granted.
During 2016 we awarded certain employees 752,426 shares of restricted stock. The restricted stock awards will be expensed over the requisite service period, subject to an estimated 12% average forfeiture rate. The terms of the restricted stock awards include vesting provisions based solely on continued service. If the service criteria are satisfied, the restricted stock awards vest generally during March of 2017, 2018, and 2019.
During 2016, we awarded 9,000 shares of restricted stock for annual director compensation. We determined that the service vesting condition of these restricted stock awards to be non-substantive and, in accordance with accounting principles for stock compensation, recorded the entire fair value of the award as compensation expense on the grant date.
Changes in nonvested restricted stock awards were as follows (in thousands, except per share amounts):
As of December 31, | |||||||||||||||||||||
2016 | 2015 | 2014 | |||||||||||||||||||
Number of Shares | Weighted- Average Grant Date Fair Value | Number of Shares | Weighted- Average Grant Date Fair Value | Number of Shares | Weighted- Average Grant Date Fair Value | ||||||||||||||||
Nonvested at the beginning of the year | 1,060 | $ | 19.79 | 1,240 | $ | 17.67 | 1,166 | $ | 17.85 | ||||||||||||
Granted | 761 | $ | 15.14 | 573 | $ | 21.88 | 721 | $ | 17.20 | ||||||||||||
Vested | (532 | ) | $ | 19.36 | (661 | ) | $ | 17.69 | (608 | ) | $ | 17.27 | |||||||||
Forfeited | (69 | ) | $ | 17.51 | (92 | ) | $ | 19.36 | (39 | ) | $ | 17.80 | |||||||||
Nonvested at the end of the year | 1,220 | $ | 17.20 | 1,060 | $ | 19.79 | 1,240 | $ | 17.67 | ||||||||||||
105
COVANTA HOLDING CORPORATION AND SUBSIDIARIES
NOTES TO CONSOLIDATED FINANCIAL STATEMENTS - (Continued)
Restricted Stock Units
In 2010, we awarded restricted stock units (“RSUs”) to certain employees in connection with specified growth-based acquisitions or development projects. Vesting of the RSUs is based on the net present value of projected cash flows of the applicable acquisition or development project, calculated as of the award date versus the vesting date. Vesting will occur after at least three years have passed following an acquisition or upon the later of three years from the grant date or one year following the commencement of commercial operations for development projects. For certain stock unit awards, dividends accrue prior to vesting and are paid when the awards vest. We calculate the fair value of share-based stock awards based on the closing price on the date the award was granted.
In January, 2016, we awarded certain employees 356,622 RSUs related to a special retention bonus that will vest after a three-year period.
In March, 2016, we awarded certain employees 471,381 RSUs, 390,728 of which will vest based upon the Company’s cumulative Free Cash Flow per share over a three-year performance period.
In May, 2016, we awarded 54,591 restricted stock units for annual director compensation. We determined the service vesting condition of these restricted stock awards and restricted stock units to be non-substantive and, in accordance with accounting principles for stock compensation, recorded the entire fair value of the awards as compensation expense on the grant date.
In September, 2016, the Board of Directors appointed two new board members. We awarded 5,550 restricted stock units for the prorated portion of the annual director compensation with respect to these directors. We determined the service vesting condition of these restricted stock awards and restricted stock units to be non-substantive and, in accordance with accounting principles for stock compensation, recorded the entire fair value of the awards as compensation expense on the grant date.
Changes in nonvested restricted stock units were as follows (in thousands, except per share amounts):
As of December 31, | |||||||||||||||||||||
2016 | 2015 | 2014 | |||||||||||||||||||
Number of Shares | Weighted- Average Grant Date Fair Value | Number of Shares | Weighted- Average Grant Date Fair Value | Number of Shares | Weighted- Average Grant Date Fair Value | ||||||||||||||||
Nonvested at the beginning of the year | 1,189 | $ | 17.60 | 894 | $ | 15.93 | 691 | $ | 16.66 | ||||||||||||
Granted | 888 | $ | 14.65 | 322 | $ | 21.95 | 247 | $ | 14.60 | ||||||||||||
Vested | (51 | ) | $ | 20.24 | (21 | ) | $ | 17.94 | (44 | ) | $ | 16.51 | |||||||||
Forfeited | (223 | ) | $ | 16.29 | (6 | ) | $ | 21.99 | — | $ | — | ||||||||||
Nonvested at the end of the year | 1,803 | $ | 16.25 | 1,189 | $ | 17.60 | 894 | $ | 15.93 | ||||||||||||
Stock Options
We have also awarded stock options to certain employees and directors. Stock options awarded to directors vested immediately. Stock options awarded to employees have typically vested annually over three to five years and expire over ten years. We calculate the fair value of our share-based option awards using the Black-Scholes option pricing model which requires estimates of the expected life of the award and stock price volatility.
106
COVANTA HOLDING CORPORATION AND SUBSIDIARIES
NOTES TO CONSOLIDATED FINANCIAL STATEMENTS - (Continued)
The following table summarizes activity and balance information of the options under the 2014 Stock Option Plan:
As of December 31, | |||||||||||||||||||||
2016 | 2015 | 2014 | |||||||||||||||||||
Shares | Weighted Average Exercise Price | Shares | Weighted Average Exercise Price | Shares | Weighted Average Exercise Price | ||||||||||||||||
2014 Stock Option Plan | (in thousands, except per share amounts) | ||||||||||||||||||||
Outstanding at the beginning of the year | 1,100 | $ | 21.37 | 1,113 | $ | 21.25 | 1,686 | $ | 20.42 | ||||||||||||
Granted | — | $ | — | — | $ | — | 25 | $ | 20.58 | ||||||||||||
Exercised | — | $ | — | (13 | ) | $ | 11.40 | (532 | ) | $ | 18.53 | ||||||||||
Expired | (20 | ) | $ | — | — | $ | — | (66 | ) | $ | 20.52 | ||||||||||
Forfeited | — | $ | — | — | $ | — | — | $ | — | ||||||||||||
Outstanding at the end of the year | 1,080 | $ | 21.38 | 1,100 | $ | 21.37 | 1,113 | $ | 21.25 | ||||||||||||
Options exercisable at year end | 1,080 | $ | 21.38 | 1,100 | $ | 21.37 | 1,100 | $ | 21.26 | ||||||||||||
Options available for future grant | 4,003 | 5,652 | 6,548 | ||||||||||||||||||
As of December 31, 2016, options for shares were in the following price ranges (in thousands, except years and per share amounts):
Weighted Average Remaining Contractual Life (Years) | ||||||||||||||||
Options Outstanding | Options Exercisable | |||||||||||||||
Exercise Price Range | Number of Shares | Weighted Average Exercise Price | Number of Shares | Weighted Average Exercise Price | ||||||||||||
$20.52 — $20.58 | 850 | $ | 20.52 | 0.4 | 850 | $ | 20.52 | |||||||||
$23.30 — $24.76 | 230 | $ | 24.57 | 1.4 | 230 | $ | 24.57 | |||||||||
1,080 | 1,080 | |||||||||||||||
The total cash received from the exercise of stock options was zero, less than $1 million and $10 million, for the years ended December 31, 2016, 2015 and 2014, respectively. The tax benefits related to the exercise of the non-qualified stock options and the vesting of the restricted stock award were not recognized during the years ended December 31, 2016, 2015 and 2014 due to our NOLs. When the NOLs have been fully utilized by us, we will recognize a tax benefit and an increase in additional paid-in capital for the excess tax deductions received on the exercised non-qualified stock options and vested restricted stock. Future realization of the tax benefit will be presented in cash flows from financing activities in the consolidated statements of cash flows in the period the tax benefit is recognized. Previously recorded tax benefits that are in excess of the realized tax benefit on a particular non-qualified stock option or restricted stock are recorded as an increase to income tax expense since there is no additional paid-in capital pool available to offset these reduced tax benefits.
The aggregate intrinsic value as of December 31, 2016 for options exercisable was $0 for options outstanding and options vested. All options outstanding as of December 31, 2016 are fully vested. The aggregate intrinsic value represents the total pre-tax intrinsic value (the difference between the closing stock price on the last trading day of 2016 and the exercise price, multiplied by the number of in-the-money options) that would have been received by the option holders had all option holders exercised their options on the last trading day of 2016 (December 30, 2016). The intrinsic value changes based on the fair market value of our common stock. The total intrinsic value of options exercised for the years ended as of December 31, 2016, 2015 and 2014 was $0, $0, and $1 million, respectively.
As of December 31, 2016, there were options to purchase 1 million shares of common stock that had vested at a weighted average exercise price of $21.38.
NOTE 18. COMMITMENTS AND CONTINGENCIES
We and/or our subsidiaries are party to a number of claims, lawsuits and pending actions, most of which are routine and all of which are incidental to our business. We assess the likelihood of potential losses on an ongoing basis and when losses are considered probable and reasonably estimable, record as a loss an estimate of the outcome. If we can only estimate the range of a possible loss, an amount representing the low end of the range of possible outcomes is recorded. Our assessments are based on estimates and assumptions that have been deemed reasonable by management, but the assessment process relies on estimates and assumptions
107
COVANTA HOLDING CORPORATION AND SUBSIDIARIES
NOTES TO CONSOLIDATED FINANCIAL STATEMENTS - (Continued)
that may prove to be incomplete or inaccurate, and unanticipated events or circumstances may occur that might cause us to change those estimates and assumptions. The final consequences of these proceedings are not presently determinable with certainty. As of December 31, 2016 and 2015, accruals for our loss contingencies approximated $11 million and $1 million, respectively.
Environmental Matters
Our operations are subject to environmental regulatory laws and environmental remediation laws. Although our operations are occasionally subject to proceedings and orders pertaining to emissions into the environment and other environmental violations, which may result in fines, penalties, damages or other sanctions, we believe that we are in substantial compliance with existing environmental laws and regulations.
We may be identified, along with other entities, as being among parties potentially responsible for contribution to costs associated with the correction and remediation of environmental conditions at disposal sites subject to federal and/or analogous state laws. In certain instances, we may be exposed to joint and several liabilities for remedial action or damages. Our liability in connection with such environmental claims will depend on many factors, including our volumetric share of waste, the total cost of remediation, and the financial viability of other companies that also sent waste to a given site and, in the case of divested operations, the contractual arrangement with the purchaser of such operations.
The potential costs related to the matters described below and the possible impact on future operations are uncertain due in part to the complexity of governmental laws and regulations and their interpretations, the varying costs and effectiveness of cleanup technologies, the uncertain level of insurance or other types of recovery and the questionable level of our responsibility. Although the ultimate outcome and expense of any litigation, including environmental remediation, is uncertain, we believe that the following proceedings will not have a material adverse effect on our consolidated financial position or results of operations.
Lower Passaic River Matter. In August 2004, the United States Environmental Protection Agency (the “EPA”) notified Covanta Essex Company (“Essex”) that it was a potentially responsible party (“PRP”) for Superfund response actions in the Lower Passaic River Study Area, referred to as “LPRSA,” a 17 mile stretch of river in northern New Jersey. Essex’s LPRSA costs to date are not material to its financial position and results of operations; however, to date the EPA has not sought any LPRSA remedial costs or natural resource damages against PRPs. On March 3, 2016, the EPA released the Record of Decision (“ROD”) for its Focused Feasibility Study of the lower 8 miles of the LPRSA; the EPA’s selected remedy includes capping/dredging of sediment, institutional controls and long-term monitoring. The Essex facility started operating in 1990 and Essex does not believe there have been any releases to the LPRSA, but in any event believes any releases would have been de minimis considering the history of the LPRSA; however, it is not possible at this time to predict that outcome or to estimate the range of possible loss relating to Essex’s liability in the matter, including for LPRSA remedial costs and/or natural resource damages.
Tulsa Matter. In January 2016, we were informed by the office of the United States Attorney for the Northern District of Oklahoma (“U.S. Attorney”) that our subsidiary, Covanta Tulsa Renewable Energy LLC, is the target of a criminal investigation being conducted by the EPA. We understand that the EPA plans to allege improprieties in the recording and reporting of emissions data during an October 2013 incident involving one of the three municipal waste combustion units at our Tulsa, Oklahoma facility. We believe that our operations in Tulsa were and are in compliance with existing laws and regulations in all material respects. While we can provide no assurance as to the outcome of this matter, we do not believe that the investigation or any issues arising therefrom will have a material adverse effect on our financial position, cash flows or results of operations.
Other Matters
Durham-York Contractor Arbitration
We are seeking to resolve outstanding disputes with our primary contractor for the Durham-York construction project regarding (i) claims by the contractor for change orders and other expense reimbursement and (ii) claims by us for charges and liquidated damages for project completion delays. Our contract with this contractor contemplates binding arbitration to resolve these disputes, which we expect may conclude in 2017. While we do not expect resolution of these disputes to have a material adverse impact on our financial position, it could be material to our results of operations and or cash flows in any given accounting period.
China Indemnification Claims
Subsequent to completing the exchange of our project ownership interests in China for a 15% ownership interest in Sanfeng Environment (see Note 4. Dispositions, Assets Held for Sale and Discontinued Operations), Sanfeng Environment made certain claims for indemnification under the agreement related to the condition of the facility in Taixing. To the extent that any payment is made related to these claims, such amount could reduce the gain recorded in a future period.
108
COVANTA HOLDING CORPORATION AND SUBSIDIARIES
NOTES TO CONSOLIDATED FINANCIAL STATEMENTS - (Continued)
Other Commitments
Other commitments as of December 31, 2016 were as follows (in millions):
Commitments Expiring by Period | ||||||||||||
Total | Less Than One Year | More Than One Year | ||||||||||
Letters of credit issued under the Revolving Credit Facility | $ | 156 | $ | — | $ | 156 | ||||||
Letters of credit - other | 61 | — | 61 | |||||||||
Surety bonds | 158 | — | 158 | |||||||||
Total other commitments — net | $ | 375 | $ | — | $ | 375 | ||||||
The letters of credit were issued to secure our performance under various contractual undertakings related to our domestic and international projects or to secure obligations under our insurance program. Each letter of credit relating to a project is required to be maintained in effect for the period specified in related project contracts, and generally may be drawn if it is not renewed prior to expiration of that period.
We believe that we will be able to fully perform under our contracts to which these existing letters of credit relate, and that it is unlikely that letters of credit would be drawn because of a default of our performance obligations. If any of these letters of credit were to be drawn by the beneficiary, the amount drawn would be immediately repayable by us to the issuing bank. If we do not immediately repay such amounts drawn under letters of credit issued under the Revolving Credit Facility, unreimbursed amounts would be treated under the Credit Facilities as either additional term loans or as revolving loans.
The surety bonds listed in the table above relate primarily to construction and performance obligations and support for other obligations, including closure requirements of various energy projects when such projects cease operating. Were these bonds to be drawn upon, we would have a contractual obligation to indemnify the surety company.
We have certain contingent obligations related to the 7.25% Notes, 6.375% Notes, 5.875% Notes, and Tax-Exempt Bonds. Holders may require us to repurchase their 7.25% Notes, 6.375% Notes, 5.875% Notes and Tax-Exempt Bonds if a fundamental change occurs. For specific criteria related to the redemption features of the 5.875% Notes, 7.25% Notes or 6.375% Notes, see Note 11. Consolidated Debt.
We have issued or are party to guarantees and related contractual support obligations undertaken pursuant to agreements to construct and operate waste and energy facilities. For some projects, such performance guarantees include obligations to repay certain financial obligations if the project revenue is insufficient to do so, or to obtain or guarantee financing for a project. With respect to our businesses, we have issued guarantees to municipal clients and other parties that our subsidiaries will perform in accordance with contractual terms, including, where required, the payment of damages or other obligations. Additionally, damages payable under such guarantees for our energy-from-waste facilities could expose us to recourse liability on project debt. If we must perform under one or more of such guarantees, our liability for damages upon contract termination would be reduced by funds held in trust and proceeds from sales of the facilities securing the project debt and is presently not estimable. Depending upon the circumstances giving rise to such damages, the contractual terms of the applicable contracts, and the contract counterparty’s choice of remedy at the time a claim against a guarantee is made, the amounts owed pursuant to one or more of such guarantees could be greater than our then-available sources of funds. To date, we have not incurred material liabilities under such guarantees.
Dublin EfW Facility
In connection with the financing of the Dublin EfW facility, Covanta Energy has made commitments for contingent support as follows: (1) lending commitments up to €25 million to fund working capital shortfalls in the project company under certain circumstances during operations; and (2) up to €75 million commitment in the aggregate to provide support payments to the project company, under certain circumstances, in the event waste revenue falls below minimum levels (set far below anticipated levels). For additional information on the Dublin EfW facility, see Note 3. New Business and Asset Management and Note 11. Consolidated Debt.
New York City Contract Investments
In 2013, New York City awarded us a contract to handle waste transport and disposal from two marine transfer stations located in Queens and Manhattan. Service for the Queens marine transfer station began in early 2015, service for the Manhattan marine transfer station is expected to follow pending notice to proceed to be issued by New York City which is anticipated in 2018. As of December 31, 2016, we expect to incur approximately $33 million of additional capital expenditures, primarily for transportation equipment.
109
COVANTA HOLDING CORPORATION AND SUBSIDIARIES
NOTES TO CONSOLIDATED FINANCIAL STATEMENTS - (Continued)
NOTE 19. QUARTERLY DATA (UNAUDITED)
The following table presents quarterly unaudited financial data for the periods presented on the consolidated statements of operations (in millions, except per share amounts):
Calendar Quarter Ended | ||||||||||||||||||||||||||||||||
March 31, | June 30, | September 30, | December 31, | |||||||||||||||||||||||||||||
2016 | 2015 | 2016 | 2015 | 2016 | 2015 | 2016 | 2015 | |||||||||||||||||||||||||
Operating revenue | $ | 403 | $ | 383 | $ | 418 | $ | 408 | $ | 421 | $ | 422 | $ | 457 | $ | 432 | ||||||||||||||||
Operating (loss) income (1) | $ | (14 | ) | $ | 7 | $ | 5 | $ | (15 | ) | $ | 60 | $ | 74 | $ | 58 | $ | 43 | ||||||||||||||
Net (loss) income | $ | (37 | ) | $ | (37 | ) | $ | (29 | ) | $ | (6 | ) | $ | 54 | $ | 34 | $ | 8 | $ | 78 | ||||||||||||
Net (loss) income attributable to Covanta Holding Corporation | $ | (37 | ) | $ | (37 | ) | $ | (29 | ) | $ | (6 | ) | $ | 54 | $ | 34 | $ | 8 | $ | 77 | ||||||||||||
(Loss) Earnings per share attributable to Covanta Holding Corporation stockholders: | ||||||||||||||||||||||||||||||||
Basic | $ | (0.29 | ) | $ | (0.28 | ) | $ | (0.23 | ) | $ | (0.05 | ) | $ | 0.42 | $ | 0.26 | $ | 0.06 | $ | 0.59 | ||||||||||||
Diluted | $ | (0.29 | ) | $ | (0.28 | ) | $ | (0.23 | ) | $ | (0.05 | ) | $ | 0.42 | $ | 0.25 | $ | 0.06 | $ | 0.58 | ||||||||||||
Cash dividend declared per share: | $ | 0.25 | $ | 0.25 | $ | 0.25 | $ | 0.25 | $ | 0.25 | $ | 0.25 | $ | 0.25 | $ | 0.25 | ||||||||||||||||
(1)As restated for the quarters ending March 31, June 30, September 30 and December 31, 2015, for reclassification of Net interest expense (income) on project debt of $2 million, $5 million, $3 million, and $(1) million, respectively, to Interest expense, net on our consolidated statement of operations. As a result, Operating income (loss) increased (decreased) accordingly.
NOTE 20. SUBSEQUENT EVENTS
Southeast Connecticut Energy-from -Waste Facility
On February 22, 2017, we extended our agreement with the Southeastern Connecticut Regional Resource Recovery Authority for an additional four years. As a result, our Southeast Connecticut energy-from-waste facility is now operating under a tip fee structure.
Fairfax County Energy-from-Waste Facility
On February 2, 2017, our Fairfax County energy-from waste facility located in Lorton, Virginia experienced a fire in the front-end receiving portion of the facility. We are still investigating and evaluating the impact of the event, and once this effort is completed, we may have an asset impairment. The cost of repair or replacement, and business interruption losses, are insured, subject to applicable deductibles. We do not expect that this will have a significant impact on our 2017 financial results.
Schedule II — Valuation and Qualifying Accounts
Receivables Valuation and Qualifying Accounts
Additions | ||||||||||||||||||||
Balance Beginning of Year | Charged to Costs and Expense | Charged to Other Accounts | Deductions | Balance at End of Period | ||||||||||||||||
(In millions) | ||||||||||||||||||||
2016 – Reserves for doubtful accounts | $ | 7 | $ | 3 | $ | — | $ | 1 | $ | 9 | ||||||||||
2015 – Reserves for doubtful accounts | $ | 6 | $ | 1 | $ | — | $ | — | $ | 7 | ||||||||||
2014 – Reserves for doubtful accounts | $ | 4 | $ | 4 | $ | — | $ | 2 | $ | 6 | ||||||||||
110
Item 9. | CHANGES IN AND DISAGREEMENTS WITH ACCOUNTANTS ON ACCOUNTING AND FINANCIAL DISCLOSURE |
There were no disagreements with accountants on accounting and financial disclosure.
Item 9A. CONTROLS AND PROCEDURES
Our management, with the participation of our Chief Executive Officer and Chief Financial Officer, has evaluated the effectiveness of Covanta’s disclosure controls and procedures, as required by Rule 13a-15(b) and 15d-15(b) under the Securities Exchange Act of 1934 (the “Exchange Act”) as of December 31, 2016. Our disclosure controls and procedures are designed to reasonably assure that information required to be disclosed by us in reports we file or submit under the Exchange Act is accumulated and communicated to our management, including our Chief Executive Officer and Chief Financial Officer, as appropriate to allow timely decisions regarding disclosure and is recorded, processed, summarized and reported within the time periods specified in the Securities and Exchange Commission’s rules and forms.
Our management, including our Chief Executive Officer and Chief Financial Officer, believes that any disclosure controls and procedures or internal controls and procedures, no matter how well conceived and operated, can provide only reasonable, not absolute, assurance that the objectives of the control system are met. Further, the design of a control system must consider the benefits of controls relative to their costs. Inherent limitations within a control system include the realities that judgments in decision-making can be faulty, and that breakdowns can occur because of simple error or mistake. Additionally, controls can be circumvented by the individual acts of some persons, by collusion of two or more people, or by unauthorized override of the control. While the design of any system of controls is to provide reasonable assurance of the effectiveness of disclosure controls, such design is also based in part upon certain assumptions about the likelihood of future events, and such assumptions, while reasonable, may not take into account all potential future conditions. Accordingly, because of the inherent limitations in a cost effective control system, misstatements due to error or fraud may occur and may not be prevented or detected.
Our management has conducted an assessment of its internal control over financial reporting as of December 31, 2016 as required by Section 404 of the Sarbanes-Oxley Act. Management’s report on our internal control over financial reporting is included on page 113. The Independent Registered Public Accounting Firm’s report with respect to the effectiveness of our internal control over financial reporting is included on page 114.
As previously disclosed in Item 4 of our Quarterly Reports on Form 10-Q filed during the year ended December 31, 2016, our Chief Executive Officer and Chief Financial Officer concluded that we did not maintain effective internal controls over financial reporting because we had control deficiencies which constituted "material weaknesses" in two areas: (i) municipally-owned facility construction accounting and (ii) income tax accounting. Our Chief Executive Officer and Chief Financial Officer have concluded that, based on their reviews, the first material weakness noted above has been remediated, while the second, as further explained below, requires additional time to test the effectiveness of corrective measures taken, and thus has not been remediated. As such, our Chief Executive officer and Chief Financial Officer have concluded that our disclosure controls and procedures are not effective to provide the reasonable assurance described above.
Changes in Internal Control over Financial Reporting
Municipally-Owned Facility Construction Accounting
As previously disclosed, our management concluded that there was a material weakness in our internal control over financial reporting related to the estimation and timeliness of the reporting of certain costs associate with an outage related to certain remediation work on the Durham-York project and initial start-up operations of the project. The Durham-York project was our only municipally-owned project in original construction or start-up. When long-term construction revenue contracts for facilities that are municipally owned move to a projected net loss position, as the Durham-York contract did in the quarter ended June 30, 2015, all changes to the projected net loss are required to be recorded in the period those changes are identified. During the quarter ended June 30, 2015, we estimated incremental costs expected to be incurred to conduct outages to modify certain equipment, and to conduct initial start-up operations. During the quarter ended September 30, 2015, we determined that our prior estimate was not sufficiently accurate, and required refinement to our projected net loss. We determined that our inability to estimate such outage and start-up costs with sufficient accuracy during the period they were identified constituted a material weakness in our internal controls over financial reporting.
During the quarter ended March 31, 2016, we determined that our estimate of construction costs associated with our Dublin construction project during the quarter ended December 31, 2015, was also not sufficiently accurate. While this project is not municipally-owned, and the inaccurate cost estimates resulted in an immaterial financial statement impact, we determined that our inability to estimate such costs was due to the existing material weakness in our internal controls over financial reporting.
We took the following steps to remediate the material weakness discussed above:
111
• | Improved coordination among the management of several functions (operations, project management and accounting) to ensure that the information required for proper financial reporting is identified, evaluated, refined and reported on a timely basis; |
• | Implemented controls to improve the precision of the estimates of costs which are to be factored into the overall profitability or loss of a project involving public-owned facilities and to ensure that such precision levels are appropriately factored into our profit or loss recognition; |
• | Implemented enhanced reviews by the accounting and finance department to ensure that project cost reports which are used as a tool to track such outage and start-up expenditures are accurately stated and include all expenditures and accruals; |
• | Consolidated forecasting and overall financial oversight responsibility with financial controllers at ongoing facility construction projects to provide a single point of coordination between the construction, operations, client management, and finance and accounting functions, and to provide oversight of the financial reporting of construction activities; and |
• | Engaged additional personnel to assist with the review of change orders, claims events and other interactions between the company and its contractors and subcontractors on all major construction contracts. |
During the quarters ended March 31, June 30, September 30 and December 31, 2016, we continued to observe the operation of each of the control changes effected as part of our remediation efforts, for the purpose of evaluating their effectiveness over a period of time sufficient for management to conclude whether the reported material weakness has been remediated.
We have concluded that the period of time over which the operating effectiveness of the newly implemented and modified controls have been observed is sufficient for our Chief Executive Officer and Chief Financial Officer to conclude that this material weakness has been effectively remediated. Our management has concluded that the identified material weakness in internal control over financial reporting discussed above was fully remediated as of December 31, 2016.
Income Tax Accounting
Our management concluded that there was a material weakness in our internal control over financial reporting related to the precision of the review to ensure the accuracy of certain cumulative deferred tax balances, including the precision of the review to ensure the accuracy of the state income tax rate applied to certain cumulative deferred tax balances and the review of the tax impact of certain business transactions. We took the following steps to remediate the material weakness discussed above:
• | Revised task assignments to ensure that discrete items impacting the blended state tax rate are subject to a more comprehensive review process by successive levels of management; |
• | Enhanced the review of the application of the state tax rate to cumulative deferred income tax balances; |
• | Implemented specific technologies minimizing our reliance on supplementary spreadsheets to perform tax calculations, reducing the risk of manual computational error and allowing for a more effective and timely review of tax accounting results; and |
• | Implemented analytical procedures to validate actual tax accounting results to supplement internal control reviews using the expected impact of discrete items as a basis. |
We identified the following additional steps, which will be implemented effective January 1, 2017, to enhance our previously described remediation plan:
• | Enhance the analysis of tax-sensitive aspects of a business transaction; |
• | Formalize the documentation of the above referenced tax analysis; and |
• | Implement a review, by the Vice President of Tax, of the above referenced tax analysis prior to finalizing. |
Because some of the controls included in our remediation plan will be implemented effective January 1, 2017, and other new and modified controls, as previously described, have only been operational for a portion of 2016, we have concluded that more time is necessary to observe the effectiveness of the controls before our Chief Executive Officer and Chief Financial Officer can conclude that these material weakness have been effectively remediated.
Except as noted in the preceding paragraphs, there has not been any change in our system of internal control over financial reporting during the quarter ended December 31, 2016 that has materially affected, or is reasonably likely to materially affect, internal control over financial reporting.
112
Management’s Report on Internal Control over Financial Reporting
The management of Covanta Holding Corporation (“Covanta”) is responsible for establishing and maintaining adequate internal control over financial reporting, as such term is defined in Exchange Act Rule 13a-15(f).
All internal control systems, no matter how well designed, have inherent limitations including the possibility of human error and the circumvention or overriding of controls. Further, because of changes in conditions, the effectiveness of internal controls may vary over time. Projections of any evaluation of effectiveness to future periods are subject to the risk that controls may become inadequate because of changes in conditions, or that the degree of compliance with the policies or procedures may deteriorate. Accordingly, even those systems determined to be effective can provide us only with reasonable assurance with respect to financial statement preparation and presentation.
Covanta’s management has assessed the effectiveness of internal control over financial reporting as of December 31, 2016, following the criteria set forth by the Committee of Sponsoring Organizations of the Treadway Commission in Internal Control - Integrated Framework (2013 Framework). Based on our assessment under the framework in Internal Control - Integrated Framework (2013 Framework), Covanta’s management has concluded that our internal control over financial reporting was not effective as of December 31, 2016.
Our independent auditors, Ernst & Young LLP, have issued an attestation report on our internal control over financial reporting. This report appears on page 114 of this report on Form 10-K for the year ended December 31, 2016.
/s/ Stephen J. Jones | |
Stephen J. Jones | |
President and Chief Executive Officer | |
/s/ Bradford J. Helgeson | |
Bradford J. Helgeson | |
Executive Vice President and Chief Financial Officer | |
February 28, 2017
113
Report of Independent Registered Public Accounting Firm
The Board of Directors and Stockholders of Covanta Holding Corporation
We have audited Covanta Holding Corporation’s internal control over financial reporting as of December 31, 2016, based on criteria established in Internal Control - Integrated Framework issued by the Committee of Sponsoring Organizations of the Treadway Commission (2013 Framework) (the COSO criteria). Covanta Holding Corporation’s management is responsible for maintaining effective internal control over financial reporting, and for its assessment of the effectiveness of internal control over financial reporting included in the accompanying Management’s Report on Internal Control over Financial Reporting. Our responsibility is to express an opinion on the company’s internal control over financial reporting based on our audit.
We conducted our audit in accordance with the standards of the Public Company Accounting Oversight Board (United States). Those standards require that we plan and perform the audit to obtain reasonable assurance about whether effective internal control over financial reporting was maintained in all material respects. Our audit included obtaining an understanding of internal control over financial reporting, assessing the risk that a material weakness exists, testing and evaluating the design and operating effectiveness of internal control based on the assessed risk, and performing such other procedures as we considered necessary in the circumstances. We believe that our audit provides a reasonable basis for our opinion.
A company’s internal control over financial reporting is a process designed to provide reasonable assurance regarding the reliability of financial reporting and the preparation of financial statements for external purposes in accordance with generally accepted accounting principles. A company’s internal control over financial reporting includes those policies and procedures that (1) pertain to the maintenance of records that, in reasonable detail, accurately and fairly reflect the transactions and dispositions of the assets of the company; (2) provide reasonable assurance that transactions are recorded as necessary to permit preparation of financial statements in accordance with generally accepted accounting principles, and that receipts and expenditures of the company are being made only in accordance with authorizations of management and directors of the company; and (3) provide reasonable assurance regarding prevention or timely detection of unauthorized acquisition, use, or disposition of the company’s assets that could have a material effect on the financial statements.
Because of its inherent limitations, internal control over financial reporting may not prevent or detect misstatements. Also, projections of any evaluation of effectiveness to future periods are subject to the risk that controls may become inadequate because of changes in conditions, or that the degree of compliance with the policies or procedures may deteriorate.
A material weakness is a deficiency, or combination of deficiencies, in internal control over financial reporting, such that there is a reasonable possibility that a material misstatement of the Company's annual or interim financial statements will not be prevented or detected on a timely basis. The following material weakness has been identified and included in management's assessment. Management has identified a material weakness in controls related to the precision of the review to ensure the accuracy of certain cumulative deferred tax balances, including the precision of the review to ensure the accuracy of the state income tax rate applied to certain cumulative deferred tax balances and the review of the tax impact of certain business transactions. We also have audited, in accordance with the standards of the Public Company Accounting Oversight Board (United States), the consolidated balance sheets of Covanta Holding Corporation as of December 31, 2016 and 2015, and the related consolidated statements of operations, comprehensive (loss) income, equity and cash flows in each of the three years in the period ended December 31, 2016. This material weakness was considered in determining the nature, timing and extent of audit tests applied in our audit of the 2016 consolidated financial statements, and this report does not affect our report dated February 28, 2017, which expressed an unqualified opinion on those financial statements.
In our opinion, because of the effect of the material weakness, described above on the achievement of the objectives of the control criteria, Covanta Holding Corporation has not maintained effective internal control over financial reporting as of December 31, 2016, based on COSO criteria.
/s/ Ernst & Young LLP
MetroPark, New Jersey
February 28, 2017
114
Item 9B. OTHER INFORMATION
None.
PART III
Item 10. DIRECTORS, EXECUTIVE OFFICERS AND CORPORATE GOVERNANCE
Information regarding our executive officers is incorporated by reference herein from the discussion under Item 1. Business — Executive Officers of this Annual Report on Form 10-K. We have a Code of Conduct and Ethics for Senior Financial Officers and a Policy of Business Conduct. The Code of Conduct and Ethics applies to our Chief Executive Officer, Chief Financial Officer, Chief Accounting Officer, Controller or persons performing similar functions. The Policy of Business Conduct applies to all of our directors, officers and employees and those of our subsidiaries. Both the Code of Conduct and Ethics and the Policy of Business Conduct are posted on our website at www.covanta.com on the Corporate Governance page. We will post on our website any amendments to or waivers of the Code of Conduct and Ethics or Policy of Business Conduct for executive officers or directors, in accordance with applicable laws and regulations. The remaining information called for by this Item 10 is incorporated by reference herein from the discussions under the headings “Election of Directors,” “Board Structure and Composition — Committees of the Board,” and “Security Ownership of Certain Beneficial Owners and Management — Section 16(a) Beneficial Ownership Reporting Compliance” in our definitive Proxy Statement for the 2017 Annual Meeting of Stockholders.
Item 11. EXECUTIVE COMPENSATION
The information required by Item 11 of Form 10-K is incorporated by reference herein from the discussions under the headings “Compensation Committee Report,” “Board Structure and Composition — Compensation of the Board,” and “Executive Compensation” in our definitive Proxy Statement for the 2017 Annual Meeting of Stockholders.
Item 12. SECURITY OWNERSHIP OF CERTAIN BENEFICIAL OWNERS AND MANAGEMENT AND RELATED STOCKHOLDER MATTERS
The information required by Item 12 of Form 10-K with respect to directors, executive officers and certain beneficial owners is incorporated by reference herein from the discussion under the heading “Security Ownership of Certain Beneficial Owners and Management” in our definitive Proxy Statement for the 2017 Annual Meeting of Stockholders.
Equity Compensation Plans
The following table sets forth information regarding the number of our securities that could be issued upon the exercise of outstanding options, the weighted average exercise price of those options in the Covanta Holding Corporation 2014 Equity Award Plan (the "Plan") and the number of securities remaining for future issuance under the Plan as of December 31, 2016.
Plan Category | Number of Securities to be Issued Upon Exercise of Outstanding Options, Warrants and Rights (A) | Weighted Average Exercise Price of Outstanding Options, Warrants and Rights (B) | Number of Securities Remaining Available for Future Issuance Under Equity Compensation Plans (Excluding Securities Reflected in Column A) (C) | |||||||
Equity Compensation Plans Approved By Security Holders | 1,079,809 | $ | 21.38 | 4,369,327 | ||||||
Equity Compensation Plans Not Approved By Security Holders | N/A | N/A | N/A | |||||||
Total | 1,079,809 | $ | 21.38 | 4,369,327 | ||||||
(1) | Of the 4,369,327 shares that remain available for future issuance, 366,451 have been forfeited, therefore, 4,002,876 shares are currently available for issuance under the equity compensation plans. |
115
Item 13. CERTAIN RELATIONSHIPS AND RELATED TRANSACTIONS, AND DIRECTOR INDEPENDENCE
The information required by Item 13 of Form 10-K is incorporated by reference herein from the discussions under the headings “Board Structure and Composition” and “Certain Relationships and Related Person Transactions” in the definitive Proxy Statement for the 2017 Annual Meeting of Stockholders.
Item 14. PRINCIPAL ACCOUNTANT FEES AND SERVICES
The information required by Item 14 of Form 10-K is incorporated by reference herein from the discussion under the heading “Independent Registered Public Accountant Fees” in the definitive Proxy Statement for the 2017 Annual Meeting of Stockholders.
PART IV
Item 15. EXHIBITS, FINANCIAL STATEMENT SCHEDULES
(a) | Documents filed as part of this report: |
(1) | Consolidated Financial Statements of Covanta Holding Corporation: |
Included in Part II of this Report:
Consolidated Statements of Operations for the years ended December 31, 2016, 2015 and 2014
Consolidated Statements of Comprehensive (Loss) Income for the years ended December 31, 2016, 2015 and 2014
Consolidated Balance Sheets as of December 31, 2016 and 2015
Consolidated Statements of Cash Flows for the years ended December 31, 2016, 2015 and 2014
Consolidated Statements of Equity for the years ended December 31, 2016, 2015 and 2014
Notes to Consolidated Financial Statements, for the years ended December 31, 2016, 2015 and 2014
Report of Ernst & Young LLP, Independent Registered Public Accounting Firm, on the consolidated financial statements of Covanta Holding Corporation for the years ended December 31, 2016, 2015 and 2014
(2) | Financial Statement Schedules of Covanta Holding Corporation: |
Included in Part II of this report: Schedule II — Valuation and Qualifying Accounts
All other schedules are omitted because they are not applicable, not significant or not required, or because the required information is included in the financial statement notes thereto.
(3) | Exhibits: |
EXHIBIT INDEX
Exhibit No. | Description | |
Articles of Incorporation and By-Laws. | ||
3.1† | Restated Certificate of Incorporation of Covanta Holding Corporation (incorporated herein by reference to Exhibit 3.1 of Covanta Holding Corporation’s Current Report on Form 8-K dated January 19, 2007 and filed with the SEC on January 19, 2007). | |
3.2† | Amended and Restated Bylaws of Covanta Holding Corporation, effective December 8, 2011 (incorporated herein by reference to Exhibit 3.1(ii) of Covanta Holding Corporation’s Current Report on Form 8-K dated September 19, 2013 filed with the SEC on September 20, 2013). | |
Instruments Defining Rights of Security Holders, Including Indentures. | ||
4.1† | Registration Rights Agreement dated November 8, 2002 among Covanta Holding Corporation and SZ Investments, L.L.C. (incorporated herein by reference to Exhibit 10.6 of Covanta Holding Corporation’s Annual Report on Form 10-K for the year ended December 27, 2002 and filed with the SEC on March 27, 2003). | |
4.2† | Registration Rights Agreement between Covanta Holding Corporation, D.E. Shaw Laminar Portfolios, L.L.C., SZ Investments, L.L.C., and Third Avenue Trust, on behalf of The Third Avenue Value Fund Series, dated December 2, 2003 (incorporated herein by reference to Exhibit 4.1 of Covanta Holding Corporation’s Current Report on Form 8-K dated December 2, 2003 and filed with the SEC on December 5, 2003). | |
4.3† | Indenture dated as of January 18, 2007 between Covanta Holding Corporation and Wells Fargo Bank, National Association, as trustee (incorporated herein by reference to Exhibit 4.1 of Covanta Holding Corporation’s Registration Statement on Form S-3 (Reg. No. 333-140082) filed with the SEC on January 19, 2007). | |
116
4.4† | Second Supplemental Indenture dated as of December 1, 2010 between Covanta Holding Corporation and Wells Fargo Bank, National Association, as trustee (including the Form of Note) (incorporated herein by reference to Exhibit 4.3 of Covanta Holding Corporation’s Current Report on Form 8-K dated December 1, 2010 and filed with the SEC on December 1, 2010). | |
4.5† | Third Supplemental Indenture dated as of March 19, 2012 between Covanta Holding Corporation and Wells Fargo Bank, National Association, as trustee (incorporated herein by reference to Exhibit 4.2 of Covanta Holding Corporation’s Current Report on Form 8-K dated March 19, 2012 and filed with the SEC on March 19, 2012). | |
4.6† | Fourth Supplemental Indenture dated as of March 6, 2014 between Covanta Holding Corporation and Wells Fargo Bank, National Association, as trustee (incorporated herein by reference to Exhibit 4.2 of Covanta Holding Corporation’s Current Report on Form 8-K dated March 6, 2014 and filled with the SEC on March 6, 2014). | |
Material Contracts. | ||
10.1† | Tax Sharing Agreement, dated as of March 10, 2004, by and between Covanta Holding Corporation, Covanta Energy Corporation, and Covanta Power International Holdings, Inc. (incorporated herein by reference to Exhibit 10.25 of Covanta Holding Corporation’s Annual Report on Form 10-K for the year ended December 31, 2003 and filed with the SEC on March 15, 2004). | |
10.2† | Amendment No. 1 to Tax Sharing Agreement, dated as of June 24, 2005, by and between Covanta Holding Corporation, Covanta Energy Corporation and Covanta Power International Holdings, Inc., amending Tax Sharing Agreement between Covanta Holding Corporation, Covanta Energy Corporation and Covanta Power International Holdings, Inc. dated as of March 10, 2004 (incorporated herein by reference to Exhibit 10.8 of Covanta Holding Corporation’s Current Report on Form 8-K dated June 24, 2005 and filed with the SEC on June 30, 2005). | |
10.3†* | Covanta Energy Savings Plan, as amended by December 2003 amendment (incorporated herein by reference to Exhibit 10.25 of Covanta Holding Corporation’s Annual Report on Form 10-K for the year ended December 31, 2004 and filed with the SEC on March 16, 2005). | |
10.4† | Rehabilitation Plan Implementation Agreement, dated January 11, 2006, by and between John Garamendi, Insurance Commissioner of the State of California, in his capacity as Trustee of the Mission Insurance Company Trust, the Mission National Insurance Company Trust and the Enterprise Insurance Company Trust, on the one hand, and Covanta Holding Corporation, on the other hand (incorporated herein by reference to Exhibit 10.1 of Covanta Holding Corporation’s Current Report on Form 8-K dated March 2, 2006 and filed with the SEC on March 6, 2006). | |
10.5† | Amendment to Rehabilitation Plan Implementation Agreement, accepted and agreed to on March 17, 2006 (incorporated herein by reference to Exhibit 10.1 of Covanta Holding Corporation’s Current Report on Form 8-K dated March 17, 2006 and filed with the SEC on March 20, 2006). | |
10.6† | Amendment to Agreement Regarding Closing (Exhibit A to the Rehabilitation Plan Implementation Agreement), dated January 10, 2006, by and between John Garamendi, Insurance Commissioner of the State of California, in his capacity as Trustee of the Mission Insurance Company Trust, the Mission National Insurance Company Trust, and the Enterprise Insurance Company Trust, on the one hand, and Covanta Holding Corporation, on the other hand (incorporated herein by reference to Exhibit 10.2 of Covanta Holding Corporation’s Current Report on Form 8-K dated March 2, 2006 and filed with the SEC on March 6, 2006). | |
10.7† | Pledge and Security Agreement, dated as of March 28, 2012, between each of Covanta Energy Corporation and the other grantors party thereto, and Bank of America, N.A., as Collateral Agent (incorporated herein by reference to Exhibit 10.1 of Covanta Holding Corporation's Current Report on Form 8-K dated March 28, 2012 and filed with the SEC on March 30, 2012). | |
10.8† | Pledge Agreement, dated as of March 28, 2012, between Covanta Holding Corporation and Bank of America, N.A., as Collateral Agent (incorporated herein by reference to Exhibit 10.1 of Covanta Holding Corporation's Current Report on Form 8-K dated March 28, 2012 and filed with the SEC on March 30, 2012). | |
10.9† | Intercompany Subordination Agreement, dated as of March 28, 2012, among Covanta Energy Corporation, Covanta Holding Corporation, certain subsidiaries of Covanta Energy Corporation, as Guarantor Subsidiaries, certain other subsidiaries of Covanta Energy Company, as non-guarantor subsidiaries, and Bank of America, N.A., as Administrative Agent (incorporated by reference to Exhibit 10.1 of Covanta Holding Corporation's Current Report on Form 8-K dated March 28, 2012 and filed with the SEC on March 30, 2012). | |
10.10† | Form of Covanta Holding Corporation Indemnification Agreement, entered into with each Director and Officer (incorporated herein by reference to Exhibit 10.1 of Covanta Holding Corporation’s Current Report on Form 8-K dated December 6, 2007 and filed with the SEC on December 12, 2007. | |
117
10.11† | Equity Commitment for Rights Offering between Covanta Holding Corporation and SZ Investments L.L.C. dated February 1, 2005 (incorporated herein by reference to Exhibit 10.2 of Covanta Holding Corporation’s Current Report on Form 8-K dated January 31, 2005 and filed with the SEC on February 2, 2005). | |
10.12† | Equity Commitment for Rights Offering between Covanta Holding Corporation and EGI-Fund (05-07) Investors, L.L.C. dated February 1, 2005 (incorporated herein by reference to Exhibit 10.3 of Covanta Holding Corporation’s Current Report on Form 8-K dated January 31, 2005 and filed with the SEC on February 2, 2005). | |
10.13† | Equity Commitment for Rights Offering between Covanta Holding Corporation and Third Avenue Trust, on behalf of The Third Avenue Value Fund Series dated February 1, 2005 (incorporated herein by reference to Exhibit 10.4 of Covanta Holding Corporation’s Current Report on Form 8-K dated January 31, 2005 and filed with the SEC on February 2, 2005). | |
10.14† | Loan Agreement, dated as of November 1, 2012, by and between Covanta Holding Corporation and the Massachusetts Development Finance Agency (incorporated by reference to Exhibit 10.1 of Covanta Holding Corporation's Current Report on Form 8-K dated November 15, 2012 and filed with the SEC on November 19, 2012). | |
10.15† | Loan Agreement, dated as of November 1, 2012, by and between Covanta Holding Corporation and the Niagara Area Development Corporation Agency (incorporated herein by reference to Exhibit 10.1 of Covanta Holding Corporation's Current Report on Form 8-K dated November 15, 2012 and filed with the SEC on November 19, 2012). | |
10.16† | Guaranty Agreement, dated as of November 1, 2012, by and between Covanta Energy Corporation and Wells Fargo Bank, National Association, pursuant to the Loan Agreement, dated as of November 1, 2012, by and between Covanta Holding Corporation and the Massachusetts Development Finance Agency (incorporated herein by reference to Exhibit 10.3 of Covanta Holding Corporation's Current Report on Form 8-K dated November 15, 2012 and filed with the SEC on November 19, 2012). | |
10.17† | Guaranty Agreement, dated as of November 1, 2012, by and between Covanta Energy Corporation and Wells Fargo Bank, National Association, pursuant to the Loan Agreement, dated as of November 1, 2012, by and between Covanta Holding Corporation and the Niagara Area Development Corporation Agency (incorporated herein by reference to Exhibit 10.4 of Covanta Holding Corporation's Current Report on Form 8-K dated November 15, 2012 and filed with the SEC on November 19, 2012). | |
10.18† | Agreement, dated as of August 22, 2013, by and among Covanta Holding Corporation and John M. Huff, as Director of the Missouri Department of Insurance, Financial Institutions and Professional Registration (the "Trustee") solely in his capacity as trustee and statutory receiver of the Mission Reinsurance Corporation Trust and the Holland-America Insurance Company Trust (incorporated herein by reference to Exhibit 10.1 of Covanta Holding Corporation's Quarterly Report on Form 10-Q dated October 24, 2013 and filed with the SEC on October 24, 2013). | |
10.19†* | Covanta Holding Corporation 2014 Equity Award Plan (incorporated herein by reference to Exhibit 4.1 of Covanta Holding Corporation’s Registration Statement on Form S-8 filed with the SEC on May 8, 2014). | |
10.20†* | Form of Covanta Holding Corporation Stock Option Agreement for Employees and Officers (incorporated herein by reference to Exhibit 4.3 of Covanta Holding Corporation’s Registration Statement on Form S-8 filed with the SEC on May 7, 2008). | |
10.21†* | Form of Growth Equity Award Agreement (incorporated herein by reference to Exhibit 10.1 of Covanta Holding Corporation’s Current Report on Form 8-K dated February 24, 2010 and filed with the SEC on March 2, 2010). | |
10.22†* | Covanta Energy Corporation Senior Officers Severance Plan (incorporated herein by reference to Exhibit 10.2 of Covanta Holding Corporation’s Current Report on Form 8-K dated February 24, 2010 and filed with the SEC on March 2, 2010). | |
10.25†* | Form of Covanta Holding Corporation Restricted Stock Award Agreement for Directors (incorporated herein by reference to Exhibit 10.3 of Covanta Holding Corporation's Quarterly Report on Form 10-QA dated August 11, 2014 and filed with the SEC on August 11, 2014). | |
10.26†* | Form of Covanta Holding Corporation TSR Award Agreement for Employees and Officers (incorporated herein by reference to Exhibit 10.4 of Covanta Holding Corporation's Quarterly Report on Form 10-QA dated August 11, 2014 and filed with the SEC on August 11, 2014). | |
10.27†* | Form of Covanta Holding Corporation Stock Option Award Agreement for Directors (incorporated herein by reference to Exhibit 10.5 of Covanta Holding Corporation's Quarterly Report on Form 10-QA dated August 11, 2014 and filed with the SEC on August 11, 2014). | |
118
10.28* | Form of Covanta Holding Corporation Restricted Stock Unit Agreement for Directors. | |
10.29† | Amended and Restated Credit and Guaranty Agreement, dated as of April 10, 2015, among Covanta Energy, LLC, Covanta Holding Corporation, certain subsidiaries of Covanta Energy, LLC, as guarantors, the lenders party thereto, Bank of America, N.A., as Administrative Agent, Collateral Agent and Issuing Bank, Credit Agricole Corporate and Investment Bank, JPMorgan Chase Bank, N.A., Citizens Bank, N.A. and MUFG Union Bank, N.A, as Syndication Agents, and TD Bank, N.A., Sumitomo Mitsui Banking Corporation and Compass Bank, as Co-Documentation Agents (incorporated herein by reference to Exhibit 10.1 of Covanta Holding Corporation's Current Report on Form 8-K dated April 10, 2015 and filed with the SEC on April 20, 2015). | |
10.30†* | Succession Agreement by and among Covanta Holding Corporation, Covanta Energy LLC, Covanta Projects LLC and Anthony J. Orlando dated January 5, 2015 (incorporated herein by reference to Exhibit 10.2 of Covanta Holding Corporation’s Current Report on Form 8-K dated January 5, 2015 and filed with the SEC on January 5, 2015). | |
10.31†* | Offer Letter from Covanta Holding Corporation to Stephen J. Jones dated January 5, 2015 (incorporated herein by reference to Exhibit 10.1 of Covanta Holding Corporation’s Current Report on Form 8-K dated January 5, 2015 and filed with the SEC on January 5, 2015). | |
10.32†* | Offer Letter from Covanta Holding Corporation to Michael J. de Castro dated May 12, 2015 (incorporated herein by reference to Exhibit 10.1 of Covanta Holding Corporation’s Current Report on Form 8-K dated June 2, 2015 and filed with the SEC on June 2, 2015). | |
10.33†* | Form of Covanta Holding Corporation 2014 Equity Award Plan Performance Share Award Agreement for Employees and Officers (incorporated herein by reference to Exhibit 10.1 of Covanta Holding Corporation's Current Report on Form 8-K dated March 2, 2016 and filed with the SEC on March 2, 2016). | |
10.34* | Form of Covanta Holding Corporation Restricted Stock Award Agreement for Senior Officers. | |
10.35* | Form of Covanta Holding Corporation Restricted Stock Unit Agreement for Senior Officers. | |
Other. | ||
12.1 | Computation of Ratio of Earnings to Fixed Charges | |
21.1 | Subsidiaries of the Registrant | |
23.1 | Consent of Independent Registered Public Accounting Firm | |
31.1 | Certification pursuant to Section 302 of Sarbanes-Oxley Act of 2002 by the Chief Executive Officer. | |
31.2 | Certification pursuant to Section 302 of Sarbanes-Oxley Act of 2002 by the Chief Financial Officer. | |
32 | Certification of periodic financial report pursuant to Section 906 of Sarbanes-Oxley Act of 2002 by the Chief Executive Officer and Chief Financial Officer. | |
101.INS | XBRL Instance Document | |
101.SCH | XBRL Taxonomy Extension Schema | |
101.CAL | XBRL Taxonomy Calculation Linkbase | |
101.LAB | XBRL Taxonomy Extension Labels Linkbase | |
101.PRE | XBRL Taxonomy Extension Presentation Linkbase | |
101.DEF | XBRL Taxonomy Extension Definition Document | |
† | Not filed herewith, but incorporated herein by reference. |
* | Management contract or compensatory plan or arrangement. |
Pursuant to paragraph 601(b)(4)(iii)(A) of Regulation S-K, the registrant has omitted from the foregoing list of exhibits, and hereby agrees to furnish to the Securities and Exchange Commission, upon its request, copies of certain instruments, each relating to long-term debt not exceeding 10% of the total assets of the registrant and its subsidiaries on a consolidated basis.
119
(b) Exhibits: See list of Exhibits in this Part IV, Item 15(a)(3) above. | ||
(c) Financial Statement Schedules: See Part IV, Item 15(a)(2) above. | ||
120
SIGNATURES
Pursuant to the requirements of Section 13 or 15(d) of the Securities Exchange Act of 1934, the registrant has duly caused this Report to be signed on its behalf by the undersigned, thereunto duly authorized.
COVANTA HOLDING CORPORATION (Registrant) | ||
By: | /S/ STEPHEN J. JONES | |
Stephen J. Jones | ||
President and Chief Executive Officer | ||
Date: February 28, 2017
Pursuant to the requirements of the Securities Exchange Act of 1934, this report has been signed below by the following persons on behalf of the registrant and in the capacities and on the dates indicated.
Name | Title | Date | ||
/S/ STEPHEN J. JONES Stephen J. Jones | President and Chief Executive Officer and Director (Principal Executive Officer) | February 28, 2017 | ||
/S/ BRADFORD J. HELGESON Bradford J. Helgeson | Executive Vice President, Chief Financial Officer (Principal Financial Officer and Principal Accounting Officer) | February 28, 2017 | ||
/S/ SAMUEL ZELL Samuel Zell | Chairman of the Board | February 28, 2017 | ||
/S/ DAVID M. BARSE David M. Barse | Director | February 28, 2017 | ||
/S/ RONALD J. BROGLIO Ronald J. Broglio | Director | February 28, 2017 | ||
/S/ PETER C. B. BYNOE Peter C. B. Bynoe | Director | February 28, 2017 | ||
/S/ LINDA J. FISHER Linda J. Fisher | Director | February 28, 2017 | ||
/S/ JOSEPH M. HOLSTEN Joseph M. Holsten | Director | February 28, 2017 | ||
/S/ ANTHONY J. ORLANDO Anthony J. Orlando | Director | February 28, 2017 | ||
/S/ DANIELLE PLETKA Danielle Pletka | Director | February 28, 2017 | ||
/S/ MICHAEL W. RANGER Michael W. Ranger | Director | February 28, 2017 | ||
/S/ ROBERT S. SILBERMAN Robert S. Silberman | Director | February 28, 2017 | ||
/S/ JEAN SMITH Jean Smith | Director | February 28, 2017 | ||
121