Attached files
| file | filename |
|---|---|
| EX-32.2 - EXHIBIT 32.2 - SYNCHRONOSS TECHNOLOGIES INC | sncr-123116ex322.htm |
| EX-32.1 - EXHIBIT 32.1 - SYNCHRONOSS TECHNOLOGIES INC | sncr-123116ex321.htm |
| EX-31.2 - EXHIBIT 31.2 - SYNCHRONOSS TECHNOLOGIES INC | sncr-123116ex312.htm |
| EX-31.1 - EXHIBIT 31.1 - SYNCHRONOSS TECHNOLOGIES INC | sncr-123116ex311.htm |
| EX-23.1 - EXHIBIT 23.1 - SYNCHRONOSS TECHNOLOGIES INC | sncr-123116ex231.htm |
| EX-21.1 - EXHIBIT 21.1 - SYNCHRONOSS TECHNOLOGIES INC | sncr-123116ex211.htm |
UNITED STATES
SECURITIES AND EXCHANGE COMMISSION
Washington, D.C. 20549
Form 10‑K
ANNUAL REPORT PURSUANT TO SECTION 13 OR 15(d) OF THE SECURITIES EXCHANGE ACT OF 1934 |
For the fiscal year ended December 31, 2016
TRANSITION REPORT PURSUANT TO SECTION 13 OR 15(d) OF THE SECURITIES EXCHANGE ACT OF 1934 |
For the transition period from to |
Commission file number 000‑52049
SYNCHRONOSS TECHNOLOGIES, INC.
(Exact name of registrant as specified in its charter)
Delaware (State of incorporation) | 06‑1594540 (IRS Employer Identification No.) |
200 Crossing Boulevard, 8th Floor, Bridgewater, New Jersey 08807
(Address of principal executive offices, including ZIP code)
(866) 620‑3940
(Registrant’s telephone number, including area code)
Securities registered pursuant to Section 12(b) of the Act:
Title of each class | Name of each exchange on which registered | |
Common Stock, par value $.0001 par value | The NASDAQ Stock Market, LLC | |
Securities registered pursuant to Section 12(g) of the Act: None
Indicate by check mark whether the registrant is a well‑known seasoned issuer, as defined in Rule 405 of the Securities Act of 1933. Yes x No ¨
Indicate by check mark if the registrant is not required to file reports pursuant to Section 13 or Section 15(d) of the Securities Exchange Act of 1934 (the “Exchange Act”). Yes ¨ No x
Indicate by check mark whether the registrant (1) has filed all reports required to be filed by Section 13 or 15(d) of the Exchange Act during the preceding 12 months (or for such shorter period that the registrant was required to file such reports), and (2) has been subject to such filing requirements for the past 90 days. Yes x No ¨
Indicate by check mark whether the registrant has submitted electronically and posted on its corporate Web site, if any, every Interactive Data File required to be submitted and posted pursuant to Rule 405 of Regulation S‑T during the preceding 12 months (or for such shorter period that the registrant was required to submit and post such files). Yes x No ¨
Indicate by check mark if disclosure of delinquent filers pursuant to Item 405 of Regulation S‑K is not contained herein, and will not be contained, to the best of Registrant’s knowledge, in definitive proxy or information statements incorporated by reference in Part III of this Form 10‑K or any amendment to this Form 10‑K. x
Indicate by check mark whether the registrant is a large accelerated filer, an accelerated filer, a non‑accelerated filer, or a smaller reporting company. See the definitions of “large accelerated filer,” “accelerated filer” and “smaller reporting company” in Rule 12b‑2 of the Exchange Act. (Check one):
Large accelerated filer x | Accelerated filer ¨ | Non‑accelerated filer ¨ (Do not check if a smaller reporting company) | Smaller reporting company ¨ |
Indicate by check mark whether the registrant is a shell company (as defined in Rule 12b‑2 of the Exchange Act). Yes ¨ No x
The aggregate market value of the common stock held by non‑affiliates of the Registrant as of June 30, 2016, the last business day of the Registrant’s last completed second quarter, based upon the closing price of the common stock as reported by The NASDAQ Stock Market on such date was approximately $1.3 billion. Shares of common stock held by each executive officer, director and stockholders known by the Registrant to own 10% or more of the outstanding stock based on public filings and other information known to the Registrant have been excluded since such persons may be deemed affiliates. This determination of affiliate status is not necessarily a conclusive determination for other purposes.
As of February 16, 2017, a total of 45,998,579 shares of the Registrant’s common stock were outstanding. The exhibit index as required by Item 601(a) of Regulation S‑K is included in Item 15 of Part IV of this report on Form 10‑K.
DOCUMENTS INCORPORATED BY REFERENCE
Information required by Part III (Items 10, 11, 12, 13 and 14) is incorporated by reference to portions of the Registrant’s definitive Proxy Statement for its 2017 Annual Meeting of Stockholders (the “Proxy Statement”), which is to be filed pursuant to Regulation 14A within 120 days after the end of the Registrant’s fiscal year ended December 31, 2016. Except as expressly incorporated by reference, the Proxy Statement shall not be deemed to be a part of this report on Form 10‑K.
SYNCHRONOSS TECHNOLOGIES, INC.
FORM 10‑K
December 31, 2016
TABLE OF CONTENTS
Item | Page No. | |
16. | Form 10-K Summary | 114 |
I
PART I
FORWARD-LOOKING STATEMENTS
The words "Synchronoss", "we", "our", "ours", "us" and the "Company" refer to Synchronoss Technologies, Inc. and its consolidated subsidiaries. We were incorporated in Delaware in 2000. All statements in this Annual Report on Form 10-K that are not historical are forward-looking statements within the meaning of Section 27A of the Securities Act of 1933, as amended, and Section 21E of the Securities Exchange Act of 1934, as amended, including statements regarding Synchronoss' "expectations," "beliefs," "hopes," "intentions," "anticipates," "seeks," "strategies," "plans," "targets," "estimations," "outlook" or the like. Such statements are based on management's current expectations and are subject to a number of factors and uncertainties that could cause actual results to differ materially from those described in the forward-looking statements. Past performance is not necessarily indicative of future results. Synchronoss cautions investors that there can be no assurance that actual results or business conditions will not differ materially from those projected or suggested in such forward-looking statements as a result of various factors including, but not limited to, the risk factors discussed in this Annual Report on Form 10-K. Synchronoss expressly disclaims any obligation or undertaking to release publicly any updates or revisions to any forward-looking statements contained herein to reflect any change in Synchronoss' expectations with regard thereto or any change in events, conditions, or circumstances on which any such statements are based.
This Annual Report on Form 10-K includes industry and market data that we obtained from periodic industry publications, third-party studies and surveys, filings of public companies in our industry and internal company surveys. These sources include government and industry sources. Industry publications and surveys generally state that the information contained therein has been obtained from sources believed to be reliable. Although we believe the industry and market data incorporated into this Annual Report on Form 10-K to be reliable, this information could prove to be inaccurate. Industry and market data could be wrong because of the method by which sources obtained their data and because information cannot always be verified with complete certainty due to the limits on the availability and reliability of raw data, the voluntary nature of the data gathering process and other limitations and uncertainties. In addition, we do not know all of the assumptions regarding general economic conditions or growth that were used in preparing the forecasts from the sources relied upon or cited herein.
ITEM 1. BUSINESS
Introduction
We have recently made a number of major announcements, including our acquisition of Intralinks Holdings, Inc. or Intralinks and the divestiture of our carrier activation business, which will help define the future strategy at Synchronoss. These transactions signify a pivot in our strategy to focus on our cloud, analytics and enterprise businesses moving forward. We believe that our “Synchronoss 3.0” strategy is laying the groundwork for our new growth vision. Our acquisition of Intralinks gives us an immediate enterprise pedigree, experience upon which to leverage our product portfolio, and go-to-market strategy providing a diversified customer footprint which allows for substantial cross-selling opportunities through Synchronoss. We believe that as one combined company, we can deploy enhanced enterprise and mobile solutions to our customers, while opening up new enterprise distribution channels across the world.
With the Intralinks acquisition, we believe that enterprise will represent a significant portion of our future total revenues, thus helping us further diversify our business model over the coming years. For our carrier business, key customer wins in our cloud and messaging businesses in the North America and Asia-Pacific regions are some of the strategic highlights of our business performance over the past year. We believe that we will be able to build on these customer wins to create a major opportunity for growth in our carrier business as we head into 2017 and beyond. On the enterprise front we are progressing with our strategic partnerships with Verizon and Goldman Sachs, as we have successfully built a strong pipeline of customer enterprise pilots across various verticals with a core focus on financial and healthcare markets.
During the fourth quarter, we had a number of successful conversions from our pipeline into signed deals, where our solutions replaced existing competitive deployments. During 2016, our sales force and strategic partnerships enjoyed some early enterprise customer validation, which is leading to additional subscription booking opportunities in our enterprise business. These partnerships, will now be part of our broader enterprise strategy that centers on the combined Intralinks-Synchronoss team driving our success forward.
We believe this foundation will serve us well as we build a comprehensive product roadmap and a go-to-market strategy for the enterprise market around identity, secure mobility, secure collaboration, and secure workflow platforms.
1
Intralinks Acquisition
On January 19, 2017, we completed the previously announced acquisition of Intralinks. Following the acquisition, Intralinks became our wholly-owned subsidiary. Intralinks is a global technology provider of software as a service or SaaS solutions for secure enterprise content collaboration within and among organizations. Intralinks’ cloud-based solutions enable organizations to securely manage, control, track, search, exchange and collaborate on sensitive information inside and outside the firewall. Intralinks provides its customers with cost-effective solutions to manage and control large amounts of electronic information, accelerate information intensive business processes, reduce time to market, optimize critical information workflows, meet regulatory and risk management requirements and collaborate with business counterparties in a secure, auditable and compliant manner. Intralinks helps its customers eliminate many of the inherent risks and inefficiencies of using email, fax, courier services and other existing solutions to collaborate and exchange information. Intralinks serves enterprises and governmental agencies across a variety of industries, including financial services, pharmaceutical, manufacturing, biotechnology, consumer, energy, telecommunications, industrial, legal, professional services, insurance and technology. Intralinks delivers its solutions through a cloud-based model, making them available on-demand over the internet using a multi-tenant SaaS architecture. Intralinks’ solutions are sold directly through a field sales team with industry-specific expertise and an inside sales team, and indirectly through a customer referral network and channel partners. Intralinks’ customer-facing teams provide a range of implementation and end-user support services to ensure that its customers remain productive throughout the duration of their use of our services.
Intralinks has built a highly secure and scalable, cloud-based, multi-tenant, content services platform upon which it develops multiple applications that allow its customers to collaborate, manage and exchange critical information securely across organizational and geographic boundaries. Intralinks integrates content management, enterprise collaboration and social, data analytics, file sync and sharing, and document security software into one platform that supports business collaboration and content exchange. The Intralinks platform scales from the needs of small groups and individuals within one organization to large teams of people across multiple enterprises, financial institutions and governmental agencies. The Intralinks platform also helps transform a wide range of slow, expensive and people- and information-intensive tasks into streamlined and efficient business processes.
For more information about Intralinks and its business, please see the Annual Report on Form 10-K filed by Intralinks for the fiscal year ended December 31, 2015 and its subsequent filings with the SEC. The remainder of the discussion in this Annual Report on Form 10-K relates to the period prior to our acquisition of Intralinks, and, except otherwise noted, generally does not give effect to the Intralinks acquisition.
For additional information about our Intralinks acquisition, see Note 19, "Subsequent Event Review" to our consolidated financial statements included in Part II, Item 8 of this report.
General
We are a global software and services company that provides essential technologies and services for the mobile transformation of business. Our portfolio, which is targeted at the Consumer and Enterprise markets, contains offerings such as personal cloud, secure-mobility, identity management and scalable messaging platforms, products and solutions. These essential technologies create a better way of delivering the transformative mobile experiences that service providers and enterprises need to help them stay ahead of the curve when it comes to competition, innovation, productivity, growth and operational efficiency.
Our products and platforms are designed to be carrier-grade, flexible and scalable, enabling multiple converged communication services to be managed across a range of distribution channels including e-commerce, m-commerce, telesales, customer stores, indirect and other retail outlets. This business model allows us to meet the rapidly changing converged services and connected devices offered by our customers. Our products, platforms and solutions enable our enterprise and service provider customers to acquire, retain and service subscribers and employees quickly, reliably and cost-effectively with our white label and custom-branded solutions. Our customers can simplify the processes associated with managing the customer experience for procuring, activating, connecting, backing-up, synchronizing and sharing/collaborating with connected devices and contents from these devices and associated services. The extensibility, scalability, reliability and relevance of our platforms enable new revenue streams and retention opportunities for our customers through: new subscriber acquisitions, sale of new devices and accessories and new value-added service offerings in the Cloud, including the services offered by Intralinks. By using our technologies, our customers can optimize their cost of operations while enhancing their customer experience.
We currently operate in and market our solutions and services directly through our sales organizations in North America, Europe, the Middle East and Africa, or EMEA, Latin America and the Asia Pacific region. We deliver essential technologies for mobile trans
2
formation to two primary types of customers: service provider and enterprise customers in regulated verticals and use cases.
Service Providers, Retailers, OEMs, Re-sellers and Service Integrators
Our products and platforms provide end-to-end seamless integration between customer-facing channels/applications, communication services, or devices and “back-office” infrastructure-related systems and processes. Our customers rely on our solutions and technology to automate the process of activation and content and settings management for their subscribers’ devices while delivering additional communication services. Our portfolio includes: cloud-based sync, backup, storage and content engagement capabilities, broadband connectivity solutions, analytics, white label messaging and identity/access management that enable communications service providers, or CSPs, cable operators/multi-services operators, or MSOs, and original equipment manufacturers, or OEMs, with embedded connectivity (e.g. smartphones, laptops, tablets and mobile Internet devices, or MIDs, such as automobiles, wearables for personal health and wellness, and connected homes), multi-channel retailers, as well as other customers to accelerate and monetize value-add services for secure and broadband networks and connected devices.
Divestiture of Call Center Operations
During the course of 2016, we strategically began the process of selling our traditional activation business. As part of this effort in late 2016, we divested a large portion of our Activation business to Sequential Technology International or STI, a newly formed company, to leverage the assets sold as part of this transaction to STI's existing global customer care operations. STI is 70% owned by Sequential Technology International Holdings, an unrelated third party that was formerly named Omniglobe International. Omniglobe has been serving many leading carriers and legal entities around the globe, including customers like AT&T for over 10 years. We retained an approximate 30% ownership in STI. Our remaining traditional activation software assets and application programming interfaces orAPI's will help facilitate new innovative platforms, aimed at accelerating the adoption of cloud and digital services for carriers and other customers. The divestiture of the service portion of the Activation business created a better overall solution for our customers as STI is positioned to capitalize on the combined experience of both teams and is expected to become a strong, global player, building on over a decade of call center operations.
Synchronoss Platforms, Products and Solutions
We provide platforms and solutions to help service provider and enterprise customers realize their own visions of mobile transformation in a variety of different areas within their respective businesses. We represent categorical points of entry for our customers to transform their relationships with subscribers and employees.
As mobile technology continues to transform the service provider and enterprise markets the value of our platforms, products and solutions is transforming along with it and enabling our customers to think and stay one step ahead of their competition. One common evolutionary shift lies in the value of data. Service providers are looking at ways to use data to fuel new revenue streams and enterprise customers are looking to data to create more effective context for improving the employee work experience, particularly in environments where a premium is placed on data security. We are able to use our platforms in powerful combinations to not only make more effective use of data such as messaging, user generated content, secure applications and sharing, but also to analyze that data to create new opportunities for our customers.
Our cloud, messaging, security, collaboration, work flow management, predictive analytics and activation platforms are designed to be highly stable, secure, scalable and automated, managing transactions relating to a wide range of existing communications and digital content services across our customers. For example, we enable wireless providers to conduct business-to-consumer, or B2C, business-to-business, or B2B, enterprise and indirect channel (i.e., reseller/dealer) transactions. The capabilities of our platforms are designed to provide our customers with the opportunity to improve operational performance and efficiencies, dynamically identify new revenue opportunities and rapidly deploy new services. Our platforms are also designed to provide customers the opportunity to improve performance and efficiencies for activation, content migration and connectivity management for connected devices.
Our platforms power integrated sets of products that create repeatable, tailored deployments for Consumer and Enterprise customers. Many of these products are customized by our customers into specific solutions that play instrumental roles in helping our customers transform their relationship with their subscribers, partners and employees. This approach gives us a common technical foundation from which we can match products and solutions to flexibly solve the challenges of mobile transformation based on the needs of a variety of customer types, market dynamics and strategies.
3
Enterprise Solutions
Our Synchronoss Enterprise solutions support an advanced digital mobility experience for businesses and consumers enabling the accessing and protecting of their information. Our identity and access management platform helps consumers and business users to securely authenticate access to online websites to conduct e-commerce transactions or access important data. Our secure mobility platforms help users safely and securely store and share important data. Our solutions are based on understanding assumptions regarding individuals' behaviors by capturing who they are, what they are doing and how, where and when they are doing it. By doing this, our platforms help reduce fraud, improve cybersecurity detection/prevention and overall productivity. Our identity and access solution supports consumers by allowing them to self-register and verify their identities, while providing non-intrusive multi-factor authentication. At the same time, our identity and access solution enables businesses to be sure that the person at the other end of the transaction is the correct person. Our secure mobility solution combines the identity platform with a “bring your own device,” or BYOD, platform that is based on a secure container for accessing data, applications, content and personal information management tools like email, calendar, messaging and notes.
Our Synchronoss Enterprise solutions offer a best-in-class technology platform with purpose-built industry solutions that drive business outcomes for Enterprise customers including: improved employee productivity in a secure environment, greater agility and responsiveness to consumers, higher consumer loyalty and enhanced revenue opportunities, as well as proactively anticipating regulatory data/retention and privacy requirements. There are currently three primary components to this platform, which drive a secure digital online experience in select Enterprise vertical markets:
• | Secure Mobility Management: A BYOD implementation that provides the rich integration and orchestration of secure mobile productivity software featuring fine grain activity capture and dynamic policy execution through best in class mobility management, security and policy management tools and intelligent productivity through behavioral analytics. |
• | Data and Analytics: A solution that supports fraud and cybersecurity detection/prevention, dynamic policy administration/execution and predictive productivity. |
• | Identity and Access Management: A solution that allows customers to self-register and verify their respective identities while providing non-intrusive multi-factor authentication, which provides businesses with the assurance that the consumer with whom they are interacting is the person authorized to conduct the transaction. |
Our Synchronoss Enterprise solutions are targeted, initially at the following markets:
•Financial Services: Capital markets, banking and insurance
•Telecommunications: CSPs
•Healthcare: Providers and payers
•Life Sciences: Pharmaceuticals, device manufacturers and clinical research organizations
•Government: Federal and State governments and government agencies
Synchronoss Personal Cloud
Our Synchronoss Personal Cloud platform is designed to deliver an operator-branded experience for subscribers to backup, restore, synchronize and share their personal content across smartphones, tablets, computers and other connected devices from anywhere at any time. A key element of our Synchronoss Personal Cloud platform is that it extends a carrier’s or OEM’s visibility and reaches into all aspects of a subscriber’s use of a connected device. It introduces the notion of Connect-Sync-Activate for all devices. Once connected, most users of mobile devices avail themselves of content synchronization from the Cloud using policies that are appropriate and applicable to each specific device. Our Synchronoss Personal Cloud platform is specifically designed to support connected devices, such as smartphones, MIDs, laptops, tablets and wirelessly enabled consumer electronics such as wearables for health and wellness, cameras, e-readers, personal navigation devices and global positioning system, or GPS, enabled devices, as well as connected automobiles. Our Synchronoss Personal Cloud solution features products that facilitate the transfer of mobile content from one smart device to another and the sync, backup, storage, content management and content engagement features for mobile content.
Our Synchronoss Personal Cloud platform is linked to a family of clients designed to enable a persistent relationship between a subscriber and his or her content across devices and time. Our platform supports clients and data backup across major operating systems including: IOS, Android, Windows and works with mobile smart devices, tablets and PCs/Web. Our platform also supports the backup, sync, upload and download of data classes including photos, videos, music, messages, documents, contacts and call logs. Our clients may also feature interactive features intended to stimulate daily use of our platform such as Groups Spaces, smart push notifications, advanced sharing capabilities, smart album creation with more being added over time. Our Synchronoss Personal Cloud platform and clients may also be integrated with select third party providers to co-opt features that drive third party application and service engagement, a feature that is designed to provide future monetization opportunities to third parties and carriers.
4
Our Synchronoss Personal Cloud platform also has the ability to intelligently analyze a subscriber’s user generated content through image tagging, object and facial recognition, as well as metadata including location, time and date, sharing and other data profiles. This information drives an enhanced user experience allowing for smart features such as flashbacks, smart albums, etc., which also allows subscribers to effectively search a massive data base of content to find just the right piece of content without browsing. However, we derive the most value from this content through our ability to apply Synchronoss Analytics to analyze the context in which a subscriber collects content. This information can be used by our customers to create valuable incremental targeting of subscriber interests, creating a context that adds to the future monetization potential of subscriber data according to our service provider customers’ strategies and policies.
Synchronoss Mobile Content Transfer
Our Synchronoss Mobile Content Transfer solution is an easy to use product that enables a secure, peer-to-peer, wireless transfer of content from one mobile smart device to another in a carrier retail location or at home/work, etc. Our solution supports secure mobile content transfer across major operating systems including IOS, Android and Windows. Our Synchronoss Mobile Content Transfer solution can transfer select data classes that may include photos, videos, music, messages, documents, contacts and call logs, across operating systems with varying degrees of support in accordance with the openness of the platform.
Synchronoss Backup & Transfer
Our Synchronoss Backup & Transfer solution is a variation of our Synchronoss Mobile Content Transfer solution that offers the same peer-to-peer transfer of select data classes across smart mobile devices and major operating systems and also offers the ability to send supported data classes that may include photos, videos, music, messages, documents, contacts and call logs up to the cloud for temporary storage and then the ability to restore that content back onto that same device or to a new device with the same subscriber. This capability supports care channel use cases of securing content during a device wipe and also creates a value-added solution in the case of lost devices, cracked screens and other edge use cases. Furthermore, our Synchronoss Backup & Transfer solution enables the subscriber to establish a cloud account at the point of transfer and an auto sync capability to keep content backed up to the cloud account going forward. This unified experience is designed to drive cloud enrollment at the point of transfer (often during a new line or upgrade) and provide an opportunity to get content into the Cloud to reduce the time of transfer for the next upgrade.
Synchronoss Messaging
Our Synchronoss Secure Messaging platform was designed for demanding large-scale environments, with optional advanced email features. We cover the spectrum when it comes to multichannel messaging, security, identity management, and customization solutions, enabling service providers to transform email and messaging from cost centers to revenue generators. With an approximate 35% market share and more than 400 million mailboxes installed worldwide, we believe that we are the premier partner for service providers around the globe. We also partner with various companies for best-in-class traffic management, anti-virus, anti-spam, and anti-malware technology.
Our Universal Messaging Suite is an email platform for expanding service provider subscriber bases and adding new revenue streams. It is an easy-to-use, end-to-end solution to make sense of different data and communications from a service provider. Our Universal Messaging Suite is a feature-rich, reliable and secure messaging solution that is available on any device and provides integrated email, chat, voice and video messaging. The use of our Universal Messaging Suite drives fewer customer service calls due to increased reliability. Our Universal Messaging Suite is a single messaging platform rather than separate infrastructures for back-end, front-end and security.
Our UX Suite 2.1 is an intuitive and easy-to-use email interface that is accessible on all smartphones, tablets and desktop devices. The user interface, or UI, applies to emails, contacts, calendars, and tasks. Our UX Suite 2.1 delivers highly intuitive and feature-rich mobile and desktop email experiences that match what any over-the-top, or OTT, providers offer and can be fully customized to provide a more engaging mobile and desktop email experience for service providers. Additionally, we also provide professional services program support in writing new feature functionality requirements, omni-channel strategy documents or use-case sequence diagrams. Our UX Suite 2.1 features include:
• | full productivity information management suite, including mail, contacts, calendar, tasks, alerts, and invites |
• | multiple mail views, including top and right reading panes and contextual toolbars with drop-downs |
• | inline media preview for Microsoft Office documents, PDFs, images and videos within mail |
• | multiple address book support with quick action icons, contact search and alphabetical quick view |
• | aggregated email management from external accounts (e.g., Gmail, Hotmail, Yahoo or any other POP/IMAP) |
5
• | adaptive touch screen navigation (scroll, swipe, refresh) for fast mobile experiences |
• | access to native mobile device APIs, such as camera and photo albums |
• | advertising ready for integrating third-party applications and value-added services |
• | optimization for large mailbox load/search/sort from any device |
Synchronoss Analytics
Our Synchronoss Analytics platform is a cloud-based SaaS, platform that improves customer experience, retention, acquisition, monetization and financial performance. Our Synchronoss Analytics platform analyzes substantial volumes of data from internal and external sources to deliver daily business insights to our customers’ executives and leverages data science, machine learning, artificial intelligence, or AI, and workflow automation while integrating with internal systems to deliver insights around customer behavior, sentiment and operational performance. Our Synchronoss Analytics platform drives significant financial benefits to our service providers and enterprise customers and plays a key role in their efforts to monetize content and customer data in this era of digital transformation.
Our Synchronoss Analytics platform provides the following categories of functionality:
• | Automated Data Generation - A data generation system that processes tens of thousands of variables to produce advanced insights for use in monetizing Internet of Things, or IoT, initiatives by ingesting data from network devices, their usage, health, connectivity, alarms, behavior and more. |
• | Self-Learning Capabilities - Automated monitoring and feedback software that adapts and learns from generated data in order to create the most valuable and up-to-date insights on an ongoing basis. This functionality precludes the need to update analytics systems, which would require the completion of expensive, labor-intensive and time-consuming projects. |
• | Repeatable Insight Delivery - As opposed to standard analytics applications that require constant reassessments and rebuilds, our Synchronoss Analytics platform provides repeatable insight delivery with an easy-to-operate user interface. |
• | Data Processing Engine - Our Synchronoss Analytics platform creates a robust, highly repeatable, scalable analytic data set upon which insights are continually generated. |
• | Measuring and Monitoring - By measuring and monitoring progress, our Synchronoss Analytics platform automatically learns and applies what it learns to improve the functionality of the analytics software. |
• | Predictive Analytics Engine - Our Synchronoss Analytics engine employs the most advanced and mature algorithms to create predictive and prescriptive insights to use for IoT business and operational purposes. |
Our Synchronoss Analytics platform helps marketers at our service provider customers target prospective customers more effectively and efficiently, while also proactively:
• | improving customer retention |
• | identifying cross-sell and upsell opportunities |
• | improving the performance of marketing campaigns |
• | identifying the Next Best Action for each customer |
• | growing customer lifetime value |
• | delivering prescriptive insights to drive customer-centric business strategies such as acquisition, cross-sell and retention |
• | identifying customer profiles dynamically to increase each marketing campaign’s success |
• | simplifying the ability to take marketing actions by integrating with downstream systems such as campaign management and customer care |
• | driving results and constantly measuring return on investment customer-centric metrics and scorecards to support campaign execution |
Our Synchronoss Analytics platform is accessible from the Synchronoss Cloud and can be integrated directly into a service provider’s business and operational support systems, or BSS/OSS. Unlike internal solutions that can take up to 24 months to build, Synchronoss solutions can be operationalized in a short time period - approximately 90 days. Our Synchronoss Analytics platform automatically provides a service provider's customer care representatives with distinct prescriptive actions to take in the customer’s specific set of circumstances.
Our Synchronoss Analytics platform integrates easily with back-end systems through the use of web services APIs and batch processing. This is instrumental for faster integration with additional applications, systems and processes including:
• | ordering new products, |
• | queuing applications to enhance the customer retail experience, |
• | call center enhancements/optimization for calls to customer service/care, |
6
• | social network care teams, |
• | Cloud customer service apps, |
• | service-on-demand mobile apps for customer callbacks, |
• | timely technician appointments (truck rolls), |
• | mobile apps to track technicians, |
• | product returns |
• | partnerships with logistics firms. |
Synchronoss Financial Assurance
Our Synchronoss Financial Assurance platform is offered as either a secure cloud or license-based application suite. Key features of this platform include:
• | management of network partners and transactions, |
• | data loading and normalization, |
• | consolidated and central database for all network infrastructure expense, |
• | automated and user-configurable audits and alerts that quantify billing errors and let customers proactively manage their vendors and reduce expense, |
• | approval workflow that mirrors the financial checks and balances that customers use throughout their organizations, |
• | automated general ledger coding/accounting for accurate cost allocation, |
• | seamlessly integration into enterprise resource planning and accounts payable systems. |
Synchronoss Activation Services
Our Synchronoss Activation Services platform is a scalable and flexible platform that decouples the order processing customer experience from varied and legacy information technology, or IT, back office order management systems. Our platform enables sale, delivery and assurance of our customers’ new “complex product” bundles quickly and inexpensively, creating a uniform product portfolio and pricing schema across all of their sales channels and reducing their costs while improving the customer experience through reduced error rates and throughput time in processing orders, alarms, etc. Our platform is fully scalable, agile and adaptable to future products, services and channel changes, serving as a future-proof activation platform with end-to-end channel visibility and analytics and featuring a flexible commercial model. We sell this platform either on a SaaS basis or as a product license sale with accompanying professional services.
Demand Drivers for Our Business
Our products and services are capable of managing a wide variety of transactions across multiple customer delivery channels and services, which we believe enables us to benefit from increased growth, complexity and technological change in the communications technology industry and in several of the enterprise markets we are targeting. As the communications technology industry evolves, new access networks, connected devices and applications with multiple services and modes are emerging. More significantly, the accumulation of multiple connected devices per subscriber is creating new opportunities for network and cloud-driven service continuity. This proliferation of services and advancement of technologies is accelerating subscriber revenue growth, significantly expanding the types and volume of rich content accessed and stored by consumers and increasing the number of transactions between our customers and their subscribers. The technology advances are also continuing the demand for our products and services in the enterprise market segment, especially in the financial and life science sectors. Key elements of our demand drivers include:
New and Richer Operating Systems and the move to 4G-LTE Networks
Device operating systems like iOS for the iPhone/iTouch/iPad portfolio, Android produced by Google, Windows mobile devices, and BlackBerry OS for the BlackBerry portfolio have accelerated the adoption and usage of smartphones. Other growing markets are in smart wearables and connected vehicles. Apple has watchOS and CarPlay, while Google has Android Wear and Android Auto, respectively. According to IDC, the smartwatch market has a compounded annual growth rate or CAGR of about 43% from 2015-2019. For connected vehicles, BI Intelligence forecasts that 82% of all cars shipped in 2021 will be connected, representing a CAGR of 35% from 2016. In addition, the continued growth of 4G-LTE networks is expected to improve the customer experience with connected devices given the network’s higher data speeds and reduced latency. In addition, devices such as mobile routers and tablets can generate mobile hotspots. With fixed mobile broadband, mobile carriers and MSOs can also offer bundled services. At the same time, these networks are also focused on enhancing machine to machine communications.
7
Increasing Mobile Adoption Worldwide
According to estimates by the International Telecommunication Union in 2016 there were 3.6 billion active mobile-broadband subscriptions in the world, representing 49.4% of the global population, and this number is expected to reach approximately 12% fixed-broadband penetration globally by 2017.
The massive penetration of smart devices in developing countries is causing a modernization of networks and IT capabilities in markets previously dominated by feature phones and standard telephony services. The nature of smart devices is to drive a massive increase in data utilization of high bandwidth networks, an increase in messaging and the creation of user generated content, or UGC, all of which lead to the need for Synchronoss products, solutions and platforms on a new scale to markets that are rapidly catching up to mobile transformation.
The Rise of User Generated Content
As smart phone data use grows, so does the creation of UGC such as pictures, videos and memes. The accumulation of UGC on mobile devices (where 1 trillion photos were taken in 2015) is on pace to outstrip UGC in computer hard drives. This creates a dilemma for users in terms of stranding content that is often perceived as being more valuable than their own device. At the same time, this proliferation of UGC also presents a formidable challenge when it comes to transferring content from device to device in retail. Our Synchronoss Personal Cloud platform solves both of these problems while improving customer loyalty, customer satisfaction and retail efficiency.
Big Data and Monetization
Along with the accumulation of UGC and messages, service providers are accumulating more and more data from all areas of their network. The collection of this data adds breadth to already deep customer data they maintain that is aimed at supporting their ability to deliver relevant offers to specific customers. Together, this data creates rich context creating a robust profile around millions and millions of subscribers. Service providers are starting to develop new ways to use “Big Data” to fuel valuable targeting for mobile ads and add new revenue streams to their existing service revenue lines. Our Synchronoss Analytics platform is used to create new insights on carrier data and add to the value of ad targeting. Our white label cloud and messaging services create additional rich context to add to our carrier customers’ already robust data. According to ABI Research, mobile operators will devote more than $50 billion to Big Data and machine learning analytics through 2021.
Messaging and the Consolidation of Email and Over The Top Players
Messaging such as e-mail is a standard offering provided by service providers to their subscribers. Recent consolidation of email providers in the global market is prompting a reconciliation of this offering across the globe. Messaging as a medium is moving beyond standard email and is fast becoming an interface for commerce. Service providers are seeing usage and monetization declining as a result of the rise in"over the top" or OTT messaging players such as Facebook, Line, What’s App, We Chat and others who are using advanced messaging to create commerce opportunities to give subscribers visibility to smart transactions within a sticky, high frequency environment. Chat bots, operating on artificial intelligence fueled from semantic analysis of messaging content are the latest entrants to create a “messaging user interface” that is linking subscribers and third parties together across multiple channels. According to Gartner, by 2020, the average person will have more conversations with bots than with his or her spouse.
Our track record of providing scalable, secure, white label email solutions to service providers provides a viable alternative to smaller providers or OTT partners. Service providers are not adopting new messaging clients to compete with highly competitive and viral OTT players; instead they are adopting the monetization techniques used by those players to extend subscriber information into third party applications and chat interfaces, creating stickier commerce opportunities. Our customers are using our Synchronoss Messaging platform, especially in the Asia Pacific market, to evolve service provider messaging into a cloud-centric commerce offering utilizing personal cloud, identity management and other advanced messaging protocols that will open up new revenue streams and allow service operators to compete with OTT providers in new ways.
Pressure on Customers to Improve Efficiency while Delivering a Superior Subscriber Experience
Increased competition, recessionary markets and the cost of network capacity have placed significant pressure on our customers to reduce costs and increase revenues. At the same time, due to deregulation, the emergence of new network technologies and the proliferation of services, the complexity of back-office operations has increased significantly. Customers with multiple back-end systems are looking for ways to help their systems interoperate for a better customer experience. In addition, customers are moving to automated provisioning systems that enable them to more easily purchase, upgrade or add new features, applications and content.
8
As a result, we believe our customers are looking for ways to offer new communications services more rapidly and efficiently to their existing and new customers. Increased competition and the demand for a superior subscriber experience have placed significant pressure on our customers to improve customer-centric processes. CSPs are increasingly turning to transaction-based, cost effective, scalable and automated third-party solutions that can offer guaranteed levels of service delivery.
Digital Transformation and Mobile
Today nearly all businesses are involved in some form of digital transformation to drive profitability, growth, innovation and customer and employee satisfaction. According to Forrester, digital transformation budgets will edge up into the billions of dollars.We provide essential, white label technologies to help service providers realize the digital transformation that we believe drives a 2x output in immediate gratification, omni-channel personalized service and customer ease and convenience of dealing with carrier services and networks. Our enterprise customers realize similar value in meeting the expectations of their employees by offering them solutions that address productivity, enable BYOD and facilitate these employees doing business from anywhere.
Security Fraud and Cyber Threat Detection and Prevention
Every year, there is an increase in the prevalence of threats against consumers and companies from a variety of sources. The main point of attack are the user credentials that are used to access applications and commerce sites. As a result, it has become critically important to assure complete confidence in the identification and authentication of users. We believe our focus on security with respect to our products, especially our products focused on the Enterprise markets, is leading to a strong demand for our products worldwide.
Consumer Identity Verification and Authentication
Consumers today are burdened with having too many username and passwords to manage across their personal and professional lives. They are looking for simple safe and secure identity and authentication methods. Through our joint venture with Goldman Sachs, our identity and access solution supports consumers by allowing them to self-register and verify their identities, while providing non-intrusive multi-factor authentication.
Growth Strategy
Our growth objective is to establish our platforms as the de-facto industry standards for enabling mobile transformation with service provider (CSPs, MSOs, OEMs, multi-channel retailers) and enterprise customers (secure vertical markets including Financial, Telecommunications, Healthcare, Life Sciences, Government, etc.). Our strategy is to expand our customer base by vertical market using our existing platforms to enable large scale product deployments while investing in organic and/or inorganic logical extensions of our product and services portfolios. We will continue to focus our technology and development efforts around improving functionality, helping customers drive higher average revenue per customer and subscriber retention, embracing alternative channels and allowing more capabilities for ordering bundled applications and content offerings across these same complex and advanced networks.
Key elements of this strategy are:
Expand our Product Portfolio to Service Providers. Given the explosive growth of connected mobile broadband devices and the increasing need to backup, restore and share content across those devices, our objective is to play a vital role in monetizing those devices with our Connect-Sync-Activate strategy. Methods of monetization may include licenses per device, maintenance fees, professional service fees, active user fees as well as data storage fees. Our prior acquisitions of cloud, analytics and messaging platform providers have enabled us to expand the functionality of our Synchronoss Personal Cloud, Synchronoss Messaging and Synchronoss Analytics platforms. We have also improved the scalability of these acquired platforms to offer a more robust solution to our customers. Once one of our deployments reaches critical mass, we believe we will be able to integrate other solutions to generate additional revenue creating new solutions and generating offers from service providers and other customers.
Expanding into the Enterprise Cloud. Following up on the success of our Synchronoss Personal Cloud offering, we have also leveraged this platform to support the increased need for cloud-based document sharing and collaboration needs in the Small and Medium Business, or SMB, area. SMBs rely heavily on CSPs for support of new trends, such as BYOD. Our Synchronoss WorkSpace offering, combined with our newly-acquired Intralinks offering and our Orbit platform, which we acquired through our Goldman Sachs joint venture are ideally suited for these types of situations, as they are designed to assure an IT manager that the organization’s employees can enhance productivity by using their own mobile devices, while still complying with the organization’s internal security and other IT policies. In addition, our Intralinks business has traditionally sold products directly into both SMB and large-scale enterprise organizations and we plan to leverage these relationships to sell our enterprise solutions.
9
Expand Presence of Consumer Products Into New Geographic Markets. Although the majority of our revenue has traditionally been generated in North America, we continue to expand globally, especially with our recent acquisitions of Intralinks and Openwave Messaging, which have helped expand our operations and customer engagements globally in EMEA, Latin America and the Asia Pacific region. We believe that the growth of connected devices will further drive opportunities to penetrate new geographic markets within the coming years. The Asia Pacific and Latin America regions are of particular interest, as these markets experience similar trends to those that have driven growth in North America and EMEA.
Broaden Customer Base and Expand Offering to Existing Customers. As our existing consumer customers continue to expand into new distribution channels, such as the rapidly growing e-commerce channels, we expect that they will likely need to support new types of transactions that are well suited to being managed by our platforms. In addition, we believe our customers will require new transaction management solutions as they expand their subscriber customer bases, which will provide us with opportunities to drive increasing amounts of transaction volume over our platforms. Many of our customers purchase multiple services from us and we believe that, with our recent acquisition of Intralinks and Openwave Messaging, we are well positioned to cross-sell additional services to customers who do not currently purchase our full services portfolio.
Expand into Emerging Devices and Internet of Things Space. Various forecasts from industry leading sources have cited explosive growth in the non-traditional connected devices space. These devices include connected cars, connected homes, health and wellness devices and the health care domain. We plan on expanding our cloud platforms (focused on storing data from the varying devices to be stored securely in the cloud), in an effort to capitalize on the growth emerging from these new opportunities.
Maintain Technology Leadership. We strive to continue to build upon our technology leadership by continuing to invest in research and development to increase the automation of processes and workflows and develop complementary product modules that leverage our platforms and competitive strengths. By doing this, we can drive increased interest by making it more economical for customers to use us as a third-party solutions provider. In addition, we believe our close relationships with our customers will continue to provide us with valuable insights into the dynamics that are creating demand for next-generation solutions.
Leverage and Enforce our Intellectual Property. We have a significant repository of granted and filed intellectual property, including over 100 issued patents. We expect to use these assets as a differentiator of our products and services in the marketplace. We rely on a combination of our patents, trademarks, copyrights and trade secrets in the United States and throughout the world, as well as confidentiality procedures and contractual provisions, to protect our proprietary technology and our brand. We will continue to assess appropriate occasions for seeking patent and other intellectual property protections for those aspects of our technology and service that we believe constitute innovations providing significant competitive advantages.
Customers
We maintain strong and collaborative relationships with our customers, which we believe to be one of our core competencies and something that is critical to our success. For our cloud and activation businesses, we are generally the only provider of the services we offer to our customers. Contracts for our cloud and activation business extend up to 60 months from execution and include minimum transaction or revenue commitments from our customers. All of our significant cloud and activation customers may terminate their contracts for convenience upon written notice and in many cases payment of contractual penalties. The contractual penalties we received for the years ended December 31, 2016, 2015, and 2014 were immaterial to our statements of income.
Each of AT&T and Verizon accounted for more than 10% of our revenues for the years ended December 31, 2016, 2015, and 2014, with AT&T and Verizon, in the aggregate, representing 62%, 71% and 67% of net revenues for the years ended December 31, 2016, 2015, and 2014, respectively. Although in December 2016, we divested our activation call center business, which included a portion of the services that we historically provided to AT&T, we will continue to generate revenue from AT&T from our activation software and professional services. We have Statements of Work for each of the Verizon and AT&T businesses that we support which typically run for 12 to 36 months. Although Intralinks has a diverse customer base and we expect that revenue from our Intralinks business will comprise a significant portion of our going forward revenue, the loss of either AT&T or Verizon as a customer would have a material negative impact on our company. We believe that if either AT&T or Verizon were to terminate their relationship with us, that they would encounter substantial costs in replacing Synchronoss' solutions.
Sales and Marketing
We continue to develop a sales and marketing capability aimed at accelerating the adoption of our solutions by expanding penetration of existing industries, capitalizing on new opportunities in underpenetrated or emerging markets and by selectively increasing our geographic coverage.
10
We sell our services through a mix of field representatives, a direct sales force, a referral network and a select group of strategic and channel partners. Our sales representatives have extensive experience selling technology solutions into a wide variety of industries including communications, financial services, healthcare, insurance, legal and life sciences. Our sales teams are well trained in our platforms, products and service offerings and are instrumental in working with our customers to shape the solutions that are material to the growth of our current and prospective customers’ businesses based on the market trends and conditions that they are facing. This enables our team to easily identify and qualify opportunities where deploying one or more of our platforms would be appropriate and beneficial to prospective customers.
Following each sale, we assign account managers to provide ongoing support and to identify additional sales opportunities. Typically our sales process for our solutions involves an initial consultative process that allows our customers to better assess the operating and capital expenditure benefits associated with an optimal activation, provisioning and cloud-based content management architecture. We generate leads from contacts made through trade-shows, seminars, conferences, events, market research, our Web site, customers, strategic partners and our ongoing public relations program. In addition to our direct sales force, we have established relationships with channel partners, primarily for our recently acquired Intralinks products that promote, sell and support our services in specific geographies. The channel partners for our recently acquired Intralinks business include, among others, systems integrators, resellers, referral partners, service partners and consultants that resell our Intralinks services directly or through a referral network. Our key channel partners for our Intralinks business are located in a variety of countries, including Brazil, Chile, China, India, Japan, Mexico, South Africa and a number of European countries.
We focus our marketing efforts on generating awareness of Synchronoss and its offerings by attaching brand recognition to key trends pertinent to our customers’ transformations. We do this through the creation of thematic and strategic content that is usually based on commissioned third party as well as original research for each of our market segments. We then market this research to industry editors in influential trade publications, media, thought leaders and press around the world. In addition, through our industry, product, and marketing communications functions, we also have an active public relations program to capitalize on recent news stories in key areas and industries. We also promote the launch of new capabilities such as the new European enterprise datacenter and reinforce key capabilities including the Trust Perimeter. Coverage has appeared in wide-reaching business outlets such as Bloomberg TV, Reuters, Fortune, Business Insider and Forbes.
We support these themes via direct marketing, digital marketing and conference presence throughout the year. We are active in numerous technology and industry forums and our employees regularly get invited to speak at tradeshows in which we also demonstrate our solutions. Key shows for our Communications & Media business include the Consumer Electronics Show (CES), Cellular Telecommunications Industry Association (CTIA), GSM Association (Mobile World Congress), and Mobile Future Forward Series, Additional shows for our Enterprise business include Industry and Financial Markets Association (SIFMA), RSA, Gartner enterprise forums, M&A regional associations and industry forums, and additional enterprise mobility events.
In addition, through our product marketing and marketing communications functions, we also have an active public relations program and maintain relationships with recognized trade media and industry analysts such as ABI Research, International Data Corporation (IDC), Gartner Inc., Forrester Research, Inc., Ovum, Frost & Sullivan and Yankee Group. We also manage and maintain our website, blog, social media profiles on LinkedIn, Twitter Facebook, instagram, YouTube and other channels, utilize search engine optimization and marketing, publish product related content and educational white papers, post videos and conduct seminars and user group meetings. Finally, we also actively sponsor technology-related and industry-related conferences and demonstrate our solutions at trade-shows targeted at providers of communications services.
In our enterprise business, where there are millions of potential users across many industries, we have adopted a vertical markets approach aligned to key persons to focus on use cases with new capabilities to serve the needs of the Enterprise market. We have a deep expertise in understanding how organizations in regulated industries such as financial services or life sciences can collaborate and share sensitive documents safely and compliantly.
Operations and Technology
We leverage common proprietary IT platforms to deliver carrier-grade services to our customers across communication and digital convergence market segments. Constructed using a combination of internally developed and licensed technologies, our platforms integrate our order management, gateway, workflow, cloud-based content management, and reporting into a unified system. Our platforms are secure foundations on which to build and offer additional services and maximize performance, scalability and reliability.
11
Competition
We face different types of competitors in the markets we target that range in market share, focus and maturity.
Competition in our markets is intense and includes rapidly-changing technologies and customer requirements, as well as evolving industry standards and frequent product introductions. We compete primarily on the basis of the breadth of our domain expertise, as well as on the basis of price, time-to-market, functionality, quality and breadth of product and service offerings. We believe the most important factors making us a strong competitor include:
• | breadth and depth of our transaction and content management solutions, including our exception handling technology, |
• | carrier grade nature and scalability of our solutions, |
• | quality and performance of our products, |
• | high-quality customer service, |
• | ability to implement and integrate solutions, |
• | overall value of our platforms |
• | references of our customers. |
We are aware of other software developers and smaller entrepreneurial companies that are focusing significant resources on developing and marketing products and services that will compete with our platforms. We anticipate continued growth in the communications industry and the entrance of new competitors in the order processing and transaction management solutions market and expect that the market for our products and services will remain intensely competitive.
The competition in our Cloud and Messaging markets are generally divided among three types of companies:
Over The Top Providers
Companies such as Google, Dropbox, Apple, Facebook, Yahoo, What’s App, Microsoft and others are active and successful in marketing their cloud and messaging solutions directly to customers using a B2C model on a massive, global scale. Depending on the proclivities of a region, some service providers have entered into strategic partnerships with OTT providers, with these relationships showing varying degrees of financial success. Service providers generally have a strategic interest in protecting the relationship they have with their subscribers, providing value-add relevance to their networks and driving additional revenue streams. However, OTT partnerships do not always allow for this. Instead, they may offer the service provider a service with little to no capital investment required. The tradeoff between cost and business upside is under constant examination and varies from company to company. Recent privacy issues with Yahoo as well as the proposed acquisition of Yahoo by Verizon, a service provider competitive to other North American providers, has given many operators a reason to re-assess their messaging strategy.
Small Service Providers
There remain a handful of smaller solutions providers in the white label cloud and messaging space such as Funambol and Open-Xchange. These providers compete with us for smaller accounts in different regions of the world. In most cases, these providers offer low cost entry and revenue sharing as a business model but they do not provide the scalability, security or stability that appeal to Tier 1 service providers which is our major strategic focus.
Analogous Service Providers
White label technology providers such as Amdocs, Ericsson, HP Momentum and others have a well-established strategic presence with large, Tier 1 service providers and are active in influencing their technology path as well as leading large-scale IT implementations. While these providers do not focus their businesses in the area of consumer offerings, they do have relationships with IT departments of these service providers and they often attempt to combine their offerings in other parts of their businesses. Therefore, we consider them as a factor in competitive initiatives, if not competitive offerings.
With respect to our recently acquired Intralinks business and our Enterprise offerings, the market for these solutions is highly competitive, fragmented and dynamic. We compete with a multitude of providers, including both virtual data room providers and enterprise software providers. The markets for online collaborative content workspaces and solutions for managing, distributing and protecting enterprise content are also rapidly changing, with relatively low barriers to entry. We expect competition to increase from existing competitors as well as new and emerging market entrants. In addition, as we expand our service offerings, we may face competition from new and existing competitors. We compete primarily on product functionality, service levels, security and compliance characteristics, price and reputation. Our competitors include companies that provide online products that serve as document
12
repositories, virtual data rooms or file sharing and collaboration solutions, together with other products or services that may result in those companies effectively selling these services at lower prices and creating downward pricing pressure for us.
We believe that the principal differentiating factors for our Intralinks business and our Enterprise offerings are primarily the ability to collaborate inside and outside firewalls while maintaining security, control, auditability and compliance standards. We believe we compete effectively based on broad capabilities across all of these factors. In particular, our Intralinks solutions are specifically designed for inter-enterprise collaboration for content and information sharing beyond the firewall. Our Intralinks platform offers enterprise class scalability and reliability, while enabling secure, auditable and compliant information exchange via a SaaS delivery model that lowers total cost of ownership. Additionally, our industry-specific expertise, global customer support, scalability and reliability to ensure uninterrupted performance, as well as price and functionality, have earned us a reputation of trust with our Intralinks customers.
Employees
We believe that our recent growth and success is attributable in large part to our employees and an experienced management team, many members of which have years of industry experience in building, implementing, marketing and selling transaction management solutions critical to business operations. We intend to continue training our employees, as well as developing and promoting our culture, and believe that these efforts provide us with a sustainable competitive advantage. We offer a work environment that enables employees to make meaningful contributions, as well as incentive programs that are designed to continue to motivate, retain and reward our employees.
As of December 31, 2016, we had 1,765 full‑time employees. None of our employees are covered by any collective bargaining agreements.
Geographic Information
Information regarding financial data by geographic location is set forth in Note 2 - “Summary of Significant Accounting Policies - Segment and Geographic Information” to our consolidated financial statements included in Part II, Item of this Annual Report on Form 10-K.
Available Information
Our Web address is www.synchronoss.com. On this Web site, we post the following filings after they are electronically filed with or furnished to the U.S. Securities and Exchange Commission (SEC): our annual reports on Form 10-K, quarterly reports on Form 10-Q, our current reports on Form 8-K, our proxy statement on Form 14A related to our annual stockholders' meeting and any amendment to those reports or statements filed or furnished pursuant to Section 13(a) or 15(d) of the Securities Exchange Act of 1934, as amended. All such filings are available on the Investor Relations portion of our Web site free of charge. The contents of our Web site are not intended to be incorporated by reference into this Form 10-K or in any other report or document we file.
The reports filed with the SEC by us and by our officers, directors and significant shareholders are available for review on the SEC’s website at www.sec.gov. You may also read and copy materials that we filed with the SEC at the SEC’s Public Reference Room at 100 F Street, NE, Washington, DC 20549. You may obtain information on the operation of the Public Reference Room by calling the SEC at 1-800-SEC-0330.
Synchronoss, Synchronoss Personal Cloud, Synchronoss Messaging and Intralinks and other trademarks of Synchronoss appearing in this Annual Report are the property of Synchronoss. Other trademarks or service marks that may appear in this Annual Report are the property of their respective holders. Solely for convenience, the trademarks and trade names in this Annual Report are referred to without the ®, ™ and SM symbols, but such references should not be construed as any indicator that their respective owners will not assert, to the fullest extent under applicable law, their rights thereto.
13
ITEM 1A. RISK FACTORS
An investment in our common stock involves a high degree of risk. The following are certain risk factors that could affect our business, financial results and results of operations. You should carefully consider the following risk factors in connection with evaluating the forward-looking statements contained in this Annual Report on Form 10-K because these factors could cause the actual results and conditions to differ materially from those projected in forward-looking statements. The risks that we have highlighted here are not the only ones that we face. If any of the risks actually occur, our business, financial condition or results of operation could be negatively affected. In that case, the trading price of our stock could decline, and our stockholders may lose part or all of their investment.
Risks Related to Our Business and Industry
We recently consummated a number of significant transactions with respect to the strategic direction of our business. There can be no guarantee that this strategy will be successful or that we will experience consistent and sustainable profitability in the future as a result of our new strategy.
We have recently made a number of major announcements, including our acquisition of Intralinks Holdings, Inc. which closed on January 19, 2017, and our divestiture of our main carrier activation business to Sequential Technology International, which closed in December 2016. These transactions signify a pivot in our strategy to focus on our cloud, analytics and enterprise businesses moving forward. In connection with the closing of our acquisition of Intralinks, we also appointed Ronald W. Hovsepian, the former President and Chief Executive Officer of Intralinks as our Chief Executive Officer.
We cannot guarantee that our strategy is the right one or that we will be effective in executing our strategy. Our strategy may not succeed for a number of reasons, including, but not limited to: general economic risks; execution risks with acquisitions; risks associated with sales not materializing based on a change in circumstances; disruption to sales; increasing competitiveness in the enterprise and mobile solutions markets; our ability to retain key personnel following acquisitions; the dynamic nature of the markets in which we operate; specific economic risks in different geographies and among different customer segments; changes in foreign currency exchange rates; uncertainty regarding increased business and renewals from existing customers; uncertainties around continued success in sales growth and market share gains; failure to convert sales pipeline into final sales; risks associated with successful implementation of multiple integrated software products and other product functionality risks; execution risks around new product development and introductions and innovation; product defects; unexpected costs, assumption of unknown liabilities and increased costs for any reason; potential litigation and disputes and the potential costs related thereto; distraction and damage to sales and reputation caused thereby; market acceptance of new products and services; the ability to attract and retain personnel; risks associated with management of growth; lengthy sales and implementation cycles, particularly in larger organizations; technological changes that make our products and services less competitive; risks associated with the adoption of, and demand for, our model in general and by specific customer segments; competition and pricing pressure.
If one or more of the foregoing risks were to materialize, our business, results of operations and ability to achieve sustained profitability could be adversely affected.
Our outstanding indebtedness and related obligations could adversely affect our financial condition and restrict our operating flexibility.
We have substantial debt and related obligations. In August 2014, we issued $230.0 million aggregate principal amount of our 0.75% Convertible Senior Notes due in 2019, or the 2019 Notes. On January 19, 2017, we entered into a Senior Secured Credit Agreement with the lending institutions from time to time parties thereto and Goldman Sachs Bank USA, as administrative agent, collateral agent, swingline lender and a letter of credit issuer, or the 2017 Credit Agreement. Our obligations under the 2017 Credit Agreement are guaranteed by certain of our subsidiaries, including Intralinks, and secured by substantially all of our assets. The term loan lenders under the 2017 Credit Agreement have advanced to us senior secured term loans in an aggregate principal amount of $900 million with a maturity date of January 19, 2024. We refer to this facility as the 2017 Term Facility. The revolving lenders under the 2017 Credit Agreement have provided us with a revolving credit facility of up to $200 million with a maturity date of January 19, 2022. We refer to this facility as the Revolving Facility. We have not drawn down on any of the funds under the Revolving Facility. The term loans under the 2017 Term Facility will amortize at 1% per annum in equal quarterly installments with the balance payable on the final maturity date and contains certain mandatory prepayments. The 2017 Credit Agreement contains a number of customary affirmative and negative covenants and events of default, which, among other things, restrict our ability, and our subsidiaries’ ability, to incur debt, allow liens on assets, make investments, pay dividends or prepay certain other debt. The 2017 Credit Agreement also requires that we comply with certain financial maintenance covenants, including a total gross leverage ratio and an interest charge coverage ratio.
14
Our substantial level of debt and related obligations, including interest payments, covenants and restrictions, could have important consequences, including by:
• | impairing our ability to invest in and successfully grow our business and make acquisitions; |
• | making it more difficult for us to satisfy our obligations with respect to our indebtedness, which could result in an event of default under the agreement governing the 2019 Notes or the 2017 Credit Facility; |
• | limiting our ability to obtain additional financing on satisfactory terms to fund our working capital requirements, capital expenditures, acquisitions, debt obligations and other general corporate requirements; |
• | hindering our ability to raise equity capital, because, in the event of a liquidation of our business, debt holders have priority over equity holders; |
• | increasing our vulnerability to general economic downturns, competition and industry conditions, which could place us at a competitive disadvantage compared to competitors that are less leveraged and are therefore we may be unable to take advantage of opportunities that our leverage prevents us from exploiting; |
• | imposing additional restrictions on the manner in which we conduct our business, including restrictions on our ability to pay dividends, incur additional debt and sell assets; and |
• | placing us at a possible disadvantage relative to less leveraged competitors and competitors that have better access to capital resources. |
The occurrence of any one of these events could have an adverse effect on our business, financial condition, operating results or cash flows and ability to satisfy our obligations under our indebtedness. Our failure to comply with the covenants under the agreements governing the 2019 Notes or the 2017 Credit Facility could result in an event of default and the acceleration of any debt then outstanding under the 2019 Notes or the 2017 Credit Facility, as the case may be. Any declaration of an event of default could significantly harm our business and prospects and could cause our stock price to decline. Insufficient funds may require us to delay, scale back or eliminate some or all of our activities.
In addition, certain of our loan agreements have a change in control provision that provides that, upon the occurrence of a change in control, all credit facility commitments shall terminate and all loans shall become due and payable. Furthermore, certain of our loan agreements require us to meet specified minimum financial measurements. The operating and financial restrictions and covenants in our loan agreements, as well as any future financing agreements that we may enter into, may restrict our ability to finance our operations, engage in business activities or expand or fully pursue our business strategies. Our ability to comply with these covenants may be affected by events beyond our control and we may not be able to meet those covenants. A breach of any of the covenants under one of our loan agreements could result in a default under some or all of our loan agreements, which could cause all of the outstanding indebtedness under our loan agreements to become immediately due and payable and terminate all commitments to extend further credit, if any.
Our business may not generate sufficient cash flows from operations or future borrowings under our credit facilities or from other sources may not be available to us in amounts sufficient to enable us to repay our indebtedness or to fund our other liquidity needs, including capital expenditure requirements and share repurchase programs announced from time to time.
We cannot guarantee that we will be able to generate sufficient revenue or obtain enough capital to service our debt, fund our planned capital expenditures, and execute on our new business strategy. We may be more vulnerable to adverse economic conditions than less leveraged competitors and thus less able to withstand competitive pressures. Any of these events could reduce our ability to generate cash available for investment or debt repayment or to make improvements or respond to events that would enhance profitability. If we are unable to service or repay our debt when it becomes due, our lenders could seek to accelerate payment of all unpaid principal and foreclose on our assets, and we may have to take actions such as selling assets, seeking additional equity investments or reducing or delaying capital expenditures, strategic acquisitions, investments and alliances. Additionally, we may not be able to take these types of actions, if necessary, on commercially reasonable terms, or at all. The occurrence of any of these events would have a material adverse effect on our business, results of operations and financial condition.
If we fail to compete successfully with existing or new competitors, our business could be harmed.
If we fail to compete successfully with established or new competitors, it could have a material adverse effect on our results of operations and financial condition. The communications and enterprise industries are highly competitive and fragmented, and we expect competition to increase. We compete with independent providers of information systems and services and with the in-house departments of our OEMs and communications services companies' customers. Rapid technological changes, such as advancements in software integration across multiple and incompatible systems, and economies of scale may make it more economical for CSPs, MSOs or OEMs to develop their own in-house processes and systems, which may render some of our products and services less valuable or, eventually, obsolete. Our competitors include firms that provide comprehensive information systems and managed services solutions, BYOD providers, systems integrators, clearinghouses and service bureaus. Many of our
15
competitors have long operating histories, large customer bases, substantial financial, technical, sales, marketing and other resources and strong name recognition.
Current and potential competitors have established, and may establish in the future, cooperative relationships among themselves or with third parties to increase their ability to address the needs of our current or prospective customers. In addition, our competitors have acquired, and may continue to acquire in the future, companies that may enhance their market offerings. Accordingly, new competitors or alliances among competitors may emerge and rapidly acquire significant market share. As a result, our competitors may be able to adapt more quickly than us to new or emerging technologies and changes in customer requirements, and may be able to devote greater resources to the promotion and sale of their products. These relationships and alliances may also result in transaction pricing pressure, which could result in large reductions in the selling prices of our products and services. Our competitors or our customers' in-house solutions may also provide services at a lower cost, significantly increasing pricing pressure on us. We may not be able to offset the effects of this potential pricing pressure. Our failure to adapt to changing market conditions and to compete successfully with established or new competitors may have a material adverse effect on our results of operations and financial condition. In particular, a failure to offset competitive pressures brought about by competitors or in-house solutions developed by our customers could result in a substantial reduction in or the outright termination of our contracts with some of our customers, which would have a significant, negative and material impact on our business.
The markets in which we market and sell our products and services are highly competitive, and if we do not adapt to rapid technological change, we could lose customers or market share.
The industries we serve are characterized by rapid technological change and frequent new service offerings and are highly competitive with respect to the need for innovation. Significant technological changes could make our technology and services obsolete, less marketable or less competitive. We must adapt to these rapidly changing markets by continually improving the features, functionality, reliability and responsiveness of our products and services, and by developing new features, services and applications to meet changing customer needs and further address the markets we serve. Our ability to take advantage of opportunities in the markets we serve may require us to invest in development and incur other expenses well in advance of our ability to generate revenues from these offerings or services. We may not be able to adapt to these challenges or respond successfully or in a cost-effective way. Our failure to do so would adversely affect our ability to compete and retain customers and/or market share. In addition, as we expand our service offerings, we may face competition from new and existing competitors. It is also possible that our customers could decide to create, invest in or collaborate in the creation of competitive products that might limit or reduce their need for our products, services and solutions. Further, we may experience delays in the development of one or more features of our offerings, which could materially reduce the potential benefits to us providing these services. In addition, our present or future service offerings may not satisfy the evolving needs of the industry in which we operate. If we are unable to anticipate or respond adequately to these evolving market needs, due to resource, technological or other constraints, our business and results of operations could be harmed. In addition, the arrival of new market entrants could reduce the demand for our services or cause us to reduce our pricing, resulting in a loss of revenue and adversely affecting our business, results of operations and financial condition. Also, the use of internal technologies, developed by our customers or their advisers, could reduce the demand for our services, result in pricing pressures or cause a reduction in our revenue. If we fail to manage these challenges adequately, our business, results of operations and financial condition could be adversely affected.
The success of our business depends on our ability to achieve or sustain market acceptance of our services and solutions at desired pricing levels.
Our competitors and customers may cause us to reduce the prices we charge for our services and solutions. Our current or future competitors may offer our customers services at reduced prices or bundling and pricing services in a manner that may make it difficult for us to compete. Customers with a significant volume of transactions may attempt to use this leverage in pricing negotiations with us. Also if our prices are too high, current or potential customers may find it economically advantageous to handle certain functions internally instead of using our services. We may not be able to offset the effects of any price reductions by increasing the number of transactions we handle or the number of customers we serve, by generating higher revenue from enhanced services or by reducing our costs. If these or other sources of pricing pressure cause us to reduce the pricing of our service or solutions below desirable levels, our business and results of operations may be adversely affected.
The success of our business depends on the continued growth of consumer and business transactions related to communications services on the Internet.
The future success of our business depends upon the continued growth of consumer and business transactions on the Internet, including attracting consumers who have historically purchased wireless services and devices through traditional retail stores and attracting new enterprise customers. Specific factors that could deter consumers from purchasing wireless services and devices on the Internet include concerns about buying wireless devices without a face-to-face interaction with sales personnel and the
16
ability to physically handle and examine the devices.
Our business growth would be impeded if the performance or perception of the Internet was harmed by security problems such as "viruses," "worms" or other malicious programs, reliability issues arising from outages and damage to Internet infrastructure, delays in development or adoption of new standards and protocols to handle increased demands of Internet activity, increased costs, decreased accessibility and quality of service, or increased government regulation and taxation of Internet activity. The Internet has experienced, and is expected to continue to experience, significant user and traffic growth, which has, at times, caused user frustration with slow access and download times. If Internet activity grows faster than Internet infrastructure or if the Internet infrastructure is otherwise unable to support the demands placed on it, or if hosting capacity becomes scarce, the growth of our business may be adversely affected.
The success of our business depends on the continued growth in demand for connected devices and the continued availability of high-speed access to the Internet.
The future success of our business depends upon the continued growth in demand for connected devices and on our customers having high-speed access to the Internet, as well as the continued maintenance and development of the Internet infrastructure. While we believe the market for connected devices will continue to grow for the foreseeable future, we cannot accurately predict the extent to which demand for connected devices will increase, if at all. If the demand for connected devices were to slow down or decline, our business and results of operations may be adversely affected. If for any reason the Internet does not remain a widespread communications medium and commercial platform, the demand for our services would be significantly reduced, which would harm our business, results of operations and financial condition.
To the extent the Internet continues to experience increased numbers of users, frequency of use or bandwidth requirements, the Internet may become congested and be unable to support the demands placed on it, and its performance or reliability may decline. Any future Internet outages or delays could adversely affect our business, results of operation and financial condition.
Though acceptance of cloud-based software has advanced in recent years, some businesses may still be hesitant to adopt these types of solutions.
Our cloud-based service strategy may not be successful. We enable our customers to offer their subscribers the ability to backup, restore and share content across multiple devices through a cloud-based environment. Some businesses may still be uncertain as to whether a cloud-based service like ours is appropriate for their business needs. The success of our offerings is dependent upon continued acceptance by and growth in subscribers of cloud-based services in general and there can be no guarantee of the adoption rate by these subscribers. Many organizations have invested substantial personnel and financial resources to integrate traditional enterprise software into their organizations and, therefore, may be reluctant or unwilling to migrate to a cloud-based model for storing, accessing, sharing and managing their content. Because we derive, and expect to continue to derive, a substantial portion of our revenue and cash flows from sales of our cloud-based solutions, our success will depend to a substantial extent on the widespread adoption of cloud computing for companies in general. Our cloud strategy will continue to evolve and we may not be able to compete effectively, generate significant revenues or maintain profitability. While we believe our expertise, investments in infrastructure, and the breadth of our cloud-based services provides us with a strong foundation to compete, it is uncertain whether our strategies will attract the users or generate the revenue required to be successful. In addition to software development costs, we incur costs to build and maintain infrastructure to support cloud-based services. It is difficult to predict customer adoption rates and demand for our services, the future growth rate and size of the cloud computing market or the entry of competitive services. The expansion of a cloud-based enterprise software market depends on a number of factors, including the cost, performance and perceived value associated with cloud computing, as well as the ability of companies that provide cloud-based services to address security and privacy concerns. If we or other providers of cloud-based services experience security incidents, loss of customer data, disruptions in delivery or other problems, the market for cloud-based services as a whole, including our services, may be negatively affected. If there is a reduction in demand for cloud-based services caused by a lack of customer acceptance, technological challenges, weakening economic conditions, security or privacy concerns, competing technologies and products, decreases in corporate spending or otherwise, we could experience decreased revenue, which could harm our growth rates and adversely affect our business and operating results.
Government regulation of the Internet and e-commerce and of the international exchange of certain information is subject to possible unfavorable changes, and our failure to comply with applicable regulations could harm our business and operating results.
As Internet commerce continues to evolve, increasing regulation by federal, state, local and foreign governments becomes more likely. For example, we believe increased regulation is likely in the area of data privacy. Further, laws and regulations applying to the solicitation, collection, processing or use of personal or consumer information could affect our customers' ability to use and
17
share data, potentially reducing demand for our products and services. In addition, taxation of products and services provided over the Internet or other charges imposed by government agencies or by private organizations for accessing the Internet may also be imposed. Any regulation imposing greater fees for Internet use or restricting the exchange of information over the Internet could result in reduced growth or a decline in the use of the Internet and could diminish the viability of our Internet-based services, which could harm our business and operating results.
Our business depends substantially on customers renewing and expanding their subscriptions for our services. Any decline in our customer renewals and expansions would harm our future operating results.
We enter into subscription agreements with certain of our customers that are generally one to two years in length. As a result, maintaining the renewal rate of those subscription agreements is critical to our future success. We cannot provide assurance that any of our customer agreements will be renewed, as our customers have no obligation to renew their subscriptions for our services after the expiration of the initial term of their agreements. The loss of any customers that individually or collectively account for a significant amount of our revenues would have a material adverse effect on our results of operations or financial condition. If our renewal rates are lower than anticipated or decline for any reason, or if customers renew on terms less favorable to us, our revenue may decrease and our profitability and gross margin may be harmed, which would have a material adverse effect on our business, results of operations and financial condition.
If we do not maintain the compatibility of our services with third-party applications that our customers use in their business processes or if we fail to adapt our services to changes in technology or the marketplace, demand for our services could decline.
Our solutions can be used alongside a wide range of other systems such as email and enterprise software systems used by our customers in their businesses. If we do not support the continued integration of our products and services with third-party applications, including through the provision of application programming interfaces that enable data to be transferred readily between our services and third-party applications, demand for our services could decline and we could lose sales or experience declining renewal rates. We will also be required to make our products and services compatible with new or additional third-party applications that are introduced to the markets that we serve and, if we are not successful, we could experience reduced demand for our services. In addition, prospective customers, especially large enterprise customers, may require heavily customized features and functions unique to their business processes. If prospective customers require customized features or functions that we do not offer and that would be difficult for them to develop and integrate within our services, then the market for our products and services may be adversely affected.
We may not currently or in the future appropriately leverage advances in technology to achieve or sustain a competitive advantage in products, services, information and processes. Our customers and users regularly adopt new technologies and industry standards continue to evolve. The introduction of products or services and the emergence of new industry standards can render our existing services obsolete and unmarketable in short periods of time. We expect others to continue to develop, introduce new and enhance existing products and services that will compete with our services. Our future success will depend, in part, on our ability to enhance our current services and to develop and introduce new services that keep pace with technological developments, emerging industry standards and the needs of our customers. We cannot assure that we will be successful in cost-effectively developing, marketing and selling new services or service enhancements that meet these changing demands on a timely basis, that we will not experience difficulties that could delay or prevent the successful development, introduction and marketing of these services, or that our new service and service enhancements will adequately meet the demands of the marketplace and achieve market acceptance. We also cannot assure that the features that we believe will drive purchasing decisions will in fact be the features that our potential customers consider most significant.
Our revenue, earnings and profitability are affected by the length of our sales cycle, and a longer sales cycle could adversely affect our results of operations and financial condition.
Our business is directly affected by the length of our sales cycles. Our customers' businesses are relatively complex and their purchase of the types of services that we offer generally involve a significant financial commitment, with attendant delays frequently associated with large financial commitments and procurement procedures within an organization. In addition, as we continue to further penetrate the enterprise and the size and complexity of our sales opportunities continue to expand, we have seen an increase in the average length of time in our sales cycles. The purchase of the types of services that we offer typically also requires coordination and agreement across many departments within a potential customer's organization. Delays associated with such timing factors could have a material adverse effect on our results of operations and financial condition. In periods of economic slowdown our typical sales cycle lengthens, which means that the average time between our initial contact with a prospective customer and the signing of a sales contract increases. The lengthening of our sales cycle could reduce growth in our revenue. In addition, the lengthening of our sales cycle contributes to an increased cost of sales, thereby reducing our profitability.
18
We traditionally have had substantial customer concentration, with a limited number of customers accounting for a substantial portion of our revenues.
Each of AT&T and Verizon accounted for more than 10% of our revenues for the years ended December 31, 2016 and 2015. AT&T and Verizon in the aggregate accounted for 62% and 71% of our revenues for the years ended December 31, 2016 and 2015, respectively. Although, as described above, in December 2016, we divested a portion of our AT&T Activation business related to our exception handling business, which will reduce our customer concentration with one of our top revenue-generating customers, there are inherent risks whenever a large percentage of total revenues are concentrated with a limited number of customers. It is not possible for us to predict the future level of demand for our services that will be generated by these customers or the future demand for the products and services of these customers in the end-user marketplace. In addition, revenues from these larger customers may fluctuate from time to time based on the commencement and completion of projects, the timing of which may be affected by market conditions or other factors, some of which may be outside of our control. Further, some of our contracts with these larger customers permit them to terminate our services at any time (subject to notice and certain other provisions). If any of our major customers experience declining or delayed sales due to market, economic or competitive conditions, we could be pressured to reduce the prices we charge for our services or we could lose the customer. Any such development could have an adverse effect on our margins and financial position, and would negatively affect our revenues and results of operations and/or trading price of our common stock. Although the recently acquired Intralinks business has a diverse customer base and we expect that revenue from our Intralinks business will comprise a significant portion of our going forward revenue, there can be no assurance that our revenues will not continue to be sufficiently concentrated among a limited number of customers.
As we continue to pursue new enterprise customers, our sales cycle, forecasting processes and deployment processes may be less predictable and require greater time and expense.
As an increasing portion of our business is focused on the enterprise market, our sales cycles may lengthen. Enterprise customers may undertake a significant evaluation process in regard to enterprise software, which can last from several months to a year or longer. Our enterprise sales efforts often require us to educate our customers about the use and benefit of our services, including the technical capabilities and potential cost savings to an organization. In this market segment, in order to make sales, we may need to provide greater levels of customer education regarding the uses and benefits of our services, as well as regarding security, privacy, and data protection laws and regulations, especially for those customers in more heavily regulated industries or those with significant international operations. If our sales cycles were to lengthen, events may occur during the sales cycle that could affect the size or timing of a purchase or even cause cancellations, and this may lead to more unpredictability in our business and operating results. Additionally, sales cycles for sales of certain of our products and services tend to be longer, ranging from three to 12 months or more, which may make forecasting more complex and uncertain. We may spend substantial time, effort and money on our sales efforts without any assurance that our efforts will produce any sales. In addition, product purchases by large enterprises are frequently subject to budget constraints, multiple approvals, and unplanned administrative processing and other delays. Finally, large enterprises may have longer implementation cycles, require greater product functionality and scalability and a broader range of services, demand that vendors take on a larger share of risks, require acceptance provisions that can lead to a delay in revenue recognition and expect greater payment flexibility from vendors. All of these factors can add further risk to business conducted with these customers. If we fail to realize an expected sale from a large end-customer in a particular quarter or at all, our business, operating results, and financial condition could be materially and adversely affected. Further, where we make sales to enterprise customers on a subscription basis, there may be a delay between when we make the sale and when we start to recognize revenue from that customer. In addition, where we provide professional services, we are required to delay revenue recognition on some of these transactions until the technical or implementation requirements have been met.
We may also face unexpected deployment challenges with enterprise customers or more complicated installations of our products. It may be difficult to deploy our software products if the customer has unexpected database, hardware or software technology issues. Additional deployment complexities may occur if a customer hires a third party to deploy our products and services. Any difficulties or delays in the initial implementation could cause customers to reject our software or lead to the delay or non-receipt of future orders, in which case our business, operating results and financial condition would be harmed.
If we do not meet our revenue forecasts, we may be unable to reduce our expenses in a timely fashion to avoid or minimize harm to our results of operations.
Our revenues are difficult to forecast and are likely to fluctuate significantly from period to period, particularly as we continue to implement our business strategy. We base our operating expense and capital investment budgets on expected sales and revenue trends, and many of our expenses, such as office and equipment leases and personnel costs, will be relatively fixed in the short term and will increase over time as we make investments in our business. Our estimates of sales trends may not correlate with actual revenues in a particular quarter or over a longer period of time. Variations in the rate and timing of conversion of our sales prospects into sales and actual revenues could cause us to plan or budget inaccurately and those variations could adversely affect
19
our financial results. In particular, delays, reductions in amount or cancellation of customers' contracts would adversely affect the overall level and timing of our revenues, and our business, results of operations and financial condition could be harmed. Due to the relatively fixed nature of many of our expenses, we may be unable to adjust spending quickly enough to offset any unexpected revenue shortfall. In the course of our sales to customers, we may encounter difficulty collecting accounts receivable and could be exposed to risks associated with uncollectible accounts receivable. In the event we are unable to collect on our accounts receivable, it could negatively affect our cash flows, operating results and business.
Because we recognize revenue for certain of our products and services ratably over the term of our customer agreements, downturns or upturns in the value of signed contracts will not be fully and immediately reflected in our operating results.
We offer certain of our products and services primarily through fixed commitment contracts and recognize revenue ratably over the related service period, which typically ranges from twelve to twenty-four months. As a result, some portion of the revenue we report in each quarter is revenue from contracts entered into during prior periods. Consequently, a decline in signed contracts in any quarter will not be fully and immediately reflected in revenue for that quarter, but will instead negatively affect our revenue in future quarters. In addition, we may be unable to adjust our cost structure to offset this reduced revenue. Similarly, revenue attributable to an increase in contracts signed in a particular quarter will not be fully and immediately recognized, as revenue from new or renewed contracts is recognized ratably over the applicable service period. Because we incur sales commissions at the time of sale, we may not recognize revenues from some customers despite incurring considerable expense related to our sales processes. Timing differences of this nature could cause our margins and profitability to fluctuate significantly from quarter to quarter.
Our offerings of new services or products may be subject to complex revenue recognition standards, which could materially affect our financial results.
As we introduce new services or products, revenue recognition could become increasingly complex and require additional analysis and judgment. Additionally, we may negotiate and revise terms and conditions of our contracts with customers and channel partners, which may also cause us to revise our revenue recognition policies. As our arrangements with customers evolve, we may be required to defer a greater portion of revenue into future periods, which could materially and adversely affect our financial results.
Failure to maintain the confidentiality, integrity and availability of our systems, software and solutions could seriously damage our reputation and affect our ability to retain customers and attract new business.
Maintaining the confidentiality, integrity and availability of our systems, software and solutions is an issue of critical importance for us and for our customers and users who rely on our systems to store and exchange large volumes of information, much of which is proprietary and confidential. There appears to be an increasing number of individuals, governments, groups and computer "hackers" developing and deploying a variety of destructive software programs (such as viruses, worms and other malicious software) that could attack our computer systems or solutions or attempt to infiltrate our systems. We make significant efforts to maintain the confidentiality, integrity and availability of our systems, solutions and source code. Despite significant efforts to create security barriers, it is virtually impossible for us to mitigate this risk entirely because techniques used to obtain unauthorized access or sabotage systems change frequently and generally are not recognized until launched against a target. Like all software solutions, our software is vulnerable to these types of attacks. An attack of this type could disrupt the proper functioning of our software solutions, cause errors in the output of our customers' work, allow unauthorized access to sensitive, proprietary or confidential information of ours or our customers and other destructive outcomes. If an actual or perceived breach of our security were to occur, our reputation could suffer, customers could stop buying our solutions and we could face lawsuits and potential liability, any of which could cause our financial performance to be negatively impacted. Though we maintain professional liability insurance that may be available to provide coverage if a cybersecurity incident were to occur, there can be no assurance that insurance coverage will be available or that available coverage will be sufficient to cover losses and claims related to any cybersecurity incidents we may experience.
There is also a danger of industrial espionage, cyber attacks, misuse or theft of information or assets (including source code), or damage to assets by people who have gained unauthorized access to our facilities, systems or information, which could lead to the disclosure of portions of our source code or other confidential information, improper usage and distribution of our solutions without compensation, illegal or inappropriate usage of our systems and solutions, jeopardizing of the security of information stored in and transmitted through our computer systems, manipulation and destruction of data, defects in our software and downtime issues. Although we actively employ measures to combat unlicensed copying, access and use of our facilities, systems, software and intellectual property through a variety of techniques, preventing unauthorized use or infringement of our rights is inherently difficult. The occurrence of an event of this nature could adversely affect our financial results or could result in significant claims against us for damages. Further, participating in either a lawsuit to protect against unauthorized access to, usage of or disclosure
20
of any of our solutions or any portion of our source code or the prosecution of an individual in connection with a cybersecurity breach could be costly and time-consuming and could divert management's attention and adversely affect the market's perception of us and our solutions.
A number of core processes, such as software development, sales and marketing, customer service and financial transactions, rely on our IT, infrastructure and applications. Defects or malfunctions in our IT infrastructure and applications could cause our service offerings not to perform as our customers expect, which could harm our reputation and business. In addition, malicious software, sabotage and other cybersecurity breaches of the types described above could cause an outage of our infrastructure, which could lead to a substantial denial of service and ultimately downtimes, recovery costs and customer claims, any of which could have a significant negative impact on our business, financial position, profit and cash flows.
We rely upon our customers and users of our solutions to perform important activities relating to the security of the data maintained on our platforms, particularly the Intralinks platform in the case of our recently acquired Intralinks business, such as assignment of user access rights and administration of document access controls. Because we do not control the access provided by our customers to third parties with respect to all the data on our systems, we cannot ensure the complete integrity or security of this data. Errors or wrongdoing by users resulting in security breaches could be attributed to us. Because many of the engagements in our business, particularly our Intralinks business, involve business-critical projects for financial institutions and their customers and for other types of customers where confidentiality is of paramount importance, a failure or inability to meet our customers' expectations with respect to security and confidentiality could seriously damage our reputation and affect our ability to retain customers and attract new business.
The confidentiality, integrity and availability of our systems could also be jeopardized by a breach of our internal controls and policies by our employees, consultants or subcontractors having access to our systems. If our systems fail or are breached as a result of a third-party attack or an error, violation of internal controls or policies or a breach of contract by an employee, consultant or subcontractor that results in the unauthorized use or disclosure of proprietary or confidential information or customer data (including information about the existence and nature of the projects and transactions our customers are engaged in), we could lose business, suffer irreparable damage to our reputation and incur significant costs and expenses relating to the investigation and possible litigation of claims relating to such event. We could be liable for damages, penalties for violation of applicable laws or regulations and costs for remediation and efforts to prevent future occurrences, any of which liabilities could be significant. There can be no assurance that the limitations of liability in our contracts would be enforceable or adequate or would otherwise protect us from liabilities or damages with respect to any particular claim. We also cannot assure that our existing general liability insurance coverage, coverage for errors and omissions and cyber liability insurance will continue to be available on acceptable terms in sufficient amounts to cover one or more large claims, or that the insurer will not deny coverage as to any future claim. The successful assertion of one or more large claims against us that exceeds our available insurance coverage, or the occurrence of changes in our insurance policies, including premium increases or the imposition of large deductible or co-insurance requirements, could have a material adverse effect on our business, financial condition and results of operations. Furthermore, litigation, regardless of its outcome, could result in a substantial cost to us and divert management's attention from our operations. Any significant claim against us or litigation involving us could have a material adverse effect on our business, financial condition and results of operations.
We have implemented a number of security measures designed to ensure the security of our information, IT resources and other assets. Nonetheless, unauthorized users could gain access to our systems through cyber attacks and steal, use without authorization and sabotage our intellectual property and confidential data. Any security breach, misuse of our IT systems or theft of our or our customers' intellectual property or data could lead to customer losses, non-renewal of customer agreements, loss of production, recovery costs or litigation brought by customers or business partners, any of which could adversely impact our cash flows and reputation and could have an adverse impact on our disclosure controls and procedures.
Undetected errors or failures found in our products and services may result in loss of or delay in market acceptance of our products and services that could seriously harm our business.
Our products and services may contain undetected errors or scalability limitations at any point in their lives, but particularly when first introduced or as new versions are released. We frequently release new versions of our products and different aspects of our platforms are in various stages of development. Despite testing by us and by current and potential customers, errors may not be found in new products and services until after commencement of commercial availability or use, resulting in a loss of or a delay in market acceptance, damage to our reputation, customer dissatisfaction and reductions in revenues and margins, any of which could seriously harm our business. Additionally, our agreements with customers that attempt to limit our exposure to liability claims may not be enforceable in jurisdictions where we operate, particularly in certain markets outside the United States.
21
Compliance with changing European privacy laws could require us to incur significant costs or experience significant business disruption and failure to so comply could result in an adverse impact on our business.
Our solutions provide our customers, for example, with access to websites to conduct e-commerce transactions or access important data and central locations where they can post information and make it accessible to any parties they authorize to access that information. In connection with offering our solutions to customers and their invited guests, we collect user information related to the individuals who access our software solutions.
Europe Directive 95/46/EC, which covers the protection of individuals with regard to the processing of personal data and on the free movement of such data, or the Directive, has required European Union member states to implement data protection laws to meet the strict privacy requirements of the Directive. Among other requirements, the Directive regulates transfers of personally identifiable data that is subject to the Directive, or Personal Data, to third countries, outside the European Economic Area, or the EEA, such as the United States, that have not been found to provide adequate protection to such Personal Data. We have in the past relied upon adherence to the U.S. Department of Commerce’s Safe Harbor Privacy Principles and compliance with the U.S.-EU Framework as agreed to and set forth by the U.S. Department of Commerce and the European Union, which established a means for legitimating the transfer of Personal Data by data controllers in the EEA to the United States. As a result of the October 6, 2015 European Union Court of Justice, or ECJ, opinion in Case C-362/14 (Schrems v. Data Protection Commissioner) regarding the adequacy of the U.S.-EU Safe Harbor Framework, the U.S.-EU Safe Harbor Framework is no longer deemed to be a valid method of compliance with requirements set forth in the Directive (and member states’ implementations thereof) regarding the transfer of Personal Data outside of the EEA.
The successor to the Safe Harbor framework, the EU-US Privacy Shield, was adopted in July 2016. We certified to adhere to this framework in October 2016. The adequacy of this framework, however, is currently being challenged in European courts. We cannot rely on the fact that the framework will not follow the path of the Safe Harbor framework and as such we will continue to face uncertainty as to whether our efforts to comply with our obligations under European privacy laws will be sufficient. If we are investigated by a European data protection authority, we may face fines and other penalties. Any such investigation or charges by European data protection authorities could have a negative effect on our existing business and on our ability to attract and retain new customers.
We have undertaken efforts to conform transfers of Personal Data from the EEA based on current regulatory obligations, the guidance of data protection authorities and evolving best practices. Despite these efforts, we may be unsuccessful in establishing conforming means of transferring such data from the EEA, including due to ongoing legislative activity, which may vary the current data protection landscape.
We may also experience hesitancy, reluctance or refusal by European or multi-national customers to continue to use our services due to the potential risk exposure that these customers might face as a result the current data protection obligations imposed on them by certain data protection authorities. These customers may also view any alternative approaches to compliance as being too costly, too burdensome, too legally uncertain or otherwise objectionable and therefore decide not to do business with us.
We and our customers are at risk of enforcement actions taken by certain EU data protection authorities until such time as we may be able to ensure that all transfers of Personal Data to us from the EEA are conducted in compliance with all applicable regulatory obligations, the guidance of data protection authorities and evolving best practices. We may find it necessary to establish systems to maintain Personal Data originating from the EU in the EEA, which may involve substantial expense and may cause us to need to divert resources from other aspects of our business, all of which may adversely affect our business.
The Directive will be replaced in time with the pending European General Data Protection Regulation, which will impose additional obligations and risk upon our business and which may increase substantially the penalties to which we could be subject in the event of any non-compliance. We may incur substantial expense in complying with the new obligations to be imposed by the European General Data Protection Regulation and we may be required to make significant changes in our business operations, all of which may adversely affect our revenues and our business overall.
Compromises to our privacy safeguards or disclosure of confidential information could impact our reputation.
Names, addresses, telephone numbers, credit card data and other personal identification information, or PII, are collected, processed and stored in our systems. Our treatment of this kind of information is subject to contractual restrictions and federal, state and foreign data privacy laws and regulations. We have implemented steps designed to protect against unauthorized access to such information, and comply with these laws and regulations. Because of the inherent risks and complexities involved in protecting this information, the steps we have taken to protect PII may not be sufficient to prevent the misappropriation or improper disclosure of such PII. If misappropriation or disclosure of PII were to occur, our business could be harmed through reputational
22
injury, litigation and possible damages claimed by the affected end customers, including in some cases costs related to customer notification and fraud monitoring, or potential fines from regulatory authorities. We may need to incur significant costs or modify our business practices and/or our services in order to comply with these data privacy and protection laws and regulations in the future. Even the mere perception of a security breach or inadvertent disclosure of PII could adversely affect our business and results of operations. In addition, third party vendors that we engage to perform services for us may unintentionally release PII or otherwise fail to comply with applicable laws and regulations. Our insurance may not cover potential claims of this type or may not be adequate to cover all costs incurred in defense of potential claims or to indemnify us for all liability that may be imposed. Concerns about the security of online transactions and the privacy of PII could deter consumers from transacting business with us on the Internet. The occurrence of any of these events could have an adverse effect on our business, financial position, and results of operations.
We intend to reserve from time to time a certain amount of cash in order to satisfy the obligations relating to our debt, which could adversely affect the amount or timing of investments to grow our business.
The 2019 Notes are unsecured debt and are not redeemable by us prior to the maturity date. Holders of the 2019 Notes may require us to purchase all or any portion of their 2019 Notes at 100% of their principal amount, plus any unpaid interest, upon a fundamental change, which is generally defined to include a merger involving us, an acquisition of a majority of our outstanding common stock and the change of a majority of our board without the approval of the board. In addition, to the extent we pursue and complete a monetization transaction, the structure of that transaction may qualify as a fundamental change under the 2019 Notes, which could trigger the put rights of the holders of the 2019 Notes, in which case we would be required to use a portion of the net proceeds from that transaction to repurchase any 2019 Notes put to us, which could adversely affect the amount or timing of any distributions to our stockholders.
We intend to reserve from time to time a certain amount of cash in order to satisfy these obligations relating to the 2019 Notes, which could materially affect the amount or timing of any investments to grow our business. If any or all of the 2019 Notes are not converted into shares of our common stock before the maturity date, we will have to pay the holders the full aggregate principal amount of the 2019 Notes then outstanding. Any of the above payments could have a material adverse effect on our cash position. If we fail to satisfy these obligations, it may result in a default under the indenture, which could result in a default under certain of our other debt instruments, if any. Any such default would harm our business and the price of our securities could fall.
Downgrades in our credit ratings may increase our future borrowing costs, limit our ability to raise capital, cause our stock price to decline or reduce analyst coverage, any of which could have a material adverse impact on our business.
Credit rating agencies review their ratings periodically and, therefore, the credit rating assigned to us by each of the rating agencies may be subject to revision at any time. Factors that can affect our credit ratings include changes in our operating performance, the economic environment, our financial position, conditions in and periods of disruption in any of our principal markets and changes in our business strategy. If weak financial market conditions or competitive dynamics cause any of these factors to deteriorate, we could see a reduction in our corporate credit rating. Since investors, analysts and financial institutions often rely on credit ratings to assess a company's creditworthiness and risk profile, make investment decisions and establish threshold requirements for investment guidelines, our ability to raise capital, our access to external financing, our ability to refinance our indebtedness, our stock price and analyst coverage of our stock could be negatively impacted by a downgrade to our credit rating.
Changes in laws, regulations or governmental policy applicable to our customers or potential customers may decrease the demand for our solutions or increase our costs.
The level of our customers' and potential customers' activity in the business processes our services are used to support is sensitive to many factors beyond our control, including governmental regulation and regulatory policies. Many of our customers and potential customers in the telecommunications, life sciences, energy, utilities, insurance, financial and other industries are subject to substantial regulation and may be the subject of further regulation in the future. Accordingly, significant new laws or regulations or changes in, or repeals of, existing laws, regulations or governmental policy may change the way these customers do business and could cause the demand for and sales of our solutions to decrease. For example, many products developed by our customers in the life sciences industry require approval of the United States Food and Drug Administration, or FDA, and other similar foreign regulatory agencies before they can market their products. The processes for filing and obtaining FDA approval to market these products are guided by specific protocols that our services help support, such as United States 21 CFR Part 11, which provides the criteria for acceptance by the FDA of electronic records. If new government regulations from future legislation or administrative action or from changes in FDA or foreign regulatory policies occur in the future, the services we currently provide may no longer support these life science processes and protocols, and we may lose customers in the life sciences industry. Any change in the scope of applicable regulations that either decreases the volume of transactions that our customers or potential
23
customers enter into or otherwise negatively impacts their use of our solutions would have a material adverse effect on our revenues or gross margins, or both. Moreover, complying with increased or changed regulations could cause our operating expenses to increase as we may have to reconfigure our existing services or develop new services to adapt to new regulatory rules and policies, either of which would require additional expense and time. Additionally, the information provided by, or residing in, the software or services we provide to our customers could be deemed relevant to a regulatory investigation or other governmental or private legal proceeding involving our customers, which could result in requests for information from us that could be expensive and time consuming for us to address or harm our reputation since our customers rely on us to protect the confidentiality of their information. These types of changes could adversely affect our business, results of operations and financial condition.
Fraudulent Internet transactions could negatively impact our business.
Our business may be exposed to risks associated with Internet credit card fraud and identity theft that could cause us to incur unexpected expenditures and loss of revenues. Under current credit card practices, a merchant is liable for fraudulent credit card transactions when, as is the case with the transactions we process, that merchant does not obtain a cardholder's signature. Although our customers currently bear the risk for a fraudulent credit card transaction, in the future we may be forced to share some of that risk and the associated costs with our customers. To the extent that technology upgrades or other expenditures are required to prevent credit card fraud and identity theft, we may be required to bear the costs associated with such expenditures. In addition, to the extent that credit card fraud and/or identity theft cause a decline in business transactions over the Internet generally, both the business of our customers and our business could be adversely affected.
Consolidation in the communications industry, the commercial or investment banking industries or the other industries that we serve can reduce the number of actual and potential customers and adversely affect our business.
There has been, and there continues to be, merger, acquisition, alliance and consolidation activity among our customers. Mergers, acquisitions, alliances or consolidations of companies in the communications industry or banks and financial institutions, in particular, have reduced and may continue to reduce the number of our customers and potential customers for our solutions, resulting in a smaller market for our services, which could have a material adverse impact on our business and results of operations. In addition, it is possible that the larger institutions that result from mergers or consolidations could themselves perform some or all of the services that we currently provide or could provide in the future. Should one or more of our significant customers acquire, consolidate or enter into an alliance with an entity or decide to either use a different service provider or to manage its transactions internally, this could have a negative material impact on our business. Any such consolidations, alliances or decisions to manage transactions internally may cause us to lose customers or require us to reduce prices as a result of enhanced customer leverage, which would have a material adverse effect on our business. We may not be able to offset the effects of any price reductions. We may not be able to expand our customer base to make up any revenue declines if we lose customers or if our transaction volumes decline.
Failures or interruptions of our systems and services could materially harm our revenues, impair our ability to conduct our operations and damage relationships with our customers.
Our success depends on our ability to provide reliable services to our customers and process a high volume of transactions in a timely and effective manner. Although we operate disaster recovery solutions our network operations are susceptible to damage or interruption from human error, fire, flood, power loss, telecommunications failure, terrorist attacks and similar events. We could also experience failures or interruptions of our systems and services, or other problems in connection with our operations, as a result of, among other things:
• | damage to or failure of our computer software or hardware or our connections and outsourced service arrangements with third parties; |
• | errors in the processing of data by our systems; |
• | computer viruses or software defects; |
• | physical or electronic break-ins, sabotage, intentional acts of vandalism and similar events; |
• | fire, cybersecurity attack, terrorist attack or other catastrophic event; |
• | increased capacity demands or changes in systems requirements of our customers; or |
• | errors by our employees or third-party service providers. We rely on various systems and applications to support our internal operations, including our billing, financial reporting and customer contracting functions. The availability of these systems and applications is essential to us and delays, disruptions or performance problems may adversely impact our ability to accurately bill our customers, report financial information and conduct our business. Additionally, we may choose to replace or implement changes to these systems, including substituting traditional systems with cloud-based solutions, which could be time-consuming and expensive and which could result in delays in the ongoing operational processes these software solutions support. Further, our cloud-based solutions may experience disruptions and outages |
24
that are beyond our control as we rely on third party vendors to support these solutions and assure their continued availability. We have also acquired a number of companies, products, services and technologies over the last several years. While we make significant efforts to address any IT security issues with respect to our acquisitions, we may still inherit certain risks when we integrate these acquisitions. In addition, our business interruption insurance may be insufficient to compensate us for losses or liabilities that may occur. Any interruptions in our systems or services could damage our reputation and substantially harm our business and results of operations.
The quality of our support and services offerings is important to our customers and if we fail to meet our service level obligations under our service level agreements or otherwise fail to offer quality support and services, we would be subject to penalties and could lose customers.
Our customers generally depend on our service organization to resolve issues relating to the use of our solutions. A high level of support is critical for the successful marketing and sale of our solutions. If we are unable to provide a level of support and service to meet or exceed the expectations of our customers, we could experience:
• | loss of customers and market share; |
• | difficulty attracting or the inability to attract new customers, including in new geographic regions; and |
• | increased service and support costs and a diversion of resources. |
Any of the above results would likely have a material adverse impact on our business, revenue, results of operations, financial condition and reputation.
In addition, we have service level agreements with many of our customers under which we guarantee specified levels of service availability. These arrangements involve the risk that we may not have adequately estimated the level of service we will in fact be able to provide. The importance of high quality customer support will increase as we expand our business and pursue new enterprise customers. If we fail to meet our service level obligations under these agreements, we would be subject to penalties, which could result in higher than expected costs, decreased revenues and decreased operating margins. We could also lose customers.
The financial and operating difficulties in the telecommunications sector may negatively affect our customers and our company.
The telecommunications sector has at times faced significant challenges resulting from significant changes in technology and consumer behavior, excess capacity, poor operating results and financing difficulties. The sector's financial status has also at times been uncertain and access to debt and equity capital has been seriously limited. The impact of these events on us could include slower collection on accounts receivable, higher bad debt expense, uncertainties due to possible customer bankruptcies, lower pricing on new customer contracts, lower revenues due to lower usage by the end customer and possible consolidation among our customers, which will put our customers and operating performance at risk. In addition, because we operate in the communications sector, we may also be negatively impacted by limited access to debt and equity capital.
Our performance and growth depend on our ability to generate customer referrals and to develop referenceable customer relationships that will enhance our sales and marketing efforts. A failure to accomplish these objectives could materially harm our business.
In our business, we depend on end-users of our solutions to generate customer referrals for our services. We depend in part on members of the communications industry, financial institutions, legal service providers and other third parties who use our services to recommend them to a larger customer base than we can reach through our direct sales and internal marketing efforts. For instance, a significant portion of our revenue from our recently acquired Intralinks mergers and acquisitions, or M&A, solutions is derived from referrals by investment banks, financial advisors and law firms that have utilized these services in connection with prior transactions. These referrals are an important source of new customers for our services and generally are made without expectation of compensation. We intend to continue to focus our marketing efforts on these referral partners in order to expand our reach and improve the efficiency of our sales efforts.
We also recognize that having respected, well known, market-leading customers who have committed to deploy our solutions within their organizations will support our marketing and sales efforts, as these customers can act as references for us and our product offerings. Our ability to establish and maintain these customer relationships is important to our future profitability. The willingness of these types of customers to provide referrals or serve as anchor or reference customers depends on a number of factors, including the performance, ease of use, reliability, reputation and cost-effectiveness of our services as compared to those offered by our competitors, as well as the internal policies of these customers. We may not be able to cultivate or maintain the strong relationships with customers that are necessary to develop those customer relationships into referenceable accounts.
25
The loss of any of our significant referral sources, including our anchor customers, or a decline in the number of referrals we receive or anchor customers that we generate could require us to devote substantially more resources to the sales and marketing of our services, which would increase our costs, potentially lead to a decline in our revenue, slow our growth and generally have a material adverse effect on our business, results of operations and financial condition. In addition, the revenue we generate from our referral and anchor relationships may vary from period to period.
We rely in part on strategic relationships with third parties to sell and deliver our solutions. If we are unable to successfully develop and maintain these relationships, our business may be harmed.
In addition to generating customer referrals through third-party users of our solutions, we intend to pursue relationships with other third parties such as technology and content providers and implementation and distribution partners. Our future growth will depend, at least in part, on our ability to enter into and maintain successful strategic relationships with these third parties. Identifying partners and negotiating and documenting relationships with them requires significant time and resources, as does integrating third-party content and technology. Some of the third parties with whom we have strategic relationships have entered and may continue to enter into strategic relationships with our competitors. Further, these third parties may have multiple strategic relationships and may not regard us as significant for their businesses. As a result, they may choose to offer their services on terms that are unfavorable to us, terminate their respective relationships with us, pursue other partnerships or relationships, or attempt to develop or acquire services or solutions that compete with ours. Our relationships with strategic partners could also interfere with our ability to enter into desirable strategic relationships with other potential partners in the future. If we are unsuccessful in establishing or maintaining relationships with strategic partners on favorable economic terms, our ability to compete in the marketplace or to grow our revenue could be impaired, and our business, results of operations and financial condition would suffer. Even if we are successful, we cannot provide assurance that these relationships will result in increased revenue or customer usage of our solutions or that the economic terms of these relationships will not adversely affect our margins.
We are exposed to our customers' credit risk.
We are subject to the credit risk of our customers and customers with liquidity issues may lead to bad debt expense for us. Most of our sales are on an open credit basis, with typical payment terms between 45 and 60 days in the United States and, because of local customs or conditions, longer payment terms in some markets outside the United States. We use various methods to screen potential customers and establish appropriate credit limits, but these methods cannot eliminate all potential bad credit risks and may not prevent us from approving applications that are fraudulently completed. Moreover, businesses that are good credit risks at the time of application may become bad credit risks over time and we may fail to detect this change. We maintain reserves we believe are adequate to cover exposure for doubtful accounts. If we fail to adequately assess and monitor our credit risks, we could experience longer payment cycles, increased collection costs and higher bad debt expense. A decrease in accounts receivable resulting from an increase in bad debt expense could adversely affect our liquidity. Our exposure to credit risks may increase if our customers are adversely affected by a difficult macroeconomic environment, or if there is a continuation or worsening of the economic environment. Although we have programs in place that are designed to monitor and mitigate the associated risk, including monitoring of particular risks in certain geographic areas, there can be no assurance that these programs will be effective in reducing our credit risks or preventing us from incurring additional losses. Future and additional losses, if incurred, could harm our business and have a material adverse effect on our business operating results and financial condition. Additionally, to the degree that the current or future credit markets makes it more difficult for some customers to obtain financing, those customers' ability to pay could be adversely impacted, which in turn could have a material adverse impact on our business, operating results, and financial condition.
Our reliance on third-party providers for communications software, services, hardware and infrastructure exposes us to a variety of risks we cannot control.
Our success depends on software, equipment, network connectivity and infrastructure hosting services supplied by, or leased from, our vendors and customers. In addition, we rely on third-party vendors to perform a substantial portion of our exception handling services. We may not be able to continue to purchase the necessary software, equipment and services from vendors on acceptable terms or at all. If we are unable to maintain current purchasing terms or ensure service availability with these vendors and customers, we may lose customers and experience an increase in costs in seeking alternative supplier services. Further, any changes in our third-party vendors could detract from management’s ability to focus on the ongoing operations of our business or could cause delays in the operations of our business.
Our business also depends upon the capacity, reliability and security of the infrastructure owned and managed by third parties, including our vendors and customers that are used by our technology interoperability services, network services, number portability services, call processed services and enterprise solutions. We have no control over the operation, quality or maintenance of a significant portion of that infrastructure and whether those third parties will upgrade or improve their software, equipment and
26
services to meet our and our customers' evolving requirements. We depend on these companies to maintain the operational integrity of our services. If one or more of these companies is unable or unwilling to supply or expand its levels of services to us in the future, our operations could be severely interrupted. In addition, rapid changes in the communications industry have led to industry consolidation. This consolidation may cause the availability, pricing and quality of the services we use to vary and could lengthen the amount of time it takes to deliver the services that we use.
Any damage to, or failure or capacity limitations of, our systems and our related network could result in interruptions in our service that could cause us to lose revenue, issue credits or refunds or could cause our customers to terminate their subscriptions for our services, in each case adversely affecting our renewal rates. Since our customers use our service for important aspects of their businesses, any errors, defects, disruptions in service or other performance problems could hurt our reputation and may damage our customers' businesses. As a result, we may lose revenue, issue credits or refunds or customers could elect not to renew our services or delay or withhold payments to us. We could also lose future sales or customers may make claims against us, which could result in an increase in our provision for doubtful accounts, an increase in collection cycles for accounts receivable or the expense or risk of litigation.
Additionally, third-party software underlying our services can contain undetected errors or bugs. We may be forced to delay commercial release of our services until any discovered problems are corrected and, in some cases, may need to implement enhancements or modifications to correct errors that we do not detect until after deployment of our services. In addition, problems with the third party software underlying our services could result in:
• | damage to our reputation; |
• | loss of or delayed revenue; |
• | loss of customers; |
• | warranty claims or litigation; |
• | loss of or delayed market acceptance of our services; or |
• | unexpected expenses and diversion of resources to remedy errors. |
We are participants in two joint ventures, which may subject us to certain risks relating to our ability to perform our obligations under the joint ventures, including funding future joint venture capital requirements.
Entering into joint ventures and alliances entails risks, including difficulties in developing and expanding the business of a newly formed joint venture, funding capital calls for the joint venture, exercising influence over the management and activities of joint venture, quality control concerns regarding joint venture products and services and potential conflicts of interest with the joint venture and our joint venture partner. We cannot guarantee that the joint venture operations will be successful. Any inability to meet our obligations as a joint venture partner under the joint ventures could result in penalties and reduced percentage interest in the joint venture for our company. Also, we could be disadvantaged in the event of disputes and controversies with a joint venture partner, since one of our joint venture partner is a relatively significant customer of our products and services and future product and services of the joint venture.
If we are unable to protect our intellectual property rights, our competitive position could be harmed or we could be required to incur significant expenses to enforce our rights.
Our success depends to a significant degree upon the protection of our software and other proprietary technology rights. We rely on trade secret, copyright and trademark laws and confidentiality agreements with employees and third parties, all of which offer only limited protection. We also regularly file patent applications to protect inventions arising from our research and development, and have obtained a number of patents in the United States and other countries. There can be no assurance that our patent applications will be approved, that any issued patents will adequately protect our intellectual property, or that our patents will not be challenged by third parties. Also, much of our business and many of our solutions rely on key technologies developed or licensed by third or other parties and we may not be able to obtain or continue to obtain licenses and technologies from these third parties at all or on reasonable terms. The steps we have taken to protect our intellectual property may not prevent misappropriation of our proprietary rights or the reverse engineering of our solutions. Legal standards relating to the validity, enforceability and scope of protection of intellectual property rights in other countries are uncertain and may afford little or no effective protection of our proprietary technology. Consequently, we may be unable to prevent our proprietary technology from being exploited abroad, which could require costly efforts to protect our technology. Policing the unauthorized use of our products, trademarks and other proprietary rights is expensive, difficult and, in some cases, impossible. Litigation may be necessary in the future to enforce or defend our intellectual property rights, to protect our trade secrets or to determine the validity and scope of the proprietary rights of others. This type of litigation could result in substantial costs and diversion of management resources, either of which could materially harm our business. Accordingly, despite our efforts, we may not be able to prevent third parties from infringing upon or misappropriating our intellectual property.
27
Claims by others that we infringe their proprietary technology could harm our business.
Third parties could claim that our current or future products or technology infringe their proprietary rights. We expect that software developers will increasingly be subject to infringement claims as the number of products and competitors providing software and services to the communications industry increases and overlaps occur. Any claim of infringement by a third party, even those without merit, could cause us to incur substantial costs defending against the claim, and could distract our management from our business. Furthermore, a party making a claim of this nature, if successful, could secure a judgment that requires us to pay substantial damages. A judgment could also include an injunction or other court order that could prevent us from offering our products or services. Any of these events could seriously harm our business.
We are generally obligated to indemnify our customers if our services infringe the proprietary rights of third parties and certain of our agreements with customers and partners include indemnification provisions under which we have agreed to indemnify the counter-party for losses suffered or incurred as a result of claims of intellectual property infringement and, in some cases, for financial and other damages caused by us to property or persons. Third parties may assert infringement claims against our customers or partners. These claims may require us to initiate or defend protracted and costly litigation on behalf of our customers or partners, regardless of the merits of these claims. If any of these claims succeed, we may be forced to pay damages on behalf of our customers or partners.
If anyone asserts a claim against us relating to proprietary technology or information, while we might seek to license their intellectual property, we might not be able to obtain a license on commercially reasonable terms or on any terms. In addition, any efforts to develop non-infringing technology could be unsuccessful. Our failure to obtain the necessary licenses or other rights or to develop non-infringing technology could prevent us from offering our services and could therefore seriously harm our business.
We may seek to acquire companies or technologies, form joint ventures or make investments in other companies or technologies, which could disrupt our ongoing business, disrupt our management and employees, dilute our stockholders’ ownership, increase our debt, and adversely affect our results of operations.
We have made, and in the future intend to form joint ventures, make acquisitions of and investments in companies, technologies or products in existing, related or new markets for us that we believe may enhance our market position or strategic strengths. However, we cannot be sure that any acquisition or investment will ultimately enhance our products or strengthen our competitive position. Acquisitions involve numerous risks, including but not limited to:
• | diversion of management's attention from other operational matters; |
• | inability to identify acquisition candidates on terms acceptable to us or at all, or inability to complete acquisitions as anticipated or at all; |
• | inability to realize anticipated benefits or commercialize purchased technologies; |
• | exposure to operational risks, rules and regulations to the extent such activities are located in countries where we have not historically done business; |
• | unknown, underestimated and/or undisclosed commitments or liabilities; |
• | incurrence of debt, contingent liabilities or future write-offs of intangible assets or goodwill; |
• | dilution of ownership of our current stockholders if we issue shares of our common stock; |
• | higher than expected transaction costs; and |
• | ineffective integration of operations, technologies, products or employees of the acquired companies. |
In addition, acquisitions may disrupt our ongoing operations, increase our expenses and/or harm our results of operations or financial condition. Future acquisitions could also result in potentially dilutive issuances of equity securities, the incurrence of debt (which may reduce our cash available for operations and other uses), an increase in contingent liabilities or an increase in amortization expense related to identifiable assets acquired, each of which could materially harm our business, financial condition and results of operations.
Specifically, in regards to our recent acquisition of Intralinks, in addition to the risks described above, we may not be able to effectively and efficiently integrate Intralinks into our company. For example, many of Intralinks’ contracts with its customers are entered into in connection with discrete one-time financial and strategic business transactions and projects, such as M&A transactions. These transactional agreements typically have initial terms of six to twelve months depending on the type of transaction and related purpose of the Intralinks exchange. On the other hand, the relationships with our customers are generally longer term, usually ranging from twelve to sixty months. This difference in our business models may create issues with our integration of the Intralinks business.
28
We make significant investments in new products and services that may not be profitable or align with our established company vision.
We intend to continue to make investments to support our business growth, including expenditures to develop new services or enhance our existing services, enhance our operating infrastructure, market and sell our product offerings and acquire complementary businesses and technologies. These endeavors may involve significant risks and uncertainties, including failures to align new initiatives with our established corporate vision and direction, which could lead to a misapplication of our resources. These new investments are inherently risky and may involve distracting management from current operations, create greater than expected liabilities and expenses, provide us with an inadequate return on capital, include other unidentified risks and, ultimately, may generally not be successful. Further, our ability to effectively integrate new services and investments into our business may affect our profitability. Significant delays in new releases or significant problems in creating new products or services could adversely affect our revenue and financial performance.
Interruptions or delays in our service due to problems with our third-party web hosting facilities or other third-party service providers could adversely affect our business.
We rely on third parties for the maintenance of certain of the equipment running our solutions and software at geographically dispersed hosting facilities with third parties. If we are unable to renew, extend or replace our agreements with any of our third party hosting facilities, we may be unable to arrange for replacement services at a similar cost and in a timely manner, which could cause an interruption in our service. We do not control the operation of these third party facilities, each of which may be subject to damage or interruption from earthquakes, floods, fires, power loss, telecommunications failures or similar events. These facilities may also be subject to break-ins, sabotage, intentional acts of vandalism or similar misconduct. Despite precautions taken at these facilities, the occurrence of a natural disaster, cessation of operations by our third-party web hosting provider or a third party's decision to close a facility without adequate notice or other unanticipated problems at any facility could result in lengthy interruptions in our service. In addition, the failure by these facilities to provide our required data communications capacity could result in interruptions in our service.
Our growth may strain our management, information systems and resources.
Our growth has placed, and may continue to place, a significant strain on our managerial, administrative, operational, financial and other resources. We intend to expand our overall business, customer base, headcount and operations both domestically and internationally. Growing a global organization and managing a geographically dispersed workforce will require substantial management effort and significant additional investment in our infrastructure. We will be required to continue to improve our IT infrastructure, reporting systems and procedures, and operational and financial controls, as well as manage expanded operations in geographically distributed locations. Our expected additional growth will increase our costs, which will make it more difficult for us to offset any future revenue shortfalls by offsetting expense reductions in the short term. If we fail to manage our growth successfully we will be unable to execute our business plan successfully, which could have a negative impact on our business, financial condition and results of operations. In addition, if we fail to develop and implement appropriate operating practices, our performance may suffer in terms of quality, cost and cycle time.
Our expansion into international markets may be subject to uncertainties that could increase our costs to comply with regulatory requirements in foreign jurisdictions, disrupt our operations and require increased focus from our management.
Our growth strategy includes the growth of our operations in foreign jurisdictions. International operations and business expansion plans are subject to numerous additional risks, including economic and political risks in foreign jurisdictions in which we operate or seek to operate, potential additional costs due to localization and other geographic specific costs, difficulty in enforcing contracts and collecting receivables through some foreign legal systems, unexpected changes in legal and regulatory requirements, differing technology standards and pace of adoption, fluctuations in currency exchange rates, varying regional and geopolitical business conditions and demands. The difficulties associated with managing a large organization spread throughout various countries and potential tax issues, including restrictions on repatriating earnings and multiple conflicting, changing and complex tax laws and regulations, and the differences in foreign laws and regulations, including foreign tax, data privacy requirements, anti-competition, intellectual property, labor, contract, trade and other laws. Additionally, compliance with international and U.S. laws and regulations that apply to our international operations may increase our cost of doing business in foreign jurisdictions. Violation of these laws and regulations could result in fines, criminal sanctions against us, our officers or our employees, or prohibitions on the conduct of our business. As we continue to expand our business globally, our success will depend, in large part, on our ability to anticipate and effectively manage these and other risks associated with our international operations. However, any of these factors could adversely affect our international operations and, consequently, our operating results.
29
Fluctuations in foreign currency exchange rates could result in foreign currency transaction losses, which could harm our operating results and financial condition.
We consider the U.S. dollar to be our functional currency. However, given our international operations, which we expect to expand following our recent acquisition of Intralinks, we currently have, and expect to have in the future, revenue and expenses and related assets and liabilities denominated in foreign currencies. Foreign currency transaction exposure results primarily from transactions with customers or vendors denominated in currencies other than the functional currency of the entity in which we record the transaction. Any fluctuation in the exchange rate of these foreign currencies may positively or negatively affect our business, financial condition and operating results.
We face exposure to movements in foreign currency exchange rates due to the fact that we have non-U.S. dollar denominated revenue worldwide. Weakening of foreign currencies relative to the U.S. dollar adversely affects the U.S. dollar value of our foreign currency denominated revenue and positively affects the U.S. dollar value of our foreign currency denominated expenses. If foreign currencies were to weaken or strengthen relative to the U.S. dollar, we might elect to raise or lower our international pricing, which could potentially impact demand for our services. Alternatively, we might opt not to adjust our international pricing as a result of fluctuations in foreign currency exchange rates, which could potentially have a positive or negative impact on our results of operations and financial condition.
Similarly, our financial performance may be impacted by fluctuations in currency exchange rates when it comes to our non-U.S. dollar denominated expenses. The third party vendors and suppliers to whom we owe payments for non-U.S. dollar denominated expenses may, or may not, decide to increase or decrease their pricing to reflect fluctuations in foreign currency exchange rates.
If there continues to be volatility in foreign currency exchange rates, we will continue to experience fluctuations in our operating results due to revaluing our assets and liabilities that are not denominated in the functional currency of the entity that recorded the asset or liability. Further, as foreign currency exchange rates change, the translation of our non-U.S. denominated revenue and expenses into U.S. dollars affects the year-over-year comparability of our operating results.
We must recruit and retain our key management and other key personnel and our failure to recruit and retain qualified employees could have a negative impact on our business.
We believe that our success depends in part on the continued contributions of our senior management and other key personnel to generate business and execute programs successfully. In addition, the relationships and reputation that these individuals have established and maintain with our customers and within the industries in which we operate contribute to our ability to maintain good relations with our customers and others within those industries. The loss of any members of senior management or other key personnel could materially impair our ability to identify and secure new contracts and otherwise effectively manage our business. In order to attract and retain executives and other key employees in a competitive marketplace, we must provide a competitive compensation package, including cash- and equity-based compensation. If we do not obtain the stockholder approval needed to continue granting equity compensation in a competitive manner, our ability to attract, retain, and motivate executives and key employees could be weakened. Further, in the technology industry, there is substantial and continuous competition for highly skilled business, product development, technical and other personnel. Competition for qualified personnel at times can be intense and as a result we may not be successful in attracting and retaining the personnel we require, which could have a material adverse effect on our ability to meet our commitments and new product delivery objectives. If we are unable to maintain or expand our direct sales capabilities, we may not be able to generate anticipated revenues. In addition, if we are unable to maintain or expand our product development capabilities, we may not be able to meet our product development goals.
Further, we rely on the expertise and experience of our senior management team. Although we have employment agreements with our executive officers, none of them or any of our other management personnel is obligated to remain employed by us. The loss of services of any key management personnel could lower productive output, interrupt our strategic vision and make it more difficult to pursue our business goals successfully.
Our employee retention and hiring may be adversely impacted by immigration restrictions and related factors.
Competition for skilled personnel is intense in our industry and any failure on our part to hire and retain appropriately skilled employees could harm our business. Our ability to hire and retain skilled employees is impacted, at least in part, by the fact that a portion of our professional workforce in the United States is comprised of foreign nationals who are not United States citizens. In order to be legally allowed to work for us, these individuals generally hold immigrant visas (which may or may not be tied to their employment with us) or green cards, the latter of which makes them permanent residents in the United States.
30
The ability of these foreign nationals to remain and work in the United States is impacted by a variety of laws and regulations, as well as the processing procedures of various government agencies. Changes in applicable laws, regulations or procedures could adversely affect our ability to hire or retain these skilled employees and could affect our costs of doing business and our ability to deliver services to our customers. In addition, if the laws, rules or procedures governing the ability of foreign nationals to work in the United States were to change or if the number of visas available for foreign nationals permitted to work in the United States were to be reduced, our business could be adversely affected, if, for example, we were unable to hire or no longer able to retain a skilled worker who is a foreign national.
Employing foreign nationals may require significant time and expense and our foreign national employees may choose to leave after we have made this investment. While a foreign national who is working under an immigrant visa tied to his or her employment by us may be less likely to choose to leave our Company than a similarly situated employee who is a United States national or a green card holder (as leaving our employ could mean also having to leave the United States), this may not always be the case. Additionally, many of our foreign national employees hold green cards, which means that they have greater flexibility to leave our Company without facing the risk of also having to leave the United States.
Our use of “open source” software could negatively affect our ability to sell our services and subject us to possible litigation.
A portion of the technologies licensed by us incorporates "open source" software, and we may incorporate open source software in the future. Open source software is generally licensed by its authors or other third parties under open source licenses. If we fail to comply with these licenses, we may be subject to certain conditions, including requirements that we offer any of our services that incorporate the open source software at no cost. Additionally, we may be required to make publicly available any source code for modifications or derivative works we create based upon, incorporating or using the open source software and/or license those modifications or alterations on terms that are unfavorable to us. If an author or other third party that distributes open source software were to allege that we had not complied with the conditions of one or more of these licenses, we could be required to incur significant legal expenses defending against such allegations and could be subject to significant damages, enjoined from selling those of our services that contained the open source software and required to comply with the foregoing conditions, which could disrupt the distribution and sale of some of our services.
In addition to risks related to license requirements, usage of open source software can lead to greater risks than use of third-party commercial software, as open source licensors generally do not provide technology support, maintenance, warranties or assurance of title or controls on the origin of the software.
Our inability to raise additional capital or generate the significant capital necessary to expand our operations and invest in new products could reduce our ability to compete and could harm our business.
We intend to continue to make investments to support our business growth and may require additional funds to respond to business challenges, including the need to develop new products and enhancements to our platforms or acquire complementary businesses and technologies. Accordingly, we may need to engage in equity or debt financings to secure additional funds. If we raise additional equity financing, our stockholders may experience significant dilution of their ownership interests and the per share value of our common stock could decline. In addition, the terms of any future issued equity securities could entitle the holders of those equity securities to rights, preferences and privileges superior to those of holders of our common stock. Furthermore, if we engage in debt financing, the holders of debt might have priority over the holders of common stock, and we may be required to accept terms that restrict our ability to incur additional indebtedness, including restrictive covenants relating to our capital raising activities and other financial and operational matters, which may make it more difficult for us to obtain additional capital and to pursue business opportunities, including potential acquisitions. We may also be required to take other actions that would otherwise be in the interests of the debt holders and force us to maintain specified liquidity or other ratios, any of which could harm our business, results of operations, and financial condition. If we need additional capital and cannot raise it on acceptable terms, we may not be able to, among other things:
• | develop or enhance our products and platforms; |
• | acquire complementary technologies, products or businesses; |
• | expand operations, in the United States or internationally; or |
• | respond to competitive pressures or unanticipated working capital requirements. |
If we are unable to obtain adequate financing or financing on terms satisfactory to us when we require it, our ability to continue to support our business growth and to respond to business challenges could be significantly limited.
31
We continue to incur significant costs as a result of operating as a public company, and our management is required to devote substantial time to new and ongoing compliance initiatives.
We operate as a public company, and will continue to incur significant legal, accounting and other expenses as we comply with the Sarbanes-Oxley Act of 2002, or the Sarbanes-Oxley Act, the Dodd-Frank Wall Street Reform and Consumer Protection Act and other public company disclosure and corporate governance requirements, as well as any new rules that may subsequently be implemented by the Securities and Exchange Commission and/or the NASDAQ Stock Market, or Nasdaq, the exchange on which our common stock is listed (Nasdaq: SNCR). These rules impose various requirements on public companies, including requirements related to disclosures, corporate governance and internal controls. We expect that the requirements of these rules and regulations will continue to increase our legal, accounting and financial compliance costs, make some activities more difficult, time consuming and costly and place significant strain on our personnel, systems and resources.
Our management and other personnel will continue to devote a substantial amount of time to these compliance initiatives. Moreover, these rules and regulations increase our legal and financial compliance costs and make some activities more time-consuming and costly. For example, we expect these rules and regulations may make it more difficult and more expensive for us to obtain director and officer liability insurance, and we may be required to accept reduced policy limits and coverage or incur substantial costs to maintain the same or similar coverage. These rules and regulations could also make it more difficult for us to attract and retain qualified persons to serve on our board of directors, our board committees or as executive officers.
The Sarbanes-Oxley Act requires, among other things, that we maintain effective disclosure controls and procedures and internal control over financial reporting. We are continuing to refine our disclosure controls and other procedures that are designed to ensure that the information that we are required to disclose in the reports that we will file with the Securities and Exchange Commission is properly recorded, processed, summarized and reported within the time periods specified in Securities and Exchange Commission rules and forms. We are also continuing to improve our internal control over financial reporting. We have expended, and anticipate that we will continue to expend, significant resources in order to maintain and improve the effectiveness of our disclosure controls and procedures and internal control over financial reporting. Further, Section 404 of Sarbanes-Oxley requires that we include in our annual report our assessment of the effectiveness of our internal control over financial reporting and our audited financial statements as of the end of each fiscal year. We successfully completed our assessment of our internal control over financial reporting as of December 31, 2016. Our continued compliance with Section 404 will require that we continue to incur substantial expense and expend significant management time on compliance related issues.
Our current controls and any new controls that we develop in the future may become inadequate because of changes in conditions in our business. Further, weaknesses in our disclosure controls or our internal control over financial reporting may be discovered in the future. Any failure to develop or maintain effective controls, or any difficulties encountered in their implementation or improvement, could harm our operating results or cause us to fail to meet our reporting obligations and may result in a restatement of our financial statements for prior periods. Any failure to implement and maintain effective internal control over financial reporting could also adversely affect the results of management reports and independent registered public accounting firm audits of our internal control over financial reporting that we will be required to include in our periodic reports that will be filed with the SEC. If we were to have ineffective disclosure controls and procedures or internal control over financial reporting, our investors could lose confidence in our reported financial and other information, which would likely have a negative effect on the market price of our common stock. As a result, we may face a loss of public confidence, the market price of our stock could decline and we could be subject to regulatory sanctions or investigations by Nasdaq, the SEC or other regulatory authorities, which would require additional financial and management resources. In addition, any failure to implement required new or improved controls, or difficulties encountered in their implementation, could harm our operating results or cause us to fail to timely meet our regulatory reporting obligations.
Changes in, or interpretations of, accounting principles could result in unfavorable accounting charges.
We prepare our consolidated financial statements in conformity with U.S. generally accepted accounting principles, or GAAP. These principles are subject to interpretation by the SEC and various bodies formed to interpret and create appropriate accounting principles. A change in these principles, or their interpretation, could have a significant effect on our reported results and may even retroactively affect previously reported results. Our accounting principles that recently have been or may be affected by changes in accounting principles are: (i) accounting for stock-based compensation; (ii) accounting for income taxes; (iii) accounting for business combinations and goodwill; (iv) revenue recognition guidance; and (v) accounting for foreign currency translation.
Changes in, or interpretations of, tax rules and regulations, could adversely affect our effective tax rates.
Unanticipated changes in our tax rates could affect our future results of operations. Our future effective tax rates could be
32
unfavorably affected by changes in tax laws or the interpretation of tax laws or by changes in the valuation of our deferred tax assets and liabilities. It is possible that future requirements, including the recently proposed implementation of International Financial Reporting Standards, or IFRS, could change our current application of GAAP, resulting in a material adverse impact on our financial position or results of operations. In addition, we are subject to the continued examination of our income tax returns by the Internal Revenue Service, or IRS, and other tax authorities. We regularly assess the likelihood of outcomes resulting from these examinations, if any, to determine the adequacy of our provision for income taxes. We believe our estimates to be reasonable, but there can be no assurance that the final determination of any of these examinations will not have an adverse effect on our operating results and financial position.
If we are required to collect sales and use taxes on the services we sell in additional jurisdictions, we may be subject to liability for past sales and our future sales could decrease.
We currently collect sales or use tax on our services in most states. Historically, with a few exceptions, we have not charged or collected value added tax on our services anywhere in the world. We may lose sales or incur significant expenses should tax authorities in other jurisdictions where we do business be successful in imposing sales and use taxes, value added taxes or similar taxes on the services we provide. A successful assertion by one or more tax authorities that we should collect sales or other taxes on the sale of our services could result in substantial tax liabilities for past sales, including interest and penalty charges, and could discourage customers from purchasing our services and otherwise harm our business. Further, we may conclude based on our own review that our services may be subject to sales and use taxes in other areas where we do business. Under these circumstances, we may voluntarily disclose our estimated liability to the respective tax authorities and initiate activities to collect taxes going forward.
It is not clear that our services are subject to sales and use tax in certain jurisdictions. States and certain municipalities in the United States, as well as countries outside the United States, have different rules and regulations governing sales and use taxes. These rules and regulations are subject to varying interpretations that may change over time and, in the future, our services may be subject to such taxes. Although our customer contracts typically provide that our customers are responsible for the payment of all taxes associated with the provision and use of our services, customers may decline to pay back taxes and may refuse responsibility for interest or penalties associated with those taxes. In certain cases, we may elect not to request customers to pay back taxes. If we are required to collect and pay back taxes and associated interest and penalties, and if our customers fail or refuse to reimburse us for all or a portion of these amounts, or if we elect not to seek payment of these amounts, we will incur unplanned expenses that may be substantial. Moreover, imposition of such taxes on our services going forward will effectively increase the cost of our services to our customers, and may adversely affect our ability to retain existing customers or gain new customers in jurisdictions in which such taxes are imposed. Any of the foregoing could have a material adverse effect on our business, results of operation or financial condition.
Economic, political and market conditions can adversely affect our business, results of operations and financial condition.
Our business is influenced by a range of factors that are beyond our control and that we have no comparative advantage in forecasting. These include but are not limited to general economic and business conditions, the overall demand for cloud-based products and services, general political developments and currency exchange rate fluctuations. Economic uncertainty may exacerbate negative trends in consumer spending and may negatively impact the businesses of certain of our customers, which may cause a reduction in their use of our platforms or increase their likelihood of defaulting on their payment obligations, and therefore cause a reduction in our revenues. These conditions and uncertainty about future economic conditions may make it challenging for us to forecast our operating results, make business decisions and identify the risks that may affect our business, financial conditions and results of operations. In addition, these factors could result in quarterly fluctuations in our business performance. Finally, changes in these conditions may result in a more competitive environment, resulting in possible pricing pressures.
Catastrophic events may disrupt our business.
A natural disaster, telecommunications failure, power outage, cybersecurity attack, war, terrorist attack, or other catastrophic event could cause us to suffer system interruptions, reputational harm, delays in product development, breaches of data security and loss of critical data. An event of this nature could also prevent us from fulfilling customer orders or maintaining certain service level requirements, particularly in respect of our SaaS and hosted offerings. While we have developed certain disaster recovery plans and maintain backup systems to reduce the potentially adverse effect of these types of events, a catastrophic event that results in the destruction or disruption of any of our data centers or our critical business or information technology systems could severely affect our ability to conduct normal business operations and, as a result, our business, operating results and financial condition could be adversely affected.
33
Risks Related to Our Recently Acquired Intralinks Business
A substantial portion of our Intralinks business revenue is derived from contracts that provide for the use of Intralinks solutions for a fixed duration. Our inability to enter into new contracts as existing ones expire could negatively impact our overall financial performance.
Many of our contracts with Intralinks customers are entered into in connection with discrete one-time financial and strategic business transactions and projects such as mergers and acquisitions, or M&A, transactions. During the fiscal years ended December 31, 2014, 2015 and 2016, revenue generated from transactional contracts constituted a substantial portion of Intralinks’ total revenue. These transactional agreements typically have initial terms of six to twelve months depending on the type of transaction and related purpose of the Intralinks exchange. Accordingly, our business depends on our ability to replace these transactional agreements as they expire. Our inability to enter into new contracts with existing customers or find new customers to replace these contracts could have a material adverse effect on our business, results of operations and financial condition.
We may not successfully develop, introduce or integrate new services or enhancements to our Intralinks Platform or our application solutions and this could harm our reputation, revenues and operating income.
Our ability to attract new customers and increase revenue from existing customers will depend in large part on our ability to enhance and improve our existing Intralinks platform, including our application solutions, and to introduce new functionality either by acquisition or internal development. Our operating results would suffer if our innovations are not responsive to the needs of our customers, are not appropriately timed with market opportunities or are not brought to market effectively. In addition, it is possible that our assumptions about the features that we believe will drive purchasing decisions for our potential customers or renewal decisions for our existing customers could be incorrect. In the past, we have experienced delays in the planned release dates of new features and upgrades and have discovered defects in new services after their introduction. There can be no assurance that new services or upgrades will be released on schedule or that, when released, they will not contain defects as a result of poor planning, execution or other factors during the product development lifecycle. In addition, we could experience challenges, delays or quality issues in our product development efforts due to the demands of the Agile development methodology our Intralinks’ business relies upon. If any of these situations were to arise, we could suffer adverse publicity, damage to our reputation, loss of revenue, delay in market acceptance or claims by customers brought against us, all of which could have a material adverse effect on our business, results of operations and financial condition. Moreover, upgrades and enhancements to our Intralinks platform may require substantial investment and there can be no assurance that our investments will prove to help us achieve or sustain a durable competitive advantage in products, services and processes. If customers do not widely adopt our solutions or new innovations to our solutions, we may not be able to justify the investments we have made. If we are unable to develop, license or acquire new solutions or enhancements to existing services on a timely and cost-effective basis, or if our new or enhanced solutions do not achieve market acceptance, our business, results of operations and financial condition will be materially adversely affected.
If we are unable to increase our penetration in the existing principal markets for our business, develop, market and sell new solutions or expand into additional markets, we will be unable to grow our business and increase our revenue.
We currently market our Intralinks solutions for a wide range of business processes. These include:
• | due diligence for M&A, public offerings and other strategic transactions; |
• | loan syndication and other debt capital markets transactions; |
• | board of directors reporting; |
• | secure mobile access to content; |
• | safety information exchange and drug development and licensing for the life sciences industry; |
• | private equity fundraising, hedge fund marketing and investor reporting; |
• | energy exploration and production ventures for the oil and gas industry; |
• | contract and vendor management; and |
• | collaboration and sharing within and outside of organizations. |
We intend to continue to focus our sales and marketing efforts in these markets to grow our business. In addition, we believe our future growth depends not only on increasing our penetration into the principal markets in which our services are currently used, but also on identifying and expanding the number of industries, communities and markets that use or could use our services and expanding the solutions we offer to customers in those markets. Efforts to expand our service offerings beyond the markets that we currently serve or to develop, market and sell new service offerings, however, may divert management resources from existing operations, expose us to increased competition from new and existing competitors and require us to commit significant financial resources to an unproven business, any of which could significantly impair our operating results. Moreover, efforts to expand beyond our existing markets and solutions may never result in new services that achieve market acceptance, create additional
34
revenue or become profitable, particularly if a new target market turns out to be substantially less attractive than we envision due to overestimates in the number of potential customers, the speed at which the market will evolve or grow, the price potential customers are willing to pay for our solutions or the rate at which they are ready to adopt new products or approaches. Our inability to further penetrate our existing markets, successfully launch new solutions or identify additional markets and achieve acceptance of our services in these additional markets could adversely affect our business, results of operations and financial condition.
A significant part of our Intralinks business is derived from the use of Intralinks application solutions in connection with financial and strategic business transactions. Economic trends that affect the volume of these transactions may negatively impact the demand for our services.
A significant portion of our revenue from the Intralinks business depends on the purchase of our services by parties involved in financial and strategic business transactions such as M&A transactions, loan syndications and other debt capital markets, or DCM, transactions. The volume of these types of transactions drives demand for our services. Downturns in the global economy or in the economies of the geographies in which we do business, rising unemployment and reduced equity valuations all create risks that could harm our business. We are not able to predict the impact any potential worsening of macroeconomic conditions could also have on our results of operations. The level of activity in the financial services industry, including the financial transactions our services are used to support, is sensitive to many factors beyond our control, including interest rates, regulatory policies, general economic conditions, our customers' competitive environments, business trends, terrorism and political change. Unfavorable conditions or changes in any of these factors could adversely affect our business, operating results and financial condition.
Risks Related to Our Common Stock
Our stock price may continue to experience significant fluctuations and could subject us to litigation.
Our stock price, like that of other technology companies, continues to fluctuate greatly. Our stock price, and demand for our stock, can be affected by many factors, such as quarterly increases or decreases in our earnings, speculation in the investment community about our financial condition or results of operations and changes in revenue or earnings estimates, announcement of new services, technological developments, alliances, or acquisitions by us. Additionally, the price of our common stock may continue to fluctuate greatly in the future due to factors that are non-company specific, such as the decline in the United States and/or international economies, acts of terror against the United States or other jurisdictions where we conduct business, war or due to a variety of company specific factors, including quarter to quarter variations in our operating results, shortfalls in revenue, gross margin or earnings from levels projected by securities analysts and the other factors discussed in these risk factors. In addition, if the market for technology stocks or the stock market in general experiences uneven investor confidence, the market price of our common stock could decline for reasons unrelated to our business, operating results or financial condition.
Fluctuation in market price and demand for our common stock may limit or prevent investors from readily selling their shares of common stock and may otherwise negatively affect the liquidity of our common stock. Causes of volatility in the market price of our stock could subject us to securities class action litigation. We are currently, and may in the future be, the subject of lawsuits that could require us to incur substantial costs defending against those lawsuits and divert the time and attention of our management.
If securities or industry analysts do not publish research or reports or publish unfavorable research about our business, our stock price and trading volume could decline.
The trading market for our common stock will depend in part on the research and reports that securities or industry analysts publish about us or our business. We currently have research coverage by securities and industry analysts, though we do not control these analysts and have no ability to ensure that they will continue to cover our common stock. If one or more of the analysts who covers us downgrades our stock or states a view that our business prospects are reduced, our stock price would likely decline. If one or more of these analysts ceases coverage of our company or fails to regularly publish reports on us, interest in the purchase of our stock could decrease, which could cause our stock price or trading volume, or both, to decline.
We may face shareholder lawsuits and other potential liabilities that could materially adversely impact our business, financial condition and results of operations.
We may in the future be the subject of various lawsuits, proceedings and investigations. The outcome and amount of resources needed to respond to, defend or resolve lawsuits or regulatory actions or requests is unpredictable and may remain unknown for long periods of time. Our exposure under these matters may also include our indemnification obligations, to the extent we have any, to current and former officers and directors and, in some cases former underwriters, against losses incurred in connection with these matters, including reimbursement of legal fees and other expenses. Although we maintain insurance for claims of this
35
nature, our insurance coverage does not apply in all circumstances and may be denied or insufficient to cover the costs related to the class action and stockholder derivative lawsuits. In addition, these matters or future lawsuits or investigations involving us may increase our insurance premiums, deductibles or co-insurance requirements or otherwise make it more difficult for us to maintain or obtain adequate insurance coverage on acceptable terms, if at all. Moreover, adverse publicity associated with regulatory actions and investigations and negative developments in pending legal proceedings could decrease customer demand for our services. As a result, the pending lawsuits and any future lawsuits or investigations involving us or our officers or directors could have a material adverse effect on our business, reputation, financial condition, results of operations, liquidity and the trading price of our common stock.
We have never paid dividends on our capital stock and we do not anticipate paying any dividends in the foreseeable future. Consequently, any gains from an investment in our common stock will likely depend on whether the price of our common stock increases.
We have not paid dividends on any of our classes of capital stock to date and we currently intend to retain our future earnings, if any, to fund the development and growth of our business. In addition, the terms of our outstanding indebtedness restrict our ability to pay dividends, and any future indebtedness that we may incur could preclude us from paying dividends. As a result, capital appreciation, if any, of our common stock will be a shareholders's sole source of gain for the foreseeable future. Consequently, in the foreseeable future, a shareholder will likely only experience a gain from your investment in our common stock if the price of our common stock increases.
Delaware law and provisions in our restated certificate of incorporation and amended and restated bylaws could make a merger, tender offer or proxy contest difficult, therefore depressing the trading price of our common stock.
We are a Delaware corporation and the anti-takeover provisions of the Delaware General Corporation Law may discourage, delay or prevent a change in control by prohibiting us from engaging in a business combination with an interested stockholder for a period of three years after the person becomes an interested stockholder, even if a change of control would be beneficial to our existing stockholders. In addition, our amended and restated certificate of incorporation and bylaws and credit agreements may discourage, delay or prevent a change in our management or control over us that stockholders may consider favorable. Our amended and restated certificate of incorporation and bylaws:
• | authorize the issuance of “blank check” preferred stock that could be issued by our board of directors to thwart a takeover attempt; |
• | prohibit cumulative voting in the election of directors, which would otherwise allow holders of less than a majority of the stock to elect some directors; |
• | establish a classified board of directors, as a result of which the successors to the directors whose terms have expired will be elected to serve from the time of election and qualification until the third annual meeting following election; |
• | require that directors only be removed from office for cause; |
• | provide that vacancies on the board of directors, including newly-created directorships, may be filled only by a majority vote of directors then in office; |
• | limit who may call special meetings of stockholders; |
• | prohibit stockholder action by written consent, requiring all actions to be taken at a meeting of the stockholders; and |
• | establish advance notice requirements for nominating candidates for election to the board of directors or for proposing matters that can be acted upon by stockholders at stockholder meetings. |
The affirmative vote of the holders of at least two-thirds of the voting power of all of the then outstanding shares of our capital stock is generally necessary to amend or repeal the above provisions that are contained in our amended and restated certificate of incorporation. Also, absent approval of our board of directors, our amended and restated by-laws may only be amended or repealed by the affirmative vote of the holders of a majority of our shares of capital stock entitled to vote.
In addition, we are subject to the provisions of Section 203 of the Delaware General Corporation Law, which limits business combination transactions with stockholders of 15% or more of our outstanding voting stock that our board of directors has not approved. These provisions and other similar provisions make it more difficult for stockholders or potential acquirers to acquire us without negotiation. These provisions may apply even if some stockholders may consider the transaction beneficial to them.
As a result, these provisions could limit the price that investors are willing to pay in the future for shares of our common stock. These provisions might also discourage a potential acquisition proposal or tender offer, even if the acquisition proposal or tender offer is at a premium over the then current market price for our common stock.
36
ITEM 1B. UNRESOLVED STAFF COMMENTS
None.
ITEM 2. PROPERTIES
We lease approximately 132,000 square feet of office space for our corporate headquarters in Bridgewater, New Jersey. We also lease a 100,000 square foot facility in Bangalore, India. In addition to the above office space, we also lease offices in various states in the United States including California, Colorado, Maryland, Massachusetts, New York, Texas, Virginia and Washington and in certain countries including Australia, China, Finland, France, Ireland, Italy, Japan, Malta and the Philippines. Lease terms for our locations expire in the years between 2017 and 2029. We believe that the facilities we now lease are sufficient to meet our needs through at least the next 12 months. However, we may require additional office space after that time or if our current business plans change, and we are currently evaluating expansion possibilities.
ITEM 3. LEGAL PROCEEDINGS
On October 7, 2014, we filed an amended complaint in the United States District Court for the District of New Jersey (Civ Act. No. 3:14-cv-06220) against F-Secure Corporation and F-Secure, Inc. (collectively, “F-Secure"), claiming that F-Secure has infringed, and continues to infringe, several of our patents. In February 2015, we entered into a patent license and settlement agreement with F-Secure Corporation and F-Secure, Inc. whereby we granted each of these companies (but not their subsidiaries or affiliates) a limited license to our patents. As a result of entering into the patent license and settlement agreement, the parties filed a joint stipulation to dismiss the above complaint.
Our 2011 acquisition agreement with Miyowa SA provided that former shareholders of Miyowa SA would be eligible for earn-out payments to the extent specified business milestones were achieved following the acquisition. In December 2013, Eurowebfund and Bakamar, two former shareholders of Miyowa SA filed a complaint against us in the Commercial Court of Paris, France claiming that they are entitled to certain earn-out payments under the acquisition agreement. We were served with a copy of this complaint in January 2014. On December 3, 2015, the Court dismissed all claims in the complaint against us. On December 19, 2015, the former shareholders of Miyowa filed an appeal with the Court of Appeal of Paris, France, appealing the Court’s decision. Although we cannot predict the outcome of the appeal, or estimate any potential loss if the outcome is adverse, due to the inherent uncertainties of litigation, we believe the positions of Eurowebfund and Bakamar are without merit, and we intend to vigorously defend all claims brought by them.
We are not currently subject to any legal proceedings that could have a material adverse effect on our operations; however, we may from time to time become a party to various legal proceedings arising in the ordinary course of our business. We are currently the plaintiff in several patent infringement cases. The defendants in several of these cases from time to time may file counterclaims. Although due to the inherent uncertainties of litigation, we cannot predict the outcome of any of these actions at this time, we continue to pursue our claims and believe that any counterclaims are without merit, and we intend to defend against all such counterclaims.
ITEM 4. MINE SAFETY DISCLOSURES
Not applicable.
37
PART II
ITEM 5. MARKET FOR REGISTRANT’S COMMON EQUITY, RELATED STOCKHOLDER MATTERS AND ISSUER PURCHASES OF EQUITY SECURITIES
Market Information
Our common stock is traded and listed on the NASDAQ Global Select Market under the symbol “SNCR.” The following table sets forth, for each period during the past two years, the high and low sale prices as reported by NASDAQ.
Common Stock | |||||||||||||||
2016 | 2015 | ||||||||||||||
High | Low | High | Low | ||||||||||||
First Quarter | $ | 35.42 | $ | 20.33 | $ | 51.39 | $ | 37.76 | |||||||
Second Quarter | $ | 37.98 | $ | 28.73 | $ | 52.45 | $ | 42.01 | |||||||
Third Quarter | $ | 43.65 | $ | 31.45 | $ | 49.53 | $ | 27.86 | |||||||
Fourth Quarter | $ | 49.94 | $ | 36.00 | $ | 40.39 | $ | 29.77 | |||||||
As of February 16, 2017, there were approximately 53 named holders of record of our common stock. On February 16, 2017, the last reported sale price of our common stock as reported on the NASDAQ Global Select Market was $33.67 per share.
Dividend Policy
We have never declared or paid cash dividends on our common or preferred equity. We do not anticipate paying any cash dividends in the foreseeable future. Any future determination to declare cash dividends will be made at the discretion of our Board of Directors, subject to the covenants under our 2017 Credit Facility and Term Loan Facility, and will depend on our financial condition, results of operations, capital requirements, general business conditions and other factors that our Board of Directors may deem relevant.
38
Stock Performance Graph
The graph set forth below compares the cumulative total stockholder return on our common stock between December 31, 2011 and December 31, 2016, with the cumulative total return of (i) the NASDAQ Computer Index and (ii) the NASDAQ Composite Index, over the same period. This graph assumes the investment of $100 on December 31, 2011 in our common stock, the NASDAQ Computer Index and the NASDAQ Composite Index, and assumes the reinvestment of dividends, if any. The graph assumes the initial value of our common stock on December 31, 2011 was the closing sales price of $30.21 per share.
The comparisons shown in the graph below are based upon historical data. We caution that the stock price performance shown in the graph below is not necessarily indicative of, nor is it intended to forecast, the potential future performance of our common stock.
Information used in the graph was obtained from NASDAQ, a source believed to be reliable, but we are not responsible for any errors or omissions in such information.
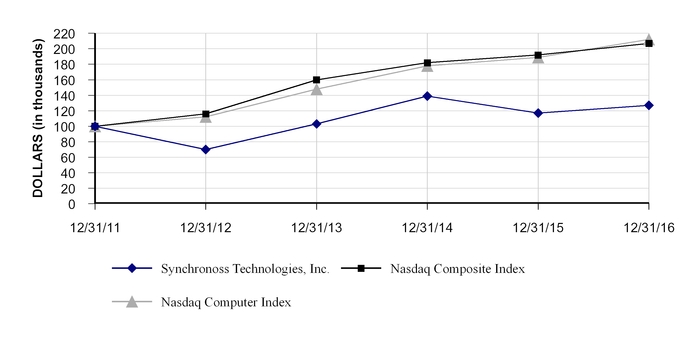
12/31/11 | 12/31/12 | 12/31/13 | 12/31/14 | 12/31/15 | 12/31/16 | ||||||||||||
Synchronoss Technologies, Inc. | 100 | 70 | 103 | 139 | 117 | 127 | |||||||||||
Nasdaq Composite Index | 100 | 116 | 160 | 182 | 192 | 207 | |||||||||||
Nasdaq Computer Index | 100 | 112 | 148 | 178 | 189 | 212 | |||||||||||
39
Issuer Purchases of Equity Securities
The following table provides information relating to our repurchase of common stock during the year ended December 31, 2016:
Period | Total Number of Shares Purchased | Average Price Paid Per Share | Total Number of Shares Purchased as Part of Publicly Announced Program | Approximate Dollar Value of Shares That May Yet Be Purchased Under the Program | ||||||||||
3/1/2016- 3/31/2016 | 552,500 | $ | 30.00 | 552,500 | $ | 83,419,170 | ||||||||
4/1/2016- 4/30/2016 | 372,462 | 32.20 | 372,462 | 71,425,709 | ||||||||||
5/1/2016- 5/31/2016 | 297,174 | 33.75 | 297,174 | 61,394,736 | ||||||||||
6/1/2016- 6/30/2016 | 39,835 | 35.64 | 39,835 | 59,974,843 | ||||||||||
Total | 1,261,971 | $ | 31.72 | 1,261,971 | $ | 59,974,843 | ||||||||
The repurchases were made under the stock repurchase program approved by our Board of Directors and announced on February 4, 2016 and through which we were authorized to purchase up to $100 million of our common stock. The program does not have an expiration date.
Repurchases under the program may take place in the open market or in privately negotiated transactions and may be made pursuant to a Rule 10b5-1 plan.
40
ITEM 6. SELECTED FINANCIAL DATA
The following selected financial data should be read in conjunction with our consolidated financial statements and related notes and the “Management’s Discussion and Analysis of Financial Condition and Results of Operations” and other financial data included elsewhere in this Form 10‑K. The selected statements of operations and the selected balance sheet data are derived from our consolidated audited financial statements.
Year Ended December 31, | |||||||||||||||||||
2016 | 2015† | 2014† | 2013† | 2012 | |||||||||||||||
(In thousands, except per share data) | |||||||||||||||||||
Statements of Operations Data: | |||||||||||||||||||
Net revenues | $ | 476,750 | $ | 428,117 | $ | 307,301 | $ | 225,368 | $ | 273,692 | |||||||||
(Loss) income from continuing operations | (71,809 | ) | 15,131 | (3,541 | ) | (19,305 | ) | 41,458 | |||||||||||
Net (loss) income from continuing operations | (66,541 | ) | 6,415 | (2,023 | ) | (9,711 | ) | 27,083 | |||||||||||
Net (loss) income attributable to noncontrolling interests | (11,596 | ) | 6,052 | — | — | — | |||||||||||||
Net (loss) income from continuing operations attributable to Synchronoss | (54,945 | ) | 363 | (2,023 | ) | (9,711 | ) | 27,083 | |||||||||||
Net (loss) income applicable to shares of common stock for diluted earnings per share | $ | (54,945 | ) | $ | 2,063 | $ | (2,023 | ) | $ | (9,711 | ) | $ | 27,083 | ||||||
Basic: | |||||||||||||||||||
Continuing operations | $ | (1.26 | ) | $ | 0.01 | $ | (0.05 | ) | $ | (0.25 | ) | $ | 0.71 | ||||||
Diluted: | |||||||||||||||||||
Continuing operations | $ | (1.26 | ) | $ | 0.01 | $ | (0.05 | ) | $ | (0.25 | ) | $ | 0.69 | ||||||
Weighted-average common shares outstanding: | |||||||||||||||||||
Basic | 43,571 | 42,284 | 40,418 | 38,891 | 38,195 | ||||||||||||||
Diluted | 43,571 | 42,284 | 40,418 | 38,891 | 39,126 | ||||||||||||||
_________________________________________________________
† | These amounts have been adjusted to exclude discontinued operations for the divestiture of the Company's BPO business in the fourth quarter of 2016. (See Note 3, Acquisitions and Divestitures in our Consolidated Financial Statements for additional information.) |
As of December 31, | |||||||||||||||||||
2016 | 2015 | 2014 | 2013 | 2012† | |||||||||||||||
(In thousands) | |||||||||||||||||||
Balance Sheet Data: | |||||||||||||||||||
Cash, cash equivalents, restricted cash and marketable securities | $ | 226,498 | $ | 233,626 | $ | 290,377 | $ | 77,605 | $ | 56,869 | |||||||||
Working capital | 210,846 | 326,765 | 354,298 | 98,786 | 84,451 | ||||||||||||||
Total assets | 1,164,729 | 1,010,228 | 862,822 | 527,019 | 466,662 | ||||||||||||||
Lease financing obligation - long-term | 12,121 | 13,343 | 9,204 | 9,252 | 9,540 | ||||||||||||||
Contingent consideration obligation - long-term | — | 930 | — | 4,468 | 5,100 | ||||||||||||||
Convertible debt | 226,291 | 224,878 | 230,000 | — | — | ||||||||||||||
Redeemable noncontrolling interest | 49,856 | 61,452 | — | — | — | ||||||||||||||
Total stockholders’ equity | 657,115 | 609,814 | 529,107 | 447,639 | 374,657 | ||||||||||||||
__________________________________________________________
† | Certain prior period amounts have been recast in connection with Accounting Standards Codification 805, Business Combinations. |
41
ITEM 7. MANAGEMENT’S DISCUSSION AND ANALYSIS OF FINANCIAL CONDITION AND RESULTS OF OPERATIONS.
Management’s Discussion and Analysis of Financial Condition and Results of Operations, or MD&A, is intended to provide a reader of our financial statements with a narrative from the perspective of our management on our financial condition, results of operations, liquidity and certain other factors that may affect our future results. The following discussion and analysis should be read in conjunction with our Consolidated Financial Statements and the related notes included in Item 8 - "Financial Statements and Supplementary Data" of this Form 10-K.
Revenues
We generate a substantial portion of our revenues on a per‑transaction or subscription basis, which is derived from contracts that extend up to 60 months from execution.
Historically, our revenues have been directly impacted by the number of transactions that we process for our customers. The future success of our business depends on the continued growth of consumer and business transactions and, as such, the volume of transactions that we process could fluctuate on a quarterly basis. See “Current Trends Affecting Our Results of Operations” for certain matters regarding future results of operations.
Most of our revenues are recorded in U.S. dollars but as we continue to expand our business with international customers and increase the extent of recording our international activities in local currencies, we will become subject to currency translation risk that could affect our future reported net sales.
Each of AT&T and Verizon accounted for more than 10% of our revenues for the years ended December 31, 2016 and 2015. AT&T and Verizon in the aggregate accounted for 62% and 71% of our revenues for the years ended December 31, 2016 and 2015, respectively. Although in December 2016, we divested our activation call center business, which included a portion of the services that we historically provided to AT&T, we will continue to generate revenue from AT&T from our activation software and professional services. We have Statements of Work for each of the Verizon and AT&T businesses that we support which typically run for 12 to 36 months. Although Intralinks has a diverse customer base and we expect that revenue from our Intralinks business will comprise a significant portion of our going forward revenue, the loss of either AT&T or Verizon as a customer would have a material negative impact on our company. We believe that if either AT&T or Verizon were to terminate their relationship with us, that they would encounter substantial costs in replacing Synchronoss' solutions.
Costs and Expenses
Our costs and expenses consist of cost of services, research and development, selling, general and administrative, depreciation and amortization, change in contingent consideration, restructuring, interest and other expense.
Cost of services includes all direct materials, direct labor, cost of facilities and those indirect costs related to revenues such as indirect labor, materials and supplies. Our primary cost of services is related to our information technology and systems department, including colocation fees, network costs, data center maintenance, database management and data processing costs, as well as personnel costs associated with service implementation, customer deployment and customer care.
Research and development costs are expensed as incurred unless they meet the criteria for deferral and amortization under U.S. Generally Accepted Accounting Principles (“GAAP”). Software development costs incurred prior to the establishment of technological feasibility do not meet these criteria, and are therefore expensed as incurred. Research and development expense consists primarily of costs related to personnel, including salaries and other personnel-related expenses, consulting fees and the cost of facilities, computer and support services used in service technology development. We also expense costs relating to developing modifications and minor enhancements of our existing technology and services.
Selling, general and administrative expense consists of personnel costs including salaries, sales commissions, sales operations and other personnel-related expenses, travel and related expenses, trade shows, costs of communications equipment and support services, facilities costs, consulting fees, costs of marketing programs, such as internet and print and other overhead and administrative costs.
Net change in contingent consideration obligation consists of the changes to the fair value estimate of the obligation to the former equity holders which resulted from our acquisitions. The estimate is based on the weighted probability of achieving certain financial targets and other milestones. The contingent consideration obligation earn-out periods have been no longer than 12
42
months in duration. As such, we recognize the changes in fair value over that period. Final determination of the earn-out payment is done up to 90 days after the applicable earn-out period ends.
Restructuring charges consist of the costs associated with work-force reduction plans to reduce costs and align our resources with our key strategic priorities. Restructuring charges include employee termination costs and facilities consolidation costs related to minimum lease payments of a leased location that was closed.
Depreciation relates to our property and equipment and includes our network infrastructure and facilities. Amortization primarily relates to trademarks, customer lists, technology acquired and internally developed software.
Interest expense consists primarily of interest on our lease financing obligations, our outstanding balance on our Credit Facility and our convertible senior notes.
Current Trends Affecting Our Results of Operations
Business from our Synchronoss Personal Cloud solution has been driven by the unprecedented growth in mobile devices globally. With mobile devices becoming content rich and acting as a replacement for other traditional devices like PC’s, the ability to securely back up content from mobile devices, sync it with other devices and share it with family, friends and business associates have become essential needs. The major Tier 1 carriers are also publicly discussing achieving 500% penetration (multiple connected devices per user) by enabling connectivity to non-traditional devices. Such devices include connected cars, health and wellness devices, connected home and health care devices. The need for the contents of these devices to be stored in a common cloud are also expected to be drivers of our businesses in the long-term.
Bring Your Own Technology (BYOT/BYOD) is impacting the work environment for enterprises and organizations which often find themselves in a position where they need to offer their employees a safe environment to share and collaborate on their work documents and files via mobile devices. We expect that by leveraging our Synchronoss Personal Cloud solution infrastructure and technology to build Synchronoss WorkSpace solutions for this purpose will enable us to serve a completely new market, which we believe will also contribute to our growth.
To support our growth we will be driven by these favorable industry trends mentioned above, we leverage modular components from our existing software platforms to build new products. We believe that these opportunities will continue to provide future benefits and position us for future revenue growth. We are also making investments in new research and development of new products designed to enable us to grow rapidly in the mobile wireless market. Our purchase of capital assets and equipment may also increase based on aggressive deployment, subscriber growth and promotional offers for free or bundled storage by our major Tier 1 carrier customers.
We continue to expand our platforms' footprint with broadband carriers and international mobile carriers to support connected devices and multiple networks through our focus on cloud-based services for back up, synchronization and sharing of content. Our initiatives with AT&T, Verizon Wireless, Vodafone, Goldman Sachs, Softbank and other CSPs continue to grow both with regard to our current businesses as well as our new product offerings. We are also exploring additional opportunities through merger and acquisition activities to support our customer, product and geographic diversification strategies.
Further, with our acquisition of Intralinks, we have enhanced our position in the Enterprise market. Enterprise customers are looking to data to create more effective context for improving the employee work experience - particularly in ultra-secure environments. The acquisition of Intralinks is an important step forward in our enterprise strategy that enhances our enterprise knowledge and experience upon which to leverage the Synchronoss product portfolio, go-to-market strategy and diversified customer footprint. We believe this sets the stage for large cross-selling opportunities by accelerating our enterprise playbook. Together with Synchronoss and Intralinks as one company, we believe we can deploy enhanced enterprise and mobile solutions to our customers, while opening up new enterprise distribution channels across the world. We believe this foundation will serve Synchronoss well as we build a comprehensive product roadmap and a go-to-market strategy for the enterprise market around identity, secure mobility, collaboration, and secure workflow platforms.
With the Intralinks acquisition, enterprise will now represent a significant portion of our total revenues, thus helping us further diversify our business model.
43
Critical Accounting Policies and Estimates
The discussion and analysis of our financial condition and results of operations are based on our consolidated financial statements, which have been prepared in accordance with U.S. GAAP. The preparation of these consolidated financial statements in accordance with U.S. GAAP requires us to utilize accounting policies and make certain estimates and assumptions that affect the reported amounts of assets and liabilities, the disclosure of contingencies as of the date of the financial statements and the reported amounts of revenues and expenses during a fiscal period. The Securities and Exchange Commission (“SEC”) considers an accounting policy to be critical if it is important to a company’s financial condition and results of operations, and if it requires significant judgment and estimates on the part of management in its application. We have discussed the selection and development of the critical accounting policies with the audit committee of our Board of Directors, and the audit committee has reviewed our related disclosures in this Form 10‑K. Although we believe that our judgments and estimates are appropriate, correct and reasonable under the circumstances, actual results may differ from those estimates. If actual results or events differ materially from those contemplated by us in making these estimates, our reported financial condition and results of operations for future periods could be materially affected. See “Risk Factors” for certain matters bearing risks on our future results of operations.
We believe the following to be our critical accounting policies because they are important to the portrayal of our consolidated financial condition and results of operations and they require critical management judgments and estimates about matters that are uncertain.
Revenue Recognition and Deferred Revenue
We provide services principally on a transactional or subscription basis or, at times, on a fixed fee basis and recognize the revenues as the services are performed or delivered as discussed below:
Transactional and Subscription Service Arrangements: Transaction and subscription revenues consist of revenues derived from the processing of transactions through our service platforms, providing enterprise portal management services on a subscription basis and maintenance agreements on software licenses. Transaction service arrangements include services such as processing equipment orders, new account set‑up and activation, number port requests, credit checks and inventory management. Subscription services include monthly active user fees, software as a service (“SaaS”) fees, hosting and storage and the related maintenance support for those services.
Transaction revenues are principally based on a contractual price per transaction and are recognized based on the number of transactions processed during each reporting period. Revenues are recorded based on the total number of transactions processed at the applicable price established in the relevant contract. The total amount of revenue recognized is based primarily on the volume of transactions. Subscription revenues are recorded one of two ways: on a straight‑line basis over the life of the contract or on a fixed monthly fee based on a set contracted amount.
Many of our contracts guarantee minimum volume transactions from the customer. In these instances, if the customer’s total transaction volume for the period is less than the contractual amount, we record revenues at the minimum guaranteed amount. At times, transaction revenues may also include billings to customers that reimburse us based on the number of individuals dedicated to processing transactions. Set‑up fees for transactional service arrangements are deferred and recognized on a straight‑line basis over the life of the contract since these amounts would not have been paid by the customer without the related transactional service arrangement. Revenues are presented net of discounts, which are volume level driven, or credits, which are performance driven, and are determined in the period in which the volume thresholds are met or the services are provided.
Professional Service and Software License Arrangements: Professional services include process and workflow consulting services and development services. Professional services when sold with transactional or subscription service arrangements are accounted for separately when the professional services have value to the customer on a standalone basis and there is objective and reliable evidence of fair value of the professional services. When accounted for separately, professional service revenues are recognized as services are performed and all other elements of revenue recognition have been satisfied.
In determining whether professional service revenues can be accounted for separately from transaction or subscription service revenues, we consider the following factors for each professional services agreement: availability of the professional services from other vendors, whether objective and reliable evidence of fair value exists of the undelivered elements, the nature of the professional services, the timing of when the professional services contract was signed in comparison to the transaction or subscription service start date and the contractual independence of the transactional or subscription service from the professional services.
If a professional service arrangement were not to qualify for separate accounting, we would recognize the professional service revenues ratably over the remaining term of the transaction or subscription agreement.
44
Revenue from software license arrangements is recognized when the license is delivered to our customers and all of the software revenue recognition criteria are met. When software arrangements include multiple elements, the arrangement consideration is allocated at the inception to all deliverables using the residual method providing we have vendor specific objective evidence (VSOE) on all undelivered elements. We determine VSOE for each element based on historical stand‑alone sales to third‑parties.
When transaction or subscription service arrangements, include multiple elements, the arrangement consideration is allocated at the inception of an arrangement to all deliverables using the relative selling price method. The relative selling price method allocates any discount in the arrangement proportionally to each deliverable on the basis of each deliverable’s selling price. The selling price used for each deliverable will be based on VSOE if available, third‑party evidence (TPE) if vendor‑ specific objective evidence is not available, or estimated selling price (ESP) if neither vendor‑specific objective evidence nor third‑party evidence is available. The objective of ESP is to determine the price at which we would transact a sale if the product or service were sold on a stand‑alone basis. We determine ESP by considering multiple factors including, but not limited to, geographies, market conditions, competitive landscape, internal costs, gross margin objectives, and pricing practices. ESP is generally used for offerings that are not typically sold on a stand‑alone basis or for new or highly customized offerings.
While we follow specific and detailed rules and guidelines related to revenue recognition, we make and use management judgments and estimates in connection with the revenue recognized in any reporting period, particularly in the areas described above, as well as collectability. If management made different estimates or judgments, differences in the timing of the recognition of revenue could occur.
Deferred Revenue: Deferred revenues primarily represent billings to customers for services in advance of the performance of services, with revenues recognized as the services are rendered, and also include the fair value of deferred revenues recorded as a result of acquisitions.
Service Level Standards
Pursuant to certain contracts, we are subject to service level standards and to corresponding penalties for failure to meet those standards. All performance‑related penalties are reflected as a corresponding reduction of our revenues. These penalties, if applicable, are recorded in the month incurred and were insignificant for the years ended December 31, 2016, 2015 and 2014.
Allowance for Doubtful Accounts
We maintain an allowance for doubtful accounts for estimated bad debts resulting from the inability of our customers to make required payments. The amount of the allowance account is based on historical experience and our analysis of the accounts receivable balance outstanding. While credit losses have historically been within our expectations and the provisions established, we cannot guarantee that we will continue to experience the same credit losses that we have in the past or that our reserves will be adequate. If the financial condition of one of our customers were to deteriorate, resulting in its inability to make payments, additional allowances may be required which would result in an additional expense in the period that this determination was made.
Income Taxes
Since we conduct operations on a global basis, our effective tax rate has and will depend upon the geographic distribution of our pre-tax earnings among locations with varying tax rates. We account for the effects of income taxes that result from our activities during the current and preceding years. Under this method, deferred income tax liabilities and assets are based on the difference between the financial statement carrying amounts and the tax basis of assets and liabilities using enacted tax rates in effect in the years in which the differences are expected to reverse or be utilized. The realization of deferred tax assets is contingent upon the generation of future taxable income. A valuation allowance is recorded if it is "more likely than not" that a portion or all of a deferred tax asset will not be realized.
In evaluating our ability to recover our deferred tax assets within the jurisdiction from which they arise, we consider all available positive and negative evidence, including scheduled reversals of deferred tax liabilities, projected future taxable income, tax-planning strategies, and results of recent operations. In projecting future taxable income, we begin with historical results and incorporate assumptions including the amount of future state, federal and foreign pretax operating income, the reversal of temporary differences, and the implementation of feasible and prudent tax-planning strategies. These assumptions require significant judgment about the forecasts of future taxable income and are consistent with the plans and estimates we are using to manage the underlying businesses.
We recognize a tax benefit from an uncertain tax position only if it is more likely than not to be sustained upon examination based on the technical merits of the position. The amount of the accrual for which an exposure exists is measured by determining the amount that has a greater than 50 percent likelihood of being realized upon the settlement of the position. Components of the
45
reserve are classified as current or a long term liability in the consolidated balance sheets based on when we expect each of the items to be settled. We record interest and penalties accrued in relation to uncertain tax benefits as a component of interest expense. We expect that the amount of unrecognized tax benefits will change during 2017; however, we do not expect the change to have a significant impact on our results of operations or financial position.
While we believe we have identified all reasonably identifiable exposures and that the reserve we have established for identifiable exposures is appropriate under the circumstances, it is possible that additional exposures exist and that exposures may be settled at amounts different than the amounts reserved. It is also possible that changes in facts and circumstances could cause us to either materially increase or reduce the carrying amount of our tax reserves. In general, tax returns for the year 2012 and thereafter are subject to future examination by tax authorities.
Our policy has been to leave our cumulative unremitted foreign earnings invested indefinitely outside the United States, and we intend to continue this policy. As such, taxes have not been provided on any of the remaining accumulated foreign unremitted earnings. Due to the timing and circumstances of repatriation of such earnings, if any, it is not practicable to determine the unrecognized deferred tax liability relating to such amounts. If the cumulative unremitted foreign earnings exceed the amount we intend to reinvest in foreign countries in the future, we would provide for taxes on such excess amount.
Stock‑Based Compensation
As of December 31, 2016, we maintain four stock‑based compensation plans. We utilize the Black‑Scholes pricing model to determine the fair value of stock options on the dates of grant. Restricted stock awards are measured based on the fair market values of the underlying stock on the dates of grant. We recognize stock‑based compensation over the requisite service period with an offsetting credit to additional paid‑in capital.
For our performance restricted stock awards we estimate the number of shares the recipient is to receive by applying a probability of achieving the performance goals. The actual number of shares the recipient receives is determined at the end of the performance period based on the results achieved versus goals based on our performance targets, such as revenue and EBITDA. Once the number of awards is determined, the compensation cost is fixed and continues to be recognized using straight line recognition over the requisite service period for each vesting tranche.
Use of a valuation model requires management to make certain assumptions with respect to selected model inputs. Expected volatility was calculated based on our historical information of our stock. The average expected life was determined using historical stock option exercise activity. The risk‑free interest rate is based on U.S. Treasury zero‑coupon issues with a remaining term equal to the expected life assumed at the date of grant. We have never declared or paid cash dividends on our common or preferred equity and do not anticipate paying any cash dividends in the foreseeable future. Forfeitures are accounted for as they occur.
Business Combinations
We account for business combinations in accordance with the acquisition method. The acquisition method of accounting requires that assets acquired and liabilities assumed be recorded at their fair values on the date of a business acquisition. Our consolidated financial statements and results of operations reflect an acquired business from the completion date of an acquisition.
The judgments that we make in determining the estimated fair value assigned to each class of assets acquired and liabilities assumed, as well as asset lives, can materially impact net income in periods following a business combination. We generally use either the income, cost or market approach to aid in our conclusions of such fair values and asset lives. The income approach presumes that the value of an asset can be estimated by the net economic benefit to be received over the life of the asset, discounted to present value. The cost approach presumes that an investor would pay no more for an asset than its replacement or reproduction cost. The market approach estimates value based on what other participants in the market have paid for reasonably similar assets. Although each valuation approach is considered in valuing the assets acquired, the approach ultimately selected is based on the characteristics of the asset and the availability of information.
We record contingent consideration resulting from a business combination at its fair value on the acquisition date. Each reporting period thereafter, we revalue these obligations and record increases or decreases in their fair value as an adjustment to net change in contingent consideration obligation within the consolidated statement of income. Changes in the fair value of the contingent consideration obligation can result from updates in the achievement of financial or other operational targets and changes to the weighted probability of achieving those future targets. Significant judgment is employed in determining the appropriateness of these assumptions as of the acquisition date and for each subsequent period. Accordingly, any change in the assumptions described above, could have a material impact on the amount of the net change in contingent consideration obligation that we record in any given period.
46
Recent Acquisitions
On January 19, 2017, we completed the acquisition of Intralinks at a price of $13.00 per share, or $850.0 million, net of working capital adjustments. For further details see the subsequent events footnote (Note 19).
The acquisition will allow the Company to leverage the Synchronoss' product portfolio, go-to-market strategy and diversified customer footprint and deploy an enhanced enterprise and mobile solution to customers while opening up new enterprise distribution channels across the world.
On March 1, 2016, we acquired all outstanding shares of Openwave Messaging, Inc. for $124.5 million, net of working capital adjustments and liabilities assumed, comprised of $102.5 million paid in cash and $22 million paid in shares of our common stock, based upon the average market value of the common stock for the ten trading days prior to the acquisition date.
Openwave’s product portfolio includes its core complete messaging platform optimized for today’s most complex messaging requirements worldwide with a particular geographic strength in Asia Pacific. With this acquisition and combined with our current global footprint, we will have increased direct access to subscribers around the world for the Synchronoss Personal Cloud platform and bolster our go-to-market efforts internationally.
On August 4, 2015, we acquired all outstanding shares of Razorsight for $25.3 million, net of liabilities assumed. Razorsight offers cloud-based analytics solutions for communications service providers. Their cloud-based products embed advanced statistical analysis and predictive analytics to proactively pinpoint customer attrition risk, revenue opportunities, and better customer experiences. We believe that this acquisition will strategically enhance our product portfolio allowing us to reach a broader client base by expanding our value proposition and more deeply embedding our platforms.
On February 23, 2015, we acquired certain cloud assets from F-Secure, an online security and privacy company headquartered in Finland, for cash consideration of $59.5 million, net of liabilities assumed. This acquisition expands our cloud services customer base.
Discontinued Operations
Management classifies a disposal transaction as discontinued operation in the consolidated financial statements when it qualifies as a component of the Company, meets the held for sale criteria, is disposed of by sale, or is disposed of other than by sale and it represents a strategic shift that has a major effect on our operations and financial results.
Recent Divestitures
On December 16, 2016, we completed the divestiture of a portion of our carrier activation business (“BPO”) to a newly formed entity named Sequential Technology International, LLC (“STI”), to leverage the assets sold as part of this transaction to STI's existing global customer care operations, for a total purchase price of $146 million. As part of the sales arrangement, we will retain a 30% investment in STI, which can be reduced during the cour ents. Sequential Technology International Holdings, LLC, an unrelated third party that was formerly named Omniglobe International LLC, owns the remaining 70% of STI. The divestiture of the service portion of the Activation business created a better overall solution for our customers as STI is positioned to capitalize on the combined experience of both teams and is expected to become a strong, global player, building on over a decade of call center operations.
On December 29, 2016, we completed the divestiture of our Mirapoint activation business to an unrelated third party and recorded a gain of $1.4 million on the sale.
On February 1, 2017, we completed the divestiture of our SpeechCycle business, to an unrelated third party, for consideration of $13.5 million. As part of the divestiture we entered into a 1 year transition services agreement with the acquirer to support various indirect activities such as customer software support, technical support services, maintenance and general & administrative support services.
Investments in Affiliates and Other Entities
In the normal course of business, we enter into various types of investment arrangements, each having unique terms and conditions. These investments may include equity interests held by us in business entities, including general or limited partnerships, contractual ventures, or other forms of equity participation. Management determines whether such investments involve a variable interest entity (“VIE”) based on the characteristics of the subject entity. If the entity is determined to be a VIE, then management
47
determines if we are the primary beneficiary of the entity and whether or not consolidation of the VIE is required. The primary beneficiary consolidating the VIE must normally have both (i) the power to direct the activities of a VIE that most significantly affect the VIE’s economic performance and (ii) the obligation to absorb losses of the VIE or the right to receive benefits from the VIE, in either case that could potentially be significant to the VIE. When we are deemed to be the primary beneficiary, the VIE is consolidated and the other party’s equity interest in the VIE is accounted for as a noncontrolling interest.
We generally account for investments that we makes in VIEs in which we have determined that we do not have a controlling financial interest but have significant influence over and hold at least a 20% ownership interest using the equity method. Any such investment not meeting the parameters to be accounted under the equity method would be accounted for using the cost method unless the investment had a readily determinable fair value, at which it would then be reported. We utilize a 1 month reporting lag in recording equity income from equity method investments.
If an entity fails to meet the characteristics of a VIE, management then evaluates such entity under the voting model. Under the voting model, we would consolidate the entity if it is determined that we, directly or indirectly, have greater than 50% of the voting shares, and determine that other equity holders do not have substantive participating rights.
Goodwill
Goodwill represents the excess of the purchase price over the fair value of assets acquired, including other definite‑lived intangible assets. Goodwill is not amortized, but reviewed annually for impairment or upon the occurrence of events or changes in circumstances that would more likely than not reduce the fair value of the reporting unit below its carrying amount. We performed our annual impairment test as of October 1, 2016, and determined that there was no impairment. We do not believe we are at significant risk for impairment.
48
Results of Operations
Year ended December 31, 2016 compared to the year ended December 31, 2015
The following table presents an overview of our results of operations for the year ended December 31, 2016 and 2015:
Year ended December 31, | ||||||||||||||||||||
2016 | 2015 | 2016 vs 2015 | ||||||||||||||||||
$ | % of Revenue | $ | % of Revenue | $ Change | % Change | |||||||||||||||
(in thousands) | ||||||||||||||||||||
Net revenues | $ | 476,750 | 100 | % | $ | 428,117 | 100 | % | $ | 48,633 | 11 | % | ||||||||
Cost of services* | 194,198 | 41 | % | 155,287 | 36 | % | 38,911 | 25 | % | |||||||||||
Research and development | 106,681 | 22 | % | 91,430 | 21 | % | 15,251 | 17 | % | |||||||||||
Selling, general and administrative | 131,106 | 27 | % | 88,411 | 21 | % | 42,695 | 48 | % | |||||||||||
Net change in contingent consideration obligation | 10,930 | 2 | % | 760 | — | % | 10,170 | 1,338 | % | |||||||||||
Restructuring charges | 6,333 | 1 | % | 4,946 | 1 | % | 1,387 | 28 | % | |||||||||||
Depreciation and amortization | 99,311 | 21 | % | 72,152 | 17 | % | 27,159 | 38 | % | |||||||||||
Total costs and expenses | 548,559 | 115 | % | 412,986 | 96 | % | 135,573 | 33 | % | |||||||||||
(Loss) income from continuing operations | $ | (71,809 | ) | (15 | )% | $ | 15,131 | 4 | % | $ | (86,940 | ) | (575 | )% | ||||||
__________________________________________________________
* | Cost of services excludes depreciation and amortization which is shown separately. |
Revenues
Net revenues. Net revenues increased $48.6 million to $476.8 million for the year ended December 31, 2016, compared to the same period in 2015. Transaction and subscription revenues as a percentage of sales were 64% or $306.8 million for the year ended December 31, 2016 compared to 64% or $275.9 million for the same period in 2015. The increase in transaction and subscription revenue is primarily driven by new subscription arrangements as a result of our expansion with new customers. Professional service and license revenues as a percentage of sales were 36% or $170.0 million for the year ended December 31, 2016, compared to 36% or $152.2 million for the same period in 2015. The increase in professional services and license revenue is primarily due to new license agreements and expansion of services with our customers.
We derive our revenue from Cloud and Activation services and software licenses. Our Cloud service revenues include, among other things, revenue from our Personal Cloud, Messaging Cloud and Enterprise Cloud platforms. Our Activation services revenues include, among other things, revenue from our Activation services, our Activation API software and Cloud Analytics.
During the course of 2016, we divested a portion of our BPO business to STI. Subsequent to December 31, 2016, we completed the sale of our SpeechCycle business. As part of this strategic divestiture process we are maintaining our software activation API which is integral to the Razorsight Cloud Analytics platform. Since our acquisition of Razorsight, our Cloud Analytics technology has been used in both our Activation and Cloud business to provide augmented subscriber information to our mobile operator customers. Cloud Analytics has become a key component to our Personal Cloud offerings and, in late 2016, we began to offer the combined technology as our Cloud Analytics solution.
As a result of our activation divestitures, on an on-going basis, our business operations on our remaining activation assets are focused on driving cloud analytics and related cloud deals with carriers given a strategic focus around our existing API’s and gateways which are integral to the Razorsight Cloud Analytics platform. Activation assets remaining in the business are key to our core cloud business going forward. We believe this combination of assets from both our Activation API's and Personal Cloud subscribers creates a new differentiating offering, providing us with a competitive advantage in our Cloud Analytics offering. As a result of this new offering we reclassified revenue historically derived from Cloud Analytics offering to the Cloud category.
49
The following table outlines the reclassification:
Year Ended December 31, 2016 | Year Ended December 31, 2015 | ||||||||||||||||||||||
Revenue from Continuing Operations | Revenue from Continuing operations | ||||||||||||||||||||||
Prior to | Cloud | After | Prior to | Cloud | After | ||||||||||||||||||
Reclassification | Analytics | Reclassification | Reclassification | Analytics | Reclassification | ||||||||||||||||||
Activation | $ | 112,652 | $ | (25,827 | ) | $ | 86,825 | $ | 118,133 | $ | (5,848 | ) | $ | 112,285 | |||||||||
Cloud | 364,098 | 25,827 | 389,925 | 309,984 | 5,848 | 315,832 | |||||||||||||||||
Net Revenues | $ | 476,750 | $ | — | $ | 476,750 | $ | 428,117 | $ | — | $ | 428,117 | |||||||||||
Of the $86.8 million referenced above as 2016 Activation revenue after reclassification, roughly $50 million of these revenues related to activation assets which we have either sold or sunsetted, or do not plan to actively market or pursue in 2017.
Net revenues related to Activation Solutions decreased $25.5 million to $86.8 million for the year ended December 31, 2016, compared to the same period in 2015 due to the completion of nonrecurring migration related work and professional service projects in 2015. Net revenues related to Activation Solutions represented 18% for the year ended December 31, 2016, compared to 26% for the same period in 2015.
Net revenues related to our Cloud Solutions increased by $74.1 million to $389.9 million of our revenues for the year ended December 31, 2016 compared to the same period in 2015. The increase in our Cloud Solution performance was a result of new cloud offerings with new and existing customers and the launch of our Enterprise solutions. Net revenues related to our Cloud Solutions represented 82% for the year ended December 31, 2016, compared to 74% for the same period in 2015.
Expenses
Cost of services. Cost of services increased $38.9 million to $194.2 million for the year ended December 31, 2016, compared to the same period in 2015, due primarily to increases in personnel and related costs, migration and integration of our acquired businesses. Personnel and related costs increased $14.6 million due to increased headcount from the Openwave acquisition and the launch of our Enterprise solution. Outside consulting expenses increased $6.2 million, of which $6 million of costs related to the launch of our Enterprise solution. Facility costs increased by $15.5 million, primarily driven by increased costs for service contracts due to the expansion of our operational footprint. Royalty fees increased $1.9 million associated with our Openwave product offerings.
Research and development. Research and development expense increased $15.3 million to $106.7 million for the year ended December 31, 2016, compared to the same period in 2015 primarily due to increases of $12.2 million in outside consultant expense and $2.9 million in personnel and related costs which were driven by the launch of our Enterprise solution and the Openwave acquisition.
Selling, general and administrative. Selling, general and administrative expense increased $42.7 million to $131.1 million for the year ended December 31, 2016, compared to the same period in 2015. The increase was driven in part by a $17.0 million increase in personnel and related costs which were driven by additional headcount due to the launch of our Enterprise solution and the Openwave acquisition. Included in this expense is mergers and acquisitions ("M&A") expenses, which increased $10.5 million as a result of our acquisition and divestiture activities. Professional services increased by $4.2 million as a result of accounting and legal costs related to our acquisitions, divestitures and tax planning. Outside consulting expenses increased by$4.9 million due primarily to costs incurred for the launch of our Enterprise solution. The remaining increases included $3.0 million related to facilities and $3.2 million related to increases in bad debt expense.
Net change in contingent consideration obligation. The net change in contingent consideration obligation was a $10.2 million increase for the year ended December 31, 2016 as compared to the year ended December 31, 2015. This was due to an achievement of the contractual milestones associated with the potential earn-out payments to the Razorsight shareholders.
Restructuring charges. Restructuring charges were $6.3 million for the year ended December 31, 2016, which related to employment termination costs as a result of the work‑force reduction plans that we commenced in March 2016 and in December 2016 that was designed to reduce costs and align our resources with our key strategic priorities.
Depreciation and amortization. Depreciation and amortization expense increased $27.2 million to $99.3 million for the year ended December 31, 2016, compared to the same period in 2015, primarily related to the increase in depreciable assets necessary
50
for the continued expansion of our platforms and amortization of our newly acquired intangible assets related to our recent acquisitions.
Interest expense. Interest expense increased $1.3 million to $7.0 million for the year ended December 31, 2016, compared to the same period in 2015 due to an increase of approximately $0.9 million in contractual interest related to the drawdown from the Amended Credit Facility and $0.2 million related to increased financing costs and commitment fees for the Amended Credit Facility.
Other income (expense), net. Other income (expense) increased $1.5 million to $1.9 million for the year ended December 31, 2016, compared to the same period in 2015 driven by the $1.4 million gain on the sale of our Mirapoint activation business.
Income tax. We recognized approximately $8.0 million and $5.4 million in income tax benefit and expense during the year ended December 31, 2016 and 2015, respectively. Our effective tax rate was approximately 11% for the year ended December 31, 2016, which was lower than our U.S. federal statutory rate due to the unfavorable impact of losses in foreign jurisdictions, which have lower tax rates than the U.S, the unfavorable impact of the fair market value adjustment for the Razorsight contingent consideration obligation and the recording of a non-cash income tax provision to establish a valuation allowance. We considered all available evidence, including our historical profitability and projections of future taxable income together with new evidence, both positive and negative, that could affect the view of the future realization of deferred tax assets. As a result of our assessment, we recorded a $9.3 million valuation allowance which reduced the deferred tax asset related to our current net operating losses of certain domestic and foreign subsidiaries. Our effective tax rate was approximately 46% for the year ended December 31, 2015, which was higher than our U.S. federal statutory rate due to the unfavorable impact of losses in foreign jurisdictions, which have lower tax rates than the U.S, the unfavorable impact of the fair market value adjustment for the Razorsight contingent consideration obligation and the recording of a non-cash income tax provision to establish a valuation allowance. We review the expected annual effective income tax rate and make changes on a quarterly basis as necessary based on certain factors such as changes in forecasted annual operating income, changes to the actual and forecasted permanent book-to-tax differences, and changes resulting from the impact of tax law changes.
51
Year ended December 31, 2015, compared to the year ended December 31, 2014
The following table presents an overview of our results of operations for the years ended December 31, 2015 and 2014:
Year ended December 31, | ||||||||||||||||||||
2015 | 2014 | 2015 vs 2014 | ||||||||||||||||||
$ | % of Revenue | $ | % of Revenue | $ Change | % Change | |||||||||||||||
(in thousands) | ||||||||||||||||||||
Net revenues | $ | 428,117 | 100 | % | $ | 307,301 | 100 | % | $ | 120,816 | 39 | % | ||||||||
Cost of services* | 155,287 | 36 | % | 102,386 | 33 | % | 52,901 | 52 | % | |||||||||||
Research and development | 91,430 | 21 | % | 73,620 | 24 | % | 17,810 | 24 | % | |||||||||||
Selling, general and administrative | 88,411 | 21 | % | 77,081 | 25 | % | 11,330 | 15 | % | |||||||||||
Net change in contingent consideration obligation | 760 | — | % | 1,799 | 1 | % | (1,039 | ) | (58 | )% | ||||||||||
Restructuring charges | 4,946 | 1 | % | — | — | % | 4,946 | 100 | % | |||||||||||
Depreciation and amortization | 72,152 | 17 | % | 55,956 | 18 | % | 16,196 | 29 | % | |||||||||||
Total costs and expenses | 412,986 | 96 | % | 310,842 | 101 | % | 102,144 | 33 | % | |||||||||||
Income (loss) from continuing operations | $ | 15,131 | 4 | % | $ | (3,541 | ) | (1 | )% | $ | 18,672 | (527 | )% | |||||||
__________________________________________________________
* | Cost of services excludes depreciation and amortization which is shown separately. |
Revenues
Net Revenues. Net revenues increased $120.8 million to $428.1 million in 2015, compared to 2014. Transaction and subscription revenues as a percentage of sales were 64% or $275.9 million in 2015 compared to 66% or $203.4 million in 2014. The $72.4 million increase in transaction and subscription revenue is primarily due to our expanded offerings and an increase in subscriptions with our existing customers. Professional service and software license revenues as a percentage of sales were 36% or $152.2 million in 2015 compared to 34% or $103.9 million in 2014. The increase in professional services and license revenue is due to new license agreements of approximately $38 million with existing and new customers of which $20.3 million related to our new ventures with Verizon and Goldman Sachs. New releases in our personal cloud offering accounted for an additional $18 million of this increase.
We derive our revenue from Cloud and Activation services and software licenses. Our Cloud service revenues include, among other things, revenue from our Personal Cloud, Messaging Cloud and Enterprise Cloud platforms. Our Activation services revenues include, among other things, revenue from our Activation services, our Activation API software and Cloud Analytics.
During the course of 2016, we divested a portion of our BPO business to STI. Subsequent to December 31, 2016, we completed the sale of our SpeechCycle business. As part of this strategic divestiture process we are maintaining our software activation API which is integral to the Razorsight Cloud Analytics platform. Since our acquisition of Razorsight, our Cloud Analytics technology has been used in both our Activation and Cloud business to provide augmented subscriber information to our mobile operator customers. Cloud Analytics has become a key component to our Personal Cloud offerings and, in late 2016, we began to offer the combined technology as our Cloud Analytics solution.
As a result of our activation divestitures, on an on-going basis, our business operations on our remaining activation assets are focused on driving cloud analytics and related cloud deals with carriers given a strategic focus around our existing API’s and gateways which are integral to the Razorsight Cloud Analytics platform. Activation assets remaining in the business are key to our core cloud business going forward. We believe this combination of assets from both our Activation API's and Personal Cloud subscribers creates a new differentiating offering, providing us with a competitive advantage in our Cloud Analytics offering. As a result of this new offering we reclassified revenue historically derived from Cloud Analytics offering to the Cloud category.
52
The following table outlines the reclassification:
Year Ended December 31, 2015 | Year Ended December 31, 2014 | ||||||||||||||||
Revenue from Continuing Operations | Revenue from Continuing Operations | ||||||||||||||||
Prior to | Cloud | After | Prior to | Cloud | After | ||||||||||||
Reclassification | Analytics | Reclassification | Reclassification | Analytics | Reclassification | ||||||||||||
Activation | 118,133 | (5,848 | ) | 112,285 | 95,836 | — | 95,836 | ||||||||||
Cloud | 309,984 | 5,848 | 315,832 | 211,465 | — | 211,465 | |||||||||||
Net Revenues | 428,117 | — | 428,117 | 307,301 | — | 307,301 | |||||||||||
Net revenues related to Activation Services increased $16.4 million to $112.3 million in 2015, compared to $95.8 million in 2014. Net revenues related to Activation Services represented 26% of our revenue for the year ended December 31, 2015, compared to 31% for 2014. The increase was driven by the expansion of our customer base.
Net revenues related to our Cloud Services increased by $104.4 million to $315.8 million of our revenues for the year ended December 31, 2015 compared to 2014. Net revenues related to our Cloud Services represented 74% of our revenue for the year ended December 31, 2015, compared to 69% in 2014. The increase in our Cloud Service performance was a result of strong adoption of our cloud offerings across our customer base and our expanded offerings.
Expense
Cost of Services. Cost of services increased $52.9 million to $155.3 million in 2015, compared to 2014, due primarily to an increase of $36.9 million in colocation costs related to the expansion and virtualization of our hosting and storage offerings. There was also an increase of $7.9 million in outside consulting expense due to our ongoing migration and integration projects. Additionally, our personnel and related costs increased $6.8 million as a result of our continued growth.
Research and Development. Research and development expense increased approximately $17.8 million to $91.4 million in 2015, compared to 2014, primarily due to an increase of $12.9 million in personnel and related costs and an increase of $1.5 million in stock-based compensation, due to an increase in headcount as a result of our acquisitions and our investments in our product group. An increase in facility costs of $1.9 million was driven by increased maintenance contracts related to our development and testing environments.
Selling, General and Administrative. Selling, general and administrative expenses increased $11.3 million to $88.4 million in 2015, compared to 2014.The most significant drivers of the increase are a $4.3 million increase in professional fees, a $3.4 million increase in outside consultants and a $3.5 million increase in our bad debt expense, offset by a $1.1 million decrease in M&A expense. The increase in professional fees relates to accounting and legal costs as a result of our acquisitions, tax planning activities and our patent licensing program. The most significant increases in outside consultants related to costs incurred for the launch of our Enterprise business, including our strategic ventures with Goldman Sachs and Verizon.
Net Change in Contingent Consideration Obligation. The net change in contingent consideration obligation decreased by $1.0 million for the year ended December 31, 2015. This was due to a $0.8 million increase in the contingent consideration for the year ended December 31, 2015 related to an increase in our potential earn-out payment to the Razorsight shareholders due to the achievement of certain milestones compared to a $1.8 million increase in 2014 in the fair value of contingent consideration associated with our potential earn-out payment to the Strumsoft shareholders.
Restructuring charges. Restructuring charges were $4.9 million related to employment termination costs and facility consolidation costs, as a result of the workforce reduction plan started in January 2015, which was designed to reduce costs and align our resources with our key strategic priorities.
Depreciation and Amortization. Depreciation and amortization expense increased $16.2 million to $72.2 million in 2015, compared to 2014, primarily related to the increase in depreciable fixed assets necessary for the continued expansion of our platforms and amortization of our newly acquired intangible assets related to our recent acquisitions and ventures.
Interest Income. Interest income increased $0.8 million to $2.0 million in 2015, compared to 2014. Interest income increased primarily due to an increase in our cash, cash equivalents and investment balances during the year.
53
Interest Expense. Interest expense increased $2.3 million to $5.7 million in 2015, compared to 2014 due to an increase of approximately $2 million related to the convertible debt contractual interest together with amortization of deferred financing costs and an increase of $0.3 million related to interest paid on capital leases.
Other Income. Other income decreased by less than $0.1 million to $0.4 million in 2015, compared to 2014. Other income decreased primarily due to the unavailability of a New York state refundable research and development tax credit in 2015 that had been available in 2014, as well as foreign currency exchange rate fluctuations.
Income Tax. During 2015 and 2014, we recognized approximately $5.4 million and $3.2 million in income tax expense and benefit, respectively. Our effective tax rate was approximately 45.8% and 61.6% during 2015 and 2014, respectively. In 2015, our effective tax rate was higher than our U.S. federal statutory rate primarily due to the tax effect of non-deductible expenses and the unfavorable tax impact of losses in foreign jurisdictions which have lower tax rates than the U.S. offset by the favorable impact of the minority interest in the ventures and the tax credit for research and experimentation expenses.
We expect to be exposed to fluctuations in our effective tax rate during the earn-out period for our contingent consideration liabilities. Due to the nature of these transactions we may experience significant adjustments to fair value of the contingent consideration obligation depending on the outcome of the target achievements.
54
Unaudited Quarterly Results of Operations
The following tables includes unaudited financial data for the fiscal year quarters in 2016 and 2015, which have been adjusted for discontinued operations.
Quarter Ended | ||||||||||||||||
March 31, | June 30, | September 30, | December 31, | |||||||||||||
(In thousands, except per share data) | ||||||||||||||||
2016 | ||||||||||||||||
Net revenues (4) | $ | 104,219 | $ | 118,255 | $ | 132,480 | $ | 121,796 | ||||||||
Gross profit(2) | 57,771 | 69,788 | 83,407 | 71,586 | ||||||||||||
Income (loss) from continuing operations | (20,555 | ) | (19,121 | ) | (1,856 | ) | (30,277 | ) | ||||||||
Net income (loss) | (11,083 | ) | (7,303 | ) | 4,833 | 21,545 | ||||||||||
Net income (loss) attributable to Synchronoss (3) | (7,954 | ) | (4,439 | ) | 7,676 | 24,305 | ||||||||||
Basic: | ||||||||||||||||
Continuing operations (1) | $ | (0.44 | ) | $ | (0.34 | ) | $ | (0.05 | ) | $ | (0.44 | ) | ||||
Discontinued operations (1) | 0.26 | 0.24 | 0.23 | 0.99 | ||||||||||||
$ | (0.18 | ) | $ | (0.10 | ) | $ | 0.18 | $ | 0.55 | |||||||
Diluted: | ||||||||||||||||
Continuing operations (1) | $ | (0.44 | ) | $ | (0.34 | ) | $ | (0.05 | ) | $ | (0.44 | ) | ||||
Discontinued operations (1) | 0.26 | 0.24 | 0.23 | 0.99 | ||||||||||||
$ | (0.18 | ) | $ | (0.10 | ) | $ | 0.18 | $ | 0.55 | |||||||
Quarter Ended | ||||||||||||||||
March 31, | June 30, | September 30, | December 31, | |||||||||||||
(In thousands, except per share data) | ||||||||||||||||
2015 | ||||||||||||||||
Net revenues (4) | $ | 95,431 | $ | 102,176 | $ | 109,297 | $ | 121,213 | ||||||||
Gross profit(2) | 61,824 | 66,231 | 69,074 | 75,701 | ||||||||||||
Income (loss) from continuing operations | 1,445 | 7,574 | 4,565 | 1,547 | ||||||||||||
Net income | 10,561 | 15,154 | 9,645 | 11,322 | ||||||||||||
Net income (loss) attributable to Synchronoss | 10,561 | 15,154 | 9,645 | 5,270 | ||||||||||||
Basic: | ||||||||||||||||
Continuing operations (1) | $ | (0.01 | ) | $ | 0.11 | $ | (0.04 | ) | $ | (0.05 | ) | |||||
Discontinued operations (1) | 0.26 | 0.25 | 0.27 | 0.17 | ||||||||||||
$ | 0.25 | $ | 0.36 | $ | 0.23 | $ | 0.12 | |||||||||
Diluted: | ||||||||||||||||
Continuing operations (1) | $ | (0.01 | ) | $ | 0.11 | $ | (0.04 | ) | $ | (0.05 | ) | |||||
Discontinued operations (1) | 0.26 | 0.25 | 0.27 | 0.17 | ||||||||||||
$ | 0.25 | $ | 0.36 | $ | 0.23 | $ | 0.12 | |||||||||
__________________________________________________________
(1) | Per common share amounts for the quarters and full year have been calculated separately. Accordingly, quarterly amounts do not add to the annual amount because of differences in the number of weighted‑average common shares outstanding during each period which results principally from the effect of issuing shares of our common stock and options throughout the year. |
(2) | Gross profit is defined as net revenues less cost of services and excludes depreciation and amortization expense. |
(3) | Net income for the quarter ended March 31, 2016 included a $0.6 million income tax expense adjustment related to the elimination of the additional paid-in-capital or APIC Pool as a result of the adoption of ASU 2016-09. |
55
(4) | In the Pro Forma Financial Information which we filed as part of our Form 8-K on December 22, 2016 in connection with the divestiture of our BPO business referenced above, net revenues for our Activation API software; which were not included in the divestiture, for the nine month period ended September 30, 2016 were originally classified as revenue from discontinued operations instead of continuing operations. Specifically, net revenues for each of the quarters of March 31, June 30 and September 30 reflect revenues of $1.3 million, $1.2 million and $2.4 million, respectively, that were originally classified as revenue from discontinued operations instead of continuing operations. This was adjusted in the quarter ended December 31, 2016 by adding these amounts to the above revenue for that quarter, and these amounts were further offset by reducing revenues from continuing operations in the quarter of approximately $5.0 million as a result of the timing of the divesture of the BPO business in the quarter. |
56
Liquidity and Capital Resources
As of December 31, 2016, our principal source of liquidity has been cash provided by operations and borrowings on our Amended Credit Facility. Our cash, cash equivalents, marketable securities and restricted cash balance was $226.5 million at December 31, 2016. We anticipate that our principal uses of cash in the future will be to fund the expansion of our business through both organic growth and acquisition activities and the expansion of our customer base. Uses of cash will also include facility and technology expansion, significant integration and restructuring activities, capital expenditures, and working capital.
At December 31, 2016, our non-U.S. subsidiaries held approximately $25.5 million of cash and cash equivalents that are available for use by all of our operations around the world. At this time, we believe the funds held by all non-U.S. subsidiaries, except those acquired as part of the Openwave acquisition, will be permanently reinvested outside of the U.S. However, if these funds were repatriated to the U.S. or used for U.S. operations, certain amounts could be subject to U.S. tax for the incremental amount in excess of the foreign tax paid. Due to the timing and circumstances of repatriation of these earnings, if any, it is not practical to determine the unrecognized deferred tax liability related to the amount.
Credit Rating
Our credit ratings impact our access to the debt capital markets and cost of capital. Our long-term credit ratings as of January 6, 2017 are as follows:
Long-term | Outlook | ||
Moody's Investors Service | B1 | Positive | |
S&P Global Ratings | BB- | Stable | |
2013 Credit Facility
In September 2013, we entered into a Credit Agreement (the “Credit Facility”) with JP Morgan Chase Bank, N.A., as the administrative agent, Wells Fargo Bank, National Association, as the syndication agent and Capital One, National Association and KeyBank National Association, as co-documentation agents. The Credit Facility, which was used for general corporate purposes, was a $100 million unsecured revolving line of credit that was set to mature on September 27, 2018. We paid a commitment fee in the range of 25 to 35 basis points on the unused balance of the revolving credit facility under this credit agreement. We had the right to request an increase in the aggregate principal amount of the Credit Facility up to $150 million.
Interest on the borrowing was based upon LIBOR plus a 2.25 basis point margin. All outstanding balances under the Credit Facility were repaid on July 7, 2016 and the 2013 Credit Facility was terminated and replaced with the Amended Credit Facility.
Amended Credit Facility
On July 7, 2016, we entered into an Amended Credit Agreement (the “Amended Credit Agreement”) with Wells Fargo Bank, National Association, as administrative agent (the “Administrative Agent”) and the several lenders party thereto. The Amended Credit Facility, which will be used for general corporate purposes, was a $250 million unsecured revolving line of credit that was set to mature on July 7, 2021, subject to terms and conditions set forth therein. We paid a commitment fee in the range of 15 to 30 basis points on the unused balance of the revolving credit facility under the Amended Credit Agreement. We have the right to request an increase in the aggregate principal amount of the Amended Credit Facility up to $350 million.
Interest on the borrowing were based upon LIBOR plus a 1.99 basis point margin. As of December 31, 2016, we had an outstanding balance of $29 million on our Amended Credit Facility.
The Amended Credit Facility was subject to certain financial covenants. As of December 31, 2016, we were in compliance with all required covenants.
On January 19, 2017, the Company repaid all outstanding obligations under the Amended Credit Agreement with Wells Fargo Bank and the several lenders party thereto. The aggregate payoff amount was $29 million and included all accrued interest and associated prepayment penalties. For further details see the subsequent events footnote (Note 19).
57
Convertible Senior Notes
On August 12, 2014, we issued $230.0 million aggregate principal amount of 0.75% Convertible Senior Notes due in 2019 (the “2019 Notes”). The 2019 Notes mature on August 15, 2019, and bear interest at a rate of 0.75% per annum payable semi-annually in arrears on February 15 and August 15 of each year. We accounted for the $230.0 million face value of the debt as a liability and capitalized approximately $7.1 million of financing fees, related to the issuance. At December 31, 2016, the carrying amount of the liability was $226.3 million and the outstanding principal of the 2019 Notes was $230.0 million, with an effective interest rate of approximately 1.39%.
2017 Term Facility
On January 19, 2017, we completed the acquisition of Intralinks at a price of $13.00 per share. In connection with the acquisition, we entered in to the 2017 Credit Agreement. We paid a total of approximately $904.1 million, in connection with the acquisition, including repayment of existing indebtedness for both Synchronoss, including the Amended Credit Facility and Intralinks, fees and costs associated with the Term Facility (as defined below) and other transaction related expenses as well as funded payments required to complete the acquisition with cash on hand and proceeds from the Credit Agreement. Our obligations under the 2017 Credit Agreement are guaranteed by certain of our subsidiaries, including Intralinks, and secured by substantially all of our assets and the guarantors.
The term loan lenders under the 2017 Credit Agreement have advanced to senior secured term loans in an aggregate principal amount of $900 million with a maturity date of January 19, 2024 (the “ 2017 Term Facility”). The revolving lenders under the Credit Agreement have provided us with a revolving credit facility of up to $200 million with a maturity date of January 19, 2022 (the “Revolving Facility”). The term loans under the Term Facility will amortize at 1% per annum in equal quarterly installments with the balance payable on the final maturity date. The proceeds of the Term Facility are being used to finance a portion of the cash consideration in the Offer and the Merger, to refinance certain of our existing indebtedness, including the Amended Credit Facility and indebtedness of Intralinks (or our subsidiaries) and to pay related fees and expenses. The Revolving Facility includes borrowing capacity available for letters of credit and for borrowings on same-day notice under swingline loans, and borrowing thereunder may be used for working capital and other general corporate purposes.
Loans under the 2017 Term Facility bear interest at a rate equal to, at our option, the adjusted LIBOR rate for an applicable interest period or an alternate base rate, in each case, plus an applicable margin of 2.75% or 1.75%, respectively. The revolving loans under the Revolving Facility initially bear interest at a rate equal to, at our option, the adjusted LIBOR rate or an alternate base rate, in each case, plus an applicable margin of 2.50% or 1.50%, respectively, subject to step-downs based on our ratio of first lien secured debt to adjusted EBITDA.
Subject to certain customary exceptions, loans under the 2017 Term Facility are subject to mandatory prepayments in amounts equal to: (1) 100% of the net cash proceeds from any non-ordinary course sale or other disposition of assets (including as a result of casualty or condemnation) by Synchronoss or its restricted subsidiaries subject to customary reinvestment provisions and certain other exceptions; (2) 100% of the net cash proceeds from incurrences of debt (other than permitted debt); and (3) a customary annual excess cash flow sweep at levels based on Parent’s then applicable ratio of first lien secured debt to adjusted EBITDA.
The 2017 Credit Agreement contains a number of customary affirmative and negative covenants and events of default, which, among other things, restrict our ability to incur debt, allow liens on assets, make investments, pay dividends or prepay certain other debt. The 2017 Credit Agreement also requires us to comply with certain financial maintenance covenants, including a total gross leverage ratio and an interest charge coverage ratio.
Certain of the lenders under the 2017 Credit Agreement, or their affiliates, have provided, and may in the future from time to time provide, certain commercial and investment banking, financial advisory and other services in the ordinary course of business for the registrant and its affiliates, for which they have in the past and may in the future receive customary fees and commissions.
Share Repurchase Program
On February 4, 2016, we announced that our Board of Directors approved a share repurchase program under which we may repurchase up to $100 million of our outstanding common stock for 12 to 18 months following the announcement.
As of December 31, 2016, we repurchased approximately 1.3 million shares of our common stock under this program for an aggregate repurchase price of $40.0 million.
58
Discussion of Cash Flows
Year ended December 31, 2016, compared to the year ended December 31, 2015
A summary of net cash flows follows (in thousands):
Year ended December 31, | |||||||||||
2016 | 2015 | Change | |||||||||
Net cash provided by (used in): | (As adjusted) | ||||||||||
Operating activities | $ | 142,589 | $ | 139,822 | $ | 2,767 | |||||
Investing activities | (99,376 | ) | (226,111 | ) | 126,735 | ||||||
Financing activities | (8,976 | ) | (1,694 | ) | (7,282 | ) | |||||
Cash flows from operations
Cash provided by operations increased by approximately $2.8 million for the year ended December 31, 2016 and was primarily impacted by:
• | Increase of $63.9 million in net working capital, specifically, the favorable timing of collections. |
• | Offset by $69.3 million decrease in non-cash items of which the net gain related to our divestiture was the most notable item. |
Cash flows from investing
Cash used in financing activities decreased by $126.7 million for the year ended December 31, 2016 and was primarily impacted by:
• | Decreased purchases of marketable securities and acquisitions. |
Cash flows from financing
Cash used in financing activities decreased by $7.3 million for the year ended December 31, 2016 and was primarily impacted by:
• | Higher net borrowings of $29 million. |
• | Share repurchases of $40 million. |
Year ended December 31, 2015, compared to the year ended December 31, 2014
A summary of net cash flows follows (in thousands):
Year ended December 31, | |||||||||||
2015 | 2014 | Change | |||||||||
Net cash provided by (used in): | (As adjusted) | (As adjusted) | |||||||||
Operating activities | $ | 139,822 | $ | 87,321 | $ | 52,501 | |||||
Investing activities | (226,111 | ) | (152,980 | ) | (73,131 | ) | |||||
Financing activities | (1,694 | ) | 237,961 | (239,655 | ) | ||||||
Cash Flows from Operations
Cash provided by operations increased by approximately $52.5 million for the year ended December 31, 2015 and was primarily impacted by:
• | An increase in net income and non-cash items of $29.7 million. |
• | An increase in net working capital of $31.4 million. |
59
Cash flows from investing
Cash used in financing activities increased by $73.1 million for the year ended December 31, 2015 and was primarily impacted by:
• | Approximately $93.5 million related to 2015 acquisitions. |
• | Purchases of property and equipment related to our continued investments in our global information technology and business systems infrastructure. |
Cash flows from financing
Cash used in financing activities decreased by $239.7 million for the year ended December 31, 2015 and was primarily impacted by:
• | The issuance of the 2019 Notes for $230 million. |
• | Decreased proceeds from stock option exercises of approximately $10.1 million. |
We believe that our existing cash and cash equivalents, cash generated from our existing operations, our available credit facilities and other available sources of financing will be sufficient to fund our operations for the next twelve months based on our current business plans.
Effect of Inflation
Although inflation generally affects us by increasing our cost of labor and equipment, we do not believe that inflation has had any material effect on our results of operations during 2016, 2015 and 2014. We do not expect the current rate of inflation to have a material impact on our business.
60
Contractual Obligations
Our contractual commitments consist of obligations under leases for office space, automobiles, convertible debt and its associated interest expense, colocation agreements, computer equipment and furniture and fixtures. The following table summarizes our long‑term contractual obligations as of December 31, 2016 (in thousands).
Payments Due by Period | ||||||||||||||||||||
Less Than | More Than | |||||||||||||||||||
Total | 1 Year | 1—3 Years | 4—5 Years | 5 Years | ||||||||||||||||
Capital lease obligations (1) | $ | 16,836 | $ | 2,464 | $ | 4,642 | $ | 2,574 | $ | 7,156 | ||||||||||
Convertible Senior Notes | 230,000 | — | 230,000 | — | — | |||||||||||||||
Interest (2) | 4,528 | 1,725 | 2,803 | — | — | |||||||||||||||
Contingent consideration obligation (3) | 11,860 | 11,860 | — | — | — | |||||||||||||||
Operating lease obligations | 70,741 | 9,564 | 14,291 | 12,402 | 34,484 | |||||||||||||||
Purchase obligations (4) | 27,762 | 14,327 | 9,969 | 3,466 | — | |||||||||||||||
Other long-term liabilities (5) | 1,742 | 170 | 1,572 | — | — | |||||||||||||||
Total | $ | 363,469 | $ | 40,110 | $ | 263,277 | $ | 18,442 | $ | 41,640 | ||||||||||
__________________________________________________________
(1) | Amount includes the Pennsylvania facility lease and the VCHS data center. |
(2) | Represents the interest on the Convertible Senior Notes. |
(3) | Amount represents the fair value of the contingent consideration obligation of our Razorsight acquisition and is based on actual achievements of financial targets and milestones as of December 31, 2016. |
(4) | Amount represents obligations associated with colocation agreements. |
(5) | Amount represents unrecognized tax positions recorded in our balance sheet. Although the timing of the settlement is uncertain, we believe this amount will be settled within 3 years. |
Recently Issued Accounting Standards
In January 2017, the Financial Accounting Standards Board (“FASB”) issued Accounting Standards Update (“ASU”) 2017-04, Intangibles-Goodwill and Other, Simplifying the Test for Goodwill Impairment, which eliminates Step 2 from the goodwill impairment test. Under the revised test, an entity should perform its annual, or interim, goodwill impairment test by comparing the fair value of a reporting unit with its carrying amount. An entity should recognize an impairment charge for the amount by which the carrying amount exceeds the reporting unit’s fair value; however, the loss recognized should not exceed the total amount of goodwill allocated to that reporting unit. This ASU is effective for any interim or annual impairment tests for fiscal years beginning after December 15, 2019, with early adoption permitted. Management is currently evaluating the impact of the adoption on our consolidated financial statements.
In January 2017, the FASB issued ASU 2017-01, Business Combinations (Topic 805): Clarifying the Definition of a Business, which clarifies the definition of a business with the objective of adding guidance to assist entities with evaluating whether transactions should be accounted for as acquisitions (or disposals) of assets or businesses. ASU 2017-01 is effective for annual reporting periods beginning after December 15, 2017, and interim periods within those years, with early adoption permitted. Management is currently evaluating the impact of the adoption on our consolidated financial statements.
In November 2016, the FASB issued ASU 2016-18, Statement of Cash Flows (Topic 230): Restricted Cash, which amends the guidance in ASC 230, including providing additional guidance related to transfers between cash and restricted cash and how entities present, in their statement of cash flows, the cash receipts and cash payments that directly affect the restricted cash accounts. ASU 2016-18 is effective for annual reporting periods beginning after December 15, 2017, and interim periods within those years, with early adoption permitted. Management is currently evaluating the impact of the adoption on our consolidated financial statements.
In October 2016, the FASB issued ASU 2016-17, Consolidation (Topic 810): Interests Held through Related Parties That Are under Common Control, which amends the consolidation guidance in ASU 2015-02 regarding the treatment of indirect interests held through related parties that are under common control. ASU 2016-17 is effective for annual reporting periods beginning after
61
December 15, 2016, and interim periods within those years, with early adoption permitted. Management is currently evaluating the impact of the adoption on our consolidated financial statements.
In October 2016, the FASB issued ASU 2016-16, “Intra-Entity Transfers of Assets Other Than Inventory,” which requires entities to recognize at the transaction date the income tax effects for intra-entity transfers of assets other than inventory. The standard is effective for interim and annual reporting periods beginning after December 15, 2017, with early adoption permitted. Management is currently evaluating the impact of the adoption on our consolidated financial statements.
In August 2016, the FASB issued ASU 2016-15, “Statement of Cash Flows” (ASU 2016-15). This new guidance will make eight targeted changes to how cash receipts and cash payments are presented and classified in the statement of cash flows. ASU 2016-15 is effective for fiscal years beginning after December 15, 2017. ASU 2016-15 will require adoption on a retrospective basis unless it is impracticable to apply, in which case we would be required to apply the amendments prospectively as of the earliest date practicable. Management is currently evaluating the impact of ASU 2016-15 on our consolidated financial statements.
In June 2016, the FASB issued ASU 2016-13 “Financial Instruments-Credit Losses (Topic 326): Measurement of Credit Losses on Financial Instruments.” The amendments in this update replace the incurred loss impairment methodology in current GAAP with a methodology that reflects expected credit losses and requires consideration of a broader range of reasonable and supportable information to inform credit loss estimates. The ASU is effective for public companies in annual periods beginning after December 15, 2019, and interim periods within those years. Early adoption is permitted beginning after December 15, 2018 and interim periods within those years. Management is currently evaluating the impact of the adoption on our consolidated financial statements.
In February 2016, the FASB issued ASU 2016-02, “Leases (Topic 842).” Under ASU 2016-02, lessees will be required to recognize, for all leases of 12 months or more, a liability to make lease payments and a right-of-use asset representing the right to use the underlying asset for the lease term. Additionally, the guidance requires improved disclosures to help users of financial statements better understand the nature of an entity’s leasing activities. This ASU is effective for public reporting companies for interim and annual periods beginning after December 15, 2018, with early adoption permitted, and must be adopted using a modified retrospective approach. We are in the process of evaluating the effect of the new guidance on our consolidated financial statements and disclosures.
In May 2014, the FASB issued ASU 2014-09, “Revenue from Contracts with Customers,” which requires an entity to recognize the amount of revenue to which it expects to be entitled for the transfer of promised goods or services to customers. The ASU will replace most existing revenue recognition guidance in U.S. GAAP when it becomes effective. In March 2016, the FASB issued ASU 2016-08, “Principal versus Agent Considerations (Reporting Revenue Gross versus Net),” which clarifies the guidance in determining revenue recognition as principal versus agent. In April 2016, the FASB issued ASU 2016-10, “Identifying Performance Obligations and Licensing,” which provides guidance in accounting for immaterial performance obligations and shipping and handling. In May 2016, the FASB issued ASU 2016-12, “Narrow-Scope Improvements and Practical Expedients” which provides clarification on assessing the collectability criterion, presentation of sales taxes, measurement date for non-cash consideration and completed contracts at transition. This ASU also provides a practical expedient for contract modifications. Finally, issued in December 2016, ASU 2016-20 makes minor corrections or minor improvements to the Codification that are not expected to have a significant effect on current accounting practice or create a significant administrative cost to most entities. The new standards are effective for public reporting companies for interim and annual periods beginning after December 15, 2017. The guidance permits two methods of adoption: retrospectively to each prior reporting period presented (full retrospective method), or retrospectively with the cumulative effect of initially applying the guidance recognized at the date of initial application (the cumulative catch-up transition method). Synchronoss has elected to use the modified retrospective transition method, with the cumulative effect of initially applying the guidance recognized at the date of initial application (the cumulative catch-up transition method).
Management is in the process of completing an initial assessment and expects changes to current accounting policy in the following areas:
For certain software license arrangements, we currently use a ratable, or over time, revenue recognition method for software licensing arrangements where vendor specific objective evidence (VSOE) of the maintenance portion of the arrangement does not exist. Under the new standard, we expect the timing of revenue recognition to be accelerated because we anticipate that the license revenue portion will be recognized at a point in time upon software license delivery, consistent with our current accounting policy for software arrangements where we can establish VSOE.
Professional services in certain software and in other consulting services arrangements are recognized over time under a proportional performance method. Under the new standard, professional services must meet one of three defined criteria for professional services to be recognized over time. The three criteria are:
62
◦ | The customer simultaneously receives and consumes the benefits as the Company performs, |
◦ | The customer controls the asset as the Company creates or enhances it, |
◦ | or the Company’s performance does not create an asset for which the entity has an alternative use, and there is a right to payment for performance to date. |
Where contract terms do not qualify for one of the over time criteria, we expect that the timing of revenue recognition for professional services in these contracts would be delayed and recognized at a point in time.
Certain implementation costs and other fulfillment costs, such as direct labor for contract set-up activities, that were previously expensed as incurred will be capitalized and amortized over the contract term and anticipated renewal periods. Capitalizing and amortizing these costs would have these costs recognized over a longer time period.
Our contracts may contain customer options for additional goods and services at stated prices, which may be material rights under the new standards. A material right exists if a contract option provides the customer with a good or service at a discounted price that a similar customer would not otherwise be offered. Under the new standards, material rights are treated as separate performance obligations and are allocated an estimated value. Where contract terms are determined to provide material rights, we expect that some portion the contract price will be allocated to these material rights and recognized in later periods.
At this time, we are not able to reasonably estimate the impact that adoption is expected to have.
In our implementation process, significant activities that are in process are the calculation of the transition adjustment, drafting and approval of new accounting policies, design and implementation of new processes and systems to accommodate the new policies and to compile the information for the enhanced disclosures under the new standards. In addition, internal controls around the new policies, processes and systems need to be designed and implemented.
Impact of New Accounting Pronouncements
In August 2014, the FASB issued ASU No. 2014-15, “Presentation of Financial Statements - Going Concern (Subtopic 205-40): Disclosure of Uncertainties about an Entity’s Ability to Continue as a Going Concern” (ASU 2014-15). ASU 2014-15 is intended to define management’s responsibility to evaluate whether there is substantial doubt about an organization’s ability to continue as a going concern and to provide related footnote disclosures. This ASU provides guidance to an organization’s management, with principles and definitions that are intended to reduce diversity in the timing and content of disclosures that are commonly provided by organizations today in the financial statement footnotes. The amendments are effective for annual periods ending after December 15, 2016, and interim periods within annual periods beginning after December 15, 2016. Early adoption is permitted. Adoption of this guidance, effective December 31, 2016, had no impact on the consolidated financial statements or disclosures.
In March, 2016, the FASB released ASU 2016-09, “Compensation - Stock Compensation (Topic 718): Improvements to Employee Share-Based Payment Accounting.” The ASU includes multiple provisions intended to simplify various aspects of the accounting for share-based payments. While aimed at reducing the cost and complexity of the accounting for share-based payments, the amendments may significantly impact net income, earnings per share, and the statement of cash flows. The ASU is effective for public companies in annual periods beginning after December 15, 2016, and interim periods within those years. Management elected to early adopt this standard in the second quarter ended June 30, 2016.
ASU 2016-09 eliminates the requirement to estimate and apply a forfeiture rate to reduce stock compensation expense during the vesting period and, instead, account for forfeitures as they occur. ASU 2016-09 requires that this change be adopted using the modified retrospective approach. As such, we recorded a cumulative-effect adjustment of $1.0 million to adjust our retained earnings.
Under ASU 2016-09, excess tax benefits related to employee share-based payments are not reclassified from operating activities to financing activities in the statement of cash flows. We applied the effect of ASU 2016-09 to the presentation of excess tax benefits in the statement of cash flows, retrospectively. This change increased the net cash provided by operating activities and decreased net cash provided by financing activities by $5.2 million and $15.1 million for the years ended December 31, 2015 and 2014, respectively.
Under ASU 2016-09, cash paid when withholding shares for tax withholding purposes are classified as a financing activity in the statement of cash flows. ASU 2016-09 requires that this change be adopted retrospectively. The presentation requirements for cash flows related to employee taxes paid for withheld shares increased the net cash provided by operating activities and decreased
63
net cash provided by financing activities by $17.0 million and $1.2 million for the years ended December 31, 2015 and 2014, respectively.
ASU 2016-09 eliminates additional paid in capital ("APIC") pools and requires excess tax benefits and tax deficiencies to be recorded in the income statement when the awards vest or are settled. This increased our effective tax rate for the three months and year ended December 31, 2016 by 1%. The ASU requires that this change be adopted prospectively. We excluded the excess tax benefits from the assumed proceeds available to repurchase shares in our computation of diluted earnings per share for the three months ended December 31, 2016. This increased our diluted weighted average common shares outstanding by 97,800 shares and decreased the diluted weighted average common shares outstanding by 66,363 for the three months and year ended December 31, 2016, respectively.
ASU 2016-09 eliminates the requirement that excess tax benefits be realized (i.e., through a reduction in income taxes payable) before they can be recognized. Previously unrecognized deferred tax assets were recognized on a modified retrospective basis which resulted in a cumulative-effect adjustment to our retained earnings of $0.5 million.
Adoption of the new standard impacted our previously reported quarterly results as follows:
Three Months Ended March 31, 2016, | |||||||
As reported | As adjusted | ||||||
Income statement: | |||||||
Provision for income taxes | $ | (3,965 | ) | $ | (4,588 | ) | |
Cash flows statement: | |||||||
Net cash from operations | $ | 37,731 | $ | 40,489 | |||
Net cash used in financing | (35,253 | ) | (32,495 | ) | |||
Balance sheet: | |||||||
Deferred tax liability | $ | 23,096 | $ | 22,864 | |||
Additional paid-in capital | 535,326 | 536,659 | |||||
Retained earnings | 194,012 | 192,911 | |||||
Management adopted ASU 2015-03, “Interest- Imputation of Interest” (subtopic 835-30); “Simplifying the Presentation of Debt Issuance Costs”, and ASU 2015-15, “Presentation and Subsequent Measurement of Debt Issuance Costs Associate with Line of Credit Arrangements” during the first quarter of 2016, concurrently. The adoption of these ASUs required us to reclassify the deferred financing costs associated with our Convertible Senior Notes from other assets to long-term debt on a retrospective basis. Our consolidated balance sheets included deferred financing costs of $3.7 million and $5.1 million as of December 31, 2016 and December 31, 2015, respectively, which were reclassified from other assets to long-term debt. The debt issuance costs associated with our 2013 Credit Facility and Amended Credit Facility continue to be presented in other assets on the consolidated balance sheets.
Off‑Balance Sheet Arrangements
We had no off-balance sheet arrangements as of and during the years ended December 31, 2016 and December 31, 2015 that have, or are reasonably likely to have, a current or future effect on our financial condition, changes in financial condition, revenues or expenses, results of operations, liquidity, capital expenditures or capital resources that are material to our interests.
64
ITEM 7A. QUANTITATIVE AND QUALITATIVE DISCLOSURES ABOUT MARKET RISK
Market Risk
The following discussion about market risk disclosures involves forward‑looking statements. Actual results could differ materially from those projected in the forward‑looking statements. We deposit our excess cash in what we believe are high‑quality financial instruments, primarily money market funds and certificates of deposit and, we may be exposed to market risks related to changes in interest rates. We do not actively manage the risk of interest rate fluctuations on our marketable securities; however, such risk is mitigated by the relatively short‑term nature of these investments. These investments are denominated in United States dollars.
The primary objective of our investment activities is to preserve our capital for the purpose of funding operations, while at the same time maximizing the income we receive from our investments without significantly increasing risk. To achieve these objectives, our investment policy allows us to maintain a portfolio of cash equivalents and short‑ and long‑term investments in a variety of securities, which could include commercial paper, money market funds and corporate and government debt securities. Our cash, cash equivalents and marketable securities at December 31, 2016 and 2015 were invested in liquid money market accounts, certificates of deposit and government securities. All market‑risk sensitive instruments were entered into for non‑trading purposes.
Foreign Currency Exchange Risk
We are exposed to translation risk because certain of our foreign operations utilize the local currency as their functional currency and those financial results must be translated into U.S dollars. As currency exchange rates fluctuate, translation of the financial statements of foreign businesses into U.S. dollars affects the comparability of financial results between years.
We do not hold any derivative instruments and do not engage in any hedging activities to mitigate foreign currency exchange risk. Although our reporting currency is the U.S. dollar, we may conduct business and incur costs in the local currencies of other countries in which we may operate, make sales and buy materials and services. As a result, we are subject to currency translation risk. Further, changes in exchange rates between foreign currencies and the U.S. dollar could affect our future net sales, cost of sales and expenses and could result in exchange losses.
We cannot accurately predict future exchange rates or the overall impact of future exchange rate fluctuations on our business, results of operations and financial condition. To the extent that our international activities recorded in local currencies increase in the future, our exposure to fluctuations in currency exchange rates will correspondingly increase and hedging activities may be considered if appropriate.
Interest Rate Risk
We are exposed to the risk of interest rate fluctuations on the interest income earned on our cash and cash equivalents. A hypothetical 100 basis point movement in interest rates applicable to our cash and cash equivalents outstanding at December 31, 2016 would increase interest income by less than $0.2 million on an annual basis.
Borrowings under our credit facility, are at variable rates of interest and expose us to interest rate risk. As such, our net income is sensitive to movements in interest rates. If interest rates increase, our debt obligations on the variable rate indebtedness would increase even though the amount borrowed remained the same, and our net income would decrease. Such increases in interest rates could have a material adverse effect on our cash flow and financial condition. We do not hold any derivative instruments and do not engage in any hedging activities to mitigate interest rate risk.
Based on our outstanding borrowings at December 31, 2016, a one-percentage point change in interest rates would have affected interest expense on the debt by $0.3 million on an annualized basis.
65
ITEM 8. FINANCIAL STATEMENTS AND SUPPLEMENTARY DATA
INDEX TO CONSOLIDATED FINANCIAL STATEMENTS
66
Report of Independent Registered Public Accounting Firm
The Board of Directors and Stockholders of
Synchronoss Technologies, Inc.
We have audited the accompanying consolidated balance sheets of Synchronoss Technologies, Inc. as of December 31, 2016 and 2015, and the related consolidated statements of income and comprehensive income, stockholders’ equity, and cash flows for each of the three years in the period ended December 31, 2016. Our audits also included the financial statement schedule listed in the Index at Item 15(a)(2). These financial statements and schedule are the responsibility of the Company’s management. Our responsibility is to express an opinion on these financial statements and schedule based on our audits.
We conducted our audits in accordance with the standards of the Public Company Accounting Oversight Board (United States). Those standards require that we plan and perform the audit to obtain reasonable assurance about whether the financial statements are free of material misstatement. An audit includes examining, on a test basis, evidence supporting the amounts and disclosures in the financial statements. An audit also includes assessing the accounting principles used and significant estimates made by management, as well as evaluating the overall financial statement presentation. We believe that our audits provide a reasonable basis for our opinion.
In our opinion, the financial statements referred to above present fairly, in all material respects, the consolidated financial position of Synchronoss Technologies, Inc. at December 31, 2016 and 2015, and the consolidated results of its operations and its cash flows for each of the three years in the period ended December 31, 2016, in conformity with U.S. generally accepted accounting principles. Also, in our opinion, the related financial statement schedule, when considered in relation to the basic financial statements taken as a whole, presents fairly in all material respects the information set forth therein.
We also have audited, in accordance with the standards of the Public Company Accounting Oversight Board (United States), Synchronoss Technologies, Inc.’s internal control over financial reporting as of December 31, 2016, based on criteria established in Internal Control-Integrated Framework issued by the Committee of Sponsoring Organizations of the Treadway Commission (2013 framework) and our report dated February 27, 2017 expressed an unqualified opinion thereon.
As discussed in Note 2 to the consolidated financial statements, the Company changed its method of accounting for share-based payments in the second quarter ended June 30, 2016.
/s/ Ernst & Young LLP
MetroPark, New Jersey
February 27, 2017
67
SYNCHRONOSS TECHNOLOGIES, INC.
CONSOLIDATED BALANCE SHEETS
(In thousands)
December 31, | |||||||
2016 | 2015 | ||||||
ASSETS | |||||||
Current assets: | |||||||
Cash and cash equivalents | $ | 181,018 | $ | 147,634 | |||
Marketable securities | 12,506 | 66,357 | |||||
Accounts receivable, net of allowance for doubtful accounts of $1,756 and $3,029 at December 31, 2016 and December 31, 2015, respectively | 137,233 | 136,117 | |||||
Prepaid expenses and other assets | 33,696 | 48,127 | |||||
Assets of discontinued operations, current | — | 8,710 | |||||
Total current assets | 364,453 | 406,945 | |||||
Restricted cash | 30,000 | — | |||||
Marketable securities | 2,974 | 19,635 | |||||
Property and equipment, net | 155,599 | 168,280 | |||||
Goodwill | 269,905 | 182,000 | |||||
Intangible assets, net | 203,864 | 174,322 | |||||
Deferred tax assets | 1,503 | 3,560 | |||||
Other assets | 7,541 | 10,350 | |||||
Note receivable from related party | 83,000 | — | |||||
Equity method investment | 45,890 | — | |||||
Assets of discontinued operations, non-current | — | 45,136 | |||||
Total assets | $ | 1,164,729 | $ | 1,010,228 | |||
LIABILITIES AND STOCKHOLDERS’ EQUITY | |||||||
Current liabilities: | |||||||
Accounts payable | $ | 15,770 | $ | 26,038 | |||
Accrued expenses | 69,435 | 45,819 | |||||
Deferred revenues | 27,542 | 8,323 | |||||
Contingent consideration obligation | 11,860 | — | |||||
Short term debt | 29,000 | — | |||||
Total current liabilities | 153,607 | 80,180 | |||||
Lease financing obligation - long term | 12,121 | 13,343 | |||||
Contingent consideration obligation - long-term | — | 930 | |||||
Convertible debt | 226,291 | 224,878 | |||||
Deferred tax liability 1 | 49,822 | 16,404 | |||||
Deferred revenues | 12,134 | 559 | |||||
Other liabilities | 3,783 | 2,668 | |||||
Redeemable noncontrolling interest | 49,856 | 61,452 | |||||
Stockholders’ equity: | |||||||
Preferred stock, $0.0001 par value; 10,000 shares authorized, 0 shares issued and outstanding at December 31, 2016 and December 31, 2015 | — | — | |||||
Common stock, $0.0001 par value; 100,000 shares authorized, 49,317 and 48,084 shares issued; 45,323 and 44,405 outstanding at December 31, 2016 and December 31, 2015, respectively | 5 | 4 | |||||
Treasury stock, at cost (3,994 and 3,679 shares at December 31, 2016 and December 31, 2015, respectively) | (95,183 | ) | (65,651 | ) | |||
Additional paid-in capital 1 | 575,093 | 512,802 | |||||
Accumulated other comprehensive loss | (43,253 | ) | (38,684 | ) | |||
Retained earnings 1 | 220,453 | 201,343 | |||||
Total stockholders’ equity | 657,115 | 609,814 | |||||
Total liabilities and stockholders’ equity | $ | 1,164,729 | $ | 1,010,228 | |||
1See Note 2 for discussion of the adoption of ASU 2016-09.
See accompanying notes to consolidated financial statements.
68
SYNCHRONOSS TECHNOLOGIES, INC.
CONSOLIDATED STATEMENTS OF INCOME
(In thousands, except per share data)
Year Ended December 31, | |||||||||||
2016 | 2015 | 2014 | |||||||||
Net revenues | $ | 476,750 | $ | 428,117 | $ | 307,301 | |||||
Costs and expenses: | |||||||||||
Cost of services* | 194,198 | 155,287 | 102,386 | ||||||||
Research and development | 106,681 | 91,430 | 73,620 | ||||||||
Selling, general and administrative | 131,106 | 88,411 | 77,081 | ||||||||
Net change in contingent consideration obligation | 10,930 | 760 | 1,799 | ||||||||
Restructuring charges | 6,333 | 4,946 | — | ||||||||
Depreciation and amortization | 99,311 | 72,152 | 55,956 | ||||||||
Total costs and expenses | 548,559 | 412,986 | 310,842 | ||||||||
(Loss) income from continuing operations | (71,809 | ) | 15,131 | (3,541 | ) | ||||||
Interest income | 2,428 | 2,047 | 1,265 | ||||||||
Interest expense | (7,013 | ) | (5,711 | ) | (3,430 | ) | |||||
Other income (expense), net | 1,863 | 372 | 441 | ||||||||
(Loss) income from continuing operations, before taxes | (74,531 | ) | 11,839 | (5,265 | ) | ||||||
Provision for income taxes 1 | 7,990 | (5,424 | ) | 3,242 | |||||||
Net (loss) income from continuing operations | (66,541 | ) | 6,415 | (2,023 | ) | ||||||
Net income from discontinued operations, net of taxes | 74,533 | 40,267 | 40,918 | ||||||||
Net income | 7,992 | 46,682 | 38,895 | ||||||||
Net (loss) income attributable to noncontrolling interests | (11,596 | ) | 6,052 | — | |||||||
Net income attributable to Synchronoss | $ | 19,588 | $ | 40,630 | $ | 38,895 | |||||
Basic † | |||||||||||
Continuing operations | $ | (1.26 | ) | $ | 0.01 | $ | (0.05 | ) | |||
Discontinued operations | 1.71 | 0.95 | 1.01 | ||||||||
$ | 0.45 | $ | 0.96 | $ | 0.96 | ||||||
Diluted † | |||||||||||
Continuing operations | $ | (1.26 | ) | $ | 0.01 | $ | (0.05 | ) | |||
Discontinued operations | 1.71 | 0.95 | 1.01 | ||||||||
$ | 0.45 | $ | 0.96 | $ | 0.96 | ||||||
Weighted-average common shares outstanding: | |||||||||||
Basic † | 43,571 | 42,284 | 40,418 | ||||||||
Diluted † | 43,571 | 42,284 | 40,418 | ||||||||
__________________________________________________________
* | Cost of services excludes depreciation and amortization which is shown separately. |
† | See notes to financial statement footnote 2. |
1 See Note 2 for discussion of the adoption of ASU 2016-09.
See accompanying notes to consolidated financial statements
69
SYNCHRONOSS TECHNOLOGIES, INC.
CONSOLIDATED STATEMENTS OF COMPREHENSIVE INCOME
(In thousands)
Year Ended December 31, | |||||||||||
2016 | 2015 | 2014 | |||||||||
Net income attributable to Synchronoss | $ | 19,588 | $ | 40,630 | $ | 38,895 | |||||
Other comprehensive income (loss), net of tax: | |||||||||||
Foreign currency translation adjustments | (4,042 | ) | (17,281 | ) | (12,739 | ) | |||||
Unrealized gain (loss) on securities | 198 | (54 | ) | (176 | ) | ||||||
Net loss on intra-entity foreign currency transactions | (725 | ) | (1,335 | ) | (6,376 | ) | |||||
Total other comprehensive loss | (4,569 | ) | (18,670 | ) | (19,291 | ) | |||||
Total comprehensive income attributable to Synchronoss | $ | 15,019 | $ | 21,960 | $ | 19,604 | |||||
See accompanying notes to consolidated financial statements.
70
SYNCHRONOSS TECHNOLOGIES, INC.
CONSOLIDATED STATEMENTS OF STOCKHOLDERS’ EQUITY
(In thousands)
Additional Paid-In Capital | Accumulated Other Comprehensive Income (Loss) | Retained Earnings | Total Stockholders' Equity | ||||||||||||||||||||||||||
Common Stock | Treasury Stock | ||||||||||||||||||||||||||||
Shares | Amount | Shares | Amount | ||||||||||||||||||||||||||
Balance at December 31, 2013 | 44,456 | $ | 4 | (3,793 | ) | $ | (67,104 | ) | $ | 393,644 | $ | (723 | ) | $ | 121,818 | $ | 447,639 | ||||||||||||
Stock based compensation | — | — | — | — | 9,992 | — | — | 9,992 | |||||||||||||||||||||
Issuance of restricted stock | 765 | — | — | — | 18,353 | — | — | 18,353 | |||||||||||||||||||||
Issuance of common stock on exercise of options | 1,223 | — | — | — | 30,003 | — | — | 30,003 | |||||||||||||||||||||
ESPP compensation | — | — | — | — | 642 | — | — | 642 | |||||||||||||||||||||
Sale of Treasury Stock in connection with an employee stock purchase plan | — | — | 60 | 768 | 909 | — | — | 1,677 | |||||||||||||||||||||
Net income attributable to Synchronoss | — | — | — | — | — | — | 38,895 | 38,895 | |||||||||||||||||||||
Total other comprehensive income (loss) | — | — | — | — | — | (19,291 | ) | — | (19,291 | ) | |||||||||||||||||||
Tax benefit from stock option exercise | — | — | — | — | 1,197 | — | — | 1,197 | |||||||||||||||||||||
Balance at December 31, 2014 | 46,444 | $ | 4 | (3,733 | ) | $ | (66,336 | ) | $ | 454,740 | $ | (20,014 | ) | $ | 160,713 | $ | 529,107 | ||||||||||||
Stock based compensation | — | — | — | — | 8,495 | — | — | 8,495 | |||||||||||||||||||||
Issuance of restricted stock | 761 | — | — | — | 22,592 | — | — | 22,592 | |||||||||||||||||||||
Issuance of common stock on exercise of options | 879 | — | — | — | 19,936 | — | — | 19,936 | |||||||||||||||||||||
ESPP compensation | — | — | — | — | 624 | — | — | 624 | |||||||||||||||||||||
Sale of Treasury Stock in connection with an employee stock purchase plan | — | — | 54 | 685 | 1,217 | — | — | 1,902 | |||||||||||||||||||||
Net income attributable to Synchronoss | — | — | — | — | — | — | 40,630 | 40,630 | |||||||||||||||||||||
Total other comprehensive income (loss) | — | — | — | — | — | (18,670 | ) | — | (18,670 | ) | |||||||||||||||||||
Tax benefit from stock option exercise | — | — | — | — | 5,198 | — | — | 5,198 | |||||||||||||||||||||
Balance at December 31, 2015 | 48,084 | $ | 4 | (3,679 | ) | $ | (65,651 | ) | $ | 512,802 | $ | (38,684 | ) | $ | 201,343 | $ | 609,814 | ||||||||||||
Cumulative effect adjustment to RE's | — | — | — | — | 710 | — | (478 | ) | 232 | ||||||||||||||||||||
Balance at Balance at January 1, 2016 | 48,084 | $ | 4 | (3,679 | ) | $ | (65,651 | ) | $ | 513,512 | $ | (38,684 | ) | $ | 200,865 | $ | 610,046 | ||||||||||||
Stock-based compensation | — | — | — | — | 7,778 | — | — | 7,778 | |||||||||||||||||||||
Issuance of restricted stock | 605 | — | — | — | 25,384 | — | — | 25,384 | |||||||||||||||||||||
Issuance of common stock on exercise of options | 608 | 1 | — | — | 13,912 | — | — | 13,913 | |||||||||||||||||||||
ESPP compensation | — | — | — | — | 817 | — | — | 817 | |||||||||||||||||||||
Issuance of common stock related to acquisition | — | — | 840 | 9,244 | 12,756 | — | — | 22,000 | |||||||||||||||||||||
Issuance of common stock to a subsidiary | 20 | — | — | — | — | — | — | — | |||||||||||||||||||||
Repurchase of treasury shares | — | — | (1,263 | ) | (40,025 | ) | — | — | — | (40,025 | ) | ||||||||||||||||||
Sale of Treasury Stock in connection with an employee stock purchase plan | — | — | 108 | 1,249 | 934 | — | — | 2,183 | |||||||||||||||||||||
Net income attributable to Synchronoss | — | — | — | — | — | — | 19,588 | 19,588 | |||||||||||||||||||||
Total other comprehensive loss | — | — | — | — | — | (4,569 | ) | — | (4,569 | ) | |||||||||||||||||||
Balance at Balance at December 31, 2016 | 49,317 | $ | 5 | (3,994 | ) | $ | (95,183 | ) | $ | 575,093 | $ | (43,253 | ) | $ | 220,453 | $ | 657,115 | ||||||||||||
71
See accompanying notes to consolidated financial statements.
72
SYNCHRONOSS TECHNOLOGIES, INC.
CONSOLIDATED STATEMENTS OF CASH FLOWS
(In thousands)
Year Ended Year ended December 31, | |||||||||||
2016 | 2015 | 2014 | |||||||||
Operating activities: | (As Adjusted) | (As Adjusted) | |||||||||
Net income | $ | 7,992 | $ | 46,682 | $ | 38,895 | |||||
Adjustments to reconcile net income to net cash provided by operating activities: | |||||||||||
Depreciation and amortization expense | 99,311 | 72,152 | 55,956 | ||||||||
Amortization of debt issuance costs | 1,607 | 1,501 | 618 | ||||||||
(Gain) loss on disposals | (952 | ) | 16 | 33 | |||||||
Gain on discontinued operations | (95,311 | ) | — | — | |||||||
Amortization of bond premium | 1,416 | 1,705 | 384 | ||||||||
Deferred income taxes | 32,826 | 8,319 | 3,207 | ||||||||
Non-cash interest on leased facility | 1,111 | 924 | 946 | ||||||||
Stock-based compensation | 33,979 | 31,711 | 28,987 | ||||||||
Contingent consideration obligation | 10,930 | (772 | ) | 3,532 | |||||||
Changes in operating assets and liabilities: | |||||||||||
Accounts receivable, net of allowance for doubtful accounts | (1,662 | ) | (27,577 | ) | (50,924 | ) | |||||
Prepaid expenses and other current assets 1 | 12,644 | (8,543 | ) | (14,660 | ) | ||||||
Other assets | 10,054 | (4,282 | ) | (1,930 | ) | ||||||
Accounts payable | (11,139 | ) | 6,185 | 4,169 | |||||||
Accrued expenses 1 | 22,024 | 16,333 | 16,402 | ||||||||
Other liabilities | (6,558 | ) | (402 | ) | 5,825 | ||||||
Deferred revenues | 24,317 | (4,130 | ) | (4,119 | ) | ||||||
Net cash provided by operating activities | 142,589 | 139,822 | 87,321 | ||||||||
Investing activities: | |||||||||||
Purchases of fixed assets | (58,542 | ) | (59,960 | ) | (73,885 | ) | |||||
Purchases of intangible assets | — | (1,200 | ) | — | |||||||
Purchases of marketable securities available-for-sale | (13,445 | ) | (139,569 | ) | (50,275 | ) | |||||
Maturities of marketable securities available-for-sale | 82,904 | 106,210 | 9,265 | ||||||||
Change in restricted cash | (30,000 | ) | — | — | |||||||
Proceeds from the sale of discontinued operations | 18,135 | — | — | ||||||||
Businesses acquired, net of cash | (98,428 | ) | (131,592 | ) | (38,085 | ) | |||||
Net cash used in investing activities | (99,376 | ) | (226,111 | ) | (152,980 | ) | |||||
Financing activities: | |||||||||||
Proceeds from the exercise of stock options | 13,912 | 19,936 | 30,003 | ||||||||
Taxes paid on withholding shares 1 | (8,885 | ) | (17,043 | ) | (15,139 | ) | |||||
Payments on contingent consideration obligation | — | (4,468 | ) | — | |||||||
Debt issuance costs | (1,346 | ) | — | (7,065 | ) | ||||||
Proceeds from issuance of convertible notes | — | — | 230,000 | ||||||||
Borrowings on revolving line of credit | 144,000 | — | 40,000 | ||||||||
Repayment of revolving line of credit | (115,000 | ) | — | (40,000 | ) | ||||||
Repurchases of common stock | (40,025 | ) | — | — | |||||||
Proceeds from the sale of treasury stock in connection with an employee stock purchase plan | 2,183 | 1,902 | 1,677 | ||||||||
Repayments of capital lease obligations | (3,815 | ) | (2,021 | ) | (1,515 | ) | |||||
Net cash (used in) provided by financing activities | (8,976 | ) | (1,694 | ) | 237,961 | ||||||
Effect of exchange rate changes on cash | (853 | ) | (350 | ) | 153 | ||||||
Net increase (decrease) in cash and cash equivalents | 33,384 | (88,333 | ) | 172,455 | |||||||
Cash and cash equivalents at beginning of period | 147,634 | 235,967 | 63,512 | ||||||||
Cash and cash equivalents at end of period | $ | 181,018 | $ | 147,634 | $ | 235,967 | |||||
Supplemental disclosures of cash flow information: | |||||||||||
Cash paid for income taxes | $ | 4,661 | $ | 29,868 | $ | 19,342 | |||||
Cash paid for interest | $ | 6,981 | $ | 5,791 | $ | 2,290 | |||||
Supplemental disclosures of non-cash investing and financing activities: | |||||||||||
Issuance of common stock in connection with Openwave acquisition | $ | 22,000 | $ | — | $ | — | |||||
1See Note 2 for discussion of the adoption of ASU 2016-09.
See accompanying notes to consolidated financial statements.
73
SYNCHRONOSS TECHNOLOGIES, INC.
NOTES TO CONSOLIDATED FINANCIAL STATEMENTS
(Amounts in tables in thousands, except for per share data or unless otherwise noted)
1. | Description of Business |
General
Synchronoss is a global software and services company that provides essential technologies for the mobile transformation of business. The Company's portfolio, which is targeted at the Consumer and Enterprise markets, contains offerings such as personal cloud, secure-mobility, identity management and scalable messaging platforms, products and solutions. These essential technologies create a better way of delivering the transformative mobile experiences that service providers and enterprises need to help them stay ahead of the curve in competition, innovation, productivity, growth and operational efficiency.
Synchronoss' products and platforms are designed to be carrier-grade, flexible and scalable, enabling multiple converged communication services to be managed across a range of distribution channels including e-commerce, m-commerce, telesales, customer stores, indirect and other retail outlets. This business model allows the Company to meet the rapidly changing converged services and connected devices offered by their customers. Synchronoss' products, platforms and solutions enable its enterprise and service provider customers to acquire, retain and service subscribers and employees quickly, reliably and cost-effectively with white label and custom-branded solutions. Synchronoss customers can simplify the processes associated with managing the customer experience for procuring, activating, connecting, backing-up, synchronizing and sharing/collaboration with connected devices and contents from these devices and associated services. The extensibility, scalability, reliability and relevance of the Company's platforms enable new revenue streams and retention opportunities for their customers through new subscriber acquisitions, sale of new devices, accessories and new value-added service offerings in the Cloud, including the services offered by Intralinks, which the Company acquired in January 2017. By using the Company's technologies, Synchronoss customers can optimize their cost of operations while enhancing their customer experience.
The Company currently operates in and markets their solutions and services directly through their sales organizations in North America, Europe, the Middle East and Africa or EMEA, Latin America and the Asia-Pacific region. Synchronoss delivers essential technologies for mobile transformation to two primary types of customers: service provider and enterprise customers in regulated verticals and use cases.
Service Providers, Retailers, OEMs, Re-sellers and Service Integrators
These products and platforms provide end-to-end seamless integration between customer-facing channels/applications, communication services, or devices and “back-office” infrastructure-related systems and processes. Synchronoss' customers rely on their solutions and technology to automate the process of activation and content and settings management for their subscribers’ devices while delivering additional communication services. Synchronoss' portfolio includes: cloud-based sync, backup, storage and content engagement capabilities, broadband connectivity solutions, analytics, white label messaging, identity/access management that enable communications service providers or CSPs, cable operators/multi-services operators, or MSOs and original equipment manufacturers, or OEMs with embedded connectivity (e.g. smartphones, laptops, tablets and mobile internet devices or MIDs, such as automobiles, wearables for personal health and wellness, and connected homes), multi-channel retailers, as well as other customers to accelerate and monetize value-add services for secure and broadband networks and connected devices.
74
SYNCHRONOSS TECHNOLOGIES, INC.
NOTES TO CONSOLIDATED FINANCIAL STATEMENTS (Continued)
(Amounts in tables in thousands, except for per share data or unless otherwise noted)
2. Summary of Significant Accounting Policies
Basis of Presentation and Consolidation
The consolidated financial statements include the accounts of the Company, its wholly‑owned subsidiaries and variable interest entities (VIE) in which the Company is the primary beneficiary and entities in which the Company has a controlling interest. Investments in less than majority-owned companies in which the Company does not have a controlling interest, but does have significant influence, are accounted for as equity method investments. All material intercompany transactions and accounts are eliminated in consolidation. Certain prior year amounts have been reclassified to conform to the current year's presentation.
Use of Estimates
The preparation of financial statements in conformity with U.S. generally accepted accounting principles (GAAP) requires management to make estimates and assumptions that affect the reported amounts of assets and liabilities, the disclosure of contingent assets and liabilities at the date of the financial statements and the reported amounts of revenues and expenses during the reporting periods. Actual results could differ from those estimates.
Revenue Recognition and Deferred Revenue
The Company provides services principally on a transactional or subscription basis or, at times, on a fixed fee basis and recognizes the revenues as the services are performed or delivered as described below:
Transactional and Subscription Service Arrangements: Transaction and subscription revenues consist of revenues derived from the processing of transactions through the Company’s service platforms, providing enterprise portal management services on a subscription basis and maintenance agreements on software licenses. Transaction service arrangements include services such as processing equipment orders, new account set‑up and activation, number port requests, credit checks and inventory management. Subscription services include monthly active user fees, software as a service (“SaaS”) fees, hosting and storage and the related maintenance support for those services.
Transaction revenues are principally based on a contractual price per transaction and are recognized based on the number of transactions processed during each reporting period. Revenues are recorded based on the total number of transactions processed at the applicable price established in the relevant contract. The total amount of revenues recognized is based primarily on the volume of transactions. Subscription revenues are recorded one of two ways: on a straight‑line basis over the life of the contract or on a fixed monthly fee based on a set contracted amount.
Many of the Company’s contracts guarantee minimum volume transactions from the customer. In these instances, if the customer’s total transaction volume for the period is less than the contractual amount, the Company records revenues at the minimum guaranteed amount. At times, transaction revenues may also include billings to customers that reimburse the Company based on the number of individuals dedicated to processing transactions. Set‑up fees for transactional service arrangements are deferred and recognized on a straight‑line basis over the life of the contract since these amounts would not have been paid by the customer without the related transactional service arrangement. Revenues are presented net of discounts, which are volume level driven, or credits, which are performance driven, and are determined in the period in which the volume thresholds are met or the services are provided.
Professional Service and Software License Arrangements: Professional services include process and workflow consulting services and development services. Professional services when sold with transactional or subscription service arrangements are accounted for separately when the professional services have value to the customer on a standalone basis and there is objective and reliable evidence of fair value of the professional services. When accounted for separately, professional service revenues are recognized as services are performed and all other elements of revenue recognition have been satisfied.
In determining whether professional service revenues can be accounted for separately from transaction or subscription service revenues, the Company considers the following factors for each professional services agreement: availability of the professional services from other vendors, whether objective and reliable evidence of fair value exists of the undelivered elements, the nature of the professional services, the timing of when the professional services contract was signed in comparison to the transaction or
75
SYNCHRONOSS TECHNOLOGIES, INC.
NOTES TO CONSOLIDATED FINANCIAL STATEMENTS (Continued)
(Amounts in tables in thousands, except for per share data or unless otherwise noted)
subscription service start date and the contractual independence of the transactional or subscription service from the professional services.
If a professional service arrangement were not to qualify for separate accounting, the Company would recognize the professional service revenues ratably over the remaining term of the transaction or subscription agreement.
Revenue from software license arrangements is recognized when the license is delivered to its customers and all of the software revenue recognition criteria are met. When software arrangements include multiple elements, the arrangement consideration is allocated at the inception to all deliverables using the residual method providing the Company has vendor specific objective evidence (VSOE) on all undelivered elements. The Company determines VSOE for each element based on historical stand‑alone sales to third parties.
When transaction or subscription service arrangements, include multiple elements, the arrangement consideration is allocated at the inception of an arrangement to all deliverables using the relative selling price method. The relative selling price method allocates any discount in the arrangement proportionally to each deliverable on the basis of each deliverable’s selling price. The selling price used for each deliverable will be based on VSOE if available, third‑party evidence (TPE) if vendor‑specific objective evidence is not available, or estimated selling price (ESP) if neither vendor‑specific objective evidence nor third‑party evidence is available. The objective of ESP is to determine the price at which the Company would transact a sale if the product or service were sold on a stand‑alone basis. The Company determines ESP by considering multiple factors including, but not limited to, geographies, market conditions, competitive landscape, internal costs, gross margin objectives, and pricing practices. ESP is generally used for offerings that are not typically sold on a stand‑alone basis or for new or highly customized offerings.
While the Company follows specific and detailed rules and guidelines related to revenue recognition, it makes and uses management judgments and estimates in connection with the revenue recognized in any reporting period, particularly in the areas described above, as well as collectability. If management made different estimates or judgments, differences in the timing of the recognition of revenue could occur.
Deferred Revenue: Deferred revenues primarily represent billings to customers for services in advance of the performance of services, with revenues recognized as the services are rendered, and also includes the fair value of deferred revenues recorded as a result of acquisitions.
Service Level Standards
Pursuant to certain contracts, the Company is subject to service level standards and to corresponding penalties for failure to meet those standards. All performance‑related penalties are reflected as a corresponding reduction of the Company’s revenues. These penalties, if applicable, are recorded in the month incurred and were insignificant for the years ended December 31, 2016, 2015 and 2014, respectively.
Cost of Services
Cost of services includes all direct materials, direct labor and those indirect costs related to revenues such as indirect labor, materials and supplies and facilities cost, exclusive of depreciation expense.
Research and Development
Research and development costs are expensed as incurred, unless they meet U.S. GAAP criteria for deferral and amortization. Software development costs incurred prior to the establishment of technological feasibility do not meet these criteria, and are expensed as incurred. The Company includes capitalized software development costs in intangible assets on the consolidated balance sheets. Amortization of software development costs is computed using the straight‑line method over the estimated useful lives of the assets, 3 and 5 years. Research and development expense consists primarily of costs related to personnel, including salaries and other personnel‑related expenses, consulting fees and the cost of facilities, computer and support services used in service technology development. The Company also expenses costs relating to developing modifications and minor enhancements of its existing technology and services.
76
SYNCHRONOSS TECHNOLOGIES, INC.
NOTES TO CONSOLIDATED FINANCIAL STATEMENTS (Continued)
(Amounts in tables in thousands, except for per share data or unless otherwise noted)
The unamortized software development costs and amortization expense were as follows:
Year ended December 31, | |||||||||||
2016 | 2015 | 2014 | |||||||||
Unamortized software development costs | $ | 19,417 | $ | 6,071 | $ | 6,106 | |||||
Software development amortization expense | $ | 2,235 | $ | 1,951 | $ | 837 | |||||
Concentration of Credit Risk
The Company’s financial instruments that are exposed to concentration of credit risk consist primarily of cash and cash equivalents, marketable securities and accounts receivable. The Company maintains its cash and cash equivalents at several major financial institutions. The Company has not experienced any realized losses in such accounts and believes it is not exposed to any significant credit risk related to cash, cash equivalents and securities. The Company’s cash equivalents and short‑term marketable securities consist primarily of money market funds, certificates of deposit, commercial paper, and municipal and corporate bonds. The Company believes that concentration of credit risk with respect to accounts receivable is limited because of the creditworthiness of the Company’s major customers.
AT&T and Verizon Wireless in the aggregate accounted for 62%, 71% and 67% of net revenues for 2016, 2015 and 2014, respectively. AT&T and Verizon accounted for 64% and 57% of accounts receivable at December 31, 2016 and 2015, respectively. The loss of either AT&T or Verizon as a customer would have a material negative impact on the Company. The Company believes that if either AT&T or Verizon terminated their relationships with Synchronoss, they would encounter substantial costs in replacing Synchronoss’ solutions.
Cash and Cash Equivalents
The Company considers all highly liquid investments purchased with a maturity of three months or less at the date of acquisition to be cash equivalents.
Restricted Cash
The restricted cash balance is held in escrow to cover certain conditions that existed at the closing of the carrier activation business divestiture. The escrow funds will be released upon the assigned contracts meeting certain minimum revenue thresholds.
Fair Value of Financial Instruments and Liabilities
The Company includes disclosures of fair value information about financial instruments and liabilities, whether or not recognized on the balance sheet, for which it is practicable to estimate that value. Due to their short‑term nature, the carrying amounts reported in the financial statements approximate the fair value for cash and cash equivalents, marketable securities, accounts receivable and accounts payable.
Marketable Securities
Marketable securities consist of fixed income investments with a maturity of greater than three months and enhanced money market funds. These investments are classified as available‑for‑sale and are reported at fair value on the Company’s balance sheet. The Company classifies its securities with maturity dates of 12 months or more as long term. Unrealized holding gains and losses are reported within accumulated other comprehensive loss as a separate component of stockholders’ equity. If a decline in the fair value of a marketable security below the Company’s cost basis is determined to be other than temporary, such marketable security is written down to its estimated fair value as a new cost basis and the amount of the write‑down is included in earnings as an impairment charge. The Company has recorded temporary changes in fair value of the marketable securities but has not recorded other‑than‑temporary charges for the periods presented herein.
77
SYNCHRONOSS TECHNOLOGIES, INC.
NOTES TO CONSOLIDATED FINANCIAL STATEMENTS (Continued)
(Amounts in tables in thousands, except for per share data or unless otherwise noted)
Accounts Receivable and Allowance for Doubtful Accounts
Accounts receivable consist of amounts due to the Company from normal business activities. The Company maintains an allowance for estimated losses resulting from the inability of its customers to make required payments. The Company estimates uncollectible amounts based upon historical bad debts, current customer receivable balances, the age of customer receivable balances, the customer’s financial condition and current economic trends.
Property and Equipment
Property and equipment and leasehold improvements are stated at cost, net of accumulated depreciation. Depreciation is computed using the straight‑line method over the estimated useful lives of the assets, which range from 3 to 5 years, or the lesser of the related initial term of the lease or useful life for leasehold improvements. Amortization of property and equipment recorded under a capital lease is included with depreciation expense. Expenditures for routine maintenance and repairs are charged against operations. Major replacements, improvements and additions are capitalized.
Noncontrolling Interest
Noncontrolling interests ("NCI") are evaluated by the Company and are shown as either a liability, temporary equity (shown between liabilities and equity) or as permanent equity depending on the nature of the redeemable features at amounts based on formulas specific to each entity. Generally, mandatorily redeemable NCI's are classified as liabilities and non-mandatorily redeemable NCI's are classified outside of stockholders' equity in the consolidated balance sheets as temporary equity under the caption, redeemable noncontrolling interests, and are measured at their redemption values at the end of each period. If the redemption value is greater than the carrying value, an adjustment is recorded in retained earnings to record the NCI at its redemption value. Redeemable NCI’s that are mandatorily redeemable are classified as a liability in the consolidated balance sheets under either other current liabilities or other long-term liabilities, depending on the remaining duration until settlement, and are measured at the amount of cash that would be paid if settlement occurred at the balance sheet date with any change from the prior period recognized as interest expense.
If the noncontrolling interest is not currently redeemable yet probable of becoming redeemable, the Company is required to either (1) accrete changes in the redemption value over the period from the date of issuance to the earliest redemption date of the instrument using an appropriate methodology, usually the interest method, or (2) recognize changes in the redemption value immediately as they occur and adjust the carrying value of the security to equal the redemption value at the end of each reporting period. The Company has elected to recognize changes in the redemption value immediately as they occur and adjust the carrying value of the noncontrolling interest to the greater of the estimated redemption value, which approximates fair value, at the end of each reporting period or the initial carrying amount.
Net income attributable to NCI’s reflects the portion of the net income (loss) of consolidated entities applicable to the NCI stockholders in the accompanying consolidated statements of income. The net income attributable to NCI is classified in the consolidated statements of income as part of consolidated net income and deducted from total consolidated net income to arrive at the net income attributable to the Company.
78
SYNCHRONOSS TECHNOLOGIES, INC.
NOTES TO CONSOLIDATED FINANCIAL STATEMENTS (Continued)
(Amounts in tables in thousands, except for per share data or unless otherwise noted)
Business Combinations
The Company accounts for business combinations in accordance with the acquisition method. The acquisition method of accounting requires that assets acquired, liabilities assumed and any noncontrolling interest in the aquiree (if any) be recorded at their fair values on the date of a business acquisition. The Company’s consolidated financial statements and results of operations reflect an acquired business from the completion date of an acquisition.
The judgments that the Company makes in determining the estimated fair value assigned to each class of assets acquired and liabilities assumed, as well as asset lives, can materially impact net income in periods following a business combination. The Company generally uses either the income, cost or market approach to aid in its conclusions of such fair values and asset lives. The income approach presumes that the value of an asset can be estimated by the net economic benefit to be received over the life of the asset, discounted to present value. The cost approach presumes that an investor would pay no more for an asset than its replacement or reproduction cost. The market approach estimates value based on what other participants in the market have paid for reasonably similar assets. Although each valuation approach is considered in valuing the assets acquired, the approach ultimately selected is based on the characteristics of the asset and the availability of information.
The Company records contingent consideration resulting from a business combination at its fair value on the acquisition date. Each reporting period thereafter, the Company revalues these obligations and records increases or decreases in their fair value as an adjustment to net change in contingent consideration obligation within the consolidated statement of income. Changes in the fair value of the contingent consideration obligation can result from updates in the achievement of financial targets and changes to the weighted probability of achieving those future financial targets. Significant judgment is employed in determining the appropriateness of these assumptions as of the acquisition date and for each subsequent period. Accordingly, any change in the assumptions described above, could have a material impact on the amount of the net change in contingent consideration obligation that the Company records in any given period.
Discontinued Operations
The Company generally classifies a disposal transaction as discontinued operation in the consolidated financial statements when it qualifies as a component of the Company, meets the held for sale criteria, is disposed of by sale, or is disposed of other than by sale and it represents a strategic shift that has a major effect on the Company's operations and financial results.
Investments in Affiliates and Other Entities
In the normal course of business, Synchronoss enters into various types of investment arrangements, each having unique terms and conditions. These investments may include equity interests held by Synchronoss in business entities, including general or limited partnerships, contractual joint ventures, or other forms of equity participation. Synchronoss determines whether such investments involve a VIE based on the characteristics of the subject entity. If the entity is determined to be a VIE, then management determines if Synchronoss is the primary beneficiary of the entity and whether or not consolidation of the VIE is required. The primary beneficiary consolidating the VIE must normally have both (i) the power to direct the activities of a VIE that most significantly affect the VIE’s economic performance and (ii) the obligation to absorb losses of the VIE or the right to receive benefits from the VIE, in either case that could potentially be significant to the VIE. When Synchronoss is deemed to be the primary beneficiary, the VIE is consolidated and the other party’s equity interest in the VIE is accounted for as a noncontrolling interest.
The Company generally accounts for investments it makes in VIEs in which it has determined that it does not have a controlling financial interest but has significant influence over and holds at least a 20% ownership interest using the equity method. Any such investment not meeting the parameters to be accounted under the equity method would be accounted for using the cost method unless the investment had a readily determinable fair value, at which it would then be reported.The Company utilizes a 1 month reporting lag in recording equity income from equity method investments.
If an entity fails to meet the characteristics of a VIE, the Company then evaluates such entity under the voting model. Under the voting model, the Company consolidates the entity if they determine that they, directly or indirectly, have greater than 50% of the voting shares, and determine that other equity holders do not have substantive participating rights.
79
SYNCHRONOSS TECHNOLOGIES, INC.
NOTES TO CONSOLIDATED FINANCIAL STATEMENTS (Continued)
(Amounts in tables in thousands, except for per share data or unless otherwise noted)
Goodwill
Goodwill represents the excess of the purchase price over the fair value of assets acquired, including other definite‑lived intangible assets. Goodwill is not amortized, but reviewed annually for impairment or upon the occurrence of events or changes in circumstances that would more likely than not reduce the fair value of the reporting unit below its carrying amount. There were no impairment charges recognized during the years ended December 31, 2016, 2015 and 2014.
Impairment of Long‑Lived Assets
A review of long‑lived assets for impairment is performed when events or changes in circumstances indicate that the carrying value of such assets may not be recoverable. If an indication of impairment is present, the Company compares the estimated undiscounted future cash flows to be generated by the asset to the asset’s carrying amount. If the undiscounted future cash flows are less than the carrying amount of the asset, the Company records an impairment loss equal to the amount by which the asset’s carrying amount exceeds its fair value. The fair value is determined based on valuation techniques such as a comparison to fair values of similar assets or using a discounted cash flow analysis. There were no impairment charges recognized during the years ended December 31, 2016, 2015 and 2014.
Long lived assets that do not have indefinite lives are amortized/depreciated over their useful lives and reviewed for impairment whenever events or changes in circumstances indicate that the carrying amount of the asset may not be recoverable. The Company reevaluates the useful life determinations each year to determine whether events and circumstances warrant a revision to the remaining useful lives.
Income Taxes
Since the Company conducts operations on a global basis, its effective tax rate has and will depend upon the geographic distribution of its pre‑tax earnings among locations with varying tax rates. The Company accounts for the effects of income taxes that result from its activities during the current and preceding years. Under this method, deferred income tax liabilities and assets are based on the difference between the financial statement carrying amounts and the tax basis of assets and liabilities using enacted tax rates in effect in the years in which the differences are expected to reverse or be utilized. The realization of deferred tax assets is contingent upon the generation of future taxable income. A valuation allowance is recorded if it is “more likely than not” that a portion or all of a deferred tax asset will not be realized.
In evaluating the Company’s ability to recover their deferred tax assets within the jurisdiction from which they arise, the Company considers all available positive and negative evidence, including scheduled reversals of deferred tax liabilities, projected future taxable income, tax-planning strategies, and results of recent operations. In projecting future taxable income, the Company begins with historical results adjusted for the results of discontinued operations and incorporates assumptions about the amount of future state, federal, and foreign pretax operating income adjusted for items that do not have tax consequences. The assumptions about future taxable income require significant judgment and are consistent with the plans and estimates the Company is using to manage the underlying businesses. In evaluating the objective evidence that historical results provide, the Company considers three years of cumulative operating income (loss).
The Company recognizes a tax benefit from an uncertain tax position only if it is more likely than not to be sustained upon examination based on the technical merits of the position. The amount of the accrual for which an exposure exists is measured by determining the amount that has a greater than 50 percent likelihood of being realized upon the settlement of the position. Components of the reserve are classified as a current or a long‑term liability in the consolidated balance sheets based on when the Company expects each of the items to be settled. The Company records interest and penalties accrued in relation to uncertain tax benefits as a component of interest expense. The Company expects that the amount of unrecognized tax benefits will change during 2017, however, the Company does not expect the change to have a significant impact on its results of operations or financial position.
While the Company believes it has identified all reasonably identifiable exposures and that the reserve that the Company has established for identifiable exposures is appropriate under the circumstances, it is possible that additional exposures exist and that exposures may be settled at amounts different than the amounts reserved. It is also possible that changes in facts and circumstances
80
SYNCHRONOSS TECHNOLOGIES, INC.
NOTES TO CONSOLIDATED FINANCIAL STATEMENTS (Continued)
(Amounts in tables in thousands, except for per share data or unless otherwise noted)
could cause the Company to either materially increase or reduce the carrying amount of its tax reserves. In general, tax returns for the year 2012 and thereafter are subject to future examination by tax authorities.
The Company’s policy has been to leave its cumulative unremitted foreign earnings invested indefinitely outside the United States, and the Company intends to continue this policy. As such, taxes have not been provided on any of the remaining accumulated foreign unremitted earnings. Due to the timing and circumstances of repatriation of such earnings, if any, it is not practicable to determine the unrecognized deferred tax liability relating to such amounts. If the cumulative unremitted foreign earnings exceed the amount the Company intends to reinvest in foreign countries in the future, the Company would provide for taxes on such excess amount.
Foreign Currency
The functional currency is translated into U.S. dollars for balance sheet accounts using the month end rates in effect as of the balance sheet date and average exchange rate for revenue and expense accounts for each respective period. The translation adjustments are deferred as a separate component of stockholders’ equity within accumulated other comprehensive income. Gains or losses resulting from transactions denominated in foreign currencies are included in other income or expense, within the consolidated statements of income.
Comprehensive Income
Reporting on comprehensive income requires components of other comprehensive income, including unrealized gains or losses on available‑for‑sale securities, to be included as part of total comprehensive income. Comprehensive income is comprised of net income, translation adjustments and unrealized gains and losses on available‑for‑sale securities. The components of comprehensive income are included in the statements of comprehensive income.
Basic and Diluted Net Income Attributable to Common Stockholders per Common Share
Basic earnings per share is calculated by using the weighted-average number of common shares outstanding during the period, excluding amounts associated with restricted shares.
The diluted earnings per share calculation is based on the weighted-average number of shares of common stock outstanding adjusted for the number of additional shares that would have been outstanding had all potentially dilutive common shares been issued.
Potentially dilutive shares of common stock include stock options, convertible debt and unvested restricted stock. The dilutive effects of stock options and restricted stock awards are based on the treasury stock method. The dilutive effect of the assumed conversion of convertible debt is determined using the if-converted method. The after-tax effect of interest expense related to the convertible securities is added back to net income, and the convertible debt is assumed to have been converted into common shares at the beginning of the period.
Stock‑Based Compensation
The Company utilizes the Black‑Scholes pricing model to determine the fair value of stock options on the dates of grant. Restricted stock awards are measured based on the fair market values of the underlying stock on the dates of grant. The Company recognizes stock‑based compensation over the requisite service period with an offsetting credit to additional paid‑in capital.
For the Company’s performance restricted stock awards the Company estimates the number of shares the recipient is to receive by applying a probability of achieving the performance goals. The actual number of shares the recipient receives is determined at the end of the performance period based on the results achieved versus goals based on the performance targets, such as revenues and EBITDA. Once the number of awards is determined, the compensation cost is fixed and continues to be recognized using straight line recognition over the requisite service period for each vesting tranche.
Use of a valuation model requires management to make certain assumptions with respect to selected model inputs. Expected volatility was calculated based on historical information of the Company's stock. The average expected life was determined using historical stock option exercise activity. The risk‑free interest rate is based on U.S. Treasury zero‑coupon issues with a remaining
81
SYNCHRONOSS TECHNOLOGIES, INC.
NOTES TO CONSOLIDATED FINANCIAL STATEMENTS (Continued)
(Amounts in tables in thousands, except for per share data or unless otherwise noted)
term equal to the expected life assumed at the date of grant. The Company has never declared or paid cash dividends on the common or preferred equity and does not anticipate paying any cash dividends in the foreseeable future. Forfeitures are accounted for as they occur.
Recently Issued Accounting Standards
In January 2017, the Financial Accounting Standards Board (“FASB”) issued Accounting Standards Update (“ASU”) 2017-04, Intangibles-Goodwill and Other, Simplifying the Test for Goodwill Impairment, which eliminates Step 2 from the goodwill impairment test. Under the revised test, an entity should perform its annual, or interim, goodwill impairment test by comparing the fair value of a reporting unit with its carrying amount. An entity should recognize an impairment charge for the amount by which the carrying amount exceeds the reporting unit’s fair value; however, the loss recognized should not exceed the total amount of goodwill allocated to that reporting unit. This ASU is effective for any interim or annual impairment tests for fiscal years beginning after December 15, 2019, with early adoption permitted. The Company is currently evaluating the impact of adoption on its consolidated financial statements.
In January 2017, the FASB issued ASU 2017-01, Business Combinations (Topic 805): Clarifying the Definition of a Business, which clarifies the definition of a business with the objective of adding guidance to assist entities with evaluating whether transactions should be accounted for as acquisitions (or disposals) of assets or businesses. ASU 2017-01 is effective for annual reporting periods beginning after December 15, 2017, and interim periods within those years, with early adoption permitted. The Company is currently evaluating the impact of adoption on its consolidated financial statements.
In November 2016, the FASB issued ASU 2016-18, Statement of Cash Flows (Topic 230): Restricted Cash, which amends the guidance in ASC 230, including providing additional guidance related to transfers between cash and restricted cash and how entities present, in their statement of cash flows, the cash receipts and cash payments that directly affect the restricted cash accounts. ASU 2016-18 is effective for annual reporting periods beginning after December 15, 2017, and interim periods within those years, with early adoption permitted. The Company is currently evaluating the impact of adoption on its consolidated financial statements.
In October 2016, the FASB issued ASU 2016-17, Consolidation (Topic 810): Interests Held through Related Parties That Are under Common Control, which amends the consolidation guidance in ASU 2015-02 regarding the treatment of indirect interests held through related parties that are under common control. ASU 2016-17 is effective for annual reporting periods beginning after December 15, 2016, and interim periods within those years, with early adoption permitted. The Company is currently evaluating the impact of adoption on its consolidated financial statements.
In October 2016, the FASB issued ASU 2016-16, Intra-Entity Transfers of Assets Other Than Inventory, which requires entities to recognize at the transaction date the income tax effects for intra-entity transfers of assets other than inventory. The standard is effective for interim and annual reporting periods beginning after December 15, 2017, with early adoption permitted. The Company is currently evaluating the impact of adoption on its consolidated financial statements.
In August 2016, the FASB issued ASU 2016-15, Statement of Cash Flows (ASU 2016-15). This new guidance will make eight targeted changes to how cash receipts and cash payments are presented and classified in the statement of cash flows. ASU 2016-15 is effective for fiscal years beginning after December 15, 2017. ASU 2016-15 will require adoption on a retrospective basis unless it is impracticable to apply, in which case the Company would be required to apply the amendments prospectively as of the earliest date practicable. The Company is currently evaluating the impact of adoption on its consolidated financial statements.
In June 2016, the FASB issued ASU 2016-13, Financial Instruments-Credit Losses (Topic 326): Measurement of Credit Losses on Financial Instruments. The amendments in this update replace the incurred loss impairment methodology in current GAAP with a methodology that reflects expected credit losses and requires consideration of a broader range of reasonable and supportable information to inform credit loss estimates. The ASU is effective for public companies in annual periods beginning after December 15, 2019, and interim periods within those years. Early adoption is permitted beginning after December 15, 2018 and interim periods within those years. The Company is currently evaluating the impact of adoption on its consolidated financial statements.
In February 2016, the FASB issued ASU 2016-02, Leases (Topic 842). Under ASU 2016-02, lessees will be required to recognize, for all leases of 12 months or more, a liability to make lease payments and a right-of-use asset representing the right to use the underlying asset for the lease term. Additionally, the guidance requires improved disclosures to help users of financial statements better understand the nature of an entity’s leasing activities. This ASU is effective for public reporting companies for interim and
82
SYNCHRONOSS TECHNOLOGIES, INC.
NOTES TO CONSOLIDATED FINANCIAL STATEMENTS (Continued)
(Amounts in tables in thousands, except for per share data or unless otherwise noted)
annual periods beginning after December 15, 2018, with early adoption permitted, and must be adopted using a modified retrospective approach. The Company is in the process of evaluating the effect of the new guidance on its consolidated financial statements and disclosures.
In May 2014, the FASB issued ASU 2014-09, “Revenue from Contracts with Customers,” which requires an entity to recognize the amount of revenue to which it expects to be entitled for the transfer of promised goods or services to customers. The ASU will replace most existing revenue recognition guidance in U.S. GAAP when it becomes effective. In March 2016, the FASB issued ASU 2016-08, “Principal versus Agent Considerations (Reporting Revenue Gross versus Net),” which clarifies the guidance in determining revenue recognition as principal versus agent. In April 2016, the FASB issued ASU 2016-10, “Identifying Performance Obligations and Licensing,” which provides guidance in accounting for immaterial performance obligations and shipping and handling. In May 2016, the FASB issued ASU 2016-12, “Narrow-Scope Improvements and Practical Expedients” which provides clarification on assessing the collectability criterion, presentation of sales taxes, measurement date for non-cash consideration and completed contracts at transition. This ASU also provides a practical expedient for contract modifications. Finally, issued in December 2016, ASU 2016-20 makes minor corrections or minor improvements to the Codification that are not expected to have a significant effect on current accounting practice or create a significant administrative cost to most entities. The new standards are effective for public reporting companies for interim and annual periods beginning after December 15, 2017. The guidance permits two methods of adoption: retrospectively to each prior reporting period presented (full retrospective method), or retrospectively with the cumulative effect of initially applying the guidance recognized at the date of initial application (the cumulative catch-up transition method). The Company has elected to use the modified retrospective transition method, with the cumulative effect of initially applying the guidance recognized at the date of initial application (the cumulative catch-up transition method).
The Company is in the process of completing an initial assessment and expect changes to current accounting policy in the following areas:
For certain software license arrangements, the Company currently uses a ratable, or over time, revenue recognition method for software licensing arrangements where vendor specific objective evidence (VSOE) of the maintenance portion of the arrangement does not exist. Under the new standard, the Company expects the timing of revenue recognition to be accelerated because it anticipates that the license revenue portion will be recognized at a point in time upon software license delivery, consistent with its current accounting policy for software arrangements where the Company can establish VSOE.
Professional services in certain software and in other consulting services arrangements are recognized over time under a proportional performance method. Under the new standard, professional services must meet one of three defined criteria for professional services to be recognized over time. The three criteria are:
◦ | The customer simultaneously receives and consumes the benefits as the Company performs, |
◦ | The customer controls the asset as the Company creates or enhances it, |
◦ | or the Company’s performance does not create an asset for which the entity has an alternative use, and there is a right to payment for performance to date. |
Where contract terms do not qualify for one of the over time criteria, the Company expects that the timing of revenue recognition for professional services in these contracts would be delayed and recognized at a point in time.
Certain implementation costs and other fulfillment costs, such as direct labor for contract set-up activities, that were previously expensed as incurred will be capitalized and amortized over the contract term and anticipated renewal periods. Capitalizing and amortizing these costs would have these costs recognized over a longer time period.
The Company's contracts may contain customer options for additional goods and services at stated prices, which may be material rights under the new standards. A material right exists if a contract option provides the customer with a good or service at a discounted price that a similar customer would not otherwise be offered. Under the new standards, material rights are treated as separate performance obligations and are allocated an estimated value. Where contract terms are determined to provide material rights, the Company expects that some portion of the contract price will be allocated to these material rights and recognized in later periods.
At this time, the Company is not able to reasonably estimate the impact that adoption is expected to have.
83
SYNCHRONOSS TECHNOLOGIES, INC.
NOTES TO CONSOLIDATED FINANCIAL STATEMENTS (Continued)
(Amounts in tables in thousands, except for per share data or unless otherwise noted)
In the Company's implementation process, significant activities that are in process are the calculation of the transition adjustment, drafting and approval of new accounting policies, design and implementation of new processes and systems to accommodate the new policies and to compile the information for the enhanced disclosures under the new standards. In addition, internal controls around the new policies, processes and systems need to be designed and implemented.
Impact of New Accounting Pronouncements
In August 2014, the FASB issued ASU No. 2014-15, Presentation of Financial Statements - Going Concern (Subtopic 205-40): Disclosure of Uncertainties about an Entity’s Ability to Continue as a Going Concern (ASU 2014-15). ASU 2014-15 is intended to define management’s responsibility to evaluate whether there is substantial doubt about an organization’s ability to continue as a going concern and to provide related footnote disclosures. This ASU provides guidance to an organization’s management, with principles and definitions that are intended to reduce diversity in the timing and content of disclosures that are commonly provided by organizations today in the financial statement footnotes. The amendments are effective for annual periods ending after December 15, 2016, and interim periods within annual periods beginning after December 15, 2016. Early adoption is permitted. Adoption of this guidance, effective December 31, 2016, had no impact on the consolidated financial statements or disclosures.
In March, 2016, the FASB released ASU 2016-09, “Compensation - Stock Compensation (Topic 718): Improvements to Employee Share-Based Payment Accounting.” The ASU includes multiple provisions intended to simplify various aspects of the accounting for share-based payments. While aimed at reducing the cost and complexity of the accounting for share-based payments, the amendments may significantly impact net income, earnings per share, and the statement of cash flows. The ASU is effective for public companies in annual periods beginning after December 15, 2016, and interim periods within those years. The Company elected to early adopt this standard in the second quarter ended June 30, 2016.
ASU 2016-09 eliminates the requirement to estimate and apply a forfeiture rate to reduce stock compensation expense during the vesting period and, instead, account for forfeitures as they occur. ASU 2016-09 requires that this change be adopted using the modified retrospective approach. As such, the Company recorded a cumulative-effect adjustment of $1.0 million to adjust retained earnings.
Under ASU 2016-09, excess tax benefits related to employee share-based payments are not reclassified from operating activities to financing activities in the statement of cash flows. The Company applied the effect of ASU 2016-09 to the presentation of excess tax benefits in the statement of cash flows, retrospectively. This change increased the net cash provided by operating activities and decreased net cash provided by financing activities by $5.2 million and $15.1 million for the years ended December 31, 2015 and 2014, respectively.
Under ASU 2016-09, cash paid when withholding shares for tax withholding purposes are classified as a financing activity in the statement of cash flows. ASU 2016-09 requires that this change be adopted retrospectively. The presentation requirements for cash flows related to employee taxes paid for withheld shares increased the net cash provided by operating activities and decreased net cash provided by financing activities by $17.0 million and $1.2 million for the years ended December 31, 2015 and 2014, respectively.
ASU 2016-09 eliminates additional paid in capital ("APIC") pools and requires excess tax benefits and tax deficiencies to be recorded in the income statement when the awards vest or are settled. This increased the effective tax rate for the three months and year ended December 31, 2016 by less than 1%. The ASU requires that this change be adopted prospectively. The Company excluded the excess tax benefits from the assumed proceeds available to repurchase shares in the computation of diluted earnings per share for the three months ended December 31, 2016. This increased the diluted weighted average common shares outstanding by 97,800 shares for the three months ended December 31, 2016 and decreased the diluted weighted average common shares outstanding by 66,363 for the year ended December 31, 2016.
ASU 2016-09 eliminates the requirement that excess tax benefits be realized (i.e., through a reduction in income taxes payable) before they can be recognized. Previously unrecognized deferred tax assets were recognized on a modified retrospective basis which resulted in a cumulative-effect adjustment to retained earnings of $0.5 million.
84
SYNCHRONOSS TECHNOLOGIES, INC.
NOTES TO CONSOLIDATED FINANCIAL STATEMENTS (Continued)
(Amounts in tables in thousands, except for per share data or unless otherwise noted)
Adoption of the new standard impacted previously reported quarterly results as follows:
Three Months Ended March 31, 2016, | |||||||
As reported | As adjusted | ||||||
Income statement: | |||||||
Provision for income taxes | $ | (3,965 | ) | $ | (4,588 | ) | |
Cash flows statement: | |||||||
Net cash from operations | $ | 37,731 | $ | 40,489 | |||
Net cash used in financing | (35,253 | ) | (32,495 | ) | |||
Balance sheet: | |||||||
Deferred tax liability | $ | 23,096 | $ | 22,864 | |||
Additional paid-in capital | 535,326 | 536,659 | |||||
Retained earnings | 194,012 | 192,911 | |||||
The Company adopted ASU 2015-03, Interest- Imputation of Interest (subtopic 835-30); Simplifying the Presentation of Debt Issuance Costs, and ASU 2015-15, Presentation and Subsequent Measurement of Debt Issuance Costs Associated with Line of Credit Arrangements, during the first quarter of 2016, concurrently. The adoption of these ASUs required the Company to reclassify its deferred financing costs associated with its Convertible Senior Notes from other assets to long-term debt on a retrospective basis. The Company's consolidated balance sheets included deferred financing costs of $3.7 million and $5.1 million as of December 31, 2016 and December 31, 2015, respectively, which were reclassified from other assets to long-term debt. The debt issuance costs associated with the Company's 2013 Credit Facility and Amended Credit Facility continue to be presented in other assets on the consolidated balance sheets.
Segment and Geographic Information
The Company’s chief operating decision‑maker is the Principal Executive Officer, who reviews financial information presented on a consolidated basis for purposes of making operating decisions, assessing financial performance and allocating resources. Accordingly, the Company has determined that it currently operates in one business segment: providing cloud solutions and software‑based activation for connected devices globally. The Company is not organized by market and is managed and operated as one business. A single management team reports to the chief operating decision maker who comprehensively manages the entire business. The Company does not operate any separate lines of business or separate business entities with respect to its services. Accordingly, the Company does not accumulate a complete set of discrete financial information with respect to separate service lines and does not have separately reportable segments. Although the Company operates in North America, Europe and Asia‑Pacific a majority of the Company’s revenue and long lived assets are in the U.S.
Revenues by geography are based on the billing addresses of the Company’s customers. The following tables set forth revenues and property and equipment, net by geographic area:
Year Ended December 31, | |||||||||||
2016 | 2015 | 2014 | |||||||||
Revenues | |||||||||||
Domestic | $ | 411,867 | $ | 375,254 | $ | 255,222 | |||||
Foreign | 64,883 | 52,863 | 52,079 | ||||||||
Total | $ | 476,750 | $ | 428,117 | $ | 307,301 | |||||
December 31, | |||||||
2016 | 2015 | ||||||
Property and equipment, net: | |||||||
Domestic | $ | 146,772 | $ | 156,961 | |||
Foreign | 8,827 | 11,319 | |||||
Total | $ | 155,599 | $ | 168,280 | |||
85
SYNCHRONOSS TECHNOLOGIES, INC.
NOTES TO CONSOLIDATED FINANCIAL STATEMENTS (Continued)
(Amounts in tables in thousands, except for per share data or unless otherwise noted)
3. Acquisition and Divestiture
Acquisition
Openwave Messaging, Inc. (“Openwave”)
On March 1, 2016, the Company acquired all outstanding shares of Openwave for $124.5 million, net of working capital adjustments and liabilities assumed, comprised of $102.5 million paid in cash and $22.0 million paid in shares of the Company’s common stock, based upon the average market value of the common stock for the ten trading days prior to the acquisition date.
Openwave’s product portfolio includes its core complete messaging platform optimized for today’s most complex messaging requirements worldwide with a particular geographic strength in Asia-Pacific. With this acquisition and combined with Synchronoss’ current global footprint, Synchronoss will have increased direct access to subscribers around the world for the Synchronoss Personal Cloud™ platform and bolster the Company’s go-to-market efforts internationally.
The Company determined the fair value of the net assets acquired as follows:
Purchase Price Allocation | |||||
Cash | $ | 4,110 | |||
Prepaid expenses and other assets | 3,145 | ||||
Property, Plant & Equipment | 2,882 | ||||
Long term assets | 1,986 | ||||
Intangible assets: | Wtd. Avg. | ||||
Tradename | 1,000 | 1 year | |||
Technology | 32,100 | 7 years | |||
Customer relationships | 29,000 | 10 years | |||
Goodwill | 91,732 | ||||
Total assets acquired | 165,955 | ||||
Accounts payable and accrued liabilities | 17,722 | ||||
Deferred revenues | 8,204 | ||||
Long term liabilities | 15,491 | ||||
Net assets acquired | $ | 124,538 | |||
The goodwill recorded in connection with this acquisition was based on operating synergies and other benefits expected to result from the combined operations and the assembled workforce acquired. The goodwill acquired is not deductible for tax purposes.
Acquisition‑Related Costs
Acquisition related costs recognized during the years ended December 31, 2016, 2015 and 2014 including transaction costs such as employee retention, legal, accounting, valuation and other professional services, were $11.8 million, $1.8 million, and $2.5 million, respectively.
86
SYNCHRONOSS TECHNOLOGIES, INC.
NOTES TO CONSOLIDATED FINANCIAL STATEMENTS (Continued)
(Amounts in tables in thousands, except for per share data or unless otherwise noted)
Divestitures
Mirapoint
On December 29, 2016, we completed the divestiture of our Mirapoint activation business to an unrelated third party and recorded a gain of $1.4 million on the sale.
Sequential Technology International, LLC
On December 16, 2016, Synchronoss completed a divestiture of a portion of its carrier activation business (“BPO”) to a newly formed entity named Sequential Technology International, LLC (“STI”) for a total purchase price of $146 million. As part of the sales arrangement, Synchronoss will retain a 30% investment in STI. Sequential Technology International Holdings, LLC ("STIH") an unrelated third party that was formerly named Omniglobe International LLC, will own the remaining 70% of STI. STIH financed the purchase of these assets through cash of $18.1 million, a new term loan, and a related party subordinated seller's note receivable in the amount of $83 million issued by Synchronoss, which is secured by STIH’s interest in STI. The related party note receivable earns interest at a rate of 12% per annum and matures on June 16, 2021.
The Company and STIH agreed to a put and call option in regards to the Company's equity interest in STI. The Company will have the right to exercise a put option at any time to sell it's interest in STI, at the fair market value determined at the date of exercise. Additionally, STIH will have the right to exercise a call option at any time to purchase the interest in STI at the fair market value determined at the date of exercise.
The Company determined that the put and call options are embedded within the host contract and do not require bifurcation and separate accounting treatment. STI has been determined to be a VIE of which the Company is not the primary beneficiary (See Note 5).
As part of the divestiture, Synchronoss entered into a three year transition services agreement (“TSA”) with STI to support various indirect activities such as customer software support, technical support services, maintenance and general & administrative support services and a term license for access to certain platforms, necessary to perform certain tasks, as part of the exception handling process.
On December 22, 2016, the Company entered into a non-exclusive perpetual license agreement with STIH, in the amount of $9.2 million, which is included in net revenues in the statement of income, for the use of the Company's Analytics software. The Company calculated the fair value of the license using a cost approach, which calculates the time and effort required to recreate the technology today. Inputs used to value the license are considered Level 3 inputs.
The following is a summary of the operating results of BPO which have been reflected within income from discontinued operations, net of tax:
Year ended December 31, | |||||||||||
2016 | 2015 | 2014 | |||||||||
Net revenues | $ | 145,613 | $ | 150,714 | $ | 150,013 | |||||
Costs and expenses: | |||||||||||
Cost of services | 96,737 | 83,931 | 82,028 | ||||||||
Selling, general and administrative | 2,615 | 2,324 | 2,146 | ||||||||
Total costs and expenses | 99,352 | 86,255 | 84,174 | ||||||||
Income from discontinued operations | 46,261 | 64,459 | 65,839 | ||||||||
Gain on sale of discontinued operations | 95,311 | — | — | ||||||||
Income from discontinued operations before taxes | 141,572 | 64,459 | 65,839 | ||||||||
Provision for income taxes | (67,039 | ) | (24,192 | ) | (24,921 | ) | |||||
Discontinued operations, net of taxes | $ | 74,533 | $ | 40,267 | $ | 40,918 | |||||
87
SYNCHRONOSS TECHNOLOGIES, INC.
NOTES TO CONSOLIDATED FINANCIAL STATEMENTS (Continued)
(Amounts in tables in thousands, except for per share data or unless otherwise noted)
The financial results reflected above may not represent BPO's stand-alone operating results, as the results reported within income from discontinued operations, net of tax only include certain costs that are directly attributable to BPO and exclude certain overhead costs that were previously allocated to BPO for each period.
4. Fair Value Measurements
The Company classifies marketable securities as available‑for‑sale. The fair value hierarchy established in the guidance adopted by the Company prioritizes the inputs used in valuation techniques into three levels as follows:
• | Level 1—Observable inputs—quoted prices in active markets for identical assets and liabilities; |
• | Level 2—Observable inputs other than the quoted prices in active markets for identical assets and liabilities—includes quoted prices for similar instruments, quoted prices for identical or similar instruments in inactive markets, and amounts derived from valuation models where all significant inputs are observable in active markets; and |
• | Level 3—Unobservable inputs—includes amounts derived from valuation models where one or more significant inputs are unobservable and require the Company to develop relevant assumptions. |
The following is a summary of assets, liabilities and redeemable noncontrolling interests and their related classifications under the fair value hierarchy:
December 31, 2016 | |||||||||||||||
Total | (Level 1) | (Level 2) | (Level 3) | ||||||||||||
Assets | |||||||||||||||
Cash and cash equivalents (A) | $ | 181,018 | $ | 181,018 | $ | — | $ | — | |||||||
Securities available-for-sale (B) | 15,480 | — | 15,480 | — | |||||||||||
Total assets | $ | 196,498 | $ | 181,018 | $ | 15,480 | $ | — | |||||||
Liabilities | |||||||||||||||
Contingent consideration obligation | $ | 11,860 | $ | — | $ | — | $ | 11,860 | |||||||
Total liabilities | $ | 11,860 | $ | — | $ | — | $ | 11,860 | |||||||
Temporary Equity | |||||||||||||||
Redeemable noncontrolling interest (C) | $ | 49,856 | $ | — | $ | — | $ | 49,856 | |||||||
Total temporary equity | $ | 49,856 | $ | — | $ | — | $ | 49,856 | |||||||
December 31, 2015 | |||||||||||||||
Total | (Level 1) | (Level 2) | (Level 3) | ||||||||||||
Assets | |||||||||||||||
Cash and cash equivalents (A) | $ | 147,634 | $ | 147,634 | $ | — | $ | — | |||||||
Securities available-for-sale (B) | 85,992 | — | 85,992 | — | |||||||||||
Total assets | $ | 233,626 | $ | 147,634 | $ | 85,992 | $ | — | |||||||
Liabilities | |||||||||||||||
Contingent consideration obligation | $ | 930 | $ | — | $ | — | $ | 930 | |||||||
Total liabilities | $ | 930 | $ | — | $ | — | $ | 930 | |||||||
Temporary Equity | |||||||||||||||
Redeemable noncontrolling interest | $ | 61,452 | $ | — | $ | — | $ | 61,452 | |||||||
Total temporary equity | $ | 61,452 | $ | — | $ | — | $ | 61,452 | |||||||
(A) | Cash and cash equivalents includes money market funds. |
(B) | Securities available-for-sale include municipal bonds, commercial papers, certificates of deposit, enhanced income money market fund and corporate bonds which are classified as marketable securities. |
88
SYNCHRONOSS TECHNOLOGIES, INC.
NOTES TO CONSOLIDATED FINANCIAL STATEMENTS (Continued)
(Amounts in tables in thousands, except for per share data or unless otherwise noted)
(C) | As of December 31, 2016, the carrying amount of the redeemable noncontrolling interest was greater than the fair value and accordingly no adjustment to the carrying amount was recorded. |
The Company utilizes the market approach to measure fair value for its financial assets. The market approach uses prices and other relevant information generated by market transactions involving identical or comparable assets. The Company's marketable securities investments classified as Level 2 primarily utilize broker quotes in a non-active market for valuation of these securities. No transfers of assets between Level 1, Level 2 and Level 3 of the fair value measurement hierarchy occurred during the year ended December 31, 2016.
Available-for-Sale Securities
At December 31, 2016 and December 31, 2015, the estimated fair value of investments classified as available for sale, are as follows:
December 31, 2016 | |||||||||||||||
Amortized Cost | Gross Unrealized Gains | Gross Unrealized Losses | Fair Value | ||||||||||||
Available-for-sale securities: | |||||||||||||||
Certificates of deposit | $ | 450 | $ | — | $ | — | $ | 450 | |||||||
Municipal bonds | 15,063 | 1 | (34 | ) | 15,030 | ||||||||||
Total available-for-sale securities | $ | 15,513 | $ | 1 | $ | (34 | ) | $ | 15,480 | ||||||
December 31, 2015 | |||||||||||||||
Amortized Cost | Gross Unrealized Gains | Gross Unrealized Losses | Fair Value | ||||||||||||
Available-for-sale securities: | |||||||||||||||
Certificates of deposit | $ | 2,329 | $ | — | $ | (5 | ) | $ | 2,324 | ||||||
Corporate bonds | 39,986 | — | (253 | ) | 39,733 | ||||||||||
Municipal bonds | 38,564 | 11 | (44 | ) | 38,531 | ||||||||||
Fixed Income Fund | 5,593 | — | (189 | ) | 5,404 | ||||||||||
Total available-for-sale securities | $ | 86,472 | $ | 11 | $ | (491 | ) | $ | 85,992 | ||||||
Unrealized gains and losses are reported as a component of accumulated other comprehensive loss in stockholders’ equity. There were no sales of marketable securities during the years ended December 31, 2016 and 2015. The cost of securities sold is based on the specific identification method. The Company evaluates investments with unrealized losses to determine if the losses are other than temporary. The Company has determined that the gross unrealized losses at December 31, 2016 and 2015 are temporary. In making this determination, the Company considered the financial condition, credit ratings and near‑term prospects of the issuers, the underlying collateral of the investments, and the magnitude of the losses as compared to the cost and the length of time the investments have been in an unrealized loss position. Additionally, while the Company classifies the securities as available for sale, the Company does not currently intend to sell such investments and it is more likely than not to recover the carrying value prior to being required to sell such investments.
89
SYNCHRONOSS TECHNOLOGIES, INC.
NOTES TO CONSOLIDATED FINANCIAL STATEMENTS (Continued)
(Amounts in tables in thousands, except for per share data or unless otherwise noted)
The unrealized losses and fair values of available-for-sale securities that have been in an unrealized loss position for a period of less than and greater than 12 months as of December 31, 2016, are as follows:
December 31, 2016 | |||||||||||||||||||||||
Securities in unrealized loss position less than 12 months | Securities in unrealized loss position greater than 12 months | Total | |||||||||||||||||||||
Unrealized Losses | Fair Value | Unrealized Losses | Fair Value | Gross Unrealized Losses | Fair Value | ||||||||||||||||||
Certificates of deposit | $ | — | $ | 250 | $ | — | $ | — | $ | — | $ | 250 | |||||||||||
Municipal bonds | (32 | ) | 12,683 | (2 | ) | 914 | (34 | ) | 13,597 | ||||||||||||||
$ | (32 | ) | $ | 12,933 | $ | (2 | ) | $ | 914 | $ | (34 | ) | $ | 13,847 | |||||||||
The unrealized losses and fair values of available-for-sale securities that have been in an unrealized loss position for a period of less than and greater than 12 months as of December 31, 2015, are as follows:
December 31, 2015 | |||||||||||||||||||||||
Securities in unrealized loss position less than 12 months | Securities in unrealized loss position greater than 12 months | Total | |||||||||||||||||||||
Unrealized Losses | Fair Value | Unrealized Losses | Fair Value | Gross Unrealized Losses | Fair Value | ||||||||||||||||||
Certificates of deposit | $ | (5 | ) | $ | 2,324 | — | $ | — | $ | (5 | ) | $ | 2,324 | ||||||||||
Corporate bonds | (253 | ) | 39,808 | — | — | (253 | ) | 39,808 | |||||||||||||||
Municipal bonds | (43 | ) | 20,630 | (1 | ) | 550 | (44 | ) | 21,180 | ||||||||||||||
Fixed Income Fund | — | — | (189 | ) | 5,404 | (189 | ) | 5,404 | |||||||||||||||
$ | (301 | ) | $ | 62,762 | $ | (190 | ) | $ | 5,954 | $ | (491 | ) | $ | 68,716 | |||||||||
Expected maturities of available-for-sale securities are as follows:
December 31, 2016 | |||||||
Amortized Cost | Fair Value | ||||||
Due within one year | $ | 12,525 | $ | 12,506 | |||
Due after 1 year through 5 years | 2,988 | 2,974 | |||||
Total available-for-sale securities | $ | 15,513 | $ | 15,480 | |||
Contingent Consideration
The Company determined the fair value of the contingent consideration related to the acquisition of Razorsight using a real options approach which uses a risk-adjusted expected growth rate based on assessments of expected growth in revenue, adjusted by an appropriate factor. The fair value measurement is based on significant inputs not observable in the market and thus represents a Level 3 measurement. The significant unobservable inputs used in the fair value measurement of the Company’s contingent consideration obligation are the probabilities of achieving certain financial targets and contractual milestones. Significant changes in any of those probabilities in isolation may result in a higher (lower) fair value measurement.
No changes in valuation techniques occurred during the year ended December 31, 2016. During the year ended December 31, 2016, the Company recognized a $10.9 million increase of the contingent consideration obligation due to an increase in the probability of achieving the contractual milestones associated with the potential earn-out payment to the Razorsight shareholders.
90
SYNCHRONOSS TECHNOLOGIES, INC.
NOTES TO CONSOLIDATED FINANCIAL STATEMENTS (Continued)
(Amounts in tables in thousands, except for per share data or unless otherwise noted)
The changes in fair value of the Company’s Level 3 contingent consideration obligation during the year ended December 31, 2016 were as follows:
Balance at December 31, 2015 | $ | 930 | |
Fair value adjustment to contingent consideration obligation included in net income | 10,930 | ||
Balance at December 31, 2016 | $ | 11,860 | |
Redeemable Noncontrolling Interests
The Company accounts for the redeemable noncontrolling interest at its acquisition date fair value as temporary equity, due to the redemption option existing outside the control of the Company. The noncontrolling shareholders have the option, which is embedded in the noncontrolling interest, to require the Company to purchase the remaining noncontrolling share at a formula price designed to approximate fair value based on operating results of the entity.
The Company recognizes changes in the redemption value immediately as they occur and adjusts the carrying value of the noncontrolling interest to the greater of the estimated redemption value, which approximates fair value, at the end of each reporting period or the initial carrying amount. As of December 31, 2016, the carrying amount of the redeemable noncontrolling interest was greater than the fair value and accordingly no adjustment to the carrying value was recorded.
The fair value of the redeemable noncontrolling interest was estimated by applying an income approach using a discounted cash flow analysis. This fair value measurement is based on significant inputs that are not observable in the market and thus represents a Level 3 measurement. Significant changes in the underlying assumptions used to value the redeemable noncontrolling interest could significantly increase or decrease the fair value estimates recorded in the consolidated balance sheets.
The changes in fair value of the Company’s Level 3 redeemable noncontrolling interests during the year ended December 31, 2016 were as follows:
Balance at December 31, 2015 | $ | 61,452 | |
Fair value adjustment | — | ||
Net loss attributable to redeemable noncontrolling interests | (11,596 | ) | |
Balance at December 31, 2016 | $ | 49,856 | |
5. Investments
STI, LLC
The Company includes investments which are accounted for using the equity method, under the caption equity method investments on the Company's consolidated balance sheets. As of December 31, 2016, the Company's investments in equity interests was comprised of $45.9 million related to a 30% equity interest in STI. The Company utilizes a 1 month reporting lag in recording equity income from STI.
Zentry, LLC
During the year ended December 31, 2015, the Company formed a venture with MCI Communications and Verizon Patent and Licensing Inc. (collectively, “Verizon”), referred to as Zentry, LLC (“Zentry”) in which the Company holds a 67% interest.
The Company determined that Zentry was a voting interest entity, because the entity has sufficient equity at risk to enable it to finance its activities independently. As the Company holds a majority ownership in Zentry, the Company consolidates Zentry under the voting model.
91
SYNCHRONOSS TECHNOLOGIES, INC.
NOTES TO CONSOLIDATED FINANCIAL STATEMENTS (Continued)
(Amounts in tables in thousands, except for per share data or unless otherwise noted)
SNCR, LLC
During the year ended December 31, 2015, the Company formed a venture with Goldman Sachs (“Goldman”), referred to as SNCR, LLC which was determined to be a VIE in which the Company holds a 67% interest.
The Company concluded that the entity does not have enough equity to finance its activities without additional subordinated financial support, which was provided by the Company via a $20 million line of credit. The Company consolidates the entity under the VIE model. The Company is the primary beneficiary and has the power to direct activities that most significantly impact the ventures’ economic performance. In particular, the Company directs the day to day operations, sales, marketing, distribution and R&D efforts of SNCR, LLC.
6. Property and Equipment
Property and equipment consist of the following:
December 31, | |||||||
2016 | 2015 | ||||||
Computer hardware | $ | 242,739 | $ | 217,659 | |||
Computer software | 48,040 | 39,510 | |||||
Construction in-progress | 14,961 | 4,299 | |||||
Furniture and fixtures | 5,981 | 4,040 | |||||
Building | 8,808 | 8,808 | |||||
Leasehold improvements | 15,576 | 11,922 | |||||
336,105 | 286,238 | ||||||
Less: Accumulated depreciation | (180,506 | ) | (117,958 | ) | |||
$ | 155,599 | $ | 168,280 | ||||
Depreciation expense was approximately $52.3 million, $43.5 million, and $36.1 million for 2016, 2015, and 2014, respectively. Amortization of property and equipment recorded under capital leases are included with depreciation expense.
7. Goodwill and Intangibles
Goodwill
The Company records goodwill which represents the excess of the purchase price over the fair value of assets acquired, including other definite-lived intangible assets. Goodwill is reviewed annually for impairment or upon the occurrence of events or changes in circumstances that would more likely than not reduce the fair value of the reporting unit below its carrying amount.
The following table shows the adjustments to goodwill during 2016 and 2015:
Balance at December 31, 2014 | $ | 147,135 | |
Acquisitions | 84,636 | ||
Reclassifications, adjustments and other | (30 | ) | |
Reclassified to assets of discontinued operations, non-current | (39,271 | ) | |
Translation adjustments | (10,470 | ) | |
Balance at December 31, 2015 | $ | 182,000 | |
Acquisition | 91,732 | ||
Adjustment to amount reclassified to assets of discontinued operations, non-current | 2,466 | ||
Reclassifications, adjustments and other | (3,033 | ) | |
Translation adjustments | (3,260 | ) | |
Balance at December 31, 2016 | $ | 269,905 | |
The reclassification, adjustments and other of $3.0 million and $30.0 thousand for the years 2016 and 2015, respectively, are primarily related to a change in the Company’s deferred tax asset in connection with a pre-acquisition tax loss.
92
SYNCHRONOSS TECHNOLOGIES, INC.
NOTES TO CONSOLIDATED FINANCIAL STATEMENTS (Continued)
(Amounts in tables in thousands, except for per share data or unless otherwise noted)
Other Intangible Assets
The Company’s intangible assets with definite lives consist primarily of trade names, technology, and customer lists and relationships. These intangible assets are being amortized on the straight‑line method over the estimated useful lives of the assets. Amortization expense related to intangible assets for the years ended December 31, 2016, 2015 and 2014 was $47.0 million, $28.6 million and $19.8 million, respectively.
The Company’s intangible assets consist of the following:
December 31, 2016 | |||||||||||
Cost | Accumulated Amortization | Net | |||||||||
Trade name | $ | 2,523 | $ | (2,259 | ) | $ | 264 | ||||
Technology | 160,169 | (60,794 | ) | 99,375 | |||||||
Customer lists and relationships | 134,280 | (50,503 | ) | 83,777 | |||||||
Capitalized software and patents | 26,666 | (6,218 | ) | 20,448 | |||||||
$ | 323,638 | $ | (119,774 | ) | $ | 203,864 | |||||
December 31, 2015 | |||||||||||
Cost | Accumulated Amortization | Net | |||||||||
Trade name | $ | 1,531 | $ | (1,372 | ) | $ | 159 | ||||
Technology | 130,200 | (35,336 | ) | 94,864 | |||||||
Customer lists and relationships | 105,864 | (33,969 | ) | 71,895 | |||||||
Capitalized software and patents | 11,406 | (4,002 | ) | 7,404 | |||||||
$ | 249,001 | $ | (74,679 | ) | $ | 174,322 | |||||
Estimated future amortization expense of its intangible assets for the next five years is as follows:
Year ending December 31, | |||
2017 | $ | 49,563 | |
2018 | 46,561 | ||
2019 | 39,631 | ||
2020 | 24,940 | ||
2021 | 12,965 | ||
Thereafter | 30,225 | ||
8. Accrued Expenses
Accrued expenses consist of the following:
93
SYNCHRONOSS TECHNOLOGIES, INC.
NOTES TO CONSOLIDATED FINANCIAL STATEMENTS (Continued)
(Amounts in tables in thousands, except for per share data or unless otherwise noted)
December 31, | |||||||
2016 | 2015 | ||||||
Accrued compensation and benefits | $ | 31,752 | $ | 24,776 | |||
Accrued accounting fees | 2,258 | 1,622 | |||||
Accrued consulting fees | 15,140 | 6,075 | |||||
Accrued other | 16,220 | 12,663 | |||||
Accrued income tax payable | 4,065 | 683 | |||||
$ | 69,435 | $ | 45,819 | ||||
9. Commitments and Contingencies
The Company leases office space, automobiles, office equipment and colocation services under non‑cancellable capital leases, operating leases or long-term agreements, which expire through December 2029. Aggregate annual future minimum payments under these non‑cancellable agreements are as follows:
Year ending December 31: | Colocation | Operating Leases | Capital Leases | ||||||||
2017 | $ | 14,327 | $ | 9,564 | $ | 2,464 | |||||
2018 | 5,055 | 7,502 | 2,357 | ||||||||
2019 | 4,914 | 6,790 | 2,285 | ||||||||
2020 | 3,466 | 6,528 | 1,293 | ||||||||
2021 and thereafter | — | 40,357 | 8,437 | ||||||||
$ | 27,762 | $ | 70,741 | $ | 16,836 | ||||||
Rent expense for the years ended December 31, 2016, 2015 and 2014 was $8.6 million, $7.6 million and $6.5 million respectively.
10. Debt
2013 Credit Facility
In September 2013, the Company entered into a Credit Agreement (the “Credit Facility”) with JP Morgan Chase Bank, N.A., as the administrative agent, Wells Fargo Bank, National Association, as the syndication agent and Capital One, National Association and KeyBank National Association, as co-documentation agents. The Credit Facility, which was used for general corporate purposes, was a $100 million unsecured revolving line of credit that was set to mature on September 27, 2018. The Company paid a commitment fee in the range of 25 to 35 basis points on the unused balance of the revolving credit facility under this credit agreement. Synchronoss had the right to request an increase in the aggregate principal amount of the Credit Facility to $150 million.
Interest on the borrowings were based upon LIBOR plus a 2.25 basis point margin. All outstanding balances under the Credit Facility were repaid on July 7, 2016 and the 2013 Credit Facility was terminated and replaced with the Amended Credit Facility.
Amended Credit Facility
On July 7, 2016, the Company entered into an Amended Credit Agreement (the “Amended Credit Agreement”) with Wells Fargo Bank, National Association, as administrative agent (the “Administrative Agent”) and several lenders party thereto (the “Amended Credit Facility”). The Amended Credit Facility, was permitted to be used for general corporate purposes, was a $250 million unsecured revolving line of credit that was set to mature on July 7, 2021, subject to terms and conditions set forth therein. The Company paid a commitment fee in the range of 15 to 30 basis points on the unused balance of the revolving credit facility under the Amended Credit Agreement. Synchronoss had the right to request an increase in the aggregate principal amount of the Amended Credit Facility up to $350 million.
Interest on the borrowings was based upon LIBOR plus a 1.99 basis point margin. As of December 31, 2016, the Company had an outstanding balance of $29 million on the Amended Credit Facility.
94
SYNCHRONOSS TECHNOLOGIES, INC.
NOTES TO CONSOLIDATED FINANCIAL STATEMENTS (Continued)
(Amounts in tables in thousands, except for per share data or unless otherwise noted)
The Amended Credit Facility was subject to certain financial covenants. As of December 31, 2016, the Company was in compliance with all required covenants.
Interest expense and commitment fees under the Credit Facility and the Amended Credit Facility were as follows:
Year ended December 31, | ||||||||||||
2016 | 2015 | 2014 | ||||||||||
Commitment fees | $ | 415 | $ | 332 | $ | 215 | ||||||
Interest expense | 877 | — | 136 | |||||||||
On January 19, 2017, the Company repaid all outstanding obligations under the Amended Credit Agreement with Wells Fargo Bank and the several lenders party thereto. The aggregate payoff amount was $29 million and included all accrued interest and associated prepayment penalties. For further details see the subsequent events footnote (Note 19).
Convertible Senior Notes
On August 12, 2014, the Company issued $230.0 million aggregate principal amount of its 0.75% Convertible Senior Notes due in 2019 (the “2019 Notes”). The 2019 Notes mature on August 15, 2019, and bear interest at a rate of 0.75% per annum payable semi-annually in arrears on February 15 and August 15 of each year. The Company accounted for the $230.0 million face value of the debt as a liability and capitalized approximately $7.1 million of financing fees, related to the issuance which are presented net of the face value of the 2019 Notes on the balance sheet.
The 2019 Notes are senior, unsecured obligations of the Company, and are convertible into shares of its common stock based on a conversion rate of 18.8072 shares per $1,000 principal amount of 2019 Notes which is equivalent to an initial conversion price of approximately $53.17 per share. The Company will satisfy any conversion of the 2019 Notes with shares of the Company’s common stock. The 2019 Notes are convertible at the note holders’ option prior to their maturity and if specified corporate transactions occur. The issue price of the 2019 Notes was equal to their face amount.
Holders of the 2019 Notes who convert their notes in connection with a qualifying fundamental change, as defined in the related indenture, may be entitled to a make-whole premium in the form of an increase in the conversion rate. Additionally, following the occurrence of a fundamental change, holders may require that the Company repurchase some or all of the 2019 Notes for cash at a repurchase price equal to 100% of the principal amount of the notes being repurchased, plus accrued and unpaid interest, if any. As of December 31, 2016, none of these conditions existed with respect to the 2019 Notes and as a result, the 2019 Notes are classified as long term.
The 2019 Notes are the Company’s direct senior unsecured obligations and rank equal in right of payment to all of the Company’s existing and future unsecured and unsubordinated indebtedness.
At December 31, 2016, the carrying amount of the liability was $226.3 million and the outstanding principal of the 2019 Notes was $230 million, with an effective interest rate of approximately 1.39%. The fair value of the 2019 Notes was $242.4 million at December 31, 2016. The fair value of the liability of the 2019 Notes was determined using a discounted cash flow model based on current market interest rates available to the Company. These inputs are corroborated by observable market data for similar liabilities and therefore classified within Level 2 of the fair-value hierarchy.
Interest expense for the Company’s 2019 Notes related to the contractual interest coupon was:
Year ended December 31, | ||||||||||||
2016 | 2015 | 2014 | ||||||||||
Contractual interest expense | $ | 1,725 | $ | 1,725 | $ | 647 | ||||||
11. Accumulated Other Comprehensive Income
The changes in accumulated other comprehensive income (loss) during the year ended December 31, 2016, are as follows:
95
SYNCHRONOSS TECHNOLOGIES, INC.
NOTES TO CONSOLIDATED FINANCIAL STATEMENTS (Continued)
(Amounts in tables in thousands, except for per share data or unless otherwise noted)
Foreign Currency | Unrealized (Loss) Income on Intra-Entity Foreign Currency Transactions | Unrealized Holding Gains (Losses) on Available-for-Sale Securities | Total | ||||||||||||
Balance at December 31, 2015 | $ | (34,092 | ) | $ | (4,292 | ) | $ | (300 | ) | $ | (38,684 | ) | |||
Other comprehensive income (loss) | (4,042 | ) | (789 | ) | 365 | (4,466 | ) | ||||||||
Tax effect | — | 64 | (167 | ) | (103 | ) | |||||||||
Total comprehensive income (loss) | (4,042 | ) | (725 | ) | 198 | (4,569 | ) | ||||||||
Balance at December 31, 2016 | $ | (38,134 | ) | $ | (5,017 | ) | $ | (102 | ) | $ | (43,253 | ) | |||
The changes in accumulated other comprehensive income (loss) during the year ended December 31, 2015, are as follows:
Foreign Currency | Unrealized (Loss) Income on Intra-Entity Foreign Currency Transactions | Unrealized Holding Gains (Losses) on Available-for-Sale Securities | Total | ||||||||||||
Balance at December 31, 2014 | $ | (16,811 | ) | $ | (2,957 | ) | $ | (246 | ) | $ | (20,014 | ) | |||
Other comprehensive income (loss) | (17,281 | ) | (2,722 | ) | (79 | ) | (20,082 | ) | |||||||
Tax effect | — | 1,387 | 25 | 1,412 | |||||||||||
Total comprehensive income (loss) | (17,281 | ) | (1,335 | ) | (54 | ) | (18,670 | ) | |||||||
Balance at December 31, 2015 | $ | (34,092 | ) | $ | (4,292 | ) | $ | (300 | ) | $ | (38,684 | ) | |||
12. Capital Structure
As of December 31, 2016, the Company’s authorized capital stock was 110 million shares of stock with a par value of $0.0001, of which 100 million shares were designated as common stock and 10 million shares were designated as preferred stock.
Common Stock
Each holder of common stock is entitled to vote on all matters and is entitled to one vote for each share held. Dividends on common stock will be paid when, and if, declared by the Company’s Board of Directors. No dividends have ever been declared or paid by the Company.
Preferred Stock
There are no shares of preferred stock outstanding as of December 31, 2016 or 2015. The Board of Directors is authorized to issue preferred shares and has the discretion to determine the rights, preferences, privileges and restrictions, including voting rights, dividend rights, conversion rights, redemption privileges and liquidation preferences of preferred stock.
Treasury Stock
On February 4, 2016, the Company's Board of Directors authorized a stock repurchase program to purchase up to $100 million of the Company's outstanding Common Stock. Under the program, the Company may purchase shares of its Common Stock in the open market, through block trades or otherwise at prices deemed appropriate by the Company. The timing and amount of repurchase transactions under the program will depend on available working capital and other factors as determined by the Board of Directors and management.
96
SYNCHRONOSS TECHNOLOGIES, INC.
NOTES TO CONSOLIDATED FINANCIAL STATEMENTS (Continued)
(Amounts in tables in thousands, except for per share data or unless otherwise noted)
As of December 31, 2016, a total of 1.3 million shares have been purchased under the program for an aggregate purchase price of $40 million.
Registration Rights
Holders of shares of common stock which were issued upon conversion of the Company’s Series A preferred stock are entitled to have their shares registered under the Securities Act of 1933, as amended (the “Securities Act”). Under the terms of an agreement between the Company and the holders of these securities which include registration rights, if the Company proposes to register any of its securities under the Securities Act, either for its own account or for the account of others, these stockholders are entitled to notice of such registration and are entitled to include their shares in such registration.
13. Stock Plans
In March 2015, the Company adopted the 2015 Equity Incentive Plan (the “2015 Plan”). The 2015 Plan replaces the Company’s prior 2000 Equity Incentive Plan (the “2000 Plan”), the 2006 Equity Incentive Plan (the “2006 Plan”) and the 2010 New Hire Equity Incentive Plan (the “2010 Plan”), (collectively, the “Plans”). Beginning March 2015, all awards were granted under the 2015 Plan. In addition, any awards that were previously granted under any prior Plans that terminate without issuance of shares, shall be eligible for issuance under the 2015 Plan.
Under the 2015 Plan, the Company may grant to its employees, outside directors and consultants awards in the form of non-qualified stock options, shares of restricted stock, stock units, or stock appreciation rights and performance shares. The Company’s Board of Directors administers the Plan and is responsible for determining the individuals to be granted options or shares, the number of options or shares each individual will receive, the price per share and the exercise period of each option. As of December 31, 2016, there were 2.3 million shares available for grant or award under the Company’s 2015 Plan.
Stock-Based Compensation
The following table summarizes stock-based compensation expense:
December 31, | |||||||||||
2016 | 2015 | 2014 | |||||||||
Stock options | $ | 7,778 | $ | 8,495 | $ | 9,992 | |||||
Restricted stock awards | 25,384 | 22,592 | 18,353 | ||||||||
ESPP Plan | 817 | 624 | 642 | ||||||||
Total stock-based compensation before taxes1 | $ | 33,979 | $ | 31,711 | $ | 28,987 | |||||
Tax benefit | $ | 11,108 | $ | 10,130 | $ | 9,939 | |||||
1 Includes $1.6 million, $1.8 million and $1.7 million related to discontinued operations for the years ended December 31, 2016, 2015 and 2014, respectively.
The total stock-based compensation cost related to unvested equity awards as of December 31, 2016 was approximately $58.3 million. The expense is expected to be recognized over a weighted-average period of approximately 2.48 years.
Stock Options
Options that were granted under the Company’s 2000, 2006 and 2015 Plans generally vest 25% on the first year anniversary of the date of grant plus an additional 1/48th for each month of continuous service thereafter.
Options that were granted under the Company’s 2010 Plan generally vest 50% on the second year anniversary and an additional 1/48th for each month of continuous service thereafter.
Incentive options that were granted under the 2000 and 2006 Plans generally vest 25% on the 1st year anniversary on the date of grant and an additional 1/48th for each month of continuous service thereafter.
97
SYNCHRONOSS TECHNOLOGIES, INC.
NOTES TO CONSOLIDATED FINANCIAL STATEMENTS (Continued)
(Amounts in tables in thousands, except for per share data or unless otherwise noted)
The weighted‑average assumptions used in the Black‑Scholes option pricing model are as follows:
December 31, | |||||||||||
2016 | 2015 | 2014 | |||||||||
Expected stock price volatility | 45 | % | 47 | % | 57 | % | |||||
Risk-free interest rate | 1.16 | % | 1.27 | % | 1.43 | % | |||||
Expected life of options (in years) | 4.0 | 4.0 | 4.2 | ||||||||
Expected dividend yield | — | % | — | % | — | % | |||||
Weighted-average fair value (grant date) of the options | $ | 11.13 | $ | 15.88 | $ | 14.67 | |||||
The following table summarizes information about stock options outstanding.
Options | Number of Options | Weighted- Average Exercise Price | Weighted- Average Remaining Contractual Term (Years) | Aggregate Intrinsic Value | |||||||||
Outstanding at December 31, 2015 | 2,348 | $ | 31.04 | ||||||||||
Options Granted | 878 | 31.04 | |||||||||||
Options Exercised | (608 | ) | 22.88 | ||||||||||
Options Cancelled | (289 | ) | 36.56 | ||||||||||
Outstanding at December 31, 2016 | 2,329 | $ | 32.48 | 4.60 | $ | 15,719 | |||||||
Vested at December 31, 2016 | 2,203 | $ | 32.45 | 4.53 | $ | 14,865 | |||||||
Exercisable at December 31, 2016 | 1,056 | $ | 31.19 | 3.03 | $ | 8,397 | |||||||
The below table summarizes additional information related to stock options:
December 31, | |||||||||||
2016 | 2015 | 2014 | |||||||||
Total intrinsic value for stock options exercised | $ | 8,953 | $ | 18,369 | $ | 18,950 | |||||
Fair value of vested awards | $ | 21,687 | $ | 29,815 | $ | 19,409 | |||||
Awards of Restricted Stock and Performance Stock
Restricted stock awards (“restricted stock”) granted under the Company’s Plans generally vest 25% of the applicable shares on the first anniversary of the date of grant and thereafter an additional 1/16th for each three months of continuous service.
Performance stock awards granted under the Company’s 2006 Plan generally vest with respect to one-third of the applicable shares on the date that the performance objectives under the performance stock awards are achieved and thereafter an additional one-third for each year of continuous service.
Generally, performance stock awards granted under the Company’s 2015 Plan vest at the end of a three-year period based on service and achievement of certain performance objectives determined by the Company’s Board of Directors.
98
SYNCHRONOSS TECHNOLOGIES, INC.
NOTES TO CONSOLIDATED FINANCIAL STATEMENTS (Continued)
(Amounts in tables in thousands, except for per share data or unless otherwise noted)
A summary of the Company’s unvested restricted stock at December 31, 2016, and changes during the year ended December 31, 2016, is presented below:
Non-Vested Restricted Stock | Number of Awards | Weighted- Average Grant Date Fair Value | |||||
Non-vested at December 31, 2015 | 1,412 | $ | 36.80 | ||||
Granted | 939 | 34.06 | |||||
Vested | (677 | ) | 35.65 | ||||
Forfeited | (334 | ) | 37.55 | ||||
Non-vested at December 31, 2016 | 1,340 | $ | 35.28 | ||||
Restricted stock awards are granted subject to other service conditions or service and performance conditions (“performance-based awards”). Restricted stock and performance-based awards are measured at the closing stock price at the date of grant and are recognized straight line over the requisite service period. During 2016, the Company issued approximately 41 thousand shares of restricted stock related to the 2015 performance share objectives.
Employee Stock Purchase Plan
On February 1, 2012, the Company established a ten year Employee Stock Purchase Plan (“ESPP” or “the Plan”) for certain eligible employees. The Plan is to be administered by the Company’s Board of Directors. The total number of shares available for purchase under the Plan is 500 thousand shares of the Company’s Common Stock. Employees participate over a six month period through payroll withholdings and may purchase, at the end of the six month period, the Company’s Common Stock at the lower of 85% of the fair market value on the first day of the offering period or the fair market value on the purchase date. No participant will be granted a right to purchase Common Stock under the Plan if such participant would own more than 5% of the total combined voting power of the Company. In addition, no participant may purchase more than a thousand shares of Common Stock within any purchase period or with a value greater than $25 thousand in any calendar year.
Treasury Stock
On February 4, 2016, the Company's Board of Directors authorized a stock repurchase program to purchase up to $100 million of the Company's outstanding Common Stock. Under the program, the Company may purchase shares of its Common Stock in the open market, through block trades or otherwise at prices deemed appropriate by the Company. The timing and amount of repurchase transactions under the program will depend on available working capital and other factors as determined by the Board of Directors and management.
As of December 31, 2016, a total of 1.3 million shares have been purchased under the program for an aggregate purchase price of $40 million. The Company classifies Common Stock repurchased as Treasury Stock on its balance sheet.
14. 401(k) Plan
The Company has a 401(k) plan (the “Plan”) covering all eligible employees. The Plan allows for a discretionary employer match. The Company incurred and expensed $2.7 million, $2.1 million, and $1.8 million for the years ended December 31, 2016, 2015 and 2014, respectively, in Plan match contributions.
99
SYNCHRONOSS TECHNOLOGIES, INC.
NOTES TO CONSOLIDATED FINANCIAL STATEMENTS (Continued)
(Amounts in tables in thousands, except for per share data or unless otherwise noted)
15. Restructuring Charges
In March 2016 and December 2016, the Company initiated the preliminary phase of a work-force reduction as part of a corporate restructuring, with reductions occurring across all levels and departments within the Company. These measures were intended to reduce costs and to align the Company’s resources with its key strategic priorities.
As of December 31, 2016, there were $1.2 million of accrued restructuring charges on the balance sheet. A summary of the Company’s restructuring accrual at December 31, 2016 and changes during the year ended December 31, 2016, is presented below:
Balance at December 31, 2015 | Charges1 | Payments | Balance at December 31, 2016 | ||||||||||||
Employment termination costs | $ | — | $ | 6,639 | $ | (5,458 | ) | $ | 1,181 | ||||||
Facilities consolidation | 54 | — | (14 | ) | 40 | ||||||||||
Total | $ | 54 | $ | 6,639 | $ | (5,472 | ) | $ | 1,221 | ||||||
1 Includes $0.3 million related to discontinued operations.
100
SYNCHRONOSS TECHNOLOGIES, INC.
NOTES TO CONSOLIDATED FINANCIAL STATEMENTS (Continued)
(Amounts in tables in thousands, except for per share data or unless otherwise noted)
16. Income Taxes
The components of income or (loss) from continuing operations before income taxes are as follows:
Year ended December 31, | |||||||||||
2016 | 2015 | 2014 | |||||||||
Domestic | $ | (57,846 | ) | $ | 32,385 | $ | (11,620 | ) | |||
Foreign | (16,685 | ) | (20,546 | ) | 6,355 | ||||||
Total | $ | (74,531 | ) | $ | 11,839 | $ | (5,265 | ) | |||
The components of income tax (expense) benefit from continuing operations are as follows:
Year ended December 31, | |||||||||||
2016 | 2015 | 2014 | |||||||||
Current: | |||||||||||
Federal | $ | (48 | ) | $ | 1,993 | $ | 12,873 | ||||
State | 1,580 | 299 | 447 | ||||||||
Foreign | (3,239 | ) | 682 | (2,040 | ) | ||||||
Deferred: | |||||||||||
Federal | 10,716 | (10,277 | ) | (10,437 | ) | ||||||
State | 301 | (480 | ) | (1,301 | ) | ||||||
Foreign | (1,320 | ) | 2,359 | 3,700 | |||||||
Income tax expense | $ | 7,990 | $ | (5,424 | ) | $ | 3,242 | ||||
Reconciliations of the statutory tax rates and the effective tax rates from continuing operations for the years ended December 31, 2016, 2015 and 2014 are as follows:
Year ended December 31, | ||||||||
2016 | 2015 | 2014 | ||||||
Statutory rate | 35 | % | 35 | % | 35 | % | ||
State taxes, net of federal benefit | 2 | % | 1 | % | (11 | )% | ||
Effect of rates different than statutory | (7 | )% | 44 | % | 47 | % | ||
Minority interest | (5 | )% | (18 | )% | — | % | ||
Non-deductible stock based compensation | — | % | — | % | (4 | )% | ||
Other permanent adjustments | — | % | 10 | % | (9 | )% | ||
Fair market value adjustment on Earn-out | (5 | )% | 2 | % | 3 | % | ||
Research and development credit | 3 | % | (19 | )% | 25 | % | ||
Subpart F income | — | % | — | % | (22 | )% | ||
Change in valuation allowance | (13 | )% | 12 | % | — | % | ||
Ireland deferred tax liability - migration | — | % | (13 | )% | — | % | ||
Customer relationship adjustment - Australia | — | % | (16 | )% | — | % | ||
Other | 1 | % | 8 | % | (2 | )% | ||
Net | 11 | % | 46 | % | 62 | % | ||
101
SYNCHRONOSS TECHNOLOGIES, INC.
NOTES TO CONSOLIDATED FINANCIAL STATEMENTS (Continued)
(Amounts in tables in thousands, except for per share data or unless otherwise noted)
Deferred income taxes reflect the net effects of temporary differences between the carrying amounts of assets and liabilities for financial reporting purposes and the amounts used for income tax purposes. Significant components of the Company’s deferred tax assets and liabilities are as follows:
December 31, | |||||||
2016 | 2015 | ||||||
Deferred tax assets: | |||||||
Accrued liabilities | $ | 22 | $ | 14 | |||
Deferred revenue | 8,715 | 316 | |||||
Bad debts reserve | 307 | 184 | |||||
Deferred compensation | 12,748 | 11,684 | |||||
Federal net operating loss carry forwards | 18,993 | 18,637 | |||||
State net operating loss carry forwards | 1,899 | 1,691 | |||||
Foreign net operating loss carry forwards | 14,433 | 9,992 | |||||
Deferred rent | 747 | 570 | |||||
Capital loss carry forward | 229 | 232 | |||||
Transaction costs | 2,438 | — | |||||
Other | 2,057 | 1,761 | |||||
Total deferred tax assets | $ | 62,588 | $ | 45,081 | |||
Deferred tax liabilities: | |||||||
Intangible assets | $ | (23,430 | ) | $ | (24,373 | ) | |
Basis difference | (15,323 | ) | — | ||||
Installment sale | (28,020 | ) | — | ||||
Depreciation and amortization | (30,034 | ) | (28,705 | ) | |||
Total deferred tax liabilities | (96,807 | ) | (53,078 | ) | |||
Less: valuation allowance | (14,100 | ) | (4,847 | ) | |||
Net deferred income tax (liabilities) assets | $ | (48,319 | ) | $ | (12,844 | ) | |
As of December 31, 2016, the Company has federal and state income tax net operating loss (NOL) carryforwards of $54.3 million and $36.6 million, respectively, which will expire at various dates from 2017 through 2036. The Company also has foreign NOL carryforwards in various jurisdictions of $75.5 million that have various carryforward periods. Such NOL carryforwards expire as follows:
2017-2021 | $ | 10,937 | |
2022-2026 | 15,647 | ||
2027-2036 | 67,526 | ||
Indefinite | 72,272 | ||
$ | 166,382 | ||
In evaluating the Company’s ability to recover its deferred tax assets within the jurisdiction from which they arise, the Company considers all available positive and negative evidence, including scheduled reversals of deferred tax liabilities, projected future taxable income, tax-planning strategies, and results of recent operations. In projecting future taxable income, the Company begins with historical results and incorporates assumptions including the amount of future state, federal and foreign pretax operating income, the reversal of temporary differences, and the implementation of feasible and prudent tax-planning strategies. These assumptions require significant judgment about the forecasts of future taxable income and are consistent with the plans and estimates the Company is using to manage the underlying businesses.
The foreign NOL carryforwards in the income tax returns filed included unrecognized tax benefits taken in prior years. The NOLs for which a deferred tax asset is recognized for financial statement purposes in accordance with ASC 740 are presented net of these unrecognized tax benefits.
102
SYNCHRONOSS TECHNOLOGIES, INC.
NOTES TO CONSOLIDATED FINANCIAL STATEMENTS (Continued)
(Amounts in tables in thousands, except for per share data or unless otherwise noted)
As of December 31, 2014, a valuation allowance of $2.5 million was recorded to place a full valuation allowance on all deferred tax assets within Spatial U.S. In 2016, a valuation allowance of $41 thousand was released for the utilization of NOL for the current year income. However, the company still believes that there is no positive evidence with regards to the projections for the future income. As such, a valuation allowance of $2.2 million has been recorded to place a full valuation allowance on all the deferred tax assets within Spatial U.S.
The Company continues to evaluate the ability to realize all of its net deferred tax assets at each reporting date and records a benefit for deferred tax assets to the extent it has deferred tax liabilities that provide a source of income to benefit the deferred tax asset. As a result of this analysis, the Company recorded a valuation allowance against the net deferred tax assets of certain foreign jurisdictions as the realization of these assets is not more likely than not, given uncertainty of future earnings in these jurisdictions.
The Company is subject to taxation in the United States and various states and foreign jurisdictions. As of December 31, 2016, the Company’s tax years for 2013, 2014 and 2015 are subject to examination by the tax authorities. With few exceptions, as of December 31, 2016, the Company is no longer subject to U.S. federal, state, local, or foreign examinations by tax authorities for years before 2012.
The Company is currently under income tax examinations in New York and New Jersey for the tax years 2012 through 2014 and currently under Federal tax examination for the tax years 2013 and 2014. The Company does not believe that the results of these audits will have a material effect on its financial position or results of operations.
The Company has provided taxes for $3.3 million of royalty fees paid to its Ireland subsidiary as Subpart F income subject to US tax in 2014. The Company has not provided taxes for the remaining $34.9 million of undistributed earnings of its foreign subsidiaries which the Company plans to reinvest indefinitely outside of the United States. Should the Company decide to repatriate the foreign earnings, it would need to adjust its income tax provision in the period it determined that the earnings will no longer be indefinitely invested outside the United States. Due to the timing and circumstances of repatriation of such earnings, if any, it is not practicable to determine the unrecognized deferred tax liability relating to such amounts
A reconciliation of the amounts of unrecognized tax benefits excluding interest are as follows:
Unrecognized tax benefit at December 31, 2013 | $ | 708 | |
Decreases for tax positions taken during prior year | (218 | ) | |
Reduction due to lapse of applicable statute of limitations | (11 | ) | |
Increases for tax positions of current period | 651 | ||
Unrecognized tax benefit at December 31, 2014 | 1,130 | ||
Decreases for tax positions taken during prior year | 38 | ||
Reduction due to lapse of applicable statute of limitations | (58 | ) | |
Increases for tax positions of current period | 344 | ||
Unrecognized tax benefit at December 31, 2015 | 1,454 | ||
Decreases for tax positions taken during prior year | (30 | ) | |
Reduction due to lapse of applicable statute of limitations | (44 | ) | |
Increases for tax positions of current period | 362 | ||
Unrecognized tax benefit at December 31, 2016 | $ | 1,742 | |
Included in the balance of unrecognized tax benefits as of the years ended December 31, 2016, 2015 and 2014, are $1.7 million, $1.5 million and $1.1 million, respectively, of tax benefits that, if recognized, would affect the effective tax rate.
The Company recognizes interest and penalties, if any, related to unrecognized tax benefits in interest expense. The liability for unrecognized tax benefits excludes accrued interest for the years ended December 31, 2016, 2015 and 2014. The Company believes that it is reasonably possible that approximately $0.2 million of its currently unrecognized tax benefits related to research and development credits, which are individually insignificant, may be recognized by the end of 2016 as a result of a lapse of the statute of limitations.
103
SYNCHRONOSS TECHNOLOGIES, INC.
NOTES TO CONSOLIDATED FINANCIAL STATEMENTS (Continued)
(Amounts in tables in thousands, except for per share data or unless otherwise noted)
17. Earnings Per Share
The following table provides a reconciliation of the numerator and denominator used in computing basic and diluted net income attributable to common stockholders per common share from continued and discontinued operations.
Year ended December 31, | |||||||||||
2016 | 2015 | 2014 | |||||||||
Numerator - Basic: | |||||||||||
Net (loss) income from continuing operations | $ | (66,541 | ) | $ | 6,415 | $ | (2,023 | ) | |||
Net (loss) income attributable to noncontrolling interests | (11,596 | ) | 6,052 | — | |||||||
Net (loss) income from continuing operations attributable to Synchronoss | (54,945 | ) | 363 | (2,023 | ) | ||||||
Net income from discontinued operations, net of taxes | 74,533 | 40,267 | 40,918 | ||||||||
Net income attributable to Synchronoss | $ | 19,588 | $ | 40,630 | $ | 38,895 | |||||
Numerator - Diluted: | |||||||||||
Net (loss) income from continuing operations attributable to Synchronoss | $ | (54,945 | ) | $ | 363 | $ | (2,023 | ) | |||
Income effect for interest on convertible debt, net of tax | — | 1,700 | — | ||||||||
Net (loss) income from continuing operations adjusted for the convertible debt | (54,945 | ) | 2,063 | (2,023 | ) | ||||||
Net income from discontinued operations, net of taxes | 74,533 | 40,267 | 40,918 | ||||||||
Net income attributable to Synchronoss, adjusted for the convertible debt | $ | 19,588 | $ | 42,330 | $ | 38,895 | |||||
Denominator: | |||||||||||
Weighted average common shares outstanding — basic | 43,571 | 42,284 | 40,418 | ||||||||
Dilutive effect of: | |||||||||||
Shares from assumed conversion of convertible debt | — | — | — | ||||||||
Options and unvested restricted shares | — | — | — | ||||||||
Weighted average common shares outstanding — diluted | 43,571 | 42,284 | 40,418 | ||||||||
Basic EPS | |||||||||||
Continuing operations | $ | (1.26 | ) | $ | 0.01 | $ | (0.05 | ) | |||
Discontinued operations | 1.71 | 0.95 | 1.01 | ||||||||
$ | 0.45 | $ | 0.96 | $ | 0.96 | ||||||
Diluted EPS | |||||||||||
Continuing operations | $ | (1.26 | ) | $ | 0.01 | $ | (0.05 | ) | |||
Discontinued operations | 1.71 | 0.95 | 1.01 | ||||||||
$ | 0.45 | $ | 0.96 | $ | 0.96 | ||||||
Anti-dilutive stock options excluded: | 1,089 | 553 | 1,100 | ||||||||
104
SYNCHRONOSS TECHNOLOGIES, INC.
NOTES TO CONSOLIDATED FINANCIAL STATEMENTS (Continued)
(Amounts in tables in thousands, except for per share data or unless otherwise noted)
18. Legal Matters
On October 7, 2014, the Company filed an amended complaint in the United States District Court for the District of New Jersey (Civ Act. No. 3:14-cv-06220) against F-Secure Corporation and F-Secure, Inc. (collectively, “F-Secure"), claiming that F-Secure has infringed, and continues to infringe, several of the Company’s patents. In February 2015, Synchronoss entered into a patent license and settlement agreement with F-Secure Corporation and F-Secure, Inc. whereby the Company granted each of these companies (but not their subsidiaries or affiliates) a limited license to Synchronoss’ patents. As a result of entering into the patent license and settlement agreement, the parties filed a joint stipulation to dismiss the above complaint.
The Company’s 2011 acquisition agreement with Miyowa SA provided that former shareholders of Miyowa SA would be eligible for earn-out payments, to the extent specified business milestones were achieved following the acquisition. In December 2013, Eurowebfund and Bakamar, two former shareholders of Miyowa SA, filed a complaint against the Company in the Commercial Court of Paris, France claiming that they are entitled to certain earn-out payments under the acquisition agreement. The Company was served with a copy of this complaint in January 2014. On December 3, 2015, the Court dismissed all claims in the complaint against the Company. On December 19, 2015, the former shareholders of Miyowa filed an appeal with the Court of Appeal of Paris, France, appealing the Court’s decision. Although the Company cannot predict the outcome of the appeal, or estimate any potential loss if the outcome is adverse, due to the inherent uncertainties of litigation, the Company believes the positions of Eurowebfund and Bakamar are without merit, and the Company intends to vigorously defend all claims brought by them.
The Company is not currently subject to any legal proceedings that could have a material adverse effect on its operations; however, it may from time to time become a party to various legal proceedings arising in the ordinary course of its business. The Company is currently the plaintiff in several patent infringement cases. The defendants in several of these cases have filed counterclaims. Although the Company cannot predict the outcome of the cases at this time due to the inherent uncertainties of litigation, the Company continues to pursue its claims and believes that the counterclaims are without merit, and the Company intends to defend all of such counterclaims.
19. Subsequent Events Review
On January 19, 2017, Synchronoss completed the acquisition of Intralinks at a price of $13.00 per share, or $850.0 million, net of working capital adjustments. In connection with the acquisition, the Company entered into a credit agreement (the "2017 Credit Agreement"). Synchronoss paid a total of approximately $904.1 million, including repayment of existing indebtedness for both Synchronoss, including the Amended Credit Facility and Intralinks, fees and costs associated with the 2017 Term Facility (as defined below) and other transaction related expenses and funded the payments required to complete the acquisition with cash on hand and proceeds from the 2017 Credit Agreement. The Company's obligations under the 2017 Credit Agreement are guaranteed by certain of their subsidiaries, including Intralinks, and secured by substantially all of their assets and the guarantors.
The Company believes that the acquisition will allow the Company to leverage the Synchronoss' product portfolio, go-to-market strategy and diversified customer footprint and deploy an enhanced enterprise and mobile solution to customers while opening up new enterprise distribution channels across the world.
At this time, the required financial information needed to complete the initial purchase price allocation of all of the tangible and identifiable intangible assets and liabilities, as well as the required supplemental pro forma results of the combined entity, is incomplete.
The term loan lenders under the 2017 Credit Agreement have advanced to senior secured term loans in an aggregate principal amount of $900 million with a maturity date of January 19, 2024 (the “ 2017 Term Facility”). The revolving lenders under the Credit Agreement have provided Synchronoss with a revolving credit facility of up to $200 million with a maturity date of January 19, 2022 (the “Revolving Facility”). The term loans under the Term Facility will amortize at 1% per annum in equal quarterly installments with the balance payable on the final maturity date. The proceeds of the Term Facility are being used to finance a portion of the cash consideration in the Offer and the Merger, to refinance certain existing indebtedness of Synchronoss, including the Amended Credit Facility and indebtedness of Intralinks (or its subsidiaries) and to pay related fees and expenses. The Revolving Facility includes borrowing capacity available for letters of credit and for borrowings on same-day notice under swingline loans, and borrowing thereunder may be used for working capital and other general corporate purposes.
105
SYNCHRONOSS TECHNOLOGIES, INC.
NOTES TO CONSOLIDATED FINANCIAL STATEMENTS (Continued)
(Amounts in tables in thousands, except for per share data or unless otherwise noted)
Loans under the 2017 Term Facility bear interest at a rate equal to, at Synchronoss' option, the adjusted LIBOR rate for an applicable interest period or an alternate base rate, in each case, plus an applicable margin of 2.75% or 1.75%, respectively. The revolving loans under the Revolving Facility initially bear interest at a rate equal to, at Synchronoss' option, the adjusted LIBOR rate or an alternate base rate, in each case, plus an applicable margin of 2.50% or 1.50%, respectively, subject to step-downs based on the Company's ratio of first lien secured debt to adjusted EBITDA.
Subject to certain customary exceptions, loans under the Term Facility are subject to mandatory prepayments in amounts equal to: (1) 100% of the net cash proceeds from any non-ordinary course sale or other disposition of assets (including as a result of casualty or condemnation) by Synchronoss or its restricted subsidiaries subject to customary reinvestment provisions and certain other exceptions; (2) 100% of the net cash proceeds from incurrences of debt (other than permitted debt); and (3) a customary annual excess cash flow sweep at levels based on Parent’s then applicable ratio of first lien secured debt to adjusted EBITDA.
The 2017 Credit Agreement contains a number of customary affirmative and negative covenants and events of default, which, among other things, restrict the ability of Synchronoss and its subsidiaries to incur debt, allow liens on assets, make investments, pay dividends or prepay certain other debt. The 2017 Credit Agreement also requires Synchronoss to comply with certain financial maintenance covenants, including a total gross leverage ratio and an interest charge coverage ratio.
Certain of the lenders under the 2017 Credit Agreement, or their affiliates, have provided, and may in the future from time to time provide, certain commercial and investment banking, financial advisory and other services in the ordinary course of business for the registrant and its affiliates, for which they have in the past and may in the future receive customary fees and commissions.
On February 1, 2017 the Company completed a divestiture of its SpeechCycle business, to an unrelated third party, for consideration of $13.5 million. As part of the divestiture, Synchronoss entered into a 1 year transition services agreement with the acquirer to support various indirect activities such as customer software support, technical support services, maintenance and general & administrative support services.
106
ITEM 9. CHANGES IN AND DISAGREEMENTS WITH ACCOUNTANTS ON ACCOUNTING AND FINANCIAL DISCLOSURE
Not applicable.
ITEM 9A. CONTROLS AND PROCEDURES
Evaluation of Disclosure Controls and Procedures.
We maintain disclosure controls and procedures (as defined in Rules 13a-15(e) or 15d-15(e) under the Securities Exchange Act of 1934, as amended (the “Exchange Act”)), that are designed to ensure that information we are required to disclose in reports that we file or submit under the Exchange Act is recorded, processed, summarized and reported within the time periods specified in the SEC rules and forms, and that such information is accumulated and communicated to our management, including our principal executive officer and principal financial officer, as appropriate, to allow timely decisions regarding required disclosure. In designing and evaluating the disclosure controls and procedures, management recognized that any controls and procedures, no matter how well designed and operated, can provide only reasonable assurance of achieving the desired control objectives. Under the supervision and with the participation of our management, including our Principal Executive Officer and our Principal Financial Officer, we evaluated the effectiveness of the design and operation of our disclosure controls and procedures as of December 31, 2016. Based upon that evaluation, our Principal Executive Officer and Principal Financial Officer concluded that our disclosure controls and procedures are effective as of December 31, 2016, the end of the period covered by this yearly report. Management believes that the Consolidated Financial Statements included in this annual report are fairly presented in all material respects in accordance with GAAP, and our Principal Executive Officer and Principal Financial Officer have certified that they fairly present in all material respects our financial condition, results of operations and cash flows for each of the periods presented.
Changes in internal controls over financial reporting
On March 1, 2016, we completed our acquisition of Openwave Messaging, Inc. (“Openwave”). SEC guidance permits management to omit an assessment of an acquired business' internal control over financial reporting from management's assessment of internal control over financial reporting for a period not to exceed one year from the date of the acquisition. Accordingly, we have not assessed Openwaves’ internal control over financial reporting as of December 31, 2016.
Excluding the Openwave acquisition, there were no changes in our internal control over financial reporting during the year ended December 31, 2016 that have materially affected, or are reasonably likely to materially affect, our internal control over financial reporting.
Management’s Annual Report on Internal Control over Financial Reporting
Our management is responsible for establishing and maintaining adequate internal control over financial reporting.
Internal control over financial reporting is a process designed to provide reasonable assurance regarding the reliability of financial reporting and the preparation of financial statements for external purposes in accordance with accounting principles generally accepted in the United States of America. Internal control over financial reporting is defined in Rules 13a‑15(f) or 15d‑15(f) promulgated under the Exchange Act as a process designed by, or under the supervision of, the Company’s principal executive and principal financial officers and effected by the Company’s Board of Directors, management and other personnel, to provide reasonable assurance regarding the reliability of financial reporting and the preparation of financial statements for external purposes in accordance with generally accepted accounting principles and includes those policies and procedures that:
• | Pertain to the maintenance of records that in reasonable detail accurately and fairly reflect the transactions and dispositions of the assets of the Company; |
• | Provide reasonable assurance that transactions are recorded as necessary to permit preparation of financial statements in accordance with generally accepted accounting principles, and that receipts and expenditures of the Company are being made only in accordance with authorizations of management and directors of the Company; and |
• | Provide reasonable assurance regarding prevention or timely detection of unauthorized acquisition, use or disposition of the Company’s assets that could have a material effect on the financial statements. |
To assist management, the Company has established procedures to verify and monitor its internal controls. Because of its inherent limitations, however, internal control over financial reporting may not prevent or detect misstatements. Projections of
107
any evaluation of effectiveness to future periods are subject to the risk that controls may become inadequate because of changes in conditions, or that the degree of compliance with the policies or procedures may deteriorate.
Management assessed the effectiveness of its internal control over financial reporting as of December 31, 2016. In making this assessment, the Company’s management used the criteria set forth by the Committee of Sponsoring Organizations of the Treadway Commission (2013 framework) (the "COSO" criteria).
We have excluded from the scope of our assessment of internal control over financial reporting the operations and related assets of Openwave which we acquired in 2016. At December 31, 2016 and for the period from acquisition through December 31, 2016, total assets, net assets, revenues and net income of Openwave represented 6%, 6%, 9% and (20%) of Synchronoss' consolidated total assets, net assets, revenues and net income, respectively, as of and for the year ended December 31, 2016.
Based on our assessment, management concluded that, as of December 31, 2016, its internal control over financial reporting was effective.
The effectiveness of the Company’s internal control over financial reporting as of December 31, 2016 has been audited by Ernst & Young LLP, its independent registered public accounting firm, as stated in their report which is included in Item 9 of this Annual Report on Form 10‑K.
Inherent Limitations on Effectiveness of Controls
The Company’s management, including its Principal Executive Officer and Principal Financial Officer, does not expect that its disclosure controls or its internal control over financial reporting will prevent all errors and all fraud. A control system, no matter how well conceived and operated, can provide only reasonable, not absolute, assurance that the objectives of the control system are met. Further, the design of a control system must reflect the fact that there are resource constraints, and the benefits of controls must be considered relative to their costs. Because of the inherent limitations in all control systems, no evaluation of controls can provide absolute assurance that all control issues and instances of fraud, if any, within the Company’s operations have been detected. These inherent limitations include the realities that judgments in decision‑making can be faulty, and that breakdowns can occur because of a simple error or mistake. Additionally, controls can be circumvented by the individual acts of some persons, by collusion of two or more people or by management override of the controls. The design of any system of controls also is based in part upon certain assumptions about the likelihood of future events, and there can be no assurance that any design will succeed in achieving its stated goals under all potential future conditions; over time, controls may become inadequate because of changes in conditions, or the degree of compliance with policies or procedures may deteriorate. Because of the inherent limitations in a cost‑effective control system, misstatements due to error or fraud may occur and not be detected.
108
Report of Independent Registered Public Accounting Firm
The Board of Directors and Stockholders of
Synchronoss Technologies, Inc.
We have audited Synchronoss Technologies, Inc.’s internal control over financial reporting as of December 31, 2016, based on criteria established in Internal Control-Integrated Framework issued by the Committee of Sponsoring Organizations of the Treadway Commission (2013 framework) (the COSO criteria). Synchronoss Technologies, Inc.’s management is responsible for maintaining effective internal control over financial reporting, and for its assessment of the effectiveness of internal control over financial reporting included in the accompanying Management’s Annual Report on Internal Control over Financial Reporting. Our responsibility is to express an opinion on the company’s internal control over financial reporting based on our audit.
We conducted our audit in accordance with the standards of the Public Company Accounting Oversight Board (United States). Those standards require that we plan and perform the audit to obtain reasonable assurance about whether effective internal control over financial reporting was maintained in all material respects. Our audit included obtaining an understanding of internal control over financial reporting, assessing the risk that a material weakness exists, testing and evaluating the design and operating effectiveness of internal control based on the assessed risk, and performing such other procedures as we considered necessary in the circumstances. We believe that our audit provides a reasonable basis for our opinion.
A company’s internal control over financial reporting is a process designed to provide reasonable assurance regarding the reliability of financial reporting and the preparation of financial statements for external purposes in accordance with generally accepted accounting principles. A company’s internal control over financial reporting includes those policies and procedures that (1) pertain to the maintenance of records that, in reasonable detail, accurately and fairly reflect the transactions and dispositions of the assets of the company; (2) provide reasonable assurance that transactions are recorded as necessary to permit preparation of financial statements in accordance with generally accepted accounting principles, and that receipts and expenditures of the company are being made only in accordance with authorizations of management and directors of the company; and (3) provide reasonable assurance regarding prevention or timely detection of unauthorized acquisition, use or disposition of the company’s assets that could have a material effect on the financial statements.
Because of its inherent limitations, internal control over financial reporting may not prevent or detect misstatements. Also, projections of any evaluation of effectiveness to future periods are subject to the risk that controls may become inadequate because of changes in conditions, or that the degree of compliance with the policies or procedures may deteriorate.
As indicated in the accompanying Management’s Annual Report on Internal Control over Financial Reporting, management’s assessment of and conclusion on the effectiveness of internal control over financial reporting did not include the internal controls of Openwave Messaging, Inc., which is included in the 2016 consolidated financial statements of Synchronoss Technologies, Inc. since the acquisition date of March 1, 2016 and constituted $55.2 million and $38.0 million of total and net assets, respectively, as of December 31, 2016 and $42.5 million and $3.9 million of revenues and net loss, respectively, for the year then ended. Our audit of internal control over financial reporting of Synchronoss Technologies, Inc. also did not include an evaluation of the internal control over financial reporting of Openwave Messaging, Inc.
In our opinion, Synchronoss Technologies, Inc. maintained, in all material respects, effective internal control over financial reporting as of December 31, 2016, based on the COSO criteria.
We also have audited, in accordance with the standards of the Public Company Accounting Oversight Board (United States), the consolidated balance sheets of Synchronoss Technologies, Inc. as of December 31, 2016 and 2015 and the related consolidated statements of income and comprehensive income, shareholders’ equity and cash flows for each of the three years in the period ended December 31, 2016 of Synchronoss Technologies, Inc. and our report dated February 27, 2017 expressed an unqualified opinion thereon.
/s/ Ernst & Young LLP
Metropark, New Jersey
February 27, 2017
109
ITEM 9B. OTHER INFORMATION
None.
110
PART III
ITEM 10. DIRECTORS AND EXECUTIVE OFFICERS OF THE REGISTRANT
(a) | Identification of Directors. Information concerning the directors of Synchronoss is set forth under the heading “Election of Directors” in the Synchronoss Proxy Statement for the 2017 Annual Meeting of Stockholders and is incorporated herein by reference. |
(b) | Audit Committee Financial Expert. Information concerning Synchronoss’ audit committee financial expert is set forth under the heading “Audit Committee” in the Synchronoss Proxy Statement for the 2017 Annual Meeting of Stockholders and is incorporated herein by reference. |
(c) | Identification of the Audit Committee. Information concerning the audit committee of Synchronoss is set forth under the heading “Audit Committee” in the Synchronoss Proxy Statement for the 2017 Annual Meeting of Stockholders and is incorporated herein by reference. |
(d) | Section 16(a) Beneficial Ownership Reporting Compliance. Information concerning compliance with beneficial ownership reporting requirements is set forth under the caption “Section 16(a) Beneficial Ownership Reporting Compliance” in the Synchronoss Proxy Statement for the 2017 Annual Meeting of Stockholders and is incorporated herein by reference. |
Code of Ethics. Information concerning the Synchronoss Code of Business Conduct is set forth under the caption “Code of Business Conduct” in the Synchronoss Proxy Statement for the 2017 Annual Meeting of Stockholders and is incorporated herein by reference. The Company intends to disclose on its website any amendments to, or waivers from, its Code of Business Conduct that are required to be disclosed pursuant to the rules of the SEC. Information contained on, or connected to, our website is not incorporated by reference into this annual report and should not be considered part of this report or any other filing that we make with the SEC.
ITEM 11. EXECUTIVE COMPENSATION
Information concerning executive compensation is set forth under the headings “Compensation of Executive Officers” in the Synchronoss Proxy Statement for the 2017 Annual Meeting of Stockholders and is incorporated herein by reference.
ITEM 12. SECURITY OWNERSHIP OF CERTAIN BENEFICIAL OWNERS AND MANAGEMENT AND RELATED STOCKHOLDER MATTERS
Information concerning shares of Synchronoss equity securities beneficially owned by certain beneficial owners and by management is set forth under the heading “Equity Security Ownership of Certain Beneficial Owners and Management” in the Synchronoss Proxy Statement for the 2017 Annual Meeting of Stockholders and is incorporated herein by reference.
ITEM 13. CERTAIN RELATIONSHIPS AND RELATED TRANSACTIONS
Information concerning certain relationships and related transactions is set forth under the heading “Certain Related Party Transactions” in the Synchronoss Proxy Statement for the 2017 Annual Meeting of Stockholders and is incorporated herein by reference.
ITEM 14. PRINCIPAL ACCOUNTANT FEES AND SERVICES
Information concerning fees and services of the Company’s principal accountants is set forth under the heading “Report of the Audit Committee” and “Independent Registered Public Accounting Firm’s Fees” in the Synchronoss Proxy Statement for the 2017 Annual Meeting of Stockholders and is incorporated herein by reference.
111
PART IV
ITEM 15. EXHIBITS AND FINANCIAL STATEMENT SCHEDULES
(a)(1) Financial Statements:
(a)(2) Schedule for the years ended December 31, 2016, 2015, 2014:
II—Valuation and Qualifying Accounts
All other Schedules have been omitted because they are not applicable or the required information is shown in the financial statements or notes thereto.
(a)(3) Exhibits:
Exhibit No. | Description | ||
2.1 | Agreement and Plan of Merger by and among Synchronoss Technologies, Inc., GL Merger Sub, Inc. and Intralinks Holdings, Inc. dated December 5, 2016, incorporated by reference to Exhibit 2.1 to the Registrant’s Current report on Form 8-K, filed December 6, 2016 (File No. 005-85999). | ||
3.1 | Restated Certificate of Incorporation of the Registrant, incorporated by reference to Registrant’s Registration Statement on Form S‑1 (Commission File No. 333‑132080). | ||
3.2 | Amended and Restated Bylaws of the Registrant, incorporated by reference to Registrant’s Registration Statement on Form S‑1 (Commission File No. 333‑132080). | ||
4.1 | Reference is made to Exhibits 3.1 and 3.2. | ||
4.2 | Amended and Restated Investors Rights Agreement, dated December 22, 2000, by and among the Registrant, certain stockholders and the investors listed on the signature pages thereto, incorporated by reference to Registrant’s Registration Statement on Form S‑1 (Commission File No. 333‑132080). | ||
4.3 | Amendment No. 1 to Synchronoss Technologies, Inc. Amended and Restated Investors Rights Agreement, dated April 27, 2001, by and among the Registrant, certain stockholders and the investors listed on the signature pages thereto, incorporated by reference to Registrant’s Registration Statement on Form S‑1 (Commission File No. 333‑132080). | ||
4.4 | Registration Rights Agreement, dated November 13, 2000, by and among the Registrant and the investors listed on the signature pages thereto, incorporated by reference to Registrant’s Registration Statement on Form S‑1 (Commission File No. 333‑132080). | ||
4.5 | Amendment No. 1 to Synchronoss Technologies, Inc. Registration Rights Agreement, dated May 21, 2001, by and among the Registrant, certain stockholders listed on the signature pages thereto and Silicon Valley Bank, incorporated by reference to Registrant’s Registration Statement on Form S‑1 (Commission File No. 333‑132080). | ||
4.6 | Form of Common Stock Certificate, incorporated by reference to Registrant’s Registration Statement on Form S-1 (Commission File No. 333-132080) | ||
4.7 | Form of Indenture for Convertible Senior Notes, incorporated by reference to Registrant’s Registration Statement on Form S-3 (Commission File No. 333-197871) | ||
10.1 | Form of Indemnification Agreement between the Registrant and each of its directors and executive officers, incorporated by reference to Registrant’s Registration Statement on Form S‑1 (Commission File No. 333‑132080). | ||
10.2 | Synchronoss Technologies, Inc. 2000 Stock Plan and forms of agreements thereunder, incorporated by reference to Registrant’s Registration Statement on Form S‑1 (Commission File No. 333‑132080). | ||
10.3 | Amendment No. 1 to Synchronoss Technologies, Inc. 2000 Stock Plan, incorporated by reference to Registrant’s Registration Statement on Form S‑1 (Commission File No. 333‑132080). | ||
10.4 | 2006 Equity Incentive Plan, as amended and restated, incorporated by reference to Registrant’s Schedule 14A dated April 8, 2010. | ||
10.4.1 | 2010 New Hire Equity Incentive Plan, incorporated by reference to Registrant’s Registration Statement on Form S‑8 (Commission File No. 333‑168745). | ||
10.4.2 | 2015 Equity Incentive Plan, incorporated by reference to Registrant’s Registration Statement on Form S‑8 (Commission File No. 333‑204311). | ||
10.5 | Employee Stock Purchase Plan, incorporated by reference to Registrant’s Annual Report on Form 10‑K for the year ended December 31, 2011. | ||
10.6 | Lease Agreement between the Registrant and Wells Reit—Bridgewater NJ, LLC for the premises located at 200 Crossing Boulevard, Bridgewater, New Jersey, dated as of October 27, 2011, incorporated by reference to Registrant’s Annual Report on Form 10‑K for the year ended December 31, 2011. | ||
112
Exhibit No. | Description | ||
10.7 | Credit Agreement dated as of September 27, 2013 between the Registrant and JPMorgan Chase Bank, N.A., as Administrative Agent, incorporated by reference to Registrant’s Quarterly Report on Form 10‑Q for the quarter ended September 30, 2013. | ||
10.8‡ | Cingular Master Services Agreement, effective September 1, 2005 by and between the Registrant and Cingular Wireless LLC, incorporated by reference to Registrant’s Annual Report on Form 10‑K for the year ended December 31, 2008. | ||
10.9 | Sub10ordinate Material and Services Agreement No. SG021306.S.025 by and between the Registrant and AT&T Services, Inc. dated as of August 1, 2013, incorporated by reference to Registrant's Annual Report on Form 10-K for the year ended December 31, 2013. | ||
10.10* | Amendment 1 effective as of January 1, 2016 to Subordinate Material and Services Agreement No. SG021306.S.025 by and between the Registrant and AT&T Services, Inc. | ||
10.11* | Order No.SG021306.S.025.S.007 effective as of January 1, 2016 by and between the Registrant and AT&T Services, Inc. | ||
10.12* | Amendment No. 1 effective as of January 1, 2016 to Order No. SG021306.S.025.S.001 dated as of August 1, 2013 by and between the Registrant and AT&T Services, Inc. together with Amended and Restated Order No. SG021306.S.025.S.001. | ||
10.13* | Amendment No. 2 effective as of January 1, 2016 to Order No. SG021306.S.025.S.002 dated as of August 1, 2013 by and between the Registrant and AT&T Services, Inc., together with Amended and Restated Order No. SG021306.S.025.S.002. | ||
10.14* | Amendment No. 3 effective as of January 1, 2016 to Order No. SG021306.S.025.S.003 dated as of August 1, 2013 by and between the Registrant and AT&T Services, Inc. | ||
10.15* | Amendment No. 4 effective as of January 1, 2016 to Order No. SG021306.S.025.S.003 dated as of August 1, 2013 by and between the Registrant and AT&T Services, Inc., together with Amended and Restated Order No. SG021306.S.025.S.003 | ||
10.16* | Amendment No. 5 effective as of January 1, 2016 to Order No. SG021306.S.025.S.004 dated as of August 1, 2013 by and between the Registrant and AT&T Services, Inc. together with Amended and Restated Order No. SG021306.S.025.S.004. | ||
10.17 | Commitment Letter, dated as of December 5, 2016, by and among Synchronoss Technologies, Inc. and Goldman Sachs Bank USA, Credit Suisse AG and Credit Suisse Securities (USA) LLC, incorporated by reference to Exhibit 10.1 to the Registrant’s Current report on Form 8-K, filed December 6, 2016 (File No. 005-85999). | ||
10.18 | Form of Tender and Support Agreement by and between Synchronoss Technologies, Inc., GL Merger Sub, Inc. and certain stockholders of Intralinks Holdings, Inc. dated December 5, 2016, incorporated by reference to Exhibit 99.1 to the Registrant’s Current report on Form 8-K, filed December 6, 2016 (File No. 005-85999). | ||
10.19† | Employment Agreement dated as of August 1, 2016 between the Registrant and Stephen G. Waldis, incorporated by reference to Exhibit 10.11 to the Registrant’s Annual Report on Form 10-K for the year ended December 31, 2015 (File No. 000-5209) | ||
10.18† | Employment Agreement dated as of August 1, 2016 between the Registrant and Karen Rosenberger, incorporated by reference to Exhibit 10.12 to the Registrant’s Annual Report on Form 10-K for the year ended December 31, 2015 (File No. 000-5209) | ||
10.19† | Employment Agreement dated as of August 1, 2016 between the Registrant and Robert Garcia, incorporated by reference to Exhibit 10.13 to the Registrant’s Annual Report on Form 10-K for the year ended December 31, 2015 (File No.000-5209) | ||
10.20† | Employment Agreement dated as of August 1, 2016 between the Registrant and Daniel Rizer, incorporated by reference to Exhibit10.11 to the Registrant’s Quarterly Report on Form 10-Q for the quarter ended March 31, 2016 (File No. 000-5209). | ||
10.21† | Employment Agreement dated as of January 1, 2015 between the Registrant and David Schuette, incorporated by reference to Exhibit 10.11 to the Registrant’s Annual Report on Form 10-K for the year ended December 31, 2016 (File No. 000-5209). | ||
10.22 | Share Purchase Agreement dated as of December 24, 2012 by and between Synchronoss Technologies Ireland Ltd. and Research In Motion Ltd, incorporated by reference to Registrant’s Annual report on Form 10‑K for the year ended December 31, 2012. | ||
21.1 | List of subsidiaries. | ||
23.1 | Consent of Ernst & Young, LLP, Independent Registered Public Accounting Firm. | ||
24 | Power of Attorney (see signature page to this Annual Report on Form 10‑K) | ||
31.1 | Certification of Principal Executive Officer pursuant to Rule 13a‑14(a) of the Exchange Act, as adopted pursuant to section 302 of the Sarbanes‑Oxley Act of 2002 | ||
31.2 | Certification of Principal Financial Officer pursuant to Rule 13a‑14(a) of the Exchange Act, as adopted pursuant to section 302 of the Sarbanes‑Oxley Act of 2002 | ||
32.1 | Certification of Principal Executive Officer pursuant to Rule 13a‑14(b) of the Exchange Act and section 18 U.S.C. Section 1350, as adopted pursuant to section 906 of the Sarbanes‑Oxley Act of 2002 | ||
32.2 | Certification of Principal Financial Officer pursuant to Rule 13a‑14(b) of the Exchange Act and section 18 U.S.C. Section 1350, as adopted pursuant to section 906 of the Sarbanes‑Oxley Act of 2002 | ||
101.INS | XBRL Instance Document | ||
101.SCH | XBRL Schema Document | ||
101.CAL | XBRL Calculation Linkbase Document | ||
101.DEF | XBRL Taxonomy Extension Definition Linkbase | ||
101.LAB | XBRL Labels Linkbase Document | ||
101.PRE | XBRL Presentation Linkbase Document | ||
__________________________________________________________
† | Compensation Arrangement. |
* | Confidential treatment has been requested for portions of this document. The omitted portions of this document have been filed with the Securities and Exchange Commission. |
113
‡ | Confidential treatment has been granted with respect to certain provisions of this exhibit. |
(b) | Exhibits. |
See (a)(3) above.
(c) | Financial Statement Schedule. |
ITEM 16. FORM 10-K SUMMARY
None.
SCHEDULE II—VALUATION AND QUALIFYING ACCOUNTS
December 31, 2016, 2015, and 2014:
Beginning | Ending | |||||||||||||||
Balance | Additions | Reductions | Balance | |||||||||||||
(In thousands) | ||||||||||||||||
Allowance for doubtful receivables | ||||||||||||||||
2016 | $ | 3,029 | $ | 7,433 | $ | (8,706 | ) | $ | 1,756 | |||||||
2015 | $ | 88 | $ | 3,872 | $ | (931 | ) | $ | 3,029 | |||||||
2014 | $ | 237 | $ | 418 | $ | (567 | ) | $ | 88 | |||||||
Beginning | Ending | |||||||||||||||
Balance | Additions | Reductions | Balance | |||||||||||||
(In thousands) | ||||||||||||||||
Valuation allowance for deferred tax assets | ||||||||||||||||
2016 | $ | 4,847 | $ | 9,370 | $ | (117 | ) | $ | 14,100 | |||||||
2015 | $ | 2,553 | $ | 2,521 | $ | (227 | ) | $ | 4,847 | |||||||
2014 | $ | 2,803 | $ | 2,724 | $ | (2,974 | ) | $ | 2,553 | |||||||
114
SIGNATURES
Pursuant to the requirements of Section 13 or 15(d) of the Securities Exchange Act of 1934, the registrant has caused this Report to be signed on its behalf by the undersigned, thereunto duly authorized.
SYNCHRONOSS TECHNOLOGIES, INC. (Registrant) | ||
By | /s/ Stephen G. Waldis | |
Stephen G. Waldis, Founder and Executive Chairman | ||
February 27, 2017
POWER OF ATTORNEY
KNOW ALL PERSONS BY THESE PRESENTS, that each person whose signature appears below constitutes and appoints Ronald J. Prague or Karen L. Rosenberger, or either of them, each with the power of substitution, their attorney‑in‑fact, to sign any amendments to this Form 10‑K (including post‑effective amendments), and to file the same, with exhibits thereto and other documents in connection therewith, with the Securities and Exchange Commission, hereby ratifying and confirming all that each of said attorneys‑in‑fact, or their substitute or substitutes, may do or cause to be done by virtue hereof.
Pursuant to the requirements of the Securities Exchange Act of 1934, this report has been signed below by the following persons on behalf of the registrant and in the capacities and on the dates indicated.
Signature | ||
/s/ Stephen G. Waldis | Executive Chairman, Principal Executive Officer & Director | February 27, 2017 |
Stephen G. Waldis | (Principal Executive Officer) | |
/s/ Karen Rosenberger | Chief Financial Officer | February 27, 2017 |
Karen L. Rosenberger | (Principal Financial Officer) | |
/s/ Ronald W. Hovsepian | Director | February 27, 2017 |
Ronald W. Hovsepian | ||
/s/ William J. Cadogan | Director | February 27, 2017 |
William J. Cadogan | ||
/s/ Thomas J. Hopkins | Director | February 27, 2017 |
Thomas J. Hopkins | ||
/s/ James M. McCormick | Director | February 27, 2017 |
James M. McCormick | ||
/s/ Donnie M. Moore | Director | February 27, 2017 |
Donnie M. Moore | ||
115