Attached files
| file | filename |
|---|---|
| EX-31.2 - EXHIBIT 31.2 - WHITEWAVE FOODS Co | wwav-20161231exx312.htm |
| EX-32.2 - EXHIBIT 32.2 - WHITEWAVE FOODS Co | wwav-20161231exx322.htm |
| EX-32.1 - EXHIBIT 32.1 - WHITEWAVE FOODS Co | wwav-20161231exx321.htm |
| EX-31.1 - EXHIBIT 31.1 - WHITEWAVE FOODS Co | wwav-20161231exx311.htm |
| EX-23 - EXHIBIT 23 - WHITEWAVE FOODS Co | wwav-20161231exx23.htm |
| EX-21 - EXHIBIT 21 - WHITEWAVE FOODS Co | wwav-20161231exx21.htm |
| EX-4.5 - EXHIBIT 4.5 - WHITEWAVE FOODS Co | wwav-20161231exx45.htm |
| EX-4.4 - EXHIBIT 4.4 - WHITEWAVE FOODS Co | wwav-20161231exx44.htm |
| EX-4.3 - EXHIBIT 4.3 - WHITEWAVE FOODS Co | wwav-20161231exx43.htm |
UNITED STATES
SECURITIES AND EXCHANGE COMMISSION
Washington, D.C. 20549
Form 10-K
(Mark One)
x | ANNUAL REPORT PURSUANT TO SECTION 13 OR 15(d) OF THE SECURITIES EXCHANGE ACT OF 1934 For The Fiscal Year Ended December 31, 2016 |
OR
¨ | TRANSITION REPORT PURSUANT TO SECTION 13 OR 15(d) OF THE SECURITIES EXCHANGE ACT OF 1934 For the Transition Period from to |
Commission File Number 001-35708
The WhiteWave Foods Company
(Exact name of Registrant as specified in its charter)

Delaware | 46-0631061 | |
(State or other jurisdiction of incorporation or organization) | (I.R.S. Employer Identification No.) | |
1225 Seventeenth Street, Suite 1000
Denver, Colorado 80202
(303) 635-4500
(Address, including zip code, and telephone number, including
area code, of Registrant’s principal executive offices)
Securities Registered Pursuant to Section 12(b) of the Act:
Title of Each Class | Name of Each Exchange on Which Registered | |
Common Stock, $.01 par value | New York Stock Exchange | |
Securities Registered Pursuant to Section 12(g) of the Act: None
Indicate by check mark if the registrant is a well-known seasoned-issuer, as defined in Rule 405 of the Securities Act. Yes x No ¨
Indicate by check mark if the registrant is not required to file reports pursuant to Section 13 or Section 15(d) of the Act. Yes ¨ No x
Indicate by check mark whether the registrant (1) has filed all reports required to be filed by Section 13 or 15(d) of the Securities Exchange Act of 1934 during the preceding 12 months (or for such shorter period that the registrant was required to file such reports), and (2) has been subject to such filing requirements for the past 90 days. Yes x No ¨
Indicate by check mark whether the registrant has submitted electronically and posted on its corporate Web site, if any, every Interactive Data File required to be submitted and posted pursuant to Rule 405 of Regulation S-T (§232.405 of this chapter) during the preceding 12 months (or for such shorter period that the registrant was required to submit and post such files). Yes x No ¨
Indicate by check mark if disclosure of delinquent filers pursuant to Item 405 of Regulation S-K is not contained herein, and will not be contained, to the best of registrant’s knowledge, in definitive proxy or information statements incorporated by reference in Part III of this Form 10-K or any amendment to this Form 10-K ¨
Indicate by check mark whether the registrant is a large accelerated filer, an accelerated filer, a non-accelerated filer, or a smaller reporting company. See the definitions of “large accelerated filer,” “accelerated filer” and “smaller reporting company” in Rule 12b-2 of the Exchange Act. (Check one):
Large accelerated filer x | Accelerated filer ¨ | Non-accelerated filer ¨ | Smaller reporting company ¨ | |||
(Do not check if a smaller reporting company) | ||||||
Indicate by check mark whether the registrant is a shell company (as defined in Rule 12b-2 of the Exchange Act). Yes ¨ No x
The aggregate market value of the registrant’s voting and non-voting common stock held by non-affiliates of the registrant at June 30, 2016, based on the closing price for the registrant’s common stock on the New York Stock Exchange on June 30, 2016, was approximately $8.1 billion.
As of January 31, 2017, there were 177,370,743 outstanding shares of common stock, par value $0.01 per share.
DOCUMENTS INCORPORATED BY REFERENCE
Information called for by Part III of this Annual Report on Form 10-K will either be included in a Form 10-K/A or incorporated by reference from the registrant’s definitive proxy statement for its 2017 annual meeting of stockholders, either of which will be filed within 120 days of the registrant’s fiscal year end.
TABLE OF CONTENTS
Item | Page | |
1 | ||
1A | ||
1B | ||
2 | ||
3 | ||
4 | ||
5 | ||
6 | ||
7 | ||
7A | ||
8 | ||
9 | ||
9A | ||
10 | ||
11 | ||
12 | ||
13 | ||
14 | ||
15 | ||
Forward-Looking Statements
This Annual Report on Form 10-K (the “Form 10-K”) contains forward-looking statements within the meaning of the Private Securities Litigation Reform Act of 1995, which are subject to risks, uncertainties and assumptions that are difficult to predict. Forward-looking statements are predictions based on expectations and projections about future events, and are not statements of historical fact. Forward-looking statements include statements concerning business strategy, plans and prospects, among other things, including anticipated trends and developments in and management plans for our business and the markets in which we operate. In some cases, you can identify these statements by forward-looking words, such as “estimate,” “expect,” “anticipate,” “project,” “plan,” “intend,” “believe,” “forecast,” “foresee,” “likely,” “may,” “should,” “goal,” “target,” “might,” “will,” “could,” “predict,” and “continue,” the negative or plural of these words and other comparable terminology. All forward-looking statements included in this Form 10-K are based upon information available to us as of the filing date of this Form 10-K, and we undertake no obligation to update any of these forward-looking statements for any reason. You should not place undue reliance on forward-looking statements. The forward-looking statements involve known and unknown risks, uncertainties and other factors that may cause our actual results, levels of activity, performance, or achievements to differ materially from those expressed or implied by these statements. These factors include the matters discussed in the section entitled “Part I - Item 1A - Risk Factors” in this Form 10-K, and elsewhere in this Form 10-K. You should carefully consider the risks and uncertainties described in this Form 10-K.
Intellectual Property
Silk, So Delicious, International Delight, Horizon Organic, Earthbound Farm, Vega, Wallaby, Magicow, Alpro, Provamel, and our other registered or common law trademarks, service marks, or trade names appearing in this Form 10-K, are the property of The WhiteWave Foods Company or its subsidiaries. Other trademarks, service marks, or trade names appearing herein, including the LAND O LAKES, Almond Joy, Cold Stone Creamery, Cinnabon, Dunkin Donuts, Heath, Hershey’s, TruMoo, and YORK, and trade names which we license, are the property of their respective owners.
1
PART I
Item 1. | Business |
Overview
The WhiteWave Foods Company (“WhiteWave”, the “Company”, “we”, “us” or “our”) is a leading consumer packaged food and beverage company that manufactures, markets, distributes and sells branded plant-based foods and beverages, coffee creamers and beverages, premium dairy products and organic produce. We sell products primarily in North America, Europe and through a joint venture in China. The Company is focused on providing consumers with innovative, great-tasting food and beverage choices that meet their increasing desires for nutritious, flavorful, convenient, and responsibly-produced products. The Company's widely-recognized, leading brands distributed in North America include Silk®, So Delicious® and Vega™ plant-based foods and beverages, International Delight® and LAND O LAKES® coffee creamers and beverages, Horizon Organic® and Wallaby Organic® premium dairy products and Earthbound Farm® organic salads, fruits and vegetables. Our popular plant-based foods and beverages brands in Europe include Alpro® and Provamel®.
Our mission is to change the way the world eats for the better by providing consumers with innovative, great-tasting food and beverage choices that meet their increasing desires for nutritious, flavorful, convenient, and responsibly-produced products.
WhiteWave is a Delaware corporation and our common stock, par value $0.01 per share trades on the New York Stock Exchange under the symbol “WWAV.”
Agreement to be Acquired by Danone S.A.
On July 6, 2016, we entered into an Agreement and Plan of Merger (the “Merger Agreement”) pursuant to which we will be acquired by Danone S.A., a leading global food company headquartered in Paris, France. The Merger Agreement provides that, in accordance with the terms and conditions of the Merger Agreement, July Merger Sub Inc., a Delaware corporation and an indirect wholly-owned subsidiary of Danone (“Merger Sub”) will be merged with and into WhiteWave (the “Merger”) with WhiteWave continuing as the surviving corporation. At the effective time of the Merger, WhiteWave will become a wholly-owned indirect subsidiary of Danone and each share of WhiteWave common stock that is issued and outstanding automatically will be cancelled and converted into the right to receive $56.25 in cash, without interest.
The closing of the Merger is subject to the satisfaction of customary conditions, including the adoption of the Merger Agreement by WhiteWave stockholders; the expiration or termination of all applicable waiting periods under the Hart-Scott-Rodino Antitrust Improvements Act (“HSR Act”) and the Competition Act of Canada; and the approval of the Merger by the European Commission pursuant to the EU Merger Regulation.
On October 4, 2016, our stockholders adopted the Merger Agreement. On September 13, 2016, the Canadian Commissioner of Competition issued an advance ruling certificate, which included a waiver of the parties’ notification requirement in Canada. On December 16, 2016, the parties obtained regulatory clearance of the Merger from the European Commission.
The United States Department of Justice (“DOJ”) continues to review the Merger under the HSR Act. As we previously announced, each of WhiteWave and Danone elected on January 6, 2017 to extend the Long Stop Date under the Merger Agreement by 90 days to facilitate the completion of the DOJ’s review. We are targeting completion of the merger in first quarter 2017, although there can be no assurance regarding timing of completion of regulatory processes.
Narrative Description of our Business
We report results of operations through two reportable segments: Americas Foods & Beverages and Europe Foods & Beverages. Our reportable segments and the product platforms and product categories in each segment are:
2
Reportable Segment | Product Platform and Products | |
Americas Foods & Beverages | Plant-based foods and beverages, which includes our Silk and So Delicious branded beverages such as soymilk, almondmilk, coconutmilk and cashewmilk, ice cream and frozen novelty products, and plant-based yogurts, and Vega plant-based nutritional products Premium dairy, which includes our Horizon Organic milk, yogurt, cheese, and other premium dairy products, Wallaby Organic Greek and Australian yogurts and Kefir beverages, and Horizon branded macaroni & cheese and snack foods Coffee creamers and beverages, which includes coffee creamers and ready-to-drink beverages under the International Delight, Magicow, Dunkin Donuts and LAND O LAKES brand names Organic salads, fruits and vegetables, which includes packaged salads and greens, fresh and frozen fruits and vegetables, dried fruit, and produce-based snacks marketed under our Earthbound Farm brand | |
Europe Foods & Beverages | Plant-based foods and beverages, which includes our Alpro and Provamel brand beverages using soy-, almond-, coconut‑, hazelnut-, rice-, oat- and other plant-based ingredients, and plant-based alternatives to yogurt, culinary creams, desserts and margarine | |
For more information about our two reportable segments see Note 15 “Segment and Customer Information” to our audited consolidated financial statements.
Net Sales by Product Category
Product categories that contributed 10% or more of our consolidated net revenues were:
Fiscal year ended December 31, | |||||||||||
2016 | 2015 | 2014 | |||||||||
Product Category: | (in thousands) | ||||||||||
Plant-based food and beverages | $ | 1,643,927 | $ | 1,452,356 | $ | 1,226,164 | |||||
Coffee creamers and beverages | 1,199,015 | 1,090,018 | 990,998 | ||||||||
Premium dairy | 812,529 | 758,046 | 644,160 | ||||||||
Organic salads, fruits and vegetables | 542,628 | 565,875 | 575,283 | ||||||||
Total net sales | $ | 4,198,099 | $ | 3,866,295 | $ | 3,436,605 | |||||
Our Customers
We sell our products across North America and Europe to a variety of customers, including grocery stores, mass merchandisers, club stores, convenience stores, and health food stores, as well as various away-from-home channels, including restaurants and foodservice outlets. Our top ten customers together accounted for 49.0% of our total net sales for the year ended December 31, 2016. Our largest customer is Wal-Mart Stores, Inc., which, including its subsidiaries such as Sam’s Club, accounted for 13.3% of our total net sales for the year ended December 31, 2016.
Sales to customers in North America accounted for 86%, 86%, and 85% of our total net sales for the years ended December 31, 2016, 2015, and 2014, respectively.
Sales Organization
We sell our products in North America and Europe primarily through our direct sales force, independent brokers, regional brokers and distributors. Our sales organization strives to cultivate strong, collaborative relationships with customers that facilitate favorable shelf placement for our products, which, we believe, when combined with our marketing capabilities and our brand strength, drives high product sales volumes. Our relationship with a national broker in the United States serves to provide additional retail customer coverage as a supplement to our direct sales force, which has contributed to our growth and has allowed us to provide enhanced service to our customers. Additionally, in Europe, we have an extensive network of partners through which we continue to build and grow relationships with customers beyond our core geographies.
Marketing and Advertising
We use a variety of marketing efforts to build awareness of, and create demand for, our products. We employ regional, national, and, for our Europe segment, international promotions of our brands and products through a variety of media, including television and radio advertising, print media, coupons, co-marketing arrangements, and social media. We build campaigns for our
3
brands around certain themes to strategically appeal to the consumers whom we believe will be attracted to our products. For example, in our television, radio, and print advertising, we emphasize the healthy attributes of Silk, Horizon Organic, So Delicious, Earthbound Farm, Wallaby and Alpro, and we highlight the ability to create a “coffeehouse experience” at home with International Delight. These marketing efforts are enhanced by our internal creative services team, who collaborate with our brand teams at critical points in the advertising cycle and lead innovation in marketing through various channels. Also, our employees regularly participate in community outreach and charity and sponsorship work. We believe that our community programs and partnerships reinforce our brands’ values and build strong and lasting relationships with consumers.
Research and Development
At our research and development ("R&D") facilities in Louisville, Colorado, San Juan Bautista, California and Wevelgem, Belgium, our experienced consumer packaged goods professionals generate and test new product concepts, new flavors, and packaging. Our 67,000-square-foot Technical Innovation Center in Louisville, Colorado includes a demonstration kitchen, culinary development areas and a packaging-sciences area and expands our capabilities in product development, dairy and plant-based chemistry, and processing technology, enables us to conduct focus group studies and consumer testing of new product concepts and provides opportunities to develop product prototypes and marketing strategies with direct consumer input. Our Wevelgem, Belgium R&D professionals have extensive experience in developing a broad range of plant-based products, including plant-based drinks, yogurts, desserts, culinary creams and margarine.
We believe that innovation is central to the ongoing successful performance of our business. To that end, innovation is one of our core strategies and we hold every business unit accountable for executing against innovation priorities.
Our R&D organization primarily develops products internally, but also leverages external technical experts for open innovation for new product ideas and concepts. Additionally, our R&D teams are actively involved in cost reduction initiatives across all of our businesses. See Note 2 “Summary of Significant Accounting Policies - Research and Development,” for information about our total R&D expenses.
Manufacturing and Distribution
Sourcing and Supply Chain
Americas Foods & Beverages. Raw materials used in our plant-based foods and beverages, premium dairy and coffee creamers and beverages products include organic and conventional milk, butterfat, almonds, organic and non-genetically modified ("non-GMO") soybeans, sweeteners and other commodities. We continuously monitor worldwide supply and cost trends of these raw materials to enable us to take appropriate action to obtain the ingredients and packaging we need for production. Although the prices of our principal raw materials fluctuate based on adverse weather, the economy, and other conditions, we believe such raw materials to be generally available from numerous sources. For example, we source almost all of the raw organic milk for our premium dairy products from our network of nearly 600 family farms throughout the United States.
For our organic salads, fruits and vegetables, we source fresh leafy greens and other produce from owned and leased property that we farm ourselves and from third-party growers. Under seasonal contract arrangements with third-party growers, we either take the risk of ownership prior to the growing season or purchase fresh produce at the time of harvest and we generally are responsible for harvesting, cooling, transporting, and processing the product. Because leafy greens are extremely sensitive to temperature and humidity, harvested produce is promptly cooled and shipped in temperature-controlled trucks to our central processing and distribution facility, where it is inspected, processed, packaged and boxed for shipment. The finished goods then travel primarily to customer distribution centers or third-party distributors for further redistribution. Orders for value-added salads and other fresh-cut produce are picked up by or shipped to customers quickly after processing.
We have an extensive production and supply chain footprint in the United States. The Americas Foods & Beverages segment utilizes 12 production facilities and several strategic co-packers in the United States. Some of our plants are dedicated to the production of specific products or brands, while other plants can accommodate multiple product lines. Our advanced production capabilities provide us with applications of technology in extended shelf life, or ultra-high temperature, and aseptic processing, gable-top, plastic, aseptic, single-serve and portion control packaging, cultured processing, frozen novelty products and allergen management functions.
Our strategic distribution network allows us to achieve broad channel reach to customers of our Americas Foods & Beverages business. We believe the flexibility provided by our distribution network allows us to quickly and efficiently service our customers’ needs.
Europe Foods & Beverages. We also have a strategic supply chain footprint across Europe, utilizing three production facilities and a limited number of co-packers. Our facilities located in the United Kingdom, Belgium and France produce a broad range of
4
plant-based drinks, yogurts, desserts and culinary creams, with the remainder produced by third-party co-packers. Raw materials used in our products include organic and conventional non-GMO soybeans, almond, coconut, hazelnuts, sweeteners and other commodities, all of which are submitted to strict control measures, traceability of our raw materials and external certification. We apply proprietary soybean de-hulling, base milk manufacturing, and yogurt fermentation technologies in our production processes, which we believe results in better taste and high product yields for our products.
Quality Assurance
Across our Company, we have implemented robust production and safety protocols at numerous points throughout our supply chain to ensure the safety and quality of our products. For example, our contracts with our farmers and suppliers contain strict standards for quality, and we periodically audit certification compliance. We also perform a hazard analysis, following HACCP (Hazard Analysis and Critical Control Point) protocol, on ingredients and products and develop critical control points to effectively mitigate risk. For example, raw organic milk is tested for impurities and antibiotics and, prior to release for sale, is tested to ensure compliance with applicable regulatory requirements and our high standards. For our fresh greens, we perform on-farm food safety assessments and test raw materials and finished products for the presence of bacteria that can cause human illness.
Trademarks and Intellectual Property
We consider our intellectual property to be material assets of our business. We rely on a combination of trademarks, patents, trade dress, copyrights, trade secrets, confidentiality procedures, and contractual provisions to protect our brands, technology, know-how and other intellectual property rights. We own numerous trademarks and patents in countries around the world. Trademark registrations generally have renewable, fixed terms and, depending on the country, trademarks remain valid for as long as they are in use or their registration status is maintained. Our significant trademarks in North America include Silk, So Delicious, Vega, International Delight, Horizon Organic, Wallaby Organic and Earthbound Farm. In Europe, our significant trademarks include Alpro and Provamel. We also license the right to utilize certain brand names from third parties, including LAND O LAKES, Almond Joy, Cold Stone Creamery, Cinnabon, Dunkin Donuts, Heath, Hershey’s, TruMoo, and YORK, on certain of our products. In addition, we have a license agreement with DSM Nutritional Products, the owner of Martek Biosciences Corporation, to use products covered by patents for supplementing certain of our premium dairy and soy products with DHA Omega-3.
We are continually developing new technology and enhancing proprietary technology related to our products and operations. Our issued patents extend for varying periods depending on the date the patent application was filed or granted and the legal term of patents in the various countries where patent protection is obtained. The actual protection afforded by a patent, which can vary from country to country, depends on the type of patent, the scope of its coverage, as determined by the patent office or administrator in the applicable country, and the availability of legal remedies in the applicable country.
Despite these protections, it may be possible for unauthorized parties to copy, obtain, or use certain portions of our proprietary technology or trademarks. Such unauthorized use could reduce the value of our products and brands, or have an adverse impact on our business and financial condition.
Competition
We operate in a highly competitive environment and face competition in each of our product categories and subcategories. We have numerous competitors of varying sizes, including manufacturers of private label products, as well as manufacturers of other branded food products, which compete for trade merchandising support and consumer dollars. We compete with large conventional consumer packaged foods companies such as General Mills, Inc., The Kraft Heinz Company, and Nestle S.A. We also compete with natural and organic consumer packaged foods companies such as The Hain Celestial Group, Inc., Blue Diamond, HP Hood, Califia Farms and Organic Valley. Competitors of our organic salads, fruits and vegetables platform include Taylor Farms, Organicgirl, and Olivia's Organics which also produce organic and value-added salads.
Competitive factors in our industry include product innovation, product quality, price, brand recognition and loyalty, product variety and ingredients, product packaging and package design, effectiveness of marketing and promotional activity, and our ability to identify and satisfy consumer tastes and preferences.
Corporate Responsibility
We are committed to operating our business in an ethical, environmentally sustainable, and socially responsible manner. We have a dedicated global sustainability framework, with clear objectives, designed to address environmental protection, economic growth and social equity. Our strategy begins with how we source our ingredients, and continues all the way through how we get our products to market and educate consumers through on-pack recycling guidelines. Our commitment to transparency is showcased through our participation in a variety of forums including Carbon Disclosure Project Climate Change, Water and Forestry, where we scored an “A- Leadership” ranking for the quality of climate change related information disclosed to investors and the global
5
marketplace. For us, transparency also applies to our clear labeling practices, which are designed to help consumers understand what’s in the food and beverages they eat and drink. Nearly 75% of our brand portfolio carries either Non-GMO Project Verified, ProTerra Certified Non-GMO, or certified organic labels. For more information on our sustainability initiatives, see our 2014-2015 Corporate Social Responsibility Report under “Why We Matter” on our website at www.whitewave.com.
WhiteWave also partners with various non-profit organizations in the communities in which we operate. Through our Values in Action program, we encourage our North America employees to volunteer with organizations in the areas of hunger relief and sustainability, and we donate cash and products to our non-profit partners that focus on ending hunger and reducing environmental impacts. One of the stand-outs is our partnership with Feeding America food banks throughout North America. As part of an annual fundraiser, WhiteWave matches employee donations dollar for dollar and, in 2016, employee donations provided more than 2.8 million meals to families in need. We are also driving positive change in Europe. For example, Europe Foods & Beverages participates in World Wildlife Fund’s Green Ambassadors program, which encourages sustainability initiatives in 4,500 primary schools throughout the U.K. and empowers children aged 5-11 to take action on sustainability in their schools. In 2016, Europe Foods & Beverages contributed approximately £100,000 to this program. In addition, our European business is a key supporter of Malnutrition Matters, a Canadian non-profit organization dedicated to providing sustainable low cost food technology solutions to malnutrition, primarily by using soy ingredients. We believe that our customers, consumers, and suppliers value our efforts to operate in an ethical, environmentally sustainable, and socially responsible manner.
Seasonality
Sales of our products are generally evenly distributed throughout the year, with slightly higher sales in the fourth quarter due to the holidays.
Employees
As of January 2017, we employed approximately 5,800 people worldwide, of which approximately 28% were covered by collective bargaining agreements or works council representation. We believe that our relationship with our employees is good.
Government Regulation
Food-Related Regulations
As a manufacturer and distributor of food and beverage products, we are subject to a number of federal, state, local and multi-national regulations related to labeling, packaging, pricing, marketing and advertising, privacy and related areas. In addition, various jurisdictions regulate our operations involving such matters as the licensing and inspection of our manufacturing facilities, enforcement by government health agencies of standards for our products, and regulation of our trade practices in connection with the sale of our products. Many of the food commodities we use in our operations are subject to government agricultural policy and intervention. These policies have substantial effects on prices and supplies and are subject to periodic governmental and administrative review.
In the United States, we are subject to a number of food-related regulations, including the Federal Food, Drug and Cosmetic Act and regulations promulgated thereunder by the FDA. This comprehensive regulatory framework governs the manufacture (including composition and ingredients), labeling, packaging, and safety of food in the United States. In addition, the FDA enforces the Public Health Service Act, which authorizes regulatory activity necessary to prevent the introduction, transmission, or spread of communicable diseases. These regulations require, for example, pasteurization of milk and milk products. The FDA also is implementing the Food Safety Modernization Act of 2011 ("FSMA") which, among other things, mandates that the FDA adopt preventive controls to be implemented by farms, warehouses, food facilities and transporters in order to minimize or prevent hazards to food safety.
In Europe, we also are subject to a number of food-related regulations, including General Food Law Regulation 178/2002, which provides a horizontal framework underpinning all European Union and national measures relating to food and covers all stages of the production, processing and distribution of food; the Regulation on Food Information to Consumers 169/2011, which governs labeling in general, presentation and advertising of foodstuffs as well as nutrition labeling for foodstuffs; and the Regulation on Health and Nutrition Claims 1924/2006, which establishes the legal framework for food business operators wishing to highlight particular beneficial properties of their products in relation to health and nutrition.
We believe that we are in material compliance with the regulations applicable to our business. We continually monitor developments in the laws and regulations applicable to our business and we currently do not expect that the cost of complying with new laws and regulations will be material.
6
Employee Safety Regulations
We are subject to certain safety regulations, including regulations issued pursuant to the U.S. Occupational Safety and Health Act. These regulations require us to comply with certain manufacturing safety standards to protect our employees from accidents. We believe that we are in material compliance with all employee safety regulations applicable to our business.
Environmental Regulations
We are subject to various environmental laws, regulations, and directives, including the Food Quality Protection Act of 1996, the Clean Air Act, the Clean Water Act, the Resource Conservation and Recovery Act, the Federal Insecticide, Fungicide and Rodenticide Act and the Comprehensive Environmental Response, Compensation and Liability Act. Our production facilities use a number of chemicals that are considered to be “extremely” hazardous substances pursuant to applicable environmental laws due to their toxicity, including ammonia, which is used extensively in our operations as a refrigerant. These and other chemicals used in our operations must be handled, stored, and disposed in accordance with applicable environmental requirements, including those governing, among other things, air emissions and the discharge of wastewater and other pollutants, the use of refrigerants, the handling and disposal of hazardous materials, and the cleanup of contamination in the environment. Also, on occasion, certain of our facilities discharge biodegradable wastewater into municipal waste treatment facilities and, as a result, certain of our facilities are required to pay wastewater surcharges or to construct wastewater pretreatment facilities. To date, such wastewater surcharges have not had a material effect on our financial condition or results of operations.
We expect to incur ongoing costs to comply with existing and future environmental requirements. For example, we maintain aboveground petroleum storage tanks at some of our facilities. We periodically inspect these tanks to determine whether they are in compliance with applicable regulations, and, as a result of such inspections, we are required to make expenditures from time to time to ensure that these tanks remain in compliance. In addition, upon removal of the tanks, we are sometimes required to make expenditures to restore the site in accordance with applicable environmental laws. To date, such expenditures have not had a material effect on our financial condition or results of operations.
In the United States, portions of our fresh fruit and vegetable farm properties are irrigated by surface water supplied by local government agencies using facilities financed by federal or state agencies, as well as from underground sources. Water received through federal facilities is subject to acreage limitations under the 1982 Reclamation Reform Act. Worldwide, the quantity and quality of water supplies varies depending on weather conditions and government regulations. We believe that under normal conditions these water supplies are adequate for current production needs.
We believe that we are in material compliance with the environmental regulations applicable to our business. We do not expect the cost of our continued compliance to have a material impact on our capital expenditures, earnings, cash flows, or competitive position in the foreseeable future.
Milk Industry Regulations
The U.S. federal government establishes minimum prices for raw milk purchased in federally regulated areas. Raw milk primarily contains raw skim milk, in addition to a small percentage of butterfat.
The federal government’s minimum prices vary depending on the processor’s geographic location or sales area and the type of product manufactured. Federal minimum prices change monthly. Class I butterfat and raw skim milk prices (which are the minimum prices for raw milk that is processed into Class I products such as fluid milk) and Class II raw milk prices (which are the minimum prices for raw milk that is processed into Class II products such as half & half and cottage cheese products) for each month are announced by the federal government the immediately preceding month.
Some states have established their own rules for determining minimum prices for raw milk. In addition to the federal or state minimum prices, we also may pay producer premiums, procurement costs, and other related charges that vary by location and supplier. While we are subject to federal government regulations that establish minimum prices for milk, the prices we pay producers of organic raw milk are generally well above such minimum prices, as organic milk production is generally more costly, and organic milk therefore commands a price premium.
Labeling Regulations
We are subject to various labeling requirements with respect to our products at the federal, state, and local levels. At the federal level, the FDA has authority to review product labeling, and the Federal Trade Commission may review labeling and advertising materials, including online and television advertisements to determine if advertising materials are misleading. Similarly, many states review dairy product labels to determine whether they comply with applicable state laws. In addition, the European Union has issued and enforces rules governing foodstuff labeling, nutrition, and health claims. We believe we are in material compliance with all labeling laws and regulations applicable to our business.
7
Organic Regulations
Our organic products are required to meet the standards set forth in the Organic Foods Production Act of 1990 and the regulations adopted thereunder by the National Organic Program, based on recommendations from the National Organic Standards Board, as well as similar agencies and laws in the European Union and the European countries in which we sell these products. These regulations require strict methods of production for organic food products and limit the ability of food processors to use non-organic or synthetic materials in the production of organic foods or in the raising of organic livestock. We believe that we are in material compliance with the organic regulations applicable to our business.
Ethics and Governance
We maintain a Code of Ethics that applies to all of our directors, executive officers, and employees. Our Code of Ethics is posted on our website at www.whitewave.com on the “Investor Relations” page under the link “Corporate Governance.” Any amendments to or waivers of our Code of Ethics relating to our directors or executive officers that is required to be disclosed also will be posted on our website.
Available Information
Our website at www.whitewave.com. We make available, free of charge in the “Investor Relations” page of our website, our annual reports on Form 10-K, quarterly reports on Form 10-Q, current reports on Form 8-K, and amendments to those reports filed or furnished pursuant to Section 13(a) or 15(d) of the Securities Exchange Act of 1934, as amended (the “Exchange Act”), as soon as reasonably practicable after we electronically file such material with, or furnish it to, the Securities and Exchange Commission (the “SEC”). Reference to our website is an inactive textual reference only. Information provided on our website is not part of this report or any other report we file with, or furnish to, the SEC.
Executive Officers of WhiteWave
The following table sets forth the name, age, and position of each of our executive officers as of February 1, 2017:
Name | Age | Position | |||
Gregg L. Engles | 59 | Chairman of the Board of Directors and Chief Executive Officer | |||
Gregory S. Christenson | 49 | Executive Vice President and Chief Financial Officer | |||
Blaine E. McPeak | 50 | Executive Vice President and Chief Operating Officer | |||
Bernard P.J. Deryckere | 58 | Executive Vice President and President, Europe Foods & Beverages | |||
Edward F. Fugger | 49 | Executive Vice President, Strategy and Corporate Development | |||
Roger E. Theodoredis | 58 | Executive Vice President, General Counsel | |||
Kevin C. Yost | 51 | Executive Vice President and U.S. Group President, Americas Foods & Beverages | |||
Thomas N. Zanetich | 65 | Executive Vice President, Human Resources | |||
Gregg L. Engles - Chairman of the Board of Directors and Chief Executive Officer
Mr. Engles, age 59, has served as Chairman of the Board of Directors and Chief Executive Officer since August 2012. Mr. Engles previously served as the Chief Executive Officer of Dean Foods Company, a leading food and beverage company and former parent company of WhiteWave, from the formation of Dean Foods in October 1994 until WhiteWave’s initial public offering in October 2012. Mr. Engles serves as a director of Liberty Expedia Holdings, Inc., which owns interests in Expedia, Inc. and its subsidiary Bodybuilding.com, LLC, where he Chairs the Audit Committee and serves as a member of the Compensation, Nominating and Corporate Governance and Common Stock Director Committees. He also serves on the board of trustees of Dartmouth College, where he serves on the Finance and the Facilities and Master Planning Committees, and is Chair of the Organizational Strategy and the Compensation Committees. Mr. Engles also serves on the board of directors of the Grocery Manufacturers of America, where he serves on the Executive Committee. He previously served as a director and as Chairman of the Board of Dean Foods and as a director of Treehouse Foods, Inc.
Gregory S. Christenson - Chief Financial Officer
Mr. Christenson, age 49, has served as Chief Financial Officer of the Company since April 2016. He served as Senior Vice President and Chief Financial Officer, Americas Foods & Beverages, from June 2013 to March 2016, where he strengthened the capabilities of the finance, accounting and IT functions within that segment and supported the business’ strategic growth initiatives. Prior to joining WhiteWave, Mr. Christenson was Vice President and Chief Financial Officer of Oberto Brands, a meat snacks company, from January 2011 to June 2013, where he was responsible for the finance, accounting, treasury, information systems, procurement, strategy, legal and risk management functions. Before that he spent 14 years at Kraft Foods, Inc., one of the largest
8
consumer packaged food and beverage companies, where he held various management positions of increasing responsibility, most recently as Director of Finance, Cheese, a business with over $2.5 billion in sales.
Blaine E. McPeak - Chief Operating Officer
Mr. McPeak, age 50, has served as Chief Operating Officer of WhiteWave since December 1, 2015. He previously served as Executive Vice President and President, Americas Foods & Beverages from 2009 to December 2015, during which he lead the Americas Foods & Beverages business in growing its core businesses, expanding geographically, collaborating on M&A initiatives, and building a strong, talented organization. He joined WhiteWave in 2007 as the President of Horizon Organic and, in 2008, was named President of the Horizon, Silk, and Rachel’s Organic U.K. businesses. Prior to joining WhiteWave, Mr. McPeak held several senior management roles at Kellogg Company, a consumer packaged food company, from 1994 to 2007. In leading Kellogg’s Wholesome Snack division, Frozen Foods division, and Kashi Company, he oversaw strategy and delivery of financial performance for sales, marketing, finance, supply chain, and R&D functions/units. Mr. McPeak serves on the Industry Affairs Council of the Grocery Manufacturers Association and on the Advisory Board for the University of Wisconsin School of Business, Center for Brand and Product Management.
Bernard P.J. Deryckere - President, Europe Foods & Beverages
Mr. Deryckere, age 58, joined the Company as Executive Vice President and President, Europe Foods & Beverages, when we acquired Alpro, a European manufacturer of branded plant-based foods and beverages, in 2009. He previously served as Chief Executive Officer of the Alpro Soya Food division of Vandemoortele Group Europe, from September 2001 to 2009, and before that held numerous leadership positions at Unilever, a consumer goods company, and Henkel, a consumer goods company. Mr. Deryckere was Marketing Director for Unilever Portugal from 1993 to 1995; European Category Director for Unilever’s European Business Group Lipton Ready to Drink Beverages from 1995 to 1998; and General Manager for Unilever’s Bakery Business, covering Belgium, the Netherlands, Luxembourg, and France, from 1998 to 2000. Immediately prior to joining Europe Foods & Beverages, Mr. Deryckere was Chief Executive Officer for Unilever Bestfoods Scandinavia. Mr. Deryckere is also a director of two private companies - Neuhaus, a Belgian producer of chocolates and confectionaries, and Jules Destrooper, a pastry and biscuit producer - and several industry associations, including the Belgilux Association of Branded Products Manufacturers and the Flemish Chamber of Commerce (Voka). He also is Vice President of the European Natural Soy Foods Manufacturers Association (ENSA) and Vice President of the Belgian Food & Drink Industry Federation.
Edward F. Fugger - Executive Vice President, Strategy and Corporate Development
Mr. Fugger, age 49, has served as Executive Vice President, Strategy and Corporate Development since August 2012. He previously served as Senior Vice President, Corporate Development of Dean Foods Company, a leading food and beverage company and former parent company of WhiteWave, from 2007 to August 2012 and as Vice President, Corporate Development of Dean Foods from 2004 to 2007. Prior to that, Mr. Fugger served as a Managing Director in the Mergers and Acquisition Group of Bear, Stearns & Co. Inc., a global investment bank, and held various positions while working across industries on mergers and acquisitions and debt and equity offerings. Mr. Fugger began his career in the audit and assurance practice at Price Waterhouse LLP.
Roger E. Theodoredis - Executive Vice President, General Counsel
Mr. Theodoredis, age 58, has served as Executive Vice President and General Counsel since August 2012, as Corporate Secretary from August 2012 to November 2016, and as Senior Vice President and General Counsel of the WhiteWave division of Dean Foods Company from 2005 to August 2012. Prior to joining WhiteWave, Mr. Theodoredis served as Vice President and Senior Counsel at Bristol-Myers Squibb, a global biopharmaceutical company, from 2002 to 2005, during which time he was lead counsel for Mead Johnson Nutrition Company, Bristol-Myers Squibb’s infant-formula division. Prior to that, Mr. Theodoredis spent 11 years in the legal department of Chiquita Brands International, Inc., a producer and distributor of bananas and other produce, most recently as Assistant General Counsel.
Kevin C. Yost - U.S. Group President, Americas Foods and Beverages
Mr. Yost, age 51, has served as U.S. Group President, Americas Foods and Beverages, overseeing WhiteWave’s U.S. businesses, since December 1, 2015. He previously served as Executive Vice President and President, Americas Fresh Foods from January 2014 to December 2015. Prior to joining WhiteWave, Mr. Yost was employed by Dean Foods Company from February 2010 through January 2013, where he served as President of Morningstar Foods from September 2010 to January 2013, and as Senior Vice President and General Manager, ESL from March 2010 to September 2010. After Dean Foods Company’s January 2013 sale of the Morningstar business to Saputo, Inc., a global food and beverage company, Mr. Yost served as President and Chief Operating Officer of the Dairy Foods Division (USA) of Saputo, Inc. He previously served in executive management roles at Swift & Company and ConAgra Foods.
9
Thomas N. Zanetich - Executive Vice President, Human Resources
Mr. Zanetich, age 65, has served as Executive Vice President, Human Resources, since August 2012. He joined WhiteWave in 2006 as Senior Vice President, Human Resources of WhiteWave and, in February 2011, was promoted to Executive Vice President, Human Resources of Dean Foods Company, a leading food and beverage company and former parent company of WhiteWave. Prior to joining Dean Foods, Mr. Zanetich was a Vice President of Human Resources for Kraft/Nabisco where he led a team of 40 human resources professionals serving a $26 billion organization with 15,000 employees. Mr. Zanetich was employed by Kraft for 20 years, during which time he served as a senior human resources advisor and led numerous staffing, employee relations, organizational development, and performance initiatives. His early experience includes managing human resources teams for Nabisco and General Foods.
There are no family relationships among any of our executive officers or directors, by blood, marriage, or adoption.
Item 1A. | Risk Factors |
In evaluating and understanding us and our business, you should carefully consider the risks described below, in conjunction with all of the other information included in this Annual Report on Form 10-K, including “Management’s Discussion and Analysis of Financial Condition and Results of Operations” contained in Part II, Item 7. If any of the events or circumstances described in the following risk factors actually occurs, our business, financial condition, results of operations, and future prospects could be materially and adversely affected.
Risk Related to Our Pending Merger with Danone S.A.
We may not be able to complete our merger with Danone S.A. and uncertainty concerning completion of the merger may adversely affect our business operations and financial results.
As described elsewhere in this Annual Report on Form 10-K, on July 6, 2016, we signed a merger agreement with Danone S.A. and July Merger Sub, Inc., a subsidiary of Danone, pursuant to which we will merge with July Merger Sub and become a wholly-owned subsidiary of Danone. The closing of the merger is subject to the satisfaction of customary conditions, including the expiration or termination of all applicable waiting periods under the Hart-Scott-Rodino Antitrust Improvements Act (“HSR Act”). The United States Department of Justice (“DOJ”) continues to review the merger under the HSR Act. As we previously announced, each of WhiteWave and Danone elected on January 6, 2017 to extend the Long Stop Date under the merger agreement by 90 days to facilitate the completion of the DOJ’s review. We are targeting completion of the merger in first quarter 2017, although there can be no assurance regarding timing of completion of regulatory processes. We cannot be certain that we will be able to satisfy or obtain a waiver of the other conditions to completion of the merger, in which case the merger may not be completed.
If the merger is not completed for any reason, including as a result of a failure to obtain regulatory clearance, our ongoing business and relationships may be adversely affected and the price of our common stock may be negatively impacted.
In addition, the merger agreement may be terminated by the Company or Danone under certain circumstances. If the merger agreement is terminated under certain specified circumstances, we will be required to pay Danone a termination fee of $310.0 million.
The restrictions on the conduct of our business prior to the consummation of the merger, and the uncertainties and risks concerning completion of the merger, may cause our business, sales, operations and financial results to suffer during the executory period or in the event the merger is not completed. The merger agreement requires us to conduct business in the ordinary course, subject to specific limitations, which may delay or prevent us from undertaking business opportunities that, absent the merger agreement, we might have pursued. The announcement of the merger and any delay in completing the merger may divert management’s attention from ongoing business operations, affect our ability to retain or recruit key employees and negatively impact our business relationships with customers and suppliers. In addition, the nature, cost and outcome of pending and future litigation and other legal proceedings, including any such proceedings related to the merger and instituted against us and others, may be material.
Risks Related to Our Business
We face significant competition, which could reduce our sales and profits.
We face significant competition in each of our product categories, and further consolidation in the industry would likely increase competition. Increased competition can reduce our sales due to loss of market share or because we reduce prices to respond to competitive and customer pressures. Competitive pressures also may restrict our ability to increase prices, including in response to commodity and other cost increases. Our competitors may be able to introduce innovative products more quickly or market
10
their products more successfully than we can, which could cause our growth rate in certain categories to be slower than we expected and could cause us to lose sales. Our competitors also may choose to compete based on price and promotions, which may impact our volume growth, profitability and market share. Our profits could decrease if a reduction in prices or increased costs are not counterbalanced with increased sales volume.
In most of our product categories, our branded products compete not only with other widely advertised branded products, but also with regional brands and with generic and private label products that are generally sold at lower prices. A consumer shift towards more private label, lower-priced, or other value offerings could result in us reducing pricing, increasing marketing or other expenditures, or losing market share. We also compete, particularly in our premium dairy and organic salads, fruits and vegetables categories, with producers of non-organic products, which usually have lower operational costs. As a result, non-organic producers can offer conventional products to customers at lower costs than organic products. This could cause us to lower our prices, resulting in lower profitability or, in the alternative, cause us to lose market share if we fail to lower prices.
Erosion of the reputation of one or more of our leading brands could reduce our sales and profits.
The majority of our net sales are from sales of our branded products, including Silk, International Delight, Horizon Organic, LAND O LAKES, Earthbound Farm, So Delicious, Wallaby, Vega, Alpro, and Provamel, and growth in our business has resulted primarily from the strength of these brands. To succeed in promoting and enhancing brand value, we need to meet and exceed consumers’ expectations for high-quality and innovative products. Our brand value could diminish significantly if, for example, there is adverse publicity about our products (whether or not valid), we are required to recall our products, we fail to maintain the quality of our products, our products fail to deliver consistently positive consumer experiences, consumers believe that we have acted in an irresponsible manner or our products are not available. The growing use of social and digital media by consumers, us and third parties increases the speed and extent that information or misinformation and opinions can be shared. Negative posts or comments about WhiteWave, our brands or our products on social or digital media could seriously damage our brands and reputation. If we do not maintain the favorable perception of our brands, our sales and profits could be negatively impacted.
In addition, the reputation of our brands may suffer if any trademarks associated with our products are perceived negatively by consumers. For example, certain of our products are marketed under trademarks we have licensed from third parties, such as LAND O LAKES, Almond Joy, Cold Stone Creamery, Cinnabon, Dunkin Donuts, Hershey’s, TruMoo, and YORK, and we are unable to control the quality of other products that third parties produce and market under those trademarks and trade names. Our results of operations could be negatively affected if the reputation of one or more of our brands suffers damage due to real or perceived quality issues with our products, or if we are found to have violated any applicable laws or regulations.
Our financial success depends on our ability to successfully predict changes in consumer preferences and develop successful new products in response.
Consumer preferences evolve over time and the success of our products depends on our ability to identify the tastes and dietary habits of consumers and to offer products that appeal to their preferences and address their concerns. Recent trends in consumer preferences that may impact us include:
• | dietary trends and increased attention to nutritional values, such as the sugar, fat, protein, fiber or calorie content; |
• | concerns about obesity and the health effects of specific ingredients and nutrients, such as sugar and other sweeteners, GMO ingredients, gluten, dairy, soybeans, nuts, oils, vitamins, fiber and minerals; and |
• | increasing awareness of the environmental and social effects of product production. |
The development and introduction of new products could require substantial R&D and other expenditures, including capital investment and marketing and slotting investments. If our products fail to meet consumer preferences, or we fail to introduce new and improved products on a timely basis, then the return on that investment will be less than anticipated and our strategy to grow sales and profits through product innovations and extensions will be less successful.
We are subject to the risk of product contamination and product liability claims, which could harm our reputation, force us to recall products and incur substantial costs.
We may be liable if the consumption of any of our products causes injury, illness or death to consumers. We may need to recall some of our products if we discover tampering by unauthorized parties; mislabeling; cross contamination of ingredients that are allergens; or product contamination or spoilage, including the presence of foreign objects, substances, chemicals, other agents, or residues introduced during the growing, production, storage, handling or transportation phases. In addition, we will voluntarily recall products in the event of contamination or damage. We also may be subject to liability if our products or operations violate applicable laws or regulations, including environmental, health, and safety requirements. A significant product liability judgment or a widespread product recall may negatively impact our sales and profitability due to the costs of the recall, the destruction of
11
product inventory, product availability, competitive reaction, customer reaction and consumer attitudes. Even if a product liability claim is unsuccessful or is not fully pursued, the negative publicity surrounding any assertion that our products caused injury, illness or death could adversely affect our reputation.
Our product advertising also could make us the target of claims relating to false or deceptive advertising under U.S. federal and state laws, including the consumer protection statutes of some states, or laws of other jurisdictions in which we operate. These types of claims or liabilities might not be covered by insurance or by any rights of indemnity or contribution that we may have against others. In addition, we have agreed with certain customers to provide defense and indemnification for certain types of these claims. Even if a product liability, consumer fraud, or other claim is found to be without merit or is otherwise unsuccessful, the negative publicity surrounding such assertions regarding our products or processes could materially and adversely affect our reputation and brand image, particularly in categories that are promoted as having strong health and wellness credentials. Any loss of consumer confidence in our product ingredients or in the safety and quality of our products would be difficult and costly to overcome.
Failure to maintain sufficient internal production capacity or to enter into third-party agreements on terms that are beneficial for us may result in our inability to meet customer demand and/or may increase our operating costs and capital expenditures.
We rely on internal production capacity and third-party co-packers to fulfill our growing production needs. Certain of our production facilities are operating at high rates of utilization, and we may need to expand our production facilities or increase our reliance on third parties to provide production and supply services, commonly referred to as “co-packing” agreements, for a number of our products. A failure by us or our co-packers to comply with food safety, environmental, or other laws and regulations may disrupt our supply of products. In addition, we have experienced, and may experience, increased distribution and warehousing costs due to capacity constraints resulting from our growth. If we need to enter into additional co-packing, warehousing or distribution agreements in the future, we can provide no assurance that we would be able to find acceptable third party providers or enter into agreements on satisfactory terms or at all. In addition, we may need to expand our internal capacity, which could increase our operating costs and could require significant capital expenditures. If we cannot maintain sufficient production, warehousing and distribution capacity, either internally or through third party agreements, we may be unable to meet customer demand and/or our manufacturing, distribution and warehousing costs may increase, which could negatively affect our business.
The loss of any of our largest customers or the continued consolidation in the retail industry could negatively impact our sales and results of operations.
Our largest customer, Wal-Mart Stores, Inc., and its subsidiaries, including Sam’s Club, accounted for 13.3% of our total net sales in 2016 and our top 10 customers, collectively, accounted for 49.0% of our total net sales in 2016. We have written agreements with some but not all of our customers, and the written agreements generally are terminable at will by the customer. The loss of any large customer, a material reduction in sales or a change in the mix of products we sell to a large customer for an extended period could negatively affect our sales and results of operations.
In addition, as the retail grocery trade continues to consolidate and mass marketers become larger, our large retail customers may seek to use their position to improve their profitability through lower pricing and increased promotional programs. If we are unable to benefit from the strength of our brands, and our marketing expertise, product innovation and category leadership positions to respond, our profitability or sales growth could be negatively affected. In addition, our customers sometimes award contracts based on competitive bidding, which could result in lower profits for contracts we win and the loss of business for contracts we lose.
We are increasingly dependent on information technology (“IT”).
We rely on IT networks and systems, including the Internet, to process, transmit and store electronic and financial information, to manage a variety of business processes and activities, including order management, manufacturing, warehousing and logistics, and to comply with regulatory, legal and tax requirements. We also depend on our IT infrastructure for digital marketing activities and for electronic communications among our locations, personnel, customers and suppliers around the world. These IT systems, some of which are hosted and/or supported by third parties, may be susceptible to damage, disruptions or shutdowns due to failures during the process of upgrading or replacing software, databases or components thereof, power outages, hardware failures, computer viruses, attacks by computer hackers or other cybersecurity risks, telecommunication failures, user errors, natural disasters, terrorist attacks or other catastrophic events. If any of our significant IT systems suffer severe or prolonged damage, disruption or shutdown, and our disaster recovery and business continuity plans do not effectively resolve the issues in a timely manner, our product sales, financial condition and results of operations may be materially and adversely affected, and we could experience delays in reporting our financial results.
Reduced availability or excess supply of raw materials and other inputs, as well as increased costs for our raw materials and other inputs, could adversely affect us.
12
We depend heavily on raw materials and other inputs, such as organic and conventional milk, butterfat, almonds, organic and non-genetically modified (“non-GMO”) soybeans, sweeteners, and organic salads, fruits and vegetables, to produce our products and also on commodities, such as packaging, utilities, natural gas, resin and petroleum-based products, to package and distribute our products. We generally source our raw materials from third-party suppliers, and we are not assured of continued supply, pricing, or exclusive access to raw materials from any of these suppliers. In addition, a substantial portion of our raw materials are agricultural products, which are vulnerable to adverse weather conditions and natural disasters, such as severe rains, floods, droughts, frost, earthquakes, and pestilence. Adverse weather conditions and natural disasters also can lower dairy and crop yields and reduce supplies of these ingredients or increase their prices. Other events that adversely affect our third-party suppliers and that are out of our control, such as problems with our suppliers’ businesses, finances, labor relations, costs, production, insurance, and reputation, could also impair our ability to obtain the raw materials and other inputs in the quantities we need and at economical prices. Over the past several years, we have experienced increased costs as a result of weather conditions and other events outside our and our suppliers’ control and this may occur again in the future. In addition, due to the nature of agricultural products, we finalize our planting plan for organic greens and produce at least several months before sales of such products occur. If we do not accurately forecast our sales of organic greens and produce, or if our sales forecasts change after we finalize our planting plan, we may have excess produce that we will not be able to sell before it spoils. The costs of such spoiled produce is higher if we have procured the produce from third party growers under fixed commitment contracts, which we do during the winter growing season, rather than grow the produce ourselves.
The organic ingredients (including milk, organic salads, fruits and vegetables, other dairy-related products, and soybeans) and non-GMO ingredients for our products are less plentiful and available from fewer suppliers than their conventional counterparts. Competition with other manufacturers in the procurement of organic and non-GMO product ingredients may increase in the future if consumer demand for organic and non-GMO products increases. In addition, the dairy industry continues to experience periodic imbalances between supply and demand for organic raw milk. Industry regulation and the costs of organic farming compared to costs of conventional farming have impacted, and may continue to impact, the supply of organic raw milk in the market. Oversupply levels of organic raw milk can increase competitive pressure on our products and pricing, while supply shortages can cause product shortages and higher costs to us. Cost increases in raw materials and other inputs could cause our profits to decrease significantly compared to prior periods, as we may be unable to increase our prices to offset the increased cost of these raw materials and other inputs. We do not fully hedge against changes in commodity prices, and the risk management procedures that we use may not always work as we intend (e.g., our hedged price could exceed the spot price on the date we actually take receipt of the commodity). If we are unable to obtain raw materials and other inputs for our products or offset any increased costs for such raw materials and inputs, our business could be negatively affected.
Imposition of new taxes or disagreements with tax or other governmental authorities could adversely affect our financial results.
We are subject to the tax laws and regulations of various federal, state and local governments in the United States, as well as tax laws and regulations in numerous foreign jurisdictions, which could impact our business operations and our acquisition of businesses in those jurisdictions. The computation of our worldwide income tax expense is complex as it is based on the laws of various taxing jurisdictions and requires significant judgment in the application of rules governing accounting for tax provisions under U.S. GAAP. Future changes in domestic or international tax laws and regulations could adversely affect our income tax liabilities. Recent developments, including potential corporate tax reform in the U.S. and its related international tax rules, the European Commission’s investigations of the tax authorities in certain European countries regarding whether decisions made by these tax authorities comply with European Union rules on state aid, as well as the Organisation for Economic Co-operation and Development’s project on Base Erosion and Profit Shifting, may result in changes to long-standing tax principles. Any such changes, in the U.S. or abroad, could adversely affect our effective tax rate or result in higher cash tax liabilities.
In the ordinary course of our business, we may engage in transactions and calculations where the ultimate tax determination is uncertain. We are subject to reviews, examinations and investigations by tax and other governmental authorities both within and outside the United States. Economic and political pressures in various jurisdictions to increase tax revenues may make resolving tax disputes more difficult. The final determination of tax audits, investigations or any related litigation could be materially different from our historical income tax expense and accruals and could have a material effect on our consolidated financial statements in the periods for which that determination is made.
We may not be able to successfully complete and integrate strategic acquisitions or establish and operate joint ventures.
One of our strategic growth initiatives has been to grow our business through the acquisition of new brands and the establishment of joint ventures in the United States and globally. We cannot be certain that we will successfully be able to identify suitable acquisition candidates or joint venture partners and accurately assess their value, growth potential, strengths, weaknesses, contingent and other liabilities, and potential profitability, negotiate transactions on terms acceptable to us, achieve the desired
13
tax results, particularly in foreign jurisdictions, that could ultimately impact the overall cost of the acquisition or the ultimate after tax profitability expected from the acquisition; or integrate any acquisitions that we complete.
Our acquisition activities may present financial, managerial, and operational risks, such as diversion of management attention from existing businesses, difficulties integrating personnel and financial and other systems, inability to promptly ensure an effective control environment, and indemnities and potential disputes with the sellers. Any of these factors could affect our sales, results of operations and financial condition. In addition, the acquired businesses or joint ventures may not achieve the level of sales or profitability that justify our investment in them, and an acquired business may have unidentified liabilities for which we, as a successor owner, may be responsible. We may be required to write down our investment if the business fails to achieve our financial expectations.
Our international operations subject us to business risks that could cause our revenue and profitability to decline.
Based upon current distribution, we estimate that our products are sold in over 50 countries worldwide. Sales to customers outside of the United States accounted for 19% and 18% of our total net sales in the years ended December 31, 2016 and 2015, respectively. In addition, we formed a joint venture in China that began producing and selling products in China at the end of 2014. Risks associated with our operations outside of the United States include:
• | interpretation of and compliance with legal and regulatory requirements in multiple jurisdictions that differ from those in the United States and change from time to time, such as tax, labor, and trade laws, food safety laws, antitrust and competition laws, and data privacy laws; |
• | difficulties and costs associated with complying with U.S. laws and regulations, such as the Foreign Corrupt Practices Act, applicable to entities with overseas operations; |
• | difficulties in managing, and additional financial investments required to manage, operations outside the U.S. and ensuring consistent compliance with company policies and procedures; |
• | foreign currency exposures; |
• | political, social and economic instability; |
• | the imposition of tariffs, quotas, trade barriers, other trade protection measures and import or export licensing requirements; |
• | increased costs, disruptions in shipping or reduced availability of freight transportation; and |
• | diminished protection of intellectual property in some countries. |
If one or more of these business risks occur, our business and results of operations could be negatively affected.
We may face difficulties as we expand our operations into countries in which we have no prior operating experience.
We intend to grow our business by, among other things, introducing our brands and products into high-growth regions across the globe, including countries in which we currently do not operate. These regions may include less developed countries, which may be less politically, socially or economically stable and which may have less developed infrastructure and legal systems. In addition, it may be difficult for us to understand and accurately predict taste preferences and purchasing habits of consumers in these new geographic markets. Our inability to develop and offer products that appeal to local consumer preferences or to efficiently navigate the regulatory, distribution, personnel, technological and other differences in these new geographies, could have a material adverse effect on our profitability. In addition, commencing operations in new countries may present financial, managerial, and operational risks, such as diversion of management attention from existing businesses, difficulties managing personnel from afar and difficulties understanding and implementing new legal and regulatory requirements. Any of these factors could affect our sales, results of operations and financial condition.
Our operations face foreign currency exchange exposure that could materially negatively impact our operating results.
We hold assets, incur liabilities, earn revenue and pay expenses in a variety of currencies other than the U.S. dollar, primarily the Euro, British pound, Canadian dollar, Mexican peso, Chinese yuan and the Brazilian real. Because our financial statements are presented in U.S. dollars, we must translate our assets, liabilities, sales and expenses into U.S. dollars at the then-applicable exchange rates. Consequently, changes in the value of the U.S. dollar versus these non-U.S. currencies may negatively affect the value of these items in our financial statements, even if their value has not changed in their original currency. We may attempt to mitigate some of this risk with hedging and other activities; however our business nevertheless will remain subject to substantial foreign exchange risk from foreign currency translation exposure.
14
Adverse weather conditions, natural disasters, crop disease, pests and other natural conditions can impose significant costs and losses on our business.
Agricultural products are vulnerable to adverse weather conditions, including severe rains, drought and temperature extremes, floods and windstorms, which are quite common but difficult to predict. For example, parts of California have experienced drought, which have impacted the availability and cost of our raw materials, including almonds and dairy inputs. Agricultural products also are vulnerable to crop disease and to pests, which may vary in severity and effect, depending on the stage of production at the time of infection or infestation, the type of treatment applied and climatic conditions. Unfavorable growing conditions caused by these factors can reduce both crop size and crop quality and, in extreme cases, entire harvests may be lost. These factors may result in lower sales volume and, in the case of farms we manage, increased costs due to expenditures for additional farming techniques, the repair of infrastructure and the replanting of damaged or destroyed crops. Incremental costs, including transportation, may also be incurred if we need to find alternate short-term supplies of organic greens or other produce from other growers. These factors can increase costs, decrease revenues and lead to additional charges to earnings, which may have a material adverse effect on our business, results of operations and financial condition.
Disruption of our supply or distribution chains could adversely affect our business.
Our ability to make, move, and sell our products is critical to our success. Damage or disruption to our manufacturing, farming or distribution capabilities due to weather, natural disaster, fire or explosion, terrorism, pandemic, strikes, government actions, the financial or operational instability of key suppliers, distributors, warehousing, and transportation providers, or other reasons could impair our ability to manufacture or sell our products. For example, the loss of any of our Europe Foods & Beverages segment’s third-party distributors for local representation in Europe could negatively affect our business. In addition, most of our organic salads, fruits and vegetables, and plant-based frozen desserts are processed in a single facility, and damage or disruption to these facilities could impair our ability to process and sell those products. Disputes with significant suppliers or contract manufacturers, including disputes regarding pricing or performance, may also adversely affect our ability to manufacture and/or sell our products, as well as our business or financial results. Failure to take adequate steps to mitigate the likelihood or potential impact of such events, or to effectively manage such events if they occur, could adversely affect our business or financial results.
Changes in our credit ratings may have a negative impact on our future financing costs or the availability of capital.
Some of our indebtedness is rated by Standard & Poor’s and Moody’s Investors Service, and there are a number of factors beyond our control that could impact these ratings. Our credit ratings are currently considered to be below “investment grade.” Although the interest rates on our existing indebtedness are not impacted by changes in our credit ratings, such ratings or any rating downgrades may impair our ability to raise additional capital in the future on terms that are acceptable to us, may cause the value of our securities to decline and may have other negative implications with respect to our business.
Economic downturns could limit consumer demand for our products and negatively affect our sales and profitability.
Retailers are increasingly offering private label products that compete with our products. Consumers’ willingness to purchase our products will depend upon our ability to offer products that appeal to consumers at the right price. It is also important that our products are perceived to be of a higher quality than less expensive alternatives. If the difference in quality between our products and those of private label brands narrows, or if such difference in quality is perceived to have narrowed, then consumers may not buy our products. Furthermore, during periods of economic uncertainty, consumers may shift their purchases to lower-priced or private label products or forego certain purchases altogether. They also may reduce the number of organic and premium products that they purchase because organic and premium products generally have higher retail prices than their conventional counterparts. Lower consumer demand resulting from an economic downturn could decrease our sales volumes and negatively affect our results of operations.
We may need additional financing in the future, and we may not be able to obtain that financing.
From time to time, we may need additional financing to support our business and pursue our growth strategy, including strategic acquisitions. Our ability to obtain additional financing, if and when required, will depend on investor demand, our operating performance, the condition of the capital markets, and other factors. We cannot assure you that additional financing will be available to us on favorable terms when required, or at all.
Our substantial debt and financial obligations could adversely affect our ability to operate our business and may limit our ability to incur additional debt.
As of January 31, 2017, we had approximately $2.2 billion of outstanding indebtedness, which excludes debt issuance costs. We also had additional borrowing capacity of approximately $819.4 million under our committed credit facilities, and these credit
15
facilities allow us, as borrower, to add one or more incremental term loan facilities and/or increase the commitments under the revolving credit facilities in an aggregate principal amount of up to $521.6 million, subject to the satisfaction of certain conditions.
Our debt levels and the terms of our financing arrangements:
• | require us to dedicate significant cash flow from operations to the payment of principal of, and interest on, our debt, which will reduce the funds we have available for other purposes; |
• | may limit our ability to obtain additional financing in the future for working capital, capital expenditures and acquisitions, to fund growth or for general corporate purposes, especially if the ratings assigned to our debt securities by rating organizations were revised downward; |
• | may limit our future ability to refinance our indebtedness on terms acceptable to us or at all; |
• | may subject us to higher levels of indebtedness than our competitors, which may cause a competitive disadvantage for us and may reduce our flexibility in responding to increased competition; |
• | may limit our flexibility in planning for or reacting to changes in our business and market conditions or in funding our strategic growth plan; and |
• | impose on us financial and operational restrictions. |
If we are not able to repay or refinance our debt as it becomes due, we may be forced to take disadvantageous actions, including reducing spending on marketing, retail trade incentives, advertising and product innovation, reducing financing in the future for working capital, capital expenditures and general corporate purposes, or otherwise dedicating an unsustainable level of our cash flow from operations to the payment of principal and interest on our indebtedness.
The credit agreement governing our senior secured credit facilities contains various covenants that impose restrictions on us that may affect our ability to operate our business.
The credit agreement governing our senior secured credit facilities contains covenants that, among other things, restrict our ability to:
• | borrow money or guarantee debt |
• | create liens; |
• | make specified types of investments and acquisitions |
• | pay dividends on or redeem or repurchase stock |
• | enter into sale and leaseback transactions |
• | enter into transactions with affiliates; and |
• | sell assets or merge with other companies |
These restrictions on the operation of our business could harm us by, among other things, limiting our ability to take advantage of financing, merger and acquisition opportunities, and other corporate opportunities. Various risks, uncertainties, and events beyond our control could affect our ability to comply with these covenants.
Labor issues could adversely affect our business.
As of January 2017, approximately 28% of our employees were covered by collective bargaining agreements or works council representation. Our collective bargaining agreements are scheduled to expire at various times over the next five years. A strike, work slowdown, or other labor unrest could in some cases impair our ability to supply our products to customers, which could result in reduced revenue and customer claims, and may distract our management from focusing on our business and strategic priorities.
We purchase a portion of our organic greens and other fresh produce from third-party growers who grow these products in the United States. The personnel engaged for harvesting operations by these third-party growers and by us, typically include significant numbers of immigrants who are authorized to work in the United States. The availability and number of these workers may decrease if certain changes are enacted in U.S. immigration laws. A scarcity of available personnel to harvest agricultural products in the United States could increase our costs for those products or could lead to product shortages.
16
Our intellectual property rights are valuable, and any inability to protect them could reduce the value of our products and brands.
We consider our intellectual property rights, particularly our trademarks, but also our patents, trade secrets, copyrights, and licenses, to be a significant and valuable aspect of our business. We attempt to protect our intellectual property rights through a combination of patent, trademark, copyright, and trade secret laws, as well as licensing agreements, third-party confidentiality, nondisclosure, and assignment agreements, and by policing third-party misuses of our intellectual property. Our failure to obtain or maintain adequate protection of our intellectual property rights, or any change in law or other changes that serve to lessen or remove the current legal protections of our intellectual property, may diminish our competitiveness and could materially harm our business.
We also face the risk of claims that we have infringed third parties’ intellectual property rights. Any claims of intellectual property infringement, even those without merit, could be expensive and time consuming to defend, cause us to cease making, licensing, or using products that incorporate the challenged intellectual property, require us to redesign or rebrand our products or packaging, divert management’s attention and resources, or require us to enter into royalty or licensing agreements to obtain the right to use a third party’s intellectual property. Any royalty or licensing agreements, if required, may not be available to us on acceptable terms or at all. Additionally, a successful claim of infringement against us could result in our being required to pay significant damages, enter into costly license or royalty agreements, or stop the sale of certain products, any of which could have a negative effect on our results of operations.
A failure to renew or a termination of our licenses for the use of other parties’ intellectual property could result in the loss of significant sales.
We have entered into license agreements to use certain trademarks, service marks, and trade names, such as LAND O LAKES, Almond Joy, Cold Stone Creamery, Cinnabon, Dunkin Donuts, Hershey’s, TruMoo and YORK, to brand and market some of our products. In addition, we have entered into a license agreement with DSM Nutritional Products, the owner of Martek Biosciences Corporation, to use products covered by a patent for supplementing certain of our premium dairy and soy products with DHA Omega-3. Most of these agreements are scheduled to expire at various dates in the future, and we cannot guarantee that we will be able to renew these licenses on acceptable terms upon expiration or at all or that we will be able to acquire new licenses to use other popular trademarks or proprietary products or processes. The termination or expiration of a license agreement would cause us to lose the sales and any associated profits generated pursuant to such license and in certain cases could result in an impairment charge for related intangible assets.
Litigation or legal proceedings could expose us to significant liabilities and have a negative impact on our reputation.
We are party to various litigation claims and legal proceedings. We evaluate these litigation claims and legal proceedings to assess the likelihood of unfavorable outcomes and to estimate, if possible, the amount of potential losses. Based on these assessments and estimates, we establish reserves or disclose the relevant litigation claims or legal proceedings, as appropriate. These assessments and estimates are based on the information available to management at the time and involve a significant amount of management judgment. Actual outcomes or losses may differ materially from our current assessments and estimates.
Our business is subject to various environmental and health and safety laws and regulations, which may increase our compliance costs or subject us to liabilities.
Our business operations are subject to numerous laws and regulations relating to the protection of the environment and health and safety matters, including the Clean Air Act, the Clean Water Act, the Comprehensive Environmental Response, Compensation and Liability Act of 1980, as amended, and the National Organic Standards of the U.S. Department of Agriculture, as well as similar state and local statutes and regulations in the United States, Europe and in each of the countries in which we do business. These laws and regulations govern, among other things, air emissions and the discharge of wastewater and other pollutants, the use of refrigerants, the handling and disposal of hazardous materials, and the cleanup of contamination in the environment. We could incur significant costs, including fines, penalties and other sanctions, cleanup costs, and third-party claims for property damage or personal injury as a result of the failure to comply with, or liabilities under, environmental, health, and safety requirements. New legislation, as well as current federal and state regulatory initiatives relating to these environmental matters, could require us to replace equipment, install additional pollution controls, purchase various emission allowances, or curtail operations. These costs could negatively affect our results of operations and financial condition.
Violations of laws or regulations related to the food industry, as well as new laws or regulations or changes to existing laws or regulations related to the food industry, could adversely affect our business.
The food production and marketing industry is subject to a variety of federal, state, local, and foreign laws and regulations, including food safety requirements related to the ingredients, manufacture, processing, storage, marketing, advertising, labeling,
17
and distribution of our products, as well as those related to worker health and workplace safety. Our activities, both in and outside of the United States, are subject to extensive regulation. We are regulated by, among other federal and state authorities, the U.S. Food and Drug Administration (“FDA”), the U.S. Federal Trade Commission (“FTC”), and the U.S. Departments of Agriculture, Commerce, and Labor, as well as by similar authorities abroad within the regulatory framework of the European Union and its members, Canada, China and Latin America. Governmental regulations also affect taxes and levies, healthcare costs, energy usage, immigration, and other labor issues, all of which may have a direct or indirect effect on our business or those of our customers or suppliers. In addition, the marketing and advertising of our products could make us the target of claims relating to alleged false or deceptive advertising under federal, state, and foreign laws and regulations, and we may be subject to initiatives that limit or prohibit the marketing and advertising of our products to children. We are also subject to federal laws and regulations relating to our organic products and production. For example, as required by the National Organic Program (“NOP”), we rely on third parties to certify certain of our products and production locations as organic. Changes in these laws or regulations or the introduction of new laws or regulations could increase our compliance costs, increase other costs of doing business for us, our customers, or our suppliers, or restrict our actions, which could adversely affect our results of operations. In some cases, increased regulatory scrutiny could interrupt distribution of our products or force changes in our production processes and our products. If we are found to be in violation of applicable laws and regulations in these areas, we could be subject to civil remedies, including fines, injunctions, or recalls, as well as potential criminal sanctions, any of which could have a material adverse effect on our business.
Item 1B. | Unresolved Staff Comments |
None.
Item 2. | Properties |
Our corporate headquarters are located in Denver, Colorado in approximately 40,000 square feet of leased office space. With respect to our business segments: Americas Foods & Beverages is headquartered in Broomfield, Colorado (approximately 137,000 square feet of leased office space) and Europe Foods & Beverages is headquartered in Ghent, Belgium (approximately 32,300 square feet of leased office space).
We operate 15 production facilities worldwide, which we believe are well maintained and suitable to support our current business operations. Our production facilities are located in the following cities and support the indicated business segments. Unless otherwise indicated, we own each of the production facilities listed below.
Americas Foods & Beverages Facilities | Europe Foods & Beverages Facilities | |||
Scottsdale, Arizona | Bridgeton, New Jersey | Wevelgem, Belgium | ||
American Canyon, California (leased) | Springfield, Oregon (leased) | Issenheim, France | ||
City of Industry, California | DuBois, Pennsylvania | Kettering, United Kingdom | ||
San Juan Bautista, California | Pflugerville, Texas (leased) | |||
Jacksonville, Florida | Dallas, Texas | |||
San Luis Potosí, Mexico | Mt. Crawford, Virginia | |||
The Americas Foods & Beverages segment also owns an organic dairy farm located in Kennedyville, Maryland; leases and operates one stand-alone 67,000 square foot R&D facility, located in Louisville, Colorado; and leases and operates an approximately 220,000 square foot storage and warehouse facility in Yuma, Arizona, and farms or purchases produce from third parties that farm approximately 35,000 crop acres of organic farmland in California, Arizona and Mexico for the Fresh Foods platform.
Item 3. | Legal Proceedings |
From time to time, we are involved in litigation relating to claims arising out of our operations in the normal course of business. Although the results of these lawsuits, claims, and proceedings in which we are involved or may become involved cannot be predicted with certainty, we do not believe that the final outcome of any of these matters will have a material adverse effect on our business, financial condition, or results of operations.
Item 4. | Mine Safety Disclosure |
Not applicable.
18
PART II
Item 5. | Market for Registrant’s Common Equity, Related Stockholder Matters and Issuer Purchases of Equity Securities |
Market Information
The following table sets forth the high and low intra-day sales prices per share of our common stock, as reported on the New York Stock Exchange, for the periods indicated. Such quotations represent inter-dealer prices without retail markup, markdown or commission and may not necessarily represent actual transactions.
Fiscal Year Ended December 31, 2016 | High | Low | |||||
Fourth Quarter | $ | 55.65 | $ | 53.30 | |||
Third Quarter | 56.82 | 46.30 | |||||
Second Quarter | 47.45 | 38.34 | |||||
First Quarter | 41.68 | 31.40 | |||||
Fiscal Year Ended December 31, 2015 | |||||||
Fourth Quarter | $ | 44.05 | $ | 36.23 | |||
Third Quarter | 52.53 | 35.17 | |||||
Second Quarter | 50.52 | 42.85 | |||||
First Quarter | 45.51 | 32.37 | |||||
As of January 31, 2017, WhiteWave had 3,003 holders of record of its common stock. This figure does not include a substantially greater number of stockholders who are beneficial holders of our common stock in “street name” through banks, brokers, and other financial institutions that are the record holders.
We have not and do not currently intend to declare or pay any cash dividends on our common stock.
Issuer Purchases of Equity Securities
On May 23, 2013, the Company announced that its Board of Directors had authorized a share repurchase program, under which the Company may repurchase up to $150 million of its common stock. As of December 31, 2016, no shares of common stock have been repurchased under this program. There is no expiration date for the program, and the authorization to repurchase shares will end when the Company has repurchased the maximum amount of shares authorized, or the Company’s Board of Directors has determined to discontinue such repurchases.
Performance Graph
The graph below compares the cumulative total stockholder return for the common stock of The WhiteWave Foods Company, the Standard and Poor’s 500 Consumer Staples Index ("S&P 500 Consumer Staples Index") and the Standard and Poor’s MidCap 400 Index (“S&P MidCap 400 Index”). The measurement points in the graph below begin on December 31, 2012 and go through the last trading day of each fiscal year through December 31, 2016. The graph assumes that $100 was invested in WhiteWave common stock at the closing price of $16.75 on October 26, 2012 (the first trading day of our common stock on the New York Stock Exchange) and in the S&P 500 Consumer Staples Index and the S&P MidCap 400 Index on October 26, 2012, and assumes reinvestment of any dividends. The stock price performance shown in the following graph is not intended to forecast or be indicative of possible future stock price performance.
19
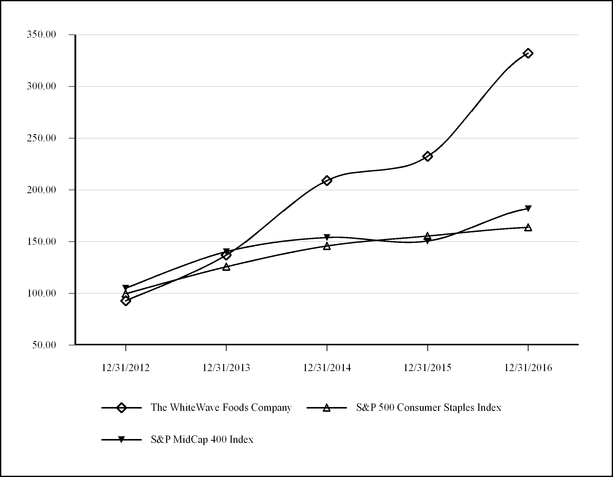
This performance graph shall not be deemed “filed” for purposes of Section 18 of the Exchange Act or incorporated by reference into any of our filings under the Securities Act or the Exchange Act, except as shall be expressly set forth by specific reference in such filing.
Item 6. | Selected Financial Data |
The WhiteWave Foods Company was incorporated on July 17, 2012 as a wholly-owned subsidiary of Dean Foods Company ("Dean Foods") to acquire the capital stock of WWF Operating Company (“WWF Opco”), a wholly-owned subsidiary of Dean Foods. Prior to our initial public offering, WWF Opco held substantially all of the historical assets and liabilities related to our business that we acquired pursuant to the contribution described below, and we had nominal assets and no liabilities, and conducted no operations. Prior to completion of our initial public offering on October 31, 2012, Dean Foods contributed all of the capital stock of WWF Opco to WhiteWave in exchange for 150,000,000 shares of Class B common stock.
The following table summarizes our consolidated financial data. We have derived the consolidated statement of income data for the years ended December 31, 2016, 2015, and 2014 and the consolidated balance sheet data as of December 31, 2016 and 2015 from our audited consolidated financial statements included elsewhere in this Annual Report on Form 10-K. The consolidated statement of income data for the years ended December 31, 2013 and 2012 and the consolidated balance sheet data as of December 31, 2014, 2013 and 2012 have been derived from our audited consolidated financial statements, which are not included in this Annual Report on Form 10-K.
Our historical consolidated financial statements for periods prior to the completion of our initial public offering were prepared on a stand-alone basis in accordance with U.S. generally accepted accounting principles ("U.S. GAAP") and derived from Dean Foods’ consolidated financial statements and accounting records using the historical results of operations and assets and liabilities attributed to our operations, and include allocations of expenses from Dean Foods. Therefore, our historical financial results prior to our initial public offering are not necessarily indicative of our results in any future period.
20
You should read the following consolidated financial data together with our audited consolidated financial statements and the related notes and “Management’s Discussion and Analysis of Financial Condition and Results of Operations.”
Year ended December 31, | |||||||||||||||||||
2016 | 2015 | 2014 | 2013 | 2012 | |||||||||||||||
(In thousands, except share and per share data) | |||||||||||||||||||
Statement of Income Data (1): | |||||||||||||||||||
Total net sales | $ | 4,198,099 | $ | 3,866,295 | $ | 3,436,605 | $ | 2,542,063 | $ | 2,289,438 | |||||||||
Loss in equity method investments | 10,221 | 11,435 | 5,984 | — | — | ||||||||||||||
Income from continuing operations | 214,554 | 168,393 | 140,185 | 99,041 | 112,514 | ||||||||||||||
Net income | 214,554 | 168,393 | 140,185 | 99,041 | 114,973 | ||||||||||||||
Net income attributable to non-controlling interest | — | — | — | — | (1,279 | ) | |||||||||||||
Net income attributable to The WhiteWave Foods Company | $ | 214,554 | $ | 168,393 | $ | 140,185 | $ | 99,041 | $ | 113,694 | |||||||||
Basic earnings per common share(2): | |||||||||||||||||||
Income from continuing operations | $ | 1.21 | $ | 0.96 | $ | 0.81 | $ | 0.57 | $ | 0.73 | |||||||||
Net discontinued operations | — | — | — | — | 0.01 | ||||||||||||||
Net income attributable to The WhiteWave Foods Company | $ | 1.21 | $ | 0.96 | $ | 0.81 | $ | 0.57 | $ | 0.74 | |||||||||
Diluted earnings per common share(2): | |||||||||||||||||||
Income from continuing operations | $ | 1.18 | $ | 0.94 | $ | 0.79 | $ | 0.57 | $ | 0.73 | |||||||||
Net discontinued operations | — | — | — | — | 0.01 | ||||||||||||||
Net income attributable to The WhiteWave Foods Company | $ | 1.18 | $ | 0.94 | $ | 0.79 | $ | 0.57 | $ | 0.74 | |||||||||
Weighted average common shares: | |||||||||||||||||||
Basic | 176,984,906 | 175,511,811 | 174,013,700 | 173,120,689 | 153,770,492 | ||||||||||||||
Diluted | 181,174,379 | 180,084,949 | 177,949,916 | 174,581,468 | 153,770,497 | ||||||||||||||
Balance Sheet Data (1): | |||||||||||||||||||
Total assets | $ | 4,468,888 | $ | 4,228,869 | $ | 3,319,067 | $ | 2,247,018 | $ | 2,134,993 | |||||||||
Total debt(3) | 2,140,341 | 2,130,389 | 1,493,364 | 653,046 | 768,548 | ||||||||||||||
Other non-current liabilities | 355,795 | 334,816 | 278,956 | 261,133 | 273,946 | ||||||||||||||
Total equity | 1,430,696 | 1,210,908 | 1,076,487 | 961,439 | 784,956 | ||||||||||||||
___________________________
(1) | The Company acquired EIEIO, Wallaby and Vega in 2015 and Earthbound Farm and So Delicious in 2014. |
(2) | Basic earnings per share is based on the weighted average number of common shares outstanding during each period. Diluted earnings per share is based on the weighted average number of common shares outstanding and the effect of all dilutive common stock equivalents outstanding during each period. For all periods prior to completion of our initial public offering, the same number of shares is being used for basic and diluted earnings per share as no WhiteWave common stock or equity awards were outstanding. 91,137 anti-dilutive options and 350 anti-dilutive RSUs were excluded from the calculation for the year ended December 31, 2016. 387,325 anti-dilutive options and 4,872 anti-dilutive RSUs were excluded from the calculation for the year ended December 31, 2015. 3,599 anti-dilutive options and 1,344 anti-dilutive RSUs were excluded from the calculation for the year ended December 31, 2014. 4,045,309 anti-dilutive options and 10 anti-dilutive RSUs were excluded from the calculation for the year ended December 31, 2013. 2,445,327 anti-dilutive options and 666,999 anti-dilutive RSUs were excluded from the calculation for the year ended December 31, 2012. |
(3) | We were allocated $440.3 million from the Dean Foods senior secured credit facility on July 2, 2009 to fund our acquisition of Alpro. Prior to completion of our initial public offering, interest expense had been allocated based on the historical interest rates of the Dean Foods senior secured credit facility. In connection with our initial public offering, the allocated portion of the Dean Foods senior secured credit facility was settled as a contribution to our capital from Dean Foods. On October 31, 2012, in connection with our initial public offering, we incurred approximately $885.0 million in new indebtedness and subsequently repaid approximately $86.0 million under the revolving credit facility with these proceeds. |
Item 7. | Management’s Discussion and Analysis of Financial Condition and Results of Operations |
The following discussion and analysis should be read in conjunction with our audited consolidated financial statements and the related notes included elsewhere in this Annual Report on Form 10-K.
21
This discussion and analysis contains forward-looking statements that are subject to risks and uncertainties. See “Forward-Looking Statements” for a discussion of the uncertainties, risks, and assumptions associated with those statements. Actual results could differ materially from those discussed in or implied by forward-looking statements as a result of various factors, including those discussed below and elsewhere in this Annual Report on Form 10-K, particularly in the section entitled “Risk Factors.”
Overview of the Business
We are a leading consumer packaged food and beverage company that manufactures, markets, distributes and sells branded plant-based foods and beverages, coffee creamers and beverages, premium dairy products and organic produce. We sell products primarily in North America, Europe and through a joint venture in China. The Company is focused on providing consumers with innovative, great-tasting food and beverage choices that meet their increasing desires for nutritious, flavorful, convenient, and responsibly-produced products. The Company's widely-recognized, leading brands distributed in North America include Silk, So Delicious and Vega plant-based foods and beverages, International Delight and LAND O LAKES coffee creamers and beverages, Horizon Organic and Wallaby Organic premium dairy products and Earthbound Farm organic salads, fruits and vegetables. Our popular plant-based foods and beverages brands in Europe include Alpro and Provamel.
Effective January 1, 2016, we report our results of operations through two reportable segments: Americas Foods & Beverages and Europe Foods & Beverages. This reporting structure aligns with the way our Chief Operating Decision Maker ("CODM"), our CEO, monitors operating performance, allocates resources, and deploys capital. In 2015 and 2014, we reported results of operations through three reportable segments: Americas Foods & Beverages, Americas Fresh Foods and Europe Foods & Beverages. In connection with our management restructure that was effective in early 2016, we combined the historical Americas Foods & Beverages and Americas Fresh Foods segments into a single Americas Foods & Beverages segment. Accordingly, segment data from prior years has been recast to reflect this new segment structure.
We sell our products to a variety of customers, including grocery stores, mass merchandisers, club stores, health food stores and convenience stores, as well as through various away-from-home channels, including foodservice outlets. We sell our products primarily through our direct sales force, independent brokers, regional brokers and distributors.
We have an extensive production and supply chain footprint and we utilize twelve production facilities and also rely on third-party co-packers to fulfill our manufacturing needs in North America and Latin America. In Europe, we have strategically positioned three plants in the United Kingdom, Belgium, and France, each supported by an integrated supply chain, and we also utilize third-party co-packers. Furthermore, we utilize a broad commercial partner network to access certain markets in Europe, in addition to our own sales organizations in the United Kingdom, Belgium, Germany, and the Netherlands.
Factors Affecting Our Business and Results of Operations
The following trends have impacted our sales and operating income over the past three years and we believe that they will continue to be factors affecting our business and results of operations in the future:
Acquisitions and Joint Venture
We have grown and may continue to grow our business in part by acquiring new brands and businesses, and forming joint ventures, both in the United States and globally. The addition of acquisitions or joint ventures allows us to leverage our resources and capabilities but can also divert resources and management attention from our day-to-day operations as we integrate them into existing operations. In 2016, we completed the IPP acquisition, in 2015 we completed the EIEIO, Vega, and Wallaby acquisitions, and in 2014, we completed the Earthbound Farm and So Delicious acquisitions.
New Product Introductions
We intend to continue to respond to evolving consumer preferences by delivering innovative products. We have a proven track record of innovation through either creating or largely developing our subcategories and we continue to focus on innovation that we believe will drive increased consumption of our products.
Volatility in Commodity Costs
Our business is heavily dependent on raw materials and other inputs, such as organic and conventional raw milk, butterfat, almonds, organic and non-genetically modified (“non-GMO”) soybeans, sweeteners, organic salads, fruits and vegetables, and other commodity costs used in the manufacturing, packaging, and distribution of our products, including utilities, natural gas, resin and diesel fuel. Changes in the costs of raw materials and other inputs historically impacted, and are expected to continue to impact our profitability. Increases in commodity costs have led, and in the future could lead, to price increases across our portfolio to mitigate the impacts of these increased costs.
22
Consumer Preferences for Nutritious, Flavorful, Convenient, and Responsibly Produced Products
The plant-based foods and beverages, organic salads, fruits and vegetables, coffee creamers and beverages, and premium dairy categories are aligned with emerging consumer preferences for products that are nutritious, flavorful, convenient, and responsibly produced. As a result, we believe these product categories will continue to offer attractive growth opportunities relative to traditional food and beverage categories. Our plant-based foods and beverages and premium dairy products are well positioned within the dairy and dairy alternatives sector, as well as the organic sector. The growth of the organic sector is outpacing the growth of the overall food and beverage industry. In addition, our coffee creamers and beverages continue to benefit from the growth and overall size of the coffee creamers sector.
Manufacturing and Warehousing Capacity Constraints
Our volume growth has required production levels and warehousing above our historical internal capacity. In response, we have relied on our third-party network for some production, which has resulted in higher costs for the production, distribution, and warehousing of our products. In addition, capacity constraints sometimes create the need for us to shift production between internal facilities, which increases overall shipping and warehousing costs. We have increased and are increasing internal capacity and will continue to both shift production between internal facilities and utilize our co-packing network, as needed, to meet our production and warehousing requirements.
Matters Affecting Comparability
Our results of operations for the years ended December 31, 2016, 2015, and 2014 were affected by the following:
Foreign Exchange Movements
Due to the international aspect of our business, our net sales and expenses are influenced by foreign exchange movements. Our primary exposures to foreign exchange rates are the Euro, British pound, Canadian dollar, Mexican peso, and the Chinese yuan against the U.S. dollar. The financial statements of our Europe Foods & Beverages segment are translated to U.S. dollars, which is our reporting currency. The functional currency is generally the local currency of the country of our subsidiary. Accordingly, income and expense items are translated at the average rates prevailing during the period. Changes in exchange rates that affect cash flows and the related receivables or payables are recognized as transaction gains and losses and are recorded in general and administrative expense in the consolidated statements of income.
Acquisitions of IPP, Wallaby, Vega, EIEIO, So Delicious and Earthbound Farm
On June 2, 2016, the Company acquired Innovation Packaging and Process, S.A. de C.V. ("IPP"). Founded in 2007, IPP is an aseptic beverage co-packer based in San Luis Potosi, Mexico. The Company purchased IPP for total cash consideration of $18.1 million.We funded this acquisition through cash provided from operations. Our preliminary purchase price allocation includes goodwill of $9.3 million, property, plant, and equipment of $9.1 million, intangible assets subject to amortization of $0.6 million related to customer relationships, and liabilities assumed net of working capital items of $0.9 million. Customer relationships are being amortized over a 3 year term. The acquisition was accounted for using the acquisition method of accounting. Assets acquired and liabilities assumed in connection with the acquisition have been recorded at their preliminary fair values. Certain estimated values for the acquisition are not yet finalized pending the final purchase price allocations, and as a result, the Company's estimates and assumptions are subject to change within the measurement period as valuations are finalized. We have included IPP's results of operations in our consolidated statements of income in our Americas Foods & Beverages segment from the date of acquisition.
On August 30, 2015, we completed our acquisition of Wallaby Yogurt Company, Inc. ("Wallaby") for approximately $122.4 million in cash. We funded this acquisition with borrowings under our credit facility. The acquisition was accounted for using the acquisition method of accounting. Assets acquired and liabilities assumed in connection with the acquisition have been recorded at their fair values. The fair values were determined by management based in part on an independent valuation of assets acquired, which includes estimated intangible assets of approximately $57.1 million and relate primarily to tradenames. Intangible assets subject to amortization of approximately $9.1 million are being amortized over a 15 year term and relate primarily to customer relationships. As of September 30, 2016, the Company has finalized its purchase price allocations related to the acquisition of Wallaby. In connection with the acquisition of Wallaby, we incurred $2.1 million in expenses during 2015 related to due diligence, investment advisors and regulatory matters. The expenses have been recorded in general and administrative expenses in our consolidated statements of income, have not been allocated to our segments and have been reflected entirely within corporate and other. We have included Wallaby's results of operations in our consolidated statements of income in our Americas Foods & Beverages segment from the date of acquisition. Net sales were $20.3 million from the acquisition date to December 31, 2015.
On August 1, 2015, we completed our acquisition of Sequel Naturals Ltd, the company that owns the Vega brand ("Vega") and is a pioneer and leader in plant-based nutrition products, for approximately $553.6 million in cash funded by borrowings under
23
our credit facility. The acquisition was accounted for using the acquisition method of accounting. Assets acquired and liabilities assumed in connection with the acquisition have been recorded at their fair values. The fair values were determined by management based in part on an independent valuation of assets acquired, which includes intangible assets of approximately $296.9 million and relate primarily to tradenames and customer relationships. Intangible assets subject to amortization of approximately $106.9 million are being amortized over a 15 year term and relate primarily to customer relationships. In connection with the acquisition of Vega, we incurred $0.3 million and $7.4 million in expenses during 2016 and 2015, respectively, related to due diligence, investment advisors and regulatory matters. The expenses have been recorded in general and administrative expenses in our consolidated statements of income, have not been allocated to our segments and have been reflected entirely within corporate and other. We have included Vega's results of operations in our consolidated statements of income in our Americas Foods & Beverages segment from the date of acquisition. Net sales were $51.4 million from the acquisition date to December 31, 2015. As of June 30, 2016, the Company has finalized its purchase price allocations related to the acquisition of Sequel Naturals Ltd.
On May 29, 2015, the Company acquired substantially all of the assets and liabilities of EIEIO, Inc. ("EIEIO"), which owns the Magicow brand as well as other brands, for $40.2 million in cash. We funded this acquisition with borrowings under our credit facility. The acquisition was accounted for using the acquisition method of accounting. Assets acquired and liabilities assumed in connection with the acquisition have been recorded at their fair values. The fair values were determined by management based in part on an independent valuation of assets acquired, which includes intangible assets of approximately $21.8 million and relate primarily to tradenames. Intangible assets subject to amortization of approximately $10.2 million are being amortized over a 15 term and relate primarily to customer relationships. In connection with the acquisition of EIEIO, we incurred $0.3 million in expenses during 2015 related to due diligence, investment advisors and regulatory matters. The expenses have been recorded in general and administrative expenses in our consolidated statements of income, have not been allocated to our segments and have been reflected entirely within corporate and other. We have included EIEIO's results of operations in our consolidated statements of income in our Americas Foods & Beverages segment from the date of acquisition. Net sales were $13.7 million from the acquisition date to December 31, 2015.
On October 31, 2014, the Company acquired the company that owns So Delicious Dairy Free ("So Delicious") for approximately $196.6 million in cash. In connection with the acquisition of So Delicious, we incurred $5.3 million in expenses during 2014 related to due diligence, investment advisors and regulatory matters. The expenses have been recorded in general and administrative expenses in our consolidated statements of income, have not been allocated to our segments and have been reflected entirely within corporate and other. We have included So Delicious's results of operations in our consolidated statements of income in our Americas Foods & Beverages segment from the date of acquisition. Net sales were $22.7 million from the acquisition date to December 31, 2014.
On January 2, 2014, the Company completed the acquisition of Earthbound Farm for approximately $608.7 million in cash. The acquisition was funded with borrowings under our senior secured credit facilities. In connection with the acquisition of Earthbound Farm, we incurred $6.8 million in expenses during 2014 related to due diligence, investment advisors and regulatory matters. As purchase accounting was closed in 2014, negotiations regarding final purchase price adjustments were completed in 2015 and resulted in a gain of $7.9 million. Both the expenses and gain were recorded in general and administrative expenses in our consolidated statements of income, have not been allocated to our segments and have been reflected entirely within corporate and other. We have included Earthbound Farm's results of operations in our consolidated statements of income in our Americas Foods & Beverages segment from the date of acquisition. Net sales were $575.3 million from the acquisition date to December 31, 2014.
The Proposed Merger with Danone
On July 6, 2016, we entered into an Agreement and Plan of Merger with Danone S.A. and July Merger Sub Inc., an indirect wholly-owned subsidiary of Danone, pursuant to which the Company will be acquired by Danone S.A., a leading global food company headquartered in Paris, France.
During the year ended December 31, 2016, the Company incurred $17.4 million of transaction costs and $1.0 million of integration planning costs related to the planned merger, which were recorded in general and administrative expenses in our consolidated statements of income. See Note 19 "The Proposed Merger with Danone."
Results of Operations
24
The following table presents, for the periods indicated, selected information from our consolidated financial results, including information presented as a percentage of net sales (note: totals may not sum and percentages may not recalculate due to rounding):
Year Ended December 31, | ||||||||||||||||||||
2016 | 2015 | 2014 | ||||||||||||||||||
Dollars | Percent | Dollars | Percent | Dollars | Percent | |||||||||||||||
(Dollars in millions) | ||||||||||||||||||||
Total net sales | $ | 4,198.1 | 100.0 | % | $ | 3,866.3 | 100.0 | % | $ | 3,436.6 | 100.0 | % | ||||||||
Cost of sales | 2,745.2 | 65.4 | % | 2,543.0 | 65.8 | % | 2,283.4 | 66.4 | % | |||||||||||
Gross profit (1) | 1,452.9 | 34.6 | % | 1,323.3 | 34.2 | % | 1,153.2 | 33.6 | % | |||||||||||
Operating expenses | ||||||||||||||||||||
Selling, distribution and marketing | 729.5 | 17.4 | % | 705.9 | 18.2 | % | 621.9 | 18.1 | % | |||||||||||
General and administrative | 321.6 | 7.7 | % | 285.2 | 7.4 | % | 265.7 | 7.7 | % | |||||||||||
Asset disposal and exit costs | — | — | % | — | — | % | (1.1 | ) | — | % | ||||||||||
Total operating expenses | 1,051.1 | 25.0 | % | 991.1 | 25.6 | % | 886.5 | 25.8 | % | |||||||||||
Operating income | 401.7 | 9.6 | % | 332.2 | 8.6 | % | 266.7 | 7.8 | % | |||||||||||
Interest and other expenses, net | 74.6 | 64.5 | 42.2 | |||||||||||||||||
Income tax expense | 102.4 | 87.9 | 78.3 | |||||||||||||||||
Loss in equity method investments | 10.2 | 11.4 | 6.0 | |||||||||||||||||
Net income | $ | 214.6 | $ | 168.4 | $ | 140.2 | ||||||||||||||
___________________________
(1) | As disclosed in Note 2 "Summary of Significant Accounting Policies" to our audited consolidated financial statements, we include certain shipping and handling costs within selling, distribution and marketing expense. As a result, our gross profit may not be comparable to other companies that present all shipping and handling costs as a component of cost of sales. |
The key performance indicators for our reportable segments are net sales, gross profit, and operating income, which are presented in the segment results tables and discussion below (note: totals may not sum due to rounding):
Year Ended December 31, 2016 Compared to Year Ended December 31, 2015
Consolidated Results
Total net sales — Total net sales by segment are shown in the table below (note: totals may not sum due to rounding):
Year Ended December 31, | ||||||||||||||
2016 | 2015 | $ Increase | % Increase | |||||||||||
(Dollars in millions) | ||||||||||||||
Americas Foods & Beverages | $ | 3,619.8 | $ | 3,333.7 | $ | 286.1 | 8.6 | % | ||||||
Europe Foods & Beverages | 578.3 | 532.6 | 45.7 | 8.6 | % | |||||||||
Total net sales | $ | 4,198.1 | $ | 3,866.3 | $ | 331.8 | 8.6 | % | ||||||
The changes in total net sales were due to the following (note: totals may not sum due to rounding):
Change in net sales 2016 vs. 2015 | |||||||||||||||
Acquisitions | Volume | Pricing, product mix and currency changes | Total increase | ||||||||||||
(Dollars in millions) | |||||||||||||||
Americas Foods & Beverages | $ | 157.0 | $ | 100.3 | $ | 28.8 | $ | 286.1 | |||||||
Europe Foods & Beverages | — | 74.5 | (28.8 | ) | 45.7 | ||||||||||
Total change in net sales | $ | 157.0 | $ | 174.8 | $ | — | $ | 331.8 | |||||||
25
Total net sales - Consolidated total net sales increased $331.8 million, or 8.6%, in 2016 compared to the prior year. This increase was driven by a combination of acquisitions in 2015 of Vega, Wallaby, and EIEIO and in 2016 of IPP, which contributed 4.1 percentage points of growth, and organic growth that was largely volume driven in both segments with additional contributions from pricing and a favorable mix in Americas Foods & Beverages. The increase was partially offset by an unfavorable currency impact of approximately 70 basis points primarily driven by a stronger U.S. dollar to British pound, and to a lesser extent, the Euro, which significantly impacted our Europe Foods & Beverages reported net sales.
Cost of sales - Cost of sales increased $202.2 million, or 8.0%, in 2016 compared to the prior year. This increase was principally driven by higher sales volumes, including the impact of acquisitions, and increased costs in the Fresh Foods platform due to an oversupply of organic inputs under fixed volume agreements that resulted in unrecoverable costs along with other significant supply chain inefficiencies. Costs were also impacted by the $2.2 million first quarter 2016 write-off of a warehouse in the Europe Foods & Beverages segment in connection with European capacity expansion. These increases were partially offset by $5.0 million of favorable foreign currency translation, a $1.5 million reduction in SAP implementation related costs within the Fresh Foods platform in 2016 compared to 2015, and $4.0 million of mark-to-market gains on our commodity hedges in 2016 compared to losses of $0.8 million in 2015 and lower commodity prices, partially offset by higher organic milk costs.
Gross profit - Gross profit margin increased to 34.6% in 2016 from 34.2% in the prior year. This increase was primarily driven by a favorable mix of products sold, including a margin benefit from acquisitions and increased costs leverage from higher volumes, partly offset by currency impacts that reduced gross margin by approximately 30 basis points.
Operating expenses - Total operating expenses increased $60.0 million, or 6.1%, in 2016 compared to the prior year.
Selling, distribution and marketing expense increased $23.6 million or 3.3% compared to the prior year. This increase was driven by an increase in selling costs associated with higher sales volumes, including the impact of acquisitions, along with higher marketing expenses. These increases were partially offset by lower distribution costs including $10.8 million of gains on our commodity hedges compared to losses of $2.0 million in 2015.
General and administrative expense increased $36.4 million or 12.8% in 2016 compared to the prior year, due principally to the impact of acquisitions. Also during the year, we incurred $19.3 million of transaction and integration planning costs related to the planned merger with Danone and other merger and acquisition activities compared to $9.8 million related to the acquisitions of EIEIO, Wallaby, and Vega in 2015. Offsetting the prior year transaction costs related to acquisitions was a $7.9 million gain recognized on the negotiated purchase price settlement from the Earthbound Farm acquisition that occurred after the purchase price allocation period was closed. During 2016 we incurred $1.9 million related to the implementation of SAP within the Fresh Foods platform compared to $3.1 million in 2015. Costs related to the management of our joint venture investment in China were $3.9 million compared to $3.7 million in 2015.
Interest and other expense, net - Interest and other expense, net for the year ended December 31, 2016 increased $10.1 million. The increase was driven by higher levels of outstanding debt for the full year 2016 due to acquisitions completed in 2015 and continued capital investments, higher average interest rates being assessed on debt and amortization of forward points on foreign exchange contracts of $3.4 million in 2016 compared to $0.8 million in 2015. These increases were partially offset by lower mark-to-market losses on our interest rate swaps of $2.0 million in 2016 compared to $5.5 million in 2015.
Income taxes - Income tax expense was $102.4 million in 2016 and recorded at an effective tax rate of 31.3%. Comparatively, income tax expense was $87.9 million in 2015 and recorded at an effective tax rate of 32.8%. Generally, our effective tax rate varies primarily based on our profitability level and relative earnings of our segments. The 2016 effective tax rate was lower than the prior year due primarily to lower state income taxes as a result of a reduction in our overall state apportionment, as well as an increase in the investment deduction in Belgium and the generally lower foreign tax rates associated with our Vega acquisition. Changes to federal, state and foreign tax laws may cause the rate to change from historical rates.
Loss in equity method investments - Our share of the losses related to the new China joint venture with Mengniu was $8.5 million and $10.7 million in 2016 and 2015, respectively. This decrease was due to increased net sales as a result of the re-launch of nut-based products and the launch of soy products, partially offset by increased promotion, selling, and general and administrative costs. Our share of the loss related to our other equity investment was $1.7 million for the year ended December 31, 2016, compared to $0.7 million in 2015.
Americas Foods & Beverages Segment Results
The following table presents certain financial information concerning our Americas Foods & Beverages segment’s financial results (note: totals may not sum due to rounding):
26
Year Ended December 31, | ||||||||||||||||||||
2016 | 2015 | $ Change | % Change | |||||||||||||||||
Dollars | Percent | Dollars | Percent | |||||||||||||||||
(Dollars in millions) | ||||||||||||||||||||
Net sales | $ | 3,619.8 | 100.0 | % | $ | 3,333.7 | 100.0 | % | $ | 286.1 | 8.6 | % | ||||||||
Cost of sales | 2,410.5 | 66.6 | % | 2,244.3 | 67.3 | % | 166.2 | 7.4 | % | |||||||||||
Gross profit | 1,209.3 | 33.4 | % | 1,089.4 | 32.7 | % | 119.9 | 11.0 | % | |||||||||||
Operating expenses | 770.8 | 21.3 | % | 730.1 | 21.9 | % | 40.7 | 5.6 | % | |||||||||||
Operating income | $ | 438.5 | 12.1 | % | $ | 359.3 | 10.8 | % | $ | 79.2 | 22.0 | % | ||||||||
Total net sales - Total net sales increased $286.1 million, or 8.6%, in 2016 compared to the prior year. This increase was driven by volume growth, including acquisitions of Vega, Wallaby and EIEIO in 2015, and IPP in 2016, which contributed $157.0 million in net sales and 4.7 percentage points of growth, and a favorable mix. These increases were partially offset by promotional investments as well as $3.7 million unfavorable impact of currency translation driven by the strengthening of the U.S. dollar compared to the Canadian dollar and the Mexican peso.
Net sales in the Plant-based Foods and Beverages platform increased 15.9%, with the acquisition of Vega and IPP contributing 11.7 percentage points of growth while currency translation had a modest unfavorable impact. Organic net sales growth was primarily driven by increased sales of plant-based yogurts, coconut beverages, nut-based beverages, including cashew and almond products, and frozen desserts, which was partially offset by declines in soy beverages of $19.9 million.
Net sales growth of 10.0% in the Coffee Creamers and Beverages platform was primarily driven by organic growth largely from increased volumes, with the acquisition of EIEIO contributing 80 basis points of growth. Organic growth was primarily driven by increases in flavored creamers, conventional and organic dairy creamers, plant-based creamers, and new product introductions, including Stōk cold-brewed coffees, driven by expanded distribution and increased velocities.
Premium Dairy platform net sales growth of 7.2% was principally driven by the acquisition of Wallaby, which contributed 5.4 percentage points of growth. Excluding Wallaby, growth was largely driven by growth in refrigerated and aseptic milks through higher pricing taken in the second quarter of 2015 to offset the rising costs of organic milk, along with growth in other organic dairy products.
Fresh Foods platform net sales decreased 4.1% and was principally due to lower packaged salad volumes as a result of supply chain constraints and lower distribution levels following the SAP implementation-related business disruptions experienced beginning in the fourth quarter of 2015, along with an unfavorable mix and lower realized pricing on commodity products.
Cost of sales - Cost of sales increased $166.2 million, or 7.4%, in 2016 compared to 2015. This increase was driven by the impact of acquisitions, along with underlying volume increases, and increased costs in the Fresh Foods platform due to an oversupply of organic inputs under fixed volume agreements that resulted in unrecoverable costs along with other significant supply chain inefficiencies. These increases were partially offset by a $1.5 million reduction in SAP implementation related costs within the Fresh Foods platform in 2016 compared to 2015, and $4.0 million of gains on our commodity hedges compared to losses of $0.8 million in 2015 as well as a benefit from nut commodities partly offset by higher organic milk costs.
Gross profit - Gross profit margin increased 70 basis points to 33.4% for 2016 compared to 32.7% for 2015. The increase was primarily driven by a favorable product mix, including the impact of acquisitions, and pricing that offset commodity costs.
Operating expenses - Operating expenses increased $40.7 million, or 5.6% in 2016 compared to 2015. This increase was primarily due to incremental expenses attributed to acquisitions of Vega and Wallaby, along with higher selling expense from increased volumes and increased marketing investments that were partially offset by lower distributions costs. During 2016, we incurred $4.4 million of integration costs related to merger and acquisition activities, and $1.9 million of post-SAP implementation associated costs within the Fresh Foods platform, compared to a total of $10.0 million in 2015.
Europe Foods & Beverages Segment Results
The following table presents certain financial information concerning our Europe Foods & Beverages segment’s financial results (note: totals may not sum due to rounding):
27
Year Ended December 31, | ||||||||||||||||||||
2016 | 2015 | $ Change | % Change | |||||||||||||||||
Dollars | Percent | Dollars | Percent | |||||||||||||||||
(Dollars in millions) | ||||||||||||||||||||
Net sales | $ | 578.3 | 100.0 | % | $ | 532.6 | 100.0 | % | $ | 45.7 | 8.6 | % | ||||||||
Cost of sales | 334.7 | 57.9 | % | 298.8 | 56.1 | % | 35.9 | 12.0 | % | |||||||||||
Gross profit | 243.6 | 42.1 | % | 233.8 | 43.9 | % | 9.8 | 4.2 | % | |||||||||||
Operating expenses | 174.4 | 30.2 | % | 166.3 | 31.2 | % | 8.1 | 4.9 | % | |||||||||||
Operating income | $ | 69.2 | 12.0 | % | $ | 67.5 | 12.7 | % | $ | 1.7 | 2.5 | % | ||||||||
Net sales - Net sales increased $45.7 million, or 8.6%, for the year ended December 31, 2016 compared to 2015. The increase was driven principally by continued strong volume growth and a favorable mix, led by nut-based, coconut and oat beverages, and growth in plant-based yogurts. Net sales growth was partially offset by unfavorable foreign currency translations which reduced growth by 4.9 percentage points.
Cost of sales - Cost of sales increased $35.9 million, or 12.0%, in 2016 compared to 2015 driven by higher sales volumes, unfavorable mix, higher depreciation expense and transition costs related to capacity expansion projects, partially offset by currency impacts which lowered cost of sales by $4.9 million. In addition, during the first quarter of 2016, we wrote off $2.2 million in fixed assets related to the demolition of the Wevelgem warehouse in connection with European capacity expansion.
Gross profit - Gross profit margin decreased to 42.1% for the year ended December 31, 2016 compared to 43.9% for 2015. The warehouse write off had an unfavorable impact on gross margins of approximately 40 basis points and currency translation contributed an additional unfavorable impact of approximately 170 basis points.
Operating expenses - Operating expenses increased $8.1 million, or 4.9%, for the year ended December 31, 2016 compared to 2015. The increase was primarily driven by higher general and administrative expenses as a result of investments in personnel and infrastructure, increased marketing investments, and higher distribution costs from increased volumes. This was significantly offset by lower transportation related to increased internal production, shipping efficiencies and favorable currency translation, which lowered operating expenses by $5.4 million.
Year Ended December 31, 2015 Compared to Year Ended December 31, 2014
Consolidated Results
Total net sales — Total net sales by segment are shown in the table below (note: totals may not sum due to rounding):
Year Ended December 31, | ||||||||||||||
2015 | 2014 | $ Increase | % Increase | |||||||||||
(Dollars in millions) | ||||||||||||||
Americas Foods & Beverages | $ | 3,333.7 | $ | 2,926.1 | $ | 407.6 | 13.9 | % | ||||||
Europe Foods & Beverages | 532.6 | 510.5 | 22.1 | 4.3 | % | |||||||||
Total net sales | $ | 3,866.3 | $ | 3,436.6 | $ | 429.7 | 12.5 | % | ||||||
The change in total net sales was due to the following (note: totals may not sum due to rounding):
Change in net sales 2015 vs. 2014 | |||||||||||||||
Acquisitions | Volume | Pricing, product mix and currency changes | Total Increase | ||||||||||||
(In millions) | |||||||||||||||
Americas Foods & Beverages | $ | 201.2 | $ | 131.0 | $ | 75.4 | $ | 407.6 | |||||||
Europe Foods & Beverages | — | 98.6 | (76.5 | ) | 22.1 | ||||||||||
Total change in net sales | $ | 201.2 | $ | 229.6 | $ | (1.1 | ) | $ | 429.7 | ||||||
28
Total net sales - Consolidated total net sales increased $429.7 million, or 12.5%, in 2015 compared to the prior year. This increase was driven by volume growth in both the Americas Foods & Beverages and Europe Foods & Beverages segments. The acquisitions of So Delicious in the fourth quarter of 2014, and the 2015 acquisitions of EIEIO, Wallaby, and Vega also made significant contributions to growth. These acquisitions contributed 5.9 percentage points of growth. The increase was partially offset by an unfavorable currency impact of 2.8 percentage points primarily driven by the stronger dollar relative to the Euro, significantly impacting our Europe Foods & Beverages reported net sales, but also due to the weakening of the Canadian dollar.
Cost of sales - Cost of sales increased $259.6 million, or 11.4%, in 2015 compared to the prior year. The increase was primarily driven by higher sales volumes including the impact of acquisitions, partially offset by approximately $55.8 million of foreign currency translation. Transition costs related to the SAP implementation within the Fresh Foods platform accounted for $11.7 million of the increase.
Gross profit - Gross profit margin increased to 34.2% in 2015 from 33.6% in the prior year. The increase was principally driven by a favorable mix of products sold.
Operating expenses - Total operating expenses increased $104.6 million, or 11.8%, in 2015 compared to the prior year. The increase was partially offset by the impact of currency translation.
Selling, distribution, and marketing costs increased $84.0 million, or 13.5%, driven by an increase in distribution costs linked to higher sales volume, including the impact of acquisitions, along with higher marketing expenses.
General and administrative expenses increased $19.5 million, or 7.3%, in 2015 due principally to higher employee related costs, including incentive based compensation, and the impact of acquisitions. In addition, we incurred $3.1 million related to the implementation of SAP within the Fresh Foods platform, $3.7 million associated with the integration of So Delicious, and $9.8 million related to the acquisitions of EIEIO, Wallaby and Vega. This was partially offset by a $7.9 million gain on the negotiated purchase price settlement of the Earthbound Farm acquisition that occurred after the purchase price allocation period was closed. By comparison, $12.1 million of transaction costs associated with the acquisitions of Earthbound Farm and So Delicious were recorded in 2014. In 2015, we incurred $3.7 million of corporate expense related to management of our joint venture investment in China, compared to $5.7 million in 2014.
Interest and other expense, net - Interest and other expense, net for the year ended December 31, 2015 increased $22.3 million. The increase was related to higher levels of debt outstanding in 2015, primarily due to the acquisition of So Delicious in the fourth quarter of 2014, along with the acquisition of EIEIO in the second quarter of 2015 and the third quarter 2015 Vega and Wallaby acquisitions, as well as continued capital expenditures. In addition, we incurred a higher weighted average interest rate on our indebtedness in 2015 due to the issuance of $500.0 million senior unsecured notes on September 17, 2014. For the year ended December 31, 2015, we incurred expense of $5.5 million related to mark to market losses on our interest rate swaps, compared to a $5.3 million expense for the same period in 2014. Partially offsetting the increase in expense was an increase of $3.4 million in annual interest rebates we received in 2015 on certain loans outstanding, as compared to prior year.
Income taxes - Income tax expense was $87.9 million in 2015 and recorded at an effective tax rate of 32.8%. Comparatively, income tax expense was $78.3 million in 2014 and recorded at an effective tax rate of 34.9%. Generally, our effective tax rate varies primarily based on our profitability level and the relative earnings of our segments. The 2015 effective tax rate was lower than the prior year primarily as a result of the completion of our 2014 tax returns that reflected favorable adjustments related to our U.S. manufacturing deduction and research and development credits.
Loss in equity method investments - Our share of the losses related to the new China joint venture with Mengniu was $10.7 million and $6.0 million in 2015 and 2014, respectively. This increase was due to the China joint venture beginning operations in late 2014. Our share of the loss related to our other equity investment was $0.7 million for the year ended December 31, 2015, compared to nil in 2014.
Americas Foods & Beverages Segment Results
The following table presents certain financial information concerning our Americas Foods & Beverages segment’s results (note: totals may not sum and percentages may not recalculate due to rounding):
29
Year Ended December 31, | ||||||||||||||||||||
2015 | 2014 | $ Change | % Change | |||||||||||||||||
Dollars | Percent | Dollars | Percent | |||||||||||||||||
(Dollars in millions) | ||||||||||||||||||||
Net sales | $ | 3,333.7 | 100.0 | % | $ | 2,926.1 | 100.0 | % | $ | 407.6 | 13.9 | % | ||||||||
Cost of sales | 2,244.3 | 67.3 | % | 1,991.8 | 68.1 | % | 252.5 | 12.7 | % | |||||||||||
Gross profit | 1,089.4 | 32.7 | % | 934.3 | 31.9 | % | 155.1 | 16.6 | % | |||||||||||
Operating expenses | 730.1 | 21.9 | % | 622.4 | 21.3 | % | 107.7 | 17.3 | % | |||||||||||
Operating income | $ | 359.3 | 10.8 | % | $ | 311.9 | 10.7 | % | $ | 47.4 | 15.2 | % | ||||||||
Total net sales - Total net sales increased $407.6 million, or 13.9%, in 2015 compared to the prior year. This increase was driven by volume growth, including the acquisitions of So Delicious, Wallaby, Vega and EIEIO, as well as increased pricing, primarily on the Premium Dairy platform. Acquisitions contributed $201.2 million in growth for the year ended December 31, 2015. These increases were partially offset by a $9.4 million decrease in sales in the Fresh Foods platform and the unfavorable impact of currency translation of $13.3 million, driven by the strengthening of the U.S. dollar compared to the Canadian dollar and the Mexican peso. The currency impact was most significant in the Plant-based Food and Beverages platform and, to a lesser extent, the Coffee Creamers and Beverages platform.
Net sales in the Plant-based Foods and Beverages platform increased 28.5%. The acquisitions of So Delicious and Vega contributed approximately 21.4 points of growth, while currency translation had a modestly unfavorable impact. Net sales also benefited from our nut-based beverages, including almond and cashew products, which collectively increased net sales by $59.8 million for the year ended December 31, 2015. This increase was partially offset by a decline in soy beverage products which reduced sales by $20.5 million.
Net sales in the Coffee Creamers and Beverages platform increased 10.0%. The performance was driven by higher volumes including the acquisitions of EIEIO and So Delicious creamers and the impact of price increases implemented in 2014 on dairy based creamers. Acquisitions contributed a combined 2.8 points of growth, while currency translation had a modestly unfavorable impact.
The Premium Dairy platform growth of 17.7% was principally driven by higher pricing taken to offset the impact of the rising cost of organic milk. In addition, the acquisition of Wallaby in August of 2015 contributed 3.2 points of growth. Volume growth was modest and was driven by increases in center store products (snacks and macaroni and cheese) and other dairy.
Fresh Foods platform net sales decreased 1.6% principally due to a disruption of sales related to warehouse and shipping constraints incurred during the implementation of SAP in the fourth quarter, and a decline in fresh fruits as we exited certain lower margin fresh fruit agreements during the year. The sales disruptions driven by our SAP implementation resulted in lower customer service levels due to our constrained ability to fulfill orders and a reduction in our points of distribution during the fourth quarter.
Cost of sales - Cost of sales increased $252.5 million, or 12.7%, in 2015 compared to 2014. The increase was driven by the impact of acquisitions and volume increases in the Company's historical platforms, as well as higher commodity costs, particularly almonds and organic dairy inputs, and costs related to the implementation of SAP in the Fresh Foods platform in the fourth quarter. SAP implementation costs were $11.7 million for the year ending December 31, 2015, which included higher warehousing costs, both internal and external, as well as higher finished goods and raw inventory obsolescence and higher farming costs driven by an increase in disposed crops.
Gross profit - Gross profit margin increased 80 basis points to 32.7% for 2015 compared to 31.9% for 2014. The increase was driven by a favorable product mix, partially offset by the incremental costs in the Fresh Foods platform associated with our SAP implementation and lower cost absorption related to reduced volumes, and the impact of a strengthening U.S. dollar relative to the Canadian dollar and the Mexican peso, which reduced gross margin by 30 basis points.
Operating expenses - Operating expenses increased $107.7 million, or 17.3% in 2015 versus 2014. This increase was principally due to the acquisitions of So Delicious, Vega and Wallaby, but was also driven by higher marketing investments in our brands, higher distribution costs linked to higher sales volumes and higher employee related costs. We also incurred higher transition costs related to acquisitions of $7.8 million for the year ended December 31, 2015 as compared to $0.8 million for the year ended December 31, 2014.
Europe Foods & Beverages Segment Results
30
The following table presents certain financial information concerning our Europe Foods & Beverages segment’s financial results (note: totals may not sum and percentages may not recalculate due to rounding):
Year Ended December 31, | ||||||||||||||||||||
2015 | 2014 | $ Change | % Change | |||||||||||||||||
Dollars | Percent | Dollars | Percent | |||||||||||||||||
(Dollars in millions) | ||||||||||||||||||||
Net sales | $ | 532.6 | 100.0 | % | $ | 510.5 | 100.0 | % | $ | 22.1 | 4.3 | % | ||||||||
Cost of sales | 298.8 | 56.1 | % | 291.7 | 57.1 | % | 7.1 | 2.4 | % | |||||||||||
Gross profit | 233.8 | 43.9 | % | 218.8 | 42.9 | % | 15.0 | 6.9 | % | |||||||||||
Operating expenses | 166.3 | 31.2 | % | 166.1 | 32.5 | % | 0.2 | 0.1 | % | |||||||||||
Operating income | $ | 67.5 | 12.7 | % | $ | 52.7 | 10.4 | % | $ | 14.8 | 28.1 | % | ||||||||
Net sales - Net sales increased $22.1 million, or 4.3%, for the year ended December 31, 2015 compared to 2014. The increase was driven principally by continued strong volume growth, let by nut-based and soy beverages, as well as strong growth in our plant-based yogurts, substantially offset by unfavorable foreign currency translation, which reduced net sales by 16.4 percentage points. Volume growth was broad-based across our European markets.
Cost of sales - Cost of sales increased $7.1 million, or 2.4%, for the year compared to 2014 driven by higher sales volumes, substantially offset by foreign currency translation. Foreign currency translation reduced cost of sales by $55.8 million. Manufacturing and warehousing costs also increased as our internal capacity continues to be constrained by our strong volume growth which has caused us to increase our utilization of third-party co-manufacturers and warehouses.
Gross profit - Gross profit margin increased to 43.9% for the year compared to 42.9% for 2014, driven by a favorable foreign currency translation, more than offsetting higher production and warehousing costs.
Operating expenses - Operating expenses increased $0.2 million, or 0.1%, for the year ended December 31, 2015 compared to 2014. The increase was driven by higher distribution costs, principally due to our volume growth, along with higher marketing investments and general and administrative expenses as we continue to invest behind our brands and infrastructure. These increases were substantially offset by a $27.4 million favorable impact of currency translation.
Liquidity and Capital Resources
Debt Facilities
As of January 31, 2017, we had outstanding borrowings of $1.6 billion under our $2.5 billion senior secured credit facilities, which consisted of $1.5 billion of term loan borrowings and $171.6 million borrowed under our $1.0 billion revolving credit facility commitment. We further had $9.0 million in outstanding letters of credit issued under our revolving credit facility. We had the ability to incur up to a maximum of approximately $778.7 million of additional indebtedness as governed by the current financial covenants under our senior secured credit facility, assuming such proceeds are not utilized to acquire additional businesses or operations.
The senior secured credit facilities are collateralized by interests and liens on substantially all of our assets and the assets of our domestic subsidiaries. The senior secured credit facilities are guaranteed by our material domestic subsidiaries. As of January 31, 2017, borrowings under our senior secured credit facilities bore interest at a rate of LIBOR plus 1.75% per annum for the $1.0 billion revolving commitment and the $712.5 million currently outstanding on the term loan A-1 facility and LIBOR plus 2.00% per annum for the $742.5 million currently outstanding on the term loan A-2 facility.
The completion of the Merger of the Company with a wholly-owned subsidiary of Danone will trigger a change of control default under the senior secured credit facilities; however, under the Merger Agreement, Danone has agreed to repay the facility at closing if the change of control default provision is not modified or waived.
Alpro maintains a revolving credit facility not to exceed €30.0 million or its currency equivalent. The facility is unsecured and guaranteed by the Company. The Alpro revolving credit facility is available for working capital and other general corporate purposes of Alpro and for the issuance of letters of credit up to €30.0 million or its currency equivalent. As of January 31, 2017, Alpro had outstanding borrowings of €30.0 million ($32.4 million USD) at an interest rate of 1.38% due upon maturity on June 29, 2017. On February 1, 2017, Alpro increased its borrowing limit by €20.0 million to €50.0 million.
31
Vega maintains an uncommitted revolving credit facility not to exceed $15.0 million CAD or its currency equivalent. The facility is unsecured and guaranteed by the Company. The facility is available for working capital and other general corporate purposes of Vega. As of January 31, 2017, Vega had outstanding borrowings of $1.6 million CAD ($1.2 million USD) under the facility.
As of December 31, 2016, we were in compliance with all related (or associated) covenants under our debt facilities.
Liquidity
Based on current and anticipated level of operations, we believe that our cash on hand, together with operating cash flows, and amounts expected to be available under our senior secured credit facilities, will be sufficient to meet our anticipated liquidity needs over the next twelve months. Our anticipated uses of cash include capital expenditures, working capital needs, other general corporate purposes, and financial obligations such as payments under the senior secured credit facility. In addition, we also evaluate and consider strategic acquisitions, divestitures, joint ventures, and stock repurchases, as well as other transactions to create stockholder value and enhance financial performance. Such transactions may require cash expenditures by us or generate proceeds for us. In connection with such transactions, or to fund other anticipated uses of cash, we may modify our senior secured credit facilities, seek additional debt financing or issue equity securities.
As of December 31, 2016, $43.3 million of our total cash on hand was attributable to our foreign operations and currently domiciled outside the U.S. We anticipate permanently reinvesting our foreign earnings outside the U.S. See Note 8 "Income Taxes."
Capital Resources
For 2017, we expect to invest approximately the same amount of capital expenditures as we did in 2016 primarily to continue to increase manufacturing and warehousing capacity to support our growth. We expect net cash interest to be slightly higher than 2016 based upon expected debt levels and current forward interest rates under our senior secured credit facilities, which excludes amortization of deferred financing fees of approximately $4.1 million. We also expect cash payments on our interest rate swaps to be approximately $3.7 million based on the notional amounts of the swaps and the forward LIBOR curve as of December 31, 2016. We anticipate that cash flows from operations and additional borrowing capacity under our senior secured credit facilities will be sufficient to meet our liquidity requirements for the foreseeable future.
Our board of directors has authorized a share repurchase program, under which the Company may repurchase up to $150.0 million of its common stock. The primary purpose of the program is to offset dilution from the Company’s equity compensation plans, but the Company also may make discretionary purchases. Shares may be repurchased under the program from time to time in one or more open market or other transactions, at the discretion of the Company, subject to market conditions and other factors. The authorization to repurchase shares will end when the Company has repurchased the maximum amount of shares authorized, or the Company’s Board of Directors has determined to discontinue such repurchases. To date, no shares have been repurchased under the share repurchase program.
Historical Cash Flow
Year Ended December 31, 2016 Compared to Year Ended December 31, 2015
The following table summarizes our cash flows from operating, investing, and financing activities (note: totals may not sum due to rounding):
Year Ended December 31, | |||||||||||
2016 | 2015 | Change | |||||||||
(In millions) | |||||||||||
Net cash flows from: | |||||||||||
Operating activities | $ | 316.5 | $ | 315.3 | $ | 1.2 | |||||
Investing activities | (307.8 | ) | (957.5 | ) | 649.7 | ||||||
Financing activities | 10.7 | 635.9 | (625.2 | ) | |||||||
Effect of exchange rate changes on cash and cash equivalents | (12.2 | ) | (5.4 | ) | (6.8 | ) | |||||
Net increase (decrease) in cash and cash equivalents | $ | 7.2 | $ | (11.6 | ) | $ | 18.8 | ||||
Operating Activities
32
Net cash provided by operating activities was $316.5 million for the year ended December 31, 2016 compared to net cash provided of $315.3 million for the year ended December 31, 2015. The primary drivers of the increase in cash from operating activities was an increase in net income after adjustments for items such as depreciation and amortization, loss on disposals and deferred income taxes offset by a decrease in cash provided from operating assets and liabilities. The decrease in cash provided from operating assets and liabilities was primarily due to lower accounts payable and accruals driven by the timing of cash disbursements related to outstanding payments at the end of 2015 relative to the end of 2014, and higher cash payments of employee bonuses in 2016 compared to 2015 as a result of higher operating results in 2015 compared to 2014 and increases in headcount. In addition, prepaid expense and other assets increased, driven primarily by an increase in income tax receivable due to timing. These were partially offset by a smaller increase in accounts receivable related to a lower rate of sales growth in 2016 compared to 2015, and a lower increase in inventory in relation to sales primarily due a specific reduction of inventory related to a co-manufacturer transition in 2016.
Investing Activities
Net cash used in investing activities was $307.8 million for the year ended December 31, 2016 compared to net cash used in investing activities of $957.5 million for the year ended December 31, 2015. The change was primarily driven by a decrease in payments for acquisitions of $690.3 million, partially offset by an increase in capital expenditures of $32.3 million.
Financing Activities
Net cash provided by financing activities was $10.7 million for the year ended December 31, 2016 compared to net cash provided of $635.9 million for the year ended December 31, 2015. The decrease in the amount of cash from financing activities from 2015 was driven primarily by the lower amount of financing related to acquisition activities of $690.3 million, partially offset by the payment of debt.
Year Ended December 31, 2015 Compared to Year Ended December 31, 2014
The following table summarizes our cash flows from operating, investing, and financing activities (note: totals may not sum and percentages may not recalculate due to rounding):
Year Ended December 31, | |||||||||||
2015 | 2014 | Change | |||||||||
(In millions) | |||||||||||
Net cash flows from: | |||||||||||
Operating activities | $ | 315.3 | $ | 284.6 | $ | 30.7 | |||||
Investing activities | (957.5 | ) | (1,140.6 | ) | 183.1 | ||||||
Financing activities | 635.9 | 813.2 | (177.3 | ) | |||||||
Effect of exchange rate changes on cash and cash equivalents | (5.4 | ) | (8.1 | ) | 2.7 | ||||||
Net decrease in cash and cash equivalents | $ | (11.6 | ) | $ | (50.9 | ) | $ | 39.2 | |||
Operating Activities
Net cash provided by operating activities was $315.3 million for the year ended December 31, 2015 compared to $284.6 million for the year ended December 31, 2014. The higher level of cash provided by operating activities was primarily due to higher net income. In addition, we experienced a favorable net change in operating assets and liabilities. Driving the favorability was a greater accounts payable change due to the timing of cash disbursements along with a favorable change in income taxes payable due to timing of the 2014 settlement with Dean Foods on the joint 2013 tax return. These increases were offset by an unfavorable change in accounts receivable and an increase in inventories to support growth.
Investing Activities
Net cash used in investing activities was $957.5 million for the year ended December 31, 2015 compared to $1,140.6 million for the year ended December 31, 2014. The change was primarily driven by the acquisitions of Vega, Wallaby and EIEIO for $716.1 million in aggregate in 2015 as compared to the purchases of Earthbound Farm and So Delicious for an aggregate $798.4 million in 2014. In addition, capital expenditures were $40.6 million lower in 2015 as compared to 2014.
Financing Activities
33
Net cash provided by financing activities was $635.9 million for the year ended December 31, 2015 compared to $813.2 million for the year ended December 31, 2014. The decrease was principally due to a reduced amount of cash utilized in investing activities as a result of lower payments for acquisitions, investments and property, plant and equipment in 2015 as compared to 2014.
Contractual Obligations and Other Long-Term Liabilities
In the normal course of business, we enter into contracts and commitments that obligate us to make payments in the future. The table below summarizes our obligations for indebtedness, purchase, lease, and other contractual obligations at December 31, 2016.
Payments Due by Period | |||||||||||||||||||
Total | Less than 1 year | 1-3 years | 3-5 years | After 5 years | |||||||||||||||
(In thousands) | |||||||||||||||||||
Senior secured credit facilities | $ | 1,627,600 | $ | 45,000 | $ | 90,000 | $ | 787,600 | $ | 705,000 | |||||||||
Senior unsecured notes | 500,000 | — | — | — | 500,000 | ||||||||||||||
Unsecured revolving credit facilities | 12,191 | 12,191 | — | — | — | ||||||||||||||
Purchase obligations(1) | 1,290,564 | 756,366 | 480,532 | 52,429 | 1,237 | ||||||||||||||
Operating leases(2) | 98,855 | 32,139 | 39,392 | 15,288 | 12,036 | ||||||||||||||
Capital leases | 20,244 | 1,394 | 3,066 | 1,756 | 14,028 | ||||||||||||||
Benefit payments(3) | 19,264 | 99 | 2,146 | 644 | 16,375 | ||||||||||||||
Interest payments(4) | 376,317 | 80,941 | 141,379 | 112,384 | 41,613 | ||||||||||||||
Total(5) | $ | 3,945,035 | $ | 928,130 | $ | 756,515 | $ | 970,101 | $ | 1,290,289 | |||||||||
___________________________
(1) | Primarily represents commitments to purchase minimum quantities of raw materials used in our production processes and materials used in our distribution process including diesel fuel. We enter into these contracts from time to time to ensure a sufficient supply of raw materials and manage risk. This also represents contractual obligations to purchase various services that are part of our production process. |
(2) | Represents future minimum lease payments under non-cancelable operating leases related to our distribution fleet, corporate offices, and certain of our manufacturing and distribution facilities. See Note 14 "Commitments and Contingencies" to our audited consolidated financial statements for more detail about our lease obligations. |
(3) | Represents expected future benefit obligations of $19.3 million related to the Company sponsored pension plans in Europe. In addition to our Company-sponsored plans, we participate in one multiemployer defined benefit pension plan. The cost of this plan is equal to the annual required contributions determined in accordance with the provisions of negotiated collective bargaining arrangements. These costs were approximately $1.8 million for each of the years ended December 31, 2016, 2015, and 2014; however, the future cost of the multiemployer plan is dependent upon a number of factors, including the funded status of the plan, the ability of other participating companies to meet ongoing funding obligations, and the level of our ongoing participation in this plan. Because the amount of future contributions we would be contractually obligated to make pursuant to this plan cannot be reasonably estimated, such amounts have been excluded from the table above. See Note 13 "Employee Retirement Plans" to our audited consolidated financial statements. |
(4) | Includes expected cash payments of $3.7 million on our interest rate swaps based on the notional amounts of the swaps and the forward LIBOR curve at December 31, 2016 and interest on our variable rate debt of $209.3 million based on the rates in effect at December 31, 2016 and interest on our $500 million fixed rate senior notes. Interest that may be due in the future on the variable rate portion of our senior secured credit facilities will vary based on the interest rate in effect at the time and the borrowings outstanding at the time. Future interest payments on our interest rate swaps will vary based on the interest rates in effect at each respective settlement date. Also includes expected cash payments of $4.6 million for other derivatives. Excluded from the table above are expected cash receipts related to the interest rate swaps. |
(5) | The table above excludes our gross liability for uncertain tax positions of $26.0 million because the timing of cash settlement, if any, is unknown at this time. |
Critical Accounting Estimates
The process of preparing our consolidated financial statements in conformity with generally accepted accounting principles requires the use of estimates and judgments that affect the reported amounts of assets, liabilities, revenue, and expenses. These estimates and judgments are based on historical experience, future expectations, and other factors and assumptions we believe to be reasonable under the circumstances. The most significant estimates and judgments are reviewed on an ongoing basis and are revised when necessary. Actual amounts may differ materially from these estimates. A summary of our significant accounting policies is contained in Note 2 "Summary of Significant Accounting Policies" to our audited consolidated financial statements.
Goodwill and Intangible Assets
Our goodwill and intangible assets result primarily from acquisitions and mainly include trademarks with indefinite lives and customer-related and supplier-related relationships. Perpetual trademarks and goodwill are evaluated for impairment annually in the fourth quarter and also on an interim basis when circumstances arise that indicate a possible impairment to ensure that the
34
carrying value is recoverable. A perpetual trademark is impaired if its book value exceeds its estimated fair value. Goodwill is evaluated for impairment if we determine that it is more likely than not the book value of its reporting unit exceeds its estimated fair value. Goodwill is allocated and tested at the reporting unit level, which is an operating segment or one level below (known as a component). Amortizable intangible assets are only evaluated for impairment upon a significant change in the operating environment. If an evaluation of the undiscounted cash flows indicates impairment, the asset is written down to its estimated fair value, which is generally based on discounted future cash flows.
Considerable management judgment is necessary to initially value intangible assets upon acquisition and to evaluate those assets and goodwill for impairment going forward. We determine fair value using widely accepted valuation techniques, including discounted cash flows, market multiples analyses, and relief from royalty analyses. Assumptions used in our valuations, such as forecasted growth rates and our cost of capital, are consistent with our internal projections and operating plans. We believe that a trademark has an indefinite life if it has a history of strong sales that we expect to continue for the foreseeable future. If these perpetual trademark criteria are not met, the trademarks are amortized over their expected useful lives. Determining the expected life of a trademark requires considerable management judgment and is based on an evaluation of a number of factors including the competitive environment, trademark history, and anticipated future trademark support.
We believe the assumptions used in valuing our reporting units and in our goodwill impairment analysis are reasonable, but variations in any of the assumptions may result in different calculations of fair values that could result in an impairment charge. For 2016, we identified three reporting units which were our Europe Foods & Beverages operating segment, Vega, and our Americas Foods & Beverages operating segment excluding Vega. The identification of reporting units is based upon on how segment management views performance and the similarity of those businesses. Based on the quantitative valuation performed in 2014, the fair value of our Americas Foods & Beverages and Europe Foods & Beverages reporting units exceeds its related carrying value by approximately $3.0 billion or 112.7%, $1.0 billion or 229.6%, respectively. In addition, Vega, an acquisition in the third quarter of 2015, is expected to exceed all critical financial and operating metrics assumed in the initial purchase price valuation performed at acquisition based on management's forecasts of future performance as of the qualitative assessment performed in the fourth quarter of 2016. The results of our qualitative assessments for all reporting units conducted in 2015 and 2016 did not indicate that it was more likely than not that the fair value of any of our reporting units were less than their carrying amounts. We can provide no assurance that we will not have impairment charges in future periods as a result of changes in our operating results or our assumptions.
We believe the assumptions used in valuing our indefinite-lived trade names and in our impairment analysis are reasonable, but variations in any of the assumptions may result in different calculations of fair values that could result in an impairment charge. Based on the quantitative valuation performed in 2015, no trade name individually had a carrying value greater than its fair value and no individual trade name had less than a 29.5% excess of fair value over carrying value. The valuation of trade names is determined using the relief from royalty method for which the main assumptions are the net sales forecasts associated with each trade name, comparable royalty rates and discount rates. The subsequent results of our qualitative assessment performed in 2016 did not indicate that it was more likely than not the fair value of any of our indefinite-lived trade names were less than their carrying amounts. We can provide no assurance that we will not have impairment charges in future periods as a result of changes in our operating results or our assumptions.
Purchase Price Allocation
The application of the acquisition method of accounting for business combinations requires the use of significant estimates and assumptions in the determination of the fair value of assets acquired and liabilities assumed in order to properly allocate purchase price consideration between assets that are depreciated and those that are amortized from goodwill. The accounting for the acquisitions requires that assets and liabilities acquired, as well as any contingent consideration that may be part of the agreement, be recorded at their respective fair values as of the date of acquisition. This requires management to make significant estimates in determining the fair values, especially with respect to intangible assets, including estimates of expected cash flows, expected cost savings and the appropriate weighted average cost of capital. As a result of these significant judgments to be made we obtain the assistance of independent valuation firms. We complete these assessments as soon as practical after the closing dates. Any excess of the purchase price over the estimated fair values of the identifiable net assets acquired is recorded as goodwill.
Our estimates of the fair values of assets and liabilities acquired are based upon assumptions believed to be reasonable, but which are inherently uncertain and unpredictable. These valuations require the use of management’s assumptions, which would not reflect unanticipated events and circumstances that may occur. During the measurement period, which is up to one year from the acquisition date, we may record adjustments to the assets acquired and liabilities assumed, with the corresponding offset to goodwill. Upon the conclusion of the measurement period, any subsequent adjustments are recorded to earnings.
Revenue Recognition, Sales Incentives and Trade Accounts Receivable
35
We routinely offer sales incentives and discounts through various regional and national programs to our customers and to consumers. These programs include rebates, shelf-price reductions, in-store display incentives, coupons, and other trade promotional activities. These programs, as well as amounts paid to customers for shelf-space in retail stores, are considered reductions in the price of our products and thus are recorded as reductions to gross sales. Some of these incentives are recorded by estimating incentive costs based on our historical experience and expected levels of performance of the trade promotion. We maintain liabilities at the end of each period for the estimated incentive costs incurred but unpaid for these programs, which are recorded as a reduction in our trade accounts receivable balance. Differences between estimated and actual incentive costs are normally not material and are recognized in earnings in the period such differences are determined. This process for analyzing trade promotion programs could impact the Company’s results of operations and trade spending liabilities depending on how actual results of the programs compare to original estimates.
Share-Based Compensation
Certain employees receive various forms of share-based payment awards and we recognize compensation costs for these awards based on their fair values. The fair values of certain stock option awards are estimated on the grant date using the Black-Scholes option pricing model, which incorporates certain assumptions regarding the expected term of an award and expected stock price volatility. The expected term is determined under the simplified method, using an average of the contractual term and vesting period of the stock options. The expected volatility is based on a blend of the historic volatility for each of our peers and our current implied stock price volatility. After calculating the aggregate fair value of an award, we use an estimated forfeiture rate to discount the amount of share-based compensation costs to be recognized in the operating results over the service period of the award. The forfeiture assumption is based on our historical pre-vesting cancellation experience. Key assumptions are described in further detail in Note 11 "Share-Based Compensation" to our audited consolidated financial statements.
We grant performance share units ("PSUs") to our executive officers under the Amended and Restated 2012 Stock Incentive Plan (the "2012 SIP") as part of our long-term incentive compensation program. PSUs vest based on a comparison of the Company’s diluted adjusted EPS growth over the three-year performance period to the diluted adjusted EPS growth of companies in the S&P 500 over the same period. In the first year, one third of the PSUs vest based on our diluted adjusted EPS growth in that year compared to the one-year diluted adjusted EPS growth of S&P 500 companies. In the second year, one third of the PSUs vest based on our cumulative diluted adjusted EPS growth over the past two years compared to the cumulative two-year diluted adjusted EPS growth of S&P 500 companies. In the third year, one third of the PSUs vest based on our cumulative diluted adjusted EPS growth over the past three years compared to the cumulative three-year diluted adjusted EPS growth of S&P 500 companies. PSUs will be converted to common stock upon vesting and the payout range is 0 to 200%. We recognize share-based compensation expense in the consolidated statements of income over the three year performance period based on the Company’s estimated relative performance for each vesting tranche. We estimate our expected performance in relation to the targets at the end of each reporting period and record any necessary adjustments.
Property, Plant, and Equipment
We perform impairment tests on our property, plant, and equipment when circumstances indicate that their carrying value may not be recoverable. Indicators of impairment could include significant changes in business environment or planned closure of a facility. There were no impairment charges recorded in the years ending December 31, 2016, 2015 or 2014.
Considerable management judgment is necessary to evaluate the impact of operating changes and to estimate asset useful lives and future cash flows. If actual results are not consistent with our estimates and assumptions used to calculate estimated future cash flows, we may be exposed to impairment losses that could be material.
Income Taxes
In the ordinary course of business there is inherent uncertainty in quantifying our income tax positions. We record a liability for uncertain tax positions to the extent a tax position taken or expected to be taken in a tax return does not meet certain recognition or measurement criteria. Considerable management judgment is necessary to assess the inherent uncertainties related to the interpretations of complex tax laws, regulations, and taxing authority procedures and rulings, as well as to the expiration of statutes of limitations in the jurisdictions in which we operate. Our judgments and estimates concerning uncertain tax positions may change as a result of the evaluation of new information, such as the outcome of tax audits or changes to, or further interpretations of, tax laws and regulations. We apply a more likely than not threshold to the recognition and derecognition of uncertain tax positions. Accordingly, we recognize the amount of tax benefit that has a greater than 50 percent likelihood of being ultimately realized upon settlement. Future changes in judgment related to the expected ultimate resolution of uncertain tax positions will affect earnings in the quarter of such change. For those income tax positions where it is not more likely than not that a tax benefit will be sustained, no tax benefit has been recognized in the financial statements.
36
A valuation allowance is recorded against a deferred tax asset if it is not more likely than not that the asset will be realized. Significant judgment is required in determining any valuation allowance recorded against deferred tax assets. In assessing the need for a valuation allowance, management considers all available evidence for each jurisdiction including past operating results, estimates of future taxable income, the remaining years available for net operating and capital loss carryforwards, and the feasibility of tax planning strategies. In the event that the Company changes its determination as to the amount of deferred tax assets that can be realized, the Company will adjust its valuation allowance with a corresponding impact to income tax expense in the period in which such determination is made.
Recent Accounting Pronouncements
New accounting guidance that we have recently adopted, as well as accounting guidance that has been recently issued but not yet adopted by us, are included in Note 2 "Summary of Significant Accounting Policies" to our audited consolidated financial statements.
Item 7A. | Quantitative and Qualitative Disclosures About Market Risk |
Commodity Price Fluctuations
We are exposed to commodity price fluctuations, including organic and conventional milk, butterfat, almonds, organic and non-GMO soybeans, sweeteners, and other commodity costs used in the manufacturing, packaging, and distribution of our products, including utilities, natural gas, resin, and diesel fuel. To secure adequate supplies of materials and bring greater stability to the cost of ingredients and their related manufacturing, packaging, and distribution, we routinely enter into forward purchase contracts and other purchase arrangements with suppliers. Under the forward purchase contracts, we commit to purchasing agreed-upon quantities of ingredients and commodities at agreed-upon prices at specified future dates. The outstanding purchase commitment for these commodities at any point in time typically ranges from one month’s to eighteen month's anticipated requirements, depending on the ingredient or commodity, but can be longer in limited cases. These contracts are considered normal purchases.
We periodically utilize commodity forward purchase contracts and supplier pricing agreements to hedge the risk of adverse movements in commodity prices for limited time periods for certain commodities. Although we may utilize forward purchase contracts and other instruments to mitigate the risks related to commodity price fluctuation, such strategies do not fully mitigate commodity price risk. Adverse movements in commodity prices over the terms of the contracts or instruments could decrease the economic benefits we derive from these strategies.
Interest Rate Fluctuations
The senior secured credit facilities are collateralized by interests and liens on substantially all of our domestic assets, and are guaranteed by our material domestic subsidiaries. As of December 31, 2016, borrowings under the revolving credit facility and term loan A-1 bore interest at a rate of LIBOR plus 1.75% per annum and the term loan A-2 at a rate of LIBOR plus 2.00% per annum.
In connection with our initial public offering, on October 31, 2012, Dean Foods novated to us certain of its interest rate swaps (the “2017 swaps”) with a notional value of $650 million and a maturity date of March 31, 2017. We follow fair value accounting for these agreements and record the fair value of these outstanding contracts on the balance sheet at the end of each reporting period. The 2017 swaps have fixed interest rates between 2.75% and 3.19%. We are subject to market risk with respect to changes in the underlying benchmark interest rate that impacts the fair value of the 2017 swaps.
As of December 31, 2016, we had outstanding borrowings of $1.6 billion under our current $2.5 billion senior secured credit facilities consisting of $172.6 million outstanding under the revolving credit facility, a $712.5 million principal balance under term loan A-1, and a $742.5 million principal balance under term loan A-2. We had $9.0 million in outstanding letters of credit issued under our revolving credit facilities and $818.4 million of additional availability under our $1 billion revolving credit facility commitment. Based on the outstanding debt under our senior secured credit facilities and any other floating rate debt as of December 31, 2016, and excluding the impact of the 2017 swaps, each 1% increase/decrease in our interest rate would increase/decrease our annual interest expense by approximately $9.8 million.
Foreign Currency Fluctuations
Our international operations represented approximately 19%, 18% and 19% of our net sales for the years ended December 31, 2016, 2015 and 2014, respectively. Sales in foreign countries, as well as certain expenses related to those sales, are transacted in currencies other than our reporting currency, the U.S. dollar. Our foreign currency exchange rate risk primarily consists of the Euro, British pound, Canadian dollar, Mexican peso and Chinese yuan related to net sales and expenses in currencies other than
37
the functional currency of the business. We may, from time to time, employ derivative financial instruments to manage our exposure to fluctuations in foreign currency rates or enter into forward currency exchange contracts to hedge our net investment and intercompany payable or receivable balances in foreign operations.
38
Item 8. | Financial Statements and Supplementary Data |
Page | |
F-1 | |
F-2 | |
F-3 | |
F-4 | |
F-5 | |
F-6 | |
F-7 | |
39
REPORT OF INDEPENDENT REGISTERED PUBLIC ACCOUNTING FIRM
To the Board of Directors and Stockholders of
The WhiteWave Foods Company
Denver, Colorado
We have audited the accompanying consolidated balance sheets of The WhiteWave Foods Company and subsidiaries (the "Company") as of December 31, 2016 and 2015, and the related consolidated statements of income, comprehensive income, stockholders' equity, and cash flows for each of the three years in the period ended December 31, 2016. These financial statements are the responsibility of the Company's management. Our responsibility is to express an opinion on the financial statements based on our audits.
We conducted our audits in accordance with the standards of the Public Company Accounting Oversight Board (United States). Those standards require that we plan and perform the audit to obtain reasonable assurance about whether the financial statements are free of material misstatement. An audit includes examining, on a test basis, evidence supporting the amounts and disclosures in the financial statements. An audit also includes assessing the accounting principles used and significant estimates made by management, as well as evaluating the overall financial statement presentation. We believe that our audits provide a reasonable basis for our opinion.
In our opinion, such consolidated financial statements present fairly, in all material respects, the financial position of The WhiteWave Foods Company and subsidiaries as of December 31, 2016 and 2015, and the results of their operations and their cash flows for each of the three years in the period ended December 31, 2016, in conformity with accounting principles generally accepted in the United States of America.
We have also audited, in accordance with the standards of the Public Company Accounting Oversight Board (United States), the Company's internal control over financial reporting as of December 31, 2016, based on the criteria established in Internal Control - Integrated Framework (2013) issued by the Committee of Sponsoring Organizations of the Treadway Commission and our report dated February 24, 2017 expressed an unqualified opinion on the Company’s internal control over financial reporting.
/s/ DELOITTE & TOUCHE LLP
Denver, Colorado
February 24, 2017
F- 1
The WhiteWave Foods Company
Consolidated Balance Sheets
December 31, | |||||||
2016 | 2015 | ||||||
(In thousands, except share and per share data) | |||||||
ASSETS | |||||||
Current assets: | |||||||
Cash and cash equivalents | $ | 45,828 | $ | 38,610 | |||
Trade receivables, net of allowance of $2,639 and $2,127 | 283,698 | 257,548 | |||||
Inventories | 296,360 | 270,737 | |||||
Prepaid expenses and other current assets | 78,055 | 39,782 | |||||
Total current assets | 703,941 | 606,677 | |||||
Equity method investments | 19,277 | 30,772 | |||||
Property, plant, and equipment, net | 1,294,710 | 1,137,521 | |||||
Identifiable intangible and other assets, net | 1,034,893 | 1,038,577 | |||||
Goodwill | 1,416,067 | 1,415,322 | |||||
Total Assets | $ | 4,468,888 | $ | 4,228,869 | |||
LIABILITIES AND SHAREHOLDERS’ EQUITY | |||||||
Current liabilities: | |||||||
Accounts payable and accrued expenses | $ | 539,083 | $ | 549,713 | |||
Current portion of debt and capital lease obligations | 58,585 | 51,449 | |||||
Income taxes payable | 2,973 | 3,043 | |||||
Total current liabilities | 600,641 | 604,205 | |||||
Long-term debt and capital lease obligations, net of debt issuance costs | 2,081,756 | 2,078,940 | |||||
Deferred income taxes | 304,347 | 293,326 | |||||
Other long-term liabilities | 51,448 | 41,490 | |||||
Total liabilities | 3,038,192 | 3,017,961 | |||||
Commitments and Contingencies (Note 14) | |||||||
Shareholders’ equity: | |||||||
Preferred stock, $0.01 par value; 170,000,000 shares authorized, no shares issued and outstanding at December 31, 2016 and 2015 | — | — | |||||
Common stock, $0.01 par value; 1,700,000,000 shares authorized, 177,251,251 issued and outstanding at December 31, 2016; 176,246,199 issued and outstanding at December 31, 2015 | 1,773 | 1,762 | |||||
Additional paid-in capital | 950,273 | 914,975 | |||||
Retained earnings | 640,259 | 425,705 | |||||
Accumulated other comprehensive loss | (161,609 | ) | (131,534 | ) | |||
Total shareholders’ equity | 1,430,696 | 1,210,908 | |||||
Total Liabilities and Shareholders’ Equity | $ | 4,468,888 | $ | 4,228,869 | |||
See notes to consolidated financial statements.
F- 2
The WhiteWave Foods Company
Consolidated Statements of Income
Year ended December 31, | |||||||||||
2016 | 2015 | 2014 | |||||||||
(In thousands, except share and per share data) | |||||||||||
Net sales | $ | 4,198,099 | $ | 3,866,295 | $ | 3,436,605 | |||||
Cost of sales | 2,745,203 | 2,543,030 | 2,283,441 | ||||||||
Gross profit | 1,452,896 | 1,323,265 | 1,153,164 | ||||||||
Operating expenses: | |||||||||||
Selling, distribution and marketing | 729,520 | 705,924 | 621,866 | ||||||||
General and administrative | 321,627 | 285,135 | 265,678 | ||||||||
Asset disposal and exit costs | — | — | (1,066 | ) | |||||||
Total operating expenses | 1,051,147 | 991,059 | 886,478 | ||||||||
Operating income | 401,749 | 332,206 | 266,686 | ||||||||
Other expense: | |||||||||||
Interest expense | 69,183 | 58,127 | 36,972 | ||||||||
Other expense, net | 5,381 | 6,343 | 5,266 | ||||||||
Total other expense | 74,564 | 64,470 | 42,238 | ||||||||
Income before income taxes | 327,185 | 267,736 | 224,448 | ||||||||
Income tax expense | 102,410 | 87,908 | 78,279 | ||||||||
Loss in equity method investments | 10,221 | 11,435 | 5,984 | ||||||||
Net income | $ | 214,554 | $ | 168,393 | $ | 140,185 | |||||
Weighted average common shares: | |||||||||||
Basic | 176,984,906 | 175,511,811 | 174,013,700 | ||||||||
Diluted | 181,174,379 | 180,084,949 | 177,949,916 | ||||||||
Net income per share: | |||||||||||
Basic | $ | 1.21 | $ | 0.96 | $ | 0.81 | |||||
Diluted | $ | 1.18 | $ | 0.94 | $ | 0.79 | |||||
See notes to consolidated financial statements.
F- 3
The WhiteWave Foods Company
Consolidated Statements of Comprehensive Income
Year ended December 31, | |||||||||||
2016 | 2015 | 2014 | |||||||||
(In thousands) | |||||||||||
Net income | $ | 214,554 | $ | 168,393 | $ | 140,185 | |||||
Other comprehensive income (loss), net of tax | |||||||||||
Change in defined benefit pension plan, net of tax benefit (expense) of $856, ($659), and $640 | (1,679 | ) | 1,289 | (1,257 | ) | ||||||
Foreign currency translation adjustment | (28,745 | ) | (71,436 | ) | (51,990 | ) | |||||
Change in fair value of derivative instruments, net of tax benefit (expense) of $(280), $338, and ($234) | 349 | (269 | ) | 569 | |||||||
Other comprehensive loss, net of tax | (30,075 | ) | (70,416 | ) | (52,678 | ) | |||||
Comprehensive income | $ | 184,479 | $ | 97,977 | $ | 87,507 | |||||
See notes to consolidated financial statements.
F- 4
The WhiteWave Foods Company
Consolidated Statements of Shareholders’ Equity
Common Stock | ||||||||||||||||||||||
Shares | Amount | Additional Paid-In Capital | Retained Earnings | Accumulated Other Comprehensive Loss | Total Equity | |||||||||||||||||
(In thousands, except share data) | ||||||||||||||||||||||
Balance at January 1, 2014 | 173,452,896 | $ | 1,735 | $ | 851,017 | $ | 117,127 | $ | (8,440 | ) | $ | 961,439 | ||||||||||
Net income | — | — | — | 140,185 | — | 140,185 | ||||||||||||||||
Share-based compensation | — | — | 26,648 | — | — | 26,648 | ||||||||||||||||
Excess tax benefit from share-based compensation | — | — | 4,282 | — | — | 4,282 | ||||||||||||||||
Shares issued in connection with share-based compensation | 935,236 | 9 | 6,740 | — | — | 6,749 | ||||||||||||||||
Minimum tax withholdings related to net share settlements of share-based compensation (Note 11) | — | — | (11,094 | ) | — | — | (11,094 | ) | ||||||||||||||
Conversion of phantom shares into restricted stock units | — | — | 956 | — | — | 956 | ||||||||||||||||
Other comprehensive loss | — | — | — | — | (52,678 | ) | (52,678 | ) | ||||||||||||||
Balance at December 31, 2014 | 174,388,132 | $ | 1,744 | $ | 878,549 | $ | 257,312 | $ | (61,118 | ) | $ | 1,076,487 | ||||||||||
Net income | — | — | — | 168,393 | — | 168,393 | ||||||||||||||||
Share-based compensation | — | — | 32,489 | — | — | 32,489 | ||||||||||||||||
Excess tax benefit from share-based compensation | — | — | 21,567 | — | — | 21,567 | ||||||||||||||||
Shares issued in connection with share-based compensation | 1,858,067 | 18 | 14,926 | — | — | 14,944 | ||||||||||||||||
Minimum tax withholdings related to net share settlements of share-based compensation (Note 11) | — | — | (32,556 | ) | — | — | (32,556 | ) | ||||||||||||||
Other comprehensive loss | — | — | — | — | (70,416 | ) | (70,416 | ) | ||||||||||||||
Balance at December 31, 2015 | 176,246,199 | $ | 1,762 | $ | 914,975 | $ | 425,705 | $ | (131,534 | ) | $ | 1,210,908 | ||||||||||
Net income | — | — | — | 214,554 | — | 214,554 | ||||||||||||||||
Share-based compensation | — | — | 30,411 | — | — | 30,411 | ||||||||||||||||
Excess tax benefit from share-based compensation | — | — | 7,794 | — | — | 7,794 | ||||||||||||||||
Shares issued in connection with share-based compensation | 1,005,052 | 11 | 10,085 | — | — | 10,096 | ||||||||||||||||
Minimum tax withholdings related to net share settlements of share-based compensation (Note 11) | — | — | (12,992 | ) | — | — | (12,992 | ) | ||||||||||||||
Other comprehensive loss | — | — | — | — | (30,075 | ) | (30,075 | ) | ||||||||||||||
Balance at December 31, 2016 | 177,251,251 | $ | 1,773 | $ | 950,273 | $ | 640,259 | $ | (161,609 | ) | $ | 1,430,696 | ||||||||||
See notes to consolidated financial statements.
F- 5
The WhiteWave Foods Company
Consolidated Statements of Cash Flows
Year ended December 31, | |||||||||||
2016 | 2015 | 2014 | |||||||||
(In thousands) | |||||||||||
CASH FLOWS FROM OPERATING ACTIVITIES: | |||||||||||
Net income | $ | 214,554 | $ | 168,393 | $ | 140,185 | |||||
Adjustments to reconcile net income to net cash provided by operating activities: | |||||||||||
Depreciation and amortization | 138,814 | 120,019 | 110,567 | ||||||||
Share-based compensation expense | 30,411 | 32,489 | 26,648 | ||||||||
Amortization of debt issuance costs | 4,242 | 4,192 | 3,173 | ||||||||
Loss (gain) on disposals and other, net | 6,626 | (1,348 | ) | 2,914 | |||||||
Deferred income taxes | 9,196 | (10,355 | ) | 6,184 | |||||||
Unrealized loss (gain) on derivative instruments | (9,422 | ) | 8,277 | 15,159 | |||||||
Loss in equity method investments | 10,221 | 11,435 | 5,984 | ||||||||
Gain on Earthbound settlement | — | (4,200 | ) | — | |||||||
Other | (1,314 | ) | (1,253 | ) | (1,282 | ) | |||||
Net change in operating assets and liabilities, net of acquisitions | |||||||||||
Trade receivables | (28,936 | ) | (53,496 | ) | (4,310 | ) | |||||
Inventories | (23,673 | ) | (36,044 | ) | (17,866 | ) | |||||
Prepaid expenses and other assets | (23,153 | ) | 9,803 | (4,037 | ) | ||||||
Accounts payable, accrued expenses, and other long-term liabilities | (10,984 | ) | 60,479 | 29,783 | |||||||
Income taxes payable | (101 | ) | 6,915 | (28,489 | ) | ||||||
Net cash provided by operating activities | 316,481 | 315,306 | 284,613 | ||||||||
CASH FLOWS FROM INVESTING ACTIVITIES: | |||||||||||
Investment in equity method investments | — | (701 | ) | (50,285 | ) | ||||||
Payments for acquisitions, net of cash acquired of $833, $8,521 and $7,190 | (17,263 | ) | (707,605 | ) | (798,446 | ) | |||||
Payments for property, plant, and equipment | (290,808 | ) | (258,488 | ) | (292,357 | ) | |||||
Proceeds from sale of fixed assets | 310 | 8,962 | 464 | ||||||||
Proceeds from acquisition adjustments | — | 346 | — | ||||||||
Net cash used in investing activities | (307,761 | ) | (957,486 | ) | (1,140,624 | ) | |||||
CASH FLOWS FROM FINANCING ACTIVITIES: | |||||||||||
Proceeds from the issuance of debt | — | 520,000 | 1,025,000 | ||||||||
Repayment of debt | (45,000 | ) | (15,000 | ) | (15,000 | ) | |||||
Payments on capital lease obligations | (1,293 | ) | (1,104 | ) | (1,044 | ) | |||||
Proceeds from revolver line of credit | 952,062 | 1,299,107 | 625,400 | ||||||||
Payments on revolver line of credit | (899,704 | ) | (1,166,761 | ) | (803,050 | ) | |||||
Proceeds from exercise of stock options | 10,085 | 14,716 | 6,740 | ||||||||
Minimum tax withholding paid on behalf of employees for share-based compensation | (12,992 | ) | (32,556 | ) | (11,094 | ) | |||||
Excess tax benefit from share-based compensation | 8,058 | 21,572 | 4,466 | ||||||||
Payment of deferred financing costs | (557 | ) | (4,063 | ) | (18,200 | ) | |||||
Net cash provided by financing activities | 10,659 | 635,911 | 813,218 | ||||||||
Effect of exchange rate changes on cash and cash equivalents | (12,161 | ) | (5,361 | ) | (8,072 | ) | |||||
INCREASE (DECREASE) IN CASH AND CASH EQUIVALENTS | 7,218 | (11,630 | ) | (50,865 | ) | ||||||
Cash and cash equivalents, beginning of year | 38,610 | 50,240 | 101,105 | ||||||||
Cash and cash equivalents, end of year | $ | 45,828 | $ | 38,610 | $ | 50,240 | |||||
SUPPLEMENTAL CASH FLOW INFORMATION | |||||||||||
Cash paid for interest, net of capitalized interest | $ | 69,879 | $ | 58,893 | $ | 25,864 | |||||
Cash paid for taxes | 97,247 | 64,576 | 94,089 | ||||||||
Non-cash activity — Unpaid purchases of plant and equipment | 39,665 | 34,759 | 33,500 | ||||||||
Non-cash activity — Conversion of phantom shares to restricted stock units | — | — | 956 | ||||||||
See notes to consolidated financial statements.
F- 6
The WhiteWave Foods Company
Notes to Consolidated Financial Statements
Years Ended December 31, 2016, 2015, and 2014
Unless otherwise indicated, references in this report to “we”, “us”, “our”, “WhiteWave”, or the “Company” refer to The WhiteWave Foods Company’s operations, taken as a whole.
1. Business and Basis of Presentation
Business
We are a leading consumer packaged food and beverage company focused on high-growth product categories that are aligned with emerging consumer trends. We manufacture, market, and sell branded plant-based foods and beverages, coffee creamers and beverages, premium dairy products and organic produce. We sell products primarily in North America, Europe and through a joint venture in China. We focus on providing consumers with innovative, great-tasting food and beverage choices that meet their increasing desires for nutritious, flavorful, convenient, and responsibly-produced products. Our widely-recognized, leading brands distributed in North America include Silk, So Delicious and Vega plant-based foods and beverages, International Delight and LAND O LAKES coffee creamers and beverages, Horizon Organic and Wallaby Organic premium dairy products and Earthbound Farm organic salads, fruits and vegetables. Our popular plant-based foods and beverages brands in Europe include Alpro and Provamel.
Effective January 1, 2016, we report results of operations through two reportable segments: Americas Foods & Beverages and Europe Foods & Beverages. This reporting structure aligns with the way our Chief Operating Decision Maker ("CODM"), our CEO, monitors operating performance, allocates resources, and deploys capital. In 2015 and 2014, we reported results of operations through three reportable segments: Americas Foods & Beverages, Americas Fresh Foods and Europe Foods & Beverages. In connection with our management restructure that was effective in early 2016, we combined the historical Americas Foods & Beverages and Americas Fresh Foods segments into a single Americas Foods & Beverages segment. Accordingly, segment data from prior years has been recast to reflect this new segment structure.
Spin-off from Dean Foods
WhiteWave initially was formed by Dean Foods Company (“Dean Foods”) and spun-off into an independent company through a series of transactions. First, in October 2012, we completed an initial public offering of shares of our Class A common stock. Second, on May 23, 2013, Dean Foods distributed to its stockholders shares of our Class A common stock, and shares of our Class B common stock, as a pro rata dividend to Dean Foods' stockholders (the "Distribution"). Finally, on July 25, 2013, Dean Foods disposed of all of its remaining shares of WhiteWave capital stock in a registered public offering.
Basis of Presentation
The accompanying consolidated financial statements have been prepared in accordance with accounting principles generally accepted in the United States of America (“U.S. GAAP”). In the opinion of management, all adjustments, consisting principally of normal recurring adjustments, considered necessary for a fair presentation have been included.
As discussed in Note 19 "The Proposed Merger with Danone", on July 6, 2016 the Company entered into an Agreement and Plan of Merger with Danone S.A. and July Merger Sub Inc., an indirect wholly-owned subsidiary of Danone, pursuant to which the Company will be acquired by Danone S.A., a leading global food company headquartered in Paris, France. Since the merger has not yet been completed, none of the consolidated financial statements and related disclosures in this Form 10-K consider the potential impact of the pending merger.
Certain reclassifications of previously reported amounts have been made to conform to the current year presentation in Note 6 "Goodwill and Intangible Assets" and Note 15 “Segment and Customer Information”. These reclassifications did not impact previously reported amounts in the Company’s consolidated balance sheets, consolidated statements of income, consolidated statements of cash flows, or consolidated statements of shareholders' equity.
2. Summary of Significant Accounting Policies
Consolidation
Our consolidated financial statements include the accounts of the Company and our wholly-owned subsidiaries and reflect the elimination of all intercompany accounts and transactions.
F- 7
Use of Estimates
The preparation of our consolidated financial statements in conformity with U.S. GAAP requires us to use our judgment to make estimates and assumptions that affect the amounts reported in the financial statements and accompanying footnotes. Actual results could differ from these estimates under different assumptions or conditions.
Cash and Cash Equivalents
As of December 31, 2016 and 2015, cash is comprised of cash held in bank accounts. We consider temporary investments that are highly liquid with an original maturity of three months or less to be cash equivalents.
Inventories
Inventories are stated at the lower of cost or market. Our products are valued using the first-in, first-out method. The costs of finished goods inventories include raw materials, direct labor, indirect production, and overhead costs. Reserves for obsolete or excess inventory are not material.
Property, Plant, and Equipment
Property, plant, and equipment are stated at cost, plus capitalized interest on borrowings during the actual construction period of major capital projects. Expenditures for repairs and maintenance that do not improve or extend the life of the assets are expensed as incurred. Depreciation is calculated using the straight-line method over the estimated useful lives of the assets, as follows:
Asset | Useful life |
Buildings | 15 to 40 years |
Machinery and equipment | 3 to 20 years |
Computer software | 3 to 8 years |
Leasehold improvements | Over the shorter of the term of the applicable lease agreement or useful life |
Goodwill and Intangible Assets
Our goodwill and identifiable intangible assets have resulted from acquisitions. Upon acquisition, the purchase price is first allocated to identifiable assets and liabilities, including customer-related intangible assets and trademarks, with any remaining purchase price recorded as goodwill. Goodwill and trademarks with indefinite lives are not amortized.
A trademark is determined to have an indefinite life if it has a history of strong sales that we expect to continue for the foreseeable future. If these perpetual trademark criteria are not met, the trademarks are amortized over their expected useful lives. Determining the expected life of a trademark is based on a number of factors including the competitive environment, trademark history, and anticipated future trademark support.
Identifiable intangible assets, other than indefinite-lived trademarks, are typically amortized over the following range of estimated useful lives:
Asset | Useful life |
Customer lists and relationships | 3 to 15 years |
Finite-lived trademarks | 5 to 15 years |
Impairment
In accordance with accounting standards related to goodwill and other intangibles assets, we do not amortize goodwill and other intangible assets determined to have indefinite useful lives. Instead, we conduct impairment tests on our goodwill and indefinite-lived trademarks annually in the fourth quarter and on an interim basis when circumstances indicate that the carrying value may not be recoverable. Goodwill is allocated and tested at the reporting unit level, which is an operating segment or one level below (known as a component). Our identified reporting units are based on how segment management views performance and the similarity of those businesses.
A quantitative assessment of goodwill was performed in 2014 and a qualitative assessment of goodwill was performed in 2015 and 2016. As part of the qualitative assessment performed in 2016 we assessed economic conditions and industry and market
F- 8
considerations, in addition to the overall historical and forecasted financial performance of each of our reporting units. We consider all evidence in our qualitative assessment, both positive and negative, and the weight of such evidence as well as mitigating factors, when determining whether it is more likely than not the fair value of our reporting units is less than the carrying amounts. Based on the results of our assessment, we determined that it was not more likely than not that any of our reporting units had a carrying value in excess of its fair value. Accordingly, no further goodwill impairment testing was completed. We did not recognize any impairment charges related to goodwill during 2016, 2015, or 2014.
A quantitative assessment of indefinite-lived intangibles was performed in 2015 and a qualitative assessment of indefinite-lived intangibles was performed in 2014 and 2016. As part of the qualitative assessment performed in 2016 we assessed economic conditions and industry and market considerations, in addition to the overall historical and forecasted financial performance of each trade name. Based on the results of our assessment, we determined that it was not more likely than not that any of our trade names had a carrying value in excess of its fair value. Accordingly, no further indefinite-lived intangibles impairment testing was completed. We did not recognize any impairment charges related to indefinite-lived intangibles during 2016, 2015, or 2014.
Long-lived assets, including property, plant, and equipment, definite-lived intangible assets and equity method investments, are reviewed for impairment whenever events or changes in circumstances indicate that the carrying amount of an asset may not be recoverable and prior to any goodwill impairment test. Recoverability of assets to be held and used is measured by a comparison of the carrying amount of an asset to future net cash flows expected to be generated by the asset. If the carrying amount of an asset exceeds its estimated future cash flows, an impairment charge is recognized by the amount by which the carrying amount of the asset exceeds the fair value of the asset. No material impairments were recorded in 2016, 2015, or 2014.
Equity Method Investments
Consolidated net income includes the Company's proportionate share of the net income or loss of the companies in which we have invested. In addition, the carry values of our equity method investments are increased or decreased by our proportionate share of the net income or loss and other comprehensive income (loss) ("OCI") of these companies.
Employee Benefit Plans
We have three separate, stand-alone defined benefit pension plans for certain of our European employees and we contribute to one multiemployer pension plan on behalf of certain of our North America employees.
We recognize the overfunded or underfunded status of defined benefit pension plans as an asset or liability on our consolidated balance sheets and recognize changes in the funded status in the year in which changes occur, through accumulated other comprehensive loss. The funded status is measured as the difference between the fair value of plan assets and benefit obligation (the projected benefit obligation for pension plans). Actuarial gains and losses and prior service costs and credits that have not been recognized as a component of net periodic benefit cost previously are recorded as a component of accumulated other comprehensive loss. Plan assets and obligations are measured as of December 31 of each year. See Note 13 “Employee Retirement Plans.”
Derivative Financial Instruments
We use derivative financial instruments for the purpose of hedging commercial risk exposures to fluctuations in interest rates, currency exchange rates and certain commodity inputs. Our derivative instruments are recorded in the consolidated balance sheets at fair value. For a derivative designated as a cash flow hedge, the effective portion of the derivative’s mark to fair value is initially reported as a component of accumulated other comprehensive loss and subsequently reclassified into earnings when the hedged item is settled. The ineffective portion of the mark to fair value associated with all hedges is reported in earnings immediately. Derivatives that do not qualify for hedge accounting are marked to fair value with gains and losses immediately recorded in earnings. In the consolidated statements of income, derivative activities are classified based on the nature of the items being hedged.
Share-Based Compensation
Under the Amended and Restated 2012 Stock Incentive Plan (the "2012 SIP"), a total of 26,850,000 shares of our common stock were reserved for issuance upon the exercise of stock options or the vesting of restricted stock units (“RSUs”), performance stock units ("PSUs") or restricted stock awards that may be issued to our employees, non-employee directors and consultants. The 2012 SIP also permits awards of stock appreciation rights (“SARs”) and phantom shares as part of our long-term incentive compensation program. In general, awards granted to our employees under the 2012 SIP vest one-third on the first anniversary of the grant date, one-third on the second anniversary of the grant date, and one-third on the third anniversary of the grant date. Unvested awards vest immediately in the following circumstances: (i) an employee retires after reaching the age of 65, (ii) in certain cases upon an employee’s death or qualified disability, and (iii) an employee with 10 years of service retires after reaching
F- 9
the age of 55, or (iv) upon a change of control, except for PSUs and all equity awards granted after 2014 to the Company's executive officers. Share-based compensation plans, related expenses and assumptions used in the Black-Scholes option pricing model are more fully described in Note 11 "Share-Based Compensation."
Revenue Recognition, Sales Incentives and Trade Accounts Receivable
Sales are recognized when persuasive evidence of an arrangement exists, the price is fixed or determinable, the product has been delivered to the customer, and there is a reasonable assurance of collection of the sales proceeds. Sales are recorded net of allowances for returns, trade promotions, and other discounts. We routinely offer sales incentives and discounts through various regional and national programs to our customers and to consumers. These programs include rebates, shelf-price reductions, in-store display incentives, coupons, and other trade promotional activities. These programs, as well as amounts paid to customers for shelf-space in retail stores, are considered reductions in the price of our products and thus are recorded as reductions to gross sales. Some of these incentives are recorded by estimating incentive costs based on our historical experience and expected levels of performance of the trade promotion. We maintain allowances at the end of each period for the estimated incentive costs incurred but unpaid for these programs, which are recorded as a reduction in our trade accounts receivable balance. Differences between estimated and actual incentive costs are normally not material and are recognized in earnings in the period such differences are determined.
We generally provide credit terms to customers between 10 and 30 days from invoice date in the U.S. In Canada and Europe, however, terms vary by country. We perform ongoing credit evaluations of our customers and maintain allowances for potential credit losses based on our historical experience. Bad debt expense associated with uncollectible accounts for the years ended December 31, 2016, 2015, and 2014 were not material. Estimated product returns historically have not been material.
Cost of Goods Sold
Cost of goods sold represents the costs directly related to the manufacturing, farming and distribution of the Company’s products and primarily includes raw materials, packaging, co-packer fees, shipping and handling, warehousing, package design, depreciation, amortization, royalties, direct and indirect labor and operating costs for the Company’s manufacturing and farming.
Advertising Expense
We market our products through advertising and other promotional activities, including media and agency. Advertising expense is charged to earnings during the period incurred, except for expenses related to the development of a major commercial or media campaign which are charged to earnings during the period in which the advertisement or campaign is first presented to the public. Advertising expense totaled $227.7 million, $216.7 million, and $194.4 million in 2016, 2015, and 2014, respectively, and is included in selling, distribution and marketing expense in our consolidated statements of income. Prepaid advertising was $2.5 million and $0.9 million as of December 31, 2016 and 2015, respectively.
Shipping and Handling Fees
Our shipping and handling costs are included in both cost of sales and selling, distribution and marketing expense, depending on the nature of such costs. In cost of sales, we include inventory warehouse costs and product loading and handling costs at Company-owned facilities. Costs associated with shipping products to customers through third-party carriers and third-party inventory warehouse costs are included in selling, distribution and marketing expense and totaled $307.4 million, $321.5 million, and $279.6 million in 2016, 2015, and 2014, respectively. Costs related to temporary use of third parties due to temporary displacement in warehousing during construction of new company facilities are included in cost of goods sold.
Insurance Accruals
We retain selected levels of property and casualty risks, employee health care and other casualty losses. Many of these potential losses are covered under conventional insurance programs with third-party carriers with high deductible limits. In other areas, we are self-insured with stop-loss coverage. Accrued liabilities for incurred but not reported losses related to these retained risks are calculated based upon loss development factors which contemplate a number of factors including claims history and expected trends. These loss development factors are developed in consultation with external actuaries.
At December 31, 2016 and 2015, we recorded accrued liabilities related to these retained risks in the amounts of $9.0 million and $8.4 million, respectively, including both current and long-term liabilities.
Research and Development
Our research and development activities primarily consist of generating and testing new product concepts, new flavors, and packaging and are primarily internal. We expense research and development costs as incurred and they primarily relate to
F- 10
compensation, facility costs and purchased research and development services, materials and supplies. Our total research and development expense was $21.2 million, $19.0 million and $15.6 million for 2016, 2015, and 2014, respectively. Research and development costs are included in general and administrative expenses in our consolidated statements of income.
Foreign Currency Translation
The financial statements of our foreign subsidiaries are translated to U.S. Dollars. The functional currency of our foreign subsidiaries is generally the local currency of the country. Accordingly, assets and liabilities of the foreign subsidiaries are translated to U.S. Dollars at period-end exchange rates. Income and expense items are translated at the average rates prevailing during the period. Changes in exchange rates that affect cash flows and the related receivables or payables are recognized as transaction gains and losses. Our transaction gains and losses are reflected in general and administrative expense in our consolidated statements of income. The cumulative translation adjustment in accumulated other comprehensive loss reflects the unrealized adjustments resulting from translating the financial statements of our foreign subsidiaries.
Income Taxes
We account for deferred income taxes based on the differences between the financial statement and tax bases of assets and liabilities at enacted tax rates in effect for the years in which the differences are expected to reverse. We also recognize deferred tax assets for operating loss and other tax carryforwards. Valuation allowances are recognized to reduce deferred tax assets to the amount that will more likely than not be realized.
We record a liability for uncertain tax positions to the extent a tax position taken or expected to be taken in a tax return does not meet certain recognition or measurement criteria. We apply a more likely than not threshold to the recognition and derecognition of uncertain tax positions. Accordingly, we recognize the amount of tax benefit that has a greater than 50 percent likelihood of being ultimately realized upon settlement. Future changes in judgment related to the expected ultimate resolution of uncertain tax positions will affect earnings in the quarter of such change. For those income tax positions where it is not more likely than not that a tax benefit will be sustained, no tax benefit has been recognized in the financial statements. We recognize interest related to uncertain tax positions as a component of income tax expense. Penalties, if incurred, are recorded in general and administrative expense in our consolidated statements of income.
Recent Accounting Pronouncements
In January 2017, the Financial Accounting Standards Board (“FASB”) issued Accounting Standards Update (“ASU”) No. 2017-04, Simplifying the Test for Goodwill Impairment, which eliminated Step 2 from the goodwill impairment test. Previously under Step 2, to determine the implied fair value for goodwill, first an entity had to perform a hypothetical purchase price allocation of the reporting unit. Under the new ASU, an entity should perform its goodwill impairment test by comparing the fair value of a reporting unit with its carrying amount. An entity should recognize an impairment charge for the amount by which the carrying amount exceeds the reporting unit’s fair value. The guidance should be applied on a prospective basis, and is effective for annual or any interim goodwill impairment tests in fiscal years beginning after December 15, 2019. Early adoption is permitted for interim or annual goodwill impairment tests performed on testing dates after January 1, 2017. We are currently evaluating the standard, but we do not expect that the adoption of this guidance will have any impact on the Company's consolidated financial statements.
In August 2016, the FASB issued ASU No. 2016-15, Classification of Certain Cash Receipts and Cash Payments, which provides clarification on the treatment of certain cash receipts and cash payments on the statement of cash flows. The pronouncement provides clarification guidance on eight specific cash flow presentation issues that have developed due to diversity in practice. The issues include, but are not limited to, debt prepayment or extinguishment costs, proceeds from the settlement of insurance claims, and distributions received from equity method investees. The pronouncement is effective for fiscal years, and for interim periods within those fiscal years, beginning after December 15, 2017, with early adoption permitted. Adoption will require a retrospective transition method in which all amendments must be reflected in all periods presented, unless impracticable to do so. We are currently evaluating transition date, but we do not expect that the adoption of this guidance will have any impact on the Company's consolidated financial statements.
In June 2016, the FASB issued ASU No. 2016-13, Measurement of Credit Losses on Financial Instruments, which provides changes on how companies measure and recognize credit losses on financial instruments. The new guidance will require companies to immediately recognize an estimate of credit losses expected to occur over the remaining life of financial assets that are in the scope of the standard. The new standard is effective for public companies in fiscal years beginning after December 31, 2019. We expect that the adoption of this guidance will not have any impact on the Company's consolidated financial statements.
In March 2016, the FASB issued ASU No. 2016-09, Improvements to Employee Share-Based Payment Accounting, which simplifies several aspects of the accounting for employee share-based payment transactions for both public and nonpublic entities, including the accounting for income taxes, forfeitures, and statutory tax withholding requirements, as well as classification in the
F- 11
statement of cash flows. The new guidance will require companies to include excess tax benefits (deficiencies) as a component of income tax expense rather than additional paid-in capital. This guidance is effective for annual reporting periods beginning after December 15, 2016, including interim periods within those annual reporting periods. The impact ASU No. 2016-09 will have on the Company’s consolidated financial statements upon adoption will mainly depend on the occurrence of future events, including the timing and value realized for future share-based transactions upon exercise/vesting versus the fair value at grant date, and will create additional benefit or expense to our consolidated statements of income.
In February 2016, the FASB issued ASU 2016-02, Leases (Topic 842). This ASU requires lessees to recognize the assets and liabilities that arise from leases on the balance sheet. A lessee should recognize in the statement of financial position a liability to make lease payments (the lease liability) and a right-of-use asset representing its right to use the underlying asset for the lease term. The new guidance is effective for financial statements issued for fiscal years beginning after December 15, 2018, and interim periods within those fiscal years. The amendments should be applied at the beginning of the earliest period presented using a modified retrospective approach with earlier application permitted as of the beginning of an interim or annual reporting period. We are currently evaluating the effects adoption of this guidance will have on the Company’s consolidated financial statements and financial statement disclosures. We expect this adoption will result in a material increase in the assets and liabilities on our consolidated balance sheets and will likely have an insignificant impact on our consolidated statements of earnings.
In July 2015, the FASB issued ASU No. 2015-11, Simplifying the Measurement of Inventory. This ASU discusses amendments to existing accounting guidance to modify the subsequent measurement of inventory. Under existing guidance, an entity measures inventory at the lower of cost or market, with market defined as replacement cost, net realizable value ("NRV"), or NRV less a normal profit margin. An entity uses current replacement cost provided that it is not above NRV (ceiling) or below NRV less a normal profit margin (floor). Amendments in the new guidance require an entity to subsequently measure inventory at the lower of cost or net realizable value and eliminates the need to determine replacement cost and evaluate whether it is above the ceiling or below the floor. NRV is defined as the estimated selling prices in the ordinary course of business, less reasonably predictable costs of completion, disposal and transportation. For public business entities, the ASU is effective for interim and annual periods beginning after December 15, 2016. Early application is permitted for all entities and should be applied prospectively. We expect that the adoption of this guidance will not have any impact on the Company's consolidated financial statements.
In May 2014, the FASB issued ASU No. 2014-09, Revenue from Contracts with Customers: Topic 606, to clarify the principles used to recognize revenue for all entities. In July 2015, the FASB approved a one-year deferral of the effective date of ASU 2014-09. In 2016, the FASB has issued the following additional guidance: i) ASU No. 2016-08, Principal Versus Agent Considerations (Reporting Revenue Gross Versus Net),which provides clarification when assessing whether an entity is a principal or agent in a revenue transaction, and impacts whether an entity reports revenue on a gross or net basis, ii) ASU No. 2016-10, Identifying Performance Obligations and Licensing, which amends the guidance in ASU 2014-09 regarding the identification of performance obligations and accounting for licenses of intellectual property, iii) ASU No. 2016-11, Rescission of SEC Guidance Because of Accounting Standards Updates 2014-09 and 2014-16 Pursuant to Staff Announcements at the March 3, 2016 Emerging Issues Task Force Meeting, which rescinds specific SEC guidance related to revenue recognition currently codified in US GAAP as a result of the new revenue standard, iv) ASU No. 2016-12, Narrow-Scope Improvements and Practical Expedients, which amends the guidance in ASU 2014-09 by providing practical expedients to simplify the transition to the new revenue standard and clarify certain aspects of the standard, and ASU No 2016-19 & 20, Technical Corrections and Improvements. The new guidance will be effective for annual and interim periods beginning on or after December 15, 2017 and will replace most existing revenue recognition guidance under U.S. GAAP when it becomes effective. The standard includes a five step model to determine when revenue should be recognized, which is when promised goods or services are transferred to customers in amounts that reflect the consideration to which the company expects to be entitled in exchange for those goods or services. The standard allows several methods of adoption including either a full retrospective adoption, meaning the standard is applied to all of the periods presented, or modified retrospective adoption, meaning the standard is applied only to the most current period presented in the financial statements. As the Company does not have significant varying revenue streams, in general, we expect to identify a single performance obligation for product shipments to our customers at a point in time. We are still evaluating the transition method and impact the adoption of the new standard may have on our consolidated financial statements and related disclosures, including any private label revenue streams where there is no alternative use of the product and an enforceable right of payment.
Recently Adopted Accounting Pronouncements
In August 2014, the FASB issued ASU No. 2014-15, Presentation of Financial Statements—Going Concern (Subtopic 205-40): Disclosure of Uncertainties about an Entity’s Ability to Continue as a Going Concern, to provide guidance on management's responsibility to perform interim and annual assessments of an entity’s ability to continue as a going concern and to provide related disclosure requirements. Adoption requires establishing a going concern assessment process to meet the standard. We have adopted this guidance as of December 31, 2016 and the adoption of this guidance did not have a significant impact on the Company’s consolidated financial statements.
F- 12
3. Acquisitions and Joint Venture
2016 Acquisitions
IPP
On June 2, 2016, the Company acquired Innovation Packaging and Process, S.A. de C.V. ("IPP"). Founded in 2007, IPP is an aseptic beverage co-packer based in San Luis Potosi, Mexico. The Company purchased IPP for total cash consideration of $18.1 million. We funded this acquisition through cash provided from operations. IPP produces products for WhiteWave and third parties. The acquisition of IPP provides the ability to grow in Latin American markets by providing in-house manufacturing. Our preliminary purchase price allocation includes goodwill of $9.3 million, property, plant, and equipment of $9.1 million, intangible assets subject to amortization of $0.6 million related to customer relationships, and liabilities assumed net of working capital items of $0.9 million. Customer relationships are being amortized over a 3 year term. We have included IPP's results of operations in our consolidated statements of income in our Americas Foods & Beverages segment from the date of acquisition.
The acquisition was accounted for using the acquisition method of accounting. Assets acquired and liabilities assumed in connection with the acquisition have been recorded at their preliminary fair values. Certain estimated values for the acquisition are not yet finalized pending the final purchase price allocations, and as a result, the Company's estimates and assumptions are subject to change within the measurement period as valuations are finalized. We expect to finalize the allocation of the purchase price within one year of the acquisition.
During 2016, we recorded $3.5 million of purchase accounting adjustments to goodwill primarily related to potential tax risks, for which we are partially indemnified, and the recording of deferred income taxes. See Note 6 "Goodwill and Intangible Assets."
2015 Acquisitions
Wallaby
On August 30, 2015, we completed our acquisition of Wallaby Yogurt Company, Inc. ("Wallaby") for approximately $122.4 million in cash. We funded this acquisition with borrowings under our credit facility. Founded in 1994 and based in American Canyon, California, Wallaby is a leading manufacturer and distributor of organic dairy yogurt products including Greek and Australian style yogurts and Kefir beverages. The addition of Wallaby strengthened and expanded our growing yogurt portfolio and provided entry into several fast-growing yogurt categories. The acquisition also provided us with additional West Coast manufacturing capabilities and further expansion and growth opportunities. In connection with the acquisition of Wallaby, we incurred $2.1 million in expenses for the year ended December 31, 2015 related to due diligence, investment advisors and regulatory matters. None of these acquisition related costs were incurred in 2016. The expenses directly associated with the acquisition were recorded in general and administrative expenses in our consolidated statements of income and were not allocated to our segments and are reflected entirely within corporate and other. We have included Wallaby's results of operations in our statements of income in our Americas Foods & Beverages segment since the date of acquisition. Net sales were $20.3 million from the acquisition date to December 31, 2015.
The acquisition was accounted for using the acquisition method of accounting. Assets acquired and liabilities assumed in connection with the acquisition have been recorded at their fair values. The fair values were determined by management based in part on an independent valuation of assets acquired, which includes intangible assets of approximately $57.1 million and relate primarily to tradenames. Estimated intangible assets subject to amortization of approximately $9.1 million are being amortized over a 15 year term and relate primarily to customer relationships.
During 2016, we recorded $6.3 million of purchase accounting adjustments to goodwill primarily related to the finalization of the fair value of certain intangible assets. See Note 6 "Goodwill and Intangible Assets." During the third quarter of 2016, the Company finalized its purchase price allocations related to the acquisition of Wallaby.
Vega
On August 1, 2015, we completed our acquisition of Sequel Naturals Ltd, the company that owns the Vega brand ("Vega") and is a pioneer and leader in plant-based nutrition products, for approximately $553.6 million in cash funded by borrowings under our credit facility. Vega offers a broad range of plant-based nutrition products - primarily powdered shakes and snack bars. This acquisition extended the Company's Plant-based Foods and Beverages platform into nutritional powders and bars, and provided additional innovation opportunities. In connection with the acquisition of Sequel Naturals Ltd, we incurred $7.4 million and $0.3 million in expenses for the year ended December 31, 2015 and 2016, respectively, related to due diligence, investment advisors and regulatory matters. The expenses directly associated with the acquisition were recorded in general and administrative expenses in our consolidated statements of income and were not allocated to our segments and are reflected entirely within corporate and
F- 13
other. We have included Vega's results of operations in our statements of income in our Americas Foods & Beverages segment from the date of acquisition. Net sales were $51.4 million from the acquisition date to December 31, 2015.
The acquisition was accounted for using the acquisition method of accounting. Assets acquired and liabilities assumed in connection with the acquisition have been recorded at their fair values. The fair values were determined by management based in part on an independent valuation of assets acquired, which includes intangible assets of approximately $296.9 million and relate primarily to tradenames and customer relationships. Intangible assets subject to amortization of approximately $106.9 million are being amortized over a 15 year term and relate primarily to customer relationships.
During 2016, we recorded $4.4 million of purchase accounting adjustments to goodwill primarily related to the finalization of certain income tax matters. See Note 6 "Goodwill and Intangible Assets." As of June 30, 2016, the Company has finalized its purchase price allocations related to the acquisition of Sequel Naturals Ltd.
EIEIO
On May 29, 2015, the Company acquired substantially all of the assets and liabilities of EIEIO, Inc. ("EIEIO") the company that owns the Magicow brand and other brands, for $40.2 million in cash. We funded this acquisition with borrowings under our credit facility. EIEIO, which is based outside Austin, Texas, manufactures, markets and distributes bulk, bag-in-box and shelf stable creamers, coffee beverages and whip toppings. The acquisition of EIEIO expanded our portfolio of bulk coffee creamer and flavor dispensing products and provided new product capabilities to support growth in our away-from-home channel. In connection with the acquisition of EIEIO, we incurred $0.3 million in expenses for the year ended December 31, 2015, related to due diligence, investment advisors and regulatory matters. No acquisition related costs were incurred in 2016. The expenses directly associated with the acquisition were recorded in general and administrative expenses in our consolidated statements of income and were not allocated to our segments and are reflected entirely within corporate and other. EIEIO's results of operations have been included in our consolidated statements of income of our Americas Foods & Beverages segment from the date of acquisition. Net sales were $13.7 million from the acquisition date to December 31, 2015.
The acquisition was accounted for using the acquisition method of accounting. Assets acquired and liabilities assumed in connection with the acquisition have been recorded at their fair values. The fair values were determined by management based in part on an independent valuation of assets acquired, which includes intangible assets of approximately $21.8 million and relate primarily to tradenames and customer relationships. Intangible assets subject to amortization of approximately $10.2 million are being amortized over a 15 year term and relate primarily to customer relationships. During the second quarter of 2016, the Company finalized its purchase price allocations related to the acquisition of EIEIO.
The following table summarizes allocation of the purchase price to the fair value of assets acquired and liabilities assumed for the fiscal 2015 acquisitions.
EIEIO | Vega | Wallaby | |||||||||
May 29, 2015 | August 1, 2015 | August 30, 2015 | |||||||||
(In thousands) | |||||||||||
Assets acquired: | |||||||||||
Cash and cash equivalents | $ | 1,546 | $ | 5,235 | $ | 1,740 | |||||
Inventories | 3,050 | 18,379 | 2,252 | ||||||||
Other current assets | 1,951 | 18,886 | 5,245 | ||||||||
Property, plant and equipment | 554 | 650 | 11,492 | ||||||||
Trademarks | 11,600 | 189,963 | 48,036 | ||||||||
Intangible assets with finite lives | 10,160 | 106,920 | 9,058 | ||||||||
Other long-term assets | — | 1,779 | 50 | ||||||||
Liabilities assumed: | |||||||||||
Accounts payable and other accruals | 2,296 | 12,802 | 1,542 | ||||||||
Deferred taxes | — | 76,739 | — | ||||||||
Other long-term liabilities | 173 | 7,581 | 1,031 | ||||||||
Total identifiable net assets | 26,392 | 244,690 | 75,300 | ||||||||
Goodwill | 13,810 | 308,942 | 47,052 | ||||||||
Total purchase price | $ | 40,202 | $ | 553,632 | $ | 122,352 | |||||
F- 14
Goodwill is calculated as the excess of consideration paid over the net assets acquired and represents synergies, organic growth and other benefits that are expected to arise from integrating the acquired businesses into our operations. Goodwill related to the 2016 and 2015 acquisitions is recorded in the Americas Foods & Beverages segment. Goodwill related to EIEIO and Wallaby is tax deductible. None of the goodwill recorded in the Vega or IPP acquisitions is tax deductible.
2014 Acquisitions
So Delicious Dairy Free
On October 31, 2014, we completed our acquisition of the company that owns So Delicious Dairy Free ("So Delicious") for total consideration of approximately $196.6 million in cash. So Delicious manufactures, markets and distributes plant-based beverages, creamers, cultured products and frozen desserts and is based in Springfield, Oregon. The acquisition of So Delicious expanded our portfolio of plant-based food and beverage products and provided the Company with an entry into the growing, plant-based frozen desert category. For the year ended December 31, 2014, the acquisition of So Delicious increased our net sales by $22.7 million. So Delicious’ results of operations have been included in our statements of income and the results of operations of our Americas Foods & Beverages segment from the date of acquisition.
The acquisition was accounted for using the acquisition method of accounting. Assets acquired and liabilities assumed in connection with the acquisition have been recorded at their fair values. The fair values were determined by management based in part on an independent valuation of assets acquired, which includes intangible assets of $83.0 million. Intangible assets subject to amortization of $29.8 million are being amortized over a weighted average period of 15 years and relate primarily to customer and supplier relationships. Prior to the third quarter of 2015, we recorded $2.0 million of purchase accounting adjustments to goodwill. Purchase accounting was completed in the third quarter of 2015.
In connection with the acquisition of So Delicious, we incurred $5.3 million in expenses for the year ended December 31, 2014, related to due diligence, investment advisors and regulatory matters. These costs are included in general and administrative expense in our consolidated statements of income in the periods in which they were incurred. These expenses have not been allocated to our segments and are reflected entirely within corporate and other.
Earthbound Farm
On January 2, 2014, the Company acquired Earthbound Farm, one of the largest organic produce brands in North America. The acquisition added to our focus on high-growth product categories that are aligned with emerging customer trends. The total consideration for the acquisition was approximately $608.7 million in cash. The acquisition was funded by approximately $615 million in borrowings under our senior secured credit facilities. See Note 9 “Debt and Capital Lease Obligations.”
The acquisition was accounted for using the acquisition method of accounting. Assets acquired and liabilities assumed in connection with the acquisition have been recorded at their fair values. The fair values were determined by management based in part on an independent valuation of assets acquired, which includes intangible assets of $255.6 million. Intangible assets subject to amortization of $104.9 million are being amortized over a weighted average period of 15 years and relate primarily to customer and supplier relationships. In the third quarter of 2015, negotiations regarding final purchase price adjustments were completed. As purchase accounting was completed in 2014, the gain of $7.9 million from the final negotiation was recorded in the third quarter of 2015 in our consolidated statements of income within general and administrative expenses within the segment caption "Corporate and other." Earthbound Farm’s results of operations have been included in our statements of income and the results of operations of our Americas Foods & Beverages segment from the date of acquisition.
For the year ended December 31, 2014, the acquisition of Earthbound Farm increased our net sales by $575.3 million. In connection with the acquisition of Earthbound Farm, we incurred $6.8 million in expenses for the year ended December 31, 2014, related to due diligence, investment advisors and regulatory matters. These costs are included in general and administrative expense in our consolidated statements of income in the periods in which they were incurred. These expenses have not been allocated to our segments and are reflected entirely within corporate and other.
The following table summarizes unaudited supplemental pro forma consolidated results of operations as if we acquired So Delicious, EIEIO, Vega and Wallaby on January 1, 2014. No pro forma unaudited consolidated results of operations is presented for the twelve months ended December 31, 2016 or the corresponding prior period related to the IPP acquisition as their results are not material to the consolidated results of the Company.
F- 15
Year ended December 31, | |||||||
2015 | 2014 | ||||||
(In thousands, except share data) | |||||||
Net sales | $ | 3,983,327 | $ | 3,689,478 | |||
Income before income taxes | 286,028 | 221,026 | |||||
Diluted earnings per common share | $ | 1.03 | $ | 0.79 | |||
The historical financial information has been adjusted to give effect to the pro forma adjustments. These adjustments are based upon currently available information and certain assumptions. Therefore, the pro forma consolidated results are not necessarily indicative of what the Company’s consolidated results of operations actually would have been had it completed the acquisitions on January 1, 2014. The historical results included in the pro forma consolidated results do not purport to project future results of operations of the combined company nor do they reflect the expected realization of any cost savings or revenue synergies associated with the acquisition. The pro forma consolidated results reflect purchase accounting adjustments primarily related to depreciation and amortization expense, interest expense, tax expense and acquisition related costs.
Joint Venture
On January 5, 2014, the Company entered into a joint venture agreement with China Mengniu Dairy Company Limited (“Mengniu”), a leading Chinese dairy company. The joint venture manufactures, markets and sells a range of premium plant-based beverage products in China. Under the terms of the agreement, the Company owns a 49% stake in the venture while Mengniu owns a 51% stake.
Based on the joint venture agreement, the Company has the ability to exert significant influence over the operations and financial policies of the joint venture and has in-substance common stock in the joint venture. Thus, the joint venture is accounted for as an equity-method investment. During the year ended December 31, 2014, we contributed $47.3 million of cash to the joint venture. No contributions were made during the years ended December 31, 2016 and 2015. The joint venture has a credit facility with Mengniu of CNY 120 million ($17.3 million USD) and, in 2016, entered into a new credit facility with Mengniu for up to an additional CNY of 90 million ($13.0 million USD), for total capacity of CNY 210 million ($30.3 million USD). The current facility is expected to support its liquidity requirements into first quarter 2017. We guarantee up to 49% on the total commitment amount of this credit facility or CNY 102.9 million ($14.8 million USD). As of December 31, 2016, the joint venture had borrowed Chinese CNY 200 million ($28.8 million USD) under the facility.
In connection with the formation of the joint venture, we incurred $0.3 million in expenses for the year ended December 31, 2014, related to due diligence, investment advisors and regulatory matters. The expenses have been recorded in general and administrative expenses in our consolidated statements of income and have not been allocated to our segments and are reflected entirely within corporate and other. In 2016, 2015, and 2014 we incurred $3.9 million, $3.7 million, and $5.7 million, respectively of corporate expenses related to management of our joint venture investment. The expenses have been recorded in general and administrative expenses in our consolidated statements of income and have not been allocated to our segments and are reflected entirely within corporate and other. For the years ended December 31, 2016, 2015, and 2014 we recorded a loss in investment in equity method investments of $10.2 million, $11.4 million, and $6.0 million respectively. Losses incurred by the joint venture with Mengniu are in line with the growth and operating targets set by the joint venture.
4. Inventories
Inventories consisted of the following:
December 31, | |||||||
2016 | 2015 | ||||||
(In thousands) | |||||||
Raw materials and supplies | $ | 139,796 | $ | 120,922 | |||
Finished goods | 156,564 | 149,815 | |||||
Total | $ | 296,360 | $ | 270,737 | |||
5. Property, Plant, and Equipment
Property, plant, and equipment consisted of the following:
F- 16
December 31, | |||||||
2016 | 2015 | ||||||
(In thousands) | |||||||
Land | $ | 60,304 | $ | 51,686 | |||
Buildings | 463,907 | 433,652 | |||||
Machinery and equipment | 1,218,675 | 1,109,004 | |||||
Leasehold improvements | 45,645 | 44,474 | |||||
Construction in progress | 197,402 | 102,899 | |||||
1,985,933 | 1,741,715 | ||||||
Less accumulated depreciation | (691,223 | ) | (604,194 | ) | |||
Total | $ | 1,294,710 | $ | 1,137,521 | |||
Depreciation expense was $118.4 million, $104.8 million, and $99.8 million in 2016, 2015, and 2014, respectively.
For 2016, 2015, and 2014, we capitalized $1.1 million, $1.4 million, and $1.5 million, respectively, in interest related to borrowings during the actual construction period of major capital projects, which is included as part of the cost of the related asset. Included in property, plant, and equipment, net, on the consolidated balance sheets is $21.0 million of capital leases.
6. Goodwill and Intangible Assets
The changes in the carrying amount of goodwill for the years ended December 31, 2016 and 2015 are as follows:
Americas Foods & Beverages | Europe Foods & Beverages | Total | |||||||||
(In thousands) | |||||||||||
Balance at January 1, 2015 | $ | 916,482 | $ | 151,794 | $ | 1,068,276 | |||||
Acquisitions | 380,297 | — | 380,297 | ||||||||
Purchase price adjustments (1) | (2,019 | ) | — | (2,019 | ) | ||||||
Foreign currency translation | (16,007 | ) | (15,225 | ) | (31,232 | ) | |||||
Balance at December 31, 2015 | $ | 1,278,753 | $ | 136,569 | $ | 1,415,322 | |||||
Acquisitions | 9,259 | — | 9,259 | ||||||||
Purchase price adjustments (1) | (10,493 | ) | — | (10,493 | ) | ||||||
Foreign currency translation | 7,099 | (5,120 | ) | 1,979 | |||||||
Balance at December 31, 2016 | $ | 1,284,618 | $ | 131,449 | $ | 1,416,067 | |||||
____________________________________
(1) Purchase price adjustments are the result of adjustments made for the finalization of the fair value of certain intangible assets and, in 2016, also includes the finalization of certain income tax matters.
There were no impairment charges related to goodwill since inception of the Company.
The gross carrying amount and accumulated amortization of our intangible assets, other than goodwill, as of December 31, 2016 and 2015 are as follows:
F- 17
December 31, | |||||||||||||||||||||||
2016 | 2015 | ||||||||||||||||||||||
Gross carrying amount | Accumulated amortization | Net carrying amount | Gross carrying amount | Accumulated amortization | Net carrying amount | ||||||||||||||||||
(In thousands) | |||||||||||||||||||||||
Intangible assets with indefinite lives: | |||||||||||||||||||||||
Trademarks (1) | $ | 780,790 | $ | — | $ | 780,790 | $ | 777,718 | $ | — | $ | 777,718 | |||||||||||
Intangible assets with finite lives: | |||||||||||||||||||||||
Customer-related and other (1) | 279,572 | (58,236 | ) | 221,336 | 270,801 | (39,828 | ) | 230,973 | |||||||||||||||
Supplier relationships | 12,000 | (2,880 | ) | 9,120 | 12,000 | (1,920 | ) | 10,080 | |||||||||||||||
Non-compete agreements (1) | 1,326 | (941 | ) | 385 | 1,267 | (592 | ) | 675 | |||||||||||||||
Trademarks | 968 | (966 | ) | 2 | 968 | (965 | ) | 3 | |||||||||||||||
Total | $ | 1,074,656 | $ | (63,023 | ) | $ | 1,011,633 | $ | 1,062,754 | $ | (43,305 | ) | $ | 1,019,449 | |||||||||
_____________________
(1) The change in the carrying amount is also the result of foreign currency translation, acquisitions, and purchase accounting adjustments.
Amortization expense on finite-lived intangible assets for the years ended December 31, 2016, 2015, and 2014 was $20.4 million, $15.2 million, and $10.7 million, respectively. Estimated aggregate finite-lived intangible asset amortization expense for the next five years is as follows (in thousands):
2017 | $ | 19,960 | |
2018 | 19,831 | ||
2019 | 18,687 | ||
2020 | 18,351 | ||
2021 | 18,338 | ||
Thereafter | 135,676 | ||
Total | $ | 230,843 | |
7. Accounts Payable and Accrued Expenses
Accounts payable and accrued expenses consisted of the following:
December 31, | |||||||
2016 | 2015 | ||||||
(In thousands) | |||||||
Accounts payable | $ | 381,186 | $ | 365,223 | |||
Payroll and benefits | 72,085 | 79,267 | |||||
Derivative liability (Note 10) | 8,309 | 25,900 | |||||
Other accrued liabilities | 77,503 | 79,323 | |||||
Total | $ | 539,083 | $ | 549,713 | |||
8. Income Taxes
Income before income taxes is comprised of the following:
F- 18
Year Ended December 31, | |||||||||||
2016 | 2015 | 2014 | |||||||||
(In thousands) | |||||||||||
Domestic | $ | 276,371 | $ | 213,873 | $ | 174,594 | |||||
Foreign | 50,814 | 53,863 | 49,854 | ||||||||
Income before income taxes | $ | 327,185 | $ | 267,736 | $ | 224,448 | |||||
Income tax expense consists of the following components:
Year Ended December 31, | |||||||||||
2016 | 2015 | 2014 | |||||||||
(In thousands) | |||||||||||
Current income taxes: | |||||||||||
Federal | $ | 67,834 | $ | 69,745 | $ | 53,843 | |||||
State | 8,460 | 14,713 | 9,750 | ||||||||
Foreign | 16,920 | 13,805 | 8,502 | ||||||||
Total current income tax expense | 93,214 | 98,263 | 72,095 | ||||||||
Deferred income taxes: | |||||||||||
Federal | 8,722 | (9,638 | ) | 3,629 | |||||||
State | (369 | ) | (230 | ) | 10 | ||||||
Foreign | 843 | (487 | ) | 2,545 | |||||||
Total deferred income tax expense (benefit) | 9,196 | (10,355 | ) | 6,184 | |||||||
Total income tax expense | $ | 102,410 | $ | 87,908 | $ | 78,279 | |||||
A reconciliation of the statutory U.S. federal tax rate to the Company’s effective tax rate is as follows:
Year Ended December 31, | ||||||||
2016 | 2015 | 2014 | ||||||
Tax expense at statutory rate of 35% | 35.0 | % | 35.0 | % | 35.0 | % | ||
Foreign taxes versus U.S. statutory rate | (3.8 | )% | (3.1 | )% | (3.1 | )% | ||
State income taxes, net of federal benefit | 2.5 | % | 3.1 | % | 2.7 | % | ||
U.S. manufacturing deduction | (1.9 | )% | (1.5 | )% | (2.1 | )% | ||
Uncertain tax positions | 1.0 | % | 0.8 | % | 1.7 | % | ||
Research & development tax credits | (0.6 | )% | (0.9 | )% | (0.3 | )% | ||
Deferred tax rate adjustments | (0.6 | )% | 0.0 | % | (0.4 | )% | ||
Non-deductible transaction costs | 0.1 | % | 0.4 | % | 0.5 | % | ||
Other | (0.4 | )% | (1.0 | )% | 0.9 | % | ||
Effective tax rate | 31.3 | % | 32.8 | % | 34.9 | % | ||
In the table above, the amounts for uncertain tax positions and deferred tax rate adjustments include amounts related to state and foreign income taxes.
The tax effects of temporary differences giving rise to deferred income tax assets (liabilities) were:
F- 19
December 31, | |||||||
2016 | 2015 | ||||||
(In thousands) | |||||||
Deferred income tax assets: | |||||||
Net operating loss carryforwards | $ | 28,766 | $ | 29,179 | |||
Capital loss carryforwards | 3,481 | 4,613 | |||||
Share-based compensation | 24,551 | 23,418 | |||||
Accrued liabilities | 19,776 | 24,075 | |||||
Inventories | 4,806 | 4,988 | |||||
Receivables | 4,110 | 2,333 | |||||
Derivative instruments | 217 | 11,524 | |||||
Other | 6,070 | 4,008 | |||||
Valuation allowances | (30,694 | ) | (31,228 | ) | |||
Total deferred income tax assets | 61,083 | 72,910 | |||||
Deferred income tax liabilities: | |||||||
Intangible assets | (237,411 | ) | (238,740 | ) | |||
Property, plant and equipment | (83,437 | ) | (88,717 | ) | |||
Partnership basis difference | (43,780 | ) | (38,648 | ) | |||
Total deferred income tax liabilities | (364,628 | ) | (366,105 | ) | |||
Net deferred income tax liability (1) | $ | (303,545 | ) | $ | (293,195 | ) | |
__________________________
(1) | Net deferred income tax liability also includes deferred tax assets of $802 and $131 recorded in Identifiable intangible and other assets, net in our consolidated balance sheets for the periods ended December 31, 2016 and 2015, respectively. |
At December 31, 2016 and 2015, we had $110.7 million and $99.7 million, respectively, of foreign net operating loss carryforwards that never expire, against which we have recorded a full valuation allowance because we do not believe it is more likely than not that these losses will be realized in the future. We assess the available positive and negative evidence to estimate whether sufficient future taxable income will be generated to permit use of the foreign net operating loss carryforwards. The amount of the related deferred tax asset considered realizable could be adjusted if future taxable income increases.
At December 31, 2016 and 2015, we had GBP 16.6 million ($20.5 million) and GBP 17.4 million ($25.6 million) respectively, of capital loss carryforwards generated in the United Kingdom. We have recorded a full valuation allowance against this loss because we do not believe it is more likely than not that this loss will be realized in the future.
At December 31, 2016 and 2015, we had $8.2 million and $10.9 million, respectively of post-apportioned, state net operating loss carryforwards, which begin to expire in 2017, and some of which were generated by certain subsidiaries prior to their acquisition. The use of our subsidiaries' state net operating losses is generally limited to future taxable income from the same subsidiary. We do not anticipate that these limitations will affect utilization of the carryforwards prior to their expiration. However, a valuation allowance of $0.2 million and $0.2 million has been recorded against the state net operating loss carryforwards at December 31, 2016 and 2015, respectively, because we do not believe it is more likely than not that all of the deferred tax assets related to the state net operating loss carryforwards will be realized prior to expiration.
Our foreign subsidiaries are required to file local jurisdiction income tax returns with respect to their operations, the earnings from which are expected to be reinvested indefinitely. At December 31, 2016, no provision had been made for U.S. federal or state income tax on approximately $201.0 million of accumulated foreign earnings as they are considered to be permanently reinvested outside the U.S. Computation of the potential deferred tax liability associated with these undistributed earnings and other basis differences is not practicable.
The following is a reconciliation of the beginning and ending gross unrecognized tax benefits, excluding interest, recorded in our consolidated balance sheets:
F- 20
December 31, | |||||||||||
2016 | 2015 | 2014 | |||||||||
(In thousands) | |||||||||||
Balance at January 1 | $ | 16,503 | $ | 7,535 | $ | 3,875 | |||||
Increases in tax positions for current year | 3,499 | 9,185 | 2,524 | ||||||||
Increases in tax positions for prior years | 3,776 | 881 | 2,332 | ||||||||
Decreases in tax positions for prior years | (519 | ) | (780 | ) | — | ||||||
Settlement of tax matters | (15 | ) | (102 | ) | (640 | ) | |||||
Lapse of applicable statutes of limitations | (247 | ) | (216 | ) | (556 | ) | |||||
Balance at December 31 | $ | 22,997 | $ | 16,503 | $ | 7,535 | |||||
The additions to unrecognized tax benefits are primarily attributable to foreign tax matters and, to a lesser extent, U.S. federal and state tax matters.
Of the balance of unrecognized tax benefits at December 31, 2016, the entire amount would impact our effective tax rate when released. Any changes to our liability for unrecognized tax benefits in the next 12 months is not expected to have a material effect on our financial condition, results of operations or liquidity.
Income tax expense for 2016, 2015, and 2014 included interest expense of $1.6 million, $0.3 million and $0.4 million, respectively. Our liability for uncertain tax positions included accrued interest of $2.5 million and $0.9 million at December 31, 2016 and 2015, respectively. Accounts payable and accrued expenses include accrued penalties of $0.5 million and nil at December 31, 2016 and 2015, respectively.
Dean Foods’ U.S. federal income tax returns, in which we were included through the spin-off date in May 2013, have been audited through 2011. State income tax returns are generally subject to examination for a period of three to five years after filing. Our foreign income tax returns are generally subject to examination for a period of one to five years after filing. We have various income tax returns in the process of examination, appeals or settlement. Under the tax matters agreement, the Company has agreed to reimburse Dean Foods and Dean Foods has agreed to reimburse the Company, as applicable, for any income tax liabilities resulting from before the spin-off date to the extent a redetermination relates to the other company’s business.
9. Debt and Capital Lease Obligations
December 31, | |||||||||||||||
2016 | 2015 | ||||||||||||||
Amount outstanding | Interest rate | Amount outstanding | Interest rate | ||||||||||||
(In thousands, except percentages) | |||||||||||||||
Senior secured credit facilities | $ | 1,627,600 | 2.63 | % | * | $ | 1,627,000 | 2.54 | % | * | |||||
Senior unsecured notes | 500,000 | 5.38 | % | 500,000 | 5.38 | % | |||||||||
Capital lease obligations | 20,244 | 21,635 | |||||||||||||
Other borrowings | 12,191 | 1.68 | % | * | 5,133 | 3.70 | % | ||||||||
Less current portion | (58,585 | ) | (51,449 | ) | |||||||||||
Less debt issuance costs | (19,694 | ) | (23,379 | ) | |||||||||||
Total long-term debt | $ | 2,081,756 | $ | 2,078,940 | |||||||||||
___________________________
* Represents a weighted average rate, including applicable interest rate margins.
Senior Secured Credit Facilities
On October 12, 2012, we entered into a credit agreement, among us, the subsidiary guarantors listed therein, Bank of America, N.A., as administrative agent, JPMorgan Chase Bank, N.A., as syndication agent, and the other lenders party thereto (the "Credit Agreement"). The Credit Agreement governed our senior secured credit facilities, consisting of a five-year revolving credit facility in a principal amount of $850.0 million, an original five-year $250.0 million term loan A-1, and an original seven-year $250.0 million term loan A-2. On November 28, 2012 we entered in an amendment (the “First Amendment’) whereby the required principal payment dates and various covenant level requirement dates were established.
F- 21
In conjunction with the January 2, 2014 acquisition of Earthbound Farm, under the terms of the Credit Agreement, we entered into an Incremental Term Loan Agreement to establish a new incremental seven-year term loan A-3 facility in an aggregate principal amount of $500.0 million (the “Incremental Term Loan Agreement”). On January 2, 2014, we also amended the Credit Agreement (the “Second Amendment”) that, among other things, reset an accordion feature that allows for our senior secured credit facilities to be increased by up to $500.0 million, subject to lenders commitments, and increased the limit of swing line loans to $85.0 million.
On August 29, 2014, we entered into an amendment to the Credit Agreement (the “Third Amendment”). The Third Amendment extended maturity dates, reset amortization requirements, increased liquidity and added additional operating flexibility under the Credit Agreement. The applicable interest rates and commitment fees under the Credit Agreement were not modified.
The Third Amendment, among other things:
• | consolidated the term loan A-3 into the term loan A-2 |
• | increased the revolving commitment to $1.0 billion, increased the limits under our revolving commitment of swing line loans to $100 million and issued letters of credit to $100 million |
• | established a maximum consolidated net leverage ratio covenant of 5.00 to 1.00 and an initial maximum consolidated senior secured net leverage ratio covenant of 4.00 to 1.00 |
On November 6, 2015 we entered into an amendment to the Credit Agreement (the “Fourth Amendment”). The Fourth Amendment extended maturity dates, reset amortization requirements, increased liquidity and added additional operating flexibility under the Credit Agreement. As a result, approximately $1.5 million of costs were expensed and $3.5 million of new deferred financing fees were capitalized related to the Fourth Amendment, resulting in $23.4 million of capitalized fees being subject to amortization over the remaining respective debt maturity dates as of December 31, 2015.
The Fourth Amendment, among other things:
• | added a wholly-owned subsidiary as a borrower |
• | extended the maturity dates of the revolving credit facility and the term loan A-1 credit facility to November 6, 2020 and the term loan A-2 credit facility to November 6, 2022 |
• | increased the term loan A-1 credit facility to $750 million, constituting an increase of $512.5 million |
• | increased the term loan A-2 credit facility to $750 million, constituting an increase of $7.5 million |
• | established principal payment requirements for the term loan A-1 to 5% per annum, with the balance due at maturity |
• | established principal payments requirements for the term loan A-2 to 1% per annum, with the balance due at maturity |
• | reduced the applicable interest rate levels |
• | modified the maximum consolidated senior secured net leverage ratio covenant to be 4.00 to 1.0 at all times |
We utilized the incremental $520 million of aggregate term loan proceeds from the Fourth Amendment, net of transaction related expenses, to reduce outstanding borrowings under the revolving credit facility, thereby increasing availability under the revolving credit facility by the same amount.
As of December 31, 2016, we had outstanding borrowings of $1.6 billion under our current $2.5 billion senior secured credit facilities consisting of $172.6 million outstanding under the revolving credit facility, a $712.5 million principal balance under term loan A-1, and a $742.5 million principal balance under term loan A-2. We had $9.0 million in outstanding letters of credit issued under our revolving credit facilities and $818.4 million of additional availability under our $1 billion revolving credit facility commitment.
The senior secured credit facilities are collateralized by interests and liens on substantially all of our domestic assets, and are guaranteed by our material domestic subsidiaries. As of December 31, 2016, borrowings under the revolving credit facility and term loan A-1 bore interest at a rate of LIBOR plus 1.75% per annum and the term loan A-2 at a rate of LIBOR plus 2.00% per annum.
Senior Unsecured Notes
F- 22
On September 17, 2014, we issued $500.0 million in aggregate principal amount of senior notes guaranteed by certain of our 100% owned subsidiaries, see Note 17 "Supplemental Guarantor Financial Information." The notes mature on October 1, 2022 and bear interest at a rate of 5.375% per annum payable on April 1 and October 1 of each year, beginning on April 1, 2015. The net proceeds from the issuance and sale of the notes, after deducting underwriting discounts and commission and offering expenses, was approximately $490.7 million. We utilized the proceeds of the issuance to pay down all outstanding borrowings under our senior secured revolving commitment, with the remaining proceeds increasing our cash balances.
The scheduled maturities of long-term debt at December 31, 2016, were as follows (in thousands):
Total | Term Loan A-1 | Term Loan A-2 | Revolver | Senior Unsecured Notes | Capital Lease Obligations | Other Borrowings | |||||||||||||||||||||
2017 | $ | 58,585 | $ | 37,500 | $ | 7,500 | $ | — | $ | — | $ | 1,394 | $ | 12,191 | |||||||||||||
2018 | 46,485 | 37,500 | 7,500 | — | — | 1,485 | — | ||||||||||||||||||||
2019 | 46,581 | 37,500 | 7,500 | — | — | 1,581 | — | ||||||||||||||||||||
2020 | 781,073 | 600,000 | 7,500 | 172,600 | — | 973 | — | ||||||||||||||||||||
2021 | 8,283 | — | 7,500 | — | — | 783 | — | ||||||||||||||||||||
Thereafter | 1,219,028 | — | 705,000 | — | 500,000 | 14,028 | — | ||||||||||||||||||||
Total outstanding debt | $ | 2,160,035 | $ | 712,500 | $ | 742,500 | $ | 172,600 | $ | 500,000 | $ | 20,244 | $ | 12,191 | |||||||||||||
Alpro Revolving Credit Facility
On June 29, 2015, Alpro entered into a new revolving credit facility not to exceed €30.0 million or its currency equivalent. The facility is unsecured and guaranteed by The WhiteWave Foods Company. The facility is available for working capital and other general corporate purposes of Alpro and for the issuance of letters of credit up to €30.0 million or its currency equivalent. At December 31, 2016 Alpro had €11.0 million ($11.6 million USD) of borrowings outstanding at an interest rate of 1.38% due upon maturity on June 29, 2017. There were no outstanding borrowings as of December 31, 2015.
Vega Revolving Credit Facility
On August 27, 2015, Vega entered into an uncommitted revolving credit facility not to exceed $10.0 million CAD or its currency equivalent and in April 2016, Vega increased the limit on its uncommitted revolving credit facility to not exceed $15.0 million CAD or its currency equivalent. The facility is unsecured and guaranteed by The WhiteWave Foods Company. The facility is available for working capital and other general corporate purposes of Vega and currently bears interest at a rate of 3.70%. At December 31, 2016, there were no outstanding borrowings under this facility. At December 31, 2015, there was $7.1 million CAD ($5.1 million USD) outstanding in borrowings under the facility.
Capital Lease Obligations
We are party to leases of certain operating facilities and equipment under capital lease arrangements which bear interest at rates from 3.1% to 8.0% and have expiration dates through 2033.
10. Derivative Financial Instruments and Fair Value Measurement
The Company is exposed to certain risks relating to its ongoing business operations. The primary risks managed by derivative instruments include interest rate risk, foreign currency risk and commodity price risk. Derivative contracts are entered into for periods consistent with the related underlying exposure and do not constitute positions independent of those exposures. The Company does not enter into derivative instruments for trading or speculative purposes.
Credit risk under these arrangements is believed to be remote as the counterparties to the derivatives are major financial institutions; however, if any of the counterparties to the derivative agreements become unable to fulfill their obligation, we may lose the financial benefits of these arrangements.
Interest Rates
In connection with our initial public offering, on October 31, 2012, Dean Foods novated to us certain of its interest rate swaps (the “2017 swaps”) with a notional value of $650 million and a maturity date of March 31, 2017. The 2017 swaps effectively change the interest payments on a portion of our debt from variable-rate, based on short term LIBOR, to fixed-rate payments. We
F- 23
are the sole counterparty to the financial institutions under these swap agreements and are directly responsible for any required settlements, and the sole beneficiary of any future receipts of funds, pursuant to their terms. We are subject to market risk with respect to changes in the underlying benchmark interest rate that impact the fair value of the 2017 swaps.
The following table summarizes the terms of the 2017 swaps as of December 31, 2016:
Fixed Interest Rates | Expiration Date | Notional Amount | ||
(In thousands) | ||||
2.75% to 3.19% | March 31, 2017 | $650,000 | ||
We have not designated such contracts as hedging instruments; therefore, the 2017 swaps are marked to market at the end of each reporting period and a derivative asset or liability is recorded in our consolidated balance sheets. We recorded losses on these contracts of $2.0 million, $5.5 million, and $5.3 million for the years ended December 31, 2016, 2015, and 2014, respectively. Gains and losses are recorded in other expense, net in our consolidated statements of income. A summary of these open swap agreements recorded at fair value in our consolidated balance sheets at December 31, 2016 and 2015 is included in the fair value table below.
Commodities
We are exposed to commodity price fluctuations, including organic and conventional milk, butterfat, almonds, organic and non-genetically modified (“non-GMO”) soybeans, sweeteners, and other commodity costs used in the manufacturing, packaging, and distribution of our products, including utilities, natural gas, resin, and diesel fuel. To secure adequate supplies of materials and bring greater stability to the cost of ingredients and their related manufacturing, packaging, and distribution, we routinely enter into forward purchase contracts and other purchase arrangements with suppliers. Under the forward purchase contracts, we commit to purchasing agreed-upon quantities of ingredients and commodities at agreed-upon prices at specified future dates. The outstanding purchase commitment for these commodities at any point in time typically ranges from one month’s to eighteen month's anticipated requirements, depending on the ingredient or commodity, but can be longer in limited cases. These contracts are considered normal purchases.
In addition to entering into forward purchase contracts, from time to time we may purchase over-the-counter hedge contracts from qualified financial institutions for commodities associated with the production and distribution of our products. Certain of these contracts offset the risk of increases in our commodity costs and are designated as cash flow hedges when appropriate. For the years ended December 31, 2016 and 2015, there were no commodity cash flow hedges into which we entered.
Derivatives not designated as hedges are not speculative and are used to manage the Company’s exposure to commodity price risk but do not meet the authoritative guidance for hedge accounting. From time to time, the Company enters into commodity forward contracts to fix the price of natural gas and diesel fuel purchases and other commodities at a future delivery date. Changes in the fair value of derivatives not designated in hedging relationships are recorded to cost of sales and selling, distribution and marketing expenses in our consolidated statements of income depending on commodity type. We recorded gains/(losses) on these contracts of $3.3 million, $(17.6) million, and $(10.9) million for the years ended December 31, 2016, 2015, and 2014, respectively. As of December 31, 2016, the Company had outstanding contracts for the purchase of 15.0 million gallons of diesel expiring throughout 2017. A summary of our open commodities contracts recorded at fair value in our consolidated balance sheets at December 31, 2016 and 2015 is included in the fair value table below.
Although we may utilize forward purchase contracts and other instruments to mitigate the risks related to commodity price fluctuation, such strategies do not fully mitigate commodity price risk. Adverse movements in commodity prices over the terms of the contracts or instruments could decrease or eliminate the economic benefits we derive from these strategies.
Foreign Currency
Our international operations represented approximately 19%, 18%, and 19% of our net sales for the years ended December 31, 2016, 2015, and 2014, respectively. Sales in foreign countries, as well as certain expenses related to those sales, are transacted in currencies other than our reporting currency, the U.S. dollar. Our foreign currency exchange rate risk primarily consists of the Euro, British pound, Canadian dollar, Mexican peso, and Chinese yuan related to net sales and expenses in currencies other than the functional currency of the business. We may, from time to time, employ derivative financial instruments to manage our exposure to fluctuations in foreign currency rates or enter into forward currency exchange contracts to hedge our net investment and intercompany payable or receivable balances in foreign operations. These contracts are designated as cash flow hedges and are recorded as an asset or liability in our consolidated balance sheets at fair value with an offset to accumulated other comprehensive loss to the extent the hedge is effective. Derivative gains and losses included in accumulated other comprehensive loss are reclassified into earnings as the underlying transaction occurs. As of December 31, 2016, the Company had an aggregate notional
F- 24
U.S. dollar equivalent of $241.1 million of U.S. dollar foreign currency contracts outstanding, expiring throughout 2017 for an intercompany note receivable and commodity purchases denominated in a currency other than the functional currency. Any ineffectiveness in our foreign currency exchange hedges is recorded as an adjustment to cost of goods sold or other expense, net, depending on nature, in our consolidated statements of income. There was no material hedge ineffectiveness related to our foreign currency exchange contracts designated as hedging instruments during the years ended December 31, 2016, 2015, and 2014.
As of December 31, 2016 and 2015, derivatives recorded at fair value, on a gross basis before considering any impacts of offsetting or master netting arrangements, in our consolidated balance sheets were as follows:
December 31, | |||||||||||||||
Derivative assets | Derivative liabilities | ||||||||||||||
2016 | 2015 | 2016 | 2015 | ||||||||||||
(In thousands) | |||||||||||||||
Derivatives designated as Hedging Instruments | |||||||||||||||
Foreign currency contracts — current(1)(3) | $ | 1,007 | $ | 483 | $ | 4,088 | $ | — | |||||||
Total | 1,007 | 483 | 4,088 | — | |||||||||||
Derivatives not designated as Hedging Instruments | |||||||||||||||
Interest rate swap contracts — current(1) | — | — | 3,650 | 15,228 | |||||||||||
Commodities contracts — current(1) | 2,738 | — | 571 | 11,093 | |||||||||||
Commodities contracts — noncurrent(2) | — | — | — | 1,551 | |||||||||||
Interest rate swap contracts — noncurrent(2) | — | — | — | 3,142 | |||||||||||
Total | 2,738 | — | 4,221 | 31,014 | |||||||||||
Total derivatives | $ | 3,745 | $ | 483 | $ | 8,309 | $ | 31,014 | |||||||
___________________________
(1) | Derivative assets and liabilities that have settlement dates equal to or less than 12 months from the respective balance sheet date were included in prepaid expenses and other current assets and accounts payable and accrued expenses, respectively, in our consolidated balance sheets. |
(2) | Derivative assets and liabilities that have settlement dates greater than 12 months from the respective balance sheet date were included in identifiable intangible and other assets, net and other long-term liabilities, respectively, in our consolidated balance sheets. |
(3) | $(4.1) million and $0.4 million of the derivative asset/(liability) balance as of December 31, 2016 and 2015, respectively relates to a foreign currency hedge on an intercompany note for which the change in fair value offsets the impact of the note being re-measured into the functional currency. |
Gains and losses on derivatives designated as cash flow hedges reclassified from accumulated other comprehensive loss into income for the years ended December 31, 2016, 2015, and 2014 were as follows:
Year ended December 31 , | |||||||||||
2016 | 2015 | 2014 | |||||||||
(In thousands) | |||||||||||
Realized (gains)/losses on foreign currency contracts(1) | $ | (51 | ) | $ | (1,522 | ) | $ | 547 | |||
Realized (gains)/losses on commodities contracts(2) | — | — | (1,299 | ) | |||||||
___________________________
(1) | Recorded in cost of sales in our consolidated statements of income. See Note 12 "Accumulated Other Comprehensive Loss." |
(2) | Recorded in selling, distribution and marketing expense or cost of sales, depending on commodity type, in our consolidated statements of income. |
Based on current exchange rates, we estimate that $3.1 million in net losses of hedging activity related to our foreign currency contracts will be reclassified from accumulated other comprehensive loss to operating results within the next 12 months.
Fair Value Measurements
Fair value is an exit price, representing the amount that would be received to sell an asset or paid to transfer a liability in an orderly transaction between market participants. As such, fair value is a market-based measurement that should be determined based on assumptions that market participants would use in pricing an asset or liability. As a basis for considering assumptions, we follow a three-tier fair value hierarchy, which prioritizes the inputs used in measuring fair value as follows:
• | Level 1 — Quoted prices for identical instruments in active markets. |
F- 25
• | Level 2 — Quoted prices for similar instruments in active markets, quoted prices for identical or similar instruments in markets that are not active, and model-derived valuations, in which all significant inputs are observable in active markets. |
• | Level 3 — Unobservable inputs in which there is little or no market data, which require the reporting entity to develop its own assumptions. |
A summary of our financial assets and liabilities subject to recurring fair value measurements and the basis for that measurement according to the levels in the fair value hierarchy as of December 31, 2016 and 2015 is as follows:
Fair value as of | |||||||||||||||
December 31, 2016 | Level 1 | Level 2 | Level 3 | ||||||||||||
(In thousands) | |||||||||||||||
Assets: | |||||||||||||||
Cash equivalents | $ | 82 | $ | 82 | $ | — | $ | — | |||||||
Supplemental Executive Retirement Plan investments | 3,747 | 3,747 | — | — | |||||||||||
Qualifying insurance policies | 11,554 | — | — | 11,554 | |||||||||||
Foreign currency contracts | 1,007 | — | 1,007 | — | |||||||||||
Commodities contracts | 2,738 | — | 2,738 | — | |||||||||||
Deferred compensation investments | 5,513 | — | 5,513 | — | |||||||||||
Total assets | $ | 24,641 | $ | 3,829 | $ | 9,258 | $ | 11,554 | |||||||
Liabilities: | |||||||||||||||
Foreign currency contracts | $ | 4,088 | $ | — | $ | 4,088 | $ | — | |||||||
Commodities contracts | 571 | — | 571 | — | |||||||||||
Interest rate swap contracts | 3,650 | — | 3,650 | — | |||||||||||
Total liabilities | $ | 8,309 | $ | — | $ | 8,309 | $ | — | |||||||
There were no transfers between the three levels of the fair value hierarchy during the year ended December 31, 2016.
Fair value as of | |||||||||||||||
December 31, 2015 | Level 1 | Level 2 | Level 3 | ||||||||||||
(In thousands) | |||||||||||||||
Assets: | |||||||||||||||
Cash equivalents | $ | 107 | $ | 107 | $ | — | $ | — | |||||||
Supplemental Executive Retirement Plan investments | 3,164 | 3,164 | — | — | |||||||||||
Qualifying insurance policies | 10,631 | — | — | 10,631 | |||||||||||
Foreign currency contracts | 483 | — | 483 | — | |||||||||||
Deferred compensation investments | 4,359 | — | 4,359 | — | |||||||||||
Total assets | $ | 18,744 | $ | 3,271 | $ | 4,842 | $ | 10,631 | |||||||
Liabilities: | |||||||||||||||
Commodities contracts | $ | 12,644 | $ | — | $ | 12,644 | $ | — | |||||||
Interest rate swap contracts | 18,370 | — | 18,370 | — | |||||||||||
Total liabilities | $ | 31,014 | $ | — | $ | 31,014 | $ | — | |||||||
We sponsor two deferred compensation plans, Pre-2005 Executive Deferred Compensation Plan and Post-2004 Executive Deferred Compensation Plan, under which certain employees with a base compensation of at least $150,000 may elect to defer receiving payment for a portion of their salary and bonus until periods after their respective retirements or upon separation from service. See Note 13 “Employee Retirement Plans.” The investments are classified as trading securities and the assets related to
F- 26
these plans are primarily invested in mutual funds and are held at fair value. We classify these assets as Level 2 as fair value can be corroborated based on quoted market prices for identical or similar instruments in markets that are not active. Changes in the fair value are recorded in general and administrative expense in our consolidated statements of income.
Additionally, we maintain a Supplemental Executive Retirement Plan (“SERP”), which is a nonqualified deferred compensation arrangement for our executive officers and other employees earning compensation in excess of the maximum compensation that can be taken into account with respect to our 401(k) plan. The SERP is designed to provide these employees with retirement benefits from us that are equivalent, as a percentage of total compensation, to the benefits provided to other employees. The investments are classified as trading securities and are primarily invested in money market funds and held at fair value. We classify these assets as Level 1 as fair value can be corroborated based on quoted market prices for identical instruments in active markets. Changes in the fair value are recorded in general and administrative expense in our consolidated statements of income.
Our assets and liabilities recorded at fair value on a recurring basis include cash equivalent money market funds. Due to their near-term maturities, the carrying amounts of trade accounts receivable and accounts payable are considered equivalent to fair value. In addition, because the interest rates on our senior secured credit facilities are variable, their fair values approximate their carrying values.
We estimate the fair value of our senior unsecured notes primarily using quoted market prices in markets that are not active. As of December 31, 2016, the carrying value and fair value of the Company's borrowings was $500.0 million and $549.4 million, respectively. See Note 9 "Debt and Capital Lease Obligations." As of December 31, 2015, the carrying value and fair value of the Company's borrowings was $500.0 million and $521.3 million, respectively. If measured at fair value in our consolidated balance sheets, our senior unsecured notes would be classified in Level 2 of the fair value hierarchy.
The fair value of our interest rate swaps is determined based on the notional amounts of the swaps and the forward LIBOR curve relative to the fixed interest rates under the swap agreements. The fair value of our commodities contracts is based on the quantities and fixed prices under the agreements and quoted forward commodity prices. The fair value of our foreign currency contracts is based on the notional amounts and rates under the contracts and observable market forward exchange rates. We classify these instruments in Level 2 because quoted market prices can be corroborated utilizing observable benchmark market rates at commonly quoted intervals and observable market transactions of spot currency rates and forward currency prices. We did not significantly change our valuation techniques from prior periods.
Our qualified pension plan investments are comprised of qualifying insurance policies and the guaranteed premiums are invested in the general assets of the insurance company. We classify these assets as Level 3 as there is little or no market data to support the fair value. The qualifying insurance policies are valued at the amount guaranteed by the insurer to pay out the insured benefits. The funding policy is to contribute assets at least equal in amount to regulatory minimum requirements. Funding is based on legal requirements, tax considerations, and investment opportunities. See Note 13 “Employee Retirement Plans.”
11. Share-Based Compensation
Under the Amended and Restated 2012 Stock Incentive Plan (the "2012 SIP"), a total of 26,850,000 shares of our common stock were reserved for issuance upon the exercise of stock options or the vesting of restricted stock units (“RSUs”), performance stock units ("PSUs") or restricted stock awards that may be issued to our employees, non-employee directors and consultants. The 2012 SIP also permits awards of stock appreciation rights (“SARs”) and phantom shares as part of our long-term incentive compensation program. Awards granted to our employees under the 2012 SIP vest one-third on the first anniversary of the grant date, one-third on the second anniversary of the grant date, and one-third on the third anniversary of the grant date. Awards granted to non-employee directors vest one year from the grant date, for awards granted in 2016, and ratably over three years, for awards granted before 2016. Unvested awards vest immediately in the following circumstances: (i) an employee retires after reaching the age of 65, (ii) in certain cases upon an employee’s death or qualified disability, and (iii) an employee with 10 years of service retires after reaching the age of 55, or (iv) upon a change of control, except for PSUs and all equity awards granted after 2014 to the Company's executive officers.
Upon the completion of the acquisition of the Company by Danone S.A., all of the Company's outstanding share-based compensation awards will automatically be canceled for no consideration, and converted into the right to receive $56.25 per share in cash, without interest. See Note 19 "The Proposed Merger with Danone" for further discussion.
Share-Based Compensation Expense
The following table summarizes the share-based compensation expense recognized for the Company’s equity and liability classified plans in the years ended December 31, 2016, 2015, and 2014:
F- 27
Year ended December 31, | |||||||||||
2016 | 2015 | 2014 | |||||||||
(In thousands) | |||||||||||
Equity awards: | |||||||||||
Stock options | $ | 8,797 | $ | 11,038 | $ | 10,741 | |||||
RSUs | 13,871 | 16,069 | 15,907 | ||||||||
PSUs | 7,743 | 5,382 | — | ||||||||
Equity awards share-based compensation expense | 30,411 | 32,489 | 26,648 | ||||||||
Liability awards: | |||||||||||
Phantom shares | 13 | 908 | 2,658 | ||||||||
SARs | 1,182 | 4,929 | 1,134 | ||||||||
Liability awards share-based compensation expense | $ | 1,195 | $ | 5,837 | $ | 3,792 | |||||
Total share-based compensation expense | $ | 31,606 | $ | 38,326 | $ | 30,440 | |||||
Share-based compensation expense is recorded within general and administrative expense. Except for PSUs, this expense is recognized one-third on the first anniversary of the grant date, one-third on the second anniversary of the grant date, and one-third on the third anniversary of the grant date, unless the employee has reached the retirement age of 65 or is 55 years of age and has 10 years of service, in which case all share-based compensation expense is recognized at the time of grant.
Stock Options
Under the terms of the 2012 SIP, certain senior employees may be granted options to purchase our common stock at a price equal to the market price on the date the option is granted, which options have a 10 year contractual term. The fair value of each option award is estimated on the date of grant using the Black-Scholes valuation model with the following assumptions:
Year ended December 31, | |||||
2016 | 2015 | 2014 | |||
Expected volatility | 28% - 29% | 28% - 29% | 28% - 29% | ||
Expected dividend yield | 0% | 0% | 0% | ||
Expected option term | 6 years | 6 years | 6 years | ||
Risk-free rate of return | 1.14% to 1.70% | 1.45% to 1.91% | 1.82% to 2.10% | ||
Forfeiture rate | 0% | 0% | 0% | ||
Since the Company’s common stock did not have a long history of being publicly traded at grant date, the expected term was determined under the simplified method, using an average of the contractual term and vesting period of the stock options. For stock options granted in 2015 and thereafter, the expected volatility assumption was calculated based on a blend of compensation peer group analysis of stock price volatility with a six-year look back period ending on the grant date, and the Company's current implied stock price volatility. For stock options granted prior to 2015, the expected volatility assumption was calculated based solely on a compensation peer group analysis of stock price volatility with a six-year look back period ending at the grant date. The risk-free rates were based on the average implied yield available on five-year and seven-year U.S. Treasury issues. The forfeiture rates are based on historical rates and the Company elected to use a 0% forfeiture rate due to historically immaterial forfeiture rates. We have not paid, and do not anticipate paying, a cash dividend on our common stock.
The following table summarizes stock option activity during the year ended December 31, 2016:
F- 28
Number of options | Weighted average exercise price | Weighted average contractual life in years | Aggregate intrinsic value | |||||||||
Options outstanding at January 1, 2016 | 9,440,803 | $ | 19.14 | |||||||||
Granted | 813,267 | 36.59 | ||||||||||
Forfeited, canceled and expired(1) | (53,119 | ) | 40.59 | |||||||||
Exercised (including tax withholding)(1) | (1,146,704 | ) | 20.07 | |||||||||
Options outstanding at December 31, 2016 | 9,054,247 | $ | 20.47 | 5.27 | $ | 318,110,209 | ||||||
Options vested and expected to vest at December 31, 2016 | 9,054,247 | $ | 20.47 | 5.27 | $ | 318,110,209 | ||||||
Options exercisable at December 31, 2016 | 7,475,892 | $ | 17.40 | 4.60 | $ | 285,613,983 | ||||||
___________________________
(1) | Pursuant to the terms of the 2012 SIP, options that are forfeited, canceled or expired may be available for future grants; however shares delivered to or withheld by the Company for the payment of the exercise price of an option and/or tax withholding related to an exercise, and shares subject to an option that are not issued upon the net exercise of such option, are not added back to the pool of shares available for future awards. |
The following table summarizes information about options outstanding at December 31, 2016:
Options outstanding | Options exercisable | ||||||||||||||
Range of exercise prices | Number outstanding | Weighted average remaining contractual life in years | Weighted average exercise price | Number exercisable | Weighted average exercise price | ||||||||||
$9.38 to 9.52 | 813,081 | 4.04 | $ | 9.50 | 813,081 | $ | 9.50 | ||||||||
11.10 | 1,248,884 | 5.13 | 11.10 | 1,248,884 | 11.10 | ||||||||||
13.39 to 15.16 | 1,211,599 | 5.28 | 14.65 | 1,211,599 | 14.65 | ||||||||||
15.17 to 16.91 | 64,365 | 5.59 | 15.86 | 64,365 | 15.86 | ||||||||||
17.00 | 1,748,341 | 5.82 | 17.00 | 1,748,341 | 17.00 | ||||||||||
18.05 to 23.33 | 1,265,004 | 1.81 | 20.82 | 1,217,819 | 20.75 | ||||||||||
26.91 to 27.69 | 1,167,073 | 5.01 | 27.14 | 873,877 | 27.22 | ||||||||||
28.18 to 38.96 | 1,426,656 | 8.36 | 36.81 | 284,596 | 36.19 | ||||||||||
39.63 to 47.29 | 93,717 | 9.20 | 41.49 | 8,153 | 40.41 | ||||||||||
51.62 to 51.62 | 15,527 | 8.58 | 51.62 | 5,177 | 51.62 | ||||||||||
Year ended December 31, | |||||||||||
2016 | 2015 | 2014 | |||||||||
(in thousands, except per share amounts) | |||||||||||
Weighted average grant date fair value per share of options granted | $ | 11.32 | $ | 12.32 | $ | 8.62 | |||||
Intrinsic value of options exercised | 25,501 | 66,036 | 12,158 | ||||||||
Fair value of shares vested | 7,875 | 11,666 | 6,281 | ||||||||
Tax benefit related to stock option expense | 2,857 | 3,816 | 3,864 | ||||||||
During the year ended December 31, 2016, we received $10.1 million of cash from stock option exercises. At December 31, 2016, there was $6.9 million of total unrecognized stock option expense, all of which is related to non-vested awards. This compensation expense is expected to be recognized over the weighted average remaining vesting period of 1.41 years.
Restricted Stock Units
RSUs are issued to certain senior employees under the 2012 SIP as part of the long-term incentive program. An RSU represents the right to receive one share of common stock in the future. RSUs have no exercise price. RSUs granted to employees vest ratably over three years.
The following table summarizes RSU activity during the year ended December 31, 2016:
F- 29
Number of shares | Weighted average grant date fair value | ||||
RSUs outstanding at January 1, 2016 (1) | 839,252 | 30.02 | |||
RSUs granted | 410,058 | 36.52 | |||
Shares issued upon vesting of RSUs (including tax withholding)(2) | (446,141 | ) | 26.78 | ||
RSUs canceled(2) | (34,886 | ) | 38.60 | ||
RSUs outstanding at December 31, 2016 (1) | 768,283 | 34.99 | |||
___________________________
(1) | Non-vested RSUs outstanding as of December 31, 2015 and 2016 were 819,296 and 749,460, respectively, with an ending 2016 weighted average grant date fair value per share of $35.29. |
(2) | Pursuant to the terms of the 2012 SIP, RSUs that are canceled or forfeited before they vest may be available for future grants; however shares delivered to or withheld by the Company for the payment of the employee's tax withholding related to an RSU vesting are not added back to the pool of shares available for future awards. |
The following table summarizes information about our RSU grants and related tax benefit during the years ended December 31, 2016, 2015 and 2014:
Year ended December 31, | |||||||||||
2016 | 2015 | 2014 | |||||||||
(in thousands, except per share amounts) | |||||||||||
Weighted average grant date fair value per RSU granted | $ | 36.52 | $ | 39.41 | $ | 26.79 | |||||
Fair value of shares vested | 11,947 | 17,287 | 11,999 | ||||||||
Tax benefit related to RSU expense | 4,658 | 5,033 | 5,109 | ||||||||
At December 31, 2016, there was $11.5 million of total unrecognized RSU expense, all of which is related to unvested awards. This compensation expense is expected to be recognized over the weighted-average remaining vesting period of 1.43 years.
Performance Stock Units
In February 2015 and 2016, we granted PSUs to our executive officers under the 2012 SIP as part of our long-term incentive compensation program. PSUs vest based on a comparison of the Company’s diluted adjusted EPS growth over the three-year performance period to the diluted adjusted EPS growth of companies in the S&P 500 over the same period. In the first year, one third of the PSUs will vest based on our diluted adjusted EPS growth in that year compared to the one-year diluted adjusted EPS growth of S&P 500 companies. In the second year, one third of the PSUs will vest based on our cumulative diluted adjusted EPS growth over the past two years compared to the cumulative two-year diluted adjusted EPS growth of S&P 500 companies. In the third year, one third of the PSUs will vest based on our cumulative diluted adjusted EPS growth over the past three years compared to the cumulative three-year diluted adjusted EPS growth of S&P 500 companies. PSUs will be converted to common stock upon vesting and the payout range is 0 to 200%.
We recognize share-based compensation expense in the consolidated statements of income over the three year performance period based on the Company’s estimated relative performance for each vesting tranche. Accordingly, for the grant made each year we recognize 100% of the estimated first year expense, 50% of the estimated second year expense and 33.3% of the estimated third year expense. As of December 31, 2016, based upon our assessment of our relative performance versus the S&P 500, the 2015 PSU awards have been expensed based upon a target payout assumption of 200% for the two year tranche (2015-2016) and 167% for the three year tranche (2015-2017). As of December 31, 2016, the 2016 PSU awards have been expensed based upon a target payout assumption of 200% for the one year tranche (2016), 150% for the two year tranche (2016-2017) and 133% for three year tranche (2016-2018).
The following table summarizes PSU activity for vested and non-vested shares during the year ended December 31, 2016:
F- 30
Number of shares | Weighted average grant date fair value | ||||
PSUs outstanding at January 1, 2016 | 107,358 | 38.96 | |||
PSUs granted | 155,846 | 36.75 | |||
Shares issued upon vesting of PSUs (1) | (71,580 | ) | 38.96 | ||
PSUs canceled (1) | — | — | |||
PSUs outstanding at December 31, 2016 (1) | 191,624 | 37.16 | |||
___________________
(1) | Pursuant to the terms of the 2012 SIP, PSUs that are canceled or forfeited before they vest may be available for future grants; however shares delivered to or withheld by the Company for the payment of the employee's tax withholding related to a PSU vesting are not added back to the pool of shares available for future awards. Shares issued upon vesting of PSUs on April 18, 2016 were 71,580, which represented 200% payout. |
The following table summarizes information about our PSU grants and related tax benefit during the years ended December 31, 2016 and 2015:
Year ended December 31, | |||||||
2016 | 2015 | ||||||
(in thousands, except per share amounts) | |||||||
Weighted average grant date fair value per PSU granted | $ | 36.75 | $ | 38.96 | |||
Fair value of shares vested | 2,789 | — | |||||
Tax benefit related to PSU expense | 2,661 | 1,880 | |||||
At December 31, 2016 there was $1.8 million of total unrecognized PSU expense, all of which is related to unvested awards. This compensation expense is expected to be recognized over the weighted average remaining vesting period of 1.15 years.
Phantom Shares
We previously granted phantom shares under the 2012 SIP as part of our long-term incentive compensation program, which are similar to RSUs in that they are based on the price of WhiteWave stock and vest ratably over a three-year period, but are cash-settled based upon the value of WhiteWave stock at each vesting period. The fair value of the awards was re-measured at each reporting period. As of March 31, 2016 all phantom shares had been cash settled.
Stock Appreciation Rights
We previously granted SARs under the 2012 SIP as part of our long-term incentive compensation program, which are similar to stock options in that they are based on the price of WhiteWave stock and vest ratably over a three-year period, but are cash-settled based upon the value of WhiteWave stock at the exercise date. We have not granted any SARs since 2013 and all outstanding SARs are fully vested.
The fair value of the awards is re-measured at each reporting period. A liability has been recorded in current liabilities in our consolidated balance sheets totaling $1.9 million and $2.7 million as of December 31, 2016 and 2015, respectively. The following table summarizes SAR activity during the year ended December 31, 2016:
Number of SARs | Weighted average exercise price | Weighted average contractual life in years | Aggregate intrinsic value | |||||||||
SARs outstanding at January 1, 2016 (1) | 122,031 | $ | 16.45 | |||||||||
Granted | — | — | ||||||||||
Forfeited and canceled(2) | — | — | ||||||||||
Exercised | (74,397 | ) | 16.44 | |||||||||
SARs outstanding at December 31, 2016 (1) | 47,634 | $ | 16.45 | 5.91 | $ | 1,864,760 | ||||||
SARs vested and expected to vest at December 31, 2016 | 47,634 | $ | 16.45 | 5.91 | $ | 1,864,760 | ||||||
SARs exercisable at December 31, 2016 | 47,634 | $ | 16.45 | 5.91 | $ | 1,864,760 | ||||||
___________________________
F- 31
(1) | Non-vested SARs as of December 31, 2016 and 2015 were 0 and 23,796, respectively. |
(2) | Pursuant to the terms of the 2012 SIP, SARs that are canceled or forfeited may be available for future grants. |
12. Accumulated Other Comprehensive Loss
The changes in accumulated other comprehensive loss by component for the years ended December 31, 2016, 2015, and 2014 were as follows (net of taxes):
Derivative instruments (1) | Defined benefit pension plan (2) | Foreign currency translation adjustment | Total | ||||||||||||
(In thousands) | |||||||||||||||
Balance at January 1, 2016 | $ | 505 | $ | (761 | ) | $ | (131,278 | ) | $ | (131,534 | ) | ||||
Other comprehensive income (loss) before reclassifications | 400 | (1,683 | ) | (28,745 | ) | (30,028 | ) | ||||||||
Amounts reclassified from accumulated other comprehensive loss | (51 | ) | 4 | — | (47 | ) | |||||||||
Other comprehensive income (loss), net of taxes of $576 | 349 | (1,679 | ) | (28,745 | ) | (30,075 | ) | ||||||||
Balance at December 31, 2016 | $ | 854 | $ | (2,440 | ) | $ | (160,023 | ) | $ | (161,609 | ) | ||||
Derivative instruments (1) | Defined benefit pension plan (2) | Foreign currency translation adjustment | Total | ||||||||||||
(In thousands) | |||||||||||||||
Balance at January 1, 2015 | $ | 774 | $ | (2,050 | ) | $ | (59,842 | ) | $ | (61,118 | ) | ||||
Other comprehensive income (loss) before reclassifications | (1,791 | ) | 1,374 | (71,436 | ) | (71,853 | ) | ||||||||
Amounts reclassified from accumulated other comprehensive loss | 1,522 | (85 | ) | — | 1,437 | ||||||||||
Other comprehensive income (loss), net of taxes of ($321) | (269 | ) | 1,289 | (71,436 | ) | (70,416 | ) | ||||||||
Balance at December 31, 2015 | $ | 505 | $ | (761 | ) | $ | (131,278 | ) | $ | (131,534 | ) | ||||
Derivative instruments (1) | Defined benefit pension plan (2) | Foreign currency translation adjustment | Total | ||||||||||||
(In thousands) | |||||||||||||||
Balance at January 1, 2014 | $ | 205 | $ | (793 | ) | $ | (7,852 | ) | $ | (8,440 | ) | ||||
Other comprehensive loss before reclassifications | (183 | ) | (2,080 | ) | (51,990 | ) | (54,253 | ) | |||||||
Amounts reclassified from accumulated other comprehensive loss | 752 | 823 | — | 1,575 | |||||||||||
Other comprehensive income (loss), net of taxes of $406 | 569 | (1,257 | ) | (51,990 | ) | (52,678 | ) | ||||||||
Balance at December 31, 2014 | $ | 774 | $ | (2,050 | ) | $ | (59,842 | ) | $ | (61,118 | ) | ||||
___________________________
(1) | The accumulated other comprehensive loss reclassification components affect cost of sales and selling, distribution and marketing. See Note 10 “Derivative Financial Instruments and Fair Value Measurement.” |
(2) | The accumulated other comprehensive loss reclassification components are primarily related to amortization of unrecognized actuarial losses which is included in the computation of net periodic pension cost. See Note 13 “Employee Retirement Plans.” |
13. Employee Retirement Plans
Substantially all full-time union and non-union employees who have completed one or more years of service and have met other requirements pursuant to the plans were eligible to participate in one or more of our plans. In addition, we contribute to one multiemployer pension plan on behalf of our employees. During 2016, 2015, and 2014, our retirement plans expenses were as follows:
F- 32
Year ended December 31, | |||||||||||
2016 | 2015 | 2014 | |||||||||
(In thousands) | |||||||||||
Defined contribution plans | $ | 6,588 | $ | 4,877 | $ | 3,397 | |||||
Defined benefit plans | 1,755 | 1,776 | 951 | ||||||||
Multiemployer pension and certain union plans | 1,834 | 1,820 | 1,758 | ||||||||
Total | $ | 10,177 | $ | 8,473 | $ | 6,106 | |||||
Defined Contribution Plans
The WhiteWave Foods Company 401(k) Plan allows certain of our non-union personnel to participate in a savings plan sponsored by the Company. This plan provides for contributions by the participants of between 1% and 20% from January 1, 2014 to March 31, 2014 and between 1% and 50% from April 1, 2014 to December 31, 2016 and provides for matching contributions by the employer up to 4% of a participant’s annual compensation. In addition, certain union hourly employees are participants in the plan, which provide for employer matching contributions in various amounts ranging from 3% to 5% per pay period per participant.
In 2014, our Earthbound Farm subsidiary maintained a separate 401(k) plan that provided for contributions by the participants between 1% and 60% and safe harbor matching contributions by the employer of up to 4% of participant’s annual compensation. Earthbound's 401(k) plan was merged into WhiteWave’s 401(k) plan as of January 1, 2015. As of December 31, 2016, we had no other material defined contribution plans.
Alpro Defined Benefit Plans
We have separate, stand-alone defined benefit pension plans. The benefits under our Alpro defined benefit plans are based on years of service and employee compensation. Our funding policy is to contribute annually the minimum amount required under local regulations plus additional amounts as management deems appropriate.
Included in accumulated other comprehensive loss at December 31, 2016, 2015, and 2014 are the following amounts that have not yet been recognized in net periodic pension cost:
December 31, | ||||||||
2016 | 2015 | 2014 | ||||||
(In thousands) | ||||||||
Unrecognized actuarial losses and other, net of tax of $1,239, $383 and $1,041 | 2,427 | 748 | 2,039 | |||||
The prior service costs and actuarial losses included in accumulated other comprehensive loss and expected to be recognized in net periodic pension cost during the year ended December 31, 2017 are not material.
The reconciliation of the beginning and ending balances of the projected benefit obligation and the fair value of plan assets for the years ended December 31, 2016 and 2015, and the funded status of the plans at December 31, 2016 and 2015, is as follows:
F- 33
Year ended December 31, | |||||||
2016 | 2015 | ||||||
(In thousands) | |||||||
Change in Benefit Obligation: | |||||||
Benefit obligation at beginning of the year | $ | 15,311 | $ | 16,735 | |||
Service cost | 1,650 | 1,630 | |||||
Interest cost | 388 | 310 | |||||
Actuarial (gain)/loss | 2,946 | (1,571 | ) | ||||
Benefits paid | (291 | ) | (58 | ) | |||
Expenses paid | (17 | ) | (17 | ) | |||
Exchange rate changes | (723 | ) | (1,718 | ) | |||
Benefit obligation, end of year | 19,264 | 15,311 | |||||
Change in Plan Assets: | |||||||
Fair value of plan assets at beginning of year | 10,631 | 10,401 | |||||
Actual return on plan assets | 522 | 263 | |||||
Employer contributions to plan | 1,115 | 1,134 | |||||
Benefits paid | (291 | ) | (58 | ) | |||
Expenses paid | (17 | ) | (17 | ) | |||
Exchange rate changes | (406 | ) | (1,092 | ) | |||
Fair value of plan assets, end of year | 11,554 | 10,631 | |||||
Funded status at end of year | $ | (7,710 | ) | $ | (4,680 | ) | |
The underfunded status of the plans of $7.7 million at December 31, 2016 is recognized in our consolidated balance sheet in other long-term liabilities. We do not expect any plan assets to be returned to us during the year ended December 31, 2017. We expect to contribute $1.3 million to the pension plans in 2017.
A summary of our key actuarial assumptions used to determine benefit obligations as of December 31, 2016 and 2015 is as follows:
Year ended December 31, | |||
2016 | 2015 | ||
Weighted average discount rate | 1.75% | 2.50% | |
Rate of compensation increase | 3.92% | 3.92% | |
A summary of our key actuarial assumptions used to determine net periodic benefit cost for 2016, 2015, and 2014 is as follows:
Year ended December 31, | |||||
2016 | 2015 | 2014 | |||
Weighted average discount rate | 2.50% | 2.03% | 3.79% | ||
Expected return on assets | 2.52% | 2.50% | 3.79% | ||
Rate of compensation increase | 3.92% | 3.92% | 3.87% | ||
F- 34
Year ended December 31, | |||||||||||
2016 | 2015 | 2014 | |||||||||
(In thousands) | |||||||||||
Components of net periodic benefit cost: | |||||||||||
Service cost | $ | 1,650 | $ | 1,630 | $ | 1,636 | |||||
Interest cost | 388 | 310 | 545 | ||||||||
Expected return on plan assets | (287 | ) | (251 | ) | (407 | ) | |||||
Amortization: | |||||||||||
Unrecognized net loss and other | 4 | 87 | 5 | ||||||||
Curtailment gain | — | — | (690 | ) | |||||||
Settlement gain | — | — | (138 | ) | |||||||
Net periodic benefit cost | $ | 1,755 | $ | 1,776 | $ | 951 | |||||
The overall expected long-term rate of return on plan assets is a weighted-average expectation based on the targeted and expected portfolio composition. We consider historical performance and current benchmarks to arrive at expected long-term rates of return in each asset category.
Pension plans with an accumulated benefit obligation in excess of plan assets are as follows:
Year ended December 31, | |||||||
2016 | 2015 | ||||||
(In thousands) | |||||||
Projected benefit obligation | $ | 19,264 | $ | 15,311 | |||
Accumulated benefit obligation | 13,866 | 11,585 | |||||
Fair value of plan assets | 11,554 | 10,631 | |||||
The weighted average discount rate reflects the rate at which our defined benefit plan obligations could be effectively settled. The rate uses a model that reflects a bond yield curve constructed from high-quality corporate or foreign government bonds, for which the timing of cash outflows approximate the estimated payments. The weighted average discount rate was decreased from 2.5% at December 31, 2015 to 1.75% at December 31, 2016, which will increase the net periodic benefit cost in 2017.
At December 31, 2016, our qualified pension plan investments are comprised of qualifying insurance policies and the guaranteed premiums are invested in the general assets of the insurance company. The funding policy is to contribute assets at least equal in amount to regulatory minimum requirements. Funding is based on legal requirements, tax considerations, and investment opportunities. The mortality tables utilized within the 2016 valuation included the following: Belgium - Standard official tables used MR/FR, Germany - Richttafeln 2005 G of Dr. Klaus Heubeck, Netherlands - Prognosetafel AG 2016 based on income class high-middle.
Estimated pension plan benefit payments to our participants for the next ten years are as follows (in thousands):
2017 | $ | 99 | |
2018 | 224 | ||
2019 | 1,922 | ||
2020 | 179 | ||
2021 | 465 | ||
Next five years | 3,145 | ||
Fair value is an exit price, representing the amount that would be received to sell an asset or paid to transfer a liability in an orderly transaction between market participants. As such, fair value is a market-based measurement that should be determined based on assumptions that market participants would use in pricing an asset or liability. As a basis for considering assumptions, we follow a three-tier fair value hierarchy, which prioritizes the inputs used in measuring fair value of our defined benefit plans’ consolidated assets. We classify the qualifying insurance policies as Level 3 as there is little or no market data for the unobservable inputs, which requires development of assumptions. The qualifying insurance policies are valued at the amount guaranteed by the
F- 35
insurer to pay out the insured benefits. The funding policy is to contribute assets at least equal in amount to regulatory minimum requirements. Funding is based on legal requirements, tax considerations, and investment opportunities. See Note 10 “Derivative Financial Instruments and Fair Value Measurement.”
A reconciliation of the change in the fair value measurement of the defined benefit plans’ consolidated assets using significant unobservable inputs (Level 3) during the years ended December 31, 2016 and 2015 is as follows:
Consolidated Assets | |||
(In thousands) | |||
Balance at January 1, 2015 | $ | 10,401 | |
Actual return on plan assets relating to instruments still held at reporting date | 263 | ||
Purchases, sales and settlements (net) | 1,059 | ||
Exchange rate changes | (1,092 | ) | |
Balance at December 31, 2015 | 10,631 | ||
Actual return on plan assets relating to instruments still held at reporting date | 522 | ||
Purchases, sales and settlements (net) | 807 | ||
Exchange rate changes | (406 | ) | |
Balance at December 31, 2016 | $ | 11,554 | |
Multiemployer Pension Plan
We contribute to a multiemployer pension plan that covers approximately 250 of our union employees. This plan is administered by a board of trustees composed of labor representatives and the management of the participating companies. The risks of participating in a multiemployer plan are different from a single-employer plan in the following aspects:
• | assets contributed to a multiemployer plan by one employer may be used to provide benefits to employees of other participating employers; |
• | if a participating employer stops contributing to the plan, the unfunded obligations of the plan may be borne by the remaining participating employers; and |
• | if we choose to stop participating in our multiemployer plan, we may be required to pay the plan an amount based on the underfunded status of the plan, referred to as a withdrawal liability. |
At this time, we have not established any significant liabilities because withdrawal from this plan is not probable or reasonably possible.
Our participation in the multiemployer plan for the year ended December 31, 2016 is outlined in the table below. Unless otherwise noted, the most recent Pension Protection Act (“PPA”) Zone Status available in 2016 and 2015 is for the plan’s year-end at December 31, 2015 and December 31, 2014, respectively. The zone status is based on information that we obtained from the plan’s Form 5500, which is available in the public domain and is certified by the plan’s actuary. Among other factors, plans in the red zone are generally less than 65% funded, plans in the yellow zone are less than 80% funded, and plans in the green zone are at least 80% funded. The “FIP/RP Status Pending/Implemented” column indicates plans for which a funding improvement plan (“FIP”) or a rehabilitation plan (“RP”) is either pending or has been implemented. Federal law requires that plans classified in the yellow zone or red zone adopt a funding improvement plan or rehabilitation plan, respectively, in order to improve the financial health of the plan. The “Extended Amortization Provisions” column indicates plans which have elected to utilize the special 30-year amortization rules provided by the Pension Relief Act of 2010 to amortize its losses from 2008 as a result of turmoil in the financial markets. The last column in the table lists the expiration date of the collective-bargaining agreement to which the plan is subject.
Pension fund | Employer identification number | Pension plan number | PPA Zone status | FIP/RP status pending/ implemented | Extended amortization provisions | Expiration date of associated collective-bargaining agreement | |||||||
2016 | 2015 | ||||||||||||
Western Conference of Teamsters Pension Plan(1) | 91-6145047 | 001 | Green | Green | N/A | No | February 2020 | ||||||
F- 36
___________________________
(1) | We are party to one collective bargaining agreement in this multiemployer Western Conference of Teamsters Pension Plan which requires contributions. We are also party to two other collective bargaining agreements whose defined contribution plans are 401(k) plans that require matching contributions. These agreements cover a large number of employee participants and expire in August 2019 & January 2022. |
Information regarding our contributions to our multiemployer pension plan is shown in the table below. There are no changes that materially affected the comparability of our contributions to the plan during the years ended December 31, 2016, 2015, and 2014 (in thousands).
Employer identification number | Pension plan number | The WhiteWave Foods Company | Surcharge imposed | ||||||||||||||
Pension fund | 2016 | 2015 | 2014 | ||||||||||||||
Western Conference of Teamsters Pension Plan | 91-6145047 | 001 | $ | 1,834 | $ | 1,820 | $ | 1,758 | No | ||||||||
During the 2016, 2015, and 2014 plan years, our contributions did not exceed 5% of total plan contributions.
Deferred Compensation Plans
We sponsor two deferred compensation plans, Pre-2005 Executive Deferred Compensation Plan and Post-2004 Executive Deferred Compensation Plan, under which certain employees with a base compensation of at least $150,000 historically may elect to defer receiving payment for a portion of their salary and bonus until periods after their respective retirements or upon separation from service. The amounts deferred are partially funded and are unsecured obligations of the Company, receiving no preferential standing. The participants in these plans may choose from a number of externally managed mutual fund investments, money market funds and stocks and their investment balances track the rates of return for these accounts. Amounts payable, including accrued deemed interest, totaled $5.8 million and $4.8 million at December 31, 2016 and 2015, respectively, which were included in other long-term liabilities in the consolidated balance sheets. The assets related to these plans are primarily invested in money market mutual funds and are recorded at fair value. We classify these assets as Level 2 as fair value can be corroborated based on quoted market prices for identical or similar instruments in markets that are not active. See Note 10 “Derivative Financial Instruments and Fair Value Measurement.”
14. Commitments and Contingencies
Lease and Purchase Obligations
We lease certain property, plant, and equipment used in our operations under both capital and operating lease agreements. Such operating leases, which are primarily for operating facilities, office space, and equipment, have lease terms ranging from one to 14 years. Rent expense was $37.9 million, $34.2 million, and $16.7 million for the years ended December 31, 2016, 2015, and 2014, respectively. The Company leases certain operating facilities and equipment under capital lease arrangements. A schedule of future minimum payments due under our capital lease arrangements is included at Note 9 "Debt and Capital Lease Obligations". These assets are included in property, plant, and equipment, net on the consolidated balance sheets.
Future minimum payments at December 31, 2016, under non-cancelable operating leases with terms in excess of one year are summarized below:
Operating leases | |||
(In thousands) | |||
2017 | $ | 32,139 | |
2018 | 25,137 | ||
2019 | 14,255 | ||
2020 | 8,219 | ||
2021 | 7,069 | ||
Thereafter | 12,036 | ||
Total minimum lease payments | $ | 98,855 | |
We have entered into various contracts, in the normal course of business, obligating us to purchase minimum quantities of raw materials used in our production and distribution processes, including soybeans, almonds, and organic raw milk. We enter
F- 37
into these contracts from time to time to ensure a sufficient supply of raw materials. In addition, we have contractual obligations to purchase various services that are part of our production and distribution processes.
Litigation, Investigations, and Audits
The Company is involved in various litigation, investigations, and audit proceedings in the normal course of business. It is management’s opinion, after consultation with counsel and a review of the facts, that a material adverse effect on the financial position, liquidity, results of operations, or cash flows of the Company is not probable or reasonably possible.
15. Segment and Customer Information
Effective January 1, 2016, we report results of operations through two reportable segments, Americas Foods & Beverages, and Europe Foods & Beverages. This reporting structure aligns with the way our Chief Operating Decision Maker ("CODM"), our CEO, monitors operating performance, allocates resources, and deploys capital. In 2015, we reported results of operations through three reportable segments: Americas Foods & Beverages, Americas Fresh Foods and Europe Foods & Beverages. In connection with our management restructure that was effective in early 2016, we combined the historical Americas Foods & Beverages and Americas Fresh Foods segments into a single Americas Foods & Beverages segment. Accordingly, prior year segment data has been recast to reflect this new segment structure.
The Americas Foods & Beverages segment offers products in the plant-based foods and beverages, coffee creamers and beverages, premium dairy products and organic produce categories throughout North America. Our Europe Foods & Beverages segment offers plant-based food and beverage products throughout Europe. We sell our products to a variety of customers, including grocery stores, mass merchandisers, club stores, health food stores and convenience stores, as well as various away-from-home channels, including foodservice outlets, across North America and Europe. We sell our products in North America and Europe primarily through our direct sales force, independent brokers, regional brokers and distributors. We utilize twelve manufacturing plants, multiple distribution centers, and three strategic co-packers across North America. Additionally, we have three plants across Europe in the United Kingdom, Belgium and France, each supported by an integrated supply chain. We also utilize third-party co-packers across Europe for certain products.
We evaluate the performance of our segments based on net sales, gross profit and operating income. The amounts in the following tables are obtained from reports used by our chief operating decision maker. There are no significant non-cash items reported in segment profit or loss other than depreciation and amortization.
Expense related to share-based compensation has not been allocated to our segments and is reflected entirely within the caption “Corporate and other.”
The following table presents the summarized income statement amounts by segment:
F- 38
Year ended December 31, | |||||||||||
2016 | 2015 | 2014 | |||||||||
(In thousands) | |||||||||||
Total net sales: | |||||||||||
Americas Foods & Beverages | $ | 3,619,753 | $ | 3,333,732 | $ | 2,926,108 | |||||
Europe Foods & Beverages | 578,346 | 532,563 | 510,497 | ||||||||
Total net sales | $ | 4,198,099 | $ | 3,866,295 | $ | 3,436,605 | |||||
Total gross profit: | |||||||||||
Americas Foods & Beverages | 1,209,306 | 1,089,459 | 934,360 | ||||||||
Europe Foods & Beverages | 243,590 | 233,806 | 218,804 | ||||||||
Total gross profit | 1,452,896 | 1,323,265 | 1,153,164 | ||||||||
Operating income: | |||||||||||
Americas Foods & Beverages | $ | 438,496 | $ | 359,311 | $ | 311,920 | |||||
Europe Foods & Beverages | 69,153 | 67,506 | 52,673 | ||||||||
Total reportable segment operating income | 507,649 | 426,817 | 364,593 | ||||||||
Corporate and other | (105,900 | ) | (94,611 | ) | (97,907 | ) | |||||
Total operating income | $ | 401,749 | $ | 332,206 | $ | 266,686 | |||||
Other expense: | |||||||||||
Interest expense | $ | 69,183 | $ | 58,127 | $ | 36,972 | |||||
Other expense, net | 5,381 | 6,343 | 5,266 | ||||||||
Income before income taxes | $ | 327,185 | $ | 267,736 | $ | 224,448 | |||||
Depreciation and amortization: | |||||||||||
Americas Foods & Beverages | $ | 111,416 | $ | 98,093 | $ | 88,061 | |||||
Europe Foods & Beverages | 25,080 | 19,734 | 21,143 | ||||||||
Corporate and other | 2,318 | 2,192 | 1,363 | ||||||||
Total depreciation and amortization | $ | 138,814 | $ | 120,019 | $ | 110,567 | |||||
The following tables present sales amounts by product categories:
Year ended December 31, | |||||||||||
2016 | 2015 | 2014 | |||||||||
(In thousands) | |||||||||||
Total net sales: | |||||||||||
Americas Foods & Beverages | |||||||||||
Plant-based food and beverages | $ | 1,065,581 | $ | 919,793 | $ | 715,667 | |||||
Coffee creamers and beverages | 1,199,015 | 1,090,018 | 990,998 | ||||||||
Premium dairy | 812,529 | 758,046 | 644,160 | ||||||||
Fresh foods | 542,628 | 565,875 | 575,283 | ||||||||
Americas Foods & Beverages net sales | 3,619,753 | 3,333,732 | 2,926,108 | ||||||||
Europe Foods & Beverages | |||||||||||
Plant-based food and beverages | 578,346 | 532,563 | 510,497 | ||||||||
Europe Foods & Beverages net sales | 578,346 | 532,563 | 510,497 | ||||||||
Total net sales | $ | 4,198,099 | $ | 3,866,295 | $ | 3,436,605 | |||||
The following tables present assets, long-lived assets, and capital expenditures by segment:
F- 39
As of December 31, | |||||||||||
2016 | 2015 | 2014 | |||||||||
(In thousands) | |||||||||||
Assets: | |||||||||||
Americas Foods & Beverages | $ | 3,727,685 | $ | 3,555,988 | $ | 2,648,735 | |||||
Europe Foods & Beverages | 665,190 | 605,843 | 561,852 | ||||||||
Corporate | 76,013 | 67,038 | 108,480 | ||||||||
Total | $ | 4,468,888 | $ | 4,228,869 | $ | 3,319,067 | |||||
Long-lived Assets: | |||||||||||
Americas Foods & Beverages | $ | 977,491 | $ | 894,232 | $ | 795,697 | |||||
Europe Foods & Beverages | 310,475 | 236,918 | 184,506 | ||||||||
Corporate | 6,744 | 6,371 | 13,004 | ||||||||
Total | $ | 1,294,710 | $ | 1,137,521 | $ | 993,207 | |||||
Year ended December 31, | |||||||||||
2016 | 2015 | 2014 | |||||||||
(In thousands) | |||||||||||
Capital expenditures: | |||||||||||
Americas Foods & Beverages | $ | 179,795 | $ | 172,296 | $ | 237,120 | |||||
Europe Foods & Beverages | 108,685 | 89,000 | 62,147 | ||||||||
Corporate | 2,328 | 378 | 3,007 | ||||||||
Total | $ | 290,808 | $ | 261,674 | $ | 302,274 | |||||
Significant Customers
The Company had a single customer that represented 13.3%, 13.7%, and 14.6% of our consolidated net sales in 2016, 2015, and 2014, respectively. Sales to this customer were primarily included in our Americas Foods & Beverages segment.
16. Earnings Per Share
Basic earnings per share is based on the weighted average number of common shares outstanding during each period. Diluted earnings per share is based on the weighted average number of common shares outstanding and the effect of all dilutive common stock equivalents outstanding during each period.
The following table reconciles the numerators and denominators used in the computations of both basic and diluted earnings per share:
F- 40
Year ended December 31, | |||||||||||
2016 | 2015 | 2014 | |||||||||
(In thousands, except share and per share data) | |||||||||||
Basic earnings per share computation: | |||||||||||
Numerator: | |||||||||||
Net income | $ | 214,554 | $ | 168,393 | $ | 140,185 | |||||
Denominator: | |||||||||||
Weighted average common shares | 176,984,906 | 175,511,811 | 174,013,700 | ||||||||
Basic earnings per share | $ | 1.21 | $ | 0.96 | $ | 0.81 | |||||
Diluted earnings per share computation: | |||||||||||
Numerator: | |||||||||||
Net income | $ | 214,554 | $ | 168,393 | $ | 140,185 | |||||
Denominator: | |||||||||||
Weighted average common shares — basic | 176,984,906 | 175,511,811 | 174,013,700 | ||||||||
Stock option conversion(1) | 3,544,508 | 3,905,133 | 3,268,052 | ||||||||
Stock units(2) | 644,965 | 668,005 | 668,164 | ||||||||
Weighted average common shares — diluted | 181,174,379 | 180,084,949 | 177,949,916 | ||||||||
Diluted earnings per share | $ | 1.18 | $ | 0.94 | $ | 0.79 | |||||
(1) Anti-dilutive options excluded | 91,137 | 387,325 | 3,599 | ||||||||
(2) Anti-dilutive RSUs excluded | 350 | 4,872 | 1,344 | ||||||||
17. Supplemental Guarantor Financial Information
In September 2014, we issued debt securities that are guaranteed by certain of our 100% owned subsidiaries. In accordance with Rule 3−10 of Regulation S−X promulgated under the Securities Act of 1933, the following condensed consolidating financial statements present the financial position, results of operations and cash flows of The WhiteWave Foods Company (referred to as “Parent” for the purpose of this note only), the combined guarantor subsidiaries, the combined non-guarantor subsidiaries and elimination adjustments necessary to arrive at the information for the Parent, guarantor subsidiaries and non-guarantor subsidiaries on a consolidated basis. Investments in subsidiaries are accounted for using the equity method for this presentation. All guarantors of our debt securities are also guarantors for our senior secured credit facilities. The guarantee is full and unconditional and joint and several. Our senior secured credit facilities are secured by security interest and liens on substantially all of our assets and the assets of our domestic subsidiaries and is presented in the Parent column of the accompanying condensed consolidating balance sheets as of December 31, 2016 and December 31, 2015.
The following condensed consolidating financial information presents the balance sheets as of December 31, 2016 and 2015, and the statements of comprehensive income and cash flows for each of the three years ended December 31, 2016, 2015, and 2014 for the Parent, guarantor subsidiaries and non-guarantor subsidiaries and elimination adjustments.
F- 41
Condensed Consolidating Balance Sheets
December 31, 2016 | ||||||||||||||||||||
Parent | Guarantor Subsidiaries | Non-Guarantor Subsidiaries | Eliminations | Consolidated Total | ||||||||||||||||
(In thousands) | ||||||||||||||||||||
ASSETS | ||||||||||||||||||||
Current assets: | ||||||||||||||||||||
Cash and cash equivalents | $ | 3 | $ | 2,555 | $ | 43,270 | $ | — | $ | 45,828 | ||||||||||
Trade receivables, net of allowance | 1,189 | 204,503 | 78,006 | — | 283,698 | |||||||||||||||
Inventories | — | 251,405 | 51,265 | (6,310 | ) | 296,360 | ||||||||||||||
Prepaid expenses and other current assets | 34,148 | 22,317 | 21,590 | — | 78,055 | |||||||||||||||
Intercompany receivables | 1,969,714 | 885,233 | — | (2,854,947 | ) | — | ||||||||||||||
Total current assets | 2,005,054 | 1,366,013 | 194,131 | (2,861,257 | ) | 703,941 | ||||||||||||||
Equity method investments | 1,265 | — | 18,012 | — | 19,277 | |||||||||||||||
Investment in consolidated subsidiaries | 2,435,711 | 966,825 | — | (3,402,536 | ) | — | ||||||||||||||
Property, plant, and equipment, net | 6,596 | 965,706 | 322,408 | — | 1,294,710 | |||||||||||||||
Identifiable intangible and other assets, net | 43,309 | 656,355 | 365,275 | (30,046 | ) | 1,034,893 | ||||||||||||||
Goodwill | — | 982,922 | 433,145 | — | 1,416,067 | |||||||||||||||
Total Assets | $ | 4,491,935 | $ | 4,937,821 | $ | 1,332,971 | $ | (6,293,839 | ) | $ | 4,468,888 | |||||||||
LIABILITIES AND SHAREHOLDERS' EQUITY | ||||||||||||||||||||
Current liabilities: | ||||||||||||||||||||
Accounts payable and accrued expenses | $ | 44,454 | $ | 336,027 | $ | 158,602 | $ | — | $ | 539,083 | ||||||||||
Current portion of debt and capital lease obligations | 45,000 | 1,394 | 12,191 | — | 58,585 | |||||||||||||||
Income taxes payable | — | — | 2,973 | — | 2,973 | |||||||||||||||
Intercompany payables | 885,233 | 1,929,060 | 40,654 | (2,854,947 | ) | — | ||||||||||||||
Total current liabilities | 974,687 | 2,266,481 | 214,420 | (2,854,947 | ) | 600,641 | ||||||||||||||
Long-term debt and capital lease obligations, net of debt issuance costs | 2,062,907 | 18,849 | — | — | 2,081,756 | |||||||||||||||
Deferred income taxes | — | 214,497 | 119,896 | (30,046 | ) | 304,347 | ||||||||||||||
Other long-term liabilities | 23,645 | 2,283 | 25,520 | — | 51,448 | |||||||||||||||
Total liabilities | 3,061,239 | 2,502,110 | 359,836 | (2,884,993 | ) | 3,038,192 | ||||||||||||||
Total shareholders' equity | 1,430,696 | 2,435,711 | 973,135 | (3,408,846 | ) | 1,430,696 | ||||||||||||||
Total Liabilities and Shareholders' Equity | $ | 4,491,935 | $ | 4,937,821 | $ | 1,332,971 | $ | (6,293,839 | ) | $ | 4,468,888 | |||||||||
F- 42
Condensed Consolidating Balance Sheets
December 31, 2015 | ||||||||||||||||||||
Parent | Guarantor Subsidiaries | Non-Guarantor Subsidiaries | Eliminations | Consolidated Total | ||||||||||||||||
(In thousands) | ||||||||||||||||||||
ASSETS | ||||||||||||||||||||
Current assets: | ||||||||||||||||||||
Cash and cash equivalents | $ | — | $ | 2,282 | $ | 36,328 | $ | — | $ | 38,610 | ||||||||||
Trade receivables, net of allowance | 2,649 | 200,808 | 54,091 | — | 257,548 | |||||||||||||||
Inventories | — | 232,757 | 46,755 | (8,775 | ) | 270,737 | ||||||||||||||
Prepaid expenses and other current assets | 15,442 | 11,070 | 13,270 | — | 39,782 | |||||||||||||||
Intercompany receivables | 1,878,299 | 686,469 | 37,962 | (2,602,730 | ) | — | ||||||||||||||
Total current assets | 1,896,390 | 1,133,386 | 188,406 | (2,611,505 | ) | 606,677 | ||||||||||||||
Equity method investments | 2,983 | — | 27,789 | — | 30,772 | |||||||||||||||
Investment in consolidated subsidiaries | 2,156,856 | 943,501 | — | (3,100,357 | ) | — | ||||||||||||||
Property, plant, and equipment, net | 6,169 | 893,594 | 237,758 | — | 1,137,521 | |||||||||||||||
Identifiable intangible and other assets, net | 34,441 | 663,101 | 365,316 | (24,281 | ) | 1,038,577 | ||||||||||||||
Goodwill | — | 991,085 | 424,237 | — | 1,415,322 | |||||||||||||||
Total Assets | $ | 4,096,839 | $ | 4,624,667 | $ | 1,243,506 | $ | (5,736,143 | ) | $ | 4,228,869 | |||||||||
LIABILITIES AND SHAREHOLDERS' EQUITY | ||||||||||||||||||||
Current liabilities: | ||||||||||||||||||||
Accounts payable and accrued expenses | $ | 47,713 | $ | 374,483 | $ | 127,517 | $ | — | $ | 549,713 | ||||||||||
Current portion of debt and capital lease obligations | 45,000 | 1,415 | 5,034 | — | 51,449 | |||||||||||||||
Income taxes payable | — | — | 3,043 | — | 3,043 | |||||||||||||||
Intercompany payables | 710,984 | 1,866,496 | 25,250 | (2,602,730 | ) | — | ||||||||||||||
Total current liabilities | 803,697 | 2,242,394 | 160,844 | (2,602,730 | ) | 604,205 | ||||||||||||||
Long-term debt and capital lease obligations, net of debt issuance costs | 2,058,621 | 20,219 | 100 | — | 2,078,940 | |||||||||||||||
Deferred income taxes | — | 200,642 | 116,965 | (24,281 | ) | 293,326 | ||||||||||||||
Other long-term liabilities | 23,613 | 4,556 | 13,321 | — | 41,490 | |||||||||||||||
Total liabilities | 2,885,931 | 2,467,811 | 291,230 | (2,627,011 | ) | 3,017,961 | ||||||||||||||
Total shareholders' equity | 1,210,908 | 2,156,856 | 952,276 | (3,109,132 | ) | 1,210,908 | ||||||||||||||
Total Liabilities and Shareholders' Equity | $ | 4,096,839 | $ | 4,624,667 | $ | 1,243,506 | $ | (5,736,143 | ) | $ | 4,228,869 | |||||||||
F- 43
Condensed Consolidating Statements of Comprehensive Income
Year ended December 31, 2016 | ||||||||||||||||||||
Parent | Guarantor Subsidiaries | Non-Guarantor Subsidiaries | Eliminations | Consolidated Total | ||||||||||||||||
(In thousands) | ||||||||||||||||||||
Net sales | $ | — | $ | 3,546,361 | $ | 780,849 | $ | (129,111 | ) | $ | 4,198,099 | |||||||||
Cost of sales | — | 2,411,778 | 463,405 | (129,980 | ) | 2,745,203 | ||||||||||||||
Gross profit | — | 1,134,583 | 317,444 | 869 | 1,452,896 | |||||||||||||||
Operating expenses: | ||||||||||||||||||||
Selling, distribution, and marketing | — | 571,533 | 157,987 | — | 729,520 | |||||||||||||||
General and administrative | 95,243 | 147,040 | 79,344 | — | 321,627 | |||||||||||||||
Total operating expenses | 95,243 | 718,573 | 237,331 | — | 1,051,147 | |||||||||||||||
Operating (loss) income | (95,243 | ) | 416,010 | 80,113 | 869 | 401,749 | ||||||||||||||
Other (income) expense: | ||||||||||||||||||||
Interest expense | 67,835 | 981 | 367 | — | 69,183 | |||||||||||||||
Other (income) expense, net | (150,924 | ) | 155,305 | 1,000 | — | 5,381 | ||||||||||||||
Total other (income) expense | (83,089 | ) | 156,286 | 1,367 | — | 74,564 | ||||||||||||||
Income (loss) before income taxes and equity in earnings of subsidiaries | (12,154 | ) | 259,724 | 78,746 | 869 | 327,185 | ||||||||||||||
Income tax expense | 2,451 | 84,965 | 14,994 | — | 102,410 | |||||||||||||||
(Loss) income before loss in equity method investments and equity in earnings of subsidiaries | (14,605 | ) | 174,759 | 63,752 | 869 | 224,775 | ||||||||||||||
Loss in equity method investments | 1,720 | — | 8,501 | — | 10,221 | |||||||||||||||
Equity in earnings of consolidated subsidiaries | 230,879 | 56,120 | — | (286,999 | ) | — | ||||||||||||||
Net income | 214,554 | 230,879 | 55,251 | (286,130 | ) | 214,554 | ||||||||||||||
Other comprehensive loss, net of tax | (30,075 | ) | (30,075 | ) | (30,075 | ) | 60,150 | (30,075 | ) | |||||||||||
Comprehensive income | $ | 184,479 | $ | 200,804 | $ | 25,176 | $ | (225,980 | ) | $ | 184,479 | |||||||||
F- 44
Condensed Consolidating Statements of Comprehensive Income
Year ended December 31, 2015 | ||||||||||||||||||||
Parent | Guarantor Subsidiaries | Non-Guarantor Subsidiaries | Eliminations | Consolidated Total | ||||||||||||||||
(In thousands) | ||||||||||||||||||||
Net sales | $ | — | $ | 3,318,001 | $ | 584,486 | $ | (36,192 | ) | $ | 3,866,295 | |||||||||
Cost of sales | — | 2,241,359 | 334,437 | (32,766 | ) | 2,543,030 | ||||||||||||||
Gross profit | — | 1,076,642 | 250,049 | (3,426 | ) | 1,323,265 | ||||||||||||||
Operating expenses: | ||||||||||||||||||||
Selling, distribution, and marketing | — | 582,859 | 123,065 | — | 705,924 | |||||||||||||||
General and administrative | 84,263 | 137,215 | 63,657 | — | 285,135 | |||||||||||||||
Total operating expenses | 84,263 | 720,074 | 186,722 | — | 991,059 | |||||||||||||||
Operating (loss) income | (84,263 | ) | 356,568 | 63,327 | (3,426 | ) | 332,206 | |||||||||||||
Other (income) expense: | ||||||||||||||||||||
Interest expense | 56,779 | 989 | 359 | — | 58,127 | |||||||||||||||
Other (income) expense, net | (138,816 | ) | 141,279 | 3,880 | — | 6,343 | ||||||||||||||
Total other (income) expense | (82,037 | ) | 142,268 | 4,239 | — | 64,470 | ||||||||||||||
Income (loss) before income taxes and equity in earnings of subsidiaries | (2,226 | ) | 214,300 | 59,088 | (3,426 | ) | 267,736 | |||||||||||||
Income tax (benefit) expense | (4,822 | ) | 81,152 | 11,578 | — | 87,908 | ||||||||||||||
Income before loss in equity method investments and equity in earnings of subsidiaries | 2,596 | 133,148 | 47,510 | (3,426 | ) | 179,828 | ||||||||||||||
Loss in equity method investments | 718 | — | 10,717 | — | 11,435 | |||||||||||||||
Equity in earnings of consolidated subsidiaries | 166,515 | 33,367 | — | (199,882 | ) | — | ||||||||||||||
Net income | 168,393 | 166,515 | 36,793 | (203,308 | ) | 168,393 | ||||||||||||||
Other comprehensive loss, net of tax | (70,416 | ) | (70,416 | ) | (70,416 | ) | 140,832 | (70,416 | ) | |||||||||||
Comprehensive income (loss) | $ | 97,977 | $ | 96,099 | $ | (33,623 | ) | $ | (62,476 | ) | $ | 97,977 | ||||||||
F- 45
Condensed Consolidating Statements of Comprehensive Income
Year ended December 31, 2014 | ||||||||||||||||||||
Parent | Guarantor Subsidiaries | Non-Guarantor Subsidiaries | Eliminations | Consolidated Total | ||||||||||||||||
(In thousands) | ||||||||||||||||||||
Net sales | $ | — | $ | 2,926,108 | $ | 510,497 | $ | — | $ | 3,436,605 | ||||||||||
Cost of sales | — | 1,991,748 | 291,693 | — | 2,283,441 | |||||||||||||||
Gross profit | — | 934,360 | 218,804 | — | 1,153,164 | |||||||||||||||
Operating expenses: | ||||||||||||||||||||
Selling, distribution, and marketing | — | 505,567 | 116,299 | — | 621,866 | |||||||||||||||
General and administrative | 92,122 | 117,938 | 55,618 | — | 265,678 | |||||||||||||||
Asset disposal and exit costs | — | (1,066 | ) | — | — | (1,066 | ) | |||||||||||||
Total operating expenses | 92,122 | 622,439 | 171,917 | — | 886,478 | |||||||||||||||
Operating (loss) income | (92,122 | ) | 311,921 | 46,887 | — | 266,686 | ||||||||||||||
Other (income) expense: | ||||||||||||||||||||
Interest expense | 35,555 | 1,219 | 198 | — | 36,972 | |||||||||||||||
Other (income) expense, net | (131,251 | ) | 134,037 | 2,480 | — | 5,266 | ||||||||||||||
Total other (income) expense | (95,696 | ) | 135,256 | 2,678 | — | 42,238 | ||||||||||||||
Income before income taxes and equity in earnings of subsidiaries | 3,574 | 176,665 | 44,209 | — | 224,448 | |||||||||||||||
Income tax expense | 9,378 | 60,010 | 8,891 | — | 78,279 | |||||||||||||||
Income (loss) before loss in equity method investments and equity in earnings of subsidiaries | (5,804 | ) | 116,655 | 35,318 | — | 146,169 | ||||||||||||||
Loss in equity method investments | — | — | 5,984 | — | 5,984 | |||||||||||||||
Equity in earnings of consolidated subsidiaries | 145,989 | 29,334 | — | (175,323 | ) | — | ||||||||||||||
Net income | 140,185 | 145,989 | 29,334 | (175,323 | ) | 140,185 | ||||||||||||||
Other comprehensive loss, net of tax | (52,678 | ) | (52,678 | ) | (53,247 | ) | 105,925 | (52,678 | ) | |||||||||||
Comprehensive income (loss) | $ | 87,507 | $ | 93,311 | $ | (23,913 | ) | $ | (69,398 | ) | $ | 87,507 | ||||||||
F- 46
Condensed Consolidating Statements of Cash Flows
Year ended December 31, 2016 | |||||||||||||||||||||||
Parent | Guarantor Subsidiaries | Non-Guarantor Subsidiaries | Eliminations | Consolidated Total | |||||||||||||||||||
(In thousands) | |||||||||||||||||||||||
CASH FLOWS FROM OPERATING ACTIVITIES: | |||||||||||||||||||||||
Net cash provided by (used in) operating activities | $ | (7,460 | ) | $ | 192,270 | $ | 131,671 | $ | — | $ | 316,481 | ||||||||||||
CASH FLOWS FROM INVESTING ACTIVITIES: | |||||||||||||||||||||||
Payments for acquisitions, net of cash acquired of $833 | — | (60 | ) | (17,203 | ) | — | (17,263 | ) | |||||||||||||||
Payments for property, plant, and equipment | (2,268 | ) | (176,216 | ) | (112,324 | ) | — | (290,808 | ) | ||||||||||||||
Intercompany contributions | 4,543 | — | — | (4,543 | ) | — | |||||||||||||||||
Proceeds from sale of fixed assets | — | 303 | 7 | — | 310 | ||||||||||||||||||
Net cash provided by (used in) investing activities | 2,275 | (175,973 | ) | (129,520 | ) | (4,543 | ) | (307,761 | ) | ||||||||||||||
CASH FLOWS FROM FINANCING ACTIVITIES: | |||||||||||||||||||||||
Intercompany contributions | — | (14,731 | ) | 10,188 | 4,543 | — | |||||||||||||||||
Repayment of debt | (45,000 | ) | — | — | — | (45,000 | ) | ||||||||||||||||
Payments on capital lease obligations | — | (1,293 | ) | — | — | (1,293 | ) | ||||||||||||||||
Proceeds from revolver line of credit | 831,350 | — | 120,712 | — | 952,062 | ||||||||||||||||||
Payments on revolver line of credit | (785,750 | ) | — | (113,954 | ) | — | (899,704 | ) | |||||||||||||||
Proceeds from exercise of stock options | 10,085 | — | — | — | 10,085 | ||||||||||||||||||
Minimum tax withholding paid on behalf of employees for share-based compensation | (12,992 | ) | — | — | — | (12,992 | ) | ||||||||||||||||
Excess tax benefit from share-based compensation | 8,052 | — | 6 | — | 8,058 | ||||||||||||||||||
Payment of deferred financing costs | (557 | ) | — | — | — | (557 | ) | ||||||||||||||||
Net cash provided by (used in) financing activities | 5,188 | (16,024 | ) | 16,952 | 4,543 | 10,659 | |||||||||||||||||
Effect of exchange rate changes on cash and cash equivalents | — | — | (12,161 | ) | — | (12,161 | ) | ||||||||||||||||
INCREASE IN CASH AND CASH EQUIVALENTS | 3 | 273 | 6,942 | — | 7,218 | ||||||||||||||||||
Cash and cash equivalents, beginning of year | — | 2,282 | 36,328 | — | 38,610 | ||||||||||||||||||
Cash and cash equivalents, end of year | $ | 3 | $ | 2,555 | $ | 43,270 | $ | — | $ | 45,828 | |||||||||||||
F- 47
Condensed Consolidating Statements of Cash Flows
Year ended December 31, 2015 | |||||||||||||||||||||||
Parent | Guarantor Subsidiaries | Non-Guarantor Subsidiaries | Eliminations | Consolidated Total | |||||||||||||||||||
(In thousands) | |||||||||||||||||||||||
CASH FLOWS FROM OPERATING ACTIVITIES: | |||||||||||||||||||||||
Net cash provided by operating activities | $ | 44,087 | $ | 210,307 | $ | 60,912 | $ | — | $ | 315,306 | |||||||||||||
CASH FLOWS FROM INVESTING ACTIVITIES: | |||||||||||||||||||||||
Investment in equity method investments | (701 | ) | — | — | — | (701 | ) | ||||||||||||||||
Payments for acquisitions, net of cash acquired of $8,521 | — | (159,208 | ) | (548,397 | ) | — | (707,605 | ) | |||||||||||||||
Payments for property, plant, and equipment | (178 | ) | (177,074 | ) | (81,236 | ) | — | (258,488 | ) | ||||||||||||||
Intercompany contributions | (674,864 | ) | — | — | 674,864 | — | |||||||||||||||||
Proceeds from sale of fixed assets | — | 2,183 | 6,779 | — | 8,962 | ||||||||||||||||||
Other | — | 346 | — | — | 346 | ||||||||||||||||||
Net cash used in investing activities | (675,743 | ) | (333,753 | ) | (622,854 | ) | 674,864 | (957,486 | ) | ||||||||||||||
CASH FLOWS FROM FINANCING ACTIVITIES: | |||||||||||||||||||||||
Intercompany contributions | — | 126,308 | 548,556 | (674,864 | ) | — | |||||||||||||||||
Proceeds from the issuance of debt | 520,000 | — | — | — | 520,000 | ||||||||||||||||||
Repayment of debt | (15,000 | ) | — | — | — | (15,000 | ) | ||||||||||||||||
Payments on capital lease obligations | — | (1,104 | ) | — | — | (1,104 | ) | ||||||||||||||||
Proceeds from revolver line of credit | 1,232,695 | — | 66,412 | — | 1,299,107 | ||||||||||||||||||
Payments on revolver line of credit | (1,105,695 | ) | — | (61,066 | ) | — | (1,166,761 | ) | |||||||||||||||
Proceeds from exercise of stock options | 14,716 | — | — | — | 14,716 | ||||||||||||||||||
Minimum tax withholding paid on behalf of employees for share-based compensation | (32,556 | ) | — | — | — | (32,556 | ) | ||||||||||||||||
Excess tax benefit from share-based compensation | 21,559 | — | 13 | — | 21,572 | ||||||||||||||||||
Payment of deferred financing costs | (4,063 | ) | — | — | — | (4,063 | ) | ||||||||||||||||
Net cash provided by financing activities | 631,656 | 125,204 | 553,915 | (674,864 | ) | 635,911 | |||||||||||||||||
Effect of exchange rate changes on cash and cash equivalents | — | — | (5,361 | ) | — | (5,361 | ) | ||||||||||||||||
INCREASE (DECREASE) IN CASH AND CASH EQUIVALENTS | — | 1,758 | (13,388 | ) | — | (11,630 | ) | ||||||||||||||||
Cash and cash equivalents, beginning of year | — | 524 | 49,716 | — | 50,240 | ||||||||||||||||||
Cash and cash equivalents, end of year | $ | — | $ | 2,282 | $ | 36,328 | $ | — | $ | 38,610 | |||||||||||||
F- 48
Condensed Consolidating Statements of Cash Flows
December 31, 2014 | |||||||||||||||||||||||
Parent | Guarantor Subsidiaries | Non-Guarantor Subsidiaries | Eliminations | Consolidated Total | |||||||||||||||||||
(In thousands) | |||||||||||||||||||||||
CASH FLOWS FROM OPERATING ACTIVITIES: | |||||||||||||||||||||||
Net cash (used in) provided by operating activities | $ | (6,140 | ) | $ | 230,511 | $ | 60,242 | $ | — | $ | 284,613 | ||||||||||||
CASH FLOWS FROM INVESTING ACTIVITIES: | |||||||||||||||||||||||
Investment in equity method investments | — | (3,000 | ) | (47,285 | ) | — | (50,285 | ) | |||||||||||||||
Payments for acquisitions, net of cash acquired of $7,190 | — | (798,446 | ) | — | — | (798,446 | ) | ||||||||||||||||
Payments for property, plant, and equipment | (42,106 | ) | (191,160 | ) | (59,091 | ) | — | (292,357 | ) | ||||||||||||||
Intercompany contributions | (766,016 | ) | — | — | 766,016 | — | |||||||||||||||||
Proceeds from sale of fixed assets | — | 464 | — | — | 464 | ||||||||||||||||||
Net cash used in investing activities | (808,122 | ) | (992,142 | ) | (106,376 | ) | 766,016 | (1,140,624 | ) | ||||||||||||||
CASH FLOWS FROM FINANCING ACTIVITIES: | |||||||||||||||||||||||
Intercompany contributions | — | 762,526 | 3,490 | (766,016 | ) | — | |||||||||||||||||
Proceeds from the issuance of debt | 1,025,000 | — | — | — | 1,025,000 | ||||||||||||||||||
Repayment of debt | (15,000 | ) | — | — | — | (15,000 | ) | ||||||||||||||||
Payments on capital lease obligations | — | (1,044 | ) | — | — | (1,044 | ) | ||||||||||||||||
Proceeds from revolver line of credit | 625,400 | — | — | — | 625,400 | ||||||||||||||||||
Payments on revolver line of credit | (803,050 | ) | — | — | — | (803,050 | ) | ||||||||||||||||
Proceeds from exercise of stock options | 6,740 | — | — | — | 6,740 | ||||||||||||||||||
Minimum tax withholding paid on behalf of employees for share-based compensation | (11,094 | ) | — | — | — | (11,094 | ) | ||||||||||||||||
Excess tax benefit from shared-based compensation | 4,466 | — | — | — | 4,466 | ||||||||||||||||||
Payment of deferred financing costs | (18,200 | ) | — | — | — | (18,200 | ) | ||||||||||||||||
Net cash provided by financing activities | 814,262 | 761,482 | 3,490 | (766,016 | ) | 813,218 | |||||||||||||||||
Effect of exchange rate changes on cash and cash equivalents | — | — | (8,072 | ) | — | (8,072 | ) | ||||||||||||||||
DECREASE IN CASH AND CASH EQUIVALENTS | — | (149 | ) | (50,716 | ) | — | (50,865 | ) | |||||||||||||||
Cash and cash equivalents, beginning of year | — | 673 | 100,432 | — | 101,105 | ||||||||||||||||||
Cash and cash equivalents, end of year | $ | — | $ | 524 | $ | 49,716 | $ | — | $ | 50,240 | |||||||||||||
18. Quarterly Results of Operations (unaudited)
The following is a summary of our unaudited quarterly results of operations for 2016 and 2015:
F- 49
Quarter | ||||||||||||||||
First | Second | Third | Fourth | |||||||||||||
(In thousands, except share and per share data) | ||||||||||||||||
2016 | ||||||||||||||||
Net sales | $ | 1,039,695 | $ | 1,049,648 | $ | 1,053,598 | $ | 1,055,158 | ||||||||
Gross profit | 353,767 | 370,408 | 381,119 | 347,602 | ||||||||||||
Net income (2) (3) | 42,600 | 51,769 | 58,037 | 62,148 | ||||||||||||
Earnings per common share(1): | ||||||||||||||||
Basic | $ | 0.24 | $ | 0.29 | $ | 0.33 | $ | 0.35 | ||||||||
Diluted | $ | 0.24 | $ | 0.29 | $ | 0.32 | $ | 0.34 | ||||||||
2015 | ||||||||||||||||
Net sales | $ | 911,142 | $ | 923,632 | $ | 1,003,888 | $ | 1,027,633 | ||||||||
Gross profit | 308,575 | 326,158 | 351,131 | 337,401 | ||||||||||||
Net income (2) | 33,347 | 37,444 | 50,022 | 47,580 | ||||||||||||
Earnings per common share(1): | ||||||||||||||||
Basic | $ | 0.19 | $ | 0.21 | $ | 0.28 | $ | 0.28 | ||||||||
Diluted | $ | 0.19 | $ | 0.21 | $ | 0.28 | $ | 0.26 | ||||||||
___________________________
(1) | Earnings per common share calculations for each of the quarters were based on the basic and diluted weighted average number of shares outstanding for each quarter. The sum of the quarters may not necessarily be equal to the full year earnings per common share amount. |
(2) | Net income was negatively impacted by the SAP implementation costs and the related operational issues within the Fresh Foods platform by $8.2 million, $4.3 million and $3.2 million, for the fourth quarter of 2015, and the first and second quarter of 2016, respectively. |
(3) | Net income was negatively impacted by transaction costs related to the planned Merger with Danone by $1.8 million, $4.6 million and $4.4 million, for the second, third and fourth quarter of 2016, respectively. See Note 19 "The Proposed Merger with Danone" for further discussion. |
19. The Proposed Merger with Danone
On July 6, 2016, the Company entered into an Agreement and Plan of Merger (the “Merger Agreement”) with Danone S.A. and July Merger Sub Inc., an indirect wholly-owned subsidiary of Danone (“Merger Sub”), pursuant to which the Company will be acquired by Danone S.A., a leading global food company headquartered in Paris, France.
The Merger Agreement provides that, among other things, Merger Sub will be merged with and into the Company, with the Company continuing as the surviving corporation (the "Merger"). As a result of the Merger, the Company will become a wholly-owned subsidiary of Danone. At the effective time of the Merger, each share of common stock of the Company, par value $0.01 per share, issued and outstanding (other than shares owned by the Company or any of its subsidiaries or Danone or any of its subsidiaries (including Merger Sub), will automatically be canceled for no consideration, and converted into the right to receive $56.25 per share in cash, without interest.
If the Merger Agreement were to be terminated in specified circumstances, the Company would be required to pay Danone a termination fee of $310.0 million.
The closing of the Merger is subject to the satisfaction of customary conditions, including the adoption of the Merger Agreement by the Company’s stockholders; the expiration or termination of all applicable waiting periods under the Hart-Scott-Rodino Antitrust Improvements Act (“HSR Act”) and the Competition Act of Canada; and the approval of the Merger by the European Commission pursuant to the EU Merger Regulation.
On October 4, 2016, our stockholders adopted the Merger Agreement. On September 13, 2016, the Canadian Commissioner of Competition issued an advance ruling certificate, which included a waiver of the parties’ notification requirement in Canada. On December 16, 2016, the parties obtained regulatory clearance of the Merger from the European Commission.
The United States Department of Justice (“DOJ”) continues to review the Merger under the HSR Act. As we previously announced, each of the Company and Danone elected on January 6, 2017 to extend the Long Stop Date under the Merger Agreement by 90 days to facilitate the completion of the DOJ’s review. The Company currently expects the Merger to occur in first quarter 2017, although there can be no assurance regarding timing of completion of regulatory processes.
During the year ended December 31, 2016, the Company incurred $17.4 million of transaction costs and $1.0 million of integration planning costs related to the planned Merger, which were recorded in general and administrative expense in our consolidated statements of income.
F- 50
Item 9. | Changes in and Disagreements with Accountants on Accounting and Financial Disclosure |
None.
Item 9A. | Controls and Procedures |
(a) Disclosure Controls and Procedures
Our Chief Executive Officer and Chief Financial Officer, with assistance from other members of management, evaluated the effectiveness of our disclosure controls and procedures (as defined in Rule 13a-15(e) and 15d-15(e) under the Exchange Act) as of the end of the period covered by this Annual Report on Form 10-K (the “Evaluation Date”) and, based upon such evaluation, have concluded that as of the Evaluation Date, the Company’s disclosure controls and procedures were effective.
(b) Changes in Internal Control over Financial Reporting
There has been no change in the Company’s internal control over financial reporting during the quarter ended December 31, 2016 that has materially affected, or is reasonably likely to materially affect, the Company’s internal control over financial reporting.
(c) Internal Control over Financial Reporting
MANAGEMENT REPORT ON INTERNAL CONTROL OVER FINANCIAL REPORTING
Our management is responsible for establishing and maintaining adequate internal control over financial reporting. Our internal control system was designed to provide reasonable assurance to our management and Board of Directors regarding the preparation and fair presentation of published financial statements.
All internal control systems, no matter how well designed, have inherent limitations. Therefore, even those systems determined to be effective can provide only reasonable assurance with respect to financial statement preparation and presentation.
We have assessed the effectiveness of our internal control over financial reporting as of December 31, 2016. In making this assessment, we used the criteria established in the 2013 Internal Control — Integrated Framework issued by the Committee of Sponsoring Organizations of the Treadway Commission (COSO). Based on our assessment we believe that, as of December 31, 2016, our internal control over financial reporting is effective based on those criteria.
We have excluded from our assessment the internal control over financial reporting at Innovation Packaging and Process, S.A. de C.V., which was acquired on June 2, 2016, and whose financial statements constitute less than 1% of total assets, total net sales, and operating income, respectively, of the consolidated financial statement amounts as of and for the year ended December 31, 2016.
The effectiveness of our internal control over financial reporting as of December 31, 2016 has been attested by the Company’s registered public accounting firm, Deloitte & Touche LLP, as stated in its report, which appears herein.
February 24, 2017
51
REPORT OF INDEPENDENT REGISTERED PUBLIC ACCOUNTING FIRM
To the Board of Directors and Stockholders of
The WhiteWave Foods Company
Denver, Colorado
We have audited the internal control over financial reporting of The WhiteWave Foods Company and subsidiaries (the "Company") as of December 31, 2016, based on criteria established in Internal Control-Integrated Framework (2013) issued by the Committee of Sponsoring Organizations of the Treadway Commission. As described in the Management Report on Internal Control over Financial Reporting, management excluded from its assessment the internal control over financial reporting at Innovation Packaging and Process, S.A. de C.V., which was acquired on June 2, 2016, and whose financial statements constitute less than 1% of total assets, total net sales, and operating income, respectively, of the consolidated financial statement amounts as of and for the year ended December 31, 2016. Accordingly, our audit did not include the internal control over financial reporting at Innovation Packaging and Process, S.A. de C.V. The Company's management is responsible for maintaining effective internal control over financial reporting and for its assessment of the effectiveness of internal control over financial reporting, included in the accompanying Management Report on Internal Control over Financial Reporting. Our responsibility is to express an opinion on the Company's internal control over financial reporting based on our audit.
We conducted our audit in accordance with the standards of the Public Company Accounting Oversight Board (United States). Those standards require that we plan and perform the audit to obtain reasonable assurance about whether effective internal control over financial reporting was maintained in all material respects. Our audit included obtaining an understanding of internal control over financial reporting, assessing the risk that a material weakness exists, testing and evaluating the design and operating effectiveness of internal control based on the assessed risk, and performing such other procedures as we considered necessary in the circumstances. We believe that our audit provides a reasonable basis for our opinion.
A company's internal control over financial reporting is a process designed by, or under the supervision of, the company's principal executive and principal financial officers, or persons performing similar functions, and effected by the company's board of directors, management, and other personnel to provide reasonable assurance regarding the reliability of financial reporting and the preparation of financial statements for external purposes in accordance with generally accepted accounting principles. A company's internal control over financial reporting includes those policies and procedures that (1) pertain to the maintenance of records that, in reasonable detail, accurately and fairly reflect the transactions and dispositions of the assets of the company; (2) provide reasonable assurance that transactions are recorded as necessary to permit preparation of financial statements in accordance with generally accepted accounting principles, and that receipts and expenditures of the company are being made only in accordance with authorizations of management and directors of the company; and (3) provide reasonable assurance regarding prevention or timely detection of unauthorized acquisition, use, or disposition of the company's assets that could have a material effect on the financial statements.
Because of the inherent limitations of internal control over financial reporting, including the possibility of collusion or improper management override of controls, material misstatements due to error or fraud may not be prevented or detected on a timely basis. Also, projections of any evaluation of the effectiveness of the internal control over financial reporting to future periods are subject to the risk that the controls may become inadequate because of changes in conditions, or that the degree of compliance with the policies or procedures may deteriorate.
In our opinion, the Company maintained, in all material respects, effective internal control over financial reporting as of December 31, 2016, based on the criteria established in Internal Control - Integrated Framework (2013) issued by the Committee of Sponsoring Organizations of the Treadway Commission.
We have also audited, in accordance with the standards of the Public Company Accounting Oversight Board (United States), the consolidated financial statements as of and for the year ended December 31, 2016 of the Company and our report dated February 24, 2017 expressed an unqualified opinion on those financial statements.
/s/ DELOITTE & TOUCHE LLP
Denver, Colorado
February 24, 2017
PART III
Item 10. | Directors, Executive Officers and Corporate Governance |
F- 52
We maintain a Code of Ethics that applies to all of our directors, executive officers, and employees. Our Code of Ethics is posted on our corporate website at www.whitewave.com on the "Investor Relations" page under the link "Corporate Governance." Any amendments to or waivers of our Code of Ethics relating to our directors or executive officers that is required to be disclosed also will be be posted on our website.
Information that will be contained in an amendment to this Form 10-K or contained in our proxy statement for our 2017 annual meeting of stockholders is incorporated herein by reference.
Item 11. | Executive Compensation |
Information that will be contained in an amendment to this Form 10-K or contained in our proxy statement for our 2017 annual meeting of stockholders is incorporated herein by reference.
Item 12. | Security Ownership of Certain Beneficial Owners and Management and Related Stockholder Matters |
Information that will be contained in an amendment to this Form 10-K or contained in our proxy statement for our 2017 annual meeting of stockholders is incorporated herein by reference.
Equity Compensation Plan Information Table
We only have one equity compensation plan, The WhiteWave Foods Company Amended and Restated 2012 Stock Incentive Plan (the "2012 Stock Incentive Plan"), which was approved by our stockholders at our 2015 annual meeting of stockholders. The following table contains certain information about the 2012 Stock Incentive Plan as of December 31, 2016.
Plan Category | (a) Number of Securities to be Issued Upon Exercise of Outstanding Options, Warrants and Rights | (b) Weighted-Average Exercise Price of Outstanding Options, Warrants and Rights | (c) Number of Securities Remaining Available for Future Issuance Under Equity Compensation Plans (excluding securities referenced in column (a)) | |||
Equity compensation plans approved by security holders | 10,018,310 (1) | $20.47 (1) | 9,057,201 | |||
Equity compensation plans not approved by security holders | - | - | - | |||
(1) | Includes 768,283 restricted stock units (“RSUs”), 4,156 restricted stock awards (“RSAs”), and 191,624 performance stock units ("PSUs") outstanding under the 2012 Stock Incentive Plan. RSUs, RSAs, and PSUs do not have an exercise price because their value is dependent upon continued employment or service over a period of time and may be settled only for shares of common stock. Accordingly, RSUs, RSAs, and PSUs have been disregarded for purposes of computing the weighted-average exercise price. |
Item 13. | Certain Relationships and Related Transactions, and Director Independence |
Information that will be contained in an amendment to this Form 10-K or contained in our proxy statement for our 2017 annual meeting of stockholders is incorporated herein by reference.
Item 14. | Principal Accountant Fees and Services |
Information that will be contained in an amendment to this Form 10-K or contained in our proxy statement for our 2017 annual meeting of stockholders is incorporated herein by reference.
F- 53
PART IV
Item 15. | Exhibits and Financial Statement Schedules |
(a) Financial Statements, Financial Statement Schedules and Exhibits
The financial statements filed as part of this Annual Report on Form 10-K are listed in the index under Part II, Item 8.
The exhibits required by Item 601 of Regulation S-K which are filed with this report or incorporated by referenced herein, are set forth in the Exhibit Index.
F- 54
SIGNATURES
Pursuant to the requirements of Section 13 or 15(d) of the Securities Exchange Act of 1934, the registrant has duly caused this report to be signed on its behalf by the undersigned, thereunto duly authorized.
THE WHITEWAVE FOODS COMPANY | |
By: | /S/ JAMES T. HAU |
James T. Hau | |
Vice President and Chief Accounting Officer | |
Dated February 24, 2017
Pursuant to the requirements of the Securities Exchange Act of 1934, this report has been signed below by the following persons on behalf of the registrant and in the capacities indicated on February 24, 2017.
Name | Title | |
/S/ GREGG L. ENGLES | Chairman and Chief Executive Officer | |
Gregg L. Engles | ||
/S/ GREGORY S. CHRISTENSON | Chief Financial Officer | |
Gregory S. Christenson | ||
/S/ JAMES T. HAU | Vice President and | |
James T. Hau | Chief Accounting Officer | |
/S/ MICHELLE P. GOOLSBY | Director | |
Michelle P. Goolsby | ||
/S/ STEPHEN L. GREEN | Director | |
Stephen L. Green | ||
/S/ JOSEPH S. HARDIN, JR. | Director | |
Joseph S. Hardin, Jr. | ||
/S/ ANTHONY J. MAGRO | Director | |
Anthony J. Magro | ||
/S/ W. ANTHONY VERNON | Director | |
W. Anthony Vernon | ||
/S/ DOREEN A. WRIGHT | Director | |
Doreen A. Wright | ||
S-1
INDEX TO EXHIBITS
Exhibit Number | Description of Exhibit | |
1 | Underwriting Agreement, dated September 12, 2014, among TheWhiteWave Foods Company, the guarantors named therein and J.P. Morgan Securities LLC, as representative on behalf of the several underwriters named therein (1) | |
2.1 | Agreement and Plan of Merger, dated as of July 6, 2016 by and among The WhiteWave Foods Company, Danone S.A., and July Merger Sub Inc. (2) | |
3.1 | Second Restated Certificate of Incorporation of the Registrant (3) | |
3.2 | By-laws of the Registrant, as amended and restated through February 26, 2014 (4) | |
4.1 | Indenture, dated September 17, 2014, between the Company and Wells Fargo Bank, National Association, as trustee (1) | |
4.2 | First Supplemental Indenture to the Indenture, dated September 17, 2014, among the Company, the guarantors named therein and Wells Fargo Bank, National Association, as trustee (1) | |
4.3* | Second Supplemental Indenture to the Indenture, dated as of January 23, 2015 between the Company and Wells Fargo Bank, National Association, as trustee | |
4.4* | Third Supplemental Indenture to the Indenture, dated as of October 16, 2015 between the Company and Wells Fargo Bank, National Association, as trustee | |
4.5* | Fourth Supplemental Indenture to the Indenture dated November 21, 2016, between the Company and Wells Fargo Bank, National Association, as trustee | |
4.7 | Form of Note for 5.375% Senior Notes due 2022 (included in Exhibit 4.3) (1) | |
Certain instruments defining the rights of holders of long-term debt securities of the Registrant and its subsidiaries are omitted pursuant to Item 601(b)(4)(iii) of Regulation S-K. The Registrant hereby undertakes to furnish to the SEC, upon request, copies of any such instruments. | ||
10.1 | Summary of Terms of Employment Agreement (translated from Dutch) between Alpro Comm. Venn. op aandelen and Bernard Deryckere, dated April 13, 2001 (5) | |
10.2 | Amendment to Employee Agreement (translated from Dutch) between Alpro Comm. Venn. op aandelen and Bernard Deryckere, dated February 4, 2011 (5) | |
10.3 | Employment Agreement between Dean Foods Company, The WhiteWave Foods Company and Gregg L. Engles, dated December 4, 2012 (6) | |
10.4 | Employment Agreement between Dean Foods Company, The WhiteWave Foods Company and Edward F. Fugger, dated December 4, 2012 (6) | |
10.5 | Employment Agreement between Dean Foods Company, The WhiteWave Foods Company and Thomas N. Zanetich, dated December 4, 2012 (6) | |
10.6 | Employment Agreement between Dean Foods Company, The WhiteWave Foods Company and Kelly J. Haecker, dated December 4, 2012 (6) | |
10.7 | Employment Agreement between Dean Foods Company, The WhiteWave Foods Company and Blaine E. McPeak, dated December 4, 2012 (6) | |
10.8 | Employment Agreement between Dean Foods Company, The WhiteWave Foods Company and Roger E. Theodoredis, dated December 4, 2012 (6) | |
10.9 | Amendment 1 to Employment Agreement between Dean Foods Company, The WhiteWave Foods Company and Gregg L. Engles, dated August 27, 2015 (7) | |
10.10 | Form of Amendment 1 to Employment Agreements between Dean Foods Company, The WhiteWave Foods and each of Kelly J. Haecker, Blaine E. McPeak, Edward F. Fugger, Roger E. Theodoredis and Thomas N. Zanetich, dated August 27, 2015 (7) | |
10.11 | Form of Change in Control Agreement dated May 1, 2013 between The WhiteWave Foods Company and Gregg L. Engles, Blaine E. McPeak and Thomas N. Zanetich (8) | |
10.12 | Form of Change in Control Agreement dated May 1, 2013 between The WhiteWave Foods Company and Kelly J. Haecker, Edward F. Fugger and Roger E. Theodoredis (8) | |
10.13 | Form of Amendment to the Change in Control Agreement dated March 11, 2014 between The WhiteWave Foods Company and Gregg L. Engles, Blaine E. McPeak and Thomas N. Zanetich (9) | |
10.14 | The WhiteWave Executive Severance Pay Plan, effective May 24, 2013 (8) | |
10.15 | Form of Indemnification Agreement (10) | |
10.16 | Amended and Restated 2012 Stock Incentive Plan (11) | |
10.17 | Form of 2015 Restricted Stock Unit Award Agreements - U.S. Executive Officers (12) | |
10.18 | Form of 2015 Restricted Stock Unit Award Agreement - non-U.S. Executive Officers (12) | |
10.19 | Form of 2015 Stock Option Award Agreement - U.S. Executive Officers (12) | |
10.20 | Form of 2015 Stock Option Award Agreement - non-U.S. Executive Officers (12) | |
10.21 | Form of 2015 Performance Stock Award Agreement - U.S. Executive Officers (12) | |
10.22 | Form of 2015 Performance Stock Award Agreement - non-U.S. Executive Officers (12) | |
10.23 | Form of Director’s Non-Qualified Stock Option Agreement (3) | |
10.24 | Form of Director’s Restricted Stock Unit Award Agreement (3) | |
10.25 | Director Compensation Policy (3) | |
10.26 | Fiscal Year 2016 Short-Term Incentive Compensation Plan-Corporate (13) | |
10.27 | Fiscal Year 2016 Short-Term Incentive Compensation Plan-Americas Foods & Beverages (13) | |
10.28 | Fiscal Year 2016 Short-Term Incentive Compensation Plan-Europe Foods & Beverages (13) | |
10.29 | Letter Agreement between The WhiteWave Foods Company and Kelly J. Haecker dated August 5, 2016 (13) | |
10.30 | Executive Deferred Compensation Plan (4) | |
10.31 | Credit Agreement, dated as of October 12, 2012, among The WhiteWave Foods Company, the subsidiary guarantors identified therein, Bank of America, N.A., as administrative agent, JPMorgan Chase Bank, N.A., as syndication agent, and the other lenders party thereto (10) | |
10.32 | Second Amendment to Credit Agreement dated as of January 2, 2014 (14) | |
10.33 | Third Amendment to Credit Agreement, dated as of August 29, 2014 (15) | |
10.34 | Fourth Amendment to Credit Agreement, dated as of November 6, 2015 (16) | |
10.35 | Incremental Term Loan Agreement dated as of January 2, 2014 (14) | |
21* | Subsidiaries of the Registrant | |
23* | Consent of Deloitte & Touche LLP | |
31.1* | Certification of Chief Executive Officer pursuant to Section 302 of the Sarbanes-Oxley Act of 2002 | |
31.2* | Certification of Chief Financial Officer pursuant to Section 302 of the Sarbanes-Oxley Act of 2002 | |
32.1* | Certification of Chief Executive Officer pursuant to Section 906 of the Sarbanes-Oxley Act of 2002 | |
32.2* | Certification of Chief Financial Officer pursuant to Section 906 of the Sarbanes-Oxley Act of 2002 | |
101.INS* | XBRL Instance Document | |
101.SCH* | XBRL Taxonomy Extension Schema Document | |
101.CAL* | XBRL Taxonomy Calculation Linkbase Document | |
101.DEF* | XBRL Taxonomy Extension Definition Linkbase Document | |
101.LAB* | XBRL Taxonomy Label Linkbase Document | |
101.PRE* | XBRL Taxonomy Presentation Linkbase Document | |
___________________________
* | Submitted electronically herewith |
(1) | Incorporated by reference to the exhibits to the Current Report on Form 8-K filed on September 17, 2014 |
(2) | Incorporated by reference to the exhibits to the Current Report on Form 8-K filed on July 7, 2016 |
(3) | Incorporated by reference to the exhibits to the Annual Report on Form 10-K for the fiscal year ended December 31, 2015 |
(4) | Incorporated by reference to the exhibits to the Annual Report on Form 10-K for the fiscal year ended December 31, 2013 |
(5) | Incorporated by reference to the exhibits to the registrant’s Amendment No. 1 to Registration Statement on Form S-1 (SEC File 333-183112) |
(6) | Incorporated by reference to the exhibits to the Annual Report on Form 10-K for the fiscal year ended December 31, 2012 |
(7) | Incorporated by reference to the exhibits to the Quarterly Report on Form 10-Q for the fiscal quarter ended September 30, 2015 |
(8) | Incorporated by reference to the exhibits to the Quarterly Report on Form 10-Q for the fiscal quarter ended March 31, 2013 |
(9) | Incorporated by reference to the exhibits to the Quarterly Report on Form 10-Q for the fiscal quarter ended March 31, 2014 |
(10) | Incorporated by reference to the exhibits to the registrant’s Amendment No. 3 to Registration Statement on Form S-1 (SEC File 333-183112) |
(11) | Incorporated by reference to Annex A to the registrant’s Proxy Statement dated April 1, 2015 |
(12) | Incorporated by reference to the exhibits to the Quarterly Report on Form 10-Q for the fiscal quarter ended June 30, 2015 |
(13) | Incorporated by reference to the exhibits to the Quarterly Report on Form 10-Q for the fiscal quarter ended June 30, 2016 |
(14) | Incorporated by reference to the exhibits to the Current Report on Form 8-K/A filed on January 8, 2014 |
(15) | Incorporated by reference to the exhibit to the Current Report on Form 8-K filed on September 2, 2014 |
(16) | Incorporated by reference to the exhibit to the Current Report on Form 8-K filed on November 9, 2015 |
Attached as Exhibit 101 to this report are the following materials from The WhiteWave Foods Company’s Annual Report on Form 10-K for the fiscal year ended December 31, 2016, formatted in XBRL (eXtensible Business Reporting Language): (i) the Consolidated Balance Sheets as of December 31, 2016 and 2015, (ii) the Consolidated Statements of Operations for the years ended December 31, 2016, 2015 and 2014, (iii) the Consolidated Statements of Comprehensive Income for the years ended December 31, 2016, 2015 and 2014, (iv) the Consolidated Statements of Equity for the years ended December 31, 2016, 2015 and 2014, (v) the Consolidated Statements of Cash Flows for the years ended December 31, 2016, 2015 and 2014, and (vi) Notes to Consolidated Financial Statements.
In accordance with Rule 406T of Regulation S-T, the XBRL-related information in Exhibit 101 to this Annual Report on Form 10-K is deemed not filed or part of a registration statement or prospectus for purposes of sections 11 or 12 of the Securities Act, is deemed not filed for purposes of section 18 of the Exchange Act, and otherwise is not subject to liability.