Attached files
| file | filename |
|---|---|
| EX-32.2 - EXHIBIT 32.2 - Tri Pointe Homes, Inc. | tph10kex322.htm |
| EX-32.1 - EXHIBIT 32.1 - Tri Pointe Homes, Inc. | tph10kex321.htm |
| EX-31.2 - EXHIBIT 31.2 - Tri Pointe Homes, Inc. | tph10kex312.htm |
| EX-31.1 - EXHIBIT 31.1 - Tri Pointe Homes, Inc. | tph10kex311.htm |
| EX-23.1 - EXHIBIT 23.1 - Tri Pointe Homes, Inc. | tph10kex231q416.htm |
| EX-21.1 - EXHIBIT 21.1 - Tri Pointe Homes, Inc. | tph10kex211.htm |
| EX-12.1 - EXHIBIT 12.1 - Tri Pointe Homes, Inc. | tph10kex121.htm |
UNITED STATES
SECURITIES AND EXCHANGE COMMISSION
Washington, D.C. 20549
_______________________________________________________________________________
FORM 10-K
_______________________________________________________________________________
(Mark One)
ý | ANNUAL REPORT PURSUANT TO SECTION 13 OR 15(d) OF THE SECURITIES EXCHANGE ACT OF 1934 |
For the fiscal year ended December 31, 2016
or
¨ | TRANSITION REPORT PURSUANT TO SECTION 13 OR 15(d) OF THE SECURITIES EXCHANGE ACT OF 1934 |
For the transition period from to
Commission File Number 1-35796

TRI Pointe Group, Inc.
(Exact Name of Registrant as Specified in Its Charter)
_______________________________________________________________________________
Delaware | 61-1763235 | |
(State or other Jurisdiction of Incorporation) | (I.R.S. Employer Identification No.) | |
19540 Jamboree Road, Suite 300
Irvine, California 92612
(Address of principal executive offices) (Zip Code)
Registrant’s telephone number, including area code (949) 438-1400
Securities registered pursuant to Section 12(b) of the Act:
Title of each class | Name of each exchange on which registered | |
Common Stock, par value $0.01 per share | New York Stock Exchange | |
Securities registered pursuant to Section 12(g) of the Act: None
Indicate by check mark if the registrant is a well-known seasoned issuer, as defined in Rule 405 of the Securities Act. Yes ý No ¨
Indicate by check mark if the registrant is not required to file reports pursuant to Section 13 or Section 15(d) of the Act. Yes ¨ No ý
Indicate by check mark whether the registrant: (1) has filed all reports required to be filed by Section 13 or 15(d) of the Securities Exchange Act of 1934 during the preceding 12 months (or for such shorter period that the registrant was required to file such reports), and (2) has been subject to such filing requirements for the past 90 days. Yes ý No ¨
Indicate by check mark whether the registrant has submitted electronically and posted on its corporate Web site, if any, every Interactive Data File required to be submitted and posted pursuant to Rule 405 of Regulation S-T (§ 232.405 of this chapter) during the preceding 12 months (or for such shorter period that the registrant was required to submit and post such files). Yes ý No ¨
Indicate by check mark if disclosure of delinquent filers pursuant to Item 405 of Regulation S-K is not contained herein, and will not be contained, to the best of registrant’s knowledge, in definitive proxy or information statements incorporated by reference in Part III of this Form 10-K or any amendment to this Form 10-K. ý
Indicate by check mark whether the registrant is a large accelerated filer, an accelerated filer, a non-accelerated filer, or a smaller reporting company. See the definitions of “large accelerated filer,” “accelerated filer” and “smaller reporting company” in Rule 12b-2 of the Exchange Act.
Large accelerated filer | ý | Accelerated filer | ¨ | |||
Non-accelerated filer | o (Do not check if a smaller reporting company) | Smaller reporting company | ¨ | |||
Indicate by check mark whether the registrant is a shell company (as defined in Rule 12b-2 of the Exchange Act).Yes ¨ No ý
The aggregate market value of the registrant’s common stock held by non-affiliates of the registrant on June 30, 2016, based on the closing price of $11.82 as reported by the New York Stock Exchange, was $1,719,493,500.
158,626,229 shares of common stock were issued and outstanding as of February 14, 2017.
DOCUMENTS INCORPORATED BY REFERENCE:
Portions from the registrant’s Proxy Statement relating to its 2017 Annual Meeting of Stockholders are incorporated by reference into Part III, Items 10, 11, 12, 13 and 14.
TRI Pointe Group, Inc.
ANNUAL REPORT ON FORM 10-K
FOR THE YEAR ENDED DECEMBER 31, 2016
Table of Contents
Page Number | ||
Part I | ||
Item 1. | ||
Item 1A. | ||
Item 1B. | ||
Item 2. | ||
Item 3. | ||
Item 4. | ||
Part II | ||
Item 5. | ||
Item 6. | ||
Item 7. | ||
Item 7A. | ||
Item 8. | ||
Item 9. | ||
Item 9A. | ||
Item 9B. | ||
Part III | ||
Item 10. | ||
Item 11. | ||
Item 12. | ||
Item 13. | ||
Item 14. | ||
Part IV | ||
Item 15. | ||
- 1 -
CAUTIONARY NOTE CONCERNING FORWARD-LOOKING STATEMENTS
This annual report on Form 10-K contains certain statements that are “forward-looking” statements within the meaning of Section 27A of the Securities Act of 1933, as amended (the “Securities Act”), and Section 21E of the Securities Exchange Act of 1934, as amended (the “Exchange Act”). These forward-looking statements are based on our current intentions, beliefs, expectations and predictions for the future, and you should not place undue reliance on these statements. These statements use forward-looking terminology, are based on various assumptions made by us, and may not be accurate because of risks and uncertainties surrounding the assumptions that are made.
Factors listed in this section–as well as other factors not included–may cause actual results to differ significantly from the forward-looking statements included in this annual report on Form 10-K. There is no guarantee that any of the events anticipated by the forward-looking statements in this annual report on Form 10-K will occur, or if any of the events occurs, there is no guarantee what effect it will have on our operations, financial condition, or share price.
We undertake no, and hereby disclaim any, obligation to update or revise any forward-looking statements, unless required by law. However, we reserve the right to make such updates or revisions from time to time by press release, periodic report, or other method of public disclosure without the need for specific reference to this annual report on Form 10-K. No such update or revision shall be deemed to indicate that other statements not addressed by such update or revision remain correct or create an obligation to provide any other updates or revisions.
Forward-Looking Statements
These forward-looking statements are generally accompanied by words such as “anticipate,” “believe,” “could,” “estimate,” “expect,” “goal,” “intend,” “may,” “might,” “plan,” “potential,” “predict,” “project,” “target,” “will,” “would,” or other words that convey the uncertainty of future events or outcomes. These forward-looking statements may include, but are not limited to, statements regarding our strategy, projections and estimates concerning the timing and success of specific projects and our future production, land and lot sales, operational and financial results, including our estimates for growth, financial condition, sales prices, prospects and capital spending.
Risks, Uncertainties and Assumptions
The major risks and uncertainties–and assumptions that are made–that affect our business and may cause actual results to differ from these forward-looking statements include, but are not limited to:
• | the effect of general economic conditions, including employment rates, housing starts, interest rate levels, availability of financing for home mortgages and strength of the U.S. dollar; |
• | market demand for our products, which is related to the strength of the various U.S. business segments and U.S. and international economic conditions; |
• | levels of competition; |
• | the successful execution of our internal performance plans, including restructuring and cost reduction initiatives; |
• | global economic conditions; |
• | raw material prices; |
• | oil and other energy prices; |
• | the effect of weather, including the re-occurrence of drought conditions in California; |
• | the risk of loss from earthquakes, volcanoes, fires, floods, droughts, windstorms, hurricanes, pest infestations and other natural disasters; |
• | transportation costs; |
• | federal and state tax policies; |
• | the effect of land use, environment and other governmental laws and regulations; |
• | legal proceedings or disputes and the adequacy of reserves; |
• | risks relating to any unforeseen changes to or effects on liabilities, future capital expenditures, revenues, expenses, earnings, synergies, indebtedness, financial condition, losses and future prospects; |
• | change in accounting principles; |
• | risks related to unauthorized access to our computer systems, theft of our homebuyers’ confidential information or other forms of cyber-attack; and |
• | other factors described in “Risk Factors.” |
- 2 -
EXPLANATORY NOTE
As used in this annual report on Form 10-K, references to “TRI Pointe”, “the Company”, “we”, “us”, or “our” in this annual report on Form 10-K (including in the consolidated financial statements and related notes thereto in this report) have the following meanings, unless the context otherwise requires:
• | For periods prior to July 7, 2015: TRI Pointe Homes, Inc., a Delaware corporation (“TRI Pointe Homes”) and its subsidiaries; and |
• | For periods from and after July 7, 2015: TRI Pointe Group, Inc., a Delaware corporation (“TRI Pointe Group”) and its subsidiaries. |
The following discussion and analysis should be read in conjunction with our audited consolidated financial statements and related notes thereto contained elsewhere in this annual report on Form 10-K. The section entitled “Risk Factors” set forth in Part I, Item 1A of this annual report on Form 10-K discusses some of the important risk factors that may affect our business, results of operations and financial condition. Investors should carefully consider those risks, in addition to the information in this annual report on Form 10-K, before deciding to invest in, or maintain an investment in, our common stock. “Winchester” is a registered trademark and is used with permission.
- 3 -
PART I.
Item 1. | Business |
Our Company
TRI Pointe was founded in April 2009, near the end of an unprecedented downturn in the national homebuilding industry. Since then, we have grown from a Southern California fee homebuilder into a regionally focused national homebuilder with a portfolio of the following six quality homebuilding brands operating in 14 markets across eight states:
• | Maracay Homes in Arizona; |
• | Pardee Homes in California and Nevada; |
• | Quadrant Homes in Washington; |
• | Trendmaker Homes in Texas; |
• | TRI Pointe Homes in California and Colorado; and |
• | Winchester Homes in Maryland and Virginia. |
Our growth strategy is to capitalize on high demand in selected "core" markets with favorable population and employment growth as a result of proximity to job centers or primary transportation corridors. As of December 31, 2016, our operations consisted of 124 active selling communities and 28,309 lots owned or controlled. See “Lots Owned or Controlled” below. Our construction expertise across an extensive product offering allows us flexibility to pursue a wide array of land acquisition opportunities and appeal to a broad range of potential homebuyers, including buyers of entry-level, move-up and luxury homes. As a result, we build across a variety of base sales price points, ranging from approximately $212,000 to $2.2 million, and home sizes, ranging from approximately 1,200 to 6,200 square feet. See “Description of Projects and Communities under Development” below. For the years ended December 31, 2016 and 2015, we delivered 4,211 and 4,057 homes and the average sales price of our new homes delivered was approximately $553,000 and $565,000, respectively.
Our founders firmly established our core values of quality, integrity and excellence. These are the driving forces behind our innovative designs and strong commitment to our homebuyers.
Formation of TRI Pointe Group
On July 7, 2015, TRI Pointe Homes reorganized its corporate structure (the “Reorganization”) whereby TRI Pointe Homes became a direct, wholly owned subsidiary of TRI Pointe Group. As part of the Reorganization, we rebranded as TRI Pointe Group, while retaining TRI Pointe Homes as a regional homebuilding brand. As a result of the Reorganization, each share of common stock, par value $0.01 per share, of TRI Pointe Homes (“TRI Pointe Homes Common Stock”) was cancelled and converted automatically into the right to receive one validly issued, fully paid and non-assessable share of common stock, par value $0.01 per share, of TRI Pointe Group (“TRI Pointe Group Common Stock”), each share having the same designations, rights, powers and preferences, and the qualifications, limitations and restrictions thereof as the shares of TRI Pointe Homes Common Stock being so converted. TRI Pointe Group, as the successor issuer to TRI Pointe Homes (pursuant to Rule 12g-3(a) under the Exchange Act), began making filings under the Securities Act and the Exchange Act on July 7, 2015, and TRI Pointe Group Common Stock continued to trade on the New York Stock Exchange (“NYSE”) under the ticker symbol “TPH”.
In connection with the Reorganization, TRI Pointe Group (i) became a co-issuer of TRI Pointe Homes’ 4.375% Senior Notes due 2019 (“2019 Notes”) and TRI Pointe Homes' 5.875% Senior Notes due 2024 (“2024 Notes”); and (ii) replaced TRI Pointe Homes as the borrower under TRI Pointe Homes’ existing unsecured revolving credit facility.
- 4 -
The business, executive officers and directors of TRI Pointe Group, and the rights and limitations of the holders of TRI Pointe Group Common Stock immediately following the Reorganization were identical to the business, executive officers and directors of TRI Pointe Homes, and the rights and limitations of holders of TRI Pointe Homes Common Stock immediately prior to the Reorganization.
Merger with WRECO
On July 7, 2014 (the “Closing Date”), TRI Pointe Homes consummated the previously announced merger (the “Merger”) with Weyerhaeuser Real Estate Company (“WRECO”), in which WRECO became a wholly owned subsidiary of TRI Pointe Homes. In the Merger, TRI Pointe issued 129,700,000 shares of common stock to the former holders of WRECO common shares, together with cash in lieu of any fractional shares. Immediately following the consummation of the Merger, the ownership of TRI Pointe common stock on a fully diluted basis was as follows: (i) the WRECO common shares held by former shareholders of Weyerhaeuser Company, the former parent of WRECO (“Weyerhaeuser”), were converted into the right to receive, in the aggregate, approximately 79.6% of the then outstanding TRI Pointe common stock, (ii) the TRI Pointe common stock outstanding immediately prior to the consummation of the Merger represented approximately 19.4% of the then outstanding TRI Pointe common stock, and (iii) the outstanding equity awards of WRECO and TRI Pointe employees represented the remaining approximately 1.0% of the then outstanding TRI Pointe common stock. References in this annual report on Form 10-K to “legacy TRI Pointe” means the operations of TRI Pointe before the Closing Date. Following the Closing Date, WRECO was renamed “TRI Pointe Holdings, Inc.”
Our Competitive Strengths
We believe the following strengths provide us with a significant competitive advantage in implementing our business strategy:
Experienced and Proven Leadership
Douglas Bauer, our Chief Executive Officer, Thomas Mitchell, our President and Chief Operating Officer, and Michael Grubbs, our Chief Financial Officer, have worked together for over 25 years and have a successful track record of managing and growing a public homebuilding company. Spanning over a century, their combined real estate industry experience includes land acquisition, financing, entitlement, development, construction, marketing and sales of single-family detached and attached homes in communities in a variety of markets. In addition, each of the presidents of our homebuilding subsidiaries has substantial industry knowledge and local market expertise. The average homebuilding experience of these presidents exceeds 20 years. We believe that our management team's prior experience, extensive relationships and strong local reputations provide us with a competitive advantage in securing projects, obtaining entitlements, building quality homes and completing projects within budget and on schedule.
Focus on High Growth Core Markets
Our business is well-positioned to capitalize on the broader national housing market recovery. We are focused on the design, construction and sale of innovative single-family detached and attached homes in major metropolitan areas in California, Colorado, Houston and Austin, Phoenix and Tucson, Las Vegas, the Washington, D.C. metro area and the Puget Sound region of Washington State. These markets are generally characterized by high job growth and increasing populations, creating strong demand for new housing. We believe they represent attractive homebuilding markets with opportunities for long-term growth and that we have strong land positions strategically located within these markets. Moreover, our management team has deep, local market knowledge of the homebuilding and development industries. We believe this experience and strong relationships with local market participants enable us to source, acquire and entitle land efficiently.
Strong Operational Discipline and Controls
Our management team pursues a hands-on approach. Our strict operating discipline, including financial accountability at the project management level, is a key part of our strategy to maximize returns while minimizing risk.
Acquire Attractive Land Positions While Reducing Risk
We believe that our reputation and extensive relationships with land sellers, master plan developers, financial institutions, brokers and other builders enable us to continue to acquire well-positioned land parcels in our target markets and provide us access to a greater number of acquisition opportunities. We believe our expertise in land development and planning enables us to create desirable communities that meet or exceed our homebuyers' expectations, while operating at competitive costs.
- 5 -
Increase Market Position in Growth Markets
We believe that there are significant opportunities to expand profitably in our existing and target markets, and we continually review our selection of markets based on both aggregate demographic information and our own operating results. We use the results of these reviews to re-allocate our investments to those markets where we believe we can maximize our profitability and return on capital over the next several years. While our primary growth strategy has focused on increasing our market position in our existing markets, we may, on an opportunistic basis, explore expansion into other markets through organic growth or acquisition.
Provide Superior Design and Homeowner Experience and Service
We consider ourselves a "progressive" homebuilder driven by an exemplary homeowner experience, cutting-edge product development and exceptional execution. Our core operating philosophy is to provide a positive, memorable experience to our homeowners through active engagement in the building process, tailoring our product to homeowners' lifestyle needs and enhancing communication, knowledge and satisfaction. We believe that the new generation of home buying families has different ideas about the kind of home buying experience it wants. As a result, our selling process focuses on the home's features, benefits, quality and design in addition to the traditional metrics of price and square footage. In addition, we devote significant resources to the research and design of our homes to better meet the needs of our homebuyers. Through our LivingSmart® platform, we provide homes that we believe are earth-friendly, enhance homeowners' comfort, promote a healthier lifestyle and deliver tangible operating cost savings versus less efficient resale homes. Collectively, we believe these steps enhance the selling process, lead to a more satisfied homeowner and increase the number of homebuyers referred to our communities.
Offer a Diverse Range of Products
We are a builder with a wide variety of product offerings that enable us to meet the specific needs of each of our core markets, which we believe provides us with a balanced portfolio and an opportunity to increase market share. We have demonstrated expertise in effectively building homes across product offerings from entry-level through first-time and second-time move-up housing. We spend extensive time studying and designing our products through the use of architects, consultants and homebuyer focus groups for all levels and price points in our target markets. We believe our diversified product strategy enables us to best serve a wide range of homebuyers, adapt quickly to changing market conditions and optimize performance and returns while strategically reducing portfolio risk. Within each of our core markets we determine the profile of homebuyers we hope to address and design neighborhoods and homes with the specific needs of those homebuyers in mind.
Focus on Efficient Cost Structure and Target Attractive Returns
Our experienced management team is vigilant in maintaining its focus on controlling costs. We competitively bid new projects and phases while maintaining strong relationships with our trade partners by managing production schedules closely and paying our vendors on time.
We combine decentralized management in those aspects of our business in which we believe detailed knowledge of local market conditions is critical (such as governmental processing, construction, land acquisition, land development and sales and marketing), with centralized management in those functions in which we believe central control is required (such as approval of land acquisitions, financial, treasury, human resources and legal matters). We have also made significant investments in systems and infrastructure to operate our business efficiently and to support the planned future growth of our company as a result of executing our expansion strategy.
Utilize Prudent Leverage
Our ongoing financial strategy includes redeployment of cash flows from continuing operations and debt to provide us with the financial flexibility to access capital on the best terms available. In that regard, we expect to employ prudent levels of leverage to finance the acquisition and development of our lots and construction of our homes. See "Our Financing Strategy" below.
Lots Owned or Controlled
As of December 31, 2016, we owned or controlled, pursuant to land option contracts or purchase contracts, an aggregate of 28,309 lots. We refer to lots that are under land option contracts as "controlled," see "Acquisition Process" below. Excluded from lots owned or controlled are those related to Note 8, Investments in Unconsolidated Entities, of the notes to our consolidated financial statements included elsewhere in this annual report on Form 10-K. The following table presents certain information with respect to our lots owned or controlled as of December 31, 2016.
- 6 -
Lots Owned | Lots Controlled | Lots Owned or Controlled | ||||||
Maracay Homes | 1,667 | 386 | 2,053 | |||||
Pardee Homes | 16,041 | 871 | 16,912 | |||||
Quadrant Homes | 1,027 | 555 | 1,582 | |||||
Trendmaker Homes | 1,687 | 312 | 1,999 | |||||
TRI Pointe Homes | 3,073 | 406 | 3,479 | |||||
Winchester Homes | 1,788 | 496 | 2,284 | |||||
Total | 25,283 | 3,026 | 28,309 | |||||
Description of Projects and Communities under Development
Our lot inventory includes land that we are holding for future development. The development of these lots will be subject to a variety of marketing, regulatory and other factors and in some cases we may decide to sell the land prior to development. The following table presents project information relating to each of our markets as of December 31, 2016 and includes information on current projects under development where we are building and selling homes as of December 31, 2016.
- 7 -
Maracay Homes
County, Project, City | Year of First Delivery(1) | Total Number of Lots(2) | Cumulative Homes Delivered as of December 31,2016 | Lots Owned as of December 31,2016(3) | Backlog as of December 31,2016(4)(5) | Homes Delivered for the Twelve Months Ended December 31,2016 | Sales Price Range(in thousands)(6) | |||||||||||
Phoenix, Arizona | ||||||||||||||||||
Verrado Tilden | 2012 | 102 | 102 | — | — | 8 | $239 - $304 | |||||||||||
Verrado Palisades | 2015 | 63 | 33 | 30 | 13 | 17 | $311 - $384 | |||||||||||
Verrado Victory | 2015 | 98 | 30 | 68 | 7 | 13 | $357 - $392 | |||||||||||
City of Chandler: | ||||||||||||||||||
Artesian Ranch | 2013 | 90 | 90 | — | — | 33 | $344 - $400 | |||||||||||
Vaquero Ranch | 2013 | 74 | 74 | — | — | 7 | $298 - $373 | |||||||||||
Maracay at Layton Lakes | 2015 | 47 | 47 | — | — | 36 | $484 - $524 | |||||||||||
Sendera Place | 2015 | 79 | 58 | 21 | 15 | 46 | $277 - $324 | |||||||||||
Hawthorn Manor | 2017 | 84 | — | 84 | — | — | $489 - $521 | |||||||||||
Town of Gilbert: | ||||||||||||||||||
Arch Crossing at Bridges of Gilbert | 2014 | 67 | 67 | — | — | 7 | $283 - $341 | |||||||||||
Trestle Place at Bridges of Gilbert | 2014 | 73 | 73 | — | — | 10 | $344 - $424 | |||||||||||
Marquis at Morrison Ranch | 2016 | 66 | 36 | 30 | 14 | 36 | $410 - $497 | |||||||||||
Artisan at Morrison Ranch | 2016 | 105 | 35 | 70 | 14 | 35 | $318 - $371 | |||||||||||
Adora Trails | 2017 | 82 | — | 82 | — | — | $371 - $399 | |||||||||||
City of Goodyear: | ||||||||||||||||||
Calderra at Palm Valley | 2013 | 81 | 81 | — | — | 1 | Closed | |||||||||||
Rio Paseo Villages | 2018 | 117 | — | 117 | — | — | $199 - $219 | |||||||||||
Rio Paseo Cottages | 2018 | 93 | — | 93 | — | — | $233 - $252 | |||||||||||
City of Mesa: | ||||||||||||||||||
Kinetic Point at Eastmark | 2013 | 80 | 75 | 5 | — | 15 | $284 - $362 | |||||||||||
Lumiere Garden at Eastmark | 2013 | 85 | 75 | 10 | 2 | 15 | $331 - $407 | |||||||||||
Aileron Square at Eastmark | 2016 | 58 | 24 | 34 | 13 | 24 | $331 - $407 | |||||||||||
Curie Court at Eastmark | 2016 | 106 | 30 | 76 | 6 | 30 | $284 - $362 | |||||||||||
Palladium Point | 2016 | 53 | 4 | 49 | 7 | 4 | $310 - $379 | |||||||||||
The Vista at Granite Crossing | 2018 | 37 | — | 37 | — | — | $380 - $455 | |||||||||||
Town of Peoria: | ||||||||||||||||||
The Reserve at Plaza del Rio | 2013 | 162 | 135 | 27 | 19 | 48 | $226 - $270 | |||||||||||
Maracay at Northlands | 2014 | 90 | 77 | 13 | 11 | 42 | $330 - $411 | |||||||||||
Legacy at The Meadows | 2017 | 74 | — | 74 | 13 | — | $400 - $426 | |||||||||||
Estates at The Meadows | 2017 | 99 | — | 99 | 22 | — | $459 - $533 | |||||||||||
Meadows 1 & 3 | 2018 | 299 | — | 299 | — | — | $365 - $523 | |||||||||||
City of Phoenix: | ||||||||||||||||||
Navarro Groves | 2018 | 20 | — | 20 | — | — | $373 - $406 | |||||||||||
Town of Queen Creek: | ||||||||||||||||||
The Preserve at Hastings Farms | 2014 | 89 | 88 | 1 | — | 45 | $300 - $385 | |||||||||||
Villagio | 2013 | 135 | 129 | 6 | 4 | 40 | $291 - $352 | |||||||||||
Phoenix, Arizona Total | 2,708 | 1,363 | 1,345 | 160 | 512 | |||||||||||||
Tucson, Arizona | ||||||||||||||||||
Marana: | ||||||||||||||||||
Tortolita Vistas | 2014 | 55 | 41 | 14 | 10 | 17 | $458 - $515 | |||||||||||
Oro Valley: | ||||||||||||||||||
Rancho del Cobre | 2014 | 68 | 55 | 13 | 5 | 12 | $410 - $478 | |||||||||||
Desert Crest - Center Pointe Vistoso | 2016 | 103 | 13 | 90 | 13 | 13 | $255 - $300 | |||||||||||
The Cove - Center Pointe Vistoso | 2016 | 83 | 18 | 65 | 11 | 18 | $335 - $395 | |||||||||||
Summit N & S - Center Pointe Vistoso | 2016 | 88 | 23 | 65 | 21 | 23 | $385 - $420 | |||||||||||
The Pinnacle - Center Pointe Vistoso | 2016 | 69 | 22 | 47 | 21 | 22 | $441 - $473 | |||||||||||
Tucson: | ||||||||||||||||||
Deseo at Sabino Canyon | 2014 | 39 | 39 | — | — | 2 | $419 - $505 | |||||||||||
Ranches at Santa Catalina | 2016 | 34 | 6 | 28 | 7 | 6 | $404 - $450 | |||||||||||
Tucson, Arizona Total | 539 | 217 | 322 | 88 | 113 | |||||||||||||
Maracay Total | 3,247 | 1,580 | 1,667 | 248 | 625 | |||||||||||||
- 8 -
Pardee Homes
County, Project, City | Year of First Delivery(1) | Total Number of Lots(2) | Cumulative Homes Delivered as of December 31, 2016 | Lots Owned as of December 31, 2016(3) | Backlog as of December 31, 2016(4)(5) | Homes Delivered for the Twelve Months Ended December 31, 2016 | Sales Price Range (in thousands)(6) | |||||||||||
California | ||||||||||||||||||
San Diego County: | ||||||||||||||||||
Alta Del Mar Homes | 2013 | 117 | 117 | — | — | 37 | $1,800 - $2,200 | |||||||||||
Watermark | 2013 | 160 | 160 | — | — | 29 | $1,000 - $1,310 | |||||||||||
Canterra | 2015 | 89 | 89 | — | — | 64 | $760 - $910 | |||||||||||
Casabella | 2015 | 139 | 100 | 39 | 18 | 78 | $900 - $1,000 | |||||||||||
Verana | 2015 | 78 | 78 | — | — | 40 | $995 - $1,100 | |||||||||||
Casavia | 2017 | 83 | — | 83 | 13 | — | $980 - $1,000 | |||||||||||
Artesana | 2017 | 56 | — | 56 | 6 | — | $1,680 - $1,900 | |||||||||||
Pacific Highlands Ranch Future | TBD | 769 | — | 769 | — | — | TBD | |||||||||||
Olive Hill Estate | 2016 | 37 | 16 | 21 | 5 | 16 | $650 - $770 | |||||||||||
Castlerock | 2017 | 415 | — | 415 | — | — | $510 - $770 | |||||||||||
Meadowood | TBD | 844 | — | 844 | — | — | $290 - $590 | |||||||||||
Parkview Condos | 2016 | 73 | 36 | 37 | 26 | 36 | $435 - $515 | |||||||||||
Luna | 2017 | 96 | — | 96 | — | — | $330 - $405 | |||||||||||
Azul | 2017 | 121 | — | 121 | — | — | $325 - $375 | |||||||||||
Ocean View Hills Future | 2017 | 700 | — | 700 | — | — | TBD | |||||||||||
South Otay Mesa | TBD | 893 | — | 893 | — | — | $185 - $530 | |||||||||||
Los Angeles County: | ||||||||||||||||||
Aliento - Verana | 2017 | 95 | — | 95 | — | — | $495 - $615 | |||||||||||
Aliento - Arista | 2017 | 112 | — | 112 | — | — | $685 - $745 | |||||||||||
Aliento - 55x100 | 2018 | 94 | — | 94 | — | — | $665 - $700 | |||||||||||
Aliento - 70x100 | 2018 | 67 | — | 67 | — | — | $810 - $860 | |||||||||||
Skyline Ranch | TBD | 1,260 | — | 1,260 | — | — | $510 - $640 | |||||||||||
Riverside County: | ||||||||||||||||||
Meadow Ridge | 2013 | 132 | 132 | — | — | 24 | $370 - $470 | |||||||||||
Meadow Glen | 2014 | 142 | 140 | 2 | 2 | 51 | $350 - $410 | |||||||||||
Amberleaf | 2014 | 131 | 131 | — | — | 45 | $320 - $370 | |||||||||||
Summerfield | 2015 | 85 | 85 | — | — | 33 | $310 - $330 | |||||||||||
Senterra | 2016 | 82 | 25 | 57 | 14 | 25 | $390 - $460 | |||||||||||
Vantage | 2016 | 83 | 15 | 68 | 13 | 15 | $350 - $380 | |||||||||||
Viewpoint | 2016 | 75 | 18 | 57 | 17 | 18 | $290 - $310 | |||||||||||
Overlook | 2016 | 112 | 24 | 88 | 8 | 24 | $305 - $335 | |||||||||||
Aura | 2017 | 79 | — | 79 | 6 | — | $340 - $360 | |||||||||||
Starling | 2018 | 107 | — | 107 | — | — | $385 - $400 | |||||||||||
Canyon Hills Future | 2018 | 125 | — | 125 | — | — | TBD | |||||||||||
Tournament Hills Future | TBD | 268 | — | 268 | — | — | TBD | |||||||||||
Woodmont | 2014 | 84 | 84 | — | — | 16 | $320 - $390 | |||||||||||
Cielo | 2015 | 92 | 92 | — | — | 14 | $220 - $275 | |||||||||||
Northstar | 2015 | 92 | 66 | 26 | 6 | 48 | $300 - $330 | |||||||||||
Skycrest | 2015 | 102 | 68 | 34 | — | 38 | $330 - $380 | |||||||||||
Flagstone | 2016 | 79 | 34 | 45 | 3 | 34 | $380 - $440 | |||||||||||
Lunetta | 2016 | 112 | 55 | 57 | 5 | 55 | $270 - $300 | |||||||||||
Elara | 2016 | 118 | 20 | 98 | 21 | 20 | $260 - $290 | |||||||||||
Sundance Future | TBD | 1,353 | — | 1,353 | — | — | TBD | |||||||||||
Tierra Del Rey | 2017 | 84 | — | 84 | — | — | $390 - $430 | |||||||||||
Spencer's Crossing | 2017 | 84 | — | 84 | — | — | TBD | |||||||||||
Manifee Heights | TBD | 359 | — | 359 | — | — | TBD | |||||||||||
Banning | TBD | 4,318 | — | 4,318 | — | — | $170 - $250 | |||||||||||
Sacramento County: | ||||||||||||||||||
Natomas | TBD | 120 | — | 120 | — | — | TBD | |||||||||||
San Joaquin County: | ||||||||||||||||||
Bear Creek | TBD | 1,252 | — | 1,252 | — | — | TBD | |||||||||||
California Total | 15,968 | 1,585 | 14,383 | 163 | 760 | |||||||||||||
Nevada | ||||||||||||||||||
- 9 -
Clark County: | ||||||||||||||||||
LivingSmart at Eldorado Ridge | 2012 | 169 | 169 | — | — | 9 | $260 - $310 | |||||||||||
LivingSmart at Eldorado Heights | 2013 | 135 | 135 | — | — | 13 | $310 - $395 | |||||||||||
LivingSmart Sandstone | 2013 | 145 | 144 | 1 | 1 | 54 | $228 - $255 | |||||||||||
North Peak | 2015 | 150 | 57 | 93 | 12 | 51 | $282 - $336 | |||||||||||
Castle Rock | 2015 | 150 | 61 | 89 | 12 | 57 | $328 - $418 | |||||||||||
Camino | 2016 | 86 | 23 | 63 | 14 | 23 | $251 - $264 | |||||||||||
Eldorado Future | 2017 | 59 | — | 59 | — | — | TBD | |||||||||||
Solano | 2014 | 132 | 117 | 15 | 2 | 56 | $300 - $335 | |||||||||||
Alterra | 2014 | 47 | 45 | 2 | 1 | 20 | $425 - $505 | |||||||||||
Bella Verdi | 2015 | 49 | 47 | 2 | 2 | 28 | $375 - $440 | |||||||||||
Escala | 2016 | 154 | 19 | 135 | 8 | 19 | $515 - $580 | |||||||||||
Montero | 2016 | 74 | 8 | 66 | 11 | 8 | $420 - $485 | |||||||||||
Strada | 2017 | 116 | — | 116 | — | — | $380 - $400 | |||||||||||
Responsive Home | 2016 | 2 | 2 | — | — | 2 | $590 - $940 | |||||||||||
POD 5-1/2-2 Future | 2017 | 31 | — | 31 | — | — | TBD | |||||||||||
Durango Ranch | 2012 | 153 | 153 | — | — | 6 | $467 - $560 | |||||||||||
Durango Trail | 2014 | 77 | 77 | — | — | 3 | $380 - $410 | |||||||||||
Meridian | 2016 | 82 | 20 | 62 | 4 | 20 | $580 - $680 | |||||||||||
Encanto | 2016 | 102 | 11 | 91 | 4 | 11 | $470 - $525 | |||||||||||
Encanto Townhomes | 2018 | 70 | — | 70 | — | — | TBD | |||||||||||
Horizon Terrace | 2014 | 165 | 94 | 71 | 9 | 34 | $400 - $455 | |||||||||||
Horizon Valle Verde | 2018 | 53 | — | 53 | — | — | TBD | |||||||||||
Summerglen | 2014 | 140 | 113 | 27 | 9 | 45 | $300 - $305 | |||||||||||
Keystone | 2017 | 70 | 1 | 69 | 8 | 1 | $450 - $530 | |||||||||||
Cobalt | 2017 | 107 | — | 107 | — | — | $340 - $370 | |||||||||||
Axis | 2017 | 78 | — | 78 | — | — | $680 - $780 | |||||||||||
The Canyons at MacDonald Ranch - R | 2017 | 22 | — | 22 | — | — | $535 - $565 | |||||||||||
Sunridge Heights | 2017 | 108 | — | 108 | — | — | $392 - $455 | |||||||||||
Nova Ridge | 2018 | 112 | — | 112 | — | — | $680 - $715 | |||||||||||
Tera Luna | 2017 | 116 | — | 116 | — | — | $546 - $596 | |||||||||||
Nevada Total | 2,954 | 1,296 | 1,658 | 97 | 460 | |||||||||||||
Pardee Total | 18,922 | 2,881 | 16,041 | 260 | 1,220 | |||||||||||||
- 10 -
Quadrant Homes
County, Project, City | Year of First Delivery(1) | Total Number of Lots(2) | Cumulative Homes Delivered as of December 31, 2016 | Lots Owned as of December 31, 2016(3) | Backlog as of December 31, 2016(4)(5) | Homes Delivered for the Twelve Months Ended December 31, 2016 | Sales Price Range (in thousands)(6) | |||||||||||
Washington | ||||||||||||||||||
Skagit County: | ||||||||||||||||||
Skagit Surplus Pod E, Mt Vernon | TBD | 4 | — | 4 | — | — | TBD | |||||||||||
Snohomish County: | ||||||||||||||||||
Evergreen Heights, Monroe | 2016 | 71 | 3 | 68 | 15 | 3 | $450 - $515 | |||||||||||
The Grove at Canyon Park, Bothell | 2017 | 60 | — | 60 | 11 | — | $645 - $727 | |||||||||||
Greenstone Heights, Bothell | 2017 | 41 | — | 41 | — | — | $859 - $919 | |||||||||||
King County: | ||||||||||||||||||
Vintner's Place, Kirkland | 2016 | 35 | 20 | 15 | 15 | 20 | $732 - $850 | |||||||||||
Copperwood, Renton | 2016 | 46 | 21 | 25 | 19 | 21 | $650 - $737 | |||||||||||
Viscaia, Bellevue | 2017 | 18 | — | 18 | 1 | — | $750 - $848 | |||||||||||
Trailside, Redmond | 2017 | 9 | — | 9 | — | — | $950 - $1,190 | |||||||||||
Parkwood Terrace, Woodinville | 2017 | 15 | — | 15 | 3 | — | $789 - $910 | |||||||||||
Hazelwood Ridge, Newcastle | 2017 | 30 | — | 30 | 4 | — | $805 - $905 | |||||||||||
Inglewood Landing, Sammamish | 2018 | 21 | — | 21 | — | — | $865 - $1,000 | |||||||||||
Jacobs Landing, Issaquah | 2017 | 20 | — | 20 | — | — | $935 - $1,000 | |||||||||||
Kirkwood Terrace, Sammamish | 2017 | 12 | — | 12 | — | — | $1,310 - $1,610 | |||||||||||
English Landing P2, Redmond | 2017 | 25 | — | 25 | — | — | $930 - $1,070 | |||||||||||
English Landing P1, Redmond | 2018 | 50 | — | 50 | — | — | $945 - $1,095 | |||||||||||
Heathers Ridge South, Redmond | 2017 | 8 | — | 8 | 8 | — | $725 - $1,008 | |||||||||||
Cedar Landing, North Bend | 2018 | 138 | — | 138 | — | — | $590 - $740 | |||||||||||
Monarch Ridge, Sammamish | 2018 | 59 | — | 59 | — | — | $860 - $975 | |||||||||||
Ray Meadows, Redmond | 2018 | 27 | — | 27 | — | — | $930 - $1,080 | |||||||||||
Wynstone, Federal Way | TBD | 4 | — | 4 | — | — | TBD | |||||||||||
Breva, Bellevue | 2017 | 29 | — | 29 | — | — | $642 - $714 | |||||||||||
Canton Crossing, Maple Valley | 2017 | 51 | — | 51 | — | — | $560 - $655 | |||||||||||
Aurea, Sammamish | 2018 | 41 | — | 41 | — | — | $580 - $670 | |||||||||||
Pierce County: | ||||||||||||||||||
Harbor Hill S-9, Gig Harbor | 2014 | 40 | 39 | 1 | — | 3 | $422 | |||||||||||
Harbor Hill S-8, Gig Harbor | 2015 | 33 | 32 | 1 | 1 | 28 | $422 | |||||||||||
Harbor Hill S-7, Gig Harbor | 2016 | 16 | 8 | 8 | 2 | 8 | $422 - $470 | |||||||||||
The Enclave at Harbor Hill, Gig Harbor | 2016 | 33 | 17 | 16 | 4 | 17 | $495 - $550 | |||||||||||
Harbor Hill S-2, Gig Harbor | 2018 | 41 | — | 41 | — | — | $453 - $508 | |||||||||||
Harbor Hill S-5/6, Gig Harbor | 2017 | 72 | — | 72 | — | — | $427 - $482 | |||||||||||
Thurston County: | ||||||||||||||||||
Campus Fairways, Lacey | 2015 | 39 | 38 | 1 | 1 | 25 | $430 | |||||||||||
Kitsap County: | ||||||||||||||||||
McCormick Meadows, Port Orchard | 2012 | 167 | 166 | 1 | 1 | 47 | $300 | |||||||||||
Mountain Aire, Poulsbo | 2016 | 145 | 29 | 116 | 16 | 29 | $405 - $455 | |||||||||||
Closed Communities | N/A | — | — | — | — | 182 | N/A | |||||||||||
Washington Total | 1,400 | 373 | 1,027 | 101 | 383 | |||||||||||||
Quadrant Homes Total | 1,400 | 373 | 1,027 | 101 | 383 | |||||||||||||
- 11 -
Trendmaker Homes
County, Project, City | Year of First Delivery(1) | Total Number of Lots(2) | Cumulative Homes Delivered as of December 31, 2016 | Lots Owned as of December 31, 2016(3) | Backlog as of December 31, 2016(4)(5) | Homes Delivered for the Twelve Months Ended December 31, 2016 | Sales Price Range(in thousands)(6) | |||||||||||
Texas | ||||||||||||||||||
Brazoria County: | ||||||||||||||||||
Sedona Lakes, Pearland | 2014 | 34 | 21 | 13 | 1 | 4 | $404 - $458 | |||||||||||
Southern Trails, Pearland | 2014 | 40 | 40 | — | — | 11 | $499 - $550 | |||||||||||
Pomona, Manvel | 2016 | 31 | 5 | 26 | 6 | 5 | $358 - $450 | |||||||||||
Rise Meridiana | 2016 | 21 | 1 | 20 | 8 | 1 | $303 - $336 | |||||||||||
Fort Bend County: | ||||||||||||||||||
Cross Creek Ranch 60', Fulshear | 2013 | 109 | 78 | 31 | 4 | 7 | $364 - $453 | |||||||||||
Cross Creek Ranch 65', Fulshear | 2013 | 103 | 75 | 28 | 5 | 13 | $416 - $475 | |||||||||||
Cross Creek Ranch 70', Fulshear | 2013 | 117 | 95 | 22 | 5 | 14 | $460 - $520 | |||||||||||
Cross Creek Ranch 80', Fulshear | 2013 | 123 | 111 | 12 | 5 | 16 | $541 - $656 | |||||||||||
Cross Creek Ranch 90', Fulshear | 2013 | 43 | 29 | 14 | 6 | 5 | $617 - $692 | |||||||||||
Villas at Cross Creek Ranch, Fulshear | 2013 | 101 | 100 | 1 | — | 9 | $454 - $496 | |||||||||||
Fulshear Run, Richmond | 2016 | 25 | 1 | 24 | 9 | 1 | $554 - $650 | |||||||||||
Cinco Ranch, Katy | 2015 | 93 | 93 | — | — | 1 | $396 - $530 | |||||||||||
Harvest Green 75', Richmond | 2016 | 20 | 9 | 11 | 3 | 9 | $421 - $477 | |||||||||||
Sienna Plantation 80', Missouri City | 2013 | 38 | 38 | — | — | 6 | $542 - $650 | |||||||||||
Sienna Plantation 85', Missouri City | 2016 | 25 | 10 | 15 | 5 | 10 | $535 - $640 | |||||||||||
Villas at Sienna South, Missouri City | 2016 | 19 | 9 | 10 | — | 9 | $445 - $507 | |||||||||||
Lakes of Bella Terra, Richmond | 2013 | 109 | 101 | 8 | 1 | 21 | $465 - $553 | |||||||||||
Villas at Aliana, Richmond | 2013 | 114 | 87 | 27 | 2 | 27 | $380 - $503 | |||||||||||
Riverstone 55', Sugar Land | 2013 | 97 | 96 | 1 | — | 16 | $437 - $467 | |||||||||||
Riverstone 80', Sugar Land | 2013 | 102 | 102 | — | — | 2 | $559 - $710 | |||||||||||
Riverstone Avanti at Avalon 100', Sugar Land | 2015 | 5 | 4 | 1 | 1 | 3 | $1,197 | |||||||||||
The Townhomes at Imperial, Sugar Land | 2015 | 27 | 27 | — | — | 7 | $396 - $530 | |||||||||||
Galveston County: | ||||||||||||||||||
Harborwalk, Hitchcock | 2014 | 50 | 50 | — | — | 6 | $680 - $686 | |||||||||||
Harris County: | ||||||||||||||||||
Fairfield, Cypress | 2010 | 91 | 91 | — | — | 14 | $530 - $595 | |||||||||||
Lakes of Fairhaven, Cypress | 2008 | 257 | 257 | — | — | 9 | $409 - $505 | |||||||||||
Towne Lake Living Views, Cypress | 2013 | 122 | 118 | 4 | 3 | 14 | $468 - $561 | |||||||||||
The Groves, Humble | 2015 | 50 | 29 | 21 | 8 | 15 | $436 - $498 | |||||||||||
Lakes of Creekside | 2016 | 21 | 1 | 20 | 4 | 1 | $476 - $550 | |||||||||||
Bridgeland '80, Cypress | 2015 | 100 | 84 | 16 | 9 | 14 | $502 - $591 | |||||||||||
Bridgeland Patio, Cypress | 2016 | 15 | 1 | 14 | 2 | 1 | $343 - $379 | |||||||||||
Elyson 70', Cypress | 2017 | 12 | — | 12 | 1 | — | $445 - $501 | |||||||||||
Hidden Arbor, Cypress | 2016 | 129 | 24 | 105 | 16 | 24 | $389 - $587 | |||||||||||
Clear Lake, Houston | 2015 | 770 | 182 | 588 | 42 | 60 | $360 - $660 | |||||||||||
Montgomery County: | ||||||||||||||||||
Barton Woods, Conroe | 2013 | 118 | 118 | — | — | 16 | $447 - $624 | |||||||||||
Villas at Oakhurst, Porter | 55 | 55 | — | — | 5 | $542 - $650 | ||||||||||||
Woodtrace, Woodtrace | 2014 | 37 | 18 | 19 | 4 | 7 | $430 - $479 | |||||||||||
Northgrove, Tomball | 2016 | 25 | 1 | 24 | — | 1 | $440 - $490 | |||||||||||
Bender's Landing Estates, Spring | 2014 | 104 | 39 | 65 | 2 | 16 | $471 - $567 | |||||||||||
The Woodlands, Creekside Park | 2016 | 92 | 14 | 78 | 2 | 14 | $415 - $624 | |||||||||||
Waller County: | ||||||||||||||||||
Cane Island, Katy | 2016 | 23 | 14 | 9 | 2 | 14 | $498 - $574 | |||||||||||
Mustang Estates | 2017 | 350 | — | 350 | — | — | TBD | |||||||||||
Williamson County: | ||||||||||||||||||
Crystal Falls | TBD | 29 | 3 | 26 | 2 | 3 | $460 - $530 | |||||||||||
Rancho Sienna 60' | TBD | 28 | 17 | 11 | — | — | TBD | |||||||||||
Hays County: | ||||||||||||||||||
Belterra 60', Austin | 2017 | 11 | — | 11 | — | — | $530 - $603 | |||||||||||
Belterra 80', Austin | 2016 | 38 | 6 | 32 | 1 | 6 | $535 - $603 | |||||||||||
Headwaters, Dripping Springs | 2017 | 14 | — | 14 | 1 | — | $420 - $479 | |||||||||||
- 12 -
Other: | ||||||||||||||||||
Avanti Custom Homes | 2007 | 125 | 121 | 4 | 2 | 21 | $480 - $856 | |||||||||||
Fulshear Run 1 Acre, Richmond | 2017 | — | — | — | 1 | — | $831 | |||||||||||
Texas Casual Cottages, Round Top | 2010 | 88 | 88 | — | — | 14 | $389 - $520 | |||||||||||
Texas Casual Cottages, Hill Country | 2012 | 46 | 46 | — | — | 2 | $443 - $500 | |||||||||||
Texas Total | 4,196 | 2,509 | 1,687 | 163 | 474 | |||||||||||||
Trendmaker Homes Total | 4,196 | 2,509 | 1,687 | 163 | 474 | |||||||||||||
- 13 -
TRI Pointe Homes
County, Project, City | Year of First Delivery(1) | Total Number of Lots(2) | Cumulative Homes Delivered as of December 31, 2016 | Lots Owned as of December 31, 2016(3) | Backlog as of December 31, 2016(4)(5) | Homes Delivered for the Twelve Months Ended December 31, 2016 | Sales Price Range (in thousands)(6) | |||||||||||
Southern California | ||||||||||||||||||
Orange County: | ||||||||||||||||||
Arcadia, Irvine | 2013 | 61 | 61 | — | — | 15 | $1,199 - $1,420 | |||||||||||
Arcadia II, Irvine | 2014 | 66 | 66 | — | — | 12 | $1,199 - $1,281 | |||||||||||
Fairwind, Huntington Beach | 2015 | 80 | 80 | — | — | 17 | $937 - $1,032 | |||||||||||
Cariz, Irvine | 2014 | 112 | 112 | — | — | 18 | $495 - $649 | |||||||||||
Messina, Irvine | 2014 | 59 | 50 | — | — | 12 | $1,515 - $1,660 | |||||||||||
Messina II, Irvine | 2016 | 43 | 20 | 16 | 4 | 20 | $1,515 - $1,660 | |||||||||||
Aria, Rancho Mission Viejo | 2016 | 87 | 48 | 39 | 12 | 45 | $618 - $671 | |||||||||||
Aria II, Rancho Mission Viejo | 2017 | 64 | — | 64 | — | — | TBD | |||||||||||
Aubergine, Rancho Mission Viejo | 2016 | 66 | 23 | 43 | 3 | 23 | $1,046 - $1,158 | |||||||||||
Aubergine II, Rancho Mission Viejo | 2017 | 57 | — | 57 | — | — | TBD | |||||||||||
Carlisle 10-Pack Garden Court, Irvine | 2017 | 74 | — | 74 | — | — | $685 - $770 | |||||||||||
Sterling Row Townhomes, Irvine | 2017 | 96 | — | 96 | — | — | $590 - $703 | |||||||||||
Varenna at Orchard Hills, Irvine | 2016 | 71 | 8 | 29 | 5 | 8 | $1,160 - $1,235 | |||||||||||
Alston, Anaheim | 2017 | 75 | — | 75 | — | — | $780 - $820 | |||||||||||
StrataPointe, Buena Park | 2017 | 149 | — | 149 | — | — | $496 - $615 | |||||||||||
Riverside County: | ||||||||||||||||||
Topazridge, Riverside | 2012 | 68 | 68 | — | — | 5 | $464 - $529 | |||||||||||
Topazridge II, Riverside | 2014 | 49 | 49 | — | — | 4 | $459 - $515 | |||||||||||
Aldea, Temecula | 2014 | 90 | 90 | — | — | 13 | $262 - $298 | |||||||||||
Kite Ridge, Riverside | 2014 | 87 | 62 | 25 | 18 | 44 | $459 - $487 | |||||||||||
Serrano Ridge at Sycamore Creek, Riverside | 2015 | 87 | 63 | 24 | 14 | 59 | $403 - $429 | |||||||||||
Terrassa Court, Corona | 2016 | 94 | 13 | 81 | 12 | 13 | $400 - $448 | |||||||||||
Terrassa Villas, Corona | 2016 | 52 | 6 | 46 | — | 6 | $438 - $478 | |||||||||||
Los Angeles County: | ||||||||||||||||||
Grayson, Santa Clarita | 2015 | 119 | 49 | 70 | 9 | 43 | $520 - $553 | |||||||||||
Garvey Square, El Monte | 2017 | 102 | — | 102 | — | — | TBD | |||||||||||
Bradford @ Rosedale, Azusa | 2017 | 52 | — | 27 | — | — | $846 - $891 | |||||||||||
Golden Valley/ Lucera at Aliento | 2017 | 67 | — | 67 | — | — | $620 - $645 | |||||||||||
Golden Valley/Tierno at Aliento | 2017 | 63 | — | 63 | — | — | $731 - $766 | |||||||||||
San Bernardino County: | ||||||||||||||||||
Sedona at Parkside, Ontario | 2015 | 152 | 92 | 60 | 28 | 79 | $384 - $421 | |||||||||||
Kensington at Park Place, Ontario | 2015 | 67 | 45 | 22 | 18 | 39 | $492 - $524 | |||||||||||
St. James at Park Place, Ontario | 2015 | 57 | 51 | 6 | — | 34 | $456 - $468 | |||||||||||
St. James II at Park Place, Ontario | 2017 | 68 | — | 34 | 18 | — | $463 - $480 | |||||||||||
Ventura County: | ||||||||||||||||||
The Westerlies, Oxnard | 2016 | 116 | 45 | 71 | 21 | 45 | $393 - $517 | |||||||||||
Southern California Total | 2,550 | 1,101 | 1,340 | 162 | 554 | |||||||||||||
Northern California | ||||||||||||||||||
Contra Costa County: | ||||||||||||||||||
Berkshire at Barrington, Brentwood | 2014 | 89 | 86 | 3 | — | 23 | $508 - $587 | |||||||||||
Hawthorne at Barrington, Brentwood | 2014 | 105 | 94 | 11 | 4 | 36 | $572 - $620 | |||||||||||
Marquette at Barrington, Brentwood | 2015 | 90 | 44 | 46 | 8 | 27 | $480 - $750 | |||||||||||
Wynstone at Barrington, Brentwood | 2017 | 92 | — | 92 | — | — | $480 - $610 | |||||||||||
Penrose at Barrington, Brentwood | 2016 | 34 | 20 | 14 | 4 | 20 | $508 - $587 | |||||||||||
Santa Clara County: | ||||||||||||||||||
Cobblestone, Milpitas | 2015 | 32 | 32 | — | — | 10 | $960 - $1,163 | |||||||||||
Derose, Morgan Hill | 2018 | 65 | — | 65 | — | — | $575 - $780 | |||||||||||
Solano County: | ||||||||||||||||||
Redstone, Vacaville | 2015 | 141 | 60 | 81 | 7 | 33 | $460 - $533 | |||||||||||
Green Valley-Lewis, Fairfield | 2018 | 91 | — | 91 | — | — | $475 - $510 | |||||||||||
Green Valley-Westgate, Fairfield | 2018 | 56 | — | 56 | — | — | $527 - $572 | |||||||||||
San Joaquin County: | ||||||||||||||||||
Ventana, Tracy | 2015 | 93 | 56 | 37 | 7 | 34 | $447 - $552 | |||||||||||
Sundance, Mountain House | 2015 | 113 | 74 | 39 | 20 | 65 | $595 - $675 | |||||||||||
Alameda County: | ||||||||||||||||||
- 14 -
Cadence, Alameda Landing | 2015 | 91 | 62 | 29 | 9 | 24 | $1,125 - $1,300 | |||||||||||
Linear, Alameda Landing | 2015 | 106 | 64 | 42 | — | 10 | $784 - $1,020 | |||||||||||
Symmetry, Alameda Landing | 2016 | 56 | 26 | 30 | 2 | 26 | $880 - $965 | |||||||||||
Commercial, Alameda Landing | 2 | — | 2 | — | — | $620 | ||||||||||||
Parasol, Fremont | 2016 | 39 | 24 | 15 | 7 | 24 | $770 - $1,050 | |||||||||||
Blackstone at the Cannery, Hayward SFA | 2016 | 105 | 24 | 81 | 3 | 24 | $586 - $686 | |||||||||||
Blackstone at the Cannery, Hayward SFD | 2016 | 52 | 19 | 33 | 6 | 19 | $689 - $749 | |||||||||||
Coopers Place, Livermore | 2017 | 31 | — | 31 | — | — | $660 - $670 | |||||||||||
Slate at Jordan Ranch, Dublin | 2017 | 56 | — | 56 | — | — | $1,025 - $1,144 | |||||||||||
Onyx at Jordan Ranch, Dublin | 2017 | 105 | — | 105 | — | — | $885 - $950 | |||||||||||
Jordan Ranch II, Dublin | 2018 | 45 | — | 45 | — | — | $855 - $1,035 | |||||||||||
Mission Stevenson, Fremont | 2018 | 77 | — | 77 | — | — | $650 - $965 | |||||||||||
Palm Avenue, Fremont | 2018 | 31 | — | 31 | — | — | $2,030 - $2,176 | |||||||||||
Northern California Total | 1,797 | 685 | 1,112 | 77 | 375 | |||||||||||||
California Total | 4,347 | 1,786 | 2,452 | 239 | 929 | |||||||||||||
Colorado | ||||||||||||||||||
Douglas County: | ||||||||||||||||||
Terrain 4000 Series, Castle Rock | 2013 | 149 | 142 | 7 | — | 42 | $358 - $411 | |||||||||||
Terrain 3500 Series, Castle Rock | 2015 | 67 | 64 | 3 | — | 27 | $327 - $350 | |||||||||||
Terrain Ravenwood Village (3500) | 2017 | 157 | — | 88 | — | — | $379 - $426 | |||||||||||
Terrain Ravenwood Village (4000) | 2017 | 100 | — | 38 | — | — | $400 - $463 | |||||||||||
Jefferson County: | ||||||||||||||||||
Leyden Rock 4000 Series, Arvada | 2014 | 51 | 51 | — | — | 6 | $390 - $446 | |||||||||||
Leyden Rock 5000 Series, Arvada | 2015 | 67 | 64 | 3 | 2 | 34 | $454 - $509 | |||||||||||
Candelas 6000 Series, Arvada | 2015 | 76 | 21 | 55 | 14 | 15 | $511 - $658 | |||||||||||
Candelas 3500 Series, Arvada | 2016 | 97 | 4 | 93 | 7 | 4 | $401 - $463 | |||||||||||
Candelas 5000 Series, Arvada | 2017 | 62 | — | 62 | — | — | $498 - $565 | |||||||||||
Candelas 4000 Series, Arvada | 2017 | 102 | — | — | — | — | $425 - $478 | |||||||||||
Denver County: | ||||||||||||||||||
Platt Park North, Denver | 2014 | 29 | 29 | — | — | 1 | $611 - $615 | |||||||||||
Larimer County: | ||||||||||||||||||
Centerra 5000 Series, Loveland | 2015 | 79 | 39 | 40 | 20 | 27 | $411 - $453 | |||||||||||
Arapahoe County: | ||||||||||||||||||
Whispering Pines, Aurora | 2016 | 115 | 3 | 112 | 12 | 3 | $569 - $635 | |||||||||||
Adams County: | ||||||||||||||||||
Amber Creek, Thornton | 2017 | 121 | 1 | 120 | 4 | 1 | $391 - $464 | |||||||||||
Colorado Total | 1,272 | 418 | 621 | 59 | 160 | |||||||||||||
TRI Pointe Total | 5,619 | 2,204 | 3,073 | 298 | 1,089 | |||||||||||||
- 15 -
Winchester Homes
County, Project, City | Year of First Delivery(1) | Total Number of Lots(2) | Cumulative Homes Delivered as of December 31, 2016 | Lots Owned as of December 31, 2016(3) | Backlog as of December 31, 2016(4)(5) | Homes Delivered for the Twelve Months Ended December 31, 2016 | Sales Price Range (in thousands)(6) | |||||||||||
Maryland | ||||||||||||||||||
Anne Arundel County: | ||||||||||||||||||
Two Rivers, Crofton | 2017 | 4 | — | 4 | — | — | TBD | |||||||||||
Watson's Glen, Millersville | 2015 | 103 | 4 | 99 | — | 2 | Closed | |||||||||||
Frederick County: | ||||||||||||||||||
Landsdale, Monrovia | — | |||||||||||||||||
Landsdale Village SFD | 2015 | 222 | 40 | 182 | 15 | 24 | $495 - $607 | |||||||||||
Landsdale Townhomes | 2015 | 100 | 26 | 74 | 1 | 23 | $335 - $375 | |||||||||||
Landsdale TND Neo SFD | 2016 | 77 | 14 | 63 | 6 | 14 | $435 - $468 | |||||||||||
Howard County: | ||||||||||||||||||
Walnut Creek, Ellicott City | 2014 | 25 | 24 | 1 | — | 9 | $1,182 - $1,409 | |||||||||||
Montgomery County: | ||||||||||||||||||
Cabin Branch, Clarksburg | ||||||||||||||||||
Cabin Branch SFD | 2014 | 359 | 91 | 268 | 27 | 48 | $498 - $607 | |||||||||||
Cabin Branch Boulevard Townhomes | TBD | 121 | — | 121 | — | — | TBD | |||||||||||
Cabin Branch Townhomes | 2014 | 507 | 131 | 376 | 18 | 68 | $380 - $423 | |||||||||||
Preserve at Stoney Spring | N/A | — | — | 5 | — | — | N/A | |||||||||||
Preserve at Rock Creek, Rockville | 2012 | 68 | 68 | — | — | 5 | $784 - $818 | |||||||||||
Poplar Run, Silver Spring | ||||||||||||||||||
Poplar Run Townhomes | 2013 | 136 | 136 | — | — | 18 | $390 - $435 | |||||||||||
Poplar Run SFD | 2010 | 305 | 249 | 56 | 19 | 32 | $572 - $771 | |||||||||||
Poplar Run Single Family Neos | 2016 | 29 | 15 | 14 | 10 | 15 | $545 - $635 | |||||||||||
Potomac Highlands, Potomac | 2017 | 23 | — | 23 | 4 | — | $1,191 - $1,289 | |||||||||||
Glenmont MetroCenter, Silver Spring | 2016 | 171 | 7 | 164 | 2 | 7 | TBD | |||||||||||
Twinbrook Metro, Rockville | 2018 | 61 | — | 61 | — | — | $495 - $578 | |||||||||||
Closed Communities | N/A | — | — | — | — | — | TBD | |||||||||||
Maryland Total | 2,311 | 805 | 1,511 | 102 | 265 | |||||||||||||
Virginia | ||||||||||||||||||
Fairfax County: | ||||||||||||||||||
Reserve at Waples Mill, Oakton | 2013 | 28 | 28 | — | — | 3 | $1,460 | |||||||||||
Stuart Mill & Timber Lake, Oakton | 2014 | 14 | 7 | 7 | 1 | 2 | $1,363 - $1,675 | |||||||||||
Stuart Mill -Lots for Sale, Oakton | N/A | 5 | — | 5 | — | — | N/A | |||||||||||
Prince William County: | ||||||||||||||||||
Villages of Piedmont, Haymarket | 2015 | 168 | 49 | 119 | 4 | 32 | $370 - $428 | |||||||||||
Loudoun County: | ||||||||||||||||||
Brambleton, Ashburn | ||||||||||||||||||
English Manor Villas | 2014 | 58 | 49 | 9 | 6 | 24 | $495 - $545 | |||||||||||
Glenmere at Brambleton SFD | 2014 | 100 | 96 | 4 | 4 | 33 | $650 - $733 | |||||||||||
Glenmere at Brambleton Townhomes | 2014 | 107 | 107 | — | — | 35 | $470 - $474 | |||||||||||
Vistas at Lansdowne, Lansdowne | 2015 | 120 | 38 | 82 | 1 | 20 | $569 - $670 | |||||||||||
Westbrook, Fairfax | 2018 | 24 | — | 24 | — | — | TBD | |||||||||||
Willowsford Grant II, Aldie | 2017 | 19 | — | 19 | 4 | — | $1,200 - $1,326 | |||||||||||
Willowsford Greens, Aldie | 2014 | 38 | 30 | 8 | 1 | 6 | $760 - $840 | |||||||||||
Closed Communities | N/A | — | — | — | — | — | ||||||||||||
Virginia Total | 681 | 404 | 277 | 21 | 155 | |||||||||||||
Winchester Total | 2,992 | 1,209 | 1,788 | 123 | 420 | |||||||||||||
Combined Company Total | 36,376 | 10,756 | 25,283 | 1,193 | 4,211 | |||||||||||||
______________________________________________
(1) | Year of first delivery for future periods is based upon management's estimates and is subject to change. |
- 16 -
(2) | The number of homes to be built at completion is subject to change, and there can be no assurance that we will build these homes. |
(3) | Owned lots as of December 31, 2016 include owned lots in backlog as of December 31, 2016. |
(4) | Backlog consists of homes under sales contracts that had not yet been delivered, and there can be no assurance that delivery of sold homes will occur. See “Backlog” below. |
(5) | Of the total homes subject to pending sales contracts that have not been delivered as of December 31, 2016, 715 homes are under construction, 179 homes have completed construction, and 299 homes have not started construction. |
(6) | Sales price range reflects base price only and excludes any lot premium, homebuyer incentives and homebuyer-selected options, which may vary from project to project. Sales prices for homes required to be sold pursuant to affordable housing requirements are excluded from sales price range. Sales prices reflect current pricing and might not be indicative of past or future pricing. |
Acquisition Process
We believe that our current inventory of lots owned or controlled will be adequate to supply our homebuilding operations for the foreseeable future. Our acquisition process generally includes the following steps to reduce development and market cycle risk:
• | review of the status of entitlements and other governmental processing, including title reviews; |
• | limitation on the size of an acquisition to minimize investment levels in any one project; |
• | completion of due diligence on the land parcel prior to committing to the acquisition; |
• | preparation of detailed budgets for all cost categories; |
• | completion of environmental reviews and third-party market studies; |
• | utilization of options, joint ventures and other land acquisition arrangements, if necessary; and |
• | employment of centralized control of approval over all acquisitions through a land committee process. |
Before purchasing a land parcel, we also engage outside architects and consultants to help review our proposed acquisition and design our homes and communities.
We acquire land parcels pursuant to purchase agreements that are often structured as option contracts. These option contracts require us to pay non-refundable deposits, which can vary by transaction, and entitle (but do not obligate) us to acquire the land typically at fixed prices. The term within which we can exercise our option varies by transaction and our acquisition is often contingent upon the completion of entitlement or other work with regard to the land (such as "backbone" improvements, which include the installation of main roads or sewer mains). Depending upon the transaction, we may be required to purchase all of the land involved at one time or we may have a right to acquire identified groups of lots over a specified timetable. In some transactions, a portion of the consideration that we pay for the land may be in the form of a share of the profits of a project after we receive an agreed upon level of profits from the project. In limited instances such as when we acquire land from a master developer that is part of a larger project, the seller may have repurchase rights entitling it to repurchase the land from us under circumstances when we do not develop the land by an outside deadline (unless the delay is caused by certain circumstances outside our control), or when we seek to sell the land directly to a third party or indirectly through a change in control of our company. Repurchase rights typically allow the seller to repurchase the land at the price that we paid the seller to acquire the land plus the cost of improvements that we have made to the land and less some specified discount.
Our Community Development, Construction and Sales and Marketing Process
Community Development
In California, we typically develop community phases based upon projected sales, and we construct homes in each phase whether or not they have been pre-sold. We have the ability to control the timing of construction of subsequent phases in the same community based on sales activity in the prior phase, market conditions and other factors. We also will attempt to delay much of the customization of a home until a qualified homebuyer has been approved, so as to enable the homebuyer to tailor the home to that homebuyer's specifications; however, we will complete the build out of any unsold homes in a particular phase when deemed appropriate for marketing purposes of such home. In our other regions, we typically develop communities on a lot by lot basis driven by sales demand.
The design of our homes is limited by factors such as zoning requirements, building codes and energy efficiency laws. As a result, we contract with a number of architects and other consultants in connection with the design process.
- 17 -
Construction
Substantially all of our construction work is done by subcontractors with us acting as the general contractor. We also enter into contracts as needed with design professionals and other service providers who are familiar with local market conditions and requirements. We do not have long-term contractual commitments with our subcontractors, suppliers or laborers. We maintain strong and long-standing relationships with many of our subcontractors. We believe that our relationships have been enhanced through both maintaining our schedules and making timely payment to our subcontractors. By dealing fairly with our key subcontractors, we are able to keep them attentive to our projects.
Sales and Marketing
In connection with the sale and marketing of our homes, we make extensive use of online and offline advertising and other promotional activities, including digital paid search and display advertising, the website of each of our six regional brands, print media advertisements, brochures, direct mail and the placement of signboards in the immediate areas of our developments. We sell our homes through our own sales representatives and through independent real estate brokers. Our in-house sales force typically works from sales offices located in model homes close to or in each community. Sales representatives assist potential homebuyers by providing them with basic floor plans, price information, development and construction timetables, tours of model homes, and the selection of options. Sales personnel are licensed by the applicable real estate bodies in their respective markets, are trained by us and generally have had prior experience selling new homes in the local market. Our personnel, along with subcontracted marketing and design consultants, carefully design exteriors and interiors of each home to coincide with the lifestyles of targeted homebuyers.
As of December 31, 2016, we owned 252 model homes that were either completed or under construction. Generally, we build model homes at each project and have them professionally decorated to display design features. We believe that model homes play a significant role in helping homebuyers understand the efficiencies and value provided by each floor plan type. Interior decorations vary among our models and are selected based upon the lifestyles of our targeted homebuyers. Structural changes in design from the model homes are not generally permitted, but homebuyers may select various other optional construction and design amenities. In addition to model homes, homebuyers can gain an understanding of the various design features and options available to them using design centers. At each design center, homebuyers can meet with a designer and are shown the standard and upgraded selections available to them.
We typically sell homes using sales contracts that include cash deposits by the purchasers. However, purchasers can generally cancel sales contracts if they are unable to sell their existing homes, if they fail to qualify for financing, or under certain other circumstances. Although cancellations can delay the sale of our homes, they have historically not had a material impact on our operating results. The cancellation rate of homebuyers who contracted to buy a home but did not close escrow (as a percentage of overall orders) was 15% and 16% for the years ended December 31, 2016 and 2015, respectively. Cancellation rates are subject to a variety of factors beyond our control such as adverse economic conditions and increases in mortgage interest rates. Our inventory of completed and unsold production homes was 405 and 351 homes as of December 31, 2016 and 2015, respectively.
Homebuyer Financing and Title Services
We seek to assist our homebuyers in obtaining financing by arranging with mortgage lenders to offer qualified homebuyers a variety of financing options. Substantially all homebuyers utilize long-term mortgage financing to purchase a home and mortgage lenders will usually make loans only to qualified borrowers. Our financial services operation (“TRI Pointe Solutions”) is comprised of mortgage financing operations (“TRI Pointe Connect”), which was formed as a joint venture with an established mortgage lender, and title services operations (“TRI Pointe Assurance”). While our homebuyers may obtain financing from any mortgage provider of their choice, TRI Pointe Connect can act as a preferred mortgage broker to our homebuyers in all of the markets in which we operate, providing mortgage financing options that help facilitate the sale and closing process as well as generate additional fee income for us. TRI Pointe Assurance provides title examinations for our homebuyers in our Trendmaker Homes and Winchester Homes brands. TRI Pointe Assurance is a wholly owned subsidiary of TRI Pointe and acts as a title agency for First American Title Insurance Company.
Quality Control and Customer Service
We pay particular attention to the product design process and carefully consider quality and choice of materials in order to attempt to eliminate building deficiencies. We monitor the quality and workmanship of the subcontractors that we employ and we make regular inspections and evaluations of our subcontractors to seek to ensure that our standards are met.
- 18 -
We maintain quality control and customer service staff whose role includes providing a positive experience for each homebuyer throughout the pre-sale, sale, building, delivery and post-delivery periods. These employees are also responsible for providing after sales customer service. Our quality and service initiatives include taking homebuyers on a comprehensive tour of their home prior to delivery and using homebuyer survey results to improve our standards of quality and homebuyer satisfaction.
Warranty Program
In the normal course of business, we incur warranty-related costs associated with homes that have been delivered to homebuyers. Estimated future direct warranty costs are accrued and charged to cost of sales in the period when the related home sales revenues are recognized while indirect warranty overhead salaries and related costs are charged to cost of sales in the period incurred. Estimation of accruals include consideration of our claims history, including current claims and estimates of claims incurred but not yet reported. In addition, management estimates warranty reserves and allowances necessary to cover any current or future construction-related claims based on actuarial analysis. Under this analysis, reserve amounts are estimated using our historical expense and claim data, as well as industry data. Factors that affect the warranty accruals include the number of homes delivered, historical and anticipated rates of warranty claims and cost per claim. Although we consider the warranty accruals reflected in our consolidated balance sheet to be adequate, actual future costs could differ significantly from our currently estimated amounts. Our warranty accrual is included in accrued expenses and other liabilities in our consolidated balance sheets included elsewhere in this annual report on Form 10-K. We maintain general liability insurance designed to protect us against a portion of our risk of loss from construction-related claims. We also generally require our subcontractors and design professionals to indemnify us for liabilities arising from their work, subject to various limitations. However, such indemnity is significantly limited with respect to certain subcontractors that are added to our general liability insurance policy. We record expected recoveries from insurance carriers when proceeds are probable and estimable. Warranty insurance receivables are recorded in receivables on the accompanying consolidated balance sheet.
There can be no assurance that the terms and limitations of the limited warranty will be effective against claims made by homebuyers, that we will be able to renew our insurance coverage or renew it at reasonable rates, that we will not be liable for damages, cost of repairs, and/or the expense of litigation surrounding possible construction defects, soil subsidence or building related claims or that claims will not arise out of uninsurable events or circumstances not covered by insurance and not subject to effective indemnification agreements with certain subcontractors.
Seasonality
We have experienced seasonal variations in our quarterly operating results and capital requirements. We typically take orders for more homes in the first half of the fiscal year than in the second half, which creates additional working capital requirements in the second and third quarters to build our inventories to satisfy the deliveries in the second half of the year. We expect this seasonal pattern to continue over the long-term, although it may be affected by volatility in the homebuilding industry. In addition to the overall volume of orders and deliveries, our operating results in a given quarter are significantly affected by the number and characteristics of our active selling communities; timing of new community openings; the timing of land and lot sales; and the mix of product types, geographic locations and average selling prices of the homes delivered during the quarter. Therefore, our operating results in any given quarter will fluctuate compared to prior periods based on these factors.
Backlog
Backlog units reflects the number of homes, net of actual cancellations experienced during the period, for which we have entered into a sales contract with a homebuyer but for which we have not yet delivered the home. Homes in backlog are generally delivered within three to nine months, although we may experience cancellations of sales contracts prior to delivery. The dollar value of backlog was approximately $661.1 million and $697.3 million as of December 31, 2016 and 2015, respectively. We expect all of our backlog at December 31, 2016 to be converted to deliveries and revenues during 2017, net of cancellations. For information concerning backlog units, the dollar value and average sales price by segment, see Part II, Item 7, "Management's Discussion and Analysis of Financial Condition and Results of Operations" included in this annual report on Form 10-K.
- 19 -
Raw Materials
Typically, all of the raw materials and most of the components used in our business are readily available in the United States. Most are standard items carried by major suppliers. However, a rapid increase in the number of homes started or other market conditions could cause delays in the delivery of, shortages in, or higher prices for necessary materials. Delivery delays or the inability to obtain necessary materials could result in delays in the delivery of homes under construction. We have established national purchase programs for certain materials and we continue to monitor the supply markets to achieve the best prices available.
Our Financing Strategy
We intend to employ both debt and equity as part of our ongoing financing strategy, coupled with redeployment of cash flows from continuing operations, to provide us with the financial flexibility to access capital on the best terms available. In that regard, we expect to employ prudent levels of leverage to finance the acquisition and development of our lots and construction of our homes. As of December 31, 2016, we had $200.0 million outstanding related to our unsecured revolving credit facility, $13.7 million of seller financed loans and $1.2 billion of outstanding senior notes as well as $208.7 million in cash and cash equivalents and $420.7 million available under our unsecured revolving credit facility. Our board of directors considers a number of factors when evaluating our level of indebtedness and when making decisions regarding the incurrence of new indebtedness, including the purchase price of assets to be acquired with debt financing, the estimated market value of our assets and the ability of particular assets, and our company as a whole, to generate cash flow to cover the expected debt service. As a means of sustaining our long-term financial health and limiting our exposure to unforeseen dislocations in the debt and financing markets, we currently expect to remain conservatively capitalized. However, our charter does not contain a limitation on the amount of debt we may incur and our board of directors may change our target debt levels at any time without the approval of our stockholders.
We intend to finance future acquisitions and developments with the most advantageous source of capital available to us at the time of the transaction, which may include a combination of common and preferred equity, secured and unsecured corporate level debt, property-level debt and mortgage financing and other public, private or bank debt.
Segments
The Company's operations are organized in two principal businesses: homebuilding and financial services.
Our homebuilding operation consists of six reportable segments: Maracay Homes, consisting of operations in Arizona; Pardee Homes, consisting of operations in California and Nevada; Quadrant Homes, consisting of operations in Washington; Trendmaker Homes, consisting of operations in Texas; TRI Pointe Homes, consisting of operations in California and Colorado; and Winchester Homes, consisting of operations in Maryland and Virginia.
Our financial services operation (TRI Pointe Solutions) is a reportable segment and is comprised of our TRI Pointe Connect mortgage financing operations and our TRI Pointe Assurance title services operations.
For financial information about our segments, see Part II, Item 7, "Management's Discussion and Analysis of Financial Condition and Results of Operations" and Note 4, Segment Information, of the notes to our consolidated financial statements included elsewhere in this annual report on Form 10-K.
Government Regulation and Environmental Matters
We are subject to numerous local, state, federal and other statutes, ordinances, rules and regulations concerning zoning, development, building design, construction and similar matters which impose restrictive zoning and density requirements, the result of which is to limit the number of homes that can be built within the boundaries of a particular area. Projects that are not entitled may be subjected to periodic delays, changes in use, less intensive development or elimination of development in certain specific areas due to government regulations. We may also be subject to periodic delays or may be precluded entirely from developing in certain communities due to building moratoriums or "slow-growth" or "no-growth" initiatives that could be implemented in the future. Local governments also have broad discretion regarding the imposition of development fees and exactions for projects in their jurisdiction. Projects for which we have received land use and development entitlements or approvals may still require a variety of other governmental approvals and permits during the development process and can also be impacted adversely by unforeseen health, safety and welfare issues, which can further delay these projects or prevent their development. Also, some states are attempting to make homebuilders responsible for violations of wage and other labor laws by their contractors. Recent National Labor Relations Board decisions may give support to these efforts if they are upheld.
- 20 -
We are also subject to a variety of local, state, federal and other statutes, ordinances, rules and regulations concerning the environment. These environmental laws include such areas as storm water and surface water management, soil, groundwater and wetlands protection, subsurface conditions and air quality protection and enhancement. The particular environmental laws that apply to any given homebuilding site vary according to multiple factors, including the site's location, its environmental conditions and the present and former uses of the site, as well as adjoining properties. Environmental laws and conditions may result in delays, may cause us to incur substantial compliance and other costs, and can prohibit or severely restrict homebuilding activity in environmentally sensitive regions or areas. In addition, in those cases where an endangered or threatened species is involved, environmental rules and regulations can result in the restriction or elimination of development in identified environmentally sensitive areas. From time to time, the United States Environmental Protection Agency and similar federal or state agencies review homebuilders' compliance with environmental laws and may levy fines and penalties for failure to strictly comply with applicable environmental laws or impose additional requirements for future compliance as a result of past failures. Any such actions taken with respect to us may increase our costs. Further, we expect that as concerns about climate change and other environmental issues continue to grow, homebuilders will be required to comply with increasingly stringent laws and regulations. Environmental laws and regulations can also have an adverse impact on the availability and price of certain raw materials such as lumber. California is especially susceptible to restrictive government regulations and environmental laws. In addition, home deliveries in California may be delayed or prevented due to governmental responses to California’s long-term drought, even when we have obtained water rights for those projects.
Under various environmental laws, current or former owners of real estate, as well as certain other categories of parties, may be required to investigate and clean up hazardous or toxic substances or petroleum product releases, and may be held liable to a governmental entity or to third parties for related damages, including for bodily injury, and for investigation and clean-up costs incurred by such parties in connection with the contamination. A mitigation system may be installed during the construction of a home if a cleanup does not remove all contaminants of concern or to address a naturally occurring condition such as methane. Some homebuyers may not want to purchase a home with a mitigation system.
Our general contractor, real estate broker, mortgage joint venture and title agency operations are subject to licensing and regulation in the jurisdictions in which they operate. Consequently, they are subject to net worth, bonding, disclosure, record-keeping and other requirements. Failure to comply with applicable requirements could result in loss of license, financial penalties, or other sanctions.
Refer to Part I, Item 1A. "Risk Factors" of this annual report on Form 10-K for risks related to government regulation and environmental matters.
Competition
Competition in the homebuilding industry is intense, and there are relatively low barriers to entry into our business. Homebuilders compete for, among other things, homebuyers, desirable land parcels, financing, raw materials and skilled labor. We compete for homebuyers primarily on the basis of a number of interrelated factors including home design and location, price, homebuyer satisfaction, construction quality, reputation and the availability of mortgage financing. Increased competition could hurt our business, as it could prevent us from acquiring attractive land parcels on which to build homes or make such acquisitions more expensive, hinder our market share expansion, and lead to pricing pressures on our homes that may adversely impact our margins and revenues. Our competitors may independently develop land and construct housing units that are superior or substantially similar to our products. Furthermore, several of our primary competitors are significantly larger, have longer operating histories and may have greater resources or lower cost of capital than ours; accordingly, they may be able to compete more effectively in one or more of the markets in which we operate. Many of these competitors also have longstanding relationships with subcontractors and suppliers in the markets in which we operate. We also compete for sales with individual resales of existing homes and with available rental housing.
Employees
As of December 31, 2016, we had 1,137 employees, 482 of whom were executive, management and administrative personnel, 267 of whom were sales and marketing personnel and 388 of whom were involved in field construction. Although none of our employees are covered by collective bargaining agreements, certain of the subcontractors engaged by us are represented by labor unions or are subject to collective bargaining arrangements. We believe that our relations with our employees and subcontractors are good.
- 21 -
Our Offices and Access to Information
Our principal executive offices are located at 19540 Jamboree Road, Suite 300, Irvine, California 92612. Our main telephone number is (949) 438-1400. Our internet website is www.tripointegroup.com. We make available free of charge through our website our annual reports on Form 10-K, quarterly reports on Form 10-Q, current reports on Form 8-K, and amendments to these reports filed or furnished pursuant to Section 13(d) or 15(d) of the Exchange Act as soon as reasonably practicable after being filed with, or furnished to, the Securities and Exchange Commission (“SEC”). The information contained in, or that can be accessed through, our website is not incorporated by reference and is not a part of this annual report on Form 10-K. In addition, the SEC website at www.sec.gov contains reports, proxy and information statements, and other information we file with, or furnish to, the SEC.
Item 1A. | Risk Factors |
Investors should carefully consider the following risk factors, which address the material risks concerning our business, together with the other information contained in this annual report on Form 10-K. If any of the risks discussed in this annual report on Form 10-K occur, our business, liquidity, financial condition and results of operations (individually and collectively referred to in these risk factors as “Financial Performance”) could be materially and adversely affected, in which case the trading price of our common stock could decline significantly and stockholders could lose all or a part of their investment. Some statements in this annual report on Form 10-K, including statements in the following risk factors, constitute forward-looking statements. Please refer to the initial section of this annual report on Form 10-K entitled “Cautionary Note Concerning Forward-Looking Statements.”
Risks Related to Our Business
Our long-term growth depends upon our ability to successfully identify and acquire desirable land parcels at reasonable prices.
Our future growth depends upon our ability to successfully identify and acquire attractive land parcels for development of our projects at reasonable prices and with terms that meet our underwriting criteria. Our ability to acquire land parcels for new projects may be adversely affected by changes in the general availability of land parcels, the willingness of land sellers to sell land parcels at reasonable prices, competition for available land parcels, availability of financing to acquire land parcels, zoning and other market conditions. If the supply of land parcels appropriate for development of projects is limited because of these factors, or for any other reason, our ability to grow could be significantly limited, and the number of homes that we build and sell could decline. Additionally, our ability to begin new projects could be impacted if we elect not to purchase land parcels under option contracts. To the extent that we are unable to purchase land parcels in a timely manner or enter into new contracts for the purchase of land parcels at reasonable prices, our home sales revenue and Financial Performance could be materially and adversely affected.
Our quarterly results of operations may fluctuate because of the seasonal nature of our business and other factors.
We have experienced seasonal fluctuations in quarterly results of operations and capital requirements that can have a material and adverse impact on our Financial Performance. In addition, we have experienced fluctuations in quarterly results of operations due to the number and characteristics of our active selling communities; the timing of new community openings; the timing of land and lot sales; and the mix of product types, geographic locations and average selling prices of the homes delivered during the quarter. We typically experience the highest new home order activity during the first and second quarters of our fiscal year. Since it typically takes four to six months to construct a new home, the number of homes delivered and associated home sales revenue typically increases in the third and fourth quarters of our fiscal year as new home orders sold earlier in the year convert to home deliveries. We believe that this type of seasonality reflects the historical tendency of homebuyers to purchase new homes in the spring and summer with deliveries scheduled in the fall or winter, as well as the scheduling of construction to accommodate seasonal weather conditions in certain markets. Although we expect this seasonal pattern to continue over the long-term, it may be affected by market cyclicality and other market factors, including seasonal natural disasters such as hurricanes, tornadoes, floods and fires, and there can be no assurance that historical seasonal patterns will continue to exist in future reporting periods. In addition, as a result of seasonal variability, our historical performance may not be a meaningful indicator of future results.
Seasonality also requires us to finance construction activities in advance of the receipt of sales proceeds. In many cases, we may not be able to recapture increased costs by raising prices because prices are established upon signing the purchase contract. Accordingly, there is a risk that we will invest significant amounts of capital in the acquisition and development of land and construction of homes that we do not sell at anticipated pricing levels or within anticipated time frames. If, due to market conditions, construction delays or other causes, we do not complete sales of our homes at anticipated pricing levels or within anticipated time frames, our Financial Performance could be materially and adversely affected.
- 22 -
Our business is cyclical and subject to risks associated with the real estate industry, and adverse changes in general economic or business conditions could reduce the demand for homes and materially and adversely affect us.
The residential homebuilding and land development industry is cyclical and is substantially affected by adverse changes in general economic or business conditions that are outside of our control, including changes in:
• | short- and long-term interest rates; |
• | the availability and cost of financing for real estate industry participants, including financing for acquisitions, construction and permanent mortgages; |
• | unanticipated increases in expenses, including, without limitation, insurance costs, labor and materials costs, development costs, real estate assessments and other taxes and costs of compliance with laws, regulations and governmental policies; |
• | enforcement of laws, regulations and governmental policies, including, without limitation, health, safety, environmental, labor, employment, zoning and tax laws, governmental fiscal policies and the Americans with Disabilities Act of 1990; |
• | consumer confidence generally and the confidence of potential homebuyers and others in the real estate industry in particular; |
• | financial conditions of buyers and sellers of properties, particularly residential homes and land suitable for development of residential homes; |
• | the ability of existing homeowners to sell their existing homes at prices that are acceptable to them; |
• | the U.S. and global financial systems and credit markets, including stock market and credit market volatility; |
• | private and federal mortgage financing programs and federal and state regulation of lending practices; |
• | the availability and cost of construction, labor and materials; |
• | federal and state income tax provisions, including provisions for the deduction of mortgage interest payments and capital gain tax rates; |
• | housing demand from population growth, household formation and demographic changes (including immigration levels and trends in urban and suburban migration); |
• | the supply of available new or existing homes and other housing alternatives, such as condominiums, apartments and other residential rental property; |
• | competition from other real estate investors with significant capital, including other real estate operating companies and developers and institutional investment funds; |
• | employment levels and job and personal income growth and household debt-to-income levels; |
• | the rate of inflation; |
• | real estate taxes; and |
• | the supply of, and demand for, developable land in our current and expected markets. |
Adverse changes in these or other general economic or business conditions may affect our business nationally or in particular regions or localities. During the recent economic downturn, several of the markets we serve, and the U.S. housing market as a whole, experienced a prolonged decrease in demand for new homes, as well as an oversupply of new and existing homes available for sale. Demand for new homes is affected by weakness in the resale market because many new homebuyers need to sell their existing homes in order to buy a home from us. In addition, demand may be adversely affected by alternatives to new homes, such as rental properties and existing homes. In the event of another economic downturn or if general economic conditions should worsen, our home sales could decline and we could be required to write down or dispose of assets or restructure our operations or debt, any of which could have a material adverse effect on our Financial Performance.
Adverse changes in economic or business conditions can also cause increased home order cancellation rates, diminished demand and prices for our homes, and diminished value of our real estate investments. These changes can also cause us to take longer to build homes and make it more costly for us to do so. We may not be able to recover any of the increased costs by raising prices because of weak market conditions and increasing pricing pressure. Additionally, the price of each home we sell is usually set several months before the home is delivered, as many homebuyers sign their home purchase contracts before or early in the construction process. The potential difficulties described above could impact our homebuyers’ ability to obtain suitable financing and cause some homebuyers to cancel or refuse to honor their home purchase contracts altogether.
- 23 -
Because most of our homebuyers finance the purchase of their homes, the terms and availability of mortgage financing can affect the demand for and the ability to complete the purchase of a home, which could materially and adversely affect us.
Our business depends on the ability of our homebuyers to obtain financing for the purchase of their homes. Many of our homebuyers must sell their existing homes in order to buy a home from us. During the recent economic downturn, the U.S. residential mortgage market as a whole experienced significant instability due to, among other things, defaults on subprime and other loans, resulting in the declining market value of such loans. In light of these developments, lenders, investors, regulators and other third parties questioned the adequacy of lending standards and other credit requirements. This led to tightened credit requirements and an increase in indemnity claims for mortgages. Deterioration in credit quality among subprime and other nonconforming loans has caused most lenders to eliminate subprime mortgages and most other loan products that do not conform to Federal National Mortgage Association (“Fannie Mae”), Federal Home Loan Mortgage Corporation (“Freddie Mac”), Federal Housing Administration (the “FHA”) or Veterans Administration (the “VA”) standards. Fewer loan products and tighter loan qualifications, in turn, make it more difficult for a borrower to finance the purchase of a new home or the purchase of an existing home from a potential homebuyer who wishes to purchase one of our homes. If our potential homebuyers or the buyers of our homebuyers’ existing homes cannot obtain suitable financing, our Financial Performance could be materially and adversely affected.
Interest rate increases or changes in federal lending programs or other regulations could lower demand for our homes, which could materially and adversely affect us.
Substantially all purchasers of our homes finance their acquisitions with mortgage financing. In December 2016, the U.S. Federal Open Market Committee raised the target range for the federal funds rate to ½ to ¾ percent. We are unable to predict if, or when, the Federal Open Market Committee will announce further increases or the impact of any such increases on home mortgage interest rates. Rising interest rates, decreased availability of mortgage financing or of certain mortgage programs, higher down payment requirements or increased monthly mortgage costs may lead to reduced demand for our homes. Increased interest rates can also hinder our ability to realize our backlog because our home purchase contracts provide homebuyers with a financing contingency. Financing contingencies allow homebuyers to cancel their home purchase contracts in the event that they cannot arrange for adequate financing. As a result, rising interest rates can decrease our home sales and mortgage originations. Any of these factors could have a material adverse effect on our Financial Performance.
In addition, the uncertainties in the mortgage markets and increased government regulation could adversely affect the ability of potential homebuyers to obtain financing for home purchases, thus preventing them from purchasing our homes. Among other things, changes made by Fannie Mae, Freddie Mac and FHA/VA to sponsored mortgage programs, as well as changes made by private mortgage insurance companies, have reduced the ability of many potential homebuyers to qualify for mortgages. Principal among these are higher income requirements, larger required down payments, increased reserves, impose higher mortgage insurance premiums and higher required credit scores. In addition, there continues to be uncertainty regarding the future of Fannie Mae and Freddie Mac, including proposals that they reduce or terminate their role as the principal sources of liquidity in the secondary market for mortgage loans. It is not clear how, if Fannie Mae and Freddie Mac were to curtail their secondary market mortgage loan purchases, the liquidity they provide would be replaced. Because the availability of Fannie Mae, Freddie Mac, FHA- and VA-backed mortgage financing is an important factor in marketing and selling many of our homes, any limitations, restrictions or changes in the availability of such government-backed financing could reduce our home sales, which could have a material adverse effect on our Financial Performance. Further, there is a substantial possibility that substituting an alternate source of liquidity would increase mortgage interest rates, which would increase the buyers' effective costs of the homes we sell, and therefore could reduce demand for our homes and have a material adverse effect on our Financial Performance.
In February 2017, President Donald Trump issued an executive order requiring the Secretary of the Treasury to report on the extent to which existing laws, treaties, regulations, guidance, reporting and recordkeeping requirements, and other government policies promote six core principals established by the President. This executive order could result in significant changes to laws, regulations and policies affecting the availability and cost of mortgage financing, including the Dodd-Frank Wall Street Reform and Consumer Protection Act. We are unable to predict the impact, if any, of these potential changes on our home sales or Financial Performance.
- 24 -
Any limitation on, or reduction or elimination of, tax benefits associated with owning a home would have an adverse effect upon the demand for our home products, which could be material to our business.
Changes in federal income tax laws may affect demand for new homes. Current tax laws generally permit significant expenses associated with owning a home, primarily mortgage interest expense and real estate taxes, to be deducted for the purpose of calculating an individual’s federal, and in many cases, state, taxable income. Various proposals have been publicly discussed to limit mortgage interest deductions and to limit the exclusion of gain from the sale of a principal residence. If such proposals were enacted without offsetting provisions, the after-tax cost of owning a new home would increase for many of our potential homebuyers. Enactment of any such proposal may have an adverse effect on the homebuilding industry in general, as the loss or reduction of homeowner tax deductions could decrease the demand for new homes.
President Trump’s Administration has called for substantial change to fiscal and tax policies, which may include comprehensive tax reform. Although we cannot predict the impact, if any, of these changes to our business, it is possible that these changes could materially and adversely affect our Financial Performance.
We face numerous risks associated with controlling, purchasing, holding and developing land.
We acquire land for expansion into new markets and for replacement of land inventory and expansion within our current markets. Risks inherent in controlling, purchasing, holding and developing land parcels for new home construction are substantial and increase when demand for consumer housing decreases. Moreover, the market value of our land and housing inventories depends on market conditions and may decline after purchase, and the measures we employ to manage inventory risk may not be adequate to insulate our operations from a severe drop in inventory values. In addition, inventory carrying costs can be significant and can result in reduced margins or losses in a poorly performing community or market. We may have bought and developed, or acquired options on, land at a cost that we will not be able to recover fully or on which we cannot build and sell homes profitably. When market conditions are such that land values are not appreciating, existing option agreements may become less desirable, at which time we may elect to forfeit deposits and pre-acquisition costs and terminate the agreements.
The valuation of real property is inherently subjective and based on the individual characteristics of each property. Factors such as changes in regulatory requirements and applicable laws (including in relation to land development and building regulations, taxation and planning), political conditions, environmental conditions and requirements, the condition of financial markets, both local and national economic conditions, the financial condition of homebuyers, potentially adverse tax consequences, and interest and inflation rate fluctuations subject valuations of real property to uncertainty. Moreover, all valuations of real property are made on the basis of assumptions that may not prove to accurately reflect economic or demographic conditions. If housing demand decreases below what we anticipated when we acquired our inventory, our profitability may be materially and adversely affected and we may not be able to recover our costs when we build and sell houses, land and lots.
The U.S. housing markets experience dynamic demand and supply patterns from time to time due to volatile economic conditions, including increased amounts of home and land inventory that entered certain housing markets from foreclosure sales or short sales. In certain periods of market weakness, we have sold homes and land for lower margins or at a loss and have recognized significant inventory impairment charges, and such conditions may recur. Write-downs and impairments have had an adverse effect on our Financial Performance. We review the value of our land holdings on a periodic basis. Further material write-downs and impairments in the value of inventory may be required, and we may sell land or homes at a loss, which could materially and adversely affect our Financial Performance.
Adverse weather and natural disasters may increase costs, cause project delays and reduce consumer demand for housing.
As a homebuilder and land developer, we are subject to the risks associated with numerous weather-related events and natural disasters that are beyond our control. These weather-related events and natural disasters include, but are not limited to, droughts, floods, wildfires, landslides, soil subsidence, hurricanes, tornadoes and earthquakes. The occurrence of any of these events could damage our land and projects, cause delays in, or prevent, completion of our projects, reduce consumer demand for housing, and cause shortages and price increases in labor or raw materials, any of which could materially and adversely affect our Financial Performance. We have substantial operations in Southern and Northern California that have historically experienced significant earthquake activity and seasonal wildfires. Our markets in Colorado have also experienced seasonal wildfires, floods and soil subsidence. In addition, our Washington market has historically experienced significant earthquake, volcanic and seismic activity and our Texas market occasionally experiences extreme weather conditions such as tornadoes and hurricanes.
- 25 -
In addition to directly damaging our land or projects, earthquakes, hurricanes, tornadoes, volcanoes, floods, wildfires or other natural events could damage roads and highways providing access to those assets or affect the desirability of our land or projects, thereby materially and adversely affecting our ability to market homes or sell land in those areas and possibly increasing the cost to complete construction of our homes.
There are some risks of loss for which we may be unable to purchase insurance coverage. For example, losses associated with landslides, earthquakes and other geologic events may not be insurable and other losses, such as those arising from terrorism, may not be economically insurable. A sizeable uninsured loss could materially and adversely affect our Financial Performance.
Drought conditions in California and other areas in which we operate may negatively impact the economy, increase the risk of wildfires, cause us to incur additional costs, and delay or prevent new home deliveries.
Certain of the areas in which we operate, particularly in California, have experienced drought conditions from time to time. Drought conditions could negatively impact the economy and environment as well as increase greatly the risk of wildfires.
In 2014, the Governor of California proclaimed a Drought State of Emergency warning that drought conditions may place drinking water supplies at risk in many California communities. In April 2015, the Governor issued an executive order (the “Governor’s Executive Order”) that, among other things, directs the State Water Resources Control Board (“Water Board”) to impose mandatory water restrictions on urban water suppliers across California to reduce potable urban water usage by 25 percent and to prohibit irrigation with potable water outside newly constructed homes that is not delivered by drip or micro-spray systems. The Governor's Executive Order also called on urban water suppliers to adjust their rate structures to implement conservation pricing, directs the Department of Water Resources to update the Model Water Efficient Landscape Ordinance, and directs the California Energy Commission to adopt emergency regulations establishing standards to improve the efficiency of water appliances such as toilets and faucets. In May 2015, the Water Board adopted emergency regulations mandating reductions in potable water use by urban water suppliers to achieve the 25% statewide reduction mandated by the Governor’s Executive Order. Based on continued drought conditions, in February 2016, the Water Board extended the emergency regulations through November 2016 but revised the regulations to provide for decreases in certain urban water suppliers’ reduction targets under specified conditions. In May 2016, the Water Board again extended the emergency regulations restricting urban water use through February 28, 2017 but adopted a “stress test” approach that mandates urban water suppliers to take actions to ensure at least a three year supply of water to their customers under drought conditions. In February 2017, the Water Board readopted its emergency regulations for another 270 days. These and other measures that are instituted to respond to drought conditions could cause us to incur additional costs. In addition, new home deliveries in some areas may be delayed or prevented due to the unavailability of water, even when we have obtained water rights for those projects.
Although California has experienced significant snow and rainfall in December 2016 and January 2017, precipitation cannot be counted on to continue, and snowpack levels, while above average for the current time of year, are subject to rapid reductions as seen in 2016 and before. In addition, some parts of the state are still experiencing water supply shortfalls and five years of drought have resulted in a significant water supply deficit, especially when it comes to California’s groundwater basins.
We may be unable to find and retain suitable contractors and subcontractors at reasonable rates.
Substantially all of our construction work is performed by subcontractors with us acting as the general contractor. Accordingly, the timing and quality of our construction depend on the availability, cost and skill of contractors and subcontractors and their employees.
The residential construction industry experiences serious shortages of skilled labor from time to time. The difficult operating environment during the recent downturn in the United States has resulted in the failure of the businesses of some contractors and subcontractors and future downturns could result in further failures. In addition, reduced levels of homebuilding in the United States have caused some skilled tradesmen to leave the real estate industry to take jobs in other industries. These shortages can be more severe during periods of strong demand for housing or during periods following natural disasters that have a significant impact on existing residential and commercial structures. While we anticipate being able to obtain sufficient reliable contractors and subcontractors during times of material shortages and believe that our relationships with contractors and subcontractors are good, we do not have long-term contractual commitments with any contractors or subcontractors, and there can be no assurance that skilled contractors, subcontractors or tradesmen will continue to be available in the areas in which we conduct our operations. If skilled contractors and subcontractors are not available on a timely basis for a reasonable cost, or if contractors and subcontractors are not able to recruit sufficient numbers of skilled employees, our development and
- 26 -
construction activities may suffer from delays and quality issues, which could lead to reduced levels of homebuyer satisfaction and materially and adversely affect our Financial Performance.
Moreover, some of the subcontractors engaged by us are represented by labor unions or are subject to collective bargaining arrangements that require the payment of prevailing wages that are typically higher than normally expected on a residential construction site. A strike or other work stoppage involving any of our subcontractors could also make it difficult for us to retain subcontractors for their construction work. In addition, union activity could result in higher costs for us to retain our subcontractors. Access to qualified labor at reasonable rates may also be affected by other circumstances beyond our control, including: (i) shortages of qualified tradespeople, such as carpenters, roofers, electricians and plumbers; (ii) high inflation; (iii) changes in laws relating to employment and union organizing activity; (iv) changes in trends in labor force migration; and (v) increases in contractor, subcontractor and professional services costs. The inability to contract with skilled contractors and subcontractors at reasonable rates on a timely basis could materially and adversely affect our Financial Performance.
In addition, the enactment of federal, state or local statutes, ordinances, rules or regulations requiring the payment of prevailing wages on private residential developments would materially increase our costs of development and construction. In January 2017, a bill was introduced in the California State Assembly that would generally require developers and homebuilders of private residential projects to comply with the requirements for “public works” projects in the state, including the payment of prevailing wages. A significant portion of our business is conducted in California, and we expect that the passage of this bill would materially increase our costs of development and construction, which could materially and adversely affect our Financial Performance.
The supply of skilled labor may be adversely affected by changes in immigration laws and policies.
The timing and quality of our construction activities depend upon the availability, cost and skill of contractors and subcontractors and their employees. The supply of labor in the markets in which we operate could be adversely affected by changes in immigration laws and policies as well as changes in immigration trends. Accordingly, it cannot be assured that a sufficient supply of skilled labor will be available to us in the future. In addition, changes in federal and state immigration laws and policies, or in the enforcement of current laws and policies, as a result of the recent presidential election may have the effect of increasing our labor costs. The lack of adequate supply of skilled labor or a significant increase in labor costs could materially and adversely affect our Financial Performance.
We could be responsible for employment-related liabilities with respect to our contractors’ employees.
Several other homebuilders have received inquiries from regulatory agencies concerning whether homebuilders using contractors are deemed to be employers of the employees of such contractors under certain circumstances. Although contractors are independent of the homebuilders that contract with them under normal management practices and the terms of trade contracts and subcontracts within the homebuilding industry, if regulatory agencies reclassify the employees of contractors as employees of homebuilders, homebuilders using contractors could be responsible for wage and hour labor laws, workers’ compensation and other employment-related liabilities of their contractors. A recent National Labor Relations Board ruling held that for labor law purposes a firm could under some circumstances be responsible as a joint employer of its contractors' employees. If that ruling is upheld on appeal, it could make us responsible for collective bargaining obligations and labor law violations by our subcontractors. Governmental rulings that make us responsible for labor practices by our subcontractors could create substantial exposures for us in situations that are not within our control. Even if we are not deemed to be joint employers with our contractors, we may be subject to legislation, such as California Labor Code Section 2810.3 that requires us to share liability with our contractors for the payment of wages and the failure to secure valid workers’ compensation coverage.
We may incur costs and liabilities if our subcontractors engage in improper construction practices or install defective materials.
Despite our quality control efforts, we may discover that our subcontractors were engaging in improper construction practices or installing defective materials in our homes. When we discover these issues, we, generally through our subcontractors, repair the homes in accordance with our new home warranty and as required by law. We reserve a percentage of the sales price of each home we sell to meet our warranty and other legal obligations to our homebuyers. These reserves are established based on market practices, our historical experiences, and our judgment of the qualitative risks associated with the types of homes built. However, the cost of satisfying our warranty and other legal obligations in these instances may be significantly higher than our warranty reserves, and we may be unable to recover the cost of repair from such subcontractors. Regardless of the steps we take, we can in some instances be subject to fines or other penalties, and our reputation may be materially and adversely affected.
- 27 -
Raw material shortages and price fluctuations could cause delays and increase our costs.
We require raw materials to build our homes. The residential construction industry experiences serious raw material shortages from time to time, including shortages in supplies of insulation, drywall, cement, steel, lumber and other building materials. These shortages can be more severe during periods of strong demand for housing or during periods following natural disasters that have a significant impact on existing residential and commercial structures. The cost of raw materials may also be materially and adversely affected during periods of shortages or high inflation. Shortages and price increases could cause delays in and increase our costs of home construction. We generally are unable to pass on increases in construction costs to homebuyers who have already entered into home purchase contracts. Sustained increases in construction costs may adversely affect our gross margins, which in turn could materially and adversely affect our Financial Performance.
Utility shortages or price increases could have an adverse impact on operations.
Certain of the markets in which we operate, including California, have experienced power shortages, including mandatory periods without electrical power, as well as significant increases in utility costs. Reduced water supplies as a result of drought conditions may negatively affect electric power generation. Additionally, municipalities may restrict or place moratoriums on the availability of utilities, such as water and sewer taps. We may incur additional costs and may not be able to complete construction on a timely basis if such utility shortages, restrictions, moratoriums and rate increases continue. In addition, these utility issues may adversely affect the local economies in which we operate, which may reduce demand for housing in those markets. Our Financial Performance may be materially and adversely impacted if further utility shortages, restrictions, moratoriums or rate increases occur in our markets.
Some of our markets have been and may continue to be adversely affected by declining oil prices.
The significant decline in oil prices that began in 2014 has adversely affected and may continue to adversely affect the economies in our Colorado and Houston markets, as energy is an important employment sector in both of those markets. As a result, demand for our homes may be reduced in these markets and our Financial Performance could be materially and adversely affected.
Government regulations and legal challenges may delay the start or completion of our communities, increase our expenses or limit our building or other activities.
The approval of numerous governmental authorities must be obtained in connection with our development activities, and these governmental authorities often have broad discretion in exercising their approval authority. We incur substantial costs related to compliance with legal and regulatory requirements, and any increase in legal and regulatory requirements may cause us to incur substantial additional costs, or in some cases cause us to determine that certain communities are not feasible for development. Government agencies also routinely initiate audits, reviews or investigations of our business practices to ensure compliance with applicable laws and regulations, which can cause us to incur costs or create other disruptions in our businesses that can be significant.
Various federal, state and local statutes, ordinances, rules and regulations concerning building, health and safety, environment, land use, zoning, density requirements, labor and wages, sales and similar matters apply to or affect the housing industry. Projects that are not entitled may be subjected to periodic delays, changes in use, less intensive development or elimination of development in certain specific areas due to government regulations. We may also be subject to periodic delays or may be precluded entirely from developing in certain communities due to building moratoriums or “slow-growth” or “no-growth” initiatives that could be implemented in the future. Local governments also have broad discretion regarding the imposition of development fees and exactions for projects in their jurisdiction. Projects for which we have received land use and development entitlements or approvals may still require a variety of other governmental approvals and permits during the development process and can also be impacted adversely by unforeseen environmental, health, safety and welfare issues, which can further delay these projects or prevent their development. We may also be required to modify our existing approvals because of changes in local circumstances or applicable law. Further, we may experience delays and increased expenses as a result of legal challenges to our proposed communities, or to permits or approvals required for such communities, whether brought by governmental authorities or private parties. As a result, home sales could decline and costs could increase, which could materially and adversely affect our Financial Performance.
- 28 -
We may be unable to obtain suitable bonding for the development of our housing projects.
We are often required to provide bonds to governmental authorities and others to ensure the completion of our projects. If we are unable to obtain required bonds in the future for our projects, or if we are required to provide credit enhancements with respect to our current or future bonds, our Financial Performance could be materially and adversely affected.
We are subject to environmental laws and regulations that may impose significant costs, delays, restrictions or liabilities.
We are subject to a variety of local, state and federal statutes, rules and regulations concerning land use and the protection of health and the environment, including those governing discharge of pollutants to water and air, impact on wetlands, protection of flora and fauna, handling of or exposure to hazardous materials, including asbestos, and cleanup of contaminated sites. We may be liable for the costs of removal, investigation, mitigation or remediation of hazardous or toxic substances located at any property currently or formerly owned, leased or occupied by us, or at third-party sites to which we have sent or send wastes for disposal, whether or not we caused or knew of such conditions. These conditions can also give rise to claims by governmental authorities or other third parties, including for personal injury, property damage and natural resources damages. Insurance coverage for such claims is nonexistent or impractical. The presence of any of these conditions, or the failure to address any of these conditions properly, or any significant environmental incident, may materially and adversely affect our ability to develop our properties or sell our homes, lots or land in affected communities or to borrow using the affected land as security, or impact our reputation. Environmental impacts have been identified at certain of our active communities, some of which will need to be addressed prior to or during development. We could incur substantial costs in excess of amounts budgeted by us to address such impacts or other environmental or hazardous material conditions that may be discovered in the future at our properties. Any failure to adequately address such impacts or conditions could delay, impede or prevent our development projects.
The particular impact and requirements of environmental laws and regulations that apply to any given community vary greatly according to the community location, the site’s environmental conditions and the development and use of the site. Any failure to comply with applicable requirements could subject us to fines, penalties, third-party claims or other sanctions. We expect that these environmental requirements will become increasingly stringent in the future. Compliance with, or liability under, these environmental laws and regulations may result in delays, cause us to incur substantial compliance and other costs and prohibit or severely restrict development, particularly in environmentally sensitive areas. In those cases where an endangered or threatened species is involved and related agency rulemaking and litigation are ongoing, the outcome of such rule-making and litigation can be unpredictable and can result in unplanned or unforeseeable restrictions on, or the prohibition of, development and building activity in identified environmentally sensitive areas. In addition, project opponents can delay or impede development activities by bringing challenges to the permits and other approvals required for projects and operations under environmental laws and regulations.
As a result, we cannot assure that our costs, obligations and liabilities relating to environmental matters will not materially and adversely affect our Financial Performance.
Changes in global or regional climate conditions and governmental response to such changes may limit, prevent or increase the costs of our planned or future growth activities.
Projected climate change, if it occurs, may exacerbate the scarcity or presence of water and other natural resources in affected regions, which could limit, prevent or increase the costs of residential development in certain areas. In addition, a variety of new legislation is being enacted, or considered for enactment, at the federal, state and local level relating to energy and climate change, and as climate change concerns continue to grow, legislation and regulations of this nature are expected to continue. This legislation relates to items such as carbon dioxide emissions control and building codes that impose energy efficiency standards. Government mandates, standards or regulations intended to mitigate or reduce greenhouse gas emissions or projected climate change impacts could result in prohibitions or severe restrictions on land development in certain areas, increased energy and transportation costs, and increased compliance expenses and other financial obligations to meet permitting or land development or home construction-related requirements that we may be unable to fully recover (due to market conditions or other factors), any of which could cause a reduction in our homebuilding gross margins and materially and adversely affect our Financial Performance. Energy-related initiatives could similarly affect a wide variety of companies throughout the United States and the world, and because our results of operations are heavily dependent on significant amounts of raw materials, these initiatives could have an indirect adverse impact on our Financial Performance to the extent the manufacturers and suppliers of our materials are burdened with expensive cap and trade or other climate related regulations.
- 29 -
As a result, climate change impacts, and laws and land development and home construction standards, and/or the manner in which they are interpreted or implemented, to address potential climate change concerns could increase our costs and have a long-term adverse impact on our Financial Performance. This is a particular concern in the western United States, where some of the most extensive and stringent environmental laws and residential building construction standards in the country have been enacted. For example, California has enacted the Global Warming Solutions Act of 2006 to achieve the goal of reducing greenhouse gas emissions to 1990 levels by 2020. As a result, California has adopted and is expected to continue to adopt significant regulations to meet this goal.
We may be unable to develop our communities successfully or within expected timeframes.
Before a community generates any revenue, time and material expenditures are required to acquire land, obtain development approvals and construct significant portions of project infrastructure, amenities, model homes and sales facilities. It can take several years from the time we acquire control of a property to the time we makes our first home sale on the site. Our costs or the time required to complete development of our communities could increase beyond our estimates after commencing the development process. Delays in the development of communities expose us to the risk of changes in market conditions for homes. A decline in our ability to successfully develop and market our communities and to generate positive cash flow from these operations in a timely manner could materially and adversely affect our Financial Performance and our ability to service our debt and to meet our working capital requirements.
Poor relations with the residents of our communities could negatively impact our sales and reputation.
Residents of communities developed by us rely on us to resolve issues or disputes that may arise in connection with the operation or development of our communities. Efforts we make to resolve these issues or disputes could be deemed unsatisfactory by the affected residents, and subsequent actions by these residents could materially and adversely affect sales and our reputation. In addition, we could be required to make material expenditures related to the settlement of such issues or disputes or to modify our community development plans, which could materially and adversely affect our Financial Performance.
The homebuilding industry is highly competitive, and if our competitors are more successful or offer better value to potential homebuyers, our business could decline.
We operate in a very competitive environment that is characterized by competition from a number of other homebuilders and land developers in each geographical market in which we operate. There are relatively low barriers to entry into our business. We compete with numerous large national and regional homebuilding companies and with smaller local homebuilders and land developers for, among other things, homebuyers, desirable land parcels, financing, raw materials and skilled management and labor resources. If we are unable to compete effectively in our markets, our business could decline disproportionately to the businesses of our competitors and our Financial Performance could be materially and adversely affected.
Increased competition could hurt our business by preventing us from acquiring attractive land parcels on which to build homes or making acquisitions more expensive, hindering our market share expansion and causing us to increase our selling incentives and reduce our prices. Additionally, an oversupply of homes available for sale or a discounting of home prices could materially and adversely affect pricing for homes in the markets in which we operate.
We also compete with the resale, or “previously owned,” home market, the size of which may change significantly as result of changes in the rate of home foreclosures, which is affected by changes in economic conditions both nationally and locally.
We may be at a competitive disadvantage with respect to larger competitors whose operations are more geographically diversified than ours, as these competitors may be better able to withstand any future regional downturn in the housing market. Due to historical and other factors, some competitors may have a competitive advantage in marketing their products, securing materials and labor at lower prices and allowing their homes to be delivered to homebuyers more quickly and at more favorable prices. This competitive advantage could materially and adversely reduce our market share and limit our ability to continue to expand our business as planned.
- 30 -
Increases in our cancellation rate could have a negative impact on our home sales revenue and homebuilding margins.
Our backlog reflects homes that may close in future periods. We have received a deposit from a homebuyer for each home reflected in our backlog, and generally we have the right, subject to certain exceptions, to retain the deposit if the homebuyer fails to comply with his or her obligations under the purchase contract, including as a result of state and local law, the homebuyer’s inability to sell his or her current home or the homebuyer’s inability to make additional deposits required under the purchase contract. Home order cancellations can result from a number of factors, including declines or slow appreciation in the market value of homes, increases in the supply of homes available to be purchased, increased competition and use of sales incentives by competitors, higher mortgage interest rates, homebuyers’ inability to sell their existing homes, homebuyers’ inability to obtain suitable mortgage financing, including providing sufficient down payments, and adverse changes in local, regional or national economic conditions. In these circumstances, homebuyers may terminate their existing purchase contracts in order to negotiate for a lower price or because they cannot, or will not, complete the purchase. Our cancellation rate was 15% and 16% for the years ended December 31, 2016 and 2015, respectively. Cancellation rates may rise significantly in the future. If economic conditions become more uncertain, mortgage financing becomes less available or expensive, or current homeowners find it difficult to sell their current homes, more homebuyers may cancel their purchase contracts. An increase in the level of home order cancellations could have a material and adverse impact on our Financial Performance.
Homebuilding is subject to products liability, home warranty and construction defect claims and other litigation in the ordinary course of business that can be significant and may not be covered by insurance.
As a homebuilder, we are currently subject to home warranty, products liability and construction defect claims arising in the ordinary course of business, in addition to other potentially significant lawsuits, arbitration proceedings and other claims, including breach of contract claims, contractual disputes, personal injury claims and disputes relating to defective title or property misdescription. In connection with the Merger, we also assumed responsibility for a substantial amount of WRECO’s pending and potential lawsuits, arbitration proceedings and other claims, as well as any future claims relating to WRECO. Furthermore, since WRECO self-insured a significant portion of its general liability exposure relating to its operations outside of California and Nevada prior to the Merger, it is likely that most of these claims will not be covered by insurance.
There can be no assurance that any current or future developments undertaken by us will be free from defects once completed. Construction defects may occur on projects and developments and may arise during a significant period of time after completion. Defects arising on a development attributable to us may lead to significant contractual or other liabilities. For these and other reasons, we establish warranty, claim and litigation reserves that we believe are adequate based on historical experience in the markets in which we operate and judgment of the risks associated with the types of homes, lots and land we sell. We also obtain indemnities from contractors and subcontractors generally covering claims related to damages resulting from faulty workmanship and materials and enroll a majority of these contractors and subcontractors in our Owner Controlled Insurance Program providing general liability coverage for these types of claims, subject to self-insured retentions.
With respect to certain general liability exposures, including construction defects and related claims and product liability claims, interpretation of underlying current and future trends, assessment of claims and the related liability and reserve estimation process require us to exercise significant judgment due to the complex nature of these exposures, with each exposure often exhibiting unique circumstances. Furthermore, once claims are asserted against us for construction defects, it is difficult to determine the extent to which the assertion of these claims will expand geographically. Plaintiffs may seek to consolidate multiple parties in one lawsuit or seek class action status in some of these legal proceedings with potential class sizes that vary from case to case. Consolidated and class action lawsuits can be costly to defend and, if we were to lose any consolidated or certified class action suit, it could result in substantial liability.
In addition to difficulties with respect to claim assessment and liability and reserve estimation, some types of claims may not be covered by insurance or may exceed applicable coverage limits. Furthermore, contractual indemnities with contractors and subcontractors can be difficult to enforce, and we may also be responsible for applicable self-insured retentions with respect to our insurance policies. This is particularly true in our markets where we include our subcontractors on our general liability insurance and our ability to seek indemnity for insured claims is significantly limited and it may be difficult for us to collect self-insured retention contributions from these subcontractors. Furthermore, any product liability or warranty claims made against us, whether or not they are viable, may lead to negative publicity, which could impact our reputation and future home sales.
- 31 -
We also currently conduct a material portion of our business in California, one of the most highly regulated and litigious jurisdictions in the United States, which imposes a ten year, strict liability tail on many construction liability claims. As a result, our potential losses and expenses due to litigation, new laws and regulations may be greater than those of our competitors who have smaller California operations.
For these reasons, although we actively manage our claims and litigation and actively monitor our reserves and insurance coverage, because of the uncertainties inherent in these matters, we cannot provide assurance that our insurance coverage, indemnity arrangements and reserves will be adequate to cover liability for any damages, the cost of repairs and litigation, or any other related expenses surrounding the current claims to which we are subject or any future claims that may arise. Such damages and expenses, to the extent that they are not covered by insurance or redress against contractors and subcontractors, could materially and adversely affect our Financial Performance.
Because real estate investments are relatively illiquid, our ability to promptly sell one or more properties for reasonable prices in response to changing economic, financial and investment conditions may be limited and we may be forced to hold non-income producing properties for extended periods of time.
Real estate investments are relatively difficult to sell quickly. As a result, our ability to promptly sell one or more properties in response to changing economic, financial and investment conditions is limited and we may be forced to hold non-income producing assets for an extended period of time. We cannot predict whether we will be able to sell any property for the price or on the terms that we set or whether any price or other terms offered by a prospective purchaser would be acceptable to us. We also cannot predict the length of time needed to find a willing purchaser and to close the sale of a property.
Fluctuations in real estate values may require us to write-down the book value of our real estate assets.
The homebuilding industry is subject to significant variability and fluctuations in real estate values. As a result, we may be required to write-down the book value of our real estate assets in accordance with U.S. generally accepted accounting principles (“GAAP”), and some of those write-downs could be material. Any material write-downs of assets could have a material adverse effect on our Financial Performance.
The geographic concentration of our operations in certain regions subjects us to an increased risk of loss of revenue or decreases in the market value of our land and homes in those regions from factors which may affect any of those regions.
Our operations are currently confined to Arizona, California, Colorado, Maryland, Nevada, Texas, Virginia and Washington. Because our operations are limited to these areas, a prolonged economic downturn in one or more of these areas, particularly within California, could have a material adverse effect on our Financial Performance and could have a disproportionately greater impact on us than other homebuilders with more diversified operations. Moreover, some or all of these regions could be affected by:
• | severe weather; |
• | natural disasters (such as earthquakes or fires); |
• | shortages in the availability of, or increased costs in obtaining, land, equipment, labor or building supplies; |
• | changes to the population growth rates and therefore the demand for homes in these regions; and |
• | changes in the regulatory and fiscal environment. |
For the years ended December 31, 2016 and 2015, respectively, we generated a significant amount of our revenues and profits from our California real estate inventory. During the downturn from 2008 to 2010, land values, the demand for new homes and home prices declined substantially in California. In addition, California is facing significant unfunded liabilities and may raise taxes and increase fees to meet these obligations. If these conditions in California persist or worsen, it could materially and adversely affect our Financial Performance.
Inflation could materially and adversely affect us by increasing the costs of land, raw materials and labor, negatively impacting housing demand, raising our costs of capital, and decreasing our purchasing power.
Inflation could materially and adversely affect us by increasing costs of land, raw materials and labor. We may respond to inflation by increasing the sales prices of land or homes in order to offset any such increases in costs, maintain satisfactory margins or realize a satisfactory return on our investment. However, if the market has an oversupply of homes relative to demand, prevailing market prices may prevent us from doing so. In addition, inflation is often accompanied by higher interest rates, which historically have had a negative impact on housing demand and the real estate industry generally and which could materially and adversely impact potential homebuyers’ ability to obtain mortgage financing on favorable terms. In such an environment, we may not be able to raise prices sufficiently to keep up with the rate of inflation and our margins and returns
- 32 -
could decrease. Additionally, if we are required to lower home prices to meet demand, the value of our land inventory may decrease. Inflation may also raise our costs of capital and decrease our purchasing power, making it more difficult to maintain sufficient funds to operate our business. Current or future efforts by the government to stimulate the economy may increase the risk of significant inflation and its adverse impact on our Financial Performance.
Acts of war, terrorism or outbreaks of contagious disease may seriously harm our business.
Acts of war, any outbreak or escalation of hostilities between the United States and any foreign power, acts of terrorism, or outbreaks of contagious diseases such as Ebola may cause disruption to the U.S. economy, or the local economies of the markets in which we operate, cause shortages of building materials, increase costs associated with obtaining building materials, result in building code changes that could increase costs of construction, affect job growth and consumer confidence, or cause economic changes that we cannot anticipate, all of which could reduce demand for our homes and materially and adversely impact our Financial Performance.
Laws and regulations governing the residential mortgage and title insurance industries could materially and adversely affect our Financial Performance.
We have established a joint venture to provide mortgage related services to homebuyers and a wholly owned title agency. The residential mortgage lending and title insurance industries are each heavily regulated. Changes to existing laws or regulations or adoption of new laws or regulations could require us to incur significant compliance costs. A material failure to comply with any of these laws or regulations could result in the loss or suspension of required licenses or other approvals, the imposition of monetary penalties, and restitution awards or other relief. In addition, we could be subject to individual or class action litigation alleging violations of these laws and regulations. Any of these could result in substantial costs and we could incur judgments or enter into settlements of claims that could have a material adverse effect on our business. Any of these outcomes could materially and adversely affect our Financial Performance.
We are subject to litigation and claims that could materially and adversely affect us.
Lawsuits, claims and proceedings have been, or in the future may be, instituted or asserted against us in the normal course of business. Moreover, in connection with the Merger, we also assumed responsibility for a substantial amount of WRECO’s pending and potential lawsuits, arbitration proceedings and other claims, as well as any future claims relating to WRECO. Some of these claims may result in significant defense costs and potentially significant judgments against us, some of which are not, or cannot be, insured against. We generally intend to defend ourselves vigorously. However, we cannot be certain of the ultimate outcomes of any claims that may arise. To resolve these matters, we may have to pay significant fines, judgments, or settlements, which, if uninsured, or if the fines, judgments and settlements exceed insured levels, could adversely impact our earnings and cash flows, thereby materially and adversely affect our Financial Performance. Certain litigation or the resolution of certain litigation may affect the availability or cost of some of our insurance coverage, which could materially and adversely impact us, expose us to increased risks that would be uninsured, and materially and adversely impact our ability to attract directors and officers. Uncertainty with respect to claims or litigation may adversely affect the availability and costs of future financings and may materially and adversely affect the trading prices of our outstanding securities.
Information technology failures and data security breaches could harm our business.
We use information technology and other computer resources to carry out important operational and marketing activities as well as maintain our business records. Many of these resources are provided to us or are maintained on our behalf by third-party service providers pursuant to agreements that specify certain security and service level standards. Our ability to conduct our business may be materially and adversely impaired if our computer resources are compromised, degraded, damaged or fail, whether due to a virus or other harmful circumstance, intentional penetration or disruption of our information technology resources by a third-party, natural disaster, hardware or software corruption or failure or error (including a failure of security controls incorporated into or applied to such hardware or software), telecommunications system failure, service provider error or failure, intentional or unintentional personnel actions (including the failure to follow our security protocols), or lost connectivity to its networked resources.
- 33 -
A significant and extended disruption in the functioning of these resources could damage our reputation and cause us to lose homebuyers, sales and revenue, result in the unintended public disclosure or the misappropriation of proprietary, personal and confidential information (including information about our homebuyers and business partners), and require us to incur significant expense to address and resolve these kinds of issues. The release of confidential information may also lead to litigation or other proceedings against us by affected individuals, business partners and/or regulators, and the outcome of such proceedings, which could include penalties or fines, could materially and adversely affect our Financial Performance. In addition, the costs of maintaining adequate protection against such threats, depending on their evolution, pervasiveness and frequency and/or government-mandated standards or obligations regarding protective efforts, could be material to our Financial Performance.
A major health and safety incident relating to our business could be costly in terms of potential liabilities and reputational damage.
Building sites are inherently dangerous, and operating in the homebuilding and land development industry poses certain inherent health and safety risks. Due to health and safety regulatory requirements and the number of our projects, health and safety performance is critical to the success of all areas of our business.
Any failure in health and safety performance may result in penalties for non-compliance with relevant regulatory requirements or litigation, and a failure that results in a major or significant health and safety incident is likely to be costly in terms of potential liabilities incurred as a result. Such a failure could generate significant negative publicity and have a corresponding impact on our reputation, our relationships with relevant regulatory agencies, governmental authorities and local communities, and our ability to win new business, which in turn could materially and adversely affect our Financial Performance.
Increases in taxes or government fees could increase our costs, which could materially and adversely affect us.
Increases in real estate taxes and other local government fees, such as development or impact fees, fees imposed on developers to fund schools, open space, road improvements, and other public improvements, and fees imposed on developers to provide low- and moderate-income housing, could increase our costs and have an adverse effect on our operations, which could have a material adverse effect on our Financial Performance. In addition, increases in local real estate taxes could adversely affect the purchasing decisions of potential homebuyers, who may consider those costs in determining whether to make a new home purchase and decide, as a result, not to purchase one of our homes, which could have a material adverse effect on our Financial Performance.
Risks Related to the Merger
For additional information concerning the Merger, please refer to Note 1, Organization and Summary of Significant Accounting Policies, and Note 2, Merger with Weyerhaeuser Real Estate Company, of the notes to our consolidated financial statements included elsewhere in this annual report on Form 10-K.
Our tax sharing agreement with WRECO’s former parent restricts our ability to undertake significant actions.
In connection with the Merger, we entered into a tax sharing agreement (the “Tax Sharing Agreement”) with Weyerhaeuser. The Tax Sharing Agreement generally restricts our and our affiliates’ ability to take actions that could cause the Merger and related transactions to fail to qualify as tax-free transactions. If we take actions that result in tax-related losses to Weyerhaeuser, then we generally will be required to indemnify Weyerhaeuser for such losses, without regard to whether Weyerhaeuser had given us prior consent.
The historical financial information of WRECO may not be representative of its results or financial condition if it had been operated independently of Weyerhaeuser and, as a result, is not a reliable indicator of its future results.
As discussed in Note 1, Organization and Summary of Significant Accounting Policies, of the notes to our consolidated financial statements included elsewhere in this annual report on Form 10-K, the Merger was treated as a “reverse acquisition” and WRECO was considered the accounting acquirer. Accordingly, WRECO is reflected as the predecessor and acquirer and therefore consolidated financial statements included in this annual report on Form 10-K reflect the historical consolidated financial statements of WRECO, and do not include the historical financial statements of legacy TRI Pointe, for all periods presented prior to the Closing Date. Prior to the consummation of the Merger, WRECO was a business segment of Weyerhaeuser. Consequently, the historical financial information included in this annual report on Form 10-K was derived from the consolidated financial statements and accounting records of WRECO and reflects all direct costs as well as assumptions and
- 34 -
allocations made by management of Weyerhaeuser. The financial position, results of operations and cash flows of WRECO for all periods presented prior to the Closing Date may be different from those that would have resulted had WRECO been operated independently of Weyerhaeuser during the applicable periods or at the applicable dates. For example, in preparing the financial statements of WRECO, Weyerhaeuser made allocations of Weyerhaeuser corporate general and administrative expense deemed to be attributable to WRECO. However, these allocations reflect the corporate general and administrative expense attributable to WRECO operated as part of a larger organization and do not necessarily reflect the corporate general and administrative expense that would be incurred by WRECO had it been operated independently. Further, WRECO’s historical financial information does not reflect changes in WRECO’s operations that occurred in connection with the Merger. As a result, the historical financial information of WRECO is not a reliable indicator of future results.
Risks Related to Conflicts of Interest
The Starwood Fund has the right to nominate one member of our board of directors and its interests may not be aligned with other stockholders.
Pursuant to an Investor Rights Agreement, VII/TPC Holdings, L.L.C., a private equity fund managed by an affiliate of the Starwood Capital Group (the “Starwood Fund”), has the right to nominate one member of our board of directors for as long as it owns at least 5% of our outstanding common stock. The Starwood Fund’s interests may not be fully aligned with other stockholders and this could lead to a strategy that is not in the best interests of other stockholders. Barry Sternlicht, our Chairman of the Board, is also the Chairman and Chief Executive Officer of Starwood Capital Group and Chris Graham, another member of our board of directors, is also a Senior Managing Director at Starwood Capital Group. As a result, Messrs. Sternlicht and Graham will devote only a portion of their business time to their duties with our board of directors and will devote a majority of their business time to their duties with Starwood Capital Group and its affiliates and other commitments. Moreover, we have engaged, and in the future may engage in transactions, such as land purchases, with Starwood Capital Group, Starwood Property Trust (which is managed by Starwood Capital Group) or their affiliates that could present an actual or perceived conflict of interest. As a result, Messrs. Sternlicht and Graham may recuse themselves from actions of our board of directors with respect to approval of these transactions. See Note 18, Related Party Transactions, of the notes to our consolidated financial statements included elsewhere in this annual report on Form 10-K
As previously disclosed in a Form 8-K that we filed with the SEC on September 5, 2014, the Starwood Fund has informed us that it has pledged certain of its shares of our common stock as collateral in connection with a margin loan. We are not a party to the margin loan documents; however, a foreclosure on the pledged shares could materially and adversely affect the price of our common stock. In addition, the pledged shares of our common stock and margin loan could present an actual or perceived conflict of interest with respect to Messrs. Sternlicht and Graham.
Risks Related to Our Indebtedness
Our use of leverage in executing our business strategy exposes us to significant risks.
We employ what we believe to be prudent levels of leverage to finance the acquisition and development of our lots and construction of our homes. Our existing indebtedness is recourse to us and we anticipate that future indebtedness will likewise be recourse.
Our board of directors considers a number of factors when evaluating our level of indebtedness and when making decisions regarding the incurrence of new indebtedness, including the purchase price of assets to be acquired with debt financing, the estimated market value of such assets and the ability of the particular assets, and our company as a whole, to generate cash flow to cover the expected debt service. As a means of sustaining our long-term financial health and limiting our exposure to unforeseen dislocations in the debt and financing markets, we currently expect to remain conservatively capitalized. However, our charter does not contain a limitation on the amount of debt we may incur, and our board of directors may change target debt levels at any time without the approval by our stockholders.
Incurring substantial debt could subject us to many risks that, if realized, would materially and adversely affect our Financial Performance, including the risks that:
• | it may be more difficult for us to satisfy our obligations with respect to our debt or to our other creditors; |
• | our cash flow from operations may be insufficient to make required payments of principal of and interest on our debt, which is likely to result in acceleration of our debt; |
• | our debt may increase our vulnerability to adverse economic and industry conditions, including fluctuations in market interest rates, with no assurance that investment yields will increase with higher financing cost, particularly in the case of debt with a floating interest rate; |
- 35 -
• | our debt may limit our ability to obtain additional financing to fund capital expenditures and acquisitions, particularly when the availability of financing in the capital markets is limited; |
• | we may be required to dedicate a portion of our cash flow from operations to payments on our debt, thereby reducing funds available for operations and capital expenditures, future investment opportunities or other purposes; |
• | in the case of secured indebtedness, we could lose our ownership interests in our land parcels or other assets because defaults thereunder may result in foreclosure actions initiated by lenders; |
• | our debt may limit our ability to buy back our common stock or pay cash dividends; |
• | our debt may limit our flexibility in planning for, or reacting to, changes in our business and the industry in which we operate, thereby limiting our ability to compete with companies that are not as highly leveraged; and |
• | the terms of any refinancing may not be as favorable as the terms of the debt being refinanced. |
We cannot make any assurances that our business will generate sufficient cash flow from operations or that future borrowings will be available to us through capital markets financings or otherwise in an amount sufficient to enable us to service or refinance our indebtedness, or to fund our other liquidity needs. We may also need to refinance all or a portion of our existing or future indebtedness on or before its maturity, and we cannot make any assurances that we will be able to refinance any of our indebtedness on commercially reasonable terms or at all. If, at the time of any refinancing, prevailing interest rates or other factors result in higher interest rates on the refinanced debt, increases in interest expense could materially and adversely affect our Financial Performance. If we are unable to refinance our debt on acceptable terms, we may be forced to dispose of our assets on disadvantageous terms, potentially resulting in significant losses.
We may incur additional indebtedness in order to finance our operations or to repay existing indebtedness. If we cannot service our indebtedness, we will risk losing to foreclosure some or all of our assets that may be pledged to secure our obligations and we may have to take actions such as selling assets, seeking additional debt or equity financing or reducing or delaying capital expenditures, strategic acquisitions, investments and alliances. We cannot make any assurances that any such actions, if necessary, could be effected on commercially reasonable terms or at all, or on terms that would be advantageous to our stockholders or on terms that would not require us to breach the terms and conditions of our existing or future debt agreements. Additionally, unsecured debt agreements may contain specific cross-default provisions with respect to specified other indebtedness, giving the unsecured lenders the right to declare a default if we are in default under other loans in some circumstances. Defaults under our debt agreements could materially and adversely affect our Financial Performance.
We may require significant additional capital in the future and may not be able to secure adequate funds on acceptable terms.
The expansion and development of our business may require significant additional capital, which we may be unable to obtain, to fund our operating expenses, including working capital needs.
We may fail to generate sufficient cash flow from the sales of our homes and land to meet our cash requirements. To a large extent, our cash flow generation ability is subject to general economic, financial, competitive, legislative and regulatory factors and other factors that are beyond our control. Further, our capital requirements may vary materially from those currently planned if, for example, our revenues do not reach expected levels or we have to incur unforeseen capital expenditures and make investments to maintain our competitive position. If this is the case, we may need to refinance all or a portion of our debt on or before its maturity, or obtain additional equity or debt financing sooner than anticipated, which could materially and adversely affect our liquidity and financial condition if financing cannot be secured on reasonable terms. As a result, we may have to delay or abandon some or all of our development and expansion plans or otherwise forego market opportunities.
Our access to additional third-party sources of financing will depend, in part, on:
• | general market conditions; |
• | the market’s perception of our growth potential, including relative to other opportunities; |
• | with respect to acquisition and/or development financing, the market’s perception of the value of the land parcels to be acquired and/or developed; |
• | our corporate credit rating and ratings of our senior notes; |
• | our current debt levels; |
• | our current and expected future earnings; |
• | our cash flow; |
• | pending litigation and claims; and |
• | the market price per share of our common stock. |
- 36 -
During the recent economic downturn, domestic financial markets experienced unusual volatility, uncertainty and a restricting of liquidity in both the debt and equity capital markets. Credit spreads for major sources of capital widened significantly during the U.S. credit crisis as investors demanded a higher risk premium. In the event of another economic downturn or if general economic conditions should worsen, potential lenders may be unwilling or unable to provide us with suitable financing or may charge us prohibitively high fees in order to obtain financing. As a result, depending on market conditions at the relevant time, we may have to rely more heavily on less efficient forms of debt financing that require a larger portion of our cash flow from operations to service, thereby reducing funds available for our operations, future business opportunities and other purposes. Investment returns on our assets and our ability to make acquisitions could be materially and adversely affected by our inability to secure additional financing on reasonable terms, if at all. Additionally, if we cannot obtain additional financing to fund the purchase of land under our option contracts or purchase contracts, we may incur contractual penalties and fees. Any difficulty in obtaining sufficient capital for planned development expenditures could also cause project delays and any such delay could result in cost increases. Any of the foregoing factors could materially and adversely affect our Financial Performance.
Our access to capital and our ability to obtain additional financing could be affected by any downgrade of our credit ratings.
Our corporate credit rating and ratings of our senior notes affect, among other things, our ability to access new capital, especially debt, and the costs of that new capital. A substantial portion of our access to capital is through the issuance of senior notes, of which we have $1.2 billion outstanding, net of debt issuance costs, as of December 31, 2016. Among other things, we may rely on proceeds of debt issuances to pay the principal of existing senior notes when they mature. Negative changes in the ratings of our senior notes could make it difficult for us to sell senior notes in the future and could result in more stringent covenants and higher interest rates with regard to new senior notes we issue.
Our current financing arrangements contain, and our future financing arrangements likely will contain, restrictive covenants relating to our operations.
Our current financing arrangements contain, and the financing arrangements we may enter into in the future will likely contain, covenants affecting our ability to, among other things:
• | incur or guarantee additional indebtedness; |
• | make certain investments; |
• | reduce liquidity below certain levels; |
• | pay dividends or make distributions on our capital stock; |
• | sell assets, including capital stock of restricted subsidiaries; |
• | agree to payment restrictions affecting our restricted subsidiaries; |
• | consolidate, merge, sell or otherwise dispose of all or substantially all of our assets; |
• | enter into transactions with our affiliates; |
• | incur liens; |
• | engage in sale-leaseback transactions; and |
• | designate any of our subsidiaries as unrestricted subsidiaries. |
If we fail to meet or satisfy any of these covenants in our debt agreements, we would be in default under these agreements, which could result in a cross-default under other debt agreements, and our lenders could elect to declare outstanding amounts due and payable, terminate their commitments, require the posting of additional collateral and enforce their respective interests against existing collateral. A default also could significantly limit our financing alternatives, which could cause us to curtail our investment activities and/or dispose of assets when we otherwise would not choose to do so. If we default on several of our debt agreements or any single significant debt agreement, it could materially and adversely affect our Financial Performance. These and certain other restrictions could also limit our ability to plan for or react to market conditions, meet capital needs or make acquisitions or otherwise restrict our activities or business plans.
- 37 -
Higher interest rates on our debt may materially and adversely affect our Financial Performance.
We employ what we believe to be prudent levels of leverage to finance the acquisition and development of our lots and construction of our homes. Some of our current debt has, and any additional debt we subsequently incur may have, a floating rate of interest. In December 2016, the U.S. Federal Open Market Committee raised the target range for the federal funds rate to ½ to ¾ percent. We are unable to predict if, or when, the Federal Open Market Committee will announce further increases and the impact of any such increases on our floating rate interest rates. Higher interest rates could increase debt service requirements on our current floating rate debt and on any floating rate debt we may subsequently incur, and could reduce funds available for operations, future business opportunities or other purposes. If we need to repay existing debt during periods of rising interest rates, we could be required to refinance our then-existing debt on unfavorable terms, or liquidate one or more of our assets to repay such debt at times which may not permit realization of the maximum return on such assets and could result in a loss. The occurrence of either or both of these events could materially and adversely affect our Financial Performance.
Failure to hedge effectively against interest rate changes may materially and adversely affect our Financial Performance.
We may obtain one or more forms of interest rate protection–in the form of swap agreements, interest rate cap contracts or similar agreements–to hedge against the possible negative effects of interest rate fluctuations. However, we cannot assure stockholders that any hedging will adequately relieve the adverse effects of interest rate increases or that counterparties under these agreements will honor their obligations thereunder. In addition, we may be subject to risks of default by hedging counterparties. Adverse economic conditions could also cause the terms on which we borrow to be unfavorable. We could be required to liquidate one or more of our assets at times which may not permit us to receive an attractive return on our assets in order to meet our debt service obligations. Failure of our hedging mechanisms could materially and adversely affect our Financial Performance.
Risks Related to Our Organization and Structure
We are and will continue to be dependent on key personnel and certain members of our management team.
Our business involves complex operations and requires a management team and employee workforce that is knowledgeable and expert in many areas necessary for its operations. Our success and ability to obtain, generate and manage opportunities depends to a significant degree upon the contributions of key personnel, including, but not limited to, Douglas Bauer, our Chief Executive Officer, Thomas Mitchell, our President and Chief Operating Officer, and Michael Grubbs, our Chief Financial Officer and Treasurer. Our investors must rely to a significant extent upon the ability, expertise, judgment and discretion of this management team and other key personnel, and their loss or departure could be detrimental to our future success. Although we have entered into employment agreements with Messrs. Bauer, Mitchell and Grubbs, there is no guarantee that these executives will remain employed with us. Additionally, key employees working in the real estate, homebuilding and construction industries are highly sought after and failure to attract and retain such personnel may materially and adversely affect the standards of our future service and may have a material and adverse impact on our Financial Performance.
Our ability to retain our management team and key personnel or to attract suitable replacements should any members of our management team leave is dependent on the competitive nature of the employment market. The loss of services from any member of our management team or key personnel, or the potential that they could have competing obligations and will only spend a portion of their time working for us, could materially and adversely impact our Financial Performance. Further, the process of attracting and retaining suitable replacements for key personnel whose services we may lose would result in transition costs and would divert the attention of other members of our management from existing operations. Moreover, such a loss could be negatively perceived in the capital markets.
We have not obtained key man life insurance that would provide us with proceeds in the event of death or disability of any of our key personnel.
Termination of the employment agreements with the members of our management team could be costly and prevent a change in control of our company.
Our employment agreements with Messrs. Bauer, Mitchell and Grubbs each provide that if their employment with us terminates under certain circumstances, we may be required to pay them significant amounts of severance compensation, thereby making it costly to terminate their employment. Furthermore, these provisions could delay or prevent a transaction or a change in control of our company that might involve a premium paid for shares of our common stock or otherwise be in the best interests of our stockholders, which could adversely affect the market price of our common stock.
- 38 -
Certain anti-takeover defenses and applicable law may limit the ability of a third-party to acquire control of us.
Our charter and bylaws and Delaware law contain provisions that may delay or prevent a transaction or a change in control of our company that might involve a premium paid for shares of our common stock or otherwise be in the best interests of our stockholders, which could adversely affect the market price of our common stock. Certain of these provisions are described below.
Selected provisions of our charter and bylaws.
Our charter and/or bylaws contain anti-takeover provisions that:
• | authorize our board of directors, without further action by the stockholders, to issue up to 50,000,000 shares of preferred stock in one or more series, and with respect to each series, to fix the number of shares constituting that series and establish the rights and other terms of that series; |
• | require that actions to be taken by our stockholders may be taken only at an annual or special meeting of our stockholders and not by written consent; |
• | specify that special meetings of our stockholders can be called only by our board of directors, the chairman of our board of directors or our chief executive officer (or if there is no chief executive officer, the president); |
• | establish advance notice procedures for stockholders to submit nominations of candidates for election to our board of directors and other proposals to be brought before a stockholders meeting; |
• | provide that our bylaws may be amended by our board of directors without stockholder approval; |
• | allow our directors to establish the size of our board of directors by action of our board, subject to a minimum of three members; |
• | provide that vacancies on our board of directors or newly created directorships resulting from an increase in the number of our directors may be filled only by a majority of directors then in office, even though less than a quorum; |
• | do not give the holders of our common stock cumulative voting rights with respect to the election of directors; and |
• | prohibit us from engaging in certain business combinations with any “interested stockholder” unless specified conditions are satisfied as described below. |
Selected provisions of Delaware law.
We have opted out of Section 203 of the Delaware General Corporation Law, which regulates corporate takeovers. However, our charter contains provisions that are similar to Section 203. Specifically, our charter provides that we may not engage in certain “business combinations” with any “interested stockholder” for a three-year period following the time that the person became an interested stockholder, unless:
• | prior to the time that person became an interested stockholder, our board of directors approved either the business combination or the transaction which resulted in the person becoming an interested stockholder; |
• | upon consummation of the transaction which resulted in the person becoming an interested stockholder, the interested stockholder owned at least 85% of the voting stock of the corporation outstanding at the time the transaction commenced, excluding certain shares; or |
• | at or subsequent to the time the person became an interested stockholder, the business combination is approved by our board of directors and by the affirmative vote of at least 66 2/3% of the outstanding voting stock which is not owned by the interested stockholder. |
Generally, a business combination includes a merger, consolidation, asset or stock sale or other transaction resulting in a financial benefit to the interested stockholder. Subject to certain exceptions, an interested stockholder is a person who, together with that person’s affiliates and associates, owns, or within the previous three years owned, 15% or more of our voting stock. However, in the case of our company, the Starwood Fund and any of its affiliates and subsidiaries and any of their permitted transferees receiving 15% or more of our voting stock will not be deemed to be interested stockholders regardless of the percentage of our voting stock owned by them. This provision could prohibit or delay mergers or other takeover or change in control attempts with respect to us and, accordingly, may discourage attempts to acquire us.
- 39 -
We may change our operational policies, investment guidelines and our business and growth strategies without stockholder consent, which may subject us to different and more significant risks in the future.
Our board of directors will determine our operational policies, investment guidelines and our business and growth strategies. Our board of directors may make changes to, or approve transactions that deviate from, those policies, guidelines and strategies without a vote of, or notice to, our stockholders. This could result in us conducting operational matters, making investments or pursuing different business or growth strategies than those contemplated currently. Under any of these circumstances, we may expose ourselves to different and more significant risks in the future, which could have a material adverse effect on our Financial Performance.
If we fail to maintain an effective system of internal controls, we may not be able to accurately determine our financial results or prevent fraud. As a result, our stockholders could lose confidence in our financial results, which could materially and adversely affect us and the market price of our common stock.
A system of internal control over financial reporting, no matter how well conceived and operated can provide only reasonable, not absolute, assurance that the objectives of the control system are met. The design of control systems reflects resource constraints and the benefits of controls must be considered in relationship to their costs. Accordingly, there can be no assurance that all control issues or fraud will be detected. We cannot be certain that we will be successful in maintaining adequate internal control over our financial reporting and financial processes. Furthermore, as we continue to grow our business, our internal controls will become more complex, and we will require significantly more resources to ensure that our internal controls remain effective. Additionally, the existence of any material weakness or significant deficiency would require management to devote significant time and incur significant expense to remediate any such material weaknesses, or significant deficiencies and management may not be able to remediate any such material weaknesses or significant deficiencies in a timely manner. There is no assurance that our independent auditor will be able to provide an unqualified attestation report on internal control over financial reporting in future years. If our independent auditor is unable to provide an unqualified attestation report, investors could lose confidence in the reliability of our financial statements, and our stock price could be materially and adversely affected. The existence of any material weakness in our internal control over financial reporting could result in errors in our financial statements that could require us to restate our financial statements, cause us to fail to meet our reporting obligations, and cause stockholders to lose confidence in our reported financial information, all of which could materially and adversely affect us and the market price for our common stock.
Changes in accounting rules, assumptions and/or judgments could delay the dissemination of our financial statements and cause us to restate prior period financial statements.
Accounting rules and interpretations for certain aspects of our operations are highly complex and involve significant assumptions and judgment. These complexities could lead to a delay in the preparation and dissemination of our financial statements. Furthermore, changes in accounting rules and interpretations or in our accounting assumptions and/or judgments, such as asset impairments, could significantly impact our financial statements. In some cases, we could be required to apply a new or revised standard retroactively, resulting in restating prior period financial statements. Any of these circumstances could have a material adverse effect on our Financial Performance.
Our joint venture investments could be materially and adversely affected by lack of sole decision making authority, reliance on co-venturers’ financial condition and disputes between us and our co-venturers.
We have co-invested, and we may co-invest in the future, with third parties through partnerships, joint ventures or other entities, acquiring noncontrolling interests in or sharing responsibility for managing the affairs of land acquisition and/or developments. We will not be in a position to exercise sole decision-making authority regarding the land acquisitions and/or developments undertaken by our current joint ventures and any future joint ventures in which we may co-invest, and our investment may be illiquid due to our lack of control. Investments in partnerships, joint ventures or other entities may, under certain circumstances, involve risks not present when a third-party is not involved, including the possibility that partners or co-venturers might become bankrupt, fail to fund their share of required capital contributions or otherwise meet their contractual obligations, make poor business decisions or block or delay necessary decisions. Partners or co-venturers may have economic or other business interests or goals which are inconsistent with our business interests or goals, and may be in a position to take actions contrary to our policies or objectives. Such investments may also have the potential risk of impasses on decisions, such as a sale, because neither us nor the partner or co-venturer would have full control over the partnership or joint venture. Disputes between us and partners or co-venturers may result in litigation or arbitration that would increase our expenses and prevent our officers and/or directors from focusing their time and effort on our business. In addition, we may in certain circumstances be liable for the actions of its third-party partners or co-venturers.
- 40 -
Risks Related to Ownership of Our Common Stock
We do not intend to pay dividends on our common stock for the foreseeable future.
We currently intend to retain our future earnings, if any, to finance the development and expansion of our business and, therefore, do not intend to pay cash dividends on our common stock for the foreseeable future. Any future determination to pay dividends will be at the discretion of our board of directors and will depend on our financial condition, results of operations, capital requirements, restrictions contained in any financing instruments and such other factors as our board of directors deems relevant. Accordingly, stockholders may need to sell their shares of our common stock to realize a return on their investment, and stockholders may not be able to sell their shares at or above the price they paid for them.
Future sales of our common stock or other securities convertible into our common stock could cause the market value of our common stock to decline and could result in dilution of stockholders’ shares.
Our board of directors is authorized, without stockholder approval, to cause us to issue additional shares of our common stock or to raise capital through the issuance of preferred stock (including equity or debt securities convertible into common stock), options, warrants and other rights, on terms and for consideration as our board of directors in its sole discretion may determine. Sales of substantial amounts of our common stock could cause the market price of our common stock to decrease significantly. We cannot predict the effect, if any, of future sales of our common stock, or the availability of our common stock for future sales, on the value of our common stock. Sales of substantial amounts of our common stock by the Starwood Fund or another large stockholder or otherwise, or the perception that such sales could occur, may adversely affect the market price of our common stock.
Future offerings of debt securities, which would rank senior to our common stock in the event of our bankruptcy or liquidation, and future offerings of equity securities that may be senior to our common stock for the purposes of dividend and liquidating distributions, may adversely affect the market price of our common stock.
In the future, we may attempt to increase our capital resources by making additional offerings of debt securities or additional offerings of equity securities. Upon bankruptcy or liquidation, holders of our debt securities and shares of preferred stock and lenders with respect to other borrowings will receive a distribution of our available assets prior to the holders of our common stock. Additional equity offerings may dilute the holdings of our existing stockholders or reduce the market price of our common stock, or both. Our preferred stock, if issued, could have a preference on liquidating distributions or a preference on dividend payments or both that could limit our ability to make a dividend distribution to the holders of our common stock. Our decision to issue securities in any future offering will depend on market conditions and other factors beyond our control. As a result, we cannot predict or estimate the amount, timing or nature of our future offerings, and purchasers of our common stock bear the risk of our future offerings reducing the market price of our common stock and diluting their ownership interest in our company.
Non-U.S. holders may be subject to United States federal income tax on gain realized on the sale or disposition of shares of our common stock.
We believe we are and will remain a “United States real property holding corporation” for United States federal income tax purposes. As a result, a non-U.S. holder generally will be subject to United States federal income tax on any gain realized on a sale or disposition of shares of our common stock, and a purchaser of the stock generally will be required to withhold and remit to the Internal Revenue Service (the “IRS”) 10% of the purchase price, unless our common stock is regularly traded on an established securities market (such as the NYSE) and such non-U.S. holder did not actually or constructively hold more than 5% of our common stock at any time during the shorter of (a) the five-year period preceding the date of the sale or disposition and (b) the non-U.S. holder’s holding period in such stock. A non-U.S. holder also will be required to file a United States federal income tax return for any taxable year in which it realizes a gain from the disposition of our common stock that is subject to United States federal income tax.
No assurance can be given that our common stock will remain regularly traded in the future. Non-U.S. holders should consult their tax advisors concerning the consequences of disposing of shares of our common stock.
- 41 -
There is no assurance that our stock repurchase program will result in repurchases of our common stock or enhance long term stockholder value, and repurchases, if any, could affect our stock price and increase its volatility and will diminish our cash reserves.
Repurchases pursuant to a stock repurchase program could affect our stock price and increase its volatility and will reduce the market liquidity for our stock. The existence of a stock repurchase program could also cause our stock price to be higher than it would be in the absence of such a program. Additionally, these repurchases will diminish our cash reserves, which could impact our ability to pursue possible future strategic opportunities and acquisitions and would result in lower overall returns on our cash balances. There can be no assurance that any stock repurchases will, in fact, occur, or, if they occur, that they will enhance stockholder value. Although stock repurchase programs is intended to enhance long term stockholder value, short-term stock price fluctuations could reduce the effectiveness of these repurchases.
Item 1B. | Unresolved Staff Comments |
Not applicable.
Item 2. | Properties |
We lease our corporate headquarters located in Irvine, California. Our homebuilding division offices and financial services operations are located in leased space in the markets where we conduct business.
We believe that such properties, including the equipment located therein, are suitable and adequate to meet the needs of our businesses.
Item 3. | Legal Proceedings |
Not applicable.
Item 4. | Mine Safety Disclosures |
Not applicable.
PART II.
Item 5. | Market for Registrant’s Common Equity, Related Stockholder Matters and Issuer Purchases of Equity Securities |
Our common stock is listed on the NYSE under the ticker symbol “TPH”. The following table sets forth the high and low intra-day sales prices per share of our common stock for the periods indicated, as reported by the NYSE.
2016 | ||||||||||||
Dividends | ||||||||||||
Quarter Ended | High | Low | Declared | |||||||||
March 31 | $ | 12.47 | $ | 8.83 | $ | — | ||||||
June 30 | $ | 12.81 | $ | 10.49 | $ | — | ||||||
September 30 | $ | 14.20 | $ | 11.59 | $ | — | ||||||
December 31 | $ | 13.37 | $ | 10.35 | $ | — | ||||||
2015 | ||||||||||||
Dividends | ||||||||||||
Quarter Ended | High | Low | Declared | |||||||||
March 31 | $ | 16.57 | $ | 13.48 | $ | — | ||||||
June 30 | $ | 16.15 | $ | 13.94 | $ | — | ||||||
September 30 | $ | 15.70 | $ | 12.89 | $ | — | ||||||
December 31 | $ | 14.60 | $ | 12.28 | $ | — | ||||||
Issuer Purchases of Equity Securities
On January 26, 2016 our board of directors approved a stock repurchase program (the “2016 Repurchase Program”), authorizing the repurchase of our common stock with an aggregate value of up to $100 million through January 25, 2017. Purchases of common stock were made in open market transactions effected through a broker-dealer at prevailing market prices, in block trades, or by other means in accordance with federal securities laws, including pursuant to any trading plan that may be adopted in accordance with Rule 10b5-1 of the Exchange Act.
During the three months ended December 31, 2016, we repurchased the following shares under the 2016 Repurchase Program:
Total number of shares purchased | Average price paid per share | Total number of shares purchased as part of publicly announced program | Approximate dollar value of shares that may yet be purchased under the program (1) | |||||||||||
October 1, 2016 to October 31, 2016 | 618,532 | $ | 12.43 | 618,532 | $ | 67,200,422 | ||||||||
November 1, 2016 to November 30, 2016 | 836,800 | $ | 11.09 | 836,800 | $ | 57,918,332 | ||||||||
December 1, 2016 to December 31, 2016 | — | $ | — | — | $ | 57,918,332 | ||||||||
Total | 1,455,332 | $ | 11.66 | 1,455,332 | ||||||||||
__________
(1) During the three months and full year ended December 31, 2016, there was an aggregate of 1,455,332 and 3,560,853 shares of common stock repurchased for $17.0 million and $42.1 million, respectively. No shares of common stock were repurchased during the year ended December 31, 2015.
The 2016 Repurchase Program expired on January 25, 2017 and no shares of common stock were repurchased under the 2016 Repurchase Program subsequent to December 31, 2016.
Stockholder Return Performance Graph
The following performance graph shows a comparison of the cumulative total returns to stockholders of the Company, as compared with the Standard & Poor’s 500 Composite Stock Index and the Dow Jones Industry Group-U.S. Home Construction Index.
- 42 -
The performance graph and related information shall not be deemed to be “soliciting material” or to be “filed” with the Securities and Exchange Commission, nor shall such information be incorporated by reference into any filing under the Securities Act or the Exchange Act, except to the extent that we specifically incorporate it by reference.
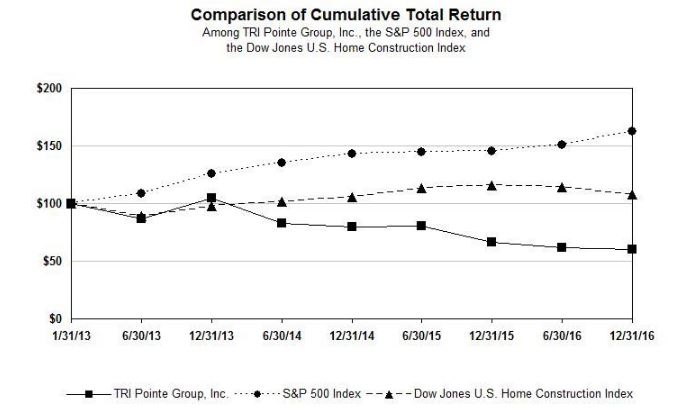
The above graph is based upon common stock and index prices calculated as of the dates indicated. The Company’s common stock closing price on December 31, 2016 was $11.48 per share. The stock price performance of the Company’s common stock depicted in the graph above represents past performance only and is not necessarily indicative of future performance.
As of February 14, 2017, we had 96 holders of record of our common stock. We have not paid any dividends on our common stock and currently intend to retain any future earnings to finance the development and expansion of our business and, therefore, do not intend to pay cash dividends on our common stock for the foreseeable future. Any future determination to pay dividends will be at the discretion of our board of directors and will depend on our financial condition, results of operations, capital requirements, restrictions contained in any financing instruments and such other factors as our board of directors deems relevant. Accordingly, stockholders may need to sell their shares of our common stock to realize a return on their investment, and stockholders may not be able to sell their shares at or above the price they paid for them. See Part I, Item 1A, “Risk Factors—Risks Related to Ownership of Our Common Stock—we do not intend to pay dividends on our common stock for the foreseeable future” of this annual report on Form 10-K.
- 43 -
Item 6. | Selected Financial Data |
The following sets forth our selected financial and operating data on a historical basis. The following summary of selected financial data should be read in conjunction with our consolidated financial statements and the related notes and with “Management’s Discussion and Analysis of Financial Condition and Results of Operations,” which are included elsewhere in this annual report on Form 10-K.
WRECO Transaction
For a description of the Merger, please see Part I, Item 1, “Business–Merger with WRECO” of this annual report on Form 10-K. The Merger is accounted for in accordance with Accounting Standards Codification (“ASC”) Topic 805, Business Combinations (“ASC 805”). For accounting purposes, the Merger was treated as a “reverse acquisition” and WRECO was considered the accounting acquirer. Accordingly, WRECO is reflected as the predecessor and acquirer and therefore the accompanying consolidated financial statements reflect the historical consolidated financial statements of WRECO, and do not include the historical financial statements of legacy TRI Pointe, for all periods presented prior to the Closing Date. Subsequent to the Closing Date and on a go forward basis, the consolidated financial statements reflect the results of the combined company.
- 44 -
Year Ended December 31, | |||||||||||||||||||
2016 | 2015 | 2014 | 2013 | 2012 | |||||||||||||||
Statement of Operations Data: | (dollars in thousands, except per share amounts) | ||||||||||||||||||
Homebuilding: | |||||||||||||||||||
Home sales revenue | $ | 2,329,336 | $ | 2,291,264 | $ | 1,646,274 | $ | 1,218,430 | $ | 870,596 | |||||||||
Land and lot sales revenue | 72,272 | 101,284 | 47,660 | 52,261 | 192,489 | ||||||||||||||
Other operations revenue | 2,314 | 7,601 | 9,682 | 4,021 | 7,221 | ||||||||||||||
Total revenues | 2,403,922 | 2,400,149 | 1,703,616 | 1,274,712 | 1,070,306 | ||||||||||||||
Cost of home sales | 1,834,857 | 1,807,091 | 1,316,470 | 948,561 | 690,578 | ||||||||||||||
Cost of land and lot sales | 17,367 | 34,844 | 37,560 | 38,052 | 116,143 | ||||||||||||||
Other operations expense | 2,247 | 4,360 | 3,324 | 2,854 | 5,214 | ||||||||||||||
Impairments and lot option abandonments (1) | 1,470 | 1,930 | 2,515 | 345,448 | (2) | 3,591 | |||||||||||||
Sales and marketing | 127,903 | 116,217 | 103,600 | 94,521 | 78,022 | ||||||||||||||
General and administrative | 123,470 | 117,496 | 82,358 | 74,244 | 75,583 | ||||||||||||||
Restructuring charges | 649 | 3,329 | 10,543 | 10,938 | 2,460 | ||||||||||||||
Homebuilding income (loss) from operations | 295,959 | 314,882 | 147,246 | (239,906 | ) | 98,715 | |||||||||||||
Equity in income (loss) of unconsolidated entities | 179 | 1,460 | (278 | ) | 2 | 2,490 | |||||||||||||
Transaction expenses | — | — | (17,960 | ) | — | — | |||||||||||||
Other income (loss), net | 312 | 858 | (1,019 | ) | 2,450 | (1,576 | ) | ||||||||||||
Homebuilding income (loss) from continuing operations before taxes | 296,450 | 317,200 | 127,989 | (237,454 | ) | 99,629 | |||||||||||||
Financial Services: | |||||||||||||||||||
Revenues | 1,220 | 1,010 | — | — | — | ||||||||||||||
Expenses | 253 | 181 | 15 | — | — | ||||||||||||||
Equity in income (loss) of unconsolidated entities | 4,810 | 1,231 | (10 | ) | — | — | |||||||||||||
Financial services income (loss) from continuing operations before taxes | 5,777 | 2,060 | (25 | ) | — | — | |||||||||||||
Income (loss) from continuing operations before taxes | 302,227 | 319,260 | 127,964 | (237,454 | ) | 99,629 | |||||||||||||
(Provision) benefit for income taxes | (106,094 | ) | (112,079 | ) | (43,767 | ) | 86,161 | (3) | (38,910 | ) | |||||||||
Income (loss) from continuing operations | 196,133 | 207,181 | 84,197 | (151,293 | ) | 60,719 | |||||||||||||
Discontinued operations, net of income taxes | — | — | — | 1,838 | 762 | ||||||||||||||
Net income (loss) | 196,133 | 207,181 | 84,197 | (149,455 | ) | 61,481 | |||||||||||||
Net income attributable to noncontrolling interests | (962 | ) | (1,720 | ) | — | — | — | ||||||||||||
Net income (loss) available to common stockholders | $ | 195,171 | $ | 205,461 | $ | 84,197 | $ | (149,455 | ) | $ | 61,481 | ||||||||
Amounts attributable to TRI Pointe Group, Inc. common stockholders: | |||||||||||||||||||
Income (loss) from continuing operations | $ | 195,171 | $ | 205,461 | $ | 84,197 | $ | (151,293 | ) | $ | 60,719 | ||||||||
Income from discontinued operations | — | — | — | 1,838 | 762 | ||||||||||||||
Net income (loss) available to common stockholders | $ | 195,171 | $ | 205,461 | $ | 84,197 | $ | (149,455 | ) | $ | 61,481 | ||||||||
Earnings (loss) per share | |||||||||||||||||||
Basic | |||||||||||||||||||
Continuing operations | $ | 1.21 | $ | 1.27 | $ | 0.58 | $ | (1.17 | ) | $ | 0.47 | ||||||||
Discontinued operations | — | — | — | 0.02 | — | ||||||||||||||
Net earnings (loss) per share | $ | 1.21 | $ | 1.27 | $ | 0.58 | $ | (1.15 | ) | $ | 0.47 | ||||||||
Diluted | |||||||||||||||||||
Continuing operations | $ | 1.21 | $ | 1.27 | $ | 0.58 | $ | (1.17 | ) | $ | 0.47 | ||||||||
Discontinued operations | — | — | — | 0.02 | — | ||||||||||||||
Net earnings (loss) per share | $ | 1.21 | $ | 1.27 | $ | 0.58 | $ | (1.15 | ) | $ | 0.47 | ||||||||
- 45 -
Year Ended December 31, | |||||||||||||||||||
2016 | 2015 | 2014 | 2013 | 2012 | |||||||||||||||
Operating Data-Owned Projects: | (dollars in thousands) | ||||||||||||||||||
Net new home orders | 4,248 | 4,181 | 2,947 | 3,055 | 2,665 | ||||||||||||||
New homes delivered | 4,211 | 4,057 | 3,100 | 2,939 | 2,314 | ||||||||||||||
Average sales price of homes delivered | $ | 553 | $ | 565 | $ | 531 | $ | 415 | $ | 376 | |||||||||
Cancellation rate | 15 | % | 16 | % | 16 | % | 15 | % | 15 | % | |||||||||
Average selling communities | 118.3 | 115.9 | 99.1 | 85.5 | 71.9 | ||||||||||||||
Selling communities at end of period | 124 | 104 | 108 | 89 | 68 | ||||||||||||||
Backlog at end of period, number of homes | 1,193 | 1,156 | 1,032 | 897 | 781 | ||||||||||||||
Backlog at end of period, aggregate sales value | $ | 661,146 | $ | 697,334 | $ | 653,096 | $ | 507,064 | $ | 342,497 | |||||||||
Year Ended December 31, | |||||||||||||||||||
2016 | 2015 | 2014 | 2013 | 2012 | |||||||||||||||
Balance Sheet Data (at period end): | (in thousands) | ||||||||||||||||||
Cash and cash equivalents | $ | 208,657 | $ | 214,485 | $ | 170,629 | $ | 4,510 | $ | 5,212 | |||||||||
Real estate inventories | $ | 2,910,627 | $ | 2,519,273 | $ | 2,280,183 | $ | 1,465,526 | $ | 1,643,691 | |||||||||
Total assets | $ | 3,564,640 | $ | 3,138,071 | $ | 2,889,838 | $ | 1,910,464 | $ | 1,999,537 | |||||||||
Total debt, net | $ | 1,382,033 | $ | 1,170,505 | $ | 1,138,493 | $ | 834,589 | $ | 798,808 | |||||||||
Total liabilities | $ | 1,716,130 | $ | 1,451,608 | $ | 1,417,362 | $ | 1,084,947 | $ | 1,005,810 | |||||||||
Total equity | $ | 1,848,510 | $ | 1,686,463 | $ | 1,472,476 | $ | 825,517 | $ | 993,727 | |||||||||
___________________________________________________
(1) | Impairments and lot option abandonments are included in cost of home sales and cost of land and lot sales on the consolidated statements of operations found in Part IV, Item 15 on this annual report on Form 10-K. For a more detailed presentation of our real estate inventory impairments and lot option abandonments, see Note 7, Real Estate Inventories, of the notes to our consolidated financial statements included elsewhere in this annual report on Form 10-K. |
(2) | Includes $343.3 million of impairment and related charges for Coyote Springs, a large master planned community north of Las Vegas, Nevada that was owned by Pardee Homes and excluded as part of the Merger. |
(3) | The tax benefit was primarily the result of a loss from continuing operations due to the Coyote Springs impairment. |
- 46 -
Item 7. | Management’s Discussion and Analysis of Financial Condition and Results of Operations |
The following should be read in conjunction with the sections of this annual report on Form 10-K entitled “Risk Factors,” “Cautionary Note Concerning Forward-Looking Statements,” “Selected Financial Data,” “Business” and our historical financial statements and related notes thereto included elsewhere in this annual report on Form 10-K. This discussion contains forward-looking statements reflecting current expectations that involve risks and uncertainties. Actual results and the timing of events may differ materially from those contained in these forward-looking statements due to a number of factors, including those discussed in the section entitled “Risk Factors” and elsewhere in this annual report on Form 10-K.
For a description of the Merger, please see Part I, Item 1, “Business–Merger with WRECO” of this annual report on Form 10-K. The Merger is accounted for in accordance with ASC 805. For accounting purposes, the Merger was treated as a "reverse acquisition" and WRECO was considered the accounting acquirer. Accordingly, WRECO is reflected as the predecessor and acquirer and therefore the accompanying consolidated financial statements reflect the historical consolidated financial statements of WRECO, and do not include the historical financial statements of legacy TRI Pointe, for all periods presented prior to the Closing Date. Subsequent to the Closing Date and on a go forward basis, the consolidated financial statements reflect the results of the combined company.
Overview and Outlook
We continue to be encouraged by the strength of the overall U.S. new-home market, which continues to improve on a slow, sustainable growth trajectory, supported by stronger general economic conditions, low unemployment levels, modest wage gains, low interest rates, and increasing consumer confidence combined with a limited supply of new homes. We believe the new presidential administration will lend support to the homebuilding industry and we are encouraged by the prospect of a deregulated financial services industry, and believe this trend will offset any new pressure created from a steady rise in interest rates. We believe demand will continue to be strong across the U.S. in general and in a majority of the markets in which we operate over the next several years. Nevertheless, we continue to see variability from market to market with demand generally driven by general local market economic conditions. Homebuilding activity in many markets continues to be constrained by land and labor availability, as well as fee increases and delays imposed by local municipalities, which we expect will continue to constrict supply. We expect these demand and supply trends will result in a continued slow and steady recovery in the homebuilding market, with consumer, job and household formation growth serving as leading indicators of positive demand. See "Cautionary Note Concerning Forward-Looking Statements".
Our full year 2016 results reflect a decrease in net income available to common stockholders of 5% as compared to the prior year period due to a decrease in land and lot sales profit and an increase in sales and marketing and general and administrative expenses, offset by an increase in homebuilding gross margin dollars and an increase in income from our Financial Services segment. New home deliveries increased 4% while the average sales price of homes delivered decreased by 2%, resulting in a 2% increase in home sales revenue. The increase in new home deliveries was accompanied by a 2% increase in average selling communities.
- 47 -
Consolidated Financial Data (in thousands, except share and per share amounts):
Year Ended December 31, | |||||||||||
2016 | 2015 | 2014 | |||||||||
Homebuilding: | |||||||||||
Home sales revenue | $ | 2,329,336 | $ | 2,291,264 | $ | 1,646,274 | |||||
Land and lot sales revenue | 72,272 | 101,284 | 47,660 | ||||||||
Other operations revenue | 2,314 | 7,601 | 9,682 | ||||||||
Total revenues | 2,403,922 | 2,400,149 | 1,703,616 | ||||||||
Cost of home sales | 1,836,327 | 1,808,776 | 1,318,617 | ||||||||
Cost of land and lot sales | 17,367 | 35,089 | 37,906 | ||||||||
Other operations expense | 2,247 | 4,360 | 3,346 | ||||||||
Sales and marketing | 127,903 | 116,217 | 103,600 | ||||||||
General and administrative | 123,470 | 117,496 | 82,358 | ||||||||
Restructuring charges | 649 | 3,329 | 10,543 | ||||||||
Homebuilding income from operations | 295,959 | 314,882 | 147,246 | ||||||||
Equity in income (loss) of unconsolidated entities | 179 | 1,460 | (278 | ) | |||||||
Transaction expenses | — | — | (17,960 | ) | |||||||
Other income (loss), net | 312 | 858 | (1,019 | ) | |||||||
Homebuilding income before income taxes | 296,450 | 317,200 | 127,989 | ||||||||
Financial Services: | |||||||||||
Revenues | 1,220 | 1,010 | — | ||||||||
Expenses | 253 | 181 | 15 | ||||||||
Equity in income (loss) of unconsolidated entities | 4,810 | 1,231 | (10 | ) | |||||||
Financial services income (loss) before income taxes | 5,777 | 2,060 | (25 | ) | |||||||
Income before income taxes | 302,227 | 319,260 | 127,964 | ||||||||
Provision for income taxes | (106,094 | ) | (112,079 | ) | (43,767 | ) | |||||
Net income | 196,133 | 207,181 | 84,197 | ||||||||
Net income attributable to noncontrolling interests | (962 | ) | (1,720 | ) | — | ||||||
Net income available to common stockholders | $ | 195,171 | $ | 205,461 | $ | 84,197 | |||||
Earnings per share | |||||||||||
Basic | $ | 1.21 | $ | 1.27 | $ | 0.58 | |||||
Diluted | $ | 1.21 | $ | 1.27 | $ | 0.58 | |||||
Weighted average shares outstanding | |||||||||||
Basic | 160,859,782 | 161,692,152 | 145,044,351 | ||||||||
Diluted | 161,381,499 | 162,319,758 | 145,531,289 | ||||||||
Year Ended December 31, 2016 Compared to Year Ended December 31, 2015
Net New Home Orders, Average Selling Communities and Monthly Absorption Rates by Segment
Year Ended December 31, 2016 | Year Ended December 31, 2015 | Percentage Change | ||||||||||||||||||||||||
Net New Home Orders | Average Selling Communities | Monthly Absorption Rates | Net New Home Orders | Average Selling Communities | Monthly Absorption Rates | Net New Home Orders | Average Selling Communities | Monthly Absorption Rates | ||||||||||||||||||
Maracay Homes | 670 | 18.0 | 3.1 | 578 | 16.6 | 2.9 | 16 | % | 8 | % | 7 | % | ||||||||||||||
Pardee Homes | 1,206 | 23.6 | 4.3 | 1,186 | 23.1 | 4.3 | 2 | % | 2 | % | — | % | ||||||||||||||
Quadrant Homes | 341 | 8.0 | 3.6 | 441 | 10.7 | 3.4 | (23 | )% | (25 | )% | 6 | % | ||||||||||||||
Trendmaker Homes | 501 | 27.8 | 1.5 | 457 | 25.1 | 1.5 | 10 | % | 11 | % | — | % | ||||||||||||||
TRI Pointe Homes | 1,097 | 27.6 | 3.3 | 1,107 | 26.9 | 3.4 | (1 | )% | 3 | % | (3 | )% | ||||||||||||||
Winchester Homes | 433 | 13.3 | 2.7 | 412 | 13.5 | 2.5 | 5 | % | (1 | )% | 8 | % | ||||||||||||||
Total | 4,248 | 118.3 | 3.0 | 4,181 | 115.9 | 3.0 | 2 | % | 2 | % | — | % | ||||||||||||||
- 48 -
Net new home orders for the year ended December 31, 2016 increased 2% to 4,248, compared to 4,181 during the prior year. The increase in net new home orders was primarily due to an overall 2% increase in average selling communities.
Maracay Homes reported a 16% increase in net new home orders driven by increases in both community count and monthly absorption rates. The increases were the result of solid market fundamentals and successful new product offerings during the year. Pardee Homes increased net new home orders by 2% mainly due to a similar increase in average community count. Demand remained strong in all of the markets in which Pardee Homes operates as evidenced by a monthly absorption rate above the company average. Net new home orders decreased at Quadrant Homes largely due to the timing of new community openings. Average selling communities decreased 25% compared to the prior year while absorptions rates increased 6%, to 3.6 homes per community per month, as a result of our well located communities and continued strong market fundamentals. Trendmaker Homes increased net new home orders by 10% based on a similar increase in average community count. The Houston market has been challenged due to the decrease in oil prices and the related impact on job growth in that sector. TRI Pointe Homes’ net new home orders were relatively flat year over year due to a slight decrease in monthly absorption rates, offset by a slight increase in average selling communities. Demand remains strong for TRI Pointe Homes, as evidenced by absorptions of 3.3 homes per community, per month, at average selling prices above the company average. Winchester Homes experienced a 5% growth in net new home orders as a result of an 8% increase in monthly absorption rates offset by a slight decrease in average selling communities. We are encouraged by the increase in sales pace and overall demand in the markets that Winchester Homes operates.
Backlog Units, Dollar Value and Average Sales Price by Segment (dollars in thousands)
As of December 31, 2016 | As of December 31, 2015 | Percentage Change | ||||||||||||||||||||||||||||
Backlog Units | Backlog Dollar Value | Average Sales Price | Backlog Units | Backlog Dollar Value | Average Sales Price | Backlog Units | Backlog Dollar Value | Average Sales Price | ||||||||||||||||||||||
Maracay Homes | 248 | $ | 114,203 | $ | 460 | 203 | $ | 82,171 | $ | 405 | 22 | % | 39 | % | 14 | % | ||||||||||||||
Pardee Homes | 260 | 134,128 | 516 | 274 | 200,588 | 732 | (5 | )% | (33 | )% | (30 | )% | ||||||||||||||||||
Quadrant Homes | 101 | 68,461 | 678 | 143 | 72,249 | 505 | (29 | )% | (5 | )% | 34 | % | ||||||||||||||||||
Trendmaker Homes | 163 | 85,579 | 525 | 136 | 72,604 | 534 | 20 | % | 18 | % | (2 | )% | ||||||||||||||||||
TRI Pointe Homes | 298 | 180,012 | 604 | 290 | 192,097 | 662 | 3 | % | (6 | )% | (9 | )% | ||||||||||||||||||
Winchester Homes | 123 | 78,763 | 640 | 110 | 77,625 | 706 | 12 | % | 1 | % | (9 | )% | ||||||||||||||||||
Total | 1,193 | $ | 661,146 | $ | 554 | 1,156 | $ | 697,334 | $ | 603 | 3 | % | (5 | )% | (8 | )% | ||||||||||||||
Backlog units reflect the number of homes, net of actual cancellations experienced during the period, for which we have entered into a sales contract with a homebuyer but for which we have not yet delivered the home. Homes in backlog are generally delivered within three to nine months, although we may experience cancellations of sales contracts prior to delivery. Our cancellation rate of homebuyers who contracted to buy a home but did not close escrow (as a percentage of overall orders) decreased to 15% for the year ended December 31, 2016 from 16% for the year ended December 31, 2015. Backlog units increased 37 units, or 3%, to 1,193 as of December 31, 2016, compared to 1,156 as of December 31, 2015. The dollar value of backlog was approximately $661.1 million as of December 31, 2016, a decrease of $36.2 million, or 5%, compared to $697.3 million as of December 31, 2015. This decrease is due to a $49,000, or 8% decrease in the average sales price of homes in backlog to $554,000 from $603,000, which was due primarily to a lower mix of coastally located products for the year ended December 31, 2016, compared to the year ended December 31, 2015.
Maracay Homes’ backlog dollar value increased 39% compared to the prior year as a result of an increase in both backlog units and average sales price. The increase in backlog units was related to the increase in net new home orders and the increase in average sales price was due to a product mix shift to more move-up product during the year. Pardee Homes' backlog dollar value decreased 33% largely due to a 30% decrease in average sales price. The prior year average sales price of $732,000 included a higher mix of luxury homes coastally located in San Diego, California. Quadrant Homes’ backlog dollar value decreased 5% as a result of a 29% decrease in backlog units, offset by an increase in average sales price. The decrease in backlog units was directly related to the decrease in net new home orders during the year as result of a lower number of active selling communities. The increase in average sales prices was related to a higher mix of homes in backlog from core Seattle markets of King and Snohomish counties which have higher price points. Trendmaker Homes' backlog dollar value increased 18% largely due to a 20% increase in backlog units. The increase in backlog units was related to the increase in net new home orders and the decrease in new home deliveries as a result of timing. TRI Pointe Homes’ backlog dollar value decreased 6% due to a decrease in average sales price, slightly offset by an increase in units. The decrease in average sales price was due to a
- 49 -
higher mix of projects in Inland Empire in 2016 compared to the prior year where the mix was more heavily weighted to higher priced, coastal communities in Orange County, California. In 2017 we expect average sales prices to increase slightly with new community openings in Orange County, California. Winchester Homes’ backlog dollar value remained relatively flat with an offsetting increase in backlog units and a decrease in average sales price. The increase in backlog units was due to the increase in net new home orders during the year and the decrease in net new home deliveries related to the timing of those deliveries. The decrease in average sales prices was due to a product mix shift to more attached product during the year that sells at lower price points.
New Homes Delivered, Homes Sales Revenue and Average Sales Price by Segment (dollars in thousands)
Year Ended December 31, 2016 | Year Ended December 31, 2015 | Percentage Change | ||||||||||||||||||||||||||||
New Homes Delivered | Home Sales Revenue | Average Sales Price | New Homes Delivered | Home Sales Revenue | Average Sales Price | New Homes Delivered | Home Sales Revenue | Average Sales Price | ||||||||||||||||||||||
Maracay Homes | 625 | $ | 255,253 | $ | 408 | 480 | $ | 185,645 | $ | 387 | 30 | % | 37 | % | 5 | % | ||||||||||||||
Pardee Homes | 1,220 | 668,835 | 548 | 1,130 | 606,161 | 536 | 8 | % | 10 | % | 2 | % | ||||||||||||||||||
Quadrant Homes | 383 | 207,057 | 541 | 411 | 180,772 | 440 | (7 | )% | 15 | % | 23 | % | ||||||||||||||||||
Trendmaker Homes | 474 | 239,734 | 506 | 539 | 275,658 | 511 | (12 | )% | (13 | )% | (1 | )% | ||||||||||||||||||
TRI Pointe Homes | 1,089 | 723,186 | 664 | 1,060 | 774,005 | 730 | 3 | % | (7 | )% | (9 | )% | ||||||||||||||||||
Winchester Homes | 420 | 235,271 | 560 | 437 | 269,023 | 616 | (4 | )% | (13 | )% | (9 | )% | ||||||||||||||||||
Total | 4,211 | $ | 2,329,336 | $ | 553 | 4,057 | $ | 2,291,264 | $ | 565 | 4 | % | 2 | % | (2 | )% | ||||||||||||||
Home sales revenue increased $38.1 million, or 2% to $2.3 billion for the year ended December 31, 2016. The increase was comprised of: (i) $87.0 million due to an increase in homes delivered to 4,211 for the year ended December 31, 2016 from 4,057 in the prior year; offset by (ii) a decrease of $48.9 million related to a $12,000 or 2% decrease in the average sales price of homes delivered to $553,000 for the year ended December 31, 2016 from $565,000 in the prior year.
Maracay Homes reported a 37% increase in home sales revenue due to a 30% increase in new homes delivered and a 5% increase in average sales price. The increase in new homes delivered was largely driven by the large order and backlog growth experienced in 2015, which resulted in higher new homes delivered in 2016. Further, net new home orders continued to grow in 2016 as a result of strong market demand while the increase in average sales price was due to increased pricing during the year and product mix. Pardee Homes increased home sales revenue by 10% largely due to an increase in new homes delivered and a slight increase in average sales price. The increase in new home deliveries at Pardee Homes was the result of an increase in net new home orders in both the current and prior year due to strong market demand. Quadrant Homes increased home sales revenue by 15% driven by increased average sales prices, slightly offset by a decrease in new home deliveries. The 23% increase in average sales price was the result of delivery more units in the core Seattle markets of King and Snohomish counties which have higher price points. The 7% decrease in new home deliveries was due to the decrease in net new home orders as a result of decreased average selling communities. Home sales revenue decreased 13% at Trendmaker Homes mainly due to a decrease in new homes delivered. The decrease in new homes delivered was a result of the lower backlog to start the year due to the decrease in net new home order volume experienced in 2015. TRI Pointe Homes reported a 7% decrease in home sales revenue as a result of a 9% decrease in average sales price slightly offset by a 3% increase in new homes delivered. Average sales prices declined due to a higher mix of projects in Inland Empire in 2016 compared to the prior year where the mix was more heavily weighted to higher priced, coastal communities in Orange County, California. In 2017 we expect average sales prices to increase slightly with new community openings in Orange County, California. Home sales revenue decreased at Winchester Homes by 13% due to a decrease in both average sales prices and new homes delivered. The decrease in average sales prices was a product mix shift to more attached product during the year that sells at lower price points.
- 50 -
Homebuilding Gross Margins (dollars in thousands)
Year Ended December 31, | |||||||||||||
2016 | % | 2015 | % | ||||||||||
Home sales revenue | $ | 2,329,336 | 100.0 | % | $ | 2,291,264 | 100.0 | % | |||||
Cost of home sales | 1,836,327 | 78.8 | % | 1,808,776 | 78.9 | % | |||||||
Homebuilding gross margin | 493,009 | 21.2 | % | 482,488 | 21.1 | % | |||||||
Add: interest in cost of home sales | 51,111 | 2.2 | % | 44,299 | 1.9 | % | |||||||
Add: impairments and lot option abandonments | 1,470 | 0.1 | % | 1,685 | 0.1 | % | |||||||
Adjusted homebuilding gross margin(1) | $ | 545,590 | 23.4 | % | $ | 528,472 | 23.1 | % | |||||
Homebuilding gross margin percentage | 21.2 | % | 21.1 | % | |||||||||
Adjusted homebuilding gross margin percentage(1) | 23.4 | % | 23.1 | % | |||||||||
_______________________________________
(1) | Non-GAAP financial measure (as discussed below). |
Our homebuilding gross margin percentage increased to 21.2% for the year ended December 31, 2016, as compared to 21.1% for the year ended December 31, 2015. Excluding interest and impairment and lot option abandonments in cost of home sales, adjusted homebuilding gross margin percentage was 23.4% for the year ended December 31, 2016 compared to 23.1% for the prior year period, with the slight increase attributable to higher interest in cost of home sales. This higher interest cost is due primarily to the higher fixed rate debt we obtained in May of 2016 with the issuance of new $300 million senior notes.
Adjusted homebuilding gross margin is a non-GAAP financial measure. We believe this information is meaningful as it isolates the impact that leverage and noncash charges have on homebuilding gross margin and permits investors to make better comparisons with our competitors, who adjust gross margins in a similar fashion. See the table above reconciling this non-GAAP financial measure to homebuilding gross margin, the nearest GAAP equivalent.
Land and Lot Gross Margins (dollars in thousands)
Year Ended December 31, | |||||||||||||
2016 | % | 2015 | % | ||||||||||
Land and lot sales revenue | $ | 72,272 | 100.0 | % | $ | 101,284 | 100.0 | % | |||||
Cost of land and lot sales | 17,367 | 24.0 | % | 35,089 | 34.6 | % | |||||||
Land and lot gross margin | $ | 54,905 | 76.0 | % | $ | 66,195 | 65.4 | % | |||||
Our land and lot gross margin percentage increased to 76.0% for the year ended December 31, 2016 as compared to 65.4% for the prior year period, in part, owing to the following. In June of 2016, Pardee Homes sold two parcels, totaling 102 homebuilding lots, located in the Pacific Highlands Ranch community in San Diego, California. Pardee Homes received $61.6 million in cash proceeds from the sales. In June of 2015 Pardee Homes sold a commercial site in the Pacific Highlands Ranch community for $53.0 million in cash proceeds. These transactions involving the Pacific Highlands Ranch community included significant gross margins due to the low land basis of the community which was acquired in 1981. Land and lot sales gross margin percentage can vary significantly due to the type of land and its related cost basis.
Sales and Marketing, General and Administrative Expense (dollars in thousands)
Year Ended December 31, | As a Percentage of Home Sales Revenue | ||||||||||||
2016 | 2015 | 2016 | 2015 | ||||||||||
Sales and marketing | $ | 127,903 | $ | 116,217 | 5.5 | % | 5.1 | % | |||||
General and administrative (G&A) | 123,470 | 117,496 | 5.3 | % | 5.1 | % | |||||||
Total sales and marketing and G&A | $ | 251,373 | $ | 233,713 | 10.8 | % | 10.2 | % | |||||
- 51 -
Sales and marketing expense as a percentage of home sales revenue increased to 5.5% for the year ended December 31, 2016 from 5.1% for the year ended December 31, 2015. Sales and marketing expense increased $11.7 million, or 10%, to $127.9 million for the year ended December 31, 2016 from $116.2 million for the prior year period. The increase was due primarily to increased deliveries associated with increased average selling communities, along with an increase in outside commission costs for the year ended December 31, 2016, compared to the prior year period. Additionally, our expansion into the Austin, Texas and Los Angeles, California markets contributed to higher upfront sales and marketing costs in 2016.
General and administrative expense as a percentage of home sales revenue increased slightly to 5.3% for the year ended December 31, 2016 from 5.1% for the same period in the prior year. General and administrative expense increased by $6.0 million to $123.5 million for the year ended December 31, 2016 from $117.5 million for the prior year ended December 31, 2015. The increase in general and administrative expenses is primarily related to incremental costs associated with supporting the growth plan of the Company, including the current expansion into the Austin, Texas and Los Angeles, California markets.
Total sales and marketing and G&A (“SG&A”) expense increased $17.7 million, or 8%, to $251.4 million for the year ended December 31, 2016 from $233.7 million in the prior year period. SG&A increased to 10.8% of home sales revenue from 10.2% for the years ended December 31, 2016 and 2015, respectively.
Restructuring Charges
Restructuring charges decreased to $649,000 for the year ended December 31, 2016 compared to $3.3 million in the prior year. The decrease was mainly due to higher employee-related severance costs and higher lease termination costs in the prior year.
Interest
Interest, which was incurred principally to finance the Merger, land acquisitions, land development and home construction, totaled $68.3 million and $61.0 million for the years ended December 31, 2016 and 2015, respectively. All interest incurred in both periods was capitalized. The increase in interest incurred during the year ended December 31, 2016 as compared to the prior year was primarily attributable to an increase in our debt balance and weighted average interest rate, as a result of the issuance of our 2021 Notes in May 2016.
Income Tax
For the year ended December 31, 2016, we have recorded a tax provision of $106.1 million based on an effective tax rate of 35.1%. For the year ended December 31, 2015, we recorded a tax provision of $112.1 million based on an effective tax rate of 35.1%. The decrease in our provision for income tax was primarily the result of the decrease in income from operations for the year ended December 31, 2016.
Financial Services Segment
Income from our financial services operations increased to $5.8 million for the year ended December 31, 2016 compared to income of $2.1 million in the prior year. The increase in financial services income for the year ended December 31, 2016 compared to the prior year primarily relates to the growth of our mortgage financing and title services operations. Both our mortgage financing and title service operations were started in late 2014, contributing to the high growth experienced for the year ended December 31, 2016 compared to the year ended December 31, 2015.
- 52 -
Lots Owned or Controlled by Segment
Excluded from lots owned or controlled are those related to Note 8, Investments in Unconsolidated Entities, of the notes to our consolidated financial statements included elsewhere in this annual report on Form 10-K. The table below summarizes our lots owned or controlled by segment as of the dates presented:
Increase | |||||||||||
December 31, | (Decrease) | ||||||||||
2016 | 2015 | Amount | % | ||||||||
Lots Owned | |||||||||||
Maracay Homes | 1,667 | 1,566 | 101 | 6 | % | ||||||
Pardee Homes | 16,041 | 16,314 | (273 | ) | (2 | )% | |||||
Quadrant Homes | 1,027 | 1,027 | — | — | % | ||||||
Trendmaker Homes | 1,687 | 1,367 | 320 | 23 | % | ||||||
TRI Pointe Homes | 3,073 | 2,504 | 569 | 23 | % | ||||||
Winchester Homes | 1,788 | 1,955 | (167 | ) | (9 | )% | |||||
Total | 25,283 | 24,733 | 550 | 2 | % | ||||||
Lots Controlled(1) | |||||||||||
Maracay Homes | 386 | 245 | 141 | 58 | % | ||||||
Pardee Homes | 871 | 365 | 506 | 139 | % | ||||||
Quadrant Homes | 555 | 247 | 308 | 125 | % | ||||||
Trendmaker Homes | 312 | 491 | (179 | ) | (36 | )% | |||||
TRI Pointe Homes | 406 | 1,124 | (718 | ) | (64 | )% | |||||
Winchester Homes | 496 | 397 | 99 | 25 | % | ||||||
Total | 3,026 | 2,869 | 157 | 5 | % | ||||||
Total Lots Owned or Controlled(1) | 28,309 | 27,602 | 707 | 3 | % | ||||||
______________________________________________
(1) | As of December 31, 2016 and 2015, lots controlled included lots that were under land option contracts or purchase contracts. |
Year Ended December 31, 2015 Compared to Year Ended December 31, 2014
Net New Home Orders, Average Selling Communities and Monthly Absorption Rates by Segment
Year Ended December 31, 2015 | Year Ended December 31, 2014 | Percentage Change | ||||||||||||||||||||||||
Net New Home Orders | Average Selling Communities | Monthly Absorption Rates | Net New Home Orders | Average Selling Communities | Monthly Absorption Rates | Net New Home Orders | Average Selling Communities | Monthly Absorption Rates | ||||||||||||||||||
Maracay Homes | 578 | 16.6 | 2.9 | 385 | 16.4 | 2.0 | 50 | % | 1 | % | 48 | % | ||||||||||||||
Pardee Homes | 1,186 | 23.1 | 4.3 | 970 | 20.2 | 4.0 | 22 | % | 14 | % | 7 | % | ||||||||||||||
Quadrant Homes | 441 | 10.7 | 3.4 | 337 | 12.2 | 2.3 | 31 | % | (12 | )% | 49 | % | ||||||||||||||
Trendmaker Homes | 457 | 25.1 | 1.5 | 557 | 24.0 | 1.9 | (18 | )% | 5 | % | (22 | )% | ||||||||||||||
TRI Pointe Homes | 1,107 | 26.9 | 3.4 | 359 | 9.2 | 3.3 | 208 | % | 192 | % | 5 | % | ||||||||||||||
Winchester Homes | 412 | 13.5 | 2.5 | 339 | 17.1 | 1.7 | 22 | % | (21 | )% | 54 | % | ||||||||||||||
Total | 4,181 | 115.9 | 3.0 | 2,947 | 99.1 | 2.5 | 42 | % | 17 | % | 21 | % | ||||||||||||||
Net new home orders for the year ended December 31, 2015 increased 42% to 4,181, compared to 2,947 during the prior year. The increase in net new home orders was due to a 21% increase in monthly absorption rates and a 17% increase in average selling communities. Net new home orders increased at all but one of our reporting segments, highlighted by the addition of TRI Pointe Homes for the full year ended December 31, 2015 resulting in 1,107 net new home orders compared to 359 in the prior year period. Trendmaker Homes in Houston reported an 18% decline in net new home orders compared to the prior year period resulting from a slowdown in the premium housing market in Houston as a result of uncertainty around the oil and gas industry.
- 53 -
Backlog Units, Dollar Value and Average Sales Price by Segment (dollars in thousands)
As of December 31, 2015 | As of December 31, 2014 | Percentage Change | ||||||||||||||||||||||||||||
Backlog Units | Backlog Dollar Value | Average Sales Price | Backlog Units | Backlog Dollar Value | Average Sales Price | Backlog Units | Backlog Dollar Value | Average Sales Price | ||||||||||||||||||||||
Maracay Homes | 203 | $ | 82,171 | $ | 405 | 105 | $ | 40,801 | $ | 389 | 93 | % | 101 | % | 4 | % | ||||||||||||||
Pardee Homes | 274 | 200,588 | 732 | 218 | 147,044 | 675 | 26 | % | 36 | % | 8 | % | ||||||||||||||||||
Quadrant Homes | 143 | 72,249 | 505 | 113 | 51,568 | 456 | 27 | % | 40 | % | 11 | % | ||||||||||||||||||
Trendmaker Homes | 136 | 72,604 | 534 | 218 | 114,948 | 527 | (38 | )% | (37 | )% | 1 | % | ||||||||||||||||||
TRI Pointe Homes | 290 | 192,097 | 662 | 243 | 192,802 | 793 | 19 | % | — | % | (17 | )% | ||||||||||||||||||
Winchester Homes | 110 | 77,625 | 706 | 135 | 105,933 | 785 | (19 | )% | (27 | )% | (10 | )% | ||||||||||||||||||
Total | 1,156 | $ | 697,334 | $ | 603 | 1,032 | $ | 653,096 | $ | 633 | 12 | % | 7 | % | (5 | )% | ||||||||||||||
Backlog units reflect the number of homes, net of actual cancellations experienced during the period, for which we have entered into a sales contract with a homebuyer but for which we have not yet delivered the home. Homes in backlog are generally delivered within three to nine months, although we may experience cancellations of sales contracts prior to delivery. Our cancellation rate of homebuyers who contracted to buy a home but did not close escrow (as a percentage of overall orders) was consistent at 16% for each of the years ended December 31, 2015 and 2014. The dollar value of backlog was approximately $697.3 million as of December 31, 2015, an increase of $44.2 million, or 7%, compared to $653.1 million as of December 31, 2014. This increase is due to an increase in the number of homes in backlog of 124, or 12%, to 1,156 homes as of December 31, 2015 from 1,032 homes as of December 31, 2014. The increase in backlog units was slightly offset by a decrease in the average sales price of homes in backlog of $30,000, or 5%, to $603,000 as of December 31, 2015.
New Homes Delivered, Homes Sales Revenue and Average Sales Price by Segment (dollars in thousands)
Year Ended December 31, 2015 | Year Ended December 31, 2014 | Percentage Change | ||||||||||||||||||||||||||||
New Homes Delivered | Home Sales Revenue | Average Sales Price | New Homes Delivered | Home Sales Revenue | Average Sales Price | New Homes Delivered | Home Sales Revenue | Average Sales Price | ||||||||||||||||||||||
Maracay Homes | 480 | $ | 185,645 | $ | 387 | 396 | $ | 150,689 | $ | 381 | 21 | % | 23 | % | 2 | % | ||||||||||||||
Pardee Homes | 1,130 | 606,161 | 536 | 1,032 | 486,176 | 471 | 9 | % | 25 | % | 14 | % | ||||||||||||||||||
Quadrant Homes | 411 | 180,772 | 440 | 320 | 134,304 | 420 | 28 | % | 35 | % | 5 | % | ||||||||||||||||||
Trendmaker Homes | 539 | 275,658 | 511 | 561 | 278,038 | 496 | (4 | )% | (1 | )% | 3 | % | ||||||||||||||||||
TRI Pointe Homes | 1,060 | 774,005 | 730 | 404 | 324,219 | 803 | 162 | % | 139 | % | (9 | )% | ||||||||||||||||||
Winchester Homes | 437 | 269,023 | 616 | 387 | 272,848 | 705 | 13 | % | (1 | )% | (13 | )% | ||||||||||||||||||
Total | 4,057 | $ | 2,291,264 | $ | 565 | 3,100 | $ | 1,646,274 | $ | 531 | 31 | % | 39 | % | 6 | % | ||||||||||||||
Home sales revenue increased $645.0 million, or 39%, to $2.3 billion for the year ended December 31, 2015 from $1.6 billion for the prior year period. The increase was comprised of: (i) $508.2 million related to an increase in homes delivered to 4,057 for the year ended December 31, 2015 from 3,100 in the prior year; and (ii) $136.8 million due to a 6% increase in the average sales price of homes delivered to $565,000 for the year ended December 31, 2015 from $531,000 in the prior year. Home sales revenue was either up or relatively flat at all six of our homebuilding brands for the year ended December 31, 2015 compared to the prior year period. The increase in new home deliveries was primarily attributable to the addition of the results of TRI Pointe Homes for the full year ended December 31, 2015 compared to partial prior year activity due to the timing of the Merger in July, 2014. The addition of full year TRI Pointe Homes deliveries resulted in a 656 increase in new homes delivered and a $450 million increase in home sales revenue, a 162% and 139% increase, respectively, compared to the same prior year period.
- 54 -
Homebuilding Gross Margins (dollars in thousands)
Year Ended December 31, | |||||||||||||
2015 | % | 2014 | % | ||||||||||
Home sales revenue | $ | 2,291,264 | 100.0 | % | $ | 1,646,274 | 100.0 | % | |||||
Cost of home sales | 1,808,776 | 78.9 | % | 1,318,617 | 80.1 | % | |||||||
Homebuilding gross margin | 482,488 | 21.1 | % | 327,657 | 19.9 | % | |||||||
Add: interest in cost of home sales | 44,299 | 1.9 | % | 28,354 | 1.7 | % | |||||||
Add: impairments and lot option abandonments | 1,685 | 0.1 | % | 2,147 | 0.1 | % | |||||||
Adjusted homebuilding gross margin(1) | $ | 528,472 | 23.1 | % | $ | 358,158 | 21.8 | % | |||||
Homebuilding gross margin percentage | 21.1 | % | 19.9 | % | |||||||||
Adjusted homebuilding gross margin percentage(1) | 23.1 | % | 21.8 | % | |||||||||
_______________________________________________
(1) | Non-GAAP financial measure (as discussed below). |
Our homebuilding gross margin percentage increased to 21.1% for the year ended December 31, 2015 as compared to 19.9% for the prior year period. The prior year margin was impacted by a $17.2 million or 100 basis point noncash purchase accounting adjustment related to the fair value increase to legacy TRI Pointe’s inventory as a result of the Merger. Excluding interest and impairment and lot option abandonments in cost of home sales, adjusted homebuilding gross margin percentage was 23.1% for the year ended December 31, 2015 compared to 21.8% for the prior year period. The increase in the adjusted homebuilding gross margin was consistent with the change in homebuilding gross margin described above.
Adjusted homebuilding gross margin is a non-GAAP financial measure. We believe this information is meaningful as it isolates the impact that leverage and noncash charges have on homebuilding gross margin and permits investors to make better comparisons with our competitors, who adjust gross margins in a similar fashion. See the table above reconciling this non-GAAP financial measure to homebuilding gross margin, the nearest GAAP equivalent.
Land and Lot Gross Margins (dollars in thousands)
Year Ended December 31, | |||||||||||||
2015 | % | 2014 | % | ||||||||||
Land and lot sales revenue | $ | 101,284 | 100.0 | % | $ | 47,660 | 100.0 | % | |||||
Cost of land and lot sales | 35,089 | 34.6 | % | 37,906 | 79.5 | % | |||||||
Land and lot gross margin | $ | 66,195 | 65.4 | % | $ | 9,754 | 20.5 | % | |||||
Our land and lot gross margin percentage increased to 65.4% for the year ended December 31, 2015 as compared to 20.5% for the prior year period. The increase in land and lot sales revenue and gross margin percentage were mainly due to the sale of a 15.72 acre employment center located in the Pacific Highlands Ranch community in the San Diego, California division of Pardee Homes. The sale was completed in June for $53 million in cash. The transaction included significant gross margins due to the low land basis of the Pacific Highlands Ranch community which was acquired in 1981.
Sales and Marketing, General and Administrative Expense (dollars in thousands)
Year Ended December 31, | As a Percentage of Home Sales Revenue | ||||||||||||
2015 | 2014 | 2015 | 2014 | ||||||||||
Sales and marketing | $ | 116,217 | $ | 103,600 | 5.1 | % | 6.3 | % | |||||
General and administrative (G&A) | 117,496 | 82,358 | 5.1 | % | 5.0 | % | |||||||
Total sales and marketing and G&A | $ | 233,713 | $ | 185,958 | 10.2 | % | 11.3 | % | |||||
- 55 -
Sales and marketing expense decreased to 5.1% of home sales revenue for the year ended December 31, 2015 from 6.3% of home sales revenue for the year ended December 31, 2014 mainly due to the addition of full year TRI Pointe Homes which has a lower sales and marketing expense as a percentage of home sales revenue due primarily to higher average sales prices per community. In addition, we experienced efficiencies in our sales and marketing spending due to the 20% increase in our monthly absorption rates. Sales and marketing expense increased $12.6 million, or 12%, to $116.2 million for the year ended December 31, 2015 from $103.6 million for the prior year period. The increase in sales and marketing expense was related primarily to the increase in new home deliveries compared to the prior year and the addition of TRI Pointe Homes for the full year compared to the prior year with no comparable amounts before the Merger.
General and administrative expense increased by $35.1 million to $117.5 million for the year ended December 31, 2015 from $82.4 million for the prior year ended December 31, 2014. General and administrative expense increased slightly to 5.1% of home sales revenue for the year ended December 31, 2015 from 5.0% of home sales revenue for the same period in the prior year. The increase in general and administrative expenses is primarily related to the addition of TRI Pointe Homes with no comparable amounts in the prior year before the Merger.
Total SG&A expense increased $47.7 million, or 26%, to $233.7 million for the year ended December 31, 2015 from $186.0 million in the prior year period, but improved to 10.2% of home sales revenue from 11.3% for the years ended December 31, 2015 and 2014, respectively.
Restructuring Charges
Restructuring charges decreased to $3.3 million for the year ended December 31, 2015 compared to $10.5 million in the same period in the prior year. The decrease was mainly due to higher employee-related restructuring costs in 2014 related to retention, severance and related costs in connection with the Merger.
Transaction Expenses
As a result of the Merger, the Company incurred advisory, financing, integration and other transaction expenses during the year ended December 31, 2014 of $18.0 million. We did not incur any transaction related expenses during the year ended December 31, 2015.
Interest
Interest, which was incurred principally to finance the Merger, land acquisitions, land development and home construction, totaled $61.0 million and $41.7 million for the years ended December 31, 2015 and 2014, respectively. The capitalized portion of interest incurred was $61.0 million and $39.0 million for the years ended December 31, 2015 and 2014, respectively. The increase in interest incurred during the year ended December 31, 2015 as compared to the prior year period was primarily attributable to an increase in our outstanding debt for the full year in 2015 compared to a partial prior year period, as the senior note debt was issued in June 2014.
All interest incurred in 2015 was capitalized. Interest expense was $2.7 million for the year ended December 31, 2014. Interest expense is included in other income, net on the consolidated statements of operations.
Income Tax
For the year ended December 31, 2015, we have recorded a tax provision of $112.1 million based on an effective tax rate of 35.1%. For the year ended December 31, 2014, we recorded a tax provision of $43.8 million based on an effective tax rate of 34.2%. The increase in our provision for income tax was primarily the result of the increase in income from operations for the year ended December 31, 2015.
Financial Services Segment
Income from our financial services operations increased to $2.1 million for the year ended December 31, 2015 compared to a loss of $25,000 in the same period in the prior year. The increase in financial services income for the year ended December 31, 2015 primarily relates to the growth of our mortgage financing and title services operations. Both our mortgage financing and title service operations were started in late 2014 and therefore had minimal activity in 2014.
- 56 -
Lots Owned or Controlled by Segment
Excluded from lots owned or controlled are those related to Note 8, Investments in Unconsolidated Entities, of the notes to our consolidated financial statements included elsewhere in this annual report on Form 10-K. The table below summarizes our lots owned or controlled by segment as of the dates presented:
Increase | |||||||||||
December 31, | (Decrease) | ||||||||||
2015 | 2014 | Amount | % | ||||||||
Lots Owned | |||||||||||
Maracay Homes | 1,566 | 1,280 | 286 | 22 | % | ||||||
Pardee Homes | 16,314 | 17,354 | (1,040 | ) | (6 | )% | |||||
Quadrant Homes | 1,027 | 973 | 54 | 6 | % | ||||||
Trendmaker Homes | 1,367 | 805 | 562 | 70 | % | ||||||
TRI Pointe Homes | 2,504 | 2,868 | (364 | ) | (13 | )% | |||||
Winchester Homes | 1,955 | 2,255 | (300 | ) | (13 | )% | |||||
Total | 24,733 | 25,535 | (802 | ) | (3 | )% | |||||
Lots Controlled(1) | |||||||||||
Maracay Homes | 245 | 705 | (460 | ) | (65 | )% | |||||
Pardee Homes | 365 | 285 | 80 | 28 | % | ||||||
Quadrant Homes | 247 | 571 | (324 | ) | (57 | )% | |||||
Trendmaker Homes | 491 | 1,268 | (777 | ) | (61 | )% | |||||
TRI Pointe Homes | 1,124 | 858 | 266 | 31 | % | ||||||
Winchester Homes | 397 | 496 | (99 | ) | (20 | )% | |||||
Total | 2,869 | 4,183 | (1,314 | ) | (31 | )% | |||||
Total Lots Owned or Controlled(1) | 27,602 | 29,718 | (2,116 | ) | (7 | )% | |||||
_________________________________________________
(1) | As of December 31, 2015 and 2014, lots controlled included lots that were under land option contracts or purchase contracts. |
Liquidity and Capital Resources
Overview
Our principal uses of capital for the year ended December 31, 2016 were operating expenses, share repurchases, land purchases, land development and home construction. We used funds generated by our operations and available borrowings to meet our short-term working capital requirements. We remain focused on generating positive margins in our homebuilding operations and acquiring desirable land positions in order to maintain a strong balance sheet and keep us poised for growth. As of December 31, 2016, we had $208.7 million of cash and cash equivalents. We believe we have sufficient cash and sources of financing for at least the next twelve months.
Our board of directors will consider a number of factors when evaluating our level of indebtedness and when making decisions regarding the incurrence of new indebtedness, including the purchase price of assets to be acquired with debt financing, the estimated market value of our assets and the ability of particular assets, and our company as a whole, to generate cash flow to cover the expected debt service. Our charter does not contain a limitation on the amount of debt we may incur and our board of directors may change our target debt levels at any time without the approval of our stockholders.
Senior Notes
In May 2016, TRI Pointe Group issued $300.0 million aggregate principal amount of 4.875% Senior Notes due 2021 (the “2021 Notes”) at 99.44% of their aggregate principal amount. Net proceeds of this issuance were $293.9 million, after debt issuance costs and discounts. The 2021 Notes mature on July 1, 2021 and interest is paid semiannually in arrears on January 1 and July 1.
TRI Pointe Group and TRI Pointe Homes are co-issuers of $450.0 million aggregate principal amount of 2019 Notes and $450.0 million aggregate principal amount of 2024 Notes. The 2019 Notes were issued at 98.89% of their aggregate principal amount and the 2024 Notes were issued at 98.15% of their aggregate principal amount. The net proceeds from the offering were $861.3 million, after debt issuance costs and discounts. The 2019 Notes and 2024 Notes mature on June 15, 2019 and June 15, 2024, respectively. Interest is payable semiannually in arrears on June 15 and December 15.
As of December 31, 2016, no principal has been paid on the 2019 Notes, 2021 Notes and 2024 Notes (collectively, the "Senior Notes"), and there was $20.9 million of capitalized debt financing costs, included in senior notes, net on our
- 57 -
consolidated balance sheet, related to the Senior Notes that will amortize over the lives of the Senior Notes. Accrued interest related to the Senior Notes was $10.7 million and $1.9 million as of December 31, 2016 and 2015, respectively.
Unsecured Revolving Credit Facility
On April 28, 2016, the Company partially exercised the accordion feature under its existing unsecured revolving credit facility (the “Credit Facility”) to increase the total commitments under the Credit Facility to $625.0 million from $550.0 million. The Credit Facility matures on May 18, 2019, and contains a sublimit of $75.0 million for letters of credit. The Company may borrow under the Credit Facility in the ordinary course of business to fund its operations, including its land development and homebuilding activities. Borrowings under the Credit Facility will be governed by, among other things, a borrowing base. The Credit Facility contains customary affirmative and negative covenants, including financial covenants relating to consolidated tangible net worth, leverage, and liquidity or interest coverage. Interest rates on borrowings will be based on either a daily Eurocurrency base rate or a Eurocurrency rate, in either case, plus a spread ranging from 1.45% to 2.20% depending on the Company’s leverage ratio.
As of December 31, 2016, the outstanding balance under the Credit Facility was $200.0 million with an interest rate of 2.44% per annum and $420.7 million of availability after considering the borrowing base provisions and outstanding letters of credit. At December 31, 2016, we had outstanding letters of credit of $4.3 million. These letters of credit were issued to secure various financial obligations. We believe it is not probable that any outstanding letters of credit will be drawn upon.
Seller Financed Loans
As of December 31, 2016, the Company had $13.7 million outstanding related to a seller financed loan to acquire lots for the construction of homes. Principal and interest payments on this loan are due at various maturity dates, including at the time individual homes associated with the acquired land are delivered. The seller financed loan accrues interest at a rate of 7.0% per annum, with interest calculated on a daily basis. A minimum principal payment of $8.1 million is due in June 2017 with any remaining unpaid balance due in June 2018.
Covenant Compliance
Under the Credit Facility, we are required to comply with certain financial covenants, including, but not limited to, those set forth in the table below (dollars in thousands):
Actual at December 31, | Covenant Requirement at December 31, | ||||||
Financial Covenants | 2016 | 2016 | |||||
Consolidated Tangible Net Worth, as defined | $ | 1,667,952 | $ | 1,068,552 | |||
(Not less than $875.9 million plus 50% of net income and 50% of the net proceeds from equity offerings after March 31, 2015) | |||||||
Leverage Test | 41.8 | % | ≤55% | ||||
(Not to exceed 55%) | |||||||
Interest Coverage Test | 5.4 | ≥1.5 | |||||
(Not less than 1.5:1.0) | |||||||
As of December 31, 2016 we were in compliance with all of the above financial covenants.
- 58 -
Leverage Ratios
We believe that our leverage ratios provide useful information to the users of our financial statements regarding our financial position and cash and debt management. The ratio of debt-to-capital and the ratio of net debt-to-capital are calculated as follows (dollars in thousands):
December 31, 2016 | December 31, 2015 | ||||||
Unsecured revolving credit facility | $ | 200,000 | $ | 299,392 | |||
Seller financed loans | 13,726 | 2,434 | |||||
Senior Notes | 1,168,307 | 868,679 | |||||
Total debt | 1,382,033 | 1,170,505 | |||||
Stockholders’ equity | 1,829,447 | 1,664,683 | |||||
Total capital | $ | 3,211,480 | $ | 2,835,188 | |||
Ratio of debt-to-capital(1) | 43.0 | % | 41.3 | % | |||
Total debt | $ | 1,382,033 | $ | 1,170,505 | |||
Less: Cash and cash equivalents | (208,657 | ) | (214,485 | ) | |||
Net debt | 1,173,376 | 956,020 | |||||
Stockholders’ equity | 1,829,447 | 1,664,683 | |||||
Total capital | $ | 3,002,823 | $ | 2,620,703 | |||
Ratio of net debt-to-capital(2) | 39.1 | % | 36.5 | % | |||
______________________________________________
(1) | The ratio of debt-to-capital is computed as the quotient obtained by dividing debt by the sum of total debt plus equity. |
(2) | The ratio of net debt-to-capital is a non-GAAP financial measure and is computed as the quotient obtained by dividing net debt (which is debt less cash and cash equivalents) by the sum of net debt plus equity. The most directly comparable GAAP financial measure is the ratio of debt-to-capital. We believe the ratio of net debt-to-capital is a relevant financial measure for investors to understand the leverage employed in our operations and as an indicator of our ability to obtain financing. See the table above reconciling this non-GAAP financial measure to the ratio of debt-to-capital. |
Cash Flows—Year Ended December 31, 2016 Compared to Year Ended December 31, 2015
The comparison of cash flows for the years ended December 31, 2016 and 2015 is as follows:
• | Net cash used in operating activities increased by $189.3 million to $158.3 million in 2016 from cash provided of $31.0 million in 2015. The change was primarily comprised of an increase in cash outflow related to real estate inventories of $153.1 million in 2016 as we increased our land acquisition and development spending to grow our community count to 124 active communities as of December 31, 2016, compared to 104 as of December 31, 2015. Other activity included, (i) a decrease in net income to $196.1 million in 2016 compared to $207.2 million in 2015 and (ii) other offsetting activity including changes in other assets, receivables, accrued expenses and other liabilities and deferred income taxes. |
• | Net cash used in investing activities was $4.0 million in 2016 compared to $862,000 in 2015. The increase in 2016 was due primarily to increased purchases of property and equipment. |
• | Net cash provided by financing activities increased to $156.5 million in 2016 from $13.7 million in 2015. The change was primarily a result of a net increase in debt borrowings of $183.1 million in 2016 compared to 2015. This increase was offset by $42.1 million in share repurchases in 2016 with no share repurchases in the prior year. |
As of December 31, 2016, our cash and cash equivalents balance was $208.7 million.
Cash Flows—Year Ended December 31, 2015 Compared to Year Ended December 31, 2014
The comparison of cash flows for the years ended December 31, 2015 and 2014 is as follows:
• | Net cash provided by operating activities increased by $144.4 million to $31.0 million in 2015 from a use of $113.4 million in 2014. The change was primarily comprised of net income of $207.2 million in 2015 compared to $84.2 million in 2014. Other activity included, (i) a decrease in the net cash outflow related to real estate inventories to $235.0 million in 2015 from $276.3 million in 2014 and (ii) other offsetting activity including changes in other assets, receivables and deferred income taxes. |
- 59 -
• | Net cash used in investing activities was $862,000 in 2015 compared to cash provided of $44.7 million in 2014. Cash provided by investing activities for 2014 was primarily related to cash acquired in the Merger. |
• | Net cash provided by financing activities decreased to $13.7 million in 2015 from $234.8 million in 2014. The change was primarily a result of 2014 activity associated with proceeds from the issuance of senior notes of $886.7 million, offset by payments of debt payable to Weyerhaeuser of $623.6 million. |
As of December 31, 2015, our cash and cash equivalents balance was $214.5 million.
Off-Balance Sheet Arrangements
In the ordinary course of business, we enter into land option contracts in order to procure lots for the construction of our homes. We are subject to customary obligations associated with entering into contracts for the purchase of land and improved lots. These purchase contracts typically require a cash deposit and the purchase of properties under these contracts is generally contingent upon satisfaction of certain requirements by the sellers, including obtaining applicable property and development entitlements. We also utilize option contracts with land sellers as a method of acquiring land in staged takedowns, to help us manage the financial and market risk associated with land holdings, and to reduce the use of funds from our corporate financing sources. Option contracts generally require a non-refundable deposit for the right to acquire lots over a specified period of time at pre-determined prices. We generally have the right at our discretion to terminate our obligations under both purchase contracts and option contracts by forfeiting our cash deposit with no further financial responsibility to the land seller. When market conditions are such that land values are not appreciating, existing option agreements may become less desirable, at which time we may elect to forfeit deposits and pre-acquisition costs and terminate the agreements. As of December 31, 2016, we had $26.6 million of non-refundable cash deposits pertaining to land option contracts and purchase contracts with an aggregate remaining purchase price of approximately $313.6 million (net of deposits).
Our utilization of land option contracts is dependent on, among other things, the availability of land sellers willing to enter into option takedown arrangements, the availability of capital to financial intermediaries to finance the development of optioned lots, general housing market conditions, and local market dynamics. Options may be more difficult to procure from land sellers in strong housing markets and are more prevalent in certain geographic regions.
As of December 31, 2016, we had $420.7 million of availability under our unsecured revolving credit facility after considering the borrowing base provisions and outstanding letters of credit.
Contractual Obligations Table
The following table summarizes our future estimated cash payments under existing contractual obligations as of December 31, 2016, including estimated cash payments due by period. Our purchase obligations primarily represent commitments for land purchases under land purchase and land option contracts with non-refundable deposits.
Payments Due by Period | |||||||||||||||||||
Contractual Obligations | Total | Less Than 1 Year | 1-3 Years | 4-5 Years | After 5 Years | ||||||||||||||
(in thousands) | |||||||||||||||||||
Long-term debt principal payments(1) | $ | 1,413,726 | $ | 13,726 | $ | 650,000 | $ | 300,000 | $ | 450,000 | |||||||||
Long-term debt interest payments | 325,827 | 67,874 | 110,836 | 82,125 | 64,992 | ||||||||||||||
Operating leases(2) | 32,707 | 6,875 | 10,927 | 9,878 | 5,027 | ||||||||||||||
Purchase obligations(3) | 313,574 | 251,248 | 59,065 | 3,261 | — | ||||||||||||||
Total | $ | 2,085,834 | $ | 339,723 | $ | 830,828 | $ | 395,264 | $ | 520,019 | |||||||||
__________________________________________
(1) | For a more detailed description of our long-term debt, please see Note 13, Senior Notes and Notes Payable and Other Borrowings, of the notes to our consolidated financial statements included elsewhere in this annual report on Form 10-K. |
(2) | For a more detailed description of our operating leases, please see Note 15, Commitments and Contingencies, of the notes to our consolidated financial statements included elsewhere in this annual report on Form 10-K. |
(3) | Includes $313.6 million (net of deposits) of the remaining purchase price for all land options contracts and purchase contracts as of December 31, 2016. For a more detailed description of our land purchase and option contracts, please see the discussion set forth above in the section entitled “—Off-Balance Sheet Arrangements.” |
- 60 -
Inflation
Our homebuilding operations can be adversely impacted by inflation, primarily from higher land, financing, labor, material and construction costs. In addition, inflation can lead to higher mortgage rates, which can significantly affect the affordability of mortgage financing to homebuyers. While we attempt to pass on cost increases to homebuyers through increased prices, when weak housing market conditions exist, we are often unable to offset cost increases with higher selling prices.
Seasonality
Historically, the homebuilding industry experiences seasonal fluctuations in quarterly operating results and capital requirements. We typically experience the highest new home order activity during the first and second quarters of our fiscal year, although this activity is also highly dependent on the number of active selling communities, timing of new community openings and other market factors. Since it typically takes four to six months to construct a new home, the number of homes delivered and associated home sales revenue typically increases in the third and fourth quarters of our fiscal year as new home orders sold earlier in the year convert to home deliveries. Due to this seasonality, home starts, construction costs and related cash outflows have historically been highest in the second and third quarters of our fiscal year, and the majority of cash receipts from home deliveries occur during the second half of the year. We expect this seasonal pattern to continue over the long-term, although it may be affected by volatility in the homebuilding industry.
Critical Accounting Policies
Our financial statements have been prepared in accordance with GAAP. The preparation of these financial statements requires our management to make estimates and judgments that affect the reported amounts of assets and liabilities at the date of the financial statements and the reported amounts of costs and expenses during the reporting period. On an ongoing basis, our management evaluates its estimates and judgments, including those which impact our most critical accounting policies. Our management bases its estimates and judgments on historical experience and on various other factors that we believe to be reasonable under the circumstances. Actual results may differ from our estimates under different assumptions or conditions. Our management believes that the following accounting policies are among the most important to the portrayal of our financial condition and results of operations and require among the most difficult, subjective or complex judgments:
Real Estate Inventories and Cost of Sales
Real estate inventories consist of land, land under development, homes under construction, completed homes and model homes and are stated at cost, net of impairment losses. We capitalize direct carrying costs, including interest, property taxes and related development costs to inventories. Field construction supervision and related direct overhead are also included in the capitalized cost of inventories. Direct construction costs are specifically identified and allocated to homes while other common costs, such as land, land improvements and carrying costs, are allocated to homes within a community based upon their anticipated relative sales or fair value. In accordance with ASC Topic 835, Interest (“ASC 835”), homebuilding interest capitalized as a cost of inventories owned is included in costs of sales as related units or lots are sold. To the extent our debt exceeds our qualified assets as defined in ASC 835, we expense a portion of the interest incurred by us. Qualified assets represent projects that are actively under development. Homebuilding cost of sales is recognized at the same time revenue is recognized and is recorded based upon total estimated costs to be allocated to each home within a community. Any changes to the estimated costs are allocated to the remaining undelivered lots and homes within their respective community. The estimation and allocation of these costs require a substantial degree of judgment by management.
The estimation process involved in determining relative sales or fair values is inherently uncertain because it involves estimating future sales values of homes before delivery. Additionally, in determining the allocation of costs to a particular land parcel or individual home, we rely on project budgets that are based on a variety of assumptions, including assumptions about construction schedules and future costs to be incurred. It is common that actual results differ from budgeted amounts for various reasons, including construction delays, increases in costs that have not been committed or unforeseen issues encountered during construction that fall outside the scope of existing contracts, or costs that come in less than originally anticipated. While the actual results for a particular construction project are accurately reported over time, a variance between the budget and actual costs could result in the understatement or overstatement of costs and have a related impact on gross margins between reporting periods. To reduce the potential for such variances, we have procedures that have been applied on a consistent basis, including assessing and revising project budgets on a periodic basis, obtaining commitments from subcontractors and vendors for future costs to be incurred and utilizing the most recent information available to estimate costs.
- 61 -
If there are indications of impairment, we perform a detailed budget and cash flow review of our real estate assets to determine whether the estimated remaining undiscounted future cash flows of the community are more or less than the asset’s carrying value. If the undiscounted cash flows are more than the asset’s carrying value, no impairment adjustment is required. However, if the undiscounted cash flows are less than the asset’s carrying value, the asset is deemed impaired and is written down to fair value. These impairment evaluations require us to make estimates and assumptions regarding future conditions, including timing and amounts of development costs and sales prices of real estate assets, to determine if expected future undiscounted cash flows will be sufficient to recover the asset’s carrying value.
When estimating undiscounted cash flows of a community, we make various assumptions, including: (i) expected sales prices and sales incentives to be offered, including the number of homes available, pricing and incentives being offered by us or other builders in other communities, and future sales price adjustments based on market and economic trends; (ii) expected sales pace and cancellation rates based on local housing market conditions, competition and historical trends; (iii) costs expended to date and expected to be incurred including, but not limited to, land and land development costs, home construction costs, interest costs, indirect construction and overhead costs, and selling and marketing costs; (iv) alternative product offerings that may be offered that could have an impact on sales pace, sales price and/or building costs; and (v) alternative uses for the property.
Many assumptions are interdependent and a change in one may require a corresponding change to other assumptions. For example, increasing or decreasing monthly sales absorption rates has a direct impact on the estimated per unit sales price of a home, the level of time sensitive costs (such as indirect construction, overhead and carrying costs), and selling and marketing costs (such as model maintenance costs and advertising costs). Depending on the underlying objective of the community, assumptions could have a significant impact on the projected cash flow analysis. For example, if our objective is to preserve operating margins, our cash flow analysis will be different than if the objective is to increase sales. These objectives may vary significantly from community to community and over time. If assets are considered impaired, impairment is determined by the amount the asset’s carrying value exceeds its fair value. Fair value is determined based on estimated future cash flows discounted for inherent risks associated with real estate assets. These discounted cash flows are impacted by expected risk based on estimated land development, construction and delivery timelines; market risk of price erosion; uncertainty of development or construction cost increases; and other risks specific to the asset or market conditions where the asset is located when assessment is made. These factors are specific to each community and may vary among communities. We perform a quarterly review for indicators of impairment. For the year ended December 31, 2016 we had no real estate inventory impairment charges. For the years ended December 31, 2015 and 2014 we recorded real estate inventory impairment charges of $1.2 million and $931,000, respectively.
Revenue Recognition
In accordance with ASC 360, Property, Plant, and Equipment, revenues from home sales and other real estate sales are recorded and a profit is recognized when the respective units are delivered. Home sales and other real estate sales are delivered when all conditions of escrow are met, including delivery of the home or other real estate asset, title passage, appropriate consideration is received and collection of associated receivables, if any, is reasonably assured. Sales incentives are a reduction of revenues when the respective unit is delivered. When it is determined that the earnings process is not complete, the sale and/or the related profit are deferred for recognition in future periods using the percentage-of-completion method. The profit we record is based on the calculation of cost of sales, which is dependent on our allocation of costs, as described in more detail above in the section entitled “Real Estate Inventories and Cost of Sales.”
Warranty Reserves
In the normal course of business, we incur warranty-related costs associated with homes that have been delivered to homebuyers. Estimated future direct warranty costs are accrued and charged to cost of sales in the period when the related home sales revenues are recognized while indirect warranty overhead salaries and related costs are charged to cost of sales in the period incurred. Factors that affect the warranty accruals include the number of homes delivered, historical and anticipated rates of warranty claims and cost per claim. Our primary assumption in estimating the amounts we accrue for warranty costs is that historical claims experience is a strong indicator of future claims experience. In addition, we maintain general liability insurance designed to protect us against a portion of our risk of loss from warranty and construction-related claims. We also generally require our subcontractors and design professionals to indemnify us for liabilities arising from their work, subject to various limitations. However, such indemnity is significantly limited with respect to certain subcontractors that are added to our general liability insurance policy.
Our warranty reserve is based on actuarial analysis that uses our historical claim and expense data, as well as industry data to estimate these overall costs. Key assumptions used in developing these estimates include claim frequencies, severities
- 62 -
and resolution patterns, which can occur over an extended period of time. These estimates are subject to variability due to the length of time between the delivery of a home to a homebuyer and when a warranty or construction defect claim is made, and the ultimate resolution of such claim; uncertainties regarding such claims relative to our markets and the types of product we build; and legal or regulatory actions and/or interpretations, among other factors. Due to the degree of judgment involved and the potential for variability in these underlying assumptions, our actual future costs could differ from those estimated. There can be no assurance that the terms and limitations of the limited warranty will be effective against claims made by homebuyers, that we will be able to renew our insurance coverage or renew it at reasonable rates, that we will not be liable for damages, cost of repairs, and/or the expense of litigation surrounding possible construction defects, soil subsidence or building related claims or that claims will not arise out of uninsurable events or circumstances not covered by insurance and not subject to effective indemnification agreements with certain subcontractors.
We also record expected recoveries from insurance carriers based on actual insurance claims made and actuarially determined amounts that depend on various factors, including, the above-described reserve estimates, our insurance policy coverage limits for the applicable policy years and historical recovery rates. Because of the inherent uncertainty and variability in these assumptions, our actual insurance recoveries could differ significantly from amounts currently estimated.
Stock-Based Compensation
We account for share-based awards in accordance with ASC 718, Compensation-Stock Compensation (“ASC 718”). ASC 718 requires that the cost resulting from all share-based payment transactions be recognized in the financial statements. ASC 718 requires all entities to apply a fair-value-based measurement method in accounting for share-based payment transactions with employees. Share-based awards are expensed on a straight-line basis over the expected vesting period.
Income Taxes
We account for income taxes in accordance with ASC Topic 740, Income Taxes (“ASC 740”). Deferred tax assets and liabilities are recorded based on future tax consequences of both temporary differences between the amounts reported for financial reporting purposes and the amounts deductible for income tax purposes, and are measured using enacted tax rates expected to apply in the years in which the temporary differences are expected to be recovered or settled. The effect on deferred tax assets and liabilities of a change in tax rates is recognized in earnings in the period when the changes are enacted.
Each quarter we assess our deferred tax assets to determine whether all or any portion of the assets is more likely than not unrealizable under ASC 740. We are required to establish a valuation allowance for any portion of the asset we conclude is more likely than not to be unrealizable. Our assessment considers, among other things, the nature, frequency and severity of our current and cumulative losses, forecasts of our future taxable income, the duration of statutory carryforward periods and tax planning alternatives. Due to uncertainties inherent in the estimation process, it is possible that actual results may vary from estimates.
We classify any interest and penalties related to income taxes as part of income tax expense.
Goodwill and Other Intangible Assets
In accordance with ASC Topic 350, Intangibles-Goodwill and Other (“ASC 350”), we evaluate goodwill and indefinite-lived intangible assets for impairment on an annual basis, or more frequently if events or changes in circumstances between annual tests indicate that it is more likely than not that the asset is impaired. We have identified one reporting unit with goodwill, TRI Pointe Homes, and performed our annual goodwill impairment evaluation as of October 1, 2016. For further details on goodwill, see Note 2, Merger with Weyerhaeuser Real Estate Company, of the notes to our consolidated financial statements included elsewhere in this annual report on Form 10-K.
For our TRI Pointe Homes reporting unit, we performed a quantitative assessment to determine whether it is more likely than not that its fair value is less than its carrying amount. Upon completion of the October 2016 annual impairment assessment, we determined that no goodwill impairment was indicated. As of December 31, 2016, we are not aware of any significant indicators of impairment that exist for our goodwill that would require additional analysis.
An impairment of our indefinite-lived intangible asset is based on a comparison of its fair value to book value, without consideration of any recoverability due to the indefinite nature of the asset. As of December 31, 2016, we believe that our indefinite-lived intangible asset continues to have an indefinite life and that its fair value exceeds its carrying value. For further details on our indefinite-lived intangible asset, see Note 2, Merger with Weyerhaeuser Real Estate Company, of the notes to our consolidated financial statements included elsewhere in this annual report on Form 10-K.
- 63 -
In accordance with ASC Topic 360, Property, Plant and Equipment ("ASC 360"), we evaluate finite-lived intangible assets for impairment on an annual basis, or more frequently if events or changes in circumstances between annual tests indicate that it is more likely than not that the asset is impaired. An impairment in the carrying value of our finite-lived intangible asset is recognized whenever anticipated future undiscounted cash flows from the asset become unrecoverable and are estimated to be less than its carrying value. As of December 31, 2016, we believe that the carrying value of our finite-lived intangible asset is recoverable and that its fair value is greater than its carrying value. For further details on our finite-lived intangible asset, see Note 10, Goodwill and Other Intangible Assets, of the notes to our consolidated financial statements included elsewhere in this annual report on Form 10-K.
Significant management judgment is required in the forecasts of future operating results that are used in our impairment evaluations. Our estimates are consistent with the plans and estimates that we use to manage our business. It is possible, however, that the plans may change and estimates used may prove to be inaccurate. If our actual results, or the plans and estimates used in future impairment analyses, are lower than the original estimates used to assess the recoverability of these assets, we could incur future impairment charges.
Related Party Transactions
For a discussion of certain relationships and related party transactions, see Note 18, Related Party Transactions, of the notes to our consolidated financial statements included elsewhere in this annual report on Form 10-K.
Recently Issued Accounting Standards
See Note 1, Organization and Summary of Significant Accounting Policies, of the notes to consolidated financial statements included elsewhere in this report on Form 10-K.
- 64 -
Item 7A. | Quantitative and Qualitative Disclosures About Market Risk |
We are exposed to market risks related to fluctuations in interest rates on our outstanding debt. We did not utilize swaps, forward or option contracts on interest rates or commodities, or other types of derivative financial instruments as of or during the year ended December 31, 2016. We have not entered into and currently do not hold derivatives for trading or speculative purposes. Many of the statements contained in this section are forward looking and should be read in conjunction with our disclosures under the heading “Cautionary Note Concerning Forward-Looking Statements.”
The table below details the principal amount and the average interest rates for the outstanding debt for each category based upon the expected maturity or disposition dates. The fair value of our debt, which consists of our unsecured revolving credit facility, seller financed loans and Senior Notes, is based on quoted market prices for the same or similar instruments as of December 31, 2016.
Expected Maturity Date | ||||||||||||||||||||||||||||||||
Estimated | ||||||||||||||||||||||||||||||||
December 31, | 2017 | 2018 | 2019 | 2020 | 2021 | Thereafter | Total | Fair Value | ||||||||||||||||||||||||
(dollars in thousands) | ||||||||||||||||||||||||||||||||
Liabilities: | ||||||||||||||||||||||||||||||||
Variable rate debt | $ | — | $ | — | $ | 200,000 | $ | — | $ | — | $ | — | $ | 200,000 | $ | 177,410 | ||||||||||||||||
Weighted average interest rate | — | % | — | % | 2.4 | % | — | % | — | % | — | % | 2.4 | % | ||||||||||||||||||
Fixed rate debt | $ | 8,063 | $ | 5,663 | $ | 450,000 | $ | — | $ | 300,000 | $ | 450,000 | $ | 1,213,726 | $ | 1,232,314 | ||||||||||||||||
Weighted average interest rate | 7.0 | % | 7.0 | % | 4.4 | % | — | % | 4.9 | % | 5.9 | % | 5.1 | % | ||||||||||||||||||
Based on the current interest rate management policies we have in place with respect to our outstanding debt, we do not believe that the future market rate risks related to the above securities will have a material adverse impact on our financial position, results of operations or liquidity. For a more detailed description of our long-term debt, please see Note 13, Senior Notes and Notes Payable and Other Borrowings, of the notes to our consolidated financial statements included elsewhere in this annual report on Form 10-K.
Item 8. | Financial Statements and Supplementary Data |
See Item 15 included in this annual report on Form 10-K.
Item 9. | Changes in and Disagreements with Accountants on Accounting and Financial Disclosure. |
None.
Item 9A. | Controls and Procedures |
Disclosure Controls and Procedures
We have established disclosure controls and procedures to ensure that information we are required to disclose in the reports we file or submit under the Exchange Act, is recorded, processed, summarized and reported within the time periods specified in the SEC’s rules and forms, and accumulated and communicated to management, including the Chief Executive Officer (the “Principal Executive Officer”) and Chief Financial Officer (the “Principal Financial Officer”), as appropriate, to allow timely decisions regarding required disclosure. Under the supervision and with the participation of senior management, including our Principal Executive Officer and Principal Financial Officer, we evaluated our disclosure controls and procedures, as such term is defined under Rule 13a-15(e) promulgated under the Exchange Act. Based on this evaluation, our Principal Executive Officer and Principal Financial Officer concluded that our disclosure controls and procedures were effective as of December 31, 2016.
- 65 -
Management's Annual Report on Internal Control Over Financial Reporting
Our management is responsible for establishing and maintaining adequate internal control over financial reporting, as such term is defined in Exchange Act Rules 13a-15(f) and 15d-15(f). Our internal control over financial reporting is a process designed to provide reasonable assurance regarding the reliability of financial reporting and the preparation of our financial statements for external purposes in accordance with GAAP. Because of its inherent limitations, internal control over financial reporting may not prevent or detect misstatements. Also, projections of any evaluation of effectiveness to future periods are subject to the risk that controls may become inadequate because of changes in conditions, or that the degree of compliance with the policies or procedures may deteriorate. Under the supervision and with the participation of our management, including our Chief Executive Officer and Chief Financial Officer, we conducted an evaluation of the effectiveness of our internal control over financial reporting based on the criteria in Internal Control-Integrated Framework (2013 framework) issued by the Committee of Sponsoring Organizations of the Treadway Commission. Based on our evaluation under the framework in Internal Control-Integrated Framework, our management concluded that our internal control over financial reporting was effective as of December 31, 2016.
The effectiveness of our internal control over financial reporting as of December 31, 2016 has been audited by Ernst & Young LLP, our independent registered public accounting firm, as stated in its attestation report which is included herein.
- 66 -
Report of Independent Registered Public Accounting Firm
The Board of Directors and Stockholders of TRI Pointe Group, Inc.:
We have audited TRI Pointe Group, Inc.’s internal control over financial reporting as of December 31, 2016, based on criteria established in Internal Control—Integrated Framework issued by the Committee of Sponsoring Organizations of the Treadway Commission (2013 framework) (the COSO criteria). TRI Pointe Group, Inc.’s management is responsible for maintaining effective internal control over financial reporting, and for its assessment of the effectiveness of internal control over financial reporting included in the accompanying Management's Annual Report on Internal Control Over Financial Reporting. Our responsibility is to express an opinion on the company’s internal control over financial reporting based on our audit.
We conducted our audit in accordance with the standards of the Public Company Accounting Oversight Board (United States). Those standards require that we plan and perform the audit to obtain reasonable assurance about whether effective internal control over financial reporting was maintained in all material respects. Our audit included obtaining an understanding of internal control over financial reporting, assessing the risk that a material weakness exists, testing and evaluating the design and operating effectiveness of internal control based on the assessed risk, and performing such other procedures as we considered necessary in the circumstances. We believe that our audit provides a reasonable basis for our opinion.
A company’s internal control over financial reporting is a process designed to provide reasonable assurance regarding the reliability of financial reporting and the preparation of financial statements for external purposes in accordance with generally accepted accounting principles. A company’s internal control over financial reporting includes those policies and procedures that (1) pertain to the maintenance of records that, in reasonable detail, accurately and fairly reflect the transactions and dispositions of the assets of the company; (2) provide reasonable assurance that transactions are recorded as necessary to permit preparation of financial statements in accordance with generally accepted accounting principles, and that receipts and expenditures of the company are being made only in accordance with authorizations of management and directors of the company; and (3) provide reasonable assurance regarding prevention or timely detection of unauthorized acquisition, use, or disposition of the company’s assets that could have a material effect on the financial statements.
Because of its inherent limitations, internal control over financial reporting may not prevent or detect misstatements. Also, projections of any evaluation of effectiveness to future periods are subject to the risk that controls may become inadequate because of changes in conditions, or that the degree of compliance with the policies or procedures may deteriorate.
In our opinion, TRI Pointe Group, Inc. maintained, in all material respects, effective internal control over financial reporting as of December 31, 2016, based on the COSO criteria.
We also have audited, in accordance with the standards of the Public Company Accounting Oversight Board (United States), the consolidated balance sheets of TRI Pointe Group, Inc. as of December 31, 2016 and 2015, and the related consolidated statement of operations, equity, and cash flows for each of the three years in the period ended December 31, 2016 of TRI Pointe Group, Inc. and our report dated February 24, 2017 expressed an unqualified opinion thereon.
/s/ Ernst & Young LLP
Irvine, California
February 24, 2017
Changes in Internal Control Over Financial Reporting
Our management, including our Chief Executive Officer and Chief Financial Officer, has evaluated our internal control over financial reporting to determine whether any change occurred during the fourth quarter of the year ended December 31, 2016 that has materially affected, or is reasonably likely to materially affect, our internal control over financial reporting. Based on that evaluation, there has been no such change during the fourth quarter of the period covered by this report.
Item 9B. | Other Information |
None.
PART III.
- 67 -
Item 10. | Directors, Executive Officers and Corporate Governance |
The information required in response to this item is incorporated by reference from the information contained in our 2017 Proxy Statement under the captions “Board of Directors,” “Management,” “Section 16(a) Beneficial Ownership Reporting Compliance,” and “Corporate Governance.”
Item 11. | Executive Compensation |
The information required in response to this item is incorporated by reference to our 2017 Proxy Statement under the captions “Executive Compensation,” “Compensation Committee Report,” and “Corporate Governance – Compensation Committee Interlocks and Insider Participation.”
Item 12. | Security Ownership of Certain Beneficial Owners and Management and Related Stockholders |
The information required in response to this item is incorporated by reference to our 2017 Proxy Statement under the captions “Ownership of Our Common Stock” and “Equity Compensation Plan Information.”
Item 13. | Certain Relationships and Related Party Transactions, and Director Independence |
The information required in response to this item is incorporated by reference to our 2017 Proxy Statement under the captions “Corporate Governance” and “Certain Relationships and Related Party Transactions.”
Item 14. | Principal Accountant Fees and Services |
The information required in response to this item is incorporated by reference to our 2017 Proxy Statement under the caption “Audit Committee Matters.”
PART IV.
Item 15. | Exhibits, Financial Statements and Financial Statement Schedules |
(a) | The following documents are filed as part of this annual report on Form 10-K: |
(1) | Financial Statements: |
Page: | |
(2) | Financial Statement Schedules |
All other schedules have been omitted since the required information is presented in the financial statements and the related notes or is not applicable.
(3) | Exhibits |
The exhibits filed or furnished as part of this annual report on Form 10-K are listed in the Index to Exhibits immediately preceding those exhibits, which Index is incorporated in this Item by reference.
- 68 -
REPORT OF INDEPENDENT REGISTERED PUBLIC ACCOUNTING FIRM
To the Board of Directors and Stockholders of TRI Pointe Group, Inc.:
We have audited the accompanying consolidated balance sheets of TRI Pointe Group, Inc. as of December 31, 2016 and 2015, and the related consolidated statements of operations, equity, and cash flows for each of the three years in the period ended December 31, 2016. These financial statements are the responsibility of the Company’s management. Our responsibility is to express an opinion on these financial statements based on our audits.
We conducted our audits in accordance with the standards of the Public Company Accounting Oversight Board (United States). Those standards require that we plan and perform the audit to obtain reasonable assurance about whether the financial statements are free of material misstatement. An audit includes examining, on a test basis, evidence supporting the amounts and disclosures in the financial statements. An audit also includes assessing the accounting principles used and significant estimates made by management, as well as evaluating the overall financial statement presentation. We believe that our audits provide a reasonable basis for our opinion.
In our opinion, the financial statements referred to above present fairly, in all material respects, the consolidated financial position of TRI Pointe Group, Inc. at December 31, 2016 and 2015, and the consolidated results of its operations and cash flows for each of the three years in the period ended December 31, 2016, in conformity with U.S. generally accepted accounting principles.
We also have audited, in accordance with the standards of the Public Company Accounting Oversight Board (United States), TRI Pointe Group Inc.'s internal control over financial reporting as of December 31, 2016, based on criteria established in Internal Control — Integrated Framework issued by the Committee of Sponsoring Organizations of the Treadway Commission (2013 Framework) and our report dated February 24, 2017 expressed an unqualified opinion thereon.
/s/ Ernst & Young LLP
Irvine, California
February 24, 2017
- 69 -
TRI POINTE GROUP, INC.
CONSOLIDATED BALANCE SHEETS
(in thousands, except share amounts)
December 31, 2016 | December 31, 2015 | ||||||
Assets | |||||||
Cash and cash equivalents | $ | 208,657 | $ | 214,485 | |||
Receivables | 82,500 | 43,710 | |||||
Real estate inventories | 2,910,627 | 2,519,273 | |||||
Investments in unconsolidated entities | 17,546 | 18,999 | |||||
Goodwill and other intangible assets, net | 161,495 | 162,029 | |||||
Deferred tax assets, net | 123,223 | 130,657 | |||||
Other assets | 60,592 | 48,918 | |||||
Total assets | $ | 3,564,640 | $ | 3,138,071 | |||
Liabilities | |||||||
Accounts payable | $ | 70,252 | $ | 64,840 | |||
Accrued expenses and other liabilities | 263,845 | 216,263 | |||||
Unsecured revolving credit facility | 200,000 | 299,392 | |||||
Seller financed loans | 13,726 | 2,434 | |||||
Senior notes, net | 1,168,307 | 868,679 | |||||
Total liabilities | 1,716,130 | 1,451,608 | |||||
Commitments and contingencies (Note 15) | |||||||
Equity | |||||||
Stockholders’ Equity: | |||||||
Preferred stock, $0.01 par value, 50,000,000 shares authorized; no shares issued and outstanding as of December 31, 2016 and 2015, respectively | — | — | |||||
Common stock, $0.01 par value, 500,000,000 shares authorized; 158,626,229 and 161,813,750 shares issued and outstanding at December 31, 2016 and 2015, respectively | 1,586 | 1,618 | |||||
Additional paid-in capital | 880,822 | 911,197 | |||||
Retained earnings | 947,039 | 751,868 | |||||
Total stockholders’ equity | 1,829,447 | 1,664,683 | |||||
Noncontrolling interests | 19,063 | 21,780 | |||||
Total equity | 1,848,510 | 1,686,463 | |||||
Total liabilities and equity | $ | 3,564,640 | $ | 3,138,071 | |||
See accompanying notes.
- 70 -
TRI POINTE GROUP, INC.
CONSOLIDATED STATEMENTS OF OPERATIONS
(in thousands, except share and per share amounts)
Year Ended December 31, | |||||||||||
2016 | 2015 | 2014 | |||||||||
Homebuilding: | |||||||||||
Home sales revenue | $ | 2,329,336 | $ | 2,291,264 | $ | 1,646,274 | |||||
Land and lot sales revenue | 72,272 | 101,284 | 47,660 | ||||||||
Other operations revenue | 2,314 | 7,601 | 9,682 | ||||||||
Total revenues | 2,403,922 | 2,400,149 | 1,703,616 | ||||||||
Cost of home sales | 1,836,327 | 1,808,776 | 1,318,617 | ||||||||
Cost of land and lot sales | 17,367 | 35,089 | 37,906 | ||||||||
Other operations expense | 2,247 | 4,360 | 3,346 | ||||||||
Sales and marketing | 127,903 | 116,217 | 103,600 | ||||||||
General and administrative | 123,470 | 117,496 | 82,358 | ||||||||
Restructuring charges | 649 | 3,329 | 10,543 | ||||||||
Homebuilding income from operations | 295,959 | 314,882 | 147,246 | ||||||||
Equity in income (loss) of unconsolidated entities | 179 | 1,460 | (278 | ) | |||||||
Transaction expenses | — | — | (17,960 | ) | |||||||
Other income (loss), net | 312 | 858 | (1,019 | ) | |||||||
Homebuilding income before income taxes | 296,450 | 317,200 | 127,989 | ||||||||
Financial Services: | |||||||||||
Revenues | 1,220 | 1,010 | — | ||||||||
Expenses | 253 | 181 | 15 | ||||||||
Equity in income (loss) of unconsolidated entities | 4,810 | 1,231 | (10 | ) | |||||||
Financial services income (loss) before income taxes | 5,777 | 2,060 | (25 | ) | |||||||
Income before income taxes | 302,227 | 319,260 | 127,964 | ||||||||
Provision for income taxes | (106,094 | ) | (112,079 | ) | (43,767 | ) | |||||
Net income | 196,133 | 207,181 | 84,197 | ||||||||
Net income attributable to noncontrolling interests | (962 | ) | (1,720 | ) | — | ||||||
Net income available to common stockholders | $ | 195,171 | $ | 205,461 | $ | 84,197 | |||||
Earnings per share | |||||||||||
Basic | $ | 1.21 | $ | 1.27 | $ | 0.58 | |||||
Diluted | $ | 1.21 | $ | 1.27 | $ | 0.58 | |||||
Weighted average shares outstanding | |||||||||||
Basic | 160,859,782 | 161,692,152 | 145,044,351 | ||||||||
Diluted | 161,381,499 | 162,319,758 | 145,531,289 | ||||||||
See accompanying notes.
- 71 -
TRI POINTE GROUP, INC.
CONSOLIDATED STATEMENTS OF EQUITY
(in thousands, except share amounts)
Number of Common Shares (Note 1) | Common Stock | Additional Paid-in Capital | Retained Earnings | Total Stockholders' Equity | Noncontrolling Interests | Total Equity | ||||||||||||||||||||
Balance at December 31, 2013 | 129,700,000 | $ | 1,297 | $ | 333,589 | $ | 462,210 | $ | 797,096 | $ | 28,421 | $ | 825,517 | |||||||||||||
Net income | — | — | — | 84,197 | 84,197 | — | 84,197 | |||||||||||||||||||
Return of capital to Weyerhaeuser | — | — | 63,355 | — | 63,355 | — | 63,355 | |||||||||||||||||||
Common shares issued in connection with the Merger (Note 2) | 31,632,533 | 317 | 498,656 | — | 498,973 | — | 498,973 | |||||||||||||||||||
Shares issued under share-based awards | 22,957 | — | 176 | — | 176 | — | 176 | |||||||||||||||||||
Excess tax benefit of share-based awards, net | — | — | 1,757 | — | 1,757 | — | 1,757 | |||||||||||||||||||
Stock-based compensation expense | — | — | 8,626 | — | 8,626 | — | 8,626 | |||||||||||||||||||
Distributions to noncontrolling interests, net | — | — | — | — | — | (17,248 | ) | (17,248 | ) | |||||||||||||||||
Net effect of consolidations, de-consolidations and other transactions | — | — | — | — | — | 7,123 | 7,123 | |||||||||||||||||||
Balance at December 31, 2014 | 161,355,490 | 1,614 | 906,159 | 546,407 | 1,454,180 | 18,296 | 1,472,476 | |||||||||||||||||||
Net income | — | — | — | 205,461 | 205,461 | 1,720 | 207,181 | |||||||||||||||||||
Capital contribution by Weyerhaeuser, net | — | — | (6,747 | ) | — | (6,747 | ) | — | (6,747 | ) | ||||||||||||||||
Shares issued under share-based awards | 458,260 | 4 | 1,612 | — | 1,616 | — | 1,616 | |||||||||||||||||||
Excess tax benefit of share-based awards, net | — | — | 428 | — | 428 | — | 428 | |||||||||||||||||||
Minimum tax withholding paid on behalf of employees for restricted stock units | — | — | (2,190 | ) | — | (2,190 | ) | — | (2,190 | ) | ||||||||||||||||
Stock-based compensation expense | — | — | 11,935 | — | 11,935 | — | 11,935 | |||||||||||||||||||
Distributions to noncontrolling interests, net | — | — | — | — | — | (3,833 | ) | (3,833 | ) | |||||||||||||||||
Net effect of consolidations, de-consolidations and other transactions | — | — | — | — | — | 5,597 | 5,597 | |||||||||||||||||||
Balance at December 31, 2015 | 161,813,750 | 1,618 | 911,197 | 751,868 | 1,664,683 | 21,780 | 1,686,463 | |||||||||||||||||||
Net income | — | — | — | 195,171 | 195,171 | 962 | 196,133 | |||||||||||||||||||
Shares issued under share-based awards | 373,332 | 4 | 583 | — | 587 | — | 587 | |||||||||||||||||||
Excess tax deficit of share-based awards, net | — | — | (165 | ) | — | (165 | ) | — | (165 | ) | ||||||||||||||||
Minimum tax withholding paid on behalf of employees for restricted stock units | — | — | (1,359 | ) | — | (1,359 | ) | — | (1,359 | ) | ||||||||||||||||
Stock-based compensation expense | — | — | 12,612 | — | 12,612 | — | 12,612 | |||||||||||||||||||
Share repurchases | (3,560,853 | ) | (36 | ) | (42,046 | ) | — | (42,082 | ) | — | (42,082 | ) | ||||||||||||||
Distributions to noncontrolling interests, net | — | — | — | — | — | (3,363 | ) | (3,363 | ) | |||||||||||||||||
Net effect of consolidations, de-consolidations and other transactions | — | — | — | — | — | (316 | ) | (316 | ) | |||||||||||||||||
Balance at December 31, 2016 | 158,626,229 | $ | 1,586 | $ | 880,822 | $ | 947,039 | $ | 1,829,447 | $ | 19,063 | $ | 1,848,510 | |||||||||||||
See accompanying notes.
- 72 -
TRI POINTE GROUP, INC.
CONSOLIDATED STATEMENTS OF CASH FLOWS
(in thousands)
Year Ended December 31, | |||||||||||
2016 | 2015 | 2014 | |||||||||
Cash flows from operating activities: | |||||||||||
Net income | $ | 196,133 | $ | 207,181 | $ | 84,197 | |||||
Adjustments to reconcile net income to net cash used in operating activities: | |||||||||||
Depreciation and amortization | 3,087 | 8,274 | 11,423 | ||||||||
Equity in (income) loss of unconsolidated entities, net | (4,989 | ) | (2,691 | ) | 288 | ||||||
Deferred income taxes, net | 7,434 | 27,164 | 5,716 | ||||||||
Amortization of stock-based compensation | 12,612 | 11,935 | 8,626 | ||||||||
Charges for impairments and lot option abandonments | 1,470 | 1,930 | 2,515 | ||||||||
Excess tax deficit of share-based awards | (165 | ) | — | — | |||||||
Bridge commitment fee | — | — | 10,322 | ||||||||
Changes in assets and liabilities: | |||||||||||
Real estate inventories | (388,145 | ) | (235,030 | ) | (276,315 | ) | |||||
Receivables | 576 | (23,592 | ) | 40,933 | |||||||
Other assets | (8,501 | ) | 35,360 | (6,680 | ) | ||||||
Accounts payable | 5,412 | (4,020 | ) | 5,571 | |||||||
Accrued expenses and other liabilities | 10,490 | 4,494 | (46 | ) | |||||||
Returns on investments in unconsolidated entities, net | 6,276 | — | 80 | ||||||||
Net cash (used in) provided by operating activities | (158,310 | ) | 31,005 | (113,370 | ) | ||||||
Cash flows from investing activities: | |||||||||||
Purchases of property and equipment | (3,985 | ) | (809 | ) | (7,850 | ) | |||||
Cash acquired in the Merger | — | — | 53,800 | ||||||||
Proceeds from sale of property and equipment | 9 | — | 23 | ||||||||
Investments in unconsolidated entities | (32 | ) | (1,468 | ) | (1,311 | ) | |||||
Distributions from unconsolidated entities | — | 1,415 | — | ||||||||
Net cash (used in) provided by investing activities | (4,008 | ) | (862 | ) | 44,662 | ||||||
Cash flows from financing activities: | |||||||||||
Borrowings from debt | 541,069 | 140,000 | 987,298 | ||||||||
Repayment of debt | (330,858 | ) | (112,851 | ) | (53,051 | ) | |||||
Debt issuance costs | (5,062 | ) | (2,688 | ) | (23,000 | ) | |||||
Bridge commitment fee | — | — | (10,322 | ) | |||||||
Repayment of debt payable to Weyerhaeuser | — | — | (623,589 | ) | |||||||
Decrease in book overdrafts | — | — | (22,491 | ) | |||||||
Distributions to Weyerhaeuser | — | — | (8,606 | ) | |||||||
Net (repayments) proceeds of debt held by variable interest entities | (2,442 | ) | (6,769 | ) | 3,903 | ||||||
Contributions from noncontrolling interests | 1,955 | 5,990 | 1,895 | ||||||||
Distributions to noncontrolling interests | (5,318 | ) | (9,823 | ) | (19,143 | ) | |||||
Proceeds from issuance of common stock under share-based awards | 587 | 1,616 | 176 | ||||||||
Excess tax benefits of share-based awards | — | 428 | 1,757 | ||||||||
Minimum tax withholding paid on behalf of employees for share-based awards | (1,359 | ) | (2,190 | ) | — | ||||||
Share repurchases | (42,082 | ) | — | — | |||||||
Net cash provided by financing activities | 156,490 | 13,713 | 234,827 | ||||||||
Net (decrease) increase in cash and cash equivalents | (5,828 | ) | 43,856 | 166,119 | |||||||
Cash and cash equivalents - beginning of year | 214,485 | 170,629 | 4,510 | ||||||||
Cash and cash equivalents - end of year | $ | 208,657 | $ | 214,485 | $ | 170,629 | |||||
See accompanying notes.
- 73 -
TRI POINTE GROUP, INC.
NOTES TO CONSOLIDATED FINANCIAL STATEMENTS
1. | Organization and Summary of Significant Accounting Policies |
Organization
TRI Pointe Group, Inc. (“TRI Pointe Group”) is engaged in the design, construction and sale of innovative single-family attached and detached homes through its portfolio of six quality brands across eight states, including Maracay Homes in Arizona, Pardee Homes in California and Nevada, Quadrant Homes in Washington, Trendmaker Homes in Texas, TRI Pointe Homes in California and Colorado and Winchester Homes in Maryland and Virginia.
Formation of TRI Pointe Group
On July 7, 2015, TRI Pointe Homes, Inc. (“TRI Pointe Homes”) reorganized its corporate structure (the “Reorganization”) whereby TRI Pointe Homes became a direct, wholly owned subsidiary of TRI Pointe Group. As a result of the Reorganization, each share of common stock, par value $0.01 per share, of TRI Pointe Homes (“Homes Common Stock”) was cancelled and converted automatically into the right to receive one validly issued, fully paid and non-assessable share of common stock, par value $0.01 per share, of TRI Pointe Group (“Group Common Stock”), each share having the same designations, rights, powers and preferences, and the qualifications, limitations and restrictions thereof as the shares of Homes Common Stock being so converted. TRI Pointe Group, as the successor issuer to TRI Pointe Homes (pursuant to Rule 12g-3(a) under the Securities Exchange Act of 1934, as amended (the “Exchange Act”)), began making filings under the Securities Act of 1933, as amended, and the Exchange Act on July 7, 2015.
In connection with the Reorganization, TRI Pointe Group (i) became a co-issuer of TRI Pointe Homes’ 4.375% Senior Notes due 2019 (the "2019 Notes") and TRI Pointe Homes' 5.875% Senior Notes due 2024 (the "2024 Notes”); and (ii) replaced TRI Pointe Homes as the borrower under TRI Pointe Homes’ existing unsecured revolving credit facility.
Basis of Presentation
The accompanying financial statements have been prepared in accordance with U.S. generally accepted accounting principles (“GAAP”) as contained within the Financial Accounting Standards Board (“FASB”) Accounting Standards Codification (“ASC”).
The consolidated financial statements include the accounts of the Company and its wholly owned subsidiaries as described in “Reverse Acquisition” below, as well as other entities in which the Company has a controlling interest and variable interest entities (“VIEs”) in which the Company is the primary beneficiary. The noncontrolling interests as of December 31, 2016 and 2015 represent the outside owners’ interests in the Company’s consolidated entities and the net equity of the VIE owners. All significant intercompany accounts have been eliminated upon consolidation.
Unless the context otherwise requires, the terms “we”, “us”, “our” and “the Company” have the following meanings:
• | For periods prior to July 7, 2015: TRI Pointe Homes (and its consolidated subsidiaries) |
• | For periods from and after July 7, 2015: TRI Pointe Group (and its consolidated subsidiaries) |
Reverse Acquisition
On July 7, 2014 (the “Closing Date”), TRI Pointe Homes consummated the previously announced merger (the “Merger”) of our wholly owned subsidiary, Topaz Acquisition, Inc. (“Merger Sub”), with and into Weyerhaeuser Real Estate Company (“WRECO”), with WRECO surviving the Merger and becoming our wholly owned subsidiary, as contemplated by the Transaction Agreement, dated as of November 3, 2013 (the “Transaction Agreement”), by and among the Company, Weyerhaeuser Company (“Weyerhaeuser”), WRECO and Merger Sub. The Merger is accounted for in accordance with ASC Topic 805, Business Combinations (“ASC 805”). For accounting purposes, the Merger was treated as a “reverse acquisition” and WRECO was considered the accounting acquirer. Accordingly, WRECO is reflected as the predecessor and acquirer and therefore the accompanying consolidated financial statements reflect the historical consolidated financial statements of WRECO, and do not include the historical financial statements of TRI Pointe, for all periods presented prior to the Closing Date. Subsequent to the Closing Date, the consolidated financial statements reflect the results of the combined company.
- 74 -
See Note 2, Merger with Weyerhaeuser Real Estate Company, for further information on the Merger. In the Merger, each issued and outstanding WRECO common share was converted into 1.297 shares of TRI Pointe common stock. The historical issued and outstanding WRECO common shares (100,000,000 common shares for all periods presented prior to the Merger) have been recast (as 129,700,000 common shares of the Company for all periods prior to the Merger) in all periods presented to reflect this conversion.
Reclassifications
Certain amounts in our consolidated financial statements for prior years have been reclassified to conform to the current period presentation, including the Company's condensed reporting of impairments and land and lot option abandonments, included in cost of home sales and cost of land and lot sales on the consolidated statements of operations in this annual report on Form 10-K. For a more detailed presentation of our real estate inventory impairments and land and lot option abandonments, please see Note 7, Real Estate Inventories.
Use of Estimates
Our financial statements have been prepared in accordance with GAAP. The preparation of these financial statements requires our management to make estimates and judgments that affect the reported amounts of assets and liabilities and the disclosures of contingent liabilities at the date of the financial statements and the reported amounts of revenues and expenses during the reporting periods. Actual results could differ from our estimates.
Cash and Cash Equivalents and Concentration of Credit Risk
We define cash and cash equivalents as cash on hand, demand deposits with financial institutions, and short-term liquid investments with an initial maturity date of less than three months. The Company’s cash balances exceed federally insurable limits. The Company monitors the cash balances in its operating accounts and adjusts the cash balances as appropriate; however, these cash balances could be impacted if the underlying financial institutions fail or are subject to other adverse conditions in the financial markets. To date, the Company has experienced no loss or lack of access to cash in its operating accounts.
Real Estate Inventories and Cost of Sales
Real estate inventories consist of land, land under development, homes under construction, completed homes and model homes and are stated at cost, net of impairment losses. We capitalize direct carrying costs, including interest, property taxes and related development costs to inventories. Field construction supervision and related direct overhead are also included in the capitalized cost of inventories. Direct construction costs are specifically identified and allocated to homes while other common costs, such as land, land improvements and carrying costs, are allocated to homes within a community based upon their anticipated relative sales or fair value. In accordance with ASC Topic 835, Interest (“ASC 835”), homebuilding interest capitalized as a cost of inventories owned is included in costs of sales as related units or lots are sold. To the extent our debt exceeds our qualified assets as defined in ASC 835, we expense a portion of the interest incurred by us. Qualified assets represent projects that are actively under development. Homebuilding cost of sales is recognized at the same time revenue is recognized and is recorded based upon total estimated costs to be allocated to each home within a community. Any changes to the estimated costs are allocated to the remaining undelivered lots and homes within their respective community. The estimation and allocation of these costs require a substantial degree of judgment by management.
The estimation process involved in determining relative sales or fair values is inherently uncertain because it involves estimating future sales values of homes before delivery. Additionally, in determining the allocation of costs to a particular land parcel or individual home, we rely on project budgets that are based on a variety of assumptions, including assumptions about construction schedules and future costs to be incurred. It is common that actual results differ from budgeted amounts for various reasons, including construction delays, increases in costs that have not been committed or unforeseen issues encountered during construction that fall outside the scope of existing contracts, or costs that come in less than originally anticipated. While the actual results for a particular construction project are accurately reported over time, a variance between the budget and actual costs could result in the understatement or overstatement of costs and have a related impact on gross margins between reporting periods. To reduce the potential for such variances, we have procedures that have been applied on a consistent basis, including assessing and revising project budgets on a periodic basis, obtaining commitments from subcontractors and vendors for future costs to be incurred and utilizing the most recent information available to estimate costs.
- 75 -
If there are indications of impairment, we perform a detailed budget and cash flow review of our real estate assets to determine whether the estimated remaining undiscounted future cash flows of the community are more or less than the asset’s carrying value. If the undiscounted cash flows are more than the asset’s carrying value, no impairment adjustment is required. However, if the undiscounted cash flows are less than the asset’s carrying value, the asset is deemed impaired and is written down to fair value. These impairment evaluations require us to make estimates and assumptions regarding future conditions, including timing and amounts of development costs and sales prices of real estate assets, to determine if expected future undiscounted cash flows will be sufficient to recover the asset’s carrying value.
When estimating undiscounted cash flows of a community, we make various assumptions, including: (i) expected sales prices and sales incentives to be offered, including the number of homes available, pricing and incentives being offered by us or other builders in other communities, and future sales price adjustments based on market and economic trends; (ii) expected sales pace and cancellation rates based on local housing market conditions, competition and historical trends; (iii) costs expended to date and expected to be incurred including, but not limited to, land and land development costs, home construction costs, interest costs, indirect construction and overhead costs, and selling and marketing costs; (iv) alternative product offerings that may be offered that could have an impact on sales pace, sales price and/or building costs; and (v) alternative uses for the property.
Many assumptions are interdependent and a change in one may require a corresponding change to other assumptions. For example, increasing or decreasing monthly sales absorption rates has a direct impact on the estimated per unit sales price of a home, the level of time sensitive costs (such as indirect construction, overhead and carrying costs), and selling and marketing costs (such as model maintenance costs and advertising costs). Depending on the underlying objective of the community, assumptions could have a significant impact on the projected cash flow analysis. For example, if our objective is to preserve operating margins, our cash flow analysis will be different than if the objective is to increase sales. These objectives may vary significantly from community to community and over time. If assets are considered impaired, impairment is determined by the amount the asset’s carrying value exceeds its fair value. Fair value is determined based on estimated future cash flows discounted for inherent risks associated with real estate assets. These discounted cash flows are impacted by expected risk based on estimated land development, construction and delivery timelines; market risk of price erosion; uncertainty of development or construction cost increases; and other risks specific to the asset or market conditions where the asset is located when assessment is made. These factors are specific to each community and may vary among communities. We perform a quarterly review for indicators of impairment. For the year ended December 31, 2016 we had no real estate inventory impairment charges. For the years ended December 31, 2015 and 2014 we recorded impairment charges of $1.2 million and $931,000, respectively.
Revenue Recognition
In accordance with ASC Topic 360, Property, Plant, and Equipment, revenues from home sales and other real estate sales are recorded and a profit is recognized when the respective units are delivered. Home sales and other real estate sales are delivered when all conditions of escrow are met, including delivery of the home or other real estate asset, title passage, appropriate consideration is received and collection of associated receivables, if any, is reasonably assured. Sales incentives are a reduction of revenues when the respective unit is delivered. When it is determined that the earnings process is not complete, the sale and/or the related profit are deferred for recognition in future periods using the percentage-of-completion method. The profit we record is based on the calculation of cost of sales, which is dependent on our allocation of costs, as described in more detail above in the section entitled “Real Estate Inventories and Cost of Sales.”
Warranty Reserves
In the normal course of business, we incur warranty-related costs associated with homes that have been delivered to homebuyers. Estimated future direct warranty costs are accrued and charged to cost of sales in the period when the related home sales revenues are recognized while indirect warranty overhead salaries and related costs are charged to cost of sales in the period incurred. Factors that affect the warranty accruals include the number of homes delivered, historical and anticipated rates of warranty claims and cost per claim. Our primary assumption in estimating the amounts we accrue for warranty costs is that historical claims experience is a strong indicator of future claims experience. In addition, we maintain general liability insurance designed to protect us against a portion of our risk of loss from warranty and construction-related claims. We also generally require our subcontractors and design professionals to indemnify us for liabilities arising from their work, subject to various limitations. However, such indemnity is significantly limited with respect to certain subcontractors that are added to our general liability insurance policy.
- 76 -
Our warranty reserve is based on actuarial analysis that uses our historical claim and expense data, as well as industry data to estimate these overall costs. Key assumptions used in developing these estimates include claim frequencies, severities and resolution patterns, which can occur over an extended period of time. These estimates are subject to variability due to the length of time between the delivery of a home to a homebuyer and when a warranty or construction defect claim is made, and the ultimate resolution of such claim; uncertainties regarding such claims relative to our markets and the types of product we build; and legal or regulatory actions and/or interpretations, among other factors. Due to the degree of judgment involved and the potential for variability in these underlying assumptions, our actual future costs could differ from those estimated. There can be no assurance that the terms and limitations of the limited warranty will be effective against claims made by homebuyers, that we will be able to renew our insurance coverage or renew it at reasonable rates, that we will not be liable for damages, cost of repairs, and/or the expense of litigation surrounding possible construction defects, soil subsidence or building related claims or that claims will not arise out of uninsurable events or circumstances not covered by insurance and not subject to effective indemnification agreements with certain subcontractors.
We also record expected recoveries from insurance carriers based on actual insurance claims made and actuarially determined amounts that depend on various factors, including, the above-described reserve estimates, our insurance policy coverage limits for the applicable policy years and historical recovery rates. Because of the inherent uncertainty and variability in these assumptions, our actual insurance recoveries could differ significantly from amounts currently estimated.
Investments in Unconsolidated Entities
We have investments in unconsolidated entities over which we have significant influence that we account for using the equity method with taxes provided on undistributed earnings. We record earnings and accrue taxes in the period that the earnings are recorded by our affiliates. Under the equity method, our share of the unconsolidated entities’ earnings or loss is included in equity in income (loss) of unconsolidated entities in the accompanying consolidated statement of operations. We evaluate our investments in unconsolidated entities for impairment when events and circumstances indicate that the carrying value of the investment may not be recoverable.
Variable Interest Entities
The Company accounts for variable interest entities in accordance with ASC Topic 810, Consolidation (“ASC 810”). Under ASC 810, a variable interest entity (“VIE”) is created when: (a) the equity investment at risk in the entity is not sufficient to permit the entity to finance its activities without additional subordinated financial support provided by other parties, including the equity holders; (b) the entity’s equity holders as a group (i) lack the direct or indirect ability to make decisions about the entity, (ii) are not obligated to absorb expected losses of the entity or (iii) do not have the right to receive expected residual returns of the entity; or (c) the entity’s equity holders have voting rights that are not proportionate to their economic interests, and the activities of the entity involve, or are conducted on behalf of, the equity holder with disproportionately few voting rights. If an entity is deemed to be a VIE pursuant to ASC 810, the enterprise that has both (a) the power to direct the activities of a VIE that most significantly impact the entity’s economic performance and (b) the obligation to absorb the expected losses of the entity or right to receive benefits from the entity that could be potentially significant to the VIE is considered the primary beneficiary and must consolidate the VIE.
Under ASC 810, a non-refundable deposit paid to an entity is deemed to be a variable interest that will absorb some or all of the entity’s expected losses if they occur. Our land purchase and lot option deposits generally represent our maximum exposure to the land seller if we elect not to purchase the optioned property. In some instances, we may also expend funds for due diligence, development and construction activities with respect to optioned land prior to takedown. Such costs are classified as inventories owned, which we would have to write off should we not exercise the option. Therefore, whenever we enter into a land option or purchase contract with an entity and make a non-refundable deposit, a VIE may have been created. In accordance with ASC 810, we perform ongoing reassessments of whether we are the primary beneficiary of a VIE.
Stock-Based Compensation
We account for share-based awards in accordance with ASC Topic 718, Compensation-Stock Compensation (“ASC 718”). ASC 718 requires that the cost resulting from all share-based payment transactions be recognized in the financial statements. ASC 718 requires all entities to apply a fair-value-based measurement method in accounting for share-based payment transactions with employees. Share-based awards are expensed on a straight-line basis over the expected vesting period.
- 77 -
Sales and Marketing Expense
Sales and marketing costs incurred to sell real estate projects are capitalized if they are reasonably expected to be recovered from the sale of the project or from incidental operations and are incurred for tangible assets that are used directly through the selling period to aid in the sale of the project or services that have been performed to obtain regulatory approval of sales. All other selling expenses and other marketing costs are expensed in the period incurred.
Restructuring Charges
Restructuring charges are incurred related to the Merger in addition to general cost reduction initiatives. These charges are comprised of employee retention and severance-related expenses and lease termination costs. We account for restructuring charges in accordance with ASC Topic 420, Exit or Disposal Cost Obligations or ASC Topic 712 – Compensation – Nonretirement Postemployment Benefits.
Income Taxes
We account for income taxes in accordance with ASC Topic 740, Income Taxes (“ASC 740”). Deferred tax assets and liabilities are recorded based on future tax consequences of both temporary differences between the amounts reported for financial reporting purposes and the amounts deductible for income tax purposes, and are measured using enacted tax rates expected to apply in the years in which the temporary differences are expected to be recovered or settled. The effect on deferred tax assets and liabilities of a change in tax rates is recognized in earnings in the period when the changes are enacted.
Each quarter we assess our deferred tax assets to determine whether all or any portion of the assets is more likely than not unrealizable under ASC 740. We are required to establish a valuation allowance for any portion of the asset we conclude is more likely than not to be unrealizable. Our assessment considers, among other things, the nature, frequency and severity of our current and cumulative losses, forecasts of our future taxable income, the duration of statutory carryforward periods and tax planning alternatives. Due to uncertainties inherent in the estimation process, it is possible that actual results may vary from estimates.
We classify any interest and penalties related to income taxes as part of income tax expense.
Goodwill and Other Intangible Assets
In accordance with ASC Topic 350, Intangibles-Goodwill and Other (“ASC 350”), we evaluate goodwill and indefinite-lived intangible assets for impairment on an annual basis, or more frequently if events or changes in circumstances between annual tests indicate that it is more likely than not that the asset is impaired. We have identified one reporting unit with goodwill, TRI Pointe Homes, and performed our annual goodwill impairment evaluation as of October 1, 2016. For further details on goodwill, see Note 2, Merger with Weyerhaeuser Real Estate Company.
For our TRI Pointe Homes reporting unit, we performed a quantitative assessment to determine whether it is more likely than not that its fair value is less than its carrying amount. Upon completion of the October 2016 annual impairment assessment, we determined that no goodwill impairment was indicated. As of December 31, 2016, we are not aware of any significant indicators of impairment that exist for our goodwill that would require additional analysis.
An impairment of our indefinite-lived intangible asset is based on a comparison of its fair value to book value, without consideration of any recoverability due to the indefinite nature of the asset. As of December 31, 2016, we believe that our indefinite-lived intangible asset continues to have an indefinite life and that its fair value exceeds its carrying value. For further details on our indefinite-lived intangible asset, see Note 2, Merger with Weyerhaeuser Real Estate Company.
In accordance with ASC Topic 360, Property, Plant and Equipment ("ASC 360"), we evaluate finite-lived intangible assets for impairment on an annual basis, or more frequently if events or changes in circumstances between annual tests indicate that it is more likely than not that the asset is impaired. An impairment in the carrying value of our finite-lived intangible asset is recognized whenever anticipated future undiscounted cash flows from the asset become unrecoverable and are estimated to be less than its carrying value. As of December 31, 2016, we believe that the carrying value of our finite-lived intangible asset is recoverable and that its fair value is greater than its carrying value. For further details on our finite-lived intangible asset, see Note 10, Goodwill and Other Intangible Assets.
- 78 -
Significant management judgment is required in the forecasts of future operating results that are used in our impairment evaluations. Our estimates are consistent with the plans and estimates that we use to manage our business. It is possible, however, that the plans may change and estimates used may prove to be inaccurate. If our actual results, or the plans and estimates used in future impairment analyses, are lower than the original estimates used to assess the recoverability of these assets, we could incur future impairment charges.
Recently Issued Accounting Standards
In May 2014, the FASB issued Accounting Standards Update 2014-09, Revenue from Contracts with Customers (“ASU 2014-09”). The core principle of ASU 2014-09 is that an entity should recognize revenue to depict the transfer of promised goods or services to customers in an amount that reflects the consideration to which the entity expects to be entitled in exchange for those goods or services. To achieve that core principle, an entity should apply the following steps: identify the contract(s) with a customer; identify the performance obligations in the contract; determine the transaction price; allocate the transaction price to the performance obligations in the contract; and recognize revenue when (or as) the entity satisfies a performance obligation. ASU 2014-09 supersedes the revenue-recognition requirements in ASC Topic 605, Revenue Recognition, most industry-specific guidance throughout the industry topics of the accounting standards codification, and some cost guidance related to construction-type and production-type contracts. On July 9, 2015, the FASB voted to defer the effective date of ASU No. 2014-09 by one year and it is now effective for public entities for the annual periods ending after December 15, 2017, and for annual and interim periods thereafter. Companies may use either a full retrospective or a modified retrospective approach to adopt ASU 2014-09, and we expect to adopt the new standard under the modified retrospective approach. We are still evaluating the accounting for marketing costs, there is a possibility that the adoption of ASU 2014-09 will impact the timing of recognition and classification in our consolidated financial statements of certain marketing costs we incur to obtain sales contracts from our customers. For example, there are various marketing costs that we currently capitalize and amortize with each home delivered in a community. Under the new guidance, these costs may need to be expensed immediately. Although we are still in the process of evaluating our contracts, we do not believe the adoption of ASU 2014-09 will have a material impact on the amount or timing of our home sales revenue, but could impact the amount and timing of land and lot sales. We are continuing to evaluate the exact impact the new standard will have on recording revenue and our marketing costs in our consolidated financial statements and related disclosures.
In August 2014, the FASB issued Accounting Standards Update No. 2014-15 (“ASU 2014-15”), Presentation of Financial Statements — Going Concern (Subtopic 205-40): Disclosure of Uncertainties about an Entity’s Ability to Continue as a Going Concern, which requires management to evaluate, in connection with preparing financial statements for each annual and interim reporting period, whether there are conditions or events, considered in the aggregate, that raise substantial doubt about an entity’s ability to continue as a going concern within one year after the date that the financial statements are issued (or within one year after the date that the financial statements are available to be issued when applicable) and provide related disclosures. We adopted ASU 2014-15 on December 31, 2016, and the adoption had no impact on our current or prior year financial statements.
In February 2015, the FASB issued Accounting Standards Update No. 2015-02, (“ASU 2015-02”), Consolidation (Topic 810): Amendments to the Consolidation Analysis. ASU 2015-02 changes the analysis that a reporting entity must perform to determine whether it should consolidate certain types of legal entities. ASU 2015-02 is effective for fiscal years, and interim periods within those years, beginning after December 15, 2015. We adopted ASU 2015-02 on January 1, 2016 and the adoption had no impact on our current or prior year financial statements.
In November 2015, the FASB issued Accounting Standards Update No. 2015-17, (“ASU 2015-17”), Income Taxes (Topic 740): Balance Sheet Classification of Deferred Taxes, which requires deferred tax liabilities and assets be classified as noncurrent in a classified statement of position. ASU 2015-17 is effective for fiscal years, and interim periods within those years, beginning after December 15, 2016. The adoption of ASU 2015-17 is not expected to have a material effect on our consolidated financial statements due to our presentation of an unclassified balance sheet.
In February 2016, the FASB issued Accounting Standards Update No. 2016-02, (“ASU 2016-02”), Leases (Topic 842): Leases, which requires an entity to recognize assets and liabilities on the balance sheet for the rights and obligations created by leased assets and provide additional disclosures. ASU 2016-02 is effective for fiscal years, and interim periods within those years, beginning after December 15, 2018, and, at that time, we will adopt the new standard using a modified retrospective approach. We are currently evaluating the impact that the adoption of ASU 2016-02 may have on our consolidated financial statements and disclosures.
- 79 -
In March 2016, the FASB issued Accounting Standards Update No. 2016-09, (“ASU 2016-09”), Compensation-Stock Compensation (Topic 718): Improvements to Employee Share-Based Payment Accounting, which changes how companies account for certain aspects of share-based payment awards to employees, including the accounting for income taxes, forfeitures, and statutory tax withholding requirements, as well as classification in the statement of cash flows. ASU 2016-09 is effective for fiscal years, and interim periods within those years, beginning after December 15, 2016. We are currently evaluating the impact that the adoption of ASU 2016-09 may have on our consolidated financial statements and disclosures, however we do not believe the guidance will have a material impact on our financial statements upon adoption.
In August 2016, the FASB issued Accounting Standards Update No. 2016-15, (“ASU 2016-15”), Statement of Cash Flows (Topic 230): Classification of Certain Cash Receipts and Cash Payments, which provides guidance on how certain cash receipts and cash payments are to be presented and classified in the statement of cash flows. ASU 2016-15 is effective for fiscal years, and interim periods within those years, beginning after December 15, 2017. Early adoption is permitted. We are currently evaluating the impact that adoption of ASU 2016-15 may have on our consolidated financial statements and disclosures, however we do not believe the guidance will have a material impact on our financial statements upon adoption.
In January 2017, the FASB issued Accounting Standards Update No. 2017-04, (“ASU 2017-04”), Intangibles - Goodwill and Other (Topic 350): Simplifying the Accounting for Goodwill Impairment, which removes the requirement to perform a hypothetical purchase price allocation to measure goodwill impairment. A goodwill impairment will now be the amount by which a reporting unit’s carrying value exceeds its fair value, not to exceed the carrying amount of goodwill. ASU 2017-04 is effective for fiscal years, and interim periods within those years, beginning after December 15, 2019, with early adoption permitted, and applied prospectively. We do not expect ASU 2017-04 to have a material impact on our financial statements.
2. | Merger with Weyerhaeuser Real Estate Company |
In the Merger, TRI Pointe issued 129,700,000 shares of TRI Pointe common stock to the former holders of WRECO common shares, together with cash in lieu of any fractional shares. On the Closing Date, WRECO became a wholly owned subsidiary of TRI Pointe. Immediately following the consummation of the Merger, the ownership of TRI Pointe common stock on a fully diluted basis was as follows: (i) the WRECO common shares held by former Weyerhaeuser shareholders were converted into the right to receive, in the aggregate, approximately 79.6% of the then outstanding TRI Pointe common stock, (ii) the TRI Pointe common stock outstanding immediately prior to the consummation of the Merger represented approximately 19.4% of the then outstanding TRI Pointe common stock, and (iii) the outstanding equity awards of WRECO and TRI Pointe employees represented the remaining 1.0% of the then outstanding TRI Pointe common stock. On the Closing Date, the former direct parent entity of WRECO paid TRI Pointe $31.5 million in cash in accordance with the Transaction Agreement. Following the Merger, WRECO changed its name to TRI Pointe Holdings, Inc.
Assumption of Senior Notes
On the Closing Date, TRI Pointe Homes assumed WRECO’s obligations as issuer of $450 million aggregate principal amount of its 2019 Notes and $450 million aggregate principal amount of its 2024 Notes (the 2019 Notes together with the 2024 Notes, the “Assumed Senior Notes”). Additionally, WRECO and certain of its subsidiaries (collectively, the “Guarantors”) entered into supplemental indentures pursuant to which they guaranteed TRI Pointe’s obligations with respect to the Assumed Senior Notes. The Guarantors also entered into a joinder agreement to the Purchase Agreement, dated as of June 4, 2014, among WRECO, TRI Pointe, and the initial purchasers of the Assumed Senior Notes (collectively, the “Initial Purchasers”), pursuant to which the Guarantors became parties to the Purchase Agreement. Additionally, TRI Pointe and the Guarantors entered into joinder agreements to the Registration Rights Agreements, dated as of June 13, 2014, among WRECO and the Initial Purchasers with respect to the Assumed Senior Notes, pursuant to which TRI Pointe and the Guarantors were joined as parties to the Registration Rights Agreements. In connection with the Reorganization, TRI Pointe Group became a co-issuer with TRI Pointe Homes of the Assumed Senior Notes.
The net proceeds of $861.3 million from the offering of the Assumed Senior Notes were deposited into two separate escrow accounts following the closing of the offering on June 13, 2014. Upon release of the escrowed funds on the Closing Date and prior to the consummation of the Merger, WRECO paid $743.7 million in cash to its former direct parent, which cash was retained by Weyerhaeuser and its subsidiaries (other than WRECO and its subsidiaries). The payment consisted of the $739.0 million Payment Amount (as defined in the Transaction Agreement) as well as $4.7 million in payment of all unpaid interest on the debt payable to Weyerhaeuser that accrued from November 3, 2013 to the Closing Date. The remaining $117.6 million of proceeds was retained by TRI Pointe.
Transaction Expenses
Advisory, financing, integration and other transaction costs directly related to the Merger, excluding the impact of restructuring costs and purchase accounting adjustments, totaled $18.0 million for the year ended December 31, 2014. No additional transaction-related costs were incurred in 2015 or 2016.
- 80 -
Fair Value of Assets Acquired and Liabilities Assumed
The following table summarizes the calculation of the fair value of the total consideration transferred and the provisional amounts recognized as of the Closing Date (in thousands, except shares and closing stock price):
Calculation of consideration transferred | |||
TRI Pointe shares outstanding | 31,632,533 | ||
TRI Pointe closing stock price on July 7, 2014 | $ | 15.85 | |
Consideration attributable to common stock | $ | 501,376 | |
Consideration attributable to TRI Pointe share-based equity awards | 1,072 | ||
Total consideration transferred | $ | 502,448 | |
Assets acquired and liabilities assumed | |||
Cash and cash equivalents | $ | 53,800 | |
Accounts receivable | 654 | ||
Real estate inventories | 539,677 | ||
Intangible asset | 17,300 | ||
Goodwill | 139,304 | ||
Other assets | 28,060 | ||
Total assets acquired | 778,795 | ||
Accounts payable | (26,105 | ) | |
Accrued expenses and other liabilities | (23,114 | ) | |
Notes payable and other borrowings | (227,128 | ) | |
Total liabilities assumed | (276,347 | ) | |
Total net assets acquired | $ | 502,448 | |
Cash and cash equivalents, accounts receivable, other assets, accounts payable, accrued payroll liabilities, and accrued expenses and other liabilities were generally stated at historical carrying values given the short-term nature of these assets and liabilities. Notes payable and other borrowings are stated at carrying value due to the limited amount of time since the notes payable and other borrowings were entered into prior to the Closing Date.
The Company determined the fair value of real estate inventories on a community-by-community basis primarily using a combination of market-comparable land transactions, land residual analysis and discounted cash flow models. The estimated fair value is significantly impacted by estimates related to expected average selling prices, sales pace, cancellation rates and construction and overhead costs. Such estimates must be made for each individual community and may vary significantly between communities.
The fair value of the acquired intangible asset was determined based on a valuation performed by an independent valuation specialist. The $17.3 million intangible asset is related to the TRI Pointe Homes trade name which is deemed to have an indefinite useful life.
Goodwill is primarily attributed to expected synergies from combining WRECO’s and TRI Pointe’s existing businesses, including, but not limited to, expected cost synergies from overhead savings resulting from streamlining certain redundant corporate functions, improved operating efficiencies, including provision of certain corporate level administrative and support functions at a lower cost than was historically allocated to WRECO for such services by its former direct parent, and growth of ancillary operations in various markets as permitted under applicable law, including a mortgage business, a title company and other ancillary operations. The Company also anticipates opportunities for growth through expanded geographic and homebuyer segment diversity and the ability to leverage additional brands. The acquired goodwill is not deductible for income tax purposes.
Supplemental Pro Forma Information (Unaudited)
The following represents unaudited pro forma operating results as if the acquisition had been completed as of January 1, 2014 (in thousands, except per share amounts):
- 81 -
Year Ended | |||
December 31, 2014 | |||
Total revenues | $ | 1,865,723 | |
Net income | $ | 88,416 | |
Earnings per share – basic | $ | 0.55 | |
Earnings per share – diluted | $ | 0.55 | |
The unaudited pro forma operating results have been determined after adjusting the operating results of TRI Pointe to reflect the purchase accounting and other acquisition adjustments including interest expense associated with the debt used to fund a portion of the Merger. The unaudited pro forma results do not reflect any cost savings, operating synergies or other enhancements that we may achieve as a result of the Merger or the costs necessary to integrate the operations to achieve these cost savings and synergies. Accordingly, the unaudited pro forma amounts are for comparative purposes only and may not necessarily reflect the results of operations had the Merger been completed at the beginning of the period or be indicative of the results we will achieve in the future.
3. | Restructuring Charges |
In connection with the Merger, the Company initiated a restructuring plan to reduce duplicate corporate and divisional overhead costs and expenses. In addition, WRECO previously recognized restructuring expenses related to general cost reduction initiatives. Restructuring costs were comprised of the following (in thousands):
Year Ended December 31, | |||||||||||
2016 | 2015 | 2014 | |||||||||
Employee-related costs | $ | 99 | $ | 1,546 | $ | 9,211 | |||||
Lease termination costs | 550 | 1,783 | 1,332 | ||||||||
Total | $ | 649 | $ | 3,329 | $ | 10,543 | |||||
Employee-related costs of $99,000 and $1.5 million for the years ended December 31, 2016 and 2015 related to severance-related expenses. Employee-related costs incurred during the year ended December 31, 2014 included employee retention and severance-related expenses of $8.3 million and stock-based compensation expense of $947,000 for employees terminated during the period. Lease termination costs of $550,000, $1.8 million and $1.3 million during the years ended December 31, 2016, 2015 and 2014, respectively, relate to contract terminations as a result of general cost reduction initiatives.
Changes in employee-related restructuring reserves were as follows (in thousands):
Year Ended December 31, | |||||||||||
2016 | 2015 | 2014 | |||||||||
Accrued employee-related costs, beginning of period | $ | 220 | $ | 3,844 | $ | 4,336 | |||||
Current year charges | 99 | 1,546 | 8,264 | ||||||||
Payments | (250 | ) | (5,170 | ) | (8,756 | ) | |||||
Accrued employee-related costs, end of period | $ | 69 | $ | 220 | $ | 3,844 | |||||
Changes in lease termination related restructuring reserves were as follows (in thousands):
Year Ended December 31, | |||||||||||
2016 | 2015 | 2014 | |||||||||
Accrued lease termination costs, beginning of period | $ | 767 | $ | 1,394 | $ | 3,506 | |||||
Current year charges | 550 | 1,783 | 1,332 | ||||||||
Payments | (1,236 | ) | (2,410 | ) | (3,444 | ) | |||||
Accrued lease termination costs, end of period | $ | 81 | $ | 767 | $ | 1,394 | |||||
Employee and lease termination restructuring reserves are included in accrued expenses and other liabilities on our consolidated balance sheets.
- 82 -
4. | Segment Information |
We operate two principal businesses: homebuilding and financial services.
Our homebuilding operations consist of six homebuilding companies, each operating under different brand names, where we acquire and develop land and construct and sell single-family detached and attached homes. In accordance with ASC Topic 280, Segment Reporting, in determining the most appropriate reportable segments, we considered similar economic and other characteristics, including product types, average selling prices, gross profits, production processes, suppliers, subcontractors, regulatory environments, land acquisition results, brand names, and underlying demand and supply. Based upon the above factors, our homebuilding operations are comprised of the following six reportable segments: Maracay Homes, consisting of operations in Arizona; Pardee Homes, consisting of operations in California and Nevada; Quadrant Homes, consisting of operations in Washington; Trendmaker Homes, consisting of operations in Texas; TRI Pointe Homes, consisting of operations in California and Colorado; and Winchester Homes, consisting of operations in Maryland and Virginia.
Our financial services reportable segment (“TRI Pointe Solutions”) is comprised of mortgage financing operations and title services operations. Our mortgage financing operation (“TRI Pointe Connect”) provides mortgage financing to our homebuyers in all of the markets in which we operate. TRI Pointe Connect was formed as a joint venture with imortgage and is accounted for under the equity method of accounting. Our title services operation (“TRI Pointe Assurance”) provides title examinations for our homebuyers in our Trendmaker Homes and Winchester Homes brands. TRI Pointe Assurance is a wholly owned subsidiary of TRI Pointe Group and acts as a title agency for First American Title Insurance Company.
Corporate is a non-operating segment that develops and implements company-wide strategic initiatives and provides support to our homebuilding reporting segments by centralizing certain administrative functions, such as marketing, legal, accounting, treasury, insurance, internal audit and risk management, information technology and human resources, to benefit from economies of scale. Our Corporate non-operating segment also includes general and administrative expenses related to operating our corporate headquarters. A portion of the expenses incurred by Corporate is allocated to the homebuilding reporting segments.
The reportable segments follow the same accounting policies as our consolidated financial statements described in Note 1, Organization and Summary of Significant Accounting Policies. Operational results of each reportable segment are not necessarily indicative of the results that would have been achieved had the reportable segment been an independent, stand-alone entity during the periods presented.
Total revenues and income before income taxes for each of our reportable segments were as follows (in thousands):
- 83 -
2016 | 2015 | 2014 | |||||||||
Revenues | |||||||||||
Maracay Homes | $ | 255,253 | $ | 185,645 | $ | 150,689 | |||||
Pardee Homes | 730,848 | 670,063 | 525,381 | ||||||||
Quadrant Homes | 213,221 | 189,401 | 145,377 | ||||||||
Trendmaker Homes | 244,001 | 278,759 | 281,270 | ||||||||
TRI Pointe Homes | 723,186 | 774,005 | 324,208 | ||||||||
Winchester Homes | 237,413 | 302,276 | 276,691 | ||||||||
Total homebuilding revenues | 2,403,922 | 2,400,149 | 1,703,616 | ||||||||
Financial services | 1,220 | 1,010 | — | ||||||||
Total | $ | 2,405,142 | $ | 2,401,159 | $ | 1,703,616 | |||||
Income before taxes | |||||||||||
Maracay Homes | $ | 17,189 | $ | 9,849 | $ | 10,845 | |||||
Pardee Homes | 204,237 | 183,077 | 74,898 | ||||||||
Quadrant Homes | 21,209 | 10,478 | 9,028 | ||||||||
Trendmaker Homes | 15,353 | 25,004 | 31,684 | ||||||||
TRI Pointe Homes | 62,013 | 104,970 | 19,272 | ||||||||
Winchester Homes | 16,147 | 22,411 | 24,612 | ||||||||
Corporate (1) | (39,698 | ) | (38,589 | ) | (42,350 | ) | |||||
Total homebuilding income before income taxes | 296,450 | 317,200 | 127,989 | ||||||||
Financial services | 5,777 | 2,060 | (25 | ) | |||||||
Total | $ | 302,227 | $ | 319,260 | $ | 127,964 | |||||
(1) | Includes $18.0 million of Merger related transaction costs and $5.5 million of restructuring charges for the year ended December 31, 2014. No similar costs were incurred for the years ended December 31, 2016 or 2015, respectively. |
Total real estate inventories and total assets for each of our reportable segments, as of the date indicated, were as follows (in thousands):
December 31, 2016 | December 31, 2015 | ||||||
Real estate inventories | |||||||
Maracay Homes | $ | 228,965 | $ | 206,912 | |||
Pardee Homes | 1,098,608 | 1,011,982 | |||||
Quadrant Homes | 221,386 | 190,038 | |||||
Trendmaker Homes | 211,035 | 199,398 | |||||
TRI Pointe Homes | 868,088 | 659,130 | |||||
Winchester Homes | 282,545 | 251,813 | |||||
Total | $ | 2,910,627 | $ | 2,519,273 | |||
Total assets | |||||||
Maracay Homes | $ | 255,466 | $ | 227,857 | |||
Pardee Homes | 1,201,302 | 1,089,586 | |||||
Quadrant Homes | 242,208 | 202,024 | |||||
Trendmaker Homes | 225,025 | 213,562 | |||||
TRI Pointe Homes | 1,052,400 | 832,423 | |||||
Winchester Homes | 305,379 | 278,374 | |||||
Corporate | 275,923 | 292,169 | |||||
Total homebuilding assets | 3,557,703 | 3,135,995 | |||||
Financial services | 6,937 | 2,076 | |||||
Total | $ | 3,564,640 | $ | 3,138,071 | |||
- 84 -
5. | Earnings Per Share |
The following table sets forth the components used in the computation of basic and diluted earnings per share (in thousands, except share and per share amounts):
Year Ended December 31, | |||||||||||
2016 | 2015 | 2014 | |||||||||
Numerator: | |||||||||||
Income available to common stockholders | $ | 195,171 | $ | 205,461 | $ | 84,197 | |||||
Denominator: | |||||||||||
Basic weighted-average shares outstanding | 160,859,782 | 161,692,152 | 145,044,351 | ||||||||
Effect of dilutive shares: | |||||||||||
Stock options and unvested restricted stock units | 521,717 | 627,606 | 486,938 | ||||||||
Diluted weighted-average shares outstanding | 161,381,499 | 162,319,758 | 145,531,289 | ||||||||
Earnings per share | |||||||||||
Basic | $ | 1.21 | $ | 1.27 | $ | 0.58 | |||||
Diluted | $ | 1.21 | $ | 1.27 | $ | 0.58 | |||||
Antidilutive stock options not included in diluted earnings per share | 4,551,337 | 2,622,391 | 1,295,280 | ||||||||
In the Merger, each issued and outstanding WRECO common share was converted into 1.297 shares of TRI Pointe common stock. The historical issued and outstanding WRECO common shares (100,000,000 common shares for all periods presented prior to the Merger) have been recast (as 129,700,000 common shares of the Company for all periods prior to the Merger) in all periods presented to reflect this conversion. See Note 2, Merger with Weyerhaeuser Real Estate Company, for further information on the Merger.
6. | Receivables, Net |
Receivables, net consisted of the following (in thousands):
December 31, 2016 | December 31, 2015 | ||||||
Escrow proceeds and other accounts receivable, net | $ | 35,625 | $ | 32,917 | |||
Warranty insurance receivable(1) (Note 15) | 46,875 | 10,493 | |||||
Notes and contracts receivable | — | 300 | |||||
Total receivables | $ | 82,500 | $ | 43,710 | |||
__________
(1) | This amount includes approximately $38.0 million reclassified in 2016, which represents the estimated recoveries related to our insurance policies that during 2015 had been offset against our insurance liabilities and recoveries. For further discussion see Note 15 – Commitments and Contingencies. |
Receivables are evaluated for collectability and allowances for potential losses are established or maintained on applicable receivables when collection becomes doubtful. Receivables were net of allowances for doubtful accounts of $286,000 in 2016 and $1.7 million in 2015.
7. | Real Estate Inventories |
Real estate inventories consisted of the following (in thousands):
- 85 -
December 31, 2016 | December 31, 2015 | ||||||
Real estate inventories owned: | |||||||
Homes completed or under construction | $ | 659,210 | $ | 575,076 | |||
Land under development | 1,824,989 | 1,443,461 | |||||
Land held for future development | 226,915 | 295,241 | |||||
Model homes | 155,039 | 140,232 | |||||
Total real estate inventories owned | 2,866,153 | 2,454,010 | |||||
Real estate inventories not owned: | |||||||
Land purchase and land option deposits | 26,174 | 39,055 | |||||
Consolidated inventory held by VIEs | 18,300 | 26,208 | |||||
Total real estate inventories not owned | 44,474 | 65,263 | |||||
Total real estate inventories | $ | 2,910,627 | $ | 2,519,273 | |||
Homes completed or under construction is comprised of costs associated with homes in various stages of construction and includes direct construction and related land acquisition and land development costs. Land under development primarily consists of land acquisition and land development costs, which include capitalized interest and real estate taxes, associated with land undergoing improvement activity. Land held for future development principally reflects land acquisition and land development costs related to land where development activity has not yet begun or has been suspended, but is expected to occur in the future.
Real estate inventories not owned represents deposits related to land purchase and land option agreements as well as consolidated inventory held by a VIE. For further details, see Note 9, Variable Interest Entities.
Interest incurred, capitalized and expensed were as follows (in thousands):
Year Ended December 31, | |||||||||||
2016 | 2015 | 2014 | |||||||||
Interest incurred | $ | 68,306 | $ | 60,964 | $ | 41,706 | |||||
Interest capitalized | (68,306 | ) | (60,964 | ) | (38,975 | ) | |||||
Interest expensed | $ | — | $ | — | $ | 2,731 | |||||
Capitalized interest in beginning inventory | $ | 140,311 | $ | 124,461 | $ | 138,233 | |||||
Interest capitalized as a cost of inventory | 68,306 | 60,964 | 38,975 | ||||||||
Interest previously capitalized as a cost of inventory, included in cost of sales | (51,288 | ) | (45,114 | ) | (52,747 | ) | |||||
Capitalized interest in ending inventory | $ | 157,329 | $ | 140,311 | $ | 124,461 | |||||
Interest is capitalized to real estate inventory during development and other qualifying activities. Interest that is capitalized to real estate inventory is included in cost of home sales as related units are delivered. Interest that is expensed as incurred is included in other income (loss), net on the consolidated statements of operations.
Real estate inventory impairments and land option abandonments
Real estate inventory impairments and land option abandonments consisted of the following (in thousands):
Year Ended December 31, | |||||||||||
2016 | 2015 | 2014 | |||||||||
Real estate inventory impairments | $ | — | $ | 1,167 | $ | 931 | |||||
Land and lot option abandonments and pre-acquisition costs | 1,470 | 763 | 1,584 | ||||||||
Total | $ | 1,470 | $ | 1,930 | $ | 2,515 | |||||
Impairments of real estate inventory relate primarily to projects or communities that include homes completed or under construction. Within a project or community, there may be individual homes or parcels of land that are currently held for sale. Impairment charges recognized as a result of adjusting individual held-for-sale assets within a community to estimated fair value less cost to sell are also included in the total impairment charges above.
- 86 -
In addition to owning land and residential lots, we also have option agreements to purchase land and lots at a future date. We have option deposits and capitalized pre-acquisition costs associated with the optioned land and lots. When the economics of a project no longer support acquisition of the land or lots under option, we may elect not to move forward with the acquisition. Option deposits and capitalized pre-acquisition costs associated with the assets under option may be forfeited at that time.
Real estate inventory impairments and land option abandonments are recorded in cost of home sales and cost of land and lot sales on the consolidated statements of operations.
8. | Investments in Unconsolidated Entities |
As of December 31, 2016, we held equity investments in six active homebuilding partnerships or limited liability companies and one financial services limited liability company. Our participation in these entities may be as a developer, a builder, or an investment partner. Our ownership percentage varies from 7% to 55%, depending on the investment, with no controlling interest held in any of these investments.
Investments Held
Our cumulative investment in entities accounted for on the equity method, including our share of earnings and losses, consisted of the following (in thousands):
December 31, | |||||||
2016 | 2015 | ||||||
Limited liability company interests | $ | 14,327 | $ | 15,739 | |||
General partnership interests | 3,219 | 3,260 | |||||
Total | $ | 17,546 | $ | 18,999 | |||
Unconsolidated Financial Information
Aggregated assets, liabilities and operating results of the entities we account for as equity-method investments are provided below. Because our ownership interest in these entities varies, a direct relationship does not exist between the information presented below and the amounts that are reflected on our consolidated balance sheets as our investment in unconsolidated entities or on our consolidated statement of operations as equity in income (loss) of unconsolidated entities.
Assets and liabilities of unconsolidated entities (in thousands):
December 31, | |||||||
2016 | 2015 | ||||||
Assets | |||||||
Cash | $ | 9,796 | $ | 18,641 | |||
Receivables | 10,203 | 13,108 | |||||
Real estate inventories | 97,402 | 92,881 | |||||
Other assets | 1,087 | 1,180 | |||||
Total assets | $ | 118,488 | $ | 125,810 | |||
Liabilities and equity | |||||||
Accounts payable and other liabilities | $ | 12,844 | $ | 14,443 | |||
Company’s equity | 17,546 | 18,999 | |||||
Outside interests' equity | 88,098 | 92,368 | |||||
Total liabilities and equity | $ | 118,488 | $ | 125,810 | |||
Results of operations from unconsolidated entities (in thousands):
- 87 -
Year Ended December 31, | |||||||||||
2016 | 2015 | 2014 | |||||||||
Net sales | $ | 18,725 | $ | 7,326 | $ | 606 | |||||
Other operating expense | (11,315 | ) | (6,690 | ) | (4,290 | ) | |||||
Other income (expense) | 4 | (279 | ) | (2 | ) | ||||||
Net income (loss) | $ | 7,414 | $ | 357 | $ | (3,686 | ) | ||||
Company’s equity in income (loss) of unconsolidated entities | $ | 4,989 | $ | 2,691 | $ | (288 | ) | ||||
9. | Variable Interest Entities |
In the ordinary course of business, we enter into land option agreements in order to procure land and residential lots for future development and the construction of homes. The use of such land option agreements generally allows us to reduce the risks associated with direct land ownership and development, and reduces our capital and financial commitments. Pursuant to these land option agreements, we generally provide a deposit to the seller as consideration for the right to purchase land at different times in the future, usually at predetermined prices. Such deposits are recorded as land purchase and land option deposits under real estate inventories not owned in the accompanying consolidated balance sheets.
We analyze each of our land option agreements and other similar contracts under the provisions of ASC 810 to determine whether the land seller is a VIE and, if so, whether we are the primary beneficiary. Although we do not have legal title to the underlying land, if we are determined to be the primary beneficiary of the VIE, we will consolidate the VIE in our financial statements and reflect its assets as real estate inventory not owned included in our real estate inventories, its liabilities as debt (nonrecourse) held by VIEs in accrued expenses and other liabilities and the net equity of the VIE owners as noncontrolling interests on our consolidated balance sheets. In determining whether we are the primary beneficiary, we consider, among other things, whether we have the power to direct the activities of the VIE that most significantly impact the VIE’s economic performance. Such activities would include, among other things, determining or limiting the scope or purpose of the VIE, selling or transferring property owned or controlled by the VIE, or arranging financing for the VIE.
Creditors of the entities with which we have land option agreements have no recourse against us. The maximum exposure to loss under our land option agreements is limited to non-refundable option deposits and any capitalized pre-acquisition costs. In some cases, we have also contracted to complete development work at a fixed cost on behalf of the land owner and budget shortfalls and savings will be borne by us.
The following provides a summary of our interests in land option agreements (in thousands):
December 31, 2016 | December 31, 2015 | ||||||||||||||||||||||
Deposits | Remaining Purchase Price | Consolidated Inventory Held by VIEs | Deposits | Remaining Purchase Price | Consolidated Inventory Held by VIEs | ||||||||||||||||||
Consolidated VIEs | $ | 400 | $ | 17,900 | $ | 18,300 | $ | 3,003 | $ | 23,239 | $ | 26,208 | |||||||||||
Unconsolidated VIEs | 2,375 | 49,016 | N/A | 11,615 | 74,590 | N/A | |||||||||||||||||
Other land option agreements | 23,799 | 246,658 | N/A | 27,440 | 279,612 | N/A | |||||||||||||||||
Total | $ | 26,574 | $ | 313,574 | $ | 18,300 | $ | 42,058 | $ | 377,441 | $ | 26,208 | |||||||||||
Unconsolidated VIEs represent land option agreements that were not consolidated because we were not the primary beneficiary. Other land option agreements were not considered VIEs.
In addition to the deposits presented in the table above, our exposure to loss related to our land option contracts consisted of capitalized pre-acquisition costs of $3.6 million and $5.0 million as of December 31, 2016 and 2015, respectively. These pre-acquisition costs were included in real estate inventories as land under development on our consolidated balance sheets.
- 88 -
10. | Goodwill and Other Intangible Assets |
During the year ended December 31, 2014, the Company recorded $139.3 million of goodwill in connection with the Merger. As of December 31, 2016 and 2015, $139.3 million of goodwill is included in goodwill and other intangible assets, net, on each of the consolidated balance sheets. The Company's goodwill balance is included in the TRI Pointe Homes reporting segment in Note 4, Segment Information. For further details on goodwill, see Note 2, Merger with Weyerhaeuser Real Estate Company.
We have two intangible assets as of December 31, 2016, comprised of an existing trade name from the acquisition of Maracay Homes in 2006, which has a 20 years useful life, and a TRI Pointe Homes trade name resulting from the acquisition of WRECO in 2014, which has an indefinite useful life. For further details on the TRI Pointe Homes trade name see Note 2, Merger with Weyerhaeuser Real Estate Company.
Goodwill and other intangible assets consisted of the following (in thousands):
December 31, 2016 | December 31, 2015 | ||||||||||||||||||||||
Gross Carrying Amount | Accumulated Amortization | Net Carrying Amount | Gross Carrying Amount | Accumulated Amortization | Net Carrying Amount | ||||||||||||||||||
Goodwill | $ | 139,304 | $ | — | $ | 139,304 | $ | 139,304 | $ | — | $ | 139,304 | |||||||||||
Trade names | 27,979 | (5,788 | ) | 22,191 | 27,979 | (5,254 | ) | 22,725 | |||||||||||||||
Total | $ | 167,283 | $ | (5,788 | ) | $ | 161,495 | $ | 167,283 | $ | (5,254 | ) | $ | 162,029 | |||||||||
The remaining useful life of our amortizing intangible asset related to Maracay was 9.2 and 10.2 years as of December 31, 2016 and 2015, respectively. Amortization expense related to this intangible asset was $534,000 for the year ended December 31, 2016 and 2015, respectively, and was charged to sales and marketing expense. Our $17.3 million indefinite life intangible asset related to TRI Pointe Homes trade name is not amortizing. All trade names are evaluated for impairment on an annual basis or more frequently if indicators of impairment exist.
Expected amortization of our intangible asset related to Maracay Homes for the next five years and thereafter is (in thousands):
2017 | $ | 534 | |
2018 | 534 | ||
2019 | 534 | ||
2020 | 534 | ||
2021 | 534 | ||
Thereafter | 2,221 | ||
Total | $ | 4,891 | |
11. | Other Assets |
Other assets consisted of the following (in thousands):
December 31, 2016 | December 31, 2015 | ||||||
Prepaid expenses | $ | 24,495 | $ | 14,523 | |||
Refundable fees and other deposits | 17,731 | 17,056 | |||||
Development rights, held for future use or sale | 2,569 | 4,360 | |||||
Deferred loan costs | 2,101 | 2,179 | |||||
Operating properties and equipment, net | 10,884 | 7,643 | |||||
Other | 2,812 | 3,157 | |||||
Total | $ | 60,592 | $ | 48,918 | |||
- 89 -
12. | Accrued Expenses and Other Liabilities |
Accrued expenses and other liabilities consisted of the following (in thousands):
December 31, 2016 | December 31, 2015 | ||||||
Accrued payroll and related costs | $ | 33,761 | $ | 28,264 | |||
Warranty reserves(1) (Note 15) | 83,135 | 45,948 | |||||
Estimated cost for completion of real estate inventories | 59,531 | 52,818 | |||||
Customer deposits | 13,437 | 12,132 | |||||
Debt (nonrecourse) held by VIEs | — | 2,442 | |||||
Income tax liability to Weyerhaeuser | 8,589 | 8,900 | |||||
Accrued income taxes payable | 1,200 | 19,279 | |||||
Liability for uncertain tax positions | — | 307 | |||||
Accrued interest | 11,570 | 2,417 | |||||
Accrued insurance expense | 529 | 1,402 | |||||
Other tax liabilities | 34,961 | 21,764 | |||||
Other | 17,132 | 20,590 | |||||
Total | $ | 263,845 | $ | 216,263 | |||
__________
(1) | Included in this amount for 2016 is approximately $38.0 million of additional warranty liabilities estimated to be covered by our insurance policies that were adjusted to present the warranty reserves and related estimated warranty insurance receivable on a gross basis at December 31, 2016. Of the $38.0 million adjusted in the current year, approximately $36.5 million related to prior year estimated warranty insurance recoveries. For further details, see Note 6, Receivables, Net and Note 15, Commitments and Contingencies. |
13. | Senior Notes and Notes Payable and Other Borrowings |
Senior Notes
Senior notes consisted of the following (in thousands):
December 31, 2016 | December 31, 2015 | ||||||
4.375% Senior Notes due June 15, 2019 | $ | 450,000 | $ | 450,000 | |||
4.875% Senior Notes due July 1, 2021 | 300,000 | — | |||||
5.875% Senior Notes due June 15, 2024 | 450,000 | 450,000 | |||||
Discount and deferred loan costs | (31,693 | ) | (31,321 | ) | |||
Total | $ | 1,168,307 | $ | 868,679 | |||
In May 2016, TRI Pointe Group issued $300 million aggregate principal amount of 4.875% Senior Notes due 2021 (the "2021 Notes") at 99.44% of their aggregate principal amount. Net proceeds of this issuance were $293.9 million, after debt issuance costs and discounts. The 2021 Notes mature on July 1, 2021 and interest is paid semiannually in arrears on January 1 and July 1.
In connection with the Reorganization, TRI Pointe Group and TRI Pointe Homes became co-issuers of the 2019 Notes and the 2024 Notes. The 2019 Notes were issued at 98.89% of their aggregate principal amount and the 2024 Notes were issued at 98.15% of their aggregate principal amount. The net proceeds from the offering were $861.3 million, after debt issuance costs and discounts. The 2019 Notes and the 2024 Notes mature on June 15, 2019 and June 15, 2024, respectively. Interest is payable semiannually in arrears on June 15 and December 15.
As of December 31, 2016, no principal has been paid on the 2019 Notes, 2021 Notes and 2024 Notes (collectively, the “Senior Notes”), and there was $20.9 million of capitalized debt financing costs, included in senior notes, net on our consolidated balance sheet, that will amortize over the lives of the Senior Notes. Accrued interest related to the Senior Notes was $10.7 million and $1.9 million as of December 31, 2016 and 2015, respectively.
- 90 -
Unsecured Revolving Credit Facility
Unsecured revolving credit facility consisted of the following (in thousands):
December 31, 2016 | December 31, 2015 | ||||||
Unsecured revolving credit facility | $ | 200,000 | $ | 299,392 | |||
On April 28, 2016, the Company partially exercised the accordion feature under its existing unsecured revolving credit facility (the “Credit Facility”) to increase the total commitments under the Credit Facility to $625.0 million from $550.0 million. The Credit Facility matures on May 18, 2019, and contains a sublimit of $75.0 million for letters of credit. The Company may borrow under the Credit Facility in the ordinary course of business to fund its operations, including its land acquisition, land development and homebuilding activities. Borrowings under the Credit Facility will be governed by, among other things, a borrowing base. Interest rates on borrowings under the Credit Facility will be based on either a daily Eurocurrency base rate or a Eurocurrency rate, in either case, plus a spread ranging from 1.45% to 2.20%, depending on the Company’s leverage ratio. As of December 31, 2016, the outstanding balance under the Credit Facility was $200.0 million with an interest rate of 2.44% per annum and $420.7 million of availability after considering the borrowing base provisions and outstanding letters of credit. As of December 31, 2016 there was $2.1 million of capitalized debt financing costs, included in other assets on our consolidated balance sheet, related to the Credit Facility that will amortize over the life of the Credit Facility, maturing on May 18, 2019. Accrued interest related to the Credit Facility was $658,000 and $407,000 as of December 31, 2016 and 2015, respectively.
At December 31, 2016 and 2015, we had outstanding letters of credit of $4.3 million and $8.4 million, respectively. These letters of credit were issued to secure various financial obligations. We believe it is not probable that any outstanding letters of credit will be drawn upon.
Seller Financed Loans
Seller financed loans consisted of the following (in thousands):
December 31, 2016 | December 31, 2015 | ||||||
Seller financed loans | $ | 13,726 | $ | 2,434 | |||
Principal and interest payments on these loans are due at various maturity dates, including at the time individual homes associated with the acquired land are delivered. The seller financed loans accrue interest at a weighted average rate of 7.0% per annum, with interest calculated on a daily basis. A minimum principal payment of $8.1 million is due in June 2017 with any remaining unpaid balance due in June 2018. Accrued interest on these loans was $519,000 and $89,000 as of December 31, 2016 and 2015, respectively.
Interest Incurred
During the years ended December 31, 2016 and 2015, the Company incurred interest of $68.3 million and $61.0 million, respectively, related to all notes payable, Senior Notes and debt payable to Weyerhaeuser outstanding during the period. All interest incurred was capitalized to inventory for the years ended December 31, 2016 and 2015, respectively. Included in interest incurred was amortization of deferred financing and Senior Notes discount costs of $6.5 million and $5.4 million for the years ended December 31, 2016 and 2015, respectively. Accrued interest related to all outstanding debt at December 31, 2016 and 2015 was $11.6 million and $2.4 million, respectively.
Covenant Requirements
The Senior Notes contain covenants that restrict our ability to, among other things, create liens or other encumbrances, enter into sale and leaseback transactions, or merge or sell all or substantially all of our assets. These limitations are subject to a number of qualifications and exceptions.
Under the Credit Facility, the Company is required to comply with certain financial covenants, including but not limited to (i) a minimum consolidated tangible net worth; (ii) a maximum total leverage ratio; and (iii) a minimum interest coverage ratio. The Company was in compliance with all applicable financial covenants as of December 31, 2016 and December 31, 2015.
- 91 -
14. | Fair Value Disclosures |
Fair Value Measurements
ASC Topic 820, Fair Value Measurements and Disclosures, defines “fair value” as the price that would be received for selling an asset or paid to transfer a liability in an orderly transaction between market participants at measurement date and requires assets and liabilities carried at fair value to be classified and disclosed in the following three categories:
• | Level 1—Quoted prices for identical instruments in active markets |
• | Level 2—Quoted prices for similar instruments in active markets; quoted prices for identical or similar instruments in markets that are inactive; and model-derived valuations in which all significant inputs and significant value drivers are observable in active markets at measurement date |
• | Level 3—Valuations derived from techniques where one or more significant inputs or significant value drivers are unobservable in active markets at measurement date |
Fair Value of Financial Instruments
A summary of assets and liabilities at December 31, 2016 and 2015, related to our financial instruments, measured at fair value on a recurring basis, is set forth below (in thousands):
December 31, 2016 | December 31, 2015 | ||||||||||||||||
Hierarchy | Book Value | Fair Value | Book Value | Fair Value | |||||||||||||
Senior Notes (1) | Level 2 | $ | 1,189,180 | $ | 1,219,125 | $ | 889,054 | $ | 881,460 | ||||||||
Unsecured revolving credit facility (2) | Level 2 | $ | 200,000 | $ | 177,410 | $ | 299,392 | $ | 299,392 | ||||||||
Seller financed loans (3) | Level 2 | $ | 13,726 | $ | 13,189 | $ | 2,434 | $ | 2,368 | ||||||||
__________
(1) | The book value of the Senior Notes is net of discounts, excluding deferred loan costs of $20.9 million and $20.4 million as of December 31, 2016 and 2015, respectively. The estimated fair value of our Senior Notes at December 31, 2016 and 2015 is based on quoted market prices. |
(2) | The estimated fair value of the Credit Facility at December 31, 2016 is based on a treasury curve analysis. We believe that the carrying value of the Credit Facility approximated fair value at December 31, 2015. |
(3) | The estimated fair value of the seller financed loans at December 31, 2016 and 2015 is based on a treasury curve analysis. |
At December 31, 2016 and 2015, the carrying value of cash and cash equivalents and receivables approximated fair value.
Fair Value of Nonfinancial Assets
Nonfinancial assets include items such as real estate inventories and long-lived assets that are measured at fair value on a nonrecurring basis with events and circumstances indicating the carrying value is not recoverable. The following table presents impairment charges and the remaining net fair value for nonfinancial assets that were measured during the periods presented (in thousands):
Year Ended December 31, 2016 | Year Ended December 31, 2015 | ||||||||||||||
Impairment Charge | Fair Value Net of Impairment | Impairment Charge | Fair Value Net of Impairment | ||||||||||||
Real estate inventories (1) | $ | — | $ | — | $ | 1,167 | $ | 28,540 | |||||||
(1) | Fair value of real estate inventories, net of impairment charges represents only those assets whose carrying values were adjusted to fair value in the respective periods presented. The fair value of these real estate inventories impaired was determined based on recent offers received from outside third parties or actual contracts. |
15. | Commitments and Contingencies |
Legal Matters
- 92 -
Lawsuits, claims and proceedings have been and may be instituted or asserted against us in the normal course of business, including actions brought on behalf of various classes of claimants. We are also subject to local, state and federal laws and regulations related to land development activities, house construction standards, sales practices, employment practices, environmental protection and financial services. As a result, we are subject to periodic examinations or inquiry by agencies administering these laws and regulations.
We record a reserve for potential legal claims and regulatory matters when they are probable of occurring and a potential loss is reasonably estimable. We accrue for these matters based on facts and circumstances specific to each matter and revise these estimates when necessary. In view of the inherent difficulty of predicting outcomes of legal claims and related contingencies, we generally cannot predict their ultimate resolution, related timing or eventual loss. Accordingly, it is possible that the ultimate outcome of any matter, if in excess of a related accrual or if no accrual was made, could be material to our financial statements. For matters as to which the Company believes a loss is probable and reasonably estimable, we had legal reserves of $225,000 and $450,000 as of December 31, 2016 and 2015, respectively.
Warranty
Warranty reserves are accrued as home deliveries occur. Our warranty reserves on homes delivered will vary based on product type and geographic area and also depending on state and local laws. The warranty reserve is included in accrued expenses and other liabilities on our consolidated balance sheets and represents expected future costs based on our historical experience over previous years. Estimated warranty costs are charged to cost of home sales in the period in which the related home sales revenue is recognized.
We maintain general liability insurance designed to protect us against a portion of our risk of loss from warranty and construction defect-related claims. We also generally require our subcontractors and design professionals to indemnify us for liabilities arising from their work, subject to various limitations. However, such indemnity is significantly limited with respect to certain subcontractors that are added to our general liability insurance policy.
Our warranty reserve and related estimated insurance recoveries are based on actuarial analysis that uses our historical claim and expense data, as well as industry data to estimate these overall costs and related recoveries. Key assumptions used in developing these estimates include claim frequencies, severities and resolution patterns, which can occur over an extended period of time. These estimates are subject to variability due to the length of time between the delivery of a home to a homebuyer and when a warranty or construction defect claim is made, and the ultimate resolution of such claim; uncertainties regarding such claims relative to our markets and the types of product we build; and legal or regulatory actions and/or interpretations, among other factors. Due to the degree of judgment involved and the potential for variability in these underlying assumptions, our actual future costs could differ from those estimated. There can be no assurance that the terms and limitations of the limited warranty will be effective against claims made by homebuyers, that we will be able to renew our insurance coverage or renew it at reasonable rates, that we will not be liable for damages, cost of repairs, and/or the expense of litigation surrounding possible construction defects, soil subsidence or building related claims or that claims will not arise out of uninsurable events or circumstances not covered by insurance and not subject to effective indemnification agreements with certain subcontractors.
We also record expected recoveries from insurance carriers based on actual insurance claims made and actuarially determined amounts that depend on various factors, including, the above-described reserve estimates, our insurance policy coverage limits for the applicable policy years and historical recovery rates. Because of the inherent uncertainty and variability in these assumptions, our actual insurance recoveries could differ significantly from amounts currently estimated. Outstanding warranty insurance receivables were $46.9 million and $10.5 million as of December 31, 2016 and 2015, respectively. Warranty insurance receivables are recorded in receivables on the accompanying consolidated balance sheet.
Warranty reserves consisted of the following (in thousands):
Year Ended December 31, | |||||||||||
2016 | 2015 | 2014 | |||||||||
Warranty reserves, beginning of period | $ | 45,948 | $ | 33,270 | $ | 24,449 | |||||
Warranty reserves accrued | 12,712 | 16,557 | 11,659 | ||||||||
Liabilities assumed in the Merger | — | — | 7,481 | ||||||||
Adjustments to pre-existing reserves(1) | 36,826 | 7,451 | 199 | ||||||||
Warranty expenditures | (12,351 | ) | (11,330 | ) | (10,518 | ) | |||||
Warranty reserves, end of period | $ | 83,135 | $ | 45,948 | $ | 33,270 | |||||
- 93 -
__________
(1) | Included in this amount for 2016 is approximately $38.0 million of additional warranty liabilities estimated to be covered by our insurance policies that were adjusted to present the warranty reserves and related estimated warranty insurance receivable on a gross basis at December 31, 2016. Of the $38.0 million adjusted in the current year, approximately $36.5 million related to prior year estimated warranty insurance recoveries. For further details, see Note 6, Receivables, Net and Note 12, Accrued Expenses and Other Liabilities. |
Performance Bonds
We obtain surety bonds in the normal course of business with various municipalities and other government agencies to secure completion of certain infrastructure improvements of our projects. As of December 31, 2016 and December 31, 2015, the Company had outstanding surety bonds totaling $449.6 million and $414.1 million, respectively. If any such performance bonds or letters of credit are called, we would be obligated to reimburse the issuer of the performance bond or letter of credit. We do not believe that a material amount of any currently outstanding performance bonds or letters of credit will be called. Performance bonds do not have stated expiration dates. Rather, we are released from the performance bonds as the underlying performance is completed.
Operating Leases
Office Space, Buildings and Equipment
We lease certain property and equipment under non-cancelable operating leases. Office leases are for terms up to nine years and generally provide renewal options for terms up to an additional five years. In most cases, we expect that, in the normal course of business, leases that expire will be renewed or replaced by other leases. Equipment leases are typically for terms of three to four years. The future minimum rental payments under operating leases, which primarily consist of office leases having initial or remaining noncancellable lease terms in excess of one year, are as follows (in thousands):
2017 | $ | 6,875 | |
2018 | 5,611 | ||
2019 | 5,316 | ||
2020 | 5,223 | ||
2021 | 4,655 | ||
Thereafter | 5,027 | ||
$ | 32,707 | ||
For the years ended December 31, 2016, 2015 and 2014, rental expense was $6.4 million, $6.2 million and $4.9 million, respectively. Rental expense is included in general and administrative expenses on the consolidated statements of operations.
Ground Leases
In 1987, we obtained two 55-year ground leases of commercial property that provided for three renewal options of ten years each and one 45-year renewal option. We exercised the three ten year extensions on one of these ground leases extending the lease through 2071. The commercial buildings on these properties have been sold and the ground leases have been sublet to the buyers.
For one of these leases, we are responsible for making lease payments to the land owner, and we collect sublease payments from the buyers of the buildings. Our lease commitments under this ground lease, which extends through 2071, were (in thousands):
- 94 -
2017 | $ | 2,239 | |
2018 | 2,239 | ||
2019 | 2,239 | ||
2020 | 2,239 | ||
2021 | 2,239 | ||
Thereafter | 74,992 | ||
$ | 86,187 | ||
This ground lease has been subleased through 2041 to the buyers of the commercial buildings. Our lease commitments through 2041 total $56.0 million as of December 31, 2016, and are fully offset by sublease receipts under the noncancellable subleases.
For the second lease, the buyers of the buildings are responsible for making lease payments directly to the land owner. However, we have guaranteed the performance of the buyers/lessees. As of December 31, 2016, guaranteed future payments on the lease, which expires in 2041, were $10.6 million.
Purchase Obligations
In the ordinary course of business, we enter into land option contracts in order to procure lots for the construction of our homes. We are subject to customary obligations associated with entering into contracts for the purchase of land and improved lots. These purchase contracts typically require a cash deposit and the purchase of properties under these contracts is generally contingent upon satisfaction of certain requirements by the sellers, including obtaining applicable property and development entitlements. We also utilize option contracts with land sellers as a method of acquiring land in staged takedowns, to help us manage the financial and market risk associated with land holdings, and to reduce the use of funds from our corporate financing sources. Option contracts generally require a non-refundable deposit for the right to acquire lots over a specified period of time at pre-determined prices. We generally have the right at our discretion to terminate our obligations under both purchase contracts and option contracts by forfeiting our cash deposit with no further financial responsibility to the land seller. As of December 31, 2016, we had $26.6 million of non-refundable cash deposits pertaining to land option contracts and purchase contracts with an aggregate remaining purchase price of approximately $313.6 million (net of deposits).
Our utilization of land option contracts is dependent on, among other things, the availability of land sellers willing to enter into option takedown arrangements, the availability of capital to financial intermediaries to finance the development of optioned lots, general housing market conditions, and local market dynamics. Options may be more difficult to procure from land sellers in strong housing markets and are more prevalent in certain geographic regions.
16. | Stock-Based Compensation |
2013 Long-Term Incentive Plan
The Company’s stock compensation plan, the 2013 Long-Term Incentive Plan (the “2013 Incentive Plan”), was adopted by legacy TRI Pointe in January 2013 and amended with the approval of our stockholders in 2014. The 2013 Incentive Plan provides for the grant of equity-based awards, including options to purchase shares of common stock, stock appreciation rights, common stock, restricted stock, restricted stock units and performance awards. The 2013 Incentive Plan will automatically expire on the tenth anniversary of its effective date. Our board of directors may terminate or amend the 2013 Incentive Plan at any time, subject to any requirement of stockholder approval required by applicable law, rule or regulation.
As amended, the number of shares of our common stock that may be issued under the 2013 Incentive Plan is 11,727,833 shares. To the extent that shares of our common stock subject to an outstanding option, stock appreciation right, stock award or performance award granted under the 2013 Incentive Plan are not issued or delivered by reason of the expiration, termination, cancellation or forfeiture of such award or the settlement of such award in cash, then such shares of our common stock generally shall again be available under the 2013 Incentive Plan. As of December 31, 2016 there were 7,605,118 shares available for future grant under the 2013 Incentive Plan.
Converted Awards
Under the Transaction Agreement, each outstanding Weyerhaeuser equity award held by an employee of WRECO was converted into a similar equity award with TRI Pointe, based on the final exchange ratio of 2.1107 (the “Exchange Ratio”),
- 95 -
rounded down to the nearest whole number of shares of common stock. The Company filed a registration statement on Form S-8 (Registration No. 333-197461) on July 16, 2014 to register 4,105,953 shares related to these equity awards. The converted awards have the same terms and conditions as the Weyerhaeuser equity awards except that all performance share units were surrendered in exchange for time-vesting restricted stock units without any performance-based vesting conditions or requirements and the exercise price of each converted stock option is equal to the original exercise price divided by the Exchange Ratio. There will be no future grants under the WRECO equity incentive plans.
The fair value of stock option awards assumed in the Merger was determined by using an option-based model with the following assumptions:
2014 Grants | 2013 Grants | 2012 Grants | 2011 Grants | ||||||||
Dividend yield | 2.92 | % | 2.23 | % | 2.94 | % | 2.48 | % | |||
Expected volatility | 31.71 | % | 38.00 | % | 40.41 | % | 38.56 | % | |||
Risk-free interest rate | 1.57 | % | 0.92 | % | 1.01 | % | 2.65 | % | |||
Expected life (in years) | 4.97 | 4.97 | 5.33 | 5.73 | |||||||
The following table presents compensation expense recognized related to all stock-based awards (in thousands):
Year Ended December 31, | |||||||||||
2016 | 2015 | 2014 | |||||||||
Total stock-based compensation | $ | 12,612 | $ | 11,935 | $ | 7,679 | |||||
As of December 31, 2016, total unrecognized stock-based compensation related to all stock-based awards was $17.0 million and the weighted average term over which the expense was expected to be recognized was 1.72 years.
Summary of Stock Option Activity
The following table presents a summary of stock option awards for the year ended December 31, 2016:
Options | Weighted Average Exercise Price Per Share | Weighted Average Remaining Contractual Life | Aggregate Intrinsic Value (in thousands) | ||||||||||
Options outstanding at December 31, 2015 | 3,220,147 | $ | 13.12 | 5.2 | $ | 3,081 | |||||||
Granted | — | — | — | — | |||||||||
Exercised | (96,572 | ) | 9.47 | ||||||||||
Forfeited | (152,205 | ) | 12.39 | ||||||||||
Options outstanding at December 31, 2016 | 2,971,370 | $ | 13.12 | 4.4 | $ | 1,568 | |||||||
Options exercisable at December 31, 2016 | 2,599,661 | $ | 13.08 | 4.0 | $ | 1,568 | |||||||
The total intrinsic value of stock option awards exercised during the years ended December 31, 2016, 2015 and 2014 was $324,000, $642,000 and $51,000, respectively. The total grant date fair value of stock option awards granted or assumed during the years ended December 31, 2016, 2015 and 2014 were $0.0, $0.0 and $11.8 million, respectively.
The fair value of stock option awards granted under the 2013 Incentive Plan at legacy TRI Pointe during the years ended December 31, 2016, 2015 and 2014 were established at the date of grant using an option based model with the following assumptions:
2016 Grants | 2015 Grants | 2014 Grants | ||||
Dividend yield | N/A | N/A | — | % | ||
Expected volatility | N/A | N/A | 63.01 | % | ||
Risk-free interest rate | N/A | N/A | 1.96 | % | ||
Expected life (in years) | N/A | N/A | 6.00 | |||
- 96 -
Summary of Restricted Stock Unit Activity
The following table presents a summary of restricted stock units (“RSUs”) for the year ended December 31, 2016:
Restricted Stock Units | Weighted Average Grant Date Fair Value Per Share | Aggregate Intrinsic Value (in thousands) | ||||||||
Nonvested RSUs at December 31, 2015 | 1,958,033 | $ | 12.21 | $ | 24,808 | |||||
Granted | 1,904,389 | 8.41 | 21,862 | |||||||
Vested | (431,761 | ) | 14.53 | |||||||
Forfeited | (17,942 | ) | 12.13 | |||||||
Nonvested RSUs at December 31, 2016 | 3,412,719 | $ | 9.77 | $ | 39,178 | |||||
The total intrinsic value of restricted stock units that vested during the years ended December 31, 2016, 2015 and 2014 was $4.6 million, $6.8 million and $1.0 million, respectively. The total grant date fair value of restricted stock awards granted or assumed during the years ended December 31, 2016, 2015 and 2014 were $21.8 million, $18.3 million and $15.2 million, respectively.
On March 5, 2015, the Company granted an aggregate of 440,800 restricted stock units to employees and officers. The restricted stock units granted vest annually on the anniversary of the grant date over a three year period. The fair value of each restricted stock award granted on March 5, 2015 was measured using a price of $14.97 per share, which was the closing stock price on the date of grant. Each award will be expensed on a straight-line basis over the vesting period.
On March 9, 2015, the Company granted 411,804, 384,351, and 274,536 performance-based RSUs to the Company’s Chief Executive Officer, President, and Chief Financial Officer, respectively, with 1/3 of the performance-based RSU amounts being allocated to each of the three following separate performance goals: total stockholder return (compared to a group of similarly sized homebuilders); earnings per share; and stock price. The performance-based restricted stock units granted will vest in each case, if at all, based on the percentage of attainment of the applicable performance goal. The performance periods for the performance-based RSUs with vesting based on total stockholder return and earnings per share are January 1, 2015 to December 31, 2017. The performance period for the performance-based RSUs with vesting based on stock price is January 1, 2016 to December 31, 2017. The fair value of the performance-based RSUs related to the total stockholder return and stock price performance goals was determined to be $7.55 and $7.90 per share, respectively, based on a Monte Carlo simulation. The fair value of the performance-based RSUs related to the earnings per share goal was measured using a price of $14.57 per share, which was the closing stock price on the date of grant. Each grant will be expensed on a straight-line basis over the expected vesting period.
On August 12, 2015, the Company granted an aggregate of 69,008 restricted stock units to members of its board of directors. The restricted stock units granted to directors on August 12, 2015 vested in their entirety on the day immediately prior to the Company’s 2016 Annual Meeting of Stockholders. The fair value of each restricted stock award granted on August 12, 2015 was measured using $14.49 per share, which was the closing price on the date of grant. Each award is expensed on a straight-line basis over the vesting period.
On March 1, 2016, the Company granted an aggregate of 1,120,677 time-vested RSUs to employees and officers. The RSUs granted vest in equal installments annually on the anniversary of the grant date over a three year period. The fair value of each RSU granted on March 1, 2016 was measured using a price of $10.49 per share, which was the closing stock price on the date of grant. Each award will be expensed on a straight-line basis over the vesting period.
On March 1, 2016, the Company granted 297,426, 285,986 and 125,834 performance-based RSUs to the Company’s Chief Executive Officer, President, and Chief Financial Officer, respectively. The vesting, if at all, of these performance-based RSUs may range from 0% to 100% and will be based on the Company’s percentage attainment of specified threshold, target and maximum performance goals. The percentage of these performance-based RSUs that vest will be determined by comparing the Company’s total stockholder return to the total stockholder returns of a group of peer homebuilding companies. The performance period for these performance-based RSUs is January 1, 2016 to December 31, 2018. These performance-based RSUs will not vest if the Company’s total stockholder return from January 1, 2016 to December 31, 2018 is not a positive number, provided that the executive will thereafter become vested in the award units, or portion thereof, that would have otherwise vested on December 31, 2018 if on any day after December 31, 2018 and on or before December 31, 2020, the Company’s total stockholder return is greater than zero and the executive is employed by the Company on that date. If the performance-based RSUs have not vested on or before December 31, 2020, such performance-based RSUs shall be cancelled
- 97 -
and forfeited for no consideration. The fair value of these performance-based RSUs was determined to be $4.76 per share based on a Monte Carlo simulation. Each award will be expensed over the requisite service period.
On June 6, 2016, the Company granted an aggregate of 74,466 RSUs to the non-employee members of its board of directors. These RSUs will vest in their entirety on the day immediately prior to the Company's 2017 Annual Meeting of Stockholders. The fair value of each RSU granted on June 6, 2016 was measured using a price of $11.75 per share, which was the closing stock price on the date of grant. Each award will be expensed on a straight-line basis over the vesting period.
As restricted stock units vest, a portion of the shares awarded is generally withheld to cover employee minimum tax withholdings. As a result, the number of restricted stock units vested and the number of shares of TRI Pointe common stock issued will differ.
17. | Income Taxes |
The provision for income tax attributable to income before income taxes consisted of (in thousands):
Year Ended December 31, | |||||||||||
2016 | 2015 | 2014 | |||||||||
Current: | |||||||||||
Federal | $ | 90,387 | $ | 91,343 | $ | (109,565 | ) | ||||
State | 8,744 | 6,715 | 5,339 | ||||||||
Total current taxes | 99,131 | 98,058 | (104,226 | ) | |||||||
Deferred: | |||||||||||
Federal | 5,749 | 8,296 | 147,797 | ||||||||
State | 1,214 | 5,725 | 196 | ||||||||
Total deferred taxes | 6,963 | 14,021 | 147,993 | ||||||||
Total income tax expense | $ | 106,094 | $ | 112,079 | $ | 43,767 | |||||
The Company’s provision for income taxes was different from the amount computed by applying the statutory federal income tax rate of 35% to the underlying income before income taxes as a result of the following (in thousands):
Year Ended December 31, | |||||||||||
2016 | 2015 | 2014 | |||||||||
Taxes at the U.S. federal statutory rate | $ | 105,779 | $ | 111,846 | $ | 44,788 | |||||
State income taxes, net of federal tax impact | 9,539 | 9,627 | 3,822 | ||||||||
Tax loss on the sale of WRI | — | — | (5,786 | ) | |||||||
Non-deductible transaction costs | 305 | — | 2,594 | ||||||||
Change in valuation allowance | (4,038 | ) | (1,872 | ) | — | ||||||
Other, net | (5,491 | ) | (7,522 | ) | (1,651 | ) | |||||
Total income tax expense | $ | 106,094 | $ | 112,079 | $ | 43,767 | |||||
Effective income tax rate | 35.1 | % | 35.1 | % | 34.2 | % | |||||
Deferred taxes consisted of the following at December 31, 2016 and 2015 (in thousands):
- 98 -
Year Ended December 31, | |||||||
2016 | 2015 | ||||||
Deferred tax assets: | |||||||
Impairment and other valuation reserves | $ | 73,890 | $ | 89,057 | |||
Incentive compensation | 8,322 | 3,617 | |||||
Indirect costs capitalized | 25,377 | 20,266 | |||||
Net operating loss carryforwards (state) | 24,583 | 29,461 | |||||
Transaction costs | (924 | ) | (833 | ) | |||
State taxes | 2,985 | 2,903 | |||||
Other costs and expenses | 15,214 | 13,641 | |||||
Gross deferred tax assets | 149,447 | 158,112 | |||||
Valuation allowance | (323 | ) | (4,361 | ) | |||
Deferred tax assets, net of valuation allowance | 149,124 | 153,751 | |||||
Deferred tax liabilities: | |||||||
Interest capitalized | (814 | ) | 268 | ||||
Basis difference in inventory | (14,186 | ) | (14,128 | ) | |||
Fixed assets | (1,101 | ) | 1,274 | ||||
Intangibles | (8,456 | ) | (9,015 | ) | |||
Other | (1,344 | ) | (1,493 | ) | |||
Deferred tax liabilities | (25,901 | ) | (23,094 | ) | |||
Net deferred tax assets | $ | 123,223 | $ | 130,657 | |||
The Company accounts for income taxes in accordance with ASC 740, which requires an asset and liability approach for measuring deferred taxes based on temporary differences between the financial statements and tax bases of assets and liabilities using enacted tax rates for the years in which taxes are expected to be paid or recovered. Each quarter we assess our deferred tax asset to determine whether all or any portion of the asset is more likely than not unrealizable under ASC 740. We are required to establish a valuation allowance for any portion of the asset we conclude is more likely than not to be unrealizable. Our assessment considers, among other things, the nature, frequency and severity of our current and cumulative losses, forecasts of our future taxable income, the duration of statutory carryforward periods and tax planning alternatives.
As of December 31, 2016, the Company had a state net operating loss carryforward of $460.9 million, which will expire between 2017 and 2034. As of December 31, 2016 and 2015, we had a valuation allowance on our deferred tax assets of $323,000 and $4.4 million, respectively, related to certain federal and state net operating loss carryforwards as the tax benefits from those losses were assessed as being not more likely than not to be realized. The decrease in the valuation allowance in 2016 is due to a release of the valuation allowance against a portion of our state net operating loss carryovers as we have determined that realization of tax benefits for the losses are now more likely than not to occur.
The Company will continue to evaluate both positive and negative evidence in determining the need for a valuation allowance against its deferred tax assets. Changes in positive and negative evidence, including differences between the Company’s future operating results and the estimates utilized in the determination of the valuation allowance, could result in changes in the Company’s estimate of the valuation allowance against its deferred tax assets. The accounting for deferred taxes is based upon estimates of future results. Differences between the anticipated and actual outcomes of these future results could have a material impact on the Company’s consolidated results of operations or financial position. Also, changes in existing federal and state tax laws and tax rates could affect future tax results and the valuation allowance against the Company’s deferred tax assets.
Unrecognized tax benefits represent potential future obligations to taxing authorities if uncertain tax positions we have taken on previously filed tax returns are not sustained. These amounts represent the gross amount of exposure in individual jurisdictions and do not reflect any additional benefits expected to be realized if such positions were not sustained, such as federal deduction that could be realized if an unrecognized state deduction was not sustained.
- 99 -
The Company files income tax returns in the U.S., including federal and multiple state and local jurisdictions. The Company’s tax years 2012-2016 will remain open to examination by the federal and state authorities for three and four years, respectively, from the date of utilization of any net operating loss or credit carryforwards.
The following table summarizes the activity related to the Company’s gross unrecognized tax benefits (in thousands):
Year Ended December 31, | |||||||
2016 | 2015 | ||||||
Balance at beginning of year | $ | 272 | $ | 14,857 | |||
Decreases related to prior year tax positions | (272 | ) | (1,706 | ) | |||
Decreases related to current year tax positions | — | (12,879 | ) | ||||
Balance at end of year | $ | — | $ | 272 | |||
The Company classifies interest and penalties related to income taxes as part of income tax expense. Accrued interest and penalties are included within the related liabilities in the balance sheet. The Company had no unpaid interest as a result of uncertain tax position as of December 31, 2016, and $35,000 as of December 31, 2015.
As a result of the Merger in fiscal 2014, the Company separated from its former parent. The Company’s income tax expense for the period prior to the Merger reflected taxes calculated pursuant to the tax sharing agreement with the former parent. If we were to calculate income taxes using the separate return method, the effect on pro forma unaudited income and pro forma unaudited earnings per share would be as follows (in thousands, except per share amounts):
Year Ended December 31, | |||||||||||
2016 | 2015 | 2014 | |||||||||
(unaudited) | (unaudited) | (unaudited) | |||||||||
Income before income taxes as reported in the accompanying financial statements | $ | 302,227 | $ | 319,260 | $ | 127,964 | |||||
Provision for income taxes assuming computation on a separate return basis | (106,094 | ) | (112,079 | ) | (49,553 | ) | |||||
Pro forma income | 196,133 | 207,181 | 78,411 | ||||||||
Net income attributable to noncontrolling interests | (962 | ) | (1,720 | ) | — | ||||||
Pro forma net income available to common stockholders | $ | 195,171 | $ | 205,461 | $ | 78,411 | |||||
Pro forma earnings per share - basic | $ | 1.21 | $ | 1.27 | $ | 0.54 | |||||
Pro forma earnings per share - diluted | $ | 1.21 | $ | 1.27 | $ | 0.54 | |||||
Based upon calculating income tax expense on a separate return basis, our income tax provision would have increased by $5.8 million for the year ended December 31, 2014 related to the tax loss on the sale of Weyerhaeuser Realty Investors, Inc. to Weyerhaeuser NR Company that would not have provided a benefit to our income tax provision. There would be no change to our income tax provision for the years ended December 31, 2016 and 2015.
Refer to Note 18, Related Party Transactions, for a description of the tax sharing agreement between TRI Pointe and Weyerhaeuser.
18. | Related Party Transactions |
Prior to the Merger, WRECO was a wholly owned subsidiary of Weyerhaeuser. Weyerhaeuser provided certain services including payroll processing and related employee benefits, other corporate services such as corporate governance, cash management and other treasury services, administrative services such as government relations, tax, internal audit, legal, accounting, human resources and equity-based compensation plan administration, lease of office space, aviation services and insurance coverage. WRECO was allocated a portion of Weyerhaeuser corporate general and administrative costs on either a proportional cost or usage basis.
Weyerhaeuser-allocated corporate general and administrative expenses were as follows (in thousands):
- 100 -
Year Ended December 31, | |||||||||||
2016 | 2015 | 2014 | |||||||||
Weyerhaeuser-allocated costs | $ | — | $ | — | $ | 10,735 | |||||
These expenses may not be indicative of the actual level of expense WRECO would have incurred if it had operated as an independent company or of expenses expected to be incurred in the future after the Closing Date.
During the year ended December 31, 2014 and prior to the Merger, WRECO sold $4.8 million of mineral rights and $21.2 million of land to Weyerhaeuser.
TRI Pointe has certain liabilities with Weyerhaeuser related to a tax sharing agreement executed in connection with the Merger. The liabilities under the tax sharing agreement relate to a portion of the California net operating loss generated prior to the Merger that are expected to be realized after July 7, 2014; federal tax credits generated prior to the Merger that are expected to be realized after July 7, 2014; and deductions for stock option awards granted through December 31, 2013 that are expected to be realized after July 7, 2014. As of December 31, 2016 and 2015, we had an income tax liability to Weyerhaeuser of $8.6 million and $8.9 million, respectively, which is recorded in accrued expenses and other liabilities on the accompanying balance sheet.
In May of 2016, TRI Pointe entered into an agreement with an affiliate of Starwood Capital Group, a greater than 5% holder of our common stock, to acquire 52 lots located in Azusa, California, for a purchase price of $18.4 million. In October of 2016 we acquired 27 of these lots for a purchase price of $9.6 million. TRI Pointe's Chairman of the Board is also the Chairman and Chief Executive Officer of Starwood Capital Group. This acquisition was approved by the TRI Pointe independent directors.
In June of 2014, TRI Pointe acquired 46 lots located in Castle Rock, Colorado, for a purchase price of approximately $2.7 million from an entity managed by an affiliate of Starwood Capital Group. In January of 2015, TRI Pointe acquired an additional 46 lots located in Castle Rock, Colorado, for a purchase price of approximately $2.8 million. In August of 2016, TRI Pointe entered into an agreement to purchase an additional 257 lots located in Castle Rock, Colorado, for a purchase price of approximately $8.6 million from the same entity managed by an affiliate of Starwood Capital Group. In October of 2016, 126 of these lots were acquired for a purchase price of $4.2 million. These acquisitions were approved by the TRI Pointe independent directors.
In October of 2015, TRI Pointe entered into an agreement with an affiliate of BlackRock, Inc. to acquire 161 lots located in Dublin, California, for a purchase price of approximately $60.0 million. BlackRock, Inc. is a greater than 5% holder of our common stock. This acquisition was approved by the executive land committee, which was comprised of independent directors. In the second half of 2016, we acquired an additional 93 lots located in Dublin, California, for a combined purchase price of approximately $25.5 million from an affiliate of BlackRock, Inc. This acquisition was approved by a majority of the TRI Pointe independent directors.
19. | Supplemental Disclosure to Consolidated Statement of Cash Flow |
The following are supplemental disclosures to the consolidated statements of cash flows (in thousands):
- 101 -
Year Ended December 31, | |||||||||||
2016 | 2015 | 2014 | |||||||||
Supplemental disclosure of cash flow information: | |||||||||||
Cash paid during the period for: | |||||||||||
Interest, net of amounts capitalized of $53,028, $60,964 and $38,975 | $ | — | $ | — | $ | 1,372 | |||||
Income taxes | $ | 117,215 | $ | 69,917 | $ | 43,005 | |||||
Supplemental disclosures of noncash activities: | |||||||||||
Increase in real estate inventory due to distribution of land from an unconsolidated joint venture | $ | — | $ | — | $ | 5,052 | |||||
Distribution to Weyerhaeuser of excluded assets and liabilities | $ | — | $ | — | $ | 126,687 | |||||
Amounts owed to Weyerhaeuser related to the tax sharing agreement | $ | — | $ | — | $ | 15,688 | |||||
Noncash settlement of debt payable to Weyerhaeuser | $ | — | $ | — | $ | 70,082 | |||||
Accrued liabilities related to the purchase of operating properties and equipment | $ | 1,828 | $ | 3,976 | $ | — | |||||
Amortization of senior note discount capitalized to real estate inventory | $ | 1,815 | $ | 1,552 | $ | 804 | |||||
Amortization of deferred loan costs capitalized to real estate inventory | $ | 4,642 | $ | 3,820 | $ | — | |||||
Effect of net consolidation and de-consolidation of variable interest entities: | |||||||||||
(Decrease) increase in consolidated real estate inventory not owned | $ | (316 | ) | $ | 5,297 | $ | 6,343 | ||||
Increase in deposits on real estate under option or contract and other assets | $ | — | $ | — | $ | 780 | |||||
Increase in accrued expenses and other liabilities | $ | — | $ | 300 | $ | — | |||||
Increase (decrease) in noncontrolling interests | $ | 316 | $ | (5,597 | ) | $ | (7,123 | ) | |||
Merger: | |||||||||||
Fair value of assets, excluding cash acquired | $ | — | $ | — | $ | 724,995 | |||||
Liabilities assumed | $ | — | $ | — | $ | (276,347 | ) | ||||
20. | Supplemental Guarantor Information |
2021 Notes
On May 26, 2016, TRI Pointe Group issued the 2021 Notes. All of TRI Pointe Group’s 100% owned subsidiaries that are guarantors (each a “Guarantor” and, collectively, the “Guarantors”) of the Company’s Credit Facility, including TRI Pointe Homes and certain other of its 100% owned subsidiaries, are party to a supplemental indenture pursuant to which they jointly and severally guarantee TRI Pointe Group’s obligations with respect to the 2021 Notes. Each Guarantor of the 2021 Notes is 100% owned by TRI Pointe Group, and all guarantees are full and unconditional, subject to customary exceptions pursuant to the indentures governing the 2021 Notes, as described in the following paragraph. All of our non-Guarantor subsidiaries have nominal assets and operations and are considered minor, as defined in Rule 3-10(h) of Regulation S-X. In addition, TRI Pointe Group has no independent assets or operations, as defined in Rule 3-10(h) of Regulation S-X. There are no significant restrictions upon the ability of TRI Pointe Group or any Guarantor to obtain funds from any of their respective wholly owned subsidiaries by dividend or loan. None of the assets of our subsidiaries represent restricted net assets pursuant to Rule 4-08(e)(3) of Regulation S-X.
A Guarantor of the 2021 Notes shall be released from all of its obligations under its guarantee if (i) all of the assets of the Guarantor have been sold; (ii) all of the equity interests of the Guarantor held by TRI Pointe Group or a subsidiary thereof have been sold; (iii) the Guarantor merges with and into TRI Pointe Group or another Guarantor, with TRI Pointe Group or such other Guarantor surviving the merger; (iv) the Guarantor is designated “unrestricted” for covenant purposes; (v) the Guarantor ceases to guarantee any indebtedness of TRI Pointe Group or any other Guarantor which gave rise to such Guarantor guaranteeing the 2021 Notes; (vi) TRI Pointe Group exercises its legal defeasance or covenant defeasance options; or (vii) all obligations under the applicable supplemental indenture are discharged.
- 102 -
2019 Notes and 2024 Notes
TRI Pointe Group and TRI Pointe Homes are co-issuers of the 2019 Notes and the 2024 Notes. All of the Guarantors (other than TRI Pointe Homes) have entered into supplemental indentures pursuant to which they jointly and severally guarantee the obligations of TRI Pointe Group and TRI Pointe Homes with respect to the 2019 Notes and the 2024 Notes. Each Guarantor of the 2019 Notes and the 2024 Notes is 100% owned by TRI Pointe Group and TRI Pointe Homes, and all guarantees are full and unconditional, subject to customary exceptions pursuant to the indentures governing the 2019 Notes and the 2024 Notes, as described below.
A Guarantor of the 2019 Notes and the 2024 Notes shall be released from all of its obligations under its guarantee if (i) all of the assets of the Guarantor have been sold; (ii) all of the equity interests of the Guarantor held by TRI Pointe or a subsidiary thereof have been sold; (iii) the Guarantor merges with and into TRI Pointe or another Guarantor, with TRI Pointe or such other Guarantor surviving the merger; (iv) the Guarantor is designated “unrestricted” for covenant purposes; (v) the Guarantor ceases to guarantee any indebtedness of TRI Pointe or any other Guarantor which gave rise to such Guarantor guaranteeing the 2019 Notes and 2024 Notes; (vi) TRI Pointe exercises its legal defeasance or covenant defeasance options; or (vii) all obligations under the applicable indenture are discharged.
Presented below are the condensed consolidating balance sheets at December 31, 2016 and December 31, 2015, condensed consolidating statements of operations for the full years ended December 31, 2016, 2015 and 2014, and condensed consolidating statements of cash flows for the full years ended December 31, 2016, 2015 and 2014. Because TRI Pointe’s non-Guarantor subsidiaries are considered minor, as defined in Rule 3-10(h) of Regulation S-X, the non-Guarantor subsidiaries’ information is not separately presented in the tables below, but is included with the Guarantors. Additionally, because TRI Pointe Group has no independent assets or operations, as defined in Rule 3-10(h) of Regulation S-X, the condensed consolidated financial information of TRI Pointe Group and TRI Pointe Homes, the co-issuers of the 2019 Notes and 2024 Notes, is presented together in the column titled “Issuer” for all periods presented after July 7, 2015, the date of the Reorganization.
- 103 -
Condensed Consolidating Balance Sheet (in thousands):
December 31, 2016 | |||||||||||||||
Issuer (1) | Guarantor Subsidiaries | Consolidating Adjustments | Consolidated TRI Pointe Group, Inc. | ||||||||||||
Assets | |||||||||||||||
Cash and cash equivalents | $ | 141,568 | $ | 67,089 | $ | — | $ | 208,657 | |||||||
Receivables | 26,692 | 55,808 | — | 82,500 | |||||||||||
Intercompany receivables | 775,321 | — | (775,321 | ) | — | ||||||||||
Real estate inventories | 868,088 | 2,042,539 | — | 2,910,627 | |||||||||||
Investments in unconsolidated entities | — | 17,546 | — | 17,546 | |||||||||||
Goodwill and other intangible assets, net | 156,604 | 4,891 | — | 161,495 | |||||||||||
Investments in subsidiaries | 1,285,295 | — | (1,285,295 | ) | — | ||||||||||
Deferred tax assets, net | 15,644 | 107,579 | — | 123,223 | |||||||||||
Other assets | 11,401 | 49,191 | — | 60,592 | |||||||||||
Total Assets | $ | 3,280,613 | $ | 2,344,643 | $ | (2,060,616 | ) | $ | 3,564,640 | ||||||
Liabilities | |||||||||||||||
Accounts payable | $ | 20,637 | $ | 49,615 | $ | — | $ | 70,252 | |||||||
Intercompany payables | — | 775,321 | (775,321 | ) | — | ||||||||||
Accrued expenses and other liabilities | 48,496 | 215,349 | — | 263,845 | |||||||||||
Unsecured revolving credit facility | 200,000 | — | — | 200,000 | |||||||||||
Seller financed loans | 13,726 | — | — | 13,726 | |||||||||||
Senior notes, net | 1,168,307 | — | — | 1,168,307 | |||||||||||
Total Liabilities | 1,451,166 | 1,040,285 | (775,321 | ) | 1,716,130 | ||||||||||
Equity | |||||||||||||||
Total stockholders’ equity | 1,829,447 | 1,285,295 | (1,285,295 | ) | 1,829,447 | ||||||||||
Noncontrolling interests | — | 19,063 | — | 19,063 | |||||||||||
Total Equity | 1,829,447 | 1,304,358 | (1,285,295 | ) | 1,848,510 | ||||||||||
Total Liabilities and Equity | $ | 3,280,613 | $ | 2,344,643 | $ | (2,060,616 | ) | $ | 3,564,640 | ||||||
__________
(1) | References to “Issuer” in Note 20, Supplemental Guarantor Information have the following meanings: |
a. | for periods prior to July 7, 2015: TRI Pointe Homes only |
b. | for periods from and after July 7, 2015: TRI Pointe Homes and TRI Pointe Group as co-issuers |
- 104 -
Condensed Consolidating Balance Sheet (in thousands):
December 31, 2015 | |||||||||||||||
Issuer (1) | Guarantor Subsidiaries | Consolidating Adjustments | Consolidated TRI Pointe Homes, Inc. | ||||||||||||
Assets | |||||||||||||||
Cash and cash equivalents | $ | 147,771 | $ | 66,714 | $ | — | $ | 214,485 | |||||||
Receivables | 17,358 | 26,352 | — | 43,710 | |||||||||||
Intercompany receivables | 783,956 | — | (783,956 | ) | — | ||||||||||
Real estate inventories | 657,221 | 1,862,052 | — | 2,519,273 | |||||||||||
Investments in unconsolidated entities | — | 18,999 | — | 18,999 | |||||||||||
Goodwill and other intangible assets, net | 156,604 | 5,425 | — | 162,029 | |||||||||||
Investments in subsidiaries | 1,093,261 | — | (1,093,261 | ) | — | ||||||||||
Deferred tax assets, net | 19,061 | 111,596 | — | 130,657 | |||||||||||
Other assets | 12,219 | 36,699 | — | 48,918 | |||||||||||
Total Assets | $ | 2,887,451 | $ | 2,127,837 | $ | (1,877,217 | ) | $ | 3,138,071 | ||||||
Liabilities | |||||||||||||||
Accounts payable | $ | 20,444 | $ | 44,396 | $ | — | $ | 64,840 | |||||||
Intercompany payables | — | 783,956 | (783,956 | ) | — | ||||||||||
Accrued expenses and other liabilities | 32,219 | 184,044 | — | 216,263 | |||||||||||
Unsecured revolving credit facility | 299,392 | — | — | 299,392 | |||||||||||
Seller financed loans | 2,034 | 400 | — | 2,434 | |||||||||||
Senior notes, net | 868,679 | — | — | 868,679 | |||||||||||
Total Liabilities | 1,222,768 | 1,012,796 | (783,956 | ) | 1,451,608 | ||||||||||
Equity | |||||||||||||||
Total stockholders’ equity | 1,664,683 | 1,093,261 | (1,093,261 | ) | 1,664,683 | ||||||||||
Noncontrolling interests | — | 21,780 | — | 21,780 | |||||||||||
Total Equity | 1,664,683 | 1,115,041 | (1,093,261 | ) | 1,686,463 | ||||||||||
Total Liabilities and Equity | $ | 2,887,451 | $ | 2,127,837 | $ | (1,877,217 | ) | $ | 3,138,071 | ||||||
__________
(1) | References to “Issuer” in Note 20, Supplemental Guarantor Information have the following meanings: |
a. | for periods prior to July 7, 2015: TRI Pointe Homes only |
b. | for periods from and after July 7, 2015: TRI Pointe Homes and TRI Pointe Group as co-issuers |
- 105 -
Condensed Consolidating Statement of Operations (in thousands):
Year Ended December 31, 2016 | |||||||||||||||
Issuer (1) | Guarantor Subsidiaries | Consolidating Adjustments | Consolidated TRI Pointe Group, Inc. | ||||||||||||
Homebuilding: | |||||||||||||||
Home sales revenue | $ | 723,186 | $ | 1,606,150 | $ | — | $ | 2,329,336 | |||||||
Land and lot sales revenue | — | 72,272 | — | 72,272 | |||||||||||
Other operations revenue | — | 2,314 | — | 2,314 | |||||||||||
Total revenues | 723,186 | 1,680,736 | — | 2,403,922 | |||||||||||
Cost of home sales | 607,316 | 1,229,011 | — | 1,836,327 | |||||||||||
Cost of land and lot sales | — | 17,367 | — | 17,367 | |||||||||||
Other operations expense | — | 2,247 | — | 2,247 | |||||||||||
Sales and marketing | 29,092 | 98,811 | — | 127,903 | |||||||||||
General and administrative | 59,327 | 64,143 | — | 123,470 | |||||||||||
Restructuring charges | — | 649 | — | 649 | |||||||||||
Homebuilding income from operations | 27,451 | 268,508 | — | 295,959 | |||||||||||
Equity in loss of unconsolidated entities | — | 179 | — | 179 | |||||||||||
Other income, net | 149 | 163 | — | 312 | |||||||||||
Homebuilding income from continuing operations before taxes | 27,600 | 268,850 | — | 296,450 | |||||||||||
Financial Services: | |||||||||||||||
Revenues | — | 1,220 | — | 1,220 | |||||||||||
Expenses | — | 253 | — | 253 | |||||||||||
Equity in income of unconsolidated entities | — | 4,810 | — | 4,810 | |||||||||||
Financial services income from continuing operations before taxes | — | 5,777 | — | 5,777 | |||||||||||
Income from continuing operations before taxes | 27,600 | 274,627 | — | 302,227 | |||||||||||
Provision for income taxes | (11,322 | ) | (94,772 | ) | — | (106,094 | ) | ||||||||
Equity of net income (loss) of subsidiaries | 178,893 | — | (178,893 | ) | — | ||||||||||
Net income (loss) | 195,171 | 179,855 | (178,893 | ) | 196,133 | ||||||||||
Net income attributable to noncontrolling interests | — | (962 | ) | — | (962 | ) | |||||||||
Net income (loss) available to common stockholders | $ | 195,171 | $ | 178,893 | $ | (178,893 | ) | $ | 195,171 | ||||||
_________
(1) | References to “Issuer” in Note 20, Supplemental Guarantor Information have the following meanings: |
a. | for periods prior to July 7, 2015: TRI Pointe Homes only |
b. | for periods from and after July 7, 2015: TRI Pointe Homes and TRI Pointe Group as co-issuers |
- 106 -
Condensed Consolidating Statement of Operations (in thousands):
Year Ended December 31, 2015 | |||||||||||||||
Issuer (1) | Guarantor Subsidiaries | Consolidating Adjustments | Consolidated TRI Pointe Group, Inc. | ||||||||||||
Homebuilding: | |||||||||||||||
Home sales revenue | $ | 774,005 | $ | 1,517,259 | $ | — | $ | 2,291,264 | |||||||
Land and lot sales revenue | — | 101,284 | — | 101,284 | |||||||||||
Other operations revenue | — | 7,601 | — | 7,601 | |||||||||||
Total revenues | 774,005 | 1,626,144 | — | 2,400,149 | |||||||||||
Cost of home sales | 624,791 | 1,183,985 | — | 1,808,776 | |||||||||||
Cost of land and lot sales | — | 35,089 | — | 35,089 | |||||||||||
Other operations expense | — | 4,360 | — | 4,360 | |||||||||||
Sales and marketing | 26,792 | 89,425 | — | 116,217 | |||||||||||
General and administrative | 55,611 | 61,885 | — | 117,496 | |||||||||||
Restructuring charges | (169 | ) | 3,498 | — | 3,329 | ||||||||||
Homebuilding income from operations | 66,980 | 247,902 | — | 314,882 | |||||||||||
Equity in loss of unconsolidated entities | — | 1,460 | — | 1,460 | |||||||||||
Other (loss) income, net | (127 | ) | 985 | — | 858 | ||||||||||
Homebuilding income from continuing operations before taxes | 66,853 | 250,347 | — | 317,200 | |||||||||||
Financial Services: | |||||||||||||||
Revenues | — | 1,010 | — | 1,010 | |||||||||||
Expenses | — | 181 | — | 181 | |||||||||||
Equity in income of unconsolidated entities | — | 1,231 | — | 1,231 | |||||||||||
Financial services income from continuing operations before taxes | — | 2,060 | — | 2,060 | |||||||||||
Income from continuing operations before taxes | 66,853 | 252,407 | — | 319,260 | |||||||||||
Provision for income taxes | (20,001 | ) | (92,078 | ) | — | (112,079 | ) | ||||||||
Equity of net income (loss) of subsidiaries | 158,609 | — | (158,609 | ) | — | ||||||||||
Net income (loss) | 205,461 | 160,329 | (158,609 | ) | 207,181 | ||||||||||
Net income attributable to noncontrolling interests | — | (1,720 | ) | — | (1,720 | ) | |||||||||
Net income (loss) available to common stockholders | $ | 205,461 | $ | 158,609 | $ | (158,609 | ) | $ | 205,461 | ||||||
__________
(1) | References to “Issuer” in Note 20, Supplemental Guarantor Information have the following meanings: |
a. | for periods prior to July 7, 2015: TRI Pointe Homes only |
b. | for periods from and after July 7, 2015: TRI Pointe Homes and TRI Pointe Group as co-issuers |
- 107 -
Condensed Consolidating Statement of Operations (in thousands):
Year Ended December 31, 2014 | |||||||||||||||
Issuer (1) | Guarantor Subsidiaries | Consolidating Adjustments | Consolidated TRI Pointe Homes, Inc. | ||||||||||||
Homebuilding: | |||||||||||||||
Home sales revenue | $ | 324,219 | $ | 1,322,055 | $ | — | $ | 1,646,274 | |||||||
Land and lot sales revenue | — | 47,660 | — | 47,660 | |||||||||||
Other operations revenue | (12 | ) | 9,694 | — | 9,682 | ||||||||||
Total revenues | 324,207 | 1,379,409 | — | 1,703,616 | |||||||||||
Cost of home sales | 271,579 | 1,047,038 | — | 1,318,617 | |||||||||||
Cost of land and lot sales | — | 37,906 | — | 37,906 | |||||||||||
Other operations expense | — | 3,346 | — | 3,346 | |||||||||||
Sales and marketing | 9,678 | 93,922 | — | 103,600 | |||||||||||
General and administrative | 16,532 | 65,826 | — | 82,358 | |||||||||||
Restructuring charges | — | 10,543 | — | 10,543 | |||||||||||
Homebuilding income from operations | 26,418 | 120,828 | — | 147,246 | |||||||||||
Equity in loss of unconsolidated entities | — | (278 | ) | — | (278 | ) | |||||||||
Transaction expenses | (7,138 | ) | (10,822 | ) | — | (17,960 | ) | ||||||||
Other income (loss), net | 17 | (1,036 | ) | — | (1,019 | ) | |||||||||
Homebuilding income from continuing operations before taxes | 19,297 | 108,692 | — | 127,989 | |||||||||||
Financial Services: | |||||||||||||||
Revenues | — | — | — | — | |||||||||||
Expenses | — | 15 | — | 15 | |||||||||||
Equity in loss of unconsolidated entities | — | (10 | ) | — | (10 | ) | |||||||||
Financial services loss from continuing operations before taxes | — | (25 | ) | — | (25 | ) | |||||||||
Income from continuing operations before taxes | 19,297 | 108,667 | — | 127,964 | |||||||||||
Provision for income taxes | (11,586 | ) | (32,181 | ) | — | (43,767 | ) | ||||||||
Equity of net income (loss) of subsidiaries | 76,486 | — | (76,486 | ) | — | ||||||||||
Net income (loss) available to common stockholders | $ | 84,197 | $ | 76,486 | $ | (76,486 | ) | $ | 84,197 | ||||||
__________
(1) | References to “Issuer” in Note 20, Supplemental Guarantor Information have the following meanings: |
a. | for periods prior to July 7, 2015: TRI Pointe Homes only |
b. | for periods from and after July 7, 2015: TRI Pointe Homes and TRI Pointe Group as co-issuers |
- 108 -
Condensed Consolidating Statement of Cash Flows (in thousands):
Year Ended December 31, 2016 | |||||||||||||||
Issuer (1) | Guarantor Subsidiaries | Consolidating Adjustments | Consolidated TRI Pointe Group, Inc. | ||||||||||||
Cash flows from operating activities: | |||||||||||||||
Net cash used in (provided by) operating activities | $ | (179,397 | ) | $ | 21,087 | $ | — | $ | (158,310 | ) | |||||
Cash flows from investing activities: | |||||||||||||||
Purchases of property and equipment | (1,603 | ) | (2,382 | ) | — | (3,985 | ) | ||||||||
Proceeds from sale of property and equipment | — | 9 | — | 9 | |||||||||||
Investments in unconsolidated entities | — | (32 | ) | — | (32 | ) | |||||||||
Intercompany | 12,102 | — | (12,102 | ) | — | ||||||||||
Net cash provided by (used in) investing activities | 10,499 | (2,405 | ) | (12,102 | ) | (4,008 | ) | ||||||||
Cash flows from financing activities: | |||||||||||||||
Borrowings from debt | 541,069 | — | — | 541,069 | |||||||||||
Repayment of debt | (330,458 | ) | (400 | ) | — | (330,858 | ) | ||||||||
Debt issuance costs | (5,062 | ) | — | — | (5,062 | ) | |||||||||
Repayment of debt payable to Weyerhaeuser | — | (2,442 | ) | — | (2,442 | ) | |||||||||
Decrease in book overdrafts | — | 1,955 | — | 1,955 | |||||||||||
Distributions to Weyerhaeuser | — | (5,318 | ) | — | (5,318 | ) | |||||||||
Proceeds from issuance of common stock under share-based awards | 587 | — | — | 587 | |||||||||||
Minimum tax withholding paid on behalf of employees for share-based awards | (1,359 | ) | — | — | (1,359 | ) | |||||||||
Share repurchases | (42,082 | ) | — | — | (42,082 | ) | |||||||||
Intercompany | — | (12,102 | ) | 12,102 | — | ||||||||||
Net cash provided by (used in) financing activities | 162,695 | (18,307 | ) | 12,102 | 156,490 | ||||||||||
Net (decrease) increase in cash and cash equivalents | (6,203 | ) | 375 | — | (5,828 | ) | |||||||||
Cash and cash equivalents - beginning of year | 147,771 | 66,714 | — | 214,485 | |||||||||||
Cash and cash equivalents - end of year | $ | 141,568 | $ | 67,089 | $ | — | $ | 208,657 | |||||||
- 109 -
Condensed Consolidating Statement of Cash Flows (in thousands):
Year Ended December 31, 2015 | |||||||||||||||
Issuer (1) | Guarantor Subsidiaries | Consolidating Adjustments | Consolidated TRI Pointe Group, Inc. | ||||||||||||
Cash flows from operating activities | |||||||||||||||
Net cash provided by operating activities | $ | 1,714 | $ | 29,291 | $ | — | $ | 31,005 | |||||||
Cash flows from investing activities: | |||||||||||||||
Purchases of property and equipment | (1,063 | ) | 254 | — | (809 | ) | |||||||||
Investments in unconsolidated entities | — | (1,468 | ) | — | (1,468 | ) | |||||||||
Distributions from unconsolidated entities | — | 1,415 | — | 1,415 | |||||||||||
Intercompany | 16,717 | — | (16,717 | ) | — | ||||||||||
Net cash provided by (used in) investing activities | 15,654 | 201 | (16,717 | ) | (862 | ) | |||||||||
Cash flows from financing activities: | |||||||||||||||
Borrowings from debt | 140,000 | — | — | 140,000 | |||||||||||
Repayment of debt | (112,651 | ) | (200 | ) | — | (112,851 | ) | ||||||||
Debt issuance costs | (2,688 | ) | — | — | (2,688 | ) | |||||||||
Net repayments of debt held by variable interest entities | — | (6,769 | ) | — | (6,769 | ) | |||||||||
Contributions from noncontrolling interests | — | 5,990 | — | 5,990 | |||||||||||
Distributions to noncontrolling interests | — | (9,823 | ) | — | (9,823 | ) | |||||||||
Proceeds from issuance of common stock under share-based awards | 1,616 | — | — | 1,616 | |||||||||||
Excess tax benefits of share-based awards | 428 | — | — | 428 | |||||||||||
Minimum tax withholding paid on behalf of employees for restricted stock units | (2,190 | ) | — | — | (2,190 | ) | |||||||||
Intercompany | — | (16,717 | ) | 16,717 | — | ||||||||||
Net cash provided by (used in) financing activities | 24,515 | (27,519 | ) | 16,717 | 13,713 | ||||||||||
Net increase in cash and cash equivalents | 41,883 | 1,973 | — | 43,856 | |||||||||||
Cash and cash equivalents - beginning of year | 105,888 | 64,741 | — | 170,629 | |||||||||||
Cash and cash equivalents - end of year | $ | 147,771 | $ | 66,714 | $ | — | $ | 214,485 | |||||||
_________
(1) | References to “Issuer” in Note 20, Supplemental Guarantor Information have the following meanings: |
a. | for periods prior to July 7, 2015: TRI Pointe Homes only |
b. | for periods from and after July 7, 2015: TRI Pointe Homes and TRI Pointe Group as co-issuers |
- 110 -
Condensed Consolidating Statement of Cash Flows (in thousands):
Year Ended December 31, 2014 | |||||||||||||||
Issuer (1) | Guarantor Subsidiaries | Consolidating Adjustments | Consolidated TRI Pointe Homes, Inc. | ||||||||||||
Cash flows from operating activities | |||||||||||||||
Net cash used in operating activities | $ | (62,715 | ) | $ | (50,655 | ) | $ | — | $ | (113,370 | ) | ||||
Cash flows from investing activities: | |||||||||||||||
Purchases of property and equipment | (2,293 | ) | (5,557 | ) | — | (7,850 | ) | ||||||||
Cash acquired in the Merger | 53,800 | — | — | 53,800 | |||||||||||
Proceeds from sale of property and equipment | — | 23 | — | 23 | |||||||||||
Investments in unconsolidated entities | — | (1,311 | ) | — | (1,311 | ) | |||||||||
Intercompany | 69,971 | — | (69,971 | ) | — | ||||||||||
Net cash provided by (used in) investing activities | 121,478 | (6,845 | ) | (69,971 | ) | 44,662 | |||||||||
Cash flows from financing activities: | |||||||||||||||
Borrowings from debt | 100,000 | 887,298 | — | 987,298 | |||||||||||
Repayment of debt | (53,051 | ) | — | — | (53,051 | ) | |||||||||
Debt issuance costs | — | (23,000 | ) | — | (23,000 | ) | |||||||||
Bridge commitment fee | — | (10,322 | ) | — | (10,322 | ) | |||||||||
Changes in debt payable to Weyerhaeuser | — | (623,589 | ) | — | (623,589 | ) | |||||||||
Change in book overdrafts | — | (22,491 | ) | — | (22,491 | ) | |||||||||
Distributions to Weyerhaeuser | — | (8,606 | ) | — | (8,606 | ) | |||||||||
Net proceeds of debt held by variable interest entities | — | 3,903 | — | 3,903 | |||||||||||
Contributions from noncontrolling interests | — | 1,895 | — | 1,895 | |||||||||||
Distributions to noncontrolling interests | — | (19,143 | ) | — | (19,143 | ) | |||||||||
Proceeds from issuance of common stock under share-based awards | 176 | — | — | 176 | |||||||||||
Excess tax benefits of share-based awards | — | 1,757 | — | 1,757 | |||||||||||
Intercompany | — | (69,971 | ) | 69,971 | — | ||||||||||
Net cash provided by financing activities | 47,125 | 117,731 | 69,971 | 234,827 | |||||||||||
Net increase in cash and cash equivalents | 105,888 | 60,231 | — | 166,119 | |||||||||||
Cash and cash equivalents - beginning of year | — | 4,510 | — | 4,510 | |||||||||||
Cash and cash equivalents - end of year | $ | 105,888 | $ | 64,741 | $ | — | $ | 170,629 | |||||||
__________
(1) | References to “Issuer” in Note 20, Supplemental Guarantor Information have the following meanings: |
a. | for periods prior to July 7, 2015: TRI Pointe Homes only |
b. | for periods from and after July 7, 2015: TRI Pointe Homes and TRI Pointe Group as co-issuers |
- 111 -
21. | Results of Quarterly Operations (Unaudited) |
The following table presents our unaudited quarterly financial data (in thousands, except per share amounts).
First | Second | Third | Fourth | ||||||||||||
2016 | Quarter | Quarter | Quarter | Quarter | |||||||||||
Total revenues(1) | $ | 424,138 | $ | 625,222 | $ | 582,029 | $ | 773,753 | |||||||
Cost of homes sales and other(2) | 325,844 | 447,781 | 464,632 | 617,684 | |||||||||||
Gross margin | $ | 98,294 | $ | 177,441 | $ | 117,397 | $ | 156,069 | |||||||
Net income | $ | 28,710 | $ | 74,193 | $ | 35,145 | $ | 58,085 | |||||||
Net income attributable to noncontrolling interests | (160 | ) | (267 | ) | $ | (311 | ) | (224 | ) | ||||||
Net income available to common stockholders | $ | 28,550 | $ | 73,926 | $ | 34,834 | $ | 57,861 | |||||||
Earnings per share | |||||||||||||||
Basic | $ | 0.18 | $ | 0.46 | $ | 0.22 | $ | 0.36 | |||||||
Diluted | $ | 0.18 | $ | 0.46 | $ | 0.22 | $ | 0.36 | |||||||
__________
(1) Total revenues includes total homebuilding revenues and financial services revenue.
(2) Cost of homes sales and other includes cost of homes sales, cost of land and lot sales, and other operations expense.
First | Second | Third | Fourth | ||||||||||||
2015 | Quarter | Quarter | Quarter | Quarter | |||||||||||
Total revenues(1) | $ | 377,258 | $ | 495,517 | $ | 648,141 | $ | 880,243 | |||||||
Cost of homes sales and other(2) | 302,777 | 353,878 | 511,564 | 680,006 | |||||||||||
Gross margin | $ | 74,481 | $ | 141,639 | $ | 136,577 | $ | 200,237 | |||||||
Net income | $ | 15,297 | $ | 56,762 | $ | 49,769 | $ | 85,353 | |||||||
Net (income) loss attributable to noncontrolling interests | — | (1,832 | ) | 393 | (281 | ) | |||||||||
Net income available to common stockholders | $ | 15,297 | $ | 54,930 | $ | 50,162 | $ | 85,072 | |||||||
Earnings per share | |||||||||||||||
Basic | $ | 0.09 | $ | 0.34 | $ | 0.31 | $ | 0.53 | |||||||
Diluted | $ | 0.09 | $ | 0.34 | $ | 0.31 | $ | 0.52 | |||||||
__________
(1) Total revenues includes total homebuilding revenues and financial services revenue.
(2) Cost of homes sales and other includes cost of homes sales, cost of land and lot sales, and other operations expense.
Quarterly and year-to-date computations of per share amounts are made independently. Therefore, the sum of per share amounts for the quarter may not agree with per share amounts for the year.
- 112 -
SIGNATURES
Pursuant to the requirements of Section 13 or 15(d) of the Securities Exchange Act of 1934, the registrant has duly caused this report to be signed on its behalf by the undersigned, thereunto duly authorized.
TRI Pointe Group, Inc. | |||
By: | /s/ Douglas F. Bauer | ||
Douglas F. Bauer | |||
Chief Executive Officer | |||
Date: February 24, 2017 | |||
Pursuant to the requirements of the Securities Exchange Act of 1934, this report has been signed below by the following persons on behalf of the registrant and in the capacities and on the dates indicated:
Signature | Title | Date | ||
/s/ Barry S. Sternlicht | Chairman of the Board, Director | February 24, 2017 | ||
Barry S. Sternlicht | ||||
/s/ Douglas F. Bauer | Chief Executive Officer and Director (Principal Executive Officer) | February 24, 2017 | ||
Douglas F. Bauer | ||||
/s/ Michael D. Grubbs | Chief Financial Officer & Treasurer (Principal Financial Officer) | February 24, 2017 | ||
Michael D. Grubbs | ||||
/s/ Glenn J. Keeler | Chief Accounting Officer (Principal Accounting Officer) | February 24, 2017 | ||
Glenn J. Keeler | ||||
/s/ Lawrence B. Burrows | Director | February 24, 2017 | ||
Lawrence B. Burrows | ||||
/s/ Daniel S. Fulton | Director | February 24, 2017 | ||
Daniel S. Fulton | ||||
/s/ Steven J. Gilbert | Director | February 24, 2017 | ||
Steven J. Gilbert | ||||
/s/ Christopher D. Graham | Director | February 24, 2017 | ||
Christopher D. Graham | ||||
/s/ Constance B. Moore | Director | February 24, 2017 | ||
Constance B. Moore | ||||
/s/ Thomas B. Rogers | Director | February 24, 2017 | ||
Thomas B. Rogers | ||||
- 113 -
Exhibit Number | Exhibit Description | ||
2.1 | Transaction Agreement, dated as of November 3, 2013, among TRI Pointe Homes, Inc., Weyerhaeuser Company, Weyerhaeuser Real Estate Company, and Topaz Acquisition, Inc. (incorporated by reference to Exhibit 2.1 to the Company’s Registration Statement on Form S‑4 (filed March 28, 2014)) | ||
3.1 | Amended and Restated Certificate of Incorporation of TRI Pointe Homes, Inc. (incorporated by reference to Exhibit 3.1 to the Company’s Current Report on Form 8‑K (filed July 7, 2015) | ||
3.2 | Amended and Restated Bylaws of TRI Pointe Group, Inc. (incorporated by reference to Exhibit 3.2 to the Company’s Current Report on Form 8-K (filed October 27, 2016)) | ||
4.1 | Specimen Common Stock Certificate of TRI Pointe Group, Inc. (incorporated by reference to Exhibit 4.1 to the Company’s Current Report on Form 8-K (filed July 7, 2015)) | ||
4.2 | Investor Rights Agreement, dated as of January 30, 2013, by and among TRI Pointe Homes, Inc., VIII/TPC Holdings, L.L.C., BMG Homes, Inc., The Bauer Revocable Trust U/D/T Dated December 31, 2003, Grubbs Family Trust Dated June 22, 2012, The Mitchell Family Trust U/D/T Dated February 8, 2000, Douglas J. Bauer, Thomas J. Mitchell and Michael D. Grubbs. (incorporated by reference to Exhibit 4.2 to the Company’s Registration Statement on Form S‑4 (filed Jan. 9, 2014)) | ||
4.3 | First Amendment to Investor Rights Agreement, dated as of November 3, 2013, by and among TRI Pointe Homes, Inc., VIII/TPC Holdings, L.L.C., BMG Homes, Inc., The Bauer Revocable Trust U/D/T Dated December 31, 2003, Grubbs Family Trust Dated June 22, 2012, The Mitchell Family Trust U/D/T Dated February 8, 2000, Douglas F. Bauer, Thomas J. Mitchell and Michael D. Grubbs (incorporated by reference to Exhibit 10.9 to the Company’s Current Report on Form 8‑K (filed Nov. 4, 2013)) | ||
4.4 | Second Amendment to Investor Rights Agreement, dated as of July 7, 2015, among TRI Pointe Group, Inc., TRI Pointe Homes, Inc., VIII/TPC Holdings, L.L.C., BMG Homes, Inc., The Bauer Revocable Trust U/D/T Dated December 31, 2003, Grubbs Family Trust Dated June 22, 2012, The Mitchell Family Trust U/D/T Dated February 8, 2000, Douglas F. Bauer, Thomas J. Mitchell and Michael D. Grubbs (incorporated by reference to Exhibit 10.8 to the Company’s Current Report on Form 8‑K (filed July 7, 2015)) | ||
4.5 | Registration Rights Agreement, dated as of January 30, 2013, among TRI Pointe Homes, Inc., VIII/TPC Holdings, L.L.C., and certain TRI Pointe Homes, Inc. stockholders (incorporated by reference to Exhibit 4.4 to the Company’s Registration Statement on Form S‑4 (filed Jan. 9, 2014)) | ||
4.6 | First Amendment to Registration Rights Agreement, dated as of July 7, 2015, among TRI Pointe Group, Inc., TRI Pointe Homes, Inc., VIII/TPC Holdings, L.L.C. and certain TRI Pointe Homes, Inc. stockholders (incorporated by reference to Exhibit 10.9 to the Company’s Current Report on Form 8‑K (filed July 7, 2015)) | ||
4.7 | Indenture, dated as of June 13, 2014, by and among Weyerhaeuser Real Estate Company and U.S. Bank National Association, as trustee (including form of 4.375% Senior Note due 2019) (incorporated by reference to Exhibit 4.1 to the Company’s Current Report on Form 8‑K (filed June 19, 2014)) | ||
4.8 | First Supplemental Indenture, dated as of July 7, 2014, among TRI Pointe Homes, Inc., Weyerhaeuser Real Estate Company and U.S. Bank National Association, as trustee, relating to the 4.375% Senior Notes due 2019 (incorporated by reference to Exhibit 4.1 to the Company’s Current Report on Form 8‑K (filed July 7, 2014)) | ||
4.9 | Second Supplemental Indenture, dated as of July 7, 2014, among the guarantors party thereto and U.S. Bank National Association, as trustee, relating to the 4.375% Senior Notes due 2019 (incorporated by reference to Exhibit 4.3 to the Company’s Current Report on Form 8‑K (filed July 7, 2014)) | ||
4.10 | Third Supplemental Indenture, dated as of July 7, 2015, among TRI Pointe Group, Inc., TRI Pointe Homes, Inc. and U.S. Bank National Association, as trustee, relating to the 4.375% Senior Notes due 2019 (incorporated by reference to Exhibit 4.2 to the Company’s Current Report on Form 8‑K (filed July 7, 2015)) | ||
- 114 -
Exhibit Number | Exhibit Description | ||
4.11 | Indenture, dated as of June 13, 2014, by and among Weyerhaeuser Real Estate Company and U.S. Bank National Association, as trustee (including form of 5.875% Senior Note due 2024) (incorporated by reference to Exhibit 4.2 to the Company’s Current Report on Form 8‑K (filed June 19, 2014)) | ||
4.12 | First Supplemental Indenture, dated as of July 7, 2014, among TRI Pointe Homes, Inc., Weyerhaeuser Real Estate Company and U.S. Bank National Association, as trustee, relating to the 5.875% Senior Notes due 2024 (incorporated by reference to Exhibit 4.2 to the Company’s Current Report on Form 8‑K (filed July 7, 2014)) | ||
4.13 | Second Supplemental Indenture, dated as of July 7, 2014, among the guarantors party thereto and U.S. Bank National Association, as trustee, relating to the 5.875% Senior Notes due 2024 (incorporated by reference to Exhibit 4.4 to the Company’s Current Report on Form 8‑K (filed July 7, 2014)) | ||
4.14 | Third Supplemental Indenture, dated as of July 7, 2015, among TRI Pointe Group, Inc., TRI Pointe Homes, Inc. and U.S. Bank National Association, as trustee, relating to the 5.875% Senior Notes due 2024 (incorporated by reference to Exhibit 4.3 to the Company’s Current Report on Form 8‑K (filed July 7, 2015)) | ||
4.15 | Indenture, dated as of May 23, 2016, by and between TRI Pointe Group, Inc. and U.S. Bank National Association, as trustee (incorporated by reference to Exhibit 4.1 to the Company’s Registration Statement on Form S-3ASR (filed May 23, 2016)) | ||
4.16 | First Supplemental Indenture, dated as of May 26, 2016, among TRI Pointe Group, Inc., the guarantors party thereto and U.S. Bank National Association, as trustee, relating to the 4.875% Senior Notes due 2021 (incorporated by reference to Exhibit 4.1 to the Company’s Current Report on Form 8-K (filed May 26, 2016)) | ||
10.1 | Joinder Agreement to Purchase Agreement, dated as of July 7, 2014, relating to the 4.375% Senior Notes due 2019 and 5.875% Senior Notes due 2024 (incorporated by reference to Exhibit 10.1 to the Company’s Current Report on Form 8‑K (filed July 7, 2014)) | ||
10.2 | Issuer Joinder Agreement to Registration Rights Agreement, dated as of July 7, 2014, relating to 4.375% Senior Notes due 2019 (incorporated by reference to Exhibit 10.2 to the Company’s Current Report on Form 8‑K (filed July 7, 2014)) | ||
10.3 | Guarantor Joinder Agreement to Registration Rights Agreement, dated as of July 7, 2014, relating to 4.375% Senior Notes due 2019 (incorporated by reference to Exhibit 10.4 to the Company’s Current Report on Form 8‑K (filed July 7, 2014)) | ||
10.4 | Issuer Joinder Agreement to Registration Rights Agreement, dated as of July 7, 2014, relating to 5.875% Senior Notes due 2024 (incorporated by reference to Exhibit 10.3 to the Company’s Current Report on Form 8‑K (filed July 7, 2014)) | ||
10.5 | Guarantor Joinder Agreement to Registration Rights Agreement, dated as of July 7, 2014, relating to 5.875% Senior Notes due 2024 (incorporated by reference to Exhibit 10.5 to the Company’s Current Report on Form 8‑K (filed July 7, 2014)) | ||
10.6 | Registration Rights Agreement with respect to 4.375% Senior Notes due 2019, dated as of June 23, 2014, by and among Weyerhaeuser Real Estate Company, CitiGroup Global Markets, Inc. and Deutsche Bank Securities Inc., as representatives of the Initial Purchasers (incorporated by reference to Exhibit 10.1 to the Company’s Current Report on Form 8‑K (filed June 19, 2014)) | ||
10.7 | Registration Rights Agreement with respect to 5.875% Senior Notes due 2024, dated as of June 13, 2014, by and among Weyerhaeuser Real Estate Company, CitiGroup Global Markets, Inc. and Deutsche Bank Securities Inc., as representatives of the Initial Purchasers (incorporated by reference to Exhibit 10.2 to the Company’s Current Report on Form 8‑K (filed June 19, 2014)) | ||
10.8 | Tax Sharing Agreement, dated as of July 7, 2014, among Weyerhaeuser Company, Weyerhaeuser Real Estate Company, and TRI Pointe Homes, Inc. (incorporated by reference to Exhibit 10.6 to the Company’s Current Report on Form 8‑K (filed July 7, 2014)) | ||
- 115 -
Exhibit Number | Exhibit Description | ||
10.9 | First Amendment to Tax Sharing Agreement, dated as of July 7, 2015, among TRI Pointe Group, Inc., TRI Pointe Homes, Inc., TRI Pointe Holdings, Inc. (f/k/a Weyerhaeuser Real Estate Company) and Weyerhaeuser Company (incorporated by reference to Exhibit 10.10 to the Company’s Current Report on Form 8‑K (filed July 7, 2015)) | ||
10.10 | Amended and Restated Revolving Line of Credit Loan Agreement by and between California Bank & Trust and TRI Pointe Homes, LLC, dated as of May 29, 2012 (incorporated by reference to Exhibit 10.1 to the Company’s Registration Statement on Form S‑1 (filed Dec. 21, 2012)) | ||
10.11 | First Amendment to Modify Loan Documents by and between California Bank & Trust and TRI Pointe Homes, LLC, dated as of December 21, 2012 (incorporated by reference to Exhibit 10.2 to the Company’s Registration Statement on Form S‑1 (Amendment No. 1, filed Jan. 9, 2013)) | ||
10.12 | Second Amendment to Modify Loan Documents, dated as of March 25, 2014, by and between TRI Pointe Homes, Inc. and California Bank & Trust (incorporated by reference to Exhibit 10.1 to the Company’s Current Report on Form 8‑K (filed April 1, 2014)) | ||
10.13 | Credit Agreement, dated as of June 26, 2014, among TRI Pointe Homes, Inc., U.S. Bank National Association, d/b/a Housing Capital Company, and the lender parties thereto (incorporated by reference to Exhibit 10.1 to the Company’s Current Report on Form 8‑K (filed June 27, 2014)) | ||
10.14 | Amended and Restated Credit Agreement, dated as of July 7, 2015, among TRI Pointe Group, Inc., U.S. Bank National Association and the lenders party thereto (incorporated by reference to Exhibit 4.4 to the Company’s Current Report on Form 8‑K (filed July 7, 2015)) | ||
10.15† | 2013 Long‑Term Incentive Plan (incorporated by reference to Exhibit 3.1 to the Company’s Registration Statement on Form S‑1 (Amendment No. 1, filed Jan. 9, 2013)) | ||
10.16† | Amendment No. 1 to 2013 Long-Term Incentive Plan (incorporated by reference to Exhibit 10.1 to the Company’s Current Report on Form 8‑K (filed June 23, 2014)) | ||
10.17† | Amendment No. 2 to 2013 Long-Term Incentive Plan (incorporated by reference to Exhibit 10.2 to the Company’s Current Report on Form 8‑K (filed June 23, 2014)) | ||
10.18† | Weyerhaeuser Real Estate Company 2004 Long-Term Incentive Plan (filed as Exhibit 99.1 to the Company’s Registration Statement on Form S-8 (filed July 16, 2014)) | ||
10.19† | Weyerhaeuser Real Estate Company 2013 Long-Term Incentive Plan (filed as Exhibit 99.1 to the Company’s Registration Statement on Form S-8 (filed July 16, 2014)) | ||
10.20† | Omnibus Amendment to the TRI Pointe Homes, Inc. 2013 Long-Term Incentive Plan, TRI Pointe Group Short-Term Incentive Plan, Weyerhaeuser Real Estate Company 2004 Long-Term Incentive Plan and the Weyerhaeuser Real Estate Company 2013 Long-Term Incentive Plan and their related stock option, restricted stock unit, cash incentive award agreements and performance share unit agreements, dated as of July 7, 2015 (incorporated by reference to Exhibit 10.7 to the Company’s Current Report on Form 8‑K (filed July 7, 2015)) | ||
10.21† | Amendment No. 4 to TRI Pointe Homes, Inc. 2013 Long-Term Incentive Plan (incorporated by reference to Exhibit 10.7 to the Company’s Current Report on Form 8‑K (filed August 13, 2015)) | ||
10.22† | Executive Employment Agreement dated as of November 19, 2015 between TRI Pointe Group, Inc. and Douglas F. Bauer (incorporated by reference to Exhibit 10.1 to the Company’s Current Report on Form 8‑K (filed November 20, 2015)) | ||
10.23† | Executive Employment Agreement dated as of November 19, 2015 between TRI Pointe Group, Inc. and Thomas J. Mitchell (incorporated by reference to Exhibit 10.2 to the Company’s Current Report on Form 8‑K (filed November 20, 2015)) | ||
- 116 -
Exhibit Number | Exhibit Description | ||
10.24† | Executive Employment Agreement dated as of November 19, 2015 between TRI Pointe Group, Inc. and Michael D. Grubbs (incorporated by reference to Exhibit 10.3 to the Company’s Current Report on Form 8‑K (filed November 20, 2015)) | ||
10.25† | Form of Indemnification Agreement between TRI Pointe Homes, Inc. and each of its directors and officers (incorporated by reference to Exhibit 10.7 to the Company’s Registration Statement on Form S‑1 (filed Dec. 21, 2012)) | ||
10.26† | Form of Amendment to Indemnification Agreement between TRI Pointe Group, Inc. and each of its directors and officers (incorporated by reference to Exhibit 10.1 to the Company’s Current Report on Form 8‑K (filed July 7, 2015)) | ||
10.27† | 2013 Long‑Term Incentive Plan form of Option Award and Stock Option Agreement (incorporated by reference to Exhibit 10.9 to the Company’s Annual Report on Form 10‑K (filed March 28, 2013)) | ||
10.28† | 2013 Long‑Term Incentive Plan form of Restricted Stock Unit Award Agreement (incorporated by reference to Exhibit 10.10 to the Company’s Annual Report on Form 10‑K (filed March 28, 2013)) | ||
10.29† | 2013 Long‑Term Incentive Plan form of Non‑Employee Director Agreement (incorporated by reference to Exhibit 10.11 to the Company’s Annual Report on Form 10‑K (filed March 28, 2013)) | ||
10.30† | 2013 Bonus Plan (incorporated by reference to Exhibit 10.1 to the Company’s Current Report on Form 8‑K (filed March 27, 2013)) | ||
10.31 | Revolving Credit Agreement, dated July 18, 2013, among TRI Pointe Homes, Inc. and U.S. Bank National Association (incorporated by reference to Exhibit 10.1 to the Company’s Current Report on Form 8‑K (filed July 25, 2013)) | ||
10.32 | Modification Agreement dated December 26, 2013 between TRI Pointe Homes, Inc. and U.S. Bank National Association, d/b/a Housing Capital Company (incorporated by reference to Exhibit 10.1 to the Company’s Current Report on Form 8‑K (filed Jan. 2, 2014)) | ||
10.33 | Second Modification Agreement, dated as of May 18, 2015, among TRI Pointe Homes, Inc., U.S. Bank National Association, and the lenders party thereto (incorporated by reference to Exhibit 10.1 to the Company’s Current Report on Form 8‑K (filed May 18, 2015)) | ||
10.34 | Voting Agreement, dated as of November 3, 2013, among Weyerhaeuser Company, Thomas J. Mitchell and The Mitchell Family Trust U/D/T Dated February 8, 2000 (incorporated by reference to Exhibit 10.1 to the Company’s Current Report on Form 8‑K (filed Nov. 4, 2013)) | ||
10.35 | Voting Agreement, dated as of November 3, 2013, among Weyerhaeuser Company, Michael D. Grubbs and Grubbs Family Trust Dated June 22, 2012 (incorporated by reference to Exhibit 10.2 to the Company’s Current Report on Form 8‑K (filed Nov. 4, 2013)) | ||
10.36 | Voting Agreement, dated as of November 3, 2013, among Weyerhaeuser Company, Douglas F. Bauer and The Bauer Family Revocable Trust U/D/T Dated December 31, 2003 (incorporated by reference to Exhibit 10.3 to the Company’s Current Report on Form 8‑K (filed Nov. 4, 2013)) | ||
10.33 | Second Modification Agreement, dated as of May 18, 2015, among TRI Pointe Homes, Inc., U.S. Bank National Association, and the lenders party thereto (incorporated by reference to Exhibit 10.1 to the Company’s Current Report on Form 8‑K (filed May 18, 2015)) | ||
10.34 | Voting Agreement, dated as of November 3, 2013, among Weyerhaeuser Company, Thomas J. Mitchell and The Mitchell Family Trust U/D/T Dated February 8, 2000 (incorporated by reference to Exhibit 10.1 to the Company’s Current Report on Form 8‑K (filed Nov. 4, 2013)) | ||
10.35 | Voting Agreement, dated as of November 3, 2013, among Weyerhaeuser Company, Michael D. Grubbs and Grubbs Family Trust Dated June 22, 2012 (incorporated by reference to Exhibit 10.2 to the Company’s Current Report on Form 8‑K (filed Nov. 4, 2013)) | ||
- 117 -
Exhibit Number | Exhibit Description | ||
10.36 | Voting Agreement, dated as of November 3, 2013, among Weyerhaeuser Company, Douglas F. Bauer and The Bauer Family Revocable Trust U/D/T Dated December 31, 2003 (incorporated by reference to Exhibit 10.3 to the Company’s Current Report on Form 8‑K (filed Nov. 4, 2013)) | ||
10.37 | Voting Agreement, dated as of November 3, 2013, among Weyerhaeuser Company, VIII/TPC Holdings, L.L.C. and SOF‑VIII U.S. Holdings, L.P. (incorporated by reference to Exhibit 10.4 to the Company’s Current Report on Form 8‑K (filed Nov. 4, 2013)) | ||
10.38 | Letter re Voting Agreement, dated as of November 3, 2013, between TRI Pointe Homes, Inc. and Thomas J. Mitchell (incorporated by reference to Exhibit 10.5 to the Company’s Current Report on Form 8‑K (filed Nov. 4, 2013)) | ||
10.39 | Letter re Voting Agreement, dated as of November 3, 2013, between TRI Pointe Homes, Inc. and Michael D. Grubbs (incorporated by reference to Exhibit 10.6 to the Company’s Current Report on Form 8‑K (filed Nov. 4, 2013)) | ||
10.40 | Letter re Voting Agreement, dated as of November 3, 2013, between TRI Pointe Homes, Inc. and Douglas F. Bauer (incorporated by reference to Exhibit 10.7 to the Company’s Current Report on Form 8‑K (filed Nov. 4, 2013)) | ||
10.41 | Letter re Voting Agreement, dated as of November 3, 2013, between TRI Pointe Homes, Inc. and VIII/TPC Holdings, L.L.C. (incorporated by reference to Exhibit 10.8 to the Company’s Current Report on Form 8‑K (filed Nov. 4, 2013)) | ||
10.42† | Form of Performance-Based Cash Award Agreement. (incorporated by reference to Exhibit 10.1 to the Company's Current Report on Form 8-K (filed March 2, 2016)) | ||
10.43† | Form of Performance-Based Restricted Stock Unit Award Agreement (total shareholder return) (incorporated by reference to Exhibit 10.2 to the Company's Current Report on Form 8-K (filed March 2, 2016)) | ||
10.44† | Form of Time-Vested Restricted Stock Unit Award Agreement (incorporated by reference to Exhibit 10.3 to the Company's Current Report on Form 8-K (filed March 2, 2016)) | ||
10.45† | Form of Severance and Change in Control Protection Agreement (incorporated by reference to Exhibit 10.4 to the Company’s Current Report on Form 8-K (filed March 2, 2016)) | ||
12.1 | Ratio of Earnings to Fixed Charges | ||
21.1 | List of subsidiaries of TRI Pointe Group, Inc. | ||
23.1 | Consent of Independent Registered Public Accounting Firm | ||
31.1 | Chief Executive Officer Section 302 Certification of the Sarbanes‑Oxley Act of 2002 | ||
31.2 | Chief Financial Officer Section 302 Certification of the Sarbanes‑Oxley Act of 2002 | ||
32.1 | Chief Executive Officer Section 906 Certification of the Sarbanes‑Oxley Act of 2002 | ||
32.2 | Chief Financial Officer Section 906 Certification of the Sarbanes‑Oxley Act of 2002 | ||
101 | The following materials from TRI Pointe Group, Inc.’s Annual Report on Form 10‑K for the year ended December 31, 2016, formatted in eXtensible Business Reporting Language (XBRL): (i) Consolidated Balance Sheets, (ii) Consolidated Statements of Operations, (iii) Consolidated Statements of Comprehensive Income, (iv) Consolidated Statement of Cash Flows, and (v) Notes to Consolidated Financial Statement. | ||
† | Management Contract or Compensatory Plan or Arrangement | ||
- 118 -