Attached files
UNITED STATES
SECURITIES AND EXCHANGE COMMISSION
Washington, D.C. 20549
FORM 10-K
ANNUAL REPORT PURSUANT TO SECTION 13 OR 15(d)
OF THE SECURITIES EXCHANGE ACT OF 1934
For the fiscal year ended December 31, 2016
Commission file number 001-33812
MSCI INC.
(Exact Name of Registrant as Specified in Its Charter)
|
Delaware |
|
13-4038723 |
|
(State or Other Jurisdiction of Incorporation or Organization) |
|
(I.R.S. Employer Identification Number) |
7 World Trade Center
250 Greenwich Street, 49th Floor
New York, New York 10007
(Address of Principal Executive Offices, zip code)
(212) 804-3900
(Registrant’s telephone number, including area code)
Securities registered pursuant to Section 12(b) of the Act:
|
Title of Each Class |
|
Name of Each Exchange on Which Registered |
|
Common stock, par value $0.01 per share |
|
New York Stock Exchange |
Securities registered pursuant to Section 12(g) of the Act: None
Indicate by check mark if the registrant is a well-known seasoned issuer, as defined in Rule 405 of the Securities Act. YES ☒ NO ☐
Indicate by check mark if the registrant is not required to file reports pursuant to Section 13 or Section 15(d) of the Act. YES ☐ NO ☒
Indicate by check mark whether the registrant (1) has filed all reports required to be filed by Section 13 or 15(d) of the Securities Exchange Act of 1934 during the preceding 12 months (or for such shorter period that the registrant was required to file such reports), and (2) has been subject to such filing requirements for the past 90 days. YES ☒ NO ☐
Indicate by check mark whether the registrant has submitted electronically and posted on its corporate Web site, if any, every Interactive Data File required to be submitted and posted pursuant to Rule 405 of Regulation S-T (§ 232.405 of this chapter) during the preceding 12 months (or for such shorter period that the registrant was required to submit and post such files). YES ☒ NO ☐
Indicate by check mark if disclosure of delinquent filers pursuant to Item 405 of Regulation S-K (§229.405 of this chapter) is not contained herein, and will not be contained, to the best of registrant’s knowledge, in definitive proxy or information statements incorporated by reference in Part III of this Form 10-K or any amendment to this Form 10-K. ☒
Indicate by check mark whether the registrant is a large accelerated filer, an accelerated filer, a non-accelerated filer, or a smaller reporting company. See definitions of “large accelerated filer,” “accelerated filer” and “smaller reporting company” in Rule 12b-2 of the Exchange Act. (Check one):
|
Large accelerated filer |
|
☒ |
|
Accelerated filer |
|
☐ |
|
|
|
|
|
|||
|
Non-accelerated filer |
|
☐ (Do not check if a smaller reporting company) |
|
Smaller Reporting Company |
|
☐ |
Indicate by check mark whether the registrant is a shell company (as defined in Rule 12b-2 of the Act). YES ☐ NO ☒
The aggregate market value of Common Stock held by non-affiliates of the registrant as of the last business day of the registrant’s most recently completed second fiscal quarter (based on the closing price of these securities as reported by The New York Stock Exchange on June 30, 2016) was $7,080,925,883. Shares of Common Stock held by executive officers and directors of the registrant are not included in the computation. However, the registrant has made no determination that such individuals are “affiliates” within the meaning of Rule 405 under the Securities Act of 1933.
As of February 17, 2017, there were 90,545,374 shares of the registrant’s Common Stock, par value $0.01 per share, outstanding.
Documents incorporated by reference: Portions of the registrant’s proxy statement for its annual meeting of stockholders, to be held on May 11, 2017, are incorporated herein by reference into Part III of this Form 10-K.
FORM 10-K
FOR THE YEAR ENDED DECEMBER 31, 2016
TABLE OF CONTENTS
|
|
|
|||
|
Item 1. |
|
|
1 |
|
|
Item 1A. |
|
|
18 |
|
|
Item 1B. |
|
|
42 |
|
|
Item 2. |
|
|
42 |
|
|
Item 3. |
|
|
42 |
|
|
Item 4. |
|
|
42 |
|
|
|
|
|
|
|
|
|
|
|||
|
Item 5. |
|
|
43 |
|
|
Item 6. |
|
|
47 |
|
|
Item 7. |
|
Management’s Discussion and Analysis of Financial Condition and Results of Operations |
|
50 |
|
Item 7A. |
|
|
82 |
|
|
Item 8. |
|
|
82 |
|
|
Item 9. |
|
Changes in and Disagreements With Accountants on Accounting and Financial Disclosure |
|
83 |
|
Item 9A. |
|
|
83 |
|
|
Item 9B. |
|
|
84 |
|
|
|
|
|
|
|
|
|
|
|||
|
Item 10. |
|
|
85 |
|
|
Item 11. |
|
|
85 |
|
|
Item 12. |
|
Security Ownership of Certain Beneficial Owners and Management and Related Stockholder Matters |
|
85 |
|
Item 13. |
|
Certain Relationships and Related Transactions, and Director Independence |
|
85 |
|
Item 14. |
|
|
85 |
|
|
|
|
|
|
|
|
|
|
|||
|
Item 15. |
|
|
86 |
|
|
Item 16. |
|
|
86 |
|
Except as the context otherwise indicates, the terms “MSCI,” the “Company,” “we,” “our” and “us” refer to MSCI Inc. together with its subsidiaries.
We have included in this Annual Report on Form 10-K and from time to time may make in our public filings, press releases or other public statements, certain statements that constitute forward-looking statements. In addition, our management may make forward-looking statements to analysts, investors, representatives of the media and others. These forward-looking statements are not historical facts and represent only MSCI’s beliefs regarding future events, many of which, by their nature, are inherently uncertain and beyond our control.
In some cases you can identify these statements by forward-looking words such as “may,” “might,” “should,” “anticipates,” “expects,” “intends,” “plans,” “seeks,” “estimates,” “potential,” “continue,” “believes” and similar expressions, although some forward-looking statements are expressed differently. Statements concerning our financial position, business strategy and plans or objectives for future operations are forward-looking statements. These statements are not guarantees of future performance and are subject to certain risks, uncertainties and assumptions that are difficult to predict and may cause actual results to differ materially from the forward-looking statements and from management’s current expectations. Such risks and uncertainties include those set forth under “Risk Factors” in Part I, Item 1A of this Annual Report on Form 10-K. The forward-looking statements in this report speak only as of the time they are made and do not necessarily reflect our outlook at any other point in time. We undertake no obligation to update publicly any forward-looking statements, whether as a result of new information, future events or for any other reason. Therefore, readers should carefully review the risk factors set forth in other reports or documents we file from time to time with the Securities and Exchange Commission (the “SEC”).
Overview
We offer products and services to support the needs of institutional investors throughout their investment processes. Clients look to us for an integrated view of the drivers of risk and return in their portfolios, broad and deep asset class coverage, quality data, an objective perspective and innovation.
Our clients include asset owners (pension funds, endowments, foundations, central banks, sovereign wealth funds, family offices and insurance companies), asset management firms (mutual funds, hedge funds, providers of exchange-traded funds (“ETFs”)), private wealth managers, real estate investment trusts and financial intermediaries (banks, broker-dealers, exchanges, custodians, trust companies and investment consultants).
We provide products and services that support global investing and for decades have helped institutional investors address challenging investment and risk problems. Equity factor investing was pioneered in the 1970s based on research, data and analytics developed by Barra – part of our company since 2004. We continue to innovate in the development of indexes and analytical models; provision of ratings and analysis that enables institutional investors to integrate environmental, social and governance (“ESG”) factors into their investment strategies; and analysis of real estate in both privately and publicly owned portfolios.
Clients use our products and services to help construct portfolios and allocate assets. The analytical content we provide through our products is enabled by applications and are the basis for the services that we provide to clients. Our analytical tools and content help clients measure and manage risk across all major asset classes. Our powerful computational and reporting platform can process large multi-asset class portfolios on an intra-day basis. We offer clients the flexibility to tailor our products and services and integrate them into their own workflows.
Primary Uses of Our Products and Services
Institutional investors use our offerings to achieve a wide range of objectives.
1
Benchmarking —Institutional investors worldwide use our indexes to evaluate the performance of their funds. Our indexes are among the most widely used benchmarks for multi-country passive and active equity strategies worldwide.
Index-linked product creation —Our indexes are used as the basis for products such as ETFs. We are a leading provider of equity indexes to the ETF industry, with approximately 900 ETFs based on our equity indexes listed around the world.
Portfolio construction —Asset managers use our research, data and multi-asset class and multi-currency models to help build portfolios and allocate assets. Our global equity content sets provide tools for portfolio optimization and back-testing. Asset managers also construct portfolios by replicating or tracking our indexes.
Risk management —Our products and services for statistical analysis provide clients with a broad range of risk calculations on a daily basis. One of our best-known statistical models calculates Value at Risk (“VaR”), which estimates the largest possible loss that could be incurred in a portfolio at a specific confidence level over a given period of time. Our Real Estate offerings include risk analytics for a variety of sectors, including residential and retail properties. We offer an extensive library of stress testing scenarios and a suite of stress testing tools that enable clients to design and run stress tests that reflect their own investment views.
ESG integration —MSCI ESG Research provides in-depth ratings and analysis of ESG-related business practices of thousands of companies worldwide. Our ratings and analysis can help institutional investors pursue their sustainable long-term investing goals and uncover risks and opportunities that traditional investment research may not detect.
Performance attribution —We offer a suite of performance attribution models with which to analyze the sources of portfolio performance on an absolute or relative basis, including a platform that helps analyze the strengths and weaknesses of a real estate portfolio’s performance relative to its benchmark. Our products are multi-asset class and multi-currency, and we collect market and portfolio data daily. A streamlined workflow makes attribution reporting intuitive and efficient.
Regulatory reporting —Our products help institutional investors comply with regulatory reporting requirements around the world. Our processing capability enables us to create and implement a broad range of customized reports.
Our Business Model
Our principal business model is to license annual, recurring subscriptions to our products and services for a fee, which is, in a majority of cases, paid in advance. Fees may vary by product or service, number of users or volume of services. Recurring subscription offerings include our managed services offering, whereby we oversee the production of risk and performance reports on behalf of clients.
We also charge clients to use our indexes as the basis for index-linked investment products such as ETFs or as the basis for passively managed funds and separate accounts. These clients commonly pay us a license fee, primarily in arrears, for the use of our intellectual property primarily based on the assets under management (“AUM”) in their investment product.
Certain exchanges use our indexes as the basis for futures and options contracts and pay us a license fee, primarily paid in arrears, for the use of our intellectual property primarily based on their volume of trades.
Clients also subscribe to periodic benchmark reports, digests and other publications associated with our Real Estate products. Fees are primarily paid in arrears after the product is delivered.
We also realize one-time fees related to customized reports, historical data sets and certain implementation and consulting services, as well as from certain products and services that are purchased on a non-renewal basis.
2
Revenues for the year ended December 31, 2016 totaled $1,150.7 million, up 7.0% from the prior year period. Sources of revenue consisted of $913.7 million in recurring subscriptions, $210.2 million in revenue from asset-based fees, and $26.8 million in non-recurring revenue. See Part II, Item 7. “Management’s Discussion and Analysis of Financial Condition and Results of Operations—Results of Operations.”
Our Operating Segments
We operate in four segments: Index, Analytics, ESG and Real Estate. Because the ESG and Real Estate operating segments do not meet segment disclosure reporting thresholds, ESG and Real Estate are combined and presented as part of the All Other segment for reporting purposes. See Note 13, “Segment Information,” of the Notes to Consolidated Financial Statements, included herein, for additional information on our current segment reporting structure.
The following table presents operating revenues and Adjusted EBITDA by reportable segment for the year ended December 31, 2016:
|
|
|
Year Ended December 31, 2016 |
|
||||||||||||||
|
|
|
Operating |
|
|
Percentage of |
|
|
|
Adjusted |
|
|
Percentage of |
|
||||
|
(in thousands) |
|
Revenues |
|
|
Total |
|
|
|
EBITDA (1) |
|
|
Total |
|
||||
|
Index |
|
$ |
613,551 |
|
|
|
53.3 |
% |
|
|
$ |
431,478 |
|
|
|
75.8 |
% |
|
Analytics |
|
|
448,353 |
|
|
|
39.0 |
% |
|
|
|
128,507 |
|
|
|
22.6 |
% |
|
All Other |
|
|
88,765 |
|
|
|
7.7 |
% |
|
|
|
9,472 |
|
|
|
1.7 |
% |
|
Total |
|
$ |
1,150,669 |
|
|
|
100.0 |
% |
|
|
$ |
569,457 |
|
|
|
100.0 |
% |
|
(1) |
See Part II, Item 7. “Management’s Discussion and Analysis of Financial Condition and Results of Operations—Results of Operations” for the definition of Adjusted EBITDA and discussion of Adjusted EBITDA and Segment Results. |
Index Segment
Our indexes are used in many areas of the investment process, including index-linked product creation and performance benchmarking, as well as portfolio construction and rebalancing, and asset allocation. We currently calculate over 190,000 global equity indexes, which include approximately 7,300 custom indexes. As of December 31, 2016, 97 of the top 100 global asset managers (as ranked by Pensions & Investments (“P&I”) in its report dated May 2016) licensed equity indexes from us. Clients receive data directly from us or from one or more third-party providers of financial information that distribute our equity indexes worldwide. The performance of our equity indexes is also referenced frequently when selecting investment managers, assigning return benchmarks in mandates, comparing performance and providing market and academic commentary. The performance of certain of our equity indexes is reported on a daily basis in the financial media.
|
|
• |
MSCI Global Equity Indexes. MSCI Global Equity Indexes include our flagship indexes and are designed to measure returns across a wide variety of equity markets (e.g., Europe, Japan, USA, emerging markets), sizes (e.g., mid and large capitalization), and industries (e.g., banks, media). As of December 31, 2016, we calculated indexes that covered more than 80 countries in developed, emerging and frontier markets, as well as various regional indexes built from the component country indexes. These indexes include the MSCI ACWI, MSCI World, MSCI EAFE, MSCI ACWI IMI, MSCI Emerging Market and MSCI USA Indexes. We believe that MSCI Global Equity Indexes are the most widely used benchmarks by cross-border equity funds. A number of asset owners use the MSCI ACWI IMI Indexes as the policy benchmark for their equity portfolios. |
3
|
|
constraints. They can be used for back-testing strategies or developing specialized investment products, minimizing portfolio tracking error and constructing index-linked products. |
|
|
• |
MSCI Factor Indexes. MSCI Factor Indexes seek to address a growing trend among institutional investors and asset managers whose asset allocation processes include risk groupings such as volatility, income, value and momentum. MSCI Factor Indexes reflect components of equity return that can be attributed to sources of systematic return such as value, size, momentum, volatility, yield and quality. We offer a comprehensive suite of factor index families, including high-exposure factor indexes (e.g., the MSCI Minimum Volatility Index), high capacity factor indexes (e.g., MSCI Value Weighted Indexes), combinations of single factor indexes (e.g., MSCI Quality Mix Index) and multi-factor indexes (e.g., MSCI Diversified Multiple-Factor Indexes). |
|
|
• |
MSCI ESG Indexes. MSCI ESG Indexes are designed to meet the growing demand for indexes that integrate ESG criteria into benchmarks to measure performance for use by institutional investors who wish to adopt a long-term sustainable investment view. They enable clients to issue index-based ESG investment products, to benchmark the performance of ESG portfolios and to measure and report on compliance with ESG mandates. The MSCI ESG Indexes include: |
|
|
• |
MSCI ACWI Sustainable Impact Index that aims to identify companies that derive revenues from products and services that address environmental and social challenges aligned with the Sustainable Development Goals adopted by the United Nations; |
|
|
• |
Socially Responsible Investment (“SRI”) Indexes that exclude companies based on certain values, norms or ethical standards; |
|
|
• |
Environmental Indexes, including Low Carbon Indexes, Fossil Fuels Exclusion Indexes and benchmarks that represent the markets for renewable energy and clean technology; and |
|
|
• |
custom indexes based on client-defined ESG specifications. |
|
|
• |
MSCI Real Estate Indexes. Our Real Estate indexes cover sectors, factors, liquid real estate and custom indexes that span the real estate market. |
|
|
• |
Global Industry Classification Standard (“GICS”®). GICS was developed and is maintained jointly by MSCI and Standard & Poor’s Financial Services, LLC, a subsidiary of S&P Global Inc. (“Standard & Poor’s”). This classification system was designed to respond to clients’ needs for a comprehensive, consistent and accurate framework for classifying companies into industries. GICS is widely accepted as an industry analysis framework for investment research, portfolio management and asset allocation. Our equity indexes classify constituent securities according to GICS. We offer GICS Direct, a joint product of MSCI and Standard & Poor’s. GICS Direct is a database comprised of over 44,000 active companies and more than 54,000 securities classified by sector, industry group, industry and sub-industry in accordance with the proprietary GICS methodology. |
We also continue to enhance and expand successful product offerings, as evidenced by the launch of new indexes (e.g., the MSCI WMA Private Investor Index Series, MSCI Governance-Quality Indexes, MSCI Women’s Leadership Indexes, MSCI Sustainable Impact Index, and MSCI Human & Physical Investment Index) to be used as the basis for ETFs and other financial products.
Analytics Segment
Our Analytics segment uses analytical content to create products and services which offer institutional investors an integrated view of risk and return. Our research-enhanced products and services help institutional investors understand and control for market, credit, liquidity and counterparty risk across all major asset classes, spanning short, medium and long-term time horizons. Our global risk and performance platform is built for scale, enabling clients to conduct complex calculations and stress tests.
Analytics offers products and services that assist institutional investors with portfolio construction, risk management, performance attribution and regulatory reporting. Analytics products and services include:
4
|
|
testing, interactive what-if analysis, counterparty credit exposure and regulatory risk reporting. RiskManager is a scalable platform accessed by clients via a license to a secure, interactive web-based application service. RiskManager is also offered as an outsourced risk reporting service or as a web service in which a client’s systems access RiskManager’s core risk elements by connecting directly to our systems. |
|
|
• |
BarraOne. BarraOne, powered by the Barra Integrated Model (“BIM”), provides clients with global, multi-asset class risk analysis using Barra’s fundamental factor methodology. BarraOne also includes VaR simulation, stress testing, optimization and performance attribution modules that enable clients to manage multi-asset class portfolios, carry out risk budgeting, manager monitoring, performance attribution and regulatory risk reporting. |
|
|
• |
Barra Portfolio Manager. Barra Portfolio Manager is an integrated risk and performance platform that is designed to help fund managers and their teams gain additional portfolio insight, manage their investment process more systematically and make faster, more informed investment decisions. The hosted interactive user interface allows users to analyze risk and return, conduct pre-trade what-if analysis across a number of scenarios and construct portfolios using the Barra Optimizer. It also allows users to decompose the risk and attribute the return of their portfolios according to Barra models. The platform supports optional data management services that allow users to outsource the loading and reconciliation of their portfolio and other proprietary data. |
|
|
• |
Barra Equity Models Direct. Barra Equity Models Direct delivers our proprietary risk data to clients for integration into their own software applications, providing clients with a better understanding of their sources of risk and return, and a factor structure that is aligned to multiple investment horizons which enables them to select the risk data that best suits their investment processes. Barra Equity Models Direct includes Barra Global Total Market Models, Barra Regional Equity Models and Barra Single Country Equity Models. The proprietary risk data in Barra Equity Models Direct is also available via third-party providers. |
|
|
• |
Barra Integrated Model. BIM provides a detailed view of risk across markets and asset classes, including currencies, equities, fixed income, commodities, mutual funds and hedge funds. It begins by identifying the factors that affect the returns of various asset classes, including equity and fixed income securities and currencies. These factors are then combined into a single global model that forecasts the risk of multi-asset class global portfolios. |
|
|
• |
Barra Aegis. Barra Aegis is a sophisticated application for equity risk management and portfolio analysis that is powered by our proprietary equity risk data. It is deployed by the client as a desktop application and is updated daily. Barra Aegis offers an integrated suite of equity investment analytics modules, specifically designed to help clients actively manage their equity risk against their expected returns. It also enables clients to construct optimized portfolios based on client-specified expectations and constraints. |
|
|
• |
HedgePlatform. HedgePlatform, a reporting service, allows clients that invest in hedge funds, including funds of funds, pension funds and endowments, to measure, evaluate and monitor the risk of their hedge fund investments across multiple hedge fund strategies. We collect position-level information from hedge funds on a monthly basis and provide clients with risk information for each individual hedge fund in which they invest as well as aggregate risk information for their overall portfolio of hedge funds. Clients who use RiskManager to measure the risk of their own holdings can further integrate the positions collected via our HedgePlatform service to allow computation of risk across their entire portfolio, while the confidential and proprietary nature of the underlying hedge fund holdings is maintained. HedgePlatform reports include statistics such as exposure (e.g., long, short, net and gross), sensitivities, scenario analysis, stress tests and VaR analysis. |
|
|
• |
InvestorForce. InvestorForce products offer performance reporting solutions to the institutional investment community in the United States by providing investment consultants with an integrated solution for daily monitoring of, analysis of and reporting on institutional assets. InvestorForce products also offer clients access via a web portal to a database that includes portfolio analytics and transaction and holdings information, which is updated in real time as data is collected from custodial banks and fund managers. |
5
|
|
• |
CreditManager. CreditManager is a portfolio credit risk management system used primarily by banks to calculate economic capital, facilitate risk-based pricing and measure credit risk concentrations. The application is designed to consolidate and compare risks and opportunities across multiple credit exposures including bonds, credit derivatives and traditional lending. |
All Other Segment—ESG
MSCI ESG Research analyzes thousands of companies worldwide to help institutional investors understand how environmental, social and governance (ESG) factors can impact the long-term risk of their investments. As of December 31, 2016, subscribers to MSCI ESG Research included 82 of the top 100 global asset managers (as ranked by P&I in its report dated May 2016), as well as leading asset owners, consultants, advisers and academics.
In addition, MSCI ESG Research data and ratings are used in the construction of equity and fixed income indexes to help institutional investors more effectively benchmark ESG investment performance, issue index-based investment products, as well as manage, measure and report on ESG mandates.
MSCI’s ESG products include:
|
|
• |
MSCI ESG Ratings. MSCI ESG Ratings are designed to identify ESG risks or opportunities that may not be captured through conventional analyses. This includes ratings, as of December 31, 2016, for more than 6,500 companies worldwide, including over 6,000 equity issuers and 400 issuers of fixed income securities including corporate bonds, sovereigns and other government related issuers. Ratings are designed to identify and analyze ESG issues, including exposures (e.g., business segment and geographic risk), management and industry-specific measures that may include the intersection of a company’s major social and environmental impacts with its core business operations, thereby identifying potential risks and opportunities for the company and its investors. |
|
|
• |
MSCI ESG Business Involvement Screening Research. MSCI ESG Business Involvement Screening Research is a screening service that is designed to enable institutional investors to manage ESG standards and restrictions reliably and efficiently. Managers, advisers and asset owners can access screening research through the online MSCI ESG Manager platform or a data feed to satisfy their clients’ investment guidelines, implement client mandates and manage potential ESG portfolio risks. |
|
|
• |
MSCI ESG Governance Metrics. MSCI ESG Governance Metrics provides institutional investors with corporate governance research and data on more than 7,000 public companies worldwide. The assessment model is based on 96 unique metrics organized into four individual scoring pillars, designed to provide consistency, transparency and structural integrity. |
All Other Segment—Real Estate
Our Real Estate products provide real estate performance analysis for funds, investors, managers and lenders. We provide products and offer services that include research, reporting and benchmarking. Our Real Estate performance and risk analytics range from multi-asset class to property-specific analysis. We also provide business intelligence to real estate owners, managers, developers and brokers worldwide.
Real Estate products and services comprise private real estate benchmarks and indexes typically branded “IPD” and include:
6
|
|
help them make informed investment decisions. Performance attribution enables users to analyze the sources of portfolio risk and return on an absolute or relative basis. PAS provides real estate investors with a granular understanding of the exposures and returns of their real estate portfolio, from the building to the fund level. |
|
|
• |
IPD Global Intel. IPD Global Intel is a databank that equips asset owners, researchers, strategists and portfolio and risk managers with data analytics to enhance their understanding of local, regional and global real estate performance and risks. IPD Global Intel comprises a consolidated set of global, regional, national, city and submarket indexes with breakdowns by property type. Drawing from actual performance data on approximately 1,700 index funds and 89,000 real estate assets, IPD Global Intel provides investors and managers an authoritative view of market trends and time series, as well as actionable information on property markets for more than 30 countries as of December 31, 2015. |
|
|
• |
IPD Rental Information Service (“IRIS”). IRIS is a platform for managing real estate income risk based on the profile of a portfolio’s contractual income. IRIS provides insight into the absolute and relative impact of four main income risk factors: lease term, embedded gain or loss from the contractual lease of each tenant based on the current market rent for such lease, creditworthiness of tenant and concentrations of income across tenants, assets, markets and industry sectors. |
Growth Strategy
We believe we are well positioned for growth. Our multi-pronged strategy is focused on addressing the most critical needs of institutional investors and building on our strong client relationships and the integral role that our products and services play in the investment process.
Client Growth
We believe there are opportunities to expand our business with existing clients and to add new clients. We intend to:
|
|
• |
Increase subscriptions within our current client base. We expect that our products and services will enable us to offer clients more ways to achieve their current and future objectives. Many of our clients use only a limited number of our offerings, and we believe there are opportunities to sell additional products and services to existing clients and to increase the number of users and locations. We believe our knowledge of our clients and our familiarity with their investment processes puts us in a unique position that enables us to license additional products to them. |
|
|
• |
Expand our client base. We seek to add new clients by increasing our sales efforts and by leveraging the investments made in recent years, including transitioning away from our historic product-centric approach to a client needs-centric approach by merging our legacy product brands under an umbrella MSCI brand. We also believe that efforts to expand our geographic presence in recent years (33 offices serving clients in 87 countries) have positioned us to further leverage our brand strength, product reach and access to the global investment community to attract new clients and capitalize on growing demand for investment decision support tools. |
|
|
• |
Focus on client relationship management. As the objectives of our clients change, we continue to respond with products and services that address their evolving strategic and investment needs. In recent years, we have realigned our global client coverage function to sharpen our focus on current clients and improve our ability to identify new prospects. In 2016, we created the position of Chief Client Officer, who oversees the functions of client coverage, marketing and corporate communications with the goal of integrating our outreach to clients and prospects, sales and marketing strategy and client service. We have also transformed our Analytics offerings across multiple dimensions, including strategy, product development, execution and governance. To ensure that we provide world-class service to our largest accounts, we have assigned senior account managers (“SAMs”) to approximately 100 of our top clients and key account managers to cover such accounts on a dedicated basis. We are developing services and custom solutions involving a range of technical experts who operate in teams that interact with clients from pre-sales (e.g., Sales, Technical Sales Support, Product Management and Applied Research) to post-sales (e.g., Implementation, Consultants and Solution Management). |
7
Number of Exchange Listings of ETFs Linked to MSCI Equity Indexes (1)
|
|
|
As of |
|
|||||||||
|
|
|
December 31, |
|
|
December 31, |
|
|
December 31, |
|
|||
|
Region |
|
2016 |
|
|
2015 |
|
|
2014 |
|
|||
|
Americas |
|
|
307 |
|
|
|
273 |
|
|
|
239 |
|
|
EMEA |
|
|
521 |
|
|
|
466 |
|
|
|
409 |
|
|
Asia |
|
|
82 |
|
|
|
59 |
|
|
|
39 |
|
|
Total |
|
|
910 |
|
|
|
798 |
|
|
|
687 |
|
(1) Data calculated by aggregating the number of share classes of all exchange traded funds tracking an MSCI index, as identified by separate Bloomberg tickers using MSCI classification. Only primary listings, and not cross-listings, are counted.
Historical values of the assets in ETFs linked to our indexes are set forth in a table under Part II, Item 7. “Management’s Discussion and Analysis of Financial Condition and Results of Operations—Results of Operations” below.
|
|
• |
Increase managed services offerings. Continued pressure on management fees is causing our clients to look for ways to become more operationally efficient. Our Managed Services include end-to-end services that aim to assist clients with meeting operational and regulatory requirements by providing a convenient and cost-effective way to outsource data processing and reporting. Our clients outsourcing of these functions to our data management professionals enables them to focus more on value-added work such as risk budgeting, asset allocation, manager selection and monitoring. Our end-to-end services include consolidation of data from various sources, data reconciliation analysis, uploading of data into our risk and portfolio management applications, identification of anomalies and customized reporting at our clients’ direction. |
Develop New Offerings, Enhance Existing Products and Services and Provide Value-Added Services
We continue to develop new offerings, enhance our current products and services and provide value-added services. Much of our product and content development is based on an ongoing and active dialogue with clients, which helps us to understand their needs and anticipate market developments. We intend to:
|
|
• |
Create innovative product and service offerings and enhance existing offerings. We see strong demand for products and services that can help clients create, implement and manage their investment strategies. We strive to transform clients’ challenges into opportunities by introducing innovative new products and enhancements to existing offerings. In Index, this includes developing new standard or custom indexes. In Analytics, we are transforming our platform with the aim of allowing investors to consolidate all MSCI content in one platform, discover drivers of return and risk across their portfolios and share their analysis with stakeholders. We also announced substantial updates in 2016 to our fixed income factor model that will help clients manage credit risk in fixed income portfolios. We are also expanding our products and services to further address the needs of fixed income investors. For example, we recently introduced a new model for bank loans. As consideration of ESG factors moves more into the mainstream of investing, we are developing new research and ratings products that assess corporate responsibility. Additionally, in Real Estate, we are building new products to address the needs of closed-end funds in the value-add and opportunistic spaces. We also aim to expand our coverage in emerging institutional markets across the European continent, Asia and South America. |
8
|
|
• |
Grow through acquisitions. We intend to continue to seek to acquire products, technologies, services and companies that will complement our product offerings and client base, as well as increase our ability to provide investment decision support tools to equity, fixed income and multi-asset class investment institutions, and the financial intermediaries that serve such institutions. |
Competitive Advantages
We believe our competitive advantages include:
|
|
• |
Strong client relationships and a deep understanding of client needs. We believe that our relationships with the leading institutional investors are broader and more global than those of our peers. Our vantage point enables us to view financial markets in terms of what matters to global investors and financial institutions. We consult with clients and other market participants during the product development process to take into account their objectives and needs. From 33 offices in the Americas, EMEA and Asia, we engage in conversations with institutional investors looking beyond geographic boundaries and asset classes to produce content and insights about global risk-taking and opportunity. We believe that our consultative approach to product development, dedication to client support and our range of products and services enable us to build strong relationships with investment professionals and institutions around the world. The skills, knowledge and experience of our research, applications development, global sales, data management and production and product management teams enable us to develop and enhance our models, methodologies, data and applications to meet client needs. As of December 31, 2016, our clients included: |
|
|
• |
97 of the top 100 global asset managers (as ranked by P&I in its report dated May 2016); |
|
|
• |
90 of the top 100 global pension funds (as ranked by P&I/Towers Watson in their report dated September 2016); |
|
|
• |
79 of the top 100 global hedge funds (as ranked by Preqin as of 2016); and |
|
|
• |
87 of the top 100 global banks (as ranked by The Banker Database as of December 2015). |
|
|
• |
High data quality. We offer proprietary software and databases that house data from more than 200 third-party sources as well as our proprietary data. Our data-management teams work to achieve the highest standards for data quality and accuracy. We currently calculate more than 190,000 end-of-day indexes daily and more than 10,000 indexes in real time. |
|
|
• |
Extensive historical databases. We have amassed extensive databases of historical global market data, proprietary equity index data, private real estate benchmark data, risk data and ESG data. Historical data is a critical component of our clients’ investment processes, allowing them to research and back-test investment strategies and analyze portfolios over many investment and business cycles and under a variety of historical situations and market environments. We believe our databases of research-enhanced data, including more than 45 years of certain index data history, nearly 35 years of certain risk and real estate data history, as well as more than 15 years of certain historical governance data, would be difficult and costly to replicate. The information is not available from any single source and would require intensive data checking and quality assurance testing that we have performed over our many years of accumulating this data. |
9
|
|
our clients are requested by their customers to report using our products or data. Additionally, our products and services can help clients comply with local regulations or client reporting requirements. Consequently, we believe that certain of our clients may experience business disruption and additional costs if they cease using or replace our products or services. |
|
|
• |
Strong brand recognition. We believe that our brand is well-established and recognized throughout the institutional investment community worldwide. The strength of our brand reflects the longstanding quality and widespread use of our products and services. We believe our indexes, data and models are well-positioned to be the tools of choice for investment institutions increasingly looking to third-party products and services for help with benchmarking, index-linked product creation and portfolio and multi-asset class market risk management. |
|
|
• |
Global products and operations. Our products cover most major investment markets throughout the world. For example, the MSCI Global Equity Index family provides broad equity market coverage for over 80 countries in our developed, emerging and frontier market categories. Additionally, we produce 49 single country models, 10 regional or global models and an integrated multi-asset class risk model covering 90 equity markets, 60 fixed income markets, 161 currencies and alternative asset classes including private assets and commodities. As of December 31, 2016, our clients were located in 87 countries, with many of them having a presence in multiple locations around the world. As of December 31, 2016, our employees were based in 21 countries in order to maintain close contact with our clients and the international markets we follow. We believe our global presence and focus enable us to serve our clients well and capitalize on a great number of business opportunities in many countries and regions of the world. |
|
|
• |
Flexibility to address investors’ needs. Our competitive advantages – proprietary content combined with applications and services that help clients solve large-scale, complex investment problems – enable us to compete with both specialty firms and providers of integrated platforms. |
|
|
• |
Sophisticated models with practical application. We have invested significant time and resources for more than three decades in developing sophisticated, innovative and practical index methodologies and risk models that combine financial theory and investment practice. We continually enhance our models to reflect the evolution of markets and to incorporate methodological advances into risk forecasting. |
|
|
• |
Open architecture and transparency. We have an open architecture philosophy aimed at increasing data access and integration features in our products and services. Clients can access our data through our applications, third-party applications or their own applications. We also recognize that the marketplace is complex and multi-layered, as a competitor in one context may be a supplier or distributor in another context. For example, Standard & Poor’s competes with us in indexes, supplies index data that we distribute in our portfolio analytics software products and jointly developed and maintains GICS and GICS Direct with us. In order to provide transparency, we document and disclose many details of our models and methodologies to our clients so that they can better understand and utilize our products and services. We believe our open architecture approach and commitment to transparency benefits us and our clients. |
|
|
• |
Scalable application platforms. We will continue to invest in our data centers, technology platforms and software products to provide scalable solutions for the processing of large volumes of asset and portfolio data. In doing so, we are able to offer clients computing capacity that they would otherwise not be able to access in a cost-effective manner through internal development. |
|
|
• |
Highly skilled employees. Our workforce is skilled, technical and, in some instances, specialized. In particular, our research and application development departments include individuals with backgrounds in mathematics, statistics, finance, portfolio investment and application development who combine advanced academic credentials with market experience. Our employees’ experience and knowledge give us access to, and allow us to add value at, the highest levels of our clients’ organizations. |
10
As of December 31, 2016, we served 6,500 clients across 87 countries worldwide, with 52.3% of revenues coming from clients in the Americas, 35.2% in EMEA and 12.5% in Asia and Australia. To calculate the number of clients, we may count certain affiliates, user locations, or business units within a single organization as separate clients. For example, the asset management and broker-dealer units of a diversified financial services firm may be treated as separate clients, even though the financial services firm is the only party to the applicable subscriptions or licenses. If we aggregate all related clients under their respective parent entity, the number of clients would be approximately 3,900, as of December 31, 2016.
Our Aggregate Retention Rate was 92.7% and 93.4% for the years ended December 31, 2016 and 2015, respectively. See Part II, Item 7. “Management’s Discussion and Analysis of Financial Condition and Results of Operations—Key Financial Metrics and Drivers— Operating Metrics—Aggregate Retention Rate ” for the definition of Aggregate Retention Rate and more detailed aggregate retention rate data.
Revenues from our 10 largest clients contributed a total of 25.7%, 26.0% and 25.8% to our total revenues for the years ended December 31, 2016, 2015 and 2014, respectively.
In the years ended December 31, 2016, 2015 and 2014, our largest client organization by revenue, BlackRock, Inc. and its affiliates (“BlackRock”), accounted for 9.4%, 10.3% and 10.6% of our operating revenues, respectively. For the years ended December 31, 2016, 2015 and 2014, 93.7%, 93.0% and 92.1%, respectively, of our revenues from BlackRock were attributable to asset-based fees on the AUM of ETFs linked to MSCI equity indexes, including its iShares ETF business.
Geographic Information
We currently have branches or subsidiaries in the following locations: Australia, Brazil, Canada, China, England, France, Germany, Hong Kong, Hungary, India, Italy, Japan, Korea, Mexico, the Netherlands, the Philippines, Singapore, South Africa, Sweden, Switzerland, Taiwan, United Arab Emirates and the U.S. See Note 13, “Segment Information,” of the Notes to Consolidated Financial Statements included herein for additional information on our revenues and certain assets by geographic area.
Marketing, Sales and Client Coverage
In 2016, we consolidated our marketing, sales and client coverage functions with the goal of better helping our clients meet their strategic initiatives, improving sales and client retention through targeted client marketing and increasing transparency within our global team and operations.
Marketing
Our marketing team’s primary focus is to promote and empower our brand. We communicate with both existing clients and prospective clients through our email newsletters which deliver research, insights and news about our content, through our public website, client portals, and via social media. We supplement these direct marketing efforts with targeted online advertising and co-branding initiatives with some of our major clients. We also issue press releases from time to time on client wins, new research and product and services developments.
Additionally, our employees play a pivotal role in ensuring the success of our marketing strategy. Our marketing professionals arrange interviews for our industry and content experts in prominent financial and trade media. Members of our research team and other employees regularly speak at industry conferences, as well as at our own events. For example, we hosted approximately 700 seminars, webinars, conferences and workshops in various locations across the globe in 2016. These events bring our staff and our clients together, expose those clients to our latest research and product enhancements, and give our staff an opportunity to gain insight into our clients’ needs.
Sales and Client Coverage
Our client coverage team is responsible for our sales and client support functions. Our geographic reach enables us to support our large global client base and provide valuable face-to-face client service. As of December
11
31, 2016, our client coverage team included approximately 200 salespeople and over 250 client support personnel in 33 offices worldwide that supported clients in 87 countries.
Our client coverage teams are organized by client segment, product and service offerings and region. From time to time, we consolidate our client coverage teams to better support our clients’ needs. For example, we consolidated the legacy risk management analytics and portfolio management analytics sales teams into one integrated team while incorporating ESG and Real Estate sales and service teams into our overall client coverage organization. In 2016, we focused on our optimized distribution model which is based on client outreach, client engagement and the client experience, all of which are intended to ensure that our clients’ diverse and evolving strategic objectives are fully supported. In 2016, the SAMs program improved our ability to more strategically engage with senior clients, up to and including CEOs. Each SAM is focused on understanding client strategy to enable us to better address our clients’ challenging investment issues through our products and services. We also implemented the Coverage target-based incentive plan (“CIP”). The CIP initiative further incentivizes our client coverage personnel by aligning each eligible employee’s target annual incentive with key performance metrics in accordance with our overall goals and strategy.
Product Development and Production
We take a coordinated team approach to product development and production. Our product management, research, data operations and technology and application development departments are at the center of this process. Our research and product management teams seek to understand our clients’ investment processes and needs in order to design products and services that help clients understand the dimensions of performance and risk in their portfolios and make better-informed investment decisions. For more information about our research and development and associated costs, see Note 1, “Introduction and Basis of Presentation—Significant Accounting Policies, Research and Development” of the Notes to Consolidated Financial Statements included herein and “Research and development” in the Consolidated Statements of Income for the years ended December 31, 2016, 2015 and 2014.
Drawing on decades of experience with the investment process worldwide, our research department develops, reviews and enhances our various methodologies and models. Our global data operations and technology team designs and manages our processes and systems for market data procurement, proprietary data production and quality control. Our application development team builds our sophisticated applications. As part of our product development process, we also commonly consult with clients and other market participants to understand their specific needs and investment process requirements. Our product management team facilitates this collaborative product development and production approach. The roles and functions of our product development and production teams include:
|
|
• |
Research. Our models are developed by a cross-functional research team of mathematicians, economists, statisticians, financial engineers and investment industry experts. Employees in our index and risk and analytics research departments have both advanced academic credentials and broad financial and investment industry experience. They work on both developing new models and methodologies and enhancing existing ones. We monitor investment trends and their drivers globally; analyze product-specific needs in areas such as capitalization-weighted, factor and specialized indexes; and examine instrument valuation, risk modeling, portfolio construction, asset allocation and VaR simulation. An important way we monitor global investment trends and their implications for our business is through the forum provided by our Editorial Advisory Board (“EAB”). Our EAB, which was established in 1999, meets twice a year and is comprised of senior investment professionals from around the world and senior members of our performance and risk research team. In 2016, our performance and risk researchers participated in numerous industry events and conferences, and their papers have been published in leading academic and industry journals. They also play a leading role in many of the seminars, workshops and webinars we host throughout the year, presenting and discussing their latest research findings with both existing and prospective clients. |
12
|
|
Our experienced information technology staff builds proprietary software and databases that house all of the data we license or produce in order for our data operations team to perform data quality checks and run our data production systems. Our applications and data reside on servers, networks and databases engineered and managed by our IT Infrastructure team, and operated and monitored by our IT Operations team. This technology suite resides in our global data centers in Nevada, U.S. and Geneva, Switzerland. Our data factory produces our proprietary index data such as end-of-day and real time equity indexes, real estate benchmarks, and our proprietary risk data such as daily and monthly equity risk forecasts, real estate performance and risk reporting and MSCI ESG Research reports. We have data operations and technology offices in North America, Europe and Asia. |
|
|
• |
Application Development. Certain of our proprietary risk data are made available to clients through our proprietary applications, such as Barra Aegis, BarraOne, RiskManager, WealthBench, Credit Manager and ESG Manager. Our application development team consists of individuals with experience in both the finance and software industries. Our staff has an extensive skill set, including expertise in both the Java-based technologies used in our web-based, on-demand software application tool for multi-asset class risk analysis and reporting and Microsoft-based technologies used in our desktop equity and fixed income analytics software applications. We also have extensive experience with database technologies, computational programming techniques, scalability and performance analysis and quality assurance. We use a customized code base and software development methodology that leverages best practices from the software industry, including agile programming, test-driven development, parallel tracking, iterative cycles, prototyping and beta releases. We build our applications by compiling multiple components, which enables us to reuse designs and codes in multiple applications. Our software development projects involve extensive collaboration with our product management team and directly with clients. We have application development offices in the U.S., Europe and Asia. |
Competition
Many industry participants compete with us by offering one or more similar indexes. Such indexes vary widely in scope, including by geographic region, business sector and risk category and may be used by clients in a variety of ways in many different markets around the world. A number of these markets have become increasingly competitive in recent years.
Among our Index competitors are FTSE Russell, a subsidiary of The London Stock Exchange Group PLC and S&P Dow Jones Indices LLC (a joint venture company owned by CME Group, Inc. and CME Group Services LLC and by S&P Global Inc.).
There is also growing competition from asset managers and investment banks that create their own indexes often in cooperation with index providers, which may, among other things, provide some form of calculation agent service. This is especially true for factor indexes, often referred to as “smart beta indexes.” Asset managers, such as WisdomTree and Goldman Sachs Asset Management, manage funds or ETF indexes based on their own proprietary indexes, and many investment banks have launched structured products or entered into OTC derivatives based on their own proprietary indexes.
Many industry participants compete with us by providing one or more similar offerings in a very competitive marketplace for risk management data and analytics.
Our Analytics products and services compete with offerings from a range of competitors, including Axioma, Inc., BlackRock Solutions, Bloomberg Finance L.P., and FactSet Research Systems Inc. Additionally, many of the larger broker-dealers have developed proprietary analytics tools for their clients. Similarly, many investment institutions, particularly the larger global organizations, have developed their own internal risk management analytics tools.
We also have a variety of competitors for our other products that comprise a smaller portion of our revenues.
13
Intellectual Property and Other Proprietary Rights
We consider many aspects of our products, processes and services to be proprietary. We have registered, among others, “MSCI,” “Barra,” “RiskMetrics,” “RiskManager,” “FEA,” “InvestorForce,” and “IPD” as trademarks or service marks in the United States and in certain foreign countries. We will continue to evaluate the registration of additional trademarks, service marks and copyrights as appropriate. From time to time, we also file patent applications to protect our proprietary rights. We currently hold 23 U.S. and foreign patents and have one U.S. patent pending. Additionally, many of our products, processes and services require the use of intellectual property obtained from third parties. It may be necessary in the future to seek or renew licenses relating to various aspects of our products and services.
Although we believe the ownership of such patents, copyrights, trademarks, service marks, the implementation of certain measures to protect our intellectual property and proprietary rights and our ability to obtain the rights to use intellectual property of third parties are important to our business and contribute in part to our overall success, we do not believe we are dependent on any one of our intellectual property rights or any one license to use third-party intellectual property. For a description of the risks associated with legal protection of our intellectual property and other rights, infringement claims and the ability to obtain or renew licenses for third-party intellectual property, see Part I, Item 1A. “Risk Factors— Legal Protections for our intellectual property rights and other rights may not be sufficient or available to protect our competitive advantages. Third parties may infringe on our intellectual property rights, and third-party litigation may materially adversely affect our ability to protect our intellectual property rights” below.
Company History
The following is a summary of the Company’s history since its inception:
MSCI Timeline
|
|
|
|
|
|
|
1969 |
|
• |
|
Capital International pioneered the development of global equity indexes and began licensing its first equity indexes in 1969. |
|
|
|
|
||
|
1998 |
|
• |
|
We were incorporated in 1998 and became a public company in November 2007. Our only two shareholders were Morgan Stanley and Capital Group International. |
|
|
|
|
||
|
2004 |
|
• |
|
In June 2004, we acquired Barra, LLC (formerly Barra, Inc., “Barra”), a provider of portfolio risk analytics tools that launched its first risk analytics products in 1975. This broadened our product range beyond indexes. |
|
|
|
|
||
|
2007 |
|
• |
|
In November 2007, we completed our initial public offering. |
|
|
|
|
||
|
2008 |
|
• |
|
In April 2008, Capital Group International divested its ownership position. |
|
|
|
|
||
|
2009 |
|
• |
|
In May 2009, Morgan Stanley divested its ownership position and we became a fully independent, stand-alone public company. |
|
|
|
|
||
|
2010 |
|
• |
|
In June 2010, we acquired RiskMetrics Group, Inc. (“RiskMetrics”), a leading provider of risk management products and services. In addition to this core product line, RiskMetrics owned Institutional Shareholder Services Inc. (“ISS”), a pioneer in the development of policy-based proxy voting recommendations and a leading provider of governance products and services. |
|
|
|
|
||
|
|
|
• |
|
RiskMetrics also owned the Center for Financial Research and Analysis (“CFRA”), Innovest Strategic Value Advisors, Inc. (“Innovest”) and KLD Research and Analytics (“KLD Research”). Innovest and KLD Research are now known as MSCI ESG Research LLC (“MSCI ESG Research”). |
|
|
|
|
||
|
|
|
• |
|
In July 2010, we acquired Measurisk, LLC (“Measurisk”), a provider of risk transparency and risk measurement tools for hedge fund investors. With our clients’ demanding increasing levels of transparency from their hedge fund managers, this acquisition helped us develop a broad platform and set the standard for analyzing and reporting hedge fund risk. Measurisk’s products are now part of our hedge fund risk transparency offerings. |
14
|
|
|
|
||
|
2012 |
|
• |
|
In November 2012, we acquired real estate performance measurement group IPD Group Limited (“IPD”). The acquisition of IPD expanded our multi-asset class offerings by facilitating the integration of private real estate assets into our models, as well as adding a family of real estate indexes to our suite of equity indexes. |
|
|
|
|
||
|
2013 |
|
• |
|
In January 2013, we acquired Investor Force Holdings, Inc. (“InvestorForce”), a leading provider of performance reporting tools to the institutional investment community in the U.S. The InvestorForce offering enables us to provide consultants with integrated, daily monitoring, analysis of and reporting on institutional assets. |
|
|
|
|
||
|
|
|
• |
|
In March 2013, we completed the sale of the CFRA product line. |
|
|
|
|
|
|
|
|
|
|
||
|
2014 |
|
• |
|
In April 2014, we completed the sale of ISS, which was not deemed to be core to our strategy. |
|
|
|
|
||
|
|
|
• |
|
In August 2014, we acquired Governance Holdings Co. (“GMI Ratings”), a provider of corporate governance research and ratings to institutional investors, banks, insurers, auditors, regulators and corporations seeking to incorporate ESG criteria into risk assessment and decision-making. This acquisition enhanced our existing platform of ESG research and tools, allowing us to deliver a more comprehensive suite of ESG data, applications and services to our clients. |
|
|
|
|
||
|
2015 |
|
• |
|
In October 2015, we acquired all of the assets of Insignis, Inc. (“Insignis”), a leading provider of daily automated collection, aggregation and management of financial data. This acquisition helped us further automate the collection and integration of data across our risk and performance management platforms. |
|
|
|
|
||
|
2016 |
|
• |
|
In August 2016, we completed the sale of the Real Estate occupiers business, which was acquired as part of the IPD acquisition in 2012. |
For more information about our acquisitions and dispositions, see Note 12, “Dispositions and Discontinued Operations,” and Note 11, “Acquisitions,” of the Notes to Consolidated Financial Statements included herein.
Employees
We had 2,862 and 2,754 employees as of December 31, 2016 and 2015, respectively. As of December 31, 2016 and 2015, 56.2% and 52.8% of our employees, respectively, were located in emerging market centers.
Government Regulation
The Company is subject to reporting, disclosure and recordkeeping obligations pursuant to SEC requirements. MSCI ESG Research is a registered investment adviser and must comply with the requirements of the Investment Advisers Act of 1940 and related SEC regulations. Such requirements relate to, among other things, disclosure obligations, recordkeeping and reporting requirements, marketing restrictions and general anti-fraud prohibitions. We registered in 2012 with the State Council Information Office of the Ministry of Commerce and the State Administration for Industry and Commerce in China as a foreign institution supplying financial information services in China. See Part I, Item 1A. “Risk Factors— Changes in government regulations, including the implementation of new or pending financial regulations or the repeal of existing financial regulations, could materially adversely affect our business, financial condition or results of operations.”
Executive Officers
|
Name |
|
Age |
|
Position |
|
Henry A. Fernandez |
|
58 |
|
Chairman, Chief Executive Officer and President |
|
Kathleen A. Winters |
|
49 |
|
Chief Financial Officer |
|
Remy Briand |
|
51 |
|
Head of ESG and Real Estate |
|
Scott A. Crum |
|
60 |
|
Chief Human Resources Officer |
|
Jorge Mina |
|
42 |
|
Head of Analytics |
|
Richard J. Napolitano |
|
50 |
|
Principal Accounting Officer and Global Controller |
15
|
|
52 |
|
Chief Operating Officer |
|
|
Laurent Seyer |
|
52 |
|
Chief Client Officer |
|
Diana H. Tidd |
|
47 |
|
Head of Index |
|
Peter J. Zangari |
|
49 |
|
Global Head of Research and Product Development |
Henry A. Fernandez
Mr. Fernandez has served as the Chairman since October 2007 and as the Chief Executive Officer (“CEO”), President and a director since 1998. Before leading MSCI’s transition to becoming a fully independent, standalone public company in 2009, he was a Managing Director at Morgan Stanley, where he worked in emerging markets product strategy, equity derivative sales and trading, mergers and acquisitions, worldwide corporate finance and mortgage finance for U.S. financial institutions. Mr. Fernandez worked for Morgan Stanley from 1983 to 1991 and from 1994 to 2009. Mr. Fernandez serves on the board of trustees of Stanford University and the board of directors of Georgetown University. He also serves on the boards of the Hoover Institution at Stanford University, the Foreign Policy Association, Memorial Sloan-Kettering Cancer Center, Catholic Charities of the Archdiocese of New York and the American Nicaraguan Foundation. Mr. Fernandez is the former Chair of the Advisory Council of the Stanford University Graduate School of Business. He holds a Bachelor of Arts in economics from Georgetown University, an M.B.A. from the Stanford University Graduate School of Business and pursued doctoral studies in economics at Princeton University.
Kathleen A. Winters
Ms. Winters has served as the Chief Financial Officer (the “CFO”) since May 2016. Prior to joining MSCI, Ms. Winters served as the Vice President and Chief Financial Officer of Performance Materials and Technologies, an operating segment of Honeywell International, Inc. (“Honeywell”) from 2012 to 2016. She served in various positions of increasing responsibility at Honeywell from 2002 to 2016, including Vice President, Corporate Controller and Chief Accounting Officer, Vice President of Business Analysis and Planning, and Chief Financial Officer of the Specialty Products business group. Ms. Winters began her career at PricewaterhouseCoopers LLP (“PwC”) where she served in various positions from 1989 to 2001 within the Technology Information Communications and Entertainment practice. She earned her Bachelor of Science degree in Accounting from Boston College.
Remy Briand
Mr. Briand was appointed the head of MSCI’s ESG and Real Estate segments in June 2016. In such capacity, he is responsible for MSCI’s ESG (environmental, social and governance) ratings products as well as MSCI’s Real Estate benchmarking and analytics services. Mr. Briand has led various aspects of the ESG business since its acquisition in 2010. He also previously served as Global Head of Research for the entire Company from February 2015 until February 2017 where he led a team of 150 researchers designing indexes, analytics and risk models for institutional investors and producing ESG ratings and research on thousands of companies. Prior to February 2015, Mr. Briand was the Head of Index Research for 10 years, where he managed the expansion of the MSCI Global Indexes to cover 80 developed, emerging and frontier markets and initiated and led the development of MSCI’s market leading factor indexes. Mr. Briand joined MSCI in 2001 from Credit Lyonnais Asset Management, where he was an equity portfolio manager and head of research. He began his career as a private equity analyst at Credit Lyonnais. He holds an MSc in Computer Sciences from INSA (Lyon) and an MBA from HEC (Paris).
Scott A. Crum
Mr. Crum has served as the Chief Human Resources Officer since April 2014. Prior to joining MSCI, Mr. Crum served as global head of human resources for four publicly traded companies. Mr. Crum worked for Avon Products, Inc. as Senior Vice President of Human Resources and Chief People Officer from September 2012 to May 2013. From July 2010 to June 2012, Mr. Crum served as Senior Vice President and Chief People Officer of Motorola Mobility Holdings, Inc., one of two publicly traded companies formally created when Motorola Inc. split in January 2011. Prior to that, he served as the Senior Vice President and Director of Human Resources of ITT Corporation from September 2002 to July 2010 and Senior Vice President of Administration and Employee
16
Resources at General Instruments Corp. from 1997 to 2000. Mr. Crum holds a Bachelor of Business Administration with a concentration in industrial relations from Southern Methodist University.
Jorge Mina
Mr. Mina has served as the Head of Analytics since February 2017. In this role, he is responsible for MSCI’s equity and multi-asset class risk and portfolio management products. Prior to this, he had served as Head of Analytics for the Americas since 2015. Mr. Mina joined MSCI in 2010 following MSCI’s acquisition of RiskMetrics and served as a managing director of Risk Management Analytics from 2010 to 2015. Prior to joining MSCI, Mr. Mina served in a variety of roles at RiskMetrics, including co-head of the RiskMetrics Business and Head of Research. Mr. Mina holds a Bachelor of Arts degree in actuarial sciences from the Instituto Tecnológico Autónomo de México and a Master’s in financial mathematics from the University of Chicago.
Richard J. Napolitano
Mr. Napolitano has served as the Principal Accounting Officer since February 2014 and Global Controller since June 2011. Prior to joining MSCI, Mr. Napolitano worked at Morgan Stanley from 2005 to 2011, J.P. Morgan Chase from 1996 to 2005 and Ernst & Young from 1988 to 1996. At these firms, he held various positions including, among others, Business Unit or Product Chief Financial Officer or Controller, Head of External Reporting and Accounting Policies and Audit Senior Manager. Mr. Napolitano earned his Bachelor of Science in accounting and an M.B.A. in finance from the Leonard N. Stern School of Business at New York University. He is also a member of the American Institute of Certified Public Accountants.
C.D. Baer Pettit
Mr. Pettit has served as the Chief Operating Officer since October 2015. As such, Mr. Pettit oversees the firm’s operations, technology and product lines. Before taking on his current role, Mr. Pettit served as Head of the Product Group from February 2015 to September 2015, Head of Client Coverage from 2001 to August 2012, Head of Marketing from 2005 to August 2012 and Head of Index Products from September 2011 to September 2015. Prior to joining MSCI, Mr. Pettit worked for Bloomberg L.P. from 1992 to 1999, most recently as Deputy Head of European Sales. He holds a Master of Arts degree in history from Cambridge University and a Master of Science degree from the School of Foreign Service at Georgetown University.
Laurent Seyer
Mr. Seyer has served as Chief Client Officer since September 2016. In such capacity, Mr. Seyer is responsible for the firm’s sales, marketing, account management and client service teams globally. Before taking on his current role, Mr. Seyer served as the Global Head of Client Coverage from December 2014 to September 2016. Prior to joining MSCI, Mr. Seyer worked for AXA Investment Managers LLC in Paris, most recently as Global Head of the Client Group. Prior to that, he spent 24 years at Societe Generale in a number of leadership positions, including as CEO of Lyxor Asset Management from 2006 to 2012, and held senior roles in equity derivatives and structured product sales, mergers and acquisitions, corporate finance, and corporate development and business strategy. Mr. Seyer graduated from Institut d’Etudes Politiques of Paris, where he studied law and economics.
Diana H. Tidd
Ms. Tidd has served as the Head of Index since February 2016. In such capacity, she is responsible for all aspects of product management and business strategy for the MSCI indexes. During her tenure at MSCI, Ms. Tidd has served in a variety of roles, including Head of Americas Client Coverage for six years. Prior to joining MSCI in 1999, Ms. Tidd worked at Brown Brothers Harriman & Co. in Boston for five years where she had roles in the Risk and Europe teams, before becoming Head of the Asia Team in the global custody division. She started her career in the Trust and Estates division of the Private Bank at Bankers Trust Co. Ms. Tidd serves as Co-President, of Women in ETFs (“WE”) and on the board of WE, as well as West Africa Village Education. Ms. Tidd graduated with a Bachelor of Arts degree in Political Science from Colgate University and received a Master’s Degree in Latin American Studies from Stanford University.
17
Mr. Zangari has served as the Global Head of Research and Product Development since February 2017. In such capacity, Mr. Zangari leads a global team of more than 150 researchers who develop insights that help institutional investors make more informed investment decisions. He is responsible for setting the research agenda and driving integration of research into our products and services to deliver innovative solutions to investment problems. He previously served as MSCI’s Head of Analytics from February 2015 to February 2017. Prior to this, he served as the Head of Equity Portfolio Management from August 2011 to February 2015. Prior to joining MSCI, Mr. Zangari held progressively senior-level positions at Goldman Sachs since 1998, most recently as the Head of Risk and a member of the leadership team for the Quantitative Investment Strategies (“QIS”) business of Goldman Sachs Asset Management (“GSAM”). Prior to joining QIS, Mr. Zangari was responsible for building out and managing GSAM’s proprietary equity risk and attribution platform. Mr. Zangari has a Bachelor of Arts degree in economics from Fordham University and a PhD in economics, with a specialization in applied econometrics and computational statistics, from Rutgers University.
Available Information
Our corporate headquarters are located at 7 World Trade Center, 250 Greenwich Street, New York, New York, 10007, and our telephone number is (212) 804-3900. We maintain a website on the internet at www.msci.com. The contents of our website are not a part of or incorporated by reference in this Annual Report on Form 10-K.
We file annual, quarterly and current reports, proxy statements and other information with the SEC. You may read and copy any materials we file with the SEC at the SEC’s Public Reference Room at 100 F Street, N.E., Washington, D.C. 20549. You may obtain information about the operation of the Public Reference Room by calling the SEC at 1-800-SEC-0330. The SEC maintains an internet website that contains reports, proxy and information statements and other information that we file electronically with the SEC at www.sec.gov. We also make available free of charge, on or through our website, these reports, proxy statements and other information as soon as reasonably practicable following the time they are electronically filed with or furnished to the SEC. To access these, click on the “SEC Filings” link found on our Investor Relations homepage ( http://ir.msci.com).
We also use our Investor Relations homepage and corporate Twitter account (@MSCI_Inc) as channels of distribution of Company information. The information we post through these channels may be deemed material.
Accordingly, investors should monitor these channels, in addition to following our press releases, SEC filings and public conference calls and webcasts. In addition, you may automatically receive email alerts and other information about us when you enroll your email address by visiting the “Email Alert Subscription” section of our Investor Relations homepage at http://ir.msci.com/alerts.cfm. The contents of our website, including our Investor Relations homepage, and social media channels are not, however, a part of or incorporated by reference in this Annual Report on Form 10-K.
You should carefully consider the following risks and all of the other information set forth in this Annual Report on Form 10-K. If any of the following risks actually occurs, our business, financial condition or results of operations could be materially and adversely affected. You should read the section titled “Forward-Looking Statements” on page 1 for a description of the types of statements that are considered forward-looking statements, as well as the significance of such statements in the context of this Annual Report on Form 10-K.
Risks Related to Our Business
We are dependent on the use of third-party data and software, and any loss of key outside suppliers of data or software products or reduction in the accuracy or quality of such data or products or any failure by us to comply with our vendors’ licensing requirements could impair our ability to provide our clients
18
with the products or services they desire, which could have a material adverse effect on our business, financial condition or results of operations.
We rely on the accuracy and quality of third-party data and software products and depend on the ability and willingness of third-party data and software providers to deliver and support reliable products, enhance their current products, develop new products on a timely and cost-effective basis, and respond to emerging industry standards and other technological changes in order to produce and deliver our products, provide services and develop new products and services.
If the data and software products from our suppliers have errors, are delayed, have design defects, become incompatible with future versions of our products, are unavailable on acceptable terms or are not available at all, we may not be able to deliver our products and services and our business, financial condition or results of operations could be materially adversely affected. As of December 31, 2016, we relied on the data of over 200 suppliers, including large volumes of data from certain stock exchanges around the world.
Many of our data and software suppliers compete with one another and, in some cases, with us. Some of our agreements with data suppliers allow them to cancel on short notice and we have not completed formal agreements with all of our data suppliers, such as certain stock exchanges. From time to time we receive notices from data suppliers, including stock exchanges, threatening to terminate the provision of their data to us, and some data suppliers, including at least one stock exchange, have terminated the provision of their data to us. Termination of provision of data by one or more of our significant data suppliers or exclusion from, or restricted use of, or litigation in connection with, a data provider’s information could decrease the information available for us to use (and offer our clients) and may have a material adverse effect on our business, financial condition or results of operations.
Although data suppliers and stock exchanges typically benefit from providing broad access to their data, some of our competitors could enter into exclusive contracts with our data suppliers, including with certain stock exchanges. If our competitors enter into such exclusive contracts, we may be precluded from receiving certain data from these suppliers or restricted in our use of such data, which would give our competitors a competitive advantage. Such exclusive contracts could hinder our ability to provide our clients with the data they prefer, which could lead to a decrease in our client base and could have a material adverse effect on our business, financial condition or results of operations.
We also monitor our use of third-party data and software products to comply with applicable license requirements. Despite our efforts, our use of certain third-party data and software products has been challenged in the past and there can be no assurance that such third parties may not challenge our use in the future, resulting in increased data acquisition or software costs, loss of rights and/or costly legal actions. Our business could be materially adversely affected if we are unable to timely or effectively replace the functionality provided by data or software that becomes unavailable or fails to operate effectively for any reason. Our operating costs could increase if license fees for third-party data or software products increase or the efforts to incorporate enhancements to third-party or other data or software are substantial and we are unable to negotiate acceptable licensing arrangements with these suppliers or find alternative sources of equivalent data or software products. If any of these risks materialize, they could have a material adverse effect on our business, financial condition or results of operations.
Our clients that pay us a fee based on the assets of an investment product may seek to negotiate a lower asset-based fee percentage or lower the total expense ratio of their funds linked to MSCI indexes or may cease using our indexes, which could limit the growth of or decrease our revenues from asset-based fees.
A portion of our revenues are from asset-based fees and these revenue streams are concentrated in some of our largest clients, including BlackRock, and in our largest market, the U.S. Our clients, including our largest clients, may seek to negotiate a lower asset-based fee percentage for a variety of reasons. As the assets of index-linked investment products managed by our clients change, they may request to pay us lower asset-based fee percentages, which are sometimes calculated as a percentage of the relevant fund’s total expense ratio (“TER”). Additionally, competition is intense and increasing rapidly among our clients that provide exchange traded funds (“ETFs”), among other products. The fees ETF providers charge their clients are one of the competitive differentiators for
19
these ETF managers with some ETF providers seeking to win or retain business by charging their clients lower fees. As noted above, in many cases our fees can be affected by an increase or decrease in a product provider’s TER. In those cases, a reduction in the TER may negatively impact our revenues.
Moreover, clients that have licensed our indexes to serve as the basis of index-linked investment products are generally not required to continue to use our indexes and could elect to cease offering the product or switch to a lower fee index, and at least one large client has ceased using MSCI indexes as the basis for a significant number of its index funds in the past. We offer a diversified pricing structure for our indexes and from time-to-time experience faster growth in lower fee product areas, resulting in a lower average asset-based fee percentage for licensing our indexes. While we look to maximize the price/volume trade-off over the long-term there can be no assurance that we will be able to do so and results for any given quarter could be materially adversely affected by stronger growth in lower fee products areas that is not sufficiently off-set by growth in the volume of AUM in ETFs or other products that are based on our indexes. In the instances described above, our asset-based fees could dramatically decrease, which could have a material adverse effect on our business, financial condition or results of operations. The ability of our licensees to cease using our indexes or switch to lower fee indexes is generally true not just with respect to an index’s use as the basis of an ETF but also with respect to its use as the basis of other financial products, including mutual funds and institutional funds. Finally, to the extent that an asset manager finds it beneficial to offer clients ETFs and institutional funds based on the same indexes, a shift away from use of an index as the basis of one type of product may lead to a corresponding shift away from the use of the same index as the basis of the other type of product.
If we are required to offer clients materially lower asset-based fee percentages with respect to investment products that generate fees based on the assets of such products or our largest clients cease to use our indexes, our revenues could be negatively impacted, which could have a material adverse effect on our business, financial condition or results of operations.
Our revenues attributable to asset-based fees may be affected by changes in the capital markets, particularly the equity capital markets. A decrease in our revenues attributable to these fees could have a material adverse effect on our business, financial condition or results of operations.
Clients that use our indexes as the basis for certain index-linked investment products, such as ETFs and mutual funds, commonly pay us a fee based on the value of the investment product’s assets. The value of an investment product’s assets may increase or decrease in response to changes in market performance and cash inflows and outflows, which could impact our revenues. Asset-based fees make up a significant portion of our revenues. They accounted for 18.3% and 18.4% of revenues for the fiscal years ended December 31, 2016 and 2015, respectively. These asset-based fees accounted for 47.4% and 48.3% of the total revenues from our ten largest clients for the fiscal years ended December 31, 2016 and 2015, respectively. Volatile capital markets, as well as changing investment styles, among other factors, may influence an investor’s decision to invest in and maintain an investment in an index-linked investment product. Accordingly, the value of assets linked to ETFs can fluctuate significantly over short periods of time and such volatility may be further impacted by fluctuations in foreign currency exchange rates. If we are unable to offset the impact of decreased values of assets linked to ETFs, including by managing our operating costs, our profitability could be materially adversely affected. See “—Our growth and profitability may not continue at the same rate as we have experienced in the past for several reasons, including if our operating costs are higher than expected, which could have a material adverse effect on our business, financial condition or results of operations” below.
20
Certain events could lead to interruptions in our operations, including interruptions affecting our information technology platform, electronic delivery systems and the internet, that could impair our ability to provide clients with products and customer service. Any resulting failures, disruptions or instability may have a material adverse effect on our financial condition or results of operations.
We depend heavily on the capacity, reliability and security of our information technology platform, electronic delivery systems and its components, including our data centers, and the internet to seamlessly provide clients with products and customer service. Heavy use of our electronic delivery systems and other factors such as loss of service from third parties, operational failures, sabotage, break-ins and similar disruptions from unauthorized tampering, intrusions or hacking, human error, cyber-terrorism, terrorist attacks affecting sites where we are located, natural disasters, power loss, telecommunications failures, technical breakdowns, internet failures or computer viruses could impair our systems’ operations or interrupt their availability for extended periods of time. Our ability to effectively use the internet may also be impaired due to infrastructure failures, service outages at third-party internet providers or increased government regulation. If disruptions, failures or slowdowns occur with respect to our operations, including to our information technology platform, our electronic delivery systems or the internet, our reputation and our ability to distribute our products effectively and to serve our clients, including those clients for whom we provide managed services or to whom we distribute index and constituent data on a real time basis that is used to manage funds that replicate MSCI indexes, may be materially adversely affected. For example, we have in recent years experienced denial-of-service attacks. While we have implemented disaster recovery and business continuity plans and have been able to defend our systems against such disruptions and attacks in the past, there is no assurance that we will be able to do so successfully in the future or that our disaster recovery or business continuity plans will be effective in mitigating the risks and costs associated with the particular event that has occurred. We have also experienced unanticipated interruption and delay in the performance and delivery of certain of our products after we migrated certain of our applications and infrastructure to new data centers and may experience such interruptions and delays in the future with respect to migrations within existing data centers or to new data centers. In response to such issues, we have in the past and could again be required to provide service credits. We could also experience cancellations and reduced demand for our products and services, resulting in decreased revenues. We may also incur increased operating expenses to recover data, repair, replace or remediate systems, equipment or facilities, and to protect ourselves from and defend against such disruptions and attacks. Accordingly, any significant failures, disruptions or instability affecting our information technology platform, electronic delivery systems or the internet may have a material adverse effect on our financial condition or results of operations and our insurance may not be adequate to compensate us for all losses, failures, or breaches.
Although we currently estimate that the total cost of ongoing development and implementation of our disaster recovery and business continuity plans will not have a material impact on our business, financial condition or results of operations, we cannot provide any assurance that our estimates regarding the timing and cost of implementing these plans will be accurate. Unexpected or higher than estimated costs could have a material adverse effect on our financial condition or results of operations.
Any failure to ensure and protect the confidentiality of client data could adversely affect our brand and reputation and have a material adverse effect on our business, financial condition or results of operations.
Many of our products provide for the exchange of sensitive information with our clients through a variety of media, such as the internet, applications and dedicated transmission lines. We rely on a complex system of internal processes and software controls along with policies, procedures and training to protect client data that we receive in the ordinary course of business, including sensitive and confidential client data such as material non-public information and client portfolio data that may be provided to us or hosted on our systems, against unauthorized data access or disclosure. If we fail to maintain the adequacy of our internal controls, including any failure to implement required new or improved controls, or if we experience difficulties in the implementation of our internal controls, policies or procedures, or if an employee purposely circumvents or violates our internal controls, policies or procedures, then unauthorized access to, or disclosure or misappropriation of, client data could occur. Such unauthorized access, disclosure or misappropriation may result in claims against us by our clients or regulatory inquiry or censure, which could, individually or in the aggregate, damage our brand and reputation and/or have a material adverse effect on our business, financial condition or results of operations. If a failure of our internal controls, policies or procedures results in a security or data privacy breach, we could also incur increased operating expenses to remediate the problems caused by the breach and prevent future breaches, which could have a material adverse effect on our business, financial condition or results of operations. See “ —Changes in government
21
regulations, including the implementation of new or pending financial regulations or the repeal of existing financial regulations, could materially adversely affect our business, financial condition or results of operations” below.
We have confidentiality policies in place regarding changes to the composition of our indexes and have implemented information barrier procedures to protect the confidentiality of the material, non-public information regarding changes to our equity indexes. If our confidentiality policies or information barrier procedures fail, our reputation could be damaged and our business, financial condition or results of operations could be materially adversely affected.
We change the composition of our indexes from time to time. We believe that, in some cases, the changes we make to our equity indexes can affect the prices of constituent securities as well as products based on our indexes. Our index clients rely on us to keep confidential material non-public information about changes to the future composition of an index and to protect against the misuse of that information until the change to the composition of the index is disclosed to clients. We have confidentiality policies in place and have implemented information barrier procedures to limit access to this information and to prevent the unauthorized disclosure and misuse of information regarding material non-public changes to the composition of our equity indexes. If our confidentiality policies or information barrier procedures fail or we are delayed in implementing such procedures as necessary with respect to a newly acquired business and an employee inadvertently discloses, or deliberately misuses, material non-public information about a change to one of our indexes, our reputation may suffer. Clients’ loss of trust and confidence in our confidentiality policies or information barrier policies and procedures could negatively impact our brand or reputation throughout the investment community, which could have a material adverse effect on our business, financial condition or results of operations.
In addition, certain exchanges permit our clients to list ETFs or other financial products based on our equity indexes only if we provide a representation to the exchange that we have information barrier procedures in place designed to address the unauthorized disclosure and misuse of material, non-public information about changes to the composition of our equity indexes. If an exchange determines that our information barrier procedures are not sufficient, the exchange might refuse to list or might delist investment products based on our equity indexes, which may have a material adverse effect on our business, financial condition or results of operations.
Increased competition and financial and budgetary pressures affecting clients in our industry may cause price reductions or loss of market share, which may materially adversely affect our business, financial condition or results of operations.
We face competition across all markets for our products and services. Our competitors range in size from large companies with substantial resources to small, single-product businesses that are highly specialized. Our larger competitors may have access to more resources and may be able to achieve greater economies of scale, and our specialized competitors that are focused on a narrower product line may be more effective in devoting technical, marketing and financial resources to compete with us with respect to a particular product. Larger competitors may offer price incentives to expand their market share, and may also consolidate with one another or form joint ventures or other business arrangements, which could allow for a narrower pool of competitors that are better capitalized or that are able to gain a competitive advantage through synergies resulting from an expanded suite of products and services.
In addition, barriers to entry may be low in many of the markets for our products and services, including for single-purpose product companies. Low barriers to entry could lead to the emergence of new competitors; for example, more broker-dealers and data suppliers could begin developing their own proprietary risk analytics or indexes. Recent developments, including increases in the availability of free or relatively inexpensive information, advances in public cloud computing and the increase in open source code, as well as proprietary software in specific areas, such as pricing, high volume computing, orchestration layers for services, and visualization, have increasingly allowed free or relatively inexpensive access to information sources, which has reduced barriers to entry even further.
22
Financial and budgetary pressures affecting our clients, including those resulting from weak or volatile economic conditions, may lead certain clients to reduce their overall spending on our products or services, including by seeking similar products or services at a lower cost than what we are able to provide, by consolidating their spending with fewer providers or by self-sourcing certain of their informational needs. Accordingly, competitive pressures may result in fewer clients, fewer subscriptions or investment product licenses, price reductions, and increased operating costs, such as for marketing and product development, which could, individually or in the aggregate, result in lower revenue, gross margins and operating income. See “— Our clients that pay us a fee based on the assets of an investment product may seek to negotiate a lower asset-based fee percentage or lower the total expense ratio of their funds linked to MSCI indexes or may cease using our indexes, which could limit the growth of or decrease our revenues from asset-based fees” above and Part I, Item 1. “Business—Competition” above.
To remain competitive and generate customer demand, we must successfully develop new and enhanced products and services and effectively manage transitions and product integrations. Failure to do so could limit our ability to maintain or grow current revenues, which could have a material adverse effect on our business, financial condition or results of operations.
We operate in an industry that is characterized by rapid technological change and evolving industry standards. Due to the highly volatile and competitive nature of this industry and the impact of technological change on our products and services, we must continually introduce new products and services, enhance, including through integration of products and services within MSCI and with third-party platforms, existing products and services, and effectively generate customer demand for new and upgraded products and services. If, among other things, we fail to accurately predict or respond or adapt to evolving technologies and changing industry standards, if we fail to anticipate and meet the needs of our clients through the successful development of new products and services, if our new products and services are not attractive to our clients or cannot be integrated with third-party platforms, if our new products do not perform as well as anticipated, if the launch of new products and offering of new services is not timely, or if competitors in any business line introduce products, services, systems and processes that are more competitive than ours or that gain greater market acceptance, we could lose market share and clients to our competitors which could materially adversely affect our business, financial condition or results of operations.
We must make long-term investments and commit significant resources before knowing whether these investments will eventually result in products and services that satisfy our clients’ needs and generate revenues required to provide the desired results. For example, we have made, and need to continue to make, investments in our technology platform in order to provide competitive products and services to our clients. From time to time, we also incur costs to integrate existing products and services and transition clients to enhanced products and services, which also present execution risks and challenges. If we are unable to effectively manage transitions to new or enhanced products and services, our business, financial condition or results of operations could be materially adversely affected. See “—If our products contain undetected errors or fail to perform properly due to defects, malfunctions or similar problems, we may, among other things, become subject to increased costs or liability based on the use of our products or services to support our clients’ investment processes, which could have a material adverse effect on our business, financial condition or results of operations” below.
23
A limited number of clients account for a material portion of our revenue. Cancellation of subscriptions or investment product licenses by any of these clients could have a material adverse effect on our business, financial condition or results of operations.
For the fiscal years ended December 31, 2016 and 2015, revenues from our ten largest clients accounted for 25.7% and 26.0% of our total revenues, respectively. Our revenue growth depends on our ability to obtain new clients and achieve and sustain a high level of renewal rates with respect to our existing subscription base and our investment product licenses. Failure of one or more of these objectives could have a material adverse effect on our business, financial condition and operating results. For the fiscal year ended December 31, 2016, our largest client organization by revenue, BlackRock, accounted for 9.4% of our total revenues. For the fiscal years ended December 31, 2016 and 2015, 93.7% and 93.0%, respectively, of the revenue from BlackRock came from fees based on the assets in BlackRock’s ETFs that are based on our indexes. If one or more of our largest clients cancels or reduces its subscriptions or investment product licenses and we are unsuccessful in replacing those subscriptions or licenses, our business, financial condition or results of operations could be materially adversely affected. See “— Our clients that pay us a fee based on the assets of an investment product may seek to negotiate a lower asset-based fee percentage or lower the total expense ratio of their funds linked to MSCI indexes or may cease using our indexes, which could limit the growth of or decrease our revenues from asset-based fees ” above.
Our growth and profitability may not continue at the same rate as we have experienced in the past for several reasons, including if our operating costs are higher than expected, which could have a material adverse effect on our business, financial condition or results of operations.
We have experienced significant growth since we began operations. There can be no assurance that we will be able to maintain the levels of growth and profitability that we have experienced in the past. If we experience higher than expected operating costs, including increased personnel costs, occupancy costs, selling and marketing costs, investments in geographic expansion, communication costs, travel costs, software development costs, professional fees, costs related to information technology infrastructure and other costs, and we cannot adjust to these costs, our operating results may fluctuate significantly or our anticipated profitability may be reduced and our anticipated results of operations and financial position may be materially adversely affected.
Additionally, there can be no assurance that we will be as successful in our product development, marketing efforts, or capital return or allocation strategies as we have been in the past, or that such efforts will result in growth or profit margins comparable to those we have experienced in the past. See “— To remain competitive and generate customer demand, we must successfully develop new and enhanced products and services and effectively manage transitions and product integrations. Failure to do so could limit our ability to maintain or grow current revenues, which could have a material adverse effect on our business, financial condition or results of operations ” above.
We are dependent on key personnel in our professional staff for their expertise. If we fail to attract or retain the necessary qualified personnel, including through our compensation programs, our business, financial condition or results of operations could be materially adversely affected.
The development, maintenance and support of our products and services are dependent upon the knowledge, experience and ability of our highly skilled, educated and trained employees. Accordingly, we believe that the success of our business depends to a significant extent upon the continued service of our executive officers and other key management, research, sales and marketing, operations, information technology and other technical personnel. Although we do not believe that we are overly dependent upon any individual employee, our management and other employees may terminate their employment at any time and the loss of any of our key employees could have a material adverse effect on our business, financial condition or results of operations.
During 2015 and 2016, our Board of Directors adopted significant changes to the Company’s compensation approach and philosophy, including the implementation of a more performance-based approach to the payment of annual cash compensation pursuant to our Annual Incentive Plan (the “AIP”) based on the achievement of certain financial metrics and long-term equity incentive compensation based on total shareholder return for executive officers and managing directors. We also implemented the CIP initiative in 2016 to further incentivize our client coverage personnel by aligning each eligible employee’s target annual incentive with key performance metrics in accordance with our overall goals and strategy. If our cash and equity incentive plans, including our new cash bonus plan (i.e., the AIP and CIP) and long-term equity incentive compensation program, do not adequately engage our
24
key employees or are not competitive, we may lose key personnel. If we fail to attract, engage and retain the necessary qualified personnel, the quality of our products and services as well as our ability to support and retain our customers and achieve business objectives may suffer, which could have a material adverse effect on our business, financial condition or results of operations.
Any future expansion may place significant strain on our management and other resources.
Our expansion in the past and any future expansion, particularly in emerging market locations, has placed, and is expected to continue to place, significant demands on our personnel, management and other resources. We must continue to improve our operational, financial, management, legal and compliance processes and information systems to keep pace with prior expansion of our business. There can also be no assurance that, if in the future, we expand organically or by way of acquisition, our management will be effective in attracting, engaging and retaining additional qualified personnel, including additional managers or key employees, developing effective leadership in all of our locations, expanding our physical facilities and information technology infrastructure, integrating acquired businesses or otherwise managing expansion. Additionally, new hires require significant training and may, in some cases, take a significant amount of time before becoming fully productive. Any failure to effectively manage expansion or to effectively manage the business could have a material adverse effect on our business, financial condition or results of operations. See “— We are subject to unanticipated costs in connection with political, economic, legal, operational, franchise and other risks as a result of our international operations, which could materially adversely impact our businesses” below, “— We are dependent on key personnel in our professional staff for their expertise. If we fail to attract or retain the necessary qualified personnel, including through our compensation programs, our business, financial condition or results of operations could be materially adversely affected ” above, Part II, Item 7. “Management’s Discussion and Analysis of Financial Condition and Results of Operations” below and Part I, Item 1. “Business—Company History” above.
Changes in government regulations, including the implementation of new or pending financial regulations or the repeal of existing financial regulations, could materially adversely affect our business, financial condition or results of operations.
The financial services industry is subject to extensive regulation at the federal and state levels, as well as by foreign governments with some jurisdictions regulating indexes directly. These regulations are complex, evolve frequently, and are subject to administrative interpretation and judicial construction in ways that could materially adversely affect our business. It is very difficult to predict the future impact of the broad and expanding legislative and regulatory requirements affecting our business and our clients’ businesses. If we fail to comply with any applicable laws, rules or regulations, we could be subject to fines or other penalties. Additionally, we may be required to comply with multiple and potentially conflicting laws, rules or regulations in various jurisdictions, which could, individually or in the aggregate, result in materially higher compliance costs to us. It is possible that laws or regulations could cause us to restrict or change the way we license our products or could impose additional costs on us. Some changes to the laws, rules and regulations applicable to our clients could impact their demand for our products and services. Likewise, to the extent that our clients become bound by certain laws, rules or regulations, we may incur higher costs in connection with modifying our products or services at their request even in instances where we are not directly legally bound. There can be no assurance that changes in laws, rules or regulations will not have a material adverse effect on our business, financial condition or results of operations. See “— Our financial condition and results of operations may be negatively impacted to the extent that our current and potential future clients are affected by adverse changes in the financial markets” below.
|
|
• |
Investment Advisers Act. Except with respect to certain products provided by MSCI ESG Research and certain of its subsidiaries, we believe that our products and services do not constitute or provide investment advice as contemplated by the Investment Advisers Act of 1940 (“Advisers Act”). Future developments in our product line or changes to current laws, rules or regulations could cause this status to change. The Advisers Act imposes fiduciary duties, recordkeeping and reporting requirements, disclosure requirements, limitations on agency and principal transactions between an adviser and advisory clients, as well as general anti-fraud prohibitions. It is possible that in addition to MSCI ESG Research and certain of its subsidiaries, other entities in our corporate family may be required to register as an investment adviser under the Advisers Act or comply with similar laws or requirements in states or foreign jurisdictions. |
25
In some instances, in connection with the provision of data and services, we have incurred additional costs to implement processes and systems at the request of our clients to ensure that the products and services that they in turn provide to their clients using our data are compliant with the financial regulations to which our clients may be subject. To the extent that our clients are subject to increased regulation, we may be indirectly impacted and could incur increased costs that could have a negative impact on the profitability of certain products.
|
|
• |
Data Privacy Legislation. Changes in laws, rules or regulations, or consumer environments relating to privacy or information collection and use may affect our ability to collect, manage, aggregate, store, transfer and use personal data. There could be a material adverse impact on our direct marketing due to the enactment of legislation or industry regulations, or simply a change in practices, arising from public concern over privacy issues. Restrictions could be placed upon the collection, management, aggregation, storage, transfer and use of information that is currently legally available, in which case our cost of collecting, managing, aggregating, storing, transferring or using certain types of data could materially increase. It is also possible that we could be prohibited from collecting, managing, aggregating, storing, transferring or using certain types of data, which could materially adversely affect our ability to meet our clients’ needs. |
|
|
• |
Regulation Affecting Benchmarks. Regulation (EU) 2016/1011 on indexes used as benchmarks in financial instruments and financial contracts or to measure the performance of investment funds was published on June 30, 2016 with effect on January 1, 2018. The new regulation governs index development, calculation, dissemination, governance, maintenance and recordkeeping, as well as input data licensing, collection and dissemination. Because this regulation governs a new area and the final technical standards under the regulation have yet to be published in final form, the full impact on our index product line is still to be determined. Additionally, the European Securities and Markets Authority (“ESMA”) may issue guidance with different or new interpretations with respect to the regulation or technical standards. Complying with the regulation, technical standards or guidance could lead to a change in our business practices and/or our ability to offer indexes in the European Union, including without limitation, by increasing our costs of doing business, diminishing our intellectual property rights, imposing constraints on our ability to meet contractual commitments to our data contributors, or causing our data contributors to refuse to contribute data to us at a reasonable cost or at all, any of which could have a material adverse effect on our equity and real estate index product lines. |
Under the Markets in Financial Instruments Regulation (Regulation (EU) No 600/2014), where the value of a financial instrument is calculated by reference to a benchmark, a person with proprietary rights to the benchmark will be required to ensure that clearing entities and trading venues may license the benchmark and receive relevant price and data feeds and information regarding the composition, methodology and pricing of the benchmark for the purposes of clearing and trading. Access to such licenses and information will have to be offered by the benchmark owner within three months of the request and on fair, reasonable and non-discriminatory terms that are no less favorable than the terms offered to other trading venues unless a different basis can be objectively justified. In the event that compliance with this regulation (expected to be required in 2019) leads to a change in our business practices or our ability to offer our indexes, increases our cost of doing business or diminishes our intellectual property rights, it could have a material adverse effect on our index product line.
26
On December 18, 2012, ESMA published guidelines on ETFs and other Undertakings for Collective Investment in Transferable Securities (“UCITS”) issues (ESMA/2012/832EN), which are updated from time to time by ESMA (“Guidelines”). The Guidelines limit the types of indexes that can be used as the basis of UCITS funds and require, among other things, index constituents, together with their respective weightings, to be made easily accessible free of charge, such as via the internet, to investors and prospective investors on a delayed and periodic basis. The Guidelines became effective as of February 17, 2013 with respect to newly launched UCITS funds. They became effective for all UCITS funds on February 17, 2014. We have made available a client communication with respect to our policies as they relate to the Guidelines. To the extent that ESMA issues new guidance or different or new interpretations with respect to the Guidelines, complying with such guidance could have a negative impact on our business and results of operations, including a material negative impact on our licensing of index data and/or our indexes as the basis of ETFs and UCITS. Additionally, other jurisdictions outside of Europe have adopted, and others could adopt, similar concepts, proposals or regulations.
On July 17, 2013, the International Organization of Securities Commissions (“IOSCO”) published its final report on principles for financial benchmarks (“IOSCO Principles”). The IOSCO Principles cover conflicts of interest, benchmark quality and integrity, methodology requirements, procedures related to handling complaints, documentation requirements and audit reviews. The IOSCO Principles require benchmark administrators to publicly disclose whether they comply with the IOSCO Principles within 12 months of their initial publication, with such compliance subject to audit. We announced our implementation of the IOSCO Principles on July 16, 2014 and posted our audit results on our website in July 2015 and July 2016. To the extent that IOSCO issues new principles or different or new interpretations with respect to the existing IOSCO Principles and/or any individual jurisdictions adopt similar, new or different concepts, proposals or regulations, complying with such principles, concepts, proposals or regulations could lead to a change in our business practices or our ability to offer our indexes, including without limitation, by increasing our costs of doing business, diminishing our intellectual property rights, imposing constraints on our ability to meet our commitments to our data contributors or causing our data contributors to refuse to contribute data to us at a reasonable cost or at all, any of which could have material adverse effect on our equity and real estate index product lines.
Our clients may become more self-sufficient, which may reduce demand for our products or services and materially adversely affect our business, financial condition or results of operations.
Our clients may internally develop certain functionality contained in the products or services they currently license from us. For example, some of our clients who currently license our risk data to analyze their portfolio risk may develop their own tools to collect data and assess risk, making our products or services unnecessary for them. Similarly, a number of our clients have obtained regulatory clearance to create indexes for use as the basis of ETFs that they manage. For example, on September 20, 2016, Blackrock received exemptive relief from the SEC to create certain indexes for use as the basis of ETFs that it would manage. To the extent that our clients become more self-sufficient, demand for our products or services may be reduced, which could have a material adverse effect on our business, financial condition or results of operations. A growing number of asset managers and investment banks, in partnership with index providers that offer calculation agent services, or acting together with an industry group or association, have created or may create their own range of proprietary indexes, which they use to manage funds or as the basis of ETFs, structured products or OTC derivatives. See “— A limited number of clients account for a material portion of our revenue. Cancellation of subscriptions or investment product licenses by any of these clients could have a material adverse effect on our business, financial condition or results of operations ” above and “— Increased competition and financial and budgetary pressures affecting clients in our industry may cause price reductions or loss of market share, which may materially adversely affect our business, financial condition or results of operations” above.
Legal protections for our intellectual property rights and other rights may not be sufficient or available to protect our competitive advantages. Third parties may infringe on our intellectual property rights, and third-party litigation may materially adversely affect our ability to protect our intellectual property rights.
We consider many aspects of our products and services to be proprietary. We rely primarily on a combination of trade secret, patent, copyright and trademark rights, as well as contractual protections and technical measures, to
27
protect our products and services. Despite our efforts, third parties may still try to challenge, invalidate or circumvent our rights and protections. There is no guarantee that any trade secret, patent, copyright or trademark rights that we may obtain will protect our competitive advantages, nor is there any assurance that our competitors will not infringe upon our rights. As we have experienced, even if we attempt to protect our intellectual property rights through litigation, it may require considerable cost, time and resources to do so, and there is no guarantee that we will be successful. Furthermore, our competitors may also independently develop and patent or otherwise protect products and services that are the same or similar to ours. In addition, the laws of certain foreign countries in which we operate do not protect our proprietary rights to the same extent as do the laws of the U.S. Also, some elements of our products and services may not be subject to intellectual property protection.
|
|
• |
Trademarks and Service Marks —We have registered “MSCI,” “Barra,” “FEA,” “InvestorForce,” “IPD” and “RiskMetrics” as trademarks or service marks in the U.S. and in certain foreign countries. We have also registered other marks for certain products and services in the U.S. and in certain foreign countries. When we enter a new geographic market or introduce a new product brand, there can be no assurance that our existing trademark or service mark of choice will be available. Furthermore, the fact that we have registered trademarks is not an assurance that other companies may not use the same or similar names. |
|
|
• |
Patents —We currently hold 23 U.S. and foreign patents. We currently have one U.S. patent application pending. Patent applications can be extremely costly to process and defend. There can be no assurance that we will be issued any patents that we apply for or that any of the rights granted under any patent that we obtain will be sufficient to protect our competitive advantages. |
|
|
• |
Copyrights —We believe our proprietary software and proprietary data are copyright protected. If a court were to determine that any of our proprietary software or proprietary data, such as our index level data, is not copyright protected, it could have a material adverse effect on our business, financial condition or results of operations. |
|
|
• |
Confidentiality and Trade Secrets —Our license agreements limit our clients’ right to copy or disclose our proprietary software and data. It is possible, however, that a client might still make unauthorized copies of our proprietary software or data, which could have a material adverse effect on our business, financial condition or results of operations. For example, if a client who licensed a large volume of our proprietary historical data made that information publicly available, we might lose potential clients who could freely obtain a copy of the data. We also seek to protect our proprietary software and data through trade secret protection and through non-disclosure obligations with our employees. However, if an employee breaches his or her non-disclosure obligation and reveals a trade secret or other confidential information, we could lose the trade secret or confidentiality protection, which could have a material adverse effect on our business, financial condition or results of operations. Furthermore, it may be very difficult to ascertain if a former employee is inappropriately using or disclosing our confidential or proprietary information. We have investigated suspicions that former employees have used or disclosed our confidential or proprietary information, but we may not be able to determine with certainty whether misappropriation has occurred. |
Likewise, we cannot be certain that we are aware or in the future will be aware of every instance in which this sort of behavior may occur. Additionally, the enforceability of our license and other agreements’ non-disclosure obligations and the availability of remedies to us in the event of a breach may vary due to the many different jurisdictions in which our clients and employees are located.
|
|
• |
License Agreements —Our products are generally made available to end users on a periodic subscription basis under a license agreement signed by the client. We also permit access to some data, such as certain index information, through the internet under online licenses that are affirmatively acknowledged by the licensee or under terms of use. There can be no assurance that third parties will abide by the terms of our licenses or that all of our license agreements will be enforceable. |
28
|
|
amount of information about the index available without a license and the other particular facts and circumstances of the cases. In some instances, the results have been unfavorable to the index owner. If courts or regulators or other governmental bodies in relevant jurisdictions determine that a license is not required to issue investment products linked to indexes, this could have a material adverse effect on our business, financial condition or results of operations. See “— Changes in government regulations, including the implementation of new or pending financial regulations or the repeal of existing financial regulations, could materially adversely affect our business, financial condition or results of operations ” above. It might also lead to changes in current industry practices such that we would no longer make our index level data publicly available, such as via our website or news media, on a timely basis. |
Third parties may claim we infringe upon their intellectual property rights. Such claims would likely be costly to defend, could require us to pay damages or limit our future use of certain technologies, which could have a material adverse effect on our business, financial condition or results of operations.
From time to time, we receive claims or notices from third parties alleging infringement or potential infringement of their intellectual property rights. The number of these claims may grow. Businesses operating in the financial services sector, including our competitors and potential competitors, have increasingly pursued or may consider pursuing patent protection for their technologies and business methods. If any third parties were to obtain a patent on a relevant index methodology, risk model, software application or other relevant product or process, we could be sued for infringement. Furthermore, there is always a risk that third parties will sue us for infringement or misappropriation of other intellectual property rights, such as trademarks, copyrights or trade secrets.
Responding to intellectual property claims, regardless of merit, can consume valuable time, and result in costly litigation or delays. We may be forced to settle such claims on unfavorable terms, and there can be no assurance that we would prevail in any litigation arising from such claims if such claims are not settled. We may be required to pay damages, to stop providing or using the affected products or services or to enter into royalty and licensing agreements. There can be no assurance that any royalty or licensing agreements will be made, if at all, on terms that are commercially acceptable to us. From time to time we receive notices calling upon us to defend partners, clients, suppliers or distributors against such third-party claims under indemnification clauses in our contracts. If any of these risks materialize, the impact of claims of intellectual property infringement could have a material adverse effect on our business, financial condition or results of operations.
Our use of open source code could impose unanticipated delays or costs in deploying our products, or impose conditions or restrictions on our ability to commercialize our products or keep them confidential.
We rely on open source code to develop software and to incorporate it in our products, as well as to support our internal systems and infrastructure. The use of open source code may entail greater risks than the use of third-party commercial software, as open source licensors generally do not provide warranties or other contractual protections regarding infringement claims or the quality of the code. Further, some open source licenses provide that if we combine our proprietary software with open source software in a certain manner, we could be required to release the source code of our proprietary software to the public. This would allow our competitors to create similar products with less development effort and time and ultimately put us at a competitive disadvantage. Additionally, the terms of many open source code licenses are ambiguous and have not been interpreted by U.S. courts. Accordingly, there are risks that there may be a failure in our procedures for controlling the usage of open source code or that these licenses could be construed in a manner that could impose unanticipated conditions or restrictions on our ability to commercialize our products. In either event, we could be required to seek licenses from third parties on terms that are not commercially feasible in order to continue offering our products, to make generally available (in source code form) portions of our proprietary code, to re-engineer our products or systems, to discontinue the licensing of our products if re-engineering could not be accomplished on a timely or cost-effective basis, or to take other remedial action that could divert resources away from our development efforts. Any of these requirements could materially adversely affect our business, financial condition or results of operations.
29
If our products contain undetected errors or fail to perform properly due to defects, malfunctions or similar problems, we may, among other things, become subject to increased costs or liability based on the use of our products or services to support our clients’ investment processes, which could have a material adverse effect on our business, financial condition or results of operations.
Our products and services support the investment processes of our clients, which relate to, in the aggregate, trillions of dollars in assets. Products we develop or license, including our indexes, may contain undetected errors or defects despite testing. Use of our products or services as part of the investment process creates the risk that our clients, or the parties whose assets are managed by our clients, may pursue claims against us for very significant dollar amounts based on what may be alleged to be even a small error or malfunction in certain of our products or services.
Errors or defects can exist at any point in a product’s life cycle, but are frequently found after introduction of new products or enhancements to existing products. We continually introduce new methodologies and products, and new versions of our products. Despite internal testing and testing by current clients, our current and future products may contain serious defects or malfunctions. If we detect any errors before we release a product or publish a methodology, we might have to delay the product or index release for an extended period of time while we address the problem. We may not discover errors that affect our new or current products or enhancements until after they are deployed, and we may need to provide enhancements to correct such errors, and in certain cases it may be impracticable to correct such errors. If undetected errors exist in our products or methodologies, or if our products fail to perform properly due to defects, malfunctions or similar problems, it could result in harm to our brand or reputation, lost sales, delays in commercial release, third party claims, contractual disputes, negative publicity, delays in or loss of market acceptance of our products, license terminations or renegotiations and/or unexpected expenses and diversion of resources to remedy or mitigate such errors. Additionally, any undetected errors, defects, malfunctions or similar problems in our products or methodologies could lead to significant failures, disruptions or slowdowns with respect to our product delivery to clients. The realization of any of these events could materially adversely affect our business, financial condition or results of operations. See “— Certain events could lead to interruptions in our operations, including interruptions affecting our information technology platform, electronic delivery systems and the internet, that could impair our ability to provide clients with products and customer service. Any resulting failures, disruptions or instability may have a material adverse effect on our financial condition or results of operations” above.
While we have provisions in our client contracts that are designed to limit our exposure to potential liability claims brought by our clients or third parties based on the use of our products or services or delay or failure to provide services, these provisions do not always eliminate liability resulting from the occurrence of any of these events entirely and may have certain exceptions that could result in the provision of credits, contractual penalties and adverse monetary judgments, or be invalidated by unfavorable judicial decisions or by federal, state, foreign or local laws. Any such claims brought against us, even if the outcome were to be ultimately favorable to us, would involve a significant commitment of our management, personnel, financial and other resources and could have a negative impact on our reputation or pose a significant disruption to our normal business operations. In addition, the duration or outcome of such claims and lawsuits is difficult if not impossible to predict, which could further exacerbate the adverse effect they may have on our business operations.
Our business is dependent on our clients’ continued investment in equity securities as well as the measurement of the performance of our clients’ equity investments against equity benchmarks. If investment in equity markets declines, if our clients significantly reduce their investments in equity securities, or if they discontinue the use of equity benchmarks to measure performance, our business, financial condition or results of operations could be materially adversely affected.
A significant portion of our revenues comes from our products that are focused on various aspects of managing or monitoring equity portfolios. Volatility in equity markets over an extended period or other factors may lead to an overall decline in the viability of such markets, which could reduce new business opportunities for us and our clients. To the extent our clients significantly deemphasize equity securities in their investment strategies, the demand for our equity products would likely decrease, which could have a material adverse effect on our business, financial condition or results of operations. See “— Our revenues attributable to asset-based fees may be affected by changes in the capital markets, particularly the equity capital markets. A decrease in our revenues attributable to these fees could have a material adverse effect on our business, financial condition or results of operations ” above.
30
Additionally, our equity indexes serve as equity benchmarks against which our clients can measure the performance of their investments. If clients decide to measure performance on an absolute return basis instead of against an equity benchmark, the demand for our equity indexes could decrease. Any such decrease in demand for our equity indexes could have a material adverse effect on our business, financial condition or results of operations.
Cancellation of subscriptions or investment product licenses or renegotiation of terms by a significant number of clients could have a material adverse effect on our business, financial condition or results of operations.
Our principal business model is to license annual, recurring subscriptions to our products for use at specified locations and often by a given number of users or for a certain volume of products or services. For most of our products and services, our clients may cancel their subscriptions or investment product licenses at the end of the current term. While we believe the primarily annual, recurring subscription model supports our marketing efforts by allowing clients to subscribe without the requirement of a long-term commitment, the cancellation of subscriptions or investment product licenses by a significant number of clients at any given time may have a material adverse effect on our business, financial condition or results of operations.
Our financial condition and results of operations may be negatively impacted to the extent that our current and potential future clients are affected by adverse changes in the financial markets.
Unfavorable changes in global or domestic financial market conditions may negatively impact the performance and financial viability of our current and potential clients, the majority of which are in the financial services industry. As a result, adverse financial market conditions could result in reduced demand for our products and services due to, among other things, the closure or consolidation of our clients, a decrease in the number of fund launches, including hedge fund launches or a shift in our clients’ investment patterns; the inability of our customers to pay for products or services, including forgoing products or services, delaying payment or underpaying; prolonged selling and renewal cycles; and increased reserves for doubtful accounts and write-offs of accounts receivable.
If we are unable to successfully identify, execute and realize synergies from acquisitions, or if we experience integration, financing, or other risks resulting from our acquisitions, our financial results may be materially adversely affected.
An element of our growth strategy is growth through acquisitions. As we continue pursuing selective acquisitions to support our growth strategy, we seek to be a disciplined acquirer, and there can be no assurance that we will be able to identify suitable candidates for successful acquisition at acceptable prices. In addition, our ability to achieve the expected returns and synergies from our past and future acquisitions depends in part upon our ability to effectively integrate the offerings, technology, sales, administrative functions and personnel of these businesses into our business. We cannot assure you that we will be successful in integrating acquired businesses or that our acquired businesses will perform at the levels we anticipate. In addition, our past and future acquisitions may subject us to unanticipated risks or liabilities or disrupt our operations. Any acquisition could present a number of risks, including:
|
|
• |
incorrect assumptions regarding the future results of acquired operations or assets or expected cost reductions or other synergies expected to be realized as a result of acquiring operations or assets; |
|
|
• |
failure to integrate the operations or management of any acquired operations or assets successfully and on a timely and cost effective basis; |
|
|
• |
failure to achieve assumed synergies; |
|
|
• |
insufficient knowledge of the operations and markets of acquired businesses, including where the acquired company operates in many countries and in markets with which we have limited experience; |
|
|
• |
increased debt, which may be incurred under terms less favorable than those associated with our current debt and which may, among other things, reduce our free cash flow and increase our risk of default; |
|
|
• |
dilution of our common stock; |
31
|
|
• |
diversion of management’s attention from existing operations or other priorities; and |
|
|
• |
inability to secure, on terms we find acceptable, sufficient financing that may be required for any such acquisition or investment. |
In the event that we experience a high level of acquisition-related activity within a limited period of time, the possibility of occurrence of these risks would likely increase for that period. In addition, if we are unsuccessful in completing acquisitions of other businesses, operations or assets or if such opportunities for expansion do not arise, our future growth, business, financial condition or results of operations could be materially adversely affected.
Our revenues, expenses, assets and liabilities are subject to foreign currency exchange rate fluctuation risk.
We are subject to foreign currency exchange rate fluctuation risk. Exchange rate movements can impact the U.S. dollar reported value of our revenues, expenses, assets and liabilities denominated in non-U.S. dollar currencies or where the currency of such items is different than the functional currency of the entity where these items were recorded.
We generally invoice our clients in U.S. dollars; however, we invoice a portion of our clients in Euros, British pounds sterling, Japanese yen and a limited number of other non-U.S. dollar currencies. For the years ended December 31, 2016 and 2015, 16.9% and 17.8%, respectively, of our revenues are subject to foreign currency exchange rate risk and primarily includes clients billed in foreign currency as well as U.S. dollar exposures on non-U.S. dollar foreign operating entities. Of the 16.9% of non-U.S dollar exposure for the year ended December 31, 2016, 35.5% was in British pounds sterling, 34.4% was in Euros and 24.9% was in Japanese yen. Of the 17.8% of non-U.S dollar exposure for the year ended December 31, 2015, 37.0% was in British pounds sterling, 35.8% was in Euros, and 21.6% was in Japanese yen.
Revenues from index-linked investment products represented 18.3% and 18.4% of operating revenues for the years ended December 31, 2016 and 2015, respectively. While a substantial portion of our fees for index-linked investment products are invoiced in U.S. dollars, the fees are based on the investment product’s assets, of which two-thirds are invested in securities denominated in currencies other than the U.S. dollar. Accordingly, declines in such other currencies against the U.S. dollar will decrease the fees payable to us under such licenses. In addition, declines in such currencies against the U.S. dollar could impact the attractiveness of such investment products resulting in net fund outflows, which would further reduce the fees payable under such licenses.
We are exposed to additional foreign currency risk in certain of our operating costs. Approximately 38.3% and 41.3% of our operating expenses for the years ended December 31, 2016 and 2015, respectively, were denominated in foreign currencies, the significant majority of which were denominated in British pounds sterling, Indian rupees, Swiss francs, Euros, Hungarian forints, Hong Kong dollars, Chinese yuan and Mexican pesos. Expenses incurred in foreign currency may increase as we expand our business outside the U.S.
We have certain monetary assets and liabilities denominated in currencies other than local functional amounts and when these balances were remeasured into their local functional currency, either a gain or a loss resulted from the change of the value of the functional currency as compared to the originating currencies. We manage foreign currency exchange rate risk, in part, through the use of derivative financial instruments comprised principally of forward contracts on foreign currency which are not designated as hedging instruments for accounting purposes. The objective of the derivative instruments is to minimize the impact on the income statement of the volatility of amounts denominated in certain foreign currencies. We recognized total foreign currency exchange losses of $0.2 million and $2.2 million for the years ended December 31, 2016 and 2015, respectively. Although we believe that our guidelines and policies are reasonable and prudent, any hedging instruments that we are currently party to or may enter into in the future may not be successful, resulting in an adverse impact on our results of operations.
To the extent that our international activities recorded in local currencies increase or decrease in the future, our exposure to fluctuations in currency exchange rates may correspondingly increase and could have a material adverse effect on our business, financial condition or results of operations. Most recently, on June 23, 2016, the
32
United Kingdom voted to leave the European Union through the Referendum of the United Kingdom’s Membership of the European Union, an event commonly referred to as “Brexit.” While the full effects of Brexit will not be known for some time, the Brexit vote caused significant volatility in currency exchange rates, especially between the U.S. dollar and the British pound sterling. For example, the exchange rate as of December 31, 2016 was £0.81/$1 compared with a rate on June 23, 2016 of £0.68/$1 and a rate on June 1, 2016 of £0.69/$1. The weaker British pound sterling means that revenues earned in British pound sterling translate to lower reported U.S. dollar revenues. The weaker British pound sterling also means that expenses incurred in British pound sterling translate to lower reported U.S. dollar expenses. The weaker British pound sterling could also impair the purchasing power of our clients and could result in decreased demand for our products and services. The fall in the British pound sterling relative to the U.S. dollar, and the strengthening of the U.S. dollar relative to a number of currencies including the British pound sterling, could have significant impacts on our business, financial condition or results of operations.
Our indebtedness could materially adversely affect our cash flows and financial flexibility.
As of December 31, 2016, we had $2.1 billion of outstanding indebtedness from our Senior Notes and a related interest expense of $101.7 million for the year ended December 31, 2016. We also maintain a $220.0 million senior unsecured revolving credit agreement (the “Revolving Credit Agreement”), which was undrawn as of December 31, 2016.
Although management believes that our cash flows will be sufficient to service our outstanding indebtedness, there may be circumstances in which required payments of principal and/or interest on this debt could adversely affect our cash flows. The terms of our current financing include restrictive covenants that limit our ability and our existing and future subsidiaries’ abilities to, among other things, incur liens; incur additional indebtedness; make investments; make acquisitions, merge, dissolve, liquidate, consolidate with or into another person; sell, transfer or dispose of assets; pay dividends or other distributions in respect of our capital stock; change the nature of our business; enter into any transactions with affiliates other than on an arm’s length basis; and prepay, redeem or repurchase debt. In addition, the agreements relating to our Senior Notes restrict our non-guarantor subsidiaries’ ability to create, assume, incur or guarantee additional indebtedness without such non-guarantor subsidiaries guaranteeing our outstanding Senior Notes on a pari passu basis. Affirmative covenants in the agreements relating to our current financings may interfere with our ability to obtain financings and to engage in business activities, which could have a material adverse effect on our business, financial condition or results of operations.
Our Revolving Credit Agreement also requires us to comply with financial ratio maintenance covenants. Under the terms of our Revolving Credit Agreement, certain increases (or decreases) in our consolidated leverage ratio may result in an increase (or decrease) in the fees applicable to (i) outstanding borrowings under such facility and (ii) undrawn commitments under such facility, in each case, in a predetermined percentage amount (the “applicable margin”). If we experience, as of a scheduled quarterly test date, an increase in our consolidated leverage ratio above a threshold amount specified in our Revolving Credit Agreement, the interest rates on our outstanding borrowings and/or the fee rate on our unused commitments will rise by the applicable margin. Consequently, any increase in our consolidated leverage ratio could result in higher debt service costs under such facility, even if we do not have borrowings outstanding under such facility.
As of December 31, 2016, our Consolidated Leverage Ratio (as defined in the Revolving Credit Agreement) was 3.50:1.00. We are therefore currently subject to the highest applicable margin provided for under our Revolving Credit Agreement. The rate on our unused commitments is 0.35%.
33
If we incur substantial additional indebtedness, the risks described above could be further exacerbated.
We may need to incur additional indebtedness, including secured indebtedness, in the future in the ordinary course of business. The terms of our Revolving Credit Agreement and the Indentures governing our Senior Notes restrict, but do not completely prohibit, us from doing so. We are permitted to borrow up to $220.0 million under our Revolving Credit Agreement. In addition, the Indentures governing our Senior Notes allow us to issue additional Senior Notes under certain circumstances. Accordingly, we may be able to incur substantial additional debt from time to time under our existing debt agreements and otherwise, to finance working capital, capital expenditures, investments or acquisitions, or for other purposes. If we do so, the risks related to our level of indebtedness could intensify. Specifically, a high level of indebtedness could, among other things:
|
|
• |
require us to dedicate a substantial portion of our cash flows from operations or proceeds of any equity issuance or additional debt incurrence to payments on our indebtedness, reducing the availability of our cash flow to fund working capital, capital expenditures, dividend payments, development activity, acquisitions and other general corporate purposes; |
|
|
• |
increase our vulnerability to adverse general economic or industry conditions; |
|
|
• |
limit our flexibility in planning for, or reacting to, changes in our business or the markets in which we operate; |
|
|
• |
make us more vulnerable to increases in interest rates, as borrowings under our Revolving Credit Agreement are at variable rates; |
|
|
• |
limit our ability to obtain additional financing in the future for working capital or other purposes, such as raising the funds necessary to repurchase all of the Senior Notes tendered to us upon the occurrence of specified changes of control in our ownership; |
|
|
• |
increase our interest expense; |
|
|
• |
make it difficult for us to optimally capitalize and manage the cash flow for our business; and |
|
|
• |
place us at a competitive disadvantage compared to our competitors that have less indebtedness. |
If we are unable to comply with the restrictions and covenants in our debt agreements, there could be a default under the terms of such agreements, which could result in an acceleration of repayment.
If we are unable to comply with the restrictions and covenants in our Revolving Credit Agreement and the Indentures governing our Senior Notes, there could be a default under the terms of these debt agreements. Our ability to comply with these restrictions and covenants, including meeting financial ratios and tests, may be affected by events beyond our control including prevailing economic, financial and industry conditions. As a result, there can be no assurance that we will be able to comply with these restrictions and covenants or meet such financial ratios and tests, and any such default under our debt agreements could have a material adverse effect on our business by, among other things, limiting our ability to take advantage of financings, mergers and acquisitions or other corporate opportunities.
Additionally, if certain events of default occur, continue or remain uncured under our debt agreements, we are required to repurchase, redeem, repay or prepay, as the case may be, the debt under such agreement prior to maturity and/or such debt could become accelerated and immediately due and payable. For example, upon the occurrence of specified changes of control in our ownership, the holders of the Senior Notes have the right to compel us to repurchase all or part of the 2024 Senior Notes, the 2025 Senior Notes, or the 2026 Senior Notes, as applicable, in cash at a price equal to 101.0% of the aggregate principal amount to be repurchased plus accrued interest. Additionally, the holders of the 2024 Senior Notes, the 2025 Senior Notes, or the 2026 Senior Notes may, in connection with certain events of default, accelerate the principal amount of the 2024 Senior Notes, the 2025 Senior Notes, or the 2026 Senior Notes, as applicable, together with accrued and unpaid interest, and declare the same to be due and payable after giving the required notice.
34
Likewise, under our Revolving Credit Agreement, the lenders may, in connection with certain events of default, elect to terminate borrowing commitments and declare all outstanding borrowings, together with accrued and unpaid interest and other fees, to be due and payable.
Our debt agreements also contain cross-default or cross-acceleration provisions, pursuant to which a default is deemed to have occurred under such agreement if a default or acceleration occurs under another debt agreement. For example, our Revolving Credit Agreement and the Indentures governing our Senior Notes contain cross-default provisions relating to nonpayment by us or any of our subsidiaries in connection with debt aggregating $50.0 million or more (subject to certain cure periods). If any of the above events should occur, we and our subsidiaries may not have sufficient assets to repay in full all of our outstanding indebtedness. Additionally, we may not be able to amend our debt agreements or obtain needed waivers on satisfactory terms.
To service our indebtedness, we will require a significant amount of cash. However, our ability to generate cash depends on many factors beyond our control. If we are unable to access or generate a sufficient amount of cash, our financial condition and results of operations could be negatively impacted.
Our ability to make payments on our indebtedness and to fund planned capital expenditures depends on our ability to generate and access cash in the future, which, in turn, is subject to general economic, financial, competitive, regulatory and other factors, many of which are beyond our control. We cannot assure you that we will maintain cash flows sufficient to permit us to pay the principal, premium, if any, and interest on our indebtedness. Our business may not generate sufficient cash flow from operations and we may not have available to us future borrowings in an amount sufficient to enable us to pay our indebtedness or to fund our other liquidity needs. In these circumstances, we may need to refinance all or a portion of our indebtedness on or before maturity. However, we may not be able to secure additional financing on terms favorable or acceptable to us or at all. If we cannot refinance or otherwise pay our obligations as they mature and fund our liquidity needs, our business, financial condition, results of operations, cash flows, liquidity, ability to obtain financing and ability to compete in our industry could be materially adversely affected.
Absent sufficient cash flow in the U.S. and the ability to refinance, we could also be forced to sell assets or to repatriate cash to the U.S. to make up for any shortfall in our payment obligations. However, the terms of our Revolving Credit Agreement and the Indentures governing our Senior Notes limit our and our subsidiaries’ ability to sell assets and also restrict the use of proceeds from such a sale. Accordingly, we may not be able to sell assets or access cash outside the U.S. quickly enough to generate sufficient amounts to enable us to meet our obligations on our indebtedness. Additionally, the repatriation of cash to the U.S. could result in additional taxes.
Increased costs of financing, a reduction in the availability of short-term and long-term funding and access to capital, fluctuations in the levels of interest rates and inflation, could materially adversely affect our liquidity, operating expenses or results of operations.
At December 31, 2016, we had no borrowings outstanding under our Revolving Credit Agreement and all of our outstanding long-term debt was subject to a fixed interest rate. Adverse conditions in the domestic and global financial markets could, however, increase our costs for additional financing and negatively affect our ability to refinance, repurchase, redeem, repay or prepay, as the case may be, our debt at or prior to maturity, raise capital or fund other types of obligations. Additionally, we may face increased financing costs if we are no longer able to deduct interest paid on our borrowings if there are changes to domestic and international tax laws. See “—We may have exposure to additional tax liabilities in various jurisdictions” below. Our access to capital is also impacted by changes in interest rates and inflation, which could restrict the availability to us of short-term and long-term funding. Recent interest rates in the U.S. have been at historically low levels, and increases in these rates could increase our interest expense and reduce our funds available for operations and other purposes with respect to newly incurred debt, or borrowings, if any. Additionally, any downgrades to our credit rating or outlook may increase the cost, and reduce the availability, of financing. See “— A change in our credit ratings could materially adversely affect our financial condition” below.
If we borrow under our Revolving Credit Agreement, such indebtedness would bear interest at fluctuating interest rates, primarily based on the London Interbank Offered Rate (“LIBOR”) for deposits of U.S. dollars. LIBOR tends to fluctuate based on general economic conditions, general interest rates, Federal Reserve rates and the supply
35
of and demand for credit in the London interbank market. Increases in the interest rate generally, and particularly when coupled with any significant variable rate indebtedness, could materially adversely impact our interest expenses. To the extent we borrow under our Revolving Credit Agreement, we are not required to enter into interest rate swaps to hedge such indebtedness. If we decide not to enter into hedges on such indebtedness, our interest expense on such indebtedness will fluctuate based on LIBOR or other variable interest rates. Consequently, we may have difficulties servicing such unhedged indebtedness and funding our other fixed costs, and our available cash flow for general corporate requirements may be materially adversely affected.
If we do enter into interest rate swap agreements, developing an effective strategy for movements in interest rates is complex, and no strategy can completely insulate us from risks associated with such fluctuations. In addition, the counterparty to a derivative instrument could default on its obligation thereby exposing us to credit risk. Further, we may have to repay certain costs, such as transaction fees or brokerage costs, if a derivative instrument is terminated by us. Finally, our interest rate risk management activities could expose us to substantial losses if interest rates move materially differently from our expectations. As a result, our interest rate hedging activities may not effectively manage our interest rate sensitivity or have the desired beneficial impact on our financial condition or results of operations.
A change in our credit ratings could materially adversely affect our financial condition.
Our credit ratings are not recommendations to buy, sell or hold any of our common stock or outstanding debt. Our outstanding debt under the Senior Notes, which amounts to an aggregate principal amount of approximately $2.1 billion, currently has a non-investment grade rating. Any rating assigned to such debt is subject to ongoing evaluation by the credit rating agencies and could be lowered or withdrawn entirely at any time by such agency if, in the agency’s judgment, future circumstances relating to the basis of the rating so warrant. Such future circumstances include, but are not limited to, adverse changes to our results of operations, financial condition or cash flows, or revisions to our corporate strategy pertaining to capitalization or leverage. For example, on July 28, 2015, the Board of Directors authorized corporate action that led to a change in the Company’s target leverage and interest expense, allowing for the issuance of our 2025 Senior Notes on August 13, 2015. Following the Board of Directors’ authorization, one of the ratings agencies described the increase as substantially higher than current leverage levels and as a result downgraded our credit rating. This recent downgrade, and any further downgrade, could adversely affect the amount of capital we can access, as well as the terms of any financing we obtain.
In addition, our debt covenants contain certain obligations that are triggered by a change in our credit rating. The Senior Notes contain covenants that require the Company to offer to repurchase the 2024 Senior Notes, the 2025 Senior Notes, or the 2026 Senior Notes as applicable, in cash at a price equal to 101.0% of their par value, in the event of a change of control of the Company or disposition of substantially all of the Company’s assets. The Company is obligated to make such repurchase offer to noteholders if the following two conditions are met at the time of, or as a result of, such change of control or asset sale transaction: (i) the Senior Notes are rated below investment grade by each rating agency that rates the Senior Notes and (ii) the Senior Notes are downgraded by any rating agency.
Any adverse change in our credit rating could have a negative effect on our liquidity and future growth through transactions in which we rely on the ability to receive debt capital at an advantageous cost and on favorable terms. Accordingly, actual or anticipated changes or downgrades to or withdrawal of our credit ratings, including any announcement that our ratings are under review or have been assigned a negative outlook, could have a material adverse effect on our financial condition, results of operations and cash flows, and on the market value of our common stock and outstanding debt.
We are subject to unanticipated costs in connection with political, economic, legal, operational, franchise and other risks as a result of our international operations, which could materially adversely impact our businesses.
As we continue to expand our international operations, we increase our exposure to political, economic, legal, operational, franchise and other risks that are inherent in operating in many countries, including risks of possible capital controls, exchange controls, customs duties, sanctions compliance, tax penalties, levies or assessments, broad
36
regulatory discretion and other restrictive governmental actions, as well as the outbreak of hostilities or political and governmental instability in certain of the countries or regions in which we conduct operations. A significant number of our employees are located in offices outside of the U.S. and a number of those employees are located in emerging market locations. For example, as of December 31, 2016, 56.2% of our employees were located in emerging market locations. The cost of establishing and maintaining these offices, including costs related to information technology infrastructure, as well as the costs of attracting, training and retaining employees in these locations may be higher, or may increase at a faster rate, than we anticipate, which could have a material adverse effect on our business, financial condition or results of operations.
Additionally, the laws and regulations in many countries applicable to our business are uncertain and evolving, and it may be difficult for us to determine the exact requirements of local laws in every market. Our inability to maintain consistent internal policies and procedures across our offices and remain in compliance with local laws in a particular market could have a significant and negative effect not only on our businesses in that market but also on our reputation generally.
In order to penetrate markets outside of the U.S., we must provide a suite of products and services that fit the needs of the local market. Demand for our products and services is still nascent in many parts of the world.
Many countries have not fully developed laws and regulations regarding risk management and ESG and, in many cases, institutions in these countries have not developed widely accepted best practices regarding the same. If we do not appropriately tailor our products and services to fit the needs of the local market, we may be unable to effectively grow sales of our products and services outside of the U.S. There can be no assurances that demand for our products and services will develop in these countries.
We may be exposed to liabilities under applicable anti-corruption laws and any determination that we violated these laws could have a material adverse effect on our business.
We are subject to various anti-corruption laws that prohibit improper payments or offers of payments to foreign governments and their officials for the purpose of obtaining or retaining business. We have business in countries and regions which are less developed and are generally recognized as potentially more corrupt business environments. Our activities in these countries create the risk of unauthorized payments or offers of payments by one of our employees or agents that could be in violation of various anti-corruption laws including the Foreign Corrupt Practices Act of 1977, as amended (the “FCPA”) and the U.K. Bribery Act 2010. We have implemented safeguards and policies to discourage these practices by our employees and agents. However, our existing safeguards and any future improvements may prove to be less than effective and our employees or agents may engage in conduct for which we might be held responsible. If employees violate our policies or we fail to maintain adequate record-keeping and internal accounting practices to accurately record our transactions we may be subject to regulatory sanctions. Violations of the FCPA or other anti-corruption laws may result in severe criminal or civil sanctions and penalties, and we may be subject to other liabilities which could have a material adverse effect on our business, results of operations and financial condition.
We may have exposure to additional tax liabilities in various jurisdictions.
As a global corporation, we are subject to income taxes as well as non-income or indirect taxes, in the U.S. and various foreign jurisdictions. Significant judgment is required in determining our global provision for income taxes and other tax liabilities. In the ordinary course of a global business, there are many intercompany transactions and calculations where the ultimate tax determination is uncertain. We are regularly under audit by tax authorities. Changes in domestic and international tax laws could negatively impact our overall effective tax rate.
Although we believe that our tax provisions are reasonable, there can be no assurance that the final determination of tax audits or tax disputes will not be different from what is reflected in our historical income tax provisions and accruals. To the extent we are required to pay amounts in excess of our reserves, such differences could have a material adverse effect on our Consolidated Statement of Income for a particular future period. In addition, an unfavorable tax settlement could require use of our cash and result in an increase in our effective tax rate in the period in which such resolution occurs.
37
We are also subject to non-income taxes, such as payroll, sales, use, value-added, net worth, property and goods and services taxes, in the U.S. and various foreign jurisdictions. We are regularly under audit by tax authorities with respect to these non-income taxes and may have exposure to additional non-income tax liabilities.
Our investments in recorded goodwill and other intangible assets as a result of acquisitions, including goodwill and other intangible assets resulting from our acquisitions, could be impaired as a result of future business conditions, requiring us to record substantial write-downs that would reduce our operating income.
We have goodwill and intangible assets of $1,903.5 million recorded on our balance sheet as of December 31, 2016. We evaluate the recoverability of recorded goodwill amounts annually or when evidence of potential impairment exists. Intangible assets are reviewed for impairment whenever events or changes in circumstances indicate that the carrying value of the asset may not be recoverable. These impairment tests are based on several factors requiring management’s judgment. Changes in fair market valuations and our operating performance or business conditions, in general, could result in future impairments of goodwill or intangible assets which could materially adversely affect our results of operations. In addition, if we are not successful in achieving anticipated operating efficiencies associated with acquisitions, our goodwill and intangible assets may become impaired.
In connection with our initial public offering and separation from Morgan Stanley, we entered into agreements with Morgan Stanley where we agreed to indemnify Morgan Stanley for, among other things, certain past, present and future liabilities related to our business.
Pursuant to certain agreements we entered into with Morgan Stanley relating to the provision of services and other matters, we agreed to indemnify Morgan Stanley for, among other matters, certain past, present and future liabilities related to our business. Such liabilities include certain unknown liabilities, which could be significant.
Risks Related to Ownership of Our Common Stock
The market price of our common stock may be volatile, which could result in substantial losses.
The market price of our common stock is likely to fluctuate in the future for a variety of factors, some of which are beyond our control. One possible outcome of such fluctuation could be a decline in the value of your investment. For example, some of the factors that may cause the market price of our common stock to fluctuate include:
|
|
• |
fluctuations in our quarterly financial results or the quarterly financial results of companies perceived to be similar to us; |
|
|
• |
changes in or failure to meet guidance or long-term targets provided by the Company with respect to financial and operating metrics; |
|
|
• |
changes in operating margins; |
|
|
• |
declines in the value of AUM in ETFs linked to MSCI indexes; |
|
|
• |
loss of key clients (See “— Our clients that pay us a fee based on the assets of an investment product may seek to negotiate a lower asset-based fee percentage or lower the total expense ratio of their funds linked to MSCI indexes or may cease using our indexes, which could limit the growth of or decrease our revenues from asset-based fees ” above); |
|
|
• |
changes in estimates of our financial results or recommendations by securities analysts; |
|
|
• |
failure of any of our products to achieve or maintain market acceptance; |
|
|
• |
failure to produce or distribute our products; |
|
|
• |
changes in market valuations of similar companies; |
|
|
• |
success of competitive products; |
38
|
|
• |
changes in our capital structure, such as future issuances of securities or the incurrence of additional debt; |
|
|
• |
changes in our dividend policy or stock repurchase program; |
|
|
• |
announcements by us or our competitors of significant products, contracts, acquisitions or strategic alliances; |
|
|
• |
litigation involving our Company, our general industry or both; |
|
|
• |
changes in or departures of key personnel; |
|
|
• |
investors’ general perception of us, including any perception of misuse of sensitive information; |
|
|
• |
changes in general economic, political, industry and market conditions in one or more significant regions around the world; and |
|
|
• |
changes in regulatory developments in the U.S., foreign countries or both and changes in other dynamics. |
In addition, if the market for stocks in our industry, or the stock market in general, experiences a loss of investor confidence, the trading price of our common stock could decline for reasons unrelated to our business, financial condition or results of operations. If any of the foregoing occurs, it could cause our stock price to fall and may expose us to lawsuits that, even if unsuccessful, could be costly to defend and a distraction to management.
Our business performance might not be sufficient for us to meet the full-year financial guidance or long-term targets that we provide publicly.
We provide full-year financial guidance and long-term targets to the public based upon our assumptions regarding our expected financial performance. For example, we provide assumptions regarding our ability to manage our expenses, generate free cash flow, achieve a certain effective tax rate, access cash generated outside of the U.S. and achieve our profitability targets. While we believe that our annual financial guidance and long-term targets provide investors and analysts with insight to our view of the Company’s future performance, such financial guidance and long-term targets are based on assumptions that may not always prove to be accurate and may vary from actual results. If we fail to meet the full-year financial guidance or achieve the long-term targets that we provide, or if we find it necessary to revise such guidance during the year or long-term targets over time, the market value of our common stock could be adversely affected.
Future sales of our common stock, or the perception that such sales may occur, could depress our common stock price.
Sales of a substantial number of shares of our common stock, or the perception that such sales may occur, could depress the market price of our common stock. This would include sales of our common stock underlying restricted shares of common stock and options to purchase shares of common stock granted in connection with our initial public offering and pursuant to our equity incentive compensation plans. The following table presents the number of shares of common stock issued under each of our equity incentive compensation plans as of December 31, 2016.
39
|
|
Number of Issued Shares of Common Stock as of December 31, 2016 |
|
|
MSCI Inc. 2016 Omnibus Plan |
|
420 |
|
MSCI Amended and Restated 2007 Equity Incentive Compensation Plan |
|
8,481,329 |
|
MSCI Inc. 2016 Non-Employee Directors Compensation Plan |
|
2,855 |
|
MSCI Inc. Independent Directors’ Equity Compensation Plan |
|
216,210 |
|
RMG Plans (1) |
|
3,930,795 |
|
|
(1) |
Consists of the RiskMetrics Group, Inc. 2000 Stock Option Plan, RiskMetrics Group, Inc. 2004 Stock Option Plan, RiskMetrics Group, Inc. 2007 Omnibus Incentive Compensation Plan and the Institutional Shareholder Services Holdings, Inc. Equity Incentive Plan. |
For additional information on our equity compensation plans, see Part II, Item 5. “Market for Registrant’s Common Equity, Related Stockholder Matters and Issuer Purchases of Equity—Equity Compensation Plans” and Note 8, “Shareholders’ Equity” of the Notes to the Consolidated Financial Statements included herein. As of February 17, 2017, 90,545,374 shares of our common stock were outstanding and freely tradable without restriction or further registration under the Securities Act of 1933, as amended, by persons other than our affiliates within the meaning of Rule 144 under the Securities Act.
In the future, we may also issue additional shares of our common stock in connection with investments and acquisitions. The amount of our common stock issued in connection with an investment or acquisition could constitute a material portion of the outstanding common stock.
Provisions in our Third Amended and Restated Certificate of Incorporation and Amended and Restated By-laws and Delaware law might discourage, delay or prevent a change of control of our Company or changes in our management and, therefore, depress the trading price of our common stock.
Provisions of our Third Amended and Restated Certificate of Incorporation and Amended and Restated By-laws and Delaware law may discourage, delay or prevent a merger, acquisition or other change in control that shareholders may consider favorable, including transactions in which you might otherwise receive a premium for your shares of our common stock. These provisions may also prevent or frustrate attempts by our shareholders to replace or remove our management. These provisions include:
|
|
• |
limitations on the removal of directors; |
|
|
• |
advance notice requirements for shareholder proposals and director nominations; |
|
|
• |
the inability of shareholders, after a change in control, to act by written consent or to call special meetings; |
|
|
• |
the ability of our Board of Directors to make, alter or repeal our By-laws; and |
|
|
• |
the ability of our Board of Directors to designate the terms of and issue a new series of preferred stock without shareholder approval. |
Generally, the amendment of our Third Amended and Restated Certificate of Incorporation requires approval by our Board of Directors and a majority vote of shareholders. Any amendment to our By-laws requires the approval of either a majority of our Board of Directors or holders of at least 80% of the votes entitled to be cast by the outstanding capital stock in the election of our Board of Directors.
Section 203 of the General Corporation Law of the State of Delaware prohibits a person who acquires more than 15% but less than 85% of all classes of our outstanding voting stock without the approval of our Board of Directors from merging or combining with us for a period of three years, unless the merger or combination is approved by the affirmative vote of at least two-thirds of our outstanding voting stock not owned by such person.
40
These provisions would apply even if the proposed merger or acquisition could be considered beneficial by some shareholders.
The existence of the foregoing provisions and anti-takeover measures could limit the price that investors might be willing to pay in the future for shares of our common stock. They could also deter potential acquirers of the Company, thereby reducing the likelihood that a premium would be paid for your common stock in an acquisition.
We may not be able to maintain payments of dividends at current levels and the failure to do so may negatively affect the market price of our common stock.
On September 17, 2014, our Board of Directors approved a plan to initiate a regular quarterly cash dividend to our shareholders. On October 30, 2014, we began paying regular quarterly cash dividends and have paid such dividends each quarter thereafter. On February 1, 2017, our Board of Directors declared our next quarterly cash dividend, in an amount of $0.28 per share of common stock, to be paid on March 15, 2017 to shareholders of record as of the close of trading on February 17, 2017. Although we plan to continue to pay regular quarterly cash dividends at the target rates (currently 30%-40% of Adjusted EPS) established by our Board of Directors from time to time, there can be no assurance that we will be able to continue to do so or that we will achieve an annual dividend rate in any particular amount. Our Board of Directors may, in its discretion, decrease the quarterly or annual rate of dividends or entirely discontinue the payment of dividends at any time if it deems such action to be in the best interests of the Company and our shareholders.
Our cash dividend policy is based upon our Board of Directors’ assessment of our financial condition and the general business environment in which we operate at the time of declaration. Any future declaration and payment of cash dividends to our shareholders depends on the assessment of a number of factors, some of which are beyond our control, and a change in any one or more factors could affect our dividend policy. These factors include: our results of operations and liquidity; future prospects for earnings and cash flows; our available cash on hand and anticipated cash needs; the level and timing of capital expenditures, principal repayments and other capital needs; our ability to comply with current or future financial and negative covenants that limit our ability to pay dividends and make certain other restricted payments (including the incurrence covenants contained in our Revolving Credit Agreement and the Indentures governing our Senior Notes); tax treatment of dividends in the U.S.; legal restrictions on the payment of dividends and other provisions of law in any applicable jurisdiction; and any other factors that our Board of Directors may deem relevant in light of the prevailing conditions at the time of such assessment. As a result, we can give no assurance that we will in the future choose or be able to declare or pay a cash dividend, maintain our current level of dividends or increase them over time. Our failure to declare or pay a dividend, a reduction in the level of such dividend or the discontinuance of such dividend could materially adversely affect the market price of our common stock.
The share repurchase programs approved by our Board of Directors may not result in enhanced value to shareholders and may negatively affect our share price.
On October 26, 2016, the Board of Directors approved an additional stock repurchase program authorizing the purchase of up to $750.0 million worth of shares of our common stock (together with the $330.3 million authorization remaining under the 2015 Repurchase Program, the “2016 Repurchase Program”). As of December 31, 2016, the remaining authorization under the 2016 Program was approximately $870.0 million. Share repurchases made pursuant to the 2016 Repurchase Program may take place in the open market or in privately negotiated transactions from time to time based on market and other conditions. This authorization may be modified, suspended or terminated by the Board of Directors at any time without prior notice. The 2016 Repurchase Program carries risks and uncertainties, including, among other things, that the authorized purchases will not be completed within the expected timing or will not be made at the best possible price. Additionally, we are permitted to, and may, discontinue the 2016 Repurchase Program at any time, including, without limitation, upon determining that we have insufficient cash flows or surplus levels required by Delaware law to continue to execute such program. Any such discontinuation or inability to continue to execute the 2016 Repurchase Program could cause the market price of our common stock to decline. Accordingly, there can be no assurance that we will pursue or be successful in completing the execution of the 2016 Repurchase Program or any future repurchase program. Additionally, the existence of a share repurchase program could cause the market price of our common stock to be higher than it would be in the absence of such a program and could potentially reduce the market liquidity for our shares. As a result, any
41
repurchase program may not ultimately result in enhanced value to our shareholders and may not prove to be the best use of our cash resources.
Nothing required to be disclosed.
Our corporate headquarters is located in New York, New York. This is also our largest sales office and one of our main research centers. As of December 31, 2016, our principal offices consisted of the following leased properties:
|
|
|
|
|
|
|
Number of |
|
|
|
|
|
Location |
|
Square Feet |
|
|
Offices |
|
|
Expiration Date |
||
|
Mumbai, India |
|
|
126,286 |
|
|
|
1 |
|
|
September 30, 2018 |
|
New York, New York |
|
|
125,811 |
|
|
|
1 |
|
|
February 28, 2033 |
|
Budapest, Hungary |
|
|
44,225 |
|
|
|
1 |
|
|
February 29, 2024 |
|
Berkeley, California |
|
|
34,178 |
|
|
|
1 |
|
|
February 29, 2020 |
|
London, England |
|
|
30,519 |
|
|
|
1 |
|
|
December 26, 2026 |
|
Monterrey, Mexico |
|
|
28,933 |
|
|
|
1 |
|
|
December 31, 2020 |
|
Norman, Oklahoma |
|
|
23,664 |
|
|
|
1 |
|
|
May 31, 2024 |
|
Manila, Philippines |
|
|
20,904 |
|
|
|
1 |
|
|
February 28, 2019 |
|
Conshohocken, Pennsylvania |
|
|
15,590 |
|
|
|
1 |
|
|
June 30, 2019 |
|
Boston, Massachusetts |
|
|
13,506 |
|
|
|
1 |
|
|
November 30, 2021 |
|
Geneva, Switzerland |
|
|
11,883 |
|
|
|
1 |
|
|
March 31, 2019 |
As of December 31, 2016, we also leased and occupied offices in the following locations: Hong Kong, China; Chicago, Illinois; San Francisco, California; Beijing, China; Frankfurt, Germany; Paris, France; Sydney, Australia; Tokyo, Japan; Ann Arbor, Michigan; Portland, Maine; Toronto, Canada; Shanghai, China; Singapore; Amsterdam, Netherlands; Seoul, Korea; Gaithersburg, Maryland; Cape Town, South Africa; Stockholm, Sweden; Sao Paolo, Brazil; and Dubai, United Arab Emirates.
We believe that our properties are in good operating condition and adequately serve our current business operations. We also anticipate that suitable additional or alternative space, including those under lease options, will be available at commercially reasonable terms for future expansion.
Various lawsuits, claims and proceedings have been or may be instituted or asserted against us in the ordinary course of business. While the amounts claimed could be substantial, the ultimate liability cannot now be determined because of the considerable uncertainty that exists. Therefore, it is possible that our business, operating results, financial condition or cash flows in a particular period could be materially adversely affected by certain contingencies. However, based on facts currently available, management believes that the disposition of matters that are currently pending or asserted will not, individually or in the aggregate, have a material effect on our business, operating results, financial condition or cash flows.
Not applicable.
42
|
Item 5. |
Market for Registrant’s Common Equity, Related Stockholder Matters and Issuer Purchases of Equity Securities |
Stock Price and Dividends
Our common stock has traded on the New York Stock Exchange since November 15, 2007 and trades under the symbol “MSCI.” As of February 17, 2017, there were 136 shareholders of record of our common stock. The following table presents the high and low closing prices per share and cash dividends declared and distributed per share of our common stock from January 1, 2015 through December 31, 2016.
|
Years Ended |
|
High |
|
|
Low |
|
|
Dividends per Share of Common Stock |
|
|||
|
December 31, 2016 |
|
|
|
|
|
|
|
|
|
|
|
|
|
First Quarter |
|
$ |
74.08 |
|
|
$ |
63.16 |
|
|
$ |
0.22 |
|
|
Second Quarter |
|
$ |
79.79 |
|
|
$ |
71.86 |
|
|
$ |
0.22 |
|
|
Third Quarter |
|
$ |
90.12 |
|
|
$ |
76.78 |
|
|
$ |
0.28 |
|
|
Fourth Quarter |
|
$ |
83.51 |
|
|
$ |
77.14 |
|
|
$ |
0.28 |
|
|
|
|
|
|
|
|
|
|
|
|
|
|
|
|
December 31, 2015 |
|
|
|
|
|
|
|
|
|
|
|
|
|
First Quarter |
|
$ |
61.31 |
|
|
$ |
47.24 |
|
|
$ |
0.18 |
|
|
Second Quarter |
|
$ |
63.75 |
|
|
$ |
60.32 |
|
|
$ |
0.18 |
|
|
Third Quarter |
|
$ |
68.16 |
|
|
$ |
57.78 |
|
|
$ |
0.22 |
|
|
Fourth Quarter |
|
$ |
72.85 |
|
|
$ |
57.95 |
|
|
$ |
0.22 |
|
On February 17, 2017, the per share closing price of our common stock on the New York Stock Exchange was $94.27.
Dividend Policy
On September 17, 2014, the Board of Directors approved a plan to initiate a regular quarterly cash dividend. On February 1, 2017, our Board of Directors declared our first quarter cash dividend, in an amount of $0.28 per share of common stock, to be paid on March 15, 2017 to shareholders of record as of the close of trading on February 17, 2017.
The payment amounts of future dividends will be determined by the Board of Directors in light of conditions then existing, including our earnings, financial condition and capital requirements, business conditions, corporate law requirements and other factors.
The Transfer Agent and Registrar for our common stock is Broadridge Financial Solutions, Inc.
Equity Compensation Plans
On February 18, 2016, the Board of Directors, upon the recommendation of the Compensation Committee, approved the MSCI Inc. 2016 Non-Employee Directors Compensation Plan (the “Directors Plan”), a new cash and equity incentive compensation plan that was approved by shareholders at the Company’s 2016 annual meeting of shareholders. The Directors Plan replaced the Company’s then existing non-employee director compensation plan—the MSCI Inc. Independent Directors’ Equity Compensation Plan (the “2011 Plan”). The total number of shares authorized to be awarded under the Directors Plan is 352,460, which is equal to the number of shares that remained available for issuance under the 2011 Plan.
43
Under the Directors Plan, directors that are not employees of the Company receive annual Board retainer fees and fees for serving on the Company’s committees, if applicable, and pursuant to the terms of the Directors Plan, a director may make an election to receive all or any portion of such director’s retainer and committee fees in shares of our common stock in lieu of cash. Non-employee directors are entitled to receive an annual grant of $140,000 each in stock units and the lead director is entitled to an additional $25,000 in stock units, which are typically subject to a one-year vesting schedule. Under the MSCI Inc. Non-Employee Directors Deferral Plan, directors may elect to defer receipt of all or any portion of any shares of our common stock issuable upon conversion of any stock unit or any retainer elected to be paid in shares of our common stock until (i) 60 days following separation of service or (ii) the earlier of a specified date or 60 days following separation of service.
On February 18, 2016, the Board of Directors, upon the recommendation of the Compensation Committee, approved the MSCI Inc. 2016 Omnibus Plan (“Omnibus Plan”), a new equity incentive compensation plan that was approved by shareholders at the Company’s 2016 annual meeting of shareholders. The Omnibus Plan replaced the Company’s existing equity compensation plan—the MSCI Inc. Amended and Restated 2007 Equity Incentive Compensation Plan (as amended, the “2007 Plan”). Compensation paid to the Company’s executive officers historically complied with the performance-based compensation exception under 162(m) of the IRC (“162(m)”) by being granted pursuant to the MSCI Inc. Performance Formula and Incentive Plan (the “Performance Plan”). Shareholder approval of the Omnibus Plan constituted approval of the material terms of the performance goals under the Omnibus Plan for purposes of 162(m). The Company will continue to maintain the Performance Plan and may make tax-qualified awards pursuant to this plan.
Pursuant to the Omnibus Plan, the Company reserved 7,565,483 shares of common stock for issuance; plus any additional shares which become available due to forfeiture, expiration or cancellation of outstanding awards, which were registered under the Securities Act following approval by the Company’s shareholders. This is in addition to currently outstanding awards under the 2007 Plan. The Omnibus Plan permits the Compensation Committee to make grants of a variety of equity based awards (such as stock options, stock appreciation rights, restricted stock units, restricted stock, performance awards and other stock-based awards) totaling up to 7,565,483 and other cash-based awards to eligible recipients, including employees and consultants. No awards will be granted under the Omnibus Plan after the earliest to occur of (i) April 28, 2026, (ii) the maximum number of shares available for issuance having been issued and (iii) the Board of Directors terminating the Omnibus Plan in accordance with its terms.
In connection with the acquisition of RiskMetrics, we filed a registration statement registering under the Securities Act the 4,257,779 shares of MSCI common stock reserved for issuance in respect of incentive awards to officers and certain employees of RiskMetrics pursuant to the RiskMetrics Group, Inc. 2000 Stock Option Plan, RiskMetrics Group, Inc. 2004 Stock Option Plan, Institutional Shareholder Services Holdings, Inc. Equity Incentive Plan and RiskMetrics Group, Inc. 2007 Omnibus Incentive Compensation Plan (collectively, the “RMG Plans”). In June 2010, we also filed a registration statement assuming 3,060,090 shares available under the RiskMetrics Group, Inc. 2007 Omnibus Incentive Compensation Plan, which terminated on June 30, 2012.
44
The following table presents certain information with respect to our equity compensation plans at December 31, 2016:
|
|
|
Number of Securities to be Issued Upon Vesting of Restricted Stock Units and Exercise of Outstanding Options a |
|
|
Weighted Average Unit Award Value of Restricted Stock Units and Weighted -Average Exercise Price of Outstanding Options b |
|
|
Number of Securities Remaining Available for Future Issuance under Equity Compensation Plans (excluding securities reflected in column (a)) c |
|
|||
|
Equity Compensation Plans Not Approved by Security Holders |
|
|
— |
|
|
|
— |
|
|
|
— |
|
|
Equity Compensation Plans Approved by Security Holders |
|
|
|
|
|
|
|
|
|
|
|
|
|
MSCI Amended and Restated 2007 Equity Incentive |
|
|
|
|
|
|
|
|
|
|
|
|
|
Compensation Plan |
|
|
1,288,660 |
|
|
$ |
55.76 |
|
|
|
— |
|
|
RiskMetrics Group, Inc. 2007 Omnibus Incentive Compensation Plan |
|
|
165,902 |
|
|
$ |
22.22 |
|
|
|
— |
|
|
MSCI Inc. 2016 Omnibus Plan |
|
|
303,790 |
|
|
$ |
74.79 |
|
|
|
7,261,273 |
|
|
MSCI Inc. 2016 Non-Employee Directors Compensation Plan |
|
|
18,657 |
|
|
$ |
76.36 |
|
|
|
330,948 |
|
|
Total |
|
|
1,777,009 |
|
|
$ |
56.10 |
|
|
|
7,592,221 |
|
Stock Repurchases
On October 28, 2015, the Board of Directors approved a new stock repurchase program authorizing the purchase of up to $1.0 billion worth of shares of MSCI’s common stock (the “2015 Repurchase Program”). On October 26, 2016, the Board of Directors approved an additional stock repurchase program authorizing the purchase of up to $750.0 million worth of shares of our common stock (together with the $330.3 million remaining authorization under the 2015 Repurchase Program, the “2016 Repurchase Program”). Share repurchases made pursuant to the 2016 Repurchase Program may take place in the open market or in privately negotiated transactions from time to time based on market and other conditions. This authorization may be modified, suspended or terminated by the Board of Directors at any time without prior notice.
For the year ended December 31, 2016, the Company repurchased approximately 10.3 million shares at an average price of $73.71 per share for a total value of $759.4 million pursuant to open market repurchases under the 2015 Repurchase Program and the 2016 Repurchase Program.
The following table provides information with respect to purchases made by or on behalf of the Company of its common stock during the quarter ended December 31, 2016. There were no other share repurchases during the quarter outside of the repurchases noted below.
45
Issuer Purchases of Equity Securities
|
Period |
|
Total Number of Shares Purchased (1) |
|
|
Average Price Paid Per Share |
|
|
Total Number of Shares Purchased As Part of Publicly Announced Plans or Programs |
|
|
Approximate Dollar Value of Shares that May Yet Be Purchased Under the Plans or Programs (2) |
|
||||
|
Month #1 (October 1, 2016-October 31, 2016) |
|
|
794,092 |
|
|
$ |
82.27 |
|
|
|
793,777 |
|
|
$ |
1,080,255,000 |
|
|
Month #2 (November 1, 2016-November 30, 2016) |
|
|
1,472,756 |
|
|
$ |
79.81 |
|
|
|
1,472,168 |
|
|
$ |
962,771,000 |
|
|
Month #3 (December 1, 2016-December 31, 2016) |
|
|
1,167,609 |
|
|
$ |
79.50 |
|
|
|
1,167,609 |
|
|
$ |
869,959,000 |
|
|
Total |
|
|
3,434,457 |
|
|
$ |
80.27 |
|
|
|
3,433,554 |
|
|
$ |
869,959,000 |
|
|
(1) |
Includes (i) shares purchased by the Company in the open market; (ii) shares withheld to satisfy tax withholding obligations on behalf of employees in connection with the vesting and delivery of outstanding shares underlying restricted stock units; (iii) shares withheld to satisfy tax withholding obligations on behalf of employees in connection with the vesting and delivery of outstanding shares underlying performance stock units; (iv) shares withheld to satisfy tax withholding obligations and exercise price on behalf of employees in connection with the exercise and delivery of outstanding shares underlying stock options; and (v) shares held in treasury under the MSCI Inc. Non-Employee Directors Deferral Plan. The value of the shares withheld were determined using the fair market value of the Company’s common stock on the date of withholding, using a valuation methodology established by the Company. The amount also includes shares repurchased under the 2016 Repurchase Program. |
|
(2) |
See Note 8, “Shareholders’ Equity” of the Notes to the Consolidated Financial Statements included herein for further information regarding our stock repurchase programs. |
Recent Sales of Unregistered Securities
The Company has issued an aggregate principle amount of $2.1 billion in senior unsecured notes (collectively, the “Senior Notes”) in three discrete private offerings in the amounts of $800.0 million, $800.0 million and $500.0 million, to qualified institutional buyers pursuant to Rule 144A under the Securities Act of 1933, as amended (the “Securities Act”), and to certain non-U.S. persons in accordance with Regulation S under the Securities Act. The Company completed its offering of the 2026 Senior Notes on August 4, 2016, the 2025 Senior Notes on August 13, 2015 and its offering of the 2024 Senior Notes on November 20, 2014. The Senior Notes have not been registered under the Securities Act or any state securities laws.
There were no unregistered sales of equity securities in the year ended December 31, 2016.
Use of Proceeds from Sale of Registered Securities
None.
46
FIVE-YEAR STOCK PERFORMANCE GRAPH
The following graph compares the cumulative total shareholders’ return on our common stock, the Standard & Poor’s 500 Stock Index and the NYSE Composite Index since December 31, 2011 assuming an investment of $100 at the closing price on December 31, 2011. In calculating total annual shareholders’ return, reinvestment of dividends, if any, is assumed. The indexes are included for comparative purposes only. They do not necessarily reflect management’s opinion that such indexes are an appropriate measure of the relative performance of the common stock. This graph is not “soliciting material,” is not to be deemed filed with the SEC and is not to be incorporated by reference in any of our filings under the Securities Act of 1933 or the Securities Exchange Act of 1934, as amended, whether made before or after the date hereof and irrespective of any general incorporation language in any such filing.
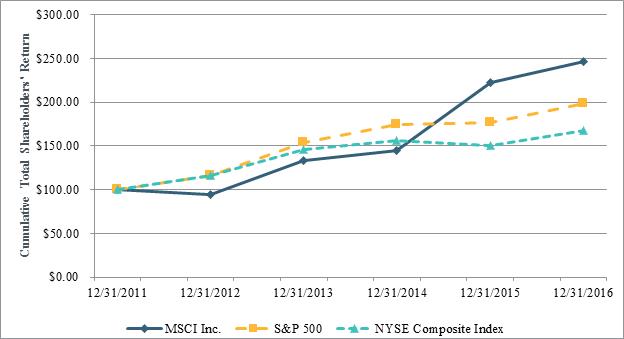
Total Investment Value
|
|
|
Years Ended |
|
|||||||||||||||||||||
|
|
|
December 31, |
|
|
December 31, |
|
|
December 31, |
|
|
December 31, |
|
|
December 31, |
|
|
December 31, |
|
||||||
|
|
|
2016 |
|
|
2015 |
|
|
2014 |
|
|
2013 |
|
|
2012 |
|
|
2011 |
|
||||||
|
MSCI Inc. |
|
$ |
246 |
|
|
$ |
222 |
|
|
$ |
145 |
|
|
$ |
133 |
|
|
$ |
94 |
|
|
$ |
100 |
|
|
S&P 500 |
|
$ |
198 |
|
|
$ |
177 |
|
|
$ |
175 |
|
|
$ |
154 |
|
|
$ |
116 |
|
|
$ |
100 |
|
|
NYSE Composite Index |
|
$ |
168 |
|
|
$ |
150 |
|
|
$ |
156 |
|
|
$ |
146 |
|
|
$ |
116 |
|
|
$ |
100 |
|
Our selected consolidated financial data for the periods presented should be read in conjunction with “Item 7. Management’s Discussion and Analysis of Financial Condition and Results of Operations” and the consolidated financial statements and notes thereto beginning on page F-1 of this Annual Report on Form 10-K.
The selected Consolidated Statement of Income data for the years ended December 31, 2016, 2015 and 2014 and the selected Consolidated Statement of Financial Condition data as of December 31, 2016 and 2015 are derived from our audited consolidated financial statements beginning on page F-1 of this Annual Report on Form 10-K. Our consolidated financial statements for the years ended December 31, 2016, 2015 and 2014 have been audited and reported upon by an independent registered public accounting firm in each period. The selected Consolidated
47
Statement of Income data for the years ended December 31, 2013 and 2012 and the selected Consolidated Statement of Financial Condition data as of December 31, 2014, 2013 and 2012 are derived from our audited consolidated financial statements not included in this Annual Report on Form 10-K.
The selected financial information presented below may not be indicative of our future performance.
|
|
|
Years Ended |
|
|||||||||||||||||
|
|
|
December 31, |
|
|
December 31, |
|
|
December 31, |
|
|
December 31, |
|
|
December 31, |
|
|||||
|
|
|
|
2016 |
|
|
2015 (1) |
|
|
2014 (2) |
|
|
2013 (4) |
|
|
2012 (5) |
|
||||
|
|
|
(in thousands, except operating margin and per share data) |
|
|||||||||||||||||
|
Operating revenues |
|
$ |
1,150,669 |
|
|
$ |
1,075,013 |
|
|
$ |
996,680 |
|
|
$ |
913,364 |
|
|
$ |
826,990 |
|
|
Total operating expenses |
|
|
662,565 |
|
|
|
671,115 |
|
|
|
659,514 |
|
|
|
573,033 |
|
|
|
508,755 |
|
|
Operating income |
|
|
488,104 |
|
|
|
403,898 |
|
|
|
337,166 |
|
|
|
340,331 |
|
|
|
318,235 |
|
|
Other expense (income), net |
|
|
102,166 |
|
|
|
54,344 |
|
|
|
28,828 |
|
|
|
27,503 |
|
|
|
57,434 |
|
|
Provision for income taxes |
|
|
125,083 |
|
|
|
119,516 |
|
|
|
109,396 |
|
|
|
112,918 |
|
|
|
96,010 |
|
|
Income from continuing operations, net of income taxes |
|
|
260,855 |
|
|
|
230,038 |
|
|
|
198,942 |
|
|
|
199,910 |
|
|
|
164,791 |
|
|
Income (loss) from discontinued operations, net of income taxes |
|
|
— |
|
|
|
(6,390 |
) |
|
|
85,171 |
|
(3) |
|
22,647 |
|
|
|
19,447 |
|
|
Net income |
|
$ |
260,855 |
|
|
$ |
223,648 |
|
|
$ |
284,113 |
|
|
$ |
222,557 |
|
|
$ |
184,238 |
|
|
Operating margin |
|
|
42.4 |
% |
|
|
37.6 |
% |
|
|
33.8 |
|
% |
|
37.3 |
% |
|
|
38.5 |
% |
|
Basic earnings per share: |
|
|
|
|
|
|
|
|
|
|
|
|
|
|
|
|
|
|
|
|
|
Earnings per basic common share from continuing operations |
|
$ |
2.72 |
|
|
$ |
2.11 |
|
|
$ |
1.72 |
|
|
$ |
1.66 |
|
|
$ |
1.34 |
|
|
Earnings per basic common share from discontinued operations |
|
|
— |
|
|
|
(0.06 |
) |
|
|
0.73 |
|
|
|
0.19 |
|
|
|
0.16 |
|
|
Earnings per basic common share |
|
$ |
2.72 |
|
|
$ |
2.05 |
|
|
$ |
2.45 |
|
|
$ |
1.85 |
|
|
$ |
1.50 |
|
|
Diluted earnings per share: |
|
|
|
|
|
|
|
|
|
|
|
|
|
|
|
|
|
|
|
|
|
Earnings per diluted common share from continuing operations |
|
$ |
2.70 |
|
|
$ |
2.09 |
|
|
$ |
1.70 |
|
|
$ |
1.64 |
|
|
$ |
1.32 |
|
|
Earnings per diluted common share from discontinued operations |
|
|
— |
|
|
|
(0.06 |
) |
|
|
0.73 |
|
|
|
0.19 |
|
|
|
0.16 |
|
|
Earnings per diluted common share |
|
$ |
2.70 |
|
|
$ |
2.03 |
|
|
$ |
2.43 |
|
|
$ |
1.83 |
|
|
$ |
1.48 |
|
|
Weighted average shares outstanding used in computing earnings per share |
|
|
|
|
|
|
|
|
|
|
|
|
|
|
|
|
|
|
|
|
|
Basic |
|
|
95,986 |
|
|
|
109,124 |
|
|
|
115,737 |
|
|
|
120,100 |
|
|
|
122,023 |
|
|
Diluted |
|
|
96,540 |
|
|
|
109,926 |
|
|
|
116,706 |
|
|
|
121,074 |
|
|
|
123,204 |
|
|
Dividends declared per common share |
|
$ |
1.00 |
|
|
$ |
0.80 |
|
|
$ |
0.18 |
|
|
$ |
— |
|
|
$ |
— |
|
48
|
|
|
As of or For the |
|
|||||||||||||||||
|
|
|
Years Ended |
|
|||||||||||||||||
|
|
|
December 31, |
|
|
December 31, |
|
|
December 31, |
|
|
December 31, |
|
|
December 31, |
|
|||||
|
|
|
2016 |
|
|
2015 (1) |
|
|
2014 (2) |
|
|
2013 (4) |
|
|
2012 (5) |
|
|||||
|
Cash and cash equivalents |
|
$ |
791,834 |
|
|
$ |
777,706 |
|
|
$ |
508,799 |
|
|
$ |
358,434 |
|
|
$ |
183,309 |
|
|
Short-term investments |
|
$ |
— |
|
|
$ |
— |
|
|
$ |
— |
|
|
$ |
— |
|
|
$ |
70,898 |
|
|
Accounts receivable (net of allowances) |
|
$ |
221,504 |
|
|
$ |
208,239 |
|
|
$ |
178,717 |
|
|
$ |
169,490 |
|
|
$ |
153,557 |
|
|
Goodwill and intangibles, net of accumulated amortization |
|
$ |
1,903,490 |
|
|
$ |
1,957,111 |
|
|
$ |
1,998,532 |
|
|
$ |
2,408,871 |
|
|
$ |
2,438,827 |
|
|
Total assets |
|
$ |
3,082,578 |
|
|
$ |
3,146,987 |
|
|
$ |
2,882,533 |
|
|
$ |
3,129,286 |
|
|
$ |
3,013,118 |
|
|
Deferred revenue |
|
$ |
334,358 |
|
|
$ |
317,552 |
|
|
$ |
310,775 |
|
|
$ |
319,735 |
|
|
$ |
308,022 |
|
|
Current maturities of long-term debt |
|
$ |
— |
|
|
$ |
— |
|
|
$ |
— |
|
|
$ |
18,301 |
|
|
$ |
40,654 |
|
|
Long-term debt, net of current maturities |
|
$ |
2,075,201 |
|
|
$ |
1,579,404 |
|
|
$ |
788,358 |
|
|
$ |
782,652 |
|
|
$ |
805,227 |
|
|
Total shareholders' equity |
|
$ |
317,605 |
|
|
$ |
901,487 |
|
|
$ |
1,432,833 |
|
|
$ |
1,564,347 |
|
|
$ |
1,413,950 |
|
|
(1) |
Includes the impact of Insignis from the October 16, 2015 acquisition date, which was not material. Deferred taxes have been presented in accordance with new accounting guidance prospectively beginning on December 31, 2015. Prior periods have not been retrospectively restated to match this presentation. |
|
(2) |
Includes the results of GMI Ratings from the August 11, 2014 acquisition date, the impact of which was not material. |
|
(3) |
Includes the net gain resulting from the disposition of ISS, the impact of which was not material. |
|
(4) |
Includes the results of InvestorForce from the January 29, 2013 acquisition date, the impact of which was not material. |
|
(5) |
Includes the results of IPD from the November 30, 2012 acquisition date, the impact of which was not material. |
49
The following discussion and analysis of the financial condition and results of our operations should be read in conjunction with the consolidated financial statements and related notes included elsewhere in this Annual Report on Form 10-K. This discussion contains forward-looking statements that involve risks and uncertainties. Our actual results could differ materially from those described below. Such risks and uncertainties include, but are not limited to, those identified below and those described in Part 1, Item 1A. “Risk Factors,” within this Annual Report on Form 10-K.
Overview
We offer products and services to support the needs of institutional investors throughout their investment processes. Clients look to us for an integrated view of the drivers of risk and return in their portfolios, broad and deep asset class coverage, quality data, an objective perspective and innovation.
Our clients include asset owners (pension funds, endowments, foundations, central banks, sovereign wealth funds, family offices and insurance companies), asset management firms (mutual funds, hedge funds, providers of exchange-traded funds (“ETFs”), private wealth managers, real estate investment trusts and financial intermediaries (banks, broker-dealers, exchanges, custodians, trust companies and investment consultants).
Our products and services include indexes and analytical models; ratings and analysis that enable institutional investors to integrate ESG factors into their investment strategies; and analysis of real estate in both privately and publicly owned portfolios. Clients use our products and services to help construct portfolios and allocate assets. The analytical content we provide through our products is enabled by applications and are the basis for the services that we provide to clients. Our analytical tools and content help clients measure and manage risk across all major asset classes. Our products and services can also be customized to meet the specific needs of our clients.
As of December 31, 2016, we had over 6,500 clients across 87 countries. To calculate the number of clients, we may count certain affiliates, user locations, or business units within a single organization as separate clients. If we aggregate all related clients under their respective parent entity, the number of clients would be approximately 3,900 as of December 31, 2016. We had offices in 33 cities in 21 countries to help serve our diverse client base, with 52.3% of our revenues coming from clients in the Americas, 35.2% in Europe, the Middle East and Africa (“EMEA”) and 12.5% in Asia and Australia.
Our principal business model is to license annual, recurring subscriptions to our products and services for use at specified locations, often by a given number of users or for a certain volume of services, for a fee, which is, in a majority of cases, paid up front. Additionally, our recurring subscription offerings include our managed services offering, whereby we oversee the production of risk and performance reports on behalf of our clients. Fees attributable to annual, recurring subscriptions are recorded as deferred revenues on our Consolidated Statement of Financial Condition and are recognized on our Consolidated Statement of Income as the service is rendered. Furthermore, a portion of our revenues comes from clients who use our indexes as the basis for index-linked investment products such as ETFs or as the basis for passively managed funds and separate accounts. These clients commonly pay us a license fee, primarily in arrears, for the use of our intellectual property, primarily in arrears, based on the investment product’s assets. We also generate revenues from certain exchanges that use our indexes as the basis for futures and options contracts and pay us a license fee, primarily in arrears, for the use of our intellectual property based on their volume of trades. In addition, we generate revenues from subscription agreements for the receipt of periodic benchmark reports, digests and other publications, which are most often associated with our real estate products that are recognized upon delivery of such reports or data updates. Fees are primarily paid in arrears after the product is delivered. We also realize one-time fees related to customized reports, historical data sets and certain implementation and consulting services, as well as from certain products and services that are purchased on a non-renewal basis.
In evaluating our financial performance, we focus on revenue and profit growth, including GAAP and non-GAAP measures, for the Company as a whole as well as by operating segment. In addition, we focus on operating metrics, including Run Rate, subscription sales and Aggregate Retention Rate to manage the business. Our business is not highly capital intensive and, as such, we expect to continue to convert a high percentage of our profits into
50
excess cash in the future. Our growth strategy includes: (a) expanding and deepening our relationships with investment institutions worldwide; (b) developing new and enhancing existing product offerings, including combining existing product features or data derived from our products to create new products; and (c) seeking to acquire products, technologies, services and companies that will enhance, complement or expand our client base and product offerings.
Key Financial Metrics and Drivers
We utilize a portfolio of key financial metrics to manage the Company, including GAAP and non-GAAP measures. As detailed below, we review revenues by type and by segment, or major product line. We also review expenses by activity, which provides more transparency into how resources are being deployed. In addition, we utilize operating metrics including Run Rate, subscription sales and Aggregate Retention Rate, to analyze past performance and to provide insight into our latest reported portfolio of recurring business.
In the discussion that follows, we provide variances excluding the impact of foreign currency exchange rate fluctuations. Foreign currency exchange rate fluctuations reflect the difference between the current period results as reported compared to the current period results recalculated using the foreign currency exchange rates in effect for the comparable prior period.
Revenues
Our revenues are characterized by type, which broadly reflects the nature of how they are recognized or earned. Our revenue types are recurring subscription, asset-based fees and non-recurring revenues. We also group our revenues by segment and provide the revenue type within each segment. See Part 1, Item 1. “Business—Our Operating Segments” above for additional details on the products and services that we offer.
Recurring subscription revenues represent fees earned from clients primarily under renewable contracts or agreements and are recognized in most cases ratably over the term of the license or service pursuant to the contract terms. The contracts state the terms under which these fees are to be calculated. The fees are recognized as we provide the product and service to the client over the license period and are generally billed in advance, prior to the license start date. When implementation services are included, we recognize revenues ratably from the date the application is put into production through the end of the license period. Revenues associated with implementation services, which are allocated based on MSCI’s best estimated sales price for such implementation services, are recognized ratably over the useful life of those services. Revenues from subscription agreements for the receipt of periodic benchmark reports, digests, and other publications, which are most often associated with our real estate benchmark business, are recognized upon delivery of such reports or data updates.
Asset-based fees are principally recognized based on the estimated assets under management (“AUM”) linked to our indexes from independent third-party sources or the most recently reported information provided by the client. Asset-based fees include revenues related to futures and options contracts linked to our indexes, which are primarily based on trading volumes.
Non-recurring revenues primarily represent fees earned on products and services where we do not have renewal contracts and primarily include revenues for providing historical data, certain implementation services and other special client requests. Based on the nature of the services provided, non-recurring revenues are recognized upon delivery or over the service period.
Operating Expenses
We group our operating expenses into the following activity categories:
|
|
• |
Cost of revenues; |
|
|
• |
Selling and marketing; |
|
|
• |
Research and development (“R&D”); |
|
|
• |
General and administrative (“G&A”); |
51
|
|
• |
Depreciation and amortization of property, equipment and leasehold improvements. |
Costs are assigned to these activity categories based on the nature of the expense or, when not directly attributable, an estimate is allocated based on the type of effort involved.
Cost of Revenues
Cost of revenues consists of costs related to the production and servicing of our products and services and primarily includes related information technology costs, including data center, platform and infrastructure costs; costs to acquire, produce and maintain market data information; costs of research to support, maintain and rebalance existing products; costs of product management teams; costs of client service and consultant teams to support customer needs; as well as other support costs directly attributable to the cost of revenues including certain human resources, finance and legal costs.
Selling and Marketing
Selling and marketing expenses consists of costs associated with acquiring new clients or selling new products or product renewals to existing clients and primarily includes the costs of our sales force and marketing teams, as well as costs incurred in other groups associated with acquiring new business, including product management, research, technology and sales operations.
Research and Development
R&D expenses consists of the costs to develop new or enhance existing products and the costs to develop new or improved technology and service platforms for the delivery of our products and services and primarily includes the costs of application development, quality and assurance, research, product management, project management and the technology support associated with these efforts.
General and Administrative
G&A expenses consists of costs primarily related to finance operations, human resources, office of the CEO, legal, corporate technology, corporate development and certain other administrative costs that are not directly attributed, but are instead allocated, to a product or service.
Amortization of Intangible Assets
Amortization of intangible assets expense relates to definite-lived intangible assets arising from past acquisitions and consists of customer relationships, trademarks and trade names, technology and software, proprietary processes and data and non-competition agreements. We amortize definite-lived intangible assets over their estimated useful lives. Definite-lived intangible assets are tested for impairment when impairment indicators are present, and, if impaired, written down to fair value based on either discounted cash flows or appraised values. No impairment of intangible assets has been identified during any of the periods presented. We have no indefinite-lived intangibles.
Depreciation and amortization of property, equipment and leasehold improvements
This category consists of expenses related to depreciating or amortizing the cost of furniture & fixtures, computer and related equipment and leasehold improvements over the estimated useful life of the assets.
Other Expense (Income), net
This category consists primarily of interest we pay on our outstanding indebtedness, interest we collect on cash and short-term investments, transition services income associated with our sale of ISS, foreign currency exchange rate gains and losses as well as other non-operating income and expense items.
52
Adjusted EBITDA
“Adjusted EBITDA,” a measure used by management to assess operating performance, is defined as net income before income (loss) from discontinued operations, net of income taxes, plus provision for income taxes, other expense (income), net, depreciation and amortization of property, equipment and leasehold improvements, amortization of intangible assets and, at times, certain other transactions or adjustments.
“Adjusted EBITDA expenses,” a measure used by management to assess operating performance, is defined as operating expenses less depreciation and amortization of property, equipment and leasehold improvements and amortization of intangible assets.
Adjusted EBITDA and Adjusted EBITDA expenses are believed to be meaningful measures of the operating performance of the Company because they adjust for significant one-time, unusual or non-recurring items as well as eliminate the accounting effects of capital spending and acquisitions that do not directly affect what management considers to be the Company’s core operating performance in the period. All companies do not calculate adjusted EBITDA and adjusted EBITDA expenses in the same way. These measures can differ significantly from company to company depending on, among other things, long-term strategic decisions regarding capital structure, the tax jurisdictions in which companies operate and capital investments. Accordingly, the Company’s computation of the Adjusted EBITDA and Adjusted EBITDA expenses measures may not be comparable to similarly titled measures computed by other companies.
Run Rate
Run Rate is a key operating metric and is important because an increase or decrease in our Run Rate ultimately impacts our operating revenues. At the end of any period, we generally have subscription and investment product license agreements in place for a large portion of total revenues for the following 12 months. We measure the fees related to these agreements and refer to this as “Run Rate.” See “—Operating Metrics—Run Rate” below for additional information on the calculation of this metric.
Subscription Sales
Subscription sales is a key operating metric and is important because new subscription sales increase our Run Rate and ultimately our operating revenues. See “—Operating Metrics—Subscription Sales” below for additional information.
Aggregate Retention Rate
Another key operating metric is Aggregate Retention Rate which is important because subscription cancellations decrease our Run Rate and ultimately our operating revenues. See “—Operating Metrics—Aggregate Retention Rate” below for additional information on the calculation of this metric.
Critical Accounting Policies and Estimates
Our consolidated financial statements are prepared in accordance with accounting principles generally accepted in the United States (“GAAP”). These accounting principles require us to make certain estimates and judgments that can affect the reported amounts of assets and liabilities as of the date of the consolidated financial statements, as well as the reported amounts of revenues and expenses during the periods presented. We believe the estimates and judgments upon which we rely are reasonable based upon information available to us at the time these estimates and judgments are made. To the extent there are material differences between these estimates and actual results, our consolidated financial statements will be affected. See Note 1, “Introduction And Basis Of Presentation—Significant Accounting Policies,” of the Notes to the Consolidated Financial Statements included herein for a listing of our accounting policies.
53
Factors Affecting the Comparability of Results
Acquisition of Insignis
On October 16, 2015, the Company completed the purchase of Insignis for $6.5 million through its subsidiary InvestorForce. Insignis is a financial data provider, including data on positions, transactions and complex instruments such as exchange-traded futures and options, OTC swaps and foreign exchange spot and forward contracts. Financial results for Insignis are included within the Analytics segment from the time of acquisition.
The purchase price allocations for the Insignis acquisition were $4.2 million for goodwill, $2.2 million of identifiable intangible assets and $0.1 million for assets other than identifiable intangible assets. The results of Insignis were included in our results of operations from its acquisition date of October 16, 2015. The Insignis acquisition has not had a significant impact on our results of operations.
Disposition of Real Estate occupiers
On August 1, 2016, MSCI completed the sale of its Real Estate occupiers business. The value of the disposed assets and liabilities and the resulting gain on disposal were not material to the Company.
Share Repurchases
On February 4, 2014, our Board of Directors approved a stock repurchase program authorizing the purchase of up to $300.0 million worth of shares of our common stock, which was subsequently increased to $850.0 million (the “2014 Repurchase Program”). On October 14, 2015, we exhausted the $850.0 million share repurchase authorization under the 2014 Repurchase Program.
On October 28, 2015, our Board of Directors approved a new stock repurchase program authorizing the purchase of up to $1.0 billion worth of shares of our common stock (the “2015 Repurchase Program”). On October 26, 2016, our Board of Directors approved an additional stock repurchase program authorizing the purchase of up to $750.0 million worth of shares of our common stock (together with the $330.3 million remaining authorization under the 2015 Repurchase Program, the “2016 Repurchase Program”). Share repurchases made pursuant to the 2016 Repurchase Program may take place in the open market or in privately negotiated transactions from time to time based on market and other conditions. This authorization may be modified, suspended or terminated by our Board of Directors at any time without prior notice.
On September 18, 2014, as part of the 2014 Repurchase Program, we entered into an ASR agreement to initiate share repurchases aggregating $300.0 million (the “September 2014 ASR Agreement”). As a result of the September 2014 ASR Agreement, we repurchased approximately 4.5 million shares of our common stock on September 19, 2014 and received approximately 1.2 million shares of our common stock on May 21, 2015 for a combined average price of $52.79 per share.
On June 2, 2015, we began purchasing shares of our common stock in the open market in accordance with SEC Rule 10b5-1.
For the year ended December 31, 2015, the Company repurchased approximately 10.7 million shares at an average price of $62.63 per share for a total value of $670.8 million pursuant to open market repurchases.
For the year ended December 31, 2016, the Company repurchased approximately 10.3 million shares at an average price of $73.71 per share for a total value of $759.4 million pursuant to open market repurchases.
The weighted average shares outstanding used to calculate our diluted earnings per share for the year ended December 31, 2016 decreased by 12.2% compared to the year ended December 31, 2015. The weighted average shares outstanding used to calculate our diluted earnings per share for the year ended December 31, 2015 decreased by 5.8% compared to the year ended December 31, 2014. The decreases in both periods reflect the impact of the share repurchase programs, partially offset by the impact of restricted stock units and stock options that converted to shares.
54
Senior Notes and Credit Agreement
On November 20, 2014, we completed our first private offering of $800.0 million aggregate principal amount of 5.25% senior unsecured notes due 2024 (the “2024 Senior Notes”) and also entered into a new $200.0 million senior unsecured revolving credit agreement (the “2014 Revolving Credit Agreement”). We used the net proceeds from the offering of the 2024 Senior Notes, together with cash on hand, to repay in full our outstanding term loan indebtedness of $794.8 million, which bore interest at LIBOR plus a margin of 2.25%.
On August 13, 2015, we completed a private offering of $800.0 million aggregate principal amount of 5.75% Senior Notes due 2025 (the “2025 Senior Notes”) and received $789.5 million, net of $10.5 million of debt issuance costs.
On August 4, 2016, we completed a private offering of $500.0 million aggregate principal amount of 4.75% Senior Notes due 2026 (the “2026 Senior Notes”) and received $493.3 million, net of $6.7 million of debt issuance costs.
The annual interest expense related to these offerings for the year ended December 31, 2016 was $101.7 million. The annual interest expense related to these offerings in future years is expected to be approximately $116.0 million.
55
Year Ended December 31, 2016 Compared to Year Ended December 31, 2015
The following table presents the results of operations for the years indicated:
|
|
|
Years Ended |
|
|
|
|
|
|
|
|
|
|||||
|
|
|
December 31, |
|
|
December 31, |
|
|
|
|
|
|
|
|
|
||
|
|
|
2016 |
|
|
2015 |
|
|
Increase/(Decrease) |
|
|||||||
|
|
|
(in thousands, except per share data) |
|
|
|
|
|
|||||||||
|
Operating revenues |
|
$ |
1,150,669 |
|
|
$ |
1,075,013 |
|
|
$ |
75,656 |
|
|
|
7.0 |
% |
|
Operating expenses: |
|
|
|
|
|
|
|
|
|
|
|
|
|
|
|
|
|
Cost of revenues |
|
|
252,107 |
|
|
|
267,695 |
|
|
|
(15,588 |
) |
|
|
(5.8 |
%) |
|
Selling and marketing |
|
|
166,666 |
|
|
|
162,294 |
|
|
|
4,372 |
|
|
|
2.7 |
% |
|
Research and development |
|
|
75,204 |
|
|
|
77,320 |
|
|
|
(2,116 |
) |
|
|
(2.7 |
%) |
|
General and administrative |
|
|
87,235 |
|
|
|
86,007 |
|
|
|
1,228 |
|
|
|
1.4 |
% |
|
Amortization of intangible assets |
|
|
47,033 |
|
|
|
46,910 |
|
|
|
123 |
|
|
|
0.3 |
% |
|
Depreciation and amortization of property, equipment and leasehold improvements |
|
|
34,320 |
|
|
|
30,889 |
|
|
|
3,431 |
|
|
|
11.1 |
% |
|
Total operating expenses |
|
|
662,565 |
|
|
|
671,115 |
|
|
|
(8,550 |
) |
|
|
(1.3 |
%) |
|
Operating income |
|
|
488,104 |
|
|
|
403,898 |
|
|
|
84,206 |
|
|
|
20.8 |
% |
|
Other expense (income), net |
|
|
102,166 |
|
|
|
54,344 |
|
|
|
47,822 |
|
|
|
88.0 |
% |
|
Income from continuing operations before provision for income taxes |
|
|
385,938 |
|
|
|
349,554 |
|
|
|
36,384 |
|
|
|
10.4 |
% |
|
Provision for income taxes |
|
|
125,083 |
|
|
|
119,516 |
|
|
|
5,567 |
|
|
|
4.7 |
% |
|
Income from continuing operations |
|
|
260,855 |
|
|
|
230,038 |
|
|
|
30,817 |
|
|
|
13.4 |
% |
|
Income (loss) from discontinued operations, net of income taxes |
|
|
— |
|
|
|
(6,390 |
) |
|
|
6,390 |
|
|
|
(100.0 |
%) |
|
Net income |
|
$ |
260,855 |
|
|
$ |
223,648 |
|
|
$ |
37,207 |
|
|
|
16.6 |
% |
|
Earnings per basic common share: |
|
|
|
|
|
|
|
|
|
|
|
|
|
|
|
|
|
From continuing operations |
|
$ |
2.72 |
|
|
$ |
2.11 |
|
|
$ |
0.61 |
|
|
|
28.9 |
% |
|
From discontinued operations |
|
|
— |
|
|
|
(0.06 |
) |
|
|
0.06 |
|
|
|
(100.0 |
%) |
|
Earnings per basic common share |
|
$ |
2.72 |
|
|
$ |
2.05 |
|
|
$ |
0.67 |
|
|
|
32.7 |
% |
|
Earnings per diluted common share: |
|
|
|
|
|
|
|
|
|
|
|
|
|
|
|
|
|
From continuing operations |
|
$ |
2.70 |
|
|
$ |
2.09 |
|
|
$ |
0.61 |
|
|
|
29.2 |
% |
|
From discontinued operations |
|
|
— |
|
|
|
(0.06 |
) |
|
|
0.06 |
|
|
|
(100.0 |
%) |
|
Earnings per diluted common share |
|
$ |
2.70 |
|
|
$ |
2.03 |
|
|
$ |
0.67 |
|
|
|
33.0 |
% |
|
Operating margin |
|
|
42.4 |
% |
|
|
37.6 |
% |
|
|
|
|
|
|
|
|
Operating Revenues
Our revenues are grouped by the following types: recurring subscription, asset-based fees and non-recurring revenues. We also group revenues by major product lines as follows: Index, Analytics and All Other, which includes the ESG and Real Estate product lines.
56
The following table presents operating revenues by recurring subscriptions, asset-based fees and non-recurring revenues for the years indicated:
|
|
|
Years Ended |
|
|
|
|
|
|
|
|
|
|||||
|
|
|
December 31, |
|
|
December 31, |
|
|
|
|
|
|
|
|
|
||
|
|
|
2016 |
|
|
|
2015 |
|
|
Increase/(Decrease) |
|
||||||
|
|
|
(in thousands) |
|
|
|
|
|
|||||||||
|
Recurring subscriptions |
|
$ |
913,669 |
|
|
$ |
857,527 |
|
|
$ |
56,142 |
|
|
|
6.5 |
% |
|
Asset-based fees |
|
|
210,229 |
|
|
|
197,974 |
|
|
|
12,255 |
|
|
|
6.2 |
% |
|
Non-recurring |
|
|
26,771 |
|
|
|
19,512 |
|
|
|
7,259 |
|
|
|
37.2 |
% |
|
Total operating revenues |
|
$ |
1,150,669 |
|
|
$ |
1,075,013 |
|
|
$ |
75,656 |
|
|
|
7.0 |
% |
Total operating revenues grew 7.0% to $1,150.7 million for the year ended December 31, 2016 compared to $1,075.0 million for the year ended December 31, 2015.
Revenue from recurring subscriptions increased 6.5% to $913.7 million for the year ended December 31, 2016 compared to $857.5 million for the year ended December 31, 2015. The increase in recurring subscription revenues was driven by growth from Index products as well as higher revenues from Analytics and ESG products, partially offset by lower Real Estate products’ revenues within the All Other segment. Adjusting for the impact of foreign currency exchange rate fluctuations, recurring subscription revenues would have increased 7.1% for the year ended December 31, 2016 compared to the year ended December 31, 2015.
Revenues from asset-based fees increased 6.2% to $210.2 million for the year ended December 31, 2016 compared to $198.0 million for the year ended December 31, 2015. The increase was primarily driven by a 19.2% increase in non-ETF passive funds, as well as a 34.8% increase in revenue from futures and options contracts linked to MSCI indexes. The average value of AUM in ETFs linked to MSCI indexes increased $27.6 billion, or 6.6%, compared to the year ended December 31, 2015. Approximately two-thirds of the underlying securities included in the AUM of our index-linked investment products are denominated in currencies other than the U.S. dollar.
The following table presents the value of AUM in ETFs linked to MSCI indexes and the sequential change of such assets as of the end of each of the periods indicated:
|
|
|
Period Ended (1) |
|
|||||||||||||||||||||||||||||
|
|
|
2015 |
|
|
2016 |
|
||||||||||||||||||||||||||
|
(in billions) |
|
March 31, |
|
|
June 30, |
|
|
September 30, |
|
|
December 31, |
|
|
March 31, |
|
|
June 30, |
|
|
September 30, |
|
|
December 31, |
|
||||||||
|
AUM in ETFs linked to MSCI indexes (2) |
|
$ |
418.0 |
|
|
$ |
435.4 |
|
|
$ |
390.2 |
|
|
$ |
433.4 |
|
|
$ |
438.3 |
|
|
$ |
439.7 |
|
|
$ |
474.9 |
|
|
$ |
481.4 |
|
|
Sequential Change in Value |
|
|
|
|
|
|
|
|
|
|
|
|
|
|
|
|
|
|
|
|
|
|
|
|
|
|
|
|
|
|
|
|
|
Market Appreciation/ (Depreciation) |
|
$ |
13.0 |
|
|
$ |
(6.9 |
) |
|
$ |
(48.2 |
) |
|
$ |
14.5 |
|
|
$ |
(1.7 |
) |
|
$ |
(2.5 |
) |
|
$ |
23.7 |
|
|
$ |
(8.7 |
) |
|
Cash Inflows |
|
|
31.7 |
|
|
|
24.3 |
|
|
|
3.0 |
|
|
|
28.7 |
|
|
|
6.6 |
|
|
|
3.9 |
|
|
|
11.5 |
|
|
|
15.2 |
|
|
Total Change |
|
$ |
44.7 |
|
|
$ |
17.4 |
|
|
$ |
(45.2 |
) |
|
$ |
43.2 |
|
|
$ |
4.9 |
|
|
$ |
1.4 |
|
|
$ |
35.2 |
|
|
$ |
6.5 |
|
Source: Bloomberg and MSCI
|
(1) |
The historical values of the assets in ETFs linked to our indexes as of the last day of the month and the monthly average balance can be found under the link “AUM in ETFs Linked to MSCI indexes” on our Investor Relations homepage at http://ir.msci.com. This information is updated on the second U.S. business day of each month. Information contained on our website is not incorporated by reference into this Annual Report on Form 10-K or any other report filed with the SEC. |
|
(2) |
The value of assets under management in ETFs linked to MSCI Indexes is calculated by multiplying the ETF net asset value by the number of shares outstanding. |
As of December 31, 2016, the value of AUM in ETFs linked to MSCI equity indexes was $481.4 billion, up
$48.0 billion, or 11.1%, from $433.4 billion as of December 31, 2015.
57
Non-recurring revenues increased 37.2% to $26.8 million for the year ended December 31, 2016, compared to $19.5 million for the year ended December 31, 2015, primarily resulting from higher one-time sales of Index products.
The following table presents operating revenues by reportable segment and revenue type for the years indicated:
|
|
|
Years Ended |
|
|
|
|
|
|
|
|
|
|||||
|
|
|
December 31, |
|
|
December 31, |
|
|
|
|
|
|
|
|
|
||
|
|
|
2016 |
|
|
|
2015 |
|
|
Increase/(Decrease) |
|
||||||
|
|
|
(in thousands) |
|
|
|
|
|
|||||||||
|
Operating revenues: |
|
|
|
|
|
|
|
|
|
|
|
|
|
|
|
|
|
Index |
|
|
|
|
|
|
|
|
|
|
|
|
|
|
|
|
|
Recurring subscriptions |
|
$ |
389,348 |
|
|
$ |
353,136 |
|
|
$ |
36,212 |
|
|
|
10.3 |
% |
|
Asset-based fees |
|
|
210,229 |
|
|
|
197,974 |
|
|
|
12,255 |
|
|
|
6.2 |
% |
|
Non-recurring |
|
|
13,974 |
|
|
|
7,854 |
|
|
|
6,120 |
|
|
|
77.9 |
% |
|
Index total |
|
|
613,551 |
|
|
|
558,964 |
|
|
|
54,587 |
|
|
|
9.8 |
% |
|
Analytics |
|
|
|
|
|
|
|
|
|
|
|
|
|
|
|
|
|
Recurring subscriptions |
|
|
439,864 |
|
|
|
426,725 |
|
|
|
13,139 |
|
|
|
3.1 |
% |
|
Non-recurring |
|
|
8,489 |
|
|
|
6,699 |
|
|
|
1,790 |
|
|
|
26.7 |
% |
|
Analytics total |
|
|
448,353 |
|
|
|
433,424 |
|
|
|
14,929 |
|
|
|
3.4 |
% |
|
All Other |
|
|
|
|
|
|
|
|
|
|
|
|
|
|
|
|
|
Recurring subscriptions |
|
|
84,457 |
|
|
|
77,666 |
|
|
|
6,791 |
|
|
|
8.7 |
% |
|
Non-recurring |
|
|
4,308 |
|
|
|
4,959 |
|
|
|
(651 |
) |
|
|
(13.1 |
%) |
|
All Other total |
|
|
88,765 |
|
|
|
82,625 |
|
|
|
6,140 |
|
|
|
7.4 |
% |
|
Total operating revenues |
|
$ |
1,150,669 |
|
|
$ |
1,075,013 |
|
|
$ |
75,656 |
|
|
|
7.0 |
% |
Refer to the section titled, “Segment Results of Operations” for an explanation of the results.
Operating Expenses
Operating expenses decreased 1.3% to $662.6 million for the year ended December 31, 2016 compared to $671.1 million for the year ended December 31, 2015. Adjusting for the impact of foreign currency exchange rate fluctuations, operating expenses would have increased 0.8% for the year ended December 31, 2016 compared to the year ended December 31, 2015.
The following table presents operating expenses by activity for the years indicated:
|
|
|
Years Ended |
|
|
|
|
|
|
|
|
|
|||||
|
|
|
December 31, |
|
|
December 31, |
|
|
|
|
|
|
|
|
|
||
|
|
|
2016 |
|
|
2015 |
|
|
Increase/(Decrease) |
|
|||||||
|
|
|
(in thousands) |
|
|
|
|
|
|||||||||
|
Operating expenses: |
|
|
|
|
|
|
|
|
|
|
|
|
|
|
|
|
|
Cost of revenues |
|
$ |
252,107 |
|
|
$ |
267,695 |
|
|
$ |
(15,588 |
) |
|
|
(5.8 |
%) |
|
Selling and marketing |
|
|
166,666 |
|
|
|
162,294 |
|
|
|
4,372 |
|
|
|
2.7 |
% |
|
Research and development |
|
|
75,204 |
|
|
|
77,320 |
|
|
|
(2,116 |
) |
|
|
(2.7 |
%) |
|
General and administrative |
|
|
87,235 |
|
|
|
86,007 |
|
|
|
1,228 |
|
|
|
1.4 |
% |
|
Amortization of intangible assets |
|
|
47,033 |
|
|
|
46,910 |
|
|
|
123 |
|
|
|
0.3 |
% |
|
Depreciation and amortization of property, equipment and leasehold improvements |
|
|
34,320 |
|
|
|
30,889 |
|
|
|
3,431 |
|
|
|
11.1 |
% |
|
Total operating expenses |
|
$ |
662,565 |
|
|
$ |
671,115 |
|
|
$ |
(8,550 |
) |
|
|
(1.3 |
%) |
58
Cost of revenues for the year ended December 31, 2016 decreased 5.8% to $252.1 million compared to $267.7 million for the year ended December 31, 2015, primarily driven by strong expense management, particularly in the Analytics segment, as reflected by lower compensation and benefits costs attributable to a higher percentage of employees in emerging market centers, which have lower cost structures, and severance costs, as well as a decrease in non-compensation information technology and occupancy costs.
Selling and Marketing
Selling and marketing expenses for the year ended December 31, 2016 increased 2.7% to $166.7 million compared to $162.3 million for the year ended December 31, 2015, primarily driven by higher incentive compensation, partially offset by lower salary expense and severance costs, as well as higher non-compensation marketing costs.
Research and Development
R&D expenses for the year ended December 31, 2016 decreased 2.7% to $75.2 million compared to $77.3 million for the year ended December 31, 2015, primarily due to an increase in capitalized software development costs. The year ended December 31, 2015 includes a non-cash charge of $3.4 million related to the termination of a technology project in the Analytics segment.
General and Administrative
G&A expenses for the year ended December 31, 2016 increased 1.4% to $87.2 million compared to $86.0 million for the year ended December 31, 2015, primarily driven by higher compensation and benefits costs, partially offset by lower non-compensation professional fees.
The following table presents operating expenses using compensation and non-compensation categories, rather than using activity categories, for the years indicated:
|
|
|
Years Ended |
|
|
|
|
|
|
|
|
|
|||||
|
|
|
December 31, |
|
|
December 31, |
|
|
|
|
|
|
|
|
|
||
|
|
|
2016 |
|
|
2015 |
|
|
Increase/(Decrease) |
|
|||||||
|
|
|
(in thousands) |
|
|
|
|
|
|||||||||
|
Compensation and benefits |
|
$ |
414,322 |
|
|
$ |
426,238 |
|
|
$ |
(11,916 |
) |
|
|
(2.8 |
%) |
|
Non-compensation expenses |
|
|
166,890 |
|
|
|
167,078 |
|
|
|
(188 |
) |
|
|
(0.1 |
%) |
|
Amortization of intangible assets |
|
|
47,033 |
|
|
|
46,910 |
|
|
|
123 |
|
|
|
0.3 |
% |
|
Depreciation and amortization of property, equipment and leasehold improvements |
|
|
34,320 |
|
|
|
30,889 |
|
|
|
3,431 |
|
|
|
11.1 |
% |
|
Total operating expenses |
|
$ |
662,565 |
|
|
$ |
671,115 |
|
|
$ |
(8,550 |
) |
|
|
(1.3 |
%) |
Compensation and benefits costs are our most significant expense and typically represent more than 60% of our operating expenses or more than 70% of the combined total of the cost of revenues, selling and marketing, R&D and G&A expense categories. We had 2,862 employees as of December 31, 2016 compared to 2,754 employees as of December 31, 2015. Our continued growth in emerging market centers around the world is an important factor in our ability to manage and control the growth of our compensation and benefits expenses. As of December 31, 2016, 56.2% of our employees were located in emerging market centers compared to 52.8% of our employees as of December 31, 2015.
Compensation and benefits costs for the year ended December 31, 2016 decreased 2.8% to $414.3 million compared to $426.2 million for year ended December 31, 2015, primarily due to lower severance as well as higher capitalized software development costs. The higher capitalized software development costs includes a non-cash charge of $2.9 million related to the termination of a technology project in the Analytics segment recognized during the year ended December 31, 2015.
59
Non-compensation expenses for the year ended December 31, 2016 decreased 0.1% to $166.9 million compared to $167.1 million for the year ended December 31, 2015, primarily driven by a decrease in occupancy and professional fees, as well as a non-cash charge of $0.5 million related to the termination of a technology project in the Analytics segment recognized during the year ended December 31, 2015. These decreases were partially offset by increases in costs primarily attributable to marketing.
Amortization of Intangibles
Amortization of intangibles expense for the years ended December 31, 2016 and 2015 totaled $47.0 million and $46.9 million, respectively.
Depreciation and amortization of property, equipment and leasehold improvements
For the years ended December 31, 2016 and 2015, depreciation and amortization of property, equipment and leasehold improvements totaled $34.3 million and $30.9 million, respectively. The 11.1% increase primarily reflected higher depreciation of investments made in our information technology infrastructure.
Other Expense (Income), Net
Other expense (income), net for the year ended December 31, 2016 increased 88.0% to $102.2 million compared to $54.3 million for the year ended December 31, 2015, primarily driven by $39.3 million of higher interest expense resulting from the increased level of indebtedness, a $3.7 million charge for estimated losses associated with miscellaneous transactions, as well as the impact of the $6.4 million from gains on the sale of investments realized in the year ended December 31, 2015.
Income Taxes
The provision for income tax expense was $125.1 million and $119.5 million for the years ended December 31, 2016 and 2015, respectively. These amounts reflect effective tax rates of 32.4% and 34.2% for the years ended December 31, 2016 and 2015, respectively. The decrease in the effective tax rate was primarily driven by efforts to better align our tax profile with our global operating footprint. For the year ended December 31, 2016, 31.7% of income from continuing operations before provision for income taxes was generated by foreign operations compared to 19.1% for the year ended December 31, 2015.
The effective tax rate of 32.4% for the year ended December 31, 2016 reflects our operating tax rate adjusted for the impact of certain discrete items. Included in the discrete items was the release of a reserve for uncertain tax positions related to an IRS audit settlement. Overall, the discrete items decreased our effective tax rate by 1.0% in the year ended December 31, 2016.
The effective tax rate of 34.2% for the year ended December 31, 2015 reflects our operating tax rate adjusted for the impact of certain discrete items. Included in the discrete items was a claim for an additional deduction related to U.S. production activities for prior years, which was partially offset by a provision for state tax liabilities related to prior years. Overall, the discrete items decreased our effective tax rate by 0.6% in the year ended December 31, 2015.
Income (loss) from Discontinued Operations, Net of Income Taxes
On April 30, 2014, MSCI completed the sale of ISS which is reflected as discontinued operations in our consolidated financial statements. Loss from discontinued operations, net of income taxes, for the year ended December 31, 2015 reflects the impact of a $6.4 million out-of-period income tax charge associated with tax obligations triggered upon the sale of ISS.
60
As a result of the factors described above, net income for the year ended December 31, 2016 increased 16.6% to $260.9 million compared to $223.6 million for the year ended December 31, 2015.
Adjusted EBITDA
The following table presents the calculation of the non-GAAP Adjusted EBITDA measure for the years indicated:
|
|
|
Years Ended |
|
|
|
|
|
|
|
|
|
|||||
|
|
|
December 31, |
|
|
December 31, |
|
|
|
|
|
|
|
|
|
||
|
|
|
2016 |
|
|
2015 |
|
|
Increase/(Decrease) |
|
|||||||
|
|
|
(in thousands) |
|
|
|
|
|
|||||||||
|
Operating revenues: |
|
$ |
1,150,669 |
|
|
$ |
1,075,013 |
|
|
$ |
75,656 |
|
|
|
7.0 |
% |
|
Adjusted EBITDA expenses |
|
|
581,212 |
|
|
|
593,316 |
|
|
|
(12,104 |
) |
|
|
(2.0 |
%) |
|
Adjusted EBITDA |
|
$ |
569,457 |
|
|
$ |
481,697 |
|
|
$ |
87,760 |
|
|
|
18.2 |
% |
|
Adjusted EBITDA margin % |
|
|
49.5 |
% |
|
|
44.8 |
% |
|
|
|
|
|
|
|
|
|
Operating margin % |
|
|
42.4 |
% |
|
|
37.6 |
% |
|
|
|
|
|
|
|
|
Adjusted EBITDA increased 18.2% to $569.5 million for the year ended December 31, 2016 compared to $481.7 million for the year ended December 31, 2015. Adjusted EBITDA margin increased to 49.5% for the year ended December 31, 2016 compared to 44.8% for the year ended December 31, 2015. The improvement in margin reflects higher growth in operating revenues in the Index, Analytics and ESG product lines, combined with lower Adjusted EBITDA expenses, reflecting strong expense management.
Reconciliation of Adjusted EBITDA to Net Income and Adjusted EBITDA Expenses to Operating Expenses
The following table presents the reconciliation of Adjusted EBITDA to net income for the years indicated:
|
|
|
Years Ended |
|
|
|
|
|
|
|
|
|
|||||
|
|
|
December 31, |
|
|
December 31, |
|
|
|
|
|
|
|
|
|
||
|
|
|
2016 |
|
|
2015 |
|
|
Increase/(Decrease) |
|
|||||||
|
|
|
(in thousands) |
|
|
|
|
|
|||||||||
|
Index Adjusted EBITDA |
|
$ |
431,478 |
|
|
$ |
392,987 |
|
|
$ |
38,491 |
|
|
|
9.8 |
% |
|
Analytics Adjusted EBITDA |
|
|
128,507 |
|
|
|
95,468 |
|
|
|
33,039 |
|
|
|
34.6 |
% |
|
All Other Adjusted EBITDA |
|
|
9,472 |
|
|
|
(6,758 |
) |
|
|
16,230 |
|
|
|
240.2 |
% |
|
|
|
|
|
|
|
|
|
|
|
|
|
|
|
|
|
|
|
Consolidated Adjusted EBITDA |
|
|
569,457 |
|
|
|
481,697 |
|
|
|
87,760 |
|
|
|
18.2 |
% |
|
Amortization of intangible assets |
|
|
47,033 |
|
|
|
46,910 |
|
|
|
123 |
|
|
|
0.3 |
% |
|
Depreciation and amortization of property, equipment and leasehold improvements |
|
|
34,320 |
|
|
|
30,889 |
|
|
|
3,431 |
|
|
|
11.1 |
% |
|
|
|
|
|
|
|
|
|
|
|
|
|
|
|
|
|
|
|
Operating income |
|
|
488,104 |
|
|
|
403,898 |
|
|
|
84,206 |
|
|
|
20.8 |
% |
|
Other expense (income), net |
|
|
102,166 |
|
|
|
54,344 |
|
|
|
47,822 |
|
|
|
88.0 |
% |
|
Provision for income taxes |
|
|
125,083 |
|
|
|
119,516 |
|
|
|
5,567 |
|
|
|
4.7 |
% |
|
Income from continuing operations |
|
|
260,855 |
|
|
|
230,038 |
|
|
|
30,817 |
|
|
|
13.4 |
% |
|
Income (loss) from discontinued operations, net of income taxes |
|
|
— |
|
|
|
(6,390 |
) |
|
|
6,390 |
|
|
|
(100.0 |
%) |
|
Net income |
|
$ |
260,855 |
|
|
$ |
223,648 |
|
|
$ |
37,207 |
|
|
|
16.6 |
% |
61
The following table presents the reconciliation of Adjusted EBITDA expenses to operating expenses for the years indicated:
|
|
|
Years Ended |
|
|
|
|
|
|
|
|
|
|||||
|
|
|
December 31, |
|
|
December 31, |
|
|
|
|
|
|
|
|
|
||
|
|
|
2016 |
|
|
2015 |
|
|
Increase/(Decrease) |
|
|||||||
|
|
|
(in thousands) |
|
|
|
|
|
|||||||||
|
Index Adjusted EBITDA expenses |
|
$ |
182,073 |
|
|
$ |
165,977 |
|
|
$ |
16,096 |
|
|
|
9.7 |
% |
|
Analytics Adjusted EBITDA expenses |
|
|
319,846 |
|
|
|
337,956 |
|
|
|
(18,110 |
) |
|
|
(5.4 |
%) |
|
All Other Adjusted EBITDA expenses |
|
|
79,293 |
|
|
|
89,383 |
|
|
|
(10,090 |
) |
|
|
(11.3 |
%) |
|
|
|
|
|
|
|
|
|
|
|
|
|
|
|
|
|
|
|
Consolidated Adjusted EBITDA expenses |
|
|
581,212 |
|
|
|
593,316 |
|
|
|
(12,104 |
) |
|
|
(2.0 |
%) |
|
Amortization of intangible assets |
|
|
47,033 |
|
|
|
46,910 |
|
|
|
123 |
|
|
|
0.3 |
% |
|
Depreciation and amortization of property, equipment and leasehold improvements |
|
|
34,320 |
|
|
|
30,889 |
|
|
|
3,431 |
|
|
|
11.1 |
% |
|
Total operating expenses |
|
$ |
662,565 |
|
|
$ |
671,115 |
|
|
$ |
(8,550 |
) |
|
|
(1.3 |
%) |
Segment Results
The results for each of our three reportable segments for the years ended December 31, 2016 and 2015 are presented below:
Index Segment
The following table presents the results for the Index segment for the years indicated:
|
|
|
Years Ended |
|
|
|
|
|
|
|
|
|
|||||
|
|
|
December 31, |
|
|
December 31, |
|
|
|
|
|
|
|
|
|
||
|
|
|
2016 |
|
|
2015 |
|
|
Increase/(Decrease) |
|
|||||||
|
|
|
(in thousands) |
|
|
|
|
|
|||||||||
|
Operating revenues: |
|
|
|
|
|
|
|
|
|
|
|
|
|
|
|
|
|
Recurring subscriptions |
|
$ |
389,348 |
|
|
$ |
353,136 |
|
|
$ |
36,212 |
|
|
|
10.3 |
% |
|
Asset-based fees |
|
|
210,229 |
|
|
|
197,974 |
|
|
|
12,255 |
|
|
|
6.2 |
% |
|
Non-recurring |
|
|
13,974 |
|
|
|
7,854 |
|
|
|
6,120 |
|
|
|
77.9 |
% |
|
Operating revenues total |
|
|
613,551 |
|
|
|
558,964 |
|
|
|
54,587 |
|
|
|
9.8 |
% |
|
Adjusted EBITDA expenses |
|
|
182,073 |
|
|
|
165,977 |
|
|
|
16,096 |
|
|
|
9.7 |
% |
|
Adjusted EBITDA |
|
$ |
431,478 |
|
|
$ |
392,987 |
|
|
$ |
38,491 |
|
|
|
9.8 |
% |
|
Adjusted EBITDA margin % |
|
|
70.3 |
% |
|
|
70.3 |
% |
|
|
|
|
|
|
|
|
Revenues related to Index products increased 9.8% to $613.6 million for the year ended December 31, 2016 compared to $559.0 million for the year ended December 31, 2015.
Revenues from recurring subscriptions were up 10.3% to $389.3 million for the year ended December 31, 2016 compared to $353.1 million for the year ended December 31, 2015. The increase was primarily driven by growth in benchmark and data products. The impact on total recurring subscriptions from foreign currency exchange rate fluctuations was not significant.
Revenues from asset-based fees increased 6.2% to $210.2 million for the year ended December 31, 2016 compared to $198.0 million for the year ended December 31, 2015. The increase was driven by a 19.2% increase in non-ETF passive funds, as well as a 34.8% increase in revenue from futures and options contracts based on MSCI indexes. Revenue from ETFs linked to MSCI indexes was essentially flat for full-year 2016, driven by the impact of a change in the product mix that offset a 6.6% increase in average AUM. Average AUM in ETFs linked to MSCI indexes increased 6.6% to $446.4 billion for the year ended December 31, 2016 compared to $418.8 billion for the year ended December 31, 2015, driven by cash inflows and market appreciation.
62
Index segment Adjusted EBITDA expenses increased 9.7% to $182.1 million for the year ended December 31, 2016 compared to $166.0 million for the year ended December 31, 2015, primarily reflecting higher selling and marketing and R&D activities. Adjusting for the impact of foreign currency exchange rate fluctuations, Adjusted EBITDA expenses would have increased 12.2% for the year ended December 31, 2016 compared to the year ended December 31, 2015.
Analytics Segment
The following table presents the results for the Analytics segment for the years indicated:
|
|
|
Years Ended |
|
|
|
|
|
|
|
|
|
|||||
|
|
|
December 31, |
|
|
December 31, |
|
|
|
|
|
|
|
|
|
||
|
|
|
2016 |
|
|
2015 |
|
|
Increase/(Decrease) |
|
|||||||
|
|
|
(in thousands) |
|
|
|
|
|
|||||||||
|
Operating revenues: |
|
|
|
|
|
|
|
|
|
|
|
|
|
|
|
|
|
Recurring subscriptions |
|
$ |
439,864 |
|
|
$ |
426,725 |
|
|
$ |
13,139 |
|
|
|
3.1 |
% |
|
Non-recurring |
|
|
8,489 |
|
|
|
6,699 |
|
|
|
1,790 |
|
|
|
26.7 |
% |
|
Operating revenues total |
|
|
448,353 |
|
|
|
433,424 |
|
|
|
14,929 |
|
|
|
3.4 |
% |
|
Adjusted EBITDA expenses |
|
|
319,846 |
|
|
|
337,956 |
|
|
|
(18,110 |
) |
|
|
(5.4 |
%) |
|
Adjusted EBITDA |
|
$ |
128,507 |
|
|
$ |
95,468 |
|
|
$ |
33,039 |
|
|
|
34.6 |
% |
|
Adjusted EBITDA margin % |
|
|
28.7 |
% |
|
|
22.0 |
% |
|
|
|
|
|
|
|
|
Our Analytics segment revenues increased 3.4% to $448.4 million for the year ended December 31, 2016 compared to $433.4 million for the year ended December 31, 2015, primarily driven by higher revenues from RiskManager, equity models and InvestorForce products. Adjusting for the impact of foreign currency exchange rate fluctuations, Analytics segment revenues would have increased 4.6% for the year ended December 31, 2016 compared to the year ended December 31, 2015.
Analytics segment Adjusted EBITDA expenses decreased 5.4% to $319.8 million for the year ended December 31, 2016 compared to $338.0 million for the year ended December 31, 2015, primarily due to a decline in cost of revenues and R&D. The decrease in R&D reflects the impact of a non-cash charge of $3.4 million related to the termination of a technology project recognized during the year ended December 31, 2015. Adjusting for the impact of foreign currency exchange rate fluctuations, Adjusted EBITDA expenses would have decreased 3.6% for the year ended December 31, 2016 compared to the year ended December 31, 2015.
All Other Segment
The following table presents the results for the All Other segment, which consists of the ESG and Real Estate product lines, for the years indicated:
|
|
|
Years Ended |
|
|
|
|
|
|
|
|
|
|||||
|
|
|
December 31, |
|
|
December 31, |
|
|
|
|
|
|
|
|
|
||
|
|
|
2016 |
|
|
2015 |
|
|
Increase/(Decrease) |
|
|||||||
|
|
|
(in thousands) |
|
|
|
|
|
|||||||||
|
Operating revenues: |
|
|
|
|
|
|
|
|
|
|
|
|
|
|
|
|
|
Recurring subscriptions |
|
$ |
84,457 |
|
|
$ |
77,666 |
|
|
$ |
6,791 |
|
|
|
8.7 |
% |
|
Non-recurring |
|
|
4,308 |
|
|
|
4,959 |
|
|
|
(651 |
) |
|
|
(13.1 |
%) |
|
Operating revenues total |
|
|
88,765 |
|
|
|
82,625 |
|
|
|
6,140 |
|
|
|
7.4 |
% |
|
Adjusted EBITDA expenses |
|
|
79,293 |
|
|
|
89,383 |
|
|
|
(10,090 |
) |
|
|
(11.3 |
%) |
|
Adjusted EBITDA |
|
$ |
9,472 |
|
|
$ |
(6,758 |
) |
|
$ |
16,230 |
|
|
|
240.2 |
% |
|
Adjusted EBITDA margin % |
|
|
10.7 |
% |
|
|
(8.2 |
%) |
|
|
|
|
|
|
|
|
All Other segment revenues increased 7.4% to $88.8 million for the year ended December 31, 2016 compared to $82.6 million for the year ended December 31, 2015, driven by a $7.4 million, or 19.6%, increase in ESG revenues to $45.0 million, partially offset by a $1.2 million, or 2.7%, decrease in revenues from Real Estate products
63
to $43.8 million. Adjusting for the impact of foreign currency exchange rate fluctuations and the divestiture of the Real Estate occupiers business, Real Estate revenues would have increased 7.9% and All Other segment revenues would have increased 13.4% for the year ended December 31, 2016 compared to the year ended December 31, 2015.
All Other segment Adjusted EBITDA expenses decreased 11.3% to $79.3 million for the year ended December 31, 2016 compared to $89.4 million for the year ended December 31, 2015, primarily driven by lower costs attributable to Real Estate, partially offset by ESG costs, mainly related to higher R&D and selling and marketing. Adjusting for the impact of foreign currency exchange rate fluctuations, Adjusted EBITDA expenses would have decreased 8.0% for the year ended December 31, 2016 compared to the year ended December 31, 2015.
Results of Operations
Year Ended December 31, 2015 Compared to Year Ended December 31, 2014
The following table presents the results of operations for the years indicated:
|
|
|
Years Ended |
|
|
|
|
|
|
|
|
|
|||||
|
|
|
December 31, |
|
|
December 31, |
|
|
|
|
|
|
|
|
|
||
|
|
|
2015 |
|
|
2014 |
|
|
Increase/(Decrease) |
|
|||||||
|
|
|
(in thousands, except per share data) |
|
|
|
|
|
|||||||||
|
Operating revenues |
|
$ |
1,075,013 |
|
|
$ |
996,680 |
|
|
$ |
78,333 |
|
|
|
7.9 |
% |
|
Operating expenses: |
|
|
|
|
|
|
|
|
|
|
|
|
|
|
|
|
|
Cost of revenues |
|
|
267,695 |
|
|
|
276,623 |
|
|
|
(8,928 |
) |
|
|
(3.2 |
%) |
|
Selling and marketing |
|
|
162,294 |
|
|
|
163,839 |
|
|
|
(1,545 |
) |
|
|
(0.9 |
%) |
|
Research and development |
|
|
77,320 |
|
|
|
71,095 |
|
|
|
6,225 |
|
|
|
8.8 |
% |
|
General and administrative |
|
|
86,007 |
|
|
|
76,369 |
|
|
|
9,638 |
|
|
|
12.6 |
% |
|
Amortization of intangible assets |
|
|
46,910 |
|
|
|
45,877 |
|
|
|
1,033 |
|
|
|
2.3 |
% |
|
Depreciation and amortization of property, equipment and leasehold improvements |
|
|
30,889 |
|
|
|
25,711 |
|
|
|
5,178 |
|
|
|
20.1 |
% |
|
Total operating expenses |
|
|
671,115 |
|
|
|
659,514 |
|
|
|
11,601 |
|
|
|
1.8 |
% |
|
Operating income |
|
|
403,898 |
|
|
|
337,166 |
|
|
|
66,732 |
|
|
|
19.8 |
% |
|
Other expense (income), net |
|
|
54,344 |
|
|
|
28,828 |
|
|
|
25,516 |
|
|
|
88.5 |
% |
|
Income from continuing operations before provision for income taxes |
|
|
349,554 |
|
|
|
308,338 |
|
|
|
41,216 |
|
|
|
13.4 |
% |
|
Provision for income taxes |
|
|
119,516 |
|
|
|
109,396 |
|
|
|
10,120 |
|
|
|
9.3 |
% |
|
Income from continuing operations |
|
|
230,038 |
|
|
|
198,942 |
|
|
|
31,096 |
|
|
|
15.6 |
% |
|
Income (loss) from discontinued operations, net of income taxes |
|
|
(6,390 |
) |
|
|
85,171 |
|
|
|
(91,561 |
) |
|
|
(107.5 |
%) |
|
Net income |
|
$ |
223,648 |
|
|
$ |
284,113 |
|
|
$ |
(60,465 |
) |
|
|
(21.3 |
%) |
|
Earnings per basic common share: |
|
|
|
|
|
|
|
|
|
|
|
|
|
|
|
|
|
From continuing operations |
|
$ |
2.11 |
|
|
$ |
1.72 |
|
|
$ |
0.39 |
|
|
|
22.7 |
% |
|
From discontinued operations |
|
|
(0.06 |
) |
|
|
0.73 |
|
|
|
(0.79 |
) |
|
|
(108.2 |
%) |
|
Earnings per basic common share |
|
$ |
2.05 |
|
|
$ |
2.45 |
|
|
$ |
(0.40 |
) |
|
|
(16.3 |
%) |
|
Earnings per diluted common share: |
|
|
|
|
|
|
|
|
|
|
|
|
|
|
|
|
|
From continuing operations |
|
$ |
2.09 |
|
|
$ |
1.70 |
|
|
$ |
0.39 |
|
|
|
22.9 |
% |
|
From discontinued operations |
|
|
(0.06 |
) |
|
|
0.73 |
|
|
|
(0.79 |
) |
|
|
(108.2 |
%) |
|
Earnings per diluted common share |
|
$ |
2.03 |
|
|
$ |
2.43 |
|
|
$ |
(0.40 |
) |
|
|
(16.5 |
%) |
|
Operating margin |
|
|
37.6 |
% |
|
|
33.8 |
% |
|
|
|
|
|
|
|
|
64
The following table presents operating revenues by recurring subscriptions, asset-based fees and non-recurring revenues for the years indicated:
|
|
|
Years Ended |
|
|
|
|
|
|
|
|
|
|||||
|
|
|
December 31, |
|
|
December 31, |
|
|
|
|
|
|
|
|
|
||
|
|
|
2015 |
|
|
|
2014 |
|
|
Increase/(Decrease) |
|
||||||
|
|
|
(in thousands) |
|
|
|
|
|
|||||||||
|
Recurring subscriptions |
|
$ |
857,527 |
|
|
$ |
801,183 |
|
|
$ |
56,344 |
|
|
|
7.0 |
% |
|
Asset-based fees |
|
|
197,974 |
|
|
|
177,105 |
|
|
|
20,869 |
|
|
|
11.8 |
% |
|
Non-recurring |
|
|
19,512 |
|
|
|
18,392 |
|
|
|
1,120 |
|
|
|
6.1 |
% |
|
Total operating revenues |
|
$ |
1,075,013 |
|
|
$ |
996,680 |
|
|
$ |
78,333 |
|
|
|
7.9 |
% |
Total operating revenues grew 7.9% to $1,075.0 million for the year ended December 31, 2015 compared to $996.7 million for the year ended December 31, 2014.
Revenue from recurring subscriptions increased 7.0% to $857.5 million for the year ended December 31, 2015 compared to $801.2 million for the year ended December 31, 2014. The increase in subscription revenues was primarily driven by growth from Index products as well as higher Analytics products’ revenues, partially offset by lower Real Estate products’ revenues within our All Other segment. Adjusting for the impact of foreign currency exchange rate fluctuations, recurring subscriptions revenues would have increased 8.8% for the year ended December 31, 2015 compared to the year ended December 31, 2014.
Revenues from asset-based fees increased 11.8% to $198.0 million for the year ended December 31, 2015 compared to $177.1 million for the year ended December 31, 2014. The increase was driven by higher average AUM in both ETFs and non-ETF passive funds as well as higher trading volumes in futures and options contracts, all linked to MSCI indexes. The average value of AUM in ETFs linked to MSCI indexes increased $56.3 billion, or 15.5%, compared to the year ended December 31, 2014. Approximately two-thirds of the underlying securities included in the AUM of our index-linked investment products are denominated in currencies other than the U.S. dollar.
The following table presents the value of AUM in ETFs linked to MSCI indexes and the sequential change of such assets as of the end of each of the periods indicated:
|
|
|
Period Ended |
|
|||||||||||||||||||||||||||||
|
|
|
2014 |
|
|
2015 |
|
||||||||||||||||||||||||||
|
(in billions) |
|
March 31, |
|
|
June 30, |
|
|
September 30, |
|
|
December 31, |
|
|
March 31, |
|
|
June 30, |
|
|
September 30, |
|
|
December 31, |
|
||||||||
|
AUM in ETFs linked to MSCI indexes (1) |
|
$ |
340.8 |
|
|
$ |
378.7 |
|
|
$ |
377.9 |
|
|
$ |
373.3 |
|
|
$ |
418.0 |
|
|
$ |
435.4 |
|
|
$ |
390.2 |
|
|
$ |
433.4 |
|
|
Sequential Change in Value |
|
|
|
|
|
|
|
|
|
|
|
|
|
|
|
|
|
|
|
|
|
|
|
|
|
|
|
|
|
|
|
|
|
Market Appreciation/ (Depreciation) |
|
$ |
1.3 |
|
|
$ |
15.2 |
|
|
$ |
(17.2 |
) |
|
$ |
(8.3 |
) |
|
$ |
13.0 |
|
|
$ |
(6.9 |
) |
|
$ |
(48.2 |
) |
|
$ |
14.5 |
|
|
Cash Inflows |
|
|
6.6 |
|
|
|
22.7 |
|
|
|
16.4 |
|
|
|
3.7 |
|
|
|
31.7 |
|
|
|
24.3 |
|
|
|
3.0 |
|
|
|
28.7 |
|
|
Total Change |
|
$ |
7.9 |
|
|
$ |
37.9 |
|
|
$ |
(0.8 |
) |
|
$ |
(4.6 |
) |
|
$ |
44.7 |
|
|
$ |
17.4 |
|
|
$ |
(45.2 |
) |
|
$ |
43.2 |
|
Source: Bloomberg and MSCI
|
(1) |
The value of AUM in ETFs linked to MSCI indexes is calculated by multiplying the ETF net asset value by the number of shares outstanding. |
As of December 31, 2015, the value of AUM in ETFs linked to MSCI equity indexes was $433.4 billion, up
65
$60.1 billion, or 16.1%, from $373.3 billion as of December 31, 2014.
Non-recurring revenues increased 6.1% to $19.5 million for the year ended December 31, 2015, compared to $18.4 million for the year ended December 31, 2014, primarily resulting from higher one-time sales of Index and Analytics products, partially offset by lower one-time sales of Real Estate products within our All Other segment.
The following table presents operating revenues by reportable segment and revenue type for the years indicated:
|
|
|
Years Ended |
|
|
|
|
|
|
|
|
|
|||||
|
|
|
December 31, |
|
|
December 31, |
|
|
|
|
|
|
|
|
|
||
|
|
|
2015 |
|
|
2014 |
|
|
Increase/(Decrease) |
|
|||||||
|
|
|
(in thousands) |
|
|
|
|
|
|||||||||
|
Operating revenues: |
|
|
|
|
|
|
|
|
|
|
|
|
|
|
|
|
|
Index |
|
|
|
|
|
|
|
|
|
|
|
|
|
|
|
|
|
Recurring subscriptions |
|
$ |
353,136 |
|
|
$ |
320,113 |
|
|
$ |
33,023 |
|
|
|
10.3 |
% |
|
Asset-based fees |
|
|
197,974 |
|
|
|
177,105 |
|
|
|
20,869 |
|
|
|
11.8 |
% |
|
Non-recurring |
|
|
7,854 |
|
|
|
6,674 |
|
|
|
1,180 |
|
|
|
17.7 |
% |
|
Index total |
|
|
558,964 |
|
|
|
503,892 |
|
|
|
55,072 |
|
|
|
10.9 |
% |
|
Analytics |
|
|
|
|
|
|
|
|
|
|
|
|
|
|
|
|
|
Recurring subscriptions |
|
|
426,725 |
|
|
|
409,766 |
|
|
|
16,959 |
|
|
|
4.1 |
% |
|
Non-recurring |
|
|
6,699 |
|
|
|
4,319 |
|
|
|
2,380 |
|
|
|
55.1 |
% |
|
Analytics total |
|
|
433,424 |
|
|
|
414,085 |
|
|
|
19,339 |
|
|
|
4.7 |
% |
|
All Other |
|
|
|
|
|
|
|
|
|
|
|
|
|
|
|
|
|
Recurring subscriptions |
|
|
77,666 |
|
|
|
71,304 |
|
|
|
6,362 |
|
|
|
8.9 |
% |
|
Non-recurring |
|
|
4,959 |
|
|
|
7,399 |
|
|
|
(2,440 |
) |
|
|
(33.0 |
%) |
|
All Other total |
|
|
82,625 |
|
|
|
78,703 |
|
|
|
3,922 |
|
|
|
5.0 |
% |
|
Total operating revenues |
|
$ |
1,075,013 |
|
|
$ |
996,680 |
|
|
$ |
78,333 |
|
|
|
7.9 |
% |
Refer to the section titled, “Segment Results of Operations” for an explanation of the results.
Operating Expenses
Operating expenses increased 1.8% to $671.1 million for the year ended December 31, 2015 compared to $659.5 million for the year ended December 31, 2014. Adjusting for the impact of foreign currency exchange rate fluctuations, operating expenses would have increased 5.8% for the year ended December 31, 2015 compared to the year ended December 31, 2014.
We had 2,754 employees as of December 31, 2015 compared to 2,926 employees as of December 31, 2014. As of December 31, 2015, 52.8% of our employees were located in emerging market centers compared to 50.5% of our employees as of December 31, 2014.
66
The following table presents operating expenses by activity for the years indicated:
|
|
|
Years Ended |
|
|
|
|
|
|
|
|
|
|||||
|
|
|
December 31, |
|
|
December 31, |
|
|
|
|
|
|
|
|
|
||
|
|
|
2015 |
|
|
2014 |
|
|
Increase/(Decrease) |
|
|||||||
|
|
|
(in thousands) |
|
|
|
|
|
|||||||||
|
Operating expenses: |
|
|
|
|
|
|
|
|
|
|
|
|
|
|
|
|
|
Cost of revenues |
|
$ |
267,695 |
|
|
$ |
276,623 |
|
|
$ |
(8,928 |
) |
|
|
(3.2 |
%) |
|
Selling and marketing |
|
|
162,294 |
|
|
|
163,839 |
|
|
|
(1,545 |
) |
|
|
(0.9 |
%) |
|
Research and development |
|
|
77,320 |
|
|
|
71,095 |
|
|
|
6,225 |
|
|
|
8.8 |
% |
|
General and administrative |
|
|
86,007 |
|
|
|
76,369 |
|
|
|
9,638 |
|
|
|
12.6 |
% |
|
Amortization of intangible assets |
|
|
46,910 |
|
|
|
45,877 |
|
|
|
1,033 |
|
|
|
2.3 |
% |
|
Depreciation and amortization of property, equipment and leasehold improvements |
|
|
30,889 |
|
|
|
25,711 |
|
|
|
5,178 |
|
|
|
20.1 |
% |
|
Total operating expenses |
|
$ |
671,115 |
|
|
$ |
659,514 |
|
|
$ |
11,601 |
|
|
|
1.8 |
% |
Cost of Revenues
Cost of revenues for the year ended December 31, 2015 decreased 3.2% to $267.7 million compared to $276.6 million for the year ended December 31, 2014, primarily driven by lower non-compensation costs reflecting strong cost discipline as well as the impact of compensation primarily driven by lower staffing levels, partially offset by higher severance costs.
Selling and Marketing
Selling and marketing expenses for the year ended December 31, 2015 decreased 0.9% to $162.3 million compared to $163.9 million for the year ended December 31, 2014, primarily driven by lower costs related to marketing and travel & entertainment, partially offset by higher compensation and benefits primarily related to higher severance costs.
Research and Development
R&D expenses for the year ended December 31, 2015 increased 8.8% to $77.3 million compared to $71.1 million for the year ended December 31, 2014, primarily driven by higher compensation and benefits costs as a result of more R&D projects, higher severance and lower net capitalized costs related to internally developed software. The reduction in net capitalized costs is the result of the reversal of a technology project in the Analytics segment of $3.4 million for the year ended December 31, 2015 compared to a $1.0 million reversal for the year ended December 31, 2014.
General and Administrative
G&A expenses for the year ended December 31, 2015 increased 12.6% to $86.0 million compared to $76.4 million for the year ended December 31, 2014, primarily driven by higher compensation and benefits costs as well as higher professional fees.
67
The following table presents operating expenses using compensation and non-compensation categories, rather than using activity categories, for the years indicated:
|
|
|
Years Ended |
|
|
|
|
|
|
|
|
|
|||||
|
|
|
December 31, |
|
|
December 31, |
|
|
|
|
|
|
|
|
|
||
|
|
|
2015 |
|
|
2014 |
|
|
Increase/(Decrease) |
|
|||||||
|
|
|
(in thousands) |
|
|
|
|
|
|||||||||
|
Compensation and benefits |
|
$ |
426,238 |
|
|
$ |
412,550 |
|
|
$ |
13,688 |
|
|
|
3.3 |
% |
|
Non-compensation expenses |
|
|
167,078 |
|
|
|
175,376 |
|
|
|
(8,298 |
) |
|
|
(4.7 |
%) |
|
Amortization of intangible assets |
|
|
46,910 |
|
|
|
45,877 |
|
|
|
1,033 |
|
|
|
2.3 |
% |
|
Depreciation and amortization of property, equipment and leasehold improvements |
|
|
30,889 |
|
|
|
25,711 |
|
|
|
5,178 |
|
|
|
20.1 |
% |
|
Total operating expenses |
|
$ |
671,115 |
|
|
$ |
659,514 |
|
|
$ |
11,601 |
|
|
|
1.8 |
% |
Compensation and benefits costs for the year ended December 31, 2015 increased 3.3% to $426.2 million compared to $412.6 million for year ended December 31, 2014. The increase was primarily impacted by higher costs related to severance and benefits, as well as lower capitalized labor costs related to internally developed software.
Non-compensation expenses for the year ended December 31, 2015 decreased 4.7% to $167.1 million compared to $175.4 million for the year ended December 31, 2014, primarily reflecting decreases in travel & entertainment, recruiting and marketing, partially offset by increases in information technology.
Amortization of Intangibles
Amortization of intangibles expense for the year ended December 31, 2015 increased 2.3% to $46.9 million compared to $45.9 million for the year ended December 31, 2014, primarily resulting from the amortization of our capitalized software.
Depreciation and amortization of property, equipment and leasehold improvements
For the years ended December 31, 2015 and 2014, depreciation and amortization of property, equipment and leasehold improvements totaled $30.9 million and $25.7 million, respectively. The 20.1% increase primarily reflected higher depreciation of investments made in our information technology infrastructure.
Other Expense (Income), Net
Other expense (income), net for the year ended December 31, 2015 increased to $54.3 million compared to $28.8 million for the year ended December 31, 2014, with the increase primarily driven by $30.6 million of higher interest expense resulting from the higher interest rates associated with our Senior Notes and the increased level of indebtedness, partially offset by $6.4 million from gains on the sale of investments realized in the year ended December 31, 2015.
Income Taxes
The provision for income tax expense was $119.5 million and $109.4 million for the years ended December 31, 2015 and 2014, respectively. These amounts reflect effective tax rates of 34.2% and 35.5% for the years ended December 31, 2015 and 2014, respectively.
The effective tax rate of 34.2% for the year ended December 31, 2015 reflects our operating tax rate adjusted for the impact of certain discrete items. Included in the discrete items was a claim for an additional deduction related to U.S. production activities for prior years, which was partially offset by a provision for state tax liabilities related to prior years. Overall, the discrete items decreased our effective tax rate by 0.6% in the year ended December 31, 2015.
68
The effective tax rate of 35.5% for the year ended December 31, 2014 reflects our operating rate adjusted for the impact of certain discrete items that increased our effective tax rate by 0.3 percentage points. Included in our effective tax rate was the benefit of the 2014 federal research and development credit, the effect of which reduced our full year effective tax rate by 0.9 percentage points.
Income (loss) from Discontinued Operations, Net of Income Taxes
On April 30, 2014, MSCI completed the sale of ISS for cash consideration of $367.4 million which is reflected as discontinued operations in our consolidated financial statements. Loss from discontinued operations, net of income taxes, for the year ended December 31, 2015 reflects the impact of a $6.4 million out-of-period income tax charge associated with tax obligations triggered upon the sale of ISS. Income from discontinued operations, net of income taxes was $85.2 million for the year ended December 31, 2014 and the results included a net gain of $78.7 million resulting from the disposition of ISS.
Net Income
As a result of the factors described above, net income for the year ended December 31, 2015 decreased 21.3% to $223.6 million compared to $284.1 million for the year ended December 31, 2014.
Adjusted EBITDA
The following table presents the calculation of the non-GAAP Adjusted EBITDA measure for the years indicated:
|
|
|
Years Ended |
|
|
|
|
|
|
|
|
|
|||||
|
|
|
December 31, |
|
|
December 31, |
|
|
|
|
|
|
|
|
|
||
|
|
|
2015 |
|
|
2014 |
|
|
Increase/(Decrease) |
|
|||||||
|
|
|
(in thousands) |
|
|
|
|
|
|||||||||
|
Operating revenues: |
|
$ |
1,075,013 |
|
|
$ |
996,680 |
|
|
$ |
78,333 |
|
|
|
7.9 |
% |
|
Adjusted EBITDA expenses |
|
|
593,316 |
|
|
|
587,926 |
|
|
|
5,390 |
|
|
|
0.9 |
% |
|
Adjusted EBITDA |
|
$ |
481,697 |
|
|
$ |
408,754 |
|
|
$ |
72,943 |
|
|
|
17.8 |
% |
|
Adjusted EBITDA margin % |
|
|
44.8 |
% |
|
|
41.0 |
% |
|
|
|
|
|
|
|
|
|
Operating margin % |
|
|
37.6 |
% |
|
|
33.8 |
% |
|
|
|
|
|
|
|
|
Adjusted EBITDA increased 17.8% to $481.7 million for the year ended December 31, 2015 compared to $408.8 million for the year ended December 31, 2014. Adjusted EBITDA margin increased to 44.8% for the year ended December 31, 2015 compared to 41.0% for the year ended December 31, 2014. The improvement in margin reflects higher growth in revenues, outpacing the growth in expenses, attributable, in part, to the benefits of the incremental investments we made in 2014 and prior.
69
Reconciliation of Adjusted EBITDA to Net Income and Adjusted EBITDA Expenses to Operating Expenses
The following table presents the reconciliation of Adjusted EBITDA to net income for the years indicated:
|
|
|
Years Ended |
|
|
|
|
|
|
|
|
|
|||||
|
|
|
December 31, |
|
|
December 31, |
|
|
|
|
|
|
|
|
|
||
|
|
|
2015 |
|
|
2014 |
|
|
Increase/(Decrease) |
|
|||||||
|
|
|
(in thousands) |
|
|
|
|
|
|||||||||
|
Index Adjusted EBITDA |
|
$ |
392,987 |
|
|
$ |
349,685 |
|
|
$ |
43,302 |
|
|
|
12.4 |
% |
|
Analytics Adjusted EBITDA |
|
|
95,468 |
|
|
|
72,173 |
|
|
|
23,295 |
|
|
|
32.3 |
% |
|
All Other Adjusted EBITDA |
|
|
(6,758 |
) |
|
|
(13,104 |
) |
|
|
6,346 |
|
|
|
48.4 |
% |
|
|
|
|
|
|
|
|
|
|
|
|
|
|
|
|
|
|
|
Consolidated Adjusted EBITDA |
|
|
481,697 |
|
|
|
408,754 |
|
|
|
72,943 |
|
|
|
17.8 |
% |
|
Amortization of intangible assets |
|
|
46,910 |
|
|
|
45,877 |
|
|
|
1,033 |
|
|
|
2.3 |
% |
|
Depreciation and amortization of property, equipment and leasehold improvements |
|
|
30,889 |
|
|
|
25,711 |
|
|
|
5,178 |
|
|
|
20.1 |
% |
|
|
|
|
|
|
|
|
|
|
|
|
|
|
|
|
|
|
|
Operating income |
|
|
403,898 |
|
|
|
337,166 |
|
|
|
66,732 |
|
|
|
19.8 |
% |
|
Other expense (income), net |
|
|
54,344 |
|
|
|
28,828 |
|
|
|
25,516 |
|
|
|
88.5 |
% |
|
Provision for income taxes |
|
|
119,516 |
|
|
|
109,396 |
|
|
|
10,120 |
|
|
|
9.3 |
% |
|
|
|
|
|
|
|
|
|
|
|
|
|
|
|
|
|
|
|
Income from continuing operations |
|
|
230,038 |
|
|
|
198,942 |
|
|
|
31,096 |
|
|
|
15.6 |
% |
|
Income (loss) from discontinued operations, net of income taxes |
|
|
(6,390 |
) |
|
|
85,171 |
|
|
|
(91,561 |
) |
|
|
(107.5 |
%) |
|
Net income |
|
$ |
223,648 |
|
|
$ |
284,113 |
|
|
$ |
(60,465 |
) |
|
|
(21.3 |
%) |
The following table presents the reconciliation of Adjusted EBITDA expenses to operating expenses for the years indicated:
|
|
|
Years Ended |
|
|
|
|
|
|
|
|
|
|||||
|
|
|
December 31, |
|
|
December 31, |
|
|
|
|
|
|
|
|
|
||
|
|
|
2015 |
|
|
2014 |
|
|
Increase/(Decrease) |
|
|||||||
|
|
|
(in thousands) |
|
|
|
|
|
|||||||||
|
Index Adjusted EBITDA expenses |
|
$ |
165,977 |
|
|
$ |
154,207 |
|
|
$ |
11,770 |
|
|
|
7.6 |
% |
|
Analytics Adjusted EBITDA expenses |
|
|
337,956 |
|
|
|
341,912 |
|
|
|
(3,956 |
) |
|
|
(1.2 |
%) |
|
All Other Adjusted EBITDA expenses |
|
|
89,383 |
|
|
|
91,807 |
|
|
|
(2,424 |
) |
|
|
(2.6 |
%) |
|
|
|
|
|
|
|
|
|
|
|
|
|
|
|
|
|
|
|
Consolidated Adjusted EBITDA expenses |
|
|
593,316 |
|
|
|
587,926 |
|
|
|
5,390 |
|
|
|
0.9 |
% |
|
Amortization of intangible assets |
|
|
46,910 |
|
|
|
45,877 |
|
|
|
1,033 |
|
|
|
2.3 |
% |
|
Depreciation and amortization of property, equipment and leasehold improvements |
|
|
30,889 |
|
|
|
25,711 |
|
|
|
5,178 |
|
|
|
20.1 |
% |
|
Total operating expenses |
|
$ |
671,115 |
|
|
$ |
659,514 |
|
|
$ |
11,601 |
|
|
|
1.8 |
% |
Segment Results
The results for each of our three reportable segments for the years ended December 31, 2015 and 2014 are presented below:
70
The following table presents the results for the Index segment for the years indicated:
|
|
|
Years Ended |
|
|
|
|
|
|
|
|
|
|||||
|
|
|
December 31, |
|
|
December 31, |
|
|
|
|
|
|
|
|
|
||
|
|
|
2015 |
|
|
2014 |
|
|
Increase/(Decrease) |
|
|||||||
|
|
|
(in thousands) |
|
|
|
|
|
|||||||||
|
Operating revenues: |
|
|
|
|
|
|
|
|
|
|
|
|
|
|
|
|
|
Recurring subscriptions |
|
$ |
353,136 |
|
|
$ |
320,113 |
|
|
$ |
33,023 |
|
|
|
10.3 |
% |
|
Asset-based fees |
|
|
197,974 |
|
|
|
177,105 |
|
|
|
20,869 |
|
|
|
11.8 |
% |
|
Non-recurring |
|
|
7,854 |
|
|
|
6,674 |
|
|
|
1,180 |
|
|
|
17.7 |
% |
|
Operating revenues total |
|
|
558,964 |
|
|
|
503,892 |
|
|
|
55,072 |
|
|
|
10.9 |
% |
|
Adjusted EBITDA expenses |
|
|
165,977 |
|
|
|
154,207 |
|
|
|
11,770 |
|
|
|
7.6 |
% |
|
Adjusted EBITDA |
|
$ |
392,987 |
|
|
$ |
349,685 |
|
|
$ |
43,302 |
|
|
|
12.4 |
% |
|
Adjusted EBITDA margin % |
|
|
70.3 |
% |
|
|
69.4 |
% |
|
|
|
|
|
|
|
|
Revenues related to Index products increased 10.9% to $559.0 million for the year ended December 31, 2015 compared to $503.9 million for the year ended December 31, 2014.
Recurring subscription revenues were up 10.3% to $353.1 million for the year ended December 31, 2015 compared to $320.1 million for the year ended December 31, 2014. The increase was primarily driven by solid growth in benchmark and data products broadly, including strong growth in market cap products, combined with higher growth in factor, ESG and thematic products. Adjusting for the impact of foreign currency exchange rate fluctuations, recurring subscription revenues would have increased 11.1% for the year ended December 31, 2015 compared to the year ended December 31, 2014.
Revenues from asset-based fees increased 11.8% to $198.0 million for the year ended December 31, 2015 compared to $177.1 million for the year ended December 31, 2015. The increase was primarily driven by an increase in revenue from ETFs, as well as strong growth in revenues from non-ETF institutional passive funds and exchange-traded futures and options linked to MSCI indexes. Average AUM in ETFs linked to MSCI indexes increased $56.3 billion, or 15.5%, to $418.8 billion primarily driven by cash inflows, partially offset by market depreciation.
Index segment Adjusted EBITDA expenses increased 7.6% to $166.0 million for the year ended December 31, 2015 compared to $154.2 million for the year ended December 31, 2014. The increase primarily reflects higher compensation and benefits costs associated with our selling, development and G&A activities. Adjusting for the impact of foreign currency exchange rate fluctuations, Adjusted EBITDA expenses would have increased 12.6% for the year ended December 31, 2015 compared to the year ended December 31, 2014.
Analytics Segment
The following table presents the results for the Analytics segment for the years indicated:
|
|
|
Years Ended |
|
|
|
|
|
|
|
|
|
|||||
|
|
|
December 31, |
|
|
December 31, |
|
|
|
|
|
|
|
|
|
||
|
|
|
2015 |
|
|
2014 |
|
|
Increase/(Decrease) |
|
|||||||
|
|
|
(in thousands) |
|
|
|
|
|
|||||||||
|
Operating revenues: |
|
|
|
|
|
|
|
|
|
|
|
|
|
|
|
|
|
Recurring subscriptions |
|
$ |
426,725 |
|
|
$ |
409,766 |
|
|
$ |
16,959 |
|
|
|
4.1 |
% |
|
Non-recurring |
|
|
6,699 |
|
|
|
4,319 |
|
|
|
2,380 |
|
|
|
55.1 |
% |
|
Operating revenues total |
|
|
433,424 |
|
|
|
414,085 |
|
|
|
19,339 |
|
|
|
4.7 |
% |
|
Adjusted EBITDA expenses |
|
|
337,956 |
|
|
|
341,912 |
|
|
|
(3,956 |
) |
|
|
(1.2 |
%) |
|
Adjusted EBITDA |
|
$ |
95,468 |
|
|
$ |
72,173 |
|
|
$ |
23,295 |
|
|
|
32.3 |
% |
|
Adjusted EBITDA margin % |
|
|
22.0 |
% |
|
|
17.4 |
% |
|
|
|
|
|
|
|
|
71
Our Analytics segment revenues increased 4.7% to $433.4 million for the year ended December 31, 2015 compared to $414.1 million for the year ended December 31, 2014. The increase was primarily driven by higher revenues from RiskManager, BarraOne and InvestorForce products. Adjusting for the impact of foreign currency exchange rate fluctuations, Analytics segment revenues would have increased 6.2% for the year ended December 31, 2015 compared to the year ended December 31, 2014.
Analytics segment Adjusted EBITDA expenses decreased 1.2% to $338.0 million for the year ended December 31, 2015 compared to $341.9 million for the year ended December 31, 2014. The decrease was due to a decline in cost of revenues and selling and marketing costs, partially offset by increases in G&A and R&D. The increase in R&D was primarily the result of the reversal of previously capitalized software costs associated with a technology project. Adjusting for the impact of foreign currency exchange rate fluctuations, Adjusted EBITDA expenses would have increased 2.3% for the year ended December 31, 2015 compared to the year ended December 31, 2014.
All Other Segment
The following table presents the results for the All Other segment for the years indicated:
|
|
|
Years Ended |
|
|
|
|
|
|
|
|
|
|||||
|
|
|
December 31, |
|
|
December 31, |
|
|
|
|
|
|
|
|
|
||
|
|
|
2015 |
|
|
2014 |
|
|
Increase/(Decrease) |
|
|||||||
|
|
|
(in thousands) |
|
|
|
|
|
|||||||||
|
Operating revenues: |
|
|
|
|
|
|
|
|
|
|
|
|
|
|
|
|
|
Recurring subscriptions |
|
$ |
77,666 |
|
|
$ |
71,304 |
|
|
$ |
6,362 |
|
|
|
8.9 |
% |
|
Non-recurring |
|
|
4,959 |
|
|
|
7,399 |
|
|
|
(2,440 |
) |
|
|
(33.0 |
%) |
|
Operating revenues total |
|
|
82,625 |
|
|
|
78,703 |
|
|
|
3,922 |
|
|
|
5.0 |
% |
|
Adjusted EBITDA expenses |
|
|
89,383 |
|
|
|
91,807 |
|
|
|
(2,424 |
) |
|
|
(2.6 |
%) |
|
Adjusted EBITDA |
|
$ |
(6,758 |
) |
|
$ |
(13,104 |
) |
|
$ |
6,346 |
|
|
|
48.4 |
% |
|
Adjusted EBITDA margin % |
|
|
(8.2 |
%) |
|
|
(16.6 |
%) |
|
|
|
|
|
|
|
|
All Other segment revenues increased 5.0% to $82.6 million for the year ended December 31, 2015 compared to $78.7 million for the year ended December 31, 2014. The increase was driven by $9.3 million, or 32.9%, rise in revenues from our ESG products, partially offset by $5.4 million, or 10.7%, decline in revenues from Real Estate products. Adjusting for the impact of foreign currency exchange rate fluctuations, All Other segment revenues would have increased 12.2% for the year ended December 31, 2015 compared to the year ended December 31, 2014, of which Real Estate revenues would have increased 0.4%.
All Other segment Adjusted EBITDA expenses decreased 2.6% to $89.4 million for the year ended December 31, 2015 compared to $91.8 million for the year ended December 31, 2014. The decrease was primarily driven by lower compensation and benefits costs and non-compensation costs attributable to Real Estate, partially offset by higher compensation and benefits costs related to ESG. Adjusting for the impact of foreign currency exchange rate fluctuations, Adjusted EBITDA expenses would have increased 4.0% for the year ended December 31, 2015 compared to the year ended December 31, 2014.
Operating Metrics
Run Rate
At the end of any period, we generally have subscription and investment product license agreements in place for a large portion of total revenues for the following 12 months. We measure the fees related to these agreements and refer to this as “Run Rate.” The Run Rate at a particular point in time primarily represents the forward-looking revenues for the next 12 months from then-current subscriptions and investment product licenses we provide to our clients under renewable contracts or agreements assuming all contracts or agreements that come up for renewal are renewed and assuming then-current currency exchange rates. For any license where fees are linked to an investment
72
product’s assets or trading volume, the Run Rate calculation reflects, for ETFs, the market value on the last trading day of the period, for futures and options, the most recent quarterly volumes and for non-ETF funds, the most recent client reported assets under such license or subscription. The Run Rate does not include fees associated with “one-time” and other non-recurring transactions. In addition, we remove from the Run Rate the fees associated with any subscription or investment product license agreement with respect to which we have received a notice of termination or non-renewal during the period and determined that such notice evidences the client’s final decision to terminate or not renew the applicable subscription or agreement, even though such notice is not effective until a later date.
Because the Run Rate represents potential future revenues, there is typically a delayed impact on our operating revenues from changes in our Run Rate. In addition, the actual amount of revenues we will realize over the following 12 months will differ from the Run Rate because of:
|
|
• |
fluctuations in revenues associated with new subscriptions and non-recurring sales; |
|
|
• |
modifications, cancellations and non-renewals of existing agreements, subject to specified notice requirements; |
|
|
• |
fluctuations in asset-based fees, which may result from changes in certain investment products’ total expense ratios, market movements, including foreign currency exchange rates, or from investment inflows into and outflows from investment products linked to our indexes; |
|
|
• |
fluctuations in fees based on trading volumes of futures and options contracts linked to our indexes; |
|
|
• |
fluctuations in the number of hedge funds for which we provide investment information and risk analysis to hedge fund investors; |
|
|
• |
price changes; |
|
|
• |
revenue recognition differences under U.S. GAAP, including those related to the timing of implementation and report deliveries for certain of our products and services; |
|
|
• |
fluctuations in foreign exchange rates; and |
|
|
• |
the impact of acquisitions and dispositions. |
Changes in Run Rate between periods may be attributable to, among other things, increases from new subscriptions, decreases from cancellations, increases or decreases, as the case may be, from the change in the value of assets of investment products linked to MSCI indexes, the change in trading volumes of futures and options contracts linked to MSCI indexes, price changes, fluctuations in foreign currency exchange rates and the impact of acquisitions and dispositions.
The following table presents Run Rates by reportable segment as of the dates indicated and the growth percentages over the years indicated:
|
|
|
As of |
|
|
Comparison of |
|
||||||||||||||
|
|
|
December 31, |
|
|
December 31, |
|
|
December 31, |
|
|
December 31, |
|
|
December 31, |
|
|||||
|
|
|
|
2016 |
|
|
|
2015 |
|
|
|
2014 |
|
|
2016 to 2015 |
|
|
2015 to 2014 |
|
||
|
|
|
(in thousands) |
|
|
|
|
|
|
|
|
|
|||||||||
|
Index: |
|
|
|
|
|
|
|
|
|
|
|
|
|
|
|
|
|
|
|
|
|
Recurring subscriptions |
|
$ |
406,729 |
|
|
$ |
368,855 |
|
|
$ |
335,277 |
|
|
|
10.3 |
% |
|
|
10.0 |
% |
|
Asset-based fees |
|
|
216,982 |
|
|
|
201,047 |
|
|
|
174,558 |
|
|
|
7.9 |
% |
|
|
15.2 |
% |
|
Index total |
|
|
623,711 |
|
|
|
569,902 |
|
|
|
509,835 |
|
|
|
9.4 |
% |
|
|
11.8 |
% |
|
Analytics |
|
|
451,533 |
|
|
|
436,671 |
|
|
|
417,677 |
|
|
|
3.4 |
% |
|
|
4.5 |
% |
|
All Other |
|
|
88,074 |
|
|
|
82,677 |
|
|
|
79,213 |
|
|
|
6.5 |
% |
|
|
4.4 |
% |
|
Total Run Rate |
|
$ |
1,163,318 |
|
|
$ |
1,089,250 |
|
|
$ |
1,006,725 |
|
|
|
6.8 |
% |
|
|
8.2 |
% |
|
|
|
|
|
|
|
|
|
|
|
|
|
|
|
|
|
|
|
|
|
|
|
Recurring subscriptions total |
|
$ |
946,336 |
|
|
$ |
888,203 |
|
|
$ |
832,167 |
|
|
|
6.5 |
% |
|
|
6.7 |
% |
|
Asset-based fees |
|
|
216,982 |
|
|
|
201,047 |
|
|
|
174,558 |
|
|
|
7.9 |
% |
|
|
15.2 |
% |
|
Total Run Rate |
|
$ |
1,163,318 |
|
|
$ |
1,089,250 |
|
|
$ |
1,006,725 |
|
|
|
6.8 |
% |
|
|
8.2 |
% |
73
December 31, 2016 Compared to December 31, 2015
Total Run Rate grew 6.8% to $1,163.3 million as of December 31, 2016 compared to $1,089.3 million as of December 31, 2015. Recurring subscription Run Rate grew 6.5% to $946.3 million as of December 31, 2016 compared to $888.2 million as of December 31, 2015. Adjusting for the impact of foreign currency exchange rate fluctuations, recurring subscription Run Rate would have increased 7.2% as of December 31, 2016 compared to December 31, 2015.
Run Rate from asset-based fees increased 7.9% to $217.0 million as of December 31, 2016, from $201.0 million as of December 31, 2015, primarily driven by higher AUM in non-ETF passive funds and ETFs as well as increases in futures and options contracts, all linked to MSCI indexes. As of December 31, 2016, the value of AUM in ETFs linked to MSCI indexes was $481.4 billion, up $48.0 billion, or 11.1%, from $433.4 billion as of December 31, 2015. The increase of $48.0 billion consisted of net inflows of $37.2 billion and market depreciation of $10.8 billion.
Index recurring subscription Run Rate grew 10.3% to $406.7 million as of December 31, 2016 compared to $368.9 million as of December 31, 2015, driven by growth in core products, factor and thematic products and usage fees. There was a negligible impact from foreign currency exchange rate fluctuations on Index recurring subscription Run Rate as of December 31, 2016 compared to December 31, 2015.
Run Rate from Analytics products increased 3.4% to $451.5 million as of December 31, 2016 compared to $436.7 million as of December 31, 2015, primarily driven by growth in sales of equity models as well as RiskManager, BarraOne and InvestorForce products. Adjusting for the impact from foreign currency exchange rate fluctuations, Analytics Run Rate would have increased 3.8% as of December 31, 2016 compared to December 31, 2015.
Run Rate from All Other products increased 6.5% to $88.1 million at December 31, 2016 compared to $82.7 million at December 31, 2015, driven by an $8.9 million, or 22.0%, increase in ESG Run Rate to $49.2 million, partially offset by a $3.5 million, or 8.2%, decrease in Real Estate Run Rate to $38.9 million. The increase in ESG Run Rate was driven by strong sales of ESG Ratings products. Adjusting for the impact of foreign currency exchange rate fluctuations and the divestiture of the Real Estate occupiers business, Real Estate Run Rate would have increased 5.2% and All Other Run Rate would have increased 14.8%, in each case as of December 31, 2016 compared to December 31, 2015.
December 31, 2015 Compared to December 31, 2014
Total Run Rate grew 8.2% to $1,089.3 million as of December 31, 2015 compared to $1,006.7 million as of December 31, 2014. Recurring subscription Run Rate grew 6.7% to $888.2 million as of December 31, 2015 compared to $832.2 million as of December 31, 2014. Adjusting for the impact of foreign currency exchange rate fluctuations, recurring subscription Run Rate would have increased 7.9% as of December 31, 2015 compared to December 31, 2014.
Run Rate from asset-based fees increased 15.2% to $201.0 million at December 31, 2015, from $174.6 million at December 31, 2014, primarily driven by higher AUM in ETFs and non-ETF passive funds as well as increases in futures and options contracts, all linked to MSCI indexes. As of December 31, 2015, the value of AUM in ETFs linked to MSCI indexes was $433.4 billion, up $60.1 billion, or 16.1%, from $373.3 billion as of December 31, 2014. The increase of $60.1 billion consisted of net inflows of $87.7 billion, partially offset by market depreciation of $27.6 billion.
Index recurring subscription Run Rate grew 10.0% to $368.9 million at December 31, 2015 compared to $335.3 million at December 31, 2014 on growth in benchmark and data products.
Total Run Rate from Analytics products increased 4.5% to $436.7 million at December 31, 2015 compared to $417.7 million at December 31, 2014, primarily driven by growth in RiskManager, equity models and InvestorForce
74
products. Adjusting for the impact of foreign currency exchange rate fluctuations, Run Rate for Analytics would have increased 6.0% as of December 31, 2015 compared to December 31, 2014.
Total Run Rate from All Other products increased 4.4% to $82.7 million at December 31, 2015 compared to $79.2 million at December 31, 2014.
ESG products Run Rate increased 16.8% to $40.3 million at December 31, 2015 compared to $34.5 million at December 31, 2014. Adjusting for the impact of foreign currency exchange rate fluctuations, Run Rate would have increased 19.5% as of December 31, 2015 compared to December 31, 2014.
Real Estate products Run Rate decreased 5.2% to $42.4 million at December 31, 2015 compared to $44.7 million at December 31, 2014. Adjusting for the impact of foreign currency exchange rate fluctuations, Run Rate would have increased 1.9% as of December 31, 2015 compared to December 31, 2014.
Subscription Sales
The following table presents our recurring subscription sales, cancellations and non-recurring sales by reportable segment for the years indicated:
|
|
|
Years Ended |
|
|
Comparison of |
|
||||||||||||||
|
|
|
December 31, |
|
|
December 31, |
|
|
December 31, |
|
|
December 31, |
|
|
December 31, |
|
|||||
|
|
|
2016 |
|
|
2015 |
|
|
2014 |
|
|
2016 to 2015 |
|
|
2015 to 2014 |
|
|||||
|
|
|
(in thousands) |
|
|
|
|
|
|
|
|
|
|||||||||
|
New recurring subscription sales |
|
|
|
|
|
|
|
|
|
|
|
|
|
|
|
|
|
|
|
|
|
Index |
|
$ |
55,279 |
|
|
$ |
49,521 |
|
|
$ |
44,547 |
|
|
|
11.6 |
% |
|
|
11.2 |
% |
|
Analytics |
|
|
55,255 |
|
|
|
52,819 |
|
|
|
55,588 |
|
|
|
4.6 |
% |
|
|
(5.0 |
%) |
|
All Other |
|
|
19,978 |
|
|
|
16,657 |
|
|
|
17,508 |
|
|
|
19.9 |
% |
|
|
(4.9 |
%) |
|
New recurring subscription sales total |
|
|
130,512 |
|
|
|
118,997 |
|
|
|
117,643 |
|
|
|
9.7 |
% |
|
|
1.2 |
% |
|
Subscription cancellations |
|
|
|
|
|
|
|
|
|
|
|
|
|
|
|
|
|
|
|
|
|
Index |
|
|
(17,417 |
) |
|
|
(16,254 |
) |
|
|
(14,310 |
) |
|
|
7.2 |
% |
|
|
13.6 |
% |
|
Analytics |
|
|
(39,205 |
) |
|
|
(29,362 |
) |
|
|
(33,172 |
) |
|
|
33.5 |
% |
|
|
(11.5 |
%) |
|
All Other |
|
|
(8,288 |
) |
|
|
(9,042 |
) |
|
|
(7,173 |
) |
|
|
(8.3 |
%) |
|
|
26.1 |
% |
|
Subscription cancellations total |
|
|
(64,910 |
) |
|
|
(54,658 |
) |
|
|
(54,655 |
) |
|
|
18.8 |
% |
|
— |
% |
|
|
Net new recurring subscription sales |
|
|
|
|
|
|
|
|
|
|
|
|
|
|
|
|
|
|
|
|
|
Index |
|
|
37,862 |
|
|
|
33,267 |
|
|
|
30,237 |
|
|
|
13.8 |
% |
|
|
10.0 |
% |
|
Analytics |
|
|
16,050 |
|
|
|
23,457 |
|
|
|
22,416 |
|
|
|
(31.6 |
%) |
|
|
4.6 |
% |
|
All Other |
|
|
11,690 |
|
|
|
7,615 |
|
|
|
10,335 |
|
|
|
53.5 |
% |
|
|
(26.3 |
%) |
|
Net new recurring subscription sales total |
|
|
65,602 |
|
|
|
64,339 |
|
|
|
62,988 |
|
|
|
2.0 |
% |
|
|
2.1 |
% |
|
Non-recurring sales |
|
|
|
|
|
|
|
|
|
|
|
|
|
|
|
|
|
|
|
|
|
Index |
|
|
17,850 |
|
|
|
8,964 |
|
|
|
8,956 |
|
|
|
99.1 |
% |
|
|
0.1 |
% |
|
Analytics |
|
|
8,830 |
|
|
|
7,286 |
|
|
|
4,837 |
|
|
|
21.2 |
% |
|
|
50.6 |
% |
|
All Other |
|
|
4,247 |
|
|
|
4,880 |
|
|
|
6,377 |
|
|
|
(13.0 |
%) |
|
|
(23.5 |
%) |
|
Non-recurring sales total |
|
|
30,927 |
|
|
|
21,130 |
|
|
|
20,170 |
|
|
|
46.4 |
% |
|
|
4.8 |
% |
|
Gross sales |
|
|
|
|
|
|
|
|
|
|
|
|
|
|
|
|
|
|
|
|
|
Index |
|
$ |
73,129 |
|
|
$ |
58,485 |
|
|
$ |
53,503 |
|
|
|
25.0 |
% |
|
|
9.3 |
% |
|
Analytics |
|
|
64,085 |
|
|
|
60,105 |
|
|
|
60,425 |
|
|
|
6.6 |
% |
|
|
(0.5 |
%) |
|
All Other |
|
|
24,225 |
|
|
|
21,537 |
|
|
|
23,885 |
|
|
|
12.5 |
% |
|
|
(9.8 |
%) |
|
Total gross sales |
|
$ |
161,439 |
|
|
$ |
140,127 |
|
|
$ |
137,813 |
|
|
|
15.2 |
% |
|
|
1.7 |
% |
|
Net sales |
|
|
|
|
|
|
|
|
|
|
|
|
|
|
|
|
|
|
|
|
|
Index |
|
$ |
55,712 |
|
|
$ |
42,231 |
|
|
$ |
39,193 |
|
|
|
31.9 |
% |
|
|
7.8 |
% |
|
Analytics |
|
|
24,880 |
|
|
|
30,743 |
|
|
|
27,253 |
|
|
|
(19.1 |
%) |
|
|
12.8 |
% |
|
All Other |
|
|
15,937 |
|
|
|
12,495 |
|
|
|
16,712 |
|
|
|
27.5 |
% |
|
|
(25.2 |
%) |
|
Total net sales |
|
$ |
96,529 |
|
|
$ |
85,469 |
|
|
$ |
83,158 |
|
|
|
12.9 |
% |
|
|
2.8 |
% |
75
Another key metric is our “Aggregate Retention Rate.” This metric is important because subscription cancellations decrease our Run Rate and ultimately our operating revenues. The annual Aggregate Retention Rate represents the retained subscription Run Rate (beginning subscription Run Rate less actual cancels during the year) as a percentage of the subscription Run Rate at the beginning of the fiscal year. If a client reduces the number of products to which it subscribes or switches between our products, we treat it as a cancellation for purposes of calculating our Aggregate Retention Rate. Our Aggregate Retention Rate is computed on a product-by-product basis. In addition, we treat any reduction in fees resulting from renegotiated contracts as a cancellation in the calculation to the extent of the reduction. We do not calculate Aggregate Retention Rate for that portion of our Run Rate attributable to assets in investment products linked to our indexes or futures and options contracts linked to our indexes. Aggregate Retention Rate for a non-annual period reflects the annualization of the cancels recorded in the period.
The following table presents our Aggregate Retention Rate by reportable segment and product category for the periods indicated for the years ended December 31, 2016, 2015 and 2014:
|
|
|
Index |
|
|
Analytics |
|
|
All Other |
|
|
Total |
|
||||
|
2016 |
|
|
|
|
|
|
|
|
|
|
|
|
|
|
|
|
|
Three Months Ended March 31, |
|
|
96.3 |
% |
|
|
94.6 |
% |
|
|
92.2 |
% |
|
|
95.1 |
% |
|
Three Months Ended June 30, |
|
|
95.6 |
% |
|
|
91.7 |
% |
|
|
89.2 |
% |
|
|
93.1 |
% |
|
Three Months Ended September 30, |
|
|
95.8 |
% |
|
|
90.4 |
% |
|
|
90.8 |
% |
|
|
92.7 |
% |
|
Three Months Ended December 31, |
|
|
93.4 |
% |
|
|
87.4 |
% |
|
|
87.8 |
% |
|
|
89.9 |
% |
|
Year Ended December 31, |
|
|
95.3 |
% |
|
|
91.0 |
% |
|
|
90.0 |
% |
|
|
92.7 |
% |
|
2015 |
|
|
|
|
|
|
|
|
|
|
|
|
|
|
|
|
|
Three Months Ended March 31, |
|
|
97.2 |
% |
|
|
92.9 |
% |
|
|
90.7 |
% |
|
|
94.4 |
% |
|
Three Months Ended June 30, |
|
|
95.4 |
% |
|
|
93.8 |
% |
|
|
90.7 |
% |
|
|
94.2 |
% |
|
Three Months Ended September 30, |
|
|
95.4 |
% |
|
|
95.3 |
% |
|
|
89.1 |
% |
|
|
94.8 |
% |
|
Three Months Ended December 31, |
|
|
92.7 |
% |
|
|
89.9 |
% |
|
|
83.9 |
% |
|
|
90.4 |
% |
|
Year Ended December 31, |
|
|
95.2 |
% |
|
|
93.0 |
% |
|
|
88.6 |
% |
|
|
93.4 |
% |
|
2014 |
|
|
|
|
|
|
|
|
|
|
|
|
|
|
|
|
|
Three Months Ended March 31, |
|
|
95.4 |
% |
|
|
90.9 |
% |
|
|
92.4 |
% |
|
|
92.8 |
% |
|
Three Months Ended June 30, |
|
|
95.3 |
% |
|
|
92.4 |
% |
|
|
88.5 |
% |
|
|
93.2 |
% |
|
Three Months Ended September 30, |
|
|
95.3 |
% |
|
|
94.2 |
% |
|
|
94.3 |
% |
|
|
94.6 |
% |
|
Three Months Ended December 31, |
|
|
95.2 |
% |
|
|
89.7 |
% |
|
|
83.9 |
% |
|
|
91.3 |
% |
|
Year Ended December 31, |
|
|
95.3 |
% |
|
|
91.8 |
% |
|
|
89.5 |
% |
|
|
93.0 |
% |
The quarterly Aggregate Retention Rate is calculated by annualizing the actual cancellations recorded during the quarter. This annualized cancellation figure is then divided by the subscription Run Rate at the beginning of the year to calculate a cancellation rate. This cancellation rate is then subtracted from 100% to derive the annualized Aggregate Retention Rate for the quarter.
For example, in the fourth quarter of 2016, we recorded cancellations of $22.3 million. To derive the Aggregate Retention Rate for the fourth quarter, we annualized the actual cancellations during the quarter of $22.3 million to derive $89.4 million of annualized cancellations. This $89.4 million was then divided by the $888.2 million subscription Run Rate at the beginning of the year to derive a cancellation rate of 10.1%. The 10.1% was then subtracted from 100.0% to derive an Aggregate Retention Rate of 89.9% for the fourth quarter.
For the year ended December 31, 2016, 34.4% of our cancellations occurred in the fourth quarter. Historically, the Aggregate Retention Rate has generally been higher during the first three quarters and lower in the fourth quarter, as the fourth quarter is traditionally the largest renewal period in the year.
76
Liquidity and Capital Resources
We require capital to fund ongoing operations, internal growth initiatives and acquisitions. Our primary sources of liquidity are cash flows generated from our operations, existing cash and cash equivalents and credit capacity under our existing credit facilities. In addition, we believe we have access to additional funding in the public and private markets. We intend to use these sources of liquidity to, among other things, service our existing and future debt obligations and fund our working capital requirements, capital expenditures, investments, acquisitions, dividend payments and repurchases of our common stock. In connection with our business strategy, we regularly evaluate acquisition opportunities. We believe our liquidity, along with other financing alternatives, will provide the necessary capital to fund these transactions and achieve our planned growth.
Senior Notes and Credit Agreement
As of December 31, 2016, we had $2.1 billion of outstanding indebtedness in the form of Senior Notes and a related interest expense of $101.7 million for the year ended December 31, 2016. We also maintain a $220.0 million senior unsecured revolving credit agreement, which was undrawn as of December 31, 2016.
The 2024 Senior Notes are scheduled to mature and be paid in full on November 15, 2024. At any time prior to November 15, 2019, we may redeem all or part of the 2024 Senior Notes upon not less than 30 nor more than 60 days’ prior notice at a redemption price equal to the sum of (i) 100% of the principal amount thereof, plus (ii) a make-whole premium as of the date of redemption, plus (iii) accrued and unpaid interest and additional interest, if any, thereon, to the date of redemption. In addition, we may redeem all or part of the 2024 Senior Notes, together with accrued and unpaid interest, on or after November 15, 2019, at redemption prices set forth in the indenture governing our 2024 Senior Notes. At any time prior to November 15, 2017, we may use the proceeds of certain equity offerings to redeem up to 35% of the aggregate principal amount of the 2024 Senior Notes, including any permitted additional notes, at a redemption price equal to 105.25% of the principal amount.
The 2025 Senior Notes are scheduled to mature and be paid in full on August 15, 2025. At any time prior to August 15, 2020, we may redeem all or part of the 2025 Senior Notes upon not less than 30 nor more than 60 days’ prior notice at a redemption price equal to the sum of (i) 100% of the principal amount thereof, plus (ii) a make-whole premium as of the date of redemption, plus (iii) accrued and unpaid interest and additional interest, if any, thereon, to the date of redemption. In addition, we may redeem all or part of the 2025 Senior Notes, together with accrued and unpaid interest, on or after August 15, 2020, at redemption prices set forth in the indenture governing our 2025 Senior Notes. At any time prior to August 15, 2018, we may use the proceeds of certain equity offerings to redeem up to 35% of the aggregate principal amount of the 2025 Senior Notes, including any permitted additional notes, at a redemption price equal to 105.75% of the principal amount.
The 2026 Senior Notes are scheduled to mature and be paid in full on August 1, 2026. At any time prior to August 1, 2021, the Company may redeem all or part of the 2026 Senior Notes upon not less than 30 nor more than 60 days’ prior notice at a redemption price equal to the sum of (i) 100% of the principal amount thereof, plus (ii) a make-whole premium as of the date of redemption, plus (iii) accrued and unpaid interest and additional interest, if any, thereon, to the date of redemption. In addition, the Company may redeem all or part of the 2026 Senior Notes, together with accrued and unpaid interest, on or after August 1, 2021, at redemption prices set forth in the indenture governing the 2026 Senior Notes. At any time prior to August 1, 2019, the Company may use the proceeds of certain equity offerings to redeem up to 35% of the aggregate principal amount of the 2026 Senior Notes, including any permitted additional notes, at a redemption price equal to 104.75% of the principal amount.
Interest payments attributable to the 2024 Senior Notes are due on May 15 and November 15 of each year. The first interest payment was made on May 15, 2015. Interest payments attributable to the 2025 Senior Notes are due on February 15 and August 15 of each year. The first interest payment was made on February 16, 2016. Interest payments attributable to the 2026 Senior Notes are due on February 1 and August 1 of each year. The first interest payment was made on February 1, 2017.
On August 4, 2016, we entered into Amendment No. 1 (the “Amendment”) to the 2014 Revolving Credit Agreement (the 2014 Revolving Credit Agreement as so amended, the “Revolving Credit Agreement”). The Amendment, among other things, (i) increased aggregate commitments available to be borrowed to $220.0 million,
77
(ii) increased the maximum consolidated leverage ratio from 3.75:1.00 to 4.25:1.00 and (iii) extended the initial term to August 2021 with an option to extend for an additional one-year term.
The Senior Notes and the Revolving Credit Agreement are fully and unconditionally, and jointly and severally, guaranteed by our direct or indirect wholly-owned domestic subsidiaries that account for more than 5% of our and our subsidiaries’ consolidated assets, other than certain excluded subsidiaries (the “subsidiary guarantors”). Amounts due under the Revolving Credit Agreement are our and the subsidiary guarantors’ senior unsecured obligations and rank equally with the Senior Notes and any of our other unsecured, unsubordinated debt, senior to any of our subordinated debt and effectively subordinated to our secured debt to the extent of the assets securing such debt.
The indentures governing our Senior Notes (the “Indentures”) among us, each of the subsidiary guarantors, and Wells Fargo Bank, National Association, as trustee, contain covenants that limit our and certain of our subsidiaries’ ability to, among other things, incur liens, enter into sale/leaseback transactions and consolidate, merge or sell all or substantially all of our assets. In addition, the Indentures restrict our non-guarantor subsidiaries’ ability to create, assume, incur or guarantee additional indebtedness without such non-guarantor subsidiaries guaranteeing the Senior Notes on a pari passu basis.
The Revolving Credit Agreement contains affirmative and restrictive covenants that, among other things, limit our ability and the ability of our existing or future subsidiaries to:
|
|
• |
incur liens and further negative pledges; |
|
|
• |
incur additional indebtedness or prepay, redeem or repurchase indebtedness; |
|
|
• |
make loans or hold investments; |
|
|
• |
merge, dissolve, liquidate, consolidate with or into another person; |
|
|
• |
enter into acquisition transactions; |
|
|
• |
enter into sale/leaseback transactions; |
|
|
• |
issue disqualified capital stock; |
|
|
• |
sell, transfer or dispose of assets; |
|
|
• |
pay dividends or make other distributions in respect of our capital stock or engage in stock repurchases, redemptions and other restricted payments; |
|
|
• |
create new subsidiaries; |
|
|
• |
permit certain restrictions affecting our subsidiaries; |
|
|
• |
change the nature of our business, accounting policies or fiscal periods; |
|
|
• |
enter into any transactions with affiliates other than on an arm’s-length basis; and |
|
|
• |
amend our organizational documents or amend, modify or change the terms of certain agreements relating to our indebtedness. |
The Revolving Credit Agreement and the Indentures also contain customary events of default, including those relating to non-payment, breach of representations, warranties or covenants, cross-default and cross-acceleration, bankruptcy and insolvency events, invalidity or impairment of loan documentation or collateral, change of control and customary ERISA defaults. None of the restrictions above are expected to impact our ability to effectively operate the business.
The Revolving Credit Agreement also requires us and our subsidiaries to achieve financial and operating results sufficient to maintain compliance with the following financial ratios on a consolidated basis through the termination of the Revolving Credit Agreement: (1) the maximum Consolidated Leverage Ratio (as defined in the Revolving Credit Agreement) measured quarterly on a rolling four-quarter basis shall not exceed 4.25:1.00 and (2)
78
the minimum Consolidated Interest Coverage Ratio (as defined in the Revolving Credit Agreement) measured quarterly on a rolling four-quarter basis shall be at least 4.00:1.00. As of December 31, 2016, our Consolidated Leverage Ratio was 3.50:1.00 and our Consolidated Interest Coverage Ratio was 6.74:1.00. There were no amounts drawn under the Revolving Credit Facility since its November 20, 2014 inception.
Our non-guarantor subsidiaries of the Senior Notes consist of: (i) domestic subsidiaries of the Company that account for 5% or less of consolidated assets of the Company and its subsidiaries and (ii) any foreign or domestic subsidiary of the Company that is deemed to be a controlled foreign corporation within the meaning of Section 957 of the Internal Revenue Code of 1986, as amended. Our non-guarantor subsidiaries accounted for approximately $186.8 million, or 16.2%, of our total revenue for the twelve months ended December 31, 2016, approximately $129.3 million, or 26.5%, of our consolidated operating income for the twelve months ended December 31, 2016, and approximately $461.1 million, or 15.0%, of our consolidated total assets (excluding intercompany assets) and $166.7 million, or 6.0%, of our consolidated total liabilities, in each case as of December 31, 2016.
Share Repurchases
On September 18, 2014, we entered into the September 2014 ASR Agreement. On September 19, 2014, we paid $300.0 million in cash and received approximately 4.5 million shares of our common stock under the September 2014 ASR Agreement. On May 21, 2015, we completed the September ASR Program, receiving approximately 1.2 million shares of our common stock. In total, 5.7 million shares of our common stock were delivered for an average purchase price of $52.79 per share. The repurchased shares are held in treasury.
On June 2, 2015, we began purchasing shares of our common stock in the open market in accordance with SEC Rule 10b5-1.
For the year ended December 31, 2015, the Company repurchased approximately 10.7 million shares at an average price of $62.63 per share for a total value of $670.8 million pursuant to open market repurchases.
For the year ended December 31, 2016, the Company repurchased approximately 10.3 million shares at an average price of $73.71 per share for a total value of $759.4 million pursuant to open market repurchases.
Subsequent to the year ended December 31, 2016 and through February 17, 2017, the Company repurchased an additional 1.0 million shares of common stock at an average price of 80.70 per share for a total value of $77.5 million.
As of February 17, 2017, a total of $792.4 million remained available on the share repurchase authorization.
Cash Dividends
On September 17, 2014, our Board of Directors approved a plan to initiate a regular quarterly cash dividend to our shareholders. On October 30, 2014, we began paying regular quarterly cash dividends and have paid such dividends each quarter thereafter. This authorization may be modified, suspended or terminated by the Board of Directors at any time without prior notice.
On February 1, 2017, the Board of Directors declared a quarterly dividend of $0.28 per share of common stock to be paid on March 15, 2017 to shareholders of record as of the close of trading on February 17, 2017.
79
The following table presents the Company’s cash and cash equivalents as of the dates indicated:
|
|
|
As of |
|
|||||
|
|
|
December 31, |
|
|
December 31, |
|
||
|
|
|
|
2016 |
|
|
|
2015 |
|
|
|
|
(in thousands) |
|
|||||
|
Cash and cash equivalents |
|
$ |
791,834 |
|
|
$ |
777,706 |
|
The following table presents the breakdown of the Company’s cash flows for the periods indicated:
|
|
|
Years Ended |
|
|||||||||
|
|
|
December 31, |
|
|
December 31, |
|
|
December 31, |
|
|||
|
|
|
|
2016 |
|
|
2015 |
|
|
2014 (1) |
|
||
|
|
|
(in thousands) |
|
|||||||||
|
Net cash provided by operating activities |
|
$ |
434,738 |
|
|
$ |
305,994 |
|
|
$ |
305,673 |
|
|
Net cash (used in) provided by investing activities |
|
|
(42,031 |
) |
|
|
(48,861 |
) |
|
|
297,037 |
|
|
Net cash (used in) provided by financing activities |
|
|
(365,274 |
) |
|
|
19,949 |
|
|
|
(442,328 |
) |
|
Effect of exchange rates on cash and cash equivalents |
|
|
(13,305 |
) |
|
|
(8,175 |
) |
|
|
(10,017 |
) |
|
Net increase in cash and cash equivalents |
|
$ |
14,128 |
|
|
$ |
268,907 |
|
|
$ |
150,365 |
|
|
(1) |
Includes results from ISS through its disposition on April 30, 2014. |
Cash and Cash Equivalents
Cash and cash equivalents were $791.8 million and $777.7 million as of December 31, 2016 and 2015, respectively. As of December 31, 2016 and 2015, $208.2 million and $128.1 million, respectively, of the cash and cash equivalents were held by foreign subsidiaries, which could be subject to U.S. federal income taxation on repatriation to the U.S. and some of which could be subject to local country taxes if repatriated to the U.S. In addition, repatriation of some foreign cash is further restricted by local laws. The increase in cash and cash equivalents held by foreign subsidiaries primarily reflects ongoing efforts to better align our tax profile with our global operating footprint. We expect the cash balance to continue to grow outside the U.S. over time. These balances will be available to meet our needs outside the U.S. whether it be for general corporate purpose or other needs, including acquisitions or expansion of our products.
We believe that domestic cash flows from operations, together with existing cash and cash equivalents and funds available under our existing credit facility and our ability to access the debt and capital markets for additional funds, will continue to be sufficient to fund our domestic operating activities and cash commitments for investing and financing activities, such as material capital expenditures and share repurchases, for at least the 12 months following issuance of this Form 10-K and for the foreseeable future thereafter. In addition, we expect existing foreign cash flows from operations, together with existing cash and cash equivalents, will continue to be sufficient to fund our foreign operating activities and cash commitments for investing activities, such as material capital expenditures, for at least the next 12 months and for the foreseeable future thereafter.
Cash Flows From Operating Activities
Cash flows from operating activities consist of net income adjusted for certain non-cash items and changes in assets and liabilities. Cash provided by operating activities was $434.8 million and $306.0 million for the years ended December 31, 2016 and 2015, respectively. The year-over-year increase reflects higher billings and collections from customers, a decrease in cash expenses and lower cash payments for income taxes, including the impact of income tax refunds, partially offset by higher interest payments.
Cash provided by operating activities was $306.0 million and $305.7 million for the years ended December 31, 2015 and 2014, respectively. The year-over-year increase reflects higher cash inflows from operating
80
results, offset by higher payments related to interest and cash taxes. Cash flows from operating activities for the year ended December 31, 2014 includes cash flows from discontinued operations.
Our primary uses of cash from operating activities are for the payment of cash compensation expenses, office rent, technology costs, market data costs, interest expenses and income taxes. Historically, the payment of cash for compensation and benefits is at its highest level in the first quarter when we pay discretionary employee compensation related to the previous fiscal year.
Cash Flows From Investing Activities
Cash used in investing activities was $42.0 million and $48.9 million for the years ended December 31, 2016 and 2015, respectively.
Cash used in investing activities was $48.9 million for the year ended December 31, 2015 compared to cash provided by investing activities of $297.0 million for the year ended December 31, 2014. The year-over-year decrease primarily reflects the impact for the year ended December 31, 2014 of $362.8 million in cash received upon the disposition of ISS, partially offset by the purchase of GMI Ratings.
Cash Flows From Financing Activities
Cash used in financing activities was $365.3 million for the year ended December 31, 2016 compared to cash provided by financing activities of $19.9 million for the year ended December 31, 2015. The year-over-year decrease primarily reflects the impact of lower proceeds from borrowings and increased repurchases of treasury shares.
Cash provided by financing activities was $19.9 million for the year ended December 31, 2015 compared to cash used in financing activities of $442.3 million for the year ended December 31, 2014. The year-over-year increase primarily reflects the impact of our 2025 Senior Notes offering in August 2015, partially offset by higher share repurchases as well as the payments of dividends, which began in the three months ended December 31, 2014.
Contractual Obligations
Our contractual obligations consist primarily of leases for office space, leases for equipment and other operating leases, obligations to vendors arising out of market data contracts and our debt obligations arising from the issuance of the Senior Notes. The following table summarizes our contractual obligations for the periods indicated as of December 31, 2016:
|
|
|
|
|
|
|
Years Ending December 31, |
|
|
|
|
|
|||||||||||||||||
|
(in thousands) |
|
Total |
|
|
2017 |
|
|
2018 |
|
|
2019 |
|
|
2020 |
|
|
2021 |
|
|
Thereafter |
|
|||||||
|
Operating leases |
|
$ |
246,322 |
|
|
|
27,869 |
|
|
$ |
27,429 |
|
|
$ |
22,559 |
|
|
$ |
19,237 |
|
|
$ |
17,413 |
|
|
$ |
131,815 |
|
|
Vendor obligations |
|
|
62,198 |
|
|
|
40,260 |
|
|
|
17,308 |
|
|
|
4,161 |
|
|
|
469 |
|
|
|
— |
|
|
|
— |
|
|
Senior Notes (1) |
|
|
3,387,302 |
|
|
|
111,552 |
|
|
|
111,750 |
|
|
|
111,750 |
|
|
|
111,750 |
|
|
|
111,750 |
|
|
|
2,828,750 |
|
|
Total contractual obligations |
|
$ |
3,695,822 |
|
|
$ |
179,681 |
|
|
$ |
156,487 |
|
|
$ |
138,470 |
|
|
$ |
131,456 |
|
|
$ |
129,163 |
|
|
$ |
2,960,565 |
|
|
(1) |
Includes the impact of payments for the principal amount on the 2024 Senior Notes, 2025 Senior Notes and the 2026 Senior Notes plus interest based on the 5.25%, 5.75% and 4.75% coupon interest rate, respectively. |
The obligations related to MSCI’s uncertain tax positions, which are not considered material, have been excluded from the table above because of the uncertainty surrounding the timing and final amounts of any settlement.
Off-Balance Sheet Arrangements
At December 31, 2016 and 2015, we did not have any relationships with unconsolidated entities or financial partnerships, such as entities often referred to as structured finance or special purpose entities, which would have
81
been established for the purpose of facilitating off-balance sheet arrangements or other contractually narrow or limited purposes.
Recent Accounting Standards Updates
See Note 2, “Recent Accounting Standards Updates,” of the Notes to the Consolidated Financial Statements included herein for further information.
Foreign Currency Risk
We are subject to foreign currency exchange fluctuation risk. Exchange rate movements can impact the U.S. dollar reported value of our revenues, expenses, assets and liabilities denominated in non-U.S. dollar currencies or where the currency of such items is different than the functional currency of the entity where these items were recorded.
We generally invoice our clients in U.S. dollars; however, we invoice a portion of our clients in Euros, British pounds sterling, Japanese yen and a limited number of other non-U.S. dollar currencies. For the years ended December 31, 2016 and 2015, 16.9% and 17.8%, respectively, of our revenues are subject to foreign currency exchange rate risk and primarily includes clients billed in foreign currency as well as U.S. dollar exposures on non-U.S. dollar foreign operating entities. Of the 16.9% of non-U.S. dollar exposure for the year ended December 31, 2016, 35.5% was in British pounds sterling, 34.4% was in Euros and 24.9% was in Japanese yen. Of the 17.8% of non-U.S. dollar exposure for the year ended December 31, 2015, 37.0% was in British pounds sterling, 35.8% was in Euros and 21.6% was in Japanese yen.
Revenues from index-linked investment products represented 18.3% and 18.4% of operating revenues for the years ended December 31, 2016 and 2015, respectively. While a substantial portion of our fees for index-linked investment products are invoiced in U.S. dollars, the fees are based on the investment product’s assets, of which two-thirds are invested in securities denominated in currencies other than the U.S. dollar. Accordingly, declines in such other currencies against the U.S. dollar will decrease the fees payable to us under such licenses. In addition, declines in such currencies against the U.S. dollar could impact the attractiveness of such investment products resulting in net fund outflows, which would further reduce the fees payable under such licenses.
We are exposed to additional foreign currency risk in certain of our operating costs. Approximately 38.3% and 41.3% of our operating expenses for the years ended December 31, 2016 and 2015, respectively, were denominated in foreign currencies, the significant majority of which were denominated in British pounds sterling, Indian rupees, Swiss francs, Hungarian forints, Hong Kong dollars, Euros, Mexican pesos and Chinese yuan. Expenses incurred in foreign currency may increase as we expand our business outside the U.S.
We have certain monetary assets and liabilities denominated in currencies other than local functional amounts and when these balances were remeasured into their local functional currency, either a gain or a loss resulted from the change of the value of the functional currency as compared to the originating currencies. We manage foreign currency exchange rate risk, in part, through the use of derivative financial instruments comprised principally of forward contracts on foreign currency which are not designated as hedging instruments for accounting purposes. The objective of the derivative instruments is to minimize the impact on the income statement of the volatility of amounts denominated in certain foreign currencies. We recognized total foreign currency exchange losses of $0.2 million, $2.2 million and $3.0 million for the years ended December 31, 2016, 2015 and 2014, respectively.
The information required by this Item is set forth beginning on page F-1 of this Annual Report on Form 10-K.
82
None.
(a). Evaluation of Disclosure Controls and Procedures
The Company maintains disclosure controls and procedures that are designed to ensure that information required to be disclosed in the Company’s reports under the Securities Exchange Act of 1934, as amended (the “Exchange Act”), is recorded, processed, summarized and reported within the time periods specified in the SEC’s rules and forms, and that such information is accumulated and communicated to management, including our Chief Executive Officer (“CEO”) and Chief Financial Officer (“CFO”) as appropriate, to allow timely decisions regarding required disclosure.
Management of the Company, with the participation of its CEO and CFO, evaluated the effectiveness of the Company’s disclosure controls and procedures. Based on their evaluation, as of December 31, 2016, the end of the period covered by this Annual Report on Form 10-K, the Company’s CEO and CFO have concluded that the Company’s disclosure controls and procedures (as defined in Rules 13a-15(e) and 15d-15(e) under the Exchange Act) were effective.
(b). Management’s Annual Report On Internal Control Over Financial Reporting
Our management is responsible for establishing and maintaining adequate internal control over financial reporting. Internal control over financial reporting is defined in Rules 13a-15(f) and 15d-15(f) promulgated under the Exchange Act as a process designed by, or under the supervision of, our principal executive and principal financial officers or persons performing similar functions and effected by the Company’s Board of Directors, management and other personnel, to provide reasonable assurance regarding the reliability of financial reporting and the preparation of financial statements for external purposes in accordance with GAAP and includes those policies and procedures that:
|
|
• |
pertain to the maintenance of records that, in reasonable detail, accurately and fairly reflect our transactions and dispositions of our assets, |
|
|
• |
provide reasonable assurance that transactions are recorded as necessary to permit preparation of our financial statements in accordance with GAAP, and that our receipts and expenditures are being made only in accordance with authorizations of management and directors of the Company, and |
|
|
• |
provide reasonable assurance regarding prevention or timely detection of unauthorized acquisition, use or disposition of our assets that could have a material effect on the financial statements. |
Because of its inherent limitations, internal control over financial reporting may not prevent or detect misstatements. Also, projections of any evaluation of effectiveness to future periods are subject to the risk that controls may become inadequate because of changes in conditions, or that the degree of compliance with the policies or procedures may deteriorate.
Management assessed the effectiveness of our internal control over financial reporting as of December 31, 2016 based on the criteria described in Internal Control—Integrated Framework (2013) issued by the Committee of Sponsoring Organizations of the Treadway Commission (COSO).
83
Based on this assessment, management, including the Company’s CEO and CFO, concluded that, as of December 31, 2016, our internal control over financial reporting was effective in providing reasonable assurance regarding the reliability of financial reporting and the preparation of financial statements for external purposes in accordance with generally accepted accounting principles.
PricewaterhouseCoopers, LLP, our independent registered public accounting firm, has audited and issued a report on the effectiveness of our internal control over financial reporting as of December 31, 2016, which appears on page F-2 of this Annual Report on Form 10-K.
(c). Changes in Internal Control Over Financial Reporting
There have been no changes in our internal control over financial reporting (as defined in Rules 13a-15(f) and 15d-15(f) under the Exchange Act) during the fiscal quarter ended December 31, 2016 that have materially affected, or are reasonably likely to materially affect, our internal control over financial reporting.
None.
84
Except for the information relating to our Executive Officers set forth in Part I of this Annual Report on Form 10-K, we incorporate by reference the information responsive to this Item appearing in our Proxy Statement, which will be filed no later than 120 days after December 31, 2016.
Information regarding our Code of Ethics and Business Conduct and Corporate Governance Policies is incorporated herein by reference from our Proxy Statement, which will be filed no later than 120 days after December 31, 2016. Any amendments to, or waivers from, a provision of our Codes of Ethics that apply to our principal executive officer, principal financial officer, controller, or persons performing similar functions and that relates to any element of the Code of Ethics enumerated in paragraph (b) of Item 406 of Regulation S-K shall be disclosed by posting such information on our website at www.msci.com. The information on our website is not and should not be considered a part of this Annual Report on Form 10-K.
We incorporate by reference the information responsive to this Item appearing in our Proxy Statement, which will be filed no later than 120 days after December 31, 2016.
|
Item 12. |
Security Ownership of Certain Beneficial Owners and Management and Related Stockholder Matters |
We incorporate by reference the information responsive to this Item appearing in our Proxy Statement, which will be filed no later than 120 days after December 31, 2016. The information provided under Part II, Item 5. “Market for Registrant’s Common Equity, Related Stockholder Matters And Issuer Purchases of Equity Securities” of this Annual Report on Form 10-K is incorporated by reference herein.
We incorporate by reference the information responsive to this Item appearing in our Proxy Statement, which will be filed no later than 120 days after December 31, 2016.
We incorporate by reference the information responsive to this Item appearing in our Proxy Statement, which will be filed no later than 120 days after December 31, 2016.
85
(a)(1) Financial Statements
The financial statements begin on page F-1 of this Annual Report on Form 10-K.
(a)(2) Financial Statement Schedules
No financial statement schedules are provided because the information called for is not applicable or not required or is included in the consolidated financial statements or the notes thereto beginning on page F-1 of this Annual Report on Form 10-K.
(a)(3) Exhibits
The information required by this Item is set forth on the exhibit index that begins on page EX-1 of this Annual Report on Form 10-K.
None.
86
Pursuant to the requirements of Section 13 or 15(d) of the Securities Exchange Act of 1934, the Registrant has duly caused this Report to be signed on its behalf by the undersigned, thereunto duly authorized.
|
MSCI INC. |
||||
|
|
|
|||
|
By: |
|
/S/ HENRY A. FERNANDEZ |
||
|
|
|
Name: |
|
Henry A. Fernandez |
|
|
|
Title: |
|
Chairman, Chief Executive Officer and President |
Date: February 24, 2017
POWER OF ATTORNEY
KNOW ALL PERSONS BY THESE PRESENTS, that each person whose signature appears below constitutes and appoints Kathleen A. Winters, Frederick W. Bogdan and Cecilia Aza, and each or any one of them, his or her true and lawful attorneys-in-fact and agents, with full powers of substitution and resubstitution, for him or her and in his or her name, place and stead, in the capacities indicated below, to sign any and all amendments to this Annual Report on Form 10-K and to file the same, with all exhibits thereto and other documents in connection therewith, with the Securities and Exchange Commission, hereby ratifying and confirming his or her signatures as they may be signed by his or her said attorneys-in-fact and agents, or their substitute or substitutes, to any and all amendments to this Annual Report on Form 10-K.
Pursuant to the requirements of Section 13 or 15(d) of the Securities Exchange Act of 1934, this report has been signed below by the following persons on behalf of the Registrant and in the capacities and on the dates indicated.
|
Signature |
|
Title |
|
Date |
|
|
|
|
|
|
|
/S/ HENRY A. FERNANDEZ |
|
Chairman, Chief Executive Officer, and |
|
February 24, 2017 |
|
Henry A. Fernandez |
|
President (principal executive officer) |
|
|
|
|
|
|
|
|
|
/S/ KATHLEEN A. WINTERS |
|
Chief Financial Officer |
|
February 24, 2017 |
|
Kathleen A. Winters |
|
(principal financial officer) |
|
|
|
|
|
|
|
|
|
/S/ RICHARD J. NAPOLITANO |
|
Global Controller |
|
February 24, 2017 |
|
Richard J. Napolitano |
|
(principal accounting officer) |
|
|
|
|
|
|
|
|
|
/S/ ROBERT G. ASHE |
|
Director |
|
February 24, 2017 |
|
Robert G. Ashe |
|
|
|
|
|
|
|
|
|
|
|
/S/ BENJAMIN F. DUPONT |
|
Director |
|
February 24, 2017 |
|
Benjamin F. duPont |
|
|
|
|
|
|
|
|
|
|
|
/S/ WAYNE EDMUNDS |
|
Director |
|
February 24, 2017 |
|
Wayne Edmunds |
|
|
|
|
|
|
|
|
|
|
|
/S/ ALICE W. HANDY |
|
Director |
|
February 24, 2017 |
|
Alice W. Handy |
|
|
|
|
|
|
|
|
|
|
|
/S/ CATHERINE R. KINNEY |
|
Director |
|
February 24, 2017 |
|
Catherine R. Kinney |
|
|
|
|
|
|
|
|
|
|
|
/S/ WENDY E. LANE |
|
Director |
|
February 24, 2017 |
|
Wendy E. Lane |
|
|
|
|
|
|
|
|
|
|
87
|
/S/ LINDA H. RIEFLER |
|
Director |
|
February 24, 2017 |
|
Linda H. Riefler |
|
|
|
|
|
|
|
|
|
|
|
/S/ GEORGE W. SIGULER |
|
Director |
|
February 24, 2017 |
|
George W. Siguler |
|
|
|
|
|
|
|
|
|
|
|
/S/ PATRICK TIERNEY |
|
Director |
|
February 24, 2017 |
|
Patrick Tierney |
|
|
|
|
|
|
|
|
|
|
|
/S/ RODOLPHE M. VALLEE |
|
Director |
|
February 24, 2017 |
|
Rodolphe M. Vallee |
|
|
|
|
88
INDEX TO CONSOLIDATED FINANCIAL STATEMENTS
|
Consolidated Financial Statements |
Page |
|
|
|
F-2 |
|
|
Consolidated Statements of Financial Condition as of December 31, 2016 and December 31, 2015 |
|
F-3 |
|
|
F-4 |
|
|
|
F-5 |
|
|
|
F-6 |
|
|
|
F-7 |
|
|
|
F-8 |
|
F-1
REPORT OF INDEPENDENT REGISTERED PUBLIC ACCOUNTING FIRM
To the Board of Directors and Shareholders of MSCI Inc.
In our opinion, the accompanying consolidated statements of financial condition and the related consolidated statements of income, of comprehensive income, of shareholders’ equity and of cash flows present fairly, in all material respects, the financial position of MSCI Inc. and its subsidiaries at December 31, 2016 and December 31, 2015, and the results of their operations and their cash flows for each of the three years in the period ended December 31, 2016 in conformity with accounting principles generally accepted in the United States of America. Also in our opinion, the Company maintained, in all material respects, effective internal control over financial reporting as of December 31, 2016, based on criteria established in Internal Control - Integrated Framework (2013) issued by the Committee of Sponsoring Organizations of the Treadway Commission (COSO). The Company's management is responsible for these financial statements, for maintaining effective internal control over financial reporting and for its assessment of the effectiveness of internal control over financial reporting, included in Management's Annual Report On Internal Control Over Financial Reporting appearing under Item 9A. Our responsibility is to express opinions on these financial statements and on the Company's internal control over financial reporting based on our integrated audits. We conducted our audits in accordance with the standards of the Public Company Accounting Oversight Board (United States). Those standards require that we plan and perform the audits to obtain reasonable assurance about whether the financial statements are free of material misstatement and whether effective internal control over financial reporting was maintained in all material respects. Our audits of the financial statements included examining, on a test basis, evidence supporting the amounts and disclosures in the financial statements, assessing the accounting principles used and significant estimates made by management, and evaluating the overall financial statement presentation. Our audit of internal control over financial reporting included obtaining an understanding of internal control over financial reporting, assessing the risk that a material weakness exists, and testing and evaluating the design and operating effectiveness of internal control based on the assessed risk. Our audits also included performing such other procedures as we considered necessary in the circumstances. We believe that our audits provide a reasonable basis for our opinions.
A company’s internal control over financial reporting is a process designed to provide reasonable assurance regarding the reliability of financial reporting and the preparation of financial statements for external purposes in accordance with generally accepted accounting principles. A company’s internal control over financial reporting includes those policies and procedures that (i) pertain to the maintenance of records that, in reasonable detail, accurately and fairly reflect the transactions and dispositions of the assets of the company; (ii) provide reasonable assurance that transactions are recorded as necessary to permit preparation of financial statements in accordance with generally accepted accounting principles, and that receipts and expenditures of the company are being made only in accordance with authorizations of management and directors of the company; and (iii) provide reasonable assurance regarding prevention or timely detection of unauthorized acquisition, use, or disposition of the company’s assets that could have a material effect on the financial statements.
Because of its inherent limitations, internal control over financial reporting may not prevent or detect misstatements. Also, projections of any evaluation of effectiveness to future periods are subject to the risk that controls may become inadequate because of changes in conditions, or that the degree of compliance with the policies or procedures may deteriorate.
/s/ PricewaterhouseCoopers LLP
New York, New York
February 24, 2017
F-2
CONSOLIDATED STATEMENTS OF FINANCIAL CONDITION
|
|
|
As of |
|
|||||
|
|
|
December 31, |
|
|
December 31, |
|
||
|
|
|
2016 |
|
|
2015 |
|
||
|
|
|
(In thousands, except per share and share data) |
|
|||||
|
ASSETS |
|
|
|
|
|
|
|
|
|
Current assets: |
|
|
|
|
|
|
|
|
|
Cash and cash equivalents |
|
$ |
791,834 |
|
|
$ |
777,706 |
|
|
Accounts receivable (net of allowances of $1,035 and $1,117 at December 31, 2016 and December 31, 2015, respectively) |
|
|
221,504 |
|
|
|
208,239 |
|
|
Prepaid income taxes |
|
|
12,389 |
|
|
|
46,115 |
|
|
Prepaid and other assets |
|
|
29,943 |
|
|
|
31,211 |
|
|
Total current assets |
|
|
1,055,670 |
|
|
|
1,063,271 |
|
|
Property, equipment and leasehold improvements (net of accumulated depreciation and amortization of $136,841 and $114,680 at December 31, 2016 and December 31, 2015, respectively) |
|
|
95,585 |
|
|
|
98,926 |
|
|
Goodwill |
|
|
1,555,850 |
|
|
|
1,565,621 |
|
|
Intangible assets (net of accumulated amortization of $462,860 and $418,512 at December 31, 2016 and December 31, 2015, respectively) |
|
|
347,640 |
|
|
|
391,490 |
|
|
Deferred tax assets |
|
|
9,531 |
|
|
|
9,180 |
|
|
Other non-current assets |
|
|
18,302 |
|
|
|
18,499 |
|
|
Total assets |
|
$ |
3,082,578 |
|
|
$ |
3,146,987 |
|
|
|
|
|
|
|
|
|
|
|
|
LIABILITIES AND SHAREHOLDERS' EQUITY |
|
|
|
|
|
|
|
|
|
Current liabilities: |
|
|
|
|
|
|
|
|
|
Accounts payable |
|
$ |
568 |
|
|
$ |
2,512 |
|
|
Accrued compensation and related benefits |
|
|
119,113 |
|
|
|
116,619 |
|
|
Other accrued liabilities |
|
|
82,531 |
|
|
|
61,433 |
|
|
Deferred revenue |
|
|
334,358 |
|
|
|
317,552 |
|
|
Total current liabilities |
|
|
536,570 |
|
|
|
498,116 |
|
|
Long-term debt |
|
|
2,075,201 |
|
|
|
1,579,404 |
|
|
Deferred taxes |
|
|
94,067 |
|
|
|
110,937 |
|
|
Other non-current liabilities |
|
|
59,135 |
|
|
|
57,043 |
|
|
Total liabilities |
|
|
2,764,973 |
|
|
|
2,245,500 |
|
|
|
|
|
|
|
|
|
|
|
|
Commitments and Contingencies (see Note 4 and Note 8) |
|
|
|
|
|
|
|
|
|
|
|
|
|
|
|
|
|
|
|
Shareholders' equity: |
|
|
|
|
|
|
|
|
|
Preferred Stock (par value $0.01, 100,000,000 share authorized, no shares issued) |
|
|
— |
|
|
|
— |
|
|
Common stock (par value $0.01; 750,000,000 common shares authorized; 128,996,344 and 128,200,189 common shares issued and 91,279,590 and 101,013,148 common shares outstanding at December 31, 2016 and December 31, 2015, respectively) |
|
|
1,290 |
|
|
|
1,282 |
|
|
Treasury shares, at cost (37,716,754 and 27,187,041 common shares held at December 31, 2016 and December 31, 2015, respectively) |
|
|
(2,170,739 |
) |
|
|
(1,395,695 |
) |
|
Additional paid in capital |
|
|
1,225,565 |
|
|
|
1,173,183 |
|
|
Retained earnings |
|
|
1,322,224 |
|
|
|
1,158,462 |
|
|
Accumulated other comprehensive loss |
|
|
(60,735 |
) |
|
|
(35,745 |
) |
|
Total shareholders' equity |
|
|
317,605 |
|
|
|
901,487 |
|
|
Total liabilities and shareholders' equity |
|
$ |
3,082,578 |
|
|
$ |
3,146,987 |
|
See Notes to Consolidated Financial Statements.
F-3
CONSOLIDATED STATEMENTS OF INCOME
|
|
|
Years Ended |
|
|||||||||
|
|
|
December 31, |
|
|
December 31, |
|
|
December 31, |
|
|||
|
|
|
2016 |
|
|
|
2015 |
|
|
2014 |
|
||
|
|
|
(in thousands, except per share and share data) |
|
|||||||||
|
Operating revenues |
|
$ |
1,150,669 |
|
|
$ |
1,075,013 |
|
|
$ |
996,680 |
|
|
Operating expenses: |
|
|
|
|
|
|
|
|
|
|
|
|
|
Cost of revenues |
|
|
252,107 |
|
|
|
267,695 |
|
|
|
276,623 |
|
|
Selling and marketing |
|
|
166,666 |
|
|
|
162,294 |
|
|
|
163,839 |
|
|
Research and development |
|
|
75,204 |
|
|
|
77,320 |
|
|
|
71,095 |
|
|
General and administrative |
|
|
87,235 |
|
|
|
86,007 |
|
|
|
76,369 |
|
|
Amortization of intangible assets |
|
|
47,033 |
|
|
|
46,910 |
|
|
|
45,877 |
|
|
Depreciation and amortization of property, equipment and leasehold improvements |
|
|
34,320 |
|
|
|
30,889 |
|
|
|
25,711 |
|
|
Total operating expenses |
|
|
662,565 |
|
|
|
671,115 |
|
|
|
659,514 |
|
|
|
|
|
|
|
|
|
|
|
|
|
|
|
|
Operating income |
|
|
488,104 |
|
|
|
403,898 |
|
|
|
337,166 |
|
|
|
|
|
|
|
|
|
|
|
|
|
|
|
|
Interest income |
|
|
(2,906 |
) |
|
|
(1,166 |
) |
|
|
(851 |
) |
|
Interest expense |
|
|
101,651 |
|
|
|
62,387 |
|
|
|
31,820 |
|
|
Other expense (income) |
|
|
3,421 |
|
|
|
(6,877 |
) |
|
|
(2,141 |
) |
|
|
|
|
|
|
|
|
|
|
|
|
|
|
|
Other expense (income), net |
|
|
102,166 |
|
|
|
54,344 |
|
|
|
28,828 |
|
|
|
|
|
|
|
|
|
|
|
|
|
|
|
|
Income from continuing operations before provision for income taxes |
|
|
385,938 |
|
|
|
349,554 |
|
|
|
308,338 |
|
|
Provision for income taxes |
|
|
125,083 |
|
|
|
119,516 |
|
|
|
109,396 |
|
|
Income from continuing operations |
|
|
260,855 |
|
|
|
230,038 |
|
|
|
198,942 |
|
|
Income (loss) from discontinued operations, net of income taxes |
|
|
— |
|
|
|
(6,390 |
) |
|
|
85,171 |
|
|
Net income |
|
$ |
260,855 |
|
|
$ |
223,648 |
|
|
$ |
284,113 |
|
|
|
|
|
|
|
|
|
|
|
|
|
|
|
|
Earnings per basic common share: |
|
|
|
|
|
|
|
|
|
|
|
|
|
Earnings per basic common share from continuing operations |
|
$ |
2.72 |
|
|
$ |
2.11 |
|
|
$ |
1.72 |
|
|
Earnings per basic common share from discontinued operations |
|
|
— |
|
|
|
(0.06 |
) |
|
|
0.73 |
|
|
Earnings per basic common share |
|
$ |
2.72 |
|
|
$ |
2.05 |
|
|
$ |
2.45 |
|
|
|
|
|
|
|
|
|
|
|
|
|
|
|
|
Earnings per diluted common share: |
|
|
|
|
|
|
|
|
|
|
|
|
|
Earnings per diluted common share from continuing operations |
|
$ |
2.70 |
|
|
$ |
2.09 |
|
|
$ |
1.70 |
|
|
Earnings per diluted common share from discontinued operations |
|
|
— |
|
|
|
(0.06 |
) |
|
|
0.73 |
|
|
Earnings per diluted common share |
|
$ |
2.70 |
|
|
$ |
2.03 |
|
|
$ |
2.43 |
|
|
|
|
|
|
|
|
|
|
|
|
|
|
|
|
Weighted average shares outstanding used in computing earnings per share: |
|
|
|
|
|
|
|
|
|
|
|
|
|
Basic |
|
|
95,986 |
|
|
|
109,124 |
|
|
|
115,737 |
|
|
Diluted |
|
|
96,540 |
|
|
|
109,926 |
|
|
|
116,706 |
|
|
|
|
|
|
|
|
|
|
|
|
|
|
|
|
Dividend declared per common share |
|
$ |
1.00 |
|
|
$ |
0.80 |
|
|
$ |
0.18 |
|
See Notes to Consolidated Financial Statements.
F-4
CONSOLIDATED STATEMENTS OF COMPREHENSIVE INCOME
|
|
|
Years Ended |
|
|||||||||
|
|
|
December 31, |
|
|
December 31, |
|
|
December 31, |
|
|||
|
|
|
2016 |
|
|
2015 |
|
|
2014 |
|
|||
|
|
|
(in thousands) |
|
|||||||||
|
Net income |
|
$ |
260,855 |
|
|
$ |
223,648 |
|
|
$ |
284,113 |
|
|
Other comprehensive (loss) income: |
|
|
|
|
|
|
|
|
|
|
|
|
|
|
|
|
|
|
|
|
|
|
|
|
|
|
|
Foreign currency translation adjustments |
|
|
(24,871 |
) |
|
|
(12,253 |
) |
|
|
(18,053 |
) |
|
Income tax effect |
|
|
(714 |
) |
|
|
135 |
|
|
|
(132 |
) |
|
|
|
|
|
|
|
|
|
|
|
|
|
|
|
Foreign currency translation adjustments, net |
|
|
(25,585 |
) |
|
|
(12,118 |
) |
|
|
(18,185 |
) |
|
|
|
|
|
|
|
|
|
|
|
|
|
|
|
Pension and other post-retirement adjustments |
|
|
660 |
|
|
|
1,872 |
|
|
|
(8,299 |
) |
|
Income tax effect |
|
|
(65 |
) |
|
|
(528 |
) |
|
|
2,163 |
|
|
|
|
|
|
|
|
|
|
|
|
|
|
|
|
Pension and other post-retirement adjustments, net |
|
|
595 |
|
|
|
1,344 |
|
|
|
(6,136 |
) |
|
|
|
|
|
|
|
|
|
|
|
|
|
|
|
Other comprehensive (loss) income, net of tax |
|
|
(24,990 |
) |
|
|
(10,774 |
) |
|
|
(24,321 |
) |
|
|
|
|
|
|
|
|
|
|
|
|
|
|
|
Comprehensive income |
|
$ |
235,865 |
|
|
$ |
212,874 |
|
|
$ |
259,792 |
|
See Notes to Consolidated Financial Statements.
F-5
CONSOLIDATED STATEMENTS OF SHAREHOLDERS’ EQUITY
|
|
|
|
|
|
|
|
|
|
|
|
|
|
|
|
|
|
|
Accumulated |
|
|
|
|
|
|
|
|
|
|
|
|
|
|
|
|
|
Additional |
|
|
|
|
|
|
Other |
|
|
|
|
|
||
|
|
|
Common |
|
|
Treasury |
|
|
Paid-in |
|
|
Retained |
|
|
Comprehensive |
|
|
|
|
|
|||||
|
|
|
Stock |
|
|
Stock |
|
|
Capital |
|
|
Earnings |
|
|
Income (Loss) |
|
|
Total |
|
||||||
|
|
|
(in thousands) |
|
|||||||||||||||||||||
|
Balance at December 31, 2013 |
|
$ |
1,256 |
|
|
$ |
(268,391 |
) |
|
$ |
1,073,157 |
|
|
$ |
758,975 |
|
|
$ |
(650 |
) |
|
$ |
1,564,347 |
|
|
Net income |
|
|
|
|
|
|
|
|
|
|
|
|
|
|
284,113 |
|
|
|
|
|
|
|
284,113 |
|
|
Dividends |
|
|
|
|
|
|
(4 |
) |
|
|
|
|
|
|
(20,393 |
) |
|
|
|
|
|
|
(20,397 |
) |
|
Other comprehensive income (loss), net of tax |
|
|
|
|
|
|
|
|
|
|
|
|
|
|
|
|
|
|
(24,321 |
) |
|
|
(24,321 |
) |
|
Common stock issued |
|
|
5 |
|
|
|
|
|
|
|
|
|
|
|
|
|
|
|
|
|
|
|
5 |
|
|
Compensation payable in common stock and options |
|
|
|
|
|
|
|
|
|
|
26,553 |
|
|
|
|
|
|
|
|
|
|
|
26,553 |
|
|
Common stock repurchased and held in treasury |
|
|
|
|
|
|
(319,651 |
) |
|
|
(90,000 |
) |
|
|
|
|
|
|
|
|
|
|
(409,651 |
) |
|
Common stock issued to directors and held in treasury |
|
|
|
|
|
|
(332 |
) |
|
|
|
|
|
|
|
|
|
|
|
|
|
|
(332 |
) |
|
Exercise of stock options |
|
|
5 |
|
|
|
|
|
|
|
9,676 |
|
|
|
|
|
|
|
|
|
|
|
9,681 |
|
|
Excess tax benefits from employee stock incentive plans |
|
|
|
|
|
|
|
|
|
|
2,835 |
|
|
|
|
|
|
|
|
|
|
|
2,835 |
|
|
|
|
|
|
|
|
|
|
|
|
|
|
|
|
|
|
|
|
|
|
|
|
|
|
|
|
Balance at December 31, 2014 |
|
$ |
1,266 |
|
|
$ |
(588,378 |
) |
|
$ |
1,022,221 |
|
|
$ |
1,022,695 |
|
|
$ |
(24,971 |
) |
|
$ |
1,432,833 |
|
|
Net income |
|
|
|
|
|
|
|
|
|
|
|
|
|
|
223,648 |
|
|
|
|
|
|
|
223,648 |
|
|
Dividends |
|
|
|
|
|
|
|
|
|
|
29 |
|
|
|
(87,881 |
) |
|
|
|
|
|
|
(87,852 |
) |
|
Other comprehensive income (loss), net of tax |
|
|
|
|
|
|
|
|
|
|
|
|
|
|
|
|
|
|
(10,774 |
) |
|
|
(10,774 |
) |
|
Common stock issued |
|
|
6 |
|
|
|
|
|
|
|
|
|
|
|
|
|
|
|
|
|
|
|
6 |
|
|
Compensation payable in common stock and options |
|
|
|
|
|
|
|
|
|
|
25,963 |
|
|
|
|
|
|
|
|
|
|
|
25,963 |
|
|
Common stock repurchased and held in treasury |
|
|
|
|
|
|
(806,782 |
) |
|
|
90,000 |
|
|
|
|
|
|
|
|
|
|
|
(716,782 |
) |
|
Common stock issued to directors and held in treasury |
|
|
|
|
|
|
(535 |
) |
|
|
29 |
|
|
|
|
|
|
|
|
|
|
|
(506 |
) |
|
Exercise of stock options |
|
|
10 |
|
|
|
|
|
|
|
19,688 |
|
|
|
|
|
|
|
|
|
|
|
19,698 |
|
|
Excess tax benefits from employee stock incentive plans |
|
|
|
|
|
|
|
|
|
|
15,253 |
|
|
|
|
|
|
|
|
|
|
|
15,253 |
|
|
|
|
|
|
|
|
|
|
|
|
|
|
|
|
|
|
|
|
|
|
|
|
|
|
|
|
Balance at December 31, 2015 |
|
$ |
1,282 |
|
|
$ |
(1,395,695 |
) |
|
$ |
1,173,183 |
|
|
$ |
1,158,462 |
|
|
$ |
(35,745 |
) |
|
$ |
901,487 |
|
|
Net income |
|
|
|
|
|
|
|
|
|
|
|
|
|
|
260,855 |
|
|
|
|
|
|
|
260,855 |
|
|
Dividends |
|
|
|
|
|
|
|
|
|
|
34 |
|
|
|
(97,093 |
) |
|
|
|
|
|
|
(97,059 |
) |
|
Other comprehensive income (loss), net of tax |
|
|
|
|
|
|
|
|
|
|
|
|
|
|
|
|
|
|
(24,990 |
) |
|
|
(24,990 |
) |
|
Common stock issued |
|
|
5 |
|
|
|
|
|
|
|
|
|
|
|
|
|
|
|
|
|
|
|
5 |
|
|
Compensation payable in common stock and options |
|
|
|
|
|
|
|
|
|
|
39,648 |
|
|
|
|
|
|
|
|
|
|
|
39,648 |
|
|
Common stock repurchased and held in treasury |
|
|
|
|
|
|
(774,565 |
) |
|
|
|
|
|
|
|
|
|
|
|
|
|
|
(774,565 |
) |
|
Common stock issued to directors and held in treasury |
|
|
|
|
|
|
(479 |
) |
|
|
38 |
|
|
|
|
|
|
|
|
|
|
|
(441 |
) |
|
Exercise of stock options |
|
|
3 |
|
|
|
|
|
|
|
5,037 |
|
|
|
|
|
|
|
|
|
|
|
5,040 |
|
|
Excess tax benefits from employee stock incentive plans |
|
|
|
|
|
|
|
|
|
|
7,625 |
|
|
|
|
|
|
|
|
|
|
|
7,625 |
|
|
|
|
|
|
|
|
|
|
|
|
|
|
|
|
|
|
|
|
|
|
|
|
|
|
|
|
Balance at December 31, 2016 |
|
$ |
1,290 |
|
|
$ |
(2,170,739 |
) |
|
$ |
1,225,565 |
|
|
$ |
1,322,224 |
|
|
$ |
(60,735 |
) |
|
$ |
317,605 |
|
See Notes to Consolidated Financial Statements.
F-6
CONSOLIDATED STATEMENTS OF CASH FLOWS
|
|
|
Years Ended |
|
|||||||||
|
|
|
December 31, |
|
|
December 31, |
|
|
December 31, |
|
|||
|
|
|
2016 |
|
|
2015 |
|
|
2014 |
|
|||
|
|
|
(in thousands) |
|
|||||||||
|
Cash flows from operating activities |
|
|
|
|
|
|
|
|
|
|
|
|
|
Net income |
|
$ |
260,855 |
|
|
$ |
223,648 |
|
|
$ |
284,113 |
|
|
Adjustments to reconcile net income to net cash provided by operating activities: |
|
|
|
|
|
|
|
|
|
|
|
|
|
Amortization of intangible assets |
|
|
47,033 |
|
|
|
46,910 |
|
|
|
48,617 |
|
|
Stock-based compensation expense |
|
|
32,001 |
|
|
|
28,558 |
|
|
|
26,585 |
|
|
Depreciation and amortization of property, equipment and leasehold improvements |
|
|
34,320 |
|
|
|
30,889 |
|
|
|
25,930 |
|
|
Amortization of debt origination fees |
|
|
3,068 |
|
|
|
2,135 |
|
|
|
7,748 |
|
|
Deferred taxes |
|
|
(16,967 |
) |
|
|
(10,288 |
) |
|
|
(4,960 |
) |
|
Amortization of discount on long-term debt |
|
|
— |
|
|
|
— |
|
|
|
2,218 |
|
|
Excess tax benefits from share-based compensation |
|
|
(7,625 |
) |
|
|
(15,253 |
) |
|
|
(2,835 |
) |
|
Gain on disposition |
|
|
(449 |
) |
|
|
— |
|
|
|
(84,620 |
) |
|
Other non-cash adjustments |
|
|
1,192 |
|
|
|
(2,067 |
) |
|
|
1,847 |
|
|
Changes in assets and liabilities, net of the effect of acquisitions and dispositions: |
|
|
|
|
|
|
|
|
|
|
|
|
|
Accounts receivable |
|
|
(18,494 |
) |
|
|
(30,900 |
) |
|
|
(26,821 |
) |
|
Prepaid income taxes |
|
|
41,332 |
|
|
|
(1,972 |
) |
|
|
(14,998 |
) |
|
Prepaid and other assets |
|
|
624 |
|
|
|
(1,217 |
) |
|
|
(9,857 |
) |
|
Accounts payable |
|
|
(1,912 |
) |
|
|
(298 |
) |
|
|
2,128 |
|
|
Accrued compensation and related benefits |
|
|
13,089 |
|
|
|
5,087 |
|
|
|
88 |
|
|
Other accrued liabilities |
|
|
19,741 |
|
|
|
17,165 |
|
|
|
8,428 |
|
|
Deferred revenue |
|
|
21,809 |
|
|
|
8,047 |
|
|
|
42,263 |
|
|
Other |
|
|
5,121 |
|
|
|
5,550 |
|
|
|
(201 |
) |
|
|
|
|
|
|
|
|
|
|
|
|
|
|
|
Net cash provided by operating activities |
|
|
434,738 |
|
|
|
305,994 |
|
|
|
305,673 |
|
|
|
|
|
|
|
|
|
|
|
|
|
|
|
|
Cash flows from investing activities |
|
|
|
|
|
|
|
|
|
|
|
|
|
Proceeds from sales of investments |
|
|
— |
|
|
|
6,736 |
|
|
|
— |
|
|
Disposition, net of cash provided |
|
|
657 |
|
|
|
— |
|
|
|
362,811 |
|
|
Proceeds from the sale of capital equipment |
|
|
— |
|
|
|
55 |
|
|
|
22 |
|
|
Capital expenditures |
|
|
(32,284 |
) |
|
|
(40,652 |
) |
|
|
(42,659 |
) |
|
Capitalized software development costs |
|
|
(10,344 |
) |
|
|
(8,500 |
) |
|
|
(8,216 |
) |
|
Acquisitions, net of cash acquired |
|
|
(60 |
) |
|
|
(6,500 |
) |
|
|
(14,921 |
) |
|
|
|
|
|
|
|
|
|
|
|
|
|
|
|
Net cash used in investing activities |
|
|
(42,031 |
) |
|
|
(48,861 |
) |
|
|
297,037 |
|
|
|
|
|
|
|
|
|
|
|
|
|
|
|
|
Cash flows from financing activities |
|
|
|
|
|
|
|
|
|
|
|
|
|
Proceeds from borrowing |
|
|
500,000 |
|
|
|
800,000 |
|
|
|
800,000 |
|
|
Excess tax benefits from share-based compensation |
|
|
7,625 |
|
|
|
15,253 |
|
|
|
2,835 |
|
|
Proceeds from exercise of stock options |
|
|
5,040 |
|
|
|
3,631 |
|
|
|
9,681 |
|
|
Repayment of long-term debt |
|
|
— |
|
|
|
— |
|
|
|
(810,000 |
) |
|
Repurchase of treasury shares |
|
|
(774,565 |
) |
|
|
(700,715 |
) |
|
|
(409,651 |
) |
|
Payment of dividends |
|
|
(96,191 |
) |
|
|
(87,743 |
) |
|
|
(20,393 |
) |
|
Payment of debt issuance costs in connection with debt |
|
|
(7,183 |
) |
|
|
(10,477 |
) |
|
|
(14,800 |
) |
|
|
|
|
|
|
|
|
|
|
|
|
|
|
|
Net cash (used in) provided by financing activities |
|
|
(365,274 |
) |
|
|
19,949 |
|
|
|
(442,328 |
) |
|
|
|
|
|
|
|
|
|
|
|
|
|
|
|
Effect of exchange rate changes |
|
|
(13,305 |
) |
|
|
(8,175 |
) |
|
|
(10,017 |
) |
|
|
|
|
|
|
|
|
|
|
|
|
|
|
|
Net increase in cash |
|
|
14,128 |
|
|
|
268,907 |
|
|
|
150,365 |
|
|
Cash and cash equivalents, beginning of period |
|
|
777,706 |
|
|
|
508,799 |
|
|
|
358,434 |
|
|
|
|
|
|
|
|
|
|
|
|
|
|
|
|
Cash and cash equivalents, end of period |
|
$ |
791,834 |
|
|
$ |
777,706 |
|
|
$ |
508,799 |
|
|
|
|
|
|
|
|
|
|
|
|
|
|
|
|
Supplemental disclosure of cash flow information: |
|
|
|
|
|
|
|
|
|
|
|
|
|
Cash paid for interest |
|
$ |
89,139 |
|
|
$ |
42,110 |
|
|
$ |
17,233 |
|
|
|
|
|
|
|
|
|
|
|
|
|
|
|
|
Cash paid for income taxes |
|
$ |
97,845 |
|
|
$ |
129,534 |
|
|
$ |
120,419 |
|
|
|
|
|
|
|
|
|
|
|
|
|
|
|
|
Supplemental disclosure of non-cash investing activities |
|
|
|
|
|
|
|
|
|
|
|
|
|
Property, equipment and leasehold improvements in other accrued liabilities |
|
$ |
4,422 |
|
|
$ |
3,644 |
|
|
$ |
6,731 |
|
|
|
|
|
|
|
|
|
|
|
|
|
|
|
|
Supplemental disclosure of non-cash financing activities |
|
|
|
|
|
|
|
|
|
|
|
|
|
Cash dividends declared, but not yet paid |
|
$ |
830 |
|
|
$ |
84 |
|
|
$ |
— |
|
See Notes to Consolidated Financial Statements.
F-7
NOTES TO CONSOLIDATED FINANCIAL STATEMENTS
1. INTRODUCTION AND BASIS OF PRESENTATION
Organization
MSCI Inc., together with its wholly-owned subsidiaries (the “Company” or “MSCI”), offers products and services to support the needs of institutional investors throughout their investment processes. The Company’s products and services include the development and production of indexes and analytical models; the provision of ratings and analysis that identify environmental, social and governance risks and opportunities and the analysis of real estate in both privately and publicly owned portfolios.
On March 17, 2014, MSCI Inc. entered into a definitive agreement to sell Institutional Shareholder Services Inc. (“ISS”). As a result, the Company reported the operating results of ISS in “Income (loss) from discontinued operations, net of income taxes” in the Consolidated Statements of Income for the years ended December 31, 2015 and 2014. Unless otherwise indicated, the disclosures accompanying these consolidated financial statements reflect the Company’s continuing operations. The Company completed the sale of ISS on April 30, 2014. See Note 12, “Dispositions and Discontinued Operations,” for further details.
Basis of Presentation
The consolidated financial statements include the accounts of MSCI Inc. and its wholly-owned subsidiaries. The Company’s policy is to consolidate all entities in which it owns more than 50% of the outstanding voting stock unless it does not control the entity. It is also the Company’s policy to consolidate any variable interest entity for which the Company is the primary beneficiary, of which the Company has none, as required by the Financial Accounting Standards Board’s (“FASB”) Accounting Standards Codification (“ASC”) Subtopic 810-10, “Consolidations.” For investments in any entities in which the Company owns 20% or less of the outstanding voting stock and significant influence does not exist, such investments are carried at cost. As of December 31, 2016, the Company had no such investments.
The Company’s operating expenses are grouped and presented in the following activity categories: cost of revenues, selling and marketing, research and development and general and administrative. Costs are assigned to these activity categories based on the nature of the expense, or, when not directly attributable, an estimate is allocated based on the type of effort involved.
Cost of revenues consists of costs related to the production and servicing of the Company’s products and services and primarily include information technology costs associated with the production and delivery of its products and services, including data center, platform and infrastructure costs; costs to acquire, produce and maintain market data information; costs of research to support, maintain and rebalance existing products; costs of product management teams; costs of client service and consultant teams to support customer needs; as well as other support costs directly attributable to the cost of revenues including certain human resources, finance and legal costs.
Selling and marketing expenses consist of costs associated with acquiring new clients or selling new products or product renewals to existing clients and primarily includes the costs of our sales force and marketing teams as well as costs incurred in other groups associated with acquiring new business, including product management, research, technology and sales operations.
Research and development expenses consist of costs to develop new or enhance existing products and the costs to develop new or improved technology and service platforms for the delivery of our products and services and primarily includes the costs of application development, research, product management, project management and the technology support associated with supporting these efforts.
General and administrative expenses consist of costs primarily related to finance operations, human resources, office of the CEO, legal, corporate technology, corporate development and certain other administrative costs that are not directly attributed, but are instead allocated, to a product or service.
F-8
Significant Accounting Policies
Basis of Financial Statements and Use of Estimates
The Company’s consolidated financial statements are prepared in accordance with accounting principles generally accepted in the United States of America (“GAAP”). These accounting principles require the Company to make certain estimates and judgments that can affect the reported amounts of assets and liabilities as of the date of the consolidated financial statements, as well as the reported amounts of revenue and expenses during the periods presented. Significant estimates and assumptions made by management include the deferral and recognition of revenue, research and development and software capitalization, impairment of long-lived assets, accrued compensation, income taxes and other matters that affect the consolidated financial statements and related disclosures. The Company believes that estimates used in the preparation of these consolidated financial statements are reasonable; however, actual results could differ materially from these estimates.
Inter-company balances and transactions are eliminated in consolidation.
Revenue Recognition
The Company applies SEC Staff Accounting Bulletin No. 104 (“SAB 104”), “Revenue Recognition,” in determining revenue recognition. Accordingly, the Company recognizes revenue when all the following criteria are met:
|
|
• |
the Company has persuasive evidence of a legally binding arrangement, |
|
|
• |
delivery has occurred, |
|
|
• |
client fee is deemed fixed or determinable, and |
|
|
• |
collection is reasonably assured. |
When a sales arrangement requires the delivery of more than one product and service, revenue is recognized pursuant to the requirements of ASC Subtopic 605-25, “Revenue Arrangements with Multiple Deliverables.” Under the provisions of ASC Subtopic 605-25, elements within a multi-deliverable arrangement should be considered separate units of accounting if both of the following criteria are met:
|
|
• |
the delivered items have value to the client on a standalone basis, which means they can be sold separately by any vendor or the client could resell the delivered items on a standalone basis; and |
|
|
• |
if the arrangement includes a general right of return relative to the delivered items, delivery or performance of the undelivered items is considered probable and substantially in the control of the vendor. |
The Company has signed contracts or agreements with substantially all clients that set forth the fees to be paid for its products and services. Further, the Company regularly assesses the receivable balances for each client for collectability. The Company’s application service license arrangements generally do not include acceptance provisions, which generally allow a client to test the solution for a defined period of time before committing to the license. If a license agreement includes an acceptance provision, the Company does not recognize subscription revenues until the earlier of the receipt of a written client acceptance or, if not notified by the client that it is cancelling the license agreement, the expiration of the acceptance period.
The Company’s subscription agreements for hosted services include provisions that, among other things, allow clients, for no additional fee, to receive updates and modifications that may be made from time to time when and if available, for the term of the agreement, which is typically one year. These arrangements do not provide the client with the right to take possession of the application at any time. For sales arrangements with multiple deliverables, which may include application service subscription and professional services associated with implementation and other services, the Company evaluates each deliverable in these multiple-element arrangements to determine whether it represents a separate unit of accounting and allocates revenue accordingly, based on the Company’s best estimated sales price.
F-9
In most cases, the Company recognizes revenues from subscription arrangements ratably over the term of the license agreement pursuant to contract terms. The contracts state the terms under which these fees are to be calculated. The fees are recognized as the Company supplies the product and service to the client over the license period and are generally billed in advance, prior to the license start date. When implementation services are included, the Company recognizes revenues allocated to the subscription ratably from the date the application is put into production to the end of the license period. Revenues associated with implementation services are recognized ratably over the useful life of those services from the date the application is put into production. For products and services whose fees are based on estimated assets under management linked to the Company’s indexes, or contract values related to futures and options, the Company recognizes revenues based on estimates from independent third-party sources or the most recently reported information from the client. Revenues from subscription agreements for the receipt of periodic benchmark reports, digests, and other publications, which are most often associated with the Company’s real estate operating segment, are primarily recognized upon delivery of such reports or data updates.
The Company’s software-related arrangements do not require significant modification or customization of any underlying software applications being licensed. Accordingly, the Company recognizes software revenues pursuant to the requirements of ASC Subtopic 985-605, “Software-Revenue Recognition.” The Company’s subscription agreements for software products include provisions that, among other things, would allow clients to receive unspecified, when and if available, software upgrades for no additional fee as well as the right to use the software products with maintenance and technical support for the term of the agreement, which is typically one year. Software agreements may include other consulting and professional services. In accordance with ASC Subtopic 985-605, “Software Revenue Recognition,” the Company does not have vendor specific objective evidence (“VSOE”) for these elements and therefore begins to recognize software related revenue ratably over the term of the license agreement once delivered.
Share-Based Compensation
Certain of the Company’s employees have received share-based compensation under various compensation programs. The Company’s compensation expense reflects the fair value method of accounting for share-based payments under ASC Subtopic 718-10, “Compensation—Stock Compensation.” ASC Subtopic 718-10 requires measurement of compensation cost for equity-based awards at fair value and recognition of compensation cost over the service period, net of estimated forfeitures.
The fair value of MSCI restricted stock units (“RSUs”) is measured using the closing price of MSCI’s common stock on the date prior to grant. Restricted stock units subject to performance conditions (“PSUs”) are based on performance measures that impact the amount of shares that each recipient will receive upon vesting. The fair value of PSUs is measured using the closing price of MSCI’s common stock on the date prior to grant. Restricted stock units that are subject to the achievement of multi-year total shareholder return targets (“MSUs”) are performance awards with a market condition. The fair value of MSUs is determined using a Monte Carlo simulation model that creates a normal distribution of future stock prices, which is then used to value the awards based on their individual terms.
The fair value of MSCI standard stock options is determined using the Black-Scholes valuation model and the single grant life method. Under the single grant life method, option awards with graded vesting are valued using a single weighted-average expected option life. The fair value of MSCI stock options that contain stock price contingencies is determined using a Monte Carlo simulation model.
The Company recognizes the expense for an award granted to an employee who is not retirement-eligible utilizing the graded vesting method over the requisite service period. For all awards, the Company bases initial accruals of compensation cost on the estimated number of units for which the requisite service is expected to be rendered and, for PSUs, the performance targets expected to be achieved is also considered. If the estimated number of units or the number of units ultimately delivered changes from previous estimates, the cumulative effect on current and prior periods of a change is recognized in compensation cost in the period of the change. Because the probability of actual shares expected to be earned is reflected in the fair value of MSUs on the grant date, the expense to be recognized for these awards is not adjusted to reflect the actual shares earned.
F-10
Based on interpretive guidance related to share-based compensation, the Company’s policy is to accrue the estimated cost of share-based awards that are granted to retirement-eligible employees over the course of the prior year in which they were earned rather than expensing the awards on the date of grant. A portion of the awards granted to retirement-eligible employees consisted of PSUs. For those PSUs, the Company bases initial accruals of compensation cost on the estimated number of units for which the requisite service is expected to be rendered. If the estimated number of units expected to convert changes from previous estimates based on the performance targets expected to be achieved, the cumulative effect of a change is recognized in compensation cost in the period of the change.
Research and Development
The Company accounts for research and development costs in accordance with several accounting pronouncements, including ASC Subtopic 730-10, “Research and Development.” ASC Subtopic 730-10 requires that research and development costs generally be expensed as incurred. The majority of the Company’s research and development costs are incurred in developing, reviewing and enhancing the methodologies and data models offered within its product portfolio by monitoring investment trends and drivers globally, as well as analyzing product-specific needs in areas such as capitalization-weighted, factor and specialized indexes, and instrument valuation, risk modeling, portfolio construction, asset allocation and value-at-risk simulation.
The Company applies the provisions of ASC Subtopic 350-40, “Internal Use Software,” and accounts for the cost of computer software developed for internal use by capitalizing qualifying costs, which are substantially incurred during the application development stage. The amounts capitalized include external direct costs of services used in developing internal-use software and payroll and payroll-related costs of employees directly associated with the development activities. Additionally, costs incurred relating to upgrades and enhancements to the software are capitalized if it is determined that these upgrades or enhancements provide additional functionality to the software.
For the year ended December 31, 2016, the Company capitalized $10.3 million of costs related to software developed for internal use in the Consolidated Statement of Financial Condition for the year ended December 31, 2016.
For the year ended December 31, 2015, the Company capitalized $8.6 million of costs related to software developed for internal use and reversed $3.4 million of previously capitalized costs associated with the termination of a technology project in the Analytics segment. As a result, $5.2 million was the net amount capitalized in the Consolidated Statement of Financial Condition for the year ended December 31, 2015.
Capitalized software development costs are amortized on a straight-line basis over the estimated useful life of the related product, which is typically three to five years, beginning with the date the software is placed into service.
Costs incurred in the preliminary and post-implementation stages of our products are expensed as incurred.
Income Taxes
Income tax expense is provided for using the asset and liability method, under which deferred tax assets and deferred tax liabilities are determined based on the temporary differences between the financial statement and income tax bases of assets and liabilities using currently enacted tax rates. The Company recognizes interest and penalties related to income tax matters within “Provision for income taxes” in the Consolidated Statement of Income.
The Company regularly evaluates the likelihood of additional assessments in each of the taxing jurisdictions in which it is required to file income tax returns. The Company has recorded additional tax expense related to open tax years, which the Company’s management believes is adequate in relation to the potential for assessments. These amounts have been recorded in “Other non-current liabilities” on the Consolidated Statement of Financial Condition. The Company’s management believes the resolution of tax matters will not have a material effect on the Company’s consolidated financial condition. However, to the extent the Company is required to pay amounts in excess of its reserves, a resolution could have a material impact on its Consolidated Statement of Income for a particular future
F-11
period. In addition, an unfavorable tax settlement could require use of cash and result in an increase in the effective tax rate in the period in which such resolution occurs.
Deferred Revenue
Deferred revenues represent amounts billed to customers for products and services in advance of delivery. The Company’s clients generally pay subscription fees annually or quarterly in advance. Deferred revenue is generally amortized ratably over the service period as revenue recognition criteria are met. Where the service period has not begun and the client has not paid or the contract has not been renewed, deferred revenues and accounts receivable are not recognized.
Goodwill
Goodwill is recorded as part of the Company’s acquisitions of businesses when the purchase price exceeds the fair value of the net tangible and separately identifiable intangible assets acquired. The Company’s goodwill is not amortized, but rather is subject to an impairment test each year, or more often if conditions indicate impairment may have occurred, pursuant to ASC Subtopic 350-10, “Intangibles—Goodwill and Other.”
The Company tests goodwill for impairment on an annual basis on July 1 and on an interim basis when certain events and circumstances exist. The testing for impairment is performed at the reporting unit level. Goodwill impairment is determined by comparing the estimated fair value of a reporting unit with its respective book value. If the estimated fair value exceeds the book value, goodwill at the reporting unit level is not deemed to be impaired. If the estimated fair value is below book value, however, further analysis is required to determine the amount of impairment. Additionally, if the book value of a reporting unit is zero or a negative value and it is determined that it is more likely than not that the goodwill is impaired, further analysis is required. As the estimated fair value of the Company’s reporting units exceeded their respective book value on the testing dates, no impairment of goodwill was recorded during the years ended December 31, 2016, 2015 and 2014.
Intangible Assets
The Company amortizes definite-lived intangible assets over their estimated useful lives. Definite-lived intangible assets are reviewed for impairment whenever events or changes in circumstances indicate that the carrying value of the asset may not be recoverable. The Company also reviews the useful lives on a quarterly basis to determine if the period of economic benefit has changed. If the carrying value of an intangible asset exceeds its fair value an impairment charge would be recognized in an amount equal to the amount by which the carrying value of the intangible asset exceeds its fair value. The Company has not identified a triggering event during any of the periods presented and as such has not recorded any impairment charges. The Company had no indefinite-lived intangibles.
Foreign Currency Translation
Assets and liabilities of operations having non-U.S. dollar functional currencies are translated at year-end exchange rates, and income statement accounts are translated at weighted average exchange rates for the year. Gains or losses resulting from translating foreign currency financial statements, net of related tax effects, are reflected in accumulated other comprehensive loss, a separate component of shareholders’ equity. Gains or losses resulting from foreign currency transactions incurred in currencies other than the local functional currency are included in non-operating “Other expense (income)” on the Consolidated Statement of Income.
Derivative Instruments
The Company applies ASC Subtopic 815-10, “Derivatives and Hedging,” which establishes accounting and reporting standards for derivative instruments and hedging activities. The Company may use interest rate swaps and forward contracts on foreign currency to manage risks generally associated with interest rate and foreign exchange rate fluctuations, respectively. The Company’s derivative financial instruments are used as risk management tools and not for speculative or trading purposes.
F-12
For derivative instruments that are designated and qualify as hedging instruments for accounting purposes, the Company documents and links the relationships between the hedging instruments and hedged items. The Company also assesses and documents at the hedge’s inception whether the derivatives used in hedging transactions were effective in offsetting changes in fair values associated with the hedged items. ASC Subtopic 815-10 provides that, for derivative instruments that qualify for hedge accounting being used to hedge cash flows, changes in the fair value are recognized in accumulated other comprehensive income (loss), a separate component of shareholders’ equity, until the hedged item is recognized in earnings. In addition, the ineffective portion of a derivative’s change in fair value is immediately recognized in earnings.
The Company manages foreign currency exchange rate risk through the use of derivative financial instruments comprised principally of forward contracts on foreign currency which are not designated as hedging instruments for accounting purposes. The objective of the derivative instruments is to minimize the income statement impact associated with assets and liabilities that are denominated in certain foreign currencies. Derivative instruments that do not qualify for hedge accounting are carried at fair value on the Consolidated Statement of Financial Condition with gains and losses recorded in the Consolidated Statement of Income in the period in which they are realized.
Property, Equipment and Leasehold Improvements
Property, equipment and leasehold improvements are stated at cost less accumulated depreciation and amortization. Depreciation of furniture and fixtures and computer and communications equipment are amortized using the straight-line method over the estimated useful life of the asset.
Treasury Stock
The Company holds repurchased shares of common stock as treasury stock. The Company accounts for treasury stock under the cost method and includes treasury stock as a component of shareholders’ equity.
In accordance with ASC Subtopic 505-10, “Equity,” the Company accounts for the capped accelerated share repurchase (“ASR”) agreements into which it enters as two separate transactions: (a) as shares of common stock acquired in a treasury stock transaction recorded on the acquisition date of the shares and (b) as a forward contract indexed to the Company’s own common stock. As such, the Company accounts for the shares that it receives under capped ASR agreements during the period as a repurchase of its common stock for the purpose of calculating earnings per common share. The Company has determined that the forward contracts indexed to the Company’s common stock meet all the applicable criteria for equity classification in accordance with ASC Subtopic 815-10 and, therefore, the capped ASR agreements are not accounted for as derivative instruments.
Allowance for Doubtful Accounts
The Company primarily licenses its products and services to institutional investors mainly in the United States, Europe and Asia (primarily Hong Kong and Japan). The Company periodically reviews receivable balances and maintains an allowance on customer accounts where estimated losses may result from the inability of its customers to make required payments. The Company does not require collateral.
F-13
An allowance for doubtful accounts is recorded when it is probable and estimable that a receivable will not be collected. Changes in the allowance for doubtful accounts from December 31, 2013 to December 31, 2016 were as follows:
|
|
|
Amount |
|
|
|
|
|
(in thousands) |
|
|
|
Balance as of December 31, 2013 |
|
$ |
1,280 |
|
|
Addition to provision |
|
|
452 |
|
|
Amounts written off, net of recoveries |
|
|
(875 |
) |
|
Balance as of December 31, 2014 |
|
$ |
857 |
|
|
Addition to provision |
|
|
940 |
|
|
Amounts written off, net of recoveries |
|
|
(680 |
) |
|
Balance as of December 31, 2015 |
|
$ |
1,117 |
|
|
Addition to provision |
|
|
1,011 |
|
|
Amounts written off, net of recoveries |
|
|
(1,093 |
) |
|
Balance as of December 31, 2016 |
|
$ |
1,035 |
|
Accrued Compensation
The Company makes significant estimates in determining its accrued non-stock based compensation and benefits expenses. A significant portion of the Company’s employee incentive compensation programs are discretionary. Each year end, the Company determines the amount of discretionary cash bonus expense. These estimates reflect an assessment of performance versus targets and other key performance indicators at the Company, segment and employee level. The Company also reviews compensation and benefits expenses throughout the year to determine how overall performance compares to management’s expectations. These and other factors, including historical performance, are taken into account in accruing discretionary cash compensation estimates quarterly.
Concentrations
For the year ended December 31, 2016, no single customer accounted for 10.0% or more of the Company’s consolidated operating revenues. For the years ended December 31, 2015 and 2014, BlackRock, Inc. accounted for 10.3% and 10.6%, respectively, of the Company’s consolidated operating revenues. For the years ended December 31, 2016, 2015 and 2014, BlackRock, Inc. accounted for 17.3%, 19.2% and 20.1%, respectively, of the Index segment’s operating revenues. No single customer accounted for 10.0% or more of revenues within the Analytics and All Other segments for the years ended December 31, 2016, 2015 and 2014.
2. RECENT ACCOUNTING STANDARDS UPDATES
In May 2014, the FASB issued Accounting Standards Update (“ASU”) 2014-09,“Revenue from Contracts with Customers (Topic 606),” or ASU 2014-09. The objective of ASU 2014-09 is to establish a single comprehensive model for entities to use in accounting for revenue arising from contracts with customers and will supersede most of the existing revenue recognition guidance, including industry-specific guidance. The core principle of ASU 2014-09 is that an entity recognizes revenue to depict the transfer of promised goods or services to customers in an amount that reflects the consideration to which the entity expects to be entitled in exchange for those goods or services. Entities have the option of adopting ASU 2014-09 retrospectively to each prior period presented, or retrospectively with a cumulative-effect adjustment recognized as of the date of initial application. In August 2015, the FASB issued ASU 2015-14, “Deferral of the Effective Date,” which defers the effective date of ASU 2014-09 by one year by changing the effective date to be for annual reporting periods, including interim periods within those periods, beginning after December 15, 2017 from December 15, 2016, with early adoption at the prior date permitted.
In March 2016, the FASB issued ASU 2016-08, “Principal Versus Agent Considerations (Reporting Revenue Gross Versus Net).” In April 2016, the FASB issued ASU 2016-10, “Identifying Performance Obligations and Licensing.” In May 2016, the FASB issued ASU 2016-12, “Narrow-Scope Improvements and Practical
F-14
Expedients.” In December 2016, the FASB issued Accounting Standards Update No. 2016-20, “Technical Corrections and Improvements to Topic 606, Revenue from Contracts with Customers.” These updates provide supplemental adoption guidance and clarification to ASU 2014-09 and must be adopted concurrently. The Company is currently evaluating the overall impact and the method of adoption of ASU 2014-09, including the latest developments from the Transition Resources Group. Areas most likely impacted may include, but not be limited to, the following: the timing of revenue recognition and costs for implementation services; the timing of revenue recognition of licenses for desktop applications; and the accounting for contract modifications. In addition, the new standard may require certain amounts in accounts receivable and deferred revenues to be netted on the balance sheet and enhanced disclosures around performance obligations. The Company’s final determination of the adoption methodology will depend on a number of factors, such as the significance of the impact of the new standard on the financial results, system readiness and the ability to accumulate and analyze the information necessary to assess the impact on prior period financial statements and new disclosure requirements. The Company does not currently know or cannot reasonably estimate quantitative information related to the impact of the new standard on its consolidated financial statements.
In August 2014, the FASB issued Accounting Standards Update No. 2014-15, “Presentation of Financial Statements: Going Concern (Subtopic 205-40),” or ASU 2014-15. The amendments in ASU 2014-15 provide guidance about management’s responsibility to evaluate whether there is substantial doubt about an entity’s ability to continue as a going concern and to provide related footnote disclosures. The guidance is effective for annual reporting periods ending after December 15, 2016, and early adoption is permitted. The Company adopted this guidance for the year ended December 31, 2016. The adoption of this guidance did not impact the Company’s consolidated financial statements.
In February 2016, the FASB issued Accounting Standards Update No. 2016-02, “Leases (Topic 842),” or ASU 2016-02. The FASB issued ASU 2016-02 in order to increase the transparency and comparability among organizations by recognizing lease assets and liabilities on the balance sheet and disclosing key information about leasing arrangements. To meet that objective, the FASB amended the FASB Accounting Standards Codification and created Topic 842, Leases. ASU 2016-02 is effective for annual reporting periods, including interim periods within those periods, beginning after December 15, 2018, with early adoption permitted. ASU 2016-02 requires reporting organizations to take a modified retrospective transition approach (as opposed to a full retrospective transition approach). The Company is evaluating the potential impact that ASU 2016-02 will have on its consolidated financial statements.
In March 2016, the FASB issued Accounting Standards Update No. 2016-09, “Compensation-Stock Compensation (Topic 718): Improvements to Employee Share-Based Payment Accounting,” or ASU 2016-09. The FASB issued ASU 2016-09 as part of its Simplification Initiative. The areas for simplification in ASU 2016-09 involve several aspects of the accounting for share-based payment transactions, including the income tax consequences, classification of awards as either equity or liabilities and classification on the statement of cash flows. ASU 2016-09 is effective for annual reporting periods, including interim periods within those periods, beginning after December 15, 2016, with early adoption permitted. The adoption of ASU 2016-09 will impact the provision for income tax expense on the Company’s Consolidated Statement of Income in relation to excess tax benefits and tax shortfalls from stock-based compensation that will be recognized in income tax expense as discrete items in the reporting period in which they occur on a prospective basis. Prior to adoption, the impact was recorded as an item in “additional paid in capital” on the Company’s Consolidated Statement of Financial Condition. Also following the adoption of ASU 2016-09, excess tax benefits and shortfalls will no longer be reported as a reclassification from cash flows from operating activities into cash flows from financing activities in the Company’s Consolidated Statement of Cash Flows. This change will be applied on a retrospective basis.
In June 2016, the FASB issued Accounting Standards Update No. 2016-13, “Financial Instruments-Credit Losses (Topic 326): Measurement of Credit Losses on Financial Instruments,” or ASU 2016-13. The amendments in ASU 2016-13 introduce an approach based on expected losses to estimate credit losses on certain types of financial instruments, modifies the impairment model for available-for-sale debt securities and provides for a simplified accounting model for purchased financial assets with credit deterioration since their origination. ASU 2016-13 is effective for annual reporting periods, including interim periods within those periods, beginning after December 15, 2019, with early adoption permitted beginning after December 15, 2018. The adoption of ASU 2016-13 is not expected to have a material effect on the Company’s consolidated financial statements.
F-15
In August 2016, the FASB issued Accounting Standards Update No. 2016-15, “Statement of Cash Flows (Topic 230): Classification of Certain Cash Receipts and Cash Payments,” or ASU 2016-15. The amendments in ASU 2016-15 are intended to reduce diversity in practice in how certain transactions are classified in the statement of cash flows. ASU 2016-15 is effective for annual reporting periods, including interim periods within those periods, beginning after December 15, 2017, with early adoption permitted. The adoption of ASU 2016-15 is not expected to have a material effect on the Company’s consolidated financial statements.
In November 2016, the FASB issued Accounting Standards Update No. 2016-18, “Statement of Cash Flows (Topic 230): Restricted Cash,” or ASU 2016-18. The amendments in ASU 2016-18 are intended to reduce diversity in practice related to the classification and presentation of changes in restricted or restricted cash equivalents on the statement of cash flows. The amendments in ASU No. 2016-18 require that amounts generally described as restricted cash and restricted cash equivalents be included with cash and cash equivalents when reconciling the beginning-of-period and end-of-period total amounts shown on the statement of cash flows. ASU 2016-18 is effective for annual reporting periods, including interim periods within those periods, beginning after December 15, 2017, with early adoption permitted. The adoption of ASU 2016-18 is not expected to have a material effect on the Company’s consolidated financial statements.
In January 2017, the FASB issued Accounting Standards Update No. 2017-01, “Business Combinations (Topic 805): Clarifying the Definition of a Business,” or ASU 2017-01. The amendments in ASU 2017-01 provide a screen to assist entities with evaluating whether transactions should be accounted for as acquisitions or disposals of assets or businesses. Under ASU 2017-01, an entity first determines whether substantially all of the fair value of the gross assets acquired is concentrated in a single identifiable asset or a group of similar identifiable assets. If this threshold is met, the set is not a business. If it’s not met, the entity then evaluates whether the set meets the requirement that a business include, at a minimum, an input and a substantive process that together significantly contribute to the ability to create outputs. ASU 2017-01 also narrows the definition of outputs by more closely aligning it with how outputs are described in ASC 606. ASU 2017-01 is effective for annual reporting periods, including interim periods within those periods, beginning after December 15, 2017, with early adoption permitted. The adoption of ASU 2017-01 is not expected to have a material effect on the Company’s consolidated financial statements.
In January 2017, the FASB issued Accounting Standards Update No. 2017-04, “Intangibles-Goodwill and Other (Topic 350): Simplifying the Test for Goodwill Impairment,” or ASU 2017-04. The amendments in ASU 2017-04 simplify the subsequent measurement of goodwill by eliminating Step 2 from the goodwill impairment test. In computing the implied fair value of goodwill under Step 2, an entity had to perform procedures to determine the fair value at the impairment testing date of its assets and liabilities. Instead, under the amendments in ASU 2017-04, an entity performs its annual, or interim, goodwill impairment test by comparing the fair value of a reporting unit with its carrying amount and recognizes an impairment charge for the amount by which the carrying amount exceeds the reporting unit’s fair value, but not more than the total amount of goodwill allocated to the reporting unit. ASU 2017-04 is effective for annual reporting periods, including interim periods within those periods, beginning after December 15, 2019, with early adoption permitted. The adoption of ASU 2017-04 is not expected to have a material effect on the Company’s consolidated financial statements.
Basic earnings per share (“EPS”) is computed by dividing income available to MSCI common shareholders by the weighted average number of common shares outstanding during the period. Common shares outstanding include common stock and vested restricted stock unit awards where recipients have satisfied either the explicit vesting terms or retirement-eligible requirements. Diluted EPS reflects the assumed conversion of all dilutive securities. There were 398, 3,778 and 78,260, anti-dilutive securities excluded from the calculation of diluted EPS for the years ended December 31, 2016, 2015 and 2014, respectively, because of their anti-dilutive effect.
F-16
The Company computes EPS using the two-class method and determines whether instruments granted in share-based payment transactions are participating securities. The following table presents the computation of basic and diluted EPS:
|
|
|
Years Ended |
|
|||||||||
|
|
|
December 31, |
|
|
December 31, |
|
|
December 31, |
|
|||
|
|
|
2016 |
|
|
2015 |
|
|
2014 |
|
|||
|
(in thousands, except per share data) |
|
|
|
|
|
|
|
|
|
|
|
|
|
Income from continuing operations, net of income taxes |
|
$ |
260,855 |
|
|
$ |
230,038 |
|
|
$ |
198,942 |
|
|
Income (loss) from discontinued operations, net of income taxes |
|
|
— |
|
|
|
(6,390 |
) |
|
|
85,171 |
|
|
Net income |
|
$ |
260,855 |
|
|
$ |
223,648 |
|
|
$ |
284,113 |
|
|
Less: Allocations of earnings to unvested restricted stock units (1) |
|
|
— |
|
|
|
— |
|
|
$ |
(368 |
) |
|
Earnings available to MSCI common shareholders |
|
$ |
260,855 |
|
|
$ |
223,648 |
|
|
$ |
283,745 |
|
|
Basic weighted average common shares outstanding |
|
|
95,986 |
|
|
|
109,124 |
|
|
|
115,737 |
|
|
Effect of dilutive securities: |
|
|
|
|
|
|
|
|
|
|
|
|
|
Stock options and restricted stock units |
|
|
554 |
|
|
|
802 |
|
|
|
969 |
|
|
Diluted weighted average common shares outstanding |
|
|
96,540 |
|
|
|
109,926 |
|
|
|
116,706 |
|
|
Earnings per basic common share from continuing operations |
|
$ |
2.72 |
|
|
$ |
2.11 |
|
|
$ |
1.72 |
|
|
Earnings per basic common share from discontinued operations |
|
|
— |
|
|
|
(0.06 |
) |
|
|
0.73 |
|
|
Earnings per basic common share |
|
$ |
2.72 |
|
|
$ |
2.05 |
|
|
$ |
2.45 |
|
|
Earnings per diluted common share from continuing operations |
|
$ |
2.70 |
|
|
$ |
2.09 |
|
|
$ |
1.70 |
|
|
Earnings per diluted common share from discontinued operations |
|
|
— |
|
|
|
(0.06 |
) |
|
|
0.73 |
|
|
Earnings per diluted common share |
|
$ |
2.70 |
|
|
$ |
2.03 |
|
|
$ |
2.43 |
|
|
(1) |
Restricted stock units granted to employees prior to 2013 and restricted stock units granted to independent directors of the Company prior to April 30, 2015 had a right to participate in all of the earnings of the Company in the computation of basic EPS and, therefore, these restricted stock units were not included as incremental shares in the diluted EPS computation. |
4. COMMITMENTS AND CONTINGENCIES
Legal matters. From time to time, the Company is party to various litigation matters incidental to the conduct of its business. The Company is not presently party to any legal proceedings the resolution of which the Company believes would have a material effect on its business, operating results, financial condition or cash flows.
Leases. The Company leases facilities under non-cancelable operating lease agreements. The terms of certain lease agreements provide for rental payments on a graduated basis. The Company recognizes rent expense on the straight-line basis over the lease period and has accrued for rent expense incurred but not paid. Rent expense for the years ended December 31, 2016, 2015 and 2014 was $24.2 million, $26.5 million and $27.0 million, respectively.
F-17
Future minimum commitments for the Company’s operating leases in place as of December 31, 2016 are as follows:
|
Years Ending December 31, |
|
Amount |
|
|
|
|
|
(in thousands) |
|
|
|
2017 |
|
$ |
27,869 |
|
|
2018 |
|
|
27,429 |
|
|
2019 |
|
|
22,559 |
|
|
2020 |
|
|
19,237 |
|
|
2021 |
|
|
17,413 |
|
|
Thereafter |
|
|
131,815 |
|
|
Total |
|
$ |
246,322 |
|
Senior Notes. The Company has issued an aggregate of $2.1 billion in senior unsecured notes (collectively, the “Senior Notes”) in the three discrete private offerings described below.
On November 20, 2014, the Company completed its private offering of $800.0 million aggregate principal amount of 5.25% senior unsecured notes due 2024 (the “2024 Senior Notes”). The Company used the net proceeds from the offering of the 2024 Senior Notes, together with cash on hand, to repay in full its then outstanding term loan indebtedness of $794.8 million.
On August 13, 2015, the Company completed its private offering of $800.0 million aggregate principal amount of 5.75% senior unsecured notes due 2025 (the “2025 Senior Notes”). The $789.5 million of net proceeds from the offering of the 2025 Senior Notes were allocated for general corporate purposes.
On August 4, 2016, the Company completed its private offering of $500.0 million aggregate principal amount of 4.75% senior unsecured notes due 2026 (the “2026 Senior Notes”). The $493.3 million of net proceeds from the offering of the 2026 Senior Notes were allocated for general corporate purposes, including, without limitation, buybacks of its common stock and potential acquisitions.
The 2024 Senior Notes are scheduled to mature and be paid in full on November 15, 2024. At any time prior to November 15, 2019, the Company may redeem all or part of the 2024 Senior Notes upon not less than 30 nor more than 60 days’ prior notice at a redemption price equal to the sum of (i) 100% of the principal amount thereof, plus (ii) a make-whole premium as of the date of redemption, plus (iii) accrued and unpaid interest and additional interest, if any, thereon, to the date of redemption. In addition, the Company may redeem all or part of the 2024 Senior Notes, together with accrued and unpaid interest, on or after November 15, 2019, at redemption prices set forth in the indenture governing the 2024 Senior Notes. At any time prior to November 15, 2017, the Company may use the proceeds of certain equity offerings to redeem up to 35% of the aggregate principal amount of the 2024 Senior Notes, including any permitted additional notes, at a redemption price equal to 105.25% of the principal amount.
The 2025 Senior Notes are scheduled to mature and be paid in full on August 15, 2025. At any time prior to August 15, 2020, the Company may redeem all or part of the 2025 Senior Notes upon not less than 30 nor more than 60 days’ prior notice at a redemption price equal to the sum of (i) 100% of the principal amount thereof, plus (ii) a make-whole premium as of the date of redemption, plus (iii) accrued and unpaid interest and additional interest, if any, thereon, to the date of redemption. In addition, the Company may redeem all or part of the 2025 Senior Notes, together with accrued and unpaid interest, on or after August 15, 2020, at redemption prices set forth in the indenture governing the 2025 Senior Notes. At any time prior to August 15, 2018, the Company may use the proceeds of certain equity offerings to redeem up to 35% of the aggregate principal amount of the 2025 Senior Notes, including any permitted additional notes, at a redemption price equal to 105.75% of the principal amount.
F-18
The 2026 Senior Notes are scheduled to mature and be paid in full on August 1, 2026. At any time prior to August 1, 2021, the Company may redeem all or part of the 2026 Senior Notes upon not less than 30 nor more than 60 days’ prior notice at a redemption price equal to the sum of (i) 100% of the principal amount thereof, plus (ii) a make-whole premium as of the date of redemption, plus (iii) accrued and unpaid interest and additional interest, if any, thereon, to the date of redemption. In addition, the Company may redeem all or part of the 2026 Senior Notes, together with accrued and unpaid interest, on or after August 1, 2021, at redemption prices set forth in the indenture governing the 2026 Senior Notes. At any time prior to August 1, 2019, the Company may use the proceeds of certain equity offerings to redeem up to 35% of the aggregate principal amount of the 2026 Senior Notes, including any permitted additional notes, at a redemption price equal to 104.75% of the principal amount.
Interest payments attributable to the 2024 Senior Notes are due on May 15 and November 15 of each year. The first interest payment was made on May 15, 2015. Interest payments attributable to the 2025 Senior Notes are due on February 15 and August 15 of each year. The first interest payment was made on February 16, 2016. Interest payments attributable to the 2026 Senior Notes are due on February 1 and August 1 of each year. The first interest payment was made on February 1, 2017.
Revolver. On November 20, 2014, the Company entered into a $200.0 million senior unsecured revolving credit agreement (the “2014 Revolving Credit Agreement”) with a syndicate of banks. The 2014 Revolving Credit Agreement had an initial term of five years with an option to extend for two additional one-year terms. On August 4, 2016, the Company entered into Amendment No. 1 (the “Amendment”) to the 2014 Revolving Credit Agreement (the 2014 Revolving Credit Agreement as so amended, the “Revolving Credit Agreement”). The Amendment, among other things, (i) increased aggregate commitments available to be borrowed to $220.0 million, (ii) increased the maximum consolidated leverage ratio and (iii) extended the initial term to August 2021 with an option to extended for an additional one-year term. At December 31, 2016, the Revolving Credit Agreement was undrawn.
Long-term debt at December 31, 2016 was $2,075.2 million, net of $24.8 million in deferred financing fees. Long-term debt at December 31, 2015 was $1,579.4 million, net of $20.6 million in deferred financing fees.
In connection with the closings of the Senior Notes offerings and entering into the 2014 Revolving Credit Agreement and the Amendment, the Company paid certain fees which, together with the existing fees related to prior credit facilities, are being amortized over the related lives. At December 31, 2016, $27.1 million of the deferred financing fees remain unamortized, $0.5 million of which is included in “Prepaid and other assets,” $1.8 million of which is included in “Other non-current assets” and $24.8 million of which is grouped and presented as part of “Long-term debt” on the Consolidated Statement of Financial Condition.
During the years ended December 31, 2016, 2015 and 2014, the Company amortized $3.1 million, $2.1 million, and $7.7 million of deferred financing fees in interest expense, respectively. There was no unamortized debt discount outstanding as of December 31, 2016, 2015 and 2014. Approximately $2.2 million of debt discount was amortized in interest expense during the year ended December 31, 2014.
At December 31, 2016 and 2015, the fair market value of the Company’s debt obligations was $2,192.5 million and $1,638.0 million, respectively. The fair market value is determined in accordance with accounting standards related to the determination of fair value and represents Level 2 valuations, which are based on one or more quoted prices in markets that are not considered to be active or for which all significant inputs are observable, either directly or indirectly. The Company utilizes the market approach and obtains security pricing from a vendor who uses broker quotes and third-party pricing services to determine fair values.
F-19
Derivatives and Hedging Activities. The Company is exposed to certain risks arising from both its business operations and economic conditions. The Company principally manages its exposures to a wide variety of business and operational risks through management of its core business activities. The Company manages economic risks, including interest rate, liquidity and credit risk primarily by managing the amount, sources, and duration of its debt funding and the use of derivative financial instruments. Specifically, the Company had previously entered into derivative financial instruments to manage exposures that arose from business activities that result in the receipt or payment of future known and uncertain cash amounts, the value of which are determined by interest rates, and may do so again in the future. The Company’s derivative financial instruments were used to manage differences in the amount, timing and duration of the Company’s known or expected cash payments principally related to the Company’s borrowings. For the year ended December 31, 2016, the Company was not party to any interest rate swaps.
Certain of the Company’s foreign operations expose the Company to fluctuations of foreign exchange rates. These fluctuations may impact the value of the Company’s cash receipts and payments in terms of the Company’s functional currency, the U.S. dollar. The Company enters into derivative financial instruments to protect the value or fix the amount of certain obligations in terms of its functional currency.
Non-designated Hedges of Foreign Exchange Risk. Derivatives not designated as hedges are not speculative and are used to manage the Company’s economic exposure to foreign exchange rate movements but do not meet the strict hedge accounting requirements. Changes in the fair value of derivatives not designated in hedging relationships are recorded directly in earnings. As of December 31, 2016, the Company had outstanding foreign currency forwards with a notional amount of $25.5 million that were not designated as hedges in qualifying hedging relationships.
The following table presents the fair values of the Company’s derivative instruments and the location in which they are presented on the Company’s Consolidated Statements of Financial Condition:
|
|
|
|
|
As of |
|
|||||
|
|
|
Consolidated Statements of |
|
December 31, |
|
|
December 31, |
|
||
|
(in thousands) |
|
Financial Condition Location |
|
2016 |
|
|
2015 |
|
||
|
Non-designated hedging instruments: |
|
|
|
|
|
|
|
|
|
|
|
Asset derivatives: |
|
|
|
|
|
|
|
|
|
|
|
Foreign exchange contracts |
|
Prepaid and other assets |
|
$ |
27 |
|
|
$ |
640 |
|
|
Liability derivatives: |
|
|
|
|
|
|
|
|
|
|
|
Foreign exchange contracts |
|
Other accrued liabilities |
|
$ |
(124 |
) |
|
$ |
(2 |
) |
The following tables present the effect of the Company’s financial derivatives and the location in which they are presented on the Company’s Consolidated Statements of Financial Condition and Consolidated Statements of Income:
|
|
|
|
|
Amount of Gain or (Loss) Recognized |
|
|||||||||
|
|
|
|
|
in Income on Derivatives for the |
|
|||||||||
|
Derivatives Not Designated as |
|
Location of Gain or |
|
Years Ended |
|
|||||||||
|
Hedging Instruments |
|
(Loss) Recognized |
|
December 31, |
|
|
December 31, |
|
|
December 31, |
|
|||
|
(in thousands) |
|
in Income on Derivatives |
|
2016 |
|
|
2015 |
|
|
2014 |
|
|||
|
Foreign exchange contracts |
|
Other expense (income) |
|
$ |
1,566 |
|
|
$ |
366 |
|
|
$ |
(834 |
) |
Gain on sale of investment
During the year ended December 31, 2015, MSCI sold an investment accounted for under the cost method and recognized a $6.3 million gain which is included within the “Other expense (income), net” in the Consolidated Statements of Income.
F-20
5. PROPERTY, EQUIPMENT AND LEASEHOLD IMPROVEMENTS
Property, equipment and leasehold improvements at December 31, 2016 and 2015 consisted of the following:
|
|
|
|
|
As of |
|
|||||
|
|
|
Estimated |
|
December 31, |
|
|
December 31, |
|
||
|
|
|
Useful Lives |
|
2016 |
|
|
2015 |
|
||
|
|
|
|
|
(in thousands) |
|
|||||
|
Computer & related equipment |
|
2 to 5 years |
|
$ |
162,306 |
|
|
$ |
143,499 |
|
|
Furniture & fixtures |
|
7 years |
|
|
9,724 |
|
|
|
9,870 |
|
|
Leasehold improvements |
|
1 to 21 years |
|
|
49,442 |
|
|
|
47,579 |
|
|
Work-in-process |
|
— |
|
|
10,954 |
|
|
|
12,658 |
|
|
Subtotal |
|
|
|
|
232,426 |
|
|
|
213,606 |
|
|
Accumulated depreciation and amortization |
|
|
|
|
(136,841 |
) |
|
|
(114,680 |
) |
|
Property, equipment and leasehold improvements, net |
|
|
|
$ |
95,585 |
|
|
$ |
98,926 |
|
Depreciation and amortization expense of property, equipment and leasehold improvements was $34.3 million, $30.9 million and $25.7 million for the years ended December 31, 2016, 2015 and 2014, respectively.
6. GOODWILL AND INTANGIBLE ASSETS
Goodwill.
The change to the Company’s goodwill was as follows:
|
(in thousands) |
|
Index |
|
|
Analytics |
|
|
All Other |
|
|
Total |
|
|
||||
|
Goodwill at December 31, 2014 (1) |
|
|
|
|
|
|
|
|
|
|
|
|
|
$ |
1,564,904 |
|
|
|
Changes to goodwill |
|
|
|
|
|
|
|
|
|
|
|
|
|
|
4,202 |
|
(2) |
|
Foreign exchange translation adjustment |
|
|
|
|
|
|
|
|
|
|
|
|
|
|
(3,485 |
) |
|
|
Goodwill at December 31, 2015 |
|
$ |
1,208,454 |
|
|
$ |
302,551 |
|
|
$ |
54,616 |
|
|
$ |
1,565,621 |
|
|
|
Changes to goodwill |
|
|
— |
|
|
|
60 |
|
(3) |
|
(110 |
) |
(4) |
|
(50 |
) |
|
|
Foreign exchange translation adjustment |
|
|
(6,006 |
) |
|
|
— |
|
|
|
(3,715 |
) |
|
|
(9,721 |
) |
|
|
Goodwill at December 31, 2016 |
|
$ |
1,202,448 |
|
|
$ |
302,611 |
|
|
$ |
50,791 |
|
|
$ |
1,555,850 |
|
|
|
(1) |
The Company changed its reportable segments during the year ended December 31, 2015. Simultaneously, segment reporting and goodwill reporting units were updated in connection with the change. The Company reallocated its goodwill to its reporting units using a relative fair value allocation approach. |
|
(2) |
Reflects the addition of $4.2 million of goodwill associated with the acquisition of Insignis, Inc. (“Insignis”) See Note 11, “Acquisitions,” for additional information. |
|
(3) |
Reflects the final working capital adjustment payment made during the year ended December 31, 2016 to complete the acquisition of Insignis. |
|
(4) |
Reflects the value disposed in the sale of the Real Estate occupiers business. |
Through the year ended December 31, 2016, the Company has never recognized an impairment of goodwill on its consolidated financial statements.
Intangible Assets.
Amortization expense related to intangible assets for the years ended December 31, 2016, 2015 and 2014, was $47.0 million, $46.9 million and $45.9 million, respectively.
F-21
The gross carrying and accumulated amortization amounts related to the Company’s identifiable intangible assets were as follows:
|
|
|
|
|
As of |
|
|||||
|
|
|
Estimated |
|
December 31, |
|
|
December 31, |
|
||
|
|
|
Useful Lives |
|
2016 |
|
|
2015 |
|
||
|
|
|
|
|
(in thousands) |
|
|||||
|
Gross intangible assets: |
|
|
|
|
|
|
|
|
|
|
|
Customer relationships |
|
5 to 21 years |
|
$ |
361,199 |
|
|
$ |
361,746 |
|
|
Trademarks/trade names |
|
5 to 21.5 years |
|
|
223,382 |
|
|
|
223,382 |
|
|
Technology/software |
|
3 to 8.5 years |
|
|
210,013 |
|
|
|
199,889 |
|
|
Proprietary data |
|
13 years |
|
|
28,627 |
|
|
|
28,627 |
|
|
Covenant not to compete |
|
2 years |
|
|
1,225 |
|
|
|
1,225 |
|
|
Subtotal |
|
|
|
|
824,446 |
|
|
|
814,869 |
|
|
Foreign exchange translation adjustment |
|
|
|
|
(13,946 |
) |
|
|
(4,867 |
) |
|
Total gross intangible assets |
|
|
|
$ |
810,500 |
|
|
$ |
810,002 |
|
|
Accumulated amortization: |
|
|
|
|
|
|
|
|
|
|
|
Customer relationships |
|
|
|
$ |
(166,923 |
) |
|
$ |
(143,325 |
) |
|
Trademarks/trade names |
|
|
|
|
(105,077 |
) |
|
|
(93,476 |
) |
|
Technology/software |
|
|
|
|
(184,290 |
) |
|
|
(175,209 |
) |
|
Proprietary data |
|
|
|
|
(8,571 |
) |
|
|
(6,698 |
) |
|
Covenant not to compete |
|
|
|
|
(1,089 |
) |
|
|
(665 |
) |
|
Subtotal |
|
|
|
|
(465,950 |
) |
|
|
(419,373 |
) |
|
Foreign exchange translation adjustment |
|
|
|
|
3,090 |
|
|
|
861 |
|
|
Total accumulated amortization |
|
|
|
$ |
(462,860 |
) |
|
$ |
(418,512 |
) |
|
Net intangible assets: |
|
|
|
|
|
|
|
|
|
|
|
Customer relationships |
|
|
|
$ |
194,276 |
|
|
$ |
218,421 |
|
|
Trademarks/trade names |
|
|
|
|
118,305 |
|
|
|
129,906 |
|
|
Technology/software |
|
|
|
|
25,723 |
|
|
|
24,680 |
|
|
Proprietary data |
|
|
|
|
20,056 |
|
|
|
21,929 |
|
|
Covenant not to compete |
|
|
|
|
136 |
|
|
|
560 |
|
|
Subtotal |
|
|
|
|
358,496 |
|
|
|
395,496 |
|
|
Foreign exchange translation adjustment |
|
|
|
|
(10,856 |
) |
|
|
(4,006 |
) |
|
Total net intangible assets |
|
|
|
$ |
347,640 |
|
|
$ |
391,490 |
|
Estimated amortization expense for succeeding years is presented below:
|
Years Ending December 31, |
|
Amortization Expense |
|
|
|
|
|
(in thousands) |
|
|
|
2017 |
|
$ |
44,123 |
|
|
2018 |
|
|
41,562 |
|
|
2019 |
|
|
39,594 |
|
|
2020 |
|
|
37,196 |
|
|
2021 |
|
|
35,846 |
|
|
Thereafter |
|
|
149,319 |
|
|
Total |
|
$ |
347,640 |
|
7. EMPLOYEE BENEFITS
The Company sponsors a 401(k) plan for eligible U.S. employees and defined contribution and defined benefit pension plans that cover substantially all of its non-U.S. employees. For the years ended December 31, 2016, 2015 and 2014, costs relating to 401(k), pension and post-retirement benefit expenses were $21.6 million, $23.1 million and $22.2 million, respectively. Amounts included in cost of revenues for the years ended December 31, 2016, 2015
F-22
and 2014 were $9.5 million, $10.7 million and $9.9 million, respectively. Amounts included in selling and marketing for the years ended December 31, 2016, 2015 and 2014 were $6.7 million, $6.8 million and $7.2 million, respectively. Amounts included in research and development for the years ended December 31, 2016, 2015 and 2014 were $4.0 million, $4.0 million and $3.7 million, respectively. Amounts included in general and administrative for the years ended December 31, 2016, 2015 and 2014 were $1.3 million, $1.6 million and $1.3 million, respectively.
401(k) and Other Defined Contribution Plans. Eligible employees may participate in the MSCI 401(k) plan (or any other regional defined contribution plan sponsored by MSCI) immediately upon hire. Eligible employees receive 401(k) and other defined contribution plan matching contributions, which are subject to vesting and certain other limitations. The Company’s expenses associated with the 401(k) plan and other defined contribution plans for the years ended December 31, 2016, 2015 and 2014 were $17.6 million, $18.4 million and $19.3 million, respectively.
Net Periodic Benefit Expense. Net periodic benefit expense incurred by the Company related to defined benefit pension plans was $4.0 million, $4.7 million and $2.8 million for the years ended December 31, 2016, 2015 and 2014, respectively.
The Company uses a measurement date of December 31 to calculate obligations under its pension and postretirement plans. As of December 31, 2016 and 2015, the Company carried an $18.4 million and $17.1 million, respectively, net liability in other non-current liabilities on its Consolidated Statement of Financial Condition related to its future pension obligations. The fair value of the defined benefit plan assets were $17.5 million and $16.4 million at December 31, 2016 and 2015, respectively.
8. SHAREHOLDERS’ EQUITY
This note reflects the share repurchases and related activity as well as share-based compensation activity recognized by the Company, including the amounts recognized in both continuing operations and discontinued operations for all periods referenced.
Return of capital. On February 4, 2014, the Board of Directors approved a stock repurchase program authorizing the purchase of up to $300.0 million worth of shares of MSCI’s common stock, which was increased to $850.0 million on September 17, 2014 (the “2014 Repurchase Program”). On October 14, 2015, the Company exhausted the $850.0 million share repurchase authorization under the 2014 Repurchase Program.
On September 18, 2014, as part of the 2014 Repurchase Program, the Company entered into an ASR agreement to initiate share repurchases aggregating $300.0 million (the “September 2014 ASR Agreement”). As a result of the September 2014 ASR Agreement, the Company received approximately 4.5 million shares of MSCI’s common stock on September 19, 2014 and received approximately 1.2 million shares of MSCI’s common stock on May 21, 2015 for a combined average price of $52.79 per share.
On June 2, 2015, the Company began purchasing shares of its common stock in the open market in accordance with SEC Rule 10b5-1.
During October 2015, the Company completed the $850.0 million repurchase authorization under the 2014 Repurchase Program.
On October 28, 2015, the Board of Directors approved a new stock repurchase program authorizing the purchase of up to $1.0 billion worth of shares of MSCI’s common stock (the “2015 Repurchase Program”).
On October 26, 2016, the Board of Directors approved an additional stock repurchase program authorizing the purchase of up to $750.0 million worth of shares of our common stock (together with the $330.3 million remaining authorization under the 2015 Repurchase Program, the “2016 Repurchase Program”). Share repurchases made pursuant to the 2016 Repurchase Program may take place in the open market or in privately negotiated
F-23
transactions from time to time based on market and other conditions. This authorization may be modified, suspended or terminated by the Board of Directors at any time without prior notice.
The following table provides information with respect to repurchases of the Company’s common stock pursuant to open market repurchases:
|
Year Ended |
|
Average Price Paid Per Share |
|
|
Total Number of Shares Repurchased |
|
|
Dollar Value of Shares Repurchased |
|
|||
|
|
|
|
|
|
|
(in thousands) |
|
|||||
|
December 31, 2014 |
|
$ |
— |
|
|
|
— |
|
|
$ |
— |
|
|
December 31, 2015 |
|
$ |
62.63 |
|
|
|
10,710 |
|
|
$ |
670,824 |
|
|
December 31, 2016 |
|
$ |
73.71 |
|
|
|
10,303 |
|
|
$ |
759,427 |
|
The following table presents cash dividends declared and distributed per common share for the periods indicated:
|
|
|
Dividends |
|
|||||||||||||
|
|
|
Per Share |
|
|
Declared |
|
|
Distributed |
|
|
Deferred |
|
||||
|
2016 |
|
|
|
|
|
(in thousands) |
|
|||||||||
|
Three Months Ended March 31, |
|
$ |
0.22 |
|
|
$ |
22,046 |
|
|
$ |
21,889 |
|
|
$ |
157 |
|
|
Three Months Ended June 30, |
|
|
0.22 |
|
|
|
21,588 |
|
|
|
21,391 |
|
|
|
197 |
|
|
Three Months Ended September 30, |
|
|
0.28 |
|
|
|
26,936 |
|
|
|
26,680 |
|
|
|
256 |
|
|
Three Months Ended December 31, |
|
|
0.28 |
|
|
|
26,524 |
|
|
|
26,304 |
|
|
|
220 |
|
|
Total |
|
$ |
1.00 |
|
|
$ |
97,094 |
|
|
$ |
96,264 |
|
|
$ |
830 |
|
|
2015 |
|
|
|
|
|
|
|
|
|
|
|
|
|
|
|
|
|
Three Months Ended March 31, |
|
$ |
0.18 |
|
|
$ |
20,424 |
|
|
$ |
20,411 |
|
|
$ |
13 |
|
|
Three Months Ended June 30, |
|
|
0.18 |
|
|
|
20,444 |
|
|
|
20,442 |
|
|
|
2 |
|
|
Three Months Ended September 30, |
|
|
0.22 |
|
|
|
24,210 |
|
|
|
24,152 |
|
|
|
58 |
|
|
Three Months Ended December 31, |
|
|
0.22 |
|
|
|
22,803 |
|
|
|
22,792 |
|
|
|
11 |
|
|
Total |
|
$ |
0.80 |
|
|
$ |
87,881 |
|
|
$ |
87,797 |
|
|
$ |
84 |
|
|
2014 |
|
|
|
|
|
|
|
|
|
|
|
|
|
|
|
|
|
Three Months Ended December 31, |
|
$ |
0.18 |
|
|
$ |
20,393 |
|
|
$ |
20,393 |
|
|
$ |
— |
|
F-24
The following table presents activity related to shares of common stock issued and repurchased for the periods indicated:
|
|
|
Common |
|
|
Treasury |
|
|
Common Stock |
|
|||
|
|
|
Stock Issued |
|
|
Stock |
|
|
Outstanding |
|
|||
|
Balance At December 31, 2013 |
|
|
125,555,268 |
|
|
|
(7,472,157 |
) |
|
|
118,083,111 |
|
|
Dividend payable/paid |
|
|
99 |
|
|
|
(99 |
) |
|
|
— |
|
|
Common stock issued and exercise of stock options |
|
|
1,076,751 |
|
|
|
— |
|
|
|
1,076,751 |
|
|
Shares withheld for tax withholding and exercises |
|
|
— |
|
|
|
(233,163 |
) |
|
|
(233,163 |
) |
|
Shares repurchased under stock repurchase programs |
|
|
— |
|
|
|
(6,856,866 |
) |
|
|
(6,856,866 |
) |
|
Shares issued to directors |
|
|
5,272 |
|
|
|
(2,636 |
) |
|
|
2,636 |
|
|
Balance At December 31, 2014 |
|
|
126,637,390 |
|
|
|
(14,564,921 |
) |
|
|
112,072,469 |
|
|
Dividend payable/paid |
|
|
802 |
|
|
|
(385 |
) |
|
|
417 |
|
|
Common stock issued and exercise of stock options |
|
|
1,558,965 |
|
|
|
— |
|
|
|
1,558,965 |
|
|
Shares withheld for tax withholding and exercises |
|
|
— |
|
|
|
(763,558 |
) |
|
|
(763,558 |
) |
|
Shares repurchased under stock repurchase programs |
|
|
— |
|
|
|
(11,856,169 |
) |
|
|
(11,856,169 |
) |
|
Shares issued to directors |
|
|
3,032 |
|
|
|
(2,008 |
) |
|
|
1,024 |
|
|
Balance At December 31, 2015 |
|
|
128,200,189 |
|
|
|
(27,187,041 |
) |
|
|
101,013,148 |
|
|
Dividend payable/paid |
|
|
892 |
|
|
|
(472 |
) |
|
|
420 |
|
|
Common stock issued and exercise of stock options |
|
|
788,304 |
|
|
|
— |
|
|
|
788,304 |
|
|
Shares withheld for tax withholding and exercises |
|
|
— |
|
|
|
(219,921 |
) |
|
|
(219,921 |
) |
|
Shares repurchased under stock repurchase programs |
|
|
— |
|
|
|
(10,303,047 |
) |
|
|
(10,303,047 |
) |
|
Shares issued to directors |
|
|
6,959 |
|
|
|
(6,273 |
) |
|
|
686 |
|
|
Balance At December 31, 2016 |
|
|
128,996,344 |
|
|
|
(37,716,754 |
) |
|
|
91,279,590 |
|
Shared-Based Compensation. The Company regularly issues share-based compensation to its employees and directors who were not employees of the Company. The accounting guidance for share-based compensation requires measurement of compensation cost for share-based awards at fair value and recognition of compensation cost over the service period, net of estimated forfeitures.
In February 2017, the Company granted a portion of its employees awards in the form of RSUs and MSUs. The total number of units granted was 259,672. The aggregate fair value of the awards was $22.2 million, of which approximately $2.1 million had been expensed in the year ended December 31, 2016 in relation to awards granted to retirement eligible employees under the award terms. A portion of the awards granted consisted of RSUs vesting over a three-year period, with one-third vesting on each anniversary of the grant in 2018, 2019 and 2020. A smaller portion of the awards granted consisted of MSUs that will time-vest over a three year period and are subject to the achievement of the applicable absolute total shareholder return compounded annual growth rate and relative total shareholder return compounded annual growth rate performance metrics measured over a minimum three-year performance period. The performance period may also be extended for an additional period of six months only in the event that both of the performance metrics achieved by the Company are below specified threshold performance levels.
For a small group of awards granted by the Company, all or a portion of the award may be cancelled in certain limited situations, including termination for cause, if employment is terminated before the end of the relevant restriction period. For the remainder of the awards granted by the Company, all or a portion of the award may be canceled if employment is terminated for certain reasons before the end of the relevant restriction period for non-retirement-eligible employees.
In connection with awards under its equity-based compensation and benefit plans, the Company is authorized to use newly issued shares or certain shares of common stock held in treasury.
F-25
The components of share-based compensation expense related to the awards to Company employees and directors who are not employees of the Company of restricted stock units and restricted stock awards (representing shares of common stock) and options to purchase shares of common stock, as applicable, are presented below:
|
|
|
Years Ended |
|
|||||||||
|
|
|
December 31, |
|
|
December 31, |
|
|
December 31, |
|
|||
|
(in thousands) |
|
2016 |
|
|
2015 |
|
|
2014 |
|
|||
|
Deferred stock |
|
$ |
32,525 |
|
|
$ |
27,549 |
|
|
$ |
25,830 |
|
|
Stock options |
|
|
— |
|
|
|
(73 |
) |
|
|
1,201 |
|
|
Total |
|
$ |
32,525 |
|
|
$ |
27,476 |
|
|
$ |
27,031 |
|
The following table presents the amount of share-based compensation expense by category for the periods indicated:
|
|
|
Years Ended |
|
|||||||||
|
|
|
December 31, |
|
|
December 31, |
|
|
December 31, |
|
|||
|
(in thousands) |
|
2016 |
|
|
2015 |
|
|
2014 |
|
|||
|
Cost of revenues |
|
$ |
7,971 |
|
|
$ |
6,909 |
|
|
$ |
7,187 |
|
|
Selling and marketing |
|
|
9,526 |
|
|
|
6,564 |
|
|
|
7,296 |
|
|
Research and development |
|
|
2,970 |
|
|
|
2,823 |
|
|
|
3,128 |
|
|
General and administrative |
|
|
12,058 |
|
|
|
11,180 |
|
|
|
8,005 |
|
|
Total share-based compensation expense |
|
$ |
32,525 |
|
|
$ |
27,476 |
|
|
$ |
25,616 |
|
There was no share-based compensation expense included in income (loss) from discontinued operations, net of income taxes for the years ended December 31, 2016 and 2015. The amount included in income (loss) from discontinued operations, net of income taxes for the year ended December 31, 2014 was $1.4 million.
The tax benefits for share-based compensation expense related to deferred stock and stock options granted to Company employees and to directors who are not employees of the Company were $7.4 million, $15.3 million and $2.8 million for the years ended December 31, 2016, 2015 and 2014, respectively.
As of December 31, 2016, $41.5 million of compensation cost related to MSCI unvested share-based awards granted to the Company’s employees and to directors who are not employees of the Company had not yet been recognized. The unrecognized compensation cost relating to unvested stock-based awards expected to vest will be recognized primarily over the next one to three years.
In connection with awards under its equity-based compensation and benefit plans, the Company is authorized to issue shares of common stock. As of December 31, 2016, 7.6 million shares of common stock were available for future grants under these plans.
Deferred Stock Awards. Certain Company employees have been granted deferred stock awards pursuant to a share-based compensation plan. The plan provides for the deferral of a portion of certain employees’ discretionary compensation with awards made in the form of RSUs, PSUs and MSUs (together, the “Deferred Stock Awards”). Recipients of RSUs, PSUs and MSUs generally have rights to receive dividend equivalents that are subject to vesting. The Company reports the target number of PSUs and MSUs granted unless it has determined, based on the actual achievement of performance measures, that an employee will receive a different amount of shares underlying the PSUs and MSUs, in which case the Company reports the amount of shares employees are likely to receive.
F-26
The following table presents activity concerning the Company’s vested and unvested deferred stock awards applicable to its employees (share data in thousands) for the period indicated:
|
|
|
|
|
|
|
Weighted |
|
|
|
|
|
|
|
|
|
Average |
|
|
|
|
|
|
|
|
|
Grant |
|
|
|
|
|
Number of |
|
|
Date Fair |
|
||
|
For the Year Ended December 31, 2016 |
|
Shares |
|
|
Value |
|
||
|
Vested and unvested deferred stock awards at December 31, 2015 |
|
|
1,075 |
|
|
$ |
47.70 |
|
|
Granted |
|
|
1,081 |
|
|
$ |
65.43 |
|
|
Conversion to common stock |
|
|
(588 |
) |
|
$ |
43.12 |
|
|
Canceled |
|
|
(61 |
) |
|
$ |
57.06 |
|
|
|
|
|
|
|
|
|
|
|
|
Vested and unvested deferred stock awards at December 31, 2016 (1) |
|
|
1,507 |
|
|
$ |
61.82 |
|
|
(1) |
As of December 31, 2016, 1,451 restricted stock units and restricted stock awards, with a weighted average price of $61.67, were vested or expected to vest. |
The total fair value of Deferred Stock Awards held by the Company’s employees that converted to MSCI common stock during the years ended December 31, 2016, 2015 and 2014 was $39.4 million, $34.1 million and $24.5 million, respectively.
The following table presents activity concerning the Company’s unvested deferred stock awards related to its employees (share data in thousands):
|
|
|
|
|
|
|
Weighted |
|
|
|
|
|
|
|
|
|
Average |
|
|
|
|
|
|
|
|
|
Grant |
|
|
|
|
|
Number of |
|
|
Date Fair |
|
||
|
For the Year Ended December 31, 2016 |
|
Shares |
|
|
Value |
|
||
|
Unvested deferred stock awards at December 31, 2015 |
|
|
800 |
|
|
$ |
47.83 |
|
|
Granted |
|
|
898 |
|
|
$ |
66.63 |
|
|
Vested |
|
|
(430 |
) |
|
$ |
43.47 |
|
|
Canceled |
|
|
(61 |
) |
|
$ |
57.07 |
|
|
|
|
|
|
|
|
|
|
|
|
Unvested deferred stock awards at December 31, 2016 |
|
|
1,207 |
|
|
$ |
62.89 |
|
|
|
|
|
|
|
|
|
|
|
|
Unvested deferred stock awards expected to vest |
|
|
1,151 |
|
|
$ |
62.77 |
|
Stock Option Awards. No stock options were issued during the years ended December 31, 2016, 2015 and 2014.
F-27
The following table presents activity concerning MSCI stock options granted to the Company’s employees for the year ended December 31, 2016 (option data and dollar values in thousands, except exercise price):
|
|
|
|
|
|
|
|
|
|
|
Weighted |
|
|
|
|
|
|
|
|
|
|
|
|
|
Weighted |
|
|
Average |
|
|
|
|
|
||
|
|
|
Number |
|
|
Average |
|
|
Remaining |
|
|
Aggregated |
|
||||
|
|
|
of |
|
|
Exercise |
|
|
Life |
|
|
Intrinsic |
|
||||
|
For the Year Ended December 31, 2016 |
|
Options |
|
|
Price |
|
|
(Years) |
|
|
Value |
|
||||
|
Options outstanding at December 31, 2015 |
|
|
485 |
|
|
$ |
23.77 |
|
|
|
2.40 |
|
|
N/A |
|
|
|
Granted or assumed |
|
|
— |
|
|
$ |
— |
|
|
N/A |
|
|
N/A |
|
||
|
Forfeited |
|
|
— |
|
|
$ |
— |
|
|
N/A |
|
|
N/A |
|
||
|
Conversion to common stock |
|
|
(216 |
) |
|
$ |
23.40 |
|
|
N/A |
|
|
N/A |
|
||
|
|
|
|
|
|
|
|
|
|
|
|
|
|
|
|
|
|
|
Options outstanding and exercisable at December 31, 2016 |
|
|
269 |
|
|
$ |
24.06 |
|
|
|
2.22 |
|
|
$ |
14,727 |
|
|
|
|
|
|
|
|
|
|
|
|
|
|
|
|
|
|
|
All outstanding stock options as of December 31, 2016 are vested and exercisable.
The following table presents information relating to the Company’s outstanding and exercisable stock options as of December 31, 2016 (number of options outstanding and aggregate intrinsic value data in thousands):
|
As of December 31, 2016 |
|
Options Outstanding |
|
|||||||||||||
|
|
|
|
|
|
|
Weighted |
|
|
|
|
|
|
|
|
|
|
|
|
|
|
|
|
|
Average |
|
|
Average |
|
|
Aggregate |
|
|||
|
|
|
Number |
|
|
Exercise |
|
|
Remaining |
|
|
Intrinsic |
|
||||
|
Range of Exercise Prices |
|
Outstanding |
|
|
Price |
|
|
Life (Years) |
|
|
Value |
|
||||
|
$9.92 to $16.48 |
|
|
40 |
|
|
$ |
16.47 |
|
|
|
2.15 |
|
|
$ |
2,465 |
|
|
$18.00 |
|
|
53 |
|
|
$ |
18.00 |
|
|
|
0.86 |
|
|
$ |
3,249 |
|
|
$20.45 to $24.11 |
|
|
80 |
|
|
$ |
23.09 |
|
|
|
1.57 |
|
|
$ |
4,464 |
|
|
$25.64 to $40.23 |
|
|
96 |
|
|
$ |
31.38 |
|
|
|
3.55 |
|
|
$ |
4,549 |
|
|
Total |
|
|
269 |
|
|
|
|
|
|
|
|
|
|
$ |
14,727 |
|
The intrinsic value of the stock options exercised by the Company’s employees during the years ended December 31, 2016, 2015 and 2014 was $11.3 million, $37.3 million and $12.8 million, respectively.
F-28
9. RECLASSIFICATIONS OUT OF ACCUMULATED OTHER COMPREHENSIVE INCOME (LOSS)
As required by ASC Subtopic 220-10, “Comprehensive Income—Overall,” the following table presents the amounts reclassified from accumulated other comprehensive income (loss) by the respective line item in the Consolidated Statement of Income:
Reclassifications Out of Accumulated Other Comprehensive Income (Loss) (1)
|
|
|
|
|
|
|
|
|
|
|
|
|
|
|
|
|
Details about Accumulated Other |
|
Amount Reclassified from Accumulated |
|
|
Affected Line Item in the |
|||||||||
|
Comprehensive Income (Loss) Components |
|
Other Comprehensive Income (Loss) |
|
|
Consolidated Statements of Income |
|||||||||
|
|
|
Years Ended |
|
|
|
|||||||||
|
|
|
December 31, |
|
|
December 31, |
|
|
December 31, |
|
|
|
|||
|
|
|
2016 |
|
|
2015 |
|
|
2014 |
|
|
|
|||
|
|
|
|
|
|
|
(in thousands) |
|
|
|
|
|
|
|
|
|
Defined benefit pension plans |
|
|
|
|
|
|
|
|
|
|
|
|
|
|
|
Amount recognized as a component of net periodic benefit expense for curtailments and settlements |
|
$ |
(261 |
) |
|
$ |
(563 |
) |
|
$ |
(104 |
) |
(2) |
|
|
|
|
|
73 |
|
|
|
153 |
|
|
|
(15 |
) |
(3) |
Provision for income taxes |
|
|
|
$ |
(188 |
) |
|
$ |
(410 |
) |
|
$ |
(119 |
) |
(4) |
Net of tax |
|
Foreign currency translation adjustment |
|
$ |
— |
|
|
$ |
— |
|
|
$ |
4,184 |
|
(5) |
|
|
Total reclassifications for the period, net of tax |
|
$ |
(188 |
) |
|
$ |
(410 |
) |
|
$ |
4,065 |
|
|
|
|
(1) |
Amounts in parentheses indicate expenses or losses moved to the Consolidated Statements of Income. |
|
(2) |
Includes $(186,000) for the year ended December 31, 2014 that was reclassified to “Income (loss) from discontinued operations, net of taxes” as part of the gain on the disposition of ISS. |
|
(3) |
Includes $6,000 for the year ended December 31, 2014 that was reclassified to “Income (loss) from discontinued operations, net of taxes” as part of the gain on the disposition of ISS. |
|
(4) |
Includes $(180,000) for the year ended December 31, 2014 that was reclassified to “Income (loss) from discontinued operations, net of taxes” as part of the gain on the disposition of ISS. |
|
(5) |
This accumulated other comprehensive income component for the year ended December 31, 2014 was reclassified to “Income (loss) from discontinued operations, net of taxes” as part of the gain on the disposition of ISS. |
F-29
The provision for income taxes (benefits) by taxing jurisdiction consisted of:
|
|
|
Years Ended |
|
|||||||||
|
|
|
December 31, |
|
|
December 31, |
|
|
December 31, |
|
|||
|
|
|
2016 |
|
|
2015 |
|
|
2014 |
|
|||
|
|
|
(in thousands) |
|
|||||||||
|
Current |
|
|
|
|
|
|
|
|
|
|
|
|
|
U.S. federal |
|
$ |
93,071 |
|
|
$ |
85,540 |
|
|
$ |
84,959 |
|
|
U.S. state and local |
|
|
16,363 |
|
|
|
22,108 |
|
|
|
13,929 |
|
|
Non U.S. |
|
|
32,616 |
|
|
|
22,156 |
|
|
|
18,505 |
|
|
|
|
|
142,050 |
|
|
|
129,804 |
|
|
|
117,393 |
|
|
Deferred |
|
|
|
|
|
|
|
|
|
|
|
|
|
U.S. federal |
|
|
(13,010 |
) |
|
|
(10,546 |
) |
|
|
(2,606 |
) |
|
U.S. state and local |
|
|
(2,235 |
) |
|
|
1,460 |
|
|
|
(3,356 |
) |
|
Non U.S. |
|
|
(1,722 |
) |
|
|
(1,202 |
) |
|
|
(2,035 |
) |
|
|
|
|
(16,967 |
) |
|
|
(10,288 |
) |
|
|
(7,997 |
) |
|
Provision for income taxes from continuing operations |
|
$ |
125,083 |
|
|
$ |
119,516 |
|
|
$ |
109,396 |
|
|
Provision for income taxes from discontinued operations |
|
$ |
— |
|
|
$ |
6,390 |
|
|
$ |
1,059 |
|
The following table reconciles the provision to the U.S. federal statutory income tax rate for income from continuing operations:
|
|
|
Years Ended |
|
|||||||||
|
|
|
December 31, |
|
|
December 31, |
|
|
December 31, |
|
|||
|
|
|
2016 |
|
|
2015 |
|
|
2014 |
|
|||
|
U.S. federal statutory income tax rate |
|
|
35.00 |
% |
|
|
35.00 |
% |
|
|
35.00 |
% |
|
U.S. state and local income taxes, net of U.S. federal income tax benefits |
|
|
2.38 |
% |
|
|
4.44 |
% |
|
|
2.72 |
% |
|
Change in tax rates applicable to non-U.S. earnings |
|
|
(3.73 |
%) |
|
|
(2.73 |
%) |
|
|
(1.88 |
%) |
|
Domestic tax credits and incentives |
|
|
(0.26 |
%) |
|
|
(2.62 |
%) |
|
|
(0.86 |
%) |
|
Other |
|
|
(0.98 |
%) |
|
|
0.10 |
% |
|
|
0.50 |
% |
|
Effective income tax rate |
|
|
32.41 |
% |
|
|
34.19 |
% |
|
|
35.48 |
% |
F-30
Deferred income taxes reflect the net tax effects of temporary differences between the financial reporting and tax bases of assets and liabilities and are measured using the enacted tax rates and laws that will be in effect when such differences are expected to reverse. Significant components of the Company’s deferred tax assets and liabilities as of December 31, 2016 and 2015, were as follows:
|
|
|
As of |
|
|||||
|
|
|
December 31, |
|
|
December 31, |
|
||
|
|
|
2016 |
|
|
2015 |
|
||
|
|
|
(in thousands) |
|
|||||
|
Deferred tax assets: |
|
|
|
|
|
|
|
|
|
Employee compensation and benefit plans |
|
$ |
27,914 |
|
|
$ |
23,700 |
|
|
Deferred rent |
|
|
7,869 |
|
|
|
7,485 |
|
|
Pension |
|
|
1,965 |
|
|
|
2,030 |
|
|
Unearned revenue |
|
|
1,322 |
|
|
|
1,555 |
|
|
Loss carryforwards - non-current |
|
|
27,616 |
|
|
|
33,389 |
|
|
Other |
|
|
558 |
|
|
|
678 |
|
|
Subtotal |
|
|
67,244 |
|
|
|
68,837 |
|
|
Less: valuation allowance |
|
|
(17,807 |
) |
|
|
(21,052 |
) |
|
Total deferred tax assets |
|
$ |
49,437 |
|
|
$ |
47,785 |
|
|
Deferred tax liabilities: |
|
|
|
|
|
|
|
|
|
Intangible assets |
|
$ |
(121,900 |
) |
|
$ |
(138,832 |
) |
|
Foreign currency translation |
|
|
— |
|
|
|
(352 |
) |
|
Property, equipment and leasehold improvements, net |
|
|
(12,073 |
) |
|
|
(10,358 |
) |
|
Total deferred tax liabilities |
|
$ |
(133,973 |
) |
|
$ |
(149,542 |
) |
|
Net deferred tax liabilities |
|
$ |
(84,536 |
) |
|
$ |
(101,757 |
) |
As presented in the table above, the Company has certain loss carryforward items. The tax value of the capital loss carryforward is $16.0 million which is set to expire in 2019. There is a full valuation allowance against this item. The tax value of the United States portion of the net operating loss carryforwards is $10.6 million which is subject to an annual limitation on utilization and will begin to expire in 2020. There is a valuation allowance against state tax losses of $1.3 million. As of December 31, 2016, the tax value of foreign net operating loss carryforwards was $1.0 million with a related valuation allowance of $0.5 million.
The following table presents changes in the Company’s deferred tax asset valuation allowance for the periods indicated:
|
|
|
Years Ended |
|
|||||||||
|
|
|
December 31, |
|
|
December 31, |
|
|
December 31, |
|
|||
|
|
|
2016 |
|
|
2015 |
|
|
2014 |
|
|||
|
|
|
(in thousands) |
|
|||||||||
|
Beginning balance |
|
$ |
21,052 |
|
|
$ |
21,232 |
|
|
$ |
7 |
|
|
Additions charged to cost and expenses |
|
|
1,862 |
|
|
|
— |
|
|
|
21,225 |
|
|
Additions charged to other accounts |
|
|
— |
|
|
|
— |
|
|
|
— |
|
|
Deductions |
|
|
(5,107 |
) |
|
|
(180 |
) |
|
|
— |
|
|
Ending balance |
|
$ |
17,807 |
|
|
$ |
21,052 |
|
|
$ |
21,232 |
|
F-31
The following table presents the components of income before provision for income taxes generated by domestic or foreign operations for the periods indicated:
|
|
|
Years Ended |
|
|||||||||
|
|
|
December 31, |
|
|
December 31, |
|
|
December 31, |
|
|||
|
|
|
2016 |
|
|
2015 |
|
|
2014 |
|
|||
|
Domestic |
|
$ |
263,536 |
|
|
$ |
282,764 |
|
|
$ |
269,944 |
|
|
Foreign (1) |
|
|
122,402 |
|
|
|
66,790 |
|
|
|
38,394 |
|
|
Total income before provision for income taxes |
|
$ |
385,938 |
|
|
$ |
349,554 |
|
|
$ |
308,338 |
|
|
(1) |
Foreign income before provision for income taxes is defined as income generated from operations located outside the U.S., which includes income from foreign branches of U.S. companies. |
Cumulative earnings attributable to foreign subsidiaries were $341.6 million, $224.8 million and $149.1 million for the years ended December 31, 2016, 2015, and 2014, respectively. No provisions for income tax that could occur upon repatriation have been recorded on these earnings which the Company intends to permanently reinvest abroad. At this time, it is not practicable to determine the amount of income taxes payable in the event all such foreign earnings are repatriated.
The Company regularly assesses the likelihood of additional assessments in each of the taxing jurisdictions in which it files income tax returns. The Company has established unrecognized tax benefits that the Company believes are adequate in relation to the potential for additional assessments. Once established, the Company adjusts unrecognized tax benefits only when more information is available or when an event occurs necessitating a change. As part of the Company’s periodic review of unrecognized tax benefits and based on new information regarding the status of federal and state examinations, the Company’s unrecognized tax benefits were remeasured. It is reasonably possible that significant changes in the balance of unrecognized tax benefits may occur within the next 12 months. At this time, however, it is not possible to reasonably estimate the expected change to the total amount of unrecognized tax benefits and the impact on the effective tax rate over the next 12 months.
The Company believes the resolution of tax matters will not have a material effect on the Consolidated Statement of Financial Condition of the Company, although a resolution could have a material impact on the Company’s Consolidated Statement of Income for a particular future period and on the Company’s effective tax rate for any period in which such resolution occurs.
The following table presents a reconciliation of the beginning and ending amount of the gross unrecognized tax benefits, excluding interest and penalties, for the years ended December 31, 2016, 2015 and 2014:
|
|
|
Years Ended |
|
|||||||||
|
|
|
December 31, |
|
|
December 31, |
|
|
December 31, |
|
|||
|
Gross unrecognized tax benefits |
|
2016 |
|
|
2015 |
|
|
2014 |
|
|||
|
(in thousands) |
|
|
|
|
|
|
|
|
|
|
|
|
|
Beginning balance |
|
$ |
8,692 |
|
|
$ |
6,525 |
|
|
$ |
7,089 |
|
|
Increases based on tax positions related to the current period |
|
|
575 |
|
|
|
536 |
|
|
|
292 |
|
|
Increases based on tax positions related to prior periods |
|
|
135 |
|
|
|
2,131 |
|
|
|
1,969 |
|
|
Decreases based on tax positions related to prior periods |
|
|
(3 |
) |
|
|
(500 |
) |
|
|
(346 |
) |
|
(Decreases) related to settlements with taxing authorities |
|
|
(1,463 |
) |
|
|
— |
|
|
|
(1,652 |
) |
|
(Decreases) related to a lapse of applicable statute of limitations |
|
|
— |
|
|
|
— |
|
|
|
(827 |
) |
|
Ending balance |
|
$ |
7,936 |
|
|
$ |
8,692 |
|
|
$ |
6,525 |
|
F-32
The total amount of unrecognized tax benefits was $7.1 million, net of federal benefit of state issues, competent authority and foreign tax credit offsets, as of December 31, 2016, which, if recognized, would favorably affect the effective tax rate in future periods. The Company recognizes the accrual of interest and penalties related to unrecognized tax benefits in the Provision for Income Taxes in the Consolidated Statement of Income. For the year ended December 31, 2016, the Company recognized $0.2 million of interest in the Consolidated Statement of Income with respect to unrecognized tax benefits. No significant penalties were recognized in the Consolidated Statement of Income for the year ended December 31, 2016. The amount of accrued interest, which includes interest related to uncertain tax positions and accrued income tax expense, recorded on the Consolidated Statement of Financial Condition as of December 31, 2016 was $1.5 million.
The Company is under examination by the IRS and other tax authorities in certain jurisdictions, including foreign jurisdictions, such as India, and states in which the Company has significant operations, such as New York. The tax years currently under examination vary by jurisdiction but include years ranging from 2005 through 2015. As a result of having previously been a member of the Morgan Stanley consolidated group, the Company may have future settlements with Morgan Stanley related to the ultimate disposition of their New York State and New York City examination relating to the tax years 2007 and 2008 and their IRS examination relating to the tax years 2006 through 2008. The Company does not believe it has any material exposure to the New York State and New York City examinations. Additionally, the Company believes it has adequate reserves for any tax issues that may arise out of the IRS examination relating to the tax years 2006 through 2008 and therefore does not believe any related settlement with Morgan Stanley will have a material impact.
11. ACQUISITIONS
The acquisition method of accounting is based on ASC Subtopic 805-10, “Business Combinations,” and uses the fair value concepts defined in ASC Subtopic 820-10, “Fair Value Measurements and Disclosures,” which the Company has adopted as required. The total purchase price is allocated to the net tangible and intangible assets based upon their fair values as of the acquisition dates. The excess of the purchase price over the fair values of the net tangible assets and intangible assets was recorded as goodwill. The allocation of the purchase price was based upon a valuation and is subject to change within the one-year measurement period following the acquisition. MSCI expects to continue to obtain information to assist it in determining the fair value of the net assets acquired at the acquisition date during the measurement period.
Acquisition of Insignis
On October 16, 2015, the Company completed the purchase of Insignis for $6.5 million through its subsidiary InvestorForce. Insignis is a financial data provider, including data on positions, transactions and complex instruments such as exchange-traded futures and options, OTC swaps and foreign exchange spot and forward contracts.
The purchase price allocations for the Insignis acquisition were $4.2 million for goodwill, $2.2 million for identifiable intangible assets and $0.1 million for assets other than identifiable intangible assets.
Acquisition of GMI Ratings
On August 11, 2014, the Company completed the acquisition of GMI Ratings for $15.5 million in cash through its subsidiary MSCI ESG Research Inc. GMI Ratings is a provider of corporate governance research and ratings on companies worldwide. Clients of GMI Ratings include institutional investors, banks, insurers, auditors, regulators and corporations seeking to incorporate ESG factors into risk assessment and decision-making.
The purchase price allocations for the GMI Ratings acquisition were $9.9 million for goodwill, $3.6 million for identifiable intangible assets, $6.7 million for assets other than identifiable intangible assets and $4.7 million for other liabilities.
F-33
12. DISPOSITIONS AND DISCONTINUED OPERATIONS
Disposition of Real Estate occupiers
On August 1, 2016, MSCI completed the sale of its Real Estate occupiers business. The value of the disposed assets and liabilities and the resulting gain on disposal were not material to the Company.
Disposition of ISS
On March 17, 2014, MSCI entered into a definitive agreement to sell ISS. The results of operations from ISS and the CFRA product line are reflected in “Income (loss) from discontinued operations, net of income taxes” in the Consolidated Statements of Income.
The sale of ISS was completed on April 30, 2014 for $367.4 million. The value of the assets and liabilities of ISS that were disposed, directly attributable transaction costs and the resulting gain on disposal that has been reported in “Income (loss) from discontinued operations, net of income taxes” for the year ended December 31, 2014 are as follows:
|
|
|
Amount |
|
|
|
|
|
(in thousands) |
|
|
|
Cash proceeds |
|
$ |
367,355 |
|
|
Less: Initial working capital adjustments |
|
|
(311 |
) |
|
Total proceeds |
|
|
367,044 |
|
|
Less assets sold and liabilities relieved resulting from disposal: |
|
|
|
|
|
Cash and cash equivalents |
|
|
(4,544 |
) |
|
Accounts receivable |
|
|
(15,765 |
) |
|
Deferred taxes (current) |
|
|
(3,174 |
) |
|
Prepaid taxes |
|
|
(617 |
) |
|
Prepaid and other assets |
|
|
(4,500 |
) |
|
Property, equipment and leasehold improvements (net of accumulated depreciation and amortization of $4,213) |
|
|
(8,544 |
) |
|
Goodwill |
|
|
(254,233 |
) |
|
Intangible assets (net of accumulated amortization of $50,283) |
|
|
(121,269 |
) |
|
Other non-current assets |
|
|
(1,645 |
) |
|
Accounts payable |
|
|
574 |
|
|
Accrued compensation and related benefits |
|
|
6,783 |
|
|
Other accrued liabilities |
|
|
4,034 |
|
|
Deferred revenue |
|
|
51,767 |
|
|
Deferred taxes (non-current) |
|
|
59,129 |
|
|
Other non-current liabilities |
|
|
5,576 |
|
|
Other comprehensive income including currency translation adjustments and pension and other post-retirement adjustments |
|
|
4,004 |
|
|
Net assets sold |
|
|
(282,424 |
) |
|
Less: Transaction costs |
|
|
(5,946 |
) |
|
Gain on sale of ISS |
|
$ |
78,674 |
|
F-34
Income (loss) from discontinued operations. Amounts associated with discontinued operations reflected in the Consolidated Statements of Income for the years ended December 31, 2015 and 2014 are as follows:
|
|
|
Years Ended |
|
|||||
|
|
|
December 31, |
|
|
December 31, |
|
||
|
|
|
2015 |
|
|
2014 |
|
||
|
|
|
(in thousands) |
|
|||||
|
Revenue from discontinued operations |
|
$ |
— |
|
|
$ |
43,122 |
|
|
Income (loss) from discontinued operations before provision (benefit) for income taxes |
|
$ |
— |
|
|
$ |
86,230 |
|
|
Provision for income taxes |
|
|
6,390 |
|
|
|
1,059 |
|
|
Income (loss) from discontinued operations, net of income taxes |
|
$ |
(6,390 |
) |
|
$ |
85,171 |
|
The year ended December 31, 2015 reflects the impact of out-of-period income tax charges associated with the tax obligations triggered upon the sale of ISS.
13. SEGMENT INFORMATION
ASC Subtopic 280-10, “Segment Reporting,” establishes standards for reporting information about operating segments. Operating segments are defined as components of an enterprise about which separate financial information is available that is evaluated regularly by the chief operating decision maker, or CODM, in deciding how to allocate resources and assess performance. MSCI’s Chief Executive Officer and Chief Operating Officer, who are considered to be its CODM, review financial information presented on an operating segment basis for purposes of making operating decisions and assessing financial performance.
The CODM measures and evaluates reportable segments based on segment operating revenues as well as Adjusted EBITDA and other measures. The Company excludes the following items from segment Adjusted EBITDA: income (loss) from discontinued operations, net of income taxes, provision for income taxes, other expense (income), net, depreciation and amortization of property, equipment and leasehold improvements, amortization of intangible assets and certain transactions or adjustments that the CODM does not consider for the purposes of making decisions to allocate resources among segments or to assess segment performance. Although these amounts are excluded from segment Adjusted EBITDA, they are included in reported consolidated net income and are included in the reconciliation that follows.
The Company’s computation of segment Adjusted EBITDA may not be comparable to other similarly titled measures computed by other companies because all companies do not calculate segment Adjusted EBITDA in the same fashion.
Revenues and expenses directly associated with each segment are included in determining its operating results. Other expenses that are not directly attributable to a particular segment are allocated based upon allocation methodologies, including time estimates, headcount, sales targets, data center consumption and other relevant usage measures. Due to the integrated structure of our business, certain costs incurred by one segment may benefit other segments. A segment may use the content and data produced by another segment without incurring an arm’s-length intersegment charge.
The CODM does not review any information regarding total assets on an operating segment basis. Operating segments do not record intersegment revenue, and, accordingly, there is none to be reported. The accounting policies for segment reporting are the same as for MSCI as a whole.
The Company has four operating segments: Index, Analytics, ESG and Real Estate.
F-35
The Index operating segment is primarily a provider of equity indexes. The indexes are used in many areas of the investment process, including index-linked product creation and performance benchmarking, as well as portfolio construction and rebalancing and asset allocation.
The Analytics operating segment uses analytical content to create products and services which offer institutional investors an integrated view of risk and return. Its research-enhanced products and services help institutional investors understand and control for market, credit, liquidity and counterparty risk across all major asset classes, spanning short, medium and long-term time horizons. The Analytics global risk and performance platform is built for scale, enabling clients to conduct complex calculations and stress tests. Analytics offers products and services that assist institutional investors with portfolio construction, risk management, performance attribution and regulatory reporting.
The ESG operating segment offers products and services that help institutional investors understand how environmental, social and governance (“ESG”) factors can impact the long-term risk of their investments. In addition, the ESG operating segment’s data and ratings products are used in the construction of equity and fixed income indexes to help institutional investors benchmark ESG investment performance, issue index-based investment products, as well as manage, measure and report on ESG mandates.
The Real Estate operating segment is a provider of real estate performance analysis for funds, investors, managers and lenders, as well as occupiers through the disposition of the Real Estate occupiers business. This segment provides products and offers services that include research, reporting and benchmarking. During the year ended December 31, 2016, the Company disposed of the Real Estate occupiers business and recorded a gain on the disposition which was recorded in “Other expense (income),” in the Consolidated Statement of Income.
The operating segments of ESG and Real Estate do not individually meet the segment reporting thresholds and have been combined and presented as part of All Other for disclosure purposes.
The following table presents operating revenue by reportable segment for the periods indicated:
|
|
|
Years Ended |
|
|||||||||
|
|
|
December 31, |
|
|
December 31, |
|
|
December 31, |
|
|||
|
|
|
2016 |
|
|
2015 |
|
|
2014 |
|
|||
|
|
(in thousands) |
|
||||||||||
|
Operating revenues |
|
|
|
|
|
|
|
|
|
|
|
|
|
Index |
|
$ |
613,551 |
|
|
$ |
558,964 |
|
|
$ |
503,892 |
|
|
Analytics |
|
|
448,353 |
|
|
|
433,424 |
|
|
|
414,085 |
|
|
All Other |
|
|
88,765 |
|
|
|
82,625 |
|
|
|
78,703 |
|
|
Total |
|
$ |
1,150,669 |
|
|
$ |
1,075,013 |
|
|
$ |
996,680 |
|
F-36
The following table presents segment profitability and a reconciliation to net income for the periods indicated:
|
|
|
Years Ended |
|
|||||||||
|
|
|
December 31, |
|
|
December 31, |
|
|
December 31, |
|
|||
|
|
|
2016 |
|
|
2015 |
|
|
2014 |
|
|||
|
|
(in thousands) |
|
||||||||||
|
Index Adjusted EBITDA |
|
$ |
431,478 |
|
|
$ |
392,987 |
|
|
$ |
349,685 |
|
|
Analytics Adjusted EBITDA |
|
|
128,507 |
|
|
|
95,468 |
|
|
|
72,173 |
|
|
All Other Adjusted EBITDA |
|
|
9,472 |
|
|
|
(6,758 |
) |
|
|
(13,104 |
) |
|
Total operating segment profitability |
|
|
569,457 |
|
|
|
481,697 |
|
|
|
408,754 |
|
|
Amortization of intangible assets |
|
|
47,033 |
|
|
|
46,910 |
|
|
|
45,877 |
|
|
Depreciation and amortization of property, equipment and leasehold improvements |
|
|
34,320 |
|
|
|
30,889 |
|
|
|
25,711 |
|
|
Operating income |
|
|
488,104 |
|
|
|
403,898 |
|
|
|
337,166 |
|
|
Other expense (income), net |
|
|
102,166 |
|
|
|
54,344 |
|
|
|
28,828 |
|
|
Provision for income taxes |
|
|
125,083 |
|
|
|
119,516 |
|
|
|
109,396 |
|
|
Income from continuing operations |
|
|
260,855 |
|
|
|
230,038 |
|
|
|
198,942 |
|
|
Income (loss) from discontinued operations, net of income taxes |
|
|
— |
|
|
|
(6,390 |
) |
|
|
85,171 |
|
|
Net income |
|
$ |
260,855 |
|
|
$ |
223,648 |
|
|
$ |
284,113 |
|
Revenue by geography is based on the shipping address of the ultimate customer utilizing the product. The following table presents revenue by geographic area for the periods indicated:
|
|
|
Years Ended |
|
|||||||||
|
|
|
December 31, |
|
|
December 31, |
|
|
December 31, |
|
|||
|
(in thousands) |
|
2016 |
|
|
|
2015 |
|
|
2014 |
|
||
|
Revenues |
|
|
|
|
|
|
|
|
|
|
|
|
|
Americas: |
|
|
|
|
|
|
|
|
|
|
|
|
|
United States |
|
$ |
556,777 |
|
|
$ |
519,429 |
|
|
$ |
471,145 |
|
|
Other |
|
|
45,185 |
|
|
|
41,552 |
|
|
|
37,189 |
|
|
Total Americas |
|
|
601,962 |
|
|
|
560,981 |
|
|
|
508,334 |
|
|
Europe, the Middle East and Africa ("EMEA"): |
|
|
|
|
|
|
|
|
|
|
|
|
|
United Kingdom |
|
|
175,749 |
|
|
|
166,019 |
|
|
|
154,308 |
|
|
Other |
|
|
229,010 |
|
|
|
215,192 |
|
|
|
209,893 |
|
|
Total EMEA |
|
|
404,759 |
|
|
|
381,211 |
|
|
|
364,201 |
|
|
Asia & Australia: |
|
|
|
|
|
|
|
|
|
|
|
|
|
Japan |
|
|
52,161 |
|
|
|
45,371 |
|
|
|
46,642 |
|
|
Other |
|
|
91,787 |
|
|
|
87,450 |
|
|
|
77,503 |
|
|
Total Asia & Australia |
|
|
143,948 |
|
|
|
132,821 |
|
|
|
124,145 |
|
|
Total |
|
$ |
1,150,669 |
|
|
$ |
1,075,013 |
|
|
$ |
996,680 |
|
F-37
Long-lived assets consist of property, equipment, leasehold improvements, goodwill and intangible assets, net of accumulated depreciation and amortization. The following table presents long-lived assets by geographic area on the dates indicated:
|
|
|
As of |
|
|||||
|
|
|
December 31, |
|
|
December 31, |
|
||
|
|
|
2016 |
|
|
2015 |
|
||
|
|
|
(in thousands) |
|
|||||
|
Long-lived assets |
|
|
|
|
|
|
|
|
|
Americas: |
|
|
|
|
|
|
|
|
|
United States |
|
$ |
1,876,366 |
|
|
$ |
1,916,689 |
|
|
Other |
|
|
1,543 |
|
|
|
2,279 |
|
|
Total Americas |
|
|
1,877,909 |
|
|
|
1,918,968 |
|
|
EMEA: |
|
|
|
|
|
|
|
|
|
United Kingdom |
|
|
89,466 |
|
|
|
110,261 |
|
|
Other |
|
|
23,780 |
|
|
|
16,849 |
|
|
Total EMEA |
|
|
113,246 |
|
|
|
127,110 |
|
|
Asia & Australia: |
|
|
|
|
|
|
|
|
|
Japan |
|
|
357 |
|
|
|
570 |
|
|
Other |
|
|
7,563 |
|
|
|
9,389 |
|
|
Total Asia & Australia |
|
|
7,920 |
|
|
|
9,959 |
|
|
Total |
|
$ |
1,999,075 |
|
|
$ |
2,056,037 |
|
F-38
14. QUARTERLY RESULTS OF OPERATIONS (unaudited):
|
|
|
2016 |
|
|
2015 |
|
||||||||||||||||||||||||||
|
|
|
First |
|
|
Second |
|
|
Third |
|
|
Fourth |
|
|
First |
|
|
Second |
|
|
Third |
|
|
Fourth |
|
||||||||
|
|
|
Quarter |
|
|
Quarter |
|
|
Quarter |
|
|
Quarter |
|
|
Quarter |
|
|
Quarter |
|
|
Quarter |
|
|
Quarter |
|
||||||||
|
|
|
(in thousands, except per share data) |
|
|||||||||||||||||||||||||||||
|
Operating revenues |
|
$ |
278,828 |
|
|
$ |
290,596 |
|
|
$ |
288,433 |
|
|
$ |
292,812 |
|
|
$ |
262,769 |
|
|
$ |
270,580 |
|
|
$ |
268,771 |
|
|
$ |
272,893 |
|
|
Cost of revenues |
|
|
63,172 |
|
|
|
62,130 |
|
|
|
62,986 |
|
|
|
63,819 |
|
|
|
69,904 |
|
|
|
67,394 |
|
|
|
65,593 |
|
|
|
64,804 |
|
|
Selling and marketing |
|
|
41,689 |
|
|
|
41,854 |
|
|
|
41,514 |
|
|
|
41,609 |
|
|
|
41,648 |
|
|
|
42,028 |
|
|
|
38,809 |
|
|
|
39,809 |
|
|
Research and development |
|
|
18,928 |
|
|
|
18,566 |
|
|
|
18,750 |
|
|
|
18,960 |
|
|
|
23,189 |
|
|
|
20,807 |
|
|
|
15,548 |
|
|
|
17,776 |
|
|
General and administrative |
|
|
21,890 |
|
|
|
22,019 |
|
|
|
21,859 |
|
|
|
21,467 |
|
|
|
20,377 |
|
|
|
22,080 |
|
|
|
19,960 |
|
|
|
23,590 |
|
|
Amortization of intangible assets |
|
|
11,840 |
|
|
|
11,943 |
|
|
|
11,752 |
|
|
|
11,498 |
|
|
|
11,702 |
|
|
|
11,695 |
|
|
|
11,710 |
|
|
|
11,803 |
|
|
Depreciation and amortization of property, equipment and leasehold improvements |
|
|
8,168 |
|
|
|
8,393 |
|
|
|
8,312 |
|
|
|
9,447 |
|
|
|
7,207 |
|
|
|
8,065 |
|
|
|
8,049 |
|
|
|
7,568 |
|
|
Total operating expenses |
|
|
165,687 |
|
|
|
164,905 |
|
|
|
165,173 |
|
|
|
166,800 |
|
|
|
174,027 |
|
|
|
172,069 |
|
|
|
159,669 |
|
|
|
165,350 |
|
|
Operating income |
|
|
113,141 |
|
|
|
125,691 |
|
|
|
123,260 |
|
|
|
126,012 |
|
|
|
88,742 |
|
|
|
98,511 |
|
|
|
109,102 |
|
|
|
107,543 |
|
|
Interest income |
|
|
(621 |
) |
|
|
(585 |
) |
|
|
(799 |
) |
|
|
(901 |
) |
|
|
(204 |
) |
|
|
(185 |
) |
|
|
(285 |
) |
|
|
(492 |
) |
|
Interest expense |
|
|
22,904 |
|
|
|
22,918 |
|
|
|
26,790 |
|
|
|
29,039 |
|
|
|
11,108 |
|
|
|
11,116 |
|
|
|
17,267 |
|
|
|
22,896 |
|
|
Other expense (income) |
|
|
81 |
|
|
|
2,814 |
|
|
|
(253 |
) |
|
|
779 |
|
|
|
178 |
|
|
|
164 |
|
|
|
(6,922 |
) |
|
|
(297 |
) |
|
Other expense (income), net |
|
|
22,364 |
|
|
|
25,147 |
|
|
|
25,738 |
|
|
|
28,917 |
|
|
|
11,082 |
|
|
|
11,095 |
|
|
|
10,060 |
|
|
|
22,107 |
|
|
Income from continuing operations before provision for income taxes |
|
|
90,777 |
|
|
|
100,544 |
|
|
|
97,522 |
|
|
|
97,095 |
|
|
|
77,660 |
|
|
|
87,416 |
|
|
|
99,042 |
|
|
|
85,436 |
|
|
Provision for income taxes |
|
|
30,410 |
|
|
|
33,587 |
|
|
|
32,241 |
|
|
|
28,845 |
|
|
|
28,036 |
|
|
|
31,399 |
|
|
|
34,644 |
|
|
|
25,437 |
|
|
Income from continuing operations |
|
|
60,367 |
|
|
|
66,957 |
|
|
|
65,281 |
|
|
|
68,250 |
|
|
|
49,624 |
|
|
|
56,017 |
|
|
|
64,398 |
|
|
|
59,999 |
|
|
Income (loss) from discontinued operations, net of income taxes |
|
|
— |
|
|
|
— |
|
|
|
— |
|
|
|
— |
|
|
|
(5,797 |
) |
|
|
— |
|
|
|
— |
|
|
|
(593 |
) |
|
Net income |
|
$ |
60,367 |
|
|
$ |
66,957 |
|
|
$ |
65,281 |
|
|
$ |
68,250 |
|
|
$ |
43,827 |
|
|
$ |
56,017 |
|
|
$ |
64,398 |
|
|
$ |
59,406 |
|
|
Earnings per basic common share |
|
|
|
|
|
|
|
|
|
|
|
|
|
|
|
|
|
|
|
|
|
|
|
|
|
|
|
|
|
|
|
|
|
From continuing operations |
|
$ |
0.61 |
|
|
$ |
0.69 |
|
|
$ |
0.69 |
|
|
$ |
0.73 |
|
|
$ |
0.44 |
|
|
$ |
0.50 |
|
|
$ |
0.59 |
|
|
$ |
0.59 |
|
|
From discontinued operations |
|
|
— |
|
|
|
— |
|
|
|
— |
|
|
|
— |
|
|
|
(0.05 |
) |
|
|
— |
|
|
|
— |
|
|
|
(0.01 |
) |
|
Earnings per basic common share |
|
$ |
0.61 |
|
|
$ |
0.69 |
|
|
$ |
0.69 |
|
|
$ |
0.73 |
|
|
$ |
0.39 |
|
|
$ |
0.50 |
|
|
$ |
0.59 |
|
|
$ |
0.58 |
|
|
Earnings per diluted common share |
|
|
|
|
|
|
|
|
|
|
|
|
|
|
|
|
|
|
|
|
|
|
|
|
|
|
|
|
|
|
|
|
|
From continuing operations |
|
$ |
0.60 |
|
|
$ |
0.69 |
|
|
$ |
0.68 |
|
|
$ |
0.73 |
|
|
$ |
0.44 |
|
|
$ |
0.50 |
|
|
$ |
0.59 |
|
|
$ |
0.58 |
|
|
From discontinued operations |
|
|
— |
|
|
|
— |
|
|
|
— |
|
|
|
— |
|
|
|
(0.05 |
) |
|
|
— |
|
|
|
— |
|
|
|
(0.01 |
) |
|
Earnings per diluted commons hare |
|
$ |
0.60 |
|
|
$ |
0.69 |
|
|
$ |
0.68 |
|
|
$ |
0.73 |
|
|
$ |
0.39 |
|
|
$ |
0.50 |
|
|
$ |
0.59 |
|
|
$ |
0.57 |
|
|
Weighted average shares outstanding used in computing per share data |
|
|
|
|
|
|
|
|
|
|
|
|
|
|
|
|
|
|
|
|
|
|
|
|
|
|
|
|
|
|
|
|
|
Basic |
|
|
99,425 |
|
|
|
96,412 |
|
|
|
94,823 |
|
|
|
93,327 |
|
|
|
112,520 |
|
|
|
112,143 |
|
|
|
108,773 |
|
|
|
102,837 |
|
|
Diluted |
|
|
99,998 |
|
|
|
96,888 |
|
|
|
95,473 |
|
|
|
93,845 |
|
|
|
113,522 |
|
|
|
112,931 |
|
|
|
109,440 |
|
|
|
103,590 |
|
15. SUBSEQUENT EVENTS
On February 1, 2017, the Board of Directors of the Company declared a quarterly dividend of $0.28 per share of common stock to be paid on March 15, 2017 to shareholders of record as of the close of trading on February 17, 2017.
Subsequent to the year ended December 31, 2016 and through February 17, 2017, the Company repurchased an additional 1.0 million shares of common stock at an average price of $80.70 per share for a total value of $77.5 million.
F-39
|
Exhibit |
Description |
Form |
File No. |
Exhibit No. |
Filing Date |
|
3.1 |
Third Amended and Restated Certificate of Incorporation
|
10-Q |
001-33812 |
3.1 |
5/4/2012 |
|
3.2 |
Amended and Restated By-laws |
10-Q |
001-33812 |
3.2 |
5/4/2012 |
|
4.1 |
Form of Senior Indenture |
S-3 |
333-206232 |
4.1 |
8/7/2015 |
|
4.2 |
Form of Subordinated Indenture |
S-3 |
333-206232 |
4.2 |
8/7/2015 |
|
4.3 |
Form of Common Stock Certificate |
10-Q |
001-33812 |
4.1 |
5/4/2012 |
|
4.4 |
Indenture, dated as of November 20, 2014, among MSCI Inc., each of the Subsidiary Guarantors party thereto and Wells Fargo Bank, National Association, as Trustee
|
8-K |
001-33812 |
4.1 |
11/20/2014 |
|
4.5 |
Form of Note for MSCI Inc. 5.250% Senior Notes due November 15, 2024 (included in Exhibit 4.4)
|
8-K |
001-33812 |
4.2 |
11/20/2014 |
|
4.6 |
Indenture, dated as of August 13, 2015, among MSCI Inc., each of the Subsidiary Guarantors party thereto and Wells Fargo Bank, National Association, as Trustee
|
8-K |
001-33812 |
4.1 |
8/13/2015 |
|
4.7 |
Form of Note for MSCI Inc. 5.750% Senior Notes due August 13, 2025 (included in Exhibit 4.6)
|
8-K |
001-33812 |
4.2 |
8/13/2015 |
|
4.8 |
Indenture, dated as of August 4, 2016, among MSCI Inc., each of the Subsidiary Guarantors party thereto and Wells Fargo Bank, National Association, as Trustee
|
8-K |
001-33812 |
4.1 |
8/05/2016 |
|
4.9 |
Form of Note for MSCI Inc. 4.750% Senior Notes due August 1, 2026
|
8-K |
001-33812 |
4.2 |
8/05/2016 |
|
10.1† |
Index License Agreement for Funds, dated as of March 18, 2000, between Morgan Stanley Capital International and Barclays Global Investors, N.A.
|
10-K |
001-33812 |
10.1 |
2/27/2015 |
|
10.2† |
Amendment to Index License Agreement for Funds between Morgan Stanley Capital International and Barclays Global Investors, N.A.
|
10-K |
001-33812 |
10.2 |
2/29/2012 |
|
10.3† |
Letter Agreement to Amend MSCI-BGI Fund Index License Agreement, dated as of June 21, 2001, between Morgan Stanley Capital International Inc. and Barclays Global Investors, N.A.
|
10-K |
001-33812 |
10.3 |
1/31/2011 |
EX-1
EX-2
EX-3
|
Exhibit |
Description |
Form |
File No. |
Exhibit No. |
Filing Date |
|
Amendment to Index License Agreement for Funds, dated as of December 15, 2009, between MSCI Inc. and Blackrock Institutional Trust Company, N.A.
|
10-K |
001-33812 |
10.57 |
1/31/2011 |
|
|
10.47 |
Amendment to Index License Agreement for Funds, dated as of June 13, 2011, between MSCI Inc. and BlackRock Institutional Trust Company, N.A.
|
10-K |
001-33812 |
10.58 |
2/29/2012 |
|
10.48 |
Amendment to Index License Agreement for Funds, dated as of May 20, 2010
|
10-K |
001-33812 |
10.59 |
1/31/2011 |
|
10.49† |
Schedule No. 11043 to the Master Index License Agreement for Index Based Funds, between MSCI Inc. and BlackRock Institutional Trust Company, N.A. (formerly, Barclays Global Investors, N.A.), dated as of September 1, 2010
|
10-K |
001-33812 |
10.60 |
1/31/2011 |
|
10.50† |
Amendment to the Index License Agreement for Funds, dated as of November 19, 2010, between MSCI Inc. and Barclays Global Investors, N.A.
|
10-K |
001-33812 |
10.50 |
2/27/2015 |
|
10.51 |
Amendment to the Index License Agreement for Funds, dated as of June 21, 2011, by and between MSCI Inc. and BlackRock Institutional Trust Company, N.A. (formerly known as Barclays Global Investors, N.A.)
|
10-K |
001-33812 |
10.62 |
2/29/2012 |
|
10.52† |
Amendment to the Index License Agreement for Funds, dated as of July 1, 2011, by and between MSCI Inc. (formerly, Morgan Stanley Capital International Inc.) and Blackrock Institutional Trust Company, N.A. (formerly, Barclays Global Investors, N.A.)
|
10-K/A |
001-33812 |
10.63 |
7/20/2012 |
|
10.53† |
Amendment to the Index License Agreement for Funds, dated as of August 23, 2011, by and between MSCI Inc. and Blackrock Institutional Trust Company, N.A. (formerly, Barclays Global Investors, N.A.)
|
10-K |
001-33812 |
10.53 |
2/27/2015 |
|
10.54 |
Amendment to the Index License Agreement for Funds, dated as of October 4, 2011, by and between MSCI Inc. and BlackRock Institutional Trust Company, N.A. (formerly known as Barclays Global Investors, N.A.)
|
10-K |
001-33812 |
10.65 |
2/29/2012 |
|
10.55† |
Amendment to the Index License Agreement for Funds, dated as of October 4, 2011, by and between MSCI Inc. and BlackRock Institutional Trust Company, N.A. (formerly, Barclays Global Investors, N.A.)
|
10-K |
001-33812 |
10.57 |
3/1/2013 |
EX-4
EX-5
EX-6
|
Exhibit |
Description |
Form |
File No. |
Exhibit No. |
Filing Date |
|
Form of Performance Award Agreement for Performance Stock Units for Executive Officers under the MSCI Inc. 2007 Amended and Restated Equity Incentive Compensation Plan
|
10-K |
001-33812 |
10.81 |
2/28/2014 |
|
|
10.77* |
Form of Award Agreement for Restricted Stock Units for Executive Officers under the MSCI Inc. 2007 Amended and Restated Equity Incentive Compensation Plan
|
10-K |
001-33812 |
10.82 |
2/28/2014 |
|
10.78* |
Form of Award Agreement for Restricted Stock Units for Chief Executive Officer under the MSCI Inc. 2007 Amended and Restated Equity Incentive Compensation Plan
|
10-K |
001-33812 |
10.83 |
2/28/2014 |
|
10.79* |
Form of Award Agreement for Restricted Stock Units for Executive Officers under the MSCI Inc. 2007 Amended and Restated Equity Incentive Compensation Plan
|
10-K |
001-33812 |
10.84 |
2/28/2014 |
|
10.80* |
Award Agreement for 2013 Non-Qualified Stock Option Award
|
10-K |
001-33812 |
10.85 |
2/28/2014 |
|
10.82† |
Amendment to the Index License Agreement for Funds, dated as of January 23, 2014, by and between MSCI Inc. (formerly, Morgan Stanley Capital International Inc.) and BlackRock Institutional Trust Company, N.A. (formerly, Barclays Global Investors, N.A.)
|
10-K |
001-33812 |
10.82 |
2/27/2015 |
|
10.83† |
Amendment to the Index License Agreement for Funds, dated as of January 23, 2014, by and between MSCI Inc. (formerly, Morgan Stanley Capital International Inc.) and BlackRock Institutional Trust Company, N.A. (formerly, Barclays Global Investors, N.A.)
|
10-K |
001-33812 |
10.83 |
2/27/2015 |
|
10.84 |
Stock Purchase Agreement, dated as of March 17, 2014, among MSCI Inc., RiskMetrics Group Holdings, LLC and VISS Acquisition Corp.
|
8-K |
001-33812 |
2.1 |
4/20/2014 |
|
10.85† |
Letter Agreement to amend the Amendment to the Index License Agreement for Funds, dated as of March 18, 2014, by and between MSCI Inc. (formerly, Morgan Stanley Capital International Inc.) and BlackRock Institutional Trust Company, N.A. (formerly, Barclays Global Investors, N.A.)
|
10-K |
001-33812 |
10.85 |
2/27/2015 |
|
10.87* |
Form of Award Agreement for Restricted Stock Units for Directors under the MSCI Inc. Independent Directors’ Equity Compensation Plan, as amended
|
10-Q |
001-33812 |
10.2 |
5/2/2014 |
EX-7
|
Exhibit |
Description |
Form |
File No. |
Exhibit No. |
Filing Date |
|
Summary of Non-Employee Director Compensation |
Filed Herewith |
||||
|
10.89† |
Amendment to the Index License Agreement for Funds, dated as of July 9, 2014, by and between MSCI Inc. (formerly, Morgan Stanley Capital International Inc.) and BlackRock Fund Advisors (as successor to Barclays Global Investors, N.A.)
|
10-K |
001-33812 |
10.89 |
2/27/2015 |
|
10.90† |
Amendment to the Index License Agreement for Funds, dated as of July 16, 2014, by and between MSCI Inc. (formerly, Morgan Stanley Capital International Inc.) and BlackRock Fund Advisors (as successor to Barclays Global Investors, N.A.)
|
10-K |
001-33812 |
10.90 |
2/27/2015 |
|
10.91† |
Amendment to the Index License Agreement for Funds, dated as of August 15, 2014, by and between MSCI Inc. (formerly, Morgan Stanley Capital International Inc.) and BlackRock Fund Advisors (as successor to Barclays Global Investors, N.A.)
|
10-K |
001-33812 |
10.91 |
2/27/2015 |
|
10.92† |
Amendment to the Index License Agreement for Funds, dated as of September 9, 2014, by and between MSCI Inc. (formerly, Morgan Stanley Capital International Inc.) and BlackRock Fund Advisors (as successor to Barclays Global Investors, N.A.)
|
10-K |
001-33812 |
10.92 |
2/27/2015 |
|
10.93† |
Amendment to the Index License Agreement for Funds, dated as of September 17, 2014, by and between MSCI Inc. (formerly, Morgan Stanley Capital International Inc.) and BlackRock Fund Advisors (as successor to Barclays Global Investors, N.A.)
|
10-K |
001-33812 |
10.93 |
2/27/2015 |
|
10.94 |
Master and Supplemental Confirmations regarding Accelerated Stock Buyback, dated as of September 18, 2014, between MSCI Inc. and Goldman, Sachs & Co.
|
10-Q |
001-33812 |
10.1 |
10/30/2014 |
|
10.95† |
Amendment to the Index License Agreement for Funds, dated as of September 22, 2014, by and between MSCI Inc. (formerly, Morgan Stanley Capital International Inc.) and BlackRock Fund Advisors (as successor to Barclays Global Investors, N.A.)
|
10-K |
001-33812 |
10.95 |
2/27/2015 |
|
10.96† |
Amendment to the Index License Agreement for Funds, dated as of October 30, 2014, by and between MSCI Inc. (formerly, Morgan Stanley Capital International Inc.) and BlackRock Fund Advisors (as successor to Barclays Global Investors, N.A.)
|
10-K |
001-33812 |
10.96 |
2/26/2016 |
EX-8
|
Exhibit |
Description |
Form |
File No. |
Exhibit No. |
Filing Date |
|
Revolving Credit Agreement, dated as of November 20, 2014, among MSCI Inc., as the Borrower, each of the Subsidiary Guarantors party thereto, JPMorgan Chase Bank, N.A., as the Administrative Agent and L/C Issuer, the Lenders party thereto and J.P. Morgan Securities LLC, as Lead Arranger and Bookrunner (amended by Amendment No. 1 to the Revolving Credit Agreement, dated August 4, 2016, among MSCI Inc., each of the Guarantors party thereto, the Lenders party thereto and JPMorgan Chase Bank, N.A., as Administrative Agent)
|
8-K |
001-33812 |
10.1 |
11/20/2014 |
|
|
10.98 |
Cooperation Agreement, dated as of January 29, 2015 (amended by Letter Agreement to Cooperation Agreement, dated as of March 10, 2016, by and among MSCI Inc., Value Act Capital Management, L.P. and D. Robert Hale)
|
8-K |
001-33812 |
99.1 |
1/30/2015 |
|
10.99* |
Form of Award Agreement for Restricted Stock Units for Executive Officers under the MSCI Inc. 2007 Amended and Restated Equity Incentive Compensation Plan
|
10-K |
001-33812 |
10.101 |
2/27/2015 |
|
10.100* |
Form of Annual Performance Award Agreement for Performance Stock Units for Managing Directors under the MSCI Inc. 2007 Amended and Restated Equity Incentive Compensation Plan
|
10-Q |
001-33812 |
10.4 |
04/29/2016 |
|
10.101* |
Form of Award Agreement for Restricted Stock Units for Managing Directors under the MSCI Inc. 2007 Amended and Restated Equity Incentive Compensation Plan
|
10-Q |
001-33812 |
10.5 |
04/29/2016 |
|
10.102† |
Amendment to the Index License Agreement for Funds, dated as of February 4, 2015, by and between MSCI Inc. (formerly, Morgan Stanley Capital International Inc.) and BlackRock Fund Advisors (as successor to Barclays Global Investors, N.A.)
|
10-K |
001-33812 |
10.102 |
2/26/2016 |
|
10.103† |
Amendment to the Index License Agreement for Funds, dated as of February 25, 2015, by and between MSCI Inc. (formerly, Morgan Stanley Capital International Inc.) and BlackRock Fund Advisors (as successor to Barclays Global Investors, N.A.)
|
10-K |
001-33812 |
10.103 |
2/26/2016 |
|
10.104† |
Letter Agreement (to amend the Amendment dated December 10, 2013) to the Index License Agreement for Funds, dated as of March 17, 2015, by and between MSCI Inc. (formerly, Morgan Stanley Capital International Inc.) and BlackRock Institutional Trust Company, N.A. (formerly, Barclays Global Investors, N.A.) |
10-K |
001-33812 |
10.104 |
2/26/2016 |
EX-9
|
Exhibit |
Description |
Form |
File No. |
Exhibit No. |
Filing Date |
|
Amendment to the Index License Agreement for Funds, dated as of April 20, 2015, by and between MSCI Inc. (formerly, Morgan Stanley Capital International Inc.) and BlackRock Fund Advisors (as successor to Barclays Global Investors, N.A.)
|
10-K |
001-33812 |
10.105 |
2/26/2016 |
|
|
10.106† |
Amendment to the Index License Agreement for Funds, dated as of April 20, 2015, by and between MSCI Inc. (formerly, Morgan Stanley Capital International Inc.) and BlackRock Fund Advisors (as successor to Barclays Global Investors, N.A.)
|
10-K |
001-33812 |
10.106 |
2/26/2016 |
|
10.107* |
Form of Award Agreement for Restricted Stock Units for Directors under the MSCI Inc. Independent Directors’ Equity Compensation Plan, as amended
|
10-Q |
001-33812 |
10.1 |
5/1/2015 |
|
10.108* |
Change of Employment Status and Release Agreement for Roveen Bhansali
|
10-Q |
001-33812 |
10.1 |
5/1/2015 |
|
10.109* |
MSCI Inc. Change in Control Severance Plan, adopted May 28, 2015
|
Filed Herewith |
|||
|
10.110† |
Amendment (to amend the Amendment dated February 21, 2013) to the Index License Agreement for Funds, dated as of June 1, 2015, by and between MSCI Inc. (formerly, Morgan Stanley Capital International Inc.) and BlackRock Fund Advisors (as successor to Barclays Global Investors, N.A.)
|
10-K |
001-33812 |
10.110 |
2/26/2016 |
|
10.111† |
Amendment to the Index License Agreement for Funds, dated as of June 1, 2015, by and between MSCI Inc. (formerly, Morgan Stanley Capital International Inc.) and BlackRock Fund Advisors (as successor to Barclays Global Investors, N.A.)
|
10-K |
001-33812 |
10.111 |
2/26/2016 |
|
10.112† |
Amendment (to amend the Amendment dated November 6, 2012) to the Index License Agreement for Funds, dated as of June 4, 2015, by and between MSCI Inc. (formerly, Morgan Stanley Capital International Inc.) and BlackRock Fund Advisors (as successor to Barclays Global Investors, N.A.)
|
10-K |
001-33812 |
10.112 |
2/26/2016 |
|
10.113† |
Amendment (to amend the Amendments dated January 23, 2014 and April 15, 2014) to the Index License Agreement for Funds, dated as of June 4, 2015, by and between MSCI Inc. (formerly, Morgan Stanley Capital International Inc.) and BlackRock Fund Advisors (as successor to Barclays Global Investors, N.A.)
|
10-K |
001-33812 |
10.113 |
2/26/2016 |
EX-10
EX-11
|
Exhibit |
Description |
Form |
File No. |
Exhibit No. |
Filing Date |
|
Letter Agreement (to amend the Amendment dated December 10, 2013) to the Index License Agreement for Funds, dated as of December 17, 2015, by and between MSCI Inc. (formerly, Morgan Stanley Capital International Inc.) and BlackRock Institutional Trust Company, N.A. (formerly, Barclays Global Investors, N.A.)
|
10-K |
001-33812 |
10.122 |
2/26/2016 |
|
|
10.123* |
Transition and Release Agreement, dated as of February 10, 2016, by and between MSCI Inc. and Robert Qutub
|
10-K |
001-33812 |
10.123 |
2/26/2016 |
|
10.124* |
Form of 2016 Multi-Year Performance Award Agreement for Performance Stock Units for the Executive Committee under the MSCI Inc. 2007 Amended and Restated Equity Incentive Compensation Plan
|
10-Q |
001-33812 |
10.6 |
4/29/2016 |
|
10.125* |
Form of 2016 Multi-Year Performance Award Agreement for Performance Stock Units for the Executive Committee under the MSCI Inc. 2016 Omnibus Incentive Plan
|
10-Q |
001-33812 |
10.7 |
4/29/2016 |
|
10.126 |
Amendment (to amend the Amendment dated January 23, 2014) to the Index License Agreement for Funds, dated as of April 15, 2014, by and between MSCI Inc. (formerly, Morgan Stanley Capital International Inc.) and BlackRock Fund Advisors (as successor to Barclays Global Investors, N.A.)
|
10-K |
001-33812 |
10.126 |
2/26/2016 |
|
10.127†† |
Amendment to the Index License Agreement for Funds, dated as of January 28, 2016, by and between MSCI Inc. (formerly, Morgan Stanley Capital International Inc.) and BlackRock Fund Advisors (as successor to Barclays Global Investors, N.A.)
|
Filed Herewith |
|||
|
10.128* |
Offer Letter, effective as of March 15, 2016, between MSCI Inc. and Kathleen A. Winters
|
8-K |
001-33812 |
10.1 |
4/27/2016 |
|
10.129†† |
Amendment to the Index License Agreement for Funds, dated as of February 29, 2016, by and between MSCI Inc. (formerly, Morgan Stanley Capital International Inc.) and BlackRock Fund Advisors (as successor to Barclays Global Investors, N.A.)
|
Filed Herewith |
|||
|
10.130†† |
Amendment to the Index License Agreement for Funds, dated as of April 8, 2016, by and between MSCI Inc. (formerly, Morgan Stanley Capital International Inc.) and BlackRock Fund Advisors (as successor to Barclays Global Investors, N.A.)
|
Filed Herewith |
|||
EX-12
|
Exhibit |
Description |
Form |
File No. |
Exhibit No. |
Filing Date |
|
Amendment (to amend the Amendment dated December 16, 2011) to the Index License Agreement for Funds, dated as of April 12, 2016, by and between MSCI Inc. (formerly, Morgan Stanley Capital International Inc.) and BlackRock Fund Advisors (as successor to Barclays Global Investors, N.A.)
|
Filed Herewith |
||||
|
10.132* |
MSCI Inc. 2016 Omnibus Incentive Plan |
S-8 |
333-210987 |
99.1 |
04/28/2016 |
|
10.133* |
MSCI Inc. 2016 Non-Employee Directors Compensation Plan
|
S-8 |
333-210987 |
99.2 |
04/28/2016 |
|
10.134* |
Form of Award Agreement for Restricted Stock Units for Directors under the MSCI Inc. 2016 Non-Employee Directors Compensation Plan
|
10-Q |
001-33812 |
10.3 |
4/29/2016 |
|
10.135* |
Non-Employee Director Stock Ownership Guidelines
|
10-Q |
001-33812 |
10.8 |
4/29/2016 |
|
10.136* |
MSCI Inc. Non-Employee Director Deferral Plan, as amended
|
10-Q |
001-33812 |
10.9 |
4/29/2016 |
|
10.137 |
Letter Agreement to Cooperation Agreement, dated as of March 10, 2016, by and among MSCI Inc., Value Act Capital Management, L.P. and D. Robert Hale.
|
10-Q |
001-33812 |
10.10 |
4/29/2016 |
|
10.138* |
Offer Letter, effective as of October 15, 2014, by and between MSCI Inc. and Laurent Seyer
|
10-Q |
001-33812 |
10.13 |
4/29/2016 |
|
10.139* |
Offer Letter, effective as of May 15, 2011, by and between MSCI Inc. and Peter Zangari
|
10-Q |
001-33812 |
10.14 |
4/29/2016 |
|
10.140†† |
Amendment to the Index License Agreement for Funds, dated as of April 29, 2016, by and between MSCI Inc. (formerly, Morgan Stanley Capital International Inc.) and BlackRock Fund Advisors (as successor to Barclays Global Investors, N.A.)
|
Filed Herewith |
|||
|
10.141 |
Amendment to the Schedules to the Index License Agreement for Funds, dated as of May 4, 2016, by and between MSCI Inc. (formerly, Morgan Stanley Capital International Inc.) and BlackRock Fund Advisors (as successor to Barclays Global Investors, N.A.)
|
Filed Herewith |
|||
|
10.142†† |
Amendment to the Index License Agreement for Funds, dated as of May 12, 2016, by and between MSCI Inc. (formerly, Morgan Stanley Capital International Inc.) and BlackRock Fund Advisors (as successor to Barclays Global Investors, N.A.)
|
Filed Herewith |
|||
EX-13
|
Exhibit |
Description |
Form |
File No. |
Exhibit No. |
Filing Date |
|
Amendment to the Index License Agreement for Funds, dated as of June 15, 2016, by and between MSCI Inc. (formerly, Morgan Stanley Capital International Inc.) and BlackRock Fund Advisors (as successor to Barclays Global Investors, N.A.)
|
Filed Herewith |
||||
|
10.144†† |
Amendment (to amend the Amendment dated February 29, 2016) to the Index License Agreement for Funds, dated as of July 21, 2016, by and between MSCI Inc. (formerly, Morgan Stanley Capital International Inc.) and BlackRock Fund Advisors (as successor to Barclays Global Investors, N.A.)
|
Filed Herewith |
|||
|
10.145* |
Form of 2016 Award Agreement for Restricted Stock Units for Managing Directors under the MSCI Inc. 2016 Omnibus Incentive Plan
|
10-Q |
001-33812 |
10.5 |
7/29/2016 |
|
10.146†† |
Amendment to the Index License Agreement for Funds, dated as of August 1, 2016, by and between MSCI Inc. (formerly, Morgan Stanley Capital International Inc.) and BlackRock Fund Advisors (as successor to Barclays Global Investors, N.A.)
|
Filed Herewith |
|||
|
10.147 |
Amendment No. 1 to the Revolving Credit Agreement, dated August 4, 2016, among MSCI Inc., each of the Guarantors party thereto, the Lenders party thereto and JPMorgan Chase Bank, N.A., as Administrative Agent
|
8-K |
001-33812 |
10.1 |
8/05/2016 |
|
10.148†† |
Amendment to the Index License Agreement for Funds, dated as of October 12, 2016, by and between MSCI Inc. (formerly, Morgan Stanley Capital International Inc.) and BlackRock Fund Advisors (as successor to Barclays Global Investors, N.A.)
|
Filed Herewith |
|||
|
10.149 |
Amendment to the Schedules to the Index License Agreement for Funds, dated as of November 30, 2016, by and between MSCI Inc. (formerly, Morgan Stanley Capital International Inc.) and BlackRock Fund Advisors (as successor to Barclays Global Investors, N.A.)
|
Filed Herewith |
|||
|
10.150†† |
Amendment to the Index License Agreement for Funds, dated as of December 5, 2016, by and between MSCI Inc. (formerly, Morgan Stanley Capital International Inc.) and BlackRock Fund Advisors (as successor to Barclays Global Investors, N.A.)
|
Filed Herewith |
|||
|
10.151* |
Form of Special Restricted Stock Unit Award Agreement under the MSCI Inc. 2016 Omnibus Incentive Plan |
Filed Herewith |
|||
EX-14
|
Exhibit |
Description |
Form |
File No. |
Exhibit No. |
Filing Date |
|
Form of Award Agreement for Restricted Stock Units for Managing Directors under the MSCI Inc. 2016 Omnibus Incentive Plan
|
Filed Herewith |
||||
|
10.153* |
Form of Award Agreement for Performance Stock Units for Managing Directors under the MSCI Inc. 2016 Omnibus Incentive Plan
|
Filed Herewith |
|||
|
21.1 |
Subsidiaries of the Registrant |
Filed Herewith |
|||
|
23.1 |
Consent of PricewaterhouseCoopers LLP |
Filed Herewith |
|||
|
24.1 |
Powers of Attorney (included as part of Signature Page)
|
Filed Herewith |
|||
|
31.1 |
Rule 13a-14(a) Certification of Chief Executive Officer
|
Filed Herewith |
|||
|
31.2 |
Rule 13a-14(a) Certification of Chief Financial Officer
|
Filed Herewith |
|||
|
32.1 |
Section 1350 Certification of Chief Executive Officer and Chief Financial Officer
|
Furnished Herewith |
|||
|
101.INS |
XBRL Instance Document. |
Filed Herewith |
|||
|
101.SCH |
XBRL Taxonomy Extension Schema Document. |
Filed Herewith |
|||
|
101.CAL |
XBRL Taxonomy Extension Calculation Linkbase Document.
|
Filed Herewith |
|||
|
101.LAB |
XBRL Taxonomy Extension Label Linkbase Document.
|
Filed Herewith |
|||
|
101.PRE |
XBRL Taxonomy Extension Presentation Linkbase Document.
|
Filed Herewith |
|||
|
101.DEF |
XBRL Taxonomy Extension Definition Linkbase Document.
|
Filed Herewith |
|||
|
* |
Indicates a management compensation plan, contract or arrangement. |
|
† |
Confidential treatment has been granted for a portion of this exhibit. |
|
†† |
Confidential treatment requested. |
EX-15