Attached files
| file | filename |
|---|---|
| 8-K - 8-K - ISTAR INC. | star-12312016xpr8xk.htm |
Exhibit 99.1

Press Release
iStar Announces Fiscal Year 2016 Results
NEW YORK, February 24, 2017
iStar (NYSE: STAR) today reported results for the fiscal year ended December 31, 2016.
2016 Highlights
◦ | Company exceeded its target of 50% year-over-year earnings growth. |
◦ | Net income (loss) for the fiscal year was $0.55 per diluted common share, versus $(0.62) for the prior year. |
◦ | Adjusted income for the fiscal year was $1.15 per diluted common share, versus $0.35 for the prior year. |
◦ | Originated $692 million of investments within the real estate finance and net lease portfolios. |
◦ | Monetized operating properties for $377 million, generating $109 million of income. |
◦ | Achieved target entitlement on approximately 90% of land portfolio. |
◦ | Raised $775 million of debt and reduced overall indebtedness by $732 million. |
◦ | Ended the year with $749 million of liquidity. |
◦ | Reduced diluted shares outstanding by 38 million shares or 30% via stock buybacks and repayment of convertible bonds. |
◦ | Added as a constituent to the MSCI US REIT Index (RMZ). |
◦ | Hired Geoffrey Jervis in the newly created role of COO and CFO. |
1
Fiscal Year 2016 Results
iStar grew net income (loss) allocable to common shareholders for the year by over 100% to $44.0 million, or $0.55 per diluted common share, compared to $(52.7) million, or $(0.62) per diluted common share for the year ended December 31, 2015.
The Company's management uses adjusted income as an internal performance measure and supplies it to investors as a supplemental non-GAAP performance measure. Management believes that adjusted income provides a useful measure of income because it excludes the effects of certain non-cash charges that management believes are not necessarily indicative of iStar's operating performance and it includes the effect of gains or losses on investments when realized. In addition, the Board of Directors determines compensation in part based upon adjusted income. Adjusted income represents net income (loss) computed in accordance with GAAP, prior to the effects of certain non-cash items. The calculation of adjusted income and reconciliation to GAAP net income is presented in the financial tables that follow the text of this press release.
In the second quarter of 2016, the Company modified its presentation of adjusted income to reflect the effect of gains and losses on certain non-cash charge-offs and dispositions on book value gross of loan loss reserves and impairments.
The Company also exceeded its 50% year-over-year growth target for adjusted income per share. Adjusted income allocable to common shareholders for the year ended December 31, 2016 was $1.15 per diluted common share, or $112.6 million, net of a $14.8 million loss associated with the modified definition of adjusted income. This compares to adjusted income allocable to common shareholders for the year ended December 31, 2015 of $0.35 per diluted common share, or $29.7 million, net of a $55.4 million loss associated with the modified definition of adjusted income.
Fourth Quarter 2016 Results
iStar reported net income (loss) allocable to common shareholders for the fourth quarter of $(19.3) million, or $(0.27) per diluted common share, versus $7.7 million, or $0.09 per diluted common share for the fourth quarter 2015.
Adjusted income (loss) allocable to common shareholders for the fourth quarter was $2.7 million, or $0.04 per diluted common share, versus $(13.2) million, or $(0.16) per diluted common share for the fourth quarter 2015.
“We made progress this year,” said Jay Sugarman, iStar's chairman and chief executive officer. “We made investments in attractive real estate finance and net lease opportunities throughout the year and, during the second and third quarters, advanced on our goal of strategically monetizing certain assets within our operating portfolio. During the year, we also reached several value-creating milestones in our land portfolio. Transaction-driven earnings continue to be material to our results, which also means that earnings can be lumpy quarter to quarter. We expect this to continue in 2017 as we make further progress in transitioning our portfolio towards assets that generate recurring income streams.”
2
Earnings Guidance
iStar announced net income and adjusted income per share guidance for the fiscal year 2017. The Company currently targets net income per diluted common share of approximately $0.65 and adjusted income per diluted common share of approximately $1.50 per share in 2017. This guidance assumes that general macro economic conditions continue to remain favorable. Please see the financial tables that follow the text of this press release for a reconciliation from GAAP net income guidance to adjusted income guidance.
Investment Activity
During the fourth quarter of 2016, the Company originated $202.5 million of new investments bringing total originations for the year to $691.8 million. During the quarter, iStar funded a total of $283.8 million associated with new investments, prior financing commitments and ongoing development across its four segments, bringing the total fundings for the year to $767.3 million. In addition, the portfolio generated $426.5 million of repayments and sales during the quarter, bringing total proceeds received to $1.28 billion for the year.
Investing Activity | ||||||||||||||
$ in millions | ||||||||||||||
Real Estate Finance | Net Lease | Operating Properties | Land & Dev | Corporate / Other | Total | |||||||||
Q4'16 | ||||||||||||||
Originations | $169.8 | $32.7 | — | — | — | $202.5 | ||||||||
Fundings | $197.1 | $43.0 | $15.2 | $28.2 | $0.3 | $283.8 | ||||||||
Proceeds received | $302.3 | $13.6 | $34.0 | $58.2 | $18.4 | $426.5 | ||||||||
FY'16 | ||||||||||||||
Originations | $432.0 | $259.8 | — | — | — | $691.8 | ||||||||
Fundings | $474.0 | $86.9 | $69.9 | $135.9 | $0.6 | $767.3 | ||||||||
Proceeds received | $614.2 | $123.4 | $377.2 | $134.8 | $32.1 | $1,281.7 | ||||||||
Note: Originations represent total commitments on new investments made during the quarter. Fundings represent capital expenditures and fundings on new investments and existing assets during the quarter. Net lease originations represent the total value of originations by iStar and by its net lease joint venture in which the Company owns a 52% interest. | ||||||||||||||
New real estate finance investments originated in the fourth quarter are expected to generate a weighted average unlevered IRR of 10.2% over the life of the investments, while the net lease originations made in the fourth quarter are expected to generate a 9.4% IRR on our equity contributions over the term of the leases.(1)
3
New real estate finance investments originated in 2016 are expected to generate a weighted average unlevered IRR of 11.0% over the life of the investments, while the net lease originations made in 2016 are expected to generate a 9.3% IRR on our equity contributions over the term of the leases.(1)
_______________________
(1) IRRs are based on contractual investment terms such as coupon, rent and term. The Company makes assumptions as to the pace of fundings, timing of construction and residual value of real estate at the end of the lease term. The net lease joint venture can elect to take on leverage and the Company makes assumptions as to the amount of debt and the cost of debt the venture will take on. The net lease IRR includes the Company's estimate of the value of the residual at the end of the lease term. While the Company believes its assumptions are reasonable, they are dependent on future real estate market conditions, capital market conditions, interest rates and decisions by iStar and its joint venture partner. No assurance can be made that the Company's assumptions will reflect actual results.
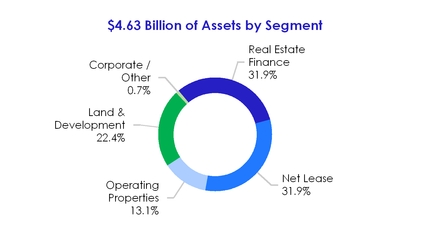
Portfolio Overview
At December 31, 2016, the Company’s portfolio totaled $4.63 billion, which is gross of $421.4 million of accumulated depreciation and $23.3 million of general loan loss reserves.
4
A summary of quarterly activity is below:
Portfolio Rollforward | |||||||||||||||||||||||
$ in millions | |||||||||||||||||||||||
Real Estate Finance | Net Lease | Operating Properties | Land & Dev | Corporate / Other | Total | ||||||||||||||||||
Net book value (9/30/16) | $ | 1,632.2 | $ | 1,105.2 | $ | 487.1 | $ | 1,115.0 | $ | 53.4 | $ | 4,392.9 | |||||||||||
Investments(1) | 197.1 | 27.3 | 12.8 | 20.4 | 0.3 | 257.9 | |||||||||||||||||
Asset transfers between segments | (31.5 | ) | — | 96.7 | (65.2 | ) | — | — | |||||||||||||||
Principal received / basis sold(2) | (302.3 | ) | (17.5 | ) | (31.1 | ) | (38.1 | ) | (21.4 | ) | (410.4 | ) | |||||||||||
Other(3) | (45.1 | ) | (5.5 | ) | (3.3 | ) | (1.7 | ) | 1.0 | (54.6 | ) | ||||||||||||
Net book value (12/31/16) | 1,450.4 | 1,109.5 | 562.2 | 1,030.4 | 33.3 | 4,185.8 | |||||||||||||||||
Add: Accumulated depreciation and general loan loss reserves | 23.3 | 368.7 | 46.2 | 6.5 | — | 444.7 | |||||||||||||||||
Gross book value (12/31/16) | $ | 1,473.7 | $ | 1,478.2 | $ | 608.4 | $ | 1,036.9 | $ | 33.3 | $ | 4,630.5 | |||||||||||
Note: The table above include the Company's pro rata share of equity method investments. | |||||||||||||||||||||||
(1) Includes fundings, capital expenditures, accruals, and deferred capitalized interest on loans. | |||||||||||||||||||||||
(2) Includes repayment of deferred interest on loans. | |||||||||||||||||||||||
(3) Real Estate Finance activity primarily represents repayment of a loan participation that was consolidated on iStar's balance sheet. | |||||||||||||||||||||||
Real Estate Finance
iStar's real estate finance business targets sophisticated and innovative investors by providing one-stop capabilities that encompass financial alternatives ranging from full envelope senior loans to custom-tailored mezzanine and preferred equity capital positions.
At December 31, 2016, the Company’s real estate finance portfolio totaled $1.47 billion. The portfolio is categorized into iStar 3.0 loans, made post January 1, 2008, and legacy loans, which were all made on or prior to December 31, 2007.
5
The following table summarizes statistics for our real estate finance portfolio:
Real Estate Finance Statistics | |||||||||||||||||||
$ in millions | |||||||||||||||||||
iStar 3.0 | Legacy | ||||||||||||||||||
Q4'16 | Q3'16 | Q4'15 | Q4'16 | Q3'16 | Q4'15 | ||||||||||||||
Gross book value | $ | 1,223.5 | $ | 1,365.9 | $ | 1,195.8 | $ | 250.3 | $ | 287.5 | $ | 442.2 | |||||||
% of total loan portfolio | 83 | % | 83 | % | 73 | % | 17 | % | 17 | % | 27 | % | |||||||
Performing loans | $ | 1,223.5 | $ | 1,365.9 | $ | 1,195.8 | $ | 58.6 | $ | 65.0 | $ | 381.9 | |||||||
Non-performing loans | $ | — | $ | — | $ | — | $ | 191.7 | $ | 222.5 | $ | 60.3 | |||||||
% Performing / Non-performing | 100% / 0% | 100% / 0% | 100% / 0% | 23% / 77% | 23% / 77% | 86% / 14% | |||||||||||||
First mortgages / senior loans | 74 | % | 72 | % | 66 | % | 38 | % | 44 | % | 32 | % | |||||||
Mezzanine / subordinated debt | 26 | % | 28 | % | 34 | % | 62 | % | 56 | % | 68 | % | |||||||
Total | 100 | % | 100 | % | 100 | % | 100 | % | 100 | % | 100 | % | |||||||
Wtd. avg. LTV (1) | 64.1 | % | 61.5 | % | 60.0 | % | 61.4 | % | 65.4 | % | 90.2 | % | |||||||
Unlevered yield (1) | 8.9 | % | 9.0 | % | 8.8 | % | 8.5 | % | 9.1 | % | 6.9 | % | |||||||
Wtd. avg. maturity (years) (1) | 2.1 | 1.6 | 2.1 | 1.8 | 1.9 | 2.7 | |||||||||||||
Weighted avg. risk rating (1) | 3.07 | 2.61 | 2.93 | 2.20 | 2.36 | 3.50 | |||||||||||||
Note: Gross book value represents the carrying value of iStar's loans, gross of general reserves. Risk rating scale based on 1 as lowest risk and 5 as highest risk. Risk ratings are based on internal metrics developed by management. They reflect management's current assessment and are not intended to predict outcomes. Actual performance of the assets may differ materially from management's current assessment of risk. See the "Loan Receivable Credit Statistics" table for additional detail on the Company's NPL and specific reserves. | |||||||||||||||||||
(1) Includes performing loans only. | |||||||||||||||||||
At December 31, 2016, the Company's non-performing loans (NPLs) were exclusively derived from its legacy loan portfolio and had a carrying value of $191.7 million, down from $222.5 million in the third quarter. The decline was primarily related to taking title to a parcel of land in downtown Chicago, IL.
Our remaining NPLs include a $144.7 million loan secured in part by pledges of equity in a portfolio of hotels and is recourse to the borrower. The borrower ceased paying current interest after it filed for bankruptcy protection during the third quarter.
Net Lease
iStar's net lease business seeks to create stable cash flows through long-term leases to single tenants on its properties. The Company targets mission-critical facilities leased on a long-term basis to tenants, offering structured solutions that combine iStar's capabilities in underwriting, lease structuring, asset management and build-to-suit construction. Since 2014, the Company has invested in new net lease investments primarily through its net lease joint venture with a sovereign wealth fund.
6
At the end of the year, iStar’s net lease portfolio totaled $1.48 billion, gross of $368.7 million of accumulated depreciation.
Net Lease Portfolio Overview | ||
$ in millions | ||
Wholly owned assets held for investment | $1,384.3 | |
Wholly owned assets available and held for sale | 1.2 | |
Joint venture investments (1) | 92.7 | |
Total | $1,478.2 | |
(1) Represents iStar's 52% interest in its net lease joint venture, which is an equity method investment. The venture's carrying value of total assets was $511.3 million | ||
During the quarter, the Company closed a new sale-leaseback in which it acquired two office/industrial campuses in Texas and Oklahoma for $32.7 million, or a 7.75% going in cap rate, and leased them back to an investment grade tenant for a 15-year term. The Company obtained an amortizing $19.6 million, 15-year non-recourse senior loan financing on the asset at a fixed interest rate of 3.875%. The Company intends to contribute this investment to its net lease joint venture. The Company's interest and commitment to deals within the joint venture fund is 52% of equity.
In addition, the Company recorded a gain of $5.2 million during the quarter associated with the sale of one asset.
Net Lease Statistics | ||||||
Q4'16 | Q3'16 | Q4'15 | ||||
Square feet (000s) | 17,214 | 17,022 | 17,807 | |||
% Leased | 98 | % | 99 | % | 96 | % |
Wtd. avg. lease term (years) | 14.7 | 14.6 | 14.9 | |||
Same store NOI (millions) (1) | $33.2 | $31.1 | $31.9 | |||
Yield | 9.1 | % | 8.2 | % | 8.4 | % |
(1) Same store net operating income includes net lease assets owned on or prior to January 1, 2015 and were in service through December 31, 2016. | ||||||
Operating Properties
At the end of the year, iStar's operating property portfolio totaled $608.4 million, gross of $46.2 million of accumulated depreciation, and was comprised of $525.9 million of commercial and $82.5 million of residential real estate properties. During the quarter, the Company invested $15.2 million within its operating properties portfolio and received $34.0 million of proceeds from sales. These sales generated $5.1 million of gains.
Commercial Operating Properties
The Company’s commercial operating properties represent a diverse pool of assets across a broad range of geographies and collateral types including office, retail and hotel properties. These properties generated $21.0 million of revenue offset by $17.5 million of expenses during the quarter. At the end of the year, the Company had $337.2 million of stabilized assets and $188.7 million of transitional assets. iStar generally seeks to reposition
7
transitional assets with the objective of maximizing their values through the infusion of capital and intensive asset management efforts. The Company made significant progress on this goal, having either stabilized or sold approximately $450 million of operating properties including land developments repositioned into operating properties in 2016.
Commercial Operating Property Statistics | |||||||||||
$ in millions | |||||||||||
Stabilized Operating | Transitional Operating | Total | |||||||||
Q4'16 | Q3'16 | Q4'15 | Q4'16 | Q3'16 | Q4'15 | Q4'16 | Q3'16 | Q4'15 | |||
Gross book value | $337.2 | $243.8 | $123.8 | $188.7 | $184.7 | $448.0 | $525.9 | $428.5 | $571.8 | ||
% of total | 64% | 57% | 22% | 36% | 43% | 78% | 100% | 100% | 100% | ||
Occupancy | 86% | 86% | 89% | 54% | 55% | 65% | 74% | 72% | 74% | ||
Yield | 8.5% | 8.4% | 8.8% | 1.5% | 2.4% | 2.8% | 5.5% | 5.9% | 4.4% | ||
Residential Operating Properties
At the end of the year, the $82.5 million residential operating portfolio was comprised of 48 condominium units generally located within luxury projects in major U.S. cities.
Residential Operating Property Statistics (excluding fractional units) | ||||||
$ in millions | ||||||
Q4'16 | Q3'16 | Q4'15 | ||||
Condominium units sold | 11 | 11 | 12 | |||
Proceeds | $22.9 | $15.4 | $13.9 | |||
Income | $2.9 | $4.6 | $3.3 | |||
Land & Development
At the end of the year, the Company’s land & development portfolio totaled $1.04 billion, with eight projects in production, nine in development and 14 in the pre-development phase. These projects are collectively entitled for approximately 15,000 lots and units.
Land & Development Portfolio Overview | ||
$ in millions | ||
Wholly owned assets held for investment | $952.1 | |
Joint venture investments | 84.8 | |
Total | $1,036.9 | |
The Company's asset management efforts and capital investment have transformed its land portfolio from land that was only 20% properly positioned when it took ownership to a portfolio with approximately 90% of land properly positioned at the end of the year.
8
Land & Development Portfolio by Type | ||||||||
$ in millions | ||||||||
Master Planned Communities | Waterfront | Urban / Infill | Total | |||||
# of projects | 10 | 6 | 15 | 31 | ||||
In production | $181.6 | $139.7 | $53.6 | $374.9 | ||||
In development | 257.2 | 138.5 | 3.6 | 399.3 | ||||
Pre-development | 130.5 | 7.6 | 124.6 | 262.7 | ||||
Gross book value | $569.3 | $285.8 | $181.8 | $1,036.9 | ||||
Land & Development Activity for Q4'16 | ||||||||
Land development revenue | $8.0 | — | $6.0 | $14.0 | ||||
Land development cost of sales | (6.9 | ) | — | (4.3 | ) | (11.2 | ) | |
Gross margin | $1.1 | — | $1.7 | $2.8 | ||||
Income from sales of real estate | — | — | 8.8 | 8.8 | ||||
Earnings from land development equity method investments | 0.1 | 2.5 | (3.8 | ) | (1.2 | ) | ||
Total | $1.2 | $2.5 | $6.7 | $10.4 | ||||
Capital expenditures / Contributions | $14.5 | $1.3 | $4.6 | $20.4 | ||||
During the quarter, the Company transferred Grand Vista, which represented 8.8% of its land & development portfolio, into its stabilized operating property portfolio after successfully signing a lease with a Fortune 100 company covering the full use of the site. The lease has a 5-year term, with one three-year extension. Based on the terms of the lease, the initial net operating income of the property will be $7.5 million per year, versus $(0.3) million of annual net operating loss at the property prior to the lease signing.
In addition, iStar sold Artesia, a 30-acre land and development project in Scottsdale, AZ for $36.0 million to a newly formed 50/50 venture between iStar and Meritage Homes. iStar recognized $8.8 million of income from sales of real estate reflecting the share of the interest sold to a third party. Both venture partners contributed $7.0 million to the venture and iStar provided the venture with a $27.0 million senior loan. The venture will seek to develop new communities at the mixed-use project, including more than 500 luxury condominiums and townhouses, a private 10-acre recreational park with running and walking trails, resort-style pools and a 20,000-square-foot community clubhouse. The two-, three- and four-bedroom residences are expected to be priced from the low $400,000s to more than $1 million.
As previously discussed, iStar acquired, via deed-in-lieu, title to an infill land asset in downtown Chicago, IL which had previously served as collateral for a loan held by the Company.
9
Capital Markets and Balance Sheet
The Company is capitalized with unsecured and secured debt, preferred equity and common equity.
Capital Structure | ||
$ in millions | ||
Secured debt | $738.6 | |
Unsecured debt | $2,651.3 | |
Preferred equity (A) | $699.7 | |
Common equity (B) | $316.9 | |
Total equity (A) + (B) | $1,016.6 | |
Accumulated depreciation and amortization and general loan loss reserves (1) (C) | $497.0 | |
Adjusted common equity (B) + (C) | $813.9 | |
Adjusted total equity (A) + (B) + (C) | $1,513.6 | |
Note: Represents carrying value. | ||
(1) Accumulated depreciation and amortization includes iStar's proportionate share of accumulated depreciation and amortization relating to equity method investments. | ||
During the quarter, the Company retired $378.3 million of convertible unsecured notes at maturity with $369 million of cash and 815,000 shares of common stock. Along with the $21.8 million of convertible unsecured notes that were repurchased in the third quarter, the Company reduced its diluted share count by 27.7 million shares during the year.
In addition, the Company repurchased 10.2 million shares of its common stock during the year for $98.4 million, or an average price of $9.67 per share. Combined with the convertible notes that were repaid, the Company reduced its fully diluted shares outstanding in 2016 by 37.9 million or 30.1%. As of December 31, 2016, the Company had remaining authorization to repurchase up to $50.0 million of common stock available to repurchase under its stock repurchase program.
Shares Outstanding | |||||||||||
in millions | |||||||||||
Q4'16 | Q3'16 | Q2'16 | Q1'16 | Q4'15 | |||||||
Basic shares outstanding at end of period | 72.0 | 71.2 | 71.9 | 75.4 | 81.1 | ||||||
3.0% convertible notes / strike of $11.77 (if converted) (1) | — | 17.0 | 17.0 | 17.0 | 17.0 | ||||||
1.5% convertible notes / strike of $17.29 (if converted) (1) | — | 10.3 | 11.6 | 11.6 | 11.6 | ||||||
4.5% Series J conv. preferred / strike of $12.79 (if converted) | 15.6 | 15.6 | 15.6 | 15.6 | 15.6 | ||||||
Other securities | 0.7 | 0.8 | 0.8 | 0.8 | 0.8 | ||||||
Diluted shares outstanding at end of period | 88.3 | 114.9 | 116.9 | 120.4 | 126.1 | ||||||
(1) Matured on November 15, 2016 | |||||||||||
During the quarter, the Company arranged a new $170 million delayed draw secured term loan with Bank of America Merrill Lynch and J.P. Morgan. The facility bears interest at an
10
initial rate of LIBOR + 1.50%. At the end of the year, the Company had not yet drawn on the facility.
Subsequent to year end, the Company repriced its $500 million senior secured credit facility. The credit facility was repriced at par and bears interest at an annual rate of LIBOR + 3.75% with a 1.00% LIBOR floor, a 75 basis point reduction from the prior rate of LIBOR + 4.50% with a 1.00% LIBOR floor. Call protection was extended for six months. All other terms of the facility, including its June 2020 maturity and 1.25x required collateral coverage, remained the same.
The Company’s weighted average cost of debt for the fourth quarter was 5.7%. The Company’s leverage was 2.0x at the end of the quarter, within the Company’s targeted range of 2.0x – 2.5x.
Leverage at 12/31/16 | |||||||
$ in millions | |||||||
Book debt | $3,389.9 | Book equity (1) | $ | 1,016.6 | |||
Less: Cash and cash equivalents | (328.7 | ) | Add: Accumulated depreciation and amortization (2) | 473.7 | |||
Net book debt (A) | $3,061.2 | Add: General loan loss reserves | 23.3 | ||||
Sum of book equity, accumulated D&A and general loan loss reserves (B) | $1,513.6 | ||||||
Leverage (A) / (B) | 2.0x | ||||||
(1) Includes $699.7 million of preferred equity. (2) Accumulated depreciation and amortization includes iStar's proportionate share of accumulated depreciation and amortization relating to equity method investments. | |||||||
11
Liquidity
At the end of the year, iStar had unrestricted cash and combined capacity on its credit facilities of $748.7 million.
Liquidity at 12/31/16 | |
$ in millions | |
Unrestricted cash | $328.7 |
Revolving credit facility capacity | $250.0 |
Delayed draw term loan | $170.0 |
Total liquidity | $748.7 |
On November 30th, iStar was added as a constituent to the MSCI US REIT Index (RMZ), reflecting its hybrid business model and highly diversified portfolio. The inclusion in the high-profile index will make iStar's investment platform more visible and allow it to reach a broader pool of potential investors.
Ÿ Ÿ Ÿ
iStar (NYSE: STAR) finances, invests in and develops real estate and real estate related projects as part of its fully-integrated investment platform. Building on over two decades of experience and more than $35 billion of transactions, iStar brings uncommon capabilities and new ways of thinking to commercial real estate and adapts its investment strategy to changing market conditions. The Company is structured as a real estate investment trust (“REIT”), with a diversified portfolio focused on larger assets located in major metropolitan markets.
iStar will hold a quarterly earnings conference call at 10:00 a.m. ET today, February 24, 2017. This conference call will be broadcast live over the internet and can be accessed by all interested parties through iStar’s website, www.istar.com. To listen to the live call, please go to the website’s “Investor” section at least 15 minutes prior to the start of the call to register, download and install any necessary audio software. For those who are not available to listen to the live broadcast, a replay will be available shortly after the call on iStar's website.
Note: Statements in this press release which are not historical fact may be deemed forward-looking statements within the meaning of Section 27A of the Securities Act of 1933 and Section 21E of the Securities Exchange Act of 1934. Although iStar believes the expectations reflected in any forward-looking statements are based on reasonable assumptions, the Company can give no assurance that its expectations will be attained. Factors that could cause actual results to differ materially from iStar’s expectations include general economic conditions and conditions in the commercial real estate and credit markets, the Company’s ability to generate liquidity and to repay indebtedness as it comes due, additional loan loss provisions, the amount and timing of asset sales, changes in NPLs, repayment levels, the Company's ability to make new investments, the Company’s ability
12
to maintain compliance with its debt covenants, the Company’s ability to generate income and gains from operating properties and land and other risks detailed from time to time in iStar SEC reports.
Company Contact:
Jason Fooks, Vice President of Investor Relations & Marketing
1114 Avenue of the Americas
New York, NY 10036
(212) 930-9400
investors@istar.com
13
iStar
Consolidated Statements of Operations
(In thousands)
(unaudited)
Three Months Ended December 31, | Twelve Months Ended December 31, | |||||||||||||||
2016 | 2015 | 2016 | 2015 | |||||||||||||
REVENUES | ||||||||||||||||
Operating lease income | $ | 52,149 | $ | 58,730 | $ | 213,018 | $ | 229,720 | ||||||||
Interest income | 29,276 | 32,463 | 129,153 | 134,687 | ||||||||||||
Other income | 11,435 | 9,718 | 46,515 | 49,931 | ||||||||||||
Land development revenue | 13,951 | 71,114 | 88,340 | 100,216 | ||||||||||||
Total revenues | $ | 106,811 | $ | 172,025 | $ | 477,026 | $ | 514,554 | ||||||||
COST AND EXPENSES | ||||||||||||||||
Interest expense | $ | 53,225 | $ | 57,302 | $ | 221,398 | $ | 224,639 | ||||||||
Real estate expense | 33,344 | 35,607 | 138,422 | 146,750 | ||||||||||||
Land development cost of sales | 11,166 | 44,554 | 62,007 | 67,382 | ||||||||||||
Depreciation and amortization | 12,145 | 15,443 | 54,329 | 65,247 | ||||||||||||
General and administrative(1) | 21,594 | 18,757 | 84,027 | 81,277 | ||||||||||||
(Recovery of) provision for loan losses | 235 | 5,623 | (12,514 | ) | 36,567 | |||||||||||
Impairment of assets | 2,731 | 4,934 | 14,484 | 10,524 | ||||||||||||
Other expense | 1,142 | 29 | 5,883 | 6,374 | ||||||||||||
Total costs and expenses | $ | 135,582 | $ | 182,249 | $ | 568,036 | $ | 638,760 | ||||||||
Income (loss) before other items | $ | (28,771 | ) | $ | (10,224 | ) | $ | (91,010 | ) | $ | (124,206 | ) | ||||
Income from sales of real estate | 16,910 | 27,794 | 105,296 | 93,816 | ||||||||||||
Earnings from equity method investments | 3,095 | 6,249 | 77,349 | 32,153 | ||||||||||||
Income tax benefit (expense) | 306 | (3,843 | ) | 10,166 | (7,639 | ) | ||||||||||
Loss on early extinguishment of debt | (1 | ) | (2 | ) | (1,619 | ) | (281 | ) | ||||||||
Net income (loss) | $ | (8,461 | ) | $ | 19,974 | $ | 100,182 | $ | (6,157 | ) | ||||||
Net (income) loss attributable to noncontrolling interests | 2,039 | 546 | (4,876 | ) | 3,722 | |||||||||||
Net income (loss) attributable to iStar | $ | (6,422 | ) | $ | 20,520 | $ | 95,306 | $ | (2,435 | ) | ||||||
Preferred dividends | (12,830 | ) | (12,830 | ) | (51,320 | ) | (51,320 | ) | ||||||||
Net (income) loss allocable to HPU holders and Participating Security holders(2) | — | (5 | ) | (14 | ) | 1,080 | ||||||||||
Net income (loss) allocable to common shareholders | $ | (19,252 | ) | $ | 7,685 | $ | 43,972 | $ | (52,675 | ) | ||||||
_______________________________________________________________________________
(1) For the three months ended December 31, 2016 and 2015, includes $3,245 and $1,947 of stock-based compensation expense, respectively. For the twelve months ended December 31, 2016 and 2015, includes $10,889 and $12,013 of stock-based compensation expense, respectively.
(2) HPU Holders were current and former Company employees who purchased high performance common stock units under the Company's High Performance Unit Program. On August 13, 2015, the Company repurchased and retired 100% of the outstanding HPU shares through an exchange offer. Participating Security holders are non-employee directors who hold common stock equivalents and restricted stock awards granted under the Company's LTIP who are eligible to participate in dividends.
14
iStar
Supplemental Information
(In thousands, except per share data)
(unaudited)
Three Months Ended December 31, | Twelve Months Ended December 31, | |||||||||||||||
2016 | 2015 | 2016 | 2015 | |||||||||||||
ADJUSTED INCOME (1) | ||||||||||||||||
Reconciliation of Net Income to Adjusted Income | ||||||||||||||||
Net income (loss) allocable to common shareholders | $ | (19,252 | ) | $ | 7,685 | $ | 43,972 | $ | (52,675 | ) | ||||||
Add: Depreciation and amortization | 14,341 | 17,207 | 64,447 | 72,132 | ||||||||||||
Add: (Recovery of) provision for loan losses | 235 | 5,623 | (12,514 | ) | 36,567 | |||||||||||
Add: Impairment of assets | 6,331 | 6,100 | 18,999 | 18,509 | ||||||||||||
Add: Stock-based compensation expense | 3,245 | 1,947 | 10,889 | 12,013 | ||||||||||||
Add: Loss on early extinguishment of debt | 1 | 2 | 1,619 | 281 | ||||||||||||
Less: Losses on charge-offs and dispositions | (2,225 | ) | (51,723 | ) | (14,827 | ) | (55,437 | ) | ||||||||
Less: HPU/Participating Security allocation | — | — | (23 | ) | (1,706 | ) | ||||||||||
Adjusted income allocable to common shareholders | $ | 2,676 | $ | (13,159 | ) | $ | 112,562 | $ | 29,684 | |||||||
_______________________________________________________________________________
(1) Adjusted Income allocable to common shareholders should be examined in conjunction with net income (loss) as shown in the Consolidated Statements of Operations. This non-GAAP financial measure should not be considered as an alternative to net income (determined in accordance with GAAP) or to cash flows from operating activities (determined in accordance with GAAP) as a measure of the Company’s liquidity, nor is it indicative of funds available to fund the Company’s cash needs or available for distribution to shareholders. It should be noted that the Company’s manner of calculating this non-GAAP financial measure may differ from the calculations of similarly-titled measures by other companies. Management considers this non-GAAP financial measure as supplemental information to net income in analyzing the performance of our underlying business. Depreciation and amortization includes our proportionate share of depreciation and amortization expense relating to equity method investments and excludes the portion of depreciation and amortization expense allocable to non-controlling interests. Impairment of assets includes impairments on cost and equity method investments recorded in other income and earnings from equity method investments, respectively. Effective in the second quarter 2016, the Company modified its presentation of Adjusted Income to include losses on charge-offs and dispositions of previously impaired or reserved assets to provide a more informative metric for investors to help evaluate our operating performance. Losses on charge-offs and dispositions represents the impact of charge-offs and dispositions realized during the period. These charge-offs and dispositions were taken on assets that were previously impaired for GAAP and reflected in net income but not in Adjusted Income.
Reconciliation of Adjusted Income per Share Guidance
to Net Income per Share Guidance
For the Year Ending | |
December 31, 2017 | |
Targeted Net Income per Diluted Common Share | $0.65 |
Add: Depreciation and amortization | $0.67 - $0.75 |
Add: Other non-cash adjustments | $0.51 - $0.59 |
Less: Losses on charge-offs and dispositions | ($0.36) - ($0.44) |
Targeted Adjusted Income per Diluted Common Share | $1.50 |
15
iStar
Earnings Per Share Information
(In thousands, except per share data)
(unaudited)
Three Months Ended December 31, | Twelve Months Ended December 31, | |||||||||||||||
2016 | 2015 | 2016 | 2015 | |||||||||||||
EPS INFORMATION FOR COMMON SHARES | ||||||||||||||||
Income (loss) from continuing operations attributable to iStar(1)(2) | ||||||||||||||||
Basic | $ | (0.27 | ) | $ | 0.09 | $ | 0.60 | $ | (0.62 | ) | ||||||
Diluted | $ | (0.27 | ) | $ | 0.09 | $ | 0.55 | $ | (0.62 | ) | ||||||
Net income (loss) | ||||||||||||||||
Basic | $ | (0.27 | ) | $ | 0.09 | $ | 0.60 | $ | (0.62 | ) | ||||||
Diluted | $ | (0.27 | ) | $ | 0.09 | $ | 0.55 | $ | (0.62 | ) | ||||||
Adjusted income | ||||||||||||||||
Basic | $ | 0.04 | $ | (0.16 | ) | $ | 1.53 | $ | 0.35 | |||||||
Diluted | $ | 0.04 | $ | (0.16 | ) | $ | 1.15 | $ | 0.35 | |||||||
Weighted average shares outstanding | ||||||||||||||||
Basic | 71,603 | 83,162 | 73,453 | 84,987 | ||||||||||||
Diluted (for net income per share) | 71,603 | 83,581 | 98,467 | 84,987 | ||||||||||||
Diluted (for adjusted income per share) | 72,038 | 83,162 | 114,102 | 85,395 | ||||||||||||
Common shares outstanding at end of period | 72,042 | 81,109 | 72,042 | 81,109 | ||||||||||||
_______________________________________________________________________________
(1) Including preferred dividends, net (income) loss attributable to noncontrolling interests and income from sales of real estate.
(2) On August 13, 2015, the Company repurchased and retired 100% of the outstanding high performance unit (HPU) shares through an exchange offer.
16
iStar
Consolidated Balance Sheets
(In thousands)
(unaudited)
As of | As of | ||||||
December 31, 2016 | December 31, 2015 | ||||||
ASSETS | |||||||
Real estate | |||||||
Real estate, at cost | $ | 1,906,592 | $ | 2,050,541 | |||
Less: accumulated depreciation | (414,840 | ) | (456,558 | ) | |||
Real estate, net | $ | 1,491,752 | $ | 1,593,983 | |||
Real estate available and held for sale | 83,764 | 137,274 | |||||
$ | 1,575,516 | $ | 1,731,257 | ||||
Land and development, net | 945,565 | 1,001,963 | |||||
Loans receivable and other lending investments, net | 1,450,439 | 1,601,985 | |||||
Other investments | 214,406 | 254,172 | |||||
Cash and cash equivalents | 328,744 | 711,101 | |||||
Accrued interest and operating lease income receivable, net | 14,775 | 18,436 | |||||
Deferred operating lease income receivable | 96,420 | 97,421 | |||||
Deferred expenses and other assets, net | 199,649 | 181,457 | |||||
Total assets | $ | 4,825,514 | $ | 5,597,792 | |||
LIABILITIES AND EQUITY | |||||||
Accounts payable, accrued expenses and other liabilities | $ | 211,570 | $ | 214,835 | |||
Loan participations payable, net | 159,321 | 152,086 | |||||
Debt obligations, net | 3,389,908 | 4,118,823 | |||||
Total liabilities | $ | 3,760,799 | $ | 4,485,744 | |||
Redeemable noncontrolling interests | $ | 5,031 | $ | 10,718 | |||
Total iStar shareholders' equity | $ | 1,016,564 | $ | 1,059,112 | |||
Noncontrolling interests | 43,120 | 42,218 | |||||
Total equity | $ | 1,059,684 | $ | 1,101,330 | |||
Total liabilities and equity | $ | 4,825,514 | $ | 5,597,792 | |||
17
iStar
Segment Analysis
(In thousands)
(unaudited)
FOR THE THREE MONTHS ENDED DECEMBER 31, 2016 | |||||||||||||||||||||||
Real Estate Finance | Net Lease | Operating Properties | Land & Dev | Corporate / Other | Total | ||||||||||||||||||
Operating lease income | $ | — | $ | 38,765 | $ | 13,277 | $ | 107 | $ | — | $ | 52,149 | |||||||||||
Interest income | 29,276 | — | — | — | — | 29,276 | |||||||||||||||||
Other income | 1,986 | 709 | 7,864 | 281 | 595 | 11,435 | |||||||||||||||||
Land development revenue | — | — | — | 13,951 | — | 13,951 | |||||||||||||||||
Earnings from equity method investments | — | 953 | 2,299 | (1,177 | ) | 1,020 | 3,095 | ||||||||||||||||
Income from sales of real estate | — | 5,242 | 2,867 | 8,801 | — | 16,910 | |||||||||||||||||
Total revenue and other earnings | $ | 31,262 | $ | 45,669 | $ | 26,307 | $ | 21,963 | $ | 1,615 | $ | 126,816 | |||||||||||
Real estate expense | — | (5,024 | ) | (19,358 | ) | (8,962 | ) | — | (33,344 | ) | |||||||||||||
Land development cost of sales | — | — | — | (11,166 | ) | — | (11,166 | ) | |||||||||||||||
Other expense | (1,086 | ) | — | — | — | (56 | ) | (1,142 | ) | ||||||||||||||
Allocated interest expense | (13,910 | ) | (16,850 | ) | (5,577 | ) | (8,848 | ) | (8,040 | ) | (53,225 | ) | |||||||||||
Allocated general and administrative(1) | (3,699 | ) | (4,450 | ) | (1,564 | ) | (3,601 | ) | (5,035 | ) | (18,349 | ) | |||||||||||
Segment profit (loss) | $ | 12,567 | $ | 19,345 | $ | (192 | ) | $ | (10,614 | ) | $ | (11,516 | ) | $ | 9,590 | ||||||||
_______________________________________________________________________________
(1) Excludes $3,245 of stock-based compensation expense.
18
iStar
Segment Analysis
(In thousands)
(unaudited)
FOR THE TWELVE MONTHS ENDED DECEMBER 31, 2016 | |||||||||||||||||||||||
Real Estate Finance | Net Lease | Operating Properties | Land & Dev | Corporate / Other | Total | ||||||||||||||||||
Operating lease income | $ | — | $ | 148,002 | $ | 64,593 | $ | 423 | $ | — | $ | 213,018 | |||||||||||
Interest income | 129,153 | — | — | — | — | 129,153 | |||||||||||||||||
Other income | 4,658 | 1,633 | 33,216 | 3,170 | 3,838 | 46,515 | |||||||||||||||||
Land development revenue | — | — | — | 88,340 | — | 88,340 | |||||||||||||||||
Earnings from equity method investments | — | 3,567 | 33,863 | 30,012 | 9,907 | 77,349 | |||||||||||||||||
Income from sales of real estate | — | 21,138 | 75,357 | 8,801 | — | 105,296 | |||||||||||||||||
Total revenue and other earnings | $ | 133,811 | $ | 174,340 | $ | 207,029 | $ | 130,746 | $ | 13,745 | $ | 659,671 | |||||||||||
Real estate expense | — | (19,058 | ) | (82,401 | ) | (36,963 | ) | — | (138,422 | ) | |||||||||||||
Land development cost of sales | — | — | — | (62,007 | ) | — | (62,007 | ) | |||||||||||||||
Other expense | (2,719 | ) | — | — | — | (3,164 | ) | (5,883 | ) | ||||||||||||||
Allocated interest expense | (57,787 | ) | (65,880 | ) | (23,156 | ) | (34,888 | ) | (39,687 | ) | (221,398 | ) | |||||||||||
Allocated general and administrative(1) | (15,311 | ) | (17,585 | ) | (6,574 | ) | (13,693 | ) | (19,975 | ) | (73,138 | ) | |||||||||||
Segment profit (loss) | $ | 57,994 | $ | 71,817 | $ | 94,898 | $ | (16,805 | ) | $ | (49,081 | ) | $ | 158,823 | |||||||||
_______________________________________________________________________________
(1) Excludes $10,889 of stock-based compensation expense.
AS OF DECEMBER 31, 2016 | |||||||||||||||||||||||
Real Estate Finance | Net Lease | Operating Properties | Land & Dev | Corporate / Other | Total | ||||||||||||||||||
Real estate | |||||||||||||||||||||||
Real estate, at cost | $ | — | $ | 1,384,255 | $ | 522,337 | $ | — | $ | — | $ | 1,906,592 | |||||||||||
Less: accumulated depreciation | — | (368,665 | ) | (46,175 | ) | — | — | (414,840 | ) | ||||||||||||||
Real estate, net | $ | — | $ | 1,015,590 | $ | 476,162 | $ | — | $ | — | $ | 1,491,752 | |||||||||||
Real estate available and held for sale | — | 1,284 | 82,480 | — | — | 83,764 | |||||||||||||||||
Total real estate | $ | — | $ | 1,016,874 | $ | 558,642 | $ | — | $ | — | $ | 1,575,516 | |||||||||||
Land and development, net | — | — | — | 945,565 | — | 945,565 | |||||||||||||||||
Loans receivable and other lending investments, net | 1,450,439 | — | — | — | — | 1,450,439 | |||||||||||||||||
Other investments | — | 92,669 | 3,583 | 84,804 | 33,350 | 214,406 | |||||||||||||||||
Total portfolio assets | $ | 1,450,439 | $ | 1,109,543 | $ | 562,225 | $ | 1,030,369 | $ | 33,350 | $ | 4,185,926 | |||||||||||
Cash and other assets | 639,588 | ||||||||||||||||||||||
Total assets | $ | 4,825,514 | |||||||||||||||||||||
19
iStar
Supplemental Information
(In thousands)
(unaudited)
Twelve Months Ended December 31, 2016 | |||||||||||
OPERATING STATISTICS | |||||||||||
Expense Ratio | |||||||||||
General and administrative expenses - trailing twelve months (A) | $ | 84,027 | |||||||||
Average total assets (B) | $ | 5,272,579 | |||||||||
Expense Ratio (A) / (B) | 1.6 | % | |||||||||
As of | |||||||||||
December 31, 2016 | |||||||||||
UNENCUMBERED ASSETS / UNSECURED DEBT | |||||||||||
Unencumbered assets (C)(1) | $ | 3,777,656 | |||||||||
Unsecured debt (D) | $ | 2,669,772 | |||||||||
Unencumbered Assets / Unsecured Debt (C) / (D) | 1.4x | ||||||||||
UNFUNDED COMMITMENTS | |||||||||||
Performance-based commitments(2) | $ | 406,477 | |||||||||
Strategic investments | 45,540 | ||||||||||
Total Unfunded Commitments | $ | 452,017 | |||||||||
LOAN RECEIVABLE CREDIT STATISTICS | As of | ||||||||||
December 31, 2016 | December 31, 2015 | ||||||||||
Carrying value of NPLs / | |||||||||||
As a percentage of total carrying value of loans | $ | 191,696 | 14.0 | % | $ | 60,327 | 3.9 | % | |||
Total reserve for loan losses / | |||||||||||
As a percentage of total gross carrying value of loans(3) | $ | 85,545 | 5.9 | % | $ | 108,165 | 6.6 | % | |||
_______________________________________________________________________________
(1) Unencumbered assets are calculated in accordance with the indentures governing the Company's unsecured debt securities.
(2) Excludes $158.7 million of commitments on loan participations sold that are not the obligation of the Company but are consolidated on the Company's balance sheet.
(3) Gross carrying value represents iStar's carrying value of loans, gross of loan loss reserves.
20
iStar
Supplemental Information
(In millions)
(unaudited)
PORTFOLIO STATISTICS AS OF DECEMBER 31, 2016(1) | |||||||||||||||||||||||
Property Type | Real Estate Finance | Net Lease | Operating Properties | Land & Dev | Total | % of Total | |||||||||||||||||
Office / Industrial | $ | 168 | $ | 772 | $ | 122 | $ | — | $ | 1,062 | 23 | % | |||||||||||
Land & Development | — | — | — | 1,037 | 1,037 | 22 | % | ||||||||||||||||
Hotel | 333 | 136 | 108 | — | 577 | 12 | % | ||||||||||||||||
Entertainment / Leisure | — | 490 | — | — | 490 | 11 | % | ||||||||||||||||
Mixed Use / Collateral | 292 | — | 171 | — | 463 | 10 | % | ||||||||||||||||
Condominium | 381 | — | 82 | — | 463 | 10 | % | ||||||||||||||||
Other Property Types | 237 | 23 | — | — | 260 | 6 | % | ||||||||||||||||
Retail | 63 | 57 | 125 | — | 245 | 5 | % | ||||||||||||||||
Strategic Investments | — | — | — | — | 34 | 1 | % | ||||||||||||||||
Total | $ | 1,474 | $ | 1,478 | $ | 608 | $ | 1,037 | $ | 4,631 | 100 | % | |||||||||||
Geography | Real Estate Finance | Net Lease | Operating Properties | Land & Dev | Total | % of Total | |||||||||||||||||
Northeast | $ | 790 | $ | 380 | $ | 47 | $ | 234 | $ | 1,451 | 31 | % | |||||||||||
West | 87 | 305 | 38 | 362 | 792 | 17 | % | ||||||||||||||||
Southeast | 127 | 235 | 150 | 157 | 669 | 15 | % | ||||||||||||||||
Mid-Atlantic | 168 | 153 | 54 | 219 | 594 | 13 | % | ||||||||||||||||
Southwest | 77 | 184 | 239 | 28 | 528 | 11 | % | ||||||||||||||||
Central | 151 | 79 | 66 | 32 | 328 | 7 | % | ||||||||||||||||
Various | 74 | 142 | 14 | 5 | 235 | 5 | % | ||||||||||||||||
Strategic Investments | — | — | — | — | 34 | 1 | % | ||||||||||||||||
Total | $ | 1,474 | $ | 1,478 | $ | 608 | $ | 1,037 | $ | 4,631 | 100 | % | |||||||||||
_______________________________________________________________________________
(1) Based on carrying value of the Company's total investment portfolio, gross of accumulated depreciation and general loan loss reserves.
21