Attached files
| file | filename |
|---|---|
| EX-32.2 - 2016 Q4 EXHIBIT 32.2 - FelCor Lodging Trust Inc | a2016q410kexh322.htm |
| EX-32.1 - 2016 Q4 EXHIBIT 32.1 - FelCor Lodging Trust Inc | a2016q410kexh321.htm |
| EX-31.4 - 2016 Q4 EXHIBIT 31.4 - FelCor Lodging Trust Inc | a2016q410kexh314.htm |
| EX-31.3 - 2016 Q4 EXHIBIT 31.3 - FelCor Lodging Trust Inc | a2016q410kexh313.htm |
| EX-31.2 - 2016 Q4 EXHIBIT 31.2 - FelCor Lodging Trust Inc | a2016q410kexh312.htm |
| EX-31.1 - 2016 Q4 EXHIBIT 31.1 - FelCor Lodging Trust Inc | a2016q410kexh311.htm |
| EX-23 - 2016 Q4 EXHIBIT 23 - FelCor Lodging Trust Inc | a2016q410kexh23.htm |
| EX-21.2 - 2016 Q4 EXHIBIT 21.2 - FelCor Lodging Trust Inc | a2016q410kexh212.htm |
| EX-21.1 - 2016 Q4 EXHIBIT 21.1 - FelCor Lodging Trust Inc | a2016q410kexh211.htm |
UNITED STATES
SECURITIES AND EXCHANGE COMMISSION
Washington, D.C. 20549
FORM 10-K
(Mark One) | ||
x | ANNUAL REPORT PURSUANT TO SECTION 13 OR 15(d) OF | |
THE SECURITIES EXCHANGE ACT OF 1934 | ||
For the fiscal year ended December 31, 2016 | ||
OR
o | TRANSITION REPORT PURSUANT TO SECTION 13 OR 15(d) OF | |
THE SECURITIES EXCHANGE ACT OF 1934 | ||
For the transition period from to | ||
Commission file number: 001-14236 | (FelCor Lodging Trust Incorporated) | ||
Commission file number: 333-39595-01 | (FelCor Lodging Limited Partnership) | ||
FelCor Lodging Trust Incorporated
FelCor Lodging Limited Partnership
(Exact Name of Registrant as Specified in Its Charter)
Maryland | (FelCor Lodging Trust Incorporated) | 75-2541756 | |||
Delaware | (FelCor Lodging Limited Partnership) | 75-2544994 | |||
(State or Other Jurisdiction of Incorporation or Organization) | (I.R.S. Employer Identification No.) | ||||
125 E. John Carpenter Freeway, Suite 1600, Irving, Texas | 75062 | ||
(Address of Principal Executive Offices) | (Zip Code) | ||
(972) 444-4900
(Registrant’s Telephone Number, Including Area Code)
Securities registered pursuant to Section 12(b) of the Act:
Title of each class | Name of each exchange on which registered | ||||||||||||||||
FelCor Lodging Trust Incorporated: | |||||||||||||||||
Common Stock | New York Stock Exchange | ||||||||||||||||
$1.95 Series A Cumulative Convertible Preferred Stock | New York Stock Exchange | ||||||||||||||||
FelCor Lodging Limited Partnership: | |||||||||||||||||
None | |||||||||||||||||
Securities registered pursuant to Section 12(g) of the Act:
None
(Title of class)
Indicate by check mark if the registrant is a well-known seasoned issuer, as defined in Rule 405 of the Securities Act.
FelCor Lodging Trust Incorporated | þ | Yes | ¨ | No | ||
FelCor Lodging Limited Partnership | ¨ | Yes | þ | No | ||
Indicate by check mark if the registrant is not required to file reports pursuant to Section 13 or Section 15(d) of the Act.
FelCor Lodging Trust Incorporated | ¨ | Yes | þ | No | ||
FelCor Lodging Limited Partnership | þ | Yes | ¨ | No | ||
Indicate by check mark whether the registrant (1) has filed all reports required to be filed by Section 13 or 15 (d) of the Securities Exchange Act of 1934 during the preceding 12 months (or for such shorter period that the registrant was required to file such reports), and (2) has been subject to such filing requirements for the past 90 days.
FelCor Lodging Trust Incorporated | þ | Yes | ¨ | No | ||
FelCor Lodging Limited Partnership | ¨ | Yes | þ | No | ||
Note: As a voluntary filer not subject to filing requirements of Section 13 or 15(d) of the Exchange Act, the registrant has filed all reports pursuant to Section 13 or 15(d) as if the registrant was subject to such filing requirements.
Indicate by check mark whether the registrant has submitted electronically and posted on its corporate website, if any, every Interactive Data File required to be submitted and posted pursuant to Rule 405 of Regulation S-T (§232.405 of this chapter) during the preceding 12 months (or for such shorter period that the registrant was required to submit and post such files).
FelCor Lodging Trust Incorporated | þ | Yes | ¨ | No | ||
FelCor Lodging Limited Partnership | þ | Yes | ¨ | No | ||
Indicate by check mark if disclosure of delinquent filers pursuant to Item 405 of Regulation S-K is not contained herein, and will not be contained, to the best of registrant’s knowledge, in definitive proxy or information statements incorporated by reference in Part III of this Form 10-K or any amendment to this Form 10-K. þ | ||||
Indicate by check mark whether the registrant is a large accelerated filer, an accelerated filer, a non-accelerated filer, or a smaller reporting company. See definition of “large accelerated filer,” “accelerated filer” and “smaller reporting company” in Rule 12b-2 of the Exchange Act.
FelCor Lodging Trust Incorporated: | ||
Large accelerated filer þ | Accelerated filer ¨ | |
Non-accelerated filer o (Do not check if a smaller reporting company) | Smaller reporting company o | |
FelCor Lodging Limited Partnership: | ||
Large accelerated filer o | Accelerated filer ¨ | |
Non-accelerated filer þ (Do not check if a smaller reporting company) | Smaller reporting company o | |
Indicate by check mark whether the registrant is a shell company (as defined in Rule 12b-2 of the Exchange Act).
FelCor Lodging Trust Incorporated | o | Yes | þ | No | ||
FelCor Lodging Limited Partnership | o | Yes | þ | No | ||
The aggregate market value of shares of common stock held by non-affiliates of FelCor Lodging Trust Incorporated as of June 30, 2016, computed by reference to the price at which its common stock was last sold at June 30, 2016, was approximately $837 million. | ||||||||||||||||||||
As of February 20, 2017, FelCor Lodging Trust Incorporated had issued and outstanding 138,103,326 shares of common stock. | ||||||||||||||||||||
DOCUMENTS INCORPORATED BY REFERENCE | ||||||||||||||||||||
Portions of FelCor Lodging Trust Incorporated’s definitive Proxy Statement pertaining to its 2017 Annual Meeting of Stockholders (the “Proxy Statement”), filed or to be filed not later than 120 days after the end of the fiscal year pursuant to Regulation 14A, is incorporated herein by reference into Part III. | ||||||||||||||||||||
EXPLANATORY NOTE
This annual report on Form 10-K for the fiscal year ended December 31, 2016, combines the filings for FelCor Lodging Trust Incorporated, or FelCor, and FelCor Lodging Limited Partnership, or FelCor LP. Where it is important to distinguish between the two, we either refer specifically to FelCor or FelCor LP. Otherwise we use the terms “we” or “our” to refer to FelCor and FelCor LP, collectively (including their consolidated subsidiaries), unless the context indicates otherwise.
FelCor is a Maryland corporation operating as a real estate investment trust, or REIT, and is the sole general partner, and the owner of a greater than 99% partnership interest in, FelCor LP. Through FelCor LP, FelCor owns hotels and conducts business. As the sole general partner of FelCor LP, FelCor has exclusive and complete control of FelCor LP’s day-to-day management.
We believe combining periodic reports for FelCor and FelCor LP into a single combined report results in the following benefits:
• | presents our business as a whole (the same way management views and operates the business); |
• | eliminates duplicative disclosure and provides a more streamlined presentation (a substantial portion of our disclosure applies to both FelCor and FelCor LP); and |
• | saves time and cost by preparing combined reports instead of separate reports. |
We operate the company as one enterprise. The employees of FelCor direct the management and operation of FelCor LP. With sole control of FelCor LP, FelCor consolidates FelCor LP for financial reporting purposes. FelCor has no assets other than its investment in FelCor LP and no liabilities separate from FelCor LP. Therefore, the reported assets and liabilities for FelCor and FelCor LP are substantially identical.
FelCor is a REIT with publicly-traded equity, while FelCor LP is a partnership with no publicly-traded equity. This difference is reflected in the financial statements in the equity (or partners’ capital) section of the consolidated balance sheets and in the consolidated statements of equity (or partners’ capital). Apart from the different equity treatment, the consolidated financial statements for FelCor and FelCor LP are nearly identical, except the net income (loss) attributable to redeemable noncontrolling interests in FelCor LP is deducted from FelCor’s net income (loss) in order to arrive at net income (loss) attributable to FelCor common stockholders. The noncontrolling interest is included in net income (loss) attributable to FelCor LP common unitholders. The holders of noncontrolling interests in FelCor LP are unaffiliated with FelCor and, in aggregate, hold less than 1% of the operating partnership units.
We present the sections in this report combined unless separate disclosure is required for clarity.
FELCOR LODGING TRUST INCORPORATED and
FELCOR LODGING LIMITED PARTNERSHIP
INDEX
Item No. | Page | ||
PART I | |||
Item 1. | Business | ||
Item 1A. | Risk Factors | ||
Item 1B. | Unresolved Staff Comments | ||
Item 2. | Properties | ||
Item 3. | Legal Proceedings | ||
Item 4. | Mine Safety Disclosures | ||
PART II | |||
Item 5. | Market for Registrant’s Common Equity, Related Stockholder Matters and Issuer Purchases of Equity Securities | ||
Item 6. | Selected Financial Data | ||
Item 7. | Management’s Discussion and Analysis of Financial Condition and Results of Operations | ||
Item 7A. | Quantitative and Qualitative Disclosures About Market Risk | ||
Item 8. | Financial Statements and Supplementary Data | ||
Item 9. | Changes in and Disagreements With Accountants on Accounting and Financial Disclosure | ||
Item 9A. | Controls and Procedures | ||
PART III | |||
Item 10. | Directors, Executive Officers of the Registrant and Corporate Governance | ||
Item 11. | Executive Compensation | ||
Item 12. | Security Ownership of Certain Beneficial Owners and Management and Related Stockholder Matters | ||
Item 13. | Certain Relationships, Related Transactions and Director Independence | ||
Item 14. | Principal Accountant Fees and Services | ||
PART IV | |||
Item 15. | Exhibits and Financial Statement Schedules | ||
Item 16. | Form 10-K Summary | 126 | |
SIGNATURES | |||
This Annual Report contains registered trademarks and service marks, including (but not limited to) Airbnb, DoubleTree Suites by Hilton, Embassy Suites Hotels, Fairmont, Hilton, Holiday Inn, The Knickerbocker, Marriott, Morgans, Renaissance, Royalton, Sheraton, VRBO, Walt Disney World, Wyndham and Wyndham Grand.
2
Disclosure Regarding Forward Looking Statements
Our disclosure and analysis in this Form 10-K and in FelCor’s 2016 Annual Report to Stockholders may contain forward-looking statements that set forth anticipated results based on management’s plans and assumptions. From time to time, we may also provide forward-looking statements in other materials we release to the public. Such statements reflect our current expectations or forecasts of future events; they do not relate strictly to historical or current facts. We have tried, wherever possible, to identify each such statement by using words such as “anticipate,” “estimate,” “expect,” “project,” “intend,” “plan,” “believe,” “will,” “target,” “forecast,” “continue” or similar expressions. In particular, these forward-looking statements may include those relating to future actions (including future acquisitions or dispositions and future capital expenditure plans) and future performance or expenses.
We cannot guarantee that any future results discussed in any forward-looking statements will be realized, although we believe that we have been prudent in our plans and assumptions. Achievement of future results is subject to risks, uncertainties and potentially inaccurate assumptions, including those discussed in Item 1A, Risk Factors. Should known or unknown risks or uncertainties materialize, or should underlying assumptions prove inaccurate, actual results could differ materially from past results and those results anticipated, estimated or projected. You should bear this in mind as you consider forward-looking statements.
We undertake no obligation to update forward-looking statements publicly, whether as a result of new information, future events or otherwise. You should consult our subsequent disclosures or related discussions in our Quarterly Reports on Form 10-Q and Current Reports on Form 8-K that we file with the Securities and Exchange Commission, or the SEC. Also note that, in our risk factors, we provide a cautionary discussion of risks, uncertainties and possibly inaccurate assumptions relevant to our business. These are factors that, individually or in the aggregate, we believe could cause our actual results to differ materially from past results and those results anticipated, estimated or projected. We note these factors for investors as permitted by the Private Securities Litigation Reform Act of 1995. It is not possible to predict or identify all such risk factors. Consequently, you should not consider the risk factor discussion to be a complete discussion of all of the potential risks or uncertainties that could affect our business.
3
PART I
Item 1. Business
About FelCor and FelCor LP
FelCor Lodging Trust Incorporated (NYSE:FCH), or FelCor, is a Maryland corporation operating as a real estate investment trust, or REIT. FelCor is the sole general partner of, and the owner of a greater than 99.5% partnership interest in, FelCor Lodging Limited Partnership, or FelCor LP, through which we held ownership interests in 39 hotels with 11,500 rooms at December 31, 2016. At December 31, 2016, we had an aggregate of 138,600,280 shares and units outstanding, consisting of 137,990,097 shares of FelCor common stock and 610,183 units of FelCor LP limited partnership interest not owned by FelCor.
Business Strategy
Strategy and Objectives. Our goal is to deliver returns to stockholders through earnings growth, asset appreciation and sustainable dividends. We strive to achieve this goal by building a well-maintained and diversified portfolio of high quality hotels in strategic locations, leveraging our core competencies to enhance the quality and earnings potential of our hotels, and continuing to enhance our balance sheet flexibility and strength while reducing our cost of capital.
Our core portfolio consists primarily of upper-upscale and luxury hotels located in major markets and resort locations that have dynamic demand generators and high barriers-to-entry. We sell, acquire, rebrand and redevelop hotels to increase our return on invested capital, improve overall portfolio quality, enhance diversification and improve growth rates. Our long-term strategy has six critical components:
• | Acquire Hotels that Further Improve our Portfolio Quality, Diversification and Earnings Growth. We seek to acquire high-quality hotels in markets with high barriers-to-entry and sustainable demand growth. We target properties that are accretive to long-term stockholder value, will provide investment returns that exceed our weighted average cost of capital and provide attractive long-term yields. Additionally, we seek properties that will improve the overall quality and diversity of our portfolio and we consider hotels that offer redevelopment and/or revenue repositioning opportunities that will further enhance returns on our investment. |
• | Sell Non-Strategic Hotels or Hotels Not Expected to Meet Our Long-Term Return Hurdles. We believe opportunistically selling hotels and reallocating capital to more attractive investments enhances our long-term growth, increases our return on capital and enables management to focus on long-term investments within our target markets. We consistently review our hotels in terms of projected performance, future capital expenditure requirements, market dynamics and concentration risk, and sell those properties in markets that are not expected to offer an attractive return on our investment or are inconsistent with our long-term portfolio strategy. |
• | Utilize Focused and Engaged Asset Management Approach to Maximize Returns at our Hotels. FelCor’s asset management is aggressive and hands-on. All of our asset managers have extensive hotel operating experience and thorough knowledge of the markets and overall demand dynamics where our hotels operate. With our long-standing and extensive brand relationships, we can significantly influence how their policies and procedures (most notably, brand strategy for marketing and revenue enhancement programs) affect us as hotel owners. We utilize our expertise and relationships to maximize revenue, market share, hotel operating margins and cash flow at every hotel. |
4
• | Pursue Redevelopment and Repositioning Opportunities that Leverage our Development and Operations Expertise. We consider redevelopment and repositioning opportunities at our properties that offer attractive risk-adjusted returns. Redevelopment opportunities may include adding guest rooms, meeting space and amenities (such as spas), and developing condominiums. Repositioning opportunities typically involve upgrading a hotel’s market position through converting to a superior brand, which can be done independently or in conjunction with a redevelopment. We are currently seeking the necessary approvals and entitlements to redevelop and/or reposition several of our hotels that are located in core markets and offer attractive risk-adjusted returns that are significantly above our cost of capital. |
• | Enhance Our Assets’ Long-Term Performance by Investing in High-ROI Capital Projects. We strive to spend capital prudently. Our capital strategy involves efficiently maintaining our properties over the long term and limiting future expenditure fluctuations, while maximizing our return on investment. We generally renovate several hotels each year to maintain their competitive positions and value. We routinely evaluate value-adding opportunities at our hotels, such as better use of existing space, new restaurant concepts and improved food and beverage operations. |
• | Manage Our Balance Sheet. We are committed to further strengthening our balance sheet by reducing leverage, extending debt maturities and taking advantage of opportunities to lower our cost of capital. Our improved balance sheet provides the necessary flexibility and capacity to thrive throughout lodging industry cycles. We will continue to reduce our leverage by, among other things, selling non-strategic or underperforming hotels and increasing operating cash flow. We also expect to reduce our cost of capital and enhance our debt maturity profile by refinancing or repaying higher cost debt and preferred stock in the future. |
Recent Achievements. We have continued making progress toward achieving our strategic objectives.
• | We sold two hotels in 2016 for $108 million total gross proceeds. |
• | We reduced our consolidated debt by $74 million and leverage ratio from 6.0x at December 31, 2015 to 5.6x at December 31, 2016. Moody’s upgraded our corporate credit rating in 2016 as a result of our stronger balance sheet and credit metrics. |
• | In 2016, we renovated two hotels (Embassy Suites - Dallas Love Field and Embassy Suites - Orlando International Drive South/Convention Center) and began redeveloping two resort properties (The Vinoy Renaissance St. Petersburg Resort & Golf Club and Embassy Suites Myrtle Beach-Oceanfront Resort), which included the construction of significant enhancements and improvements to our resort amenities. In total, we spent $74.3 million on capital expenditure at our hotels, and believe our renovation and redevelopment projects will offer attractive returns. |
• | We successfully completed negotiations with Hilton with respect to new management agreements for 18 of our properties, with four currently pending lender approval. The new management agreements shift a substantial portion of fees from fixed base fees to variable incentive fees, which are payable only after achieving a base return on our invested capital. This new fee structure better aligns Hilton’s interest with our economic interest. We also negotiated comprehensive, long-term renovation plans at the affected hotels that allow us to deploy our capital more efficiently. We are excited to extend our strong relationship with Hilton, and we are confident the new agreements will help us achieve meaningful returns on these assets. |
• | We acquired the fee interest in the land at our Wyndham Houston-Medical Center Hotel & Suites that was previously leased. |
5
• | We remain committed to the highest standards of Board accountability, corporate ethics and stockholder engagement. Accordingly, in 2016 we implemented various corporate governance enhancements, including, among others: (i) amending and restating FelCor’s 2014 Equity Compensation Plan to impose minimum vesting and post-vesting holding periods and to prohibit cash buyouts of underwater options; (ii) refreshing and enhancing the independence of the Board by appointing two independent directors to serve on the Board; (iii) adding a new section to FelCor’s Bylaws to provide proxy access to director candidates nominated by stockholders that meet certain ownership thresholds and satisfy other criteria; and (iv) amending FelCor’s Bylaws to delete a section that had reserved for the Board the exclusive power to amend FelCor’s Bylaws (stockholders will be able to propose binding amendments to FelCor’s Bylaws assuming they approve a corresponding charter amendment at this year’s annual meeting). The foregoing initiatives follow prior actions, as previously disclosed, that also strengthen our corporate governance and stockholder accountability. |
Our Industry
The United States lodging industry is diverse and fragmented, comprising a myriad of hotel types across multiple quality and service segments. The industry caters to a wide range of guests, including transient customers (both leisure and corporate), groups (both leisure and corporate) and long-term, or contract, customers. Average rates charged by hotels are dependent on multiple factors, including the potential customer mix, level of customer demand and rooms supply in the market. Many hotels are marketed under a brand or “flag,” such as Hilton and Marriott, among others. Franchisors typically receive fees in exchange for brand recognition, marketing support and their reservation systems. Other hotels operate independently, often because they do not desire to fit within the standards of a particular brand or, in some cases, because operating as an independent “boutique” hotel enhances a hotel’s appeal to targeted guests. Hotels, and the underlying real estate, are owned by both public and private companies and partnerships. Franchisors or independent management companies often operate hotels on behalf of their owners. All of our hotels are operated on our behalf, mostly by managers affiliated with international franchisors.
Hotel Classification. Smith Travel Research (STR), a leading research provider for the lodging industry, classifies hotel chains into seven distinct segments: luxury, upper-upscale, upscale, upper-midscale, midscale, economy and independent. More than 90% of our Hotel EBITDA is generated from luxury (Fairmont) and upper-upscale (Embassy Suites, Hilton, Marriott, Renaissance, Sheraton, and Wyndham) hotels. We also own upscale (Doubletree), upper-midscale (Holiday Inn) and independent (Knickerbocker, Royalton and Morgans) hotels.
Industry Performance. The industry is cyclical, driven by changes in supply and demand. Overall economic conditions and local market factors influence demand, as do GDP growth, employment growth and corporate profits. While lodging industry fundamentals remain relatively healthy, acceleration of supply growth, coupled with a deceleration in demand growth, is expected to result in lower Revenue Per Available Room (RevPAR) growth in 2017.
6
For 2016, STR reported:
• | RevPAR increased 3.2%, to $81.19, achieving the highest RevPAR ever recorded by STR for any year; |
• | ADR increased 3.1% to $123.97, achieving the highest ADR ever recorded by STR; and |
• | Occupancy increased 0.1% to 65.5%, as demand growth outpaced supply growth. |
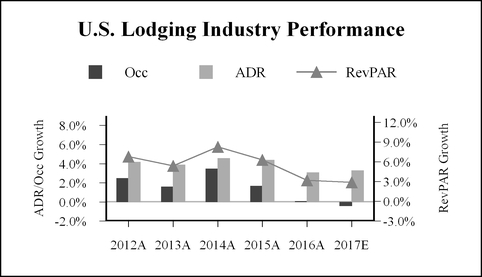
For 2017, CBRE Hotel Horizons (formerly, PKF Hospitality Research), or CBRE, another leading provider of hospitality industry research, projects occupancy to decrease 0.4%, ADR to increase by 3.3%, contributing to a projected 2.9% RevPAR increase in 2017. In its publication Hospitality Directions US, PwC’s outlook for 2017 RevPAR is a 2.3% increase, with an ADR increase of 2.6% and an occupancy decline of 0.3%.
Competition
The lodging industry is highly competitive. Customers can choose from a variety of brands and products. The interplay between the supply of and demand for hotel rooms is cyclical and affects our industry significantly. Certain markets have low barriers-to-entry (e.g., inexpensive land, favorable zoning, etc.), making it easier to build new hotels and increase the supply of modern, high-quality hotel rooms. Lodging demand growth typically moves in tandem with the overall economy, as well as local market factors that stimulate travel to specific destinations. Economic indicators, such as GDP, business investment and employment levels, are common indicators of lodging demand. Each of our hotels competes for guests, primarily with other full service and limited service hotels in the immediate vicinity and, secondarily, with other hotels in its geographic market. Location, brand recognition, hotel quality, service levels and prices are the principal competitive factors affecting our hotels.
Environmental Matters
Under various federal, state and local environmental laws, ordinances and regulations, a current or previous owner or operator of real property may be liable for the costs of removal or remediation of hazardous or toxic substances on, under or in a property. These laws may impose liability whether or not the owner or operator knew of, or was responsible for, the presence of such hazardous or toxic substances. In addition, certain environmental laws and common law principles could be used to impose liability for release of asbestos-containing materials, and third parties may seek recovery from owners or operators of real property for personal injury associated with exposure to related asbestos-containing materials. Environmental laws also may impose restrictions on the manner in which property may be used or businesses may be operated, and these restrictions may require corrective modifications or other expenditures. In connection with our current or prior ownership or operation of hotels or other real estate, we may be liable for various environmental costs or liabilities.
7
We customarily obtain a Phase I environmental survey from an independent environmental consultant before acquiring a hotel. The principal purpose of a Phase I survey is to identify potential environmental contamination and, secondarily, to assess, to a limited extent, the potential for environmental regulatory compliance liabilities. The Phase I surveys of our hotels were designed to meet the requirements of the then current industry standards governing those surveys, and consistent with those requirements, none of the surveys involved testing of groundwater, soil or air. Accordingly, they do not represent evaluations of conditions at the studied sites that would be revealed only through such testing. In addition, Phase I assessments of environmental regulatory compliance issues are general in scope and not a detailed determination of a hotel’s environmental compliance. Similarly, Phase I reports do not involve comprehensive analysis of potential offsite liability. Our Phase I reports have not revealed any environmental liability that we believe would have a material adverse effect on our business, assets or results of operations, nor are we aware of any such liability. Nevertheless, it is possible that these reports do not reveal or accurately assess all material environmental conditions and that there are material environmental conditions of which we are unaware.
We believe that our hotels materially comply with all federal, state, and local laws and regulations regarding hazardous substances and other environmental matters, to the extent violation of such laws and regulations have a material adverse effect on us. We have not been notified by any governmental authority or private party of any noncompliance, liability or claim relating to hazardous or toxic substances or other environmental matters in connection with any of our current or former properties that we believe would have a material adverse effect on our business, assets or results of operations. However, obligations for compliance with environmental laws that arise or are discovered in the future may adversely affect our financial condition.
Tax Status
FelCor LP is a partnership for federal income tax purposes, and is not subject to federal income tax. However, under its partnership agreement, it is required to reimburse FelCor for any tax payments it is required to make. Accordingly, the tax information herein represents disclosures regarding FelCor and its taxable subsidiaries.
FelCor elected to be treated as a REIT under the U.S. Internal Revenue Code. As a REIT, FelCor generally is not subject to federal income taxation at the corporate level on taxable income that is distributed to its stockholders. FelCor may, however, be subject to certain state and local taxes on its income and property and to federal income and excise taxes on its undistributed taxable income. FelCor’s taxable REIT subsidiaries, or TRSs, formed to lease its hotels, are subject to federal, state and local income taxes. A REIT is subject to a number of organizational and operational requirements, including a requirement that it currently distribute at least 90% of its annual taxable income to its stockholders. If FelCor fails to qualify as a REIT in any taxable year for which the statute of limitations remains open, it will be subject to federal income taxes at regular corporate rates (including any applicable alternative minimum tax) for such taxable year and may not qualify as a REIT for four subsequent years. In connection with FelCor’s election to be treated as a REIT, its charter imposes restrictions on the ownership and transfer of shares of its common stock. FelCor LP expects to make distributions on its units sufficient to enable FelCor to meet its distribution obligations as a REIT. At December 31, 2016, FelCor had a federal income tax net operating loss carryforward of $534.2 million, and its TRSs had federal income tax loss carryforwards of $254.8 million.
Employees
At December 31, 2016, we had 63 full-time employees. None of our employees are involved in the day-to-day operation of our hotels.
8
Ownership of our Hotels
Of our 39 hotels at December 31, 2016, we owned 100% interests in 36 hotels, a 95% interest in one hotel (The Knickerbocker) and 50% interests in entities that owned two hotels. We consolidate our real estate interests in the 37 hotels in which we hold majority interests, and we record the real estate interests of the two hotels in which we hold 50% interests using the equity method. We lease 38 of the 39 hotels to our TRSs, in which we own a controlling interest. We operate one 50% owned hotel without a lease. Because we own controlling interests in our operating lessees, we consolidate our interests in all 38 leased hotels (which we refer to as our Consolidated Hotels) and reflect their operating revenues and expenses in our statements of operations. We own 50% of the real estate interest in one Consolidated Hotel (we account for our real estate interest in this hotel by the equity method) and majority real estate interests in our remaining 37 Consolidated Hotels (we consolidate our real estate interests in these hotels). Our Consolidated Hotels are located in 14 states, with concentrations in major urban markets and resort areas.
Segment Reporting
Our business is conducted in one operating segment because of the similar economic characteristics of our hotels. Other information by geographic area may be found in the footnotes to our consolidated financial statements elsewhere in this report.
Additional Information
Additional information relating to our hotels and our business, including the charters of our Executive Committee, Governance Committee, Lead Director, Compensation Committee, Finance Committee and Audit Committee; our corporate governance guidelines; and our code of business conduct and ethics can be found on our website at www.felcor.com. Information relating to our hotels and our business can also be found in the Notes to Consolidated Financial Statements located elsewhere in this report. Our annual, quarterly and current reports, and amendments to these reports, filed with the Securities and Exchange Commission, or SEC, under the Securities Exchange Act of 1934, or Exchange Act, are made available on our website, free of charge, under the “Financials” tab on our “Investor Relations” page, as soon as practicable following their filing. The public may also read and copy any materials we file with the SEC at the SEC’s Public Reference Room at 100 F Street, N.E., Washington, D.C. 20549. The public may obtain information on the operation of the Public Reference Room by calling the SEC at 1-800-SEC-0330. The SEC also maintains a website that contains reports, proxy and information statements, and other information regarding issuers that file electronically with the SEC at www.sec.gov.
9
Item 1A. Risk Factors
The risk factors in this section describe the major risks to our business and should be considered carefully. In addition, these statements constitute our cautionary statements under the Private Securities Litigation Reform Act of 1995.
Our revenues, expenses and the value of our hotels are subject to conditions affecting both the real estate and lodging industries.
Real estate investments are subject to numerous risks. Our investment in hotels is subject to numerous risks generally associated with owning real estate, including among others:
• | general economic conditions, including unemployment rates, major bank failures, unsettled capital markets and sovereign debt uncertainty; |
• | changes in international, national, regional and local economic climate and real estate market conditions; |
• | changes in zoning laws; |
• | changes in traffic patterns and neighborhood characteristics; |
• | increases in assessed property taxes from changes in valuation and real estate tax rates; |
• | increases in the cost of property insurance; |
• | potential for uninsured or underinsured property losses; |
• | governmental regulations, including changes in immigration laws that may impact travel and labor and fiscal policies; |
• | changes in interest rates and in the availability, cost and terms of debt financing; |
• | the ongoing need for capital improvements; |
• | changes in tax laws; and |
• | other circumstances beyond our control. |
Moreover, real estate investments are substantially illiquid, and we may not be able to adjust our portfolio in a timely manner to respond to changes in economic and other conditions.
Investing in hotel assets involves special risks. We have invested in hotels and related assets, and our hotels are subject to all the risks common to the hotel industry. These risks could adversely affect hotel occupancy, operating costs and rates that can be charged for hotel rooms, and generally include:
• | changes in business and leisure travel patterns; |
• | decreases in demand for hotel rooms; |
• | increases in lodging supply or competition, which may adversely affect demand at our hotels; |
• | the effect of geopolitical disturbances, including terrorist attacks and terror alerts, that reduce business and leisure travel; |
• | the appeal of our hotels to consumers relative to competing hotels; |
• | seasonal fluctuations in our revenue caused by the seasonal nature of the hotel industry; |
• | unforeseen events beyond our control, including organizing labor at our hotels; |
• | the threat or outbreak of a pandemic or epidemic disease, including the Zika virus, and natural disasters affecting the travel industry; |
• | increasing fuel costs and other travel expenses resulting in reductions of travel; |
• | consolidation in the lodging industry; and |
• | increased transportation security precautions affecting the travel industry. |
10
We are subject to risks inherent to hotel operations. We have ownership interests in the operating lessees of our hotels; consequently, we are subject to the risk of fluctuating hotel operating expenses at our hotels, including but not limited to:
• | increases in operating expenses due to inflation; |
• | wage and benefit costs, including hotels that employ unionized labor and minimum wage increases in states where our hotels are located; |
• | repair and maintenance expenses; |
• | gas and electricity costs; |
• | insurance costs including health, general liability and workers compensation; and |
• | other operating expenses. |
Economic conditions may reduce demand for hotel properties and adversely affect our profitability. The performance of the lodging industry is highly cyclical and has traditionally been closely linked with the performance of the general economy. We cannot predict the pace or duration of the global economic cycle or the cycles of the lodging industry. In the event conditions in the industry deteriorate or do not continue to see sustained improvement, or there is an extended period of economic weakness, our occupancy rates, revenues and profitability could be adversely affected. Furthermore, other macroeconomic factors, such as consumer confidence and conditions which negatively shape public perception of travel, may have a negative effect on the lodging industry and may adversely affect our business.
We could face increased competition. Each of our hotels competes with other hotels in its geographic area. In addition to competing with traditional hotels and lodging facilities, we compete with alternative lodging, including third party providers of short-term rental properties, such as Airbnb and VRBO. A number of additional hotel rooms have been, or may be, built in a number of the geographic areas in which our hotels are located, which could adversely affect both occupancy and rates in those markets. A significant increase in the supply of upscale and upper-upscale hotel rooms, or if demand fails to increase at least proportionately, could have a material adverse effect on our business, financial condition and results of operations.
The lodging business is seasonal in nature. Generally, hotel revenues for our hotel portfolio are greater in the second and third calendar quarters than in the first and fourth calendar quarters. Revenues for hotels in tourist areas are generally substantially greater during tourist season than other times of the year. We expect that seasonal variations in revenue at our hotels will cause quarterly fluctuations in our revenues.
Actions by organized labor may adversely affect our business. We believe that unions are increasingly aggressive about organizing workers at hotels in certain locations. If workers employed by our hotel management companies organize in the future, increased labor activity at our hotels could impact the labor, administrative, legal, and other expenses of our management companies, which would negatively effect our profitability.
Compliance with environmental laws may adversely affect our financial condition. Owners of real estate are subject to numerous federal, state and local environmental laws and regulations. Under these laws and regulations, a current or former owner of real estate may be liable for the costs of remediating hazardous substances found on its property, whether or not they were responsible for its presence. In addition, if an owner of real property arranges for the disposal of hazardous substances at another site, it may also be liable for the costs of remediating the disposal site, even if it did not own or operate the disposal site. Such liability may be imposed without regard to fault or the legality of a party’s conduct and may, in certain circumstances, be joint and several. A property owner may also be liable to third parties for personal injuries or property damage sustained as a result of its release of hazardous or
11
toxic substances, including asbestos-containing materials, into the environment. Environmental laws and regulations may require us to incur substantial expenses and limit the use of our properties. We could have substantial liability for a failure to comply with applicable environmental laws and regulations, which may be enforced by the government or, in certain instances, by private parties. The existence of hazardous substances at a property can also adversely affect the value of, and the owner’s ability to use, sell or borrow against the property.
We cannot provide assurances that future or amended laws or regulations, or more stringent interpretations or enforcement of existing environmental requirements, will not impose any material environmental liability, or that the environmental condition or liability relating to our hotels will not be affected by new information or changed circumstances, by the condition of properties in the vicinity of such hotels, such as the presence of leaking underground storage tanks, or by the actions of unrelated third parties.
Compliance with the Americans with Disabilities Act may adversely affect our financial condition. Under the Americans with Disabilities Act of 1990, as amended, or the ADA, all public accommodations, including hotels, are required to meet certain federal requirements for access and use by disabled persons. Various state and local jurisdictions have also adopted requirements relating to the accessibility of buildings to disabled persons. We make every reasonable effort to ensure that our hotels substantially comply with the requirements of the ADA and other applicable laws. However, we could be liable for both governmental fines and payments to private parties if it were determined that our hotels are not in compliance with these laws. We also may be subject to future changes in these laws. If we were required to make unanticipated major modifications to our hotels to comply with the requirements of the ADA and similar laws, it could materially adversely affect our ability to make distributions to our stockholders and to satisfy our other obligations.
System security risks, data protection breaches, cyber-attacks and systems integration issues could disrupt our internal operations or service provided to guests at our hotels, and any such disruption could reduce our expected revenue, increase our expenses, damage the reputation of our hotels and adversely affect our stock price. Experienced computer programmers and hackers may be able to penetrate our network security or the network security of our third-party managers and franchisors, and misappropriate or compromise our confidential information or that of our hotel guests, create system disruptions or cause the shutdown of our hotels. Computer programmers and hackers also may be able to develop and deploy viruses, worms and other malicious software programs that attack our computer systems or the computer systems operated by our third-party managers and franchisors, or otherwise exploit any security vulnerabilities of our respective networks. In addition, sophisticated hardware and operating system software and applications that we and our third-party managers or franchisors may procure from outside companies may contain defects in design or manufacture, including “bugs” and other problems that could unexpectedly interfere with our internal operations or the operations at our hotels. The costs to us to eliminate or alleviate cyber or other security problems, bugs, viruses, worms, malicious software programs and security vulnerabilities could be significant, and our efforts to address these problems may not be successful and could result in interruptions, delays, cessation of service and loss of existing or potential business at our hotels.
Portions of our information technology infrastructure or the information technology infrastructure of our independent managers and franchisors also may experience interruptions, delays or cessations of service or produce errors in connection with systems integration or migration work that takes place from time to time. We, or our third-party managers and franchisors, may not be successful in implementing new systems and transitioning data, which could cause business disruptions and be more expensive, time consuming, disruptive and resource-intensive. Such disruptions could adversely impact the ability of our third-party managers and franchisors to fulfill reservations for guestrooms and other services offered at
12
our hotels. Delayed sales or bookings, lower margins or lost guest reservations resulting from these disruptions could adversely affect our financial results, stock price and the reputation of our hotels.
We seek to minimize the impact of these attacks through various technologies, processes and practices designed to protect our networks, systems, computers and data from attack, damage or unauthorized access. However, there are no guaranties that our cyber-security practices will be sufficient to thwart all attacks. While we carry property, business interruption and cyber risk insurance, we may not be sufficiently compensated for all losses we may incur. These losses include not only a loss of revenues but also potential litigation, fines or regulatory action against us. Furthermore, we may also incur substantial remediation costs to repair system damage as well as satisfy liabilities for stolen assets or information that may further reduce our profits.
If we (or our independent managers or franchisors) fail to comply with applicable privacy laws and regulations, we could be subject to payment of fines, damages or face restrictions on our use of guest data. Our managers and franchisors collect information relating to our guests for various business purposes, including marketing and promotional purposes. Collecting and using personal data is governed by U.S. and other privacy laws and regulations. Privacy regulations continue to evolve and may be inconsistent from one jurisdiction to another. Compliance with applicable privacy regulations may increase our operating costs and/or adversely impact our managers’ ability to market our products, properties and services to our guests. In addition, non-compliance (or in some circumstances non-compliance by third parties engaged by us (including our managers and franchisors)) or a breach of security in systems storing privacy data, may result in fines, payment of damages or restrictions on our (or our managers’ or franchisors’) use or transfer of data.
Future terrorist activities and political instability may adversely affect, and create uncertainty in, our business. Terrorism in the United States or elsewhere could have an adverse effect on our business, although the degree of impact will depend on a number of factors, including the United States and global economies and global financial markets. Previous terrorist attacks in the United States and subsequent terrorism alerts have adversely affected the travel and hospitality industries in the past. Such attacks, or the threat of such attacks, could have a material adverse effect on our business, our ability to finance our business, our ability to insure our properties, and/or our results of operations and financial condition, as a whole.
Furthermore, most of our hotels are classified as upper-upscale or upscale. In an economic downturn, these types of hotels may be more susceptible to a decrease in revenue, as compared to hotels in other categories that have lower room rates. This characteristic may result from the fact that upper-upscale and upscale hotels generally target business and high-end leisure travelers. In periods of economic difficulties, business and leisure travelers may seek to reduce travel costs by limiting travel or seeking to reduce costs on their trips. In addition, in periods of weak demand, as may occur during a general economic recession, profitability is negatively affected by the relatively high fixed costs of operating luxury, upper-upscale and upscale hotels. Consequently, any uncertainty in the general economic environment could adversely affect our business.
We face reduced insurance coverages and increasing premiums. Our property insurance has a $100,000 “all-risk” deductible, as well as a 5% deductible (insured value) for named windstorm and California earthquake coverage. Substantial uninsured or under-insured losses would have a material adverse impact on our operating results, cash flows and financial condition. Catastrophic losses could make the cost of insuring against these types of losses prohibitively expensive or difficult to find. In an effort to limit the cost of insurance, we purchase catastrophic insurance coverage based on probable maximum losses based on 250-year events. We have established a self-insured retention of $250,000 per
13
occurrence for general liability insurance with regard to 32 of our hotels. The remainder of our hotels participate in general liability programs sponsored by our managers, with no deductible.
We could have uninsured or under-insured property losses. Our property policies provide that all of the claims from each of our properties resulting from a particular insurable event must be combined together for purposes of evaluating whether the aggregate limits and sub-limits contained in our policies have been exceeded. Therefore, if an insurable event occurs that affects more than one of our hotels, the claims from each affected hotel will be added together to determine whether the aggregate limit or sub-limits, depending on the type of claim, have been reached, and each affected hotel may only receive a proportional share of the amount of insurance proceeds provided for under the policy if the total value of the loss exceeds the aggregate limits available. We may incur losses in excess of insured limits, and as a result, we may be even less likely to receive sufficient coverage for risks that affect multiple properties such as earthquakes or catastrophic terrorist acts. Risks such as war, catastrophic terrorist acts, nuclear, biological, chemical or radiological attacks and some environmental hazards may be deemed to fall completely outside the general coverage limits of our policies or may be uninsurable or may be too expensive to justify insuring against.
We may also encounter disputes concerning whether an insurance provider will pay a particular claim that we believe is covered under our policy. Should a loss in excess of insured limits or an uninsured loss occur or should we be unsuccessful in perfecting a claim from an insurance carrier, we could lose all, or a portion of, the capital we have invested in a property, as well as the anticipated future revenue from the hotel. In that event, we might nevertheless remain obligated for any mortgage debt or other financial obligations related to the property.
We obtain terrorism insurance as well as general liability and directors’ and officers’ policies. However, our all-risk policies have limitations, such as per-occurrence limits and sub-limits, that might have to be shared proportionally across participating hotels under certain loss scenarios. Also, all-risk insurers only have to provide terrorism coverage to the extent mandated by the Terrorism Risk Insurance Act, or TRIA, for “certified” acts of terrorism - namely those that are committed on behalf of non-United States persons or interests. Furthermore, we do not have full replacement coverage at all of our hotels for acts of terrorism committed on behalf of United States persons or interests (“non-certified” events) as our coverage for such incidents is subject to sub-limits and/or annual aggregate limits. In addition, property damage related to war and to nuclear, biological and chemical incidents is excluded under our policies. While TRIA will reimburse insurers for losses resulting from nuclear, biological and chemical perils, TRIA does not require insurers to offer coverage for these perils and, to date, insurers are not willing to provide this coverage, even with government reinsurance. Additionally, Congress may not renew TRIA in the future, which would eliminate the federal subsidy for terrorism losses. As a result of the above, the extent and adequacy of terrorism coverage that will be available in the future to protect our interests in the event of future terrorist attacks that impact our properties is uncertain.
We have geographic concentrations that may create risks from regional or local economic, seismic or weather conditions. At December 31, 2016, approximately 56% of our same-store hotel rooms were located in, and 62% of our 2016 Hotel EBITDA was generated from, three states: California (31% of our same-store hotel rooms and 37% of our Hotel EBITDA); Florida (16% of our same-store hotel rooms and 16% of our Hotel EBITDA); and Massachusetts (8% of our same-store hotel rooms and 10% of our Hotel EBITDA). Additionally, at December 31, 2016, we had concentrations in five major metropolitan areas which together represented approximately 50% of our Hotel EBITDA for the year ended December 31, 2016 (the San Francisco Bay area (19%), Boston (10%), South Florida (8%), Los Angeles area (7%) and Myrtle Beach (6%)). Therefore, adverse economic, seismic or weather conditions in these states or metropolitan areas may have a greater adverse effect on us than on the industry as a whole.
14
Transfers and/or termination of franchise licenses and management agreements may occur. Hotel managers and franchise licensors may have the right to terminate their agreements or suspend their services in the event of default under such agreements or under other third-party agreements such as ground leases and mortgages, upon the loss of liquor licenses, or in the event of the sale or transfer of the hotel. When franchise licenses expire by their terms, we may not be able to obtain replacement franchise licenses.
If a management agreement or franchise license were terminated under certain circumstances (such as the sale of a hotel), we could be liable for liquidated damages (which may be guaranteed by us or certain of our subsidiaries). In addition, we may need to obtain a different franchise and/or engage a different manager, and the costs and disruption associated with those changes could be significant (and materially adverse to the value of the affected hotel) because of the loss of associated name recognition, marketing support and centralized reservation systems provided by the franchise licensor or operations management provided by the manager. Additionally, most of our management agreements restrict our ability to encumber our interests in the applicable hotels under certain circumstances without the managers’ consent, which can make it more difficult to obtain secured financing on acceptable terms.
We are subject to possible adverse effects of management, franchise and license agreement requirements. All of our hotels are operated under existing management, franchise or license agreements with nationally recognized hotel companies. Each agreement requires that the hotel be maintained and operated in accordance with specific standards and restrictions. Compliance with these standards, and changes in these standards, could require us to incur significant expenses or capital expenditures, which could adversely affect our results of operations and ability to pay dividends to our stockholders and service our debt.
Our ownership of hotels through ground leases exposes us to the risk of losing a hotel upon breach of the terms of a ground lease, selling a hotel for a discounted price and not renewing a ground lease. As of December 31, 2016, 10 of our hotels were subject to ground leases. If we default under one or more of our ground leases and are unable to cure the default in a timely manner, we may be liable for damages and could lose our leasehold interest in the applicable property and interest in the hotel on the applicable property. If any events of default occur and are not cured timely, our business could be materially and adversely affected. Our ground leases also generally require the lessor’s consent prior to transferring our interest in the ground lease. These provisions may impact our ability to sell or finance our hotels or our ability to sell the property at a higher price. Furthermore, there is no guaranty that we will be able to extend the terms of our ground leases or purchase the underlying fee interest at the end of the leasehold. Accordingly, we would lose the ability to use the hotel and derive income from it, which could materially and adversely affect us.
The operation and management of our hotels is concentrated. We are subject to the potential risks associated with the concentration of our hotels under a limited number of brands and management companies. A negative public image or other adverse event that becomes associated with a brand or management company could adversely affect hotels operated under that brand or by that management company. If any brands under which we operate hotels or any management company suffer a significant decline in appeal to the traveling public, the revenues and profitability of such hotels could be adversely affected. At December 31, 2016, 18 hotels (comprising 45% of our same-store hotel rooms) were flagged as Embassy Suites, and we derived approximately 44% of our 2016 Hotel EBITDA from those hotels. Furthermore, at December 31, 2016, subsidiaries of Hilton managed 20 of our hotels, and we derived approximately 50% of our 2016 Hotel EBITDA from those hotels.
The increasing use of Internet travel intermediaries by consumers may adversely affect our profitability. Some of our hotel rooms may be booked through Internet travel intermediaries. As these
15
Internet bookings increase, these intermediaries may be able to obtain higher commissions, reduced room rates or other significant contract concessions from us and our management companies. Moreover, some of these Internet travel intermediaries offer hotel rooms as a putative commodity, by increasing the importance of price and general indicators of quality (such as “three-star downtown hotel”) at the expense of brand identification. These agencies hope that consumers will eventually develop brand loyalties to their reservations system rather than to the brands under which our hotels are franchised. If the number or percentage of sales made through Internet travel intermediaries increases significantly, room revenues may flatten or decrease and our profitability may be adversely affected.
If revenue declines faster than operating expenses, our margins may shrink materially. We are subject to the risks of a decline in Hotel EBITDA margins, which occur when hotel operating expenses increase disproportionately to revenues or fail to shrink at least as fast as revenues decline. These operating expenses and Hotel EBITDA margins are controlled by independent third-party managers over whom we have limited influence.
Our business may be adversely affected by consolidation in the lodging industry. Consolidation among companies in the lodging industry may increase the resulting companies’ negotiating power relative to ours, and decrease competition among those companies for franchisees and management contracts. Consolidation could result in increased franchise or management fees. To the extent that consolidation among hotel brand companies adversely affects the loyalty reward program offered by one or more of our hotels, customer loyalty to those hotels may suffer and demand for guestrooms may decrease. Furthermore, because each hotel brand company relies on its own network of reservation systems, hotel management systems and customer databases, the integration of two or more networks may result in a disruption to operations of these systems, such as disruptions in processing guest reservations, delayed bookings or sales, or lost guest reservations, which could adversely affect our financial condition and results of operations.
We have substantial financial leverage.
At December 31, 2016, our consolidated debt ($1.3 billion) represented approximately 49% of our total enterprise value. Declining revenues and cash flow may adversely affect our public debt ratings and may limit our access to additional debt. Historically, we have incurred debt for acquisitions and to fund our renovation, redevelopment and rebranding programs. If our access to additional debt financing is limited, our ability to fund these programs or acquire hotels in the future could be adversely affected. Also, we can make no assurances that we will be able to refinance any of our debt on a timely basis or on satisfactory terms, if at all.
Financial leverage could have negative consequences. For example, it could:
• | limit our ability to obtain additional financing for working capital, renovation, redevelopment and rebranding plans, acquisitions, debt service requirements and other purposes; |
• | limit our ability to refinance existing debt; |
• | limit our ability to pay dividends, invest in unconsolidated joint ventures, etc.; |
• | require us to agree to additional restrictions and limitations on our business operations and capital structure to obtain financing; |
• | enhance the impact of adverse economic and industry conditions and of interest rate fluctuations; |
• | require us to dedicate a substantial portion of our cash flow from operations to payments on our debt, thereby reducing funds available for capital expenditures, future business opportunities, paying dividends or other purposes; |
• | limit our flexibility to make, or react to, changes in our business and our industry; and |
• | place us at a competitive disadvantage when compared to our competitors that have less leverage. |
16
Compliance with, or failure to comply with, our financial covenants may adversely affect our financial position and results of operations.
The agreements governing our senior secured notes require that we satisfy total leverage, secured leverage and interest coverage tests in order, among other things, to: (i) incur certain additional indebtedness, except to refinance maturing debt with replacement debt, as defined under our indentures; (ii) pay dividends other than to maintain FelCor’s REIT status; (iii) repurchase FelCor’s capital stock; or (iv) merge. In addition, our 5.625% senior secured notes are secured by a combination of first lien mortgages and related security interests on nine hotels, as well as pledges of equity interests in certain subsidiaries of FelCor LP, and the 6.00% senior unsecured notes require us to maintain a minimum amount of unencumbered assets. These restrictions may adversely affect our ability to finance our operations or engage in other business activities that may be in our best interest.
Various political, economic, social or business risks, uncertainties and events beyond our control could affect our ability to comply with these covenants and financial thresholds. Failure to comply with any of the covenants in our existing or future financing agreements could result in a default under those agreements and under other agreements containing cross-default provisions. A default could permit lenders to accelerate the maturity of obligations under these agreements and to foreclose upon any collateral securing those obligations. Under these circumstances, we might not have sufficient funds or other resources to satisfy all of our obligations. In addition, the limitations imposed by financing agreements on our ability to incur additional debt and to take other actions could significantly impair our ability to obtain other financing. We cannot assure you that we will be granted waivers or amendments if for any reason we are unable to comply with these agreements, or that we will be able to refinance our debt on terms acceptable to us, or at all.
Certain of our subsidiaries have been formed as special purpose entities, or SPEs. These SPEs have incurred mortgage debt secured by the assets of those SPEs, which debt is non-recourse to us, except in connection with certain customary recourse “carve-outs,” including fraud, misapplication of funds, etc., in which case this debt could become fully recourse to us.
Our debt agreements will allow us to incur additional debt that, if incurred, could exacerbate the other risks described herein.
We may incur substantial debt in the future. Although the instruments governing our debt contain restrictions on the incurrence of additional debt, these restrictions are subject to a number of qualifications and exceptions and, under certain circumstances, debt incurred in compliance with these restrictions could be substantial. If we add incremental debt, the leverage-related risks described above would intensify.
Our ability to achieve our long-term objectives is subject to various risks and uncertainties, and we may be unable to execute some or all of those objectives as contemplated, or at all.
Our long-term strategy contemplates: (i) redeveloping hotels in our portfolio, including potentially rebranding and enhancing facilities, to enhance hotel performance and improve returns on our investment; (ii) acquiring additional hotels in our target markets that meet our investment criteria and/or present redevelopment opportunities similar to hotels already in our portfolio; and (iii) recycling capital invested in our portfolio by selling hotels that no longer meet our investment criteria, or are significantly more valuable as single assets than as part of a larger portfolio, and reinvesting the proceeds in hotels that meet or exceed our investment criteria. For example, while we intend to recycle capital invested in hotels that no longer meet our investment criteria, there is no assurance that we will be able to sell such hotels at acceptable prices, or at all, and we can provide no assurance that the capital recycled from selling hotels will, when reinvested, generate targeted returns. Similarly, we can provide no assurance that current and
17
future redevelopment opportunities will proceed as contemplated, or at all, or whether, if they do proceed, they will be successful and achieve or exceed targeted returns. In addition, while we contemplate acquiring hotels in our target markets, we can provide no assurances that we will successfully identify appropriate acquisition opportunities that meet our investment criteria or that we will be able to act on those opportunities and acquire hotels that will contribute to the long-term growth of our portfolio and deliver incremental stockholder value, or that our assumptions about the benefits of our target markets (growth rates and potential returns, among others) will prove correct. If we are unable to execute our plans, we may be unable to realize the growth underlying our strategy, and our future business operations or financial performance could be adversely affected.
We may be unable to execute our deleveraging strategy successfully if we are unable to sell hotels designated to be sold, or at all, or sell them for satisfactory pricing or if we are unable to grow our cash flow.
Our ability to sell hotels is at least partially dependent on potential buyers obtaining financing. If adequate financing is not available or is only available at undesirable terms, we may be unable to sell hotels or sell them for desired pricing. If we are unable to sell hotels or if we sell them below desired pricing, it could affect our ability to repay and refinance debt and slow the execution of our strategic plan. If we sell a mortgaged hotel for less than its outstanding debt balance, we would be required to use cash to make up the shortfall or substitute an unencumbered hotel as collateral, which would restrict future flexibility when refinancing debt or restrict us from using cash for other purposes. Similarly, if we are unsuccessful in growing the cash flow at our hotels, our deleveraging strategy could be frustrated.
We depend on external sources of capital for future growth, and we may be unable to access capital when necessary.
As a REIT, our ability to finance our growth must largely be funded by external sources of capital because we are required to distribute to our stockholders at least 90% of our taxable income (other than net capital gains) including, in some cases, taxable income we recognize for federal income tax purposes but with regard to which we do not receive corresponding cash. Our ability to obtain the external capital we require could be limited by a number of factors, many of which are outside our control, including general market conditions, unfavorable market perception of our future prospects, lower current and/or estimated future earnings, excessive cash distributions or a lower market price for our common stock.
Our ability to access additional capital also may be limited by the terms of our existing debt, which, under certain circumstances, restrict our incurrence of debt and the payment of distributions. Any of these factors, individually or in combination, could prevent us from being able to obtain the external capital we require on terms that are acceptable to us, or at all. If our future cash flow from operations and external sources of capital are insufficient to pay our obligations as they mature or to fund our liquidity needs, we may be forced to reduce or delay our business activities and capital expenditures, sell assets, obtain additional equity capital or restructure or refinance all or a portion of our debt on or before maturity. Failing to obtain necessary external capital could have a material adverse effect on our ability to finance our future growth. We may have only a limited number of unencumbered hotels and limited resources to raise additional capital or we may have difficulties obtaining consent of an applicable lessor on any of our hotels subject to a ground lease.
Our ability to pay dividends may be limited or prohibited by the terms of our debt or preferred stock.
We are currently party to agreements and instruments that can restrict or prevent the payment of dividends on our common and preferred stock (except, to some degree, as necessary to retain REIT status). Under the agreements governing our senior notes, dividend payments are permitted only to the
18
extent that, at the time of the distribution, we can satisfy certain financial thresholds (concerning leverage and fixed charges) and meet other requirements. Under the terms of our outstanding preferred stock, we are not permitted to pay dividends on our common stock unless all accrued preferred dividends then payable have been paid. While our preferred dividends are current, if we fail to pay future dividends on our preferred stock for any reason, including to comply with the terms of our senior secured notes, our preferred dividends will accrue, and we will be prohibited from paying any common dividends until all such accrued but unpaid preferred dividends have been paid.
Our business could be negatively affected as a result of actions by activist stockholders.
Stockholder campaigns to effect changes in publicly-traded companies are sometimes led by activist investors through various corporate actions, including proxy contests. Responding to these actions can disrupt our operations by diverting the attention of management and our employees as well as our financial resources. Stockholder activism could create perceived uncertainties as to our future direction, which could result in the loss of potential business opportunities and make it more difficult to attract and retain qualified personnel and business partners. Furthermore, the election of individuals to our Board with a specific agenda could adversely affect our ability to effectively and timely implement our strategic plans.
Departure of key personnel would deprive us of the institutional knowledge, expertise and leadership they provide.
Members of our management team generally possess institutional knowledge about our organization and the hospitality or real estate industries, have significant expertise in their fields and possess leadership skills that are important to our operations. The loss of any of our executives or other long-tenured officers and our inability to find suitable replacements could adversely affect our ability to execute our business strategy.
As a REIT, we are subject to specific tax laws and regulations, the violation of which could subject us to significant tax liabilities.
The federal income tax laws governing REITs are complex. We have operated, and intend to continue to operate, in a manner that enables us to qualify as a REIT under the federal income tax laws. The REIT qualification requirements are extremely complicated, and interpretations of the federal income tax laws governing qualification as a REIT are limited. Accordingly, we cannot be certain that we have been, or will continue to be, successful in operating so as to qualify as a REIT.
The federal income tax laws governing REITs are subject to change. At any time, the federal income tax laws governing REITs or the administrative interpretations of those laws may be amended. These new laws, interpretations or court decisions may change the federal income tax laws relating to, or the federal income tax consequences of, qualification as a REIT. Any of these new laws or interpretations may take effect retroactively and could adversely affect us, or you as a stockholder.
Failure to make required distributions would subject us to tax. Each year, a REIT must pay out to its stockholders at least 90% of its taxable income, other than any net capital gain. To the extent that we satisfy the 90% distribution requirement, but distribute less than 100% of our taxable income, we will be subject to federal corporate income tax on our undistributed taxable income. In addition, we will be subject to a 4% non-deductible tax if the actual amount we pay out to our stockholders in a calendar year is less than the minimum amount specified under federal tax laws. Our only source of funds to make such distributions comes from distributions from FelCor LP. Accordingly, we may be required to borrow
19
money or sell assets to enable us to pay out enough of our taxable income to satisfy the distribution requirements and to avoid corporate income tax and the 4% tax in a particular year.
Failure to qualify as a REIT would subject us to federal income tax. If we fail to qualify as a REIT in any taxable year for which the statute of limitations remains open we would be subject to federal income tax at regular corporate rates (including any applicable alternative minimum tax) for such taxable year and may not qualify as a REIT for four subsequent years. We might need to borrow money or sell hotels in order to obtain the funds necessary to pay any such tax. If we cease to be a REIT, we no longer would be required to distribute most of our taxable income to our stockholders. Unless our failure to qualify as a REIT was excused under federal income tax laws, we could not re-elect REIT status until the fifth calendar year following the year in which we failed to qualify.
We lack control over the management and operations of our hotels. Because federal income tax laws restrict REITs and their subsidiaries from operating hotels, we do not manage our hotels. Instead, we depend on third-party managers to operate our hotels pursuant to management agreements. As a result, we are unable to directly implement strategic business decisions for the operation and marketing of our hotels, such as setting room rates, establishing salary and benefits provided to hotel employees, conducting food and beverage operations and similar matters. While our taxable REIT subsidiaries monitor the third-party manager’s performance, we have limited specific recourse under our management agreements if we believe the third-party managers are not performing adequately. Failure by our third-party managers to fully perform the duties agreed to in our management agreements could adversely affect our results of operations. In addition, our third-party managers, or their affiliates, manage hotels that compete with our hotels, which may result in conflicts of interest. As a result, our third-party managers may have in the past made, and may in the future make, decisions regarding competing lodging facilities that are not or would not be in our best interests.
Complying with REIT requirements may cause us to forgo attractive opportunities that could otherwise generate strong risk-adjusted returns and instead pursue less attractive opportunities, or none at all.
To continue to qualify as a REIT for federal income tax purposes, we must continually satisfy tests concerning, among other things, the sources of our income, the nature of our assets, the amounts we distribute to our stockholders and the ownership of our stock. Thus, compliance with the REIT requirements may hinder our ability to operate solely on the basis of generating strong risk-adjusted returns on invested capital for our stockholders.
Complying with REIT requirements may force us to liquidate otherwise attractive investments, which could result in an overall loss on our investments.
To continue to qualify as a REIT, we must also ensure that at the end of each calendar quarter at least 75% of the value of our assets consists of cash, cash items, government securities and qualified REIT real estate assets. The remainder of our investment in securities (other than government securities and qualified real estate assets) generally cannot include more than 10% of the outstanding voting securities of any one issuer or more than 10% of the total value of the outstanding securities of any one issuer. In addition, in general, no more than 5% of the value of our assets (other than government securities and qualified real estate assets) can consist of the securities of any one issuer, and no more than 25% (20% effective in 2018) of the value of our total securities can be represented by securities of one or more TRSs. If we fail to comply with these requirements at the end of any calendar quarter, the REIT statutes provide a means to cure the exception. If we are unable to cure the exception, we may be subject to an additional tax. As a result, we may be required to liquidate otherwise attractive investments.
20
We may become subject to a 100% excise tax if our TRSs pay us excessive rent.
The Internal Revenue Service, or IRS, could challenge the rents paid to us by our TRSs as excessive, and a court could reach a similar conclusion. In either event, we could be taxed at 100% of the amount of rents determined to be excessive. There can be no assurance that we will not be subjected to that excise tax. If we are, and if the amount is material, our liquidity and ability to service our debt and pay dividends could be materially and adversely affected.
If any hotel management companies that we engage do not qualify as “eligible independent contractors,” or if our hotels are not “qualified lodging facilities,” we would likely fail to qualify as a REIT.
Rent paid by a lessee that is a “related party tenant” of ours generally will not be qualifying income for purposes of the two gross income tests applicable to REITs. An exception is provided, however, for leases of “qualified lodging facilities” to a TRS so long as the hotels are managed by an “eligible independent contractor” and certain other requirements are satisfied. We lease and expect to lease all or substantially all of our hotels to TRS lessees, which are disregarded subsidiaries of the TRSs, and to engage hotel management companies that are intended to qualify as “eligible independent contractors.” Among other requirements, in order to qualify as an eligible independent contractor, the hotel management company must not own, directly or through its stockholders, more than 35% of our outstanding shares, and no person or group of persons can own more than 35% of our outstanding shares and the shares (or ownership interest) of the hotel management company (taking into account certain ownership attribution rules and, with respect to our shares and the outstanding shares of any publicly traded hotel management company, only the shares owned by persons who own, directly or indirectly, more than 5% of a publicly traded class of shares). The ownership attribution rules that apply for purposes of these 35% thresholds are complex, and monitoring actual and constructive ownership of our shares by the hotel management companies and their owners may not be practical. Accordingly, there can be no assurance that these ownership levels will not be exceeded.
In addition, for a hotel management company to qualify as an eligible independent contractor, such company or a related person must be actively engaged in the trade or business of operating “qualified lodging facilities” (as defined below) for one or more persons not related to the REIT or its TRSs at each time that such company enters into a hotel management contract with a TRS or its TRS lessee. As of the date hereof, we believe the hotel management companies operate qualified lodging facilities for certain persons who are not related to us or our TRS. However, no assurances can be provided that this will continue to be the case or that any other hotel management companies that we may engage in the future will in fact comply with this requirement in the future. Failure to comply with this requirement would require us to find other managers for future contracts, and, if we hired a management company without knowledge of the failure, could jeopardize our status as a REIT.
Finally, each hotel with respect to which our TRS lessees pay rent must be a “qualified lodging facility.” A “qualified lodging facility” is a hotel, motel or other establishment more than one-half of the dwelling units in which are used on a transient basis, including customary amenities and facilities, provided that no wagering activities are conducted at or in connection with such facility by any person who is engaged in the business of accepting wagers and who is legally authorized to engage in such business at or in connection with such facility. As of the date hereof, we believe that all of the hotels leased to our TRS lessees will be qualified lodging facilities. Although we intend to monitor future acquisitions and improvements of hotels, the REIT provisions of the IRS Code provide only limited guidance for making determinations under the requirements for qualified lodging facilities, and there can be no assurance that these requirements will be satisfied in all cases.
21
We own, and may acquire, interests in hotel joint ventures with third parties that expose us to some risk of additional liabilities or capital requirements.
Through our subsidiaries, we own interests in some real estate joint ventures. Our unconsolidated joint ventures owned two hotels, in which we had an $8.3 million aggregate investment at December 31, 2016. We include the lessee operations of one of these two hotels in our consolidated results of operations because we own a majority interest in the lessee. All of our joint venture partners are unaffiliated with us. The joint ventures owned hotels that secured $22.3 million of non-recourse loans at December 31, 2016.
Our subsidiaries’ personal liability for existing non-recourse loans secured by our joint venture hotels is generally limited to guarantying the lender’s losses caused by misconduct, fraud or misappropriation of funds by the borrowers and other customary “bad boy” exceptions from the non-recourse covenants in the loans (e.g., environmental liabilities). We may invest in other joint ventures in the future that own hotels and have recourse or non-recourse debt financing. If a joint venture defaults under a loan, the lender may accelerate the loan and demand payment in full before taking action to foreclose on the hotel. As a joint venturer, our subsidiary may be liable for claims asserted against the joint venture (including lenders’ claims for repayment), and the joint venture may have insufficient assets or insurance to cover the liability.
Our subsidiaries may be unable to control decisions unilaterally regarding these joint venture hotels. In addition, joint venture hotels may perform at levels below expectations, raising concerns about joint venture liquidity and solvency unless the joint venturers provide additional funds. In some cases, the joint venturers may elect to forgo additional capital contributions. We may be confronted with the choice of losing our investment or investing additional capital with no guaranty of any return on that investment.
Our charter limits ownership and transferring shares of our stock, which could adversely affect attempted transfers of our capital stock.
To maintain our status as a REIT, no more than 50% in value of our outstanding stock may be owned, actually or constructively, under the applicable tax rules, by five or fewer persons during the last half of any taxable year. Our charter prohibits, subject to some exceptions, any person from owning more than 9.9% of the number of outstanding shares of any class of our stock. Our charter also prohibits any transfer of our stock that would result in a violation of the 9.9% ownership limit, reduce the number of stockholders below 100 or otherwise result in our failure to qualify as a REIT. Any attempted transfer of shares in violation of the charter prohibitions is void, and the intended transferee acquires no right to those shares. We have the right to take any lawful action that we believe is necessary or advisable to ensure compliance with these ownership and transfer restrictions and to preserve our status as a REIT, including refusing to recognize any transfer of stock in violation of our charter.
Some provisions in our charter and bylaws and Maryland law make a takeover more difficult.
Ownership Limit. The ownership and transfer restrictions of our charter may have the effect of discouraging or preventing a third party from attempting to gain control of us without the approval of our Board. Accordingly, it is less likely that a change in control, even if beneficial to stockholders, could be effected without the approval of our Board.
Authority to Issue Additional Shares. Under our charter, our Board may issue up to an aggregate of 20 million shares of preferred stock without stockholder action. The preferred stock may be issued, in one or more series, with the preferences and other terms designated by our Board that may delay or
22
prevent a change in control of us, even if the change is in the best interests of stockholders. At December 31, 2016, we had 12,879,475 shares of Series A preferred stock outstanding.
Maryland Law. As a Maryland corporation, we are subject to various provisions under the Maryland General Corporation Law, including the Maryland Business Combination Act, that may have the effect of delaying or preventing a transaction or a change in control that might involve a premium price for the stock or otherwise be in the best interests of stockholders. Under the Maryland business combination statute, some “business combinations,” including some issuances of equity securities, between a Maryland corporation and an “interested stockholder,” which is any person who beneficially owns 10% or more of the voting power of the corporation’s shares, or an affiliate of that stockholder, are prohibited for five years after the most recent date on which the interested stockholder becomes an interested stockholder. Any of these business combinations must be approved by a stockholder vote meeting two separate super majority requirements, unless, among other conditions, the corporation’s common stockholders receive a minimum price, as defined in the statute, for their shares and the consideration is received in cash or in the same form as previously paid by the interested stockholder for its common shares. Our charter currently provides that the Maryland Control Share Acquisition Act will not apply to any of our existing or future stock. That statute may deny voting rights to shares involved in an acquisition of one-tenth or more of the voting stock of a Maryland corporation. To the extent these or other laws are applicable to us, they may have the effect of delaying or preventing a change in control of us even though beneficial to our stockholders.
In addition, under the Maryland General Corporation Law, unless prohibited by charter or resolution (which we are with respect to certain provisions), our Board can elect by resolution without stockholder approval to be subject to certain corporate governance provisions that may be inconsistent with our charter and bylaws. Under certain sections of that statute, our Board may adopt corporate governance provisions that may, individually or in the aggregate, affect stockholders’ ability to alter corporate policies directly or delay or prevent a strategic transaction or a change in control.
Our directors may have interests that could conflict with our interests.
A director who has a conflict of interest with respect to an issue presented to our Board will have no inherent legal obligation to abstain from voting upon that issue. We do not have provisions in our bylaws or charter that require an interested director to abstain from voting upon an issue. Although each director has a duty of loyalty to us, there is a risk that, should an interested director vote upon an issue in which a director or one of his or her affiliates has an interest, his or her vote may reflect a bias that could be contrary to our best interests. In addition, even if an interested director abstains from voting, that director’s participation in the meeting and discussion of an issue in which they have, or companies with which he or she is associated have, an interest could influence the votes of other directors regarding the issue.
The trading volume and market price of our common shares may be volatile and could decline substantially in the future.
The market price of our common shares may be volatile in the future. In addition, the trading volume in our common shares may fluctuate and cause significant price variations to occur. We cannot assure stockholders that the market price of our common shares will not fluctuate or decline significantly in the future, including as a result of factors unrelated to our operating performance or prospects. In particular, the market price of our common shares could be subject to wide fluctuations in response to a number of factors, including, among others, the following:
• | actual or anticipated differences in our operating results, liquidity or financial condition; |
23
• | changes in our revenues, EBITDA, FFO or earnings estimates; |
• | publication of research reports about us, our hotels or the lodging or overall real estate industry; |
• | additions and departures of key personnel; |
• | the performance and market valuations of other similar companies; |
• | the realization of any of the other risk factors presented in this Annual Report on Form 10-K; |
• | changes in accounting principles; |
• | terrorist acts; and |
• | general market and economic conditions, including factors unrelated to our operating performance. |
In the past, securities class action litigation has often been instituted against companies following periods of volatility in the market price of their common shares. If the market price of our common shares is volatile and this type of litigation is brought against us, it could result in substantial costs and divert our management’s attention and resources, which could have a material adverse effect on us.
Item 1B. Unresolved Staff Comments
None.
Item 2. Properties
We own a diversified portfolio of hotels managed by Hilton Worldwide, or Hilton; Wyndham Worldwide, or Wyndham; Marriott International Inc., or Marriott; InterContinental Hotels Group, or IHG; Fairmont, a subsidiary of AccorHotels Group; Highgate Hotels, or Highgate; SBE (who acquired Morgans Hotel Group Corporation); and Aimbridge Hospitality. Our hotels are high-quality lodging properties with respect to desirability of location, size, facilities, physical condition, quality and variety of services offered in the markets in which they are located. Our hotels are designed to appeal to a broad range of hotel customers, including frequent business travelers, groups and conventions, as well as leisure travelers. They generally feature comfortable, modern guest rooms, meeting facilities and full-service restaurant and catering facilities. At December 31, 2016, all of our Consolidated Hotels were located in the United States (14 states), with concentrations in major markets and resort areas. Our hotels average 298 rooms.
24
The following table provides room counts for the hotels in which we held an ownership interest at December 31, 2016.
Consolidated Hotels | Rooms | |||
Embassy Suites Atlanta-Buckhead | 316 | |||
DoubleTree Suites by Hilton Austin | 188 | |||
Embassy Suites Birmingham | 242 | |||
The Fairmont Copley Plaza, Boston | 383 | |||
Wyndham Boston Beacon Hill | 304 | |||
Embassy Suites Boston-Marlborough | 229 | |||
Sheraton Burlington Hotel & Conference Center | 309 | |||
The Mills House Wyndham Grand Hotel, Charleston | 216 | |||
Embassy Suites Dallas-Love Field | 248 | |||
Embassy Suites Deerfield Beach-Resort & Spa | 244 | |||
Embassy Suites Fort Lauderdale 17th Street | 361 | |||
Wyndham Houston-Medical Center Hotel & Suites | 287 | |||
Embassy Suites Los Angeles-International Airport/South | 349 | |||
Embassy Suites Mandalay Beach-Hotel & Resort | 250 | |||
Embassy Suites Miami-International Airport | 318 | |||
Embassy Suites Milpitas-Silicon Valley | 266 | |||
Embassy Suites Minneapolis-Airport | 310 | |||
Embassy Suites Myrtle Beach-Oceanfront Resort | 255 | |||
Hilton Myrtle Beach Resort | 385 | |||
Embassy Suites Napa Valley | 205 | |||
Wyndham New Orleans-French Quarter | 374 | |||
The Knickerbocker New York | 330 | |||
Morgans New York | 117 | |||
Royalton New York | 168 | |||
Embassy Suites Orlando-International Drive South/Convention Center | 244 | |||
DoubleTree Suites by Hilton Orlando-Lake Buena Vista | 229 | |||
Wyndham Philadelphia Historic District | 364 | |||
Sheraton Philadelphia Society Hill Hotel | 364 | |||
Embassy Suites Phoenix-Biltmore | 232 | |||
Wyndham Pittsburgh University Center | 251 | |||
Wyndham San Diego Bayside | 600 | |||
Embassy Suites San Francisco Airport-South San Francisco | 312 | |||
Embassy Suites San Francisco Airport-Waterfront | 340 | |||
Holiday Inn San Francisco-Fisherman’s Wharf | 585 | |||
San Francisco Marriott Union Square | 400 | |||
Wyndham Santa Monica at the Pier | 132 | |||
Embassy Suites Secaucus-Meadowlands(a) | 261 | |||
The Vinoy Renaissance St. Petersburg Resort & Golf Club | 361 | |||
11,329 | ||||
Unconsolidated Hotel | ||||
Chateau LeMoyne - French Quarter, New Orleans(a) | 171 | |||
(a) We own a 50% interest in this property.
25
Hotel Operating Statistics
Occupancy (%) | ADR ($) | RevPar ($) | |||||||||||||||||||||||
Year Ended December 31, | Year Ended December 31, | Year Ended December 31, | |||||||||||||||||||||||
Same-store Hotels(1) | 2016 | 2015 | %Change | 2016 | 2015 | %Change | 2016 | 2015 | %Change | ||||||||||||||||
Embassy Suites Atlanta-Buckhead | 77.3 | 79.5 | (2.7 | ) | 156.50 | 147.51 | 6.1 | 121.04 | 117.30 | 3.2 | |||||||||||||||
DoubleTree Suites by Hilton Austin | 81.3 | 81.8 | (0.6 | ) | 221.70 | 221.63 | — | 180.33 | 181.35 | (0.6 | ) | ||||||||||||||
Embassy Suites Birmingham | 77.9 | 79.0 | (1.3 | ) | 137.76 | 134.07 | 2.7 | 107.35 | 105.86 | 1.4 | |||||||||||||||
The Fairmont Copley Plaza, Boston | 76.0 | 75.5 | 0.5 | 325.88 | 326.70 | (0.3 | ) | 247.52 | 246.81 | 0.3 | |||||||||||||||
Wyndham Boston Beacon Hill | 79.0 | 79.2 | (0.2 | ) | 228.49 | 234.42 | (2.5 | ) | 180.61 | 185.60 | (2.7 | ) | |||||||||||||
Embassy Suites Boston-Marlborough | 68.6 | 74.9 | (8.5 | ) | 171.81 | 171.10 | 0.4 | 117.81 | 128.20 | (8.1 | ) | ||||||||||||||
Sheraton Burlington Hotel & Conference Center | 74.4 | 75.2 | (1.1 | ) | 119.86 | 116.52 | 2.9 | 89.14 | 87.64 | 1.7 | |||||||||||||||
The Mills House Wyndham Grand Hotel, Charleston | 81.6 | 81.1 | 0.6 | 228.13 | 222.42 | 2.6 | 186.26 | 180.45 | 3.2 | ||||||||||||||||
Embassy Suites Dallas-Love Field (2) | 73.6 | 87.9 | (16.2 | ) | 142.57 | 132.52 | 7.6 | 104.91 | 116.42 | (9.9 | ) | ||||||||||||||
Embassy Suites Deerfield Beach-Resort & Spa | 76.9 | 80.2 | (4.2 | ) | 199.23 | 200.97 | (0.9 | ) | 153.13 | 161.22 | (5.0 | ) | |||||||||||||
Embassy Suites Fort Lauderdale 17th Street | 83.6 | 84.8 | (1.4 | ) | 174.15 | 165.76 | 5.1 | 145.59 | 140.55 | 3.6 | |||||||||||||||
Wyndham Houston-Medical Center Hotel & Suites | 76.4 | 81.5 | (6.2 | ) | 145.35 | 150.80 | (3.6 | ) | 111.07 | 122.87 | (9.6 | ) | |||||||||||||
Embassy Suites Los Angeles-International Airport/South | 86.2 | 81.3 | 6.0 | 169.72 | 159.93 | 6.1 | 146.27 | 129.98 | 12.5 | ||||||||||||||||
Embassy Suites Mandalay Beach-Hotel & Resort | 80.5 | 78.0 | 3.2 | 227.22 | 212.81 | 6.8 | 182.82 | 165.97 | 10.1 | ||||||||||||||||
Embassy Suites Miami-International Airport | 85.0 | 88.3 | (3.8 | ) | 146.80 | 151.72 | (3.2 | ) | 124.76 | 133.98 | (6.9 | ) | |||||||||||||
Embassy Suites Milpitas-Silicon Valley | 81.5 | 82.4 | (1.1 | ) | 201.81 | 195.17 | 3.4 | 164.57 | 160.88 | 2.3 | |||||||||||||||
Embassy Suites Minneapolis-Airport | 75.4 | 77.1 | (2.3 | ) | 156.54 | 150.93 | 3.7 | 117.95 | 116.38 | 1.4 | |||||||||||||||
Embassy Suites Myrtle Beach-Oceanfront Resort | 74.2 | 74.4 | (0.2 | ) | 176.68 | 172.30 | 2.5 | 131.18 | 128.12 | 2.4 | |||||||||||||||
Hilton Myrtle Beach Resort | 61.6 | 64.1 | (4.0 | ) | 146.09 | 140.45 | 4.0 | 89.95 | 90.09 | (0.2 | ) | ||||||||||||||
Embassy Suites Napa Valley | 80.9 | 83.8 | (3.4 | ) | 242.71 | 232.95 | 4.2 | 196.36 | 195.12 | 0.6 | |||||||||||||||
Wyndham New Orleans-French Quarter | 72.2 | 68.9 | 4.9 | 146.18 | 150.70 | (3.0 | ) | 105.60 | 103.77 | 1.8 | |||||||||||||||
Morgans New York | 84.9 | 82.4 | 3.1 | 265.31 | 282.65 | (6.1 | ) | 225.28 | 232.79 | (3.2 | ) | ||||||||||||||
Royalton New York | 83.9 | 86.7 | (3.2 | ) | 291.17 | 303.39 | (4.0 | ) | 244.42 | 263.02 | (7.1 | ) | |||||||||||||
Embassy Suites Orlando-International Drive South/Convention Center(2) | 70.0 | 83.9 | (16.5 | ) | 148.73 | 146.67 | 1.4 | 104.15 | 122.99 | (15.3 | ) | ||||||||||||||
DoubleTree Suites by Hilton Orlando-Lake Buena Vista | 88.2 | 89.4 | (1.3 | ) | 141.13 | 139.63 | 1.1 | 124.54 | 124.89 | (0.3 | ) | ||||||||||||||
Wyndham Philadelphia Historic District | 74.4 | 64.3 | 15.7 | 153.83 | 160.43 | (4.1 | ) | 114.49 | 103.22 | 10.9 | |||||||||||||||
Sheraton Philadelphia Society Hill Hotel | 71.0 | 69.0 | 2.8 | 181.94 | 174.72 | 4.1 | 129.09 | 120.54 | 7.1 | ||||||||||||||||
Embassy Suites Phoenix-Biltmore | 68.0 | 71.4 | (4.8 | ) | 180.19 | 175.83 | 2.5 | 122.60 | 125.60 | (2.4 | ) | ||||||||||||||
Wyndham Pittsburgh University Center | 69.1 | 71.1 | (2.8 | ) | 145.80 | 145.55 | 0.2 | 100.76 | 103.53 | (2.7 | ) | ||||||||||||||
Wyndham San Diego Bayside | 78.1 | 78.1 | — | 151.72 | 147.63 | 2.8 | 118.47 | 115.33 | 2.7 | ||||||||||||||||
Embassy Suites San Francisco Airport-South San Francisco | 88.3 | 88.4 | (0.1 | ) | 203.47 | 200.69 | 1.4 | 179.70 | 177.46 | 1.3 | |||||||||||||||
Embassy Suites San Francisco Airport-Waterfront | 89.7 | 86.4 | 3.8 | 208.23 | 207.60 | 0.3 | 186.75 | 179.35 | 4.1 | ||||||||||||||||
Holiday Inn San Francisco-Fisherman’s Wharf | 86.5 | 86.2 | 0.3 | 210.92 | 208.90 | 1.0 | 182.47 | 180.10 | 1.3 | ||||||||||||||||
San Francisco Marriott Union Square | 89.3 | 86.8 | 2.9 | 294.41 | 288.45 | 2.1 | 263.03 | 250.49 | 5.0 | ||||||||||||||||
Wyndham Santa Monica at the Pier | 86.1 | 83.9 | 2.7 | 278.40 | 255.40 | 9.0 | 239.83 | 214.26 | 11.9 | ||||||||||||||||
Embassy Suites Secaucus-Meadowlands | 72.7 | 76.0 | (4.3 | ) | 179.80 | 184.97 | (2.8 | ) | 130.75 | 140.57 | (7.0 | ) | |||||||||||||
The Vinoy Renaissance St. Petersburg Resort & Golf Club | 80.7 | 81.9 | (1.4 | ) | 219.22 | 210.49 | 4.1 | 177.00 | 172.39 | 2.7 | |||||||||||||||
Same-store Hotels | 78.5 | 79.3 | (0.9 | ) | 191.14 | 187.74 | 1.8 | 150.11 | 148.81 | 0.9 | |||||||||||||||
(1) | Consolidated Hotels excluding The Knickerbocker. |
(2) Hotel under renovation in 2016.
26
Management Agreements
At December 31, 2016, of our 38 Consolidated Hotels: (i) subsidiaries of Hilton managed 20 hotels; (ii) subsidiaries of Wyndham managed eight hotels; (iii) subsidiaries of Marriott managed four hotels; (iv) subsidiaries of IHG managed one hotel; (v) Fairmont, a subsidiary of AccorHotels Group, managed one hotel; (vi) a subsidiary of Highgate managed one hotel; (vii) a subsidiary of SBE (who recently acquired Morgans Hotel Group) managed two hotels; and (viii) Aimbridge Hospitality managed one hotel.
During 2016, we renegotiated certain management agreements with Hilton. The management agreements relating to 32 Consolidated Hotels contain the right and license to operate the hotels under specified brands. No separate franchise agreements exist, and no separate franchise fee is required, for these hotels. These hotels are managed by (i) Wyndham, under the Wyndham brand, (ii) Hilton, under the DoubleTree, Hilton and Embassy Suites brands, (iii) Marriott, under the Renaissance, Marriott and Sheraton brands, (iv) IHG, under the Holiday Inn brand, and (v) Fairmont, under the Fairmont brand. The Knickerbocker (managed by Highgate) as well as Morgans and Royalton (managed by SBE) are operated without a brand.
Management Fees. Minimum base management fees generally range from 2 to 3% of total revenue, with the exception of our IHG-managed hotel, where base management fees are 2% of total revenue plus 5% of room revenue. The performance of our Wyndham-managed hotels is subject to a $100 million guaranty from Wyndham Worldwide Corporation over the initial 10-year term (which can be extended for an additional five years), with an annual performance guaranty of up to $21.5 million, which ensures minimum annual NOI for those hotels.
Most of our management agreements also provide for incentive management fees that are subordinated to our return on investment.
We incurred the following management fees (in thousands) included in continuing operations during each of the past three years:
Year Ended December 31, | ||||||||||||
2016 | 2015 | 2014 | ||||||||||
Base fees | $ | 18,190 | $ | 19,948 | $ | 19,583 | ||||||
Incentive fees | 4,995 | 4,091 | 3,316 | |||||||||
Total management fees | $ | 23,185 | $ | 24,039 | $ | 22,899 | ||||||
The Wyndham management agreements became effective on March 1, 2013. Because Wyndham guarantees a minimum level of net operating income, we reduced Wyndham’s contractual management fees during 2016, 2015 and 2014 by $2.9 million, $1.4 million and $1.3 million, respectively. In addition, in 2016, we reduced additional Wyndham contractual fees (other than management fees) by $2.4 million to reflect Wyndham’s guaranty.
Term and Termination. The initial term of Wyndham’s management agreements ends in 2022 and the term may be extended by Wyndham subject to certain conditions. IHG’s management agreement terminates in 2018. Marriott’s management agreements terminate in 2025 for our Renaissance hotel and 2029 for our Marriott hotel, and these agreements may be extended to 2055 and 2039, respectively, at Marriott’s option. Marriott’s management agreements for our Sheraton hotels terminate in 2017. Fairmont’s management agreement terminates in 2030 and may be extended to 2040 and 2050 at Fairmont’s option. The SBE management agreements terminate in 2026 and may be extended to 2036 at SBE’s option. However, we have agreed to terms that allow us to terminate the SBE management
27
agreements prior to 2026. Highgate’s management agreement terminates in 2025 and may be extended to 2035 at Highgate’s option. Hilton’s management agreements generally have initial terms of 15 years and are renewable beyond the initial term upon the mutual written agreement of the parties.
The following management agreements covering 37 of our 38 Consolidated Hotels expire after 2016 (one hotel agreement expired in 2015 and is renewed monthly), subject to any renewal rights:
Number of Management Agreements Expiring | ||||||||||||
Manager | 2017 | 2018 | Thereafter | |||||||||
Hilton | 4 | — | 16 | |||||||||
Wyndham | — | — | 8 | |||||||||
Marriott(a) | 2 | — | 2 | |||||||||
IHG | — | 1 | — | |||||||||
SBE | — | — | 2 | |||||||||
Fairmont | — | — | 1 | |||||||||
Highgate | — | — | 1 | |||||||||
Total | 6 | 1 | 30 | |||||||||
(a)Includes Sheraton hotels.
Management agreements are generally terminable upon the occurrence of customary events of default or if the subject hotel fails to meet certain performance hurdles. Upon termination for any reason, we are generally required to pay all amounts due and owing under the management agreement through the effective date of termination. If an agreement is terminated as a result of our default, or by us other than for cause, we may also be liable for damages suffered by the manager. We expect to enter into new management agreements for all agreements set to expire in 2017.
Assignment. Generally, neither party to a management agreement may sell, assign or transfer the agreement to an unaffiliated third party without the prior written consent of the other party, which consent shall not be unreasonably withheld. A change in control of FelCor would require manager or franchisor consent under most of our management and franchise agreements.
Franchise Agreements
After renegotiating certain management agreements with Hilton during 2016, six of our Consolidated Hotels operate under franchise or license agreements with Embassy Suites that are separate from our management agreements.
These six Embassy Suites franchise agreements grant us the right to the use of the Embassy Suites Hotels name, system and marks with respect to specified hotels and establish various management, operational, record-keeping, accounting, reporting and marketing standards and procedures with which the licensed hotel must comply. In addition, the franchisor establishes requirements for the quality and condition of the hotel and its furniture, fixtures and equipment, and we are obligated to expend such funds as may be required to maintain the hotel in compliance with those requirements. Typically, our Embassy Suites franchise agreements provide for a license fee, or royalty, of 4 to 5.5% of room revenues. In addition, we pay approximately 3.5 to 4% of room revenues as marketing and reservation system contributions for the systemwide benefit of Embassy Suites Hotels. We incurred marketing and reservation systems fees of $9.3 million, $10.2 million and $12.3 million in 2016, 2015 and 2014, respectively. We incurred license fees included in continuing operations with respect to our hotels
28
operated as Embassy Suites of $9.8 million, $11.5 million and $13.2 million in 2016, 2015 and 2014, respectively.
The terms of our typical Embassy Suites franchise agreements extend 10 to 20 years. The agreements provide no renewal or extension rights and are not assignable. If we breach a franchise agreement, we may lose the right to use the Embassy Suites name for the applicable hotel and be liable, under certain circumstances, for liquidated damages (generally equal to the fees paid to the franchisor with respect to that hotel during the three immediately preceding years). Of our Embassy Suites franchise agreements, four expire in 2017 and the remainder expire later. We expect to enter into new agreements in 2017 for these properties, allowing us the continued use of the Embassy Suites brand.
Item 3. Legal Proceedings
There is no litigation pending or known to be threatened against us or affecting any of our hotels, other than claims arising in the ordinary course of business or which are not considered to be material. Furthermore, most of these claims are substantially covered by insurance. We do not believe that any claims known to us, individually or in the aggregate, will have a material adverse effect on us.
Item 4. Mine Safety Disclosures
Not applicable.
29
PART II
Item 5. Market for Registrant’s Common Equity, Related Stockholder Matters and Issuer Purchases of Equity Securities
Our common stock is traded on the New York Stock Exchange under the symbol “FCH.” The following table sets forth the high and low sale prices for our common stock for the indicated periods, as traded on that exchange, and dividends declared per share.
High | Low | Dividends Declared Per Share | ||||||||||||
2016 | ||||||||||||||
First quarter | $ | 8.17 | $ | 5.47 | $ | 0.06 | ||||||||
Second quarter | 8.08 | 5.68 | 0.06 | |||||||||||
Third quarter | 7.19 | 6.00 | 0.06 | |||||||||||
Fourth quarter | 8.44 | 6.07 | 0.06 | |||||||||||
2015 | ||||||||||||||
First quarter | $ | 12.43 | $ | 9.70 | $ | 0.04 | ||||||||
Second quarter | 12.29 | 9.64 | 0.04 | |||||||||||
Third quarter | 10.87 | 6.88 | 0.04 | |||||||||||
Fourth quarter | 8.63 | 6.83 | 0.06 | |||||||||||
Stockholder Information
At February 20, 2017, we had approximately 138 record holders of our common stock and 15 record holders of our Series A preferred stock (which is convertible into common stock). However, because many of the shares of our common stock and Series A preferred stock are held by brokers and other institutions on behalf of stockholders, we believe there are substantially more beneficial holders of our common stock and Series A preferred stock than record holders. At February 20, 2017, there were 18 holders (other than FelCor) of FelCor LP units. FelCor LP units are redeemable for cash or, at our election, for shares of FelCor common stock.
IN ORDER TO COMPLY WITH CERTAIN REQUIREMENTS RELATED TO OUR QUALIFICATION AS A REIT, OUR CHARTER LIMITS, SUBJECT TO CERTAIN EXCEPTIONS, THE NUMBER OF SHARES OF ANY CLASS OR SERIES OF OUR CAPITAL STOCK THAT MAY BE OWNED BY ANY SINGLE PERSON OR AFFILIATED GROUP TO 9.9% OF THE OUTSTANDING SHARES OF THAT CLASS OR SERIES.
Distribution Information
In order to maintain our qualification as a REIT, we must distribute at least 90% of our annual taxable income (other than net capital gains) to our stockholders each year. We distributed in excess of 100% of our taxable income in 2016 and 2015. We had no taxable income for 2014. Under certain circumstances, we may be required to make distributions that exceed cash available for distribution in order to meet REIT distribution requirements. In that event, we expect to borrow funds or sell assets to obtain cash sufficient to make the required distribution.
Our senior notes indentures limit our ability to pay dividends and make other payments based on our ability to satisfy certain financial requirements (except as necessary to retain REIT status). The terms of our outstanding preferred stock prohibit us from paying dividends on our common stock unless all accrued preferred dividends then payable have been paid. None of these restrictions prevent us from paying dividends under current circumstances. We discuss these limitations further in “Liquidity and Capital Resources” in Item 7 and in Item 1A, Risk Factors.
30
Item 6. Selected Financial Data
The following tables set forth selected financial data derived from our audited consolidated financial statements and the related notes. This data should be read in conjunction with Item 7, Management’s Discussion and Analysis of Financial Condition and Results of Operations, and our audited consolidated financial statements and the related notes.
SELECTED FINANCIAL DATA
(in millions, except per share/unit data)
Year Ended December 31, | ||||||||||||||||||||
2016 | 2015 | 2014 | 2013 | 2012 | ||||||||||||||||
Statement of Operations Data:(a) | ||||||||||||||||||||
Total revenues | $ | 867 | $ | 886 | $ | 922 | $ | 893 | $ | 862 | ||||||||||
Income (loss) from continuing operations | 1 | (24 | ) | 28 | (84 | ) | (187 | ) | ||||||||||||
Diluted earnings per share/unit: | ||||||||||||||||||||
FelCor - income (loss) from continuing operations | $ | (0.13 | ) | $ | (0.33 | ) | $ | 0.43 | $ | (0.95 | ) | $ | (1.81 | ) | ||||||
FelCor LP - income (loss) from continuing operations | (0.13 | ) | (0.33 | ) | 0.43 | (0.95 | ) | (1.81 | ) | |||||||||||
Other Data: | ||||||||||||||||||||
Cash flows provided by operating activities | $ | 135 | $ | 147 | $ | 108 | $ | 69 | $ | 48 | ||||||||||
Cash distributions declared per common share/unit | 0.24 | 0.18 | 0.10 | 0.02 | — | |||||||||||||||
Adjusted FFO per share/unit(b) | 0.92 | 0.83 | 0.65 | 0.39 | 0.23 | |||||||||||||||
Adjusted EBITDA(b) | 240 | 235 | 221 | 200 | 203 | |||||||||||||||
Balance Sheet Data (at end of period): | ||||||||||||||||||||
Total assets (c) | $ | 1,707 | $ | 1,866 | $ | 2,082 | $ | 2,119 | $ | 2,174 | ||||||||||
Total debt, net of unamortized debt issuance costs and discount (c) | 1,338 | 1,410 | 1,563 | 1,638 | 1,602 | |||||||||||||||
FelCor’s redeemable noncontrolling interests in FelCor LP, at redemption value | 5 | 4 | 7 | 5 | 3 | |||||||||||||||
(a) | Hotels that were designated as held for sale at December 31, 2013 or disposed of prior to that date are included in discontinued operations. |
(b) | We include a more detailed description and computation of Adjusted FFO per share and Adjusted EBITDA in “Non-GAAP Financial Measures,” which is found in Management’s Discussion and Analysis of Financial Condition and Results of Operations in Item 7. |
(c) | Since the adoption of ASU 2015-03, Simplifying the Presentation of Debt Issuance Costs, in 2016, we classify deferred financing costs within the debt on our consolidated balance sheets. We previously classified deferred financing costs as an asset on our consolidated balance sheets. All periods presented have been adjusted to conform with the presentation required under ASU 2015-03. Deferred financing costs associated with our line of credit continue to be classified as an asset. |
31
Item 7. Management’s Discussion and Analysis of Financial Condition and Results of Operations
RevPAR for our 37 same-store hotels (which excludes The Knickerbocker) increased 0.9% during 2016 compared to last year, reflecting a 1.8% increase in ADR offset by a 0.9% decrease in occupancy.
In our continuing effort to increase long-term stockholder value, we look for opportunities to redeploy capital to achieve higher returns and strengthen our balance sheet. As part of our 2015 strategic plan, our Board approved selling five hotels. In 2016, we sold two of those hotels, the Renaissance Esmeralda Indian Wells Resort and the Holiday Inn Nashville Airport, for aggregate gross proceeds of $108.0 million. We used proceeds from these sales to repay our line of credit. We continue to market our three New York hotels for sale.
In 2015, our Board approved a common stock repurchase program, under which we may repurchase up to $100 million of our common stock through October 2017. We may repurchase shares in transactions on the open market, in privately-negotiated transactions or by other means, including Rule 10b5-1 trading plans, in accordance with applicable securities laws and other restrictions. In 2015, FelCor paid $14.4 million (including commissions) to repurchase approximately 2.0 million shares of its common stock at an average price of $7.26 per share. In 2016, FelCor repurchased 4.6 million shares for $30.5 million (including commissions) at an average price of $6.58 per share. Since the inception of the share repurchase program, FelCor has repurchased 6.6 million shares for a total of $44.8 million (including commissions) at an average share price of $6.78 per share.
Financial Comparison (Hotel EBITDA and Income (Loss) from Continuing Operations, $ in millions)
Year Ended December 31, | |||||||||||||||||||||||
2016 | 2015 | % Change 2015-16 | 2014 | % Change 2014-15 | |||||||||||||||||||
RevPAR(a) | $ | 150.11 | $ | 148.81 | 0.9 | % | $ | 137.24 | 8.4 | % | |||||||||||||
Income (loss) from continuing operations | 1 | (24 | ) | (104.3 | )% | 28 | (184.9 | )% | |||||||||||||||
Hotel EBITDA(a)(b) | 239 | 237 | 0.6 | % | 206 | 15.4 | % | ||||||||||||||||
Hotel EBITDA margin(a)(b) | 30.6 | % | 30.8 | % | (0.5 | )% | 29.0 | % | 6.2 | % | |||||||||||||
(a) | Data shown is for our 37 same-store Consolidated Hotels for all years presented. |
(b) | Hotel EBITDA and Hotel EBITDA margin are non-GAAP financial measures. A discussion of the use, limitations and importance of these non-GAAP financial measures and detailed reconciliations to the most comparable GAAP measures are found in “Non-GAAP Financial Measures.” |
32
Results of Operations
Comparison of the Years Ended December 31, 2016 and 2015
For the year ended December 31, 2016, we recorded $4.2 million of net income compared to a $3.5 million net loss in 2015. Our 2016 net income includes $26.5 million in impairment charges relating to two hotels (one of which was sold in 2016) and a $6.9 million severance charge, primarily related to the retirement of our former chief executive officer, partially offset by a $3.2 million net gain on hotel sales (including a $3.1 million loss in discontinued operations). Our 2015 net loss included debt extinguishment charges of $30.9 million and a $20.9 million impairment charge for a hotel subsequently sold in 2016, partially offset by a $20.1 million net gain on hotel sales (including $658,000 in discontinued operations) and $3.7 million in net revenue attributable to a favorable settlement of a commercial dispute. Additionally, in 2015, one of our unconsolidated joint ventures sold a hotel, the gain from which increased our equity in income from unconsolidated entities by $7.1 million.
In 2016:
• | Hotel operating revenue decreased $15.6 million, including a $24.0 million net reduction in revenue for hotels that have been disposed of or recently opened. Excluding these hotels, hotel operating revenue increased 1.1% from last year. We attribute the increase primarily to the 0.9% increase in same-store RevPAR, reflecting a 1.8% increase in ADR offset by a 0.9% decrease in occupancy. In 2016, certain hotels also experienced improved food and beverage operations, primarily in the banquet and catering departments, and an increase in revenue (such as resort fees) for other hotel departments. |
• | Other revenue decreased $3.7 million, resulting primarily from a favorable $3.7 million net settlement of a commercial dispute in 2015. |
• | Hotel departmental expenses decreased $7.1 million, including a $10.2 million net reduction in expense for hotels that have been disposed of or recently opened. Excluding these hotels, hotel departmental expenses increased slightly to 34.5% of hotel operating revenue from 34.4% last year. |
• | Other property-related costs decreased $11.4 million, including a $12.1 million net reduction in expense for hotels that have been disposed of or recently opened. Excluding these hotels, other property-related costs decreased slightly to 24.4% of hotel operating revenue from 24.6% last year. |
• | Management and franchise fees decreased $2.6 million, including a $1.8 million net reduction in expense for hotels that have been disposed of or recently opened. Excluding these hotels, these costs decreased slightly to 3.9% of hotel operating revenue from 4.0% last year. |
• | Taxes, insurance and lease expense decreased $1.9 million, including a $3.8 million net reduction in expense for hotels that have been disposed of or recently opened. Excluding these hotels, these expenses increased to 7.0% of hotel operating revenue from 6.8% last year. We attribute this increase to successfully resolving property tax appeals last year and a more favorable insured claims experience in 2015, partially offset by higher land lease expense last year. Land lease expense last year included a $1.6 million straight-line lease expense adjustment related to prior years for a ground lease associated with one of our Consolidated Hotels. Improved operations at certain hotels in the current year offset lower land lease expense resulting from the 2015 adjustment. To the extent our ground lease rent is tied to revenue, land lease expense increases as revenue increases. |
• | Impairment was $26.5 million compared to $20.9 million last year. The 2016 charges reflect a reduction in the fair value of one hotel resulting from third-party offers to purchase the hotel, as well as observable market data for hotels in similar locations, and a charge reflecting an accepted third-party offer to |
33
purchase a hotel sold in the current year. The 2015 charge resulted from reducing the estimated hold period for a hotel subsequently sold in 2016.
• | Other expenses increased $261,000 from last year. We attribute this change primarily to a $3.2 million increase in severance expense from last year, an $856,000 increase in expense for a litigation settlement, $740,000 incurred for hurricane costs in the current year and a $300,000 increase in abandoned costs. These increases are partially offset by a $5.0 million reduction in pre-opening costs, primarily attributable to The Knickerbocker. |
• | Net interest expense decreased $936,000. In 2015, we completed certain renovation and redevelopment projects, including The Knickerbocker, resulting in lower capitalized interest in the current year as compared to last year. Excluding the increase in interest expense resulting from less capitalization of interest on redevelopment projects, interest expense declined $5.9 million, reflecting lower average outstanding debt and a lower blended interest rate in the current year. |
• | Debt extinguishment charges in the current year were zero, compared to $30.9 million last year (which included a $10.5 million write-off of deferred loan costs), primarily related to redeeming our 6.75% senior secured notes. |
• | Equity in income from unconsolidated entities decreased $6.3 million, primarily reflecting the 2015 $7.1 million gain on sale of a hotel owned by one of our unconsolidated joint ventures, partially offset by improved operations at one of our unconsolidated joint ventures resulting from completing renovations which contributed to displacement-related reductions in 2015. |
• | Discontinued operations in 2016 and 2015 include adjustments to gains and losses for hotels sold prior to December 31, 2013. |
Comparison of the Years Ended December 31, 2015 and 2014
For the year ended December 31, 2015, we recorded a $3.5 million net loss compared to $94.2 million of net income in 2014. Our 2015 net loss included debt extinguishment charges of $30.9 million and a $20.9 million impairment charge related to one hotel, which was subsequently sold in 2016, partially offset by a $20.1 million net gain on hotel sales (including $658,000 in discontinued operations) and $3.7 million in net revenue attributable to a favorable settlement of a commercial dispute. Additionally, in 2015, one of our unconsolidated joint ventures sold a hotel, the gain from which increased our equity in income from unconsolidated entities by $7.1 million. Our 2014 net income included a $66.7 million net gain on hotel sales (of which $24.4 million resulted from foreign currency translation previously recorded in accumulated other comprehensive income and $102,000 included in discontinued operations), a $30.2 million gain on the disposition of our interests in unconsolidated hotels, and a $20.7 million gain on the fair value remeasurement of previously unconsolidated hotels. The 2014 gains were partially offset by a $5.9 million charge for a commercial dispute contingency (of which $3.7 million was subsequently recovered in 2015) and $5.0 million of debt extinguishment charges (including $245,000 in discontinued operations).
In 2015:
• | Hotel operating revenue decreased $39.6 million, including a $104.5 million net reduction in revenue for hotels that were disposed of or recently opened. Excluding these hotels, hotel operating revenue increased 8.5% from 2014. The increase was driven by an 8.1% increase in same-store RevPAR, reflecting a 5.3% increase in ADR and a 2.7% increase in occupancy from 2014. RevPAR for our Wyndham portfolio increased 15.1% from 2014, driven by a 9.9% increase in ADR and a 4.7% increase in occupancy, which primarily reflected the repositioning of these hotels as upper-upscale. |
34
• | Other revenue increased $4.3 million, primarily reflecting a $3.7 million net settlement of a commercial dispute in 2015. |
• | Hotel departmental expenses decreased $18.7 million, including a $31.6 million net reduction in expense for hotels that were disposed of or recently opened. Excluding these hotels, hotel departmental expenses decreased to 35.2% of hotel operating revenue in 2015 from 36.5% in 2014. This reduction primarily reflected improved margins for the rooms department, driven by increased ADR. Additionally, banquet and catering operations, which typically have higher margins than other food and beverage operations, increased in 2015 compared to 2014. |
• | Other property-related costs decreased $14.6 million, including a $29.4 million net reduction in expense for hotels that were disposed of or recently opened. Excluding these hotels, other property-related costs decreased slightly to 24.9% of hotel operating revenue in 2015 from 25.1% in 2014, primarily driven by ADR growth. |
• | Management and franchise fees decreased $495,000, including a $5.1 million net reduction in expense for hotels that were disposed of or recently opened. Excluding these hotels, these costs increased slightly to 4.0% of hotel operating revenue in 2015 from 3.8% in 2014. |
• | Taxes, insurance and lease expense decreased $25.1 million to 6.7% of hotel operating revenue in 2015 compared to 9.2% for 2014. The decrease primarily reflected a $24.2 million reduction in hotel lease expense resulting from unwinding our 10-hotel unconsolidated joint ventures in 2014 and selling one hotel owned by an unconsolidated joint venture in 2015. |
The decrease also included a $1.3 million net reduction, primarily due to property tax expense, and included property insurance and land lease expense for hotels that were disposed of or recently opened. Excluding these hotels, the net reduction in property tax expense reflected the successful resolution of property tax appeals, partially offset by increased assessed property values. Our insurance expense declined due to more favorable property insurance rates and a successful insured claims experience in 2015. Land lease expense in 2015 included a $1.6 million straight-line lease expense adjustment related to prior years for a ground lease associated with one of our Consolidated Hotels. The 2015 lease adjustment, as well as improved hotel operations at hotels subject to a ground lease, partially offset reductions attributable to property taxes and insurance. To the extent our ground lease rent is tied to revenue, land lease expense increases as revenue increases.
• | Corporate expenses decreased $2.3 million and primarily reflected the change in stock compensation expense associated with variable stock awards (our stock price increased during 2014 but decreased in 2015) and lower corporate bonus expense in 2015. |
• | Depreciation and amortization expense decreased $1.4 million primarily attributable to selling hotels, partially offset by depreciation recognized on The Knickerbocker after the hotel was placed in service during 2015. |
• | Impairment for 2015 was $20.9 million resulting from a reduced estimated hold period for one hotel subsequently sold in 2016. We recorded no impairment for 2014. |
• | Other expenses decreased $5.5 million from 2014. This change was primarily attributable to a $5.9 million charge recognized in 2014 for a commercial dispute contingency and a $2.4 million reduction in pre-opening costs incurred for The Knickerbocker in 2015. These reductions were partially offset by $3.7 million in severance charges in 2015 compared to $928,000 in 2014. |
35
• | Net interest expense decreased $11.6 million, primarily reflecting lower outstanding debt and a lower blended interest rate, offset partially by lower capitalized interest as we completed certain renovation and redevelopment projects, including The Knickerbocker in 2015. |
• | Debt extinguishment was $30.9 million in 2015 (which included a $10.5 million write-off of deferred loan costs), primarily related to the redemption of our 6.75% senior secured notes. In 2014, we recorded $4.8 million in debt extinguishment charges primarily related to repaying the remaining $234.0 million of our 10% senior secured notes, which were due in 2014, and repaying a $9.6 million loan in connection with the sale of a hotel. |
• | Equity in income from unconsolidated entities increased $2.8 million. In 2015, one of our unconsolidated joint ventures sold a hotel, which increased our equity in income from unconsolidated entities by $7.1 million from the gain on sale. That increase was partially offset by lower income after we unwound our 10-hotel unconsolidated joint ventures in July 2014 and a decline in operations at one of our remaining unconsolidated joint ventures, which resulted from renovation-related displacement. |
• | Income tax expense increased $585,000, primarily due to changes in state apportionment factors, resulting from hotel asset sales, and full utilization of state net operating loss carryforwards. |
36
Non-GAAP Financial Measures
We refer in this Annual Report to certain “non-GAAP financial measures.” These measures, including FFO (Funds From Operations), Adjusted FFO, EBITDA (Earnings before Interest, Taxes, Depreciation and Amortization), Adjusted EBITDA, Same-store Adjusted EBITDA, Hotel EBITDA and Hotel EBITDA margin, are measures of our financial performance that are not calculated and presented in accordance with generally accepted accounting principles, or GAAP. The following tables reconcile these non-GAAP measures to FelCor’s most comparable GAAP financial measures. Immediately following the reconciliations, we include a discussion of why we believe these measures are useful supplemental measures of our performance and of the limitations of such measures.
37
Reconciliation of Net Income (Loss) to FFO and Adjusted FFO
(in thousands, except per share data)
Year Ended December 31, | |||||||||||||||||||||
2016 | 2015 | ||||||||||||||||||||
Dollars | Shares | Per Share Amount | Dollars | Shares | Per Share Amount | ||||||||||||||||
Net income (loss) | $ | 4,193 | $ | (3,465 | ) | ||||||||||||||||
Noncontrolling interests | 766 | (3,963 | ) | ||||||||||||||||||
Preferred dividends | (25,115 | ) | (30,138 | ) | |||||||||||||||||
Preferred distributions - consolidated joint venture | (1,461 | ) | (1,437 | ) | |||||||||||||||||
Redemption of preferred stock | — | (6,096 | ) | ||||||||||||||||||
Net loss attributable to FelCor common stockholders | (21,617 | ) | (45,099 | ) | |||||||||||||||||
Less: Dividends declared on unvested restricted stock | (129 | ) | (56 | ) | |||||||||||||||||
Basic and diluted earnings per share data | (21,746 | ) | 138,128 | $ | (0.16 | ) | (45,155 | ) | 137,730 | $ | (0.33 | ) | |||||||||
Depreciation and amortization | 114,054 | — | 0.83 | 114,452 | — | 0.83 | |||||||||||||||
Depreciation, unconsolidated entities and other partnerships | 1,844 | — | 0.01 | 2,211 | — | 0.02 | |||||||||||||||
Other gains, net | (342 | ) | — | — | (100 | ) | — | — | |||||||||||||
Impairment | 26,459 | — | 0.19 | 20,861 | — | 0.15 | |||||||||||||||
Gain on sale of hotel in unconsolidated entity | — | — | — | (7,126 | ) | — | (0.05 | ) | |||||||||||||
Gain on sale of hotels, net of noncontrolling interests in other partnerships | (3,191 | ) | — | (0.03 | ) | (15,096 | ) | — | (0.12 | ) | |||||||||||
Noncontrolling interests in FelCor LP | (93 | ) | 611 | — | (194 | ) | 611 | — | |||||||||||||
Dividends declared on unvested restricted stock | 129 | — | — | 56 | 4 | — | |||||||||||||||
Conversion of unvested restricted stock units | — | 155 | — | — | 488 | — | |||||||||||||||
FFO* | 117,114 | 138,894 | 0.84 | 69,909 | 138,833 | 0.50 | |||||||||||||||
Debt extinguishment | — | — | — | 30,909 | — | 0.22 | |||||||||||||||
Debt extinguishment, unconsolidated entities | — | — | — | 330 | — | — | |||||||||||||||
Variable stock compensation | 450 | — | — | 798 | — | 0.01 | |||||||||||||||
Redemption of preferred stock | — | — | — | 6,096 | — | 0.05 | |||||||||||||||
Severance costs | 6,874 | — | 0.06 | 3,667 | — | 0.03 | |||||||||||||||
Contract dispute recovery | — | — | — | (3,717 | ) | — | (0.03 | ) | |||||||||||||
Pre-opening costs, net of noncontrolling interests | 527 | — | — | 5,235 | — | 0.04 | |||||||||||||||
Litigation settlement | 856 | — | 0.01 | — | — | — | |||||||||||||||
Lease adjustment | — | — | — | 1,628 | — | 0.01 | |||||||||||||||
Hurricane and earthquake loss | 740 | — | 0.01 | — | — | — | |||||||||||||||
Hurricane and earthquake loss, unconsolidated entities | 45 | — | — | — | — | — | |||||||||||||||
Abandoned projects | 620 | — | — | 320 | — | — | |||||||||||||||
Adjusted FFO* | $ | 127,226 | 138,894 | $ | 0.92 | $ | 115,175 | 138,833 | $ | 0.83 | |||||||||||
* FFO and Adjusted FFO are attributable to FelCor common stockholders and FelCor LP common unitholders other than FelCor.
38
Reconciliation of Net Income (Loss) to FFO and Adjusted FFO
(in thousands, except per share data)
Year Ended December 31, | ||||||||||||||||||||||||||||||||
2014 | 2013 | 2012 | ||||||||||||||||||||||||||||||
Dollars | Shares | Per Share Amount | Dollars | Shares | Per Share Amount | Dollars | Shares | Per Share Amount | ||||||||||||||||||||||||
Net income (loss) | $ | 94,152 | $ | (65,783 | ) | $ | (129,414 | ) | ||||||||||||||||||||||||
Noncontrolling interests | (834 | ) | 4,279 | 1,407 | ||||||||||||||||||||||||||||
Preferred dividends | (38,712 | ) | (38,713 | ) | (38,713 | ) | ||||||||||||||||||||||||||
Preferred distributions - consolidated joint venture | (1,219 | ) | — | — | ||||||||||||||||||||||||||||
Net income (loss) attributable to FelCor common stockholders | 53,387 | (100,217 | ) | (166,720 | ) | |||||||||||||||||||||||||||
Less: Dividends declared on unvested restricted stock | (8 | ) | — | — | ||||||||||||||||||||||||||||
Less: Undistributed earnings allocated to unvested restricted stock | (20 | ) | — | — | ||||||||||||||||||||||||||||
Basic earnings per share data | 53,359 | 124,158 | 0.43 | (100,217 | ) | 123,818 | $ | (0.81 | ) | (166,720 | ) | 123,634 | $ | (1.35 | ) | |||||||||||||||||
Restricted stock units | — | 734 | — | — | — | — | — | — | — | |||||||||||||||||||||||
Diluted earnings per share data | 53,359 | 124,892 | 0.43 | (100,217 | ) | 123,818 | (0.81 | ) | (166,720 | ) | 123,634 | (1.35 | ) | |||||||||||||||||||
Depreciation and amortization | 115,819 | — | 0.93 | 119,624 | — | 0.97 | 116,384 | — | 0.94 | |||||||||||||||||||||||
Depreciation, discontinued operations, unconsolidated entities and other partnerships | 6,891 | — | 0.06 | 15,996 | — | 0.13 | 24,216 | — | 0.20 | |||||||||||||||||||||||
Other gains, net | (100 | ) | — | — | (37 | ) | — | — | — | — | — | |||||||||||||||||||||
Other gains, discontinued operations | — | — | — | (59 | ) | — | — | — | — | — | ||||||||||||||||||||||
Impairment, net of noncontrolling interests in other partnerships | — | — | — | 20,382 | — | 0.16 | — | — | — | |||||||||||||||||||||||
Impairment, discontinued operations | — | — | — | 4,354 | — | 0.04 | 1,335 | — | 0.01 | |||||||||||||||||||||||
Gain on sale of hotels | (65,453 | ) | — | (0.52 | ) | (18,590 | ) | — | (0.15 | ) | (54,459 | ) | — | (0.44 | ) | |||||||||||||||||
Gain from remeasurement of unconsolidated entities | (20,737 | ) | — | (0.17 | ) | — | — | — | — | — | — | |||||||||||||||||||||
Gain on sale of investment in unconsolidated entities, net | (30,176 | ) | — | (0.24 | ) | — | — | — | — | — | — | |||||||||||||||||||||
Noncontrolling interests in FelCor LP | 137 | 614 | (0.01 | ) | (497 | ) | 619 | (0.01 | ) | (842 | ) | 628 | — | |||||||||||||||||||
Dividends declared on unvested restricted stock | 8 | 5 | — | — | — | — | — | — | — | |||||||||||||||||||||||
Conversion of unvested restricted stock units | 20 | — | — | — | 547 | — | — | — | — | |||||||||||||||||||||||
FFO* | 59,768 | 125,511 | 0.48 | 40,956 | 124,984 | 0.33 | (80,086 | ) | 124,262 | (0.64 | ) | |||||||||||||||||||||
Acquisition costs | — | — | — | 23 | — | — | 132 | — | — | |||||||||||||||||||||||
Debt extinguishment, including discontinued operations | 4,850 | — | 0.03 | — | — | — | 75,117 | — | 0.60 | |||||||||||||||||||||||
Debt extinguishment, unconsolidated entities | 168 | — | — | — | — | — | — | — | — | |||||||||||||||||||||||
Variable stock compensation | 2,723 | — | 0.02 | 963 | — | 0.01 | — | — | — | |||||||||||||||||||||||
Severance costs | 928 | — | 0.01 | 3,268 | — | 0.02 | 553 | — | — | |||||||||||||||||||||||
Contract dispute contingency | 5,850 | — | 0.05 | — | — | — | — | — | — | |||||||||||||||||||||||
Pre-opening costs, net of noncontrolling interests | 7,530 | — | 0.06 | 2,314 | — | 0.02 | 398 | — | — | |||||||||||||||||||||||
Hurricane and earthquake loss | 348 | — | — | — | — | — | 792 | — | 0.01 | |||||||||||||||||||||||
Hurricane and earthquake loss, discontinued operations and unconsolidated entities | — | — | — | — | — | — | 482 | — | — | |||||||||||||||||||||||
Conversion expenses | — | — | — | 1,134 | — | 0.01 | 31,197 | — | 0.25 | |||||||||||||||||||||||
Dividends declared on unvested restricted stock | — | — | — | — | — | — | — | 11 | 0.01 | |||||||||||||||||||||||
Abandoned projects | — | — | — | — | — | — | 219 | — | — | |||||||||||||||||||||||
Adjusted FFO* | $ | 82,165 | 125,511 | $ | 0.65 | $ | 48,658 | 124,984 | $ | 0.39 | $ | 28,804 | 124,273 | $ | 0.23 | |||||||||||||||||
* FFO and Adjusted FFO are attributable to FelCor common stockholders and FelCor LP common unitholders other than FelCor.
39
Reconciliation of Net Income (Loss) to EBITDA and Adjusted EBITDA and Same-store Adjusted EBITDA
(in thousands)
Year ended December 31, | |||||||||||||||||||
2016 | 2015 | 2014 | 2013 | 2012 | |||||||||||||||
Net income (loss) | $ | 4,193 | $ | (3,465 | ) | $ | 94,152 | $ | (65,783 | ) | $ | (129,414 | ) | ||||||
Depreciation and amortization | 114,054 | 114,452 | 115,819 | 119,624 | 116,384 | ||||||||||||||
Depreciation, discontinued operations, unconsolidated entities and other partnerships | 1,844 | 2,211 | 6,891 | 15,996 | 24,216 | ||||||||||||||
Interest expense | 78,244 | 79,142 | 90,743 | 103,865 | 121,690 | ||||||||||||||
Interest expense, discontinued operations and unconsolidated entities | 366 | 521 | 1,896 | 3,496 | 8,586 | ||||||||||||||
Income taxes | 873 | 1,245 | — | — | — | ||||||||||||||
Noncontrolling interests in preferred distributions - consolidated joint venture | (73 | ) | (71 | ) | — | — | — | ||||||||||||
Noncontrolling interests in other partnerships | 673 | (4,157 | ) | (697 | ) | 3,782 | 565 | ||||||||||||
EBITDA* | 200,174 | 189,878 | 308,804 | 180,980 | 142,027 | ||||||||||||||
Impairment, net of noncontrolling interests in other partnerships | 26,459 | 20,861 | — | 20,382 | — | ||||||||||||||
Impairment, discontinued operations and unconsolidated entities | — | — | — | 4,354 | 1,335 | ||||||||||||||
Hurricane and earthquake loss | 740 | — | 348 | — | 792 | ||||||||||||||
Hurricane and earthquake loss, discontinued operations and unconsolidated entities | 45 | — | — | — | 482 | ||||||||||||||
Debt extinguishment, including discontinued operations, net of noncontrolling interests | — | 30,909 | 4,850 | — | 75,117 | ||||||||||||||
Debt extinguishment, unconsolidated entities | — | 330 | 168 | — | — | ||||||||||||||
Gain on sale of hotel in unconsolidated entity | — | (7,126 | ) | — | — | — | |||||||||||||
Acquisition costs | — | — | — | 23 | 132 | ||||||||||||||
Contract dispute contingency | — | — | 5,850 | — | — | ||||||||||||||
Contract dispute recovery | — | (3,717 | ) | — | — | — | |||||||||||||
Amortization of fixed stock and directors’ compensation | 6,638 | 7,121 | 6,122 | 5,570 | 5,003 | ||||||||||||||
Severance costs | 6,874 | 3,667 | 928 | 3,268 | 553 | ||||||||||||||
Lease adjustment | — | 1,628 | — | — | — | ||||||||||||||
Litigation settlement | 856 | — | — | — | — | ||||||||||||||
Abandoned projects | 620 | 320 | — | — | 219 | ||||||||||||||
Conversion expenses | — | — | — | 1,134 | 31,197 | ||||||||||||||
Variable stock compensation | 450 | 798 | 2,723 | 963 | — | ||||||||||||||
Pre-opening costs, net of noncontrolling interests | 527 | 5,235 | 7,530 | 2,314 | 398 | ||||||||||||||
Gain on sale of hotels, net of noncontrolling interests in other partnerships | (3,191 | ) | (15,096 | ) | (65,453 | ) | (18,590 | ) | (54,459 | ) | |||||||||
Gain on sale of investment in unconsolidated entities, net | — | — | (30,176 | ) | — | — | |||||||||||||
Gain from remeasurement of unconsolidated entities | — | — | (20,737 | ) | — | — | |||||||||||||
Other gains, net of noncontrolling interests in other partnerships | (342 | ) | (100 | ) | (100 | ) | (37 | ) | — | ||||||||||
Other gains, discontinued operations, net of noncontrolling interests in other partnerships | — | — | — | (59 | ) | — | |||||||||||||
Adjusted EBITDA* | $ | 239,850 | $ | 234,708 | $ | 220,857 | $ | 200,302 | $ | 202,796 | |||||||||
Adjusted EBITDA from hotels disposed, held for sale or recently opened | (18,077 | ) | (15,193 | ) | (34,365 | ) | (44,135 | ) | (61,926 | ) | |||||||||
Same-store Adjusted EBITDA* | $ | 221,773 | $ | 219,515 | $ | 186,492 | $ | 156,167 | $ | 140,870 | |||||||||
* EBITDA, Adjusted EBITDA and Same-store Adjusted EBITDA are attributable to FelCor common stockholders and FelCor LP unitholders other than FelCor.
40
Hotel EBITDA and Hotel EBITDA Margin
(dollars in thousands)
Year Ended December 31, | |||||||||||
2016 | 2015 | 2014 | |||||||||
Same-store operating revenue: | |||||||||||
Room | $ | 604,280 | $ | 597,423 | $ | 550,971 | |||||
Food and beverage | 132,433 | 131,874 | 118,912 | ||||||||
Other operating departments | 43,818 | 42,806 | 40,336 | ||||||||
Same-store operating revenue(a) | 780,531 | 772,103 | 710,219 | ||||||||
Same-store operating expense: | |||||||||||
Room | 154,562 | 150,966 | 144,447 | ||||||||
Food and beverage | 100,111 | 99,363 | 90,689 | ||||||||
Other operating departments | 14,309 | 15,552 | 17,896 | ||||||||
Other property related costs | 190,591 | 189,869 | 175,821 | ||||||||
Management and franchise fees | 30,362 | 31,155 | 26,711 | ||||||||
Taxes, insurance and lease expense | 51,832 | 47,744 | 48,970 | ||||||||
Same-store operating expense(a) | 541,767 | 534,649 | 504,534 | ||||||||
Hotel EBITDA | $ | 238,764 | $ | 237,454 | $ | 205,685 | |||||
Hotel EBITDA Margin | 30.6 | % | 30.8 | % | 29.0 | % | |||||
(a) | Excludes The Knickerbocker, which opened in February 2015. |
41
Reconciliation of Same-store Operating Revenue and Same-store Operating Expenses to Total Revenue,
Total Operating Expenses and Operating Income
(dollars in thousands)
Year ended December 31, | |||||||||||||||
2016 | 2015 | 2014 | |||||||||||||
Same-store operating revenue | $ | 780,531 | $ | 772,103 | $ | 710,219 | |||||||||
Other revenue | 4,136 | 7,883 | 3,606 | ||||||||||||
Revenue from hotels disposed and recently opened (a) | 82,287 | 106,268 | 207,762 | ||||||||||||
Total revenue | 866,954 | 886,254 | 921,587 | ||||||||||||
Same-store operating expense | 541,767 | 534,649 | 504,534 | ||||||||||||
Consolidated hotel lease expense(b) | 4,896 | 7,107 | 31,635 | ||||||||||||
Unconsolidated taxes, insurance and lease expense | (1,983 | ) | (2,194 | ) | (6,163 | ) | |||||||||
Lease adjustment | — | 1,628 | — | ||||||||||||
Corporate expenses | 27,037 | 27,283 | 29,585 | ||||||||||||
Depreciation and amortization | 114,054 | 114,452 | 115,819 | ||||||||||||
Impairment loss | 26,459 | 20,861 | — | ||||||||||||
Expenses from hotels disposed and recently opened (a) | 63,802 | 90,276 | 160,373 | ||||||||||||
Other expenses | 12,740 | 12,479 | 17,952 | ||||||||||||
Total operating expenses | 788,772 | 806,541 | 853,735 | ||||||||||||
Operating income | $ | 78,182 | $ | 79,713 | $ | 67,852 | |||||||||
(a) | Under GAAP, we include the operating performance for disposed, held for sale and recently-opened hotels in continuing operations in our statements of operations. However, for purposes of our non-GAAP reporting metrics, we have excluded the results of these hotels to provide a meaningful same-store comparison. |
(b) | Consolidated hotel lease expense represents the lease expense of our 51% owned operating lessees. The offsetting lease revenue is included in equity in income from unconsolidated entities. |
Substantially all of our assets consist of real estate. Historical cost accounting for real estate assets implicitly assumes that the value of real estate assets diminishes predictably over time. Since real estate values instead have historically risen or fallen with market conditions, most industry investors consider supplemental measures of performance, which are not measures of operating performance under GAAP, to be helpful in evaluating a real estate company’s operations. These supplemental measures are not measures of operating performance under GAAP. However, we consider these non-GAAP measures to be supplemental measures of a hotel REIT’s performance and should be considered along with, but not as an alternative to, net income (loss) attributable to FelCor as a measure of our operating performance.
42
FFO and EBITDA
The National Association of Real Estate Investment Trusts (NAREIT) defines Funds From Operations (FFO) as net income or loss attributable to parent (computed in accordance with GAAP), excluding gains or losses from sales of property, plus depreciation, amortization and impairment losses. FFO for unconsolidated partnerships and joint ventures is calculated on the same basis. We compute FFO in accordance with standards established by NAREIT. This may not be comparable to FFO reported by other REITs that do not define the term in accordance with the current NAREIT definition or that interpret the current NAREIT definition differently than we do.
Earnings Before Interest, Taxes, Depreciation and Amortization (EBITDA) is a commonly used measure of performance in many industries. We define EBITDA as net income or loss attributable to parent (computed in accordance with GAAP) plus interest expenses, income taxes, depreciation and amortization, and after adjustments for unconsolidated partnerships and joint ventures. Adjustments for unconsolidated partnerships and joint ventures are calculated to reflect EBITDA on the same basis.
Adjustments to FFO and EBITDA
We adjust FFO and EBITDA when evaluating our performance because management believes that the exclusion of certain additional items provides useful supplemental information to investors regarding our ongoing operating performance and that the presentation of Adjusted FFO, and Adjusted EBITDA when combined with GAAP net income (loss) attributable to FelCor, EBITDA and FFO, is beneficial to an investor’s understanding of our operating performance.
• | Gains and losses related to extinguishment of debt and interest rate swaps - We exclude gains and losses related to extinguishment of debt and interest rate swaps from FFO and EBITDA because we believe that it is not indicative of ongoing operating performance of our hotel assets. This also represents an acceleration of interest expense or a reduction of interest expense, and interest expense is excluded from EBITDA. |
• | Cumulative effect of a change in accounting principle - Infrequently, the Financial Accounting Standards Board promulgates new accounting standards that require the consolidated statements of operations to reflect the cumulative effect of a change in accounting principle. We exclude these one-time adjustments in computing Adjusted FFO and Adjusted EBITDA because they do not reflect our actual performance for that period. |
• | Other expenses and costs - From time to time, we incur expenses or transaction costs that are not indicative of ongoing operating performance. Such costs include, but are not limited to, conversion costs, acquisition costs, pre-opening costs, severance costs and certain non-cash adjustments. We exclude these costs from the calculation of Adjusted FFO and Adjusted EBITDA. |
• | Variable stock compensation - We exclude the cost associated with our variable stock compensation. This cost is subject to volatility related to the price and dividends of our common stock that does not necessarily correspond to our operating performance. |
In addition, to derive Adjusted EBITDA, we exclude gains or losses on the sale of depreciable assets and impairment losses because including them in EBITDA is inconsistent with reporting the ongoing performance of our remaining assets. Additionally, the gain or loss on sale of depreciable assets and impairment losses represents either accelerated depreciation or excess depreciation in previous periods, and depreciation is excluded from EBITDA. We also exclude the amortization of our fixed stock and directors’ compensation, which is included in corporate expenses and is not separately stated on our statements of operations. Excluding amortization of our fixed stock and directors’ compensation maintains consistency with the EBITDA definition.
43
Hotel EBITDA and Hotel EBITDA Margin
Hotel EBITDA and Hotel EBITDA margin are commonly used measures of performance in the hotel industry and give investors a more complete understanding of the operating results over which our individual hotels and brands/managers have direct control. We believe that Hotel EBITDA and Hotel EBITDA margin are useful to investors by providing greater transparency with respect to two significant measures that we use in our financial and operational decision-making. Additionally, using these measures facilitates comparisons with other hotel REITs and hotel owners. We present Hotel EBITDA and Hotel EBITDA margin in a manner consistent with Adjusted EBITDA, however, we also eliminate all revenues and expenses from continuing operations not directly associated with hotel operations, including other income and corporate-level expenses. We eliminate these additional items because we believe property-level results provide investors with supplemental information into the ongoing operational performance of our hotels and the effectiveness of management on a property-level basis. We also eliminate consolidated percentage rent paid to unconsolidated entities, which is effectively eliminated by noncontrolling interests and equity in income from unconsolidated subsidiaries, and include the cost of unconsolidated taxes, insurance and lease expense, to reflect the entire operating costs applicable to our Consolidated Hotels. Hotel EBITDA and Hotel EBITDA margins are presented on a same-store basis.
Use and Limitations of Non-GAAP Measures
We use FFO, Adjusted FFO, EBITDA, Adjusted EBITDA, Same-store Adjusted EBITDA, Hotel EBITDA and Hotel EBITDA margin to evaluate the performance of our hotels and to facilitate comparisons between us and other lodging REITs, hotel owners who are not REITs and other capital intensive companies. We use Hotel EBITDA and Hotel EBITDA margin in evaluating hotel-level performance and the operating efficiency of our hotel managers.
The use of these non-GAAP financial measures has certain limitations. As we present them, these non-GAAP financial measures may not be comparable to similar non-GAAP financial measures as presented by other real estate companies. These measures do not reflect certain expenses or expenditures that we incurred and will incur, such as depreciation, interest and capital expenditures. We compensate for these limitations by separately considering the impact of these excluded items to the extent they are material to operating decisions or assessments of our operating performance. Our reconciliations to the most comparable GAAP financial measures, and our consolidated statements of operations and cash flows, include interest expense, capital expenditures, and other excluded items, all of which should be considered when evaluating our performance, and the usefulness of our non-GAAP financial measures.
These non-GAAP financial measures are used in addition to and in conjunction with results presented in accordance with GAAP. They should not be considered as alternatives to operating profit, cash flow from operations or any other operating performance measure prescribed by GAAP. These non-GAAP financial measures reflect additional ways of viewing our operations that we believe, when viewed with our GAAP results and the reconciliations to the corresponding GAAP financial measures, provide a more complete understanding of factors and trends affecting our business than could be obtained absent this disclosure. We strongly encourage investors to review our financial information in its entirety and not to rely on any single financial measure.
44
Liquidity and Capital Resources
Operating Activities
For the year ended December 31, 2016, RevPAR at our same-store hotels increased 0.9%, driven by a 1.8% increase in ADR offset by a 0.9% decrease in occupancy. We expect our RevPAR will increase 0.5 to 2.5% during 2017, primarily from higher ADR, and our operations will generate $142 million to $152 million of cash flow in 2017.
At December 31, 2016, we had $47.3 million of cash and cash equivalents, including approximately $29.1 million held by third-party management companies. During 2016, our operations (primarily hotel operations) provided $134.9 million in cash, $11.7 million less than 2015. This decrease primarily reflects changes in the timing of property tax payments made, and the timing of payments received from hotel guests, compared to last year.
Our consolidated statements of cash flows combine cash flow from continuing and discontinued operations. However, our hotels accounted for as discontinued operations have not changed since 2013. The operating cash flow related to these hotels has not been significant during 2016, 2015 and 2014.
We are subject to increases in hotel operating expenses, including wage and benefit costs, repair and maintenance expenses, utilities and insurance expenses that can fluctuate disproportionately to revenues. Some operating expenses are difficult to predict and control, which lends volatility to our operating results. Our hotels have extensive cost containment initiatives, including managing headcount and improving productivity and energy efficiency. If RevPAR decreases, or fails to grow in line with or better than occupancy, and/or Hotel EBITDA margins shrink, our operations, earnings and/or cash flow could be materially adversely affected.
Investing Activities
During 2016, our investing activities provided $18.6 million of cash compared to $116.6 million during 2015. In 2016, we sold two hotels for $101.0 million in aggregate net proceeds, while in 2015 we sold eight hotels for $187.9 million in aggregate net proceeds. Additionally, in 2015 we sold a hotel owned by an unconsolidated joint venture resulting in a $6.3 million distribution included in investing activities. We continue to market our three New York hotels for sale.
Our restricted cash increased $1.8 million in 2016 compared to a decrease of $2.8 million during 2015, primarily reflecting the redevelopment of The Knickerbocker, which we completed in 2015. We spent $33.5 million to redevelop The Knickerbocker in 2015 as we completed that project. In 2016, we spent $25.8 million more on renovation and redevelopment projects at our other hotels than we did in 2015. Additionally, after completing The Knickerbocker, we capitalized less interest in 2016 than in 2015. In 2016, we acquired land under one of our hotels for $8.2 million, including closing costs. We had previously leased the land.
Any future renovations and redevelopments will be made using operating cash flow, cash on hand and borrowings under our line of credit.
45
Financing Activities
During 2016, cash used in financing activities was $166.0 million, $84.4 million less than cash used in financing activities in 2015. In 2016, we repaid $156.0 million of our line of credit borrowings and $2.7 million in normal recurring principal payments.
The following transactions took place in 2015:
• | We amended and restated our secured line of credit to increase aggregate lender commitments to $400 million from $225 million (resulting in deferred financing fees of $5.8 million) and used funds drawn on the line of credit to repay a $140 million secured loan; |
• | We issued $475 million 6.0% senior unsecured notes (resulting in deferred financing fees of $8.5 million) and used the net proceeds, in addition to cash on hand and funds drawn under our line of credit, to repurchase and redeem our $525 million (face value) 6.75% senior secured notes; |
• | We repaid $62.1 million of secured debt using sale proceeds; |
• | We increased our borrowings under our loan secured by The Knickerbocker from $64.9 million to $85 million, amended the loan to lower the interest rate to LIBOR plus 300 basis points, and extended the maturity to November 2017; |
• | We issued 18.4 million shares of our common stock for net proceeds of approximately $199 million; |
• | We used proceeds from selling our common stock to redeem all of our outstanding shares of 8% Series C Cumulative Preferred Stock for an aggregate redemption price of $170.4 million (including $491,000 of accrued dividends); |
• | We received $1.7 million, compared to $597,000 in 2016, of additional net proceeds from selling preferred equity interests pursuant to the EB-5 Immigrant Investor Program by The Knickerbocker consolidated joint venture; and |
• | We increased our distributions to non-controlling interest holders to $17.6 million primarily due to selling a hotel in a consolidated joint venture. |
In 2015, our Board approved a stock repurchase program, pursuant to which we may repurchase up to $100 million of our common stock through October 2017. We may repurchase shares in transactions on the open market, in privately-negotiated transactions or by other means, including Rule 10b5-1 trading plans, in accordance with applicable securities laws and other restrictions. In 2015, FelCor paid $14.4 million (including commissions) to repurchase approximately 2.0 million shares of its common stock at an average price of $7.26 per share. In 2016, FelCor repurchased 4.6 million shares for $30.5 million (including commissions) at an average price of $6.58 per share. Since the inception of the repurchase program, FelCor has repurchased 6.6 million shares for a total of $44.8 million (including commissions), at an average share price of $6.78 per share.
In 2017, we expect to make approximately $3 million of scheduled principal payments and pay approximately $25 million of preferred stock dividends and $33 million of common stock dividends (assuming no change to our current quarterly dividend), all of which we expect to fund with operating cash flow and cash on hand. We are also marketing three hotels and expect to use the sale proceeds to repay debt, repurchase common stock and/or take advantage of future value-creation opportunities.
Our Board of Directors declared a $0.04 per share quarterly common stock dividend in March, June, and September of 2015 and a $0.06 per share quarterly common stock dividend in December 2015 and in each quarter in 2016.
46
Financing Activities (continued)
FelCor LP, which is our operating partnership, distributes funds to FelCor to pay common stock and preferred stock dividends. Our Board determines the amount of common stock and preferred stock dividends for each quarter, if any, based upon various factors including operating results, economic conditions, other operating trends, our financial condition and capital requirements, as well as the minimum REIT distribution requirements.
Except for our 5.625% senior secured notes due 2023 and our line of credit, our secured debt is generally recourse solely to the specific hotels securing the debt, except in case of fraud, misapplication of funds and certain other customary limited recourse carve-out provisions that could extend recourse to us. Much of our secured debt allows us to substitute collateral under certain conditions and is freely prepayable, subject in some instances to various prepayment, yield maintenance or defeasance obligations.
Most of our secured debt (other than our 5.625% senior secured notes) is subject to lock-box arrangements under certain circumstances. We are permitted to spend an amount required to cover our hotel operating expenses, taxes, debt service, insurance and capital expenditure reserves, even if revenues are flowing through a lock-box triggered by a specified debt service coverage ratio not being met. All of our consolidated loans subject to lock-box provisions currently exceed the applicable minimum debt service coverage ratios.
Senior Notes. Our senior notes, which are guaranteed by FelCor, require that we satisfy total leverage, secured leverage and interest coverage tests in order to: (i) incur additional indebtedness, except to refinance maturing debt with replacement debt, as defined under our indentures; (ii) pay dividends in excess of the minimum distributions required to qualify as a REIT; (iii) repurchase capital stock; or (iv) merge. We currently exceed all minimum thresholds. In addition, our 5.625% senior secured notes are secured by a combination of first lien mortgages and related security interests on nine hotels, as well as pledges of equity interests in certain subsidiaries of FelCor LP, and our 6.0% senior unsecured notes require us to maintain at least a minimum amount of unencumbered assets.
Interest Rate Caps. To fulfill requirements under one of our loans, we entered into an interest rate cap agreement with an aggregate notional amount of $140 million at December 31, 2015. We did not designate the interest rate cap as a hedge, and it had an insignificant fair value at December 31, 2015, resulting in no significant impact on earnings. We had no outstanding interest rate caps at December 31, 2016.
Consolidated debt consisted of the following (in thousands) at the dates shown:
Encumbered | Interest | Maturity | December 31, | ||||||||||||||
Hotels | Rate (%) | Date | 2016 | 2015 | |||||||||||||
Senior unsecured notes | — | 6.00 | June 2025 | $ | 475,000 | $ | 475,000 | ||||||||||
Senior secured notes | 9 | 5.625 | March 2023 | 525,000 | 525,000 | ||||||||||||
Mortgage debt(a) | 4 | 4.95 | October 2022 | 120,109 | 122,237 | ||||||||||||
Mortgage debt | 1 | 4.94 | October 2022 | 30,184 | 30,717 | ||||||||||||
Line of credit(b) | 7 | LIBOR + 2.75 | June 2019 | 119,000 | 190,000 | ||||||||||||
Mortgage debt (c) | 1 | LIBOR + 3.00 | November 2017 | 85,000 | 85,000 | ||||||||||||
Total | 22 | $ | 1,354,293 | $ | 1,427,954 | ||||||||||||
Unamortized debt issuance costs | (15,967 | ) | (18,065 | ) | |||||||||||||
Debt, net of unamortized debt issuance costs | $ | 1,338,326 | $ | 1,409,889 | |||||||||||||
(a) | This debt is comprised of separate non-cross-collateralized loans, each secured by a mortgage encumbering a separate hotel. |
(b) | Our line of credit can be extended for one year, subject to satisfying certain conditions. We may borrow up to $400 million under our line of credit. |
(c) | This loan can be extended for one year, subject to satisfying certain conditions. |
47
Contractual Obligations
We have obligations and commitments to make certain future payments under debt agreements and various contracts. The following schedule details these obligations at December 31, 2016 (in thousands):
Total | Less Than 1 Year | 1 – 3 Years | 4 – 5 Years | After 5 Years | ||||||||||||||||
Debt(a) | $ | 1,832,688 | $ | 161,532 | $ | 263,302 | $ | 136,091 | $ | 1,271,763 | ||||||||||
Operating leases | 237,259 | 8,463 | 13,615 | 11,649 | 203,532 | |||||||||||||||
Purchase obligations | 26,184 | 22,409 | 3,775 | — | — | |||||||||||||||
Total contractual obligations | $ | 2,096,131 | $ | 192,404 | $ | 280,692 | $ | 147,740 | $ | 1,475,295 | ||||||||||
(a) | This includes both principal and interest. Interest expense for variable rate debt was calculated using interest rates at December 31, 2016. |
Off-Balance Sheet Arrangements
At December 31, 2016, we had unconsolidated 50% interests in entities that owned two hotels (which we refer to as hotel joint ventures). We own more than 50% of the operating lessee for one of these hotels and one hotel is operated without a lease. We also own 50% interests in entities that own real estate in Myrtle Beach, South Carolina and provide condominium management services there. None of our directors, officers or employees owns any interest in any of these joint ventures or entities. One of our hotel joint ventures had $22.3 million of non-recourse mortgage debt, of which our pro rata portion was $11.2 million, none of which is reflected as a liability on our consolidated balance sheet. Our liabilities with regard to non-recourse debt and the liabilities of our subsidiaries that are members or partners in joint ventures are generally limited to guaranties of the borrowing entity’s obligations to pay for the lender’s losses caused by misconduct, fraud or misappropriation of funds by the venture and other typical exceptions from the non-recourse provisions in the mortgages, such as for environmental liabilities.
We have recorded equity in income from unconsolidated entities of $1.5 million, $7.8 million and $5.0 million for 2016, 2015 and 2014, respectively. We received $2.8 million of distributions (of which $1.2 million came from operations), $13.4 million (of which $6.1 million came from operations) and $17.0 million (of which $4.1 million came from operations) in 2016, 2015 and 2014, respectively. The principal source of income for our hotel joint ventures is percentage lease revenue from the operating lessees.
Capital expenditures at hotels owned by a hotel joint venture are generally funded from operating income at its hotels. However, if a joint venture has insufficient cash flow to meet operating expenses or make necessary capital improvements, it may call capital from the investors. In the event of a capital call, the other joint investors may be unwilling or unable to make the necessary capital contributions. Under such circumstances, we may elect to fund the difference as a loan to the joint venture or as an additional capital contribution by us. Under certain circumstances, a capital contribution by us may increase our equity investment to greater than 50% and may require that we consolidate the joint venture, including all of its assets and liabilities, into our consolidated financial statements. We may be confronted with the choice of losing our investment in a venture or investing additional capital with no guaranty of any return on that investment.
48
Inflation
Operators of hotels, in general, possess the ability to adjust room rates daily to reflect the effects of inflation. Competitive pressures may, however, require us to reduce room rates in the near term and may limit our ability to raise room rates in the future. We are also subject to the risk that inflation will cause increases in hotel operating expenses disproportionately to revenues.
Seasonality
The lodging business is seasonal in nature. Generally, hotel revenues are greater in the second and third calendar quarters than in the first and fourth calendar quarters, although this may not always apply for hotels in major tourist destinations. Revenues for hotels in tourist areas generally are substantially greater during tourist season than other times of the year. Seasonal variations in revenue at our hotels can be expected to cause quarterly fluctuations in our revenues. Quarterly earnings also may be adversely affected by events beyond our control, such as extreme weather conditions, economic factors and other considerations affecting travel. To the extent that cash flow from operations is insufficient during any quarter, due to temporary or seasonal fluctuations in revenues, we may utilize cash on hand or borrowings to satisfy our obligations.
49
Critical Accounting Policies and Estimates
Our discussion and analysis of our financial condition and results of operations is based upon our consolidated financial statements, which have been prepared in accordance with GAAP. The preparation of these financial statements requires us to make estimates and judgments that affect the reported amounts of assets, liabilities, revenues and expenses, and related disclosure of contingent assets and liabilities.
On an on-going basis, we evaluate our estimates, including those related to bad debts, the carrying value of investments in hotels, litigation, and other contingencies. We base our estimates on historical experience and on various other assumptions that we believe to be reasonable under the circumstances, the results of which form the basis for making judgments about the carrying values of assets and liabilities that are not readily apparent from other sources. Actual results may differ from these estimates under different assumptions or conditions.
We believe the following critical accounting policies affect the most significant judgments and estimates used in the preparation of our consolidated financial statements:
• | We record an impairment charge when we believe that an investment in one or more of our hotels held for investment has been impaired, such that future undiscounted cash flows would not recover the book basis, or net book value, of the investment. We test for impairment charge when certain events occur, including one or more of the following: projected cash flows are significantly less than recent historical cash flows; significant changes in legal factors or actions by a regulator that could affect the value of our hotels; events that could cause changes or uncertainty in travel patterns; and a current expectation that, more likely than not, a hotel will be sold or otherwise disposed of significantly before the end of its previously estimated useful life. In the evaluation of impairment of our hotels, and in establishing impairment charges, we make many assumptions and estimates on a hotel by hotel basis, which include the following: |
◦ | Annual cash flow growth rates for revenues and expenses; |
◦ | Holding periods; |
◦ | Expected remaining useful lives of assets; |
◦ | Estimates in fair values taking into consideration future cash flows, capitalization rates, discount rates and comparable selling prices; and |
◦ | Future capital expenditures. |
• | We record an impairment charge when one or more of our investments in unconsolidated subsidiaries experiences an other-than-temporary decline in fair value. Any decline in fair value that is not expected to be recovered in the next 12 months is considered other-than-temporary. We record an impairment in our equity-based investments as a reduction in the carrying value of the investment. Our estimates of fair values are based on future cash flow estimates, capitalization rates, discount rates and comparable selling prices. |
Changes in these estimates, future adverse changes in market conditions or poor operating results of underlying hotels could result in an inability to recover the carrying value of our hotels or investments in unconsolidated entities, thereby requiring future impairment charges.
• | We capitalize interest and certain other costs, such as property taxes, land leases, property insurance and employee costs related to hotels undergoing major renovations and redevelopments. In 2016, 2015 and 2014, we capitalized $7.7 million, $13.3 million and $25.9 million, respectively, of such costs. We make estimates with regard to when components of the renovated assets or redevelopment projects are taken out of service or placed in service when determining the appropriate amount and time to capitalize these costs. If these estimates are inaccurate, we could capitalize too much or too little with regard to a particular project. |
50
• | Depreciation expense is based on the estimated useful life of our assets, and amortization expense for leasehold improvements is the shorter of the lease term or the estimated useful life of the related assets. The lives of the assets are based on a number of assumptions including cost and timing of capital expenditures to maintain and refurbish the assets, as well as specific market and economic conditions. While we believe our estimates are reasonable, a change in the estimated lives could affect depreciation and amortization expense and net income (loss) or the gain or loss on the sale of any of our hotels. |
• | Investments in hotel properties are based on purchase price and allocated to land, property and equipment, identifiable intangible assets and assumed debt and other liabilities at fair value. Any remaining unallocated purchase price, if any, is treated as goodwill. Property and equipment are recorded at fair value, based on current replacement cost for similar capacity, and allocated to buildings, improvements, furniture, fixtures and equipment using appraisals and valuations prepared by management and/or independent third parties. Identifiable intangible assets (typically contracts including ground and retail leases and management and franchise agreements) are recorded at fair value, although no value is generally allocated to contracts which are at market terms. Above-market and below-market contract values are based on the present value of the difference between contractual amounts to be paid pursuant to the contracts acquired and our estimate of the fair value of contract rates for corresponding contracts measured over the period equal to the remaining non-cancelable term of the contract. Intangible assets are amortized using the straight-line method over the remaining non-cancelable term of the related agreements. In making estimates of fair values for purposes of allocating purchase price, we may utilize a number of sources such as those obtained in connection with the acquisition or financing of a property and other market data, including third-party appraisals and valuations. |
• | We make estimates with respect to contingent liabilities for losses covered by insurance. We record liabilities for self-insured losses under our insurance programs when it becomes probable that an asset has been impaired or a liability has been incurred at the date of our financial statements and the amount of the loss can be reasonably estimated. We are self-insured for the first $250,000, per occurrence, of our general liability claims with regard to 32 of our hotels. We review the adequacy of our reserves for our self-insured claims on a regular basis. Our reserves are intended to cover the estimated ultimate uninsured liability for losses with respect to reported and unreported claims incurred at the end of each accounting period. These reserves represent estimates at a given date, generally utilizing projections based on claims, historical settlement of claims and estimates of future costs to settle claims. Estimates are also required since there may be delays in reporting. Because the establishment of insurance reserves is an inherently uncertain process involving estimates, currently established reserves may not be sufficient. If our insurance reserves of $3.3 million, at December 31, 2016, for general liability losses are insufficient, we will record an additional expense in future periods. Property and catastrophic losses are event-driven losses and, as such, until a loss occurs and the amount of loss can be reasonably estimated, no liability is recorded. We recorded no contingent liabilities with regard to property or catastrophic losses at December 31, 2016. |
• | The deferred income tax asset associated with potential future tax deductions and credits was $123.4 million at December 31, 2016. We recorded a 100% valuation allowance related to our TRSs’ net deferred tax assets because we believe it is more likely than not that the deferred tax assets will not be fully realized. The realization of the deferred tax assets associated with our net operating losses is dependent on projections of future taxable income, for which there is uncertainty when considering our historic results and cyclical nature of the lodging industry. The objectives of accounting for income taxes are to recognize the amount of taxes payable or refundable for the current year and deferred tax liabilities and assets for the future tax consequences of events that have been recognized in an entity’s financial statements or tax returns. We have considered future taxable income and ongoing prudent and feasible tax planning strategies in assessing the need for a valuation allowance. In the event we were to determine that we would be able to realize all or a portion of our deferred tax assets in the future, an adjustment to the deferred tax assets would increase operating income in the period such determination was made. |
51
Item 7A. Quantitative and Qualitative Disclosures About Market Risk
At December 31, 2016, approximately 85% of our consolidated debt had fixed interest rates. In some cases, market rates of interest are below the rates we are obligated to pay on our fixed-rate debt.
The following table provides information about our financial instruments that are sensitive to changes in interest rates. For debt obligations, the table presents scheduled maturities (before extension options) and weighted average interest rates, by maturity dates. The fair value of our fixed-rate debt indicates the estimated principal amount of debt having the same debt service requirements that could have been borrowed at the date presented, at then current market interest rates.
December 31, 2016 | |||||||||||||||||||||||||||||||
Expected Maturity Date | |||||||||||||||||||||||||||||||
2017 | 2018 | 2019 | 2020 | 2021 | Thereafter | Total | Fair Value | ||||||||||||||||||||||||
Liabilities | (dollars in thousands) | ||||||||||||||||||||||||||||||
Fixed rate: | |||||||||||||||||||||||||||||||
Debt | $ | 2,637 | $ | 2,954 | $ | 3,106 | $ | 3,245 | $ | 3,432 | $ | 1,134,919 | $ | 1,150,293 | $ | 1,196,022 | |||||||||||||||
Average interest rate | 4.95 | % | 4.95 | % | 4.95 | % | 4.95 | % | 4.95 | % | 5.70 | % | 5.69 | % | |||||||||||||||||
Floating rate: | |||||||||||||||||||||||||||||||
Debt | $ | 85,000 | — | $ | 119,000 | — | — | — | $ | 204,000 | $ | 204,000 | |||||||||||||||||||
Average interest rate(a) | 4.17 | % | — | 4.86 | % | — | — | — | 4.57 | % | |||||||||||||||||||||
Total debt | $ | 87,637 | $ | 2,954 | $ | 122,106 | $ | 3,245 | $ | 3,432 | $ | 1,134,919 | $ | 1,354,293 | |||||||||||||||||
Average interest rate | 4.19 | % | 4.95 | % | 4.86 | % | 4.95 | % | 4.95 | % | 5.70 | % | 5.52 | % | |||||||||||||||||
Unamortized debt issuance costs | $ | (15,967 | ) | ||||||||||||||||||||||||||||
Debt, net of unamortized debt issuance costs | $ | 1,338,326 | |||||||||||||||||||||||||||||
(a) | The average floating rate reflects the implied forward rates in the yield curve at December 31, 2016. |
December 31, 2015 | |||||||||||||||||||||||||||||||
Expected Maturity Date | |||||||||||||||||||||||||||||||
2016 | 2017 | 2018 | 2019 | 2020 | Thereafter | Total | Fair Value | ||||||||||||||||||||||||
Liabilities | (dollars in thousands) | ||||||||||||||||||||||||||||||
Fixed rate: | |||||||||||||||||||||||||||||||
Debt | $ | 2,488 | $ | 2,810 | $ | 2,954 | $ | 3,106 | $ | 3,245 | $ | 1,138,351 | $ | 1,152,954 | $ | 1,184,292 | |||||||||||||||
Average interest rate | 4.95 | % | 4.95 | % | 4.95 | % | 4.95 | % | 4.95 | % | 5.70 | % | 5.69 | % | |||||||||||||||||
Floating rate: | |||||||||||||||||||||||||||||||
Debt | — | $ | 85,000 | $ | — | 190,000 | — | — | $ | 275,000 | $ | 275,000 | |||||||||||||||||||
Average interest rate(a) | — | 4.47 | % | — | % | 4.77 | — | — | 4.68 | % | |||||||||||||||||||||
Total debt | $ | 2,488 | $ | 87,810 | $ | 2,954 | $ | 193,106 | $ | 3,245 | $ | 1,138,351 | $ | 1,427,954 | |||||||||||||||||
Average interest rate | 4.95 | % | 4.49 | % | 4.95 | % | 4.77 | % | 4.95 | % | 5.70 | % | 5.70 | % | |||||||||||||||||
Unamortized debt issuance costs | $ | (18,065 | ) | ||||||||||||||||||||||||||||
Debt, net of unamortized debt issuance costs | $ | 1,409,889 | |||||||||||||||||||||||||||||
(a) | The average floating rate reflects the implied forward rates in the yield curve at December 31, 2015. |
To fulfill requirements under one of our loans, we entered into an interest rate cap agreement with an aggregate notional amount of $140 million at December 31, 2015. This interest rate cap was not designated as a hedge and had an insignificant fair value at December 31, 2015, resulting in no significant impact on earnings. We had no outstanding interest rate caps at December 31, 2016.
52
Item 8. Financial Statements and Supplementary Data
FELCOR LODGING TRUST INCORPORATED and
FELCOR LODGING LIMITED PARTNERSHIP
INDEX TO FINANCIAL STATEMENTS
Report of Independent Registered Public Accounting Firm (FelCor Lodging Trust Incorporated) | |
Report of Independent Registered Public Accounting Firm (FelCor Lodging Limited Partnership) | |
FelCor Lodging Trust Incorporated Financial Statements: | |
Consolidated Balance Sheets — As of December 31, 2016 and 2015 | |
Consolidated Statements of Operations for the years ended December 31, 2016, 2015 and 2014 | |
Consolidated Statements of Comprehensive Income (Loss) for the years ended December 31, 2016, 2015 and 2014 | |
Consolidated Statements of Equity for the years ended December 31, 2016, 2015 and 2014 | |
Consolidated Statements of Cash Flows for the years ended December 31, 2016, 2015 and 2014 | |
FelCor Lodging Limited Partnership Financial Statements: | |
Consolidated Balance Sheets — As of December 31, 2016 and 2015 | |
Consolidated Statements of Operations for the years ended December 31, 2016, 2015 and 2014 | |
Consolidated Statements of Comprehensive Income (Loss) for the years ended December 31, 2016, 2015 and 2014 | |
Consolidated Statements of Partners’ Capital for the years ended December 31, 2016, 2015 and 2014 | |
Consolidated Statements of Cash Flows for the years ended December 31, 2016, 2015 and 2014 | |
Notes to Consolidated Financial Statements | |
Schedule III — Real Estate and Accumulated Depreciation as of December 31, 2016 | |
All other schedules are omitted because they are not required or the required information is shown in the financial statements or notes thereto.
53
Report of Independent Registered Public Accounting Firm
To the Board of Directors and Stockholders of
FelCor Lodging Trust Incorporated
In our opinion, the accompanying consolidated balance sheets and the related consolidated statements of operations, of comprehensive income (loss), of equity, and of cash flows present fairly, in all material respects, the financial position of FelCor Lodging Trust Incorporated and its subsidiaries at December 31, 2016 and 2015, and the results of their operations and their cash flows for each of the three years in the period ended December 31, 2016 in conformity with accounting principles generally accepted in the United States of America. In addition, in our opinion, the financial statement schedule listed in the accompanying index presents fairly, in all material respects, the information set forth therein when read in conjunction with the related consolidated financial statements. Also in our opinion, the Company maintained, in all material respects, effective internal control over financial reporting as of December 31, 2016, based on criteria established in Internal Control - Integrated Framework (2013) issued by the Committee of Sponsoring Organizations of the Treadway Commission (COSO). The Company’s management is responsible for these financial statements and financial statement schedule, for maintaining effective internal control over financial reporting and for its assessment of the effectiveness of internal control over financial reporting, included in Management’s Report on Internal Control over Financial Reporting appearing under Item 9A. Our responsibility is to express opinions on these financial statements, on the financial statement schedule, and on the Company’s internal control over financial reporting based on our integrated audits. We conducted our audits in accordance with the standards of the Public Company Accounting Oversight Board (United States). Those standards require that we plan and perform the audits to obtain reasonable assurance about whether the financial statements are free of material misstatement and whether effective internal control over financial reporting was maintained in all material respects. Our audits of the financial statements included examining, on a test basis, evidence supporting the amounts and disclosures in the financial statements, assessing the accounting principles used and significant estimates made by management, and evaluating the overall financial statement presentation. Our audit of internal control over financial reporting included obtaining an understanding of internal control over financial reporting, assessing the risk that a material weakness exists, and testing and evaluating the design and operating effectiveness of internal control based on the assessed risk. Our audits also included performing such other procedures as we considered necessary in the circumstances. We believe that our audits provide a reasonable basis for our opinions.
As discussed in Note 9 to the consolidated financial statements, the Company changed the presentation of certain deferred financing costs.
A company’s internal control over financial reporting is a process designed to provide reasonable assurance regarding the reliability of financial reporting and the preparation of financial statements for external purposes in accordance with generally accepted accounting principles. A company’s internal control over financial reporting includes those policies and procedures that (i) pertain to the maintenance of records that, in reasonable detail, accurately and fairly reflect the transactions and dispositions of the assets of the company; (ii) provide reasonable assurance that transactions are recorded as necessary to permit preparation of financial statements in accordance with generally accepted accounting principles, and that receipts and expenditures of the company are being made only in accordance with authorizations of management and directors of the company; and (iii) provide reasonable assurance regarding prevention or timely detection of unauthorized acquisition, use, or disposition of the company’s assets that could have a material effect on the financial statements.
54
Because of its inherent limitations, internal control over financial reporting may not prevent or detect misstatements. Also, projections of any evaluation of effectiveness to future periods are subject to the risk that controls may become inadequate because of changes in conditions, or that the degree of compliance with the policies or procedures may deteriorate.
/s/ PricewaterhouseCoopers LLP
Dallas, Texas
February 24, 2017
55
Report of Independent Registered Public Accounting Firm
To the Board of Directors of FelCor Lodging Trust Incorporated
and the Partners of FelCor Lodging Limited Partnership
In our opinion, the accompanying consolidated balance sheets and the related consolidated statements of operations, of comprehensive income (loss), of partners’ capital, and of cash flows present fairly, in all material respects, the financial position of FelCor Lodging Limited Partnership and its subsidiaries at December 31, 2016 and 2015, and the results of their operations and their cash flows for each of the three years in the period ended December 31, 2016 in conformity with accounting principles generally accepted in the United States of America. In addition, in our opinion, the financial statement schedule listed in the accompanying index presents fairly, in all material respects, the information set forth therein when read in conjunction with the related consolidated financial statements. Also in our opinion, the Company maintained, in all material respects, effective internal control over financial reporting as of December 31, 2016, based on criteria established in Internal Control - Integrated Framework (2013) issued by the Committee of Sponsoring Organizations of the Treadway Commission (COSO). The Company’s management is responsible for these financial statements and financial statement schedule, for maintaining effective internal control over financial reporting and for its assessment of the effectiveness of internal control over financial reporting, included in Management’s Report on Internal Control over Financial Reporting appearing under Item 9A. Our responsibility is to express opinions on these financial statements, on the financial statement schedule, and on the Company’s internal control over financial reporting based on our integrated audits. We conducted our audits in accordance with the standards of the Public Company Accounting Oversight Board (United States). Those standards require that we plan and perform the audits to obtain reasonable assurance about whether the financial statements are free of material misstatement and whether effective internal control over financial reporting was maintained in all material respects. Our audits of the financial statements included examining, on a test basis, evidence supporting the amounts and disclosures in the financial statements, assessing the accounting principles used and significant estimates made by management, and evaluating the overall financial statement presentation. Our audit of internal control over financial reporting included obtaining an understanding of internal control over financial reporting, assessing the risk that a material weakness exists, and testing and evaluating the design and operating effectiveness of internal control based on the assessed risk. Our audits also included performing such other procedures as we considered necessary in the circumstances. We believe that our audits provide a reasonable basis for our opinions.
As discussed in Note 9 to the consolidated financial statements, the Company changed the presentation of certain deferred financing costs.
A company’s internal control over financial reporting is a process designed to provide reasonable assurance regarding the reliability of financial reporting and the preparation of financial statements for external purposes in accordance with generally accepted accounting principles. A company’s internal control over financial reporting includes those policies and procedures that (i) pertain to the maintenance of records that, in reasonable detail, accurately and fairly reflect the transactions and dispositions of the assets of the company; (ii) provide reasonable assurance that transactions are recorded as necessary to permit preparation of financial statements in accordance with generally accepted accounting principles, and that receipts and expenditures of the company are being made only in accordance with authorizations of management and directors of the company; and (iii) provide reasonable assurance regarding prevention or timely detection of unauthorized acquisition, use, or disposition of the company’s assets that could have a material effect on the financial statements.
56
Because of its inherent limitations, internal control over financial reporting may not prevent or detect misstatements. Also, projections of any evaluation of effectiveness to future periods are subject to the risk that controls may become inadequate because of changes in conditions, or that the degree of compliance with the policies or procedures may deteriorate.
/s/ PricewaterhouseCoopers LLP
Dallas, Texas
February 24, 2017
57
FELCOR LODGING TRUST INCORPORATED
CONSOLIDATED BALANCE SHEETS
December 31, 2016 and 2015
(in thousands)
2016 | 2015 | ||||||
Assets | |||||||
Investment in hotels, net of accumulated depreciation of $932,886 and $899,575 at December 31, 2016 and 2015, respectively | $ | 1,566,823 | $ | 1,729,531 | |||
Investment in unconsolidated entities | 8,312 | 9,575 | |||||
Cash and cash equivalents | 47,317 | 59,786 | |||||
Restricted cash | 19,491 | 17,702 | |||||
Accounts receivable, net of allowance for doubtful accounts of $177 and $204 at December 31, 2016 and 2015, respectively | 42,080 | 28,136 | |||||
Deferred expenses, net of accumulated amortization of $2,959 and $1,086 at December 31, 2016 and 2015, respectively | 4,527 | 6,390 | |||||
Other assets | 18,542 | 14,792 | |||||
Total assets | $ | 1,707,092 | $ | 1,865,912 | |||
Liabilities and Equity | |||||||
Debt, net of unamortized debt issuance costs of $15,967 and $18,065 at December 31, 2016 and 2015, respectively | $ | 1,338,326 | $ | 1,409,889 | |||
Distributions payable | 14,858 | 15,140 | |||||
Accrued expenses and other liabilities | 116,437 | 125,274 | |||||
Total liabilities | 1,469,621 | 1,550,303 | |||||
Commitments and contingencies | |||||||
Redeemable noncontrolling interests in FelCor LP, 610 and 611 units issued and outstanding at December 31, 2016 and 2015, respectively | 4,888 | 4,464 | |||||
Equity: | |||||||
Preferred stock, $0.01 par value, 20,000 shares authorized: | |||||||
Series A Cumulative Convertible Preferred Stock, 12,879 shares, liquidation value of $321,987, issued and outstanding at December 31, 2016 and 2015 | 309,337 | 309,337 | |||||
Common stock, $0.01 par value, 200,000 shares authorized; 137,990 and 141,808 shares issued and outstanding at December 31, 2016 and 2015, respectively | 1,380 | 1,418 | |||||
Additional paid-in capital | 2,576,988 | 2,567,515 | |||||
Accumulated deficit | (2,706,408 | ) | (2,618,117 | ) | |||
Total FelCor stockholders’ equity | 181,297 | 260,153 | |||||
Noncontrolling interests in other partnerships | 7,503 | 7,806 | |||||
Preferred equity in consolidated joint venture, liquidation value of $44,667 and $43,954 at December 31, 2016 and 2015, respectively | 43,783 | 43,186 | |||||
Total equity | 232,583 | 311,145 | |||||
Total liabilities and equity | $ | 1,707,092 | $ | 1,865,912 | |||
The accompanying notes are an integral part of these consolidated financial statements.
58
FELCOR LODGING TRUST INCORPORATED
CONSOLIDATED STATEMENTS OF OPERATIONS
For the Years Ended December 31, 2016, 2015 and 2014
(in thousands, except per share data)
2016 | 2015 | 2014 | |||||||||
Revenues: | |||||||||||
Hotel operating revenue | $ | 862,818 | $ | 878,371 | $ | 917,981 | |||||
Other revenue | 4,136 | 7,883 | 3,606 | ||||||||
Total revenues | 866,954 | 886,254 | 921,587 | ||||||||
Expenses: | |||||||||||
Hotel departmental expenses | 306,050 | 313,141 | 331,876 | ||||||||
Other property-related costs | 212,180 | 223,546 | 238,170 | ||||||||
Management and franchise fees | 32,935 | 35,572 | 36,067 | ||||||||
Taxes, insurance and lease expense | 57,317 | 59,207 | 84,266 | ||||||||
Corporate expenses | 27,037 | 27,283 | 29,585 | ||||||||
Depreciation and amortization | 114,054 | 114,452 | 115,819 | ||||||||
Impairment | 26,459 | 20,861 | — | ||||||||
Other expenses | 12,740 | 12,479 | 17,952 | ||||||||
Total operating expenses | 788,772 | 806,541 | 853,735 | ||||||||
Operating income | 78,182 | 79,713 | 67,852 | ||||||||
Interest expense, net | (78,182 | ) | (79,118 | ) | (90,695 | ) | |||||
Debt extinguishment | — | (30,909 | ) | (4,770 | ) | ||||||
Gain on sale of investment in unconsolidated entities, net | — | — | 30,176 | ||||||||
Gain from remeasurement of unconsolidated entities, net | — | — | 20,737 | ||||||||
Other gains, net | 342 | 166 | 100 | ||||||||
Income (loss) before equity in income from unconsolidated entities | 342 | (30,148 | ) | 23,400 | |||||||
Equity in income from unconsolidated entities | 1,533 | 7,833 | 5,010 | ||||||||
Income (loss) from continuing operations before income tax expense | 1,875 | (22,315 | ) | 28,410 | |||||||
Income tax expense | (873 | ) | (1,245 | ) | (660 | ) | |||||
Income (loss) from continuing operations | 1,002 | (23,560 | ) | 27,750 | |||||||
Income (loss) from discontinued operations | (3,131 | ) | 669 | (360 | ) | ||||||
Income (loss) before gain on sale of hotels | (2,129 | ) | (22,891 | ) | 27,390 | ||||||
Gain on sale of hotels, net | 6,322 | 19,426 | 66,762 | ||||||||
Net income (loss) | 4,193 | (3,465 | ) | 94,152 | |||||||
Net loss (income) attributable to noncontrolling interests in other partnerships | 673 | (4,157 | ) | (697 | ) | ||||||
Net loss (income) attributable to redeemable noncontrolling interests in FelCor LP | 93 | 194 | (137 | ) | |||||||
Preferred distributions - consolidated joint venture | (1,461 | ) | (1,437 | ) | (1,219 | ) | |||||
Net income (loss) attributable to FelCor | 3,498 | (8,865 | ) | 92,099 | |||||||
Preferred dividends | (25,115 | ) | (30,138 | ) | (38,712 | ) | |||||
Redemption of preferred stock | — | (6,096 | ) | — | |||||||
Net income (loss) attributable to FelCor common stockholders | $ | (21,617 | ) | $ | (45,099 | ) | $ | 53,387 | |||
Basic and diluted per common share data: | |||||||||||
Income (loss) from continuing operations | $ | (0.13 | ) | $ | (0.33 | ) | $ | 0.43 | |||
Net income (loss) | $ | (0.16 | ) | $ | (0.33 | ) | $ | 0.43 | |||
Basic weighted average common shares outstanding | 138,128 | 137,730 | 124,158 | ||||||||
Diluted weighted average common shares outstanding | 138,128 | 137,730 | 124,892 | ||||||||
The accompanying notes are an integral part of these consolidated financial statements.
59
FELCOR LODGING TRUST INCORPORATED
CONSOLIDATED STATEMENTS OF COMPREHENSIVE INCOME (LOSS)
For the Years Ended December 31, 2016, 2015 and 2014
(in thousands)
2016 | 2015 | 2014 | ||||||||||
Net income (loss) | $ | 4,193 | $ | (3,465 | ) | $ | 94,152 | |||||
Foreign currency translation adjustment | — | — | (490 | ) | ||||||||
Reclassification of foreign currency translation to gain | — | — | (24,448 | ) | ||||||||
Comprehensive income (loss) | 4,193 | (3,465 | ) | 69,214 | ||||||||
Comprehensive loss (income) attributable to noncontrolling interests in other partnerships | 673 | (4,157 | ) | (697 | ) | |||||||
Comprehensive loss (income) attributable to redeemable noncontrolling interests in FelCor LP | 93 | 194 | (136 | ) | ||||||||
Preferred distributions - consolidated joint venture | (1,461 | ) | (1,437 | ) | (1,219 | ) | ||||||
Comprehensive income (loss) attributable to FelCor | $ | 3,498 | $ | (8,865 | ) | $ | 67,162 | |||||
The accompanying notes are an integral part of these consolidated financial statements.
60
FELCOR LODGING TRUST INCORPORATED
CONSOLIDATED STATEMENTS OF EQUITY
For the Years Ended December 31, 2016, 2015 and 2014
(in thousands)
Preferred Stock | Common Stock | Additional Paid-in Capital | Accumulated Other Comprehensive Income (Loss) | Noncontrolling Interests in Other Partnerships | Preferred Equity in Consolidated Joint Venture | Comprehensive Income | |||||||||||||||||||||||||||||||||||
Number of Shares | Amount | Number of Shares | Amount | Accumulated Deficit | Total Equity | ||||||||||||||||||||||||||||||||||||
Balance at December 31, 2013 | 12,948 | $ | 478,774 | 124,051 | $ | 1,240 | $ | 2,354,328 | $ | 24,937 | $ | (2,568,350 | ) | $ | 23,301 | — | $ | 314,230 | |||||||||||||||||||||||
Conversion of preferred stock into common stock | (1 | ) | (25 | ) | — | — | 25 | — | — | — | — | — | |||||||||||||||||||||||||||||
Issuance of stock awards | — | — | 864 | 9 | (9 | ) | — | — | — | — | — | ||||||||||||||||||||||||||||||
Stock awards - amortization and severance | — | — | — | — | 4,319 | — | — | — | — | 4,319 | |||||||||||||||||||||||||||||||
Stock compensation shares withheld | — | — | (316 | ) | (3 | ) | — | — | (3,114 | ) | — | — | (3,117 | ) | |||||||||||||||||||||||||||
Conversion of operating partnership units into common shares | — | — | 6 | — | 56 | — | — | — | — | 56 | |||||||||||||||||||||||||||||||
Allocation to redeemable noncontrolling interests | — | — | — | — | (1,545 | ) | — | — | — | — | (1,545 | ) | |||||||||||||||||||||||||||||
Contributions from noncontrolling interests | — | — | — | — | — | — | — | 6,375 | — | 6,375 | |||||||||||||||||||||||||||||||
Distribution to noncontrolling interests | — | — | — | — | — | — | — | (9,596 | ) | — | (9,596 | ) | |||||||||||||||||||||||||||||
Acquisition of noncontrolling interest | — | — | — | — | (3,508 | ) | — | — | (2,342 | ) | — | (5,850 | ) | ||||||||||||||||||||||||||||
Dividends declared: | |||||||||||||||||||||||||||||||||||||||||
$0.10 per common share | — | — | — | — | — | — | (12,594 | ) | — | — | (12,594 | ) | |||||||||||||||||||||||||||||
$1.95 per Series A preferred share | — | — | — | — | — | — | (25,116 | ) | — | — | (25,116 | ) | |||||||||||||||||||||||||||||
$2.00 per Series C depositary preferred share | — | — | — | — | — | — | (13,596 | ) | — | — | (13,596 | ) | |||||||||||||||||||||||||||||
Preferred distributions - consolidated joint venture | — | — | — | — | — | — | — | — | (1,219 | ) | (1,219 | ) | |||||||||||||||||||||||||||||
Issuance of preferred equity - consolidated joint venture | — | — | — | — | — | — | — | — | 41,442 | 41,442 | |||||||||||||||||||||||||||||||
Comprehensive income (attributable to FelCor and noncontrolling interests in other partnerships): | |||||||||||||||||||||||||||||||||||||||||
Foreign exchange translation | — | — | — | — | — | (489 | ) | — | — | — | $ | (489 | ) | ||||||||||||||||||||||||||||
Reclassification of foreign currency translation to gain | — | — | — | — | — | (24,448 | ) | — | — | — | (24,448 | ) | |||||||||||||||||||||||||||||
Net income | — | — | — | — | — | — | 92,099 | 697 | 1,219 | 94,015 | |||||||||||||||||||||||||||||||
Comprehensive income | $ | 69,078 | 69,078 | ||||||||||||||||||||||||||||||||||||||
Balance at December 31, 2014 | 12,947 | $ | 478,749 | 124,605 | $ | 1,246 | $ | 2,353,666 | $ | — | $ | (2,530,671 | ) | $ | 18,435 | $ | 41,442 | $ | 362,867 | ||||||||||||||||||||||
The accompanying notes are an integral part of these consolidated financial statements.
61
FELCOR LODGING TRUST INCORPORATED
CONSOLIDATED STATEMENTS OF EQUITY – (continued)
For the Years Ended December 31, 2016, 2015 and 2014
(in thousands)
Preferred Stock | Common Stock | Accumulated Other Comprehensive Income (Loss) | Noncontrolling Interests in Other Partnerships | Preferred Equity in Consolidated Joint Venture | |||||||||||||||||||||||||||||||||||||
Number of Shares | Amount | Number of Shares | Amount | Additional Paid-in Capital | Accumulated Deficit | Comprehensive Loss | Total Equity | ||||||||||||||||||||||||||||||||||
Balance at December 31, 2014 | 12,947 | $ | 478,749 | 124,605 | $ | 1,246 | $ | 2,353,666 | $ | — | $ | (2,530,671 | ) | $ | 18,435 | $ | 41,442 | $ | 362,867 | ||||||||||||||||||||||
Issuance of common stock | — | — | 18,400 | 184 | 198,464 | — | — | — | 198,648 | ||||||||||||||||||||||||||||||||
Issuance of stock awards | — | — | 1,050 | 11 | 727 | — | — | — | — | 738 | |||||||||||||||||||||||||||||||
Repurchase of common stock | — | — | (1,971 | ) | (20 | ) | — | — | (14,342 | ) | — | — | (14,362 | ) | |||||||||||||||||||||||||||
Stock awards - amortization and severance | — | — | — | — | 7,271 | — | — | — | — | 7,271 | |||||||||||||||||||||||||||||||
Stock compensation shares withheld | — | — | (276 | ) | (3 | ) | — | — | (2,051 | ) | — | — | (2,054 | ) | |||||||||||||||||||||||||||
Redemption of Series C preferred stock | (68 | ) | (169,412 | ) | — | — | 5,522 | — | (6,096 | ) | — | — | (169,986 | ) | |||||||||||||||||||||||||||
Allocation to redeemable noncontrolling interests | — | — | — | — | 1,865 | — | — | — | — | 1,865 | |||||||||||||||||||||||||||||||
Contributions from noncontrolling interests | — | — | — | — | — | — | — | 2,809 | — | 2,809 | |||||||||||||||||||||||||||||||
Distribution to noncontrolling interests | — | — | — | — | — | — | — | (17,595 | ) | — | (17,595 | ) | |||||||||||||||||||||||||||||
Dividends declared: | |||||||||||||||||||||||||||||||||||||||||
$0.18 per common share | — | — | — | — | — | — | (25,954 | ) | — | — | (25,954 | ) | |||||||||||||||||||||||||||||
$1.95 per Series A preferred share | — | — | — | — | — | — | (25,115 | ) | — | — | (25,115 | ) | |||||||||||||||||||||||||||||
$2.00 per Series C depositary preferred share | — | — | — | — | — | — | (5,023 | ) | — | — | (5,023 | ) | |||||||||||||||||||||||||||||
Preferred distributions - consolidated joint venture | — | — | — | — | — | — | — | — | (1,437 | ) | (1,437 | ) | |||||||||||||||||||||||||||||
Issuance of preferred equity - consolidated joint venture | — | — | — | — | — | — | — | — | 1,744 | 1,744 | |||||||||||||||||||||||||||||||
Comprehensive loss (attributable to FelCor and noncontrolling interests in other partnerships): | |||||||||||||||||||||||||||||||||||||||||
Net income (loss) | — | — | — | — | — | — | (8,865 | ) | 4,157 | 1,437 | $ | (3,271 | ) | ||||||||||||||||||||||||||||
Comprehensive loss | $ | (3,271 | ) | (3,271 | ) | ||||||||||||||||||||||||||||||||||||
Balance at December 31, 2015 | 12,879 | $ | 309,337 | 141,808 | $ | 1,418 | $ | 2,567,515 | $ | — | $ | (2,618,117 | ) | $ | 7,806 | $ | 43,186 | $ | 311,145 | ||||||||||||||||||||||
The accompanying notes are an integral part of these consolidated financial statements.
62
FELCOR LODGING TRUST INCORPORATED
CONSOLIDATED STATEMENTS OF EQUITY – (continued)
For the Years Ended December 31, 2016, 2015 and 2014
(in thousands)
Preferred Stock | Common Stock | Additional Paid-in Capital | Accumulated Other Comprehensive Income (Loss) | Noncontrolling Interests in Other Partnerships | Preferred Equity in Consolidated Joint Venture | Comprehensive Income | |||||||||||||||||||||||||||||||||||
Number of Shares | Amount | Number of Shares | Amount | Accumulated Deficit | Total Equity | ||||||||||||||||||||||||||||||||||||
Balance at December 31, 2015 | 12,879 | $ | 309,337 | 141,808 | $ | 1,418 | $ | 2,567,515 | $ | — | $ | (2,618,117 | ) | $ | 7,806 | $ | 43,186 | $ | 311,145 | ||||||||||||||||||||||
Issuance of stock awards | — | — | 1,157 | 11 | 911 | — | — | — | — | 922 | |||||||||||||||||||||||||||||||
Repurchase of common stock | — | — | (4,610 | ) | (45 | ) | — | — | (30,417 | ) | (30,462 | ) | |||||||||||||||||||||||||||||
Cumulative effect of change in accounting for stock compensation forfeitures | — | — | — | — | 185 | — | (185 | ) | — | — | — | ||||||||||||||||||||||||||||||
Stock awards - amortization and severance | — | — | — | — | 9,041 | — | — | — | — | 9,041 | |||||||||||||||||||||||||||||||
Stock compensation shares withheld | — | — | (366 | ) | (4 | ) | — | — | (2,746 | ) | — | — | (2,750 | ) | |||||||||||||||||||||||||||
Conversion of operating partnership units into common shares | — | — | 1 | — | 9 | — | — | — | — | 9 | |||||||||||||||||||||||||||||||
Allocation to redeemable noncontrolling interests | — | — | — | — | (673 | ) | — | — | — | — | (673 | ) | |||||||||||||||||||||||||||||
Contributions from noncontrolling interests | — | — | — | — | — | — | — | 636 | — | 636 | |||||||||||||||||||||||||||||||
Distribution to noncontrolling interests | — | — | — | — | — | — | — | (266 | ) | — | (266 | ) | |||||||||||||||||||||||||||||
Dividends declared: | |||||||||||||||||||||||||||||||||||||||||
$0.24 per common share | — | — | — | — | — | — | (33,326 | ) | — | — | (33,326 | ) | |||||||||||||||||||||||||||||
$1.95 per Series A preferred share | — | — | — | — | — | — | (25,115 | ) | — | — | (25,115 | ) | |||||||||||||||||||||||||||||
Preferred distributions - consolidated joint venture | — | — | — | — | — | — | — | — | (1,461 | ) | (1,461 | ) | |||||||||||||||||||||||||||||
Issuance of preferred equity - consolidated joint venture | — | — | — | — | — | — | — | — | 597 | 597 | |||||||||||||||||||||||||||||||
Comprehensive income (attributable to FelCor and noncontrolling interests in other partnerships): | |||||||||||||||||||||||||||||||||||||||||
Net income (loss) | — | — | — | — | — | — | 3,498 | (673 | ) | 1,461 | $ | 4,286 | |||||||||||||||||||||||||||||
Comprehensive income | $ | 4,286 | 4,286 | ||||||||||||||||||||||||||||||||||||||
Balance at December 31, 2016 | 12,879 | $ | 309,337 | 137,990 | $ | 1,380 | $ | 2,576,988 | $ | — | $ | (2,706,408 | ) | $ | 7,503 | $ | 43,783 | $ | 232,583 | ||||||||||||||||||||||
The accompanying notes are an integral part of these consolidated financial statements.
63
FELCOR LODGING TRUST INCORPORATED
CONSOLIDATED STATEMENTS OF CASH FLOWS
For the Years Ended December 31, 2016, 2015 and 2014
(in thousands)
2016 | 2015 | 2014 | |||||||||
Cash flows from operating activities: | |||||||||||
Net income (loss) | $ | 4,193 | $ | (3,465 | ) | $ | 94,152 | ||||
Adjustments to reconcile net income (loss) to net cash provided by operating activities: | |||||||||||
Depreciation and amortization | 114,054 | 114,452 | 115,819 | ||||||||
Gain on sale of hotels and other assets, net | (3,534 | ) | (20,250 | ) | (66,760 | ) | |||||
Gain on sale of investment in unconsolidated entities, net | — | — | (30,176 | ) | |||||||
Gain from remeasurement of unconsolidated entities, net | — | — | (20,737 | ) | |||||||
Amortization of deferred financing fees and debt discount | 3,973 | 5,425 | 9,558 | ||||||||
Amortization of fixed stock and directors’ compensation | 6,638 | 7,121 | 6,122 | ||||||||
Equity based severance | 2,891 | 1,352 | — | ||||||||
Equity in income from unconsolidated entities | (1,533 | ) | (7,833 | ) | (5,010 | ) | |||||
Distributions of income from unconsolidated entities | 1,209 | 6,051 | 4,128 | ||||||||
Debt extinguishment | — | 30,909 | 5,015 | ||||||||
Impairment | 26,459 | 20,861 | — | ||||||||
Changes in assets and liabilities: | |||||||||||
Accounts receivable | (9,066 | ) | (944 | ) | 7,941 | ||||||
Other assets | (4,758 | ) | 3,194 | (6,975 | ) | ||||||
Accrued expenses and other liabilities | (5,606 | ) | (10,210 | ) | (5,193 | ) | |||||
Net cash flow provided by operating activities | 134,920 | 146,663 | 107,884 | ||||||||
Cash flows from investing activities: | |||||||||||
Acquisition of land | (8,226 | ) | — | — | |||||||
Improvements and additions to hotels | (74,264 | ) | (48,436 | ) | (83,664 | ) | |||||
Hotel development | — | (33,525 | ) | (86,565 | ) | ||||||
Net proceeds from asset sales | 100,970 | 187,949 | 163,618 | ||||||||
Proceeds from unconsolidated joint venture transaction | — | — | 4,032 | ||||||||
Change in restricted cash - investing | (1,789 | ) | 2,794 | 56,731 | |||||||
Insurance proceeds | 341 | 477 | 521 | ||||||||
Distributions from unconsolidated entities in excess of earnings | 1,586 | 7,317 | 12,828 | ||||||||
Contributions to unconsolidated entities | — | (15 | ) | (7 | ) | ||||||
Net cash flow provided by investing activities | 18,618 | 116,561 | 67,494 | ||||||||
Cash flows from financing activities: | |||||||||||
Proceeds from borrowings | 85,000 | 1,025,438 | 473,062 | ||||||||
Repayment of borrowings | (158,662 | ) | (1,203,809 | ) | (623,106 | ) | |||||
Payment of deferred financing costs | (12 | ) | (14,952 | ) | (3,215 | ) | |||||
Acquisition of noncontrolling interest | — | — | (5,850 | ) | |||||||
Distributions paid to noncontrolling interests | (16 | ) | (17,595 | ) | (9,596 | ) | |||||
Contributions from noncontrolling interests | 636 | 2,809 | 6,375 | ||||||||
Distributions paid to FelCor LP limited partners | (147 | ) | (93 | ) | (42 | ) | |||||
Distributions paid to preferred stockholders | (25,115 | ) | (32,404 | ) | (38,712 | ) | |||||
Redemption of preferred stock | — | (169,986 | ) | — | |||||||
Repurchase of common stock | (30,462 | ) | (14,362 | ) | — | ||||||
Stock compensation withholding | (2,750 | ) | (2,054 | ) | (3,066 | ) | |||||
Preferred distributions - consolidated joint venture | (1,461 | ) | (1,431 | ) | (1,102 | ) | |||||
Distributions paid to common stockholders | (33,606 | ) | (22,385 | ) | (9,981 | ) | |||||
Net proceeds from issuance of preferred equity - consolidated joint venture | 597 | 1,744 | 41,442 | ||||||||
Net proceeds from common stock issuance | — | 198,648 | — | ||||||||
Net cash flow used in financing activities | (165,998 | ) | (250,432 | ) | (173,791 | ) | |||||
Effect of exchange rate changes on cash | (9 | ) | (153 | ) | (85 | ) | |||||
Net change in cash and cash equivalents | (12,469 | ) | 12,639 | 1,502 | |||||||
Cash and cash equivalents at beginning of periods | 59,786 | 47,147 | 45,645 | ||||||||
Cash and cash equivalents at end of periods | $ | 47,317 | $ | 59,786 | $ | 47,147 | |||||
Supplemental cash flow information — interest paid, net of capitalized interest | $ | 74,499 | $ | 74,585 | $ | 86,734 | |||||
Supplemental cash flow information — income taxes paid | $ | 332 | $ | 1,187 | $ | 660 | |||||
The accompanying notes are an integral part of these consolidated financial statements.
64
FELCOR LODGING LIMITED PARTNERSHIP
CONSOLIDATED BALANCE SHEETS
December 31, 2016 and 2015
(in thousands)
2016 | 2015 | ||||||
Assets | |||||||
Investment in hotels, net of accumulated depreciation of $932,886 and $899,575 at December 31, 2016 and 2015, respectively | $ | 1,566,823 | $ | 1,729,531 | |||
Investment in unconsolidated entities | 8,312 | 9,575 | |||||
Cash and cash equivalents | 47,317 | 59,786 | |||||
Restricted cash | 19,491 | 17,702 | |||||
Accounts receivable, net of allowance for doubtful accounts of $177 and $204 at December 31, 2016 and 2015, respectively | 42,080 | 28,136 | |||||
Deferred expenses, net of accumulated amortization of $2,959 and $1,086 at December 31, 2016 and 2015, respectively | 4,527 | 6,390 | |||||
Other assets | 18,542 | 14,792 | |||||
Total assets | $ | 1,707,092 | $ | 1,865,912 | |||
Liabilities and Partners’ Capital | |||||||
Debt, net of unamortized debt issuance costs of $15,967 and $18,065 at December 31, 2016 and 2015, respectively | $ | 1,338,326 | $ | 1,409,889 | |||
Distributions payable | 14,858 | 15,140 | |||||
Accrued expenses and other liabilities | 116,437 | 125,274 | |||||
Total liabilities | 1,469,621 | 1,550,303 | |||||
Commitments and contingencies | |||||||
Redeemable units, 610 and 611 units issued and outstanding at December 31, 2016 and 2015, respectively | 4,888 | 4,464 | |||||
Capital: | |||||||
Preferred units: | |||||||
Series A Cumulative Convertible Preferred Units, 12,879 units issued and outstanding at December 31, 2016 and 2015 | 309,337 | 309,337 | |||||
Common units, 137,990 and 141,808 units issued and outstanding at December 31, 2016 and 2015, respectively | (128,040 | ) | (49,184 | ) | |||
Total FelCor LP partners’ capital | 181,297 | 260,153 | |||||
Noncontrolling interests | 7,503 | 7,806 | |||||
Preferred capital in consolidated joint venture | 43,783 | 43,186 | |||||
Total partners’ capital | 232,583 | 311,145 | |||||
Total liabilities and partners’ capital | $ | 1,707,092 | $ | 1,865,912 | |||
The accompanying notes are an integral part of these consolidated financial statements.
65
FELCOR LODGING LIMITED PARTNERSHIP
CONSOLIDATED STATEMENTS OF OPERATIONS
For the Years Ended December 31, 2016, 2015 and 2014
(in thousands, except for per unit data)
2016 | 2015 | 2014 | |||||||||
Revenues: | |||||||||||
Hotel operating revenue | $ | 862,818 | $ | 878,371 | $ | 917,981 | |||||
Other revenue | 4,136 | 7,883 | 3,606 | ||||||||
Total revenues | 866,954 | 886,254 | 921,587 | ||||||||
Expenses: | |||||||||||
Hotel departmental expenses | 306,050 | 313,141 | 331,876 | ||||||||
Other property-related costs | 212,180 | 223,546 | 238,170 | ||||||||
Management and franchise fees | 32,935 | 35,572 | 36,067 | ||||||||
Taxes, insurance and lease expense | 57,317 | 59,207 | 84,266 | ||||||||
Corporate expenses | 27,037 | 27,283 | 29,585 | ||||||||
Depreciation and amortization | 114,054 | 114,452 | 115,819 | ||||||||
Impairment | 26,459 | 20,861 | — | ||||||||
Other expenses | 12,740 | 12,479 | 17,952 | ||||||||
Total operating expenses | 788,772 | 806,541 | 853,735 | ||||||||
Operating income | 78,182 | 79,713 | 67,852 | ||||||||
Interest expense, net | (78,182 | ) | (79,118 | ) | (90,695 | ) | |||||
Debt extinguishment | — | (30,909 | ) | (4,770 | ) | ||||||
Gain on sale of investment in unconsolidated entities, net | — | — | 30,176 | ||||||||
Gain from remeasurement of unconsolidated entities, net | — | — | 20,737 | ||||||||
Other gains, net | 342 | 166 | 100 | ||||||||
Income (loss) before equity in income from unconsolidated entities | 342 | (30,148 | ) | 23,400 | |||||||
Equity in income from unconsolidated entities | 1,533 | 7,833 | 5,010 | ||||||||
Income (loss) from continuing operations before income tax expense | 1,875 | (22,315 | ) | 28,410 | |||||||
Income tax expense | (873 | ) | (1,245 | ) | (660 | ) | |||||
Income (loss) from continuing operations | 1,002 | (23,560 | ) | 27,750 | |||||||
Income (loss) from discontinued operations | (3,131 | ) | 669 | (360 | ) | ||||||
Income (loss) before gain on sale of hotels | (2,129 | ) | (22,891 | ) | 27,390 | ||||||
Gain on sale of hotels, net | 6,322 | 19,426 | 66,762 | ||||||||
Net income (loss) | 4,193 | (3,465 | ) | 94,152 | |||||||
Net loss (income) attributable to noncontrolling interests | 673 | (4,157 | ) | (697 | ) | ||||||
Preferred distributions - consolidated joint venture | (1,461 | ) | (1,437 | ) | (1,219 | ) | |||||
Net income (loss) attributable to FelCor LP | 3,405 | (9,059 | ) | 92,236 | |||||||
Preferred distributions | (25,115 | ) | (30,138 | ) | (38,712 | ) | |||||
Redemption of preferred units | — | (6,096 | ) | — | |||||||
Net income (loss) attributable to FelCor LP common unitholders | $ | (21,710 | ) | $ | (45,293 | ) | $ | 53,524 | |||
Basic and diluted per common unit data: | |||||||||||
Income (loss) from continuing operations | $ | (0.13 | ) | $ | (0.33 | ) | $ | 0.43 | |||
Net income (loss) | $ | (0.16 | ) | $ | (0.33 | ) | $ | 0.43 | |||
Basic weighted average common units outstanding | 138,739 | 138,341 | 124,772 | ||||||||
Diluted weighted average common units outstanding | 138,739 | 138,341 | 125,511 | ||||||||
The accompanying notes are an integral part of these consolidated financial statements.
66
FELCOR LODGING LIMITED PARTNERSHIP
CONSOLIDATED STATEMENTS OF COMPREHENSIVE INCOME (LOSS)
For the Years Ended December 31, 2016, 2015 and 2014
(in thousands)
2016 | 2015 | 2014 | |||||||||
Net income (loss) | $ | 4,193 | $ | (3,465 | ) | $ | 94,152 | ||||
Foreign currency translation adjustment | — | — | (490 | ) | |||||||
Reclassification of foreign currency translation to gain | — | — | (24,553 | ) | |||||||
Comprehensive income (loss) | 4,193 | (3,465 | ) | 69,109 | |||||||
Comprehensive loss (income) attributable to noncontrolling interests | 673 | (4,157 | ) | (697 | ) | ||||||
Preferred distributions - consolidated joint venture | (1,461 | ) | (1,437 | ) | (1,219 | ) | |||||
Comprehensive income (loss) attributable to FelCor LP | $ | 3,405 | $ | (9,059 | ) | $ | 67,193 | ||||
The accompanying notes are an integral part of these consolidated financial statements.
67
FELCOR LODGING LIMITED PARTNERSHIP
CONSOLIDATED STATEMENTS OF PARTNERS’ CAPITAL
For the Years Ended December 31, 2016, 2015 and 2014
(in thousands)
Preferred Units | Common Units | Accumulated Other Comprehensive Income (Loss) | Noncontrolling Interests | Preferred Capital in Consolidated Joint Venture | Comprehensive Income (Loss) | Total Partners’ Capital | |||||||||||||||||||||
Balance at December 31, 2013 | $ | 478,774 | $ | (212,888 | ) | $ | 25,043 | $ | 23,301 | $ | — | $ | 314,230 | ||||||||||||||
Conversion of preferred units into common units | (25 | ) | 25 | — | — | — | — | ||||||||||||||||||||
FelCor restricted stock compensation | — | 1,202 | — | — | — | 1,202 | |||||||||||||||||||||
Contributions | — | — | — | 6,375 | — | 6,375 | |||||||||||||||||||||
Distributions | — | (51,306 | ) | — | (9,596 | ) | (1,219 | ) | (62,121 | ) | |||||||||||||||||
Allocation to redeemable units | — | (1,520 | ) | — | — | — | (1,520 | ) | |||||||||||||||||||
Acquisition of noncontrolling interest | — | (3,508 | ) | — | (2,342 | ) | (5,850 | ) | |||||||||||||||||||
Issuance of preferred capital - consolidated joint venture | — | — | — | — | 41,442 | 41,442 | |||||||||||||||||||||
Comprehensive income: | |||||||||||||||||||||||||||
Foreign exchange translation | — | — | (490 | ) | — | — | $ | (490 | ) | ||||||||||||||||||
Reclassification of foreign currency translation to gain | — | — | (24,553 | ) | — | — | (24,553 | ) | |||||||||||||||||||
Net income | 92,236 | 697 | 1,219 | 94,152 | |||||||||||||||||||||||
Comprehensive income | $ | 69,109 | 69,109 | ||||||||||||||||||||||||
Balance at December 31, 2014 | $ | 478,749 | $ | (175,759 | ) | $ | — | $ | 18,435 | 41,442 | $ | 362,867 | |||||||||||||||
Issuance of common units | — | 198,648 | — | — | 198,648 | ||||||||||||||||||||||
FelCor restricted stock compensation | — | 5,955 | — | — | — | 5,955 | |||||||||||||||||||||
Repurchase of common units | — | (14,362 | ) | — | — | — | (14,362 | ) | |||||||||||||||||||
Redemption of Series C preferred units | (169,412 | ) | (574 | ) | — | — | — | (169,986 | ) | ||||||||||||||||||
Contributions | — | — | — | 2,809 | — | 2,809 | |||||||||||||||||||||
Distributions | — | (56,185 | ) | — | (17,595 | ) | (1,437 | ) | (75,217 | ) | |||||||||||||||||
Allocation to redeemable units | — | 2,152 | — | — | — | 2,152 | |||||||||||||||||||||
Issuance of preferred capital - consolidated joint venture | — | — | — | — | 1,744 | 1,744 | |||||||||||||||||||||
Comprehensive loss: | |||||||||||||||||||||||||||
Net income (loss) | (9,059 | ) | 4,157 | 1,437 | $ | (3,465 | ) | ||||||||||||||||||||
Comprehensive loss | $ | (3,465 | ) | (3,465 | ) | ||||||||||||||||||||||
Balance at December 31, 2015 | $ | 309,337 | $ | (49,184 | ) | $ | — | $ | 7,806 | $ | 43,186 | $ | 311,145 | ||||||||||||||
FelCor restricted stock compensation | — | 7,213 | — | — | — | 7,213 | |||||||||||||||||||||
Repurchase of common units | — | (30,462 | ) | — | — | — | (30,462 | ) | |||||||||||||||||||
Contributions | — | — | — | 636 | — | 636 | |||||||||||||||||||||
Distributions | — | (58,588 | ) | — | (266 | ) | (1,461 | ) | (60,315 | ) | |||||||||||||||||
Allocation to redeemable units | — | (424 | ) | — | — | (424 | ) | ||||||||||||||||||||
Issuance of preferred capital - consolidated joint venture | — | — | — | — | 597 | 597 | |||||||||||||||||||||
Comprehensive income: | |||||||||||||||||||||||||||
Net income (loss) | 3,405 | (673 | ) | 1,461 | $ | 4,193 | |||||||||||||||||||||
Comprehensive income | $ | 4,193 | 4,193 | ||||||||||||||||||||||||
Balance at December 31, 2016 | $ | 309,337 | $ | (128,040 | ) | $ | — | $ | 7,503 | $ | 43,783 | $ | 232,583 | ||||||||||||||
The accompanying notes are an integral part of these consolidated financial statements.
68
FELCOR LODGING LIMITED PARTNERSHIP
CONSOLIDATED STATEMENTS OF CASH FLOWS
For the Years Ended December 31, 2016, 2015 and 2014
(in thousands)
2016 | 2015 | 2014 | |||||||||
Cash flows from operating activities: | |||||||||||
Net income (loss) | $ | 4,193 | $ | (3,465 | ) | $ | 94,152 | ||||
Adjustments to reconcile net income (loss) to net cash provided by operating activities: | |||||||||||
Depreciation and amortization | 114,054 | 114,452 | 115,819 | ||||||||
Gain on sale of hotels and other assets, net | (3,534 | ) | (20,250 | ) | (66,760 | ) | |||||
Gain on sale of investment in unconsolidated entities, net | — | — | (30,176 | ) | |||||||
Gain from remeasurement of unconsolidated entities, net | — | — | (20,737 | ) | |||||||
Amortization of deferred financing fees and debt discount | 3,973 | 5,425 | 9,558 | ||||||||
Amortization of fixed stock and directors’ compensation | 6,638 | 7,121 | 6,122 | ||||||||
Equity based severance | 2,891 | 1,352 | — | ||||||||
Equity in income from unconsolidated entities | (1,533 | ) | (7,833 | ) | (5,010 | ) | |||||
Distributions of income from unconsolidated entities | 1,209 | 6,051 | 4,128 | ||||||||
Debt extinguishment | — | 30,909 | 5,015 | ||||||||
Impairment | 26,459 | 20,861 | — | ||||||||
Changes in assets and liabilities: | |||||||||||
Accounts receivable | (9,066 | ) | (944 | ) | 7,941 | ||||||
Other assets | (4,758 | ) | 3,194 | (6,975 | ) | ||||||
Accrued expenses and other liabilities | (5,606 | ) | (10,210 | ) | (5,193 | ) | |||||
Net cash flow provided by operating activities | 134,920 | 146,663 | 107,884 | ||||||||
Cash flows from investing activities: | |||||||||||
Acquisition of land | (8,226 | ) | — | — | |||||||
Improvements and additions to hotels | (74,264 | ) | (48,436 | ) | (83,664 | ) | |||||
Hotel development | — | (33,525 | ) | (86,565 | ) | ||||||
Net proceeds from asset dispositions | 100,970 | 187,949 | 163,618 | ||||||||
Proceeds from unconsolidated joint venture transaction | — | — | 4,032 | ||||||||
Change in restricted cash - investing | (1,789 | ) | 2,794 | 56,731 | |||||||
Insurance proceeds | 341 | 477 | 521 | ||||||||
Distributions from unconsolidated entities in excess of earnings | 1,586 | 7,317 | 12,828 | ||||||||
Contributions to unconsolidated entities | — | (15 | ) | (7 | ) | ||||||
Net cash flow provided by investing activities | 18,618 | 116,561 | 67,494 | ||||||||
Cash flows from financing activities: | |||||||||||
Proceeds from borrowings | 85,000 | 1,025,438 | 473,062 | ||||||||
Repayment of borrowings | (158,662 | ) | (1,203,809 | ) | (623,106 | ) | |||||
Payment of deferred financing fees | (12 | ) | (14,952 | ) | (3,215 | ) | |||||
Acquisition of noncontrolling interest | — | — | (5,850 | ) | |||||||
Distributions paid to noncontrolling interests | (16 | ) | (17,595 | ) | (9,596 | ) | |||||
Contributions from noncontrolling interests | 636 | 2,809 | 6,375 | ||||||||
Distributions paid to FelCor LP limited partners | (147 | ) | (93 | ) | (42 | ) | |||||
Distributions paid to preferred unitholders | (25,115 | ) | (32,404 | ) | (38,712 | ) | |||||
Redemption of preferred units | — | (169,986 | ) | — | |||||||
Repurchase of common units | (30,462 | ) | (14,362 | ) | — | ||||||
FelCor stock compensation withholding | (2,750 | ) | (2,054 | ) | (3,066 | ) | |||||
Preferred distributions - consolidated joint venture | (1,461 | ) | (1,431 | ) | (1,102 | ) | |||||
Distributions paid to common unitholders | (33,606 | ) | (22,385 | ) | (9,981 | ) | |||||
Net proceeds from issuance of preferred capital - consolidated joint venture | 597 | 1,744 | 41,442 | ||||||||
Net proceeds from common unit issuance | — | 198,648 | — | ||||||||
Net cash flow used in financing activities | (165,998 | ) | (250,432 | ) | (173,791 | ) | |||||
Effect of exchange rate changes on cash | (9 | ) | (153 | ) | (85 | ) | |||||
Net change in cash and cash equivalents | (12,469 | ) | 12,639 | 1,502 | |||||||
Cash and cash equivalents at beginning of periods | 59,786 | 47,147 | 45,645 | ||||||||
Cash and cash equivalents at end of periods | $ | 47,317 | $ | 59,786 | $ | 47,147 | |||||
Supplemental cash flow information – interest paid, net of capitalized interest | $ | 74,499 | $ | 74,585 | $ | 86,734 | |||||
Supplemental cash flow information — income taxes paid | $ | 332 | $ | 1,187 | $ | 660 | |||||
The accompanying notes are an integral part of these consolidated financial statements.
69
FELCOR LODGING TRUST INCORPORATED AND FELCOR LODGING LIMITED PARTNERSHIP
NOTES TO CONSOLIDATED FINANCIAL STATEMENTS
1. | Organization |
FelCor Lodging Trust Incorporated (NYSE:FCH), or FelCor, is a Maryland corporation operating as a real estate investment trust, or REIT. FelCor is the sole general partner of, and the owner of a greater than 99.5% partnership interest in, FelCor Lodging Limited Partnership, or FelCor LP, through which we held ownership interests in 39 hotels as of December 31, 2016. At December 31, 2016, we had an aggregate of 138,600,280 shares and units outstanding, consisting of 137,990,097 shares of FelCor common stock and 610,183 FelCor LP units not owned by FelCor.
Of our 39 hotels as of December 31, 2016, we owned 100% interests in 36 hotels, a 95% interest in one hotel (The Knickerbocker) and 50% interests in entities owning two hotels. The Knickerbocker opened in February 2015. During 2015, we transferred all development costs ($329.8 million) into investment in hotels. We consolidate our real estate interests in the 37 hotels in which we hold majority interests, and we record the real estate interests of the two hotels in which we hold indirect 50% interests using the equity method. We lease 38 of the 39 hotels to our taxable REIT subsidiaries, of which we own a controlling interest. We operate one 50% owned hotel without a lease. Because we own controlling interests in our operating lessees, we consolidate our interests in all 38 leased hotels (which we refer to as our Consolidated Hotels) and reflect their operating revenues and expenses in our statements of operations. We own 50% of the real estate interest in one Consolidated Hotel (we account for our real estate interest of this hotel by the equity method) and majority real estate interests in our remaining 37 Consolidated Hotels (we consolidate our real estate interest in these hotels).
The following table reflects the distribution of our 38 Consolidated Hotels at December 31, 2016:
Brand | Hotels | Rooms | |||||
Embassy Suites by Hilton® | 18 | 4,982 | |||||
Wyndham® and Wyndham Grand® | 8 | 2,528 | |||||
Marriott® and Renaissance® | 2 | 761 | |||||
Holiday Inn® | 1 | 585 | |||||
DoubleTree by Hilton® and Hilton® | 3 | 802 | |||||
Sheraton® | 2 | 673 | |||||
Fairmont® | 1 | 383 | |||||
The Knickerbocker® | 1 | 330 | |||||
Morgans® and Royalton® | 2 | 285 | |||||
Total | 38 | 11,329 | |||||
At December 31, 2016, our Consolidated Hotels were located in 14 states, with concentrations in California (10 hotels), Florida (six hotels) and Massachusetts (three hotels). We generated approximately 57% of our revenue from hotels in these three states in 2016.
At December 31, 2016, of our Consolidated Hotels (i) subsidiaries of Hilton Worldwide managed 20 hotels; (ii) subsidiaries of Wyndham Worldwide managed eight hotels; (iii) subsidiaries of Marriott International managed four hotels; (iv) subsidiaries of InterContinental Hotels Group managed one hotel; (v) Fairmont, a subsidiary of AccorHotels group, managed one hotel; (vi) a subsidiary of Highgate Hotels managed one hotel; (vii) a subsidiary of SBE (who acquired Morgans Hotel Group) managed two hotels; and (viii) Aimbridge Hospitality managed one hotel.
70
FELCOR LODGING TRUST INCORPORATED AND FELCOR LODGING LIMITED PARTNERSHIP
NOTES TO CONSOLIDATED FINANCIAL STATEMENTS
2. | Summary of Significant Accounting Policies |
Principles of Consolidation — Our consolidated financial statements include the assets, liabilities, revenues and expenses of all majority-owned subsidiaries. Intercompany transactions and balances are eliminated in consolidation. Investments in unconsolidated entities (consisting entirely of 50% owned ventures) are accounted for by the equity method. We follow the voting interest model and consolidate entities in which we have greater than 50% ownership interest and report entities in which we have 50% or less ownership interest under the equity method.
On January 1, 2016, we adopted accounting guidance under Accounting Standards Update (“ASU”) 2015-2, modifying the analysis performed to determine whether we should consolidate certain types of legal entities. The guidance does not amend the existing disclosure requirements for variable interest entities “VIEs” or voting interest model entities. The guidance, however, modified the requirements to qualify under the voting interest model. Under the revised guidance, FelCor LP is a variable interest entity of FelCor. As FelCor LP is already consolidated in the balance sheets of FelCor, the identification of this entity as a variable interest entity has no impact on the consolidated financial statements of FelCor. There were no other legal entities under the scope of the revised guidance that were consolidated as a result of the adoption.
Use of Estimates — The preparation of the financial statements in conformity with accounting principles generally accepted in the United States of America, requires that management make estimates and assumptions that affect the amounts reported in the financial statements and accompanying notes. Actual results could differ from those estimates.
Investment in Hotels — Our hotels are stated at cost and are depreciated using the straight-line method over estimated useful lives of 40 years for buildings, 15 to 30 years for improvements and three to 10 years for furniture, fixtures, and equipment. For those hotels subject to a ground lease, depreciation expense is based on the shorter of the lease term or the estimated useful life of the asset.
We capitalize certain inventory (such as china, glass, silver and linen) at the time of a hotel opening or acquisition, or when significant inventory is purchased (in conjunction with a major rooms renovation or when the number of rooms or meeting space at a hotel is expanded). These amounts are then amortized over the estimated useful life of three years. Subsequent replacement purchases are expensed when placed in service.
We periodically review the carrying value of each of our hotels to determine if circumstances exist indicating an impairment in the carrying value of the investment in the hotel or modification of depreciation periods. If facts or circumstances support the possibility of impairment of a hotel, we prepare a projection of the undiscounted future cash flows, without interest charges, over the shorter of the hotel’s estimated useful life or the expected hold period, and determine if the investment in such hotel is recoverable based on the undiscounted future cash flows. If impairment is indicated, we make an adjustment to reduce the carrying value of the hotel to its then fair value. We use recent operating results and current market information to arrive at our estimates of fair value.
Maintenance and repairs are expensed, and major renewals and improvements are capitalized. Upon the sale or disposition of a fixed asset, the asset and related accumulated depreciation are removed from our accounts and the related gain or loss is included in operations.
Acquisition of Hotels — Investments in hotels are based on purchase price and allocated to land, property and equipment, identifiable intangible assets and assumed debt and other liabilities at fair value. Any remaining unallocated purchase price, if any, is treated as goodwill. Property and equipment are recorded at fair value based on current replacement cost for similar capacity and allocated to buildings, improvements, furniture, fixtures and equipment using appraisals and valuations prepared by management and/or independent third parties. Identifiable intangible assets (typically contracts including ground and retail leases and management and
71
FELCOR LODGING TRUST INCORPORATED AND FELCOR LODGING LIMITED PARTNERSHIP
NOTES TO CONSOLIDATED FINANCIAL STATEMENTS
2. | Summary of Significant Accounting Policies — (continued) |
franchise agreements) are recorded at fair value, although no value is generally allocated to contracts which are at market terms. Above-market and below-market contract values are based on the present value of the difference between contractual amounts to be paid pursuant to the contracts acquired and our estimate of the fair value of contract rates for corresponding contracts measured over the period equal to the remaining non-cancelable term of the contract. Intangible assets are amortized using the straight-line method over the remaining non-cancelable term of the related agreements. In making estimates of fair values for purposes of allocating purchase price, we may utilize a number of sources such as those obtained in connection with the acquisition or financing of a property and other market data, including third-party appraisals and valuations.
Investment in Unconsolidated Entities — We own a 50% interest in various real estate ventures in which the partners or members jointly make all material decisions concerning the business affairs and operations. Because we do not control these entities, we carry our investment in unconsolidated entities at cost, plus our equity in net earnings or losses, less distributions received since the date of acquisition and any adjustment for impairment. Our equity in net earnings or losses is adjusted for the straight-line depreciation, over the lower of 40 years or the remaining life of the venture, of the difference between our cost and our proportionate share of the underlying net assets at the date of acquisition. We periodically review our investment in unconsolidated entities for other-than-temporary declines in fair value. Any decline that is not expected to be recovered in the next 12 months is considered other-than-temporary and an impairment is recorded as a reduction in the carrying value of the investment. Estimated fair values are based on our projections of cash flows, market capitalization rates and sales prices of comparable assets.
We track inception-to-date contributions, distributions and earnings for each of our unconsolidated investments. We determine the character of cash distributions from our unconsolidated investments for purposes of our consolidated statements of cash flows as follows:
• | Cash distributions up to the aggregate historical earnings of the unconsolidated entity are recorded as an operating activity (i.e., a distribution of earnings); and |
• | Cash distributions in excess of aggregate historical earnings are recorded as an investing activity (i.e., a distribution of contributed capital). |
Hotels Held for Sale — We consider each individual hotel to be an identifiable component of our business. We do not consider a hotel held for sale until it is probable that the sale will be completed within 12 months. Generally, we consider a sale to be probable when a buyer completes its due diligence review, we have an executed contract for sale, and we have received a substantial non-refundable deposit. We test hotels held for sale for impairment each reporting period and record them at the lower of their carrying amounts or fair value less costs to sell. Once we designate a hotel as held for sale it is not depreciated.
Cash and Cash Equivalents — All highly liquid investments with a maturity of three months or less when purchased are considered to be cash equivalents.
We deposit cash at major banks. Our bank account balances may exceed the Federal Depository Insurance Limits; however, management believes the credit risk related to these deposits is minimal.
Restricted Cash —Restricted cash includes reserves for capital expenditures, real estate taxes and insurance, as well as cash collateral deposits for mortgage debt agreement provisions.
72
FELCOR LODGING TRUST INCORPORATED AND FELCOR LODGING LIMITED PARTNERSHIP
NOTES TO CONSOLIDATED FINANCIAL STATEMENTS
2. | Summary of Significant Accounting Policies — (continued) |
Deferred Expenses — Deferred expenses, consisting primarily of loan costs, are recorded at cost. Amortization is computed using a method that approximates the effective interest method over the maturity of the related debt. Deferred loan costs associated with our line of credit are classified as an asset on our consolidated balance sheets, while deferred loan costs associated with other outstanding debt are classified within the debt on our consolidated balance sheets.
Other Assets — Other assets consist primarily of hotel operating inventories, prepaid expenses and deposits.
Revenue Recognition — Nearly 100% of our revenue is comprised of hotel operating revenues, such as room revenue, food and beverage revenue and revenue from other hotel operating departments (such as telephone, parking, resort fees and business centers). These revenues are recorded net of any sales or occupancy taxes collected from our guests as earned. All rebates or discounts are recorded, when allowed, as a reduction in revenue, and there are no material contingent obligations with respect to rebates or discounts offered by us. All revenues are recorded on an accrual basis, as earned. Appropriate allowances are made for doubtful accounts and are recorded as a bad debt expense. The remainder of our revenue is from condominium management fee income and other sources.
We do not have any time-share arrangements and do not sponsor any frequent guest programs for which we would have any contingent liability. We participate in frequent guest programs sponsored by the brand owners of our hotels, and we expense the charges associated with those programs (typically consisting of a percentage of the total guest charges incurred by a participating guest) as incurred. When a guest redeems accumulated frequent guest points at one of our hotels, the hotel bills the sponsor for the services provided in redemption of such points and records revenue in the amount of the charges billed to the sponsor. We have no loss contingencies or ongoing obligation associated with frequent guest programs beyond what is paid to the brand owner following a guest’s stay.
Taxes, insurance and lease expense — For the year ended December 31, 2015, taxes, insurance and lease expense included an out-of-period adjustment of $1.6 million related to straight-line lease expense from prior years for a ground lease associated with one of our consolidated hotels. The $1.6 million adjustment represented the cumulative additional rent that should have been recognized in prior years on a straight-line basis, with the credit being included in accrued expenses and other liabilities on the consolidated balance sheet. Management evaluated the impact to all previously reported periods and concluded all previously issued financial statements were not materially misstated, nor was the impact of the adjustment material to the three months or the year ended December 31, 2015.
Foreign Currency Translation — Results of operations for our Canadian hotel were maintained in Canadian dollars and translated using the weighted average exchange rates during the period. Assets and liabilities were translated to U.S. dollars using the exchange rate in effect at the balance sheet date. Resulting translation adjustments were reflected in accumulated other comprehensive income. In 2014, we sold our remaining Canadian hotel and recorded a $24.4 million gain from foreign currency translation (which we had previously recorded in accumulated other comprehensive income).
Capitalized Costs — We capitalize interest (by applying our weighted average cost of borrowing to our construction in progress) and certain other costs, such as property taxes, land leases, property insurance and employee costs relating to hotels undergoing major renovations and redevelopments. In addition, these costs were capitalized on our Knickerbocker hotel during development. We begin capitalizing these costs when activities necessary to get the asset ready for its intended use are underway and cease capitalizing these costs to
73
FELCOR LODGING TRUST INCORPORATED AND FELCOR LODGING LIMITED PARTNERSHIP
NOTES TO CONSOLIDATED FINANCIAL STATEMENTS
2. | Summary of Significant Accounting Policies — (continued) |
projects when construction is substantially complete. Such costs capitalized in 2016, 2015 and 2014, were $7.7 million, $13.3 million and $25.9 million, respectively.
Net Income (Loss) per Common Share/Unit — We treat unvested share (unit)-based payment awards containing non-forfeitable rights to dividends (distributions) or dividend equivalents (whether paid or unpaid) as participating securities for computation of earnings per share (unit) (pursuant to the two-class method, in accordance with the Accounting Standards Codification, or ASC, 260-10-45-59A through 45-70).
We compute basic earnings per share (unit) by dividing net income (loss) attributable to common stockholders (or unitholders) less dividends (distributions) declared on FelCor’s unvested restricted stock by the weighted average number of common shares (units) outstanding. We compute diluted earnings per share (unit) by dividing net income (loss) attributable to common stockholders less dividends (distributions) declared on FelCor’s unvested restricted stock by the weighted average number of common shares (units) and equivalents outstanding.
For all years presented, our Series A cumulative preferred stock (units), or Series A preferred stock (units), if converted to common shares (units), would be antidilutive; accordingly, we do not assume conversion of the Series A preferred stock (units) in the computation of diluted earnings per share (unit).
FelCor’s Stock Compensation — We account for stock-based employee compensation using the fair value based method of accounting. We classify share-based payment awards granted in exchange for employee services as either equity awards or liability awards. Equity classified awards are measured based on the fair value on the date of grant. Liability classified awards are remeasured to fair value each reporting period. Awards that are to be settled in cash (i.e., phantom stock) are classified as liability awards. The value of all our share-based awards is recognized over the period during which an employee is required to provide services in exchange for the award – the requisite service period (usually the vesting period). No compensation cost is recognized for awards for which employees do not render the requisite services.
In March 2016, the FASB issued ASU 2016-09, Improvements to Employee Share-Based Payment Accounting, which is intended to improve the accounting for share-based payment transactions. Under the new standard, companies can withhold shares up to the maximum individual statutory tax rate in the applicable jurisdiction as participants vest in stock and maintain equity classification of the entire award. Also under the new standard, forfeitures for stock awards may be recorded when they occur (the prior guidance required estimating forfeitures when recording stock compensation costs). Finally, the standard requires classifying cash paid when remitting cash to the tax authorities for stock compensation withholding as financing activity in the statement of cash flows. We adopted this standard effective January 1, 2016. Upon adoption, we revised our policy to account for stock compensation forfeitures as they occur, which resulted in a $185,000 increase in our accumulated deficit for the cumulative effect of change in accounting principle. In addition, in our statement of cash flows, we reclassified $2.1 million and $3.1 million of cash paid to taxing authorities for shares withheld from operating activities to financing activities for the years ended December 31, 2015 and 2014, respectively.
Derivatives — We recognize derivatives as either assets or liabilities on the balance sheet and measure those instruments at fair value. Additionally, the fair value adjustments will affect either equity or net income, depending on whether the derivative instrument qualifies as a hedge for accounting purposes and the nature of the hedging activity.
74
FELCOR LODGING TRUST INCORPORATED AND FELCOR LODGING LIMITED PARTNERSHIP
NOTES TO CONSOLIDATED FINANCIAL STATEMENTS
2. Summary of Significant Accounting Policies — (continued)
Segment Information — We have determined that our business is conducted in one operating segment.
Distributions and Dividends — FelCor declared aggregate common dividends of $0.24, $0.18 and $0.10 per share in 2016, 2015 and 2014, respectively. FelCor’s ability to make distributions depends on FelCor’s receipt of quarterly distributions from FelCor LP, and FelCor LP’s ability to make distributions is dependent upon the results of operations of our hotels.
FelCor LP distributes funds to FelCor to pay common and preferred dividends. FelCor’s Board of Directors will determine the amount of any future common and preferred dividends based upon various factors including operating results, economic conditions, other operating trends, our financial condition and capital requirements, as well as minimum REIT distribution requirements.
Reacquired Stock — We account for FelCor’s purchase of capital stock under a method that is consistent with Maryland law (Maryland is FelCor’s domicile), which does not contemplate treasury stock. Any capital stock reacquired for any purpose is recorded as a reduction of common stock (at $0.01 par value per share) and an increase in accumulated deficit.
Noncontrolling Interests — Noncontrolling interests in other partnerships represents the proportionate share of the equity in other partnerships not owned by us. Noncontrolling interests in FelCor LP represents FelCor LP units not owned by FelCor. We allocate income and loss to noncontrolling interests in FelCor LP and other partnerships based on the weighted average percentage ownership throughout the year. FelCor characterizes minority interest in FelCor LP as noncontrolling interests, but because of the redemption feature of these units, FelCor includes them in the mezzanine section (between liabilities and equity) on its consolidated balance sheets. These units are redeemable at the option of the holders for a like number of shares of FelCor’s
common stock or, at our option, the cash equivalent thereof. We adjust redeemable noncontrolling interests in FelCor LP (or redeemable units) each period to reflect the greater of its carrying value based on the accumulation of historical cost or its redemption value.
Income Taxes — FelCor has elected to be treated as a REIT under Sections 856 to 860 of the Internal Revenue Code and is not subject to federal income tax, provided that it distributes all of its taxable income annually to its stockholders and complies with certain other requirements. FelCor LP is treated as a partnership for federal income tax purposes and is not subject to federal income taxes. However, both FelCor and FelCor LP may be subject to state, local and foreign income and franchise taxes in certain jurisdictions. We generally lease our hotels to wholly-owned taxable REIT subsidiaries, or TRSs, that are subject to federal, state and foreign income taxes. Through these lessees, we record room revenue, food and beverage revenue and other revenue related to the operations of our hotels. We account for income taxes using the asset and liability method under which deferred tax assets and liabilities are recognized for the future tax consequences attributable to differences between the financial statement carrying amounts of existing assets and liabilities and their respective tax bases. A valuation allowance is recorded for net deferred tax assets that are not expected to be realized.
We determine whether it is “more-likely-than-not” that a tax position will be sustained upon examination, including resolution of any related appeals or litigation processes, based on the technical merits of the position. Once it is determined that a position meets the more-likely-than-not recognition threshold, the position is measured to determine the amount of benefit to recognize in the financial statements. We apply this policy to all tax positions related to income taxes.
75
FELCOR LODGING TRUST INCORPORATED AND FELCOR LODGING LIMITED PARTNERSHIP
NOTES TO CONSOLIDATED FINANCIAL STATEMENTS
3. | Investment in Hotels |
Investment in hotels consisted of the following (in thousands):
December 31, | ||||||||
2016 | 2015 | |||||||
Building and improvements | $ | 1,761,228 | $ | 1,859,100 | ||||
Furniture, fixtures and equipment | 426,692 | 449,437 | ||||||
Land | 271,662 | 294,384 | ||||||
Construction in progress | 40,127 | 26,185 | ||||||
2,499,709 | 2,629,106 | |||||||
Accumulated depreciation - Building and improvements | (716,376 | ) | (697,386 | ) | ||||
Accumulated depreciation - Furniture, fixtures and equipment | (216,510 | ) | (202,189 | ) | ||||
$ | 1,566,823 | $ | 1,729,531 | |||||
In the third quarter of 2016, we acquired land previously leased for one of our hotels for $8.2 million (including closing costs).
In 2016, we retired fully depreciated furniture, fixtures and equipment aggregating approximately $35.0 million and fully depreciated assets for building and improvements aggregating approximately $763,000.
We invested $74.3 million and $48.4 million in additions and improvements to our consolidated hotels during the years ended December 31, 2016 and 2015, respectively.
4. Consolidated Joint Venture Preferred Equity/Capital
Our joint venture that redeveloped The Knickerbocker raised $45 million through the sale of redeemable preferred equity/capital under the EB-5 immigrant investor program. The purchasers receive a 3.25% current annual return (which increases to 8% if we do not redeem this equity interest before the fifth anniversary of its issuance), plus a 0.25% non-compounding annual return payable at redemption. To date, the venture has received $44.4 million in gross proceeds ($43.8 million net of issuance costs), including $600,000 and $1.8 million in gross proceeds received during the years ended December 31, 2016 and 2015, respectively. The venture expects to receive the remaining $600,000 as investors’ visas are approved.
76
FELCOR LODGING TRUST INCORPORATED AND FELCOR LODGING LIMITED PARTNERSHIP
NOTES TO CONSOLIDATED FINANCIAL STATEMENTS
5. | Impairment Charges |
Our hotels are comprised of operations and cash flows that can clearly be distinguished, operationally and for financial reporting purposes, from the remainder of our operations. Accordingly, we consider our hotels to be components for purposes of determining impairment charges.
We test for impairment whenever changes in circumstances indicate a hotel’s carrying value may not be recoverable. We conduct the test using undiscounted cash flows for the shorter of the hotel’s estimated hold period or its remaining useful life. When testing for recoverability of hotels held for investment, we use projected cash flows over its expected hold period. Those hotels held for investment that fail the impairment test are written down to their then current estimated fair value, before any selling expense, and we continue to depreciate the hotels over their remaining useful lives.
As part of our long-term strategic plan to enhance stockholder value and achieve or exceed targeted returns on invested capital, we sell and acquire hotels to improve our overall portfolio quality, enhance diversification and improve growth rates. In that regard, we regularly review each hotel in our portfolio in terms of projected performance, future capital expenditure requirements and market dynamics and concentration risk. Based on this analysis, we may establish a plan to sell our interests in certain hotels (two of which are owned by unconsolidated joint ventures) that no longer meet our investment criteria. As a consequence, we would shorten our estimated hold periods for those hotels and test the consolidated hotels for impairment when they are approved as non-strategic hotels. When the hotels owned by unconsolidated joint ventures are designated by those ventures as non-strategic, the joint ventures will test for impairment based on the reduced estimated hold periods.
In September 2016, we recorded a $20.1 million impairment charge for a hotel. The impairment charge was primarily based on both third-party offers to purchase the hotel and observable market data on a price per room basis from transactions involving hotels in similar locations (a Level 2 input under authoritative guidance for fair value measurements).
In June 2016, we recorded a $6.3 million impairment charge for a hotel subsequently sold in the third quarter of 2016. The impairment charge was based on an accepted third-party offer to purchase the hotel (a Level 2 input under authoritative guidance for fair value measurements) at a price below our previously estimated fair market value for the property. In 2015, we determined that this hotel no longer met our investment criteria, and we recorded a $20.9 million impairment charge for this hotel at that time. The 2015 impairment charge was determined using Level 3 input under authoritative guidance for fair value measurements. For this estimate, we used a discounted cash flow analysis with an estimated stabilized growth rate of 3%, a discounted cash flow term of five years, a terminal capitalization rate of 8%, and a discount rate of 11%.
We may record additional impairment charges if operating results of individual hotels are materially different from our forecasts, the economy and lodging industry weakens or we shorten our contemplated holding period for additional hotels.
77
FELCOR LODGING TRUST INCORPORATED AND FELCOR LODGING LIMITED PARTNERSHIP
NOTES TO CONSOLIDATED FINANCIAL STATEMENTS
6. | Hotel Dispositions |
Effective January 1, 2014, we adopted the provisions of Accounting Standards Update No. 2014-08, under which the disposal of components of an entity are reported as discontinued operations only if the disposal represents a strategic shift that has (or will have) a major effect on an entity’s operations and financial results. We only apply these new provisions prospectively; consequently, we continue to report hotels that were considered discontinued operations for the year ended December 31, 2013 and prior years as discontinued operations in all periods presented.
During the year ended December 31, 2016, we sold two hotels, and in 2015, we sold eight hotels. In 2014, we sold eight hotels, one of which was previously held for sale at December 31, 2013, and disposed of five unconsolidated hotels when we unwound our joint ventures as discussed in Note 7.
We designate a hotel as held for sale when the sale is probable within the next 12 months. Generally, we consider a sale to be probable when a buyer completes its due diligence review, we have an executed contract for sale and we have received a substantial non-refundable deposit. Excluding the hotel held for sale at December 31, 2013 and sold in 2014, we included operations for the sold hotels, and those hotels designated as held for sale at December 31, 2014, in income (loss) from continuing operations as shown in the statements of operations for the years ended December 31, 2016, 2015 and 2014, as disposition of these hotels did not represent a strategic shift in our business. Additionally, we included selling costs, which we expense as they are incurred, in the gain (loss) on the sale of hotels.
The following table includes condensed financial information primarily related to 12 of 13 hotels sold in 2014 (the remaining hotel was held for sale as of December 31, 2013), eight hotels sold in 2015 and two hotels sold in 2016 included in continuing operations (in thousands):
Year Ended December 31, | ||||||||||||||
2016 | 2015 | 2014 | ||||||||||||
Hotel operating revenue | $ | 39,750 | $ | 85,840 | $ | 207,762 | ||||||||
Operating expenses (a) | (39,530 | ) | (97,655 | ) | (197,180 | ) | ||||||||
Operating income (loss) | 220 | (11,815 | ) | 10,582 | ||||||||||
Interest expense, net | 1 | (1,031 | ) | (2,475 | ) | |||||||||
Debt extinguishment | — | (309 | ) | (932 | ) | |||||||||
Gain on sale of investment in unconsolidated entities, net | — | — | 30,176 | |||||||||||
Equity in income from unconsolidated entities | — | 7,111 | 3,294 | |||||||||||
Income (loss) from continuing operations | 221 | (6,044 | ) | 40,645 | ||||||||||
Gain on sale of hotels, net(b) | 6,322 | 19,426 | 66,762 | |||||||||||
Net income | 6,543 | 13,382 | 107,407 | |||||||||||
Net income attributable to noncontrolling interests in other partnerships | — | (5,166 | ) | (977 | ) | |||||||||
Net income attributable to redeemable noncontrolling interests in FelCor LP | (28 | ) | (35 | ) | (394 | ) | ||||||||
Net income attributable to FelCor | $ | 6,515 | $ | 8,181 | $ | 106,036 | ||||||||
(a) | Operating expenses include impairment charges of $6.3 million and $20.9 million for the years ended December 31, 2016 and 2015, respectively. |
(b) | We recorded a $24.4 million gain from foreign currency translation (which we had previously recorded in accumulated other comprehensive income) when we sold our remaining Canadian hotel in 2014, which substantially liquidated all of our foreign investments. |
78
FELCOR LODGING TRUST INCORPORATED AND FELCOR LODGING LIMITED PARTNERSHIP
NOTES TO CONSOLIDATED FINANCIAL STATEMENTS
7. Joint Venture Transactions
In July 2014, we unwound unconsolidated joint ventures in which we held 50% interests that collectively owned 10 hotels. As a consequence of that transaction, we owned 100% of five of those hotels and none of the other five hotels. We also obtained 100% ownership of an additional hotel of which we owned 90% prior to the unwinding of the joint ventures. We paid $2.2 million to our joint venture partner to equalize the aggregate value of assets each party received as the joint ventures were unwound. This payment was the net of $5.9 million paid for our partner’s 10% interest in the one hotel and $3.7 million received for the difference in values of the five hotels wholly-owned by us compared to the five hotels in which we no longer had any ownership subsequent to the transaction.
Our joint ventures had an outstanding loan that was secured by eight of these hotels and was bifurcated when the joint ventures were unwound. That loan bore interest at one-month LIBOR plus 3%, matured in March 2017 and was freely pre-payable in whole or in part. Subsequent to the unwinding of the joint ventures, we were only liable for our $64 million share of the bifurcated non-recourse loan, which was secured by mortgages on four of the five former joint venture hotels that we wholly-owned. In 2015, this loan was repaid in connection with the sale of three of the four hotels securing the loan. The remaining hotel was sold later in 2015.
As a result of these transactions, we recorded the following in 2014:
• | A $20.7 million gain on the remeasurement of the fair value of the five previously unconsolidated hotels, which we controlled and wholly-owned following the transaction; |
• | A $30.2 million gain on the disposition of our unconsolidated interests in the five other hotels (net of $457,000 in transaction costs); and |
• | A $3.5 million decrease in Additional Paid-In Capital related to our acquisition of the 10% noncontrolling interest of another hotel, which we wholly-owned following the transaction. |
In addition to the foregoing, we increased our ownership interest in the operating entities of all six hotels in conjunction with unwinding the joint ventures. Prior to the transaction, we had 51% controlling interests in 10 of the hotel lessees that operated the joint ventures’ 10 hotels and a 90% controlling interest in the hotel lessee that operated the eleventh hotel. After unwinding the joint ventures, we no longer had any interest in five lessees and owned 100% in the lessees of the six hotels we owned outright following the transaction. When we unwound the joint ventures, we liquidated the lessees’ assets and liabilities to cash, which was then distributed to the partners based on their ownership interests just prior to unwinding the joint ventures. Consequently, we recorded no gains or losses when changing ownership of the lessees.
The following table summarizes the fair values of assets acquired and liabilities assumed where we obtained control of a previously unconsolidated entity (i.e., a business combination) through this, primarily non-cash, transaction (in thousands):
Assets | |||
Investment in hotels | $ | 130,100 | |
Other assets | 1,300 | ||
Deferred expenses | 259 | ||
Total assets acquired | $ | 131,659 | |
Liabilities | |||
Debt | $ | 64,000 | |
Net assets acquired | $ | 67,659 | |
79
FELCOR LODGING TRUST INCORPORATED AND FELCOR LODGING LIMITED PARTNERSHIP
NOTES TO CONSOLIDATED FINANCIAL STATEMENTS
7. Joint Venture Transactions — (continued)
The value of the assets acquired was primarily based on a sales comparison approach (for land) and a depreciated replacement cost approach (for buildings and furniture, fixtures, and equipment). The sales comparison approach used inputs of recent land sales in the respective hotel markets. The depreciated replacement cost approach used inputs of both direct and indirect replacement costs using a nationally recognized authority on replacement cost information as well as the age and the square footage of the respective buildings. The fair value of the debt was based on the estimated principal amount of debt having the same debt service requirements that could have been borrowed on the transaction date, at then current market interest rates.
The non-cash transaction also resulted in a $19.9 million reduction in our investment in unconsolidated entities.
The following unaudited consolidated pro forma results of operations for the years ended December 31, 2014 and 2013 assumes the joint venture transactions (the business combination, the disposition of unconsolidated interests, the acquisition of a 10% interest in one hotel, and the change in lessee ownership percentages) occurred on January 1, 2013 (in thousands, except per share data). The unaudited consolidated pro forma results of operations are not necessarily indicative of the results of operations if the transactions had been completed on the assumed date.
Year Ended December 31, | |||||||
2014 | 2013 | ||||||
Revenue | $ | 892,555 | $ | 843,878 | |||
Net income (loss) | $ | 94,869 | $ | (65,670 | ) | ||
Income (loss) per share/unit - basic | $ | 0.43 | $ | (0.82 | ) | ||
Income (loss) per share/unit - diluted | $ | 0.43 | $ | (0.82 | ) | ||
80
FELCOR LODGING TRUST INCORPORATED AND FELCOR LODGING LIMITED PARTNERSHIP
NOTES TO CONSOLIDATED FINANCIAL STATEMENTS
8. | Investment in Unconsolidated Entities |
At December 31, 2016 and 2015, we owned 50% interests in joint ventures that owned two hotels. We also own 50% interests in entities that own real estate in Myrtle Beach, South Carolina and provide condominium management services there. We account for our investments in these unconsolidated entities under the equity method. We consolidate all of our majority-owned subsidiaries in our financial statements. We make adjustments to our equity in income from unconsolidated entities related to the difference between our basis in investment in unconsolidated entities compared to the historical basis of the assets recorded by the joint ventures.
The following table summarizes combined balance sheet information for our unconsolidated entities (in thousands):
December 31, | |||||||
2016 | 2015 | ||||||
Investment in hotels and other properties, net of accumulated depreciation | $ | 20,898 | $ | 23,047 | |||
Total assets | $ | 27,052 | $ | 29,033 | |||
Debt, net of unamortized debt issuance costs | $ | 22,065 | $ | 22,563 | |||
Total liabilities | $ | 24,311 | $ | 24,541 | |||
Equity | $ | 2,741 | $ | 4,492 | |||
Our unconsolidated entities’ debt at December 31, 2016 and 2015 consisted entirely of non-recourse mortgage debt.
In May 2015, one of our joint ventures sold a hotel, resulting in a $7.1 million gain that we included in our equity in income from unconsolidated entities. In connection with selling this hotel, the joint venture repaid the outstanding $10.5 million mortgage loan encumbering this hotel.
The following table (which, among other things, reflects decreases attributable to the unwinding of our 10-hotel unconsolidated joint ventures in July 2014) sets forth summarized combined statement of operations information for our unconsolidated entities (in thousands):
Year Ended December 31, | |||||||||||
2016 | 2015 | 2014 | |||||||||
Total revenues | $ | 33,615 | $ | 32,591 | $ | 59,453 | |||||
Net income | $ | 3,839 | $ | 22,799 | $ | 12,561 | |||||
Net income attributable to FelCor | $ | 1,920 | $ | 11,400 | $ | 6,281 | |||||
Cost in excess of joint venture book value of sold hotel | — | (3,140 | ) | — | |||||||
Depreciation of cost in excess of book value | (387 | ) | (427 | ) | (1,271 | ) | |||||
Equity in income from unconsolidated entities | $ | 1,533 | $ | 7,833 | $ | 5,010 | |||||
81
FELCOR LODGING TRUST INCORPORATED AND FELCOR LODGING LIMITED PARTNERSHIP
NOTES TO CONSOLIDATED FINANCIAL STATEMENTS
8. | Investment in Unconsolidated Entities — (continued) |
The following table summarizes the components of our investment in unconsolidated entities (in thousands):
December 31, | |||||||
2016 | 2015 | ||||||
Equity basis of hotel joint venture investments | $ | (4,533 | ) | $ | (4,216 | ) | |
Cost of hotel investments in excess of joint venture book value | 6,942 | 7,329 | |||||
Equity basis of land and condominium joint venture investments | 5,903 | 6,462 | |||||
Investment in unconsolidated entities | $ | 8,312 | $ | 9,575 | |||
The following table summarizes the components of our equity in income from unconsolidated entities (in thousands):
Year Ended December 31, | |||||||||||
2016 | 2015 | 2014 | |||||||||
Hotel investments | $ | 2,092 | $ | 8,535 | $ | 5,784 | |||||
Other investments | (559 | ) | (702 | ) | (774 | ) | |||||
Equity in income from unconsolidated entities | $ | 1,533 | $ | 7,833 | $ | 5,010 | |||||
9. | Debt |
Consolidated debt consisted of the following (in thousands) at the dates shown:
Encumbered | Interest | Maturity | December 31, | |||||||||||||
Hotels | Rate (%) | Date | 2016 | 2015 | ||||||||||||
Senior unsecured notes | — | 6.00 | June 2025 | $ | 475,000 | $ | 475,000 | |||||||||
Senior secured notes | 9 | 5.625 | March 2023 | 525,000 | 525,000 | |||||||||||
Mortgage debt(a) | 4 | 4.95 | October 2022 | 120,109 | 122,237 | |||||||||||
Mortgage debt | 1 | 4.94 | October 2022 | 30,184 | 30,717 | |||||||||||
Line of credit(b) | 7 | LIBOR + 2.75 | June 2019 | 119,000 | 190,000 | |||||||||||
Mortgage debt(c) | 1 | LIBOR + 3.00 | November 2017 | 85,000 | 85,000 | |||||||||||
Total | 22 | $ | 1,354,293 | $ | 1,427,954 | |||||||||||
Unamortized debt issuance costs | (15,967 | ) | (18,065 | ) | ||||||||||||
Debt, net of unamortized debt issuance costs | $ | 1,338,326 | $ | 1,409,889 | ||||||||||||
(a) | This debt is comprised of separate non-cross-collateralized loans, each secured by a mortgage encumbering a separate hotel. |
(b) | Our line of credit can be extended for one year, subject to satisfying certain conditions. We may borrow up to $400 million under our line of credit. |
(c) | This loan can be extended for one year, subject to satisfying certain conditions. |
82
FELCOR LODGING TRUST INCORPORATED AND FELCOR LODGING LIMITED PARTNERSHIP
NOTES TO CONSOLIDATED FINANCIAL STATEMENTS
9. Debt — (continued)
Since adoption of ASU 2015-03, we classify deferred financing costs of $16.0 million and $18.1 million as of December 31, 2016 and 2015, respectively, within the debt on our consolidated balance sheets. We previously classified deferred financing costs of $18.1 million at December 31, 2015 as an asset on our consolidated balance sheets. In accordance with ASU 2015-15, we continue classifying deferred financing costs associated with our line of credit as an asset on our consolidated balance sheets.
In February 2015, we sold a hotel and repaid $13.0 million in mortgage debt secured by that hotel that would have otherwise matured in March 2017.
In May 2015, we issued $475 million aggregate principal amount of our 6.00% unsecured senior notes due 2025. We used the proceeds from that issuance, together with cash on hand and funds drawn under our line of credit, to repurchase and redeem $525 million in aggregate principal amount of our 6.75% senior secured notes due 2019, which was secured by mortgages on six hotels. We incurred $28.4 million of debt extinguishment charges relating to prepayment premiums and the write-off of deferred loan costs in connection with this transaction. All cash paid to satisfy the extinguishment of the senior secured notes was classified as a financing activity in the statements of cash flows.
In June 2015, we amended and restated our secured line of credit facility primarily to expand our borrowing capacity from $225 million to $400 million. The amended facility now matures in June 2020 (extended from June 2017), assuming we exercise a one-year extension option that is subject to certain conditions. Borrowings under the facility bear interest at LIBOR (no floor) plus an applicable margin ranging from 225 to 275 basis points (reduced from 337.5 basis points), depending on our leverage. The unused commitment fee decreased 5 basis points to 35 basis points. The facility is secured by mortgages on seven hotels and permits partial release and substitution of properties, subject to certain conditions. We incurred $164,000 of debt extinguishment charges (relating to writing-off deferred loan costs) when we amended the facility. We concurrently repaid a $140 million term loan that otherwise matured in 2017, bore interest at LIBOR plus 250 basis points and was secured by mortgages on three hotels, including one hotel that is part of the security for the amended facility. We incurred $2.0 million of debt extinguishment charges relating to writing-off deferred loan costs for the repaid loan.
In June 2015, when we sold two hotels, we repaid a $49.1 million loan secured by mortgages on three hotels (including the two sold hotels), that would have otherwise matured in March 2017. We sold the remaining hotel that had been mortgaged to secure this loan in September 2015. We incurred $237,000 of debt extinguishment charges relating to writing-off deferred loan costs for the repaid loan.
In 2015, we increased our borrowings under our loan secured by The Knickerbocker from $64.9 million to $85.0 million. Also, in November 2015, we amended our Knickerbocker loan to lower the interest rate to LIBOR plus 300 basis points and extended the maturity to November 2017.
Our senior notes, which are guaranteed by FelCor, require that we satisfy total leverage, secured leverage and interest coverage tests in order to: (i) incur additional indebtedness, except to refinance maturing debt with replacement debt, as defined under our indentures; (ii) pay dividends in excess of the minimum distributions required to qualify as a REIT; (iii) repurchase capital stock; or (iv) merge. We currently exceed all minimum thresholds. In addition, our 5.625% senior notes are secured by a combination of first lien mortgages and related security interests on nine hotels, as well as pledges of equity interests in certain subsidiaries of FelCor LP, and our 6.00% senior unsecured notes require us to maintain a minimum amount of unencumbered assets.
83
FELCOR LODGING TRUST INCORPORATED AND FELCOR LODGING LIMITED PARTNERSHIP
NOTES TO CONSOLIDATED FINANCIAL STATEMENTS
9. Debt — (continued)
At December 31, 2016, we had consolidated secured debt totaling $879.3 million, encumbering 22 of our Consolidated Hotels with a $1.1 billion aggregate net book value. Except for our 5.625% senior secured notes due 2023 and our line of credit, our secured debt is generally recourse solely to the specific hotels securing the debt, except in case of fraud, misapplication of funds and certain other customary limited recourse carve-out provisions that could extend recourse to us. Much of our secured debt allows us to substitute collateral under certain conditions and is freely prepayable, subject in some instances to various prepayment, yield maintenance or defeasance obligations.
Most of our secured debt (other than our 5.625% senior secured notes) is subject to lock-box arrangements under certain circumstances. We are permitted to spend an amount required to cover our hotel operating expenses, taxes, debt service, insurance and capital expenditure reserves, even if revenues are flowing through a lock-box triggered by a specified debt service coverage ratio not being met. All of our consolidated loans subject to lock-box provisions currently exceed the applicable minimum debt service coverage ratios.
We reported $78.2 million, $79.1 million, and $90.7 million of interest expense for the years ended December 31, 2016, 2015, and 2014, respectively, which is net of: (i) interest income of $62,000, $24,000, and $48,000, and (ii) capitalized interest of $973,000, $6.0 million, and $16.3 million, respectively.
To fulfill requirements under one of our loans, we entered into an interest rate cap agreement with an aggregate notional amount of $140 million at December 31, 2015. We did not designate the interest rate cap as a hedge, and it had an insignificant fair value at December 31, 2015, resulting in no significant impact on earnings. We had no outstanding interest rate caps at December 31, 2016.
Future scheduled principal payments on debt obligations at December 31, 2016 are as follows (in thousands):
Year | ||||
2017 | $ | 87,637 | ||
2018 | 2,954 | |||
2019 | 122,106 | |||
2020 | 3,245 | |||
2021 | 3,432 | |||
Thereafter | 1,134,919 | |||
$ | 1,354,293 | |||
84
FELCOR LODGING TRUST INCORPORATED AND FELCOR LODGING LIMITED PARTNERSHIP
NOTES TO CONSOLIDATED FINANCIAL STATEMENTS
10. Fair Value of Financial Instruments
We base disclosures about fair value of our financial instruments on pertinent information available to management as of December 31, 2016 and 2015. We exercise considerable judgment when interpreting market data and developing estimated fair value. Accordingly, the estimates presented herein are not necessarily indicative of the amounts that we could realize on disposition of the financial instruments. Different market assumptions and/or estimation methodologies may have a material effect on estimated fair value amounts.
We base our estimates of the fair value of: (i) cash and cash equivalents, restricted cash, accounts receivable, accounts payable and accrued expenses on their carrying values due to their relatively short maturity; (ii) our debt for which trading prices are publicly available on observable market data (a Level 2 input) (that debt had an estimated fair value of approximately $1.0 billion at December 31, 2016 and 2015); and (iii) our debt for which trading prices are not publicly available on a discounted cash flow model using effective borrowing rates for debt with similar terms, loan to estimated fair value of collateral and remaining maturities (a Level 3 input) (that debt had an estimated fair value of $364.6 million and $438.8 million at December 31, 2016 and 2015, respectively). The estimated fair value of all our debt was $1.4 billion and $1.5 billion at December 31, 2016 and 2015, respectively. The carrying value of our debt was $1.3 billion and $1.4 billion at December 31, 2016 and 2015, respectively.
85
FELCOR LODGING TRUST INCORPORATED AND FELCOR LODGING LIMITED PARTNERSHIP
NOTES TO CONSOLIDATED FINANCIAL STATEMENTS
11. FelCor Capital Stock/FelCor LP Partners’ Capital
FelCor, as FelCor LP’s general partner, is obligated to contribute the net proceeds from any issuance of its equity securities to FelCor LP in exchange for units, corresponding in number and terms to the equity securities issued.
Preferred Stock/Units
FelCor’s Board of Directors is authorized to provide for the issuance of up to 20 million shares of preferred stock in one or more series, to establish the number of shares in each series, to fix the designation, powers, preferences and rights of each such series, and the qualifications, limitations or restrictions thereof.
Our Series A preferred stock (units) bears an annual cumulative dividend (distribution) payable in arrears equal to the greater of $1.95 per share (unit) or the cash distributions declared or paid for the corresponding period on the number of shares of common stock (units) into which the Series A preferred stock (units) is then
convertible. Each share (unit) of the Series A preferred stock (units) is convertible at the holder’s option to 0.7752 shares of common stock (units), subject to certain adjustments.
In April 2015, FelCor called for redemption of all of its outstanding shares of 8% Series C Cumulative Redeemable Preferred Stock and all depositary shares representing the Series C preferred stock. FelCor redeemed those shares of Series C preferred stock and the depositary shares, and FelCor LP concurrently redeemed its Series C preferred units, on May 14, 2015 using proceeds from the equity offering. Including dividends of $491,000, the total redemption price was $170.4 million. We reduced income available to common stockholders (unitholders) by $6.1 million for the year ended December 31, 2015, primarily representing the original issuance costs ($5.5 million) and discount ($538,000) of the redeemed Series C preferred stock (Units).
Common Stock/Units
In April 2015, FelCor issued 18.4 million shares of its common stock at $11.25 per share in a public offering. FelCor contributed the net proceeds from the offering ($199 million) to FelCor LP in exchange for 18.4 million common units of limited partnership interests.
In 2015, FelCor’s Board approved a common stock repurchase program, under which it may spend up to $100 million repurchasing shares of its common stock through October 2017. FelCor may repurchase shares in transactions on the open market, in privately-negotiated transactions or by other means, including Rule 10b5-1 trading plans, in accordance with applicable securities laws and other restrictions. In 2015, FelCor paid $14.4 million (including commissions) repurchasing approximately 2.0 million shares of its common stock at an average price of $7.26 per share. In 2016, FelCor repurchased 4.6 million shares for $30.5 million (including commissions), at an average price of $6.58 per share. Since the inception of the repurchase program, FelCor has repurchased 6.6 million shares for $44.8 million (including commissions), at an average share price of $6.78 per share. All repurchased shares have been retired and have been re-designated as authorized but unissued.
There is no guaranty as to the number of shares that will be repurchased, and FelCor may extend, suspend or discontinue its repurchase program at any time without notice at its discretion.
86
FELCOR LODGING TRUST INCORPORATED AND FELCOR LODGING LIMITED PARTNERSHIP
NOTES TO CONSOLIDATED FINANCIAL STATEMENTS
12. | Income Taxes |
FelCor LP is a partnership for federal income tax purposes, and is not subject to federal income tax. However, under its partnership agreement, it is required to reimburse FelCor for any tax payments FelCor LP is required to make. Accordingly, the tax information herein represents disclosures regarding FelCor and its taxable subsidiaries.
FelCor elected to be treated as a REIT under the federal income tax laws. As a REIT, FelCor generally is not subject to federal income taxation at the corporate level on taxable income that is distributed to its stockholders. FelCor may, however, be subject to certain state and local taxes on its income and property and to federal income and excise taxes on its undistributed taxable income. FelCor’s taxable REIT subsidiaries, or TRSs, formed to lease its hotels are subject to federal, state and local income taxes. A REIT is subject to a number of organizational and operational requirements, including a requirement that it currently distributes at least 90% of its annual taxable income to its stockholders. If FelCor fails to qualify as a REIT in any taxable year for which the statute of limitations remains open, it will be subject to federal income taxes at regular corporate rates (including any applicable alternative minimum tax) for such taxable year and may not qualify as a REIT for four subsequent years. In connection with FelCor’s election to be treated as a REIT, its charter imposes restrictions on the ownership and transfer of shares of its common stock. FelCor LP expects to make distributions on its units sufficient to enable FelCor to meet its distribution obligations as a REIT.
We account for income taxes using the asset and liability method, under which deferred tax assets and liabilities are recognized for the future tax consequences attributable to differences between the financial statement carrying amounts of existing assets and liabilities and their respective tax bases.
The following table reconciles our TRSs’ GAAP net income (loss) to federal taxable income (in thousands):
Year Ended December 31, | ||||||||||||
2016 | 2015 | 2014 | ||||||||||
GAAP consolidated net income (loss) attributable to FelCor LP | $ | 3,405 | $ | (9,059 | ) | $ | 92,236 | |||||
Loss (income) allocated to FelCor LP unitholders | 93 | 194 | (137 | ) | ||||||||
GAAP consolidated net income (loss) attributable to FelCor | 3,498 | (8,865 | ) | 92,099 | ||||||||
GAAP net loss (income) from REIT operations | 21,332 | 21,838 | (68,796 | ) | ||||||||
GAAP net income of taxable subsidiaries | 24,830 | 12,973 | 23,303 | |||||||||
Taxes related to joint venture transaction | — | — | 5,761 | |||||||||
Gain/loss differences from dispositions | — | (872 | ) | — | ||||||||
Depreciation and amortization(a) | (12,437 | ) | (1,877 | ) | (461 | ) | ||||||
Employee benefits not deductible for tax | (2,965 | ) | (588 | ) | (101 | ) | ||||||
Management fee recognition | — | (107 | ) | (1,151 | ) | |||||||
Cancellation of debt | — | — | (3,188 | ) | ||||||||
Capitalized TRS start-up costs | — | — | 11,859 | |||||||||
Other book/tax differences | 386 | 3,827 | 181 | |||||||||
Federal tax income of taxable subsidiaries before utilization of net operating losses | 9,814 | 13,356 | 36,203 | |||||||||
Utilization of net operating loss | (9,814 | ) | (13,356 | ) | (36,203 | ) | ||||||
Net federal tax income of taxable subsidiaries | $ | — | $ | — | $ | — | ||||||
(a) | The changes in book/tax differences in depreciation and amortization principally result from book and tax basis differences, differences in depreciable lives and accelerated depreciation methods. |
87
FELCOR LODGING TRUST INCORPORATED AND FELCOR LODGING LIMITED PARTNERSHIP
NOTES TO CONSOLIDATED FINANCIAL STATEMENTS
12. Income Taxes — (continued)
Included in our consolidated statement of operations are $873,000, $1.2 million and $660,000 related to current state income taxes for the years ended December 31, 2016, 2015 and 2014, respectively. State income taxes in 2014 have been reclassified from taxes, insurance and lease expense to conform to the 2016 and 2015 presentation of a separate line for income tax expense on our consolidated statements of operations.
Our TRSs had a deferred tax asset, on which we had a 100% valuation allowance, primarily comprised of the following (in thousands):
December 31, | ||||||||
2016 | 2015 | |||||||
Accumulated net operating losses of TRSs | $ | 94,219 | $ | 98,367 | ||||
Tax property basis compared to book | 4,844 | (4,518 | ) | |||||
Accrued employee benefits not deductible for tax | 4,966 | 4,889 | ||||||
Historic tax credits(a) | 19,357 | 25,375 | ||||||
Other | 26 | 109 | ||||||
Gross deferred tax asset | 123,412 | 124,222 | ||||||
Valuation allowance | (123,412 | ) | (124,222 | ) | ||||
Deferred tax asset after valuation allowance | $ | — | $ | — | ||||
(a) | Because of the completion of construction at The Knickerbocker in 2015, one of our TRSs became entitled to the future benefits of historic tax credits that vest over a five year period and do not expire. Historic tax credits for 2015 reflect both federal and state credits. Upon the filing of the state return for 2015 in 2016, the state credit became refundable. Historic tax credits for 2016 reflect federal credits only. |
We provided a valuation allowance against our deferred tax asset that results in no net deferred tax asset at December 31, 2016 and 2015. We recorded a 100% valuation allowance related to our TRSs’ net deferred tax asset because we believe it is more likely than not that the deferred tax asset will not be fully realized. The realization of the deferred tax assets associated with our net operating losses and historic tax credits is dependent on projections of future taxable income, for which there is uncertainty when considering our historic results and the cyclical nature of the lodging industry. Accordingly, no provision or benefit for deferred income taxes is reflected in the accompanying consolidated statements of operations. At December 31, 2016, our TRSs had net operating loss carryforwards for federal income tax purposes of $254.8 million, which are available to offset future taxable income, if any, and do not begin to expire until 2024.
88
FELCOR LODGING TRUST INCORPORATED AND FELCOR LODGING LIMITED PARTNERSHIP
NOTES TO CONSOLIDATED FINANCIAL STATEMENTS
12. Income Taxes — (continued)
The following table reconciles REIT GAAP net income (loss) to taxable income (loss) (in thousands):
Year Ended December 31, | ||||||||||||
2016 | 2015 | 2014 | ||||||||||
GAAP net income (loss) from REIT operations | $ | (21,332 | ) | $ | (21,838 | ) | $ | 68,796 | ||||
Book/tax differences, net: | ||||||||||||
Dividend income from TRS | 25,650 | 24,809 | — | |||||||||
Depreciation and amortization(a) | 19,582 | 3,937 | 1,831 | |||||||||
Noncontrolling interests | (93 | ) | (400 | ) | 329 | |||||||
Gain/loss differences from dispositions | (16,572 | ) | 18,335 | (99,946 | ) | |||||||
Impairment loss not deductible for tax | 26,459 | 20,861 | — | |||||||||
Conversion costs | (3,233 | ) | (3,233 | ) | (3,233 | ) | ||||||
Other | (446 | ) | 1,505 | (1,674 | ) | |||||||
Tax income (loss)(b) | $ | 30,015 | $ | 43,976 | $ | (33,897 | ) | |||||
(a) | Book/tax differences in depreciation and amortization principally result from differences in depreciable lives and accelerated depreciation methods. |
(b) | The dividend distribution requirement is 90% of any taxable income (net of capital gains). For 2016 and 2015, our distributions were in excess of 100% of taxable income. |
At December 31, 2016, FelCor had net operating loss carryforwards for federal income tax purposes of $534.2 million, which it expects to use to offset future distribution requirements.
For income tax purposes, dividends paid consist of ordinary income, capital gains, return of capital or a combination thereof. Dividends paid per share were characterized, in accordance with the requirements under the Internal Revenue Code, as follows:
2016 | 2015 | 2014 | |||||||||||||||
Amount | % | Amount | % | Amount | % | ||||||||||||
Preferred Stock – Series A | |||||||||||||||||
Capital gains | $ | — | — | $ | 1.23 | 63.08 | $ | — | — | ||||||||
Dividend income | 1.03 | 52.82 | 0.72 | 36.92 | — | — | |||||||||||
Non-dividend distribution | 0.92 | 47.18 | — | — | 1.95 | 100.00 | |||||||||||
$ | 1.95 | (a) | 100.00 | $ | 1.95 | (b) | 100.00 | $ | 1.95 | (c) | 100.00 | ||||||
Preferred Stock – Series C | |||||||||||||||||
Capital gains | $ | — | — | $ | 0.63 | 63.00 | $ | — | — | ||||||||
Dividend income | — | — | 0.37 | 37.00 | — | — | |||||||||||
Non-dividend distribution | — | — | — | — | 2.00 | 100.00 | |||||||||||
$ | — | — | $ | 1.00 | (b) | 100.00 | $ | 2.00 | (c) | 100.00 | |||||||
Common Stock | |||||||||||||||||
Capital gains | $ | — | — | $ | — | — | $ | — | — | ||||||||
Dividend income | — | — | — | — | — | — | |||||||||||
Non-dividend distribution | 0.24 | 100.00 | 0.16 | 100.00 | 0.08 | 100.00 | |||||||||||
$ | 0.24 | (a) | 100.00 | $ | 0.16 | (b) | 100.00 | $ | 0.08 | (c) | 100.00 | ||||||
(a) | Fourth quarter 2015 preferred and common distributions were paid January 29, 2016, and were treated as 2016 distributions for tax purposes. |
(b) | Fourth quarter 2014 preferred and common distributions were paid January 29, 2015, and were treated as 2015 distributions for tax purposes. |
(c) | Fourth quarter 2013 preferred and common distributions were paid January 30, 2014, and were treated as 2014 distributions for tax purposes. |
89
FELCOR LODGING TRUST INCORPORATED AND FELCOR LODGING LIMITED PARTNERSHIP
NOTES TO CONSOLIDATED FINANCIAL STATEMENTS
13. Redeemable Noncontrolling Interests in FelCor LP/Redeemable Units
We record redeemable noncontrolling interests in FelCor LP, in the case of FelCor, and redeemable units, in the case of FelCor LP, in the mezzanine section (between liabilities and equity or partners’ capital) of our consolidated balance sheets because of the redemption feature of these units. Additionally, FelCor’s consolidated statements of operations separately present earnings attributable to redeemable noncontrolling interests. We adjust redeemable noncontrolling interests in FelCor LP (or redeemable units) each period to reflect the greater of its carrying value based on the accumulation of historical cost or its redemption value. We base the historical cost on the proportionate relationship between the carrying value of equity associated with FelCor’s common stockholders relative to that of FelCor LP’s unitholders. We base redemption value on the closing price of FelCor’s common stock at period end. FelCor allocates net income (loss) to FelCor LP’s noncontrolling partners based on their weighted average ownership percentage during the period.
At December 31, 2016, we had 610,183 limited partnership units outstanding carried at $4.9 million. We base the value of these outstanding units on the closing price of FelCor’s common stock at December 31, 2016 ($8.01/share).
Changes in redeemable noncontrolling interests (or redeemable units) are shown below (in thousands):
Year Ended December 31, | ||||||||
2016 | 2015 | |||||||
Balance at beginning of period | $ | 4,464 | $ | 6,616 | ||||
Conversion of units | (9 | ) | — | |||||
Redemption value allocation | 673 | (1,865 | ) | |||||
Distributions paid to unitholders | (147 | ) | (93 | ) | ||||
Comprehensive income (loss): | ||||||||
Net loss | (93 | ) | (194 | ) | ||||
Balance at end of period | $ | 4,888 | $ | 4,464 | ||||
14. Hotel Operating Revenue, Departmental Expenses and Other Property-Related Operating Costs
Hotel operating revenue from continuing operations was comprised of the following (in thousands):
Year Ended December 31, | |||||||||||
2016 | 2015 | 2014 | |||||||||
Room revenue | $ | 661,640 | $ | 673,276 | $ | 713,213 | |||||
Food and beverage revenue | 155,227 | 158,531 | 157,607 | ||||||||
Other operating departments | 45,951 | 46,564 | 47,161 | ||||||||
Total hotel operating revenue | $ | 862,818 | $ | 878,371 | $ | 917,981 | |||||
Nearly all of our revenue is comprised of hotel operating revenues. These revenues are recorded net of any sales or occupancy taxes collected from our guests. We record all rebates or discounts, when allowed, as a reduction in revenue, and there are no material contingent obligations with respect to rebates or discounts offered by us. All revenues are recorded on an accrual basis, as earned. We make appropriate allowances for doubtful accounts, which we record as bad debt expense. The remainder of our revenue is from condominium management fee income and other sources.
90
FELCOR LODGING TRUST INCORPORATED AND FELCOR LODGING LIMITED PARTNERSHIP
NOTES TO CONSOLIDATED FINANCIAL STATEMENTS
14. Hotel Operating Revenue, Departmental Expenses and Other Property-Related Operating Costs — (continued)
Hotel departmental expenses from continuing operations were comprised of the following (in thousands):
Year Ended December 31, | |||||||||||
2016 | 2015 | 2014 | |||||||||
Room | $ | 171,883 | $ | 172,252 | $ | 188,465 | |||||
Food and beverage | 119,047 | 123,384 | 121,201 | ||||||||
Other operating departments | 15,120 | 17,505 | 22,210 | ||||||||
Total hotel departmental expenses | $ | 306,050 | $ | 313,141 | $ | 331,876 | |||||
Other property-related costs from continuing operations were comprised of the following amounts (in thousands):
Year Ended December 31, | |||||||||||
2016 | 2015 | 2014 | |||||||||
Hotel general and administrative expense | $ | 78,329 | $ | 78,233 | $ | 79,420 | |||||
Marketing | 70,978 | 76,548 | 77,939 | ||||||||
Repair and maintenance | 36,381 | 39,091 | 43,886 | ||||||||
Utilities | 26,492 | 29,674 | 36,925 | ||||||||
Total other property-related costs | $ | 212,180 | $ | 223,546 | $ | 238,170 | |||||
In March 2013, we rebranded and transitioned management at eight hotels located in strategic markets to Wyndham brands. Wyndham’s parent guaranteed a minimum level of net operating income for each year of the initial 10-year term, subject to an aggregate $100 million limit over the term (of which we have received or accrued $16.1 million through 2016) and an annual $21.5 million limit. Amounts recorded under the guaranty are accounted for, to the extent available, as a reduction in contractual management and other fees paid and payable to Wyndham. Any amounts in excess of those fees will be recorded as revenue when earned. For the years ended December 31, 2016, 2015, and 2014, we have recorded $5.3 million, $1.4 million, and $1.3 million, respectively, for the guaranty as a reduction of Wyndham’s contractual management and other fees.
91
FELCOR LODGING TRUST INCORPORATED AND FELCOR LODGING LIMITED PARTNERSHIP
NOTES TO CONSOLIDATED FINANCIAL STATEMENTS
15. | Taxes, Insurance and Lease Expense |
Taxes, insurance and lease expense from continuing operations were comprised of the following
(in thousands):
Year Ended December 31, | |||||||||||
2016 | 2015 | 2014 | |||||||||
Hotel lease expense(a) | $ | 4,896 | $ | 7,107 | $ | 31,635 | |||||
Land lease expense(b) | 14,220 | 15,458 | 12,338 | ||||||||
Real estate and other taxes | 30,556 | 29,469 | 31,113 | ||||||||
Property insurance, general liability insurance and other | 7,645 | 7,173 | 9,180 | ||||||||
Total taxes, insurance and lease expense | $ | 57,317 | $ | 59,207 | $ | 84,266 | |||||
(a) | We record hotel lease expense for the consolidated operating lessees of hotels owned by unconsolidated entities and partially offset this expense through noncontrolling interests in other partnerships (generally 49%). We record our 50% share of the corresponding lease income through equity in income from unconsolidated entities. Hotel lease expense includes percentage rent of $1.7 million, $3.4 million and $17.3 million for the years ended December 31, 2016, 2015, and 2014, respectively, and reflects a decrease attributable to the unwinding of our 10-hotel unconsolidated joint ventures in July 2014. |
(b) | We include in land lease expense percentage rent of $5.8 million, $5.7 million and $4.5 million for the years ended December 31, 2016, 2015, and 2014, respectively. |
16. Land Leases and Hotel Rent
We lease land occupied by certain hotels from third parties under various operating leases that expire through 2090. Certain land leases contain contingent rent features based on gross revenue at the respective hotels. In addition, we recognize rent expense for one hotel that is owned by an unconsolidated entity and is leased to our consolidated lessee. These leases require the payment of base rents and contingent rent based on revenues at the respective hotels. Future minimum lease payments under our land lease obligations and hotel leases at December 31, 2016, were as follows (in thousands):
Year | |||
2017 | $ | 8,463 | |
2018 | 7,807 | ||
2019 | 5,808 | ||
2020 | 5,819 | ||
2021 | 5,830 | ||
2022 and thereafter | 203,532 | ||
$ | 237,259 | ||
92
FELCOR LODGING TRUST INCORPORATED AND FELCOR LODGING LIMITED PARTNERSHIP
NOTES TO CONSOLIDATED FINANCIAL STATEMENTS
17. Income (Loss) Per Share/Unit
The following tables set forth the computation of basic and diluted income (loss) per share/unit (in thousands, except per share/unit data):
FelCor Income (Loss) Per Share
Year Ended December 31, | |||||||||||
2016 | 2015 | 2014 | |||||||||
Numerator: | |||||||||||
Net income (loss) attributable to FelCor | $ | 3,498 | $ | (8,865 | ) | $ | 92,099 | ||||
Discontinued operations attributable to FelCor | 3,118 | (674 | ) | 359 | |||||||
Income (loss) from continuing operations attributable to FelCor | 6,616 | (9,539 | ) | 92,458 | |||||||
Less: Preferred dividends | (25,115 | ) | (30,138 | ) | (38,712 | ) | |||||
Less: Redemption of preferred stock | — | (6,096 | ) | — | |||||||
Less: Dividends declared on unvested restricted stock | (129 | ) | (56 | ) | (8 | ) | |||||
Less: Undistributed earnings allocated to unvested restricted stock | — | — | (20 | ) | |||||||
Numerator for continuing operations attributable to FelCor common stockholders | (18,628 | ) | (45,829 | ) | 53,718 | ||||||
Discontinued operations attributable to FelCor | (3,118 | ) | 674 | (359 | ) | ||||||
Numerator for basic and diluted income (loss) attributable to FelCor common stockholders | $ | (21,746 | ) | $ | (45,155 | ) | $ | 53,359 | |||
Denominator: | |||||||||||
Denominator for basic income (loss) per share | 138,128 | 137,730 | 124,158 | ||||||||
FelCor restricted stock units, less shares assumed purchased at market | — | — | 734 | ||||||||
Denominator for diluted income (loss) per share | 138,128 | 137,730 | 124,892 | ||||||||
Basic and diluted income (loss) per share data: | |||||||||||
Income (loss) from continuing operations | $ | (0.13 | ) | $ | (0.33 | ) | $ | 0.43 | |||
Discontinued operations | $ | (0.02 | ) | $ | — | $ | — | ||||
Net income (loss) | $ | (0.16 | ) | $ | (0.33 | ) | $ | 0.43 | |||
93
FELCOR LODGING TRUST INCORPORATED AND FELCOR LODGING LIMITED PARTNERSHIP
NOTES TO CONSOLIDATED FINANCIAL STATEMENTS
17. Income (Loss) Per Share/Unit — (continued)
FelCor LP Income (Loss) Per Unit
Year Ended December 31, | |||||||||||
2016 | 2015 | 2014 | |||||||||
Numerator: | |||||||||||
Net income (loss) attributable to FelCor LP | $ | 3,405 | $ | (9,059 | ) | $ | 92,236 | ||||
Discontinued operations attributable to FelCor LP | 3,131 | (677 | ) | 360 | |||||||
Income (loss) from continuing operations attributable to FelCor LP | 6,536 | (9,736 | ) | 92,596 | |||||||
Less: Preferred distributions | (25,115 | ) | (30,138 | ) | (38,712 | ) | |||||
Less: Redemption of preferred units | — | (6,096 | ) | — | |||||||
Less: Distributions declared on FelCor unvested restricted stock | (129 | ) | (56 | ) | (8 | ) | |||||
Less: Undistributed earnings allocated to FelCor unvested restricted stock | — | — | (20 | ) | |||||||
Numerator for continuing operations attributable to FelCor LP common unitholders | (18,708 | ) | (46,026 | ) | 53,856 | ||||||
Discontinued operations attributable to FelCor LP | (3,131 | ) | 677 | (360 | ) | ||||||
Numerator for basic and diluted income (loss) attributable to FelCor LP common unitholders | $ | (21,839 | ) | $ | (45,349 | ) | $ | 53,496 | |||
Denominator: | |||||||||||
Denominator for basic income (loss) per unit | 138,739 | 138,341 | 124,772 | ||||||||
FelCor restricted stock units, less shares assumed purchased at market | — | — | 739 | ||||||||
Denominator for diluted income (loss) per unit | 138,739 | 138,341 | 125,511 | ||||||||
Basic and diluted income (loss) per unit data: | |||||||||||
Income (loss) from continuing operations | $ | (0.13 | ) | $ | (0.33 | ) | $ | 0.43 | |||
Discontinued operations | $ | (0.02 | ) | $ | — | $ | — | ||||
Net income (loss) | $ | (0.16 | ) | $ | (0.33 | ) | $ | 0.43 | |||
The income (loss) from continuing operations attributable to FelCor/FelCor LP share/unit in the above calculations includes the net gain on sale of hotels attributable to FelCor/FelCor LP.
94
FELCOR LODGING TRUST INCORPORATED AND FELCOR LODGING LIMITED PARTNERSHIP
NOTES TO CONSOLIDATED FINANCIAL STATEMENTS
17. Income (Loss) Per Share/Unit — (continued)
Securities that could potentially dilute earnings per share/unit in the future that were not included in the computation of diluted income (loss) per share/unit, because they would have been antidilutive for the periods presented, are as follows (unaudited, in thousands):
Year Ended December 31, | |||||||||
2016 | 2015 | 2014 | |||||||
Series A convertible preferred shares/units | 9,984 | 9,984 | 9,984 | ||||||
FelCor restricted stock units, less shares assumed purchased at the market | 155 | 488 | — | ||||||
Series A preferred dividends (distributions) that would be excluded from net income (loss) attributable to FelCor common stockholders (or FelCor LP common unitholders), if these preferred shares/units were dilutive, were $25.1 million for all periods presented.
We grant our executive officers restricted stock units each year, which provides them with the potential to earn shares of our common stock. We amortize the fixed cost of these grants over the vesting period. We calculate the potential dilutive impact of these awards on our earnings per share using the treasury stock method.
18. Commitments and Contingencies
Our property insurance has a $100,000 “all-risk” deductible and a 5% deductible (insured value) for named windstorm coverage and for California earthquake coverage. Substantial uninsured or not fully insured losses would have a material adverse impact on our operating results, cash flows and financial condition. Catastrophic losses, such as the losses caused by hurricanes in 2005, could make the cost of insuring against these types of losses prohibitively expensive or difficult to find. In an effort to limit the cost of insurance, we purchase catastrophic insurance coverage based on probable maximum losses based on 250-year events. We have established a self-insured retention of $250,000 per occurrence for general liability insurance with regard to 32 of our hotels. The remainder of our hotels participate in general liability programs sponsored by our managers, with no deductible.
Our hotels are operated under various management agreements that call for minimum base management fees, which generally range from 2 to 3% of total revenue, with the exception of our IHG-managed hotel, where base management fees are 2% of total revenue plus 5% of room revenue. Most of our management agreements also provide for incentive management fees that are subordinated to our return on investment. In addition, the management agreements generally require us to invest approximately 3 to 5% of revenues for capital expenditures. The management agreements generally have terms from 5 to 20 years and generally have renewal options.
The management agreements governing the operations of 32 of our Consolidated Hotels contain the right and license to operate the hotels under the specified brands. The remaining six Consolidated Hotels operate under franchise or license agreements that are separate from our management agreements. Typically, our franchise or license agreements provide for a license fee, or royalty, of 4 to 5.5% of room revenues. In the event
95
FELCOR LODGING TRUST INCORPORATED AND FELCOR LODGING LIMITED PARTNERSHIP
NOTES TO CONSOLIDATED FINANCIAL STATEMENTS
18. Commitments and Contingencies - (continued)
we breach one of these agreements, in addition to losing the right to use the brand name for the operation of the applicable hotel, we may be liable, under certain circumstances, for liquidated damages (generally equal to the fees paid to the franchisor with respect to that hotel during the three immediately preceding years).
At December 31, 2016, we have $26.2 million in purchase obligations related to planned renovations at our hotels, most of which we expect to spend in 2017.
One of our consolidated subsidiaries was engaged in a commercial dispute with a third party that related to circumstances that arose prior to December 31, 2014. Under generally accepted accounting principles, we recorded $5.9 million in other expenses in 2014 to establish a provision for our estimate of our maximum exposure for this contingency. We paid the disputed amount in January 2015 but continued asserting our contractual rights. In June 2015, we settled the commercial dispute and recovered $3.7 million (net of legal costs), which we have recorded in other revenue for the year ended December 31, 2015.
In April 2016, an affiliate of InterContinental Hotels Group PLC, or IHG, which had formerly operated three hotels on our behalf (two of which we sold in 2006, and one of which we converted to Wyndham operation and brand in 2013), notified us that the pension fund in which the employees at those hotels had participated has assessed $8.3 million in withdrawal liability in connection with the termination of IHG’s operation of those hotels. Under our hotel management agreements with IHG, we may be obligated to indemnify and hold IHG harmless for some or all of any amount ultimately contributed to the pension fund with respect to these hotels.
Because of the rules and regulations governing the pension trust, we have paid $1.1 million to the pension trust during 2016 and expect to continue making such payments, on a quarterly basis, while the dispute is ongoing, subject to an overall contribution limit corresponding to the amount sought by the pension trust. While we aggressively oppose the pension trust’s position, we believe that resolution of this matter may not occur until mid-2018. Accordingly, we have recorded the $1.1 million in payments made in 2016 and accrued for seven more quarterly payments (approximately $2.0 million) that would be made if the dispute remains unresolved until mid-2018 as a loss on the sale of hotels included in discontinued operations (because it primarily relates to hotels sold prior to 2013).
Despite these payments and accruals, we believe that (i) the pension trust was in error in assessing the withdrawal liability in this situation and (ii) even if the pension trust was not in error, we are not responsible for a significant portion (or perhaps any) of the withdrawal liability assessed by the pension trust for other reasons and that we are likely to recover a significant portion (if not all) of what we have paid, and may pay in the future, to the pension trust with respect to its claim. Consequently, we are vigorously disputing the underlying claims and, if appropriate, IHG’s demand for indemnification. The matter involves significant legal, actuarial and factual analysis with respect to each hotel, and we have not determined whether any loss to us is probable or that any such loss is estimable (other than the payments and accrual noted in the previous paragraph, for which we intend to seek recovery).
There is no other litigation pending or known to be threatened against us or affecting any of our hotels, other than claims arising in the ordinary course of business or which are not considered to be material. Furthermore, most of these claims are substantially covered by insurance. We do not believe that any claims known to us, individually or in the aggregate, will have a material adverse effect on us.
96
FELCOR LODGING TRUST INCORPORATED AND FELCOR LODGING LIMITED PARTNERSHIP
NOTES TO CONSOLIDATED FINANCIAL STATEMENTS
19. Supplemental Cash Flow Disclosure
In 2016 and 2014, we allocated $8,600 and $55,700, respectively, of noncontrolling interests to additional paid-in capital with regard to the exchange of 1,279 and 6,080 units, respectively, for common stock.
For the year ended December 31, 2016, our repayment of borrowings consisted of payments on our line of credit of $156.0 million and normal recurring principal payments of $2.7 million.
For the year ended December 31, 2015, our repayment of borrowings consisted of debt retirement of $880.5 million, payments on our line of credit of $314.5 million, payments on the cash collateralized tranche of our Knickerbocker loan of $6.3 million and normal recurring principal payments of $2.6 million.
For the year ended December 31, 2014, our repayment of borrowings consisted of debt retirement of $310.2 million, payments on our line of credit of $251.0 million, payments on the cash collateralized tranche of our Knickerbocker loan of $58.6 million and normal recurring principal payments of $3.3 million.
For the years ended December 31, 2016, 2015, and 2014, the changes in accrued expenses and other liabilities related to investment in hotels and hotel development were a decrease of $4.5 million, an increase of $2.7 million, and a decrease of $11.3 million, respectively.
20. FelCor Stock Based Compensation Plans
FelCor sponsors a restricted stock and stock option plan, or the Plan. FelCor is authorized to issue up to 6,100,000 shares of common stock under the Plan pursuant to awards granted in the form of incentive stock options, non-qualified stock options, restricted stock and restricted stock units. Stock-based grants vest subject to time-based or performance-based vesting. There were 4,085,899 shares available for grant under the Plan at December 31, 2016.
FelCor Restricted Stock and Restricted Stock Units
A summary of the status of FelCor’s restricted stock and restricted stock unit grants as of December 31, 2016, 2015 and 2014, and the changes during these years is presented below:
2016 | 2015 | 2014 | ||||||||||||||||||
Shares | Weighted Average Fair Market Value at Grant | Shares | Weighted Average Fair Market Value at Grant | Shares | Weighted Average Fair Market Value at Grant | |||||||||||||||
Shares unvested at beginning of the year | 1,830,123 | $ | 6.79 | 1,509,519 | $ | 5.70 | 1,270,000 | $ | 4.12 | |||||||||||
Granted: | ||||||||||||||||||||
With up to 5-year pro rata vesting | 1,207,926 | $ | 6.24 | 1,116,394 | $ | 8.14 | 1,036,252 | $ | 6.70 | |||||||||||
Forfeited | (396,148 | ) | $ | 6.04 | (2,250 | ) | $ | 9.62 | (2,250 | ) | $ | 9.62 | ||||||||
Vested | (771,508 | ) | $ | 7.72 | (793,540 | ) | $ | 6.61 | (794,483 | ) | $ | 4.46 | ||||||||
Shares unvested at end of the year | 1,870,393 | $ | 6.21 | 1,830,123 | $ | 6.79 | 1,509,519 | $ | 5.70 | |||||||||||
97
FELCOR LODGING TRUST INCORPORATED AND FELCOR LODGING LIMITED PARTNERSHIP
NOTES TO CONSOLIDATED FINANCIAL STATEMENTS
20. FelCor Stock Based Compensation Plans - (continued)
Our executive officers were granted market based restricted stock units providing them with the potential to earn common shares based on total stockholder return relative to a group of 10 lodging REIT peers. These awards granted in 2013 through 2015 vest in three increments over four years. Market based awards granted to our executive officers in 2016 cliff vest in three years. Fair value of our market based restricted stock units estimates are based on a Monte Carlo simulation.
The assumptions used in this simulation include the following:
2016 | 2015 | 2014 | |||||||||
Annual volatility(a) | 45.92 | % | 48.11 | % | 53.78 | % | |||||
Dividend rate(b) | $ | 0.05 | $ | 0.04 | $ | 0.02 | |||||
Risk-free rate | 0.93 | % | 1.32 | % | 1.13 | % | |||||
(a) Based on share price history.
(b) Based on dividend rate at time of award.
Our executive officers were also granted time-based restricted stock unit awards in 2016 that vest in three equal increments over three years. Other employees have received time-based restricted stock awards that vest in equal increments over three years to five years.
Our executive officers also received financial performance based awards in 2016, however the three-year performance requirement for vesting has not yet been established. As such, these awards do not yet have a grant date and no expense has been recorded for financial statement purposes.
The fixed cost of market and time based grants is amortized over the vesting period. The unearned compensation cost of FelCor’s granted but unvested restricted stock and units was $5.1 million and $6.9 million,
as of December 31, 2016 and 2015, respectively. The weighted average period over which the December 31, 2016 cost is to be amortized is approximately one year. Amortization expense for fixed stock compensation related to FelCor’s restricted stock and units was $5.0 million, $5.1 million, and $3.7 million for the years ended December 31, 2016, 2015 and 2014, respectively.
The restricted stock unit grant also provides that to the extent any of these executive officers earn more shares than allowed under the plan upon vesting of this grant, the excess is settled in cash. To the extent there is excess likely to settle in cash, these awards are accounted for as liability awards, the fair value of which is remeasured at the end of each reporting period. We paid $3.3 million in 2016 and $1.9 million in 2015 for the excess cash settlements for vested awards. The liability accrued for these awards expected to be settled in cash was $1.0 million and $2.6 million as of December 31, 2016 and 2015, respectively. Amortization expense for our variable stock compensation was $450,000, $798,000, and $2.7 million for the years ended December 31, 2016, 2015 and 2014, respectively.
21. Employee Benefits
FelCor offers a 401(k) retirement savings plan and health insurance benefits to its employees. FelCor’s matching contribution to our 401(k) plan totaled approximately $1.0 million during 2016 and 2015 and $948,000 for 2014. Health insurance benefits cost $1.4 million for the year ended December 31, 2016, $1.3 million for 2015, and $1.2 million for 2014.
98
FELCOR LODGING TRUST INCORPORATED AND FELCOR LODGING LIMITED PARTNERSHIP
NOTES TO CONSOLIDATED FINANCIAL STATEMENTS
21. Employee Benefits — (continued)
During the years ended December 31, 2016 and 2015, we recorded severance charges of $6.9 million (including $2.9 million of equity based charges) and $3.7 million (including $1.4 million of equity based charges), respectively. The charges are included in other expenses and primarily relate to FelCor’s former chief executive officer for 2016 and certain other officers for 2015.
FelCor LP has no employees, and FelCor, as FelCor LP’s sole general partner, performs FelCor LP’s management functions.
The employees at our hotels are employees of the respective management companies. Under the management agreements, we reimburse the management companies for the compensation and benefits related to the employees who work at our hotels. We are not, however, the sponsors of their employee benefit plans.
22. Segment Information
We have determined that our business is conducted in one operating segment because of the similar economic characteristics of our hotels.
The following table sets forth revenues from continuing operations and investment in hotel assets represented by the following geographical areas (in thousands):
Revenue For the Year Ended December 31, | Investment in Hotel Assets as of December 31, | |||||||||||||||||||
2016 | 2015 | 2014 | 2016 | 2015 | ||||||||||||||||
California | $ | 293,002 | $ | 299,422 | $ | 277,458 | $ | 312,222 | $ | 410,009 | ||||||||||
Florida | 136,789 | 138,055 | 135,972 | 223,362 | 215,657 | |||||||||||||||
Massachusetts | 93,037 | 93,685 | 85,665 | 152,462 | 162,875 | |||||||||||||||
New York | 72,966 | 51,649 | 33,916 | 431,724 | 469,489 | |||||||||||||||
South Carolina | 64,783 | 63,258 | 58,398 | 114,339 | 112,038 | |||||||||||||||
Other states | 206,377 | 240,185 | 321,792 | 332,714 | 359,463 | |||||||||||||||
Canada | — | — | 8,386 | — | — | |||||||||||||||
Total | $ | 866,954 | $ | 886,254 | $ | 921,587 | $ | 1,566,823 | $ | 1,729,531 | ||||||||||
99
FELCOR LODGING TRUST INCORPORATED AND FELCOR LODGING LIMITED PARTNERSHIP
NOTES TO CONSOLIDATED FINANCIAL STATEMENTS
23. Quarterly Operating Results (unaudited)
Our unaudited consolidated quarterly operating data for the years ended December 31, 2016 and 2015 follows (in thousands, except per share/unit data). In the opinion of management, all adjustments (consisting of normal recurring accruals) necessary for a fair presentation of quarterly results have been reflected in the data. It is also management’s opinion, however, that quarterly operating data for hotel enterprises is not indicative of results to be achieved in succeeding quarters or years. In order to obtain a more accurate indication of performance, there should be a review of operating results, changes in stockholders’ equity (or partners’ capital) and cash flows for a period of several years.
FelCor
2016 | First Quarter | Second Quarter | Third Quarter | Fourth Quarter | ||||||||||||
Total revenues | $ | 210,144 | $ | 237,906 | $ | 222,981 | $ | 195,923 | ||||||||
Income (loss) from continuing operations | $ | (4,367 | ) | $ | 14,400 | $ | (9,761 | ) | $ | 730 | ||||||
Discontinued operations | $ | — | $ | — | $ | (3,131 | ) | $ | — | |||||||
Net income (loss) attributable to FelCor | $ | (4,922 | ) | $ | 13,391 | $ | (5,099 | ) | $ | 128 | ||||||
Net income (loss) attributable to FelCor common stockholders | $ | (11,201 | ) | $ | 7,112 | $ | (11,378 | ) | $ | (6,150 | ) | |||||
Comprehensive income (loss) attributable to FelCor | $ | (4,922 | ) | $ | 13,391 | $ | (5,099 | ) | $ | 128 | ||||||
Basic and diluted per common share data: | ||||||||||||||||
Net income (loss) from continuing operations | $ | (0.08 | ) | $ | 0.05 | $ | (0.06 | ) | $ | (0.04 | ) | |||||
Discontinued operations | $ | — | $ | — | $ | (0.02 | ) | $ | — | |||||||
Net income (loss) | $ | (0.08 | ) | $ | 0.05 | $ | (0.08 | ) | $ | (0.04 | ) | |||||
Basic weighted average common shares outstanding | 139,678 | 138,182 | 137,464 | 137,244 | ||||||||||||
Diluted weighted average common shares outstanding | 139,678 | 138,678 | 137,464 | 137,244 | ||||||||||||
2015 | First Quarter | Second Quarter | Third Quarter | Fourth Quarter | ||||||||||||
Total revenues | $ | 213,695 | $ | 241,103 | $ | 225,152 | $ | 206,304 | ||||||||
Loss from continuing operations | $ | (4,895 | ) | $ | (2,614 | ) | $ | (11,785 | ) | $ | (4,266 | ) | ||||
Discontinued operations | $ | 4 | $ | (83 | ) | $ | 498 | $ | 250 | |||||||
Net income (loss) attributable to FelCor | $ | 6,783 | $ | (3,284 | ) | $ | (8,208 | ) | $ | (4,156 | ) | |||||
Net loss attributable to FelCor common stockholders | $ | (2,895 | ) | $ | (17,283 | ) | $ | (14,487 | ) | $ | (10,434 | ) | ||||
Comprehensive income (loss) attributable to FelCor | $ | 6,783 | $ | (3,284 | ) | $ | (8,208 | ) | $ | (4,156 | ) | |||||
Basic and diluted per common share data: | ||||||||||||||||
Net loss from continuing operations | $ | (0.02 | ) | $ | (0.12 | ) | $ | (0.10 | ) | $ | (0.07 | ) | ||||
Basic weighted average common shares outstanding | 124,519 | 140,322 | 142,982 | 142,823 | ||||||||||||
Diluted weighted average common shares outstanding | 124,519 | 140,322 | 142,982 | 142,823 | ||||||||||||
100
FELCOR LODGING TRUST INCORPORATED AND FELCOR LODGING LIMITED PARTNERSHIP
NOTES TO CONSOLIDATED FINANCIAL STATEMENTS
23. Quarterly Operating Results (unaudited) – (continued)
FelCor LP
2016 | First Quarter | Second Quarter | Third Quarter | Fourth Quarter | ||||||||||||
Total revenues | $ | 210,144 | $ | 237,906 | $ | 222,981 | $ | 195,923 | ||||||||
Income (loss) from continuing operations | $ | (4,367 | ) | $ | 14,400 | $ | (9,761 | ) | $ | 730 | ||||||
Discontinued operations | $ | — | $ | — | $ | (3,131 | ) | $ | — | |||||||
Net income (loss) attributable to FelCor LP | $ | (4,970 | ) | $ | 13,422 | $ | (5,149 | ) | $ | 102 | ||||||
Net income (loss) attributable to FelCor LP common unitholders | $ | (11,249 | ) | $ | 7,143 | $ | (11,428 | ) | $ | (6,176 | ) | |||||
Comprehensive income (loss) attributable to FelCor LP | $ | (4,970 | ) | $ | 13,422 | $ | (5,149 | ) | $ | 102 | ||||||
Basic and diluted per common unit data: | ||||||||||||||||
Net income (loss) from continuing operations | $ | (0.08 | ) | $ | 0.05 | $ | (0.06 | ) | $ | (0.04 | ) | |||||
Discontinued operations | $ | — | $ | — | $ | (0.02 | ) | $ | — | |||||||
Net income (loss) | $ | (0.08 | ) | $ | 0.05 | $ | (0.08 | ) | $ | (0.04 | ) | |||||
Basic weighted average common units outstanding | 140,289 | 138,793 | 138,075 | 137,854 | ||||||||||||
Diluted weighted average common units outstanding | 140,289 | 139,289 | 138,075 | 137,854 | ||||||||||||
2015 | First Quarter | Second Quarter | Third Quarter | Fourth Quarter | ||||||||||||
Total revenues | $ | 213,695 | $ | 241,103 | $ | 225,152 | $ | 206,304 | ||||||||
Loss from continuing operations | $ | (4,895 | ) | $ | (2,614 | ) | $ | (11,785 | ) | $ | (4,266 | ) | ||||
Discontinued operations | $ | 4 | $ | (83 | ) | $ | 498 | $ | 250 | |||||||
Net income (loss) attributable to FelCor LP | $ | 6,769 | $ | (3,359 | ) | $ | (8,269 | ) | $ | (4,200 | ) | |||||
Net loss attributable to FelCor LP common unitholders | $ | (2,909 | ) | $ | (17,358 | ) | $ | (14,548 | ) | $ | (10,478 | ) | ||||
Comprehensive income (loss) attributable to FelCor LP | $ | 6,769 | $ | (3,359 | ) | $ | (8,269 | ) | $ | (4,200 | ) | |||||
Basic and diluted per common unit data: | ||||||||||||||||
Net loss from continuing operations | $ | (0.02 | ) | $ | (0.12 | ) | $ | (0.10 | ) | $ | (0.07 | ) | ||||
Basic weighted average common units outstanding | 125,130 | 140,933 | 143,594 | 143,434 | ||||||||||||
Diluted weighted average common units outstanding | 125,130 | 140,933 | 143,594 | 143,434 | ||||||||||||
101
FELCOR LODGING TRUST INCORPORATED AND FELCOR LODGING LIMITED PARTNERSHIP
NOTES TO CONSOLIDATED FINANCIAL STATEMENTS
24. Recently Issued Accounting Standards
In May 2014, the FASB issued ASU 2014-09, Revenue from Contracts with Customers. ASU 2014-09 is a comprehensive new revenue recognition model requiring a company to recognize revenue to depict the transfer of goods or services to a customer at an amount reflecting the consideration it expects to receive in exchange for those goods or services. In adopting ASU 2014-09, companies may use either a full retrospective or a modified retrospective approach.
Additionally, this guidance requires improved disclosures regarding the nature, amount, timing and uncertainty of revenue and cash flows arising from contracts with customers. ASU 2014-09 is effective for the first interim period within annual reporting periods beginning after December 15, 2017, and early adoption is permitted but not before the original effective date (for annual reporting periods beginning after December 15, 2016). The Company expects to adopt this guidance on January 1, 2018, on a modified retrospective basis. Based on the company’s assessment of this standard, it is not expected to have a material effect on the amount of revenue, or the timing of recognizing revenue, from our hotel operations.
In February 2016, the FASB issued ASU 2016-02 - Leases (ASC 842), which sets out the principles for the recognition, measurement, presentation and disclosure of leases for both parties to a contract (i.e., lessees and lessors). The new standard requires lessees to apply a dual approach, classifying leases as either finance or operating leases based on the principle of whether or not the lease is effectively a financed purchase by the lessee. This classification will determine whether lease expense is recognized based on an effective interest method or on a straight-line basis over the term of the lease. A lessee is also required to record a right-of-use asset and a lease liability for all leases with a term of greater than 12 months regardless of their classification. Leases with a term of 12 months or less will be accounted for similar to existing guidance for operating leases today. The new standard requires lessors to account for leases using an approach that is substantially equivalent to existing guidance for sales-type leases, direct financing leases and operating leases. The ASU is expected to impact our consolidated financial statements as we have certain operating lease arrangements. ASC 842 supersedes the previous leases standard, ASC 840 Leases. The standard is effective on January 1, 2019, with early adoption permitted. While we are still in the process of evaluating the impact of this new guidance, we do expect that the application of this standard will result in the recording of a right-of-use asset and a related lease liability on our ground leases.
In August 2016, the Financial Accounting Standards Board (FASB) issued ASU No. 2016-18, Restricted Cash, which addresses classification issues related to the statement of cash flows which may impact our classification of cash activity related to restricted cash. The standard is effective for fiscal years beginning after December 15, 2017, with early adoption permitted.
102
FELCOR LODGING TRUST INCORPORATED AND FELCOR LODGING LIMITED PARTNERSHIP
NOTES TO CONSOLIDATED FINANCIAL STATEMENTS
25. | FelCor LP’s Consolidating Financial Information |
Certain of FelCor LP’s 100% owned subsidiaries (FCH/PSH, L.P.; FelCor/CMB Buckhead Hotel, L.L.C.; FelCor/CMB Marlborough Hotel, L.L.C.; FelCor/CMB Orsouth Holdings, L.P.; FelCor/CMB SSF Holdings, L.P.; FelCor/CSS Holdings, L.P.; FelCor Dallas Love Field Owner, L.L.C.; FelCor Milpitas Owner, L.L.C.; FelCor TRS Borrower 4, L.L.C.; FelCor TRS Holdings, L.L.C.; FelCor Hotel Asset Company, L.L.C.; FelCor St. Pete (SPE), L.L.C.; FelCor Esmeralda (SPE), L.L.C.; FelCor S-4 Hotels (SPE), L.L.C.; Madison 237 Hotel, L.L.C.; Myrtle Beach Owner, L.L.C.; and Royalton 44 Hotel, L.L.C., collectively, “Subsidiary Guarantors”), together with FelCor, guaranty, fully and unconditionally, except where subject to customary release provisions as described below, and jointly and severally, our senior debt.
The guaranties by the Subsidiary Guarantors may be automatically and unconditionally released upon (i) the sale or other disposition of all of the capital stock of the Subsidiary Guarantor or the sale or disposition of all or substantially all of the assets of the Subsidiary Guarantor, if, in each case, as a result of such sale or disposition, such Subsidiary Guarantor ceases to be a subsidiary of FelCor LP, (ii) the consolidation or merger of any such Subsidiary Guarantor with any person other than FelCor LP, or a subsidiary of FelCor LP, if, as a result of such consolidation or merger, such Subsidiary Guarantor ceases to be a subsidiary of FelCor LP, (iii) a legal defeasance or covenant defeasance of the indenture, (iv) the unconditional and complete release of such Subsidiary Guarantor in accordance with the modification and waiver provisions of the indenture, or (v) the designation of a restricted subsidiary that is a Subsidiary Guarantor as an unrestricted subsidiary under and in compliance with the indenture.
103
FELCOR LODGING TRUST INCORPORATED AND FELCOR LODGING LIMITED PARTNERSHIP
NOTES TO CONSOLIDATED FINANCIAL STATEMENTS
25. | FelCor LP’s Consolidating Financial Information - (continued) |
The following tables present consolidating information for the Subsidiary Guarantors.
FELCOR LODGING LIMITED PARTNERSHIP
CONSOLIDATING BALANCE SHEET
December 31, 2016
(in thousands)
FelCor LP | Subsidiary Guarantors | Non-Guarantor Subsidiaries | Eliminations | Total Consolidated | |||||||||||||||
Net investment in hotels | $ | — | $ | 488,528 | $ | 1,078,295 | $ | — | $ | 1,566,823 | |||||||||
Equity investment in consolidated entities | 1,190,737 | — | — | (1,190,737 | ) | — | |||||||||||||
Investment in unconsolidated entities | 2,410 | 4,800 | 1,102 | — | 8,312 | ||||||||||||||
Cash and cash equivalents | 13,532 | 29,141 | 4,644 | — | 47,317 | ||||||||||||||
Restricted cash | — | 16,433 | 3,058 | — | 19,491 | ||||||||||||||
Accounts receivable, net | 2,804 | 33,338 | 5,938 | — | 42,080 | ||||||||||||||
Deferred expenses, net | — | — | 4,527 | — | 4,527 | ||||||||||||||
Other assets | 5,634 | 10,009 | 2,899 | — | 18,542 | ||||||||||||||
Total assets | $ | 1,215,117 | $ | 582,249 | $ | 1,100,463 | $ | (1,190,737 | ) | $ | 1,707,092 | ||||||||
Debt, net | $ | 985,767 | $ | — | $ | 391,995 | $ | (39,436 | ) | $ | 1,338,326 | ||||||||
Distributions payable | 14,734 | — | 124 | — | 14,858 | ||||||||||||||
Accrued expenses and other liabilities | 28,431 | 79,439 | 8,567 | — | 116,437 | ||||||||||||||
Total liabilities | 1,028,932 | 79,439 | 400,686 | (39,436 | ) | 1,469,621 | |||||||||||||
Redeemable units, at redemption value | 4,888 | — | — | — | 4,888 | ||||||||||||||
Preferred units | 309,337 | — | — | — | 309,337 | ||||||||||||||
Common units | (128,040 | ) | 503,765 | 647,536 | (1,151,301 | ) | (128,040 | ) | |||||||||||
Total FelCor LP partners’ capital | 181,297 | 503,765 | 647,536 | (1,151,301 | ) | 181,297 | |||||||||||||
Noncontrolling interests | — | (955 | ) | 8,458 | — | 7,503 | |||||||||||||
Preferred capital in consolidated joint venture | — | — | 43,783 | — | 43,783 | ||||||||||||||
Total partners’ capital | 181,297 | 502,810 | 699,777 | (1,151,301 | ) | 232,583 | |||||||||||||
Total liabilities and partners’ capital | $ | 1,215,117 | $ | 582,249 | $ | 1,100,463 | $ | (1,190,737 | ) | $ | 1,707,092 | ||||||||
104
FELCOR LODGING TRUST INCORPORATED AND FELCOR LODGING LIMITED PARTNERSHIP
NOTES TO CONSOLIDATED FINANCIAL STATEMENTS
25. | FelCor LP’s Consolidating Financial Information — (continued) |
FELCOR LODGING LIMITED PARTNERSHIP
CONSOLIDATING BALANCE SHEET
December 31, 2015
(in thousands)
FelCor LP | Subsidiary Guarantors | Non-Guarantor Subsidiaries | Eliminations | Total Consolidated | |||||||||||||||
Net investment in hotels | $ | — | $ | 625,835 | $ | 1,103,696 | $ | — | $ | 1,729,531 | |||||||||
Equity investment in consolidated entities | 1,260,779 | — | — | (1,260,779 | ) | — | |||||||||||||
Investment in unconsolidated entities | 4,440 | 3,871 | 1,264 | — | 9,575 | ||||||||||||||
Cash and cash equivalents | 21,219 | 33,873 | 4,694 | — | 59,786 | ||||||||||||||
Restricted cash | — | 15,442 | 2,260 | — | 17,702 | ||||||||||||||
Accounts receivable, net | 644 | 25,575 | 1,917 | — | 28,136 | ||||||||||||||
Deferred expenses, net | — | — | 6,390 | — | 6,390 | ||||||||||||||
Other assets | 3,587 | 8,786 | 2,419 | — | 14,792 | ||||||||||||||
Total assets | $ | 1,290,669 | $ | 713,382 | $ | 1,122,640 | $ | (1,260,779 | ) | $ | 1,865,912 | ||||||||
Debt, net | $ | 984,226 | $ | — | $ | 465,099 | $ | (39,436 | ) | $ | 1,409,889 | ||||||||
Distributions payable | 15,016 | — | 124 | — | 15,140 | ||||||||||||||
Accrued expenses and other liabilities | 26,810 | 83,787 | 14,677 | — | 125,274 | ||||||||||||||
Total liabilities | 1,026,052 | 83,787 | 479,900 | (39,436 | ) | 1,550,303 | |||||||||||||
Redeemable units, at redemption value | 4,464 | — | — | — | 4,464 | ||||||||||||||
Preferred units | 309,337 | — | — | — | 309,337 | ||||||||||||||
Common units | (49,184 | ) | 630,412 | 590,931 | (1,221,343 | ) | (49,184 | ) | |||||||||||
Total FelCor LP partners’ capital | 260,153 | 630,412 | 590,931 | (1,221,343 | ) | 260,153 | |||||||||||||
Noncontrolling interests | — | (817 | ) | 8,623 | — | 7,806 | |||||||||||||
Preferred capital in consolidated joint venture | — | — | 43,186 | — | 43,186 | ||||||||||||||
Total partners’ capital | 260,153 | 629,595 | 642,740 | (1,221,343 | ) | 311,145 | |||||||||||||
Total liabilities and partners’ capital | $ | 1,290,669 | $ | 713,382 | $ | 1,122,640 | $ | (1,260,779 | ) | $ | 1,865,912 | ||||||||
105
FELCOR LODGING TRUST INCORPORATED AND FELCOR LODGING LIMITED PARTNERSHIP
NOTES TO CONSOLIDATED FINANCIAL STATEMENTS
25. | FelCor LP’s Consolidating Financial Information — (continued) |
FELCOR LODGING LIMITED PARTNERSHIP
CONDENSED CONSOLIDATING STATEMENT OF OPERATIONS
For the Year Ended December 31, 2016
(in thousands)
FelCor LP | Subsidiary Guarantors | Non-Guarantor Subsidiaries | Eliminations | Total Consolidated | |||||||||||||||
Revenues: | |||||||||||||||||||
Hotel operating revenue | $ | — | $ | 862,818 | $ | — | $ | — | $ | 862,818 | |||||||||
Percentage lease revenue | — | — | 134,462 | (134,462 | ) | — | |||||||||||||
Other revenue | 210 | 3,498 | 428 | — | 4,136 | ||||||||||||||
Total revenue | 210 | 866,316 | 134,890 | (134,462 | ) | 866,954 | |||||||||||||
Expenses: | |||||||||||||||||||
Hotel operating expenses | — | 551,165 | — | — | 551,165 | ||||||||||||||
Taxes, insurance and lease expense | 149 | 168,757 | 22,873 | (134,462 | ) | 57,317 | |||||||||||||
Corporate expenses | — | 14,848 | 12,189 | — | 27,037 | ||||||||||||||
Depreciation and amortization | 261 | 45,764 | 68,029 | — | 114,054 | ||||||||||||||
Impairment | — | 26,459 | — | — | 26,459 | ||||||||||||||
Other expenses | 7,266 | 4,830 | 644 | — | 12,740 | ||||||||||||||
Total operating expenses | 7,676 | 811,823 | 103,735 | (134,462 | ) | 788,772 | |||||||||||||
Operating income | (7,466 | ) | 54,493 | 31,155 | — | 78,182 | |||||||||||||
Interest expense, net | (58,265 | ) | 30 | (19,947 | ) | — | (78,182 | ) | |||||||||||
Other gains, net | — | — | 342 | — | 342 | ||||||||||||||
Income before equity in income from unconsolidated entities | (65,731 | ) | 54,523 | 11,550 | — | 342 | |||||||||||||
Equity in income from consolidated entities | 69,540 | — | — | (69,540 | ) | — | |||||||||||||
Equity in income from unconsolidated entities | 1,781 | (202 | ) | (46 | ) | — | 1,533 | ||||||||||||
Income from continuing operations before income tax expense | 5,590 | 54,321 | 11,504 | (69,540 | ) | 1,875 | |||||||||||||
Income tax expense | 559 | (1,586 | ) | 154 | — | (873 | ) | ||||||||||||
Income from continuing operations | 6,149 | 52,735 | 11,658 | (69,540 | ) | 1,002 | |||||||||||||
Loss from discontinued operations | (3,131 | ) | — | — | — | (3,131 | ) | ||||||||||||
Loss before gain on sale of hotels | 3,018 | 52,735 | 11,658 | (69,540 | ) | (2,129 | ) | ||||||||||||
Gain on sale of hotels, net | 387 | 6,450 | (515 | ) | — | 6,322 | |||||||||||||
Net income | 3,405 | 59,185 | 11,143 | (69,540 | ) | 4,193 | |||||||||||||
Loss attributable to noncontrolling interests | — | 520 | 153 | — | 673 | ||||||||||||||
Preferred distributions - consolidated joint venture | — | — | (1,461 | ) | — | (1,461 | ) | ||||||||||||
Net income attributable to FelCor LP | 3,405 | 59,705 | 9,835 | (69,540 | ) | 3,405 | |||||||||||||
Preferred distributions | (25,115 | ) | — | — | — | (25,115 | ) | ||||||||||||
Net loss attributable to FelCor LP common unitholders | $ | (21,710 | ) | $ | 59,705 | $ | 9,835 | $ | (69,540 | ) | $ | (21,710 | ) | ||||||
106
FELCOR LODGING TRUST INCORPORATED AND FELCOR LODGING LIMITED PARTNERSHIP
NOTES TO CONSOLIDATED FINANCIAL STATEMENTS
25. | FelCor LP’s Consolidating Financial Information — (continued) |
FELCOR LODGING LIMITED PARTNERSHIP
CONDENSED CONSOLIDATING STATEMENT OF OPERATIONS
For the Year Ended December 31, 2015
(in thousands)
FelCor LP | Subsidiary Guarantors | Non-Guarantor Subsidiaries | Eliminations | Total Consolidated | |||||||||||||||
Revenues: | |||||||||||||||||||
Hotel operating revenue | $ | — | $ | 878,371 | $ | — | $ | — | $ | 878,371 | |||||||||
Percentage lease revenue | — | — | 126,867 | (126,867 | ) | — | |||||||||||||
Other revenue | 143 | 7,288 | 452 | — | 7,883 | ||||||||||||||
Total revenue | 143 | 885,659 | 127,319 | (126,867 | ) | 886,254 | |||||||||||||
Expenses: | |||||||||||||||||||
Hotel operating expenses | — | 572,259 | — | — | 572,259 | ||||||||||||||
Taxes, insurance and lease expense | 490 | 163,727 | 21,857 | (126,867 | ) | 59,207 | |||||||||||||
Corporate expenses | — | 15,022 | 12,261 | — | 27,283 | ||||||||||||||
Depreciation and amortization | 188 | 49,589 | 64,675 | — | 114,452 | ||||||||||||||
Impairment | — | 20,861 | — | — | 20,861 | ||||||||||||||
Other expenses | 3,995 | 7,451 | 1,033 | — | 12,479 | ||||||||||||||
Total operating expenses | 4,673 | 828,909 | 99,826 | (126,867 | ) | 806,541 | |||||||||||||
Operating income | (4,530 | ) | 56,750 | 27,493 | — | 79,713 | |||||||||||||
Interest expense, net | (57,062 | ) | 11 | (22,067 | ) | — | (79,118 | ) | |||||||||||
Debt extinguishment | (28,459 | ) | — | (2,450 | ) | — | (30,909 | ) | |||||||||||
Other gains, net | — | — | 166 | — | 166 | ||||||||||||||
Loss before equity in income from unconsolidated entities | (90,051 | ) | 56,761 | 3,142 | — | (30,148 | ) | ||||||||||||
Equity in income from consolidated entities | 73,274 | — | — | (73,274 | ) | — | |||||||||||||
Equity in income from unconsolidated entities | 8,368 | (489 | ) | (46 | ) | — | 7,833 | ||||||||||||
Loss from continuing operations before income tax expense | (8,409 | ) | 56,272 | 3,096 | (73,274 | ) | (22,315 | ) | |||||||||||
Income tax expense | (252 | ) | (993 | ) | — | — | (1,245 | ) | |||||||||||
Loss from continuing operations | (8,661 | ) | 55,279 | 3,096 | (73,274 | ) | (23,560 | ) | |||||||||||
Income from discontinued operations | — | 11 | 658 | — | 669 | ||||||||||||||
Loss before gain on sale of hotels | (8,661 | ) | 55,290 | 3,754 | (73,274 | ) | (22,891 | ) | |||||||||||
Gain on sale of hotels, net | (398 | ) | (17 | ) | 19,841 | — | 19,426 | ||||||||||||
Net loss | (9,059 | ) | 55,273 | 23,595 | (73,274 | ) | (3,465 | ) | |||||||||||
Income attributable to noncontrolling interests | — | 769 | (4,926 | ) | — | (4,157 | ) | ||||||||||||
Preferred distributions - consolidated joint venture | — | — | (1,437 | ) | — | (1,437 | ) | ||||||||||||
Net loss attributable to FelCor LP | (9,059 | ) | 56,042 | 17,232 | (73,274 | ) | (9,059 | ) | |||||||||||
Preferred distributions | (30,138 | ) | — | — | — | (30,138 | ) | ||||||||||||
Redemption of preferred units | (6,096 | ) | — | — | — | (6,096 | ) | ||||||||||||
Net loss attributable to FelCor LP common unitholders | $ | (45,293 | ) | $ | 56,042 | $ | 17,232 | $ | (73,274 | ) | $ | (45,293 | ) | ||||||
107
FELCOR LODGING TRUST INCORPORATED AND FELCOR LODGING LIMITED PARTNERSHIP
NOTES TO CONSOLIDATED FINANCIAL STATEMENTS
25. | FelCor LP’s Consolidating Financial Information — (continued) |
FELCOR LODGING LIMITED PARTNERSHIP
CONDENSED CONSOLIDATING STATEMENT OF OPERATIONS
For the Year Ended December 31, 2014
(in thousands)
FelCor LP | Subsidiary Guarantors | Non-Guarantor Subsidiaries | Eliminations | Total Consolidated | |||||||||||||||
Revenues: | |||||||||||||||||||
Hotel operating revenue | $ | — | $ | 917,981 | $ | — | $ | — | $ | 917,981 | |||||||||
Percentage lease revenue | 4,181 | — | 92,936 | (97,117 | ) | — | |||||||||||||
Other revenue | 6 | 3,143 | 457 | — | 3,606 | ||||||||||||||
Total revenue | 4,187 | 921,124 | 93,393 | (97,117 | ) | 921,587 | |||||||||||||
Expenses: | |||||||||||||||||||
Hotel operating expenses | — | 606,113 | — | — | 606,113 | ||||||||||||||
Taxes, insurance and lease expense | 1,267 | 159,600 | 20,516 | (97,117 | ) | 84,266 | |||||||||||||
Corporate expenses | 427 | 16,743 | 12,415 | — | 29,585 | ||||||||||||||
Depreciation and amortization | 2,717 | 55,832 | 57,270 | — | 115,819 | ||||||||||||||
Other expenses | 178 | 12,330 | 5,444 | — | 17,952 | ||||||||||||||
Total operating expenses | 4,589 | 850,618 | 95,645 | (97,117 | ) | 853,735 | |||||||||||||
Operating income | (402 | ) | 70,506 | (2,252 | ) | — | 67,852 | ||||||||||||
Interest expense, net | (71,024 | ) | 6 | (19,677 | ) | — | (90,695 | ) | |||||||||||
Debt extinguishment | (3,823 | ) | — | (947 | ) | — | (4,770 | ) | |||||||||||
Gain on sale of investment in unconsolidated entities, net | 30,176 | — | — | — | 30,176 | ||||||||||||||
Gain from remeasurement of unconsolidated entities, net | 20,737 | — | — | — | 20,737 | ||||||||||||||
Other gains, net | — | 100 | — | — | 100 | ||||||||||||||
Income before equity in income from unconsolidated entities | (24,336 | ) | 70,612 | (22,876 | ) | — | 23,400 | ||||||||||||
Equity in income from consolidated entities | 113,267 | — | — | (113,267 | ) | — | |||||||||||||
Equity in income from unconsolidated entities | 4,682 | 374 | (46 | ) | — | 5,010 | |||||||||||||
Income from continuing operations before income tax expense | 93,613 | 70,986 | (22,922 | ) | (113,267 | ) | 28,410 | ||||||||||||
Income tax expense | (134 | ) | (526 | ) | — | — | (660 | ) | |||||||||||
Income from continuing operations | 93,479 | 70,460 | (22,922 | ) | (113,267 | ) | 27,750 | ||||||||||||
Loss from discontinued operations | — | (146 | ) | (214 | ) | — | (360 | ) | |||||||||||
Income before gain on sale of hotels | 93,479 | 70,314 | (23,136 | ) | (113,267 | ) | 27,390 | ||||||||||||
Gain on sale of hotels, net | (1,243 | ) | (244 | ) | 68,249 | — | 66,762 | ||||||||||||
Net income | 92,236 | 70,070 | 45,113 | (113,267 | ) | 94,152 | |||||||||||||
Income attributable to noncontrolling interests | — | 339 | (1,036 | ) | — | (697 | ) | ||||||||||||
Preferred distributions - consolidated joint venture | — | — | (1,219 | ) | — | (1,219 | ) | ||||||||||||
Net income attributable to FelCor LP | 92,236 | 70,409 | 42,858 | (113,267 | ) | 92,236 | |||||||||||||
Preferred distributions | (38,712 | ) | — | — | — | (38,712 | ) | ||||||||||||
Net income attributable to FelCor LP common unitholders | $ | 53,524 | $ | 70,409 | $ | 42,858 | $ | (113,267 | ) | $ | 53,524 | ||||||||
108
FELCOR LODGING TRUST INCORPORATED AND FELCOR LODGING LIMITED PARTNERSHIP
NOTES TO CONSOLIDATED FINANCIAL STATEMENTS
25. FelCor LP’s Consolidating Financial Information — (continued)
FELCOR LODGING LIMITED PARTNERSHIP
CONDENSED CONSOLIDATING STATEMENT OF COMPREHENSIVE INCOME
For the Year Ended December 31, 2016
(in thousands)
FelCor LP | Subsidiary Guarantors | Non-Guarantor Subsidiaries | Eliminations | Total Consolidated | |||||||||||||||
Net income and comprehensive income | $ | 3,405 | $ | 59,185 | $ | 11,143 | $ | (69,540 | ) | $ | 4,193 | ||||||||
Comprehensive loss attributable to noncontrolling interests | — | 520 | 153 | — | 673 | ||||||||||||||
Preferred distributions - consolidated joint venture | — | — | (1,461 | ) | — | (1,461 | ) | ||||||||||||
Comprehensive income attributable to FelCor LP | $ | 3,405 | $ | 59,705 | $ | 9,835 | $ | (69,540 | ) | $ | 3,405 | ||||||||
FELCOR LODGING LIMITED PARTNERSHIP
CONDENSED CONSOLIDATING STATEMENT OF COMPREHENSIVE LOSS
For the Year Ended December 31, 2015
(in thousands)
FelCor LP | Subsidiary Guarantors | Non-Guarantor Subsidiaries | Eliminations | Total Consolidated | |||||||||||||||
Net loss and comprehensive loss | $ | (9,059 | ) | $ | 55,273 | $ | 23,595 | $ | (73,274 | ) | $ | (3,465 | ) | ||||||
Comprehensive income attributable to noncontrolling interests | — | 769 | (4,926 | ) | — | (4,157 | ) | ||||||||||||
Preferred distributions - consolidated joint venture | — | — | (1,437 | ) | — | (1,437 | ) | ||||||||||||
Comprehensive loss attributable to FelCor LP | $ | (9,059 | ) | $ | 56,042 | $ | 17,232 | $ | (73,274 | ) | $ | (9,059 | ) | ||||||
109
FELCOR LODGING TRUST INCORPORATED AND FELCOR LODGING LIMITED PARTNERSHIP
NOTES TO CONSOLIDATED FINANCIAL STATEMENTS
25. | FelCor LP’s Consolidating Financial Information — (continued) |
FELCOR LODGING LIMITED PARTNERSHIP
CONDENSED CONSOLIDATING STATEMENT OF COMPREHENSIVE INCOME
For the Year Ended December 31, 2014
(in thousands)
FelCor LP | Subsidiary Guarantors | Non-Guarantor Subsidiaries | Eliminations | Total Consolidated | |||||||||||||||
Net income | $ | 92,236 | $ | 70,070 | $ | 45,113 | $ | (113,267 | ) | $ | 94,152 | ||||||||
Foreign currency translation adjustment | (490 | ) | — | (490 | ) | 490 | (490 | ) | |||||||||||
Reclassification of foreign currency translation to gain | (24,553 | ) | — | (24,553 | ) | 24,553 | (24,553 | ) | |||||||||||
Comprehensive income | 67,193 | 70,070 | 20,070 | (88,224 | ) | 69,109 | |||||||||||||
Comprehensive income attributable to noncontrolling interests | — | 339 | (1,036 | ) | — | (697 | ) | ||||||||||||
Preferred distributions - consolidated joint venture | — | — | (1,219 | ) | — | (1,219 | ) | ||||||||||||
Comprehensive income attributable to FelCor LP | $ | 67,193 | $ | 70,409 | $ | 17,815 | $ | (88,224 | ) | $ | 67,193 | ||||||||
110
FELCOR LODGING TRUST INCORPORATED AND FELCOR LODGING LIMITED PARTNERSHIP
NOTES TO CONSOLIDATED FINANCIAL STATEMENTS
25. FelCor LP’s Consolidating Financial Information — (continued)
FELCOR LODGING LIMITED PARTNERSHIP
CONDENSED CONSOLIDATING STATEMENT OF CASH FLOWS
For the Year Ended December 31, 2016
(in thousands)
FelCor LP | Subsidiary Guarantors | Non-Guarantor Subsidiaries | Eliminations | Total Consolidated | |||||||||||||||
Operating activities: | |||||||||||||||||||
Cash flows from operating activities | $ | (65,416 | ) | $ | 115,577 | $ | 84,759 | $ | — | $ | 134,920 | ||||||||
Investing activities: | |||||||||||||||||||
Acquisition of land | — | — | (8,226 | ) | — | (8,226 | ) | ||||||||||||
Improvements and additions to hotels | (11 | ) | (31,309 | ) | (42,944 | ) | — | (74,264 | ) | ||||||||||
Net proceeds from asset dispositions | (1,433 | ) | 102,726 | (323 | ) | — | 100,970 | ||||||||||||
Insurance proceeds | — | — | 341 | — | 341 | ||||||||||||||
Change in restricted cash | — | (992 | ) | (797 | ) | — | (1,789 | ) | |||||||||||
Distributions from unconsolidated entities | 1,586 | — | — | — | 1,586 | ||||||||||||||
Intercompany financing | 149,667 | — | — | (149,667 | ) | — | |||||||||||||
Cash flows from investing activities | 149,809 | 70,425 | (51,949 | ) | (149,667 | ) | 18,618 | ||||||||||||
Financing activities: | |||||||||||||||||||
Proceeds from borrowings | — | — | 85,000 | — | 85,000 | ||||||||||||||
Repayment of borrowings | — | — | (158,662 | ) | — | (158,662 | ) | ||||||||||||
Payment of deferred financing costs | — | — | (12 | ) | — | (12 | ) | ||||||||||||
Distributions paid to noncontrolling interests | — | (14 | ) | (2 | ) | — | (16 | ) | |||||||||||
Contributions from noncontrolling interests | — | 397 | 239 | — | 636 | ||||||||||||||
Net proceeds from issuance of preferred equity-consolidated joint venture | — | — | 597 | — | 597 | ||||||||||||||
Repurchase of common stock | (30,462 | ) | — | — | — | (30,462 | ) | ||||||||||||
Distributions paid to preferred unitholders | (25,115 | ) | — | — | — | (25,115 | ) | ||||||||||||
Distributions paid to common unitholders | (33,606 | ) | — | — | — | (33,606 | ) | ||||||||||||
Intercompany financing | — | (191,117 | ) | 41,450 | 149,667 | — | |||||||||||||
Other | (2,897 | ) | — | (1,461 | ) | — | (4,358 | ) | |||||||||||
Cash flows used in financing activities | (92,080 | ) | (190,734 | ) | (32,851 | ) | 149,667 | (165,998 | ) | ||||||||||
Effect of exchange rate changes on cash | — | — | (9 | ) | — | (9 | ) | ||||||||||||
Change in cash and cash equivalents | (7,687 | ) | (4,732 | ) | (50 | ) | — | (12,469 | ) | ||||||||||
Cash and cash equivalents at beginning of period | 21,219 | 33,873 | 4,694 | — | 59,786 | ||||||||||||||
Cash and cash equivalents at end of period | $ | 13,532 | $ | 29,141 | $ | 4,644 | $ | — | $ | 47,317 | |||||||||
111
FELCOR LODGING TRUST INCORPORATED AND FELCOR LODGING LIMITED PARTNERSHIP
NOTES TO CONSOLIDATED FINANCIAL STATEMENTS
25. FelCor LP’s Consolidating Financial Information — (continued)
FELCOR LODGING LIMITED PARTNERSHIP
CONDENSED CONSOLIDATING STATEMENT OF CASH FLOWS
For the Year Ended December 31, 2015
(in thousands)
FelCor LP | Subsidiary Guarantors | Non-Guarantor Subsidiaries | Eliminations | Total Consolidated | |||||||||||||||
Operating activities: | |||||||||||||||||||
Cash flows from operating activities | $ | (54,129 | ) | $ | 123,302 | $ | 77,490 | $ | — | $ | 146,663 | ||||||||
Investing activities: | |||||||||||||||||||
Improvements and additions to hotels | 242 | (42,039 | ) | (6,639 | ) | — | (48,436 | ) | |||||||||||
Hotel development | — | — | (33,525 | ) | — | (33,525 | ) | ||||||||||||
Net proceeds from asset dispositions | (569 | ) | (669 | ) | 189,187 | — | 187,949 | ||||||||||||
Insurance proceeds | 274 | — | 203 | — | 477 | ||||||||||||||
Distributions from unconsolidated entities | 6,517 | 800 | — | — | 7,317 | ||||||||||||||
Contributions to unconsolidated entities | (15 | ) | — | — | — | (15 | ) | ||||||||||||
Change in restricted cash - investing | — | (3,243 | ) | 6,037 | — | 2,794 | |||||||||||||
Intercompany financing | 184,776 | — | — | (184,776 | ) | — | |||||||||||||
Cash flows from investing activities | 191,225 | (45,151 | ) | 155,263 | (184,776 | ) | 116,561 | ||||||||||||
Financing activities: | |||||||||||||||||||
Proceeds from borrowings | 475,000 | — | 550,438 | — | 1,025,438 | ||||||||||||||
Repayment of borrowings | (545,453 | ) | — | (658,356 | ) | — | (1,203,809 | ) | |||||||||||
Payment of deferred financing costs | (8,505 | ) | — | (6,447 | ) | — | (14,952 | ) | |||||||||||
Distributions paid to noncontrolling interests | — | (444 | ) | (17,151 | ) | — | (17,595 | ) | |||||||||||
Contributions from noncontrolling interests | — | 548 | 2,261 | — | 2,809 | ||||||||||||||
Redemption of preferred units | (169,986 | ) | — | — | — | (169,986 | ) | ||||||||||||
Repurchase of common stock | (14,362 | ) | — | — | — | (14,362 | ) | ||||||||||||
Net proceeds from issuance of preferred equity-consolidated joint venture | — | — | 1,744 | — | 1,744 | ||||||||||||||
Distributions paid to preferred unitholders | (32,404 | ) | — | — | — | (32,404 | ) | ||||||||||||
Distributions paid to common unitholders | (22,385 | ) | — | — | — | (22,385 | ) | ||||||||||||
Net proceeds from common unit issuance | 198,648 | — | — | — | 198,648 | ||||||||||||||
Intercompany financing | — | (76,697 | ) | (108,079 | ) | 184,776 | — | ||||||||||||
Other | (2,147 | ) | — | (1,431 | ) | — | (3,578 | ) | |||||||||||
Cash flows used in financing activities | (121,594 | ) | (76,593 | ) | (237,021 | ) | 184,776 | (250,432 | ) | ||||||||||
Effect of exchange rate changes on cash | — | — | (153 | ) | — | (153 | ) | ||||||||||||
Change in cash and cash equivalents | 15,502 | 1,558 | (4,421 | ) | — | 12,639 | |||||||||||||
Cash and cash equivalents at beginning of period | 5,717 | 32,315 | 9,115 | — | 47,147 | ||||||||||||||
Cash and cash equivalents at end of period | $ | 21,219 | $ | 33,873 | $ | 4,694 | $ | — | $ | 59,786 | |||||||||
112
FELCOR LODGING TRUST INCORPORATED AND FELCOR LODGING LIMITED PARTNERSHIP
NOTES TO CONSOLIDATED FINANCIAL STATEMENTS
25. | FelCor LP’s Consolidating Financial Information — (continued) |
FELCOR LODGING LIMITED PARTNERSHIP
CONDENSED CONSOLIDATING STATEMENT OF CASH FLOWS
For the Year Ended December 31, 2014
(in thousands)
FelCor LP | Subsidiary Guarantors | Non-Guarantor Subsidiaries | Eliminations | Total Consolidated | |||||||||||||||
Operating activities: | |||||||||||||||||||
Cash flows from operating activities | $ | (62,837 | ) | $ | 130,359 | $ | 40,362 | $ | — | $ | 107,884 | ||||||||
Investing activities: | |||||||||||||||||||
Improvements and additions to hotels | (135 | ) | (46,765 | ) | (36,764 | ) | — | (83,664 | ) | ||||||||||
Hotel development | — | — | (86,565 | ) | — | (86,565 | ) | ||||||||||||
Net proceeds from asset dispositions | 6,488 | (55 | ) | 157,185 | — | 163,618 | |||||||||||||
Proceeds from unconsolidated joint venture transaction | 3,154 | — | 878 | — | 4,032 | ||||||||||||||
Change in restricted cash - investing | — | (3,571 | ) | 60,302 | — | 56,731 | |||||||||||||
Insurance proceeds | — | — | 521 | — | 521 | ||||||||||||||
Distributions from unconsolidated entities | 7,472 | 5,356 | — | — | 12,828 | ||||||||||||||
Contributions to unconsolidated entities | (7 | ) | — | — | — | (7 | ) | ||||||||||||
Intercompany financing | 334,905 | — | — | (334,905 | ) | — | |||||||||||||
Cash flows from investing activities | 351,877 | (45,035 | ) | 95,557 | (334,905 | ) | 67,494 | ||||||||||||
Financing activities: | |||||||||||||||||||
Proceeds from borrowings | — | — | 473,062 | — | 473,062 | ||||||||||||||
Repayment of borrowings | (236,745 | ) | — | (386,361 | ) | — | (623,106 | ) | |||||||||||
Payment of deferred financing costs | (4 | ) | — | (3,211 | ) | — | (3,215 | ) | |||||||||||
Acquisition of noncontrolling interests | — | — | (5,850 | ) | — | (5,850 | ) | ||||||||||||
Net proceeds from issuance of preferred equity-consolidated joint venture | — | — | 41,442 | — | 41,442 | ||||||||||||||
Distributions paid to preferred unitholders | (38,712 | ) | — | — | — | (38,712 | ) | ||||||||||||
Distributions paid to common unitholders | (9,981 | ) | — | — | — | (9,981 | ) | ||||||||||||
Distributions paid to noncontrolling interests | — | (850 | ) | (8,746 | ) | — | (9,596 | ) | |||||||||||
Contributions from noncontrolling interests | — | 1,265 | 5,110 | — | 6,375 | ||||||||||||||
Intercompany financing | — | (86,470 | ) | (248,435 | ) | 334,905 | — | ||||||||||||
Other | (3,108 | ) | — | (1,102 | ) | — | (4,210 | ) | |||||||||||
Cash flows used in financing activities | (288,550 | ) | (86,055 | ) | (134,091 | ) | 334,905 | (173,791 | ) | ||||||||||
Effect of exchange rate changes on cash | — | (71 | ) | (14 | ) | — | (85 | ) | |||||||||||
Change in cash and cash equivalents | 490 | (802 | ) | 1,814 | — | 1,502 | |||||||||||||
Cash and cash equivalents at beginning of period | 5,227 | 33,117 | 7,301 | — | 45,645 | ||||||||||||||
Cash and cash equivalents at end of period | $ | 5,717 | $ | 32,315 | $ | 9,115 | $ | — | $ | 47,147 | |||||||||
113
FELCOR LODGING TRUST INCORPORATED and FELCOR LODGING LIMITED PARTNERSHIP
Schedule III – Real Estate and Accumulated Depreciation
as of December 31, 2016
(in thousands)
Initial Cost | Cost Capitalized Subsequent to Acquisition | Gross Amounts at Which Carried at Close of Period | Accumulated Depreciation Buildings & Improvements | Life Upon Which Depreciation is Computed(*) | ||||||||||||||||||||||||||||||||||||||
Location | Encumbrances | Land | Building and Improvements | Land | Building and Improvements | Land | Building and Improvements | Total | Year Opened | Date Acquired | ||||||||||||||||||||||||||||||||
Birmingham, AL (a) | $ | 22,760 | $ | 2,843 | $ | 29,286 | $ | — | $ | 4,759 | $ | 2,843 | $ | 34,045 | $ | 36,888 | $ | 17,433 | 1987 | 1/3/1996 | 15 - 40 Yrs | |||||||||||||||||||||
Phoenix - Biltmore, AZ (a) | — | 4,694 | 38,998 | — | 4,981 | 4,694 | 43,979 | 48,673 | 22,385 | 1985 | 1/3/1996 | 15 - 40 Yrs | ||||||||||||||||||||||||||||||
Los Angeles – International Airport – South, CA (a) | 14,089 | 2,660 | 17,997 | — | 6,609 | 2,660 | 24,606 | 27,266 | 11,787 | 1985 | 3/27/1996 | 15 - 40 Yrs | ||||||||||||||||||||||||||||||
Milpitas – Silicon Valley, CA (a) | (k) | 4,021 | 23,677 | — | 4,928 | 4,021 | 28,605 | 32,626 | 14,440 | 1987 | 1/3/1996 | 15 - 40 Yrs | ||||||||||||||||||||||||||||||
Napa Valley, CA (a) | 26,639 | 2,218 | 14,205 | — | 6,933 | 2,218 | 21,138 | 23,356 | 9,791 | 1985 | 5/8/1996 | 15 - 40 Yrs | ||||||||||||||||||||||||||||||
Oxnard - Mandalay Beach – Hotel & Resort, CA (a) | — | 2,930 | 22,125 | — | 11,473 | 2,930 | 33,598 | 36,528 | 16,466 | 1986 | 5/8/1996 | 15 - 40 Yrs | ||||||||||||||||||||||||||||||
San Diego Bayside, CA (j) | — | (l) | 68,229 | — | 13,535 | — | 81,764 | 81,764 | 49,340 | 1965 | 7/28/1998 | 15 - 40 Yrs | ||||||||||||||||||||||||||||||
San Francisco – Airport/Waterfront, CA (a) | — | (m) | 39,929 | — | 8,556 | — | 48,485 | 48,485 | 23,213 | 1986 | 11/6/1995 | 15 - 40 Yrs | ||||||||||||||||||||||||||||||
San Francisco – Airport/South San Francisco, CA (a) | (k) | 3,418 | 31,737 | — | 5,805 | 3,418 | 37,542 | 40,960 | 18,967 | 1988 | 1/3/1996 | 15 - 40 Yrs | ||||||||||||||||||||||||||||||
San Francisco - Fisherman’s Wharf, CA (e) | — | (n) | 61,883 | — | 18,681 | — | 80,564 | 80,564 | 40,629 | 1970 | 7/28/1998 | 15 - 40 Yrs | ||||||||||||||||||||||||||||||
San Francisco –Union Square, CA (f) | 28,881 | 8,466 | 73,684 | (434 | ) | 54,504 | 8,032 | 128,188 | 136,220 | 54,995 | 1970 | 7/28/1998 | 15 - 40 Yrs | |||||||||||||||||||||||||||||
Santa Monica Beach – at the Pier, CA (j) | 9,746 | 10,200 | 16,580 | — | 1,917 | 10,200 | 18,497 | 28,697 | 5,697 | 1967 | 3/11/2004 | 15 - 40 Yrs | ||||||||||||||||||||||||||||||
Deerfield Beach – Resort & Spa, FL (a) | 30,184 | 4,523 | 29,443 | 68 | 7,357 | 4,591 | 36,800 | 41,391 | 18,715 | 1987 | 1/3/1996 | 15 - 40 Yrs | ||||||||||||||||||||||||||||||
Ft. Lauderdale – 17th Street, FL (a) | 34,117 | 5,329 | 47,850 | (163 | ) | 7,700 | 5,166 | 55,550 | 60,716 | 28,498 | 1986 | 1/3/1996 | 15 - 40 Yrs | |||||||||||||||||||||||||||||
Miami – International Airport, FL (a) | — | 4,135 | 24,950 | — | 7,441 | 4,135 | 32,391 | 36,526 | 16,470 | 1983 | 1/3/1996 | 15 - 40 Yrs | ||||||||||||||||||||||||||||||
Orlando – International Drive South/Convention, FL (a) | (k) | 1,632 | 13,870 | — | 5,876 | 1,632 | 19,746 | 21,378 | 9,879 | 1985 | 7/28/1994 | 15 - 40 Yrs | ||||||||||||||||||||||||||||||
Orlando – Walt Disney World Resort, FL (c) | — | (o) | 28,092 | — | 3,978 | — | 32,070 | 32,070 | 22,536 | 1987 | 7/28/1997 | 15 - 40 Yrs | ||||||||||||||||||||||||||||||
St. Petersburg – Vinoy Resort & Golf Club, FL (d) | 20,528 | (p) | 100,823 | — | 11,687 | — | 112,510 | 112,510 | 27,440 | 1925 | 12/16/2007 | 15 - 40 Yrs | ||||||||||||||||||||||||||||||
114
FELCOR LODGING TRUST INCORPORATED and FELCOR LODGING LIMITED PARTNERSHIP
Schedule III – Real Estate and Accumulated Depreciation – (continued)
as of December 31, 2016
(in thousands)
Initial Cost | Cost Capitalized Subsequent to Acquisition | Gross Amounts at Which Carried at Close of Period | Accumulated Depreciation Buildings & Improvements | Life Upon Which Depreciation is Computed(*) | ||||||||||||||||||||||||||||||||||||||
Location | Encumbrances | Land | Building and Improvements | Land | Building and Improvements | Land | Building and Improvements | Total | Year Opened | Date Acquired | ||||||||||||||||||||||||||||||||
Atlanta – Buckhead, GA (a) | (k) | 7,303 | 38,996 | (300 | ) | 4,722 | 7,003 | 43,718 | 50,721 | 21,363 | 1988 | 10/17/1996 | 15 - 40 Yrs | |||||||||||||||||||||||||||||
New Orleans – French Quarter, LA (j) | — | (q) | 50,732 | — | 11,671 | — | 62,403 | 62,403 | 26,187 | 1969 | 7/28/1998 | 15 - 40 Yrs | ||||||||||||||||||||||||||||||
Boston – at Beacon Hill, MA (j) | — | (r) | 45,192 | — | 6,622 | — | 51,814 | 51,814 | 33,114 | 1968 | 7/28/1998 | 15 - 40 Yrs | ||||||||||||||||||||||||||||||
Boston – Copley Plaza, MA (h) | 24,014 | 27,600 | 62,500 | — | 15,086 | 27,600 | 77,586 | 105,186 | 12,863 | 1912 | 8/18/2010 | 15 - 40 Yrs | ||||||||||||||||||||||||||||||
Boston – Marlborough, MA (a) | (k) | 948 | 8,143 | 761 | 16,399 | 1,709 | 24,542 | 26,251 | 11,719 | 1988 | 6/30/1995 | 15 - 40 Yrs | ||||||||||||||||||||||||||||||
Minneapolis – Airport, MN (a) | 36,594 | 5,417 | 36,508 | 24 | 3,205 | 5,441 | 39,713 | 45,154 | 20,539 | 1986 | 11/6/1995 | 15 - 40 Yrs | ||||||||||||||||||||||||||||||
New York - Morgans (i) | — | 16,200 | 29,872 | — | 2,916 | 16,200 | 32,788 | 48,988 | 4,349 | 1984 | 5/23/2011 | 15 - 40 Yrs | ||||||||||||||||||||||||||||||
New York - Royalton (i) | — | 32,500 | 48,423 | — | 3,839 | 32,500 | 52,262 | 84,762 | 7,327 | 1988 | 5/23/2011 | 15 - 40 Yrs | ||||||||||||||||||||||||||||||
New York - The Knickerbocker(u) | 85,000 | 85,400 | 213,941 | — | 1,741 | 85,400 | 215,682 | 301,082 | 8,463 | 2015 | 12/6/2011 | 15 - 40 Yrs | ||||||||||||||||||||||||||||||
Philadelphia – Historic District, PA (j) | — | 3,164 | 27,535 | 7 | 7,741 | 3,171 | 35,276 | 38,447 | 15,871 | 1972 | 7/28/1998 | 15 - 40 Yrs | ||||||||||||||||||||||||||||||
Philadelphia – Society Hill, PA (b) | (k) | 4,542 | 45,121 | — | 10,553 | 4,542 | 55,674 | 60,216 | 26,430 | 1986 | 10/1/1997 | 15 - 40 Yrs | ||||||||||||||||||||||||||||||
Pittsburgh – at University Center (Oakland), PA (j) | — | (s) | 25,031 | — | 3,265 | — | 28,296 | 28,296 | 12,828 | 1988 | 11/1/1998 | 15 - 40 Yrs | ||||||||||||||||||||||||||||||
Charleston – Mills House, SC (j) | 12,352 | 3,251 | 28,295 | 7 | 8,666 | 3,258 | 36,961 | 40,219 | 15,910 | 1982 | 7/28/1998 | 15 - 40 Yrs | ||||||||||||||||||||||||||||||
Myrtle Beach – Oceanfront Resort, SC (a) | — | 2,940 | 24,988 | — | 13,268 | 2,940 | 38,256 | 41,196 | 16,875 | 1987 | 12/5/1996 | 15 - 40 Yrs | ||||||||||||||||||||||||||||||
Myrtle Beach Resort (g) | (k) | 9,000 | 19,844 | 6 | 32,688 | 9,006 | 52,532 | 61,538 | 20,435 | 1974 | 7/23/2002 | 15 - 40 Yrs | ||||||||||||||||||||||||||||||
Austin, TX (c) | 9,389 | 2,508 | 21,908 | — | 5,067 | 2,508 | 26,975 | 29,483 | 13,118 | 1987 | 3/20/1997 | 15 - 40 Yrs | ||||||||||||||||||||||||||||||
Dallas – Love Field, TX (a) | (k) | 1,934 | 16,674 | — | 6,751 | 1,934 | 23,425 | 25,359 | 11,328 | 1986 | 3/29/1995 | 15 - 40 Yrs | ||||||||||||||||||||||||||||||
Houston - Medical Center, TX (j) | — | (t) | 22,027 | 8,226 | 6,914 | 8,226 | 28,941 | 37,167 | 12,468 | 1984 | 7/28/1998 | 15 - 40 Yrs | ||||||||||||||||||||||||||||||
Burlington Hotel & Conference Center, VT (b) | (k) | 3,136 | 27,283 | (2 | ) | 8,297 | 3,134 | 35,580 | 38,714 | 15,335 | 1967 | 12/4/1997 | 15 - 40 Yrs | |||||||||||||||||||||||||||||
Total hotels | $ | 354,293 | $ | 262,912 | $ | 1,476,371 | $ | 8,200 | $ | 356,131 | $ | 271,112 | $ | 1,832,502 | $ | 2,103,614 | $ | 715,203 | ||||||||||||||||||||||||
Other properties (less than 5% of total) | $ | — | $ | 550 | $ | 3,686 | $ | — | $ | 267 | $ | 550 | $ | 3,953 | $ | 4,503 | $ | 1,173 | ||||||||||||||||||||||||
Total | $ | 354,293 | $ | 263,462 | $ | 1,480,057 | $ | 8,200 | $ | 356,398 | $ | 271,662 | $ | 1,836,455 | $ | 2,108,117 | $ | 716,376 | ||||||||||||||||||||||||
115
FELCOR LODGING TRUST INCORPORATED AND
FELCOR LODGING LIMITED PARTNERSHIP
Schedule III – Real Estate and Accumulated Depreciation – (continued)
as of December 31, 2016
(in thousands)
(a) Embassy Suites Hotel
(b) Sheraton
(c) DoubleTree by Hilton
(d) Renaissance
(e) Holiday Inn
(f) Marriott
(g) Hilton
(h) Fairmont
(i) Morgans Hotel Group
(j) Wyndham
(k) This hotel is mortgaged to secure repayment of our 5.625% senior notes due in 2023.
(l) This hotel is subject to a ground lease which expires October 2029.*
(m) This hotel is subject to a ground lease which expires April 2059.*
(n) This hotel is subject to ground leases which expire October 2018.*
(o) This hotel is subject to a ground lease which expires March 2032.*
(p) | This hotel is subject to ground leases, including the golf course, which expire February 2090 and a lease on the marina which expires September 2088.* |
(q) This hotel is subject to a ground lease which expires October 2065.*
(r) This hotel is subject to a ground lease which expires November 2028.*
(s) This hotel is subject to a ground lease which expires October 2038.*
(t) | We previously leased the land for this property. In the third quarter of 2016, we acquired the land for $8.2 million (including closing costs). |
(u) Development on this hotel was completed in 2015.
* For those hotels subject to ground leases, depreciation expense is based on the shorter of the lease term or estimated useful life of the assets.
116
FELCOR LODGING TRUST INCORPORATED AND
FELCOR LODGING LIMITED PARTNERSHIP
Schedule III – Real Estate and Accumulated Depreciation – (continued)
as of December 31, 2016
(in thousands)
Year ended December 31, | ||||||||||||
2016 | 2015 | 2014 | ||||||||||
Reconciliation of Land and Buildings and Improvements: | ||||||||||||
Balance at beginning of period | $ | 2,229,492 | $ | 2,062,289 | $ | 2,175,100 | ||||||
Additions during period: | ||||||||||||
Completed hotel development | — | 299,341 | — | |||||||||
Acquisitions from joint venture transaction | — | — | 108,901 | |||||||||
Purchase of land | 8,226 | — | — | |||||||||
Improvements | 20,973 | 15,324 | 21,167 | |||||||||
Deductions during period: | ||||||||||||
Disposition of properties and other | (150,574 | ) | (147,462 | ) | (242,879 | ) | ||||||
Balance at end of period before impairment charges | 2,108,117 | 2,229,492 | 2,062,289 | |||||||||
Cumulative impairment charges on real estate assets owned at end of period | (75,227 | ) | (76,008 | ) | (65,277 | ) | ||||||
Balance at end of period | $ | 2,032,890 | $ | 2,153,484 | $ | 1,997,012 | ||||||
Reconciliation of Accumulated Depreciation | ||||||||||||
Balance at beginning of period | $ | 697,386 | $ | 661,758 | $ | 698,146 | ||||||
Additions during period: | ||||||||||||
Depreciation for the period | 57,044 | 57,022 | 56,564 | |||||||||
Deductions during period: | ||||||||||||
Disposition of properties and other | (38,054 | ) | (21,394 | ) | (92,952 | ) | ||||||
Balance at end of period | $ | 716,376 | $ | 697,386 | $ | 661,758 | ||||||
The aggregate cost of real estate for federal income tax purposes is approximately $2.0 billion at December 31, 2016.
117
Item 9. Changes in and Disagreements With Accountants on Accounting and Financial Disclosure
None.
Item 9A. Controls and Procedures
Controls and Procedures (FelCor Lodging Trust Incorporated)
Evaluation of Disclosure Controls and Procedures.
Under the supervision and with the participation of our management, including our Interim Senior Executive Officer and Chief Financial Officer, we have evaluated the effectiveness of our disclosure controls and procedures pursuant to Exchange Act Rule 13a-15(b) as of the end of the period covered by this report (the “Evaluation Date”). Based on this evaluation, our Interim Senior Executive Officer and Chief Financial Officer have concluded, as of the Evaluation Date, that these disclosure controls and procedures were effective, such that the information relating to FelCor required to be disclosed in our reports is recorded, processed, summarized and reported within the time periods specified in SEC rules and forms, and is accumulated and communicated to our management, including our Interim Senior Executive Office and Chief Financial Officer, as appropriate to allow timely decisions regarding required disclosure.
Changes in Internal Control over Financial Reporting.
There have been no changes in our internal control over financial reporting (as defined in Rule 13a-15(f) promulgated under the Exchange Act) during the fourth quarter that have materially affected, or are reasonably likely to materially affect, our internal control over financial reporting.
Management’s Report on Internal Control over Financial Reporting.
Management is responsible for establishing and maintaining adequate internal control over financial reporting for FelCor Lodging Trust Incorporated. A company’s internal control over financial reporting is a process designed to provide reasonable assurance regarding the reliability of financial reporting and the preparation of financial statements for external purposes in accordance with generally accepted accounting principles.
Management assessed the effectiveness of our internal control over financial reporting as of December 31, 2016. In making this assessment, management used the criteria set forth by the Committee of Sponsoring Organizations of the Treadway Commission (COSO) in its Internal Control-Integrated Framework (2013). Based on this assessment, management concluded that, as of December 31, 2016, our internal control over financial reporting is effective, based on those criteria.
The effectiveness of our internal control over financial reporting as of December 31, 2016, has been audited by PricewaterhouseCoopers LLP, an independent registered public accounting firm as stated in their report, which appears in Item 8 of this report.
Controls and Procedures (FelCor LP)
Evaluation of Disclosure Controls and Procedures.
Under the supervision and with the participation of FelCor’s management, including its Interim Senior Executive Officer and Chief Financial Officer, we have evaluated the effectiveness of our disclosure controls and procedures pursuant to Exchange Act Rule 13a-15(b) as of the end of the period covered by this report (the
118
“Evaluation Date”). Based on this evaluation, FelCor’s Interim Senior Executive Officer and Chief Financial Officer have concluded, as of the Evaluation Date, that these disclosure controls and procedures were effective, such that the information relating to FelCor LP required to be disclosed in its reports is recorded, processed, summarized and reported within the time periods specified in SEC rules and forms, and is accumulated and communicated to FelCor’s management, including its Interim Senior Executive Office and Chief Financial Officer, as appropriate to allow timely decisions regarding required disclosure.
Changes in Internal Control over Financial Reporting.
There have been no changes in FelCor LP’s internal control over financial reporting (as defined in Rule 13a-15(f) promulgated under the Exchange Act) during the fourth quarter that have materially affected, or are reasonably likely to materially affect, its internal control over financial reporting.
Management’s Report on Internal Control over Financial Reporting.
FelCor’s management is responsible for establishing and maintaining adequate internal control over financial reporting for FelCor LP. A company’s internal control over financial reporting is a process designed to provide reasonable assurance regarding the reliability of financial reporting and the preparation of financial statements for external purposes in accordance with generally accepted accounting principles.
FelCor’s management assessed the effectiveness of FelCor LP’s internal control over financial reporting as of December 31, 2016. In making this assessment, management used the criteria set forth by the Committee of Sponsoring Organizations of the Treadway Commission (COSO) in its Internal Control-Integrated Framework (2013). Based on this assessment, FelCor’s management concluded that, as of December 31, 2016, FelCor LP’s internal control over financial reporting is effective, based on those criteria.
The effectiveness of FelCor LP’s internal control over financial reporting as of December 31, 2016, has been audited by PricewaterhouseCoopers LLP, an independent registered public accounting firm as stated in their report, which appears in Item 8 of this report.
119
PART III
Item 10. Directors, Executive Officers of the Registrant and Corporate Governance
The information called for by this Item is contained in FelCor’s definitive Proxy Statement for its 2017 Annual Meeting of Stockholders, and is incorporated herein by reference.
Item 11. Executive Compensation
The information called for by this Item is contained in FelCor’s definitive Proxy Statement for its 2017 Annual Meeting of Stockholders, and is incorporated herein by reference.
Item 12. Security Ownership of Certain Beneficial Owners and Management and Related Stockholder Matters
The information called for by this Item is contained in FelCor’s definitive Proxy Statement for its 2017 Annual Meeting of Stockholders, or in Item 5 of this report, and is incorporated herein by reference.
Item 13. Certain Relationships, Related Transactions and Director Independence
The information called for by this Item is contained in FelCor’s definitive Proxy Statement for its 2017 Annual Meeting of Stockholders, and is incorporated herein by reference.
Item 14. Principal Accountant Fees and Services
The information called for by this Item is contained in FelCor’s definitive Proxy Statement for its 2017 Annual Meeting of Stockholders, and is incorporated herein by reference.
120
PART IV
Item 15. Exhibits and Financial Statement Schedules
(a) The following is a list of documents filed as a part of this report:
(1) Financial Statements.
All financial statements of the registrants are included herein under Item 8 of this report.
(2) Financial Statement Schedules.
The following financial statement schedule is included herein under Item 8 of this report.
Schedule III - Real Estate and Accumulated Depreciation for FelCor Lodging Trust Incorporated
All other schedules for which provision is made in Regulation S-X are either not required to be included herein under the related instructions, are inapplicable or the related information is included in the footnotes to the applicable financial statement and, therefore, have been omitted.
(b) Exhibits.
The following exhibits are provided pursuant to the provisions of Item 601 of Regulation S-K:
Column(s) have been removed from this table.
Exhibit Number | Description of Exhibit | |
3.1 | Articles of Amendment and Restatement dated May 19, 2015, amending and restating the Charter of FelCor Lodging Trust Incorporated (“FelCor”) (filed as Exhibit 3.1 to FelCor’s Form 8-K, dated May 20, 2015, and incorporated herein by reference). | |
3.1.1 | Articles Supplementary filed May 19, 2015 (filed as Exhibit 3.2 to FelCor’s Form 8‑K, dated May 20, 2015, and incorporated herein by reference). | |
3.1.2 | Articles Supplementary filed December 15, 2015 (filed as Exhibit 3.1 to FelCor’s Form 8-K, dated December 15, 2015, and incorporated herein by reference). | |
3.2 | Bylaws of FelCor restated through October 27, 2016 (filed as Exhibit 3.2 to FelCor’s Form 8-K, dated October 27, 2016, and incorporated herein by reference). | |
4.1 | Form of Share Certificate for Common Stock (filed as Exhibit 4.1 to FelCor’s Form 10-Q for the quarter ended June 30, 1996 and incorporated herein by reference). | |
4.2 | Form of Share Certificate for $1.95 Series A Cumulative Convertible Preferred Stock (filed as Exhibit 4.4 to FelCor’s Form 8-K, dated May 1, 1996, and incorporated herein by reference). | |
4.3 | Indenture, dated as of December 17, 2012, between FelCor Lodging Limited Partnership (“FelCor LP”), FelCor, the subsidiary guarantors party thereto, and U.S. Bank National Association, as trustee, collateral agent, registrar and paying agent (filed as Exhibit 4.1 to FelCor’s Form 8-K, dated December 17, 2012, and incorporated herein by reference). |
121
4.3.1 | First Supplemental Indenture, dated as of January 7, 2013, by and among FelCor, FelCor LP, certain of their subsidiaries, as guarantors, and U.S. Bank National Association, as trustee. (filed as Exhibit 4.1 to FelCor’s Form 8-K, dated January 7, 2013, and incorporated herein by reference). |
4.4 | Registration Rights Agreement, dated December 17, 2012, among FelCor LP, FelCor, the subsidiary guarantors named therein, and J.P. Morgan Securities LLC (filed as Exhibit 4.2 to FelCor’s Form 8-K, dated December 17, 2012, and incorporated herein by reference). |
4.5 | Indenture, dated as of May 21, 2015, between FelCor LP, FelCor, the subsidiary guarantors party thereto, and U.S. Bank National Association, as trustee, registrar and paying agent (filed as Exhibit 4.1 to FelCor’s Form 8-K, dated May 22, 2015, and incorporated herein by reference). |
4.6 | Registration Rights Agreement, dated May 21, 2015, among FelCor LP, FelCor, the subsidiary guarantors named therein, and Merrill Lynch, Pierce, Fenner & Smith Incorporated and J.P. Morgan Securities LLC (filed as Exhibit 4.2 to FelCor’s Form 8-K, dated May 22, 2015, and incorporated herein by reference). |
10.1 | Second Amended and Restated Agreement of Limited Partnership of FelCor LP, dated as of December 31, 2001 (filed as Exhibit 10.1 to FelCor’s Form 10-K for the fiscal year ended December 31, 2001 (the “2001 Form 10-K”) and incorporated herein by reference). |
10.1.1 | First Amendment to Second Amended and Restated Agreement of Limited Partnership of FelCor LP, dated April 1, 2002 (filed as Exhibit 10.1.1 to FelCor’s Form 8-K, dated April 1, 2002, and incorporated herein by reference). |
10.1.2 | Second Amendment to Second Amended and Restated Agreement of Limited Partnership of FelCor LP, dated August 31, 2002 (filed as Exhibit 10.1.2 to FelCor’s Form 10-K for the fiscal year ended December 31, 2002 (the “2002 Form 10-K”) and incorporated herein by reference). |
10.1.3 | Third Amendment to Second Amended and Restated Agreement of Limited Partnership of FelCor LP, dated October 1, 2002 (filed as Exhibit 10.1.3 to the 2002 Form 10-K and incorporated herein by reference). |
10.1.4 | Fourth Amendment to Second Amended and Restated Agreement of Limited Partnership of FelCor LP, dated as of July 1, 2003 (filed as Exhibit 10.1.4 to FelCor’s Form 10-Q for the quarter ended March 31, 2004 and incorporated herein by reference). |
10.1.5 | Fifth Amendment to Second Amended and Restated Agreement of Limited Partnership of FelCor LP, dated as of April 2, 2004 (filed as Exhibit 10.1.5 to FelCor’s Form 10-Q for the quarter ended March 31, 2004 and incorporated herein by reference). |
10.1.6 | Sixth Amendment to Second Amended and Restated Agreement of Limited Partnership of FelCor LP, dated as of August 23, 2004 (filed as Exhibit 10.1.6 to FelCor’s Form 8-K, dated August 26, 2004, and incorporated herein by reference). |
10.1.7 | Seventh Amendment to Second Amended and Restated Agreement of Limited Partnership of FelCor LP, dated as of April 7, 2005, which contains Addendum No. 4 to the Second Amended and Restated Agreement of Limited Partnership of FelCor L P (filed as Exhibit 10.1.8 to FelCor’s Form 8-K, dated April 6, 2005, and incorporated herein by reference). |
10.1.8 | Eighth Amendment to Second Amended and Restated Agreement of Limited Partnership of FelCor LP, dated as of August 30, 2005 (filed as Exhibit 10.1.9 to FelCor’s Form 8-K, dated August 29, 2005, and incorporated herein by reference). |
122
10.2 | Employment Agreement, dated as of February 10, 2017, by and between FelCor and Steven R. Goldman (filed as Exhibit 10.1 to the FelCor’s Form 8-K, dated February 16, 2017, and incorporated herein by reference). |
10.2.1 | Change in Control and Severance Agreement dated as of February 10, 2017, by and between FelCor and Steven R. Goldman (filed as Exhibit 10.2 to FelCor’s Form 8-K, dated February 16, 2017, and incorporated herein by reference). |
10.3 | Executive Employment Agreement dated October 19, 2007, between FelCor and Richard A. Smith (filed as Exhibit 10.1 to FelCor’s Form 10-Q for the quarter ended September 30, 2007 and incorporated herein by reference). |
10.3.1 | Letter dated October 16, 2012 amending the 2007 Employment Agreement between FelCor and Richard A. Smith (filed as Exhibit 10.3 to FelCor’s Form 10-Q for the quarter ended September 30, 2012 and incorporated herein by reference). |
10.3.2 | Retirement, Severance and Release Agreement, dated as of September 16, 2016, by and between FelCor and Richard A. Smith (filed as Exhibit 10.3 to FelCor’s Form 8-K, dated September 19, 2016, and incorporated herein by reference). |
10.4 | Form of 2007 Change in Control and Severance Agreement between FelCor and each of Michael Hughes, Thomas Hendrick, Troy Pentecost, Jon Yellen and Tom Corcoran (filed as Exhibit 10.1 to FelCor’s Form 8-K, dated October 23, 2007, and incorporated herein by reference). |
10.4.1 | Amendment to Change in Control and Severance Agreement dated October 29, 2015 between FelCor and Tom Corcoran. |
10.5 | Savings and Investment Plan of FelCor (filed as Exhibit 10.10 to the 2001 Form 10-K and incorporated herein by reference). |
10.6 | FelCor’s 2005 Restricted Stock and Stock Option Plan (as amended through October 29, 2012) (filed as Exhibit 10.1 to FelCor’s Form 10-Q for the quarter ended March 31, 2013 and incorporated herein by reference). |
10.7 | Form of Performance Equity Grant Agreement (filed as Exhibit 10.2 to FelCor’s Form 10-Q for the quarter ended September 30, 2012 and incorporated herein by reference). |
10.8 | 2014 Equity Compensation Plan, as amended and restated (filed as Exhibit 10.1 to FelCor’s Form 8-K, dated October 27, 2016, and incorporated herein by reference). |
10.9 | Form of Equity Grant Agreement (Time Vesting) (filed as Exhibit 10.2 to Felcor’s Form 10-Q for the quarter ended June 30, 2016, and incorporated herein by reference). |
10.10 | Form of Performance Equity Grant Agreement (Market Performance). (filed as Exhibit 10.3 to Felcor’s Form 10-Q for the quarter ended June 30, 2016, and incorporated herein by reference). |
10.11 | Form of Performance Equity Grant Agreement (Financial Performance) (filed as Exhibit 10.4 to Felcor’s Form 10-Q for the quarter ended June 30, 2016, and incorporated herein by reference). |
10.12 | Form of Restricted Stock Award (filed as Exhibit 10.5 to Felcor’s Form 10-Q for the quarter ended June 30, 2016, and incorporated herein by reference). |
10.13 | General Terms and Conditions Applicable to Restricted Stock Awards (filed as Exhibit 10.6 to Felcor’s Form 10-Q for the quarter ended June 30, 2016, and incorporated herein by reference). |
123
10.14 | Equity Grant Agreement, dated as of September 19, 2016, by and between FelCor Lodging Trust Incorporated (“FelCor”) and Troy A. Pentecost (filed as Exhibit 10.1 to FelCor’s Form 8-K, dated September 19, 2016, and incorporated herein by reference). |
10.15 | Form of Indemnification Agreement by and among FelCor, FelCor LP and individual officers and directors of FelCor (filed as Exhibit 10.1 to FelCor’s 10-Q for the quarter ended March 31, 2009 and incorporated herein by reference; superseding the form of Indemnification Agreement that was filed as Exhibit 10.1 to FelCor’s Form 8-K, dated November 9, 2006, and incorporated herein by reference.) |
10.16 | Form of Guaranty Agreement by and among FelCor, FelCor LP and individual employees of FelCor (filed as Exhibit 10.2 to FelCor’s Form 10-Q for the quarter ended March 31, 2009 and incorporated herein by reference). |
10.17 | Incentive Compensation Program for Executive Officers, as amended (filed as Exhibit 10.2 to FelCor’s Form 8-K, dated September 19, 2016, and incorporated herein by reference). |
10.18 | Summary of Annual Compensation Program for Directors of FelCor (filed as Exhibit 10.16 to FelCor’s Form 10-K for the year ended December 31, 2014, and incorporated herein by reference). |
10.19 | Second Amended and Restated Credit Agreement, dated as of June 4, 2015, among FelCor Austin Downtown Hotel, L.L.C., FelCor Copley Plaza Owner, L.L.C., FelCor/LAX Hotels, L.L.C., Charleston Mills House Hotel, L.L.C., FelCor Santa Monica Owner, L.L.C., FelCor Union Square Hotel, L.L.C., FelCor St. Pete Owner, L.L.C., FelCor Austin Downtown Lessee, L.L.C., FelCor Copley Plaza Leasing, L.L.C., FelCor LAX Lessee, L.L.C., Charleston Mills House Lessee, L.L.C., FelCor Santa Monica Lessee, L.L.C., FelCor Union Square Lessee, L.L.C., and FelCor St. Pete Leasing (SPE), L.L.C., as borrowers, and JPMorgan Chase Bank, N.A., as administrative agent, and the lenders that are parties thereto (filed as Exhibit 10.1 to FelCor’s Form 8-K, dated June 9, 2015, and incorporated herein by reference). |
10.19.1 | Second Amended and Restated Guaranty Agreement to the Second Amended and Restated Revolving Credit Agreement, dated as of June 4, 2015, by FelCor and FelCor LP in favor of JPMorgan Chase Bank, N.A., as administrative agent, on behalf of the lenders (filed as Exhibit 10.2 to FelCor’s Form 8-K, dated June 9, 2015, and incorporated herein by reference). |
10.19.2 | Form of Mortgage, Assignment of Leases and Rents, Security Agreement and Fixture Filing under the Second Amended and Restated Revolving Credit Agreement for the benefit of JPMorgan Chase Bank, N.A., as administrative agent for the lenders (filed as Exhibit 10.3 to FelCor’s Form 8-K, dated June 9, 2015, and incorporated herein by reference). |
10.19.3 | Form of Pledge and Security Agreement under the Second Amended and Restated Revolving Credit Agreement in favor of JPMorgan Chase Bank, N.A., as administrative agent for the lenders (filed as Exhibit 10.4 to FelCor’s Form 8-K, dated June 9, 2015, and incorporated herein by reference). |
10.20 | Form of [Fee and] Leasehold Mortgage, Deed of Trust, Assignment of Leases and Rents, Security Agreement and Fixture Filing for the benefit of U.S. Bank National Association, as collateral agent, relating to FelCor LP’s 5.625% Senior Secured Notes due 2023 (filed as Exhibit 10.3 to FelCor’s Form 10-Q for the quarter ended March 31, 2013, and incorporated herein by reference). |
10.20.1 | Pledge Agreement, dated as of December 17, 2012, by FelCor LP, in favor of U.S. Bank National Association, as collateral agent (filed as Exhibit 10.1 to FelCor’s Form 8-K, dated December 17, 2012, and incorporated herein by reference). |
124
10.21 | Letter Agreement dated February 18, 2016 between FelCor and Land & Buildings Investment Management LLC (filed as Exhibit 10.1 to FelCor’s Form 8-K, dated February 19, 2016, and incorporated herein by reference). |
10.22 | Letter Agreement dated January 20, 2017 between FelCor and Snow Park Capital Partners, LP. (filed as Exhibit 10.1 to FelCor’s Form 8-K, dated January 20, 2017, and incorporated herein by reference). |
21.1* | List of Subsidiaries of FelCor. |
21.2* | List of Subsidiaries of FelCor LP. |
23* | Consent of PricewaterhouseCoopers LLP. |
31.1* | Certification of the Chief Executive Officer pursuant to Section 302 of the Sarbanes-Oxley Act of 2002 for FelCor. |
31.2* | Certification of the Chief Financial Officer pursuant to Section 302 of the Sarbanes-Oxley Act of 2002 for FelCor. |
31.3* | Certification of the Chief Executive Officer pursuant to Section 302 of the Sarbanes-Oxley Act of 2002 for FelCor LP. |
31.4* | Certification of the Chief Financial Officer pursuant to Section 302 of the Sarbanes-Oxley Act of 2002 for FelCor LP. |
32.1*† | Certification of the Chief Executive Officer and Chief Financial Officer pursuant to Section 906 of the Sarbanes-Oxley Act of 2002 (18 U.S.C. 1350) for FelCor. |
32.2*† | Certification of the Chief Executive Officer and Chief Financial Officer pursuant to Section 906 of the Sarbanes-Oxley Act of 2002 (18 U.S.C. 1350) for FelCor LP. |
101.INS | XBRL Instance Document. Submitted electronically with this report. |
101.SCH | XBRL Taxonomy Extension Schema Document. Submitted electronically with this report. |
101.CAL | XBRL Taxonomy Calculation Linkbase Document. Submitted electronically with this report. |
101.DEF | XBRL Taxonomy Extension Definition Linkbase Document. Submitted electronically with this report. |
101.LAB | XBRL Taxonomy Label Linkbase Document. Submitted electronically with this report. |
101.PRE | XBRL Taxonomy Presentation Linkbase Document. Submitted electronically with this report. |
---------------------
*Filed herewith
†This certificate is being furnished solely to accompany the report pursuant to 18 U.S.C. 1350 and is not being filed for purposes of Section 18 of the Securities Exchange Act of 1934, as amended, and is not to be incorporated by reference into any filing under the Securities Act of 1933, as amended, or the Securities Exchange Act of 1934, as amended, whether made before or after the date hereof, regardless of any general incorporation language in such filing.
125
Attached as Exhibit 101 to this report are the following documents formatted in XBRL (Extensible Business Reporting Language): (i) FelCor’s Consolidated Balance Sheets at December 31, 2016 and 2015; (ii) FelCor’s Consolidated Statements of Operations for the years ended December 31, 2016, 2015 and 2014; (iii) FelCor’s Consolidated Statements of Comprehensive Income (Loss) for the years ended December 31, 2016, 2015 and 2014; (iv) FelCor’s Consolidated Statements of Changes in Equity for the years ended December 31, 2016, 2015 and 2014; (v) FelCor’s Consolidated Statements of Cash Flows for the years ended December 31, 2016, 2015 and 2014; (vi) FelCor LP’s Consolidated Balance Sheets at December 31, 2016 and 2015; (vii) FelCor LP’s Consolidated Statements of Operations for the years ended December 31, 2016, 2015 and 2014; (viii) FelCor LP’s Consolidated Statements of Comprehensive Income (Loss) for the years ended December 31, 2016, 2015 and 2014; (ix) FelCor LP’s Consolidated Statements of Partners’ Capital for the years ended December 31, 2016, 2015 and 2014; (x) FelCor LP’s Consolidated Statements of Cash Flows for the years ended December 31, 2016, 2015 and 2014; and (xi) the Notes to Consolidated Financial Statements. Users of this data are advised pursuant to Rule 406T of Regulation S‑T that this interactive data file is deemed not filed or part of a registration statement or prospectus for purposes of Sections 11 or 12 of the Securities Act of 1933, is deemed not filed for purposes of Section 18 of the Securities Exchange Act of 1934, and otherwise is not subject to liability under these sections.
Section 16. Form 10-K Summary
None.
126
SIGNATURES
Pursuant to the requirements of the Securities Exchange Act of 1934, the registrant has duly caused this report to be signed on its behalf by the undersigned thereunto duly authorized.
FELCOR LODGING TRUST INCORPORATED | |||
February 24, 2017 | By: | /s/ Jonathan H. Yellen | |
Name: | Jonathan H. Yellen | ||
Title: | Executive Vice President, General Counsel and Secretary | ||
Pursuant to the requirements of the Securities Exchange Act of 1934, this report has been signed below by the following persons on behalf of the registrant, and in the capacities and on the dates indicated.
Date | Signature | |||||
February 24, 2017 | /s/ Troy A. Pentecost | |||||
Troy A. Pentecost President and Interim Senior Executive Officer (Principal Executive Officer) | ||||||
February 24, 2017 | /s/ Michael C. Hughes | |||||
Michael C. Hughes Executive Vice President and Chief Financial Officer (Principal Financial Officer) | ||||||
February 24, 2017 | /s/ Jeffrey D. Symes | |||||
Jeffrey D. Symes Senior Vice President, Chief Accounting Officer and Treasurer (Principal Accounting Officer) | ||||||
February 24, 2017 | /s/ Thomas J. Corcoran, Jr. | |||||
Thomas J. Corcoran, Jr. Chairman of the Board and Director | ||||||
February 24, 2017 | /s/ Glenn A. Carlin | |||||
Glenn A. Carlin, Director | ||||||
February 24, 2017 | /s/Robert F. Cotter | |||||
Robert F. Cotter, Director | ||||||
127
Date | Signature | |||||
February 24, 2017 | /s/Patricia L. Gibson | |||||
Patricia L. Gibson, Director | ||||||
February 24, 2017 | /s/Steven R. Goldman | |||||
Steven R. Goldman, Director | ||||||
February 24, 2017 | /s/Dana Hamilton | |||||
Dana Hamilton, Director | ||||||
February 24, 2017 | /s/Christopher J. Hartung | |||||
Christopher J. Hartung, Director | ||||||
February 24, 2017 | /s/ Charles A. Ledsinger, Jr. | |||||
Charles A. Ledsinger, Jr., Director | ||||||
February 24, 2017 | /s/ Robert H. Lutz, Jr. | |||||
Robert H. Lutz, Jr., Director | ||||||
February 24, 2017 | /s/ Mark D. Rozells | |||||
Mark D. Rozells, Director | ||||||
128
FELCOR LODGING LIMITED PARTNERSHIP | |||
a Delaware limited partnership | |||
By: | FelCor Lodging Trust Incorporated | ||
Its General Partner | |||
February 24, 2017 | By: | /s/ Jonathan H. Yellen | |
Name: | Jonathan H. Yellen | ||
Title: | Executive Vice President, General Counsel and Secretary | ||
Pursuant to the requirements of the Securities Exchange Act of 1934, this report has been signed below by the following officers and directors of FelCor Lodging Trust Incorporated, the general partner of the registrant, and in the capacities and on the dates indicated.
Date | Signature | |||||
February 24, 2017 | /s/ Troy A. Pentecost | |||||
Troy A. Pentecost President and Interim Senior Executive Officer (Principal Executive Officer) | ||||||
February 24, 2017 | /s/ Michael C. Hughes | |||||
Michael C. Hughes Executive Vice President and Chief Financial Officer (Principal Financial Officer) | ||||||
February 24, 2017 | /s/ Jeffrey D. Symes | |||||
Jeffrey D. Symes Senior Vice President, Chief Accounting Officer and Treasurer (Principal Accounting Officer) | ||||||
February 24, 2017 | /s/ Thomas J. Corcoran, Jr. | |||||
Thomas J. Corcoran, Jr. Chairman of the Board and Director | ||||||
February 24, 2017 | /s/ Glenn A. Carlin | |||||
Glenn A. Carlin, Director | ||||||
February 24, 2017 | /s/Robert F. Cotter | |||||
Robert F. Cotter, Director | ||||||
129
Date | Signature | |||||
February 24, 2017 | /s/Patricia L. Gibson | |||||
Patricia L. Gibson, Director | ||||||
February 24, 2017 | /s/Steven R. Goldman | |||||
Steven R. Goldman, Director | ||||||
February 24, 2017 | /s/Dana Hamilton | |||||
Dana Hamilton, Director | ||||||
February 24, 2017 | /s/Christopher J. Hartung | |||||
Christopher J. Hartung, Director | ||||||
February 24, 2017 | /s/ Charles A. Ledsinger, Jr. | |||||
Charles A. Ledsinger, Jr., Director | ||||||
February 24, 2017 | /s/ Robert H. Lutz, Jr. | |||||
Robert H. Lutz, Jr., Director | ||||||
February 24, 2017 | /s/ Mark D. Rozells | |||||
Mark D. Rozells, Director | ||||||
130