Attached files
UNITED STATES
SECURITIES AND EXCHANGE COMMISSION
Washington, D.C. 20549
FORM 10-K
(Mark One)
|
☒ |
ANNUAL REPORT PURSUANT TO SECTION 13 OR 15(d) OF THE SECURITIES EXCHANGE ACT OF 1934 |
For the fiscal year ended December 31, 2016
OR
|
☐ |
TRANSITION REPORT PURSUANT TO SECTION 13 OR 15(d) OF THE SECURITIES EXCHANGE ACT OF 1934 |
For the transition period from to
Commission file number 0-27512
CSG SYSTEMS INTERNATIONAL, INC.
(Exact name of registrant as specified in its charter)
|
Delaware |
|
47-0783182 |
|
(State or other jurisdiction |
|
(I.R.S. Employer |
9555 Maroon Circle
Englewood, Colorado 80112
(Address of principal executive offices, including zip code)
(303) 200-2000
(Registrant’s telephone number, including area code)
Securities Registered Pursuant to Section 12(b) of the Act:
|
Title of Each Class |
|
Name of Each Exchange on Which Registered |
|
Common Stock, Par Value $0.01 Per Share |
|
NASDAQ Stock Market LLC |
Securities Registered Pursuant to Section 12(g) of the Act: None.
Indicate by check mark if the registrant is a well-known seasoned issuer, as defined in Rule 405 of the Securities Act. Yes ☒ No ☐
Indicate by check mark if the registrant is not required to file reports pursuant to Section 13 or Section 15(d) of the Act. Yes ☐ No ☒
Indicate by check mark whether the registrant (1) has filed all reports required to be filed by Section 13 or 15(d) of the Securities Exchange Act of 1934 during the preceding 12 months (or for such shorter period that the registrant was required to file such reports), and (2) has been subject to such filing requirements for the past 90 days. Yes ☒ No ☐
Indicate by check mark whether the registrant has submitted electronically and posted on its corporate Website, if any, every Interactive Data File required to be submitted and posted pursuant to Rule 405 of Regulation S-T during the preceding 12 months (or for such shorter period that the registrant was required to submit and post such files). YES ☒ NO ☐
Indicate by a check mark if disclosure of delinquent filers pursuant to Item 405 of Regulation S-K is not contained herein, and will not be contained, to the best of registrant’s knowledge, in definitive proxy or information statements incorporated by reference in Part III of this Form 10-K or any amendment to this Form 10-K. ☐
Indicate by check mark whether the registrant is a large accelerated filer, an accelerated filer, a non-accelerated filer, or a smaller reporting company. See the definitions of “large accelerated filer”, “accelerated filer” and “smaller reporting company” in Rule 12b-2 of the Exchange Act.
|
Large accelerated filer ☒ |
|
Accelerated filer ☐ |
|
Non-accelerated filer ☐ |
|
Smaller reporting company ☐ |
Indicate by check mark whether the registrant is a shell company (as defined in Rule 12b-2 of the Act). Yes ☐ No ☒
The aggregate market value of the voting and non-voting common equity held by non-affiliates of the registrant, computed by reference to the last sales price of such stock, as of the close of trading on June 30, 2016, was $1,141,220,683.
Shares of common stock outstanding at February 17, 2017: 32,844,169
DOCUMENTS INCORPORATED BY REFERENCE
Portions of the Registrant's Proxy Statement for its 2017 Annual Meeting of Stockholders to be filed on or prior to April 30, 2017, are incorporated by reference into Part III of the Form 10-K.
CSG SYSTEMS INTERNATIONAL, INC.
2016 FORM 10-K
TABLE OF CONTENTS
|
|
|
|
|
Page |
|
|
|
|||
|
|
|
|
|
|
|
Item 1. |
|
|
3 |
|
|
Item 1A. |
|
|
8 |
|
|
Item 1B. |
|
|
14 |
|
|
Item 2. |
|
|
14 |
|
|
Item 3. |
|
|
15 |
|
|
Item 4. |
|
|
15 |
|
|
|
|
|
||
|
|
|
|||
|
|
|
|
|
|
|
Item 5. |
|
|
18 |
|
|
Item 6. |
|
|
21 |
|
|
Item 7. |
|
Management’s Discussion and Analysis (“MD&A”) of Financial Condition and Results of Operations |
|
23 |
|
Item 7A. |
|
|
38 |
|
|
Item 8. |
|
|
40 |
|
|
Item 9. |
|
Changes in and Disagreements With Accountants on Accounting and Financial Disclosure |
|
70 |
|
Item 9A. |
|
|
70 |
|
|
Item 9B. |
|
|
70 |
|
|
|
|
|
||
|
|
|
|||
|
|
|
|
|
|
|
Item 10. |
|
|
71 |
|
|
Item 11. |
|
|
71 |
|
|
Item 12. |
|
Security Ownership of Certain Beneficial Owners and Management and Related Stockholder Matters |
|
71 |
|
Item 13. |
|
Certain Relationships and Related Transactions, and Director Independence |
|
71 |
|
Item 14. |
|
|
71 |
|
|
|
|
|
||
|
|
|
|||
|
|
|
|
|
|
|
Item 15. |
|
|
72 |
|
|
|
|
|
73 |
|
2
Overview
CSG Systems International, Inc. (the “Company”, “CSG”, or forms of the pronoun “we”) is one of the world’s largest and most established providers of business support solutions, primarily serving the global communications industry. We have over thirty years of expertise supporting communications service providers (“CSPs”) as their businesses have evolved from a single product offering to highly complex and competitive multi-product offerings, while also requiring increasingly differentiated, real-time, and personalized experiences for their customers.
Our proven experience and world-class solutions support the mission critical management of our clients’ revenue, customer interactions, and digital ecosystem as they advance their video, voice, data, content, and digital services to consumers. Over the years, we have focused our research and development (“R&D”) and acquisition investments on expanding our solution set to address the complex, transformative needs of service providers. Our broad and deep solutions help our clients be competitive in a dynamically evolving global business environment, respond to changing consumer demands, quickly launch new compelling product offerings, provide enhanced customer experiences through relevant and targeted interactions, and cost-effectively streamline and scale operations.
Our principal executive offices are located at 9555 Maroon Circle, Englewood, Colorado 80112, and the telephone number at that address is (303) 200-2000. Our common stock is listed on the NASDAQ Stock Market LLC (“NASDAQ”) under the symbol “CSGS”. We are a S&P Small Cap 600 company.
Industry Overview
Background. We provide business support solutions (“BSS”) to the world’s leading CSPs, as well as clients in several evolving, highly competitive industries. Our solutions coordinate and manage many aspects of a service provider’s customer interactions, from the initial activation of customer accounts, to the support and fulfilment of various services, and through the calculation, presentment, and accounts receivables management of monthly customer statements. While our heritage is in serving the North American video and satellite market, through acquisition and organic growth, we have enhanced our solutions and approach to support the broad scope of participants in the global communications landscape such as carriers, media and entertainment, and digital content distribution.
Market Trends of Communications Industry. The global communications industry is going through an unprecedented level of change. This dramatic disruption is driving the emergence of heightened competition, innovative digital products, compelling customer engagements, real-time operational processes, and intense cost pressures. There are some key trends that are emerging as CSPs try to evolve and compete in this highly complex ecosystem.
|
|
• |
The first trend in the communications industry is the dramatic shift in purchasing power to the “always-connected” consumer, who ultimately demands any content, on any device at any time. Consumers have more choices now than ever before among various options for communication services, entertainment content, portable devices, and service providers. The competition among providers to obtain, retain, and grow their share of wallet has thus increased dramatically. CSPs must provide compelling offerings and positive customer experiences to differentiate themselves and maintain long-term customer relationships. |
|
|
• |
The next critical trend faced by CSPs is meeting the consumer demands for a seamless, real-time, and personalized engagement with providers. Consumers have become accustomed to and value a simplified purchasing experience, much like they do with online apps like music or video downloads. And while many aspects of a consumer’s experience outwardly appear simpler, the complexity behind the comprehensive services framework dramatically increases with the integration of emerging services like over-the-top (“OTT”), digital services (home security, health services, etc.), and digital payment functionality. The increased velocity required in managing relevant pricing, packaging, promotions, and personalized experiences within this changing business environment requires increased flexibility and nimbleness in the CSPs’ operational platforms. |
|
|
• |
The third trend that we see is the evolution of the CSPs to a digital lifestyle services provider. In an “always-on” and connected digital society, some CSPs desire to be the key source for content in a highly personalized experience based on individual consumer needs, desires, and consumption history. These providers look beyond their own network and provide ubiquitous access to digital services. The “brand” and the “experience” become much more important to these providers as brand loyalty and personalized experience play a larger role in purchasing decisions. They will no longer be competing solely with the traditional communication companies, but will also be competing against well-known brands like Apple, Amazon, Netflix, and Google for their share of the consumer’s wallet. And, importantly, they will be looking to create a digital |
3
|
|
services ecosystem that extends beyond the traditional video, entertainment, and content services and offer everything from e-books to health care monitoring services, thereby increasing their ecosystem and revenue management complexity. |
|
|
• |
Finally, the last trend relates to an increased pressure for CSPs to find new revenue sources, while also managing their cost structure and quality of service delivery during their business transformation. CSPs are seeing a decline in revenues and profits associated with their traditional services like wireline voice and video as a result of new or increased competition. In order to offset these declining revenues and profits, CSPs are looking for ways to improve their cost structure, grow through acquisitions, and launch new, revenue generating services with minimal capital investment. The result is many CSPs are cutting costs associated with their traditional systems, integrating disparate acquired business operations, and launching new digital services with highly-flexible, lower cost solutions. |
Overall, these market trends drive the demand for scalable, flexible, and cost-efficient revenue and customer interaction management solutions, which we believe will provide us with revenue opportunities. As a result, we have historically invested a significant amount of our revenues in R&D and have acquired companies that enable us to expand our offerings in a timely and efficient manner. We believe that our scalable, modular, and flexible solutions combined with our rich domain expertise provide the industry with proven solutions to improve their profitability and consumers’ experiences. We have specifically architected our solutions to provide operators with an incremental approach to transforming their businesses, thereby reducing the risk associated with this evolution.
Market Conditions of the Communications Industry. As the majority of our clients operate within the global communications industry sector, the economic state of this industry directly impacts our business. The global communications industry has undergone significant fluctuations in growth rates and capital investment cycles over the past several years due to multiple competitive and economic factors. Current economic indices suggest a stabilization of the industry, but it is impossible to predict whether this stabilization will persist or be subject to future instability. In addition, industry consolidation continues as CSPs look for ways to expand their product offerings, extend their market share, increase their revenues, and gain greater scale efficiencies in their operations.
The impact of these market factors has resulted in spending cautiousness with large transformational projects being displaced in favor of more incremental changes to business operations. Globally, mature operators are looking for ways to differentiate competitive offerings, foster customer loyalty, effectively control costs, streamline operations, and scale business operations, while operators in emerging markets are focusing on capitalizing on the rapid growth of new digital services and the explosion of connected devices. Regardless of the specific situation, companies continue to have an increased focus on investing in those solutions and services that have a demonstrable short-term return on investment, generate new revenues, and help businesses remain competitive and meet rapidly changing consumer demands.
Business Strategy
Our goal is to be the most trusted provider of world-class cloud and software-based solutions to service providers around the globe who depend upon the timely and accurate processing of complex, high-volume transactions to operate their business and deliver a superior customer experience. We believe that by successfully executing on this goal we can grow our revenues and earnings, and therefore, create long-term value for our clients, employees, and stockholders. Our strategic focus to accomplish this goal is as follows:
Expand Our Leadership Position in Cable and Satellite Markets. While we have a dominant market share position in the North American cable and satellite business already, we believe that we can expand this share further. Over the past year, we advanced our progress with this initiative with continued subscriber conversions to our platforms and extending our domain expertise and products globally.
Create More Long-Term, Recurring Relationships Within the Communications Industry. Our relentless, relationship-driven, customer-focused business approach is built on a foundation of respect, integrity, and collaboration. As a result, we enjoy long-term relationships with many of the world’s leading CSPs based on a true partnership aimed at helping providers enable sustainable growth, create efficiencies, and deliver differentiated services to their customers. We have seen successful adoption of our managed services approach with global CSPs based upon our compelling value proposition and proven track record.
Expand Our Product and Services Portfolio Through Continuous Innovation. We believe that our product technology, cloud-based solutions, and pre-integrated suite of solutions give service providers a competitive advantage. Our solutions allow providers to effectively manage their traditional businesses while being able to also quickly deliver new digital services directly to consumers with a modern, personalized, branded experience driving customer satisfaction, and loyalty. We continually add new, relevant capabilities to what we do as a company, both in terms of our people and our solutions. By doing this, we build very strong recurring relationships which are difficult for our competitors to displace.
4
Deliver On Our Commitments. Our products and services are business critical. We help our clients manage the entire customer lifecycle, from acquisition to servicing to billing for their end customers. As a result, it is imperative that we deliver on our commitments. For over 30 years, we have been helping blue-chip companies manage periods of explosive and sustained market growth and change – helping them drive revenues, improve their profitability, and deliver positive customer experiences. Our track record of doing what we say we are going to do has enabled us to be a trusted advisor and integral member of our clients’ operations.
Bring New Skills and Talents to Market. In order to help our clients manage the rapid pace of change in the communications industry, we invest in our people so that they are prepared to bring the highest quality technical skills, interpersonal skills, and managerial skills to our business and our clients.
In summary, we are focused on helping our clients compete more effectively and successfully in an ever-changing market.
Description of Business
Key Clients. We work with the leading communication providers located around the world. A partial list of those service providers as of December 31, 2016 is included below:
|
América Móvil |
|
Mediacom Communications |
|
Bell Canada TV |
|
MTN |
|
Bharti Airtel |
|
Singtel |
|
Cable One Inc. |
|
Telefônica |
|
Charter Communications, Inc. (“Charter”) |
|
Telstra |
|
Comcast Corporation (“Comcast”) |
|
Verizon |
|
DISH Network Corporation (“DISH”) |
|
Vodafone |
|
Hutchinson Whampoa 3G |
|
|
The North American communications industry has experienced significant consolidation over the past decade, resulting in a large percentage of the market being served by a limited number of service providers with greater size and scale, and there are possibilities of further consolidation, illustrated by the acquisition of Time Warner Cable, Inc. (“Time Warner”) by Charter. Consistent with this market concentration and our heritage in serving the North American cable and satellite markets, a large percentage of our historical revenues have been generated from our three largest clients, as shown in the table below. Clients that represented 10% or more of our revenues for 2016 and 2015 were as follows (in millions, except percentages):
|
|
|
2016 |
|
|
2015 |
|
||||||||||
|
|
|
Amount |
|
|
% of Revenues |
|
|
Amount |
|
|
% of Revenues |
|
||||
|
Comcast |
|
$ |
195 |
|
|
|
26 |
% |
|
$ |
177 |
|
|
|
24 |
% |
|
Charter/Time Warner (combined for all periods) |
|
|
160 |
|
|
|
21 |
% |
|
|
155 |
|
|
|
21 |
% |
|
DISH |
|
|
102 |
|
|
|
13 |
% |
|
|
107 |
|
|
|
14 |
% |
See the Significant Client Relationships section of our MD&A for additional information regarding our business relationships with these key clients.
Research and Development. Our clients around the world are facing competition from new entrants and at the same time, are deploying new services at a rapid pace and dramatically increasing the complexity of their business operations. Therefore, we continue to make meaningful investments in R&D to ensure that we stay ahead of our clients’ needs and advance our clients’ businesses as well as our own. We recognize these challenges and believe our value proposition is to provide solutions that help our clients ensure that each customer interaction is an opportunity to create value and deepen the business relationship. As a result of our R&D efforts, we have broadened our footprint within our client base with many new innovative product offerings.
Our total R&D expenses for 2016 and 2015 were $98.7 million and $102.0 million, respectively, or approximately 13% and 14%, respectively, of our total revenues. We anticipate the level of R&D investment to trend up due to the heightened level of our planned investments for 2017.
There are certain inherent risks associated with significant technological innovations. Some of these risks are described in this report in our Risk Factors section below.
5
Products and Services. Our products and services help companies with complex transaction-centric business models manage the opportunities and challenges associated with accurately capturing, managing, generating, and optimizing the revenue associated with the immense volumes of customer interactions and then manage the intricate nature of those customer relationships. Our primary product solutions include the following:
|
|
• |
Revenue Management & Customer Experience Solutions: Our revenue management solutions provide global service providers with a robust, integrated real-time revenue management framework in either a cloud-based or stand-alone environment to support a single view of the customer across all services and transactions. |
|
|
o |
Our Advanced Convergent Platform (“ACP”), is a private, cloud-based solution for cable and satellite providers in North America. ACP and our related business support solutions are relied upon every single day by over 58 million consumers of voice, video, and data services, and are used by more than 100,000 of our clients’ customer service agents, and 40,000 of our clients’ field force technicians, dispatchers, and routers. |
|
|
o |
Ascendon is deployed in some of the world’s leading media and entertainment companies and is a SaaS-based, cloud platform that provides a trusted path to digital transformation. With Ascendon, organizations can offer new, digital services right now, while moving purposefully toward a business model that dramatically reduces operational expenses, fully digitizes front and back offices, and unites a portfolio of services into a single customer relationship that allows for a deep customer engagement across all communication channels. |
|
|
o |
And, leading wireline, wireless, IP carriers, and Mobile Virtual Network Operators (MVNOs) rely on our Singleview solution to deliver real-time charging, pre-and post-paid billing for fully converged services from a single platform. |
|
|
• |
Customer Interaction Management: Our customer interaction management solutions are a diverse and integrated suite of tools designed to manage and improve every aspect of the customer experience. We are an industry leader in supporting omni-channel communications between our clients and their customers, processing more than one billion interactive voice, SMS/text, print, e-mail, web, and fax messages each year. |
|
|
• |
Managed Services: Our managed services offering leverages our 30+ year history in running highly scalable, complex business support solutions to improve operational efficiencies and effectiveness. For our managed services clients, we assume long-term responsibility for delivering our software solutions and related operations under a defined scope and specified service levels. Under managed services agreements, we may operate software products (primarily our software solutions) on behalf of our clients: (i) out of a client’s data center; (ii) out of a data center we own and operate; or (iii) out of a third-party data center (including public cloud providers) we contract with for such services. |
|
|
• |
Mediation and Data Management: Our Total Service Mediation (“TSM”) solution provides a comprehensive framework enabling network operators to achieve maximum efficiency with the lowest cost for all interactions between the network and other business support solution applications and related processes. The TSM framework supports offline and real-time mediation requirements as well as service activation. Recognized for its high performance and exceptional throughput, TSM provides the event processing foundation to manage today’s exploding network traffic. |
|
|
• |
Wholesale Settlement and Routing: Our market-leading Wholesale Business Management Solution (“WBMS”) is a comprehensive and powerful settlements system delivered in either a cloud or stand-alone environment. It handles every kind of traffic – from simple voice to the most advanced data and content services – in a single, highly-integrated platform. It helps operators around the globe improve profits, meet strict regulatory and audit compliance requirements, and comply with the broadest range of global standards. |
Historically, a substantial percentage of our total revenues have been generated from ACP and Customer Interaction Management solutions. These products and services are expected to provide a large percentage of our total revenues in the foreseeable future as well.
Business Acquisitions. Our strategy includes acquiring assets and businesses which provide the technology and personnel to expedite our product development efforts, provide complementary products and services, increase market share, and/or provide access to new markets and clients.
Professional Services. We employ professional services experts globally who bring a wide-ranging expertise – including solution architecture, project management, systems implementation, and business consultancy – to every project. We apply a proven methodology to each of our engagements, leveraging consistent world-class processes, best-practice programs, and systemized templates for all engagements.
6
Sales and Marketing. We organize our sales efforts to clients primarily within our geographically dispersed, dedicated account teams, with senior level account managers who are responsible for new revenues and renewal of existing contracts within a client account. The account teams are supported by sales support personnel who are experienced in the various products and services that we provide.
Competition. The market for business support solutions products and services in the communications industry, as well as in other industries we serve, is highly competitive. We compete with both independent providers and in-house developers of customer management systems. We believe that our most significant competitors in our primary markets are Amdocs Limited and NEC Corporation; network equipment providers such as Ericsson and Huawei; and internally-developed solutions. Some of our actual and potential competitors have substantially greater financial, marketing, and technological resources than us and in some instances we may actually partner and collaborate with our competitors on large opportunities and projects.
We believe service providers in our industry use the following criteria when selecting a vendor for the mission critical management of their revenue, customer interactions and digital ecosystem: (i) functionality, scalability, flexibility, interoperability, and architecture of the software assets; (ii) the breadth and depth of pre-integrated product solutions; (iii) product quality, client service, and support; (iv) operational excellence and reliability; (v) quality of R&D efforts; and (vi) total cost of ownership. We believe that our products and services allow us to compete effectively in these areas.
Proprietary Rights and Licenses
We rely on a combination of trade secret, copyright, trademark, and patent laws in the United States (“U.S.”) and similar laws in other countries, and non-disclosure, confidentiality, and other types of contractual arrangements to establish, maintain, and enforce our intellectual property rights in our solutions. Despite these measures, any of our intellectual property rights could be challenged, invalidated, circumvented, or misappropriated. Although we hold a limited number of patents and patent applications on some of our newer solutions, we do not rely upon patents as a primary means of protecting our rights in our intellectual property. In any event, there can be no assurance that our patent applications will be approved, that any issued patents will adequately protect our intellectual property, or that such patents will not be challenged by third parties. Also, much of our business and many of our solutions rely on key technologies developed or licensed by third parties, and we may not be able to obtain or continue to obtain licenses and technologies from these third parties at all or on reasonable terms. Our failure to adequately establish, maintain, and protect our intellectual property rights could have a material adverse impact on our business, financial condition, and results of operations. For a description of the risks associated with our intellectual property rights, see “Item 1A - Risk Factors - Failure to Protect Our Intellectual Property Rights or Claims by Others That We Infringe Their Intellectual Property Rights Could Substantially Harm Our Business, Financial Condition and Results of Operations.”
Employees
As of December 31, 2016, we had a total of 3,312 employees, an increase of 35 employees when compared to the number of employees we had as of December 31, 2015. Our success is dependent upon our ability to attract and retain qualified employees. We are subject to various foreign employment laws and regulations based on the country in which our employees are located. We believe that our relations with our employees are good.
Available Information
Our annual reports on Form 10-K, quarterly reports on Form 10-Q, current reports on Form 8-K, proxy materials, and amendments to those reports filed or furnished pursuant to Section 13(a) or 15(d) of the Securities Exchange Act are available free of charge on our website at www.csgi.com. Additionally, these reports are available at the SEC’s Public Reference Room at 100 F Street, NE., Washington, D.C. 20549 or on the SEC’s website at www.sec.gov. Information on the operation of the Public Reference Room can be obtained by calling the SEC at 1-800-SEC-0330.
Code of Conduct and Business Ethics
A copy of our Code of Conduct and Business Ethics (the “Code of Conduct”) is maintained on our website. Any future amendments to the Code of Conduct, or any future waiver of a provision of our Code of Conduct, will be timely posted to our website upon their occurrence. Historically, we have had minimal changes to our Code of Conduct, and have had no waivers of a provision of our Code of Conduct.
7
We or our representatives from time-to-time may make or may have made certain forward-looking statements, whether orally or in writing, including without limitation, any such statements made or to be made in MD&A contained in our various SEC filings or orally in conferences or teleconferences. We wish to ensure that such statements are accompanied by meaningful cautionary statements, so as to ensure, to the fullest extent possible, the protections of the safe harbor established in the Private Securities Litigation Reform Act of 1995.
Accordingly, the forward-looking statements are qualified in their entirety by reference to and are accompanied by the following meaningful cautionary statements identifying certain important risk factors that could cause actual results to differ materially from those in such forward-looking statements. This list of risk factors is likely not exhaustive. We operate in rapidly changing and evolving markets throughout the world addressing the complex needs of communication service providers, financial institutions, and many others, and new risk factors will likely emerge. Further, as we enter new market sectors such as financial services, as well as new geographic markets, we are subject to new regulatory requirements that increase the risk of non-compliance and the potential for economic harm to us and our clients. Management cannot predict all of the important risk factors, nor can it assess the impact, if any, of such risk factors on our business or the extent to which any risk factor, or combination of risk factors, may cause actual results to differ materially from those in any forward-looking statements. Accordingly, there can be no assurance that forward-looking statements will be accurate indicators of future actual results, and it is likely that actual results will differ from results projected in forward-looking statements and that such differences may be material.
We Derive a Significant Portion of Our Revenues From a Limited Number of Clients, and the Loss of the Business of a Significant Client Could Have a Material Adverse Effect on Our Financial Position and Results of Operations.
Over the past decade, the worldwide communications industry has experienced significant consolidation, resulting in a large percentage of the market being served by a limited number of service providers with greater size and scale, and there are possibilities of further consolidation. Consistent with this market concentration, we generate approximately 60% of our revenues from our three largest clients, which are (in order of size) Comcast, Charter (to include the recently acquired Time Warner business), and DISH, which each individually accounted for 10% or more of our total revenues. See the Significant Client Relationships section of MD&A for key renewal dates and a brief summary of our business relationship with these clients.
There are inherent risks whenever a large percentage of total revenues are concentrated with a limited number of clients. One such risk is that a significant client could: (i) undergo a formalized process to evaluate alternative providers for services we provide; (ii) terminate or fail to renew their contracts with us, in whole or in part for any reason; (iii) significantly reduce the number of customer accounts processed on our solutions, the price paid for our services, or the scope of services that we provide; or (iv) experience significant financial or operating difficulties. Any such development could have a material adverse effect on our financial position and results of operations and/or trading price of our common stock.
Our industry is highly competitive, and as a result, it is possible that a competitor could increase its footprint and share of customers serviced at our expense or a service provider could develop their own internal solutions. While our clients may incur some costs in switching to our competitors or their own internally-developed solutions, they may do so for a variety of reasons, including: (i) price; (ii) dissatisfaction with our solutions or service levels; or (iii) dissatisfaction with our relationships.
We May Not Realize Our Anticipated Growth With Comcast Related to New Customer Account Conversion Opportunities.
In July 2014, we entered into an expanded and extended contract with our largest client, Comcast. The expanded contract provides the framework for Comcast to consolidate its residential business onto our billing solution. Since that time, Comcast has added approximately seven million residential customer accounts onto our billing solution. We believe we have the opportunity to convert up to an additional two to three million Comcast customer accounts that are currently on one of our competitor’s platforms onto our solution over the next year as part of Comcast’s future standardization initiatives for their residential business.
Although Comcast has expressed to us their intention to consolidate their residential customer accounts to our platform, they have no financial or legal requirement to do so. The timing of and the number of customer accounts to be converted to CSG, if any, is at the discretion of Comcast. There can be no assurances, therefore, as to the timing or the number of any new customer accounts converted to us by Comcast.
We May Not Be Able to Efficiently and Effectively Implement New Solutions or Convert Clients onto Our Solutions.
Our continued growth plans include the implementation of new solutions, as well as migrating both new and existing clients to our solutions. Such implementations or conversions (collectively referred to hereafter in this section as “implementations”), regardless of whether they involve new solutions or new customers, have become increasingly more difficult because of the sophistication,
8
complexity, and interdependencies of the various software and network environments impacted, combined with the increasing complexity of the clients’ underlying business processes. In addition, the complexity of the implementations increases when the arrangement includes other vendors participating in the project, including but not limited to, prime and subcontractor relationships with our company. For these reasons, implementations subject our clients’ to potential business disruption, which could cause them to delay or even cancel future implementations.
As a result, there is a risk that we may experience cancellations, delays, or unexpected costs associated with implementations. In addition, our inability to complete implementations in an efficient and effective manner could have a material adverse effect on our results of operations, and could damage our reputation in the market place, reducing our opportunity to grow our business with both new and existing clients.
The Delivery of Our Solutions is Dependent on a Variety of Computing Environments and Communications Networks Which May Not Be Available or May Be Subject to Security Attacks.
Our solutions are generally delivered through a variety of third-party and internally-operated computing environments (collectively referred to hereafter in this section as “Systems”). The end users are connected to our Systems through a variety of public and private communications networks, which we will collectively refer to herein as “Networks.” Our solutions are generally considered to be mission critical customer management systems by our clients. As a result, our clients are highly dependent upon the high availability and uncompromised security of our Networks and Systems to conduct their business operations.
Our Networks and Systems are subject to the risk of an extended interruption, outage, or security breach due to many factors such as: (i) planned changes to our Systems and Networks for such things as scheduled maintenance and technology upgrades, or conversions to other technologies, service providers, or physical location of hardware; (ii) defects in software program(s); (iii) human and machine error; (iv) acts of nature; and (v) intentional, unauthorized attacks from computer “hackers”, or cyber-attacks. Most recently, the marketplace is experiencing an ever-increasing exposure to both the number and severity of cyber-attacks. In addition, we continue to expand our use of the Internet with our product offerings thereby permitting, for example, our clients’ customers to use the Internet to review account balances, order services or execute similar account management functions. Allowing access to our Networks and Systems via the Internet has the potential to increase their vulnerability to unauthorized access and corruption, as well as increasing the dependency of our Systems’ reliability on the availability and performance of the Internet and end users’ infrastructure they obtain through other third party providers.
The method, manner, cause and timing of an extended interruption, outage, or security breach in our Networks or Systems are impossible to predict. As a result, there can be no assurances that our Networks and Systems will not fail, not suffer a security breach or that our business continuity or remediation plans will adequately mitigate the negative effects of a disruption or security breach to our Networks or Systems. Further, our property, technology errors and omissions, and business interruption insurance may not adequately compensate us for losses that we incur as a result of such interruptions or security breaches. Should our Networks or Systems: (i) experience an extended interruption or outage; (ii) have their security breached; or (iii) have their data lost, corrupted or otherwise compromised, it would impede our ability to meet product and service delivery obligations, and likely have an immediate impact to the business operations of our clients. This would most likely result in an immediate loss to us of revenue or increase in expense, as well as damaging our reputation. The loss of confidential information could result in losing the customers’ confidence, as well as imposition of fines and damages. Any of these events could have an immediate, negative impact upon our financial position and our short-term revenue and profit expectations, as well as our long-term ability to attract and retain new clients.
The Occurrence or Perception of a Security Breach or Disclosure of Confidential Personally Identifiable Information Could Harm Our Business.
In providing solutions to our clients, we process, transmit, and store confidential and personally identifiable information (“PII”), including social security numbers and financial information. Our treatment of such information is subject to contractual restrictions and federal, state, and foreign data privacy laws and regulations, which continue to evolve resulting in greater scrutiny over the protection of PII. In response to these evolving restrictions and regulations, we leverage various data encryption strategies and have implemented measures to protect against unauthorized access to such information, and comply with these laws and regulations. These measures include standard industry practices (i.e. ISO-27002 guidelines), periodic security reviews of our systems by independent parties, network firewalls, procedural controls, intrusion detection systems, and antivirus applications. Because of the inherent risks and complexities to defend against cybercrime, these measures may fail to adequately protect this information. Any failure on our part to protect the privacy of personally identifiable information or comply with data privacy laws and regulations may subject us to contractual liability and damages, loss of business, damages from individual claimants, fines, penalties, criminal prosecution, and unfavorable publicity. Even the mere perception of a security breach or inadvertent disclosure of personally identifiable information could damage our reputation and inhibit market acceptance of our solutions. In addition, third party vendors that we engage to perform services for us may unintentionally release personally identifiable information or otherwise fail to comply with applicable laws and regulations. The occurrence of any of these events could have an adverse effect on our business, financial position, and results of operations.
9
Our Business is Highly Dependent on the Global Communications Industry.
Since a large percentage of our revenues are generated from clients that operate within the global communications industry sector, we are highly dependent on the health and the business trends occurring within this industry (in particular for our North American cable and satellite clients). Key factors within this industry that could potentially impact our clients’ businesses, and thus, our business, are as follows:
|
|
• |
Key Market Conditions: The global communications industry has undergone significant fluctuations in growth rates and capital investment cycles in the past decade. Current economic indices suggest a slow stabilization of the industry, but it is impossible to predict whether this stabilization will persist or be subject to future instability. |
In addition, changes in demand for traditional services for CSPs are causing them to seek new revenue sources, while also managing their cost structure and quality of service delivery during their business transformation. The result is that many CSPs are delaying investment decision on maintaining/advancing legacy systems, and/or making investments in new solutions to drive their business forward into new areas.
|
|
• |
Market Consolidation: The pace of consolidation within the industry continues to accelerate as service providers look to increase the scale of their operations and footprint within the entire communications ecosystem. Potential byproducts of this consolidation that could impact us are as follows: (i) there could be fewer providers in the market, each with potentially greater bargaining power and economic leverage due to their larger size, which may result in our having to lower our prices to remain competitive, retain our market share, or comply with the surviving client’s current more favorable contract terms, and (ii) the controlling entity in a consolidation that is not our current client, may acquire one of our existing clients and choose to consolidate both entities onto the controlling entity’s software platform, thus reducing and possibly eliminating our business with our existing client. |
Also, as consolidated entities execute upon their revenue and operational synergies, there is generally a slowdown in decision-making on large transformational projects, discretionary spending, and/or on new business initiatives. While this could be a timing issue only, it could impact quarterly and annual results.
|
|
• |
Increased Competition: Our clients operate in a highly competitive environment. Competitors range from traditional wireline and wireless providers to new entrants like new digital lifestyle service providers such as Hulu, YouTube, Google, Netflix, Apple, and Amazon. Should these competitors be successful in their strategies, it could threaten our clients’ market share, pricing power, and level of services delivered, all of which could negatively impact our clients’ revenues, putting pressure on our source of revenues, as generally speaking, these companies do not use our core solutions and there can be no assurance that new entrants will become our clients. In addition, demand for spectrum, network bandwidth and content continues to increase and any changes in the regulatory environment could have a significant impact to not only our clients’ businesses, but in our ability to help our clients be successful. |
The above industry factors are impacting our clients’ businesses, and thus could cause delays, cancellations/loss of business, and/or downward pricing pressure on our sales and services. This could cause us to either fall short of revenue expectations or have a cost model that is misaligned with revenues, either or both of which could have a material adverse effect on our financial position and results of operations.
We May Not Be Able to Respond to Rapid Technological Changes.
The market for business support solutions, such as customer care and billing solutions, is characterized by rapid changes in technology and is highly competitive with respect to the need for timely product innovations and new product introductions. As a result, we believe that our future success in sustaining and growing our revenues depends upon: (i) our ability to continuously expand, adapt, modify, maintain, and operate our solutions to address the increasingly complex and evolving needs of our clients without sacrificing the reliability or quality of the solutions; (ii) the integration of acquired technologies and their widely distributed, complex worldwide operations; and (iii) creating and maintaining an integrated suite of customer care and billing solutions, which are portable to new verticals such as utilities, financial services, and content distribution. In addition, the market is demanding that our solutions have greater architectural flexibility and interoperability, and that we are able to meet the demands for technological advancements to our solutions at a greater pace. Our attempts to meet these demands subjects our R&D efforts to greater risks.
As a result, substantial and effective R&D and product investment will be required to maintain the competitiveness of our solutions in the market. Technical problems may arise in developing, maintaining, integrating, and operating our solutions as the complexities are increased. Development projects can be lengthy and costly, and may be subject to changing requirements, programming difficulties, a shortage of qualified personnel, and/or unforeseen factors which can result in delays. In addition, we may be responsible for the implementation of new solutions and/or the conversion of clients to new solutions, and depending upon the specific solution, we may also be responsible for operations of the solution.
10
There is an inherent risk in the successful development, implementation, conversion, integration, and operation of our solutions as the technological complexities, and the pace at which we must deliver these solutions to market, continue to increase. The risk of making an error that causes significant operational disruption to a client, or results in incorrect customer or vendor data processing that we perform on behalf of our clients, increases proportionately with the frequency and complexity of changes to our solutions and new delivery models. There can be no assurance: (i) of continued market acceptance of our solutions; (ii) that we will be successful in the development of enhancements or new solutions that respond to technological advances or changing client needs at the pace the market demands; or (iii) that we will be successful in supporting the implementation, conversion, integration, and/or operations of enhancements or new solutions.
A Reduction in Demand for Our Key Business Support Solutions Could Have a Material Adverse Effect on Our Financial Position and Results of Operations.
Historically, a substantial percentage of our total revenues have been generated from our core cloud-based product, ACP, and related solutions. These solutions are expected to continue to provide a large percentage of our total revenues in the foreseeable future. Any significant reduction in demand for ACP and related solutions could have a material adverse effect on our financial position and results of operations. Likewise, a large percentage of revenues derived from our software license and services business have been derived from wholesale billing, retail billing and mediation products which are typically associated with large implementation projects. A sudden downward shift in demand for these products or for our professional services associated with these products could have a material adverse effect on our financial position and results of operations.
Failure to Attract and Retain Our Key Management and Other Highly Skilled Personnel Could Have a Material Adverse Effect on Our Business.
Our future success depends in large part on the continued service of our key management, sales, product development, professional services, and operational personnel. We believe that our future success also depends on our ability to attract and retain highly skilled technical, managerial, operational, and sales and marketing personnel, including, in particular, personnel in the areas of R&D, professional services, and technical support. Competition for qualified personnel at times can be intense, particularly in the areas of R&D, conversions, software implementations, and technical support. This risk is heightened with a widely dispersed customer base and employee populations. For these reasons, we may not be successful in attracting and retaining the personnel we require, which could have a material adverse effect on our ability to meet our commitments and new product delivery objectives.
Variability of Our Quarterly Revenues and Our Failure to Meet Revenue and Earnings Expectations Would Negatively Affect the Market Price of Our Common Stock.
From time to time, we may experience variability in quarterly revenues and operating results. Common causes of failure to meet revenue and operating expectations include, among others:
|
|
• |
Inability to close and/or recognize revenue on certain transactions in the period originally anticipated; |
|
|
• |
Delays in renewal of multiple or individually significant agreements; |
|
|
• |
Inability to renew existing arrangements at anticipated rates; |
|
|
• |
Delays in timing of initiation and/or implementation of significant projects or arrangements; |
|
|
• |
Inability to meet client expectations materially within our cost estimates; |
|
|
• |
Changes in spending and investment levels; |
|
|
• |
Foreign currency fluctuations; and |
|
|
• |
Economic and political conditions. |
Should we fail to meet our revenue and earnings expectations of the investment community, by even a relatively small amount, it would most likely have a disproportionately negative impact upon the market price of our common stock.
Our International Operations Subject Us to Additional Risks.
We currently conduct a portion of our business outside the U.S. We are subject to certain risks associated with operating internationally including the following items:
|
|
• |
Product development not meeting local requirements; |
|
|
• |
Fluctuations in foreign currency exchange rates for which a natural or purchased hedge does not exist or is ineffective; |
|
|
• |
Staffing and managing foreign operations; |
|
|
• |
Longer sales cycles for new contracts; |
11
|
|
• |
Longer collection cycles for client billings or accounts receivable, as well as heightened client collection risks, especially in countries with highly inflationary economies and/or restrictions on the movement of cash out of the country; |
|
|
• |
Trade barriers; |
|
|
• |
Governmental sanctions; |
|
|
• |
Complying with varied legal and regulatory requirements across jurisdictions; |
|
|
• |
Reduced protection for intellectual property rights in some countries; |
|
|
• |
Inability to recover value added taxes and/or goods and services taxes in foreign jurisdictions; |
|
|
• |
Political instability and threats of terrorism; and |
|
|
• |
A potential adverse impact to our overall effective income tax rate resulting from, among other things: |
|
|
• |
Operations in foreign countries with higher tax rates than the U.S.; |
|
|
• |
The inability to utilize certain foreign tax credits; and |
|
|
• |
The inability to utilize some or all of losses generated in one or more foreign countries. |
One or more of these factors could have a material adverse effect on our international operations, which could adversely impact our results of operations and financial position.
We May Not Be Successful in the Integration of Our Acquisitions.
As part of our growth strategy, we seek to acquire assets, technology, and businesses which will provide the technology and personnel to expedite our product development efforts, provide complementary solutions, or provide access to new markets and clients.
Acquisitions involve a number of risks and difficulties, including: (i) expansion into new markets and business ventures; (ii) the requirement to understand local business practices; (iii) the diversion of management’s attention to the assimilation of acquired operations and personnel; (iv) being bound by acquired client or vendor contracts with unfavorable terms; and (v) potential adverse effects on a company’s operating results for various reasons, including, but not limited to, the following items: (a) the inability to achieve financial targets; (b) the inability to achieve certain financial expectations, operating goals, and synergies; (c) costs incurred to exit current or acquired contracts or activities; (d) costs incurred to service any acquisition debt; and (e) the amortization or impairment of acquired intangible assets.
Due to the multiple risks and difficulties associated with any acquisition, there can be no assurance that we will be successful in achieving our expected strategic, operating, and financial goals for any such acquisition.
Our International Operations Require Us To Comply With Applicable U.S. and International Laws and Regulations.
Doing business on a worldwide basis requires our company and our subsidiaries to comply with the laws and the regulations of the U.S. government and various international jurisdictions. In addition, the number of countries enacting anti-corruption laws and related enforcement activities is increasing. These regulations place restrictions on our operations, trade practices and trade partners. In particular, our international operations are subject to U.S. and foreign anti-corruption laws and regulations such as the Foreign Corrupt Practices Act (“FCPA”), the U.K. Anti-Bribery Act and economic sanction programs administered by the Office of Foreign Assets Control (“OFAC”).
The FCPA prohibits us from providing anything of value to foreign officials for the purposes of influencing official decisions or obtaining or retaining business. In addition, the FCPA imposes accounting standards and requirements on publicly traded U.S. corporations and their foreign affiliates, which are intended to prevent the diversion of corporate funds to the payment of bribes and other improper payments, and to prevent the establishment of “off books” slush funds from which such improper payment can be made. As part of our business, we regularly deal with state-owned business enterprises, the employees of which are considered foreign officials for purposes of the FCPA. In addition, some of the international locations in which we operate lack a developed legal system and have higher than normal levels of corruption. We inform our personnel and third-party sales representatives of the requirements of the FCPA and other anti-corruption laws, including, but not limited to their reporting requirements. We have also developed and will continue to develop and implement systems for formalizing contracting processes, performing due diligence on agents and improving our recordkeeping and auditing practices regarding these regulations. However, there is no guarantee that our employees, third-party sales representatives or other agents have not or will not engage in conduct undetected by our processes and for which we might be held responsible under the FCPA or other anti-corruption laws.
12
Economic sanctions programs restrict our business dealings with certain countries and individuals. From time to time, certain of our foreign subsidiaries have had limited business dealings with entities in jurisdictions subject to OFAC-administered sanctions. As a result of our worldwide business, we are exposed to a heightened risk of violating anti-corruption laws and OFAC regulations. Violations of these laws and regulations are punishable by civil penalties, including fines, injunctions, asset seizures, debarment from government contracts and revocations or restrictions of licenses, as well as criminal fines and imprisonment.
Our Use of Open Source Software May Subject Us to Certain Intellectual Property-Related Claims or Require Us to Re-Engineer Our Software, Which Could Harm Our Business.
We use open source software in connection with our solutions, processes, and technology. Companies that use or incorporate open source software into their products have, from time to time, faced claims challenging their use, ownership and/or licensing rights associated with that open source software. As a result, we could be subject to suits by parties claiming certain rights to what we believe to be open source software. Some open source software licenses require users who distribute open source software as part of their software to publicly disclose all or part of the source code in their software and make any derivative works of the open source code available on unfavorable terms or at no cost. In addition to risks related to license requirements, use of open source software can lead to greater risks than use of third party commercial software, as open source licensors generally do not provide warranties, support, or controls with respect to origin of the software. Use of open source software also complicates compliance with export-related laws. While we take measures to protect our use of open source software in our solutions, open source license terms may be ambiguous, and many of the risks associated with usage of open source software cannot be eliminated. If we were found to have inappropriately used open source software, we may be required to release our proprietary source code, re-engineer our software, discontinue the sale of certain solutions in the event re-engineering cannot be accomplished on a timely basis, or take other remedial action that may divert resources away from our development efforts, any of which could adversely affect our business, financial position, and results of operations.
We Face Significant Competition in Our Industry.
The market for our solutions is highly competitive. We directly compete with both independent providers and in-house solutions developed by existing and potential clients. In addition, some independent providers are entering into strategic alliances with other independent providers, resulting in either new competitors, or competitors with greater resources. Many of our current and potential competitors have significantly greater financial, marketing, technical, and other competitive resources than our company, many with significant and well-established domestic and international operations. There can be no assurance that we will be able to compete successfully with our existing competitors or with new competitors.
Failure to Protect Our Intellectual Property Rights or Claims by Others That We Infringe Their Intellectual Property Rights Could Substantially Harm Our Business, Financial Position and Results of Operations.
We rely on a combination of trade secret, copyright, trademark, and patent laws in the U.S. and similar laws in other countries, and non-disclosure, confidentiality, and other types of contractual arrangements to establish, maintain, and enforce our intellectual property rights in our solutions. Despite these measures, any of our intellectual property rights could be challenged, invalidated, circumvented, or misappropriated. Further, our contractual arrangements may not effectively prevent disclosure of our confidential information or provide an adequate remedy in the event of unauthorized disclosure of our confidential information. Others may independently discover trade secrets and proprietary information, which may complicate our assertion of trade secret rights against such parties. Costly and time consuming litigation could be necessary to enforce and determine the scope of our proprietary rights, and failure to obtain or maintain trade secret protection could adversely affect our competitive business position. In addition, the laws of certain countries do not protect proprietary rights to the same extent as the laws of the U.S. Therefore, in certain jurisdictions, we may be unable to protect our proprietary technology adequately against unauthorized third party copying or use, which could adversely affect our competitive position.
Although we hold a limited number of patents and patent applications on some of our solutions, we do not rely upon patents as a primary means of protecting our rights in our intellectual property. In any event, there can be no assurance that our patent applications will be approved, that any issued patents will adequately protect our intellectual property, or that such patents will not be challenged by third parties. Also, much of our business and many of our solutions rely on key technologies developed or licensed by third parties, and we may not be able to obtain or continue to obtain licenses and technologies from these third parties at all or on reasonable terms.
Finally, third parties may claim that we, our clients, licensees or other parties indemnified by us are infringing upon their intellectual property rights. Even if we believe that such claims are without merit, they can be time consuming and costly to defend and distract management’s and technical staff’s attention and resources. Claims of intellectual property infringement also might require us to redesign affected solutions, enter into costly settlement or license agreements or pay costly damage awards, or face a temporary or permanent injunction prohibiting us from marketing or selling certain of our solutions. Even if we have an agreement to indemnify us against such costs, the indemnifying party may be unable to uphold its contractual obligations. If we cannot or do not license the
13
infringed technology on reasonable pricing terms or at all, or substitute similar technology from another source, our business, financial position, and results of operations could be adversely impacted. Our failure to adequately establish, maintain, and protect our intellectual property rights could have a material adverse impact on our business, financial position, and results of operations.
We May Incur Material Restructuring Charges in the Future.
In the past, we have recorded restructuring charges related to involuntary employee terminations, various facility abandonments, and various other restructuring and reorganization activities. We continually evaluate ways to reduce our operating expenses through new restructuring opportunities, including more effective utilization of our assets, workforce, and operating facilities. As a result, there is a risk, which is increased during economic downturns and with expanded global operations, that we may incur material restructuring or reorganization charges in the future.
Substantial Impairment of Goodwill and Other Long-lived Assets in the Future May Be Possible.
As a result of various acquisitions and the growth of our company over the last several years, we have approximately $201 million of goodwill, and $104 million of long-lived assets other than goodwill (principally, property and equipment, software, and client contracts) as of December 31, 2016. These long-lived assets are subject to ongoing assessment of possible impairment summarized as follows:
|
|
• |
Goodwill is required to be tested for impairment on an annual basis. We have elected to do our annual test for possible impairment as of July 31 of each year. In addition to this annual requirement, goodwill is required to be evaluated for possible impairment on a periodic basis (e.g., quarterly) if events occur or circumstances change that could indicate a possible impairment may have occurred. |
|
|
• |
Long-lived assets other than goodwill are required to be evaluated for possible impairment whenever events or changes in circumstances indicate that the carrying amount of these assets may not be recoverable. |
We utilize our market capitalization and/or cash flow models as the primary basis to estimate the fair value amounts used in our goodwill and other long-lived asset impairment valuations. If an impairment was to be recorded in the future, it could materially impact our results of operations in the period such impairment is recognized, but such an impairment charge would be a non-cash expense, and therefore would have no impact on our cash flows.
None.
As of December 31, 2016, we were operating in over 25 leased sites around the world, representing approximately 550,000 square feet.
Our corporate headquarters is located in Englewood, Colorado. In addition, we lease office space in the U.S. in Atlanta, Georgia; Bloomfield, New Jersey; Chicago, Illinois; Columbia, Maryland; Omaha, Nebraska; and Philadelphia, Pennsylvania. The leases for these office facilities expire in the years 2017 through 2025. We also maintain leased facilities internationally in Australia, Brazil, Canada, China, Colombia, Denmark, France, India, Ireland, Malaysia, South Africa, Sweden, United Arab Emirates, and the U.K. The leases for these international office facilities expire in the years 2017 through 2025. We utilize these office facilities primarily for the following: (i) client services, training, and support; (ii) product and operations support; (iii) systems and programming activities; (iv) professional services staff; (v) R&D activities; (vi) sales and marketing activities; and (vii) general and administrative functions.
Additionally, we lease two statement production and mailing facilities totaling approximately 176,000 square feet. These facilities are located in: (i) Omaha, Nebraska; and (ii) Crawfordville, Florida. The leases for these facilities expire in the 2018 and 2019, respectively.
We believe that our facilities are adequate for our current needs and that additional suitable space will be available as required. We also believe that we will be able to either: (i) extend our current leases as they terminate; or (ii) find alternative space without experiencing a significant increase in cost. See Note 9 to our Financial Statements for information regarding our obligations under our facility leases.
14
From time-to-time, we are involved in litigation relating to claims arising out of our operations in the normal course of business. In the opinion of our management, we are not presently a party to any material pending or threatened legal proceedings.
Not applicable.
************************************************************************************************
Executive Officers of the Registrant
Our executive officers are Bret C. Griess (President and Chief Executive Officer), Randy R. Wiese (Executive Vice President and Chief Financial Officer), Brian A. Shepherd (Executive Vice President and President Broadband, Cable and Satellite), and Kenneth M. Kennedy (Executive Vice President, Product Development). We have employment agreements with each of the executive officers.
Bret C. Griess
President and Chief Executive Officer
Mr. Griess, 48, serves as our President and Chief Executive Officer. He joined CSG in 1996 and held a variety of positions in Operations and Information Technology, until being appointed Executive Vice President of Operations in February 2009, Chief Operating Officer in March 2011, and President in June 2015. In January 2016, Mr. Griess was appointed President and Chief Executive Officer and a member of our Board. Prior to joining CSG, Mr. Griess was Genesis Product Manager with Chief Automotive Systems from 1995 to 1996, and an information systems analyst with the Air Force from 1990 to 1995. Mr. Griess holds a M.A. degree in Management and a B.S. degree in Management from Bellevue University in Nebraska, an A.A.S. degree from the Community College of the Air Force, and an A.S. degree in Business Administration from Eastern Florida State College, formerly Brevard Community College.
Randy R. Wiese
Executive Vice President and Chief Financial Officer
Mr. Wiese, 57, serves as Executive Vice President and Chief Financial Officer for CSG. Mr. Wiese joined CSG in 1995 as Controller and later served as Chief Accounting Officer. He was named Executive Vice President and Chief Financial Officer in April 2006. Prior to joining CSG, he was manager of audit and business advisory services and held other accounting-related positions at Arthur Andersen & Co. Mr. Wiese is a member of the AICPA and the Nebraska Society of Certified Public Accountants. He holds a B.S. degree in Accounting from the University of Nebraska-Omaha.
Kenneth M. Kennedy
Executive Vice President, Product Development
Mr. Kennedy, 47, became Executive Vice President of Product Development in March 2016. In this role, he defines CSG’s product and technology roadmap while aligning the company’s technical vision with its business strategy. Mr. Kennedy is responsible for the definition, development and operations of CSG’s software solutions. Prior to this role, he served as CSG’s Chief Technology Officer and Senior Vice President of Product Management, Development and Operations from 2006 to 2016, managing CSG’s software development organization and implementing technology initiatives for CSG’s product offerings. Prior to his role at CSG, Mr. Kennedy was one of the original founders of Telution where he served as Vice President of Software Development and Professional Services from 1998 to 2006. Prior to Telution, Mr. Kennedy worked at Andersen Consulting where he was responsible for developing highly-scalable distributed software solutions for the manufacturing, financial services, and communications industries. Mr. Kennedy received a Bachelor of Business Administration and Management Information Systems from the University of Notre Dame.
Brian A. Shepherd
Executive Vice President and President, Global Broadband, Cable and Satellite Business
Mr. Shepherd, 49, serves as Executive Vice President and President of Global Broadband, Cable and Satellite Business for CSG. He joined CSG in 2016 to focus on accelerating the growth and strategic direction of CSG’s global broadband, cable and direct broadcast satellite business, where CSG has served as a trusted partner to the largest companies in the industry for more than 30 years. Mr.
15
Shepherd is an international business expert with strong management, customer relationship, global sales, strategy and corporate growth experience. In previous executive roles at companies such as TeleTech, Amdocs, DST Innovis, and McKinsey & Company, Shepherd built wide and deep relationships with C-Suite leaders, decision-makers and policy influencers who have shaped these industries globally. Mr. Shepherd graduated Magna cum laude in Economics from Wabash College and received a Master of Business Administration degree from Harvard Business School.
Board of Directors of the Registrant
Information related to our Board of Directors (the “Board”) is provided below.
Donald B. Reed
Mr. Reed, 72, was elected to the Board in May 2005 and has served as the Company’s non-executive Chairman of the Board since January 2010. Mr. Reed is presently retired. He served as Chief Executive Officer of Cable & Wireless Global from 2000 to 2003. Cable & Wireless Global, a subsidiary of Cable & Wireless plc, is a provider of internet protocol (“IP”) and data services to business customers in the U.S., United Kingdom, Europe, and Japan. From June 1998 until May 2000, Mr. Reed served Cable & Wireless in various other executive positions. Mr. Reed’s career includes 30 years at NYNEX Corporation (now part of Verizon), a regional telephone operating company. From 1995 to 1997, Mr. Reed served NYNEX Corporation as President and Group Executive with responsibility for directing the company’s regional, national, and international government affairs, public policy initiatives, legislative and regulatory matters, and public relations. Mr. Reed holds a B.A. degree in History from Virginia Military Institute.
Bret C. Griess
Mr. Griess’ biographical information is included in the “Executive Officers of the Registrant” section shown directly above.
David G. Barnes
Mr. Barnes, 55, was appointed to the Board in February 2014. He currently serves as Senior Vice President, Finance of Stantec Inc., a publicly traded global provider of engineering, consulting, and construction services. From 2009 through 2016 he served as Executive Vice President and Chief Financial Officer of MWH Global Inc., an employee-owned engineering and construction firm. MWH Global Inc. was acquired by Stantec Inc. in 2016. From 2006 to 2008, he was Executive Vice President of Western Union Financial Services. From 2004 to 2006, Mr. Barnes served as Chief Financial Officer of Radio Shack Corporation. From 1999 to 2004, he was Vice President, Treasurer and U.S. Chief Financial Officer for Coors Brewing Company. Mr. Barnes holds a M.B.A. degree from the University of Chicago and a B.A. degree from Yale University.
Ronald H. Cooper
Mr. Cooper, 60, was elected to the Board in November 2006. He is presently retired. He most recently served as the President and Chief Executive Officer of Clear Channel Outdoor Americas, Inc. from 2009 through 2012. Prior to this position, he was a Principal at Tufts Consulting LLC from 2006 through 2009. Previously, he spent nearly 25 years in the cable and telecommunications industry, most recently at Adelphia Communications where he served as President and Chief Operating Officer from 2003 to 2006. Prior to Adelphia, Mr. Cooper held a series of executive positions at AT&T Broadband, RELERA Data Centers & Solutions, MediaOne and its predecessor Continental Cablevision, Inc. He has served on various boards of directors and committees with the National Cable Television Association, California Cable & Telecommunications Association, Cable Television Association for Marketing, New England Cable Television Association, and Outdoor Advertising Association of America. Mr. Cooper holds a B.A. degree from Wesleyan University.
Marwan H. Fawaz
Mr. Fawaz, 54, was appointed to the Board in March 2016. Mr. Fawaz is currently the CEO of Nest Labs, Inc., an Alphabet company. With more than 28 years of experience in the media, cable, telecommunications and broadband industries, Mr. Fawaz offers a wealth of knowledge and expertise, developed from his time as Executive Vice President and Chief Executive Officer of Google/Motorola Mobility from 2012 to 2013 and Executive Vice President of Strategy and Operations and Chief Technology Officer of Charter Communications from 2006 to 2011. In addition, he served as Senior Vice President and Chief Technology Officer of Adelphia Communications from 2003 to 2006, and held leadership positions for other cable industry companies such as MediaOne, among others. In addition, he was the founder and principal of Sarepta Advisors, a strategic advisory and consulting group supporting the technology, media and telecommunications industries. He holds a M.S. degree in Electrical and Communication Engineering and a B.S. degree in Electrical Engineering, both from California State University at Long Beach.
16
John L. M. Hughes
Mr. Hughes, 65, was appointed to the Board in March 2011. Mr. Hughes previously served as Chairman of the Board for Intec Telecom Systems plc for nearly six years until it was acquired by us in 2010. Mr. Hughes currently serves as Chairman of the Board for Just-Eat Group plc and Spectris plc, and for privately-held IQSA Group. He is also a Director on the boards for Equinix, Inc. and privately-held Scorpion Ventures Limited. During the past five years, Mr. Hughes was formerly a Director on the boards of the public companies of Sepura plc, Telecity Group plc, and Vitec Group plc. Mr. Hughes has been an advisor to Oakley Corporate Finance since 2012 and previously served as an advisor to Advent International, a private equity fund, from 2008 to 2011. Prior to his board positions, from 2000 to 2004, Mr. Hughes served as Executive Vice President and Chief Operating Officer for Thales Group, a European provider of complex systems for the defense, aerospace, and commercial markets. Prior to 2000, he served as President of GSM/UMTS Wireless Networks of Lucent Technologies, and as a Director of Convex Global Field Operations and Vice President and Managing Director of Convex Europe, a division of Hewlett‑Packard Company. Mr. Hughes holds a B.S. degree in Electrical and Electronic Engineering from the Hatfield Polytechnic (now the University of Hertfordshire).
Janice I. Obuchowski
Ms. Obuchowski, 65, was elected to the Board in November 1997. Ms. Obuchowski is the founder and President of Freedom Technologies, Inc., a research and consulting firm providing public policy, strategic, and engineering advice to companies in the communications sector, government agencies, and international clients, a position she has held since 1992. In 2003, Ms. Obuchowski was appointed by President George W. Bush to serve as Ambassador and Head of the U.S. Delegation to the World Radiocommunication Conference. She has served as Assistant Secretary for Communications and Information at the Department of Commerce and Administrator for the National Telecommunications and Information Administration (“NTIA”) and as the head of international government relations at NYNEX Corporation. She also has served on several non-profit and other publicly traded company boards. She holds a J.D. degree from Georgetown University and a B.A. degree from Wellesley College, and also attended the University of Paris.
Frank V. Sica
Mr. Sica, 66, has served as a director of the Company since its formation in 1994. Mr. Sica is currently a Managing Partner of Tailwind Capital. From 2004 to 2005, Mr. Sica was a Senior Advisor to Soros Private Funds Management. From 2000 until 2003, he was President of Soros Private Funds Management, where he oversaw the direct real estate and private equity investment activities of Soros. In 1998, he joined Soros Fund Management where he was a Managing Director responsible for Soros’ private equity investments. Mr. Sica was previously Managing Director for Morgan Stanley Merchant Banking Division. He currently serves as a Director on the boards of JetBlue Airways, Kohl’s Corporation, and Safe Bulkers, Inc. Mr. Sica holds a M.B.A. degree from the Tuck School of Business at Dartmouth College and a B.A. degree from Wesleyan University.
Donald V. Smith
Mr. Smith, 74, was elected to the Board in January 2002. Mr. Smith is presently retired. Previously, he served as Senior Managing Director of Houlihan Lokey Howard & Zukin, Inc., an international investment banking firm with whom he had been associated from 1988 through 2009, and where he served on the board of directors. From 1978 to 1988, he served as Principal with Morgan Stanley & Co. Inc., where he headed the company’s valuation and reorganization services. He also serves on the board of directors of several non-profit organizations. Mr. Smith holds a M.B.A. degree from the Wharton Graduate School of the University of Pennsylvania and a B.S. degree from the United States Naval Academy.
James A. Unruh
Mr. Unruh, 76, was elected to the Board in June 2005. Mr. Unruh became a founding Principal of Alerion Capital Group, LLC (a private equity investment company) in 1998 and currently holds such position. Mr. Unruh was an executive with Unisys Corporation from 1987 to 1997, including serving as its Chairman and Chief Executive Officer from 1990 to 1997. From 1982 to 1986, Mr. Unruh held various executive positions, including Senior Vice President-Finance and Chief Financial Officer with Burroughs Corporation, a predecessor of Unisys Corporation. Prior to 1982, Mr. Unruh was Chief Financial Officer with Memorex Corporation and also held various executive positions with Fairchild Camera and Instrument Corporation, including Chief Financial Officer. Mr. Unruh currently serves as Director on the board of Tenet Healthcare Corporation, and formerly served as Director on the boards for Prudential Financial, Inc. and CenturyLink, Inc. during the past five years. He holds a M.B.A. degree from the University of Denver and a B.S. degree from the University of Jamestown.
17
|
Market for Registrant’s Common Equity, Related Stockholder Matters and Issuer Purchases of Equity Securities |
Our common stock is listed on NASDAQ under the symbol ‘‘CSGS’’. The following table sets forth, for the fiscal quarters indicated, the high and low sale prices of our common stock as reported by NASDAQ.
|
2016: |
|
High |
|
|
Low |
|
|
Dividends |
|
|||
|
First quarter |
|
$ |
45.96 |
|
|
$ |
32.45 |
|
|
$ |
0.185 |
|
|
Second quarter |
|
|
46.54 |
|
|
|
38.47 |
|
|
|
0.185 |
|
|
Third quarter |
|
|
44.76 |
|
|
|
39.38 |
|
|
|
0.185 |
|
|
Fourth quarter |
|
|
49.85 |
|
|
|
36.33 |
|
|
|
0.185 |
|
|
2015: |
|
High |
|
|
Low |
|
|
Dividends |
|
|||
|
First quarter |
|
$ |
30.95 |
|
|
$ |
23.72 |
|
|
$ |
0.175 |
|
|
Second quarter |
|
|
32.80 |
|
|
|
28.69 |
|
|
|
0.175 |
|
|
Third quarter |
|
|
33.20 |
|
|
|
29.18 |
|
|
|
0.175 |
|
|
Fourth quarter |
|
|
38.85 |
|
|
|
30.54 |
|
|
|
0.175 |
|
On February 21, 2017, the last sale price of our common stock as reported by NASDAQ was $39.99 per share. On January 31, 2017, the number of holders of record of common stock was 140.
Dividends
In June 2013, our Board approved the initiation of a quarterly cash dividend to be paid to our stockholders for the first time in our history. Quarterly cash dividends were paid to stockholders in March, June, September, and December of 2016 and 2015, as detailed in the table above. Going forward, we expect to continue to pay dividends each year in March, June, September, and December, with the amount and timing subject to the Board’s approval. In January 2017, our Board declared a dividend of $0.1975 per share of common stock to be paid on March 30, 2017 for shareholders of record as of the close of business on March 15, 2017.
The payment of dividends is subject to the covenants of our Credit Agreement, and has certain impacts to our convertible debt (the 2010 Convertible Notes and the 2016 Convertible Notes). See Note 5 to our Financial Statements for additional discussion of our long-term debt.
18
Stock Price Performance
The following graph compares the cumulative total stockholder return on our common stock, the Russell 2000 Index, and our Standard Industrial Classification (“SIC”) Code Index: Data Preparation and Processing Services during the indicated five-year period. The graph assumes that $100 was invested on December 31, 2011, in our common stock and in each of the two indexes, and that all dividends, if any, were reinvested.
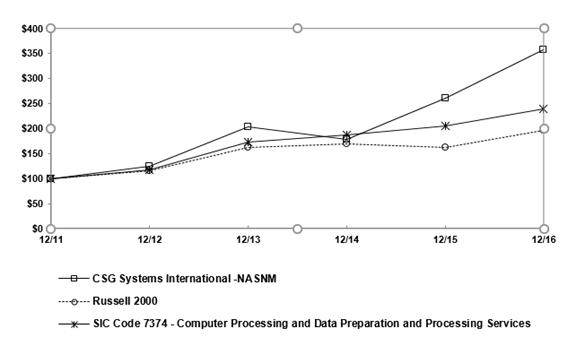
|
|
|
As of December 31, |
|
|||||||||||||||||||||
|
|
|
2011 |
|
|
2012 |
|
|
2013 |
|
|
2014 |
|
|
2015 |
|
|
2016 |
|
||||||
|
CSG Systems International, Inc. |
|
$ |
100.00 |
|
|
$ |
123.59 |
|
|
$ |
203.45 |
|
|
$ |
177.56 |
|
|
$ |
260.52 |
|
|
$ |
356.63 |
|
|
Russell 2000 Index |
|
|
100.00 |
|
|
|
116.35 |
|
|
|
161.52 |
|
|
|
169.43 |
|
|
|
161.95 |
|
|
|
196.45 |
|
|
Data Preparation and Processing Services |
|
|
100.00 |
|
|
|
116.63 |
|
|
|
172.17 |
|
|
|
186.53 |
|
|
|
205.84 |
|
|
|
239.36 |
|
Equity Compensation Plan Information
The following table summarizes certain information about our equity compensation plans as of December 31, 2016:
|
Plan Category |
|
Number of securities to be issued upon exercise of outstanding options, warrants, and rights |
|
Weighted-average exercise price of outstanding options, warrants, and rights |
|
|
Number of securities remaining available for future issuance |
|
||
|
Equity compensation plans approved by security holders |
|
— |
|
$ |
- |
|
|
|
3,971,423 |
|
Of the total number of securities remaining available for future issuance, 3,574,456 shares can be used for various types of stock-based awards, as specified in the equity compensation plan, with the remaining 396,967 shares to be used for our employee stock purchase plan. See Note 11 to our Financial Statements for additional discussion of our equity compensation plans.
19
Issuer Repurchases of Equity Securities
The following table presents information with respect to purchases of our common stock made during the fourth quarter of 2016 by CSG Systems International, Inc. or any “affiliated purchaser” of CSG Systems International, Inc., as defined in Rule 10b-18(a)(3) under the Exchange Act.
|
Period |
|
Total Number of Shares Purchased (1) (2) |
|
|
Average Price Paid Per Share |
|
|
Total Number of Shares Purchased as Part of Publicly Announced Plans or Programs (2) |
|
|
Maximum Number (or Approximate Dollar Value) of Shares that May Yet Be Purchased Under the Plan or Programs (2) |
|
||||
|
October 1 - October 31 |
|
|
42,357 |
|
|
$ |
38.44 |
|
|
|
41,019 |
|
|
|
6,754,777 |
|
|
November 1 - November 30 |
|
|
27,805 |
|
|
|
40.06 |
|
|
|
12,510 |
|
|
|
6,742,267 |
|
|
December 1 - December 31 |
|
|
- |
|
|
|
- |
|
|
|
- |
|
|
|
6,742,267 |
|
|
Total |
|
|
70,162 |
|
|
$ |
39.08 |
|
|
|
53,529 |
|
|
|
|
|
|
|
(1) |
The total number of shares purchased that are not part of the Stock Repurchase Program represents shares purchased and cancelled in connection with stock incentive plans. |
|
|
(2) |
See Note 10 to our Financial Statements for additional information regarding our share repurchases. |
20
Item 6. Selected Financial Data
The following selected financial data have been derived from our audited financial statements. The selected financial data presented below should be read in conjunction with, and is qualified by reference to, our MD&A and our Financial Statements. The information below is not necessarily indicative of the results of future operations.
|
|
|
Year Ended December 31, |
|
|||||||||||||||||
|
|
|
2016 |
|
|
2015 |
|
|
2014 |
|
|
2013 |
|
|
2012 |
|
|||||
|
|
|
(in thousands, except per share amounts) |
|
|||||||||||||||||
|
Statements of Income Data: |
|
|
|
|
|
|
|
|
|
|
|
|
|
|
|
|
|
|
|
|
|
Revenues (1)(2) |
|
$ |
760,958 |
|
|
$ |
752,520 |
|
|
$ |
751,286 |
|
|
$ |
747,468 |
|
|
$ |
756,866 |
|
|
Operating income (1)(2) |
|
|
132,629 |
|
|
|
113,140 |
|
|
|
75,690 |
|
|
|
76,704 |
|
|
|
96,574 |
|
|
Net income |
|
|
62,882 |
|
|
|
62,567 |
|
|
|
35,711 |
|
|
|
45,268 |
|
|
|
47,120 |
|
|
|
|
|
|
|
|
|
|
|
|
|
|
|
|
|
|
|
|
|
|
|
|
Weighted-average diluted shares outstanding |
|
|
33,014 |
|
|
|
33,438 |
|
|
|
33,736 |
|
|
|
32,873 |
|
|
|
32,476 |
|
|
|
|
|
|
|
|
|
|
|
|
|
|
|
|
|
|
|
|
|
|
|
|
Diluted net income per common share |
|
$ |
1.90 |
|
|
$ |
1.87 |
|
|
$ |
1.06 |
|
|
$ |
1.38 |
|
|
$ |
1.45 |
|
|
|
|
|
|
|
|
|
|
|
|
|
|
|
|
|
|
|
|
|
|
|
|
Dividend declared per share (4) |
|
$ |
0.74 |
|
|
$ |
0.70 |
|
|
$ |
0.62 |
|
|
$ |
0.45 |
|
|
$ |
- |
|
|
|
|
|
|
|
|
|
|
|
|
|
|
|
|
|
|
|
|
|
|
|
|
Key Capital Activities: |
|
|
|
|
|
|
|
|
|
|
|
|
|
|
|
|
|
|
|
|
|
Shares repurchased under Stock Repurchase Program (5) |
|
|
318 |
|
|
|
1,838 |
|
|
|
733 |
|
|
|
500 |
|
|
|
823 |
|
|
Cost of shares repurchased under Stock Repurchase Program (5) |
|
$ |
11,565 |
|
|
$ |
56,959 |
|
|
$ |
19,106 |
|
|
$ |
10,129 |
|
|
$ |
13,350 |
|
|
Dividends declared (4) |
|
|
23,753 |
|
|
|
22,852 |
|
|
|
21,327 |
|
|
|
15,214 |
|
|
|
- |
|
|
|
|
|
|
|
|
|
|
|
|
|
|
|
|
|
|
|
|
|
|
|
|
Balance Sheet Data (at Period End): |
|
|
|
|
|
|
|
|
|
|
|
|
|
|
|
|
|
|
|
|
|
Cash, cash equivalents and short-term investments (3) |
|
$ |
276,498 |
|
|
$ |
240,936 |
|
|
$ |
201,800 |
|
|
$ |
210,837 |
|
|
$ |
169,321 |
|
|
Total assets (6) |
|
|
891,879 |
|
|
|
862,731 |
|
|
|
839,367 |
|
|
|
848,705 |
|
|
|
817,964 |
|
|
Total debt (3)(6) |
|
|
416,260 |
|
|
|
279,130 |
|
|
|
250,376 |
|
|
|
257,269 |
|
|
|
264,486 |
|
|
Total treasury stock (5) |
|
|
826,002 |
|
|
|
814,437 |
|
|
|
757,478 |
|
|
|
738,372 |
|
|
|
728,243 |
|
|
Total stockholders' equity (4) |
|
|
251,360 |
|
|
|
345,845 |
|
|
|
358,633 |
|
|
|
358,262 |
|
|
|
324,880 |
|
|
(1) |
On July 13, 2012, we acquired the Ascade business, and as a result, approximately six months of their operations are included in our 2012 results (approximately $9 million of revenue impact) and a full twelve months of their operations are included in our 2013, through 2016 results. The overall cost of the Ascade acquisition was approximately $19 million, and was paid from existing cash. |
|
(2) |
In September 2015, we sold our cyber-security business, marketed under the Invotas brand, to certain former management personnel, resulting in a gain on the sale of $3.7 million. In February 2016, this business was acquired by a third-party. Based on the terms of the agreement, we received additional consideration upon a liquidation event, as defined in the agreement, which resulted in an additional gain on the sale of $6.6 million. The impact of Invotas to our business prior to the divestiture date was not material. |
On July 1, 2013, we sold a small print operation, and on December 31, 2013, we sold our marketing analytics business marketed under the Quaero brand. As a result of these divestitures, 2014 revenue levels were approximately $13 million lower when compared to our 2013 revenues generated from these businesses. We sold these businesses for a total of approximately $6 million, and recorded a total loss on the dispositions of approximately $3 million.
|
(3) |
In March 2016, we completed an offering of $230 million of 4.25% senior convertible notes due March 15, 2036. The net proceeds of approximately $223 million will be used to settle the outstanding 2010 Convertible Notes, due March 1, 2017. As of December 31, 2016, we have repurchased approximately $115 million of the 2010 Convertible Notes for approximately $216 million. The remainder of the proceeds will be used to settle the outstanding principal amount of the 2010 Convertible Notes. |
In February 2015, we refinanced our Credit Agreement. As a result, under the refinanced Credit Agreement, we: (i) extended the term of the agreement to February 2020; (ii) increased the amount of the revolving credit facility from $100 million to $200 million; and (iii) borrowed $150 million, resulting in a net increase of available cash of $30 million, after paying off the outstanding $120 million balance from the term loan under the previous Credit Agreement.
In November 2012, we refinanced our Credit Agreement, and as a result, under the refinanced Credit Agreement, we: (i) borrowed $150 million, thus paying down $18 million of outstanding debt; and (ii) extended the term from 2015 to 2017.
See Note 5 to our Financial Statements for additional discussion of our debt.
|
(4) |
In June 2013, our Board approved the initiation of a quarterly cash dividend to be paid to our stockholders for the first time in our history. Quarterly dividends are typically paid each year in March, June, September, and December with the amount and timing subject to the Board’s approval. Because of the timing of when we initiated our dividend, 2013 only includes three quarterly dividends. |
|
(5) |
In March 2015, we entered into an accelerated share repurchase (“ASR”) Agreement with a counterparty to repurchase $50 million of our common stock. Final share settlement occurred in December 2015, with total shares purchased under the ASR Agreement of 1.6 million. |
21
|
(6) |
In 2016, we adopted Accounting Standards Update (“ASU”) 2015-03, Interest-Imputation of Interest (Subtopic 835-30) and ASU 2015-17, Income Taxes (Topic 740). ASU 2015-03 requires that debt issuance costs related to a recognized debt liability be presented in the balance sheet as a reduction from the carrying amount of that debt liability, consistent with debt discounts. ASU 2015-17 requires that all deferred tax liabilities and assets be classified as noncurrent. We adopted both ASU’s on January 1, 2016, which resulted in a reclassification of our Balance Sheets for the periods presented. |
22
Forward-Looking Statements
This report contains a number of forward-looking statements relative to our future plans and our expectations concerning our business and the industries we serve. These forward-looking statements are based on assumptions about a number of important factors, and involve risks and uncertainties that could cause actual results to differ materially from estimates contained in the forward-looking statements. Some of the risks that are foreseen by management are outlined above within Item 1A., “Risk Factors”. Item 1A. constitutes an integral part of this report, and readers are strongly encouraged to review this section closely in conjunction with MD&A.
MD&A Basis of Discussion - Impact of Divestiture
In September 2015, we sold our cyber-security business, marketed under the Invotas brand, to certain former management personnel, resulting in a gain on the sale of $3.7 million, which is included in restructuring and reorganization charges in our 2015 Income Statement. The impact of Invotas to our business prior to the divestiture date was not material. We retained a minority interest in the business such that the results of operations from the business are not included in our financial statements subsequent to the divestiture date.
In February 2016, this business was acquired by a third-party. Based on the terms of our agreement with former management personnel, we received additional consideration contingent upon a liquidation event, as defined in the agreement, resulting in an additional gain on the sale of approximately $6.6 million, which reduced our 2016 restructuring and reorganization charges in our Income Statement.
Management Overview
Results of Operations. A summary of our results of operations for 2016 and 2015, and other key performance metrics are as follows (in thousands, except percentages and per share amounts):
|
|
|
|
Year Ended December 31, |
|
|||||
|
|
|
|
2016 |
|
|
2015 |
|
||
|
Revenues |
|
|
$ |
760,958 |
|
|
$ |
752,520 |
|
|
Operating Results: |
|
|
|
|
|
|
|
|
|
|
Operating income |
|
|
|
132,629 |
|
|
|
113,140 |
|
|
Operating income margin |
|
|
|
17.4 |
% |
|
|
15.0 |
% |
|
Diluted EPS |
|
|
$ |
1.90 |
|
|
$ |
1.87 |
|
|
Supplemental Data: |
|
|
|
|
|
|
|
|
|
|
Restructuring and reorganization charges |
|
|
$ |
416 |
|
|
$ |
3,074 |
|
|
Stock-based compensation (1) |
|
|
|
22,795 |
|
|
|
21,371 |
|
|
Amortization of acquired intangible assets |
|
|
|
8,489 |
|
|
|
11,983 |
|
|
Amortization of OID |
|
|
|
4,866 |
|
|
|
6,246 |
|
|
Loss on repurchase of convertible notes |
|
|
|
(8,651 |
) |
|
— |
|
|
|
|
(1) |
Stock-based compensation included in the table above excludes amounts that have been recorded in restructuring and reorganization charges. |
Revenues. Our revenues for 2016 were $761.0 million, a 1% increase when compared to $752.5 million for 2015. The increase can be primarily attributed to a 5% increase in our cloud and related solutions revenues. The increase in our cloud and related solutions revenues for 2016 was driven largely by the conversion of new customer accounts onto ACP during the year, and increases in revenues from recurring managed services arrangements. These increases more than offset the decline in our software and services and maintenance revenues.
Operating Results. Operating income for 2016 was $132.6 million, or a 17.4% operating income margin percentage, compared to $113.1 million, or a 15.0% operating income margin percentage for 2015, with the increase mainly attributed to the scale benefits we are achieved from increasing the number of customer accounts to our cloud solutions, and operational cost improvements made throughout 2015 and 2016, to include the divestiture of Invotas in 2015, discussed above.
Diluted EPS. Diluted EPS for 2016 was $1.90 compared to $1.87 for 2015 with the increase primarily attributed to the higher operating margin, which more than offset the negative impact of the loss on the repurchase of the 2010 Convertible Notes and higher interest expense, both related to the refinancing of this instrument earlier this year.
23
Balance Sheet and Cash Flows. As of December 31, 2016, we had cash, cash equivalents, and short-term investments of $276.5 million, as compared to $240.9 million as of December 31, 2015. Cash flows from operating activities for 2016 were $84.2 million, compared to $137.0 million for 2015. Cash flows from operations for 2016 were negatively impacted by year end working capital timing fluctuations and a payment made at year end as part of the closure of several years of outstanding tax audits with the IRS. See the Liquidity section below for further discussion of our cash flows.
Significant Client Relationships
Comcast. Comcast continues to be our largest client. For 2016 and 2015, revenues from Comcast were $196 million and $177 million, respectively, representing approximately 26% and 24% of our total revenues. This increase is driven primarily by the conversion of additional Comcast customer accounts to our platform, as noted below. Our agreement with Comcast runs through June 30, 2019, with an option to extend the agreement for two consecutive one-year terms by exercising the renewal options no later than January 1, 2019 for the first extension option, and January 1, 2020 for the second extension option.
Since July 2014, when we entered into an expanded and extended contract with Comcast, we have converted approximately seven million residential Comcast customer accounts onto ACP. We believe we have the opportunity to convert up to an additional two to three million Comcast customer accounts that are currently on one of our competitor’s platforms onto our solution over the next year as part of Comcast’s future standardization initiatives for their residential business. However, the timing of and the number of additional customer accounts to be converted to CSG, if any, is at the discretion of Comcast. Therefore, there can be no assurances as to the timing or the number of additional customer accounts converted to us by Comcast, or whether we will experience any further material increase in revenues or profits under the Amended Agreement. See our Risk factors for additional discussion.
A copy of the Comcast agreement and related amendments, with confidential information redacted, is included in the exhibits to our periodic filings with the SEC.
Charter/Time Warner. In May 2016, Charter, our then fourth largest client, received final approval from regulators and closed on its acquisition of Time Warner, which was previously our third largest client. Consequently, the Time Warner agreement was assigned to Charter in connection with the merger and the Time Warner customer accounts serviced by us are now owned by Charter. As a result, Charter now receives more favorable volume-tier pricing terms due to their larger, combined business with us.
Subsequent to this acquisition, Charter is our second largest client. Our revenues from the combined Charter/Time Warner entity for 2016 and 2015 were $160 million and $155 million, respectively, representing approximately 21% of our total revenues for both periods. Our agreement with Charter runs through December 31, 2019. The Time Warner customer accounts currently still operate under the assigned Time Warner agreement, which is set to expire on March 31, 2017. We are working with Charter to legally combine our contract with the two businesses under one master agreement. Pending completion of this documentation, we intend to pursue an extension of the assigned Time Warner agreement.
Both the Charter and Time Warner agreements and related amendments, with confidential information redacted, are included in the exhibits to our periodic filings with the SEC.
DISH. DISH is our third largest client. For 2016 and 2015, revenues from DISH were $102 million and $107 million, respectively, representing approximately 13% and 14% of our total revenues. Our agreement with DISH runs through December 31, 2017, with two options to extend the term for two additional years each by exercising renewal options on or before June 30, 2017, and June 30, 2019.
The DISH agreement and related amendments, with confidential information redacted, is included in the exhibits to our periodic filings with the SEC.
24
Stock-Based Compensation Expense
Stock-based compensation expense is included in the following captions in our Income Statement (in thousands):
|
|
|
2016 |
|
|
2015 |
|
|
2014 |
|
|||
|
Cost of cloud and related solutions |
|
$ |
3,958 |
|
|
$ |
2,589 |
|
|
$ |
3,203 |
|
|
Cost of software and services |
|
|
1,348 |
|
|
|
2,563 |
|
|
|
1,071 |
|
|
Cost of maintenance |
|
|
371 |
|
|
|
204 |
|
|
|
201 |
|
|
Research and development |
|
|
3,339 |
|
|
|
3,206 |
|
|
|
2,343 |
|
|
Selling, general and administrative |
|
|
13,779 |
|
|
|
12,809 |
|
|
|
9,837 |
|
|
Restructuring |
|
|
(80 |
) |
|
|
(241 |
) |
|
|
- |
|
|
Total stock-based compensation expense |
|
$ |
22,715 |
|
|
$ |
21,130 |
|
|
$ |
16,655 |
|
See Notes 2 and 11 to our Financial Statements for additional discussion of our stock-based compensation expense.
Amortization of Acquired Intangible Assets
Amortization of acquired intangible assets is included in the following captions in our Income Statement (in thousands):
|
|
|
2016 |
|
|
2015 |
|
|
2014 |
|
|||
|
Cost of cloud and related solutions |
|
$ |
1,092 |
|
|
$ |
1,347 |
|
|
$ |
1,305 |
|
|
Cost of maintenance |
|
|
7,397 |
|
|
|
10,636 |
|
|
|
14,103 |
|
|
Total amortization of acquired intangible assets |
|
$ |
8,489 |
|
|
$ |
11,983 |
|
|
$ |
15,408 |
|
See Note 4 to our Financial Statements for additional discussion of our amortization of acquired intangible assets.
Critical Accounting Policies
The preparation of our Financial Statements in conformity with accounting principles generally accepted in the U.S. requires us to select appropriate accounting policies, and to make judgments and estimates affecting the application of those accounting policies. In applying our accounting policies, different business conditions or the use of different assumptions may result in materially different amounts reported in our Financial Statements.
We have identified the most critical accounting policies that affect our financial position and the results of our operations. These critical accounting policies were determined by considering our accounting policies that involve the most complex or subjective decisions or assessments. The most critical accounting policies identified relate to: (i) revenue recognition; (ii) impairment assessments of goodwill and other long-lived assets; (iii) income taxes; and (iv) loss contingencies. These critical accounting policies, as well as our other significant accounting policies, are disclosed in the notes to our Financial Statements.
Revenue Recognition. The revenue recognition policy that involves the most complex or subjective decisions or assessments that may have a material impact on our business’ operations relates to the accounting for certain software license and services arrangements. For the 2016, 2015, and 2014, software and services revenues was approximately 10%, 12% and 14%, respectively, of our total revenues.
The accounting for software license arrangements, especially when software is sold in a multiple-element arrangement, can be complex and may require considerable judgment. Key factors considered in accounting for software license and related services include the following criteria: (i) the identification of the separate elements of the arrangement; (ii) the determination of whether any undelivered elements are essential to the functionality of the delivered elements; (iii) the assessment of whether the software, if hosted, should be accounted for as a services arrangement and thus outside the scope of the software revenue recognition literature; (iv) the determination of vendor specific objective evidence (“VSOE”) of fair value for the undelivered element(s) of the arrangement; (v) the assessment of whether the software license fees are fixed or determinable; (vi) the determination as to whether the fees are considered collectible; and (vii) the assessment of whether services included in the arrangement represent significant production, customization or modification of the software. The evaluation of these factors, and the ultimate revenue recognition decision, requires significant judgments to be made by us. The judgments made in this area could have a significant effect on revenues recognized in any period by changing the amount and/or the timing of the revenue recognized. In addition, because software licenses typically have little or no direct, incremental costs related to the recognition of the revenue, these judgments could also have a significant effect on our results of operations.
25
The initial sale of our software products generally requires significant production, modification or customization and thus falls under the guidelines of contract accounting. In these software license arrangements, the software license and professional services elements of the arrangement fee are typically combined and subject to contract accounting using the percentage-of-completion (“POC”) method of accounting. Under the POC method of accounting, software license and professional services revenues are typically recognized as the professional services related to the software implementation project are performed. We are using hours performed on the project as the measure to determine the percentage of the work completed.
A portion of our professional services revenues does not include an element of software delivery (e.g., business consulting services, etc.), and thus, do not fall within the scope of specific authoritative accounting literature for software arrangements. In these cases, revenues from fixed-price, professional service contracts are recognized using a method consistent with the proportional performance method, which is relatively consistent with our POC methodology. Under a proportional performance model, revenue is recognized by allocating revenue between reporting periods based on relative service provided in each reporting period, and costs are generally recognized as incurred. We utilize an input-based approach (i.e., hours worked) for purposes of measuring performance on these types of contracts. Our input measure is considered a reasonable surrogate for an output measure. In instances when the work performed on fixed price agreements is of relatively short duration, or if we are unable to make reasonably dependable estimates at the outset of the arrangement, we use the completed contract method of accounting whereby revenue is recognized when the work is completed.
Our use of the POC and proportional performance methods of accounting on professional services engagements requires estimates of the total project revenues, total project costs and the expected hours necessary to complete a project. Changes in estimates as a result of additional information or experience on a project as work progresses are inherent characteristics of the POC and proportional performance methods of accounting as we are exposed to various business risks in completing these engagements. The estimation process to support these methods of accounting is more difficult for projects of greater length and/or complexity. The judgments and estimates made in this area could: (i) have a significant effect on revenues recognized in any period by changing the amount and/or the timing of the revenue recognized; and/or (ii) impact the expected profitability of a project, including whether an overall loss on an arrangement has occurred. To mitigate the inherent risks in using the POC and proportional performance methods of accounting, we track our performance on projects and reevaluate the appropriateness of our estimates as part of our monthly accounting cycle.
Revenues are recognized only if we determine that the collection of the fees included in an arrangement is considered probable (i.e., we expect the client to pay all amounts in full when invoiced). In making our determination of collectability for revenue recognition purposes, we consider a number of factors depending upon the specific aspects of an arrangement, which may include, but is not limited to, the following items: (i) an assessment of the client’s specific credit worthiness, evidenced by its current financial position and/or recent operating results, credit ratings, and/or a bankruptcy filing status (as applicable); (ii) the client’s current accounts receivable status and/or its historical payment patterns with us (as applicable); (iii) the economic condition of the industry in which the client conducts the majority of its business; and/or (iv) the economic conditions and/or political stability of the country or region in which the client is domiciled and/or conducts the majority of its business. The evaluation of these factors, and the ultimate determination of collectability, requires significant judgments to be made by us. The judgments made in this area could have a significant effect on revenues recognized in any period by changing the amount and/or the timing of the revenue recognized.
Impairment Assessments of Goodwill and Other Long-Lived Assets.
Goodwill. Goodwill is required to be tested for impairment on an annual basis. We have elected to do our annual test for possible impairment as of July 31 of each year. In addition to this annual requirement, goodwill is required to be evaluated for possible impairment on a periodic basis (e.g., quarterly) if events occur or circumstances change that could indicate a possible impairment may have occurred. Goodwill is considered impaired if the carrying value of the reporting unit, which includes the goodwill, is greater than the estimated fair value of the reporting unit. If it is determined that an impairment has occurred, an impairment loss (equal to the excess of the carrying value of the goodwill over its estimated fair value) is recorded.
As of July 31, 2016, we had goodwill of approximately $208 million, which was assigned to a single reporting unit. Since we had only a single reporting unit, we used our public market capitalization as our primary means to estimate the fair value for that single reporting unit. Since our market capitalization exceeded the carrying value of our single reporting unit by a significant margin, we concluded there was no impairment of goodwill.
We believe that our approach for testing our goodwill for impairment was appropriate. However, if we experience a significant drop in our market capitalization due to company performance, and/or broader market conditions, it may result in an impairment loss. If a goodwill impairment was to be recorded in the future, it would likely materially impact our results of operations in the period such impairment is recognized, but such an impairment charge would be a non-cash expense, and therefore would have no impact on our cash flows, or on the financial position of our company.
Other Long-lived Assets. Long-lived assets other than goodwill, which for us relates primarily to property and equipment, software, and client contracts, are required to be evaluated for possible impairment whenever events or changes in
26
circumstances indicate that the carrying amount of these assets may not be recoverable. A long-lived asset (or group of long-lived assets) is impaired if estimated future undiscounted cash flows associated with that asset, without consideration of interest, are insufficient to recover the carrying amount of the long-lived asset. Once deemed impaired, even if by $1, the long-lived asset is written down to its fair value which could be considerably less than the carrying amount or future undiscounted cash flows. The determination of estimated future cash flows and, if required, the determination of the fair value of a long-lived asset, are by their nature, highly subjective judgments. Changes to one or more of the assumptions utilized in such an analysis could materially affect our impairment conclusions for long-lived assets.
Income Taxes. We are required to estimate our income tax liability in each jurisdiction in which we operate, which includes the U.S. (including both Federal and state income taxes) and numerous foreign countries.
Various judgments are required in evaluating our income tax positions and determining our provisions for income taxes. During the ordinary course of our business, there are certain transactions and calculations for which the ultimate income tax determination may be uncertain. In addition, we may be subject to examination of our income tax returns by various tax authorities which could result in adverse outcomes. For these reasons, we establish a liability associated with unrecognized tax benefits based on estimates of whether additional taxes and interest may be due. We adjust this liability based upon changing facts and circumstances, such as the closing of a tax audit, the closing of a tax year upon the expiration of a statute of limitations, or the refinement of an estimate. Should any of the factors considered in determining the adequacy of this liability change significantly, an adjustment to the liability may be necessary. Because of the potential significance of these issues, such an adjustment could be material.
One of the more complex items within our income tax expense is the determination of our annual research and experimentation income tax credit (“R&D credit”). We incur approximately $100 million annually in R&D expense. The calculation of the R&D tax credit involves the identification of qualifying projects, and then an estimation of the qualifying costs for such projects. Because of the size, nature, and the number of projects worked on in any given year, the calculation can become complex and certain judgments are necessary in determining the amount of the R&D credits claimed.
Loss Contingencies. In the ordinary course of business, we are subject to claims (and potential claims) related to various items including but not limited to the following: (i) legal and regulatory matters; (ii) client and vendor contracts; (iii) product and service delivery matters; and (iv) labor matters. Accounting and disclosure requirements for loss contingencies requires us to assess the likelihood of any adverse judgments in or outcomes to these matters, as well as the potential ranges of probable losses. A determination of the amount of reserves for such contingencies, if any, for these contingencies is based on an analysis of the issues, often with the assistance of legal counsel. The evaluation of such issues, and our ultimate accounting and disclosure decisions, are by their nature, subject to various estimates and highly subjective judgments. Should any of the factors considered in determining the adequacy of any required reserves change significantly, an adjustment to the reserves may be necessary. Because of the potential significance of these issues, such an adjustment could be material.
Detailed Discussion of Results of Operations
Total Revenues. Total revenues for: (i) 2016 were $761.0 million, a 1% increase from $752.5 million for 2015; and (ii) 2015 were $752.5 million, a slight increase from $751.3 million for 2014.
|
|
• |
The 1% year-over-year increase in total revenues between 2016 and 2015 can be attributed to the 5% growth of our cloud and related solutions revenues, driven primarily from continued conversions of customer accounts onto ACP, and increases in revenues from recurring managed services arrangements. These increases more than offset the decline in our software and services and maintenance revenues, and negative foreign currency movements of approximately $5 million. |
|
|
• |
The slight increase in revenues between 2015 and 2014 can be primarily attributed to growth in our cloud and related solutions revenues, offset by unfavorable foreign currency movements, which had a negative impact to total revenues of approximately $15 million. The growth in our cloud and related solutions revenues for 2015 was driven largely by the conversions of new customer accounts onto ACP, and the continued revenue growth from our Ascendon solution and international managed services offering, offset by some of the decreases we experienced in our software and services revenues. |
The components of total revenues, discussed in more detail below, are as follows:
27
|
|
|
Year Ended December 31, |
|
|||||||||
|
|
|
2016 |
|
|
2015 |
|
|
2014 |
|
|||
|
Revenues: |
|
|
|
|
|
|
|
|
|
|
|
|
|
Cloud and related solutions |
|
$ |
606,936 |
|
|
$ |
577,410 |
|
|
$ |
562,109 |
|
|
Software and services |
|
|
79,400 |
|
|
|
93,678 |
|
|
|
102,585 |
|
|
Maintenance |
|
|
74,622 |
|
|
|
81,432 |
|
|
|
86,592 |
|
|
Total revenues |
|
$ |
760,958 |
|
|
$ |
752,520 |
|
|
$ |
751,286 |
|
Cloud and Relation Solutions Revenues. Cloud and related solutions revenues for: (i) 2016 increased 5% to $606.9 million, from $577.4 million for 2015; and (ii) 2015 increased 3% to $577.4 million, from $562.1 million for 2014.
|
|
• |
The year-over-year increase between 2016 and 2015 in cloud and related solutions revenues can be mainly attributed to the conversion of customer accounts onto ACP, and increases in revenues from recurring managed services arrangements. As previously discussed, Comcast added approximately two million customer accounts onto ACP during the second half of 2015 and an additional three million customer accounts onto ACP during 2016, of which half were converted during the fourth quarter of 2016. Additionally, our recurring managed services revenues for 2016 grew by over 60% from 2015. |
|
|
• |
The year-over-year increase between 2015 and 2014 in cloud and related solutions revenues is primarily the result of the conversion of new customer accounts onto ACP, and the continued revenue growth from our Ascendon solution and managed services offering. As discussed above, Comcast added over two million customer accounts onto ACP during the fourth quarter of 2014, and approximately two million additional customer accounts during the second half of 2015. |
Additionally, amortization of the investments in client contracts intangible asset (reflected as a reduction of cloud and related solutions revenues) for 2016, 2015, and 2014 was $6.6 million, $5.2 million, and $6.4 million, respectively.
Software and Services Revenues. Software and services revenues for: (i) 2016 decreased 15% to $79.4 million, from $93.7 million for 2015; and (ii) 2015 decreased 9% to $93.7 million, from $102.6 million for 2014.
|
|
• |
The year-over-year decrease between 2016 to 2015 in software and services revenues can be primarily attributed to the continued low market demand for large transformational software and service deals. We continue to transition this part of our business into a more predictable recurring revenue model, with our managed services arrangements and delivery of our cloud-based solutions. |
|
|
• |
The year-over-year decrease in software and services revenues between 2015 to 2014 is primarily attributed to foreign currency movements, and to a lesser degree, continued extended sales cycles in our software and professional services business and lower demand. |
Maintenance Revenues. Maintenance revenues for: (i) 2016 decreased 8% to $74.6 million, from $81.4 million for 2015; and (ii) 2015 decreased 6% to $81.4 million, from $86.6 million for 2014.
|
|
• |
The year-over-year decrease from 2016 to 2015 in maintenance revenues can be mainly attributed to the timing of maintenance renewals and related revenue recognition, and is consistent with our lower software and services revenues. |
|
|
• |
The year-over-year decrease in maintenance revenues from 2015 to 2014 can be attributed to foreign currency movements. |
Total Operating Expenses. Our operating expenses for: (i) 2016 decreased 2% to $628.3 million, from $639.4 million for 2015; and (ii) 2015 decreased 5% to $639.4 million, from $675.6 million for 2014.
|
|
• |
The $11.1 million decrease in total operating expenses between 2016 and 2015 is primarily due to favorable foreign currency movements of approximately $8 million, operational cost improvements, to include the divestiture of Invotas in September 2015, and lower restructuring and reorganization costs, which offset the increased cost of sales, reflective of our increased revenues. |
|
|
• |
The $36.2 million decrease in total operating expenses between 2015 and 2014 is due mainly to $24 million of favorable foreign currency movements, our focus on cost improvements (to include the benefits we received from the 2014 restructuring activities), and a reduction in restructuring and reorganization costs. |
The components of total expenses are discussed in more detail below. Cost of Cloud and Related Solutions (Exclusive of Depreciation). The cost of cloud and related solutions revenues consists principally of the following: (i) data processing and network communications costs; (ii) statement production costs (e.g., labor, paper, envelopes, equipment, equipment maintenance, etc.);
28
(iii) client support organizations (e.g., our client support call center, account management, etc.); (iv) various product delivery and support organizations (e.g., managed services delivery, product management, product maintenance, etc.); (v) facilities and infrastructure costs related to the statement production and support organizations; and (vi) amortization of acquired intangibles. The costs related to new product development (including significant enhancements to existing products and services) are included in R&D expenses.
The cost of cloud and related solutions for: (i) 2016 increased 5% to $283.0 million, from $270.7 million for 2015; and (ii) 2015 decreased 2% to $270.7 million, from $277.1 million for 2014. Total cloud and related solutions cost of revenues as a percentage of our cloud and related solutions revenues for 2016, 2015, and 2014, were 46.6%, 46.9%, and 49.3%, respectively.
|
|
• |
The year-over-year increase in cost of cloud and related solutions between 2016 and 2015 is reflective of the increases we experienced in cloud and related solutions revenues and are primarily related to increased ACP cloud-based costs and the reassignment of personnel and the related costs from other areas of the business to client directed and funded work. |
|
|
• |
The year-over-year decrease in cost of cloud and related solutions between 2015 and 2014 is mainly due cost savings initiatives, and other decreases in variable costs, and to a lesser degree, favorable foreign currency movements. |
Cost of Software and Services (Exclusive of Depreciation). The cost of software and services revenues consists principally of the following: (i) professional services organization; (ii) various product support organizations (e.g., delivery, etc.); (ii) (iii) facilities and infrastructure costs related to these organizations; and (iv) third-party software costs and/or royalties related to certain software products. The costs related to new product development (including significant enhancements to existing products and services) are included in R&D expenses.
The cost of software and services for: (i) 2016 decreased 28% to $49.2 million, from $68.6 million for 2015; and (ii) 2015 decreased 14% to $68.6 million, from $79.6 million for 2014.
|
|
• |
The year-over-year decrease in cost of software and services between 2016 and 2015 is mainly due to targeted efficiencies and cost improvements within our professional services practice, estimated costs overruns recorded in the first quarter of 2015 related to a large software and services implementation project, discussed below, and foreign currency movements. |
|
|
• |
The year-over-year decrease in cost of software and services between 2015 and 2014 is primarily attributed to favorable foreign currency movements, and to a lesser degree, targeted efficiencies and cost improvements within our professional services practice. |
Total cost of software and services as a percentage of our software and services revenues for 2016, 2015, and 2014, were 62.0%, 73.2%, and 77.6%, respectively, with the level and variability of these percentages reflective of the negative impact of two large implementation projects. In the first quarter of 2014, we incurred a loss of approximately $4 million related to a large software and implementation project (to be substantially completed in 2019) due to estimated cost overruns. In the first quarter of 2015, we incurred a loss of approximately $5 million on another large software and services implementation project (substantially completed in the third quarter of 2016) due to estimated cost overruns.
Variability in quarterly revenues and operating results are inherent characteristics of companies that sell software licenses and perform professional services. Our quarterly revenues for software licenses and professional services may fluctuate, depending on various factors, including the timing of executed contracts and revenue recognition, and the delivery of contracted solutions. However, the costs associated with software and professional services revenues are not subject to the same degree of variability (e.g., these costs are generally fixed in nature within a relatively short period of time), and thus, fluctuations in our cost of software and services as a percentage of our software and services revenues will likely occur between periods.
Cost of Maintenance (Exclusive of Depreciation). The cost of maintenance consists principally of the following: (i) client support organizations (e.g., our client support call center, account management, etc.); (ii) various product support organizations (e.g., product maintenance, product management, etc.); (iii) facilities and infrastructure costs related to these organizations; and (iv) amortization of acquired intangibles.
The cost of maintenance for: (i) 2016 increased 6% to $43.0 million, from $40.4 million for 2015; and (ii) 2015 increased 24% to $40.4 million, from $32.6 million for 2014. Total cost of maintenance as a percentage of our maintenance revenues for 2016, 2015, and 2014 were 57.6%, 49.6%, and 37.7%, respectively.
|
|
• |
The increase in cost of maintenance between 2016 and 2015 can be primarily attributed to the reassignment of personnel and the related costs to maintenance projects from other projects, and an increase in third party maintenance costs. |
|
|
• |
The increase in cost of maintenance between 2015 and 2014 can be mainly attributed to the reassignment of personnel and the related costs to maintenance projects from other projects, offset by the favorable movements in foreign currency between years. |
29
R&D Expense (Exclusive of Depreciation). R&D expense for: (i) 2016 decreased 3% to $98.7 million, from $102.0 million for 2015; and (ii) 2015 decreased 3% to $102.0 million, from $104.7 million for 2014.
|
|
• |
The decrease in R&D expense between 2016 and 2015 is primarily due to the reassignment of personnel and the related costs previously allocated to development projects to other area of the business. |
|
|
• |
The decrease in R&D expense between 2015 and 2014 can be attributed to favorable foreign currency movements. |
Our R&D efforts are focused on the continued evolution of our solutions that enable service providers worldwide to provide a more personalized customer experience while introducing new digital products and services. This includes the continued investment in our business support solutions aimed at improving a providers’ time-to-market for new offerings, flexibility, scalability, and total cost of ownership.
As a percentage of total revenues, R&D expense for 2016, 2015, and 2014 was 13.0%, 13.5%, and 13.9%, respectively. We anticipate the level of R&D investment to trend up due to the heightened level of our planned investments for 2017.
Selling, General and Administrative Expense (Exclusive of Depreciation) (“SG&A”). SG&A expense for: (i) 2016 was $140.5 million, relatively consistent when compared to $139.8 million for 2015; and (ii) 2015 decreased 9% to $139.8 million, from $153.5 million for 2014.
|
|
• |
SG&A expense increased $0.7 million between 2016 and 2015, due primarily to higher incentive compensation for 2016, which was offset by favorable foreign currency movements. |
|
|
• |
The decrease in SG&A expense between 2015 and 2014 reflect: (i) the financial benefits of the restructuring activities undertaken in 2014 to reduce our sales and marketing costs; (ii) focus on cost improvements, to include the divestiture of Invotas; and (iii) impact of foreign currency movements. Additionally, it should be noted that 2014 SG&A expense benefited from a settlement agreement ending litigation that we had asserted against a third party for patent infringement and misappropriation of trade secrets. In exchange for the release from the lawsuit we initiated, we recorded $3.9 million (net of a time value discount and legal costs incurred) as a reduction of SG&A expenses in that period. |
As a percentage of total revenues, SG&A expense for 2016, 2015, and 2014 was 18.5%, 18.6%, and 20.4%, respectively.
Depreciation Expense. Depreciation expense for all property and equipment is reflected separately in the aggregate and is not included in the cost of revenues or the other components of operating expenses. Depreciation expense for: (i) 2016 was $13.6 million, an 8% decrease from $14.8 million for 2015; and (ii) 2015 was $14.8 million, a slight increase from $14.1 million for 2014. The decrease in depreciation expense between 2016 and 2015 is reflective of the reduced level of capital expenditures made over the last two years. Going forward, we expect our capital expenditures to return to a more normal investment level.
Restructuring and Reorganization Charges. In 2016, 2015, and 2014, we implemented various cost reduction and efficiency initiatives that resulted in restructuring and reorganization charges of $0.4 million, $3.1 million, and $14.0 million, respectively. These initiatives included: (i) the divestitures of our Invotas cyber security business and our Quaero marketing analytics business; (ii) the reorganization of our Content Direct solution to facilitate its alignment across our offerings, including management programs and incentives; (iii) reducing our workforce to further align it around our long-term growth initiatives; and (iv) the abandonment of space at some of our facility locations. We completed these initiatives in order to better align and allocate our resources around our long-term growth initiatives.
See Note 6 to our Financial Statements for additional information regarding these initiatives.
30
Operating Income. Operating income and operating income margin for: (i) 2016 was $132.6 million, or 17.4% of total revenues, compared to $113.1 million, or 15.0% of total revenues for 2015; and (ii) 2015 was $113.1 million, or 15.0% of total revenues, compared to $75.7 million, or 10.1% of total revenues for 2014.
|
|
• |
The increases in operating income and operating income margin between 2016 and 2015 can be mainly attributed to the overall reduction in operating expenses, as discussed above, and to a lesser degree, the scale benefits from adding more customer accounts to our cloud solutions and higher revenues. |
|
|
• |
The increases in operating income and operating income margin between 2015 and 2014 are due primarily to the overall reduction in operating expenses, discussed above, and the scale benefits we are achieving from increasing the number of customer accounts and clients on our solutions. |
For the fourth quarter of 2016, our operating margin percentage was 13.0%, which reflects our planned increased investments aimed at our long-term business growth, and coupled with higher levels of employee incentive compensation earned in the fourth quarter. Going forward, we expect our operating income and operating margin percentage to trend downward from our 2016 full year level, as we look to increase our strategic investments in R&D, our go-to-market programs, and the operating environments for our cloud solutions (e.g. resiliency, security, etc.).
Interest Expense and Amortization of Original Issue Discount (“OID”). Our interest expense relates primarily to our 2010 and 2016 Convertible Notes and our Credit Agreement. See Note 5 to our Financial Statements for additional discussion of our long-term debt, to include the non-cash interest expense related to the amortization of the convertible debt OID.
Interest expense for: (i) 2016 increased 48% to $16.3 million, from $11.0 million for 2015; and (ii) 2015 increased to $11.0 million, from $10.5 million for 2014.
|
|
• |
The increase in interest expense between 2016 and 2015 is mainly due to the interest on the 2016 Convertible Notes, which were issued in March 2016, offset by the decrease in interest on the 2010 Convertible Notes due to repurchases throughout 2016. |
|
|
• |
The increase in interest expense between 2015 and 2014 can be mainly attributed to the higher average debt balance outstanding in 2015 as compared to 2014 as a result of the additional $30 million that was borrowed in conjunction with the refinancing of the credit agreement in February 2015. |
Loss on Repurchase of Convertible Notes. During 2016, we repurchased $115.3 million aggregated principal amount of the 2010 Convertible Notes for an aggregated purchase price of $215.7 million, and recognized a loss on the repurchases of $8.7 million.
Income Tax Provision. Our effective income tax rates for 2016, 2015, and 2014 were as follows:
|
2016 |
|
|
2015 (1) |
|
|
2014 (1) |
|
|||
|
|
37 |
% |
|
|
35 |
% |
|
|
42 |
% |
|
(1) |
Our 2015 effective tax rate was positively impacted by improved earnings in our non-U.S. operations. |
As further discussed in Note 2 to our consolidated financial statements, we will adopt Accounting Standards Update (“ASU”) 2016-09, Compensation – Stock Compensation (Topic 718) in the first quarter of 2017. This ASU requires a change in the recognition of excess tax benefits and tax deficiencies, related to share-based payment transactions, which are currently recorded in equity, and will be recorded as a component of income tax expense in the income statement. We anticipate the adoption of this ASU will have an approximate three to four percentage point decrease on our 2017 effective income tax rate.
Liquidity
Cash and Liquidity. As of December 31, 2016, our principal sources of liquidity included cash, cash equivalents, and short-term investments of $276.5 million, compared to $240.9 million as of December 31, 2015. We generally invest our excess cash balances in low-risk, short-term investments to limit our exposure to market and credit risks.
As part of our 2015 Agreement, we have a $200 million senior secured revolving loan facility (“Revolver”) with a syndicate of financial institutions that expires in February 2020. As of December 31, 2016, there were no borrowings outstanding on the Revolver. The Credit Agreement contains customary affirmative covenants and financial covenants. As of December 31, 2016, and the date of this filing, we believe that we are in compliance with the provisions of the Credit Agreement.
31
Our cash, cash equivalents, and short-term investment balances as of the end of the indicated periods were located in the following geographical regions (in thousands):
|
|
|
December 31, |
|
|
December 31, |
|
||
|
|
|
2016 |
|
|
2015 |
|
||
|
Americas (principally the U.S.) |
|
$ |
220,269 |
|
|
$ |
199,117 |
|
|
Europe, Middle East and Africa |
|
|
46,941 |
|
|
|
36,396 |
|
|
Asia Pacific |
|
|
9,288 |
|
|
|
5,423 |
|
|
Total cash, equivalents and short-term investments |
|
$ |
276,498 |
|
|
$ |
240,936 |
|
We generally have ready access to substantially all of our cash, cash equivalents, and short-term investment balances, but may face limitations on moving cash out of certain foreign jurisdictions due to currency controls. As of December 31, 2016, we had $4.3 million of cash restricted as to use to collateralize outstanding letters of credit.
Cash Flows From Operating Activities. We calculate our cash flows from operating activities beginning with net income, adding back the impact of non-cash items or non-operating activity (e.g., depreciation, amortization, amortization of OID, impairments, deferred income taxes, stock-based compensation, etc.), and then factoring in the impact of changes in operating assets and liabilities.
Our primary source of cash is from our operating activities. Our current business model consists of a significant amount of recurring revenue sources related to our long-term cloud-based and managed services arrangements (mostly billed monthly), and software maintenance agreements (billed monthly, quarterly, or annually). This recurring revenue base provides us with a reliable and predictable source of cash. In addition, software license fees and professional services revenues are sources of cash, but the payment streams for these items are less predictable.
The primary use of our cash is to fund our operating activities. Over half of our total operating costs relate to labor costs (both employees and contracted labor) for the following: (i) compensation; (ii) related fringe benefits; and (iii) reimbursements for travel and entertainment expenses. The other primary cash requirements for our operating expenses consist of: (i) data processing and related services and communication lines for our outsourced cloud-based business; (ii) paper, envelopes, and related supplies for our statement processing solutions; (iii) hardware and software; and (iv) rent and related facility costs. These items are purchased under a variety of both short-term and long-term contractual commitments. A summary of our material contractual obligations is provided below.
Our 2016 and 2015 net cash flows from operating activities, broken out between operations and changes in operating assets and liabilities, for the indicated quarterly periods are as follows (in thousands):
|
|
|
|
|
|
|
|
|
|
|
Net Cash |
|
|
|
|
|
|
|
|
|
Changes in |
|
|
Provided by |
|
||
|
|
|
|
|
|
|
Operating |
|
|
(Used In) Operating |
|
||
|
|
|
|
|
|
|
Assets and |
|
|
Activities – |
|
||
|
|
|
Operations |
|
|
Liabilities |
|
|
Totals |
|
|||
|
Cash Flows from Operating Activities: |
|
|
|
|
|
|
|
|
|
|
|
|
|
2016: |
|
|
|
|
|
|
|
|
|
|
|
|
|
March 31 (1)(2) |
|
$ |
36,755 |
|
|
$ |
(26,081 |
) |
|
$ |
10,674 |
|
|
June 30 |
|
|
28,880 |
|
|
|
11,211 |
|
|
|
40,091 |
|
|
September 30 (3) |
|
|
31,309 |
|
|
|
(22,568 |
) |
|
|
8,741 |
|
|
December 31 (4) |
|
|
29,178 |
|
|
|
(4,498 |
) |
|
|
24,680 |
|
|
Total |
|
$ |
126,122 |
|
|
$ |
(41,936 |
) |
|
$ |
84,186 |
|
|
2015: |
|
|
|
|
|
|
|
|
|
|
|
|
|
March 31 (1) |
|
$ |
26,193 |
|
|
$ |
(7,257 |
) |
|
$ |
18,936 |
|
|
June 30 |
|
|
26,770 |
|
|
|
12,806 |
|
|
|
39,576 |
|
|
September 30 |
|
|
33,187 |
|
|
|
(7,353 |
) |
|
|
25,834 |
|
|
December 31 |
|
|
27,688 |
|
|
|
24,925 |
|
|
|
52,613 |
|
|
Total |
|
$ |
113,838 |
|
|
$ |
23,121 |
|
|
$ |
136,959 |
|
|
|
(1) |
Cash flows from operating activities for the first quarter of 2016 and 2015 reflect the negative impacts of the payment of the 2015 and 2014 year-end accrued employee incentive compensation in the first quarter subsequent to the year-end accrual for those items. |
32
|
|
(2) |
Cash flows from operating activities for the first quarter of 2016 were negatively impacted by a prospective change in the timing of payment terms for a key vendor related to postage. |
|
|
(3) |
For the third quarter of 2016, cash flows from operating activities were negatively impacted by the increase in the accounts receivable balance primarily related to the timing around certain recurring client payments that were delayed at quarter-end. |
|
|
(4) |
Cash flows from operating activities for the fourth quarter of 2016 were negatively impacted by year-end working capital timing fluctuations, and a payment made at year-end as part of the closure of several years of outstanding tax audits with the IRS. |
We believe the above table illustrates our ability to generate recurring quarterly cash flows from our operations, and the importance of managing our working capital items. The quarterly and annual variations in our net cash provided by operating activities are related mostly to the changes in our operating assets and liabilities (related mostly to fluctuations in timing at quarter-end of client payments and changes in accrued expenses), and generally over longer periods of time, do not significantly impact our cash flows from operations.
Significant fluctuations in key operating assets and liabilities between 2016 and 2015 that impacted our cash flows from operating activities are as follows:
Billed Trade Accounts Receivable
Management of our billed accounts receivable is one of the primary factors in maintaining strong quarterly cash flows from operating activities. Our billed trade accounts receivable balance includes significant billings for several non-revenue items (primarily postage, sales tax, and deferred revenue items). As a result, we evaluate our performance in collecting our accounts receivable through our calculation of days billings outstanding (“DBO”) rather than a typical days sales outstanding (“DSO”) calculation. DBO is calculated by taking the average monthly net trade accounts receivable balance for the period divided by billings for the period (including non-revenue items).
Our gross and net billed trade accounts receivable and related allowance for doubtful accounts receivable (“Allowance”) as of the end of the indicated quarterly periods, and the related DBOs for the quarters then ended, are as follows (in thousands, except DBOs):
|
Quarter Ended |
|
Gross |
|
|
Allowance |
|
|
Net Billed |
|
|
DBOs |
|
||||
|
2016: |
|
|
|
|
|
|
|
|
|
|
|
|
|
|
|
|
|
March 31 |
|
$ |
185,297 |
|
|
$ |
(3,647 |
) |
|
$ |
181,650 |
|
|
|
61 |
|
|
June 30 |
|
|
182,640 |
|
|
|
(3,726 |
) |
|
|
178,914 |
|
|
|
63 |
|
|
September 30 |
|
|
204,516 |
|
|
|
(2,906 |
) |
|
|
201,610 |
|
|
|
69 |
|
|
December 31 |
|
|
212,010 |
|
|
|
(3,080 |
) |
|
|
208,930 |
|
|
|
70 |
|
|
2015: |
|
|
|
|
|
|
|
|
|
|
|
|
|
|
|
|
|
March 31 |
|
$ |
183,283 |
|
|
$ |
(3,187 |
) |
|
$ |
180,096 |
|
|
|
64 |
|
|
June 30 |
|
|
176,206 |
|
|
|
(3,937 |
) |
|
|
172,269 |
|
|
|
65 |
|
|
September 30 |
|
|
181,225 |
|
|
|
(3,878 |
) |
|
|
177,347 |
|
|
|
62 |
|
|
December 31 |
|
|
182,454 |
|
|
|
(3,600 |
) |
|
|
178,854 |
|
|
|
60 |
|
The increases in gross and net billed accounts receivable at September 30, 2016 and December 31, 2016 are primarily related to the timing around certain recurring customer payments that were delayed at each quarter end, thus negatively impacting our DBO for the third and fourth quarters of 2016.
As a global provider of software and professional services, a portion of our accounts receivable balance relates to clients outside the U.S. As a result, this diversity in the geographic composition of our client base may adversely impact our DBOs as longer billing cycles (i.e., billing terms and cash collection cycles) are an inherent characteristic of international software and professional services transactions. For example, our ability to bill (i.e., send an invoice) and collect arrangement fees may be dependent upon, among other things: (i) the completion of various client administrative matters, local country billing protocols and processes (including local cultural differences), and/or non-client administrative matters; (ii) us meeting certain contractual invoicing milestones; or (iii) the overall project status in certain situations in which we act as a subcontractor to another vendor on a project.
33
Unbilled Trade Accounts Receivable
Revenue earned and recognized prior to the scheduled billing date of an item is reflected as unbilled accounts receivable. Our unbilled accounts receivable as of the end of the indicated periods are as follows (in thousands):
|
|
|
2016 |
|
|
2015 |
|
||
|
March 31 |
|
$ |
39,236 |
|
|
$ |
44,281 |
|
|
June 30 |
|
|
34,518 |
|
|
|
47,216 |
|
|
September 30 |
|
|
33,934 |
|
|
|
46,795 |
|
|
December 31 |
|
|
30,828 |
|
|
|
41,110 |
|
The unbilled accounts receivable balances above are primarily the result of several transactions with various milestone and contractual billing dates which have not yet been reached. Unbilled accounts receivable are an inherent characteristic of certain software and professional services transactions and may fluctuate between quarters, as these type of transactions typically have scheduled invoicing terms over several quarters, as well as certain milestone billing events.
Trade Accounts Payable
Trade accounts payable decreased $8.3 million, to $35.1 million as of December 31, 2016, compared to $43.4 million as of December 31, 2015, due primarily to a prospective change in the timing of payment terms for a key vendor related to postage costs.
Accrued Employee Compensation
Accrued employee compensation increased $5.7 million to $65.3 million as of December 31, 2016, compared to $59.6 million as of December 31, 2015, with the increase mainly due to an increase in accrued incentive compensation.
Income Taxes Payable/Receivable
For 2016, our cash flows used by operating activities related to income taxes payable/receivable was $14.2 million, compared to cash flows provided by operating activities related to income taxes payable/receivable of $9.0 million for 2015. This net $23.2 million change is primarily due to the timing of our estimated Federal and state income tax payments and the payment made at year-end as part of the closure of several years of outstanding tax audits with the IRS.
Cash Flows From Investing Activities. Our typical investing activities consist of purchases/sales of short-term investments, purchases of property and equipment, and investments in client contracts, which are discussed below.
Purchases/Sales of Short-term Investments.
During 2016, 2015, and 2014 we purchased $197.0 million, $181.6 million, and $190.4 million, respectively, and sold or had mature $157.8 million, $193.0 million, and $197.5 million, respectively, of short-term investments. We continually evaluate the possible uses of our excess cash balances and will likely purchase and sell additional short-term investments in the future.
Property and Equipment/Client Contracts.
Our annual capital expenditures for property and equipment, and investments in client contracts were as follows (in thousands):
|
|
|
2016 |
|
|
2015 |
|
|
2014 |
|
|||
|
Property and equipment |
|
$ |
14,263 |
|
|
$ |
18,845 |
|
|
$ |
25,985 |
|
|
Client contracts |
|
|
7,587 |
|
|
|
8,018 |
|
|
|
5,600 |
|
Our capital expenditures for these periods consisted principally of investments in: (i) computer hardware, software, and related equipment; and (ii) statement production equipment.
Our investments in client contracts for 2016, 2015, and 2014 relate primarily to: (i) cash incentives provided to clients to convert their customer accounts to, or retain their customer’s accounts on, our managed services solutions; and (ii) direct and incremental costs incurred for conversion/set-up services related to long-term managed services arrangements where we are required to defer conversion/set-up services fees and recognize those fees as the related services are performed. For 2016, 2015, and 2014 our: (i) investments in client contracts related to cash incentives were $1.5 million, $1.8 million, and $3.0 million, respectively; and (ii) the deferral of costs related to conversion/set-up services provided under long-term managed services contracts were $6.1 million, $6.2 million, and $2.6 million, respectively.
34
Proceeds from the Disposition of Business Operations.
During 2016, we received additional cash proceeds totaling $8.9 million related to the sale of our cyber-security business marketed under the Invotas brand. The proceeds were contingent on a liquidation event, as defined in the sale agreement.
Cash Flows From Financing Activities. Our financing activities typically consist of various debt-related transactions and activities with our common stock, which are discussed below.
Issuance of Common Stock.
Proceeds from the issuance of common stock for 2016, 2015, and 2014 were $1.5 million, $1.5 million, and $1.4 million, respectively, and relates primarily to employee stock purchase plan purchases.
Repurchase of Common Stock.
During 2016, 2015, and 2014 we repurchased approximately 318,000, 1,838,000, and 733,000 shares of our common stock under the guidelines of our Stock Repurchase Program for $11.6 million, $56.9 million, and $19.1 million, respectively. Of our 2015 stock repurchases, $50 million was repurchased under an ASR Agreement entered into in March 2015.
Additionally, outside of our Stock Repurchase Program, during 2016, 2015, and 2014, we repurchased from our employees and then cancelled approximately 344,000 shares, 265,000 shares, and 252,000 shares of our common stock for $13.6 million, $8.1 million, and $6.9 million, respectively, in connection with minimum tax withholding requirements resulting from the vesting of restricted stock under our stock incentive plans.
Cash Dividends Paid on Common Stock.
During 2016, 2015, and 2014, the Board approved dividend payments totaling $23.8 million, $22.9 million, and $21.3 million, respectively, of which $24.1 million, $22.2 million, and $20.5 million, respectively, had been paid through December 31, 2016, 2015, and 2014 (with the differences attributed to unvested incentive shares that are paid upon vesting).
Long-term debt.
In March 2016, we completed an offering of $230 million of 4.25% senior subordinated convertible notes due March 15, 2036, paid $6.7 million of deferred financing costs, and repurchased $115.3 million aggregate principal amount of the 2010 Convertible Notes for a total purchase price of $215.7 million.
In February 2015 we amended our 2012 Credit Agreement and as a result, we repaid the outstanding principal balance of $120.0 million and borrowed $150.0 million under the 2015 Credit Agreement, resulting in a net increase of available cash of $30.0 million. As part of this refinancing, we paid $2.7 million of deferred financing costs. As of December 31, 2016, the total Term Loan balance outstanding was $135.0 million.
Additionally, during 2016, 2015, and 2014 we made principal repayments of $7.5 million, $7.5 million, and $15.0 million, respectively, on our long-term debt balance. See Note 5 to our Financial Statements for additional discussion of our long-term debt.
Contractual Obligations and Other Commercial Commitments and Contingencies
We have various contractual obligations that are recorded as liabilities in our Consolidated Balance Sheets. Other items, such as certain purchase commitments and other executory contracts, are not recognized as liabilities in our Balance Sheet but are required to be disclosed.
The following table summarizes our significant contractual obligations and commercial commitments as of December 31, 2016, and the future periods in which such obligations are expected to be settled in cash (in thousands).
|
|
|
|
|
|
|
Less than |
|
|
|
|
|
|
|
|
|
|
More than |
|
||
|
|
|
Total |
|
|
1 Year |
|
|
Years 2-3 |
|
|
Years 4-5 |
|
|
5 Years |
|
|||||
|
Long-term debt |
|
$ |
601,834 |
|
|
$ |
64,139 |
|
|
$ |
71,158 |
|
|
$ |
94,799 |
|
|
$ |
371,738 |
|
|
Leases |
|
|
72,132 |
|
|
|
13,007 |
|
|
|
22,979 |
|
|
|
14,567 |
|
|
|
21,579 |
|
|
Purchase obligations |
|
|
279,747 |
|
|
|
76,671 |
|
|
|
90,436 |
|
|
|
81,853 |
|
|
|
30,787 |
|
|
Other obligations |
|
|
11,488 |
|
|
|
5,744 |
|
|
|
5,744 |
|
|
|
- |
|
|
|
- |
|
|
Total |
|
$ |
965,201 |
|
|
$ |
159,561 |
|
|
$ |
190,317 |
|
|
$ |
191,219 |
|
|
$ |
424,104 |
|
35
The contractual obligation amounts reflected for our long-term debt are as of December 31, 2016, based upon the following assumptions:
|
(i) |
our 2010 Convertible Notes will remain outstanding through their maturity date of March 1, 2017; upon settlement, our cash obligation will not exceed the principal amount; and interest paid through maturity is at a rate of 3.0% per annum (see further discussion of our cash and non-cash obligations related to the 2010 Convertible Notes in Capital Resources below); |
|
(ii) |
our 2016 Convertible Notes will remain outstanding through their maturity date of March 15, 2036 (although the 2016 Convertible Notes can be converted during the period from, and including, December 15, 2021 to the close of business on the business day immediately preceding March 15, 2022 and holders may require us to repurchase the 2016 Convertible Notes for cash on each of March 15, 2022, March 14, 2026 and March 15, 2031); upon settlement, our cash obligation will not exceed the principal amount; and interest paid through maturity is at a rate of 4.25%. |
|
(iii) |
our Credit Agreement includes the mandatory quarterly amortization payments on the term loan as of December 31, 2016, and the interest paid throughout the life of the term loan is based upon the interest rate applicable as of December 31, 2016. |
Our long-term debt obligations are discussed in more detail in Note 5 to our Financial Statements.
The operating leases are discussed in Note 9 to our Financial Statements. As of December 31, 2016, our purchase obligations consist primarily of our expected minimum base fees under the Infocrossing service agreement (discussed in Note 9 to our Financial Statements).
The other obligations reflect the requirement for us to pay cash of approximately $11 million ratably over two years related to the deferred income tax liabilities associated with our repurchase of the 2004 Convertible Debt Securities as discussed in Note 7 to our Financial Statements.
Of the total contractual obligations and commercial commitments above, approximately $438 million is reflected on our Balance Sheet.
Off-Balance Sheet Arrangements
None
Capital Resources
The following are the key items to consider in assessing our sources and uses of capital resources:
Current Sources of Capital Resources.
|
|
• |
Cash, Cash Equivalents and Short-term Investments. As of December 31, 2016, we had cash, cash equivalents, and short-term investments of $276.5 million, of which approximately 77% is in U.S. Dollars and held in the U.S. We have $4.3 million of restricted cash, used primarily to collateralize outstanding letters of credit. For the remainder of the monies denominated in foreign currencies and/or located outside the U.S., we do not anticipate any material amounts being unavailable for use in running our business. |
|
|
• |
Operating Cash Flows. As described in the Liquidity section above, we believe we have the ability to generate strong cash flows to fund our operating activities and act as a source of funds for our capital resource needs. |
|
|
• |
Revolving Loan Facility. As of December 31, 2016, we had a $200 million revolving loan facility, the 2015 Revolver, with a syndicate of financial institutions. As of December 31, 2016, we had no borrowing outstanding on our 2015 Revolver and had the entire $200 million available to us. The 2015 Credit Agreement provides us with additional capital capacity, and greater flexibility to manage our capital structure over the next five years. Our long-term debt obligations are discussed in more detail in Note 5 to our Financial Statements. |
36
Uses/Potential Uses of Capital Resources. Below are the key items to consider in assessing our uses/potential uses of capital resources:
|
|
• |
Common Stock Repurchases. We have made repurchases of our common stock in the past under our Stock Repurchase Program. As of December 31, 2016, we had 6.7 million shares authorized for repurchase remaining under our Stock Repurchase Program. Our 2015 Credit Agreement places certain limitations on our ability to repurchase our common stock. |
During 2016, we repurchased 0.3 million shares of our common stock for $11.6 million (weighted-average price of $36.07 per share).
Under our Stock Repurchase Program, we may repurchase shares in the open market or a privately negotiated transaction, including through an ASR plan or under a SEC Rule 10b5-1 plan. The actual timing and amount of the share repurchases will be dependent on the then current market conditions and other business-related factors. Our common stock repurchases are discussed in more detail in Note 10 to our Financial Statements.
|
|
• |
Cash Dividends. During the year ended December 31, 2016, the Board declared dividends totaling $23.8 million. Going forward, we expect to pay cash dividends each year in March, June, September, and December, with the amount and timing subject to the Boards’ approval. |
|
|
• |
Acquisitions. As part of our growth strategy, we are continually evaluating potential business and/or asset acquisitions and investments in market share expansion with our existing and potential new clients. |
|
|
• |
Capital Expenditures. During 2016, we spent $14.3 million on capital expenditures. As of December 31, 2016, we had committed to purchase approximately $8 million of equipment. |
|
|
• |
Investments in Client Contracts. In the past, we have provided incentives to new or existing U.S. cloud-based clients to convert their customer accounts to, or retain their customer’s accounts on, our customer care and billing solutions. During 2016, we made investments in client contracts of $7.6 million. |
We have issued stock warrants to Comcast (the “Warrant Agreement”) for the right to purchase up to approximately 2.9 million shares of our common stock (the “Stock Warrants”) as an additional incentive for Comcast to convert new customer accounts to ACP. Once vested, Comcast may exercise the Stock Warrants and elect either physical delivery of common shares or net share settlement (cashless exercise). Alternatively, the exercise of the Stock Warrants may be settled with cash based solely on our approval, or if Comcast were to beneficially own or control in excess of 19.99% of the common stock or voting of the Company. As of December 31, 2016, 1.4 million Stock Warrants had vested based on the terms of the Warrant Agreement.
In January 2017, Comcast exercised 1.4 million vested Stock Warrants. We net share settled the exercise of the Stock Warrants by delivering approximately 649,000 shares of our common stock that we were holding as treasury shares. After this exercise, approximately 1.5 million Stock Warrants are outstanding, none of which are vested as of the date of this filing.
The Stock Warrants are discussed in more detail in Note 10 to our Financial Statements.
|
|
• |
Long-Term Debt. As discussed above, in March 2016, we completed an offering of $230 million of 4.25% senior subordinated convertible notes due March 15, 2036 (the 2016 Convertible Notes). As of December 31, 2016, our long-term debt consisted of the following: (i) 2016 Convertible Notes with a par value of $230 million; (ii) 2010 Convertible Notes with a par value of $34.7 million; and (ii) 2015 Credit Agreement term loan borrowings of $135 million. |
2016 Convertible Notes
The net proceeds from the sale of the 2016 Convertible Notes were approximately $223 million after deducting the initial purchasers’ discount and estimated financing costs payable by us. As of December 31, 2016, we have repurchased approximately $115 million aggregate principal amount of our 2010 Convertible Notes for a total purchase price of approximately $216 million with the net proceeds from the offering of the 2016 Convertible Notes. After these repurchases, the remaining aggregate principal outstanding on the 2010 Convertible Notes is $34.7 million. The remainder of the net proceeds will be used to settle the par value of the outstanding 2010 Convertible Notes.
During the next twelve months, there are no scheduled conversion triggers on our 2016 Convertible Notes. As a result, we expect our required debt service cash outlay during the next twelve months for the 2016 Convertible Notes to be limited to interest payments of $9.8 million.
37
2010 Convertible Notes
Beginning September 1, 2016, holders of the 2010 Convertible Notes can elect to convert their securities at any time with settlement occurring on March 1, 2017. Upon any conversion of the 2010 Convertible Notes, we will settle our conversion obligation as follows: (i) we are required to pay cash for 100% of the par value of the 2010 Convertible Notes that are converted; and (ii) to the extent the value of our conversion obligation exceeds the par value we will satisfy the remaining conversion obligation in our common stock. On March 1, 2017, we will cash settle $34.7 million par value of the 2010 Convertible Notes and pay approximately $0.5 million of interest. The difference between the par value payable in cash upon conversion and the total settlement value of the 2010 Convertible Notes of $39.8 million will be settled with common stock. The final settlement amount is based upon a 20-day observation period of our stock price through February 24, 2017.
2015 Credit Agreement
Our 2015 Credit Agreement mandatory repayments and the cash interest expense (based upon current interest rates) for 2017 is $15.0 million, and $4.1 million, respectively. We have the ability to make prepayments on our 2015 Credit Agreement without penalty.
Our long-term debt obligations are discussed in more detail in Note 5 to our Financial Statements.
In summary, we expect to continue to have material needs for capital resources going forward, as noted above. We believe that our current cash, cash equivalents and short-term investments balances and our 2015 Revolver, together with cash expected to be generated in the future from our current operating activities, will be sufficient to meet our anticipated capital resource requirements for at least the next 12 months. We also believe we could obtain additional capital through other debt sources which may be available to us if deemed appropriate.
Market risk is the potential loss arising from adverse changes in market rates and prices. As of December 31, 2016, we are exposed to various market risks, including changes in interest rates, fluctuations and changes in the market value of our cash equivalents and short-term investments, and changes in foreign currency exchange rates. We have not historically entered into derivatives or other financial instruments for trading or speculative purposes.
Interest Rate Risk
Long-Term Debt. The interest rate on our 2016 Convertible Notes and our 2010 Convertible Notes is fixed, and thus, as it relates to our convertible debt borrowings, we are not exposed to changes in interest rates.
The interest rates under our Credit Agreement are based upon an adjusted LIBOR rate plus an applicable margin, or an alternate base rate plus an applicable margin. Refer to Note 5 to our Financial Statements for further details of our long-term debt.
A hypothetical adverse change of 10% in the December 31, 2016 adjusted LIBOR rate would not have had a material impact upon our results of operations.
Market Risk
Cash Equivalents and Short-Term Investments. Our cash and cash equivalents as of December 31, 2016 and 2015 were $126.4 million and $132.6 million, respectively. Certain of our cash balances are “swept” into overnight money market accounts on a daily basis, and at times, any excess funds are invested in low-risk, somewhat longer term, cash equivalent instruments and short-term investments. Our cash equivalents are invested primarily in institutional money market funds, commercial paper, and time deposits held at major banks. We have minimal market risk for our cash and cash equivalents due to the relatively short maturities of the instruments.
Our short-term investments as of December 31, 2016 and 2015 were $150.1 million and $108.3 million, respectively. Currently, we utilize short-term investments as a means to invest our excess cash only in the U.S. The day-to-day management of our short-term investments is performed by a large financial institution in the U.S., using strict and formal investment guidelines approved by our Board. Under these guidelines, short-term investments are limited to certain acceptable investments with: (i) a maximum maturity; (ii) a maximum concentration and diversification; and (iii) a minimum acceptable credit quality. At this time, we believe we have minimal liquidity risk associated with the short-term investments included in our portfolio.
Long-Term Debt. The fair value of our convertible debt is exposed to market risk. We do not carry our convertible debt at fair value but present the fair value for disclosure purposes (see Note 2 to our Financial Statements). Generally, the fair value of our convertible
38
debt is impacted by changes in interest rates and changes in the price and volatility of our common stock. As of December 31, 2016, the fair value of the 2016 Convertible Notes and the 2010 Convertible Notes was estimated at $258.2 million and $74.8 million, respectively, using quoted market prices.
Foreign Currency Exchange Rate Risk
Due to foreign operations around the world, our balance sheet and income statement are exposed to foreign currency exchange risk due to the fluctuations in the value of currencies in which we conduct business. While we attempt to maximize natural hedges by incurring expenses in the same currency in which we contract revenue, the related expenses for that revenue could be in one or more differing currencies than the revenue stream.
During the year ended December 31, 2016, we generated approximately 89% of our revenues in U.S. dollars. We expect that, in the foreseeable future, we will continue to generate a very large percentage of our revenues in U.S. dollars.
As of December 31, 2016 and 2015, the carrying amounts of our monetary assets and monetary liabilities on the books of our non-U.S. subsidiaries in currencies denominated in a currency other than the functional currency of those non-U.S. subsidiaries are as follows (in thousands, in U.S. dollar equivalents):
|
|
|
December 31, 2016 |
|
|
December 31, 2015 |
|
||||||||||
|
|
|
Monetary |
|
|
Monetary |
|
|
Monetary |
|
|
Monetary |
|
||||
|
|
|
Liabilities |
|
|
Assets |
|
|
Liabilities |
|
|
Assets |
|
||||
|
Pounds sterling |
|
$ |
(18 |
) |
|
$ |
3,753 |
|
|
$ |
- |
|
|
$ |
2,646 |
|
|
Euro |
|
|
(135 |
) |
|
|
12,402 |
|
|
|
(179 |
) |
|
|
10,063 |
|
|
U.S. Dollar |
|
|
(197 |
) |
|
|
20,248 |
|
|
|
(346 |
) |
|
|
18,551 |
|
|
Other |
|
|
- |
|
|
|
2,419 |
|
|
|
(53 |
) |
|
|
3,709 |
|
|
Totals |
|
$ |
(350 |
) |
|
$ |
38,822 |
|
|
$ |
(578 |
) |
|
$ |
34,969 |
|
A hypothetical adverse change of 10% in the December 31, 2016 exchange rates would not have had a material impact upon our results of operations.
39
CSG SYSTEMS INTERNATIONAL, INC.
CONSOLIDATED FINANCIAL STATEMENTS
INDEX
|
Management’s Report on Internal Control Over Financial Reporting |
|
41 |
|
|
42 |
|
|
Consolidated Balance Sheets as of December 31, 2016 and 2015 |
|
44 |
|
Consolidated Statements of Income for the Years Ended December 31, 2016, 2015, and 2014 |
|
45 |
|
Consolidated Statements of Comprehensive Income for the Years Ended December 31, 2016, 2015, and 2014 |
|
46 |
|
|
47 |
|
|
Consolidated Statements of Cash Flows for the Years Ended December 31, 2016, 2015, and 2014 |
|
48 |
|
|
49 |
40
Management’s Report on Internal Control Over Financial Reporting
Management of CSG Systems International, Inc. and subsidiaries (the “Company”) is responsible for establishing and maintaining adequate internal control over financial reporting as defined in Rule 13a-15(f) or 15d-15(f) under the Securities Exchange Act of 1934, as amended. The Company’s internal control over financial reporting is designed to provide reasonable assurance regarding the reliability of financial reporting and the preparation of financial statements for external purposes in accordance with U.S. generally accepted accounting principles. The Company’s internal control over financial reporting includes those policies and procedures that:
|
|
(i) |
Pertain to the maintenance of records that, in reasonable detail, accurately and fairly reflect the transactions and dispositions of the assets of the Company; |
|
|
(ii) |
Provide reasonable assurance that transactions are recorded as necessary to permit preparation of financial statements in accordance with U.S. generally accepted accounting principles, and that receipts and expenditures of the Company are being made only in accordance with authorizations of management and directors of the Company; and |
|
|
(iii) |
Provide reasonable assurance regarding prevention or timely detection of unauthorized acquisition, use or disposition of the Company’s assets that could have a material effect on the financial statements. |
Because of its inherent limitations, internal control over financial reporting may not prevent or detect misstatements. Also, projections of any evaluation of effectiveness to future periods are subject to the risk that controls may become inadequate because of changes in conditions, or that the degree of compliance with the policies and procedures may deteriorate.
Management assessed the effectiveness of the Company’s internal control over financial reporting as of December 31, 2016. In making this assessment, management used the criteria set forth by the Committee of Sponsoring Organizations of the Treadway Commission (COSO) in Internal Control-Integrated Framework (2013).
Based on our assessment, management believes that the Company maintained effective internal control over financial reporting as of December 31, 2016.
The Company’s independent registered public accounting firm, KPMG LLP, has issued an attestation report on the effectiveness of the Company’s internal control over financial reporting as of December 31, 2016. That report appears immediately following.
41
Report of Independent Registered Public Accounting Firm
The Board of Directors and Stockholders
CSG Systems International, Inc.:
We have audited CSG Systems International, Inc.’s (the Company) internal control over financial reporting as of December 31, 2016, based on criteria established in Internal Control – Integrated Framework (2013) issued by the Committee of Sponsoring Organizations of the Treadway Commission (COSO). CSG Systems International Inc.’s management is responsible for maintaining effective internal control over financial reporting and for its assessment of the effectiveness of internal control over financial reporting, included in the accompanying Management’s Report on Internal Control over Financial Reporting. Our responsibility is to express an opinion on the Company’s internal control over financial reporting based on our audit.
We conducted our audit in accordance with the standards of the Public Company Accounting Oversight Board (United States). Those standards require that we plan and perform the audit to obtain reasonable assurance about whether effective internal control over financial reporting was maintained in all material respects. Our audit included obtaining an understanding of internal control over financial reporting, assessing the risk that a material weakness exists, and testing and evaluating the design and operating effectiveness of internal control based on the assessed risk. Our audit also included performing such other procedures as we considered necessary in the circumstances. We believe that our audit provides a reasonable basis for our opinion.
A company’s internal control over financial reporting is a process designed to provide reasonable assurance regarding the reliability of financial reporting and the preparation of financial statements for external purposes in accordance with generally accepted accounting principles. A company’s internal control over financial reporting includes those policies and procedures that (1) pertain to the maintenance of records that, in reasonable detail, accurately and fairly reflect the transactions and dispositions of the assets of the company; (2) provide reasonable assurance that transactions are recorded as necessary to permit preparation of financial statements in accordance with generally accepted accounting principles, and that receipts and expenditures of the company are being made only in accordance with authorizations of management and directors of the company; and (3) provide reasonable assurance regarding prevention or timely detection of unauthorized acquisition, use, or disposition of the company’s assets that could have a material effect on the financial statements.
Because of its inherent limitations, internal control over financial reporting may not prevent or detect misstatements. Also, projections of any evaluation of effectiveness to future periods are subject to the risk that controls may become inadequate because of changes in conditions, or that the degree of compliance with the policies or procedures may deteriorate.
In our opinion, CSG Systems International, Inc. maintained, in all material respects, effective internal control over financial reporting as of December 31, 2016, based on criteria established in Internal Control – Integrated Framework (2013) issued by the Committee of Sponsoring Organizations of the Treadway Commission (COSO).
We also have audited, in accordance with the standards of the Public Company Accounting Oversight Board (United States), the consolidated balance sheets of CSG Systems International, Inc. and subsidiaries as of December 31, 2016 and 2015, and the related consolidated statements of income, comprehensive income, stockholders’ equity, and cash flows for each of the years in the three-year period ended December 31, 2016, and our report dated February 24, 2017 expressed an unqualified opinion on those consolidated financial statements.
/s/ KPMG LLP
Omaha, Nebraska
February 24, 2017
42
Report of Independent Registered Public Accounting Firm
The Board of Directors and Stockholders
CSG Systems International, Inc.:
We have audited the accompanying consolidated balance sheets of CSG Systems International, Inc. and subsidiaries (the Company) as of December 31, 2016 and 2015, and the related consolidated statements of income, comprehensive income, stockholders’ equity, and cash flows for each of the years in the three-year period ended December 31, 2016. These consolidated financial statements are the responsibility of the Company’s management. Our responsibility is to express an opinion on these consolidated financial statements based on our audits.
We conducted our audits in accordance with the standards of the Public Company Accounting Oversight Board (United States). Those standards require that we plan and perform the audit to obtain reasonable assurance about whether the financial statements are free of material misstatement. An audit includes examining, on a test basis, evidence supporting the amounts and disclosures in the financial statements. An audit also includes assessing the accounting principles used and significant estimates made by management, as well as evaluating the overall financial statement presentation. We believe that our audits provide a reasonable basis for our opinion.
In our opinion, the consolidated financial statements referred to above present fairly, in all material respects, the financial position of CSG Systems International, Inc. and subsidiaries as of December 31, 2016 and 2015, and the results of their operations and their cash flows for each of the years in the three-year period ended December 31, 2016, in conformity with U.S. generally accepted accounting principles.
We also have audited, in accordance with the standards of the Public Company Accounting Oversight Board (United States), CSG Systems International, Inc.’s internal control over financial reporting as of December 31, 2016, based on criteria established in Internal Control – Integrated Framework (2013) issued by the Committee of Sponsoring Organizations of the Treadway Commission (COSO), and our report dated February 24, 2017 expressed an unqualified opinion on the effectiveness of the Company’s internal control over financial reporting.
/s/ KPMG LLP
Omaha, Nebraska
February 24, 2017
43
CSG SYSTEMS INTERNATIONAL, INC.
CONSOLIDATED BALANCE SHEETS
(in thousands, except per share amounts)
|
|
|
December 31, |
|
|
December 31, |
|
||
|
|
|
2016 |
|
|
2015 |
|
||
|
ASSETS |
|
|
|
|
|
|
|
|
|
Current assets: |
|
|
|
|
|
|
|
|
|
Cash and cash equivalents |
|
$ |
126,351 |
|
|
$ |
132,631 |
|
|
Short-term investments |
|
|
150,147 |
|
|
|
108,305 |
|
|
Total cash, cash equivalents and short-term investments |
|
|
276,498 |
|
|
|
240,936 |
|
|
Trade accounts receivable: |
|
|
|
|
|
|
|
|
|
Billed, net of allowance of $3,080 and $3,600 |
|
|
208,930 |
|
|
|
178,854 |
|
|
Unbilled |
|
|
30,828 |
|
|
|
41,110 |
|
|
Income taxes receivable |
|
|
11,931 |
|
|
|
4,038 |
|
|
Other current assets |
|
|
31,751 |
|
|
|
35,153 |
|
|
Total current assets |
|
|
559,938 |
|
|
|
500,091 |
|
|
Non-current assets: |
|
|
|
|
|
|
|
|
|
Property and equipment, net of depreciation of $122,866 and $112,282 |
|
|
33,116 |
|
|
|
35,992 |
|
|
Software, net of amortization of $99,316 and $95,094 |
|
|
30,427 |
|
|
|
35,095 |
|
|
Goodwill |
|
|
201,094 |
|
|
|
219,724 |
|
|
Client contracts, net of amortization of $96,723 and $87,890 |
|
|
40,675 |
|
|
|
39,738 |
|
|
Deferred income taxes |
|
|
14,218 |
|
|
|
17,462 |
|
|
Other assets |
|
|
12,411 |
|
|
|
14,629 |
|
|
Total non-current assets |
|
|
331,941 |
|
|
|
362,640 |
|
|
Total assets |
|
$ |
891,879 |
|
|
$ |
862,731 |
|
|
LIABILITIES, CURRENT PORTION OF LONG-TERM DEBT CONVERSION OBLIGATION AND STOCKHOLDERS' EQUITY |
|
|
|
|
|
|
|
|
|
Current liabilities: |
|
|
|
|
|
|
|
|
|
Current portion of long-term debt, net of unamortized discounts of $296 and $8,632 |
|
$ |
49,426 |
|
|
$ |
148,868 |
|
|
Client deposits |
|
|
33,916 |
|
|
|
33,694 |
|
|
Trade accounts payable |
|
|
35,118 |
|
|
|
43,392 |
|
|
Accrued employee compensation |
|
|
65,341 |
|
|
|
59,607 |
|
|
Deferred revenue |
|
|
45,064 |
|
|
|
41,907 |
|
|
Income taxes payable |
|
|
822 |
|
|
|
8,962 |
|
|
Other current liabilities |
|
|
22,342 |
|
|
|
22,980 |
|
|
Total current liabilities |
|
|
252,029 |
|
|
|
359,410 |
|
|
Non-current liabilities: |
|
|
|
|
|
|
|
|
|
Long-term debt, net of unamortized discounts of $23,007 and $4,738 |
|
|
326,993 |
|
|
|
130,262 |
|
|
Deferred revenue |
|
|
6,694 |
|
|
|
9,828 |
|
|
Income taxes payable |
|
|
2,245 |
|
|
|
4,413 |
|
|
Deferred income taxes |
|
|
99 |
|
|
|
182 |
|
|
Other non-current liabilities |
|
|
12,618 |
|
|
|
12,791 |
|
|
Total non-current liabilities |
|
|
348,649 |
|
|
|
157,476 |
|
|
Total liabilities |
|
|
600,678 |
|
|
|
516,886 |
|
|
Current portion of long-term debt conversion obligation |
|
|
39,841 |
|
|
|
- |
|
|
Stockholders' equity: |
|
|
|
|
|
|
|
|
|
Preferred stock, par value $.01 per share; 10,000 shares authorized; zero shares issued and outstanding |
|
|
- |
|
|
|
- |
|
|
Common stock, par value $.01 per share; 100,000 shares authorized; 3,971 and 4,664 shares reserved for employee stock purchase plan and stock incentive plans; 32,261 and 32,555 shares outstanding |
|
|
672 |
|
|
|
672 |
|
|
Common stock warrants; 2,851 and 2,851 warrants issued and outstanding |
|
|
16,007 |
|
|
|
7,310 |
|
|
Additional paid-in capital |
|
|
391,209 |
|
|
|
503,254 |
|
|
Treasury stock, at cost, 34,919 and 34,601 shares |
|
|
(826,002 |
) |
|
|
(814,437 |
) |
|
Accumulated other comprehensive income (loss): |
|
|
|
|
|
|
|
|
|
Unrealized loss on short-term investments, net of tax |
|
|
(159 |
) |
|
|
(97 |
) |
|
Cumulative foreign currency translation adjustments |
|
|
(45,213 |
) |
|
|
(26,288 |
) |
|
Accumulated earnings |
|
|
714,846 |
|
|
|
675,431 |
|
|
Total stockholders' equity |
|
|
251,360 |
|
|
|
345,845 |
|
|
Total liabilities, current portion of long-term debt conversion obligation and stockholders' equity |
|
$ |
891,879 |
|
|
$ |
862,731 |
|
The accompanying notes are an integral part of these consolidated financial statements.
44
CSG SYSTEMS INTERNATIONAL, INC.
CONSOLIDATED STATEMENTS OF INCOME
(in thousands, except per share amounts)
|
|
|
Year Ended December 31, |
|
|||||||||
|
|
|
|
2016 |
|
|
|
2015 |
|
|
|
2014 |
|
|
Revenues: |
|
|
|
|
|
|
|
|
|
|
|
|
|
Cloud and related solutions |
|
$ |
606,936 |
|
|
$ |
577,410 |
|
|
$ |
562,109 |
|
|
Software and services |
|
|
79,400 |
|
|
|
93,678 |
|
|
|
102,585 |
|
|
Maintenance |
|
|
74,622 |
|
|
|
81,432 |
|
|
|
86,592 |
|
|
Total revenues |
|
|
760,958 |
|
|
|
752,520 |
|
|
|
751,286 |
|
|
Cost of revenues (exclusive of depreciation, shown separately below): |
|
|
|
|
|
|
|
|
|
|
|
|
|
Cloud and related solutions |
|
|
282,952 |
|
|
|
270,715 |
|
|
|
277,084 |
|
|
Software and services |
|
|
49,202 |
|
|
|
68,597 |
|
|
|
79,640 |
|
|
Maintenance |
|
|
42,993 |
|
|
|
40,429 |
|
|
|
32,619 |
|
|
Total cost of revenues |
|
|
375,147 |
|
|
|
379,741 |
|
|
|
389,343 |
|
|
Other operating expenses: |
|
|
|
|
|
|
|
|
|
|
|
|
|
Research and development |
|
|
98,683 |
|
|
|
101,950 |
|
|
|
104,712 |
|
|
Selling, general and administrative |
|
|
140,467 |
|
|
|
139,839 |
|
|
|
153,488 |
|
|
Depreciation |
|
|
13,616 |
|
|
|
14,776 |
|
|
|
14,084 |
|
|
Restructuring and reorganization charges |
|
|
416 |
|
|
|
3,074 |
|
|
|
13,969 |
|
|
Total operating expenses |
|
|
628,329 |
|
|
|
639,380 |
|
|
|
675,596 |
|
|
Operating income |
|
|
132,629 |
|
|
|
113,140 |
|
|
|
75,690 |
|
|
Other income (expense): |
|
|
|
|
|
|
|
|
|
|
|
|
|
Interest expense |
|
|
(16,262 |
) |
|
|
(10,967 |
) |
|
|
(10,453 |
) |
|
Amortization of original issue discount |
|
|
(4,866 |
) |
|
|
(6,246 |
) |
|
|
(5,781 |
) |
|
Interest and investment income, net |
|
|
2,457 |
|
|
|
1,038 |
|
|
|
798 |
|
|
Loss on repurchase of convertible notes |
|
|
(8,651 |
) |
|
|
- |
|
|
|
- |
|
|
Other, net |
|
|
(5,308 |
) |
|
|
(624 |
) |
|
|
1,268 |
|
|
Total other |
|
|
(32,630 |
) |
|
|
(16,799 |
) |
|
|
(14,168 |
) |
|
Income before income taxes |
|
|
99,999 |
|
|
|
96,341 |
|
|
|
61,522 |
|
|
Income tax provision |
|
|
(37,117 |
) |
|
|
(33,774 |
) |
|
|
(25,811 |
) |
|
Net income |
|
$ |
62,882 |
|
|
$ |
62,567 |
|
|
$ |
35,711 |
|
|
|
|
|
|
|
|
|
|
|
|
|
|
|
|
Weighted-average shares outstanding: |
|
|
|
|
|
|
|
|
|
|
|
|
|
Basic |
|
|
30,968 |
|
|
|
31,051 |
|
|
|
32,449 |
|
|
Diluted |
|
|
33,014 |
|
|
|
33,438 |
|
|
|
33,736 |
|
|
|
|
|
|
|
|
|
|
|
|
|
|
|
|
Earnings per common share: |
|
|
|
|
|
|
|
|
|
|
|
|
|
Basic |
|
$ |
2.03 |
|
|
$ |
2.01 |
|
|
$ |
1.10 |
|
|
Diluted |
|
|
1.90 |
|
|
|
1.87 |
|
|
|
1.06 |
|
|
|
|
|
|
|
|
|
|
|
|
|
|
|
|
Cash dividends declared per common share |
|
$ |
0.74 |
|
|
$ |
0.70 |
|
|
$ |
0.62 |
|
The accompanying notes are an integral part of these consolidated financial statements.
45
CSG SYSTEMS INTERNATIONAL, INC.
CONSOLIDATED STATEMENTS OF COMPREHENSIVE INCOME
(in thousands)
|
|
|
Year Ended December 31, |
|
|||||||||
|
|
|
|
2016 |
|
|
|
2015 |
|
|
|
2014 |
|
|
Net income |
|
$ |
62,882 |
|
|
$ |
62,567 |
|
|
$ |
35,711 |
|
|
Other comprehensive income (loss), net of tax: |
|
|
|
|
|
|
|
|
|
|
|
|
|
Foreign currency translation adjustments |
|
|
(18,925 |
) |
|
|
(12,902 |
) |
|
|
(15,060 |
) |
|
Unrealized holding gains (losses) on short-term investments arising during period |
|
|
(62 |
) |
|
|
(103 |
) |
|
|
(35 |
) |
|
Cash flow hedges: |
|
|
|
|
|
|
|
|
|
|
|
|
|
Unrealized gains on change in fair value of interest rate swap contracts (net of tax effect of $0, $0, and $110) |
|
|
- |
|
|
|
- |
|
|
|
195 |
|
|
Reclassification adjustment for losses included in net income (net of tax effect of $0, $0, and $(55)) |
|
|
- |
|
|
|
- |
|
|
|
(97 |
) |
|
Net change in cash flow hedges |
|
|
- |
|
|
|
- |
|
|
|
98 |
|
|
Other comprehensive loss, net of tax |
|
|
(18,987 |
) |
|
|
(13,005 |
) |
|
|
(14,997 |
) |
|
Total comprehensive income, net of tax |
|
$ |
43,895 |
|
|
$ |
49,562 |
|
|
$ |
20,714 |
|
The accompanying notes are an integral part of these consolidated financial statements.
46
CSG SYSTEMS INTERNATIONAL, INC.
CONSOLIDATED STATEMENTS OF STOCKHOLDERS’ EQUITY
(in thousands)
|
|
Shares of Common Stock Outstanding |
|
Common Stock |
|
Common Stock Warrants |
|
Additional Paid-in Capital |
|
Treasury Stock |
|
Accumulated Other Comprehensive Income (Loss) |
|
Accumulated Earnings |
|
Total Stockholders' Equity |
|
||||||||
|
BALANCE, January 1, 2014 |
|
33,745 |
|
$ |
658 |
|
$ |
- |
|
$ |
473,190 |
|
$ |
(738,372 |
) |
$ |
1,617 |
|
$ |
621,169 |
|
$ |
358,262 |
|
|
|
|
|
|
|
|
|
|
|
|
|
|
|
|
|
|
|
|
|
|
|
|
|
|
|
|
Comprehensive income: |
|
|
|
|
|
|
|
|
|
|
|
|
|
|
|
|
|
|
|
|
|
|
|
|
|
Net income |
|
- |
|
|
- |
|
|
- |
|
|
- |
|
|
- |
|
|
- |
|
|
35,711 |
|
|
|
|
|
Unrealized loss on short-term investments, net of tax |
|
- |
|
|
- |
|
|
- |
|
|
- |
|
|
- |
|
|
(35 |
) |
|
- |
|
|
|
|
|
Unrealized pension plan gains and prior service costs, net of tax |
|
- |
|
|
- |
|
|
- |
|
|
- |
|
|
- |
|
|
98 |
|
|
- |
|
|
|
|
|
Foreign currency translation adjustments |
|
- |
|
|
- |
|
|
- |
|
|
- |
|
|
- |
|
|
(15,060 |
) |
|
- |
|
|
|
|
|
Total comprehensive income |
|
|
|
|
|
|
|
|
|
|
|
|
|
|
|
|
|
|
|
|
|
|
20,714 |
|
|
Repurchase of common stock |
|
(985 |
) |
|
(2 |
) |
|
- |
|
|
(6,925 |
) |
|
(19,106 |
) |
|
- |
|
|
- |
|
|
(26,033 |
) |
|
Issuance of common stock pursuant to employee stock purchase plan |
|
61 |
|
|
- |
|
|
- |
|
|
1,394 |
|
|
- |
|
|
- |
|
|
- |
|
|
1,394 |
|
|
Stock-based compensation income tax benefits |
|
- |
|
|
- |
|
|
- |
|
|
2,060 |
|
|
- |
|
|
- |
|
|
- |
|
|
2,060 |
|
|
Issuance of restricted common stock pursuant to stock-based compensation plans |
|
1,261 |
|
|
11 |
|
|
- |
|
|
(11 |
) |
|
- |
|
|
- |
|
|
- |
|
|
- |
|
|
Cancellation of restricted common stock issued pursuant to stock-based compensation plans |
|
(137 |
) |
|
- |
|
|
- |
|
|
- |
|
|
- |
|
|
- |
|
|
- |
|
|
- |
|
|
Stock-based compensation expense |
|
- |
|
|
- |
|
|
- |
|
|
16,706 |
|
|
- |
|
|
- |
|
|
- |
|
|
16,706 |
|
|
Issuance of common stock warrants, granted to Comcast |
|
- |
|
|
- |
|
|
6,694 |
|
|
- |
|
|
- |
|
|
- |
|
|
- |
|
|
6,694 |
|
|
Declaration of cash dividends |
|
- |
|
|
- |
|
|
- |
|
|
- |
|
|
- |
|
|
- |
|
|
(21,164 |
) |
|
(21,164 |
) |
|
BALANCE, December 31, 2014 |
|
33,945 |
|
$ |
667 |
|
$ |
6,694 |
|
$ |
486,414 |
|
$ |
(757,478 |
) |
$ |
(13,380 |
) |
$ |
635,716 |
|
$ |
358,633 |
|
|
|
|
|
|
|
|
|
|
|
|
|
|
|
|
|
|
|
|
|
|
|
|
|
|
|
|
Comprehensive income: |
|
|
|
|
|
|
|
|
|
|
|
|
|
|
|
|
|
|
|
|
|
|
|
|
|
Net income |
|
- |
|
|
- |
|
|
- |
|
|
- |
|
|
- |
|
|
- |
|
|
62,567 |
|
|
|
|
|
Unrealized loss on short-term investments, net of tax |
|
- |
|
|
- |
|
|
- |
|
|
- |
|
|
- |
|
|
(103 |
) |
|
- |
|
|
|
|
|
Foreign currency translation adjustments |
|
- |
|
|
- |
|
|
- |
|
|
- |
|
|
- |
|
|
(12,902 |
) |
|
- |
|
|
|
|
|
Total comprehensive income |
|
|
|
|
|
|
|
|
|
|
|
|
|
|
|
|
|
|
|
|
|
|
49,562 |
|
|
Repurchase of common stock |
|
(2,103 |
) |
|
(3 |
) |
|
- |
|
|
(8,065 |
) |
|
(56,959 |
) |
|
- |
|
|
- |
|
|
(65,027 |
) |
|
Issuance of common stock pursuant to employee stock purchase plan |
|
59 |
|
|
1 |
|
|
- |
|
|
1,546 |
|
|
- |
|
|
- |
|
|
- |
|
|
1,547 |
|
|
Stock-based compensation income tax benefits |
|
- |
|
|
- |
|
|
- |
|
|
2,185 |
|
|
- |
|
|
- |
|
|
- |
|
|
2,185 |
|
|
Issuance of restricted common stock pursuant to stock-based compensation plans |
|
728 |
|
|
8 |
|
|
- |
|
|
(8 |
) |
|
- |
|
|
- |
|
|
- |
|
|
- |
|
|
Cancellation of restricted common stock issued pursuant to stock-based compensation plans |
|
(74 |
) |
|
(1 |
) |
|
- |
|
|
1 |
|
|
- |
|
|
- |
|
|
- |
|
|
- |
|
|
Stock-based compensation expense |
|
- |
|
|
- |
|
|
- |
|
|
21,181 |
|
|
- |
|
|
- |
|
|
- |
|
|
21,181 |
|
|
Issuance of common stock warrants, granted to Comcast |
|
- |
|
|
- |
|
|
616 |
|
|
- |
|
|
- |
|
|
- |
|
|
- |
|
|
616 |
|
|
Declaration of cash dividends |
|
- |
|
|
- |
|
|
- |
|
|
- |
|
|
- |
|
|
- |
|
|
(22,852 |
) |
|
(22,852 |
) |
|
BALANCE, December 31, 2015 |
|
32,555 |
|
|
672 |
|
|
7,310 |
|
|
503,254 |
|
|
(814,437 |
) |
|
(26,385 |
) |
|
675,431 |
|
|
345,845 |
|
|
|
|
|
|
|
|
|
|
|
|
|
|
|
|
|
|
|
|
|
|
|
|
|
|
|
|
Comprehensive income: |
|
|
|
|
|
|
|
|
|
|
|
|
|
|
|
|
|
|
|
|
|
|
|
|
|
Net income |
|
- |
|
|
- |
|
|
- |
|
|
- |
|
|
- |
|
|
- |
|
|
62,882 |
|
|
|
|
|
Unrealized gain on short-term investments, net of tax |
|
- |
|
|
- |
|
|
- |
|
|
- |
|
|
- |
|
|
(62 |
) |
|
- |
|
|
|
|
|
Foreign currency translation adjustments |
|
- |
|
|
- |
|
|
- |
|
|
- |
|
|
- |
|
|
(18,925 |
) |
|
- |
|
|
|
|
|
Total comprehensive income |
|
|
|
|
|
|
|
|
|
|
|
|
|
|
|
|
|
|
|
|
|
|
43,895 |
|
|
Repurchase of common stock |
|
(662 |
) |
|
(3 |
) |
|
- |
|
|
(13,628 |
) |
|
(11,565 |
) |
|
- |
|
|
- |
|
|
(25,196 |
) |
|
Issuance of common stock pursuant to employee stock purchase plan |
|
44 |
|
|
- |
|
|
- |
|
|
1,547 |
|
|
- |
|
|
- |
|
|
- |
|
|
1,547 |
|
|
Stock-based compensation income tax benefits |
|
- |
|
|
- |
|
|
- |
|
|
4,729 |
|
|
- |
|
|
- |
|
|
- |
|
|
4,729 |
|
|
Issuance of restricted common stock pursuant to stock-based compensation plans |
|
572 |
|
|
5 |
|
|
- |
|
|
(5 |
) |
|
- |
|
|
- |
|
|
- |
|
|
- |
|
|
Cancellation of restricted common stock issued pursuant to stock-based compensation plans |
|
(248 |
) |
|
(2 |
) |
|
- |
|
|
2 |
|
|
- |
|
|
- |
|
|
- |
|
|
- |
|
|
Stock-based compensation expense |
|
- |
|
|
- |
|
|
- |
|
|
22,745 |
|
|
- |
|
|
- |
|
|
- |
|
|
22,745 |
|
|
Issuance of common stock warrants, granted to Comcast |
|
- |
|
|
- |
|
|
8,697 |
|
|
- |
|
|
- |
|
|
- |
|
|
- |
|
|
8,697 |
|
|
Issuance of convertible notes |
|
- |
|
|
- |
|
|
- |
|
|
9,816 |
|
|
- |
|
|
- |
|
|
- |
|
|
9,816 |
|
|
Repurchase of convertible notes, net of tax |
|
- |
|
|
- |
|
|
- |
|
|
(97,410 |
) |
|
- |
|
|
- |
|
|
- |
|
|
(97,410 |
) |
|
Debt conversion obligation reclassification |
|
- |
|
|
- |
|
|
- |
|
|
(39,841 |
) |
|
- |
|
|
- |
|
|
- |
|
|
(39,841 |
) |
|
Declaration of cash dividends |
|
- |
|
|
- |
|
|
- |
|
|
- |
|
|
- |
|
|
- |
|
|
(23,467 |
) |
|
(23,467 |
) |
|
BALANCE, December 31, 2016 |
|
32,261 |
|
$ |
672 |
|
$ |
16,007 |
|
$ |
391,209 |
|
$ |
(826,002 |
) |
$ |
(45,372 |
) |
$ |
714,846 |
|
$ |
251,360 |
|
The accompanying notes are an integral part of these consolidated financial statements.
47
CSG SYSTEMS INTERNATIONAL, INC.
CONSOLIDATED STATEMENTS OF CASH FLOWS
(in thousands)
|
|
|
Year Ended |
|
|||||||||
|
|
|
|
2016 |
|
|
|
2015 |
|
|
|
2014 |
|
|
Cash flows from operating activities: |
|
|
|
|
|
|
|
|
|
|
|
|
|
Net income |
|
$ |
62,882 |
|
|
$ |
62,567 |
|
|
$ |
35,711 |
|
|
Adjustments to reconcile net income to net cash provided by operating activities- |
|
|
|
|
|
|
|
|
|
|
|
|
|
Depreciation |
|
|
13,616 |
|
|
|
14,776 |
|
|
|
14,084 |
|
|
Amortization |
|
|
27,626 |
|
|
|
29,281 |
|
|
|
33,553 |
|
|
Amortization of original issue discount |
|
|
4,866 |
|
|
|
6,246 |
|
|
|
5,781 |
|
|
Asset impairment |
|
|
- |
|
|
|
1,685 |
|
|
|
- |
|
|
(Gain) loss on short-term investments and other |
|
|
(83 |
) |
|
|
177 |
|
|
|
1,123 |
|
|
Loss on repurchase of convertible notes |
|
|
8,651 |
|
|
|
- |
|
|
|
- |
|
|
Gain on disposition of business operations |
|
|
(6,611 |
) |
|
|
(3,733 |
) |
|
|
(222 |
) |
|
Deferred income taxes |
|
|
(2,811 |
) |
|
|
(16,106 |
) |
|
|
41 |
|
|
Excess tax benefit of stock-based compensation awards |
|
|
(4,729 |
) |
|
|
(2,185 |
) |
|
|
(2,060 |
) |
|
Stock-based compensation |
|
|
22,715 |
|
|
|
21,130 |
|
|
|
16,655 |
|
|
Changes in operating assets and liabilities, net of acquired amounts: |
|
|
|
|
|
|
|
|
|
|
|
|
|
Trade accounts receivable, net |
|
|
(23,243 |
) |
|
|
1,831 |
|
|
|
(14,326 |
) |
|
Other current and non-current assets |
|
|
255 |
|
|
|
(5,387 |
) |
|
|
(3,230 |
) |
|
Income taxes payable/receivable |
|
|
(14,167 |
) |
|
|
8,953 |
|
|
|
(2,260 |
) |
|
Trade accounts payable and accrued liabilities |
|
|
(5,738 |
) |
|
|
13,916 |
|
|
|
4,359 |
|
|
Deferred revenue |
|
|
957 |
|
|
|
3,808 |
|
|
|
(5,558 |
) |
|
Net cash provided by operating activities |
|
|
84,186 |
|
|
|
136,959 |
|
|
|
83,651 |
|
|
|
|
|
|
|
|
|
|
|
|
|
|
|
|
Cash flows from investing activities: |
|
|
|
|
|
|
|
|
|
|
|
|
|
Purchases of property and equipment |
|
|
(14,263 |
) |
|
|
(18,845 |
) |
|
|
(25,985 |
) |
|
Purchases of short-term investments |
|
|
(196,967 |
) |
|
|
(181,553 |
) |
|
|
(190,427 |
) |
|
Proceeds from sale/maturity of short-term investments |
|
|
157,825 |
|
|
|
192,994 |
|
|
|
197,466 |
|
|
Acquisition of and investments in business, net of cash acquired |
|
|
- |
|
|
|
(1,300 |
) |
|
|
- |
|
|
Acquisition of and investments in client contracts |
|
|
(7,587 |
) |
|
|
(8,018 |
) |
|
|
(5,600 |
) |
|
Proceeds from the disposition of business operations |
|
|
8,850 |
|
|
|
- |
|
|
|
1,130 |
|
|
Net cash used in investing activities |
|
|
(52,142 |
) |
|
|
(16,722 |
) |
|
|
(23,416 |
) |
|
|
|
|
|
|
|
|
|
|
|
|
|
|
|
Cash flows from financing activities: |
|
|
|
|
|
|
|
|
|
|
|
|
|
Proceeds from issuance of common stock |
|
|
1,547 |
|
|
|
1,547 |
|
|
|
1,394 |
|
|
Payment of cash dividends |
|
|
(24,110 |
) |
|
|
(22,238 |
) |
|
|
(20,530 |
) |
|
Repurchase of common stock |
|
|
(25,196 |
) |
|
|
(65,027 |
) |
|
|
(25,138 |
) |
|
Payments on acquired asset financing |
|
|
- |
|
|
|
(829 |
) |
|
|
(1,097 |
) |
|
Proceeds from long-term debt |
|
|
230,000 |
|
|
|
150,000 |
|
|
|
- |
|
|
Payments on long-term debt |
|
|
(7,500 |
) |
|
|
(127,500 |
) |
|
|
(15,000 |
) |
|
Repurchase of convertible notes |
|
|
(215,676 |
) |
|
|
- |
|
|
|
- |
|
|
Payments of deferred financing costs |
|
|
(6,744 |
) |
|
|
(2,742 |
) |
|
|
- |
|
|
Excess tax benefit of stock-based compensation awards |
|
|
4,729 |
|
|
|
2,185 |
|
|
|
2,060 |
|
|
Net cash used in financing activities |
|
|
(42,950 |
) |
|
|
(64,604 |
) |
|
|
(58,311 |
) |
|
Effect of exchange rate fluctuations on cash |
|
|
4,626 |
|
|
|
(4,714 |
) |
|
|
(2,898 |
) |
|
|
|
|
|
|
|
|
|
|
|
|
|
|
|
Net increase (decrease) in cash and cash equivalents |
|
|
(6,280 |
) |
|
|
50,919 |
|
|
|
(974 |
) |
|
|
|
|
|
|
|
|
|
|
|
|
|
|
|
Cash and cash equivalents, beginning of period |
|
|
132,631 |
|
|
|
81,712 |
|
|
|
82,686 |
|
|
Cash and cash equivalents, end of period |
|
$ |
126,351 |
|
|
$ |
132,631 |
|
|
$ |
81,712 |
|
|
|
|
|
|
|
|
|
|
|
|
|
|
|
|
Supplemental disclosures of cash flow information: |
|
|
|
|
|
|
|
|
|
|
|
|
|
Cash paid during the period for- |
|
|
|
|
|
|
|
|
|
|
|
|
|
Interest |
|
$ |
12,191 |
|
|
$ |
8,380 |
|
|
$ |
8,265 |
|
|
Income taxes |
|
|
53,020 |
|
|
|
41,860 |
|
|
|
25,153 |
|
The accompanying notes are an integral part of these consolidated financial statements.
48
NOTES TO CONSOLIDATED FINANCIAL STATEMENTS
|
1. |
General |
CSG Systems International, Inc. (the “Company”, “CSG”, or forms of the pronoun “we”), a Delaware corporation, was formed in October 1994 and is based in Englewood, Colorado. We are a provider of business support solutions, primarily serving the global communications industry. We have over thirty years of experience supporting communications service providers’ management of their revenue, customer interactions, and digital ecosystem as they advance their video, voice, data content, and digital services to consumers. Over the years, we have focused our research and development (“R&D”) and acquisition investments on expanding our solution set to address the complex, transformative needs of service providers. We are a S&P SmallCap 600 company.
The accompanying Consolidated Financial Statements (“Financial Statements”) are prepared in conformity with accounting principles generally accepted (“GAAP”) in the United States (“U.S.”).
|
2. |
Summary of Significant Accounting Policies |
Principles of Consolidation. Our Financial Statements include all of our accounts and our subsidiaries’ accounts. All material intercompany accounts and transactions have been eliminated.
Translation of Foreign Currency. Our foreign subsidiaries use the local currency of the countries in which they operate as their functional currency. Their assets and liabilities are translated into U.S. dollars at the exchange rates in effect at the balance sheet date. Revenues, expenses, and cash flows are translated at the average rates of exchange prevailing during the period. Foreign currency translation adjustments are included in comprehensive income in stockholders’ equity. Foreign currency transaction gains and losses are included in the determination of net income.
Use of Estimates in Preparation of Our Financial Statements. The preparation of our Financial Statements requires management to make estimates and assumptions that affect the reported amounts of assets and liabilities and disclosure of contingent assets and liabilities at the date of our Financial Statements and the reported amounts of revenues and expenses during the reporting period. Actual results could differ from those estimates. The more critical estimates and related assumptions that affect our financial position and results of operations are in the areas of: (i) revenue recognition; (ii) impairment assessments of goodwill and other long-lived assets; (iii) income taxes; and (iv) loss contingencies.
Revenue Recognition. We use various judgments and estimates in connection with the determination of the amount of revenues to be recognized in each accounting period. Our primary revenue recognition criteria include: (i) persuasive evidence of an arrangement; (ii) delivery; (iii) fixed or determinable fees; and (iv) collectability of fees.
Cloud and Related Solutions.
Our cloud and related solutions revenue relates to: (i) our cloud-based, revenue management and content monetization solutions, and various related services; and (ii) our managed services offering in which we operate software solutions (primarily our software solutions) on behalf of our clients.
We contract for our cloud-based solutions using long-term arrangements whose terms have typically ranged from three to ten years. The long-term cloud-based arrangements include multiple services delivered each month, to include such things as: (i) revenue billing and data processing services; (ii) business support services (e.g., workforce management tools, consumer credit verifications, etc.); (iii) content monetization and delivery functions; and (iv) customer statement invoice printing and mailing services. The fees for these deliverables typically are billed to our clients monthly based upon actual monthly volumes and/or usage of services (e.g., the number of client customers processed on our systems, the number of transactions processed on our systems, and/or the quantity and content of the monthly statements and mailings processed through our systems) or on a fixed monthly fee.
We contract for our other related solutions such as managed services using long-term arrangements whose terms have typically ranged from three to five years. Under managed services agreements, we may operate software products (primarily our software solutions) on behalf of our clients: (i) out of a client’s data center; (ii) out of a data center we own and operate; or (iii) out of a third-party data center we contract with for such services. Managed services can also include us providing other services, such as transitional services, fulfillment, remittance processing, operational consulting, back office, and end user billing services.
We recognize cloud and related solutions revenue on a monthly basis as we provide the services.
49
Software and Services.
Our software and services revenue relates primarily to: (i) software license sales; and (ii) professional services to implement the software.
The accounting for software license arrangements, especially when software is sold in a multiple-element arrangement, can be complex and requires considerable judgment. Key factors considered in accounting for software license and related services include the following criteria: (i) the identification of the separate elements of the arrangement; (ii) the determination of whether any undelivered elements are essential to the functionality of the delivered elements; (iii) the assessment of whether the software, if hosted, should be accounted for as a services arrangement and thus outside the scope of the software revenue recognition literature; (iv) the determination of vendor specific objective evidence (“VSOE”) of fair value for the undelivered element(s) of the arrangement; (v) the assessment of whether the software license fees are fixed or determinable; (vi) the determination as to whether the fees are considered collectible; and (vii) the assessment of whether services included in the arrangement represent significant production, customization or modification of the software. The evaluation of these factors, and the ultimate revenue recognition decision, requires significant judgments to be made by us. The judgments made in this area could have a significant effect on revenues recognized in any period by changing the amount and/or the timing of the revenue recognized. In addition, because software licenses typically have little or no direct, incremental costs related to the recognition of the revenue, these judgments could also have a significant effect on our results of operations.
The initial sale of software products generally requires significant production, modification or customization and thus falls under the guidelines of contract accounting. In these software license arrangements, the elements of the arrangements are typically a software license, professional services, and maintenance. When we have VSOE of fair value for the maintenance, which we generally do, we allocate a portion of the total arrangement fee to the maintenance element based on its VSOE of fair value, and the balance of the arrangement fee is subject to contract accounting using the percentage-of-completion (“POC”) method of accounting. Under the POC method of accounting, software license and professional services revenues are typically recognized as the professional services related to the software implementation project are performed. We are using hours performed on the project as the measure to determine the percentage of the work completed.
In certain instances, we sell software license volume upgrades, which provide our clients the right to use our software to process higher transaction volume levels. In these instances, if: (i) maintenance is the only undelivered element of the software arrangement; (ii) we have VSOE of fair value for the maintenance related to the volume upgrade; and (iii) we meet the other revenue recognition criteria, we recognize the software license revenue on the effective date of the volume upgrade.
A portion of our professional services revenues does not include an element of software delivery (e.g., business consulting services, etc.), and thus, do not fall within the scope of specific authoritative accounting literature for software arrangements. In these cases, revenues from fixed-price, professional service contracts are recognized using a method consistent with the proportional performance method, which is relatively consistent with our POC methodology. Under a proportional performance model, revenue is recognized by allocating revenue between reporting periods based on relative service provided in each reporting period, and costs are generally recognized as incurred. We utilize an input-based approach (i.e., hours worked) for purposes of measuring performance on these types of contracts. Our input measure is considered a reasonable surrogate for an output measure. In instances when the work performed on fixed price agreements is of relatively short duration, or if we are unable to make reasonably dependable estimates at the outset of the arrangement, we use the completed contract method of accounting whereby revenue is recognized when the work is completed.
Our use of the POC and proportional performance methods of accounting on professional services engagements requires estimates of the total project revenues, total project costs and the expected hours necessary to complete a project. Changes in estimates as a result of additional information or experience on a project as work progresses are inherent characteristics of the POC and proportional performance methods of accounting as we are exposed to various business risks in completing these engagements. The estimation process to support these methods of accounting is more difficult for projects of greater length and/or complexity. The judgments and estimates made in this area could: (i) have a significant effect on revenues recognized in any period by changing the amount and/or the timing of the revenue recognized; and/or (ii) impact the expected profitability of a project, including whether an overall loss on an arrangement has occurred. To mitigate the inherent risks in using the POC and proportional performance methods of accounting, we track our performance on projects and reevaluate the appropriateness of our estimates as part of our monthly accounting cycle.
Revenues from professional services contracts billed on a time-and-materials basis are recognized as the services are performed and as amounts due from clients are deemed collectible and contractually non-refundable.
Maintenance.
Our maintenance revenue relates primarily to support of our software once it has been implemented. Maintenance revenues are recognized ratably over the software maintenance period. Our maintenance consists primarily of client and product support, technical updates (e.g., bug fixes, etc.), and unspecified upgrades or enhancements to our software products. If specified upgrades or enhancements are offered in an arrangement, which is rare, they are accounted for as a separate element of the software arrangement.
50
Deferred Revenue and Unbilled Accounts Receivable. Client payments and billed amounts due from clients in excess of revenue recognized are recorded as deferred revenue. Deferred revenue amounts expected to be recognized within the next twelve months are classified as current liabilities. Revenue recognized prior to the scheduled billing date is recorded as unbilled accounts receivable.
Postage. We pass through to our clients the cost of postage that is incurred on behalf of those clients, and typically require an advance payment on expected postage costs. These advance payments are included in client deposits in the accompanying Consolidated Balance Sheets (“Balance Sheets” or “Balance Sheet”) and are classified as current liabilities regardless of the contract period. We net the cost of postage against the postage reimbursements for those clients where we require advance deposits, and include the net amount (which is not material) in cloud and related solutions revenues.
Cash and Cash Equivalents. We consider all highly liquid investments with original maturities of three months or less at the date of purchase to be cash equivalents. As of December 31, 2016 and 2015, our cash equivalents consist primarily of institutional money market funds, commercial paper, and time deposits held at major banks.
As of December 31, 2016 and 2015, we had $4.3 million and $5.0 million, respectively, of restricted cash that serves to collateralize outstanding letters of credit. This restricted cash is included in cash and cash equivalents in our Balance Sheet.
Short-term Investments and Other Financial Instruments. Our financial instruments as of December 31, 2016 and 2015 include cash and cash equivalents, short-term investments, accounts receivable, accounts payable, and debt. Because of their short maturities, the carrying amounts of cash equivalents, accounts receivable, and accounts payable approximate their fair value.
Our short-term investments and certain of our cash equivalents are considered “available-for-sale” and are reported at fair value in our Balance Sheets, with unrealized gains and losses, net of the related income tax effect, excluded from earnings and reported in a separate component of stockholders’ equity. Realized and unrealized gains and losses were not material in any period presented.
Primarily all short-term investments held by us as of December 31, 2016 and 2015 have contractual maturities of less than two years from the time of acquisition. Our short-term investments at December 31, 2016 and 2015 consisted almost entirely of fixed income securities. Proceeds from the sale/maturity of short-term investments in 2016, 2015, and 2014 were $157.8 million, $193.0 million, and $197.5 million, respectively.
The following table represents the fair value hierarchy based upon three levels of inputs, of which Levels 1 and 2 are considered observable and Level 3 is unobservable, for our financial assets and liabilities measured at fair value (in thousands):
|
|
|
December 31, 2016 |
|
|
December 31, 2015 |
|
||||||||||||||||||
|
|
|
Level 1 |
|
|
Level 2 |
|
|
Total |
|
|
Level 1 |
|
|
Level 2 |
|
|
Total |
|
||||||
|
Assets: |
|
|
|
|
|
|
|
|
|
|
|
|
|
|
|
|
|
|
|
|
|
|
|
|
|
Cash equivalents: |
|
|
|
|
|
|
|
|
|
|
|
|
|
|
|
|
|
|
|
|
|
|
|
|
|
Money market funds |
|
$ |
6,531 |
|
|
$ |
— |
|
|
$ |
6,531 |
|
|
$ |
35,730 |
|
|
$ |
— |
|
|
$ |
35,730 |
|
|
Commercial paper |
|
— |
|
|
|
24,826 |
|
|
|
24,826 |
|
|
— |
|
|
|
17,245 |
|
|
|
17,245 |
|
||
|
Short-term investments: |
|
|
|
|
|
|
|
|
|
|
|
|
|
|
|
|
|
|
|
|
|
|
|
|
|
Corporate debt securities |
|
— |
|
|
|
109,140 |
|
|
|
109,140 |
|
|
— |
|
|
|
77,898 |
|
|
|
77,898 |
|
||
|
Municipal bonds |
|
— |
|
|
|
— |
|
|
|
— |
|
|
— |
|
|
|
2,763 |
|
|
|
2,763 |
|
||
|
U.S. government agency bonds |
|
— |
|
|
|
26,513 |
|
|
|
26,513 |
|
|
— |
|
|
|
16,201 |
|
|
|
16,201 |
|
||
|
Asset-backed securities |
|
— |
|
|
|
14,494 |
|
|
|
14,494 |
|
|
— |
|
|
|
11,443 |
|
|
|
11,443 |
|
||
|
Total |
|
$ |
6,531 |
|
|
$ |
174,973 |
|
|
$ |
181,504 |
|
|
$ |
35,730 |
|
|
$ |
125,550 |
|
|
$ |
161,280 |
|
Valuation inputs used to measure the fair values of our money market funds were derived from quoted market prices. The fair values of all other financial instruments are based upon pricing provided by third-party pricing services. These prices were derived from observable market inputs.
We have chosen not to measure our debt at fair value, with changes recognized in earnings each reporting period. The following table indicates the carrying value and estimated fair value of our debt as of the indicated periods (in thousands):
|
|
|
December 31, 2016 |
|
|
December 31, 2015 |
|
||||||||||
|
|
|
Carrying |
|
|
Fair |
|
|
Carrying |
|
|
Fair |
|
||||
|
|
|
Value |
|
|
Value |
|
|
Value |
|
|
Value |
|
||||
|
Credit agreement (carrying value including current maturities) |
|
$ |
135,000 |
|
|
$ |
135,000 |
|
|
$ |
142,500 |
|
|
$ |
142,500 |
|
|
2010 Convertible debt (par value) |
|
|
34,722 |
|
|
|
74,795 |
|
|
|
150,000 |
|
|
|
237,900 |
|
|
2016 Convertible debt (par value) |
|
|
230,000 |
|
|
|
258,175 |
|
|
— |
|
|
— |
|
||
51
The fair value for our Credit Agreement was estimated using a discounted cash flow methodology, while the fair value for our convertible debt was estimated based upon quoted market prices or recent sales activity, both of which are considered Level 2 inputs. See Note 5 for discussion regarding our debt.
Concentrations of Credit Risk. In the normal course of business, we are exposed to credit risk. The principal concentrations of credit risk relate to cash deposits, cash equivalents, short-term investments, and accounts receivable. We regularly monitor credit risk exposures and take steps to mitigate the likelihood of these exposures resulting in a loss. We hold our cash deposits, cash equivalents, and short-term investments with financial institutions we believe to be of sound financial condition.
We generally do not require collateral or other security to support accounts receivable. We evaluate the credit worthiness of our clients in conjunction with our revenue recognition processes, as well as through our ongoing collectability assessment processes for accounts receivable. We maintain an allowance for doubtful accounts receivable based upon factors surrounding the credit risk of specific clients, historical trends, and other information. We use various judgments and estimates in determining the adequacy of the allowance for doubtful accounts receivable. See Note 3 for additional details of our concentration of accounts receivable.
The activity in our allowance for doubtful accounts receivable is as follows (in thousands):
|
|
|
2016 |
|
|
2015 |
|
|
2014 |
|
|||
|
Balance, beginning of year |
|
$ |
3,600 |
|
|
$ |
3,323 |
|
|
$ |
2,359 |
|
|
Additions to expense |
|
|
614 |
|
|
|
533 |
|
|
|
1,406 |
|
|
Write-offs |
|
|
(1,102 |
) |
|
|
(318 |
) |
|
|
(465 |
) |
|
Recoveries |
|
|
— |
|
|
|
89 |
|
|
|
— |
|
|
Other |
|
|
(32 |
) |
|
|
(27 |
) |
|
23 |
|
|
|
Balance, end of year |
|
$ |
3,080 |
|
|
$ |
3,600 |
|
|
$ |
3,323 |
|
Property and Equipment. Property and equipment are recorded at cost (or at estimated fair value if acquired in a business combination) and are depreciated over their estimated useful lives ranging from three to ten years. Leasehold improvements are depreciated over the shorter of their economic life or the lease term. Depreciation expense is computed using the straight-line method for financial reporting purposes. Depreciation expense for all property and equipment is reflected in our accompanying Consolidated Statements of Income (“Income Statements”) separately in the aggregate and is not included in the cost of revenues or the other components of operating expenses. Depreciation for income tax purposes is computed using accelerated methods.
Software. We expend substantial amounts on R&D, particularly for new products and services, or for enhancements of existing products and services. For development of software products that are to be licensed by us, we expense all costs related to the development of the software until technological feasibility is established. For development of software to be used internally (e.g., cloud-based systems software), we expense all costs prior to the application development stage.
During 2016, 2015, and 2014, we expended $98.7 million, $102.0 million, and $104.7 million, respectively, on R&D projects. We did not capitalize any R&D costs in 2016, 2015, and 2014, as the costs subject to capitalization during these periods were not material. We did not have any capitalized R&D costs included in our December 31, 2016 and 2015 Balance Sheets.
Realizability of Long-Lived Assets. We evaluate our long-lived assets, other than goodwill, for possible impairment whenever events or changes in circumstances indicate that the carrying value of these assets may not be recoverable. A long-lived asset is impaired if estimated future undiscounted cash flows associated with that asset are insufficient to recover the carrying amount of the long-lived asset. If deemed impaired, the long-lived asset is written down to its fair value.
Goodwill. We evaluate our goodwill for impairment on an annual basis. In addition, we evaluate our goodwill on a more periodic basis (e.g., quarterly) if events occur or circumstances change that could indicate a potential impairment may have occurred. Goodwill is considered impaired if the carrying value of the reporting unit which includes the goodwill is greater than the estimated fair value of the reporting unit.
Contingencies. We accrue for a loss contingency when: (i) it is probable that an asset has been impaired, or a liability has been incurred; and (ii) the amount of the loss can be reasonably estimated. The determination of accounting for loss contingencies is subject to various judgments and estimates. We do not record the benefit from a gain contingency until the benefit is realized.
52
Earnings Per Common Share (“EPS”). Basic and diluted EPS amounts are presented on the face of our Income Statements.
No reconciliation of the basic and diluted EPS numerators is necessary as net income is used as the numerators for all periods presented. The reconciliation of the basic and diluted EPS denominators related to the common shares is included in the following table (in thousands):
|
|
|
2016 |
|
|
2015 |
|
|
2014 |
|
|||
|
Basic weighted-average common shares |
|
|
30,968 |
|
|
|
31,051 |
|
|
|
32,449 |
|
|
Dilutive effect of restricted common stock |
|
|
603 |
|
|
|
624 |
|
|
|
569 |
|
|
Dilutive effect of 2010 Convertible Notes |
|
|
1,062 |
|
|
|
1,633 |
|
|
|
717 |
|
|
Dilutive effect of Stock Warrants |
|
|
381 |
|
|
|
130 |
|
|
|
1 |
|
|
Diluted weighted-average common shares |
|
|
33,014 |
|
|
|
33,438 |
|
|
|
33,736 |
|
In 2016, we repurchased 0.3 million shares of our common stock under our stock repurchase program.
The Convertible Notes have a dilutive effect only in those quarterly periods in which our average stock price exceeds the current effective conversion price (see Note 5).
The Stock Warrants have a dilutive effect only in those quarterly periods in which our average stock price exceeds the exercise price of $26.68 per warrant (under the treasury stock method), and are not subject to performance vesting conditions (see Note 10).
Potentially dilutive common shares related to unvested restricted stock and Stock Warrants excluded from the computation of diluted EPS, as the effect was antidilutive, were not material in any period presented.
Stock-Based Compensation. Stock-based compensation represents the cost related to stock-based awards granted to employees and non-employee directors. We measure stock-based compensation cost at the grant date of the award, based on the estimated fair value of the award and recognize the cost (net of estimated forfeitures) over the requisite service period. Benefits of tax deductions in excess of recognized compensation expense, if any, are reported as a financing cash inflow rather than as an operating cash inflow.
Income Taxes. We account for income taxes using the asset and liability method. Under this method, income tax expense is recognized for the amount of taxes payable or refundable for the current year. In addition, deferred tax assets and liabilities are recognized for expected future tax consequences of temporary differences between the financial reporting and tax bases of assets and liabilities using enacted tax rates in effect for the year in which the differences are expected to reverse. The effect of a change in tax rates on deferred tax assets and liabilities is recognized in income in the period that includes the enactment date.
Accounting Pronouncements Adopted. In April 2015, the Financial Accounting Standards Board (“FASB”) issued Accounting Standards Update (“ASU”) 2015-03, Interest-Imputation of Interest (Subtopic 835-30). This ASU requires that debt issuance costs related to a recognized debt liability be presented in the balance sheet as a reduction from the carrying amount of that debt liability, consistent with debt discounts. This ASU is effective in fiscal years beginning after December 15, 2015 and must be applied retrospectively. We adopted this ASU retrospectively on January 1, 2016, which resulted in the reclassification of $5.4 million of debt issuance costs from other assets to long-term debt on our December 31, 2015 Balance Sheet.
In November 2015, the FASB issued ASU 2015-17, Income Taxes (Topic 740), requiring that all deferred tax liabilities and assets be classified as noncurrent. Prior guidance required us to record deferred tax balances as either current or non-current in accordance with the classification of the underlying attributes. This ASU is effective in fiscal years beginning after December 15, 2016, with early adoption permitted and may be applied either prospectively to all deferred tax liabilities and assets or retrospectively to all periods presented. We adopted this ASU retrospectively on January 1, 2016, which resulted in a decrease of $18.1 million in current deferred income tax assets, an increase in non-current deferred income tax assets of $9.1 million and a decrease in non-current deferred income tax liabilities of $9.0 million on our December 31, 2015 Balance Sheet.
Accounting Pronouncement Issued But Not Yet Effective. The FASB has issued ASU 2014-09, Revenue from Contracts with Customers (Topic 606). In August 2015, the FASB issued ASU 2015-14 Revenue from Contracts with Customers (Topic 606): Deferral of the Effective Date which deferred the effective date of ASU 2014-09 for one year. In December 2016, the FASB issued ASU 2016-20 Technical Corrections and Improvements to Topic 606, Revenue from Contracts with Customers. Collectively, this ASU is a single comprehensive model which supersedes nearly all existing revenue recognition guidance under U.S. GAAP. Under the new guidance, revenue is recognized when promised goods or services are transferred to customers in an amount that reflects the consideration that is expected to be received for those goods or services. The ASU also requires additional disclosure about the nature, amount, timing, and uncertainty of revenue and cash flows arising from customer contracts, including significant judgments and changes in judgments and assets recognized from costs incurred to obtain or fulfill a contract. The accounting guidance is
53
effective for annual and interim reporting periods in fiscal years beginning after December 15, 2017. Early adoption is permitted. An entity may choose to adopt this ASU either retrospectively or through a cumulative effect adjustment as of the start of the first period for which it applies the standard.
We are currently evaluating the impact this ASU will have to our accounting policies, business processes and potential differences in the timing and/or method of revenue recognition for our customer contracts. In conjunction with this evaluation, we are updating our policies to align with the new accounting guidance as well as evaluating our significant customer contracts to determine if the guidance will materially impact our existing portfolio of customer contracts. In addition, we will review new contracts entered into up until the adoption of the ASU. Based upon our initial evaluations, the adoption of this guidance is not expected to have a material impact on our consolidated financial statements. We currently intend to adopt the ASU in the first quarter of 2018, utilizing the cumulative effect approach.
In February 2016, the FASB issued ASU 2016-02, Leases (Topic 842). This ASU requires lessees to recognize a lease liability and a right-to-use asset for all leases, including operating leases, with a term greater than twelve months on its balance sheet. This ASU is effective in annual and interim periods in fiscal years beginning after December 15, 2018, with early adoption permitted, and requires a modified retrospective transition method. We are currently in the process of evaluating the impact this ASU will have on our Financial Statements. Currently, we plan to early adopt this ASU in the first quarter of 2018. Based on our initial evaluations, we believe the adoption of this standard will have a material impact on our consolidated balance sheet.
In March 2016, the FASB issued ASU 2016-09, Compensation – Stock Compensation (Topic 718). This ASU simplifies several aspects of the accounting for share-based payment transactions, including the income tax consequences, classification of awards as either equity or liabilities, and classification on the statement of cash flows. This ASU is effective for fiscal years beginning after December 15, 2016, with early adoption permitted. The methods of adoption for this ASU vary by amendment. We plan to adopt this ASU in the first quarter of 2017, prospectively applying the guidance related to the recognition of excess tax benefits and tax deficiencies in the income statement and the presentation of excess tax benefits on the statement of cash flows. We do not expect the adoption of this ASU to have a material impact on our consolidated financial statements.
In October 2016, the FASB issued ASU 2016-16, Income Taxes (Topic 740) Intra-Entity Transfers of Assets Other Than Inventory. This ASU requires entities to recognize at the transaction date the income tax consequences of intercompany asset transfers. This ASU is effective in annual and interim periods in fiscal years beginning after December 15, 2017, with early adoption permitted, and requires a modified retrospective transition method. We are currently in the process of evaluating the impact that this new guidance will have on our Financial Statements.
|
3. |
Segment Reporting and Significant Concentration |
Segment Information. We have evaluated how our chief operating decision maker has organized our company for purposes of making operating decisions and assessing performance, and have concluded that as of December 31, 2016, we have one reportable segment.
Products and Services. Our products and services help companies with complex transaction-centric business models manage the opportunities and challenges associated with accurately capturing, managing, generating, and optimizing the revenue associated with the immense volumes of customer interactions and then manage the intricate nature of those customer relationships. Our core billing and customer care platform, Advanced Convergent Platform (“ACP”), is a pre-integrated cloud-based platform. We generate a substantial percentage of our revenues by providing our ACP cloud-based and customer interaction management solutions, and related software products (e.g., Advanced Customer Service Representative, Workforce Express, etc.) to the North American cable and satellite markets. Our next-generation solution, Ascendon, a SaaS-based, cloud platform, that provides a trusted path to digital transformation. Additionally, we license certain software products (e.g., WBMS, TSM, and Singleview) and provide our professional services to implement, configure, and maintain these software products, and allow clients to effectively roll out new products as well as attract and retain customers. We also provide our software solutions under managed services arrangements, where we assume long-term responsibility for delivering our solutions and related operations under a defined scope and specified service levels.
54
Geographic Regions. For 2016 and 2015, 86% and 84%, respectively, of our revenues were attributable to our operations in the Americas. We use the location of the client as the basis of attributing revenues to individual regions.
Financial information relating to our operations by geographic region is as follows (in thousands):
Total Revenues:
|
|
|
2016 |
|
|
2015 |
|
|
2014 |
|
|||
|
Americas (principally the U.S.) |
|
$ |
652,376 |
|
|
$ |
634,389 |
|
|
$ |
636,482 |
|
|
Europe, Middle East and Africa (principally Europe) |
|
|
69,425 |
|
|
|
78,711 |
|
|
|
79,535 |
|
|
Asia Pacific |
|
|
39,157 |
|
|
|
39,420 |
|
|
|
35,269 |
|
|
Total revenues |
|
$ |
760,958 |
|
|
$ |
752,520 |
|
|
$ |
751,286 |
|
|
Property and Equipment: |
|
As of December 31, |
|
|||||
|
|
|
2016 |
|
|
2015 |
|
||
|
Americas (principally the U.S.) |
|
$ |
28,003 |
|
|
$ |
29,052 |
|
|
Europe, Middle East and Africa (principally Europe) |
|
|
2,749 |
|
|
|
3,879 |
|
|
Asia Pacific |
|
|
2,364 |
|
|
|
3,061 |
|
|
Total property and equipment |
|
$ |
33,116 |
|
|
$ |
35,992 |
|
Significant Clients and Industry Concentration. A large percentage of our historical revenues have been generated from our largest clients, which are Comcast Corporation (“Comcast”), the combined Charter Communications, Inc. (“Charter”)/Time Warner Cable, Inc. (“Time Warner”) entity, resulting from Charter’s acquisition of Time Warner in May 2016, and the subsequent assignment of the Time Warner agreement to Charter, and DISH Network Corporation (“DISH”). To provide a consistent basis of comparison, the Charter and Time Warner revenues and accounts receivable balances are combined in the following tables for all periods prior to the acquisition without adjustment.
Revenues from these clients represented the following percentages of our total revenues for the following years:
|
|
|
2016 |
|
|
2015 |
|
|
2014 |
|
|||
|
Comcast |
|
|
26 |
% |
|
|
24 |
% |
|
|
22 |
% |
|
Charter/Time Warner (combined for all periods) |
|
|
21 |
% |
|
|
21 |
% |
|
|
20 |
% |
|
DISH |
|
|
13 |
% |
|
|
14 |
% |
|
|
15 |
% |
As of December 31, 2016 and 2015, the percentage of net billed accounts receivable balances attributable to these clients were as follows:
|
|
|
As of December 31, |
|
|||||
|
|
|
2016 |
|
|
2015 |
|
||
|
Comcast |
|
|
25 |
% |
|
|
30 |
% |
|
Charter/Time Warner (combined for all periods) |
|
|
24 |
% |
|
|
13 |
% |
|
DISH |
|
|
10 |
% |
|
|
13 |
% |
We expect to continue to generate a significant percentage of our future revenues from our largest clients, mentioned above. There are inherent risks whenever a large percentage of total revenues are concentrated with a limited number of clients. Should a significant client: (i) terminate or fail to renew their contracts with us, in whole or in part for any reason; (ii) significantly reduce the number of customer accounts processed on our solutions, the price paid for our services, or the scope of services that we provide; or (iii) experience significant financial or operating difficulties, it could have a material adverse effect on our financial position and results of operations.
55
|
4. |
Long-Lived Assets |
Property and Equipment. Property and equipment at December 31 consisted of the following (in thousands, except years):
|
|
|
Useful Lives |
|
|
|
|
|
|
|
|
|
|
|
|
|
(Years) |
|
|
2016 |
|
|
2015 |
|
|||
|
Computer equipment |
|
3-5 |
|
|
$ |
74,640 |
|
|
$ |
70,408 |
|
|
|
Leasehold improvements |
|
5-10 |
|
|
|
15,013 |
|
|
|
15,226 |
|
|
|
Operating equipment |
|
3-8 |
|
|
|
57,210 |
|
|
|
53,494 |
|
|
|
Furniture and fixtures |
|
|
8 |
|
|
|
9,119 |
|
|
|
9,146 |
|
|
|
|
|
|
|
|
|
155,982 |
|
|
|
148,274 |
|
|
Less - accumulated depreciation |
|
|
|
|
|
|
(122,866 |
) |
|
|
(112,282 |
) |
|
Property and equipment, net |
|
|
|
|
|
$ |
33,116 |
|
|
$ |
35,992 |
|
Goodwill. We do not have any intangible assets with indefinite lives other than goodwill. A rollforward of goodwill in 2015 and 2016 is as follows (in thousands):
|
January 1, 2015 balance |
|
$ |
225,269 |
|
|
Adjustments related to prior acquisitions |
|
|
(60 |
) |
|
Effects of changes in foreign currency exchange rates |
|
|
(5,485 |
) |
|
December 31, 2015 balance |
|
|
219,724 |
|
|
Adjustments related to prior acquisitions |
|
|
(60 |
) |
|
Effects of changes in foreign currency exchange rates |
|
|
(18,570 |
) |
|
December 31, 2016, balance |
|
$ |
201,094 |
|
Other Intangible Assets. Our intangible assets subject to ongoing amortization consist of client contracts and software.
Client Contracts
Client contracts consist of the following: (i) investments in client contracts; (ii) direct and incremental costs that we have capitalized related to contractual arrangements where we have deferred revenues to convert or set-up client customers onto our outsourced solutions; and (iii) client contracts acquired in business combinations.
As of December 31, 2016 and 2015, the carrying values of these assets were as follows (in thousands):
|
|
|
2016 |
|
|
2015 |
|
||||||||||||||||||
|
|
|
Gross |
|
|
|
|
|
|
|
|
|
|
Gross |
|
|
|
|
|
|
|
|
|
||
|
|
|
Carrying |
|
|
Accumulated |
|
|
Net |
|
|
Carrying |
|
|
Accumulated |
|
|
Net |
|
||||||
|
|
|
Amount |
|
|
Amortization |
|
|
Amount |
|
|
Amount |
|
|
Amortization |
|
|
Amount |
|
||||||
|
Investments in client contracts (1) |
|
$ |
37,482 |
|
|
$ |
(23,265 |
) |
|
$ |
14,217 |
|
|
$ |
25,176 |
|
|
$ |
(17,060 |
) |
|
$ |
8,116 |
|
|
Capitalized costs (2) |
|
|
16,831 |
|
|
|
(5,130 |
) |
|
|
11,701 |
|
|
|
10,868 |
|
|
|
(2,489 |
) |
|
|
8,379 |
|
|
Acquired client contracts (3) |
|
|
83,085 |
|
|
|
(68,328 |
) |
|
|
14,757 |
|
|
|
91,584 |
|
|
|
(68,341 |
) |
|
|
23,243 |
|
|
Total client contracts |
|
$ |
137,398 |
|
|
$ |
(96,723 |
) |
|
$ |
40,675 |
|
|
$ |
127,628 |
|
|
$ |
(87,890 |
) |
|
$ |
39,738 |
|
The aggregate amortization related to client contracts included in our operations for 2016, 2015, and 2014, was as follows (in thousands):
|
|
|
2016 |
|
|
2015 |
|
|
2014 |
|
|||
|
Investments in client contracts (1) |
|
$ |
6,591 |
|
|
$ |
5,165 |
|
|
$ |
6,409 |
|
|
Capitalized costs (2) |
|
|
2,755 |
|
|
|
1,334 |
|
|
|
1,007 |
|
|
Acquired client contracts (3) |
|
|
6,683 |
|
|
|
8,902 |
|
|
|
11,951 |
|
|
Total client contracts |
|
$ |
16,029 |
|
|
$ |
15,401 |
|
|
$ |
19,367 |
|
|
(1) |
Investments in client contracts consist principally of incentives provided to new or existing clients to convert their customer accounts to, or retain their customer’s accounts on, our customer care and billing systems. Investments in client contracts related to client incentives are amortized ratably over the lives of the respective client contracts, which as of December 31, 2016, have termination dates that range from 2017 through 2022. Amortization of the investments in client contracts related to client incentives is reflected as a reduction in cloud and related solutions revenues in our Income Statements. |
56
|
(2) |
Capitalized costs related to client conversion/set-up services related to long-term cloud-based or managed services arrangements are generally amortized proportionately over the contract period that the services are expected to be provided, and are primarily reflected in cost of cloud and related solutions in our Income Statements. |
|
(3) |
Acquired client contracts represent assets acquired in our prior business acquisitions. Acquired client contracts are being amortized over their estimated useful lives ranging from five to ten years based on the approximate pattern in which the economic benefits of the intangible assets are expected to be realized. Classification of the amortization of acquired client contracts generally follows where the acquired business’ cost of revenues is categorized in our Income Statements. |
The weighted-average remaining amortization period of client contracts as of December 31, 2016 was approximately 38 months. Based on the December 31, 2016 net carrying value of these intangible assets, the estimated amortization for each of the five succeeding fiscal years ending December 31 will be: 2017 – $16.3 million; 2018 – $12.6 million; 2019 – $7.9 million; 2020 – $3.0 million; and 2021 – $0.2 million.
Software
Software consists of: (i) software and similar intellectual property rights from various business combinations; and (ii) internal use software.
As of December 31, 2016 and 2015, the carrying values of these assets were as follows (in thousands):
|
|
|
2016 |
|
|
2015 |
|
||||||||||||||||||
|
|
|
Gross |
|
|
|
|
|
|
|
|
|
|
Gross |
|
|
|
|
|
|
|
|
|
||
|
|
|
Carrying |
|
|
Accumulated |
|
|
Net |
|
|
Carrying |
|
|
Accumulated |
|
|
Net |
|
||||||
|
|
|
Amount |
|
|
Amortization |
|
|
Amount |
|
|
Amount |
|
|
Amortization |
|
|
Amount |
|
||||||
|
Acquired software (4) |
|
$ |
65,500 |
|
|
$ |
(62,306 |
) |
|
$ |
3,194 |
|
|
$ |
66,798 |
|
|
$ |
(61,475 |
) |
|
$ |
5,323 |
|
|
Internal use software (5) |
|
|
64,243 |
|
|
|
(37,010 |
) |
|
|
27,233 |
|
|
|
63,391 |
|
|
|
(33,619 |
) |
|
|
29,772 |
|
|
Total software |
|
$ |
129,743 |
|
|
$ |
(99,316 |
) |
|
$ |
30,427 |
|
|
$ |
130,189 |
|
|
$ |
(95,094 |
) |
|
$ |
35,095 |
|
The aggregate amortization related to software included in our operations for 2016, 2015, and 2014, was as follows (in thousands):
|
|
|
2016 |
|
|
2015 |
|
|
2014 |
|
|||
|
Acquired software (4) |
|
$ |
1,806 |
|
|
$ |
3,081 |
|
|
$ |
3,457 |
|
|
Internal use software (5) |
|
|
7,510 |
|
|
|
8,048 |
|
|
|
8,404 |
|
|
Total software |
|
$ |
9,316 |
|
|
$ |
11,129 |
|
|
$ |
11,861 |
|
|
(4) |
Acquired software represents the software intangible assets acquired in our prior business acquisitions, which are being amortized over their estimated useful lives ranging from five to ten years. |
|
(5) |
Internal use software represents: (i) third-party software licenses; and (ii) the internal and external costs related to the implementation of the third-party software licenses. Internal use software is amortized over its estimated useful life ranging from twelve months to ten years. |
The weighted-average remaining amortization period of the software intangible assets as of December 31, 2016 was approximately 61 months. Based on the December 31, 2016 net carrying value of these intangible assets, the estimated amortization for each of the five succeeding fiscal years ending December 31 will be: 2017 – $8.4 million; 2018 – $6.5 million; 2019 – $5.0 million; 2020 – $3.6 million; and 2021 – $2.6 million.
57
|
5. |
Debt |
As of December 31, 2016 and 2015, our long-term debt was as follows (in thousands):
|
|
|
December 31, |
|
|
December 31, |
|
||
|
|
|
2016 |
|
|
2015 |
|
||
|
Credit Agreement: |
|
|
|
|
|
|
|
|
|
Term loan, due February 2020, interest at adjusted LIBOR plus 1.75% (combined rate of 2.75% at December 31, 2016) |
|
$ |
135,000 |
|
|
$ |
142,500 |
|
|
Less - deferred financing costs |
|
|
(3,489 |
) |
|
|
(4,738 |
) |
|
Term loan, net of unamortized discounts |
|
|
131,511 |
|
|
|
137,762 |
|
|
$200 million revolving loan facility, due February 2020, interest at adjusted LIBOR plus applicable margin |
|
— |
|
|
— |
|
||
|
Convertible Notes: |
|
|
|
|
|
|
|
|
|
2016 Convertible Notes – Senior convertible notes; due March 15, 2036; cash interest at 4.25% |
|
|
230,000 |
|
|
— |
|
|
|
Less – unamortized original issue discount |
|
|
(14,005 |
) |
|
— |
|
|
|
Less – deferred financing costs |
|
|
(5,513 |
) |
|
— |
|
|
|
2016 Convertible Notes, net of unamortized discounts |
|
|
210,482 |
|
|
|
— |
|
|
2010 Convertible Notes – Senior subordinated convertible notes; due March 1, 2017; cash interest at 3.0% |
|
|
34,722 |
|
|
|
150,000 |
|
|
Less – unamortized original issue discount |
|
|
(272 |
) |
|
|
(7,923 |
) |
|
Less – deferred financing costs |
|
|
(24 |
) |
|
|
(709 |
) |
|
2010 Convertible Notes, net of unamortized discounts |
|
|
34,426 |
|
|
|
141,368 |
|
|
Total debt, net of unamortized discounts |
|
|
376,419 |
|
|
|
279,130 |
|
|
Current portion of long-term debt, net of unamortized discounts |
|
|
(49,426 |
) |
|
|
(148,868 |
) |
|
Long-term debt, net of unamortized discounts |
|
$ |
326,993 |
|
|
$ |
130,262 |
|
Credit Agreement.
In February 2015, we entered into an amended and restated $350 million credit agreement with several financial institutions (the “2015 Credit Agreement”). The 2015 Credit Agreement provided borrowings in the form of: (i) a $150 million aggregate principal five-year term loan (the “2015 Term Loan”); and (ii) a $200 million aggregate principal five-year revolving loan facility (the “2015 Revolver”).
The interest rates under the 2015 Credit Agreement are based upon our choice of an adjusted LIBOR rate plus an applicable margin of 1.75% - 2.75%, or an alternate base rate plus an applicable margin of 0.75% -1.75%, with the applicable margin, depending on our then-net secured total leverage ratio. We pay a commitment fee of 0.250% - 0.375% of the average daily unused amount of the 2015 Revolver, with the commitment fee rate also dependent upon our then-net secured total leverage ratio. As of December 31, 2016, our interest rate on the 2015 Term Loan is 2.75% (adjusted LIBOR plus 1.75% per annum), effective through March 31, 2017, and our commitment fee on the unused 2015 Revolver is 0.25%. As of December 31, 2016, we had no borrowing outstanding on our 2015 Revolver and had the entire $200 million available to us.
The 2015 Credit Agreement includes mandatory repayments of the aggregate principal amount of the 2015 Term Loan (payable quarterly) for the first (5% of total), second (5% of total), third (10% of total), fourth (15% of total), and fifth years (15% of total), with the remaining principal balance due at maturity (50% of total). The 2015 Credit Agreement has no prepayment penalties and requires mandatory repayments under certain circumstances, including: (i) asset sales or casualty proceeds; and (ii) proceeds of debt or preferred stock issuances.
The 2015 Credit Agreement contains customary affirmative covenants. In addition, the 2015 Credit Agreement has customary negative covenants that place limits on our ability to: (i) incur additional indebtedness; (ii) create liens on its property; (iii) make investments; (iv) enter into mergers and consolidations; (v) sell assets; (vi) declare dividends or repurchase shares; (vii) engage in certain transactions with affiliates; and (viii) prepay certain indebtedness; and (ix) issue capital stock of subsidiaries. We must also meet certain financial covenants to include: (i) a maximum total leverage ratio; (ii) a maximum secured leverage ratio; (iii) a minimum interest coverage ratio; and (iv) a limitation on capital expenditures. As of December 31, 2016, we were in compliance with the financial ratios and other covenants related to the 2015 Credit Agreement.
58
In conjunction with the 2015 Credit Agreement, we have pledged assets under a security agreement in favor of a financial institution as collateral agent (the “Security Agreement”). Under the Security Agreement and 2015 Credit Agreement, all of CSG’s domestic subsidiaries have guaranteed its obligations, and CSG and such subsidiaries have pledged substantially all of its assets to secure the obligations under the 2015 Credit Agreement and such guarantees.
Convertible Notes.
2016 Convertible Notes. In March 2016, we completed an offering of $230 million of 4.25% senior convertible notes due March 15, 2036 (the “2016 Convertible Notes”) to qualified institutional buyers pursuant to Rule 144A under the Securities Act of 1933, as amended. The 2016 Convertible Notes are unsecured obligations and will pay 4.25% annual cash interest, payable semiannually in arrears on March 15 and September 15 of each year, beginning on September 15, 2016.
The 2016 Convertible Notes will be convertible at the option of the note holders upon the satisfaction of specified conditions and during certain periods. During the period from, and including, December 15, 2021 to the close of business on the business day immediately preceding March 15, 2022 and on or after December 15, 2035, holders may convert all or any portion of their 2016 Convertible Notes at the conversion rate then in effect at any time regardless of these conditions. The 2016 Convertible Notes will be convertible at an initial conversion rate of 17.4642 shares of our common stock per $1,000 principal amount of the 2016 Convertible Notes, which is equivalent to an initial conversion price of approximately $57.26 per share of our common stock. Under the terms of the 2016 Convertible Notes, we will adjust the conversion rate for any quarterly dividends exceeding $0.185 per share. We will settle conversions of the 2016 Convertible Notes by paying or delivering, as the case may be, cash, shares of our common stock, or a combination thereof, at our election. It is our current intent and policy to settle our conversion obligations as follows: (i) pay cash for 100% of the par value of the 2016 Convertible Notes that are converted; and (ii) to the extent the value of our conversion obligation exceeds the par value, we can satisfy the remaining conversion obligation in our common stock, cash or a combination thereof.
Holders may require CSG to repurchase the 2016 Convertible Notes for cash on each of March 15, 2022, March 15, 2026, and March 15, 2031, or upon the occurrence of a fundamental change (as defined in the 2016 Convertible Notes Indenture (“2016 Notes Indenture”)) in each case at a purchase price equal to the principal amount thereof plus accrued and unpaid interest.
We may not redeem the 2016 Convertible Notes prior to March 20, 2020. On or after March 20, 2020, we may redeem for cash all or part of the 2016 Convertible Notes if the last reported sale price of our common stock has been at least 130% of the conversion price then in effect for at least 20 trading days (whether or not consecutive) during any 30 consecutive trading day period (including the last trading day of such period) ending on, and including, the trading day immediately preceding the date on which CSG provides notice of redemption. On or after March 15, 2022, we may redeem for cash all or part of the 2016 Convertible Notes regardless of the sales price condition described in the preceding sentence. In each case, the redemption price will equal the principal amount of the 2016 Convertible Notes to be redeemed, plus accrued and unpaid interest.
The 2016 Notes Indenture includes customary terms and covenants, including certain events of default after which the 2016 Convertible Notes may be due and payable immediately. The Notes Indenture contains customary affirmative covenants, including compliance with terms of certain other indebtedness of the Company over a defined threshold amount.
The net proceeds from the sale of the 2016 Convertible Notes were approximately $223 million after deducting the initial purchasers’ discount and estimated offering expenses payable by us. As of December 31, 2016, we repurchased approximately $115 million aggregate principal amount of our 2010 Convertible Notes for $215.6 million (see additional discussion in 2010 Convertible Notes below) with the net proceeds from the offering of the 2016 Convertible Notes. The remainder of the net proceeds will be used to settle the outstanding 2010 Convertible Notes.
The original issue discount (“OID”) related to the 2016 Convertible Notes of $15.9 million, as a result of an effective interest rate of the liability component of 5.63% compared to the cash interest rate of 4.25%, is being amortized to interest expense through December 15, 2021, the first date the 2016 Convertible Notes can be put back to us by the holders.
2010 Convertible Notes. In March 2010, we completed an offering of $150 million of 3.0% senior subordinated convertible notes due March 1, 2017 (the “2010 Convertible Notes”) to qualified institutional buyers pursuant to Rule 144A under the Securities Act of 1933, as amended. The 2010 Convertible Notes are unsecured obligations, subordinated to any future senior indebtedness and senior to any future junior subordinated debt. The 2010 Convertible Notes were issued at a price of 100% of their par value and bear interest at a rate of 3.0% per annum, which is payable semiannually in arrears on March 1 and September 1 of each year. The 2010 Convertible Notes contain customary affirmative covenants, including compliance with terms of certain other indebtedness of the Company over a defined threshold amount.
59
During 2016, we repurchased $115.3 million aggregated principal amount of our 2010 Convertible Notes at a total purchase price of $215.6 million, and recognized a loss on the repurchases of $8.6 million, to include the write-off of amortized deferred financing costs and OID. In addition, during 2016, we had holders convert $50,000 aggregate principal amount of the 2010 Convertible Notes for a total price of $0.1 million. As of December 31, 2016, the principal outstanding on the 2010 Convertible Notes was $34.7 million.
The 2010 Convertible Notes are convertible into our common stock, under the specified conditions and settlement terms outlined below. As a result of us declaring a quarterly cash dividend beginning in June 2013, the conversion rate has also been adjusted quarterly. As of December 31, 2016, the conversion rate was 44.3684 shares of our common stock per $1,000 par value of the 2010 Convertible Notes (equivalent to a conversion price of $22.54 per share of our common stock). The Indenture related to the 2010 Convertible Notes (“Notes Indenture”) includes anti-dilution provisions for the holders such that the conversion rate (and thus the initial conversion price) can be adjusted in the future for certain events, to include stock dividends, the issuance of rights, options or warrants to purchase our common stock at a price below the then-current market price, and certain distributions of common stock, property or rights, options or warrants to acquire our common stock to all or substantially all holders of our common stock. Additionally, the conversion rate may be adjusted prior to the maturity date in connection with the occurrence of specified corporate transactions for a “make-whole” premium as set forth in the Notes Indenture.
Prior to September 1, 2016, holders of the 2010 Convertible Notes could convert their securities at any time in the fiscal quarter following the period in which the price of our common stock trades over 130% of the conversion price for at least 20 consecutive trading days in the last 30 trading days of a fiscal quarter. Beginning September 1, 2016, the holders of the 2010 Convertible Notes can elect to convert their securities at any time, with settlement occurring on March 1, 2017. As of December 31, 2016, we classified the $34.7 million principal amount of the 2010 Convertible Notes as a current liability and reclassified the difference between the principal amount payable in cash upon conversion and the total settlement value of the 2010 Convertible Notes, or the intrinsic value of the conversion obligation, of approximately $40 million from stockholders’ equity to current portion of long-term debt conversion obligation on our Balance Sheet.
Upon conversion of the 2010 Convertible Notes, we will settle our conversion obligation as follows: (i) we will pay cash for 100% of the par value of the 2010 Convertible Notes that are converted; and (ii) to the extent the value of our conversion obligation exceeds the par value, we will satisfy the remaining conversion obligation in our common stock. Based on our December 31, 2016 closing stock price of $48.40 per share, the 2010 Convertible Notes would have had a total settlement value of approximately $75 million.
The remaining OID related to the 2010 Convertible Notes is being amortized to interest expense through March 1, 2017, the maturity date of the 2010 Convertible Notes.
Estimated Maturities on Long-Term Debt.
As of December 31, 2016, the maturities of our long-term debt, based upon: (i) the mandatory repayment schedule for the 2015 Term Loan; (ii) the convertibility of the 2010 Convertible Notes; and (iii) the expected remaining life of the 2016 Convertible Notes, was as follows (in thousands):
|
|
|
2017 |
|
|
2018 |
|
|
2019 |
|
|
2020 |
|
|
2021+ |
|
|||||
|
2015 Term Loan |
|
$ |
15,000 |
|
|
$ |
22,500 |
|
|
$ |
22,500 |
|
|
$ |
75,000 |
|
|
$ |
— |
|
|
2010 Convertible Notes |
|
|
34,722 |
|
|
— |
|
|
— |
|
|
— |
|
|
— |
|
||||
|
2016 Convertible Notes |
|
— |
|
|
— |
|
|
— |
|
|
— |
|
|
|
230,000 |
|
||||
|
Total long-term debt repayments |
|
$ |
49,722 |
|
|
$ |
22,500 |
|
|
$ |
22,500 |
|
|
$ |
75,000 |
|
|
$ |
230,000 |
|
Deferred Financing Costs. As of December 31, 2016, net deferred financing costs related to the 2015 Credit Agreement were $3.5 million, and are being amortized to interest expense over the related term of the 2015 Credit Agreement (through February 2020). As of December 31, 2016, net deferred financing costs related to the 2016 Convertible Notes were $5.5 million, and are being amortized to interest expense through December 15, 2021, the first date the 2016 Convertible Notes can be put back to us by the holders. The remaining net deferred financing costs related to the 2010 Convertible Notes is being amortized to interest expense through maturity (March 2017). The net deferred financing costs are presented as a reduction from the carrying amount of the corresponding debt liability in our Balance Sheets. Interest expense for 2016, 2015, and 2014 includes amortization of deferred financing costs of $2.4 million, $1.9 million, and $2.5 million, respectively. The weighted-average interest rate on our debt borrowings, including amortization of OID, amortization of deferred financing costs, and commitment fees on a revolving loan facility, for 2016, 2015, and 2014, was approximately 5%, 6%, and 6%, respectively.
60
|
6. |
Restructuring and Reorganization Charges |
Restructuring and reorganization charges are expenses that generally result from cost reduction initiatives and/or significant changes to our business, to include such things as involuntary employee terminations, changes in management structure, divestitures of businesses, facility consolidations and abandonments, impairment of acquired intangible assets, and fundamental reorganizations impacting operational focus and direction. The following are the key restructuring and reorganizational activities we incurred over the last three years that have impacted our results from operations:
During 2014 we implemented the following restructuring and reorganization activities:
|
|
• |
In conjunction with the reorganization of our Content Direct solution to facilitate its integration with our other offerings, we terminated an incentive arrangement with certain employees to develop and then grow our Content Direct solution (the “Arrangement”) in exchange for a one-time cash payment of $8.0 million, which was reflected as a reorganization charge in 2014. The Arrangement included certain liquidation options for the employees in the event of a change of control of the Content Direct solution. |
|
|
• |
We reduced our workforce by approximately 60 employees worldwide, to further align our workforce around our near- and long-term business opportunities. As a result, we recorded restructuring expense of $5.6 million. |
|
|
• |
We abandoned space at two of our locations to improve our space utilization, resulting in a restructuring charge of $1.1 million. |
During 2015 we implemented the following restructuring activities:
|
|
• |
We reduced our workforce by approximately 160 employees worldwide. These actions were primarily taken to consolidate delivery centers and better align our spending levels with our revenue opportunities. We incurred restructuring charges related to these involuntary terminations of $4.5 million. These actions also led to the discontinuance of certain non-essential products, resulting in an asset impairment charge of $1.7 million. |
|
|
• |
We abandoned space at five of our locations as a result of workforce reductions and improvements in our space utilization, resulting in restructuring charges of $1.2 million. |
|
|
• |
We entered into an agreement (the “Agreement”) with certain former management personnel for the sale of our cyber-security business marketed under the Invotas brand, resulting in a reduction in restructuring charges of $3.7 million related to the gain on the sale. |
During 2016 we implemented the following restructuring activities:
|
|
• |
We reduced our workforce by approximately 60 employees, primarily in North America, as a result of organizational changes and the realignment of our workforce. As a result, we incurred restructuring charges of $7.2 million. |
|
|
• |
In 2016, the cyber-security business we sold in 2015 was acquired by a third-party. Based on the terms of the Agreement, we received additional consideration contingent upon a liquidation event, as defined in the Agreement. This resulted in an additional gain on the sale of $6.6 million in the first quarter of 2016, which reduced restructuring and reorganization charges. |
The activities discussed above resulted in total charges for 2016, 2015, and 2014 of $0.4 million, $3.1 million, and $14.0 million, respectively, which have been reflected as a separate line item in our Income Statements.
61
The activity in the business restructuring and reorganization reserves during 2016, 2015, and 2014 is as follows (in thousands):
|
|
|
|
|
|
|
|
|
|
|
Disposition of |
|
|
|
|
|
|
|
|
|
|
|
|
|
Termination |
|
|
Facilities |
|
|
Business |
|
|
|
|
|
|
|
|
|
|||
|
|
|
Benefits |
|
|
Abandonment |
|
|
Operations |
|
|
Other |
|
|
Total |
|
|||||
|
January 1, 2014, balance |
|
$ |
3,717 |
|
|
$ |
— |
|
|
$ |
— |
|
|
$ |
— |
|
|
$ |
3,717 |
|
|
Charged to expense during period |
|
|
5,589 |
|
|
|
1,146 |
|
|
|
(222 |
) |
|
|
7,456 |
|
|
|
13,969 |
|
|
Cash payments |
|
|
(6,421 |
) |
|
|
— |
|
|
|
— |
|
|
|
(8,000 |
) |
|
|
(14,421 |
) |
|
Adjustment for the gain on the disposition of business operations |
|
— |
|
|
— |
|
|
|
222 |
|
|
— |
|
|
|
222 |
|
|||
|
Other |
|
|
(66 |
) |
|
|
(33 |
) |
|
— |
|
|
|
560 |
|
|
|
461 |
|
|
|
December 31, 2014, balance |
|
|
2,819 |
|
|
|
1,113 |
|
|
|
— |
|
|
|
16 |
|
|
|
3,948 |
|
|
Charged to expense during period |
|
|
4,544 |
|
|
|
1,175 |
|
|
|
(3,733 |
) |
|
|
1,088 |
|
|
|
3,074 |
|
|
Cash payments |
|
|
(5,694 |
) |
|
|
(405 |
) |
|
— |
|
|
|
(30 |
) |
|
|
(6,129 |
) |
|
|
Adjustment for the gain on the disposition of business operations |
|
— |
|
|
— |
|
|
|
3,733 |
|
|
— |
|
|
|
3,733 |
|
|||
|
Adjustment for asset impairment |
|
— |
|
|
— |
|
|
— |
|
|
|
(1,685 |
) |
|
|
(1,685 |
) |
|||
|
Other |
|
|
(32 |
) |
|
|
(526 |
) |
|
— |
|
|
|
611 |
|
|
|
53 |
|
|
|
December 31, 2015, balance |
|
|
1,637 |
|
|
|
1,357 |
|
|
|
— |
|
|
|
- |
|
|
|
2,994 |
|
|
Charged to expense during period |
|
|
7,201 |
|
|
|
556 |
|
|
|
(6,611 |
) |
|
|
(730 |
) |
|
|
416 |
|
|
Cash payments |
|
|
(6,781 |
) |
|
|
(473 |
) |
|
— |
|
|
— |
|
|
|
(7,254 |
) |
||
|
Adjustment for the gain on the disposition of business operations |
|
— |
|
|
— |
|
|
|
6,611 |
|
|
— |
|
|
|
6,611 |
|
|||
|
Adjustment for asset impairment |
|
— |
|
|
|
(194 |
) |
|
— |
|
|
— |
|
|
|
(194 |
) |
|||
|
Other |
|
357 |
|
|
86 |
|
|
— |
|
|
|
730 |
|
|
|
1,173 |
|
|||
|
December 31, 2016, balance |
|
$ |
2,414 |
|
|
$ |
1,332 |
|
|
$ |
- |
|
|
$ |
- |
|
|
$ |
3,746 |
|
As of December 31, 2016, $3.0 million of the business restructuring and reorganization reserves were included in current liabilities.
|
7. |
Income Taxes |
Income Tax Provision/(Benefit). The components of net income from continuing operations before income taxes are as follows (in thousands):
|
|
|
2016 |
|
|
2015 |
|
|
2014 |
|
|||
|
Domestic |
|
$ |
98,966 |
|
|
$ |
93,390 |
|
|
$ |
70,737 |
|
|
Foreign |
|
|
1,033 |
|
|
|
2,951 |
|
|
|
(9,215 |
) |
|
Total |
|
$ |
99,999 |
|
|
$ |
96,341 |
|
|
$ |
61,522 |
|
The income tax provision related to continuing operations consists of the following (in thousands):
|
|
|
2016 |
|
|
2015 |
|
|
2014 |
|
|||
|
Current: |
|
|
|
|
|
|
|
|
|
|
|
|
|
Federal |
|
$ |
31,409 |
|
|
$ |
41,002 |
|
|
$ |
20,374 |
|
|
State |
|
|
3,819 |
|
|
|
5,227 |
|
|
|
2,443 |
|
|
Foreign |
|
|
4,639 |
|
|
|
3,651 |
|
|
|
2,953 |
|
|
|
|
|
39,867 |
|
|
|
49,880 |
|
|
|
25,770 |
|
|
Deferred: |
|
|
|
|
|
|
|
|
|
|
|
|
|
Federal |
|
|
(2,229 |
) |
|
|
(14,611 |
) |
|
|
1,139 |
|
|
State |
|
|
276 |
|
|
|
(1,147 |
) |
|
|
837 |
|
|
Foreign |
|
|
(797 |
) |
|
|
(348 |
) |
|
|
(1,935 |
) |
|
|
|
|
(2,750 |
) |
|
|
(16,106 |
) |
|
|
41 |
|
|
Total income tax provision |
|
$ |
37,117 |
|
|
$ |
33,774 |
|
|
$ |
25,811 |
|
62
The difference between our income tax provision computed at the statutory Federal income tax rate and our financial statement income tax related to continuing operations is summarized as follows (in thousands):
|
|
|
2016 |
|
|
2015 |
|
|
2014 |
|
|||
|
Provision at Federal rate of 35% |
|
$ |
35,000 |
|
|
$ |
33,719 |
|
|
$ |
21,533 |
|
|
State income taxes, net of Federal impact |
|
|
2,662 |
|
|
|
2,652 |
|
|
|
2,132 |
|
|
Research and experimentation credits |
|
|
(71 |
) |
|
|
(2,135 |
) |
|
|
(450 |
) |
|
Tax uncertainties |
|
|
(1,597 |
) |
|
|
(166 |
) |
|
|
187 |
|
|
Section 199 manufacturing deduction |
|
|
(4,060 |
) |
|
|
(2,884 |
) |
|
|
(1,936 |
) |
|
Foreign rate differential |
|
|
857 |
|
|
|
688 |
|
|
|
2,847 |
|
|
Valuation allowance for deferred tax assets |
|
|
1,287 |
|
|
|
919 |
|
|
|
3,602 |
|
|
Other impact of foreign operations |
|
|
2,157 |
|
|
|
283 |
|
|
|
(3,555 |
) |
|
Other |
|
|
882 |
|
|
|
698 |
|
|
|
1,451 |
|
|
Total income tax provision |
|
$ |
37,117 |
|
|
$ |
33,774 |
|
|
$ |
25,811 |
|
We have undistributed earnings of approximately $43 million from certain foreign subsidiaries. We intend to indefinitely reinvest these foreign earnings, therefore, a provision has not been made for income taxes that might be payable upon remittance of such earnings. Determination of the amount of unrecognized deferred tax liability on unremitted foreign earnings is not practicable because of the complexities of the hypothetical calculation.
Deferred Income Taxes. Net deferred income tax assets as of December 31, 2016 and 2015 are as follows (in thousands):
|
|
|
2016 |
|
|
2015 |
|
||
|
Deferred income tax assets |
|
$ |
65,690 |
|
|
$ |
77,270 |
|
|
Deferred income tax liabilities |
|
|
(33,748 |
) |
|
|
(42,576 |
) |
|
Valuation allowance |
|
|
(17,823 |
) |
|
|
(17,414 |
) |
|
Net deferred income tax assets |
|
$ |
14,119 |
|
|
$ |
17,280 |
|
The components of our net deferred income tax assets (liabilities) as of December 31, 2016 and 2015 are as follows (in thousands):
|
|
|
2016 |
|
|
2015 |
|
||
|
Net deferred income tax assets: |
|
|
|
|
|
|
|
|
|
Accrued expenses and reserves |
|
$ |
13,252 |
|
|
$ |
14,001 |
|
|
Stock-based compensation |
|
|
5,066 |
|
|
|
5,528 |
|
|
Software |
|
|
912 |
|
|
|
602 |
|
|
Client contracts and related intangibles |
|
|
(590 |
) |
|
|
(2,079 |
) |
|
Goodwill |
|
|
(8,336 |
) |
|
|
(7,590 |
) |
|
Net operating loss carryforwards |
|
|
36,123 |
|
|
|
38,726 |
|
|
Property and equipment |
|
|
(8,672 |
) |
|
|
(7,244 |
) |
|
Convertible debt securities |
|
|
(16,094 |
) |
|
|
(16,853 |
) |
|
Deferred revenue |
|
|
3,556 |
|
|
|
4,268 |
|
|
Facility abandonments |
|
|
2,273 |
|
|
|
2,374 |
|
|
Contingent payments |
|
|
848 |
|
|
|
849 |
|
|
Other |
|
|
3,630 |
|
|
|
2,294 |
|
|
Total deferred income tax assets |
|
|
31,968 |
|
|
|
34,876 |
|
|
Less: valuation allowance |
|
|
(17,750 |
) |
|
|
(17,414 |
) |
|
Net deferred income tax assets |
|
$ |
14,218 |
|
|
$ |
17,462 |
|
|
Net deferred income tax liabilities: |
|
|
|
|
|
|
|
|
|
Other |
|
$ |
(26 |
) |
|
$ |
(182 |
) |
|
Total deferred income tax liabilities |
|
|
(26 |
) |
|
|
(182 |
) |
|
Less: valuation allowance |
|
|
(73 |
) |
|
|
- |
|
|
Net deferred income tax liabilities |
|
$ |
(99 |
) |
|
$ |
(182 |
) |
We regularly assess the likelihood of the future realization of our deferred income tax assets. To the extent we believe that it is more likely than not that a deferred income tax asset will not be realized, a valuation allowance is established. As of December 31, 2016, we believe that between: (i) carryback opportunities to past periods with taxable income; and (ii) sufficient taxable income to be
63
generated in the future, we will realize 100% of the benefit of our U.S. Federal deferred income tax assets, thus no valuation allowance has been established. As of December 31, 2016, we have deferred income tax assets related to state and foreign income tax jurisdictions of $2.6 million and $27.6 million, respectively, and have established valuation allowances against those deferred income tax assets of $2.5 million and $15.4 million, respectively.
As of December 31, 2016 and 2015, we have an acquired U.S. Federal net operating loss (“NOL”) carryforward of approximately $45 million and $50 million, respectively, which will begin to expire in 2023 and can be utilized through 2030. The acquired U.S. Federal NOL carryforward is attributable to the pre-acquisition periods of acquired subsidiaries. The annual utilization of this U.S. Federal NOL carryforward is limited pursuant to Section 382 of the Internal Revenue Code of 1986, as amended. In addition, as of December 31, 2016 and 2015, we have: (i) state NOL carryforwards of approximately $63 million for both years, which will expire beginning in 2017 and end in 2037; and (ii) foreign subsidiary NOL carryforwards of approximately $87 million and $91 million, respectively, which will expire beginning in 2017, with a portion of the losses available over an indefinite period of time.
Our 2004 Convertible Debt Securities, which we fully extinguished in 2011, were subject to special U.S. Treasury regulations governing contingent payment debt instruments. These regulations allowed us to take a tax deduction for interest expense on our U.S. Federal income tax return at a constant rate of 9.09% (subject to certain adjustments), compounded semi-annually, which represented the estimated yield on comparable non-contingent, non-convertible, fixed-rate debt instruments with terms and conditions otherwise similar to the 2004 Convertible Debt Securities. This interest expense tax deduction was greater than the interest expense reflected in the accompanying Income Statements, thus creating a deferred income tax liability. The extinguishment of the 2004 Convertible Debt Securities resulted in: (i) the holders of the 2004 Convertible Debt Securities not having the ability to achieve the 9.09% target yield, and (ii) a requirement for us to pay an amount equal to the cumulative deferred income tax liability to the U.S. tax authorities (without interest or penalties). During 2011, we paid cash of approximately $6 million related to the deferred income tax liabilities associated with the 2004 Convertible Debt Securities repurchased in 2011. In 2016 and 2015, we paid cash of $5.6 million in each of the years related to the deferred income tax liabilities associated with the 2004 Convertible Debt Securities repurchased in 2009 and 2010. The remaining balance owed of approximately $11 million will be paid ratably over the next two years.
Accounting for Uncertainty in Income Taxes. We are required to estimate our income tax liability in each jurisdiction in which we operate, including U.S. Federal, state and foreign income tax jurisdictions. Various judgments and estimates are required in evaluating our tax positions and determining our provisions for income taxes. During the ordinary course of business, there are certain transactions and calculations for which the ultimate income tax determination may be uncertain. In addition, we may be subject to examination of our income tax returns by various tax authorities, which could result in adverse outcomes. For these reasons, we establish a liability associated with unrecognized tax benefits based on estimates of whether additional taxes and interest may be due. This liability is adjusted based upon changing facts and circumstances, such as the closing of a tax audit, the expiration of a statute of limitations or the refinement of an estimate.
A reconciliation of the beginning and ending balances of our liability for unrecognized tax benefits is as follows (in thousands):
|
|
|
2016 |
|
|
2015 |
|
|
2014 |
|
|||
|
Balance, beginning of year |
|
$ |
4,079 |
|
|
$ |
3,417 |
|
|
$ |
3,713 |
|
|
Additions based on tax positions related to current year |
|
|
— |
|
|
|
150 |
|
|
|
351 |
|
|
Settlements |
|
|
(1,893 |
) |
|
|
— |
|
|
|
— |
|
|
Lapse of statute of limitations |
|
|
(122 |
) |
|
|
— |
|
|
|
— |
|
|
Additions for tax positions of prior years |
|
|
370 |
|
|
|
925 |
|
|
|
30 |
|
|
Reductions for tax positions of prior years |
|
|
(543 |
) |
|
|
(413 |
) |
|
|
(677 |
) |
|
Balance, end of year |
|
$ |
1,891 |
|
|
$ |
4,079 |
|
|
$ |
3,417 |
|
We recognize interest and penalty expense associated with our liability for unrecognized tax benefits as a component of income tax expense in our Income Statements. In addition to the $1.9 million, $4.1 million, and $3.4 million of liability for unrecognized tax benefits as of December 31, 2016, 2015, and 2014, we had $0.4 million, $0.3 million, and $0.2 million, respectively, of income tax-related accrued interest, net of any federal benefit of deduction. If recognized, the $1.9 million of unrecognized tax benefits as of December 31, 2016, would favorably impact our effective tax rate in future periods.
We file income tax returns in the U.S. Federal jurisdiction, various U.S. state and local jurisdictions, and many foreign jurisdictions. The U.S., U.K., and Australia are the main taxing jurisdictions in which we operate. The years open for audit vary depending on the taxing jurisdiction. During 2016, the U.S. Internal Revenue Service (“IRS”) completed its audits of our 2010 through 2012 tax years and in December 2016 we made an additional payment of approximately $8 million and entered into an agreement with the IRS closing the audits for those tax years. We estimate that it is reasonably possible that the amount of gross unrecognized tax benefits will decrease by up to $0.3 million over the next twelve months due to completion of audits and the expiration of statute of limitations.
64
|
8. |
Employee Retirement Benefit Plans |
Defined Contribution-Type Plans. We sponsor defined contribution plans covering substantially all our U.S.-based employees. Participants may contribute up to 100% of their annual wages, subject to certain limitations, as pretax, salary deferral contributions. We make certain matching, and at our discretion, service-based contributions to the plan. The expense related to matching and service-related contributions for 2016, 2015, and 2014 was $9.9 million, $9.7 million, and $9.0 million, respectively. We also have defined contribution-type plans for certain of our non-U.S.-based employees. The total contributions made to these plans in 2016, 2015, and 2014 were $3.9 million, $3.7 million, and $5.0 million, respectively.
|
9. |
Commitments, Guarantees and Contingencies |
Operating Leases. We lease certain office and production facilities under non-cancellable operating leases, with the longest lease that runs through July 2025. The leases generally are renewable and provide for the payment of real estate taxes and certain other occupancy expenses. Future aggregate minimum lease payments under these facilities are as follows: 2017 - $13.0 million; 2018 - $12.4 million; 2019 - $10.5 million; 2020 - $7.5 million; 2021 - $7.0 million; and thereafter - $21.6 million. Total rent expense for 2016, 2015, and 2014 was $14.5 million, $17.1 million, and $19.9 million, respectively.
Service Agreements. We have an agreement with Infocrossing LLC (“Infocrossing”), a Wipro Limited company, to provide us outsourced data center services. We amended our previous agreement with Infocrossing in 2015, which extended the term of the agreement through June 30, 2022. We outsource the data processing and related computer services required for the operation of our outsourced ACP solutions. Our ACP proprietary software and other software applications are run in an outsourced data center environment in order to obtain the necessary computer processing capacity and other computer support services without us having to make the substantial capital and infrastructure investments that would be necessary for us to provide these services internally. Our clients are connected to the outsourced data center environment through a combination of private and commercially-provided networks. Our ACP cloud-based solutions are generally considered to be mission critical customer management systems by our clients. As a result, we are highly dependent upon Infocrossing for system availability, security, and response time.
Warranties. We generally warrant that our solutions and related offerings will conform to published specifications, or to specifications provided in an individual client arrangement, as applicable. The typical warranty period is 90 days from delivery of the solution or offering. For certain service offerings we provide a limited warranty for the duration of the services provided. We generally warrant that services will be performed in a professional and workmanlike manner. The typical remedy for breach of warranty is to correct or replace any defective deliverable, and if not possible or practical, we will accept the return of the defective deliverable and refund the amount paid under the client arrangement that is allocable to the defective deliverable. Our contracts also generally contain limitation of damages provisions in an effort to reduce our exposure to monetary damages arising from breach of warranty claims. Historically, we have incurred minimal warranty costs, and as a result, do not maintain a warranty reserve.
Product and Services Indemnifications. Our arrangements with our clients generally include an indemnification provision that will indemnify and defend a client in actions brought against the client that claim our products and/or services infringe upon a copyright, trade secret, or valid patent. Historically, we have not incurred any significant costs related to such indemnification claims, and as a result, do not maintain a reserve for such exposure.
Claims for Company Non-performance. Our arrangements with our clients typically cap our liability for breach to a specified amount of the direct damages incurred by the client resulting from the breach. From time-to-time, these arrangements may also include provisions for possible liquidated damages or other financial remedies for our non-performance, or in the case of certain of our outsourced customer care and billing solutions, provisions for damages related to service level performance requirements. The service level performance requirements typically relate to system availability and timeliness of service delivery. As of December 31, 2016, we believe we have adequate reserves, based on our historical experience, to cover any reasonably anticipated exposure as a result of our nonperformance for any past or current arrangements with our clients.
Indemnifications Related to Officers and the Board of Directors. We have agreed to indemnify members of our Board of Directors (the “Board”) and certain of our officers if they are named or threatened to be named as a party to any proceeding by reason of the fact that they acted in such capacity. We maintain directors’ and officers’ (“D&O”) insurance coverage to protect against such losses. We have not historically incurred any losses related to these types of indemnifications, and are not aware of any pending or threatened actions or claims against any officer or member of our Board. As a result, we have not recorded any liabilities related to such indemnifications as of December 31, 2016. In addition, as a result of the insurance policy coverage, we believe these indemnification agreements are not significant to our results of operations.
Legal Proceedings. From time-to-time, we are involved in litigation relating to claims arising out of our operations in the normal course of business.
65
10.Stockholders’ Equity
Stock Repurchase Program. We currently have a stock repurchase program, approved by our Board, authorizing us to repurchase shares of our common stock from time-to-time as market and business conditions warrant (the “Stock Repurchase Program”). During 2016, 2015, and 2014, we repurchased 0.3 million shares of our common stock for $11.6 million (weighted–average price of $36.42 per share), 0.3 million shares of our common stock for $6.9 million (weighted-average price of $27.06 per share), and 0.7 million shares of our common stock for $19.1 million (weighted-average price of $26.05 per share), respectively, under a Securities and Exchange Commission (“SEC”) Rule 10b5-1 Plan.
In 2015, we entered into an accelerated share repurchase transaction agreement (the “ASR Agreement”) with a counterparty to repurchase $50 million of our common stock. Total shares purchased under the ASR Agreement in 2015 were 1.6 million shares at an average purchase price of $31.64 per share. The shares were reflected as treasury stock in the periods the shares were delivered.
As of December 31, 2016, the total remaining number of shares available for repurchase under the Stock Repurchase Program totaled approximately 6.7 million shares.
In addition to the above mentioned stock repurchases, during 2016, 2015, and 2014, we repurchased and then cancelled approximately 344,000 shares, 265,000 shares, and 252,000 shares for $13.7 million, $8.1 million, and $6.9 million, respectively, of common stock from our employees in connection with minimum tax withholding requirements resulting from the vesting of restricted stock under our stock incentive plans.
Cash Dividend. During 2016 and 2015, our Board approved total cash dividends of $0.74 per share and $0.70 per share of common stock, totaling $23.8 million and $22.9 million, respectively.
Warrants. In 2014, in conjunction with the execution of an amendment to our current agreement with Comcast, we issued stock warrants (the “Warrant Agreement”) for the right to purchase up to approximately 2.9 million shares of our common stock (the “Stock Warrants”) as an additional incentive for Comcast to convert new customer accounts onto our ACP cloud solution. The Stock Warrants have a 10-year term and an exercise price of $26.68 per warrant.
Of the total Stock Warrants, 1.9 million Stock Warrants relate to Comcast’s existing residential business and vest(ed) as follows:
|
|
• |
The first 25% of these Stock Warrants (approximately 0.5 million) vested upon the successful conversion of the first 0.5 million customer accounts, which occurred during the fourth quarter of 2014. |
|
|
• |
The next 25% of these Stock Warrants had a time-based vesting provision, and vested in January 2015. |
|
|
• |
The next 25% of these Stock Warrants vested after a cumulative total of 5.5 million customer accounts were converted onto ACP, which occurred in the fourth quarter of 2016. |
|
|
• |
The last 25% of these Stock Warrants vest proportionately based on the number of customer accounts converted above 5.5 million accounts, with full vesting based on a target of 5.7 million customer accounts above the 5.5 million account level (i.e., a total target of 11.2 million customer account conversions). |
The remaining 1.0 million Stock Warrants relate to additional residential accounts that Comcast may acquire and convert onto ACP in the future and vest proportionately with acquired customer accounts converted onto ACP from other providers’ billing platforms, with full vesting based on a target of 5 million newly converted customer accounts.
Fifty percent of the unvested Stock Warrants become fully vested upon a fundamental change (including a change in control) of the Company, as defined, proportionally reducing the number of Stock Warrants eligible for vesting based on future performance conditions.
Once vested, Comcast may exercise the Stock Warrants and elect either physical delivery of common shares or net share settlement (cashless exercise). Alternatively, the exercise of the Stock Warrants may be settled with cash based solely on our approval, or if Comcast were to beneficially own or control in excess of 19.99% of the common stock or voting of the Company.
Upon vesting, the Stock Warrants are recorded as a client incentive asset, as determined using the Black-Scholes option-pricing model, with the corresponding offset to stockholders’ equity. The client incentive asset related to the Stock Warrants is being amortized as a reduction in cloud and related solutions revenues over the remaining term of the Comcast amended agreement. As of December 31, 2016 and 2015, we have recorded a client incentive asset related to these Stock Warrants of $16.0 million and $7.3 million, respectively, and have recorded accumulated amortization related to these Stock Warrants of $4.3 million and $2.0 million, respectively.
66
The remaining unvested Stock Warrants will be accounted for as client incentive assets in the period the performance conditions necessary for vesting have been met. As of December 31, 2016, none of the Stock Warrants had been exercised.
In January 2017, Comcast exercised 1.4 million vested Stock Warrants. We net share settled the exercise of the Stock Warrants by delivering approximately 649,000 shares of our common stock that we were holding as treasury shares. After this exercise, approximately 1.5 million Stock Warrants are outstanding, none of which are vested as of the date of this filing.
Convertible Debt Securities. Under GAAP, convertible debt securities that may be settled in cash upon conversion (including partial cash settlement), which would include our 2016 Convertible Notes and our 2010 Convertible Notes, must be separated into their liability and equity components at initial recognition by: (i) recording the liability component at the fair value of a similar liability that does not have an associated equity component; and (ii) attributing the remaining proceeds from the issuance to the equity component. As of December 31, 2016, the carrying amount of the equity component related to our 2016 Convertible Notes was $9.8 million. As of December 31, 2015, the carrying amount of the equity component related to our 2010 Convertible Notes was $22.9 million. Beginning September 1, 2016, the holders of the 2010 Convertible Notes can elect to convert their securities at any time, with settlement occurring on March 1, 2017. Accordingly, at December 31, 2016, we classified the difference between the principal amount payable in cash upon conversion and the total settlement value of the 2010 Convertible Notes of $39.8 million as current portion of long-term debt conversion obligation on our Balance Sheet, outside of stockholders’ equity (see Note 5).
|
11. |
Equity Compensation Plans |
Stock Incentive Plans
Stock Incentive Plan. Our stockholders have approved the issuance of 18.7 million shares under the 2005 Stock Incentive Plan (the “2005 Plan”). Shares reserved under the 2005 Plan can be granted to officers and other key employees of our company and its subsidiaries and to non-employee directors of our company in the form of stock options, stock appreciation rights, performance unit awards, restricted stock awards, or stock bonus awards. Shares granted under the 2005 Plan in the form of a performance unit award, restricted stock award, or stock bonus award are counted toward the aggregate number of shares of common stock available for issuance under the 2005 Plan as two shares for every one share granted or issued in payment of such award. As of December 31, 2016, 3.6 million shares were available for issuance, with 3.1 million shares available for grant.
Restricted Stock. We generally issue new shares (versus treasury shares) to fulfill restricted stock award grants. Restricted stock awards are granted at no cost to the recipient. Historically, our restricted stock awards have vested annually primarily over three or four years with no restrictions other than the passage of time (i.e., the shares are released upon calendar vesting with no further restrictions) (“Time-Based Awards”). Unvested Time-Based Awards are typically forfeited and cancelled upon termination of employment with our company. Certain Time-Based Awards become fully vested (vesting accelerates) upon a change in control, as defined, and the subsequent involuntary termination of employment. The fair value of the Time-Based Awards (determined by using the closing market price of our common stock on the grant date) is charged to expense on a straight-line basis over the requisite service period for the entire award.
We also issue restricted stock shares to key members of management that vest in equal installments over three years upon meeting either pre-established financial performance objectives or pre-established stock price objectives (“Performance-Based Awards”). The structure of the performance goals for the Performance-Based Awards has been approved by our stockholders. The Performance-Based Awards become fully vested (vesting accelerates) upon a change in control, as defined, and the subsequent involuntary termination of employment. The fair value of the Performance-Based Awards (determined by using the closing market price of our common stock on the grant date) is charged to expense on a straight-line basis over the requisite service period, taking into consideration the probability of vesting, for each separately vesting portion of the award as if the award is, in-substance, multiple awards.
67
A summary of our unvested restricted stock activity during 2016 is as follows (shares in thousands):
|
|
|
|
|
|
|
|
|
|
|
|
|
2016 |
|
|||||
|
|
|
Shares |
|
|
Weighted- Average Grant Date Fair Value |
|
||
|
Unvested awards, beginning |
|
|
2,124 |
|
|
$ |
26.03 |
|
|
Awards granted |
|
|
526 |
|
|
|
39.07 |
|
|
Awards forfeited/cancelled |
|
|
(282 |
) |
|
|
29.69 |
|
|
Awards vested |
|
|
(974 |
) |
|
|
24.54 |
|
|
Unvested awards, ending |
|
|
1,394 |
|
|
$ |
31.26 |
|
The weighted-average grant date fair value per share of restricted stock shares granted during 2016, 2015, and 2014 was $39.07, $30.71, and $26.45, respectively. The total market value of restricted stock shares vesting during 2016, 2015, and 2014 was $38.5 million, $24.8 million, and $20.7 million, respectively.
1996 Employee Stock Purchase Plan
As of December 31, 2016, we have an employee stock purchase plan whereby 1.7 million shares of our common stock have been reserved for sale to our U.S. employees through payroll deductions. The price for shares purchased under the plan is 85% of market value on the last day of the purchase period. Purchases are made at the end of each month. During 2016, 2015, and 2014, 43,655 shares, 58,927 shares, and 61,592 shares, respectively, were purchased under the plan for $1.6 million ($29.70 to $41.14 per share), $1.6 million ($20.84 to $30.58 per share), and $1.4 million ($21.31 to $25.47 per share), respectively. As of December 31, 2016, 396,967 shares remain eligible for purchase under the plan.
Stock-Based Compensation Expense
We recorded stock-based compensation expense of $22.7 million, $21.1 million, and $16.7 million, respectively, for 2016, 2015, and 2014. As of December 31, 2016 there was $28.3 million of total compensation cost related to unvested awards not yet recognized. That cost, excluding the impact of forfeitures, is expected to be recognized over a weighted-average period of 2.2 years.
We recorded a deferred income tax benefit related to stock-based compensation expense during 2016, 2015, and 2014, of $7.3 million, $6.8 million, and $5.0 million, respectively. The actual income tax benefit realized for the tax deductions from stock option exercises and vesting of restricted stock for 2016, 2015, and 2014, totaled $12.5 million, $7.9 million, and $6.5 million, respectively.
68
|
12. |
Unaudited Quarterly Financial Data |
|
|
|
Quarter Ended |
|
|||||||||||||
|
|
|
March 31 |
|
|
June 30 |
|
|
September 30 |
|
|
December 31 |
|
||||
|
|
|
(in thousands, except per share amounts) |
|
|||||||||||||
|
2016: |
|
|
|
|
|
|
|
|
|
|
|
|
|
|
|
|
|
Total revenues |
|
$ |
186,226 |
|
|
$ |
190,252 |
|
|
$ |
189,311 |
|
|
$ |
195,169 |
|
|
Total cost of revenues (exclusive of depreciation) |
|
|
89,483 |
|
|
|
92,783 |
|
|
|
93,420 |
|
|
|
99,461 |
|
|
Operating income (1) |
|
|
41,291 |
|
|
|
29,374 |
|
|
|
36,598 |
|
|
|
25,366 |
|
|
Income before income taxes (1) |
|
|
33,094 |
|
|
|
17,285 |
|
|
|
30,159 |
|
|
|
19,461 |
|
|
Income tax provision (2) |
|
|
(11,590 |
) |
|
|
(6,448 |
) |
|
|
(12,265 |
) |
|
|
(6,814 |
) |
|
Net income (1)(2) |
|
|
21,504 |
|
|
|
10,837 |
|
|
|
17,894 |
|
|
|
12,647 |
|
|
Basic earnings per common share (1)(2) |
|
$ |
0.70 |
|
|
$ |
0.35 |
|
|
$ |
0.58 |
|
|
$ |
0.41 |
|
|
Diluted earnings per common share (1)(2) |
|
|
0.64 |
|
|
|
0.33 |
|
|
|
0.55 |
|
|
|
0.38 |
|
|
|
|
|
|
|
|
|
|
|
|
|
|
|
|
|
|
|
|
2015: |
|
|
|
|
|
|
|
|
|
|
|
|
|
|
|
|
|
Total revenues |
|
$ |
185,631 |
|
|
$ |
182,641 |
|
|
$ |
186,960 |
|
|
$ |
197,288 |
|
|
Total cost of revenues (exclusive of depreciation) |
|
|
100,266 |
|
|
|
91,796 |
|
|
|
92,182 |
|
|
|
95,497 |
|
|
Operating income (3) |
|
|
21,893 |
|
|
|
26,156 |
|
|
|
31,021 |
|
|
|
34,070 |
|
|
Income before income taxes (3) |
|
|
16,711 |
|
|
|
22,446 |
|
|
|
27,943 |
|
|
|
29,241 |
|
|
Income tax provision (2) |
|
|
(7,353 |
) |
|
|
(9,652 |
) |
|
|
(11,196 |
) |
|
|
(5,573 |
) |
|
Net income (2)(3) |
|
|
9,358 |
|
|
|
12,794 |
|
|
|
16,747 |
|
|
|
23,668 |
|
|
Basic earnings per common share (2)(3) |
|
$ |
0.30 |
|
|
$ |
0.42 |
|
|
$ |
0.54 |
|
|
$ |
0.76 |
|
|
Diluted earnings per common share (2)(3) |
|
|
0.28 |
|
|
|
0.39 |
|
|
|
0.50 |
|
|
|
0.70 |
|
|
(1) |
During the first, second, and fourth quarters of 2016 we incurred restructuring and reorganization charges of $(5.7) million, $5.3 million, and $1.0 million, respectively, or $(0.11), $0.10, and $0.02 per diluted share. The negative restructuring and reorganization charges in the first quarter reflect the gain on disposition of business operations (see Note 6). |
|
(2) |
Fluctuations in our effective income tax rate between quarters generally relates to the accounting for discrete income tax items in any given quarter, and revisions of estimates for certain income tax components during the year. |
|
(3) |
During the first, second, third, and fourth quarters of 2015 we incurred restructuring and reorganization charges of $0.6 million, $0.4 million, $0.8 million, and $1.3 million, respectively, or $0.01, $0.01, $0.02, and $0.03 per diluted share (see Note 6). |
|
|
69
None.
(a) Evaluation of Disclosure Controls and Procedures
As required by Rule 13a-15(b), our management, including the Chief Executive Officer (“CEO”) and Chief Financial Officer (“CFO”), conducted an evaluation as of the end of the period covered by this report of the effectiveness of our disclosure controls and procedures as defined in Rule 13a-15(e). Based on that evaluation, the CEO and CFO concluded that our disclosure controls and procedures were effective as of the end of the period covered by this report.
(b) Management’s Annual Report on Internal Control over Financial Reporting
As required by Rule 13a-15(d), our management, including the CEO and CFO, also conducted an evaluation of our internal control over financial reporting, as defined by Rule 13a-15(f). Management’s Report on Internal Control over Financial Reporting is located at the front of Part II, Item 8 of this report.
(c) Attestation Report of the Independent Registered Public Accounting Firm
Our independent registered public accounting firm issued an attestation report on the effectiveness of our internal control over financial reporting as of December 31, 2016. KPMG LLP’s report is located immediately following Management’s Report on Internal Control over Financial Reporting at the front of Part II, Item 8 of this report.
(d) Changes in Internal Control over Financial Reporting
There were no changes in our internal control over financial reporting identified in connection with the evaluation required by paragraph (d) of Exchange Act Rules 13a-15 or 15d-15 that occurred during the fourth quarter of 2016 that have materially affected, or are reasonably likely to materially affect, our internal control over financial reporting.
None.
70
See the Proxy Statement for our 2017 Annual Meeting of Stockholders, from which information regarding directors is incorporated herein by reference. Information regarding our executive officers will be omitted from such proxy statement and is furnished in a separate item captioned ‘‘Executive Officers of the Registrant’’ included at the end of Part I of this Form 10-K.
See the Proxy Statement for our 2017 Annual Meeting of Stockholders, from which information in response to this Item is incorporated herein by reference.
See the Proxy Statement for our 2017 Annual Meeting of Stockholders, from which information required by this Item is incorporated herein by reference, with the exception of the equity compensation plan information which is presented in Item 5, “Market for Registrant’s Common Equity, Related Stockholder Matters and Issuer Purchases of Equity Securities”, and is incorporated herein by reference.
See the Proxy Statement for our 2017 Annual Meeting of Stockholders, from which information in response to this Item is incorporated herein by reference.
See the Proxy Statement for our 2017 Annual Meeting of Stockholders, from which information in response to this Item is incorporated herein by reference.
71
(a) Financial Statements, Financial Statement Schedules, and Exhibits:
(1) Financial Statements
The financial statements filed as part of this report are listed on the Index to Consolidated Financial Statements on page 40.
(2) Financial Statement Schedules:
None. Any information required in the Financial Statement Schedules is provided in sufficient detail in our Financial Statements and notes thereto.
(3) Exhibits
Exhibits are listed in the Exhibit Index on page 74.
The Exhibits include management contracts, compensatory plans and arrangements required to be filed as exhibits to the Form 10-K by Item 601 of Regulation S-K.
(b) Exhibits
The Exhibits filed or incorporated by reference herewith are as specified in the Exhibit Index.
72
Pursuant to the requirements of Section 13 or 15(d) of the Securities Exchange Act of 1934, the registrant has duly caused this report to be signed on its behalf by the undersigned, thereunto duly authorized.
|
|
CSG SYSTEMS INTERNATIONAL, INC. |
||
|
|
By: |
|
/s/ BRET C. GRIESS |
|
|
|
|
Bret C. Griess |
|
|
|
|
President and Chief Executive Officer |
|
|
|
|
(Principal Executive Officer) |
|
|
|
|
|
|
|
Date: February 24, 2017 |
||
Pursuant to the requirements of the Securities Exchange Act of 1934, this report has been signed below by the following persons on behalf of the registrant and in capacities and on the dates indicated.
|
Signature |
|
Title |
|
Date |
|
/s/ DONALD B. REED |
|
Chairman of the Board of Directors |
|
February 24, 2017 |
|
Donald B. Reed |
|
|
|
|
|
|
|
|
|
|
|
/s/ BRET C. GRIESS |
|
Director, Chief Executive Officer, and President |
|
February 24, 2017 |
|
Bret C. Griess |
|
(Principal Executive Officer) |
|
|
|
|
|
|
|
|
|
/s/ RANDY R. WIESE |
|
Executive Vice President and Chief Financial Officer |
|
February 24, 2017 |
|
Randy R. Wiese |
|
(Principal Financial Officer) |
|
|
|
|
|
|
|
|
|
/s/ ROLLAND B. JOHNS |
|
Chief Accounting Officer |
|
February 24, 2017 |
|
Rolland B. Johns |
|
(Principal Accounting Officer) |
|
|
|
|
|
|
|
|
|
/s/ DAVID G. BARNES |
|
Director |
|
February 24, 2017 |
|
David G. Barnes |
|
|
|
|
|
|
|
|
|
|
|
/s/ RONALD H. COOPER |
|
Director |
|
February 24, 2017 |
|
Ronald H. Cooper |
|
|
|
|
|
|
|
|
|
|
|
/s/ MARWAN H. FAWAZ |
|
Director |
|
February 24, 2017 |
|
Marwan H. Fawaz |
|
|
|
|
|
|
|
|
|
|
|
/s/ JOHN L. M. HUGHS |
|
Director |
|
February 24, 2017 |
|
John L. M. Hughes |
|
|
|
|
|
|
|
|
|
|
|
/s/ JANICE I. OBUCHOWSKI |
|
Director |
|
February 24, 2017 |
|
Janice I. Obuchowski |
|
|
|
|
|
|
|
|
|
|
|
/s/ FRANK V. SICA |
|
Director |
|
February 24, 2017 |
|
Frank V. Sica |
|
|
|
|
|
|
|
|
|
|
|
/s/ DONALD V. SMITH |
|
Director |
|
February 24, 2017 |
|
Donald V. Smith |
|
|
|
|
|
|
|
|
|
|
|
/s/ JAMES A. UNRUH |
|
Director |
|
February 24, 2017 |
|
James A. Unruh |
|
|
|
|
73
EXHIBIT INDEX
|
Exhibit |
|
Description |
|
|
|
|
|
2.10 (14) |
|
Implementation Agreement between CSG Systems International, Inc. and Intec |
|
|
|
|
|
3.01 (1) |
|
Restated Certificate of Incorporation of the Company |
|
|
|
|
|
3.02 (50) |
|
Amended and Restated Bylaws of CSG Systems International, Inc. |
|
|
|
|
|
3.03 (2) |
|
Certificate of Amendment of Restated Certificate of Incorporation of CSG Systems International, Inc. |
|
|
|
|
|
4.01 (1) |
|
Form of Common Stock Certificate |
|
|
|
|
|
4.10 (47) |
|
Indenture dated March 15, 2016, between CSG Systems International, Inc. and The Bank of New York Mellon Trust Company, N.A., as trustee |
|
|
|
|
|
4.30 (11) |
|
Purchase Agreement dated February 24, 2010, by and between CSG Systems International, Inc., and Barclays Capital Inc., J.P. Morgan Securities Inc., and UBS Securities LLC |
|
|
|
|
|
4.40 (11) |
|
Indenture dated March 1, 2010 between CSG Systems International, Inc. and The Bank of New York Mellon Trust Company, N.A., as trustee |
|
|
|
|
|
4.60 (25) |
|
$250,000,000 Amended and Restated Credit Agreement dated as of November 9, 2012, among CSG Systems International, Inc., as Borrower, The Guarantors Party Hereto, The Lenders Party Hereto, RBC Capital Markets, Wells Fargo Securities, LLC, HSBC Bank USA, National Association and BBVA Compass, as Join Lead Arrangers and Joint Bookmanagers, Wells Fargo Bank, National Association, as Syndication Agent, HSBC Bank USA, National Association and BBVA Compass, as Co-Documentation Agents, Royal Bank of Canada, as Administrative Agent and Collateral Agent, and Royal Bank of Canada, as Issuing Bank and Swingline Lender |
|
|
|
|
|
4.70 (37) |
|
$350,000,000 Second Amended and Restated Credit Agreement dated as of February 3, 2015, among CSG Systems International, Inc., as Borrower, The Guarantors Party Hereto, The Lenders Party Hereto, RBC Capital Markets, Wells Fargo Securities, LLC, HSBC Bank USA, National Association, BBVA, and Merrill Lynch, Pierce, Fenner & Smith Incorporated as Joint Lead Arrangers and Joint Bookmanagers; Wells Fargo Bank, National Association as Syndication Agent; HSBC Bank USA, National Association, BBVA Compass, and Bank of America, N.A. as Co-Documentation Agents; Royal Bank of Canada as Administrative Agent and Collateral Agent, and Royal Bank of Canada as Issuing Bank and Swingline Lender |
|
|
|
|
|
10.02 (17) |
|
Second Amended and Restated 1996 Employee Stock Purchase Plan, as adopted on May 17, 2011 |
|
|
|
|
|
10.04 (32) |
|
CSG Systems International, Inc. 2005 Stock Incentive Plan, as adopted on May 22, 2014 |
|
|
|
|
|
10.05 (17) |
|
CSG Systems International, Inc. Performance Bonus Program, as adopted on May 17, 2011 |
|
|
|
|
|
10.06 (5) |
|
CSG Systems International, Inc. 2001 Stock Incentive Plan, as amended August 14, 2007 |
|
|
|
|
|
10.10* (40) |
|
Fixed Notional Accelerated Share Repurchase Transaction between CSG Systems International, Inc. and RBC Capital Markets LLC, as agent for Royal Bank of Canada |
|
|
|
|
|
10.15 (12) |
|
Form of Indemnification Agreement between CSG Systems International, Inc. and Directors and Executive Officers |
|
|
|
|
|
10.16 (4) |
|
Indemnification Agreement between CSG Systems International, Inc. and Mr. Ronald Cooper, dated November 16, 2006 |
|
|
|
|
|
10.20 (47) |
|
Purchase Agreement dated March 9, 2016, by and between CSG Systems International, Inc., and Stifel, Nicolaus & Company, Incorporated and RBC Capital Markets, LLC as representatives of the several initial purchasers |
|
|
|
|
|
10.22* (26) |
|
CSG Master Subscriber Management System Agreement between CSG Systems, Inc. and Comcast Cable Communications Management, LLC |
|
|
|
|
|
10.22A* (27) |
|
First Amendment to the CSG Master Subscriber Management System Agreement between CSG Systems, Inc. and Comcast Cable Communications Management, LLC |
74
|
Exhibit |
|
Description |
|
|
|
|
|
10.22B* (28) |
|
Second Amendment to the CSG Master Subscriber Management System Agreement between CSG Systems, Inc. and Comcast Cable Communications Management, LLC |
|
|
|
|
|
10.22C* (28) |
|
Third Amendment to the Restated and Amended CSG Master Subscriber Management System Agreement between CSG Systems, Inc. and Comcast Cable Communications Management, LLC |
|
|
|
|
|
10.22D* (28) |
|
Fourth Amendment to the CSG Master Subscriber Management System Agreement between CSG Systems, Inc. and Comcast Cable Communications Management, LLC |
|
|
|
|
|
10.22E* (29) |
|
Fifth Amendment to the CSG Master Subscriber Management System Agreement between CSG Systems, Inc. and Comcast Cable Communications Management, LLC |
|
|
|
|
|
10.22F* (29) |
|
Sixth Amendment to the CSG Master Subscriber Management System Agreement between CSG Systems, Inc. and Comcast Cable Communications Management, LLC |
|
|
|
|
|
10.22G* (29) |
|
Seventh Amendment to the CSG Master Subscriber Management System Agreement between CSG Systems, Inc. and Comcast Cable Communications Management, LLC |
|
|
|
|
|
10.22H* (30) |
|
CD Addendum to CSG Master Subscriber Management System Agreement between CSG Systems, Inc. and Comcast Cable Communications Management, LLC |
|
|
|
|
|
10.22I* (35) |
|
Ninth Amendment to the CSG Master Subscriber Management System Agreement between CSG Systems, Inc. and Comcast Cable Communications Management, LLC |
|
|
|
|
|
10.22J* (35) |
|
Tenth Amendment to the CSG Master Subscriber Management System Agreement between CSG Systems, Inc. and Comcast Cable Communications Management, LLC |
|
|
|
|
|
10.22K* (37) |
|
Eleventh Amendment to the CSG Master Subscriber Management System Agreement between CSG Systems, Inc. and Comcast Cable Communications Management, LLC |
|
|
|
|
|
10.22L* (37) |
|
Twelfth Amendment to the CSG Master Subscriber Management System Agreement between CSG Systems, Inc. and Comcast Cable Communications Management, LLC |
|
|
|
|
|
10.22M* (37) |
|
Thirteenth Amendment to the CSG Master Subscriber Management System Agreement between CSG Systems, Inc. and Comcast Cable Communications Management, LLC |
|
|
|
|
|
10.22N* (38) |
|
Fourteenth Amendment to the CSG Master Subscriber Management System Agreement between CSG Systems, Inc. and Comcast Cable Communications Management, LLC |
|
|
|
|
|
10.22O* (38) |
|
Fifteenth Amendment to the CSG Master Subscriber Management System Agreement between CSG Systems, Inc. and Comcast Cable Communications Management, LLC |
|
|
|
|
|
10.22P* (39) |
|
Sixteenth Amendment to the CSG Master Subscriber Management System Agreement between CSG Systems, Inc. and Comcast Cable Communications Management, LLC |
|
|
|
|
|
10.22Q* (41) |
|
Seventeenth Amendment to the CSG Master Subscriber Management System Agreement between CSG Systems, Inc. and Comcast Cable Communications Management, LLC |
|
|
|
|
|
10.22R* (44) |
|
Eighteenth Amendment to the CSG Master Subscriber Management System Agreement between CSG Systems, Inc. and Comcast Cable Communications Management, LLC |
|
|
|
|
|
10.22S* (44) |
|
Nineteenth Amendment to the CSG Master Subscriber Management System Agreement between CSG Systems, Inc. and Comcast Cable Communications Management, LLC |
|
|
|
|
|
10.22T*(48) |
|
Nineteenth Amendment to the CSG Master Subscriber Management System Agreement between CSG Systems, Inc. and Comcast Cable Communications Management, LLC |
|
|
|
|
|
10.22U* (48) |
|
Twentieth Amendment to the CSG Master Subscriber Management System Agreement between CSG Systems, Inc. and Comcast Cable Communications Management, LLC |
|
|
|
|
|
10.22V* (51) |
|
Twenty-Second Amendment to the CSG Master Subscriber Management System Agreement between CSG Systems, Inc. and Comcast Cable Communications Management, LLC |
|
|
|
|
|
10.22W* (51) |
|
Twenty-Fourth Amendment to the CSG Master Subscriber Management System Agreement between CSG Systems, Inc. and Comcast Cable Communications Management, LLC |
|
|
|
|
75
|
Exhibit |
|
Description |
|
10.22X* |
|
Twenty-First Amendment to the CSG Master Subscriber Management System Agreement between CSG Systems, Inc. and Comcast Cable Communications Management, LLC |
|
|
|
|
|
10.22Y* |
|
Common Stock Purchase Warrant between CSG Systems International, Inc. and Comcast Alpha Holdings, Inc., dated January 3, 2017 |
|
|
|
|
|
10.23* (10) |
|
CSG Master Subscriber Management System Agreement between CSG Systems, Inc. and DISH Network L.L.C. |
|
|
|
|
|
10.23A* (12) |
|
Third Amendment to the CSG Master Subscriber Management System Agreement between CSG Systems, Inc. and DISH Network, L.L.C. |
|
|
|
|
|
10.23B* (15) |
|
Fourth Amendment to the CSG Master Subscriber Management System Agreement between CSG Systems, Inc. and DISH Network, L.L.C. |
|
|
|
|
|
10.23C* (16) |
|
Tenth Amendment to the CSG Master Subscriber Management System Agreement Between CSG Systems, Inc. and DISH Network, L.L.C. |
|
|
|
|
|
10.23D* (18) |
|
Eleventh Amendment to the CSG Master Subscriber Management System Agreement Between CSG Systems, Inc. and DISH Network L.L.C. |
|
|
|
|
|
10.23E* (18) |
|
Twelfth Amendment to the CSG Master Subscriber Management System Agreement Between CSG Systems, Inc. and DISH Network L.L.C. |
|
|
|
|
|
10.23F* (18) |
|
Thirteenth Amendment to the CSG Master Subscriber Management System Agreement Between CSG Systems, Inc. and DISH Network L.L.C. |
|
|
|
|
|
10.23G* (18) |
|
Fourteenth Amendment to the CSG Master Subscriber Management System Agreement Between CSG Systems, Inc. and DISH Network L.L.C |
|
|
|
|
|
10.23H* (19) |
|
Fifteenth Amendment to the CSG Master Subscriber Management System Agreement Between CSG Systems, Inc. and DISH Network L.L.C. |
|
|
|
|
|
10.23I* (23) |
|
Sixteenth Amendment to the CSG Master Subscriber Management System Agreement Between CSG Systems, Inc. and DISH Network L.L.C. |
|
|
|
|
|
10.23J* (22) |
|
Seventeenth Amendment to the CSG Master Subscriber Management System Agreement Between CSG Systems, Inc. and DISH Network L.L.C. |
|
|
|
|
|
10.23K* (22) |
|
Eighteenth Amendment to the CSG Master Subscriber Management System Agreement Between CSG Systems, Inc. and DISH Network L.L.C. |
|
|
|
|
|
10.23L* (21) |
|
Nineteenth Amendment to the CSG Master Subscriber Management System Agreement Between CSG Systems, Inc. and DISH Network L.L.C. |
|
|
|
|
|
10.23M* (22) |
|
Twentieth Amendment to the CSG Master Subscriber Management System Agreement Between CSG Systems, Inc. and DISH Network L.L.C. |
|
|
|
|
|
10.23N* (22) |
|
Twenty-first Amendment to the CSG Master Subscriber Management System Agreement Between CSG Systems, Inc. and DISH Network L.L.C. |
|
|
|
|
|
10.23O* (33) |
|
Twenty-second Amendment to the CSG Master Subscriber Management System Agreement Between CSG Systems, Inc. and DISH Network L.L.C. |
|
|
|
|
|
10.23P* (23) |
|
Twenty-third Amendment to the CSG Master Subscriber Management System Agreement Between CSG Systems, Inc. and DISH Network L.L.C. |
|
|
|
|
|
10.23Q* (23) |
|
Twenty-fourth Amendment to the CSG Master Subscriber Management System Agreement Between CSG Systems, Inc. and DISH Network L.L.C. |
|
|
|
|
|
10.23R* (24) |
|
Twenty-fifth Amendment to the CSG Master Subscriber Management System Agreement Between CSG Systems, Inc. and DISH Network L.L.C. |
|
|
|
|
|
10.23S* (24) |
|
Twenty-sixth Amendment to the CSG Master Subscriber Management System Agreement Between CSG Systems, Inc. and DISH Network L.L.C. |
76
|
Exhibit |
|
Description |
|
|
|
|
|
10.23T* (25) |
|
Twenty-seventh Amendment to the CSG Master Subscriber Management System Agreement Between CSG Systems, Inc. and DISH Network L.L.C. |
|
|
|
|
|
10.23U* (25) |
|
Twenty-eighth Amendment to the CSG Master Subscriber Management System Agreement Between CSG Systems, Inc. and DISH Network L.L.C. |
|
|
|
|
|
10.23V* (25) |
|
Twenty-ninth Amendment to the CSG Master Subscriber Management System Agreement Between CSG Systems, Inc. and DISH Network L.L.C. |
|
|
|
|
|
10.23W* (25) |
|
Thirtieth Amendment to the CSG Master Subscriber Management System Agreement Between CSG Systems, Inc. and DISH Network L.L.C. |
|
|
|
|
|
10.23X* (27) |
|
Thirty-First Amendment to the CSG Master Subscriber Management System Agreement between CSG Systems, Inc. and DISH Network L.L.C. |
|
|
|
|
|
10.23Y* (27) |
|
Thirty-Second Amendment to the CSG Master Subscriber Management System Agreement between CSG Systems, Inc. and DISH Network L.L.C. |
|
|
|
|
|
10.23Z* (27) |
|
Thirty-Third Amendment to the CSG Master Subscriber Management System Agreement between CSG Systems, Inc. and DISH Network L.L.C. |
|
|
|
|
|
10.23AA* (27) |
|
Thirty-Fourth Amendment to the CSG Master Subscriber Management System Agreement between CSG Systems, Inc. and DISH Network L.L.C. |
|
|
|
|
|
10.23AB* (28) |
|
Thirty-Fifth Amendment to the CSG Master Subscriber Management System Agreement between CSG Systems, Inc. and DISH Network L.L.C. |
|
|
|
|
|
10.23AC* (28) |
|
Thirty-Sixth Amendment to the CSG Master Subscriber Management System Agreement between CSG Systems, Inc. and DISH Network L.L.C. |
|
|
|
|
|
10.23AD* (29) |
|
Thirty-Seventh Amendment to the CSG Master Subscriber Management System Agreement between CSG Systems, Inc. and DISH Network L.L.C. |
|
|
|
|
|
10.23AE* (29) |
|
Thirty-Ninth Amendment to the CSG Master Subscriber Management System Agreement between CSG Systems, Inc. and DISH Network L.L.C. |
|
|
|
|
|
10.23AF* (31) |
|
Fortieth Amendment to the CSG Master Subscriber Management System Agreement between CSG Systems, Inc. and DISH Network L.L.C. |
|
|
|
|
|
10.23AG* (31) |
|
Forty-First Amendment to the CSG Master Subscriber Management System Agreement between CSG Systems, Inc. and DISH Network L.L.C. |
|
|
|
|
|
10.23AH* (35) |
|
Forty-Second Amendment to the CSG Master Subscriber Management System Agreement between CSG Systems, Inc. and DISH Network L.L.C. |
|
|
|
|
|
10.23AI* (35) |
|
Forty-Third Amendment to the CSG Master Subscriber Management System Agreement between CSG Systems, Inc. and DISH Network L.L.C. |
|
|
|
|
|
10.23AJ* (35) |
|
Forty-Fourth Amendment to the CSG Master Subscriber Management System Agreement between CSG Systems, Inc. and DISH Network L.L.C. |
|
|
|
|
|
10.23AK* (35) |
|
Forty-Fifth Amendment to the CSG Master Subscriber Management System Agreement between CSG Systems, Inc. and DISH Network L.L.C. |
|
|
|
|
|
10.23AL* (35) |
|
Forty-Sixth Amendment to the CSG Master Subscriber Management System Agreement between CSG Systems, Inc. and DISH Network L.L.C. |
|
|
|
|
|
10.23AM* (37) |
Forty-Seventh Amendment to the CSG Master Subscriber Management System Agreement between CSG Systems, Inc. and DISH Network L.L.C. |
|
|
|
|
|
|
10.23AN* (39) |
|
Forty-Eighth Amendment to the CSG Master Subscriber Management System Agreement between CSG Systems, Inc. and DISH Network L.L.C. |
|
|
|
|
|
10.23AO* (41) |
|
Forty-Ninth Amendment to the CSG Master Subscriber Management System Agreement between CSG Systems, Inc. and DISH Network L.L.C. |
|
|
|
|
77
|
Exhibit |
|
Description |
|
10.23AP* (41) |
|
Fiftieth Amendment to the CSG Master Subscriber Management System Agreement between CSG Systems, Inc. and DISH Network L.L.C. |
|
|
|
|
|
10.23AQ (48) |
|
Fifty-First Amendment to the CSG Master Subscriber Management System Agreement between CSG Systems, Inc. and DISH Network L.L.C. |
|
|
|
|
|
10.23AR* (52) |
|
Fifty-Second Amendment to the CSG Master Subscriber Management System Agreement between CSG Systems, Inc. and DISH Network L.L.C. |
|
|
|
|
|
10.23AS* (52) |
|
Fifty-Third Amendment to the CSG Master Subscriber Management System Agreement between CSG Systems, Inc. and DISH Network L.L.C. |
|
|
|
|
|
10.23AT* (52) |
|
Fifty-Fourth Amendment to the CSG Master Subscriber Management System Agreement between CSG Systems, Inc. and DISH Network L.L.C. |
|
|
|
|
|
10.23AU* |
|
Fifty-Fifth Amendment to the CSG Master Subscriber Management System Agreement between CSG Systems, Inc. and DISH Network L.L.C. |
|
|
|
|
|
10.23AV* |
|
Fifty-Sixth Amendment to the CSG Master Subscriber Management System Agreement between CSG Systems, Inc. and DISH Network L.L.C. |
|
|
|
|
|
10.24* (9) |
|
CSG Master Subscriber Management System Agreement between CSG Systems, Inc. and Time Warner Cable dated March 13, 2003 |
|
|
|
|
|
10.24A* (9) |
|
ComTec Processing and Production Services Agreement |
|
|
|
|
|
10.24B* (9) |
|
Second Amendment to the Processing and Production Services Agreement between CSG Systems, Inc. and Time Warner Cable Inc. |
|
|
|
|
|
10.24C* (15) |
|
Forty-Ninth Amendment of the CSG Master Subscriber Management System Agreement between CSG Systems, Inc. and Time Warner Cable Inc. |
|
|
|
|
|
10.24D* (18) |
|
Third Amendment to the Processing and Production Services Agreement between CSG Systems, Inc. and Time Warner Cable Inc. |
|
|
|
|
|
10.24E* (18) |
|
Fifty-First Amendment of the CSG Master Subscriber Management System Agreement between CSG Systems, Inc. and Time Warner Cable Inc. |
|
|
|
|
|
10.24F* (18) |
|
Fifty-Third Amendment of the CSG Master Subscriber Management System Agreement between CSG Systems, Inc. and Time Warner Cable Inc. |
|
|
|
|
|
10.24G* (23) |
|
Fifty-Seventh Amendment of the CSG Master Subscriber Management System Agreement between CSG Systems, Inc. and Time Warner Cable Inc. |
|
|
|
|
|
10.24H* (23) |
|
Sixty-First Amendment of the CSG Master Subscriber Management System Agreement between CSG Systems, Inc. and Time Warner Cable Inc. |
|
|
|
|
|
10.24I* (24) |
|
Fifty-Sixth Amendment of the CSG Master Subscriber Management System Agreement between CSG Systems, Inc. and Time Warner Cable Inc. |
|
|
|
|
|
10.24J* (24) |
|
Sixty-Third Amendment of the CSG Master Subscriber Management System Agreement between CSG Systems, Inc. and Time Warner Cable Inc. |
|
|
|
|
|
10.24K* (24) |
|
Sixty-Fifth Amendment of the CSG Master Subscriber Management System Agreement between CSG Systems, Inc. and Time Warner Cable Inc. |
|
|
|
|
|
10.24L* (25) |
|
Forty-Eighth Amendment of the CSG Master Subscriber Management System Agreement between CSG Systems, Inc. and Time Warner Cable Inc. |
|
|
|
|
|
10.24M* (25) |
|
Fifty-Ninth Amendment of the CSG Master Subscriber Management System Agreement between CSG Systems, Inc. and Time Warner Cable Inc. |
|
|
|
|
|
10.24N* (25) |
|
Sixty-Seventh Amendment of the CSG Master Subscriber Management System Agreement between CSG Systems, Inc. and Time Warner Cable Inc. |
|
|
|
|
|
10.24O* (25) |
|
Sixty-Eighth Amendment of the CSG Master Subscriber Management System Agreement between CSG Systems, Inc. and Time Warner Cable Inc. |
78
|
Exhibit |
|
Description |
|
|
|
|
|
10.24P (25) |
|
Second Amendment to Affiliate Addendum (Corporate National Sales Division) |
|
|
|
|
|
10.24P* (26) |
|
Sixtieth Amendment to the CSG Master Subscriber Management Agreement between CSG Systems, Inc. and Time Warner Cable Inc. |
|
|
|
|
|
10.24Q (25) |
|
Fourth Amendment to Affiliate Addendum Carolina Region |
|
|
|
|
|
10.24Q* (26) |
|
Seventieth Amendment to the CSG Master Subscriber Management Agreement between CSG Systems, Inc. and Time Warner Cable Inc. |
|
|
|
|
|
10.24R (26) |
|
First Amendment to Affiliate Addendum Media Sales Division between CSG Systems, Inc. and Time Warner Cable Inc. |
|
|
|
|
|
10.24S* (27) |
|
Sixty-Ninth Amendment to the CSG Master Subscriber Management System Agreement between CSG Systems, Inc. and Time Warner Cable Inc. |
|
|
|
|
|
10.24T* (28) |
|
Seventy-Third Amendment to the CSG Master Subscriber Management System Agreement between CSG Systems, Inc. and Time Warner Cable Inc. |
|
|
|
|
|
10.24U* (28) |
|
Seventy-Sixth Amendment to the CSG Master Subscriber Management System Agreement between CSG Systems, Inc. and Time Warner Cable Inc. |
|
|
|
|
|
10.24V* (29) |
|
Fifty-Eighth Amendment to the CSG Master Subscriber Management System Agreement between CSG Systems, Inc. and Time Warner Cable Inc. |
|
|
|
|
|
10.24W* (29) |
|
Seventy-Second Amendment to the CSG Master Subscriber Management System Agreement between CSG Systems, Inc. and Time Warner Cable Inc. |
|
|
|
|
|
10.24X* (29) |
|
Seventy-Fifth Amendment to the CSG Master Subscriber Management System Agreement between CSG Systems, Inc. and Time Warner Cable Inc. |
|
|
|
|
|
10.24Y* (29) |
|
Seventy-Seventh Amendment to the CSG Master Subscriber Management System Agreement between CSG Systems, Inc. and Time Warner Cable Inc. |
|
|
|
|
|
10.24Z* (46) |
|
Eighty-Second Amendment to the CSG Master Subscriber Management System Agreement between CSG Systems, Inc. and Time Warner Cable Inc. |
|
|
|
|
|
10.24AA* (31) |
|
Seventy-Fourth Amendment to the CSG Master Subscriber Management System Agreement between CSG Systems, Inc. and Time Warner Cable Inc. |
|
|
|
|
|
10.24AB* (31) |
|
Seventy-Eighth Amendment to the CSG Master Subscriber Management System Agreement between CSG Systems, Inc. and Time Warner Cable Inc. |
|
|
|
|
|
10.24AC* (31) |
|
Seventy-Ninth Amendment to the CSG Master Subscriber Management System Agreement between CSG Systems, Inc. and Time Warner Cable Inc. |
|
|
|
|
|
10.24AD* (33) |
|
Eighty-First Amendment to the CSG Master Subscriber Management System Agreement between CSG Systems, Inc. and Time Warner Cable Inc. |
|
|
|
|
|
10.24AE* (33) |
|
Eighty-Third Amendment to the CSG Master Subscriber Management System Agreement between CSG Systems, Inc. and Time Warner Cable Inc. |
|
|
|
|
|
10.24AF* (33) |
|
Eighty-Fourth Amendment to the CSG Master Subscriber Management System Agreement between CSG Systems, Inc. and Time Warner Cable Inc. |
|
|
|
|
|
10.24AG* (33) |
|
Eighty-Fifth Amendment to the CSG Master Subscriber Management System Agreement between CSG Systems, Inc. and Time Warner Cable Inc. |
|
|
|
|
|
10.24AH* (34) |
|
Amended and Restated Processing and Production Services Agreement entered into between CSG Systems, Inc. and Time Warner Cable Inc. |
|
|
|
|
|
10.24AI* (35) |
|
Eighty-Seventh Amendment to the CSG Master Subscriber Management System Agreement between CSG Systems, Inc. and Time Warner Cable Inc. |
|
|
|
|
|
10.24AJ* (35) |
|
Eighty-Eighth Amendment to the CSG Master Subscriber Management System Agreement between CSG Systems, Inc. and Time Warner Cable Inc. |
|
|
|
|
79
|
Exhibit |
|
Description |
|
10.24AK* (35) |
|
Eighty-Ninth Amendment to the CSG Master Subscriber Management System Agreement between CSG Systems, Inc. and Time Warner Cable Inc. |
|
|
|
|
|
10.24AL* (35) |
|
Ninetieth Amendment to the CSG Master Subscriber Management System Agreement between CSG Systems, Inc. and Time Warner Cable Inc. |
|
|
|
|
|
10.24AM* (35) |
|
Ninety-First Amendment to the CSG Master Subscriber Management System Agreement between CSG Systems, Inc. and Time Warner Cable Inc. |
|
|
|
|
|
10.24AN* (38) |
|
Eighty-Sixth Amendment to the CSG Master Subscriber Management System Agreement between CSG Systems, Inc. and Time Warner Cable Inc. |
|
|
|
|
|
10.24AO* (37) |
|
First Amendment to the CSG Master Subscriber Management System Agreement Between CSG Systems, Inc. and Time Warner Cable Enterprises LLC |
|
|
|
|
|
10.24AP* (38) |
|
Second Amendment to the Amended and Restated Processing and Production Services Agreement Between CSG Systems, Inc. and Time Warner Cable Enterprises LLC |
|
|
|
|
|
10.24AQ* (38) |
Ninety-Fifth Amendment of the CSG Master Subscriber Management System Agreement between CSG Systems, Inc. and Time Warner Cable Inc. |
|
|
|
|
|
|
10.24AR* (39) |
Ninety-Seventh Amendment to the CSG Master Subscriber Management System Agreement between CSG Systems, Inc. and Time Warner Cable Inc. |
|
|
|
|
|
|
10.24AS* (39) |
Ninety-Eighth Amendment to the CSG Master Subscriber Management System Agreement between CSG Systems, Inc. and Time Warner Cable Inc. |
|
|
|
|
|
|
10.24AT* (41) |
Third Amendment to the Amended and Restated Processing and Production Services Agreement between CSG Systems, Inc. and Time Warner Cable Enterprises LLC |
|
|
|
|
|
|
10.24AU* (41) |
Ninety-Second Amendment to the CSG Master Subscriber Management System Agreement between CSG Systems, Inc. and Time Warner Cable Inc. |
|
|
|
|
|
|
10.24AV* (41) |
Ninety-Sixth Amendment to the CSG Master Subscriber Management System Agreement between CSG Systems, Inc. and Time Warner Cable Inc. |
|
|
|
|
|
|
10.24AW* (44) |
Ninety-Ninth Amendment to the CSG Master Subscriber Management System Agreement between CSG Systems, Inc. and Time Warner Cable Inc. |
|
|
|
|
|
|
10.24AX* (44) |
One Hundredth Amendment to the CSG Master Subscriber Management System Agreement between CSG Systems, Inc. and Time Warner Cable Inc. |
|
|
|
|
|
|
10.24AY* (44) |
One Hundred First Amendment to the CSG Master Subscriber Management System Agreement between CSG Systems, Inc. and Time Warner Cable Inc. |
|
|
|
|
|
|
10.24AZ* (45) |
One Hundred Third Amendment to the CSG Master Subscriber Management System Agreement between CSG Systems, Inc. and Time Warner Cable Inc. |
|
|
|
|
|
|
10.24BA* (48) |
One Hundred Second Amendment to the CSG Master Subscriber Management System Agreement between CSG Systems, Inc. and Time Warner Cable Inc. |
|
|
|
|
|
|
10.24BB* (51) |
One Hundred Fourth Amendment to the CSG Master Subscriber Management System Agreement between CSG Systems, Inc. and Time Warner Cable Inc. |
|
|
|
|
|
|
10.24BC* (51) |
One Hundred Sixth Amendment to the CSG Master Subscriber Management System Agreement between CSG Systems, Inc. and Time Warner Cable Inc. |
|
|
|
|
|
|
10.24BD* (52) |
One Hundred Fifth Amendment to the CSG Master Subscriber Management System Agreement between CSG Systems, Inc. and Charter Communications Holding Company, LLC |
|
|
|
|
|
|
10.24BE* (52) |
One Hundred Seventh Amendment to the CSG Master Subscriber Management System Agreement between CSG Systems, Inc. and Time Warner Cable Inc. |
|
|
|
|
|
|
10.24BF* (52) |
One Hundred Eighth Amendment to the CSG Master Subscriber Management System Agreement between CSG Systems, Inc. and Charter Communications Holding Company, LLC |
|
|
|
|
|
80
|
Exhibit |
|
Description |
|
10.24BG* |
One Hundred Ninth Amendment to the CSG Master Subscriber Management System Agreement between CSG Systems, Inc. and Charter Communications Holding Company, LLC |
|
|
|
|
|
|
10.24BH* |
One Hundred Tenth Amendment to the CSG Master Subscriber Management System Agreement between CSG Systems, Inc. and Charter Communications Holding Company, LLC |
|
|
|
|
|
|
10.24BI* |
One Hundred Twelfth Amendment to the CSG Master Subscriber Management System Agreement between CSG Systems, Inc. and Charter Communications Holding Company, LLC |
|
|
|
|
|
|
10.25* (51) |
|
Amended and Restated CSG Master Subscriber Management System Agreement between CSG Systems, Inc. and Charter Communications Holding Company, LLC |
|
|
|
|
|
10.25A* (51) |
|
First Amendment to the Amended and Restated CSG Master Subscriber Management System Agreement between CSG Systems, Inc. and Charter Communications Holding Company, LLC |
|
|
|
|
|
10.25B* (51) |
|
Second Amendment to the Amended and Restated CSG Master Subscriber Management System Agreement between CSG Systems, Inc. and Charter Communications Holding Company, LLC |
|
|
|
|
|
10.25C* (51) |
|
Fourth Amendment to the Amended and Restated CSG Master Subscriber Management System Agreement between CSG Systems, Inc. and Charter Communications Holding Company, LLC |
|
|
|
|
|
10.25D* (51) |
|
Fifth Amendment to the Amended and Restated CSG Master Subscriber Management System Agreement between CSG Systems, Inc. and Charter Communications Holding Company, LLC |
|
|
|
|
|
10.25E* (51) |
|
Sixth Amendment to the Amended and Restated CSG Master Subscriber Management System Agreement between CSG Systems, Inc. and Charter Communications Holding Company, LLC |
|
|
|
|
|
10.25F* (51) |
|
Seventh Amendment to the Amended and Restated CSG Master Subscriber Management System Agreement between CSG Systems, Inc. and Charter Communications Holding Company, LLC |
|
|
|
|
|
10.25G* (51) |
|
Eighth Amendment to the Amended and Restated CSG Master Subscriber Management System Agreement between CSG Systems, Inc. and Charter Communications Holding Company, LLC |
|
|
|
|
|
10.25H* (51) |
|
Ninth Amendment to the Amended and Restated CSG Master Subscriber Management System Agreement between CSG Systems, Inc. and Charter Communications Holding Company, LLC |
|
|
|
|
|
10.25I* (51) |
|
Tenth Amendment to the Amended and Restated CSG Master Subscriber Management System Agreement between CSG Systems, Inc. and Charter Communications Holding Company, LLC |
|
|
|
|
|
10.25J* (51) |
|
Eleventh Amendment to the Amended and Restated CSG Master Subscriber Management System Agreement between CSG Systems, Inc. and Charter Communications Holding Company, LLC |
|
|
|
|
|
10.25K* (51) |
|
Twelfth Amendment to the Amended and Restated CSG Master Subscriber Management System Agreement between CSG Systems, Inc. and Charter Communications Holding Company, LLC |
|
|
|
|
|
10.25L* (51) |
|
Thirteenth Amendment to the Amended and Restated CSG Master Subscriber Management System Agreement between CSG Systems, Inc. and Charter Communications Holding Company, LLC |
|
|
|
|
|
10.25M* (51) |
|
Fourteenth Amendment to the Amended and Restated CSG Master Subscriber Management System Agreement between CSG Systems, Inc. and Charter Communications Holding Company, LLC |
|
|
|
|
|
10.25N* (51) |
|
Fifteenth Amendment to the Amended and Restated CSG Master Subscriber Management System Agreement between CSG Systems, Inc. and Charter Communications Holding Company, LLC |
|
|
|
|
|
10.25O (51) |
|
Sixteenth Amendment to the Amended and Restated CSG Master Subscriber Management System Agreement between CSG Systems, Inc. and Charter Communications Holding Company, LLC |
|
|
|
|
|
10.25P* (51) |
|
Seventeenth Amendment to the Amended and Restated CSG Master Subscriber Management System Agreement between CSG Systems, Inc. and Charter Communications Holding Company, LLC |
|
|
|
|
|
10.25Q* (51) |
|
Eighteenth Amendment to the Amended and Restated CSG Master Subscriber Management System Agreement between CSG Systems, Inc. and Charter Communications Holding Company, LLC |
|
|
|
|
|
10.25R* (51) |
|
Nineteenth Amendment to the Amended and Restated CSG Master Subscriber Management System Agreement between CSG Systems, Inc. and Charter Communications Holding Company, LLC |
|
|
|
|
81
|
Exhibit |
|
Description |
|
10.25S* (51) |
|
Twentieth Amendment to the Amended and Restated CSG Master Subscriber Management System Agreement between CSG Systems, Inc. and Charter Communications Holding Company, LLC |
|
|
|
|
|
10.25T* (51) |
|
Twenty-First Amendment to the Amended and Restated CSG Master Subscriber Management System Agreement between CSG Systems, Inc. and Charter Communications Holding Company, LLC |
|
|
|
|
|
10.25U* (51) |
|
Twenty-Second Amendment to the Amended and Restated CSG Master Subscriber Management System Agreement between CSG Systems, Inc. and Charter Communications Holding Company, LLC |
|
|
|
|
|
10.25V (51) |
|
Twenty-Third Amendment to the Amended and Restated CSG Master Subscriber Management System Agreement between CSG Systems, Inc. and Charter Communications Holding Company, LLC |
|
|
|
|
|
10.25W* (51) |
|
Twenty-Fourth Amendment to the Amended and Restated CSG Master Subscriber Management System Agreement between CSG Systems, Inc. and Charter Communications Holding Company, LLC |
|
|
|
|
|
10.25X* (51) |
|
Twenty-Fifth Amendment to the Amended and Restated CSG Master Subscriber Management System Agreement between CSG Systems, Inc. and Charter Communications Holding Company, LLC |
|
|
|
|
|
10.25Y* (51) |
|
Twenty-Sixth Amendment to the Amended and Restated CSG Master Subscriber Management System Agreement between CSG Systems, Inc. and Charter Communications Holding Company, LLC |
|
|
|
|
|
10.25Z* (51) |
|
Twenty-Seventh Amendment to the Amended and Restated CSG Master Subscriber Management System Agreement between CSG Systems, Inc. and Charter Communications Holding Company, LLC |
|
|
|
|
|
10.25AA* (51) |
|
Twenty-Ninth Amendment to the Amended and Restated CSG Master Subscriber Management System Agreement between CSG Systems, Inc. and Charter Communications Holding Company, LLC |
|
|
|
|
|
10.25AB* (51) |
|
Thirtieth Amendment to the Amended and Restated CSG Master Subscriber Management System Agreement between CSG Systems, Inc. and Charter Communications Holding Company, LLC |
|
|
|
|
|
10.25AC* (51) |
|
Thirty-First Amendment to the Amended and Restated CSG Master Subscriber Management System Agreement between CSG Systems, Inc. and Charter Communications Holding Company, LLC |
|
|
|
|
|
10.25AD* (51) |
|
Thirty-Second Amendment to the Amended and Restated CSG Master Subscriber Management System Agreement between CSG Systems, Inc. and Charter Communications Holding Company, LLC |
|
|
|
|
|
10.25AE* (51) |
|
Thirty-Third Amendment to the Amended and Restated CSG Master Subscriber Management System Agreement between CSG Systems, Inc. and Charter Communications Holding Company, LLC |
|
|
|
|
|
10.25AF* (51) |
|
Thirty-Fourth Amendment to the Amended and Restated CSG Master Subscriber Management System Agreement between CSG Systems, Inc. and Charter Communications Holding Company, LLC |
|
|
|
|
|
10.25AG* (51) |
|
Amended and Restated Thirty-Sixth Amendment to Amended and Restated CSG Master Subscriber Management System Agreement between CSG Systems, Inc. and Charter Communications Holding Company, LLC |
|
|
|
|
|
10.25AH* (51) |
|
Thirty-Seventh Amendment to the Amended and Restated CSG Master Subscriber Management System Agreement between CSG Systems, Inc. and Charter Communications Holding Company, LLC |
|
|
|
|
|
10.25AI* (51) |
|
Thirty-Eighth Amendment to the Amended and Restated CSG Master Subscriber Management System Agreement between CSG Systems, Inc. and Charter Communications Holding Company, LLC |
|
|
|
|
|
10.25AJ* (51) |
|
Thirty-Ninth Amendment to the Amended and Restated CSG Master Subscriber Management System Agreement between CSG Systems, Inc. and Charter Communications Holding Company, LLC |
|
|
|
|
|
10.25AK* (51) |
|
Fortieth Amendment to the Amended and Restated CSG Master Subscriber Management System Agreement between CSG Systems, Inc. and Charter Communications Holding Company, LLC |
|
|
|
|
|
10.25AL* (51) |
|
Forty-First Amendment to the Amended and Restated CSG Master Subscriber Management System Agreement between CSG Systems, Inc. and Charter Communications Holding Company, LLC |
|
|
|
|
|
10.25AM* (51) |
|
Forty-Second Amendment to the Amended and Restated CSG Master Subscriber Management System Agreement between CSG Systems, Inc. and Charter Communications Holding Company, LLC |
|
|
|
|
|
10.25AN* (51) |
|
Forty-Third Amendment to the Amended and Restated CSG Master Subscriber Management System Agreement between CSG Systems, Inc. and Charter Communications Holding Company, LLC |
|
|
|
|
82
|
Exhibit |
|
Description |
|
10.25AO* (51) |
|
Forty-Fourth Amendment to the Amended and Restated CSG Master Subscriber Management System Agreement between CSG Systems, Inc. and Charter Communications Holding Company, LLC |
|
|
|
|
|
10.25AP* (51) |
|
Forty-Sixth Amendment to the Amended and Restated CSG Master Subscriber Management System Agreement between CSG Systems, Inc. and Charter Communications Holding Company, LLC |
|
|
|
|
|
10.25AQ* (51) |
|
Forty-Seventh Amendment to the Amended and Restated CSG Master Subscriber Management System Agreement between CSG Systems, Inc. and Charter Communications Holding Company, LLC |
|
|
|
|
|
10.25AR* (51) |
|
Forty-Eighth Amendment to the Amended and Restated CSG Master Subscriber Management System Agreement between CSG Systems, Inc. and Charter Communications Holding Company, LLC |
|
|
|
|
|
10.25AS* (51) |
|
Forty-Ninth Amendment to the Amended and Restated CSG Master Subscriber Management System Agreement between CSG Systems, Inc. and Charter Communications Holding Company, LLC |
|
|
|
|
|
10.25AT* (51) |
|
Fiftieth Amendment to the Amended and Restated CSG Master Subscriber Management System Agreement between CSG Systems, Inc. and Charter Communications Holding Company, LLC |
|
|
|
|
|
10.25AU* (51) |
|
Fifty-First Amendment to the Amended and Restated CSG Master Subscriber Management System Agreement between CSG Systems, Inc. and Charter Communications Holding Company, LLC |
|
|
|
|
|
10.25AV* (51) |
|
Fifty-Second Amendment to the Amended and Restated CSG Master Subscriber Management System Agreement between CSG Systems, Inc. and Charter Communications Holding Company, LLC |
|
|
|
|
|
10.25AW* (51) |
|
Fifty-Third Amendment to the Amended and Restated CSG Master Subscriber Management System Agreement between CSG Systems, Inc. and Charter Communications Holding Company, LLC |
|
|
|
|
|
10.25AX* (51) |
|
Fifty-Fourth Amendment to the Amended and Restated CSG Master Subscriber Management System Agreement between CSG Systems, Inc. and Charter Communications Holding Company, LLC |
|
|
|
|
|
10.25AY* (51) |
|
Fifty-Fifth Amendment to the Amended and Restated CSG Master Subscriber Management System Agreement between CSG Systems, Inc. and Charter Communications Holding Company, LLC |
|
|
|
|
|
10.25AZ* (51) |
|
Fifty-Sixth Amendment to the Amended and Restated CSG Master Subscriber Management System Agreement between CSG Systems, Inc. and Charter Communications Holding Company, LLC |
|
|
|
|
|
10.25BA* (51) |
|
Fifty-Seventh Amendment to the Amended and Restated CSG Master Subscriber Management System Agreement between CSG Systems, Inc. and Charter Communications Holding Company, LLC |
|
|
|
|
|
10.25BB (51) |
|
Fifty-Eighth Amendment to the Amended and Restated CSG Master Subscriber Management System Agreement between CSG Systems, Inc. and Charter Communications Holding Company, LLC |
|
|
|
|
|
10.25BC* (51) |
|
Fifty-Ninth Amendment to the Amended and Restated CSG Master Subscriber Management System Agreement between CSG Systems, Inc. and Charter Communications Holding Company, LLC |
|
|
|
|
|
10.25BD* (51) |
|
Sixtieth Amendment to the Amended and Restated CSG Master Subscriber Management System Agreement between CSG Systems, Inc. and Charter Communications Holding Company, LLC |
|
|
|
|
|
10.25BE* (51) |
|
Sixty-First Amendment to the Amended and Restated CSG Master Subscriber Management System Agreement between CSG Systems, Inc. and Charter Communications Holding Company, LLC |
|
|
|
|
|
10.25BF* (51) |
|
Sixty-Second Amendment to the Amended and Restated CSG Master Subscriber Management System Agreement between CSG Systems, Inc. and Charter Communications Holding Company, LLC |
|
|
|
|
|
10.25BG* (51) |
|
Sixty-Third Amendment to the Amended and Restated CSG Master Subscriber Management System Agreement between CSG Systems, Inc. and Charter Communications Holding Company, LLC |
|
|
|
|
|
10.25BH (51) |
|
Sixty-Fourth Amendment to the Amended and Restated CSG Master Subscriber Management System Agreement between CSG Systems, Inc. and Charter Communications Holding Company, LLC |
|
|
|
|
|
10.25BI (51) |
|
Sixty-Fifth Amendment to the Amended and Restated CSG Master Subscriber Management System Agreement between CSG Systems, Inc. and Charter Communications Holding Company, LLC |
|
|
|
|
|
10.25BJ (51) |
|
Sixty-Sixth Amendment to the Amended and Restated CSG Master Subscriber Management System Agreement between CSG Systems, Inc. and Charter Communications Holding Company, LLC |
|
|
|
|
83
|
Exhibit |
|
Description |
|
10.25BK* (51) |
|
Sixty-Eighth Amendment to the Amended and Restated CSG Master Subscriber Management System Agreement between CSG Systems, Inc. and Charter Communications Holding Company, LLC |
|
|
|
|
|
10.25BL* (51) |
|
Sixty-Ninth Amendment to the Amended and Restated CSG Master Subscriber Management System Agreement between CSG Systems, Inc. and Charter Communications Holding Company, LLC |
|
|
|
|
|
10.25BM* (51) |
|
Seventieth Amendment to the Amended and Restated CSG Master Subscriber Management System Agreement between CSG Systems, Inc. and Charter Communications Holding Company, LLC |
|
|
|
|
|
10.25BN* (51) |
|
Seventy-First Amendment to the Amended and Restated CSG Master Subscriber Management System Agreement between CSG Systems, Inc. and Charter Communications Holding Company, LLC |
|
|
|
|
|
10.25BO* (51) |
|
Seventy-Second Amendment to the Amended and Restated CSG Master Subscriber Management System Agreement between CSG Systems, Inc. and Charter Communications Holding Company, LLC |
|
|
|
|
|
10.25BP* (51) |
|
Seventy-Fourth Amendment to the Amended and Restated CSG Master Subscriber Management System Agreement between CSG Systems, Inc. and Charter Communications Holding Company, LLC |
|
|
|
|
|
10.25BQ* (51) |
|
Seventy-Fifth Amendment to the Amended and Restated CSG Master Subscriber Management System Agreement between CSG Systems, Inc. and Charter Communications Holding Company, LLC |
|
|
|
|
|
10.25BR* (51) |
|
Seventy-Sixth Amendment to the Amended and Restated CSG Master Subscriber Management System Agreement between CSG Systems, Inc. and Charter Communications Holding Company, LLC |
|
|
|
|
|
10.25BS* (51) |
|
Seventy-Seventh Amendment to the Amended and Restated CSG Master Subscriber Management System Agreement between CSG Systems, Inc. and Charter Communications Holding Company, LLC |
|
|
|
|
|
10.25BT* (51) |
|
Seventy-Eighth Amendment to the Amended and Restated CSG Master Subscriber Management System Agreement between CSG Systems, Inc. and Charter Communications Holding Company, LLC |
|
|
|
|
|
10.25BU* (51) |
|
Seventy-Ninth Amendment to the Amended and Restated CSG Master Subscriber Management System Agreement between CSG Systems, Inc. and Charter Communications Holding Company, LLC |
|
|
|
|
|
10.25BV* (51) |
|
Eightieth Amendment to the Amended and Restated CSG Master Subscriber Management System Agreement between CSG Systems, Inc. and Charter Communications Holding Company, LLC |
|
|
|
|
|
10.25BW* (51) |
|
Eighty-First Amendment to the Amended and Restated CSG Master Subscriber Management System Agreement between CSG Systems, Inc. and Charter Communications Holding Company, LLC |
|
|
|
|
|
10.25BX* (51) |
|
Eighty-Third Amendment to the Amended and Restated CSG Master Subscriber Management System Agreement between CSG Systems, Inc. and Charter Communications Holding Company, LLC |
|
|
|
|
|
10.25BY* (51) |
|
Eighty-Fourth Amendment to the Amended and Restated CSG Master Subscriber Management System Agreement between CSG Systems, Inc. and Charter Communications Holding Company, LLC |
|
|
|
|
|
10.25BZ* (51) |
|
Eighty-Fifth Amendment to the Amended and Restated CSG Master Subscriber Management System Agreement between CSG Systems, Inc. and Charter Communications Holding Company, LLC |
|
|
|
|
|
10.25CA* (51) |
|
Eighty-Sixth Amendment to the Amended and Restated CSG Master Subscriber Management System Agreement between CSG Systems, Inc. and Charter Communications Holding Company, LLC |
|
|
|
|
|
10.25CB* (51)
|
|
Eighty-Seventh Amendment to the Amended and Restated CSG Master Subscriber Management System Agreement between CSG Systems, Inc. and Charter Communications Holding Company, LLC |
|
|
|
|
|
10.25CC* (51) |
|
Eighty-Eighth Amendment to the Amended and Restated CSG Master Subscriber Management System Agreement between CSG Systems, Inc. and Charter Communications Holding Company, LLC |
|
|
|
|
|
10.25CD* (52) |
|
Eighty-Ninth Amendment to the Amended and Restated CSG Master Subscriber Management System Agreement between CSG Systems, Inc. and Charter Communications Holding Company, LLC |
|
|
|
|
|
10.25CE* (52) |
|
Ninety-First Amendment to the Amended and Restated CSG Master Subscriber Management System Agreement between CSG Systems, Inc. and Charter Communications Holding Company, LLC |
|
|
|
|
|
10.25CF* (52) |
|
Ninety-Second Amendment to the Amended and Restated CSG Master Subscriber Management System Agreement between CSG Systems, Inc. and Charter Communications Holding Company, LLC |
|
|
|
|
84
|
Exhibit |
|
Description |
|
10.25CG* |
|
Ninety-Third Amendment to the Amended and Restated CSG Master Subscriber Management System Agreement between CSG Systems, Inc. and Charter Communications Holding Company, LLC |
|
|
|
|
|
10.25CH* |
|
Ninety-Fifth Amendment to the Amended and Restated CSG Master Subscriber Management System Agreement between CSG Systems, Inc. and Charter Communications Holding Company, LLC |
|
|
|
|
|
10.39 (7) |
CSG Systems, Inc. Wealth Accumulation Plan, as amended August 15, 2008 |
|
|
|
|
|
|
10.47 (6) |
|
Restated Employment Agreement with Randy R. Wiese, dated May 29, 2008 |
|
|
|
|
|
10.47A (7) |
|
First Amendment to Restated Employment Agreement with Randy R. Wiese, dated August 19, 2008 |
|
|
|
|
|
10.47B (43) |
|
Amended and Restated Employment Agreement with Randy R. Wiese, dated November 30, 2015 |
|
|
|
|
|
10.47C (53) |
|
Amendment No. 1 to Amended and Restated Employment Agreement with Randy R. Wiese, dated November 17, 2016 |
|
|
|
|
|
10.48 (6) |
|
Restated Employment Agreement with Peter E. Kalan, dated May 29, 2008 |
|
|
|
|
|
10.48A (7) |
|
First Amendment to Restated Employment Agreement with Peter E. Kalan, dated August 19, 2008 |
|
|
|
|
|
10.48B (42) |
|
Resignation and Retirement Agreement with Peter E. Kalan, dated November 19, 2015 |
|
|
|
|
|
10.49 (6) |
|
Restated Employment Agreement with Joseph T. Ruble, dated May 29, 2008 |
|
|
|
|
|
10.49A (7) |
|
First Amendment to Restated Employment Agreement with Joseph T. Ruble, dated August 19, 2008 |
|
|
|
|
|
10.49B (43) |
|
Amended and Restated Employment Agreement with Joseph T. Ruble, dated November 30, 2015 |
|
|
|
|
|
10.49C (49) |
|
Separation Agreement with Joseph T. Ruble dated April 21, 2016 |
|
|
|
|
|
10.50 (3) |
|
CSG Systems International, Inc. 2001 Stock Incentive Plan |
|
|
|
|
|
10.51 (8) |
|
Employment Agreement with Bret C. Griess dated February 19, 2009 |
|
|
|
|
|
10.51A (42) |
|
Amended and Restated Employment Agreement with Bret C. Griess, dated November 19, 2015 |
|
|
|
|
|
10.51B (53) |
|
Amendment No. 1 to Amended and Restated Employment Agreement with Bret C. Griess, dated November 17, 2016 |
|
|
|
|
|
10.52 (46) |
|
Employment Agreement with Brian Shepherd, dated February 15, 2016 |
|
|
|
|
|
10.52A (53) |
|
Amendment No. 1 to Employment Agreement with Brian Shepherd, dated November 17, 2016 |
|
|
|
|
|
10.53 (46) |
|
Employment Agreement with Kenneth M. Kennedy, dated March 1, 2016 |
|
|
|
|
|
10.53A (53) |
|
Amendment No. 1 to Employment Agreement with Kenneth M. Kennedy, dated November 17, 2016 |
|
|
|
|
|
10.83 (26) |
|
Forms of Agreement for Equity Compensation |
|
|
|
|
|
10.83A (28) |
|
Forms of Agreement for Equity Compensation |
|
|
|
|
|
10.84 (48) |
|
Forms of Agreement for Equity Compensation |
|
|
|
|
|
21.01 |
|
Subsidiaries of the Registrant |
|
|
|
|
|
23.01 |
|
Consent of KPMG LLP |
|
|
|
|
|
31.01 |
|
Certifications Pursuant to Section 302 of the Sarbanes-Oxley Act of 2002 |
|
|
|
|
|
31.02 |
|
Certifications Pursuant to Section 302 of the Sarbanes-Oxley Act of 2002 |
|
|
|
|
|
32.01 |
|
Certification pursuant to 18 U.S.C. Section 1350, as Adopted Pursuant to Section 906 of the Sarbanes-Oxley Act of 2002 |
|
|
|
|
|
101.INS |
|
XBRL Instance Document |
|
|
|
|
|
101.SCH |
|
XBRL Taxonomy Extension Schema Document |
|
|
|
|
|
101.CAL |
|
XBRL Taxonomy Extension Calculation Linkbase Document |
|
|
|
|
85
|
Exhibit |
|
Description |
|
101.DEF |
|
XBRL Taxonomy Extension Definition Linkbase Document |
|
|
|
|
|
101.LAB |
|
XBRL Taxonomy Extension Label Linkbase Document |
|
|
|
|
|
101.PRE |
|
XBRL Taxonomy Extension Presentation Linkbase Document |
|
(1) |
Incorporated by reference to the exhibit of the same number to the Registration Statement No. 333-244 on Form S-1. |
|
(2) |
Incorporated by reference to the exhibit of the same number to the Registrant’s Quarterly Report on Form 10-Q for the period ended June 30, 1997. |
|
(3) |
Incorporated by reference to the exhibit of the same number to the Registrant’s Quarterly Report on Form 10-Q for the period ended June 30, 2002. |
|
(4) |
Incorporated by reference to the exhibit of the same number to the Registrant’s Current Report on Form 8-K for the event dated November 16, 2006. |
|
(5) |
Incorporated by reference to the exhibit of the same number to the Registrant’s Quarterly Report on Form 10-Q for the period ended September 30, 2007. |
|
(6) |
Incorporated by reference to the exhibit of the same number to the Registrant’s Quarterly Report on Form 10-Q for the period ended June 30, 2008. |
|
(7) |
Incorporated by reference to the exhibit of the same number to the Registrant’s Quarterly Report on Form 10-Q for the period ended September 30, 2008. |
|
(8) |
Incorporated by reference to the exhibit of the same number to the Registrant’s Quarterly Report on Form 10-Q for the period ended March 31, 2009. |
|
(9) |
Incorporated by reference to the exhibit of the same number to the Registrant’s Annual Report on Form 10-K/A for the year ended December 31, 2008, filed on September 8, 2009. |
|
(10) |
Incorporated by reference to the exhibit of the same number to the Registrant’s Annual Report on Form 10-K for the year ended December 31, 2009. |
|
(11) |
Incorporated by reference to the exhibit of the same number to the Registrant’s Current Report on Form 8-K for the event dated February 24, 2010. |
|
(12) |
Incorporated by reference to the exhibit of the same number to the Registrant’s Quarterly Report on Form 10-Q for the period ended March 31, 2010. |
|
(13) |
Incorporated by reference to the exhibit of the same number to the Registrant’s Current Report on Form 8-K for the event dated July 13, 2010. |
|
(14) |
Incorporated by reference to the exhibit of the same number to the Registrant’s Quarterly Report on Form 10-Q for the period ended September 30, 2010. |
|
(15) |
Incorporated by reference to the exhibit of the same number to the Registrant’s Annual Report on Form 10-K for the year ended December 31, 2010. |
|
(16) |
Incorporated by reference to the exhibit of the same number to the Registrant’s Quarterly Report on Form 10-Q for the period ended March 31, 2011. |
|
(17) |
Incorporated by reference to the exhibit of the same number to the Registrant’s Current Report on Form 8-K for the event dated May 17, 2011. |
|
(18) |
Incorporated by reference to the exhibit of the same number to the Registrant’s Quarterly Report on Form 10-Q for the period ended June 30, 2011. |
|
(19) |
Incorporated by reference to the exhibit of the same number to the Registrant’s Quarterly Report on Form 10-Q for the period ended September 30, 2011. |
|
(20) |
Incorporated by reference to the exhibit of the same number to the Registrant’s Annual Report on Form 10-K for the year ended December 31, 2011. |
|
(21) |
Incorporated by reference to the exhibit of the same number to the Registrant’s Quarterly Report on Form 10-Q for the period ended March 31, 2012. |
|
(22) |
Incorporated by reference to the exhibit of the same number to the Registrant’s Quarterly Report on Form 10-Q/A for the period ended March 31, 2012, filed on August 29, 2012. |
|
(23) |
Incorporated by reference to the exhibit of the same number to the Registrant’s Quarterly Report on Form 10-Q for the period ended June 30, 2012. |
|
(24) |
Incorporated by reference to the exhibit of the same number to the Registrant’s Quarterly Report on Form 10-Q for the period ended September 30, 2012. |
|
(25) |
Incorporated by reference to the exhibit of the same number to the Registrant’s Annual Report on Form 10-K for the year ended December 31, 2012. |
|
(26) |
Incorporated by reference to the exhibit of the same number to the Registrant’s Quarterly Report on Form 10-Q for the period ended March 31, 2013. |
|
(27) |
Incorporated by reference to the exhibit of the same number to the Registrant’s Quarterly Report on Form 10-Q for the period ended June 30, 2013. |
86
|
(28) |
Incorporated by reference to the exhibit of the same number to the Registrant’s Quarterly Report on Form 10-Q for the period ended September 30, 2013. |
|
(29) |
Incorporated by reference to the exhibit of the same number to the Registrant’s Annual Report on Form 10-K for the year ended December 31, 2013. |
|
(30) |
Incorporated by reference to the exhibit of the same number to the Registrant’s Quarterly Report on Form 10-K/A for the period ended December 31, 2013, filed on July 9, 2014. |
|
(31) |
Incorporated by reference to the exhibit of the same number to the Registrant’s Quarterly Report on Form 10-Q for the period ended March 31, 2014. |
|
(32) |
Incorporated by reference to the exhibit of the same number to the Registrant’s Current Report on Form 8-K for the event dated May 22, 2014. |
|
(33) |
Incorporated by reference to the exhibit of the same number to the Registrant’s Quarterly Report on Form 10-Q for the period ended June 30, 2014. |
|
(34) |
Incorporated by reference to the exhibit of the same number to the Registrant’s Quarterly Report on Form 10-Q/A for the period ended June 30, 2014, filed on October 23, 2014. |
|
(35) |
Incorporated by reference to the exhibit of the same number to the Registrant’s Quarterly Report on Form 10-Q for the period ended September 30, 2014. |
|
(36) |
Incorporated by reference to the exhibit of the same number to the Registrant’s Current Report on Form 8-K for the event dated November 20, 2014. |
|
(37) |
Incorporated by reference to the exhibit of the same number to the Registrant’s Annual Report on Form 10-K for the year ended December 31, 2014. |
|
(38) |
Incorporated by reference to the exhibit of the same number to the Registrant’s Quarterly Report on Form 10-Q for the period ended March 31, 2015. |
|
(39) |
Incorporated by reference to the exhibit of the same number to the Registrant’s Quarterly Report on Form 10-Q for the period ended June 30, 2015. |
|
(40) |
Incorporated by reference to the exhibit of the same number to the Registrant’s Quarterly Report on Form 10-Q/A for the period ended March 31, 2015, filed on September 18, 2015. |
|
(41) |
Incorporated by reference to the exhibit of the same number to the Registrant’s Quarterly Report on Form 10-Q for the period ended September 30, 2015. |
|
(42) |
Incorporated by reference to the exhibit of the same number to the Registrant’s Current Report on Form 8-K for the event dated November 19, 2015. |
|
(43) |
Incorporated by reference to the exhibit of the same number to the Registrant’s Current Report on Form 8-K/A for the event dated November 19, 2015, filed on December 1, 2015. |
|
(44) |
Incorporated by reference to the exhibit of the same number to the Registrant’s Annual Report on Form 10-K for the year ended December 31, 2015. |
|
(45) |
Incorporated by reference to the exhibit of the same number to the Registrant’s Annual Report on Form 10-K/A for the year ended December 31, 2015, filed on August 29, 2016. |
|
(46) |
Incorporated by reference to the exhibit of the same number to the Registrant’s Current Report on Form 8-K for the event dated February 25, 2016. |
|
(47) |
Incorporated by reference to the exhibit of the same number to the Registrant’s Current Report on Form 8-K for the event dated March 9, 2016. |
|
(48) |
Incorporated by reference to the exhibit of the same number to the Registrant’s Quarterly Report on Form 10-Q for the period ended March 31, 2016. |
|
(49) |
Incorporated by reference to the exhibit of the same number to the Registrant’s Current Report on Form 8-K for the event dated April 21, 2016. |
|
(50) |
Incorporated by reference to the exhibit of the same number to the Registrant’s Current Report on Form 8-K for the event dated May 26, 2016. |
|
(51) |
Incorporated by reference to the exhibit of the same number to the Registrant’s Quarterly Report on Form 10-Q for the period ended June 30, 2016. |
|
(52) |
Incorporated by reference to the exhibit of the same number to the Registrant’s Quarterly Report on Form 10-Q for the period ended September 30, 2016. |
|
(53) |
Incorporated by reference to the exhibit of the same number to the Registrant’s Current Report on Form 8-K for the event dated November 17, 2016. |
|
* |
Portions of the exhibit have been omitted pursuant to an application for confidential treatment, and the omitted portions have been filed separately with the Commission. |
87