Attached files
| file | filename |
|---|---|
| EX-32.2 - EXHIBIT 32.2 - AEROHIVE NETWORKS, INC | hive-ex322x20161231.htm |
| EX-32.1 - EXHIBIT 32.1 - AEROHIVE NETWORKS, INC | hive-ex321x20161231.htm |
| EX-31.2 - EXHIBIT 31.2 - AEROHIVE NETWORKS, INC | hive-ex312x20161231.htm |
| EX-31.1 - EXHIBIT 31.1 - AEROHIVE NETWORKS, INC | hive-ex311x20161231.htm |
| EX-23.1 - EXHIBIT 23.1 - AEROHIVE NETWORKS, INC | hive-ex231x20161231.htm |
| EX-21.1 - EXHIBIT 21.1 - AEROHIVE NETWORKS, INC | hive-ex211x20161231.htm |
UNITED STATES SECURITIES AND EXCHANGE COMMISSION Washington, D.C. 20549 | ||
Form 10-K | ||
x ANNUAL REPORT PURSUANT TO SECTION 13 OR 15(d) OF THE SECURITIES EXCHANGE ACT OF 1934
For the fiscal year ended December 31, 2016
o TRANSITION REPORT PURSUANT TO SECTION 13 OR 15(d) OF THE SECURITIES EXCHANGE ACT OF 1934
For the transition period from to
Commission file number: 001-36355
Aerohive Networks, Inc. |
(Exact name of registrant as specified in its charter) |
Delaware | 20-4524700 | |||
(State or other jurisdiction of incorporation or organization) | (I.R.S. Employer Identification Number) | |||
1011 McCarthy Boulevard
Milpitas, California 95035
(408) 510-6100
(Address, including zip code, and telephone number, including area code, of registrant's principal executive offices) |
Securities registered pursuant to Section 12(b) of the Act:
Title of Each Class | Name of Exchange on Which Registered | |
Common Stock, par value $0.001 per share | New York Stock Exchange | |
Securities registered pursuant to Section 12(g) of the Act:
None
Indicate by check mark if the registrant is a well-known seasoned issuer, as defined in Rule 405 of the Securities Act. Yes o No x
Indicate by check mark if the registrant is not required to file reports pursuant to Section 13 or Section 15(d) of the Securities Exchange Act of 1934 (the “Exchange Act”). Yes o No x
Indicate by check mark whether the registrant (1) has filed all reports required to be filed by Section 13 or 15(d) of the Securities Exchange Act of 1934 during the preceding 12 months (or for such shorter period that the registrant was required to file such reports), and (2) has been subject to such filing requirements for the past 90 days. Yes x No ¨
Indicate by check mark whether the registrant has submitted electronically and posted on its corporate Web site, if any, every Interactive Data File required to be submitted and posted pursuant to Rule 405 of Regulation S-T (§232.405 of this chapter) during the preceding 12 months (or for such shorter period that the registrant was required to submit and post such files). Yes x No ¨
Indicate by a check mark if disclosure of delinquent filers pursuant to Item 405 of Regulation S-K (§229.405 of this chapter) is not contained herein, and will not be contained, to the best of registrant's knowledge, in definitive proxy or information statements incorporated by reference in Part III of this Form 10-K or any amendment to this Form 10-K. Yes o No x
Indicate by check mark whether the registrant is a large accelerated filer, an accelerated filer, a non-accelerated filer, or a smaller reporting company. See the definitions of “large accelerated filer,” “accelerated filer” and “smaller reporting company” in Rule 12b-2 of the Exchange Act.
Large accelerated filer ¨ | Accelerated filer x | |
Non-accelerated filer ¨ (Do not check if a smaller reporting company) | Smaller reporting company ¨ | |
Indicate by check mark whether the registrant is a shell company (as defined in Rule 12b-2 of the Exchange Act). Yes o No x
The aggregate market value of the registrant's common stock held by non-affiliates of the registrant as of the last business day of the registrant's most recently completed second fiscal quarter was approximately $207.3 million based upon the closing sale price of such stock on the New York Stock Exchange. For purposes of this disclosure, shares of common stock held or controlled by executive officers and directors of the registrant and by persons who hold more than 10% of the outstanding shares of common stock have been treated as shares held by affiliates. However, such treatment should not be construed as an admission that any such person is an “affiliate” of the registrant. The registrant has no non-voting common equity.
The number of shares of the registrant's common stock, par value $0.001, outstanding as of February 17, 2017 was 52,293,117.
TABLE OF CONTENTS
PART I. | Page | |
Item 1. | ||
Item 1A. | ||
Item 1B. | ||
Item 2. | ||
Item 3. | ||
Item 4. | ||
PART II. | ||
Item 5. | ||
Item 6. | ||
Item 7. | ||
Item 7A. | ||
Item 8. | ||
Item 9. | ||
Item 9A | ||
Item 9B. | ||
PART III. | ||
Item 10. | ||
Item 11. | ||
Item 12. | ||
Item 13. | ||
Item 14. | ||
PART IV. | ||
Item 15. | ||
The Aerohive Networks design logo and the marks “Aerohive®”, “HiveManager®”, “HiveOS®”, "HiveManager ConnectTM" and "HiveManager SelectTM", are the property of Aerohive Networks, Inc. All Rights Reserved. This Annual Report on Form 10-K contains additional trade names, trademarks and service marks of other companies.
1
SPECIAL NOTE REGARDING FORWARD-LOOKING STATEMENTS
This Annual Report on Form 10-K, including the sections entitled “Business,” “Risk Factors,” and “Management's Discussion and Analysis of Financial Condition and Results of Operations,” contains forward-looking statements within the meaning of Section 27A of the Securities Act of 1933, as amended, and Section 21E of the Securities Exchange Act of 1934, as amended. The words “believe,” “will,” “may,” “estimate,” “continue,” “anticipate,” “intend,” “should,” “plan,” “expect,” “predict,” “could,” “potentially” and similar expressions that convey uncertainty of future events or outcomes are intended to identify forward-looking statements.
These forward-looking statements include, but are not limited to, statements concerning the following:
• | our ability to predict our revenue, operating results and gross margin accurately, including guidance we provide to our investors and investment analysts; |
• | our ability to timely develop, deliver and transition to new product offerings and transition existing and new end-customers to such offerings, including in conjunction with our Connect product offering, while maintaining existing product revenue and our existing service level commitments to end-customers; |
• | our ability to continue to secure orders from large customers and any potential loss of or reductions in orders from such larger customers; |
• | our ability to maximize the economic opportunity of the U.S. Federal Communications Commission’s E-Rate program and the timing and uncertainty of the availability of funding, the level of available funding and the decisions by end-customers to purchase our products using such funding; |
• | the length and seasonal unpredictability of our sales cycles, including with service provider end-customers; |
• | the effects of increased competition in and consolidation of our market and our ability to compete with larger competitors with greater financial, technical and other resources; |
• | our ability to attract new end-customers within the verticals and geographies in which we currently operate; |
• | changes in global consumer confidence and demand for our products internationally, due to changes to foreign currency exchange rates and other factors, including following the decision of the United Kingdom to withdraw from the European Union; |
• | our ability to continue to build and enhance relationships with channel partners and to derive revenue from our investments in those partnerships, particularly with our strategic partners; |
• | our ability to protect our intellectual property and our exposure to third party claims that we or our customers or channel partners infringe their intellectual property; and |
• | other risk factors included under the section titled “Risk Factors.” |
These forward-looking statements are subject to a number of risks, uncertainties, and assumptions, including those described in “Risk Factors” included in Part I, Item 1A and elsewhere in this report. Moreover, we operate in a very competitive and rapidly changing environment, and new risks emerge from time to time. It is not possible for us to predict all risks, nor can we assess the impact of all factors on our business or the extent to which any factor, or combination of factors, may cause actual results to differ materially from those contained in any forward-looking statements we may make. In light of these risks, uncertainties and assumptions, the forward-looking events and circumstances discussed in this report may not occur, and actual results could differ materially and adversely from those anticipated or implied in the forward-looking statements. We undertake no obligation to revise or publicly release the results of any revision to these forward-looking statements, except as required by law. Given these risks and uncertainties, we caution you not to place undue reliance on such forward-looking statements.
The following information should be read in conjunction with the Consolidated Financial Statements and the accompanying Notes to Consolidated Financial Statements included in this report.
PART I
ITEM 1. BUSINESS
Overview
Aerohive Networks, Inc. and together with its subsidiaries (“Aerohive Networks,” “Aerohive,” “Company,” “we,” “us,” and “our”) has designed and developed a leading cloud networking and enterprise Wi-Fi solution that enables our customers to use the power of Wi-Fi, cloud, analytics and applications to transform how they serve their customers. Our products include Wi-Fi access points, routers and switches required to build an edge-access network; a cloud services platform for centralized management in a wide range of customer environments; and data collection, analytics and applications that leverage the network to provide additional capabilities to the business and IT organization. Together, these products, service platform, data and applications create a simple, scalable, and secure solution to deliver a better-connected experience. Customers around the world, from Fortune 500 businesses to small schools, have chosen our products.
Technologies and Solutions
We have built our portfolio of products and solutions around three primary sets of technologies and capabilities:
• | Enterprise Cloud Networking. Using cloud-based technologies, whether as a public or private cloud, to manage the network and reduce the complexity of supporting large numbers of devices. |
• | Wi-Fi Connectivity. Wi-Fi access points and supporting wired devices built around a unique distributed control architecture that delivers simplicity, speed, security, and scale. |
• | Application and Insights. Collected data sets and analytics accessed through APIs that enable customized business & IT applications to unlock new information, insights, and engagement. |
We believe that each of these areas adds valuable customer capabilities, differentiates our offering, and showcases our continuing innovation.
Enterprise Cloud Networking. Our customers today are increasingly demanding simplicity in how they manage and operate their Wi-Fi network. Cloud networking enables us to deliver this. Our cloud networking capabilities, including our HiveManager network management applications, combine the benefits of the cloud with the feature depth required for managing enterprise-class networks. We believe we are the only major vendor who can provide these enterprise-class capabilities in both a public cloud and a private cloud deployment.
We have chosen to focus on enterprise cloud networking based on the compelling benefits we believe we can offer our customers. Legacy approaches to network management have relied on complex enterprise applications that customers must install, integrate, maintain, and administer themselves. New releases were infrequent and updates installed by customers even less frequent. In contrast, our cloud-based network management provides a single, integrated management view across the entire network that a user can access from virtually anywhere. We maintain and administer the network management application in the cloud, which users then access as a subscription service that can be regularly updated in response to new features or urgent changes.
With our cloud networking and our HiveManager application, we deliver a number of important capabilities to our customers. While enterprise customers want simplified network management they still need a full set of features and capabilities. Our “progressive disclosure” user interface means that advanced features are available but are hidden from view when then are not being used. Similarly, organizations that need to deploy the network often do not have technical staff at every location. Our cloud networking supports automated provisioning, where a device that is connected to the network for the first time can automatically find and download its proper configuration. Our cloud network solution also includes troubleshooting capabilities, such as dashboards to quickly identify potential issues and monitoring to easily research and resolve issues. Finally, cloud networking makes it possible for a customer to very quickly evaluate the capabilities of our solution. A single wireless access point with a corresponding license for HiveManager gives customers complete access to our capabilities. In addition, those customers who want the capabilities of cloud networking but also need to manage their network in their own datacenter, behind their own firewall, can install and run HiveManager "on premises" at a customer location with similar functionality and same software as we offer in the public cloud. Overall, by taking advantage of our cloud network capabilities, our customers are able to manage even large networks with a small staff and limited resources.
While we were an early leader in cloud networking we continue to innovate and to invest in HiveManager as our strategic cloud networking application. We are focusing our current efforts on HiveManager NG, an updated version of our legacy HiveManager application, we now call HiveManager Classic, which features an updated user interface, improved troubleshooting, expanded access to data and analytics, and an upgraded cloud deployment platform. While HiveManager NG offers a more compelling customer solution, it also offers a more dynamic platform for innovation. In April 2016, we announced with our partner Dell, a Dell-branded version of HiveManager NG capable of managing Dell N-series switches in the same network as Aerohive Wi-Fi access points, delivering multi-vendor integrated wired and wireless network management. Throughout 2016, we delivered new releases of HiveManager NG that continued to expand our enterprise feature set and improve the user experience. In January 2017, we announced HiveManager Connect, a simplified version of HiveManager NG included as a part of our new Aerohive Connect product line designed for customers with less complex, connectivity oriented requirements. Aerohive's Connect customers can purchase a subscription to upgrade to our current full-featured offering, we refer to as Aerohive Select. Aerohive Select includes additional capabilities, such as advanced security and troubleshooting tools, support for Bring-Your-Own-Device programs, increased network visibility, enterprise support options, and the ability to deploy HiveManager on-premises or in a private cloud environment. The capabilities of our scalable cloud platform enabled all of these innovations.
During the second half of 2016, we saw significant increases in the rate of adoption HiveManager NG by new customers. We expect that HiveManager NG will over time replace the HiveManager Classic solution currently used by the majority of our customers. During this transition, we will continue to offer and support both versions of the application, working with current customers as appropriate to migrate to HiveManager NG.
Scalable Wi-Fi. Our scalable Wi-Fi provides the network connectivity for the overall Aerohive solution. We have built our Wi-Fi around a distributed control architecture that simplifies operations and improves resilience. Integral to our Wi-Fi is the ability to securely control access to the wireless network. We also offer the access switches and branch routers needed for a complete access network infrastructure.
We believe our distributed control technology remains one of our key innovations and differentiators. Over the last decade, Wi-Fi architectures have gone through a series of evolutions in response to changing technologies and user requirements. When the original autonomous Wi-Fi access points proved difficult to manage vendors introduced wireless LAN controllers to the network. Wireless LAN controllers brought management and control, but they also brought the cost and complexity of dedicated hardware, a new single point of failure, and rigid deployments too inflexible to meet dynamic requirements of wireless networks. To overcome these limitations other vendors have integrated their controller with switches or Wi-Fi access points, or moved their controllers into the cloud, with greater cost and limited capabilities. In contrast, our architecture fully distributes the control plane across the Wi-Fi access points, eliminating the need for any wireless LAN controller and reducing cost of operations. We deliver the algorithms for distributed control through HiveOS, our device operating system that runs on every Aerohive Wi-Fi access point. HiveOS delivers radio management, client roaming, load balancing, policy enforcement, packet inspection and other functions locally on the Wi-Fi access point.
Our distributed control architecture provides key benefits to our customers. Most important is the scalability of a single architecture effective for deployments from one to thousands of Wi-Fi access points. Most of our competitors have different technologies and products for different sizes of deployments. Instead, our customers can start small and grow as they need to without any change in architecture or Wi-Fi technology. Our customers can also mix different generations of Wi-Fi access points in the same network, providing investment protection. Overall, by intelligently distributing control over the Wi-Fi access points our architecture can support faster deployments and greater resiliency.
Integral to our scalable Wi-Fi is the ability to enforce security at the Wi-Fi access point based on the end user’s access policies, which can be based on the application being used, user identity and role, device type and ownership, location and time of day. Our Private Pre-Shared Key, or PPSK, technology extends these capabilities to assign each device a unique key for accessing the network that can be authorized or revoked without impacting any other network device. PPSK can also be used in Internet of Things deployments to authorize devices that do not have a keyboard or some other mechanism for providing credentials.
During 2016, we continued to expand our family of Wi-Fi access points in response to technology and market trends. We introduced two 802.11ac Wave 2 access points, the AP250 and AP550, both built on new high performance standards and components, and as a result, we saw strong growth in Wave 2 as a proportion of our business. The AP 250 and AP 550 offer the important innovation of dual 5 GHz radios that are software configurable radios which enable customers to effectively double the capacity of their networks. In January 2017, we announced the AP122 as our new entry-level 802.11ac access point. We remain active in the Wi-Fi Alliance and monitor emerging Wi-Fi technologies as input to our future product roadmap.
While we emphasize our Wi-Fi capabilities our portfolio also includes wired access switches and branch routers. Wireless access points generally connect to an access switch for connectivity and power. In the second half of 2016, we released a new family of cloud-managed access switches based on Broadcom's FastPath operating system. We believe that
adopting an industry-standard platform will enable us to more quickly innovate and grow our switch business. We also continue to offer our previously available HiveOS-based switches and branch routers. Our Wi-Fi access points do not require either our switches or branch routers - they can be used with products from other major network hardware manufacturers. However, customers who purchase our access switches or branch routers gain the ability to manage them with their wireless access points through a single HiveManager interface.
Applications and Insights. Increasingly, our customers are looking for value from their network beyond just connectivity. Wireless networks collect enormous amounts of data about users and devices - where they are, how they are being used, how often they are on the network, etc. Our emerging capabilities provide access to this data to enable new business and IT applications. While in some cases we may develop and sell applications, such as HiveManager NG, our primary role is to enable third party software developers to create applications using our data. Such application may address a variety of use cases including:
• | Network Management. Tracking the behavior of the network to identify opportunities to improve performance. For example, our HiveManager NG application provides a simpler, more efficient way to manage a wireless and wired network. |
• | Network Access. Streamlining how access to the network is granted. For example, our personal device access capabilities can be integrated with an application to allow guests to register their devices on the network, then have their registration approved by an employee from his or her mobile phone. |
• | Business Insight. Tracking the presence and location of users and devices. For example, our presence data can be used to understand the behavior of consumers in a retail environment or when employees come to work in the office, or track student attendance. |
Application developers can take advantage of the Aerohive Cloud Services (ACS) platform. The ACS platform collects data from Aerohive network devices and, we expect in the future, from other vendor devices or other third-party sources. Collected data can be aggregated into a secure and scalable cloud-based store of big data, which then can be processed and made available externally via application programming interfaces (APIs) that we provide. Application developers can incorporate these APIs into their applications in order to receive data and analytics from us without needing to collect and process this data themselves. This approach means that the ACS platform has the extensibility to support additional use cases in the future. We expect to continue to expand the APIs and analytics that we make available from the ACS platform in order to encourage and enable an open application development environment to make possible compelling applications for our partners and customers.
Products
We offer our solution to end customers as a portfolio of products that includes our hardware products, cloud-based network management and applications, and support services.
Our hardware products include Wi-Fi access points, branch routers and access switches. Our hardware design team develops our hardware products by working in conjunction with original design manufacturer, or ODM, partners, and leveraging the latest commercially available and economically viable Wi-Fi radios, processors, and switching chips. Our Wi-Fi access points run our proprietary HiveOS operating system. We generally sell our access switches and branch routers in conjunction with a sale of Wi-Fi access points. We also sell our Wi-Fi access points for use with other manufactures access switches.
Our cloud-based product offering includes HiveManager, our network management application, and our Mobility Suite, which includes our Guest Access, Personal Device Access, ID Manager, and Social Login applications. As described above, we continue to invest in our cloud platform and applications, including our next-generation network management application, HiveManager NG.
We offer tiered maintenance and support services under renewable, fee-based maintenance and support contracts, which include technical support, bug fixes, access to priority hardware replacement service and unspecified upgrades on a when-and-if-available basis. Our Software as a Service, or SaaS, subscriptions include comparable maintenance and support services.
We continue to look for new ways to package and deliver our product to best address customer demand and market opportunity. In January 2017, we introduced a new Aerohive Connect product line targeting customers with simpler connectivity-oriented use cases. Aerohive Connect packages together one of our entry-level access points, either the AP122 or AP130, a simplified version of HiveManager, and community/email-based customer support into a single product offered at a lower list price. Aerohive Connect is offered as a complement to, not a replacement for, our current full offering which we now refer to as Aerohive Select. Aerohive Select remains our flagship solution capable of addressing the most complete and demanding enterprise network, deployment, and security requirements. Aerohive Connect customers can easily upgrade from
Connect to Select at any time with the purchase of an entitlement key that provides access to additional feature sets and support. We expect many customers who might otherwise not consider us to be attracted to the simplicity and low cost of Aerohive Connect but ultimately purchase Aerohive Select as a better match to their network requirements. Going forward we expect to look for other opportunities to package and monetize our product capabilities.
Segment and Geographic Information
We operate one reporting segment and operating segment structure. We present financial information about our operating segment and geographic areas in Note 10 to our Notes to Consolidated Financial Statements.
Customers
We sell our products through a network of authorized value-added resellers, or VARs, value-added distributors, or VADs, and managed service providers, or MSPs. Our products have been sold to over approximately 30,000 end-customers worldwide. We define end-customers as organizations holding or having held licenses to our products and software subscription and services. Our end-customers represent a broad range of industry verticals, including K-12 and higher education, distributed enterprises, retail and healthcare. In many cases, our target customers are installing a Wi-Fi network for the first time, or in parts of their organization that do not currently have Wi-Fi installed. In other cases, our customers already have a Wi-Fi network installed and our opportunity is to engage them in an expansion or replacement of their current solution.
Sales
We use channel partners to sell and deliver our solutions to our end-user customers, which we support through our sales organization. Our field-based regional sales organization supports large-account acquisition and overall market development. Our centrally based inside sales teams focus on the acquisition of mid-market accounts in both the Enterprise and State & Local Government/Education segments. Our channel sales team recruits and manages channel partners. Our sales engineers have responsibility for pre-sales technical support, solutions engineering for our end-customers, and technical training for our channel partners. We continue to evaluate and adjust our sales headcount in our principal and emerging markets based on a combination of our current sales results and future sales potential.
Our sales teams work with our channel partners who have networking, Wi-Fi and/or vertical market expertise to win and support end-customers through a direct-touch approach. Our VADs sell our products to and support our VARs, who then sell our products directly to end user customers, often with the addition of their own installation or professional services. We are increasingly working with MSPs, who bundle our product and service offerings with their own infrastructure and services to provide ongoing network operations and management to end-customers. This includes traditional VARs who are now expanding their services offering to include ongoing network management services.
We extend our sales capabilities through strategic alliances with companies such as Juniper Networks and Dell. Our business with and through Dell showed significant growth across 2016 and we expect this alliance to be a meaningful contribution to our business going forward.
Backlog
We typically accept and ship orders for product and related services within a short time-frame. However, our partners may reschedule orders without penalty or we may delay shipment due to inventory constraints. As such, we do not believe that our backlog at any particular time is a reliable indicator of future revenue.
Research and Development
Continued investment in research and development is critical to our business. To this end, we have assembled a team of engineers with expertise in various fields, including networking platforms, cloud operations and applications, security systems, RF functions, user-interface design and open-source programming. We currently conduct our research and development efforts in California, Oregon and China.
We have invested significant time and financial resources in the development of our products, including our ACS, HiveManager and our HiveOS platforms. We view continued investment in these capabilities as essential to our ability to differentiate ourselves in a competitive industry and to continue to be able to grow our business. For example, in 2015 we released HiveManager NG, our next-generation cloud services platform which provides a basis for data services and data analytic applications, and we released additional software modules to enhance the functionality and performance of our HiveOS operating system. In 2015, we announced our ACS platform which provides a secure and scalable cloud-based big data store for data collected from Aerohive network devices, other vendor devices, or other third-party sources, which can then be available to application developers to incorporate their API applications without needing to collect and process this data themselves. We also announced our Connected Experience platform that enables applications and insights that help our end-
customers' business and IT teams to unearth new data sources and opportunities for personalized access and engagement, increase productivity and efficiency and, ultimately, fuel a better customer experience, leading to business growth.
We plan to continue to expand our product offerings and solutions capabilities in the future to dedicate significant resources to these research and development efforts.
Manufacturing
We outsource the manufacturing of our hardware products to ODMs located in China and Taiwan. We believe that using original design manufacturers helps to optimize our operations by lowering costs, reducing time-to-market and enabling us to adjust to changing end-customer demand.
Our ODM partners ship finished products to our warehousing and delivery logistics centers in California and the Netherlands. We operate these logistic centers for all end-customer shipments, whether destined to locations in the Americas, Europe, the Middle East and Africa, or EMEA, or Asia Pacific and Japan, or APAC.
Our manufacturing partners procure components and assemble our products based on our demand forecasts. These forecasts represent our estimates at the time of future demand for our products, based upon historical trends and the assessment of our sales and product management functions of end-customer demand and overall market conditions.
Our ODMs source the component parts within our products. We do not contract directly and do not have any long-term manufacturing contracts that guarantee us any fixed access to such component parts or specific pricing. This absence of direct and long-term component supply contracts may increase our exposure to shortages of component availability and to price increases which the ODM or supplier may charge in response to increased product demand or fluctuations related to the raw material inputs for such components.
We continue to consolidate our manufacturing with our key manufacturers, and renegotiating those contractual relationships, to provide for longer termination notices and transition terms in the event we or they terminate our manufacturing relationship. We hope to increase our relative position and the significance of our relationships with those manufacturers, by concentrating our purchasing across a small number of manufacturers.
Competition
We operate in a competitive market for enterprise mobility and network-edge infrastructure, which continues to experience constant change and consolidation. Our competitors fall into two main groups:
• | General networking vendors, such as Cisco/Meraki, Hewlett-Packard/Aruba, and Brocade/Ruckus whose portfolios include enterprise mobility solutions and against whom we most commonly compete; |
• | Independent Wi-Fi vendors, such as Ubiquiti and Xirrus, whose primary focus is on wireless access products but who have a smaller presence among our target markets and against whom we less frequently compete. |
Trends in enterprise network infrastructures and mobility are all significantly increasing the importance of Wi-Fi to our target customers. As organizations address the proliferation of mobile devices, increased BYOD utilization, enterprise adoption of cloud and the adoption of mobile-first applications they compare competing wireless infrastructure produces, including:
• | ability to address specific customer use cases; |
• | ease-of-use and simplicity of solutions; |
• | price and total cost of ownership; |
• | flexibility and feature-depth of solutions; |
• | ability to meet deployment requirements; |
• | capability to support business or customer-facing applications; |
• | performance and scalability of products; |
• | network survivability and reliability of solutions; |
• | security of the network; and |
• | for service providers, the ability to support business/operating models. |
We believe that we generally compete favorably on the combined basis of all of these factors. However, many of our competitors have substantially greater financial, technical and other resources, greater name recognition, longer operating histories, larger sales and marketing budgets, broader distribution and established relationships with distribution partners and end-customers and larger and more mature intellectual property portfolios which provide a greater ability to assemble, market,
and aggressively price different capabilities across an integrated product platform. Other competitors are also working to grow their cloud networking capabilities, an area that has been one of our key differentiators.
Seasonality
See Item 7, "Management's Discussion and Analysis of Financial Condition and Results of Operations for information regarding seasonality of our business.
Intellectual Property
Our success depends in part upon our ability to protect our core technology and intellectual property. We rely on patents, trademarks, copyrights and trade secret laws, confidentiality procedures, and employee disclosure and invention assignment agreements to protect our intellectual property rights. As of December 31, 2016, we had 29 issued patents and 48 patent applications pending in the United States relating to our current and next-generation networking products, operating platform and cloud-based applications, and the ability to claim priority to most of the patent applications worldwide. Our first issued patents begin to expire in 2028. However, these patents or any patents that may issue to us in the future may be subject to re-examination, contested, circumvented, found unenforceable or invalidated, and we may or may not be able to prevent third parties from infringing them. We also license software from third parties for integration into our products, including open-source software. We believe our licenses are on commercially reasonable terms.
We utilize internal and external controls to restrict access to and use of our proprietary software and other confidential information, including contractual protections with employees, contractors, end-customers and channel partners. Our software is also protected by U.S. and international copyright laws. However, despite our efforts to protect our trade secrets and proprietary rights through intellectual property rights, licenses and confidentiality agreements, third parties may still copy our products or otherwise gain access to or obtain and use our proprietary software and technology without our knowledge or authority or in ways we do not intend.
Our industry is characterized by the existence of a large number of patents, and competitors increasingly may utilize litigation regarding patent and other intellectual property rights to protect or expand their market position. In particular, leading and more mature companies in the wireless networking industry have extensive patent portfolios and are regularly involved in both offensive and defensive litigation. As end customers increasingly use our products and services, and to the extent that we gain greater visibility and market exposure as a public company, we face a higher risk of being the subject of intellectual property infringement claims from third parties, not only from our competitors but also increasingly from non-operating entities, who will be more likely to claim that our platform infringes their proprietary rights, or to develop products and services that are similar to ours and that may infringe our proprietary rights. From time-to-time, such third parties, including certain of these leading companies and, increasingly, non-operating entities, may assert patent, copyright, trademark, and other intellectual property rights against us, our channel partners or our end-customers. In these instances, our standard license and other agreements may obligate us to indemnify our channel partners and end-customers against such claims. Successful claims of infringement by a third party could prevent us from distributing certain products or performing certain services, require us to expend significant management attention and money to develop non-infringing solutions or force us to pay substantial damages, royalties or other fees. This could include treble damages, if we are found to have willfully infringed patents or copyrights.
In addition, our products utilize software modules licensed to us by third-party authors under open-source licenses, including as incorporated into software we receive from third party commercial software vendors. Some open-source licenses contain requirements that we make available source code for modifications or derivative works we create based upon the type of open-source software that we use. If we combine our proprietary software with open-source software in a certain manner, we could, under certain open-source licenses, be required to release portions of the source code of our proprietary software to the public. This could allow our competitors to create similar products with lower development effort and time, and ultimately could result in a loss of product sales for us.
We cannot assure that we do not currently infringe, or that we will not in the future infringe, or that we can resolve through litigation or on reasonable settlement terms, any such claims against us relating to any third-party patents or other proprietary rights, including relating to use of third-party open source software. See “Part I, Item 3 - Legal Proceedings” and “Part I, Item 1A - Risk Factors-Claims by others that we infringe their proprietary technology or other rights could harm our business” for additional information.
Employees
As of December 31, 2016, we had approximately 620 employees in offices in the Americas, EMEA and APAC. None of our employees is represented by labor unions, whether in the United States or abroad. We consider all current employee relations to be good. However, we continue to see employee turn-over, particularly amongst our employees in Silicon Valley where competition is typically high for sales and engineering personnel, and in Hangzhou China, where we currently maintain our principal research presence, where competition is high for highly skilled product development and engineering personnel.
Corporate Information
In March 2006, we incorporated our business in the State of Delaware. Our principal executive offices are located at 1011 McCarthy Boulevard, Milpitas, CA 95035. Our telephone number at that location is (408) 510-6100. Our website address is www.aerohive.com. Information on our website is not part of this prospectus and should not be relied upon in determining whether to invest in our common stock.
We are an emerging growth company as defined in the Jumpstart Our Business Startups Act of 2012, or JOBS Act. We will remain an emerging growth company until the earlier of (1) the last day of the fiscal year (a) following the fifth anniversary of our initial public offering, (b) in which we have total annual gross revenue of at least $1.0 billion, or (c) in which we are deemed to be a large accelerated filer, which means the market value of our common stock that is held by non-affiliates exceeds $700 million as of the prior June 30th, or (2) the date on which we have issued more than $1.0 billion in non-convertible debt securities during the prior three year period.
Website Posting of SEC Filings
We make available on our website, free of charge, our annual reports on Form 10-K, quarterly reports on Form 10-Q, current reports on Form 8-K and amendments to such reports, as soon as reasonably practical after we electronically file or furnish them with the SEC. You can access these reports and amendments by clicking on the “Company/Investor Relations” tab. Further, you may read and copy these materials we file with the SEC at the SEC’s Public Reference Room at 100 F Street, NE, Washington, D.C. 20549. You can obtain information on the operation of the Public Reference Room by calling the SEC at 1-800-SEC-0330. The SEC maintains an internet site that contains reports, proxy and information statements and other information regarding our filings at www.sec.gov. The contents of our website are not incorporated into, or otherwise to be regarded as a part of, this report or any other report we file with or furnish to the SEC.
Investors and others should note that we announce material financial information to our investors using our website (http://www.aerohive.com), and specifically its Investor Relations Home page (http://ir.aerohive.com). This includes news and commentary about our business and financial performance, SEC filings, notices of investor events, press and earnings releases, and public conference calls and webcasts. We use these channels as well as social media to communicate with our investors and the public about our company, our services and other issues. We also provide corporate governance information, including our corporate governance guidelines, board committee charters, and code of conduct, on the Investor Relations Home page of our website under the heading “Corporate Governance.” It is possible that this information as well as information we post on social media could be deemed to be material information. Therefore, we encourage investors, the media, and others interested in our company to review the information we post on our website and social media channels. However, the contents of our website and information we may post on social media channels are not incorporated by reference into this Annual Report on Form 10-K or in any other report or document we file with the SEC, and any references to our website or social media channels are intended to be inactive textual references only.
ITEM 1A. RISK FACTORS
In evaluating Aerohive and our business, you should carefully consider the risks and uncertainties described below, together with all of the other information in this report, including our consolidated financial statements and related notes. The risks and uncertainties described below are not the only ones we face. If any of the following or other risks occur, our business, financial condition, operating results, and prospects could be materially harmed. In that event, the price of our common stock could decline, and you could lose part or all of your investment.
Risks Related to Our Business
We have a history of losses and we may not achieve profitability in the future.
In February 2016, we indicated that we believe we can achieve quarterly non-GAAP operating profitability in 2016, based on revenues in the range of $50 million to $51 million, and that we expect to meet this objective through a combination of revenue growth and controlled operating expenses. In February 2017, we indicated that we have taken actions to reduce our ongoing operating expenses that we believe positions us to achieve non-GAAP operating profitability at $45 million quarterly revenue. Nonetheless, we have a history of losses and we have never achieved profitability on a quarterly or annual basis, and we cannot predict with certainty whether or when we might be profitable in the foreseeable future, even at these revenue levels. We experienced net losses on a GAAP basis of $29.0 million, $44.2 million and $36.9 million for fiscal years 2014, 2015 and 2016, respectively. As of December 31, 2016, our accumulated deficit was $227.3 million. We expect to continue to incur expenses associated with the continued development and expansion of our business, including expenditures to hire additional personnel: specifically, personnel costs relating to sales and marketing and engineering, and investments in channel and product development and support. As such, we may not control our expenses sufficiently to achieve operating profitability on a non-GAAP basis even if we achieve quarterly revenue in the indicated range. If we fail to increase our revenue and manage our cost structure, we may not achieve or sustain profitability in the future. Once achieved, we may not be able to sustain or increase our profitability, at all or at levels our investors or industry analysts expect, or we may choose to continue to make investments in our operations which we feel will promote long-term growth but which will reduce near-term profitability. This could also require us to continue to use available cash to support our investments and ongoing operations. As a result, our business and prospects, and how investors view and value our common stock, would be harmed.
It is difficult for us to evaluate our prospects and future financial results, which may increase the risk that we will not be successful.
It is difficult for us to forecast our future operating results. Our prospects should be considered and evaluated in light of the risks and uncertainties frequently encountered by companies similarly with limited operating histories. These risks and difficulties include challenges in accurate financial planning as a result of limited historical data and the uncertainties resulting from having had a relatively limited time period in which to implement and evaluate our business strategies as compared to more mature companies with longer operating histories.
Our operating results may fluctuate significantly from period to period, which makes our future operating results difficult to predict and could cause our operating results in any particular period or over an extended period to fall below expectations of investors or analysts.
Our operating results have fluctuated significantly in the past and we expect will continue to fluctuate significantly in the future. In particular, the timing and size of sales of our products and services, including results across regions, are highly variable and difficult to predict and can result in significant fluctuations in our revenue from period to period. Other participants in our industry have also experienced these fluctuations. As a result, our future results in any particular period or over any extended period may be difficult for us, our investors and analysts to predict.
In addition, our planned expense levels depend in part on our expectations of future revenue. We may choose to increase levels of investment in areas such as R&D and sales and marketing, despite near-term fluctuations in revenue, in order to position us for continued growth. We also may reduce product prices in order to increase revenue growth and/or penetration of our products into targeted verticals. For example, in January 2017, we announced HiveManager Connect, a simplified version of HiveManager NG included as part of our new Aerohive Connect product line designed for customers with less complex connectivity-oriented requirements. Under the Aerohive Connect program, customers may purchase our entry-level access points, such as currently either the AP122 or AP130, at lower list prices. It may be difficult and take time for us to adjust expenses sufficiently to compensate for a shortfall in revenue, even when we may anticipate the shortfall. In such instances, even a small shortfall or seasonal fluctuation in revenue could disproportionately and adversely affect our overall revenue, operating margin, operating results and use of cash for a given quarter.
Our operating results may also fluctuate due to a variety of other factors, both within and outside of our control and which we may not foresee, or which we may foresee but not effectively manage, including the changing and volatile domestic
10
and international economic environments, and demand for our products in general and from any particular vertical which may be a target market for our products, and any of which may cause our stock price to fluctuate. In addition to other risks listed in this “Risk Factors” section, factors that may affect our operating results include:
• | fluctuations in demand for our products and services, including seasonal variations, especially in the education vertical where purchasing in the United States has typically been stronger in the second and third quarters and weakest in the first and fourth quarters, and where purchasing at any time may depend on the availability of funding, including fluctuations based on the timing and availability of funding for schools under the FCC’s E-Rate program and the decisions of schools to defer purchases in anticipation of the availability of such funding or due to a decision to delay product deployments; |
• | the sequential seasonal expansion of our operating performance typically from the first quarter to the second quarter, and our ability to sustain that expansion in subsequent quarters; |
• | our ability to forecast and provide guidance to our investors and industry analysts regarding our revenue and operating results in any particular period, or to achieve results consistent with the guidance we provide; |
• | our ability to control operating expenses in order to achieve non-GAAP operating profitability at $45 million of revenue in any particular quarterly period; |
• | our ability to hire, train, develop, integrate and retain a sufficient number of skilled sales and engineering employees to support our continued growth, (including, specifically, in Silicon Valley, Portland, Oregon and Hangzhou, China, and to replace turn-over of our employees in these functions and locations); |
• | the complexity, length and associated unpredictability of our sales cycles for our products and services; |
• | changes in end-customers’ budgets for technology purchases and delays in their purchasing decisions and cycles; |
• | technical challenges in end-customer networks, which may be unrelated to our products, which could delay adoption and installation and impact the operation of our products and purchases of our services; |
• | delay in development and availability of component parts needed for development and timely introduction of our next-generation products and product features; |
• | our ability to develop, increase and sustain sales capacity across all our sales territories; |
• | changes in the competitive dynamics of our target markets, including new entrants, further consolidation and pricing trends; |
• | variation in sales channels, product costs, prices or the mix of products we sell; |
• | our contract manufacturers’ and component suppliers’ ability to meet our product demand forecasts on time, at acceptable prices, or at all, particularly with respect to our newer products; |
• | our ability to develop and make more productive relationships with our channel and strategic partners, including specifically Dell, and such partners’ ability to effectively develop sales opportunities for us and distribute our products; |
• | the timing of our product releases or upgrades by us or by our competitors, such as next-generation products or product features; |
• | delays in new product introductions and our ability to manage the transition from existing products and operating platforms to new products and platforms and to support and improve such products after introduction, including, specifically, delays in our development of and transition of end customers to our HiveManager NG platform; |
• | our ability to introduce and expand our HiveManager Connect product line and to manage customer and market transition to this new product line and pricing platform while maintaining levels of revenue, gross margin and operating performance which we or our investors and analysts expect; |
• | our ability to successfully expand the suite of products we sell and services we offer to existing end-customers and channel partners, to manage the transition of our end-customers to these new products and services, including transition timeline of our end-customers to HiveManager NG, and to limit disruption to our end-customers’ ordering practices and the pricing environment for our legacy products and services; |
• | the potential need to record additional inventory reserves for products that may become obsolete or slow moving due to our new product introductions, changes in end-customer requirements, new competitive product or service offerings or our over-estimation of demand for such products as of any particular period; |
• | our decision to continue or increase our investments in sales, marketing, engineering and other activities in response to changes in the marketplace or perceived marketplace opportunities or in anticipation of or to position us for future growth; |
11
• | our ability to control costs, including our operating expenses and the costs of the components we purchase while continuing to derive benefits from our investments in sales, marketing, engineering and other activities; |
• | the continuing strength of the U.S. dollar relative to the currencies of the countries of our VADs or end-customers who purchase our products, or of our contract manufacturers or the component suppliers to our contract manufacturers, may require us to reduce pricing for our products outside the United States in order to maintain sales and revenue performance, or raise the cost we must pay to our manufacturers for our products, resulting in either case in lower revenue and/or gross margins for those products; |
• | growth in our headcount, including hiring related to our status as a public company and hiring to support any future growth in our business, especially skilled sales and engineering employees; |
• | volatility in our stock price, which may lead to higher stock compensation expenses or harm our ability to effectively attract, incentivize and retain our employees using stock-based compensation; |
• | the ability of our competitors, including those with greater financial resources, to introduce new products, product features and services more quickly and in response to end-customer demand and to drive down pricing on our products and services, which could materially reduce our revenue and gross margins; |
• | our ability to achieve as of any particular period or over time a level of financial performance consistent with the expectations of our investors and industry analysts; and |
• | general economic or political conditions in our domestic and international markets. |
The effects of these factors individually or in combination, create unpredictability in our operating results, our ability to forecast those results and our ability to achieve those forecasts. As a result, you should not rely on our past results as an indication of our future performance and comparing our operating results on a period-to-period basis, or anticipating our future results based on our public forecasts may not be meaningful. This variability and unpredictability could also result in our failing to meet the expectations of our investors or financial analysts for any period. We may release guidance in our quarterly earnings conference calls, quarterly earnings releases, or otherwise, based on management predictions, which are necessarily speculative in nature. Our guidance may vary, and has varied, materially from actual results. For example, on October 13, 2016, we provided preliminary revenue for our third quarter ending September 30, 2016 and a preliminary revenue outlook for our fourth quarter ending December 31, 2016, which we further discussed on our November 2, 2016 earnings call. Our third quarter revenue was below the estimates of financial analysts at that time, as was the revenue outlook we provided at that time for our fourth quarter. On February 14, 2017, we announced our revenue results for our fourth quarter of fiscal 2016, which was below the revenue outlook we had provided for the period in November 2016. Similarly, on February 11, 2015, we provided a guidance range for revenue for our first quarter ending March 31, 2015, which was below the estimates of financial analysts at that time. On April 13, 2015, we provided a revised lower guidance range for our revenue for the quarter. In each of these instances, we believe that lower-than-expected U.S. education business during the quarter were primary drivers of our lower revenue performance and outlook. If our revenue or operating results, or the rate of growth of our revenue or operating results, fall below the expectations of our investors or financial analysts, or below any forecasts or guidance we may provide to the market, or if the forecasts we provide to the market are below the expectations of analysts or investors, the price of our common stock could decline substantially. Such a stock price decline could occur even when we have met our own or other publicly stated revenue or earnings forecasts. Our failure to meet our own or other publicly stated revenue or earnings forecasts, or even when we meet our own forecasts but fall short of analyst or investor expectations, could cause our stock price to decline and expose us to costly lawsuits, including securities class action suits. Such litigation against us could impose substantial costs and divert management’s attention and resources.
Our results are subject to quarterly seasonal variances, which make it difficult to compare or forecast our financial results on a quarter-by-quarter basis.
Our revenue fluctuates on a seasonal basis, which affects the comparability of our results between periods. For example, our total revenue has historically decreased from our fourth quarter to the first quarter of our next fiscal year due to seasonal buying patterns and budget cycles within both our education vertical and general enterprise end-customers. Demand in the education vertical tends to be weakest in the first and fourth quarters. However, we also historically have seen a sequential increase in end-of-year purchases by enterprise customers in our fourth quarter, which we believe is mainly due to an expectation to complete purchases within their calendar-year budget cycle. These seasonal variations are difficult to predict accurately and at times may be entirely unpredictable. In addition, the typical sequential expansion of our operating performance from the first quarter to the second quarter can create execution, delivery and product support challenges in subsequent quarters. Our ability to sustain that expansion in subsequent quarters, particularly in our less-developed sales territories, introduces additional risk into our business and our ability to accurately provide our own publicly stated revenue and earnings forecasts. In addition, we rely upon forecasts of end-customer demand to build inventory in advance of anticipated sales. We believe our seasonal business pattern has become more difficult to predict, making it more difficult for us to forecast product demand, inventory requirements and our financial results, including on a quarter-to-quarter basis. Moreover, part of our
12
strategy is to increase our sales in non-education verticals, and if our sales mix changes the seasonal nature of our revenue may change in an unpredictable way, which could increase the volatility of both our financial results and stock price.
The market and demand for our products and services may not develop as we expect.
Our year-over-year revenue grew 12% from 2015 to 2016, 10% from 2014 to 2015, 28% from 2013 to 2014 and 50% from 2012 to 2013. The slowing rate of our revenue growth may continue as the general demand for wireless networking in the industry verticals that we target, or demand for our products in particular, may grow at a slower rate than we anticipate or not at all.
Part of our strategy depends upon expanding sales of our cloud-managed wireless networking, switching and routing products to medium and large enterprise headquarters, branch offices and teleworkers. We intend to continue to direct resources to improve HiveManager NG, our next-generation cloud services platform, as the basis for data services and data analytics applications. Sales of such products, services and applications to enterprise end-customers typically require long sales cycles and are subject to price sensitivity. Moreover, many potential end-customers in the enterprise market have substantial network expertise and experience, which may require a more-costly and sophisticated marketing and sales strategy. It is unclear whether our end-customers will pay for data analytics or other SaaS services we expect to provide or, instead, require us to provide them as enhancements to our support offerings (at no cost to them or incremental revenue to us).
In January 2017, we announced HiveManager Connect, a simplified version of HiveManager NG included as part of our new Aerohive Connect product line designed for customers with less complex connectivity-oriented requirements. Under the Aerohive Connect program, customers may purchase entry-level access points, such as currently either the AP122 or AP130, with a simplified version of HiveManager, and community/email based customer support, at lower list prices. It is unclear whether our customers will choose the simplified Connect product offering, even at the lowest list prices offered, as an alternative to our current offering, or whether we will be able to manage the transition amongst our customers and in our market to our Connect offering.
If our competitors offer services or provide technologies or application platforms superior to our current cloud-managed platform, or the new products and services we introduce, alone or as part of a more-integrated offering or at reduced pricing, it would have a material adverse effect on our business, operating results and financial condition. As a result, demand for our products, services and applications may not continue to develop as we anticipate, or at all. In addition, if new customers do not purchase our Connect products, or having purchased our Connect products do not also purchase subscriptions to our Select offering, or if our existing customers migrate toward Connect products without also continuing to purchase our Select-level services and support offerings, in each case at all or at the levels we assume, our overall revenue, operating performance and margins could decline, perhaps significantly, making more difficult our ability to demonstrate growth and achieve profitability at expected revenue levels and the value of our stock could decline.
A significant portion of our sales is concentrated in the education vertical, which may cause us to have longer sales cycles, and be subject to program funding uncertainties and constraints.
A significant portion of our revenue is concentrated in the education vertical. The majority of our sales in education is concentrated in both public and private K-12 institutions. This vertical is characterized by long sales cycles and often requires additional sales efforts. In addition, this vertical typically operates on limited budgets, and depends on annual budget approvals, which add additional uncertainty to the sales cycle. For example, the U.S. federal government is providing supplemental funding to local school districts in conjunction with its E-Rate initiative to assist districts to upgrade their technical infrastructure, including Wi-Fi infrastructure. The announced incremental federal funding is significant and available over a five-year period, which began in the second half of 2015. However, this program continues to be subject to uncertainty regarding its eligibility criteria, the timing and specific amount of federal funding actually available during each annual funding cycle, and federal program guidelines and funding appropriations, each of which can change from year-to-year. Corresponding funding appropriation by respective states and local districts is also uncertain and, even upon such appropriation, local districts must still then submit and have approved applications consistent with the final timing and eligibility requirements of the federal program for that annual funding cycle. We also believe that the prospect of federal funding available each annual cycle continues to cause some K-12 institutions to delay or defer near-term transactions they might otherwise make during the cycle to purchase our products.
Purchases made by schools before April 1, 2015 were not eligible for E-Rate funding and actual E-Rate funding was not released to schools and libraries to fund transactions until after July 1, 2015. In order to be eligible for funding during a particular annual funding cycle the schools and libraries must then receive a Funding Commitment Decision Letter. We believe that based on the availability of this federal funding end-customers in the education vertical typically defer purchases until they secure E-Rate funding and receive a specific funding commitment letter. As a result, beginning in 2015, E-Rate amplified the historical sequential decline in product revenue we previously experienced from the fourth quarter into the first quarter and shifted spending from the first half of the year into the second half of the year, and even into the following year. We believe
13
that in our fiscal 2015, this caused increased seasonal variations in demand for our products and services in the education vertical, making it more difficult to forecast our operating performance and achieve revenue and other operating results based on those forecasts. For example, the sales results for our first fiscal quarter 2015 were below expectations, primarily due to a pause in demand in U.S education business due to such various aspects and timing of the federal E-Rate program. We also saw K-12 spending shift during the 2015 annual funding cycle from the first half of the year into the second half of the year, and into our fiscal 2016 as well. We believe such deferrals and delays continued during the 2016 annual E-Rate funding cycle.
In 2016 E-Rate cycle, USAC also experienced significant administrative challenges that led them to extend the period for schools to submit Form 471 funding requests, and that led many schools to abandon their Form 470 bid requests or not submit their Form 471 funding requests in the first instance. Based on publicly reported information, the total value of submissions of Form 471 funding requests for "Category 2" projects in the 2016 funding cycle was 17% below the total value of funding requests submitted in the 2015 funding cycle. Aerohive increased its reported share of the funding requests for Wi-Fi products from 10% in 2015 to 11% in 2016; however, due to the overall reduction in funding requests, total Aerohive-related awards in 2016 were 12% lower than the 2015 funding cycle. Further, USAC continues to report significant delays in its ability to process and fund such requests during the 2016 funding cycle, causing the pace of release of approved funds and resulting availability of those funds to schools to be significantly lower than in 2015. For example, as of the end of third quarter, E-Rate program funding approvals were running nearly 70 percent below the pace of approvals over the same period in 2015.
On October 13, 2016, we provided preliminary revenue for our third quarter ending September 30, 2016, and a preliminary revenue outlook for the fourth quarter ending December 31, 2016, which we discussed further on our November 2, 2016 earnings call. Our third quarter revenue and fourth quarter outlook were below the estimates of financial analysts at that time. On February 14, 2017, we announced our revenue results for our fourth quarter fiscal 2016, which were below the revenue outlook we had provided for the period in November 2016. We believe that the significantly slower pace of E-Rate funding approvals we experienced was one of the primary drivers of our weaker-than-expected order volume and lower revenue performance in the third quarter and lowered revenue outlook for our fourth quarter. We expect these delays, deferrals and lower levels of E-Rate-funded transactions to continue into 2017. These are specific examples of the many factors which add additional uncertainty to our future revenue from our educational end-customers.
Our sales cycles often require significant time, effort and investment and are subject to risks beyond our control.
Our sales efforts can take several quarters, and involve educating our potential customers about the applications and benefits of our products, including the technical capabilities of our products and associated applications and services, and recruiting and developing our channel partners. In our territories that experience turn-over, we may experience slower-than-expected sales productivity. We continue to invest in these territories, but such further investment may take significant time and effort in order to realize growth. As we respond to turn-over, newly hired personnel may also require several quarters to gain experience and develop their territories before achieving capacities we have assumed in our sales forecasts. Sales to the education vertical are an important channel for us, and can involve an extended sales cycle. In addition, sales to our enterprise customers may also involve an extended sales cycle, and often initial purchases are small. Purchases of our products are also frequently subject to our end-customers’ budget constraints, multiple approvals, unplanned administrative processing and other risks and delays. Such end-customers, in particular larger enterprise customers, also may hesitate to place orders with us, instead preferring our larger and longer-established competitors. In addition, the evolving nature of the market may lead prospective end-customers to postpone their purchasing decisions pending resolution of wireless networking or other standards, or wait for adoption of technology developed by others. We pay our sales staff commissions upon receiving orders; however, we typically recognize revenue on products only after the products are shipped to end-customers, or not until certain other terms of sales are satisfied. As a result, some of the cost of obtaining sales, including manufacturing costs and expenses, may occur in a fiscal period prior to the fiscal period in which we may recognize revenue from the sale, which may cause additional fluctuations in our operating results and cash flows and balances from quarter to quarter.
We need to develop new products and continue to make enhancements to our existing products to remain competitive in a rapidly changing market.
The technology and end-customer demands in the wireless networking market change rapidly, which requires us to continuously develop and release new products and product features and associated applications and services. We must continuously anticipate and adapt to our end-customers’ needs and market trends, and continue to make investments to develop or acquire new products, applications and services that meet market demands, technology trends and regulatory requirements. If our competitors introduce new products, applications and services that compete with ours, we may be required to reposition our product offerings or introduce new products in response to such competitive pressure. We may also offer products and services, and/or combinations thereof at lower price points in order to broaden our penetration in the enterprise market.
Developing our products is challenging and involves substantial commitment of resources and significant development risk. Each phase in our product development presents serious risks of failure, rework or delay, any one of which could impact
14
the timing and cost-effective development of products, and each of which could affect our ability to take advantage of a business opportunity or could jeopardize end-customer acceptance of the product. Compared to our larger and longer-established competitors, our ability to develop and timely deliver new products and product functionality is limited. We also have experienced in the past and may in the future experience design, manufacturing, marketing and other difficulties that could delay or prevent the development, introduction or marketing of new products and enhancements. For example, we are currently developing and bringing to market the next-generation versions of our Wi-Fi hardware, including our .11ac “Wave 2” products, Ethernet switches and our HiveManager NG cloud services platform providing cloud-delivered network management applications and on-premises network management, as well as supporting data structures, analytics and APIs. For example, in our third quarter of 2016, we introduced our AP550 access point, which features specifically designed for high-density and high performance requirements of enterprise environments. We also recently announced programs to develop new data analytics services and API platforms. These are complex technical undertakings and subject to many variables and risks of delay. For example, we announced in August 2015 that our Wave 2 .11ac products, which we had expected to be commercially available in the second half of 2015, would be delayed until the first quarter of 2016. This was due to limited availability in component parts that affected availability of our AP250 access point and the ability of our manufacturing partner and component suppliers to timely deliver sufficient quantities of this product consistent with our demand and sales forecasts. Similarly, our timeline to transition new and existing end customers to HiveManager NG and make our cloud services platform and applications available to customers in either a subscription public cloud or on-premises private cloud deployment has been delayed and we are now targeting completion for late-2017. This development timeline has also delayed our ability to demonstrate full feature and functional compatibility of this platform across certain other products, including specifically our new switch products. This affected revenue from our switch products which we expected in the second half of our 2016 fiscal year.
If we fail to develop new products, product enhancements applications or services, or fail effectively to manage the transition of our end-customers to these new products, product enhancements, applications or services, or our end-customers or potential end-customers do not perceive our products, product enhancements, applications or services to have compelling technical or cost-based advantages, our business and prospects could be adversely affected, particularly if our competitors are able to introduce solutions at lower prices and/or with increased functionality. For example, in January 2017, we announced HiveManager Connect, a simplified version of HiveManager NG included as part of our new Aerohive Connect product line designed for customers with less complex connectivity-oriented requirements. Under the Aerohive Connect program, customers may purchase entry-level access points, such as currently either the AP122 or AP130, with a simplified version of HiveManager, and community/email based customer support, at lower list prices. It is unclear whether new customers will purchase our Connect products, or having purchased our Connect products will also purchase subscriptions to our Select offering, or whether our existing customers will continue to purchase our Select-level services and support offerings, in each case at all or at the levels we assume. If our customers, both new and existing, choose the simplified and lower-priced Connect product offering, as an alternative to our current Select offering, we could see a mix-shift in favor of these product offerings, thus reducing overall revenue, gross margins and ability to achieve profitability. In addition, the introduction of new or enhanced products requires that we carefully manage the transition from older products to minimize disruption in customer ordering practices, and ensure that new products can be timely delivered to meet our end-customers’ demand and to limit inventory obsolescence. Further, after delivery of new products we may identify and must timely address performance issues as the products are used in the field in a particular environment or at scale which we could not replicate or did not anticipate during development. Our end-customers may also defer decisions to purchase our existing products in anticipation of our expected release of a next-generation product. We also may not correctly anticipate customer interest in or demand for our data analytics services or API platforms, or our customers may expect that we provide these additional services as part of our existing product support (and at no cost to them or incremental revenue to us). If we do not carefully manage the timing of our new products or product feature releases, and effectively support the new products and product feature releases, we could interfere with our end-customers’ purchases and disrupt the pricing environment for our new and legacy products, which could drive down our revenues and operating margins. For example, we believe that we introduced our new HiveManager NG product to some of our larger and more complex customers before its feature set was able to fully address their requirements, which resulted in elongated sales cycles and reduced revenue opportunities, which specifically contributed to our lower revenue performance in the fourth quarter and our outlook for the first quarter of our fiscal year 2017. We believe that the lengthier sales cycle associated with our HiveManager NG offering, and its impact on our revenue opportunities and operating results will continue into 2017. As a result, we may not be successful in modifying our current products or introducing new products in a timely or appropriately responsive manner, or at all. If we fail to address these changes successfully, our business and operating results and prospects would be materially harmed.
Our gross margin will vary over time and may decline in the future.
Our gross margin was 67.4%, 66.8% and 67.4% for fiscal years 2016, 2015 and 2014, respectively. Our gross margin will vary over time, may be difficult to predict and may decline in future periods. Our gross margin also varies across our product lines and, therefore, a change in the mix of products our end-customers purchase in any period would likely have a significant impact on our overall gross margin in the period. We may face additional competition for these products, either by
15
introduction of new products by new or existing competitors, or by our end-customers using lower-priced products, including our own, which are becoming increasingly more sophisticated.
In addition, the exchange rate of the U.S. dollar relative to foreign currencies continues to be strong, which may require us to reduce pricing for our products outside the United States in order to maintain sales and revenue performance, or incur higher manufacturing costs, each of which would lower gross margins for those products.
The market for wireless networking products is also characterized by rapid innovation and declining average sales prices as products mature in the market place. Even if we are successful in launching new products, competition may continue to increase in the market segments in which we compete, which would likely result in increased pricing competition. To retain our average gross margin, we are required to continuously update our products and introduce new products and reduce our manufacturing costs and expenses, and we could fail to accomplish this. In addition, the sales prices for our products and services may decline for a variety of reasons, including sales strategy, competitive pricing pressures, customer demand, discounts, a change in our mix of products and services, including seasonal changes in our end-customers’ ordering practices, anticipation of the introduction of new products or services and decisions by end-customers to defer purchases, or promotional programs. For example, we may introduce new products or offerings, such as we did with our AP230 access point which we announced in April 2014, at lower price points than competitive offerings or our own legacy offerings to help drive the adoption of our new products and this may adversely affect our revenues and operating margins. In January 2017, we announced HiveManager Connect, a simplified version of HiveManager NG included as part of our new Aerohive Connect product line. Under the Aerohive Connect program, customers may purchase entry-level access points at lower list prices. Larger competitors, such as Cisco/Meraki, Hewlett-Packard/Aruba, Brocade/Ruckus and Ubiquiti Networks, each with significantly greater financial, sales, engineering resources and/or more diverse product and service offerings may reduce the price of their products or services that compete with ours or may bundle them with other products and services. If we do not similarly reduce our product manufacturing costs, or if we reduce our prices for such products or services in order to remain competitive, our gross margin and revenue will decline. Any such declines in our gross margins or revenue could have an adverse impact on the value of our common stock.
As a result of being a public company, we need to further develop and maintain our internal control over financial reporting. If our internal control over financial reporting is not effective, it may adversely affect investor confidence in our company.
We are required, pursuant to Section 404 of the Sarbanes-Oxley Act, to furnish a report by management on, among other things, the effectiveness of our internal control over financial reporting, which would include a disclosure of any material weaknesses identified by our management in our internal control over financial reporting.
We continue to develop our system and documentation necessary to perform the evaluation needed to comply with Section 404. We may not be able to complete on an annual and ongoing basis our evaluation, testing and any required remediation in a timely fashion. During the evaluation and testing process, if we identify one or more material weaknesses in our internal control over financial reporting, we will be unable to assert that our internal controls are effective. Further, our independent registered public accounting firm is not required to report on the effectiveness of our internal control over financial reporting until the later of the year following our first annual report required to be filed with the SEC, or the date we are no longer an "emerging growth company," as defined by the Jumpstart Our Business Startups Act of 2012, or the JOBS Act. At such time, our independent registered public accounting firm may issue a report that is adverse in the event it is not satisfied with the level at which our controls are documented, designed or operating.
We cannot be certain that we will not discover, or that we will timely discover, material weaknesses or control deficiencies in the future. If our remediation efforts are not successful or other material weaknesses or control deficiencies occur in the future, we may be unable to report our financial results accurately or on a timely basis, which could cause our reported financial results to be materially misstated and result in the loss of investor confidence or delisting and cause the trading price of our common stock to decline. If we are unable to conclude that our internal control over financial reporting is effective or, if our independent registered public accounting firm is unable to express an opinion on the effectiveness of our internal controls when it is required to do so by the applicable rules, we could lose investor confidence in the accuracy and completeness of our financial reports, which could cause the price of our common stock to decline, and we may be subject to investigation or sanctions by the SEC. We would also be in violation of certain covenants under our debt facilities, which could accelerate payment obligations and/or increase our borrowing costs significantly.
Our products utilize cloud-managed solutions, and our future growth relies in significant part in continued demand for cloud-managed solutions and our ability to develop and deliver such services.
Most of our end-customers utilize our cloud-managed networking platform to access our applications through the Internet, rather than access our application through a physical device or virtual machine that our end-customers host on their premises. As our business grows, we must increase the capacity of our cloud-managed solutions and continue to develop new
16
and innovative solutions that meet the needs of our end-customers. Demand for our cloud-managed solutions could decline if we are not able to offer sufficient capacity or if confidence in the security of cloud-managed solutions in general, or our platform in particular, were to decline. In addition, a significant feature of our platform will increasingly be the ability to collect and analyze user data through applications specific to particular industry vertical and use cases. Regulatory changes relating to the use of end-customer data, including requirements relating to data privacy and security, or shifting societal norms regarding data privacy and security, could affect market demand for, and our ability to deploy, our platform. Moreover, although our end-customers do not immediately lose network functionality if cloud-connectivity fails, if our ability to deliver services through the cloud were interrupted repeatedly or for an extended period, our reputation could be damaged and confidence in our platform would likely decline, causing our revenue to decline.
We plan to target new industry verticals and geographies to diversify our end-customer base and expand our channel relationships, which could result in higher research and development and sales and marketing expenses, and which may not be successful and could reduce our operating margin.
Part of our strategy is to target new industry verticals and geographies. Currently, we focus a significant portion of our business on the education and retail verticals, and to a lesser extent healthcare, which may depend on developing new products targeted to such sectors. Specifically, we intend to invest in the development of data applications and analytics capabilities which we feel may be attractive to our end-customers, particularly in the retail vertical. In addition, we also plan to continue to expand to additional countries beyond those in which we currently operate. We also intend to invest in existing and new channel relationships to reach additional end-customers to further diversify our revenue base. Targeting new industry verticals and geographies and developing customized products, data applications and partnerships, including our channel partners, targeting these industry verticals and geographies may be expensive, require us to attract, train, develop, integrate and retain qualified employees and key sales personnel, and increase our research and development costs, as well as our sales and marketing expenditures. We may need to develop new product features or target new market segments, which could divert resources and attention from our existing products and target markets. We must also further develop and make more productive relationships with our channel partners and our channel partners’ ability to effectively market, distribute and support our products, which require specific investments and additional dedicated resources. Because we have limited experience in developing and managing such channels and markets, we may not be successful in further penetrating certain geographic regions or reaching a broader customer base. Failure to develop or manage additional sales channels effectively would limit our ability to succeed in these markets and could adversely affect our ability to grow our business.
We announced in April 2015 a new relationship with Dell Inc., whereby Dell became a reseller of Aerohive’s Wi-Fi and cloud services. In February 2016, we announced a partnership with SYNNEX Corporation, as a value-added distributor of our products in the United States and Canada. To support these relationships, we will need to continue to identify and invest in additional and dedicated resources and, potentially, new product, service and support offerings, which could distract management’s attention and divert existing resources from our current business. We do not know if we will be successful in any of these efforts, or whether the level of success we achieve will justify the additional spending and specific investments and dedicated resources required. It will also take time for us to fully realize the benefits from our continued relationship with Dell. If our channel partners fail to effectively market, distribute and support our products, or if our channel strategy, or particular channel partner initiatives or investments, such as with Dell or others we may identify, are otherwise unsuccessful, our revenue performance and operating margin would be harmed, which could adversely affect the value of our common stock.
We base our inventory purchasing decisions on our forecasts of customers’ demand, and if these forecasts are inaccurate our revenue, gross margin and liquidity could be harmed.
We place orders with our manufacturers based on our forecasts of our end-customer demand. We base our forecasts on multiple assumptions, including internal and channel partner sales forecasts, each of which may cause our estimates to be inaccurate, affecting our ability to fulfill demand for our products. When demand for our products increases significantly, we may not be able to meet demand on a timely basis, or we may incur additional expediting costs to assure we meet demand. If we underestimate demand, we may forego revenue opportunities, lose market share and damage our reputation and our relationship with our channel partners and our end-customer relationships. Conversely, if we overestimate demand, we may purchase more inventory than we are able to sell at any given time, or at all, which would increase our reserves and risk of potential write-offs.
Our value-added distributors' stock inventory of our products, and are entitled in certain circumstances to limited stock rotation rights, which could cause us to accept the return of products and expose us to the risks of higher costs.
We grant our value-added distributors, or VADs, limited stock rotation rights, which could require us to accept stock back from a VAD’s inventory under certain circumstances. Under certain agreements, a VAD may have or retain a right to return a portion of products which the VAD, typically purchased within the prior six months. We typically recognize revenue upon shipment to the end-customer; however, if we are required to accept returns of obsolete or slower moving inventory, our
17
costs would increase and our operating results could be harmed. If our forecasts were inaccurate we could have higher costs, lower revenue or otherwise suffer adverse financial consequences, including holding obsolete or slower moving inventory.
We outsource the manufacturing of our products to third parties, and we therefore do not have the ability to completely control quality over the manufacturing process. In addition, if our contract manufacturers refuse or are unable to manufacturer our products, we may be unable to qualify new manufacturers in a timely manner, which would result in our being unable to sell our products.
We outsource the manufacturing of our products to third-party original design manufacturers located in China and Taiwan. Finished products are then shipped to warehousing and delivery logistics centers in California and the Netherlands, where we perform quality inspection, conduct reliability testing and manage our inventory. We operate these logistics centers currently for all end-customer shipments, whether destined to locations in North, South and Central America, or the Americas, Europe, the Middle East and Africa, or EMEA, or Asia Pacific and Japan, or APAC.
Our reliance on these third-party manufacturers reduces our control over the manufacturing process and exposes us to risks, including reduced control over quality assurance, product costs, product supply and timing. Any manufacturing or shipping disruption by these third parties could severely impair our ability to fulfill orders. If we are unable to manage effectively our relationships with these third parties, or if these third parties suffer delay or suffer manufacturing disruptions for any reason, experience increased manufacturing lead-times, capacity constraints or quality control problems in their manufacturing operations, or fail to meet our future requirements for timely delivery and quality purposes, our ability to ship products to our end-customers would be severely impaired and our reputation and our relationship with our channel partners and end-customers would be seriously harmed. Additionally, labor unrest or disruption to trade or the expected movement of our product could delay delivery of our products by third parties, or by us to our channel partners and end-customers, which could significantly delay revenue or increase our costs and in ways we cannot currently anticipate. Any natural disaster, political instability, disruption in labor or foreign relationships could also disrupt our relationships with our manufacturers or delay their ability to timely deliver our products.
We do not have long-term agreements with certain of our original design manufacturers. These manufacturers typically fulfill our supply requirements on the basis of individual orders. We also do not have long-term contracts with our third-party manufacturers that guarantee capacity, the continuation of particular pricing terms or the extension of credit limits. Accordingly, our third-party manufacturers are not obligated to continue to fulfill our supply requirements, which could result on short notice to us of supply shortages and increases in the prices we are charged for manufacturing services. In addition, as a result of global financial market conditions, natural disasters, labor disruption or other causes, it is possible that any of our manufacturers could experience interruptions in production, cease operations or alter our current arrangements. If our manufacturers are unable or unwilling to continue manufacturing our products in required volumes, or on current or acceptable terms, we will be required to identify one or more acceptable alternative manufacturers.
It is time-consuming and costly, and could be impractical, for us to begin to use new manufacturers, and changes in our third-party manufacturers may cause significant interruptions in supply if the new manufacturers have difficulty manufacturing products to our specification. As a result, our ability to meet our scheduled product deliveries to our end-customers could be adversely affected, which could cause the loss of sales to existing or potential end-customers, delayed revenue or an increase in our costs. We also do not currently require all our manufacturers to maintain and demonstrate robust disaster recovery capabilities. Any production interruptions for any reason, such as due to a contractual disagreement, natural disaster, epidemic, capacity shortages or quality problems, at one of our manufacturers would negatively affect sales of our product lines manufactured by that manufacturer and adversely affect our business and operating results.
Our manufacturing partners purchase component parts for our products based on estimates we provide, which may not be accurate. In addition, our manufacturing partners purchase some of the components and technologies used in our products from a single source or a limited number of sources. If our estimates were to be inaccurate, or if our manufacturing partners were to lose any of these sources as suppliers, we might incur additional transition costs, resulting in delays in the manufacturing and delivery of our products, excess or obsolete inventory, or the need to redesign our products.
We rely on our manufacturing partners to select and source the component parts within our products. We do not choose or contract directly with the component parts providers and do not have manufacturing contracts that guarantee us any fixed access to such component parts, or at specific pricing. This absence of any relationship between us and the component suppliers or direct and long-term component supply contracts may increase the risk of issues relating to the quality, performance or operability of such component parts and our exposure to shortages of component availability and to price fluctuations related to the raw material inputs for such components, foreign exchange adjustments and other factors.
Moreover, we currently depend on a single source or limited number of sources for several components for our products. For example, each of our products typically incorporates third-party components that have no more than two suppliers. In some instances, we may have a sole source for critical components, such as semiconductor chip sets or other
18
components critical to product functionality. We have also recently seen consolidation amongst component manufacturers, in particular of semiconductor chip sets, and rises in component prices and more restrictive component availability as a result. If our manufacturing partners were unable to obtain such components for any reason, or on a limited basis or at increased prices, they would be unable to manufacture such product at all, or in the quantities we need or at pricing we expect. We have also entered into license agreements with some of our suppliers for technologies used in our products, and the termination of these agreements, which can generally be done on relatively short notice, could have a material adverse effect on our access to these technologies and, thus, on our business. Termination of these agreements could also make technology used in or developed for our products available to our competitors. If any of those manufacturing agreements was terminated, we could experience significant supply disruptions and be required to redesign some of our products in order to incorporate technology from alternative sources, and any such termination of the agreement, disruption in supply and redesign of certain of our products could materially and adversely affect our business and operating results.
There are no other sources currently identified and qualified for certain of our components. If we lose any of these suppliers or licenses we could be required to transition to a new supplier or licensor, which could increase our costs, result in delays in the manufacturing and delivery and increase in the cost of our products or cause us to carry excess or obsolete inventory. Poor quality and delays in availability of any of the components in our products, including especially those with limited or sole sourcing, could also result in lost sales or lost sales opportunities. If the quality of the components does not meet our or our end-customers’ requirements, if we are unable to obtain components from our existing suppliers on commercially reasonable terms, or if any of our limited or solely sourced component suppliers ceases to remain in business or to continue to manufacture such components, we could be required to redesign our products in order to incorporate components or technologies from alternative sources. The resulting stoppage or delay in selling our products and the expense of securing and qualifying alternative sources or redesigning our products could result in significant manufacturing and development costs, delayed or lost sales opportunities and damage to customer relationships, which would adversely affect our reputation, business and operating results. For example, in August 2015, we announced that our AP250 and AP245X access points, which are our initial Wave 2 access point products, would not be commercially available until early 2016. This delayed release was due to delays in the products' development and the availability to us of a component part essential to our development and release of the products. Such as with the AP250 and AP245X access points, limited availability in component parts may affect the ability of our manufacturing partner and component suppliers to timely deliver sufficient quantities of this product to meet our demand and sales forecasts. There is a risk that existing or potential customers (including customers in our important education vertical) may elect not to purchase our products or defer purchases they otherwise would make of our products.
We rely upon third parties for the warehousing and delivery of our products, and we therefore have less control over these functions than we otherwise would.
We outsource the warehousing and delivery of all of our products to a third-party logistics provider for worldwide fulfillment. As a result of relying on a third party, we have reduced control over shipping and logistics. Any shipping delays, disruptions or mismanagement by these third parties could severely impair our ability to fulfill orders. For example, at the end of our quarter ended March 31, 2015, our third-party logistics provider was not able to ship product and, as a result, we were not able to take revenue in the quarter on all the orders that we had received and processed. We since transitioned to a new logistics provider. If we are unable to have our products shipped in a timely manner, we may suffer reputational harm, and lose revenue.
We rely significantly on channel partners to sell and support our products, and the failure of this channel to be effective could materially reduce our revenue.
Our channel partners consist primarily of VADs and VARs. We believe that establishing and maintaining successful relationships with these channel partners is, and will continue to be, important to our financial success. Recruiting and retaining qualified channel partners and training them in our technology and product offerings require significant time, resources and investment. Additionally, we need to recruit and develop different qualified channel partners for different geographic regions and markets. To develop and expand our channel, we must continue to scale and improve our processes and procedures that support our channel partners, including investment in systems and training. Additionally, we will increasingly focus our resources and attention on those channel partners best able to help us meet our growth expectations. As a result, the total number of our channel partners over time may decline.
Existing and future channel partners will only work with us if we are able to provide them with competitive products at prices and on terms that are attractive to them. If we fail to maintain the quality of our products or to update and enhance them, and at reasonable pricing, existing and future channel partners may elect to work instead with one or more of our competitors.
We sell to our channel partners typically under a contract with an initial term of one or three years, with one-year renewal terms, based on compliance with our program requirements. Our contracts generally require payment by the channel partner to us within 30 to 45 calendar days of the date we issue an invoice for such sales. We typically do not have minimum purchase commitments from our channel partners, and our contracts with channel partners do not prohibit them from offering
19
products or services that compete with ours, including products they currently offer or may develop in the future and incorporate into their own systems. Some of our competitors may have stronger relationships with our channel partners than we do and we have limited control, if any, as to whether those partners use our products, rather than our competitors’ products, or whether they devote resources to market and support our competitors’ products, rather than our offerings.
For example, we announced in April 2015 a new relationship with Dell Inc., whereby Dell became a reseller of Aerohive’s Wi-Fi and cloud services. In February 2016, we announced a partnership with SYNNEX Corporation as a value-added distributor of our products in the United States and Canada. To support these new relationships, we are continuing to identify and invest in additional and dedicated resources and, potentially, new product, service and support offerings. It will take time for us to fully realize the benefits from these investments, including, specifically from our continued relationship with Dell. If we fail to maintain relationships with our channel partners, fail to develop new relationships with other channel partners, including in new markets, fail to manage, train or incentivize existing channel partners effectively, fail to provide channel partners with competitive products on attractive terms, or if these channel partners are not successful in their sales efforts, our revenue may decrease and our operating results could suffer.
Our products are subject to U.S. export controls; where we fail to comply with these laws, we could suffer monetary or other penalties.
Our products are subject to U.S. export controls, specifically the Export Administration Regulations, and economic sanctions enforced by the Office of Foreign Assets Control. We incorporate standard encryption algorithms into our products, which, along with the underlying technology, we may export outside of the United States only with the required export authorizations, including by license, license exception or other appropriate government authorizations. Each of these authorizations may require us to file an encryption registration and classification request. Furthermore, U.S. export control laws and economic sanctions prohibit the shipment of certain products and services to countries, governments and persons targeted by U.S. sanctions. We take precautions to prevent our products and services from being exported in violation of these laws, and in many instances, we rely on our channel partners, in particular our VAD, VAR and MSP partners, to assure compliance when selling, distributing and/or using our products outside the United States. In certain instances, we have shipped encryption products prior to obtaining the required export authorizations and/or submitting the required requests, including a classification request and request for an encryption registration number. As a result, we previously filed a Voluntary Self Disclosure with the U.S. Department of Commerce’s Bureau of Industry and Security concerning these violations. A repeat of these past instances could result in monetary or other penalties assessed against us. Additionally, even though we take precautions to ensure that our channel partners comply with all relevant regulations, any failure by our channel partners to comply with such regulations could have negative consequences for us, including reputational harm, government investigations and penalties.
Furthermore, various countries regulate the import of certain encryption technology and operation of our products, including through import permitting, certification and licensing requirements, and have enacted laws that could limit our ability to distribute our products or our end-customers’ ability to operate our products in those countries, or could impose additional expense on us to meet these requirements as a condition to distribute our products. Encryption products and the underlying technology may also be subject to export control restrictions. Governmental regulation of encryption technology and regulation of imports or exports of encryption products, or our failure to obtain required import or export approval for our products, when applicable, could harm our international sales and adversely affect our revenue. Compliance with applicable regulatory laws and regulations regarding the export or import of our products, including with respect to new releases of our products, may create delays in the introduction of our products in international markets, prevent our end-customers with international operations from deploying our products throughout their globally distributed systems or, in some cases, prevent the export or import of our products to some countries altogether.
In addition, because our sales are made through channel partners, if these channel partners fail to obtain appropriate import, export or re-export licenses or authorizations, we may also be adversely affected, including potentially being liable for penalties under government restrictions and regulations, even where the channel partner failed to obtain the appropriate licenses or authorizations. Obtaining the necessary authorizations, including any required license, for a particular sale may be time-consuming, is not guaranteed and may result in the delay or loss of sales opportunities. Changes in our products or changes in applicable export or import laws and regulations may also create delays in the introduction and sale of our products in international markets, prevent our end-customers with international operations from deploying our products or, in some cases, prevent the export or import of our products to certain countries, governments or persons altogether. Any change in export or import laws and regulations, shift in the enforcement or scope of existing laws and regulations, or change in the countries, governments, persons or technologies targeted by such laws and regulations, could also result in decreased use of our products, or in our decreased ability to export or sell our products to existing or potential end-customers with international operations. Any decreased use of our products or limitation on our ability to export or sell our products could adversely affect our business, financial condition and results of our operations.
20
U.S. export control laws and economic sanctions programs also prohibit the shipment of certain products and services to countries, governments and persons that are subject to U.S. economic embargoes and trade sanctions. If we or our channel partners ship products to those targets or third parties provide our products to these targets, we could be subject to government investigations, penalties and reputational harm. Furthermore, any new embargo or sanctions program, or any change in the countries, governments, persons or activities targeted by such existing programs, could result in decreased use of our products, or in our decreased ability to export or sell our products to existing or potential end-customers, which could adversely affect our business and our financial condition.
Regulations related to conflict minerals may cause us to incur additional expenses and could limit the supply and increase the costs of certain metals used in the manufacturing of our products.
As a public company, we are subject to the requirements under the Dodd-Frank Wall Street Reform and Consumer Protection Act of 2010, or the Dodd-Frank Act, to diligence, disclose and annually report whether our products contain conflict minerals. The implementation of these requirements could adversely affect the sourcing, availability and pricing of the materials used in the manufacture of components used in our products. We have incurred and will continue to incur additional costs to comply with the disclosure requirements, including costs related to conducting diligence procedures to determine the sources of conflict minerals that may be used in or necessary to the production of our products and, if applicable, potential changes to products, processes or sources of supply as a consequence of such verification activities and we expect to incur additional costs in the future to comply with these disclosure requirements. We do not choose or contract directly with the component parts providers and do not have contracts with these component parts suppliers. We rely instead, on our manufacturing partners to select, source, diligence and report to us the component parts within our products. This absence of any relationship between us and the component suppliers makes significantly more difficult our ability to determine and report whether our products contain conflict minerals. Consequently, we may face reputational harm if our channel partners incorrectly determine or report whether certain of our products contain minerals not determined to be conflict-free or if we are unable to alter our products, processes or sources of supply to avoid use of such materials.
Our products incorporate complex technology and may contain defects or errors. We may become subject to warranty claims, product returns, product liability and product recalls as a result, any of which could cause harm to our reputation, impose costs and increase expenses, expose us to liability and adversely affect our business.
Our products incorporate complex technology and must support a wide variety of devices and new and complex applications in a variety of environments that use different wireless networking communication industry standards. Our products have contained, and may contain in the future, undetected defects or errors or may not perform as we expect in certain environments. We may discover some errors in our products only after a product has been installed and used by end-customers. These issues are most prevalent when we introduce new products into the market or, once introduced, when experiencing significant loads in actual use environments or at scale which we could not create or did not anticipate during development. We have delayed and may in the future delay the introduction of our new products due to such defects and errors. Since our products contain components that we purchase from third parties, we also expect our products to contain latent defects and errors from time to time related to those third-party components.
Defects and errors may also cause our products to be vulnerable to security attacks. The techniques used by computer hackers to access or sabotage networks are becoming increasingly sophisticated, change frequently and generally are not recognized until after they have been launched against a target. As we increasingly collect, store, analyze, use and transmit data, and provide data analytics solutions to our end-customers, these risks become more significant to us. Accordingly, our products and third-party security products may be unable to anticipate these techniques or provide a solution in time to protect our and our end-customers’ networks. In addition, we might not be able to timely develop and provide updated products and software to our end-customers, thereby leaving our end-customers vulnerable to attacks. Finally, if our employees, or others who have access to end-customer data, misuse this information, our reputation would be harmed and we could be subject to claims for damages.
Real or perceived defects or errors in our products could result in claims to return product or that we reimburse losses that our end-customers or channel partners sustain and we may be required, or may choose for customer or partner relations or other reasons, to expend additional resources in order to help correct the problem, including incurring additional warranty and repair costs, process management costs and costs associated with remanufacturing our inventory. We typically offer a limited warranty on our Wi-Fi access points for a period of five years from the date we discontinue sale of the product. We typically offer a limited warranty on our other hardware products for a one-year period. We also provide certain service commitment guarantees for our cloud-managed platform, pursuant to which our end-customers may receive service credits in connection with service outages. Liability limitations in our standard terms and conditions of sale may not be enforceable under some circumstances or may not fully or effectively protect us from claims and related liabilities and costs. In addition, regardless of the party at fault, errors of these kinds which would divert the attention of our engineering personnel from our product development efforts, damage our reputation and the reputation of our products, cause significant customer relations problems,
21
and can result in product liability claims. We do not maintain insurance which would protect against many of these types of claims associated with the use of our products. Even where claims ultimately are unsuccessful we may have to expend funds in connection with litigation, including on behalf of our end-customers and channel partners, and divert management’s time and other resources. We also may incur costs and expenses relating to a recall of one or more of our products. The process of identifying and recalling products that have been widely distributed may be lengthy and require significant resources, and we may incur significant replacement costs, contract damage claims from our end-customers and channel partners and significant harm to our reputation. The occurrence of any of these problems could result in substantial costs to us and the delay or loss of market acceptance of our products and could adversely impact our business, operating results and financial condition.
The loss of key personnel or an inability to attract, retain and motivate qualified personnel may impair our ability to expand our business.
Our success is substantially dependent upon the continued service and performance of our senior management team and other key personnel, including, in particular, David K. Flynn, who is our Chief Executive Officer. Our employees, including our senior management team, are at-will employees, and therefore may terminate employment with us at any time with no advance notice. The loss of any members of our senior management team or other key personnel, whether through resignation, illness, disability or death, or the failure to attract replacement personnel, as needed, or the transition of newly hired senior management may significantly delay or prevent the achievement of our business objectives. In addition, if any of our executives or other key employees were to join a competitor or form a competing company, we could lose customers, suppliers, know-how and key personnel and our business and product strategies and capabilities could be at risk and subject to disclosure, including to our competitors.
Our future success also depends on our ability to continue to attract, integrate and retain highly skilled personnel, especially skilled executives and sales and engineering employees. We have experienced in the past higher than normal turn-over, especially amongst our sales and engineering personnel, and continue to replace personnel where we think needed to improve our operations and product development capabilities and processes. We also continue to replace personnel as part of our ongoing performance and expense management initiatives. Turn-over is highly disruptive to our operations and has had and could continue to have an adverse effect on our revenue. In addition, competition for highly skilled personnel is frequently intense, especially in Silicon Valley, where we maintain our headquarters and a substantial operating and sales presence, and Hangzhou, China, where we currently maintain a significant research presence and highly skilled product development and engineering personnel. Volatility or lack of performance in our stock price may also affect our ability to attract and retain our key employees. Many of our employees have become, or will soon become, vested in a substantial amount of stock or number of stock options. Our employees may be more likely to leave us if the shares they own or the shares underlying their vested options have significantly appreciated in value relative to the original purchase or exercise prices, or if the exercise prices of the options that they hold are significantly above the market price of our common stock the options to purchase such shares will have little or no retention value. The lack of performance in our stock price may affect our ability to attract new employees or retain existing employees by decreasing the perceived value of any stock-based compensation we may offer or they may hold. Prolonged periods of low performance or volatility in our stock price could negatively impact our appeal as an employer, harm employee morale or increase employee turnover, including amongst our Silicon Valley and China-based employees. Any failure to successfully attract, integrate or retain qualified personnel to fulfill our current or future needs may negatively impact our growth. Also, to the extent we hire personnel from our competitors, we may be subject to allegations that these hires have been improperly solicited, or that they have divulged to us proprietary or other confidential information of their former employers, or that their former employers own their inventions or other work product. This may expose us to significant liability and litigation risk.
Our ability to sell our products is highly dependent on the quality of our support offerings, and our failure to offer high quality support would have a material adverse effect on our sales and results of operations.
Once our products are deployed, our end-customers depend on our support organization and support provided by our channel partners to resolve any issues relating to our products. Our support delivery organization comprises employees in various geographic locations and an outside service provider, which provides more general technical support to our end-customers. A high level of support is important for the successful marketing and sale of our products. If we do not effectively help our end-customers quickly resolve issues or provide effective ongoing support, it would adversely affect our ability to sell our products to existing end-customers as well as demand for continued support and renewal contracts, and could harm our reputation with existing and potential end-customers.
If our products do not interoperate with cellular networks and mobile devices, future sales of our products could be negatively affected.
For our products to remain competitive, we may need to be able to demonstrate and assure that our products can be interoperated with cellular networks and mobile devices using wireless networking technology. These networks and devices
22
have varied and complex specifications. To meet these requirements, we must continue to undertake development and testing efforts that require significant capital and employee resources. We may not accomplish these development efforts quickly or cost-effectively, or at all. If our products do not interoperate effectively, orders for our products could be delayed or cancelled, which would harm our revenue, gross margins and our reputation, potentially resulting in the loss of existing and potential end-customers. The failure of our products to interoperate effectively with cellular networks or mobile devices may result in significant warranty, support and repair costs, divert the attention of our engineering personnel from our product development efforts and cause significant customer and end-customer relations problems. In addition, our end-customers may require our products to comply with new and rapidly evolving security or other certifications and standards. If our products are late in achieving or fail to achieve compliance with these certifications and standards, or our competitors achieve compliance with these certifications and standards, such end-customers may not choose to purchase our products, which would harm our business, operating results and financial condition.
We are subject to complex and evolving U.S. and foreign laws and regulations regarding privacy, data protection and other matters and violations of these complex and dynamic laws, rules and regulations may result in claims, changes to our business practices, monetary penalties, increased costs of operations, and/or other harms to our business.
A wide variety of provincial, state, national and international laws and regulations apply to the collection, use, retention, protection, disclosure, transfer and other processing of data, including personal data. Foreign data protection, privacy and other laws and regulations are often more restrictive than those in the United States. These data protection and privacy-related laws and regulations are varied, evolving, can be subject to significant change, may be augmented or replaced by new or additional laws and regulations, and may result in ever-increasing regulatory and public scrutiny and escalating levels of enforcement and sanctions. The European Union, for example, has adopted various directives regulating data protection, privacy and security and the collection, storage, analysis, use and transmission of content using the Internet involving European Union residents, including those directives known as the Data Protection Directive, the E-Privacy Directive, and the Privacy and Electronic Communications Directive. The European Union may adopt similar directives in the future.
The European Union model has been replicated substantially or in part in various jurisdictions outside the U.S., including in certain Asia-Pacific Economic Cooperation countries. Changes in European Union data protection regulations, including the General Data Protection Regulation, or GDPR, may also introduce new or additional operational requirements for companies that receive personal data, which may differ from than those currently in effect in the European Union, which may also include significant additional compliance requirements and increased penalties for non-compliance. For example, the GDPR, which will become fully effective in May 2018, will supersede existing European Union data protection laws, includes more stringent operational requirements for companies processing European Union personal data, and imposes significant penalties for non-compliance. Further, some countries may require separate and local storage and processing of data that could limit certain of our product applications and solutions and increase the cost and complexity of selling our solutions or maintaining our business operations in those jurisdictions. California has also introduced broad rules, which may or may not anticipate and be consistent with rules expected to be adopted by our federal government. The introduction of new data platforms, applications and solutions or expansion of our activities in certain jurisdictions may subject us to additional laws and regulations. For instance, participation in the federal E-Rate funding program may subject us to additional privacy and data use restrictions under U.S. federal, state, and local laws and regulations relating to the processing of data relating to students or children.
The application and interpretation of these laws and regulations are often uncertain, particularly in the new and rapidly evolving industry in which we operate, and these laws and regulations may be interpreted and applied inconsistently from within a country or country to country, and inconsistently with our current policies and practices, and may be contradictory with each other. Additionally, various federal, state, and foreign regulatory or other governmental bodies may issue rulings that invalidate prior laws, regulations, or legal frameworks in manners that may adversely impact our business. For example, the European Court of Justice in October 2015 issued a ruling invalidating the U.S.-E.U. Safe Harbor Framework, which facilitated personal data transfers to the U.S. in compliance with applicable European Union data protection laws. The U.S. and E.U. have implemented a replacement for the U.S.-E.U. Safe-Harbor Framework (known as the U.S.-E.U. Privacy Shield), but some regulatory uncertainty remains regarding the future of data transfers from the European Union to the U.S. In addition to government regulation, privacy advocacy and industry groups have adopted and are considering the adoption of various self-regulatory standards and codes of conduct that, if applied to our, our partners or our end-customers’ businesses, may place additional burdens on us and our partners and end-customers, which may further reduce demand for our products, data platforms, applications and solutions and harm our business.
While we work to comply with all applicable privacy and data protection laws, regulations, standards, and codes of conduct, as well as our own privacy policies and contractual commitments to the extent possible, our failure to comply could result in enforcement actions against us, including fines, imprisonment of company officials and public censure, claims for damages by end-customers and other affected individuals, demands that we modify or cease existing practices, damage to our reputation and loss of goodwill (both in relation to existing and prospective end-customers), any of which could have a material
23
adverse effect on our operations, financial performance and business. Privacy and data protection regulators within the United States, the European Union and other jurisdictions have the power to fine non-compliant organizations significant amounts and seek injunctive relief, including the cessation of certain data processing activities. The GDPR provides for European Union regulators to be able to impose fines in some cases of the greater of €20 million or 4% of a company’s worldwide annual sales. Such fines are in addition to the rights of individuals to sue for damages in respect of any data privacy breach which has caused them to suffer loss. Such actions against our partners, including third-party providers of data analytics services, could also affect our operating performance, including demand for our products and cloud-managed solutions and, if these or other third-party vendors violate applicable laws or our policies, such violations may also put our end-customers’ information at risk and could in turn have a material and adverse effect on our business. Additionally, there is a risk that failures in systems designed to protect private, personal or proprietary data held by us will allow such data to be disclosed to or seen by others, resulting in potential regulatory investigations, enforcement actions or penalties, remediation obligations and/or private litigation by parties whose data were improperly disclosed. There is also a risk that we could be found to have failed to comply with U.S. or foreign laws or regulations regarding the collection, storage, handling, analysis, use, transfer, or disposal of such privacy, personal or proprietary data, or consent to the same, which could subject us to fines or other sanctions, as well as adverse reputational impact.
Evolving and changing privacy and data protection laws, regulations and societal norms, including evolving and changing definitions of personal data and personal information, within the United States, European Union, and elsewhere, especially relating to classification of IP addresses, MAC addresses, machine identification, location and tracking, data analytics and other information, may limit or inhibit our ability to operate or expand our business, including limiting our product and data application development and our strategic partnerships that may involve the collection, storage, handling, analysis, use, transfer or disposal of end-user data, thus reducing our and our stockholders' opportunity to benefit from the significant investments we are making in these areas. Even the perception of privacy concerns, failures to secure data, or inadequate data protection, whether valid and whether owing to any action or inaction on our part, may harm our reputation and inhibit adoption of our products, applications and services by current and future end-customers.
Our international operations expose us to additional business risks and failure to manage these risks may adversely affect our international revenue.
We derive a significant portion of our revenue from end-customers and channel partners outside the United States. For fiscal years ended December 31, 2016 and 2015, we attributed 44% and 38%, respectively, of our revenue to our international end-customers and channel partners. As of December 31, 2016, approximately 43% of our full-time employees were located outside of North America, with 25% located in China. We expect that our international activities will be dynamic over the foreseeable future as we continue to pursue opportunities in international markets, which will require significant management attention and financial resources.
Given the extent of our international operations, we are subject to other inherent risks and our future results could be adversely affected by a number of factors, including:
• | tariffs and trade barriers, export regulations and other regulatory or contractual limitations, such as import, technical and other certification requirements, on our ability to sell or develop our products in certain foreign markets; |
• | regulatory requirements or preferences for domestic products, which could reduce demand for our products; |
• | differing technical standards, existing or future regulatory and certification requirements and required product features and functionality; |
• | management communication and integration problems related to entering new markets with different languages, cultures, commercial practices and political systems; |
• | difficulties in enforcing contracts and collecting accounts receivable, and longer payment cycles, especially in emerging markets; |
• | heightened risks of unfair competition or corrupt business practices in certain geographies and of improper or fraudulent sales arrangements that may impact financial results and result in restatements of, and irregularities in, our financial statements; |
• | difficulties and costs of staffing and managing foreign operations, and retaining key personnel; |
• | differing labor standards; |
• | the uncertainty of protection for our intellectual property rights and the enforceability of our rights and third-party rights in some countries; |
• | potentially adverse tax consequences, including regulatory requirements regarding our ability to repatriate profits to the United States; |
24
• | uncertainties and instability in economic and market conditions following the decision of the United Kingdom to withdraw from the European Union; |
• | added legal compliance obligations and complexity, including complying with varying local labor, compensation and tax and securities laws as well as specific and evolving local requirements regarding data protection; |
• | foreign currency exchange risk; |
• | the increased cost of terminating employees in some countries; and |
• | political and economic instability and terrorism. |
To the extent we continue to expand our business globally, our success will depend, in large part, on our ability to effectively anticipate and manage these and other risks and expenses associated with our international operations. Political instability and uncertainty in the European Union and, in particular, Britain's recent decision to exit the European Union has slowed economic growth and created significant economic disruption and uncertainty in the region, which could continue to discourage near-term economic activity, including delay decisions to purchase Aerohive products. This could have a significant and extended impact of our expected revenue from our European operations, in particular continuing into 2017, as the terms and circumstances of Britain’s exit and its impact on other countries of the European Union are resolved. Our failure to manage any of these risks successfully could harm our international operations and reduce our international sales, and business generally, adversely affecting our business, operating results and financial condition.
Our operations in certain emerging markets expose us to political, economic and regulatory risks.
Our growth strategy depends in part on our ability to expand our operations in emerging markets, including Asia Pacific, the Middle East and Africa, and Latin America. However, some emerging markets have greater political, economic and currency volatility, and greater vulnerability to infrastructure and labor disruptions than more established markets. In many countries outside of the United States, particularly those with emerging economies, it may be common for others to engage in business practices prohibited by laws and regulations with extraterritorial reach, such as the U.S. Foreign Corrupt Practices Act, or FCPA, the U.K. Bribery Act, or other local anti-bribery laws. These laws generally prohibit companies and their employees, contractors or agents from making improper payments to government officials, including in connection with obtaining permits or engaging in other actions necessary to do business. Failure to comply with these laws could subject us to civil and criminal penalties that could materially and adversely affect our reputation, financial condition and results of operations.
For example, under the FCPA, U.S. companies may be held liable for the corrupt actions taken by employees, strategic or local partners, or other representatives. Under the FCPA, we and our channel partners are required to maintain accurate books and records and a system of internal accounting controls. As such, if we or our intermediaries fail to comply with the requirements of the FCPA or similar legislation outside the United States, governmental authorities in the United States and elsewhere could seek to impose civil or criminal fines and penalties, which could have a material adverse effect on our business, operating results and financial conditions. While our employee handbook and other policies prohibit our employees from engaging in corrupt conduct, we do not yet have in place compliance measures and training to require both our employees and our third-party intermediaries to comply with the FCPA and similar anticorruption laws.
Establishing operations and distribution partners in these emerging markets may also require complex legal arrangements and operations to deliver services on global contracts for our end-customers. Because of our limited experience with international operations and developing and managing sales and distribution channels in international markets, our international expansion efforts may not be successful. Additionally, we have established operations in locations remote from our more developed business centers. As a result, we are subject to heightened risks inherent in conducting business internationally, including the following:
• | failure to comply with local regulations or restrictions; |
• | enactment of legislation, regulation or restriction, whether by the United States or in the foreign countries, including unfavorable labor regulations, tax policies or economic sanctions (such as potential economic sanctions arising from political disputes), and currency controls or restrictions on the transfer of funds; |
• | enforcement of legal rights or recognition of commercial procedures by regulatory or judicial authorities in a manner in which we are not accustomed, would not reasonably expect or with which we could reasonably comply; |
• | differing technical and environmental standards, data protection and telecommunications regulations and certification requirements, which could prevent the import, sale or use of our products or SaaS offerings in such countries; |
• | difficulties and costs associated with staffing and managing foreign operations; |
• | potentially longer payment cycles and greater difficulty collecting accounts receivable; |
• | the need to adapt and localize our services for specific countries, including conducting business and providing services in local languages; |
25
• | reliance on third parties over which we have limited control, such as our VARs, VADs, or their resellers or agents, for marketing and reselling our products and solutions; |
• | availability of reliable broadband connectivity and wide area networks in areas we target for expansion; |
• | difficulties in understanding and complying with local laws, regulations, and customs in foreign jurisdictions or unanticipated changes in such laws; |
• | application of or changes in anti-bribery laws, such as the FCPA and UK Bribery Act, which may disrupt our staffing or ability to manage our foreign operations; |
• | changes in political and economic conditions leading to changes in the business environment in which we operate, as well as changes in foreign currency exchange rates; |
• | sanctions restricting local commercial activity, including retaliatory actions by local governments; and |
• | natural disasters, pandemics or international conflict, including terrorist acts or labor or political disputes, which could interrupt our operations or endanger our personnel. |
In addition, our competitors may also expand their operations in these markets or others we may also target, and low-cost local manufacturers may also expand and improve products and their production capacities, thus increasing competition in these emerging markets. Our success in emerging markets is important to our growth strategy. If we cannot successfully increase our business in emerging markets and manage associated political, economic, regulatory and currency volatility, our product sales, financial condition and results of operations could be materially and adversely affected.
We could be subject to additional income tax liabilities.
We are subject to income taxes in the United States and numerous foreign jurisdictions. We use significant judgment in evaluating our worldwide provision for income taxes, which could be adversely affected by several factors, many of which are outside our control. During the ordinary course of business, there are many transactions for which the ultimate tax determination is uncertain. For example, our effective tax rates could be adversely affected by earnings being lower than we anticipate in countries that have lower statutory rates and higher than we anticipate in countries that have higher statutory rates, by changes in foreign currency exchange rates, by changes in the valuation of our deferred tax assets and liabilities, or by changes in the relevant tax, accounting and other laws, regulations, principles and interpretations, including possible changes to the U.S. taxation of earnings of our foreign subsidiaries, the deductibility of expenses attributable to foreign income or the foreign tax credit rules. We are subject to audit in various jurisdictions, and such jurisdictions may assess additional income tax against us as well as penalties and fines. As we operate in multiple taxing jurisdictions, the application of tax laws can be subject to diverging and sometimes conflicting interpretations by tax authorities of these jurisdictions. The time and expense necessary to defend and resolve a tax audit may be significant. Although we believe our tax estimates are reasonable, the final outcome of tax audits and any related litigation could be materially different from our historical income tax provisions and accruals and may have a material effect on our operating results or cash flows in the period or periods for which we make such determination.
Our international operations and corporate structure subject us to potential adverse tax consequences.
We generally conduct our international operations through wholly owned subsidiaries and report our taxable income in various jurisdictions worldwide based upon our business operations in those jurisdictions. Our intercompany relationships are subject to complex transfer pricing regulations administered by taxing authorities in various jurisdictions. The relevant taxing authorities may disagree with our determinations as to the income and expenses attributable to specific jurisdictions. If such a disagreement were to occur, and our position was not sustained, we could be required to pay additional taxes, interest and penalties, which could result in one-time tax charges, higher effective tax rates, reduced cash flows and lower overall profitability of our operations. We may not have adequate reserves to cover such a contingency.
In the future, we may reorganize our corporate structure or intercompany relationships, which would likely require us to incur expenses in the near term for which we may not realize related benefits, at all or within a reasonable period, to justify the expense. Changes in domestic and international tax laws, including proposed legislation to reform U.S. taxation of international business activities, may negatively impact our ability to effectively restructure, or reduce the benefits we expected from such corporate restructuring. Any such restructuring would likely involve sophisticated analysis, including analysis of U.S. and international tax regimes. Compliance with such laws and regulations may be difficult and expensive and subject our business to additional risks, costs and uncertainties.
26
Our ability to use our net operating losses to offset future taxable income may be subject to certain limitations; in addition, we may be unable to use a substantial part of our net operating losses if we don’t attain profitability in an amount necessary to offset such losses.
In general, under Section 382 of the Internal Revenue Code of 1986, as amended, a corporation that undergoes an “ownership change” is subject to limitations on its ability to utilize its pre-change net operating losses, or NOLs, to offset future taxable income. Our existing NOLs may be subject to limitations arising from previous ownership changes, and if we undergo a future ownership change our ability to utilize NOLs could be further limited by Section 382. Future changes in our stock ownership, some of which are outside of our control, could result in a deemed ownership change under Section 382. Furthermore, we may be unable to use a substantial part of our NOLs due to regulatory changes, such as suspensions of the use of NOLs, or if we do not attain profitability in an amount sufficient to offset such losses. For example, our California state NOL carryforwards of $55.7 million as of December 31, 2016, began to expire in 2016. For these reasons, we may not be able to utilize a material portion of the NOLs reflected on our balance sheet, even if we attain profitability at a later date.
Taxing authorities may successfully assert that we should have collected or in the future should collect sales and use, value-added or similar taxes, and we could be subject to liability with respect to past or future sales, which could adversely affect our results of operations.
We do not collect sales and use, value-added or similar taxes in all jurisdictions in which we have sales, based on our belief that such taxes are not applicable. Sales and use, value-added and similar tax laws and rates vary greatly by jurisdiction. Certain jurisdictions in which we do not collect such taxes may assert that such taxes are applicable, which could result in tax assessments, penalties and interest, and we may be required to collect such taxes in the future. Such tax assessments, penalties and interest or future requirements could be significant and may adversely affect the results of our operations.
If we are unable to manage our growth and expand our operations successfully, our business and operating results will be harmed and our reputation may be damaged.
We have expanded our operations significantly since inception and anticipate that we may require further expansion to achieve our business objectives. For example, our revenue for fiscal years 2016, 2015 and 2014 was $169.8 million, $151.7 million and $137.3 million, respectively, and our global headcount as of the end of fiscal years 2016, 2015 and 2014, was approximately 620, 620 and 570 employees, respectively. The growth and expansion of our business and product offerings places a continuous and significant strain on our management, operational and financial resources. Any such future growth would also add complexity to and require effective coordination throughout our organization.
We must improve our infrastructure to manage our growth, which could involve significant costs and could, if not properly managed, harm our operating results.
To manage any future growth effectively we must continue to improve and expand our information technology and financial and administrative infrastructure, our operating systems and administrative controls and our ability to manage headcount, capital and processes in an efficient manner. For example, we continue to evaluate upgrades to our existing business processes and systems to better manage licensing, renewals and order processing, and to transition to a global distribution platform. Such new processes and systems may significantly improve our transaction efficiency and ability to scale our revenue and operating performance, including through an ability to track, timely identify and manage increasing volumes of product, license and renewal opportunities and transactions. We may not be able to successfully implement improvements to these systems and processes in a timely or efficient manner, which could result in additional operating inefficiencies and lost business opportunities and associated revenue, and could cause our costs to increase more than planned. If we do increase our operating expenses in anticipation of the growth of our business and this growth does not meet our expectations, at all or sufficiently to justify the expense, our operating results may be negatively impacted. If we are unable to manage future expansion, our ability to develop and deliver high quality products and services and securely process increased transaction volumes could be harmed, which could damage our reputation and brand and impede expected growth, and any of which may have a material adverse effect on our business, operating results and financial condition.
Our business and operating results could be adversely affected by unfavorable economic and market conditions.
Our business depends on the overall demand for wireless network technology and on the economic health and general willingness of our current and prospective end-customers to purchase our products. The conditions in the United States and global economies are volatile and if they deteriorate, our business, operating results and financial condition may be harmed. In particular, we do not know whether spending on wireless network technology will increase or decrease in the future, or at what rate.
Investments in technology by educational institutions in particular could be related to budgetary constraints unrelated to overall economic conditions, or may be magnified by unfavorable economic conditions. The purchase of our products or
27
willingness to replace existing infrastructure are discretionary and highly dependent on a perception of continued rapid growth in consumer usage of mobile devices and in many cases involve a significant commitment of capital and other resources. In addition, our small and medium enterprise end-customers may also be more sensitive to adverse economic conditions than other potential customers, which could amplify the adverse impact of a deterioration of economic conditions. Therefore, weak economic conditions, uncertain availability of government funding, or a reduction in capital spending would likely adversely impact our business, operating results and financial condition. A reduction in spending on wireless network technology could occur or persist even if economic conditions improve.
In addition, if interest rates rise or U.S. dollar foreign exchange rates weaken for our international end-customers and channel partners, overall demand for our products and services could decline and related capital spending may be reduced. For example, the exchange rate of the U.S. dollar to foreign currencies continues to be strong, which makes the price of our products outside the United States less competitive, reducing our sales or requiring us to lower pricing for our products outside the United States in order to maintain sales and revenue performance (thus also reducing our gross margins). Furthermore, any increase in the U.S. dollar-value of worldwide commodity prices may result in higher component prices for us and increased manufacturing and shipping costs, each of which may negatively impact our financial results.
U.S. and global political, credit and financial market conditions may negatively impact or impair the value of our current portfolio of cash, cash equivalents and short-term investments, including U.S. treasury securities and U.S.-backed investment vehicles.
Our cash, cash equivalents and short-term investments were $76.8 million as of December 31, 2016, which we held as money market funds, U.S. treasury securities, commercial paper and investment-grade corporate debt with Moody's and S&P ratings of A-/A3 or better. As a result of the uncertain domestic and global political, credit and financial market conditions, investments in these types of financial instruments pose risks arising from liquidity and credit concerns. Any deterioration in the U. S. and global credit and financial markets could cause losses or significant deterioration in the value of our cash, cash equivalents or possible investments. If any such losses or significant deteriorations occur, it may negatively impact or impair our current portfolio of cash, cash equivalents and possible investments, which may affect our ability to fund future obligations. Further, unless and until the current U.S. and global political, credit and financial market crisis has been sufficiently resolved, it may be difficult for us to liquidate our investments prior to their maturity without incurring a loss, which would have a material adverse effect on our business, operating results and financial condition.
System security risks, data security incidents and cyber-attacks could compromise our or our end-customers’ information including proprietary information and end-customer information and disrupt our internal operations, which could cause our business and reputation to suffer and adversely affect our stock price.
In the ordinary course of business, we store sensitive data, as well as our proprietary business information and that of our end-customers, suppliers and business partners. The secure maintenance of this information, and our ability to protect our network from interruption or damage from unauthorized entry, computer viruses or other events beyond our control, is critical to our operations, and business strategy, reputation and, ultimately, our success as a business and value to our investors. While we believe we use certain proven applications designed for data security and integrity, we are in the process of developing an information security program. Despite the implementation of security measures, our infrastructure or systems may be vulnerable to hackers, computer viruses, worms, malware, ransomware or other malicious software programs or similar disruptive problems caused by our customers, employees, consultants or other Internet users who attempt to invade public and private data networks.
Increasingly, companies are subject to a wide variety of attacks on their networks on an ongoing basis. Our information technology and infrastructure may be vulnerable to persistent threats, penetration or attacks by computer programmers and hackers, software bugs or other technical malfunctions, or other disruptions. Due to our business model and the location of some of our development centers, we have faced and are likely to face threats that target both our internal systems and our products and data analytics solutions, which, in turn, may threaten our end-customers' networks, devices, applications and data. In addition, our employees could breach our data security measures and misuse such data or other information, whether through error or misconduct. Any such data security incident, whether external or internal in origin, could compromise our networks, including our cloud-managed platform, creating system disruptions or slowdowns and exploiting security vulnerabilities of our products, and the information stored on our networks could be improperly accessed, publicly disclosed, lost or stolen, which could subject us to liability to our end-customers, suppliers, channel and business partners and others, and cause us reputational and financial harm. Additionally, an effective attack on our systems or products or data analytics solutions could disrupt their proper functioning, allow unauthorized access to sensitive, proprietary or confidential information of ours or of our end-customers, disrupt or temporarily interrupt customers' networking traffic, or cause other destructive outcomes, including the theft of information sufficient to engage in fraudulent financial transactions or compromise other sensitive information. Because the techniques used by computer programmers and hackers, many of whom are highly sophisticated and well-funded, to access or sabotage networks change frequently and generally are not recognized until after they are used, we may be unable to
28
anticipate or immediately detect these techniques. This could delay our response or the effectiveness of our response and impede our sales, manufacturing, distribution or other critical functions and ability to limit our exposure to third-party claims and potential liability. If any of these types of data security incidents were to occur or to be believed to have occurred, or if we were to be unable to timely respond to protect sensitive data or other proprietary or non-public data, our relationships with our business partners and end-customers could be materially damaged, our reputation and brand could be materially harmed, use of our solutions could decrease, and affected partners, end-customers or government authorities could initiate legal or regulatory action against us in connection with such incidents, which could cause us to incur significant expenses and liability or could result in orders, judgments, or consent decrees forcing us to modify our business practices. The risk that these types of events could seriously harm our business is likely to increase as we expand the number of web-based products and data analytics solutions we offer, and as we operate in more countries.
In addition, if an actual or perceived data security incident occurs in our network or in the network of a partner or an end-customer of one of our products and data analytics solutions (particularly our cloud-based offerings), regardless of whether the incident is attributable to our products and data analytics solutions, the market perception of the effectiveness of our products and data analytics solutions could be harmed. We may also be required to expend significant financial and operational resources in an effort to secure our systems and our and our partners' or customers’ data from security threats and hazards. Further, real or perceived defects or errors in our products and data analytics solutions (particularly in our cloud-based offerings, due to cloud-based offerings sometimes being perceived as being inherently less secure) could result in claims by channel partners and end-customers for losses that they sustain, including potentially losses resulting from data security incidents affecting our systems, our end-customers' networks and/or downtime of those networks. If channel partners or end-customers make these types of claims, we may be required, or may choose for customer relations or other reasons, to expend additional resources in order to help correct the problem, including warranty and repair costs, process management costs, and costs associated with re-manufacturing our inventory and to respond to and resolve litigation and regulatory claims. The economic costs to us to eliminate or alleviate cyber or other security problems, bugs, viruses, worms, malware, ransomware or malicious software systems and security vulnerabilities and claims could be significant and may be difficult to anticipate or measure because the damage may differ based on the identity and motive of the programmer or hacker, which may be difficult for us to identify.
Undetected software errors or flaws in our cloud platform could harm our reputation or decrease market acceptance of our solution, which would harm our operating results.
Our platform may contain undetected errors or defects when introduced or as we release new versions. We have experienced these errors or defects in the past in connection with new releases and solution upgrades, and we expect that we or others will find errors or defects from time to time in future releases, even after we release them commercially. Since our end-customers may use our platform for security and compliance reasons, any errors, defects, disruptions in service or other performance problems may damage our end-customers’ business and could hurt our reputation. If that occurs, we may incur significant costs, the attention of our key personnel could be diverted, our end-customers may delay or withhold payment to us or elect not to continue to use our products or renew our services, or defer further purchases, or other significant customer relations problems may arise. We may also be subject to government penalties and liability claims for damages related to errors or defects in our platform.
Our business is subject to the risks of earthquakes, fire, floods and other natural catastrophic events, and interruptions by man-made problems, such as network data-security incidents, computer viruses or terrorism.
Our corporate headquarters are located in Silicon Valley, and substantially all of our contract manufacturers are located in Asia, both regions known for seismic activity. A significant natural disaster, such as an earthquake, a fire or a flood, occurring near our headquarters, or near the facilities of our contract manufacturers, could have a material adverse impact on our business, operating results and financial condition. Despite the implementation of network security measures, our networks also may be vulnerable to computer viruses, break-ins, denial of service attacks, malware, ransomware and other disruptions and data security incidents arising from unauthorized tampering with our systems or our products or our data analytic solutions or from internal or external threats. In addition, natural disasters, acts of terrorism or war could cause disruptions in our or our end-customers’ or channel partners’ businesses, our suppliers’ and manufacturers’ operations or the economy as a whole. We also rely on information technology systems to communicate among our workforce and with third parties. Any disruption to our communications, whether caused by a natural disaster or by manmade problems, such as power disruptions, could adversely affect our business. We do not have a formal disaster recovery plan or policy or incident response plan or comprehensive written information or data security plans in place and do not currently require that all our manufacturing partners have such plans or policies in place. To the extent that such incidents or our failure to promptly or effectively respond result in delays or cancellations of orders or impede our suppliers’ and/or our manufacturers’ ability to timely deliver our products and product components, or the deployment of our products, our business, operating results and financial condition could be adversely affected. We do maintain what we believe are commercially reasonable levels of business interruption insurance. However, we
29
cannot assure that such insurance would be available to us or adequately cover our losses in the event of a significant disruption in our business.
We may acquire other businesses or form partnerships or joint ventures that could require significant management attention, disrupt our business and dilute stockholder value.
We may make investments in complementary companies, products or technologies, or form partnerships or joint ventures with third parties. For example, in January 2016, we lent $1.5 million in cash in the form of a promissory note issued by a privately held company which provides Wi-Fi application and analytics, which note we may convert into preferred shares of the privately held company upon certain circumstances.
We have limited experience identifying, making investments in, purchasing and integrating third-party companies, technologies or other assets that could be complementary to our business or help advance our strategy, in particular, internationally. As a result, our ability as an organization to identify, invest in, acquire and integrate other companies, technologies or other assets in a successful manner is unproven. We may not be able to find suitable investment or acquisition candidates, and we may not be able to complete such investments or acquisitions on favorable terms, if at all. If we do complete investments or acquisitions, we may not ultimately strengthen our competitive position or achieve our goals, and any investments or acquisitions we complete could be viewed negatively by our end-customers, investors and financial analysts. In addition, if we are unsuccessful at integrating such acquisitions, or the technologies associated with such investments or acquisitions, the business prospects, operating results and financials of the combined company could be adversely affected. Any integration process may require significant time and resources, and we may not be able to manage the process successfully. Cross-border transactions may involve complex regulatory, labor or government compliance requirements which we may not fully anticipate or which could impose ongoing cost and require significant management attention and resources. We may not successfully evaluate or utilize the acquired technology or personnel, or accurately forecast the financial impact of an acquisition, including accounting charges. We may have to pay cash, assume liabilities, incur debt or issue equity securities to pay for any such investment or acquisition, each of which could adversely affect our financial condition or the value of our common stock. The sale of equity or issuance of debt to finance any such investment or acquisition could result in dilution to our stockholders. The incurrence of indebtedness would result in increased fixed obligations and could also include covenants or other restrictions that would impede our ability to manage our operations.
Our future capital needs are uncertain, and we may need to raise additional funds in the future. If we require additional funds in the future, those funds may not be available on acceptable terms, or at all.
We believe that our existing cash and cash equivalents will be sufficient to meet our anticipated working capital and capital expenditure needs for at least the next 12 months. We may, however, need to raise substantial additional capital in the future to:
• | fund our operations; |
• | continue our research and development; |
• | develop and commercialize new products; |
• | invest in or acquire companies, in-licensed products or intellectual property; or |
• | expand sales and marketing activities. |
Our future funding requirements will depend on many factors, including:
• | market acceptance of our products and services; |
• | the cost of our research and development activities; |
• | refinancing, extending or replacing existing obligations, including our existing credit facilities and lease obligations as they mature or where earlier repayment may be required; |
• | the cost of defending and resolving, in litigation or otherwise, claims that we infringe third-party patents or violate other intellectual property rights; |
• | the cost and timing of establishing additional sales, marketing and distribution capabilities; |
• | the cost and timing of establishing additional technical support capabilities; |
• | the effect of competing technological and market developments; |
• | the market for different types of funding and overall economic conditions; and |
• | continued investments we may make to fund anticipated future growth. |
30
We may require additional funds in the future, and we may not be able to obtain those funds on acceptable terms, or at all. If we raise additional funds by issuing equity securities, our stockholders may experience dilution. Debt financing, if available, may involve covenants restricting our operations or our ability to incur additional debt. Upon any liquidation, our debt lenders and other creditors would be repaid all interest and principal then-outstanding prior to the holders of our common stock receiving any distribution. Any debt or additional equity financing that we raise may contain terms that are not favorable to us or our stockholders.
If we do not have, or are not able to obtain, sufficient funds, we may have to reduce our cash burn rate, delay development or commercialization of our products or license to third parties the rights to commercialize products or technologies that we would otherwise seek to commercialize. If we raise additional funds through collaboration and licensing arrangements with third parties, it may be necessary to relinquish some rights to our technologies or our products, or to grant licenses on terms that are not favorable to us. If we are unable to generate sufficient cash flows or to raise adequate funds to finance our forecasted expenditures, we may have to liquidate some or all of our assets, or delay, reduce the scope of or eliminate some or all of our development programs. We also may have to reduce sales, marketing, engineering, customer support or other resources devoted to our products, or cease operations. Any of these actions could impede our ability to achieve our business objectives and harm our operating results.
The requirements of being a public company may strain our resources, divert management’s attention and affect our ability to attract and retain qualified members of our board of directors.
As a public company, we are subject to the reporting requirements of the Securities Exchange Act of 1934, as amended, or the Exchange Act, the Dodd-Frank Act, the listing requirements of the New York Stock Exchange, the Financial Industry Regulatory Authority, or FINRA, and other applicable securities rules and regulations. Compliance with these rules and regulations increases our legal and financial compliance costs, make some activities more difficult, time-consuming or costly, and increase demand on our systems and resources. The Exchange Act requires, among other things, that we file annual, quarterly and current reports with respect to our business and operating results.
Being a public company has increased our ongoing expenses in general and specifically the cost for us to obtain director and officer liability insurance at levels we deem commercially reasonable, and we have incurred higher costs and accepted higher retentions to obtain such coverage. Being a public company also makes it more difficult for us to attract and retain qualified members of our board of directors, particularly to serve on its audit committee and compensation committee, and qualified executive officers.
As a result of disclosure of information in filings required by us as a public company, our business and financial condition is more visible, which might result in threatened or actual litigation, including by competitors and other third parties. For example, we recently settled a class action law suit asserting that statements we made in conjunction with our initial public offering in March 2014 were false or misleading, or failed to include material information. We incurred significant expenses to defend this action and expended time and resources, including management resources, necessary to resolve it. Such litigation could harm our business and operating results.
An increasing volume of our business is being delivered through our channel partners and value-added distributors, thus increasing our credit exposure to those partners.
We will continue to increase our investment in our channel partners and value-added distributors, and expect the level of our revenue to be delivered through those partners and distributors to increase as well. While this may reduce the credit risk we would otherwise have with respect to individual end-customer transactions, it increases our overall credit risk to these partners and distributors. We attempt to monitor periodically the business conditions of our partners and distributors. However, we may not fully understand or be able to anticipate at any time difficult financial or market conditions that could affect or undermine their credit worthiness and ability to meet their obligations to us. This is particularly true for our partners located outside the United States and those who do not provide a level of financial reporting or disclosure consistent with U.S.-reporting companies. In the event one or more of these channel partners and distributors were to experience financial difficulties, slow their payments or default entirely on their obligations to us this could have a material effect on our revenue and overall business.
Our debt obligations contain restrictions that impact our business and expose us to risks that could adversely affect our liquidity and financial conditions.
On June 21, 2012, we entered into a revolving credit facility with Silicon Valley Bank, which we refer to, as amended, as our Revolving Credit Facility. As of December 31, 2016, we have $20.0 million drawn under the Revolving Credit Facility.
Our obligations under the Revolving Credit Facility is secured by substantially all of our property, other than our intellectual property. The Revolving Credit Facility contains customary negative covenants that limit our ability to, among other
31
things, incur additional indebtedness, grant liens, make investments, repurchase stock, pay dividends, transfer assets or engage in merger and acquisition activity, including merge or consolidate with a third party. The Revolving Credit Facility also requires us to maintain a liquidity ratio of not less than 1.25 to 1.00 and to demonstrate minimum cash balances and the absence of defined events of default in order to have access to the available borrowing. Our Revolving Credit Facility also contains customary affirmative covenants, including requirements to, among other things, deliver audited financial statements, and it contains customary events of default, subject to customary cure periods for certain defaults, which include, among other things, non-payment defaults, covenant defaults, material judgment defaults, bankruptcy and insolvency defaults, cross-defaults to certain other material indebtedness, and defaults arising from inaccuracy of representations and warranties. The Revolving Credit Facility also includes a default upon the occurrence of a material adverse change to our business.
If our cash balances or cash flows decline due to any of the factors described in this “Risk Factors” section or otherwise, if we breach covenants under our Revolving Credit Facility or if there occurs a material adverse change in our business, we could be prohibited from further borrowing under the Revolving Credit Facility, our interest rates on the outstanding borrowings could increase and our obligation to repay principal amounts could be accelerated. Our failure to pay interest and principal amounts when due or comply with covenants could cause a default under the Revolving Credit Facility. Any such default could have a material adverse effect on our liquidity and financial condition. In the event of our liquidation, the lender would be repaid all outstanding principal and interest prior to distribution of assets to other creditors. Our holders of common stock would receive a portion of any liquidation proceeds only if all of our creditors were first repaid in full.
Risks Related to Our Industry
We compete in highly competitive markets, and competitive pressures from existing and new companies may harm our business, revenue, growth rates and prospects. In addition, many of our current or potential competitors have longer operating histories, greater brand recognition, larger customer bases and significantly greater resources than we do, and we may lack sufficient financial or other resources to maintain or improve our competitive position.
The markets in which we compete are highly competitive, and we expect competition to increase in the future, whether from established competitors or new market entrants. The markets are influenced by, among others, the following competitive factors:
• | brand awareness and reputation; |
• | price and total cost of ownership; |
• | discounts and other incentives offered to resellers and channel partners; |
• | strength and scale of sales and marketing efforts, professional services and customer support; |
• | product features, reliability and performance; |
• | incumbency of the current provider, either for wireless or wired networking or other products; |
• | scalability of products; |
• | ability to integrate with other technology infrastructures; and |
• | breadth of product offerings. |
Our main competitors include general networking infrastructure vendors, such as Cisco/Meraki, Hewlett-Packard/Aruba Networks and Brocade/Ruckus Wireless, and others, such as Ubiquiti Networks, whose broad networking portfolios may include enterprise mobility solutions they have developed or acquired or may acquire in the future. In addition, Cisco and Apple announced in August 2015 a collaboration to improve the performance and experience of Apple iOS-based products when used on Cisco networks and operating systems. Cisco and other vendors have also committed significant internal sales and marketing resources to increase their participation in the 2016 FCC’s E-Rate funding program for K-12 schools. Such vendors have significant sales and engineering resources and, along with the relationships they have formed, can offer customers and resellers a broader or more compelling portfolio of products and platform solutions than we can offer, which some customers may prefer, and can use their broader offerings to provide additional financial and technical incentives for customers to purchase their products. These companies may also expand their product offerings over time and, through such partnerships and acquisitions and with greater resources, are able more effectively and opportunistically to target emerging markets or market opportunities, becoming more difficult competitors for us. They are also able to develop broader suites of products, and provide a complete and integrated wired and wireless hardware solution may be preferable to our end-customers. We expect competition to intensify in the future as companies introduce new products into our markets, consolidate or broaden their product offerings or from partnerships or collaborations, including amongst our competitors and partners, which expand the breadth and compatibility of their product offerings. This competition could result in increased pricing pressure, reduced profit margins, increased sales and marketing expenses, and failure to increase, or the loss of, our market share, any of which would likely seriously harm our business, operating results or financial condition. If we do not keep pace with product and technology
32
advances, or if we are unable to differentiate our products and services successfully from those of our competitors, including our total cost of ownership, there could be a material and adverse effect on our competitive position, revenue and prospects for growth.
A number of our current or potential competitors have longer operating histories, greater name recognition, larger customer bases, more resellers, and significantly greater financial, technical, sales, marketing and other resources. Our competitors may be better able to anticipate, influence or adapt more quickly to new or emerging technologies and changes in customer requirements, devote greater resources to the promotion and sale of their products and services, initiate or withstand substantial price competition, take advantage of acquisitions or other opportunities more readily and develop and expand their product and service offerings more quickly than we can. Such greater resource and operating histories of our larger and longer-established competitors may be particularly important to our larger enterprise customers when choosing our or a competing production solution. In addition, certain of our competitors may be able to leverage their relationships with customers based on other products or incorporate functionality into existing products to gain business in a manner that discourages customers from purchasing our products, including through selling at low or even negative margins, product bundling, or closed-technology platforms. Our competitors may also be able to offer a broader integrated product platform, or across platforms through partnerships, bringing together a unified product, security and applications offering. Potential end-customers may prefer to purchase all of their equipment from a single provider, or may prefer to purchase wireless and wired networking products from an existing supplier rather than a new supplier, regardless of product performance or features.
We expect increased competition from our current competitors, as well as other established and emerging companies, to the extent our markets continue to develop and expand. Conditions in our markets could change rapidly and significantly as a result of technological advancements or other factors. These pressures could limit our growth and materially adversely affect our business, operating results and financial condition.
Industry consolidation and strategic partnerships lead to increased competition and may harm our operating results.
There has been a trend toward industry consolidation in our markets for several years as companies attempt to strengthen or hold their market positions in an evolving industry, and as companies are acquired or are unable to continue operations. Some of our competitors have made acquisitions or entered into partnerships or other strategic relationships to offer a more comprehensive solution than they individually had offered. For example, in November 2012, Cisco Systems acquired Meraki Networks. In 2014, Juniper Networks announced that it was exiting its wireless networking business as part of a strategic partnership with Aruba Networks. In April 2014, Zebra Technologies announced that it would buy the enterprise business of Motorola Solutions, which Zebra later sold to Extreme Networks in September 2016. In March 2015, Hewlett-Packard announced that it would acquire Aruba Networks. In July 2015, Fortinet, Inc. completed its acquisition of Meru Networks. Cisco and Apple announced in August 2015 a collaboration to improve the performance and experience of Apple iOS-based products when used on Cisco networks and operating systems. In October 2015, Ruckus announced its acquisition of CloudPath Networks, a provider of Wi-Fi onboarding technology. In April 2016, Brocade announced its acquisition of Ruckus. Brocade subsequently announced its sale to Broadcom, and its intention in conjunction with the sale to spin-out its Ruckus business unit. Such or similar consolidation or strategic partnerships may continue in the future. The companies or alliances resulting from these possible consolidations may create more compelling or bundled or integrated product platforms, bringing together unified product, security and application offerings, as well as being able to offer greater pricing flexibility, making it more difficult for us to compete effectively, including on the basis of price, sales and marketing programs, channel coverage, technology or product functionality. Continued industry consolidation may adversely impact customers’ perceptions of the viability of smaller and even medium-sized technology companies such as ourselves and, consequently, customers’ willingness to purchase from us. Such greater resource and operating histories of our larger and longer-established competitors may be particularly important to our larger enterprise customers when choosing our or a competing production solution. In addition, companies that are our strategic alliance or channel partners in some areas of our business may acquire or form alliances with our competitors, thereby reducing their business with us. We believe that industry consolidation may result in stronger competitors, with more efficient cost structures that are better able to compete as sole-source vendors for our end-customers. This could lead to more variability in our operating results and could have a material adverse effect on our business, operating results and financial condition.
Demand for our products and services depends in part on the continued growth of the industries in which we participate, as well as our ability to diversify into other verticals, and the failure of these industries to expand or of our ability to diversify our revenue opportunities, could harm our operating results.
We currently target K-12 and higher education, retail, distributed enterprise and, to a lesser extent, healthcare end-customers, and we sell into verticals such as finance, manufacturing, utilities, telecom, state and local government, transportation, legal, accounting, architecture, engineering and construction. In the event, any of the specific sectors we target fails to expand on wireless networking, or slows the rate of their spending, our operating results could be harmed. For example, the education sector is faced with limited resources to spend on technology purchases. In North America, the U.S. government's
33
E-Rate program starting on July 1, 2015 was expected to continue to provide a significant portion over the next several years of the funding used by schools to purchase our solutions. If this sector does not continue to expand expenditures on technology in general, or the rate of funding slows or is delayed, our business could be harmed. If the E-Rate program is discontinued or receives a lower level of funding than we expect, or the share of funding our end-customers secure or direct toward purchasing our products is lower than we expect, our business could also be harmed.
We realize that our revenue-dependence on the volatile education market may bring uncertainty to our results. For this reason, a priority for our business is to expand and diversify our offerings and revenue opportunities into other verticals, with particular focus on enterprise customers. This includes developing and introducing new products and solution offerings.
If functionality similar to that offered by our products is incorporated into existing network infrastructure products, enterprises may decide against adding our products to their network, which would have an adverse effect on our business.
Large, well-established providers of networking equipment may continue to introduce features that compete with our products, either in stand-alone products or as additional features or applications in their network platforms. For example, several of our larger competitors may be better able to integrate into a single platform a broader product, security and applications offering. The inclusion of, or the announcement of an intent to include, functionality perceived to be better or more cost-effective than that offered by our platform may have an adverse effect on our ability to market and sell our products. Furthermore, even if the functionality offered by these providers is more limited or less cost-effective than our platform, end-customers may elect to accept such products in lieu of adding platforms from an additional vendor such as ourselves. Many enterprises have invested substantial personnel and financial resources to design and operate their networks and have established deep relationships with other providers of networking products, which may make them reluctant to add new components to their networks, particularly from other vendors such as ourselves. In addition, an enterprise’s existing vendors or new vendors with a broad product offering may be able to offer concessions that we are not able to match. If enterprises are reluctant to add new vendors or otherwise decide to work with their existing vendors, our ability to maintain or improve our market share, our financial condition and operating results will be adversely affected.
We rely on revenue from subscription and services that may decline. Because we recognize revenue from subscriptions and services over the term of the relevant service period, downturns or upturns in sales are not immediately reflected in full in our operating results.
Software subscription and services revenue, consisting of sales of new or renewal subscription and support and maintenance contracts, accounts for a significant portion of our revenue, comprising 20%, 17% and 12% of our total revenue for fiscal years 2016, 2015 and 2014, respectively. Our service revenue may decline and fluctuate as a result of a number of factors, including end-customers’ level of satisfaction with our offerings, the prices, pricing and changes in the scope of our offerings, the prices of products and services offered by our competitors and reductions in our end-customers’ spending levels. We are developing and implementing systems to enable us better to track and timely identify renewal opportunities. If our sales of new or renewal subscription and support and maintenance contracts decline, or we are not able to manage efficiently increased support transaction volumes, including renewals, our revenue and revenue growth may decline and our business will suffer. In addition, we recognize service revenue ratably over the term of the relevant service period, which is typically one, three or five years. As a result, much of the service revenue we report each fiscal quarter is the recognition of deferred revenue from service contracts entered into during previous fiscal quarters. Consequently, a decline in new or renewed subscription or support and maintenance contracts in any one fiscal quarter will not be fully reflected in revenue in that fiscal quarter but will continue to negatively affect our revenue in future fiscal quarters. Accordingly, the effect of significant downturns in new or renewed sales of our subscriptions or support and maintenance is not reflected in full in our operating results until future periods. Also, it is difficult for us to rapidly increase our services revenue through additional service sales in any period, as revenue from new and renewal service contracts must be recognized over the applicable service period. Furthermore, any increase in the average term of services contracts would result in revenue for services contracts being recognized over longer periods of time and the associated revenue we recognize could be lower in any particular quarter.
If we fail to comply with environmental requirements, our business, financial condition, operating results, and reputation could be adversely affected.
We are subject to various local, state, federal, and international environmental laws and regulations, including laws governing the hazardous material content of our products and laws relating to the collection of and recycling of electrical and electronic equipment. Examples of these laws and regulations include the European Union Restriction on the Use of Certain Hazardous Substances in Electrical and Electronic Equipment Directive ("RoHS"), and the European Union Waste Electrical and Electronic Equipment Directive ("WEEE Directive"), as well as the implementing legislation of the European Union member states. Similar laws and regulations have been passed or are pending in China, South Korea, Norway, and Japan and may be enacted in other regions in which we currently or expect to operate, including in the United States, and we are, or may in the future be, subject to these laws and regulations.
34
The RoHS and the similar laws of other jurisdictions limit the content of certain hazardous materials, such as lead, mercury and cadmium, in the manufacture of electrical equipment, including our products. Currently, our products comply with the EU RoHS requirements. However, if there are changes to these or other laws (or their interpretation) or other jurisdictions pass new similar laws or requirements, we may be required to reengineer our products to use components compatible with these regulations. This reengineering and component substitution could result in additional costs to us or disrupt our operations or logistics or delay our ability to sell our products.
The WEEE Directive requires electronic goods producers to register as a WEEE producer and be responsible for the collection, recycling, and treatment of such products. Changes in interpretation of the directive may cause us to have additional regulatory requirements to meet in the future in order to comply with this directive, or with any similar laws adopted in other jurisdictions.
We are also subject to environmental laws and regulations governing the management of hazardous materials, which we use in small quantities in our engineering labs. Our failure to comply with these or past, present and future similar laws could result in reduced sales of our products, substantial product inventory write-offs, reputational damage, costs, penalties, third-party property damage, and other sanctions, any of which could harm our business and financial condition. We also expect that our products will be affected by new environmental laws and regulations on an ongoing basis, imposing greater compliance costs, and increasing risks and penalties associated with violations, which could harm our business. To date, our expenditures for environmental compliance have not had a material impact on our results of operations or cash flows, and although we cannot predict the future impact of such laws or regulations, they will likely result in additional costs and may increase penalties associated with violations or require us to change the content of our products or how they are manufactured, any of which could have a material adverse effect on our business, operating results, and financial condition.
New regulations or standards or changes in existing regulations or standards in the United States or internationally related to our products may result in unanticipated costs or liabilities, which could have a material adverse effect on our business, results of operations and future sales, and could place additional burdens on the operations of our business.
Our products are subject to governmental regulations in a variety of jurisdictions. In order to achieve and maintain market acceptance, our products must continue to comply with these regulations as well as a significant number of industry standards. In the United States, our products must comply with various regulations defined by the Federal Communications Commission, or FCC, Underwriters Laboratories and others. We must also comply with similar international regulations in order for our products to be certified for use in such countries. For example, our wireless communication products operate through the transmission of radio signals and radio emissions are subject to regulation in the United States and in other countries in which we do business. In the United States, various federal agencies, including the Center for Devices and Radiological Health of the Food and Drug Administration, the FCC and various state agencies have promulgated regulations that concern the use of radio/electromagnetic emissions standards. Member countries of the European Union and individual countries in the Asia Pacific region have enacted similar standards concerning electrical safety and electromagnetic compatibility and emissions. In addition, our data analytics solutions, and the manner in which we collect, store, analyze, use or transmit end-customer data, increasingly may be subject to regulation under the Federal Trade Commission.
As these regulations and standards evolve, and if new regulations or standards are implemented, we will be required to modify our products or develop and support new versions of our products, or change the manner in which we collect, store, analyze, use or transmit end-customer data, and our compliance with these regulations and standards may become more burdensome and require significant investments. The failure of our products to comply, or delays in compliance, with the various existing and evolving industry regulations and standards could prevent or delay introduction of our products, which could harm our business. End-customer uncertainty regarding future policies may also affect demand for communications products, including our products. Moreover, channel partners or end-customers may require us, or we may otherwise deem it necessary or advisable, to alter our products to address actual or anticipated changes in the regulatory environment. Our inability to alter our products to address these requirements and any regulatory changes may have a material adverse effect on our business, operating results and financial condition.
Risks Related to Our Intellectual Property
If we are unable to protect our intellectual property rights, our competitive position could be harmed or we could be required to incur significant expenses to enforce our rights.
We protect our proprietary information and technology through licensing agreements, third-party nondisclosure agreements and other contractual provisions, as well as through patent, trademark, copyright and trade secret laws in the United States and similar laws in other countries. As of December 31, 2016, we held 29 patents issued and 48 applications pending in the United States (as well as certain foreign equivalents issued and applications pending outside the United States).
35
We do not know whether these protections will be available in all cases or will be adequate to prevent our competitors from copying, reverse engineering or otherwise obtaining and using our technology, proprietary rights or products. The laws of some foreign countries, including countries in which our products are sold, used or manufactured, are in many cases not as protective of intellectual property rights as those in the United States, and mechanisms for enforcement of intellectual property rights may be inadequate. In addition, third parties may seek to challenge, invalidate or circumvent our patents, trademarks, copyrights and trade secrets, or applications for any of the foregoing. Our competitors may independently develop technologies that are substantially equivalent or superior to our technology or design around our proprietary rights. We have focused patent, trademark, copyright and trade secret protection primarily in the United States. As a result, we may not have sufficient protection of our intellectual property in all countries where infringement may occur. In each case, our ability to compete or offer our products for sale could be significantly impaired.
To prevent substantial unauthorized use of our intellectual property rights, it may be necessary to prosecute actions for infringement and/or misappropriation of our proprietary rights against third parties. We currently have a limited portfolio of issued patents compared to our larger competitors and, therefore, may not be able to effectively utilize our intellectual property portfolio to assert against third parties. Any such action could result in significant costs and diversion of our resources and management’s attention and, in any case, we could fail to be successful in any such action. Furthermore, many of our current and potential competitors have the ability to dedicate substantially greater resources to enforce their intellectual property rights than we do. Accordingly, despite our efforts, we may not be able to prevent third parties from infringing upon or misappropriating our intellectual property.
Claims by others that we infringe their intellectual property rights could harm our business.
Companies that sell products, as well as non-operating patent holding companies, in the wireless networking industry are often aggressive in protecting intellectual property rights and perceived rights, which has resulted in protracted and expensive litigation for some companies. In addition, non-operating entities have been increasingly aggressive in asserting intellectual property rights and perceived rights against operating companies in the Wi-Fi and networking industry, including ourselves. We currently are subject to claims and litigation by third parties that we infringe their intellectual property rights.
As our business expands, and the number of products and competitors in our market increases and overlaps occur, we expect that infringement claims against us or our partners or end-customers may increase in number and significance. Any claims or proceedings against us, whether meritorious, will be time-consuming, result in costly litigation, require significant amounts of management time or result in the diversion of significant operational resources, any of which could materially and adversely affect our business and operating results.
Intellectual property lawsuits are subject to inherent uncertainties due to the complexity of the technical issues involved, and we cannot be certain that we will be successful in defending ourselves against intellectual property claims. Our limited portfolio of issued patents may not provide defenses or counterclaims in response to patent infringement claims or litigation brought against us by third party competitors. Further, where non-operating entities or other adverse patent owners who have no relevant products or revenue bring such claims or litigation against us, our patents provide no deterrence or competitive risk. In any case, many potential litigants have the capability to dedicate substantially greater resources to enforce their intellectual property rights and to defend claims than we could against them. Furthermore, a successful claimant could secure a judgment that requires us to pay substantial damages or prevents us from distributing certain products or performing certain services. We might also be required to seek a license and pay royalties for the use of such intellectual property, which may not be available on commercially acceptable terms, or at all. Alternatively, we may be required to develop non-infringing technology, which could require significant effort and expense or redesign our product, which could delay our product offering and may ultimately not be successful.
See Part I, Item 3 “Legal Proceedings." for a discussion of the intellectual property litigation in which we are currently involved.
Our use of open-source software could impose limitations on our ability to commercialize our products.
Our products utilize software modules licensed to us by third-party authors under open-source licenses, including as incorporated into software we receive from third party commercial software vendors. Use and distribution of open-source software may entail greater risks than use of third-party commercial software, as open-source licensors generally do not provide support, updates, warranties, or other contractual protections regarding infringement claims or the quality of the code. Furthermore, the terms of many open-source licenses have not been interpreted by U.S. or foreign courts, and these licenses could be construed in a way that could impose other unanticipated conditions or restrictions on our ability to commercialize our products. In addition, some open-source licenses require the licensee, under certain circumstances, to make available source code for modifications or derivative works the licensee creates based upon such open-source software, and to allow further modification and distribution of such works. As a result, if we combine our proprietary software with open-source software or modify such software in a certain manner, we could be required to release certain source code we authored under license terms
36
that freely permit third parties, including our competitors, to further modify, use and distribute our software. In some instances, this could allow our competitors to create similar products with lower development effort and time, create security vulnerabilities in our products, and ultimately result in a loss of product sales for us. Further, if we are held to have breached or otherwise failed to comply with the terms of an open-source software license, we could be required to pay damages, seek licenses from third parties to continue offering our products, re-engineer our products, or discontinue the sale of our products if re-engineering could not be accomplished on a timely basis, any of which could harm our business, operating results and financial condition.
We continue to review our usage of open-source software in our products, and to analyze the impact of such usage on our products and business. We may not be able to identify all of the risks regarding our use of open-source software and what steps we will need to take to come into compliance with applicable license terms. Moreover, our implementation of tools and policies designed to monitor our ongoing use of open-source software in our products may not be adequate or entirely effective in all instances. Depending on our determination of the impact on our business of compliance with applicable open-source license requirements, we could be required to re-engineer certain aspects of our products and/or seek licenses from third parties. Our review to date has identified certain uses of third-party open-source software that, under the terms of applicable open-source licenses, will likely require us to provide certain additional notices, and to distribute and to offer to release certain of our source code under open-source software license terms, which we are currently preparing to do. We are also considering re-engineering of certain portions of our products to limit the scope of and potential impact on our business of such disclosure and licensing requirements going forward. Until we have completed our analysis, we will not know the full extent of such required disclosures or re-engineering efforts, or if and on what terms such alternative licenses could be available.
We rely on the availability of third-party licenses. If these licenses are available to us only on less favorable terms or not at all in the future, our business and operating results would be harmed.
We have incorporated third-party licensed technology and intellectual property rights into our products. It may be necessary in the future to renew licenses relating to various aspects of these products or to seek additional licenses for existing or new products. These necessary licenses could be unavailable to us on acceptable terms, or at all. The inability to obtain certain licenses or other rights, or to obtain those licenses or rights on favorable terms, or the need to engage in litigation regarding these matters, could result in delays in product releases until such time, if ever, as we can identify, license or develop equivalent technology and integrate such technology into our products, which might have a material adverse effect on our business, operating results and financial condition. Moreover, the inclusion in our products of intellectual property licensed from third parties on a nonexclusive basis could limit our ability to differentiate our product offering or protect our proprietary rights in our products.
Risks Related to Ownership of Our Common Stock
We have experienced significant volatility in the price of our common stock, and you could lose all or part of your investment.
The trading price of our common stock has fluctuated substantially. From the date of our initial public offering in March 2014 through December 31, 2016, the high and low trading price for our common stock as reported by the New York Stock Exchange ranged between a high of $12.23 and a low of $3.43. The trading price of our common stock depends on a number of factors, including those described in this “Risk Factors” section, many of which are beyond our control and may not be related to our operating performance. These fluctuations could cause you to lose all or part of your investment in our common stock, since you might not be able to sell your shares at or above the price you paid.
Factors that could cause fluctuations in the trading price of our common stock include the following:
• | price and volume fluctuations in the overall stock market from time to time; |
• | volatility in the market prices and trading volumes of high-technology stocks; |
• | changes in operating performance and stock market valuations of other technology companies generally, or those in our industry in particular; |
• | sales of shares of our common stock by us or our stockholders, including through secondary offerings we may initiate to generate cash to fund our ongoing operations; |
• | failure of financial analysts to maintain coverage of us, changes in financial estimates by any analysts who follow our company, or our failure to meet these estimates or the expectations of our investors; |
• | the financial projections we may provide to the public, any changes in those projections or our failure to meet those projections; |
• | announcements by us or our competitors of new products or new or terminated significant contracts, commercial relationships or capital commitments, or of delays in our product offerings; |
37
• | public analyst or investor reaction to our press releases, other public announcements and filings with the Securities and Exchange Commission, including specifically, concerning our operations, business initiatives or operating performance; |
• | rumors and market speculation involving us or other companies in our industry; |
• | vesting of shares under RSU awards to our employees and delivery of shares our employees purchase under our ESPP, and related selling of such shares into the market, including to cover employee tax withholding obligations; |
• | actual or anticipated changes in our results of operations or fluctuations in our operating results, including any actual or perceived slowing in our rate of growth or ability to achieve profitability at all or on a schedule expected by our investors or industry analysts; |
• | actual or anticipated developments in our business or our competitors’ businesses or the competitive landscape generally; |
• | litigation involving us, our industry or both, or investigations by regulators into our operations or those of our competitors; |
• | developments or disputes concerning our intellectual property or our products, or third-party proprietary rights; |
• | announced or completed investments in or acquisitions of businesses or technologies by us or our competitors, including the result of ongoing consolidation within our industry, and the performance of such investments or acquisitions; |
• | the partnerships we or our competitors may announce, and the performance of such partnerships; |
• | declines in our operating, margin or revenue growth or customer acquisition rates; |
• | new laws or regulations or new interpretations of existing laws or regulations applicable to our business; |
• | changes in accounting standards, policies, guidelines, interpretations or principles; |
• | changes in our senior management or our board of directors; |
• | general economic conditions and slow or negative growth of our markets; and |
• | other events or factors, including those resulting from war, incidents of terrorism or responses to these events. |
The stock market in general, and the market for technology companies in particular, has experienced extreme price and volume fluctuations that have often been unrelated or disproportionate to the operating performance of those companies. Broad market and industry factors may seriously affect the market price of our common stock, regardless of our actual operating performance. In addition, in the past, following periods of volatility in the overall market and the market prices of particular companies’ securities, securities class action litigations have often been instituted against these companies. Our industry has experienced significant consolidation recently, and the prices paid in such consolidations and the performance of such acquisitions could have a significant impact how analysts and investors view our stock and the price such investors are willing to pay. For example, in April 2016, Brocade announced its acquisition of Ruckus Wireless, one of our competitors. Brocade subsequently announced its sale to Broadcom, and it intention in conjunction with that sale to spin-out its Ruckus business unit. Whether a buyer can be found for the Ruckus business unit, and what price that buyer pays to acquire Ruckus, could have a significant and negative affect on our stock price or what a potential buyer would be willing to pay for our stock. In addition, if our revenue or operating results, or the rate of growth of our revenue or operating results, fall below the expectations of our investors or financial analysts, or below any forecasts or guidance we may provide to the market, or if the forecasts we provide to the market are below the expectations of analysts or investors, the price of our common stock could decline substantially. Such a stock price decline could occur and result in litigation against us even when we have met our own or other publicly stated revenue or earnings forecasts, and substantial costs and a diversion of our management’s attention and resources.
We utilize RSU awards as a significant component of the equity incentives we provide to our employees. Shares subject to these awards typically vest on March 1, June 1, September 1 and December 1 of each year. On each of these dates, we may direct the sale of such shares into the market to generate cash sufficient to satisfy our estimate of the minimum statutory employee tax withholding. Our employees are also able to purchase shares of our common stock twice per year under our ESPP, which purchase dates currently are June 1 and December 1 of each year. Employees may choose then to sell a portion or all of such shares, including to generate cash sufficient to satisfy statutory tax withholding requirements they may have under local law. The coincidence of such sales of our common stock, concentrating on specific dates, may increase the typical or average trading volume of our common stock, and increase the volatility and degree of fluctuation in the trading price of our common stock. For example, on each of March 1, June 1, September 1 and December 1, 2016, and for the several days thereafter, the average trading volume in our common stock, as reported by the NYSE, increased significantly, as did the degree of fluctuation in the trading price for our stock. We expect such increased trading volumes and related trading price volatility to be repeated, coinciding with future RSU vesting and ESPP purchase dates. Such trading volume and price volatility could
38
create uncertainty amongst our investors or contribute to further stock price declines which may not be related to the actual performance of our business.
Insiders continue to have substantial control over us and will be able to influence corporate matters.
Our directors and executive officers, and stockholders holding more than 5% of our capital stock and their affiliates, but excluding stockholders and affiliates holding between 5% and 10% of our capital stock not affiliated with any of our officers or directors (and who do not otherwise possess any other indicia of control with respect to our company), beneficially owned, in the aggregate, as of December 31, 2016, approximately 21.9% of our outstanding common stock based on the number of shares outstanding as of December 31, 2016. As a result, these stockholders are able to exercise significant influence over all matters requiring stockholder approval, including the election of directors, and approval of significant corporate transactions, such as a merger or other sale of our company or its assets. This concentration of ownership could limit our stockholders’ ability to influence corporate matters and may have the effect of delaying or preventing a third party from acquiring control over us.
Certain provisions in our charter documents and under Delaware law could limit attempts by our stockholders to replace or remove members of our board of directors or current management and may adversely affect the market price of our common stock.
Provisions in our certificate of incorporation and bylaws may have the effect of delaying or preventing a change of control or changes in our board of directors or management. These provisions include the following:
• | our Board has the right to elect directors to fill a vacancy created by the expansion of the Board or the resignation, death or removal of a director, which prevents stockholders from being able to fill vacancies on our Board; |
• | our stockholders may not act by written consent or call special stockholders’ meetings; as a result, a holder or holders controlling a majority of our capital stock would not be able to take certain actions other than at annual stockholders’ meetings or special stockholders’ meetings called by the Board, the chair of the Board, the chief executive officer or the president; |
• | our directors may only be removed for cause, which would delay the replacement of a majority of our Board; |
• | our Board is staggered in three tiers, with directors serving for three years, which could impede an acquiror from rapidly replacing our existing directors with its own slate of directors; |
• | our certificate of incorporation prohibits cumulative voting in the election of directors, which limits the ability of minority stockholders to elect director candidates; |
• | our stockholders must provide advance notice and additional disclosures in order to nominate individuals for election to our Board or to propose matters that can be acted upon at a stockholders’ meeting, which may discourage or deter a potential acquiror from conducting a solicitation of proxies to elect the acquiror’s own slate of directors or otherwise attempting to obtain control of our company; and |
• | our Board may issue, without stockholder approval, shares of undesignated preferred stock; the ability to issue undesignated preferred stock makes it possible for our Board to issue preferred stock with voting or other rights or preferences that could impede the success of any attempt to acquire us. |
As a Delaware corporation, we are also subject to certain Delaware anti-takeover provisions. For example, under Delaware law, a corporation may not engage in a business combination with any holder of 15% or more of its capital stock unless the holder has held the stock for three years or, among other things, the Board has approved the transaction. Our Board could rely on Delaware law to prevent or delay an acquisition of us.
Our directors are entitled to accelerated vesting of their equity awards pursuant to the terms of their service arrangements upon a change of control of our company, and our executive officers in the event their employment is actually or constructively terminated in the context of a change of control. In addition to the arrangements currently in place with some of our executive officers, we may enter into similar arrangements in the future with other officers. Such arrangements could delay or discourage a potential acquisition of our company.
If financial or industry analysts do not publish research or reports about our business, or if they issue an adverse or misleading opinion regarding our common stock, our stock price and trading volume could decline.
The trading market for our common stock is influenced by the research and reports that industry or financial analysts publish about us, our business, our competitors’ business or our industry. We do not control these analysts or the content and opinions included in their reports. We may not attract sufficient research coverage or maintain coverage of analysts that currently publish reports regarding our business. If any of the analysts who cover us issues an adverse or misleading opinion regarding our stock price, our stock price would likely decline. If one or more of these analysts ceases coverage of our company
39
or fails to publish reports on us regularly, we could lose visibility in the financial markets, which in turn could cause our stock price or trading volume to decline.
We recently announced a share repurchase program, but we cannot guarantee that in fact that our repurchase of shares will enhance long-term stockholder value. Our share repurchases could also increase the volatility of the price of our common stock and could diminish our cash reserves.
In February 2016, our board of directors authorized a stock repurchase program. Under the program, we are authorized to repurchase shares of our common stock for an aggregate purchase price of up to $10 million. As of December 31, 2016, we had repurchased under this program 364,627 shares of our common stock at a total price of $2.1 million. Although our board of directors authorized the program, we are not obligated to repurchase any minimum or specific number or dollar amount of shares. In addition, we may suspend or terminate the program at any time before its expiration as of June 30, 2017. Under the program, we may purchase shares of our stock from time to time, in the open market or through private transactions, subject to market conditions, in compliance with applicable state and federal securities laws. However, the timing and number of our share repurchases, if any, will depend upon several factors, including market and business conditions, the trading price of our common stock and the nature of other investment opportunities available to us. We may also choose to defer or limit repurchases given other uses of our cash or our desire to preserve cash balances. In addition, our repurchases of common stock could affect the market price of our common stock or increase its volatility. For example, the existence of a share repurchase program could cause our share price to be higher than it would be in the absence of such a program and could potentially reduce the market liquidity for our stock. Additionally, our repurchase program could diminish our cash reserves, which may impact our ability to finance future growth and to pursue possible future strategic opportunities and acquisitions. We also cannot assure that any share repurchases will enhance stockholder value because the market price of our common stock may decline below the levels at which we repurchase our stock, and short-term stock price fluctuations could reduce the program’s effectiveness.
We do not intend to pay dividends and under our loan agreements with our lenders we are not permitted to pay dividends. As a result, your ability to achieve a return on your investment will depend on appreciation in the price of our common stock.
Pursuant to our Revolving Credit Facility, we are restricted from paying dividends while this facility is in place. Moreover, we have never declared or paid any cash dividends on our common stock and do not intend to pay any cash dividends in the foreseeable future. We anticipate that we will retain all of our future earnings for use in the development of our business and for general corporate purposes our Board may determine, in its discretion. Any determination to pay dividends in the future will be at the discretion of our Board. Accordingly, investors must rely on sales of their common stock after price appreciation, which may never occur, as the only way to realize any future gains on their investments.
We are an “Emerging Growth Company,” and any decision on our part to comply only with certain reduced disclosure requirements applicable to Emerging Growth Companies could make our common stock less attractive to investors.
We are an “emerging growth company,” as defined in the Jumpstart Our Business Startups Act enacted in April 2012, and, for as long as we continue to be an “emerging growth company,” we choose to take advantage of exemptions from various reporting or compliance requirements applicable to other public companies but not to “emerging growth companies,” including, but not limited to, not being required to comply with the auditor attestation requirements of Section 404 of the Sarbanes-Oxley Act, reduced disclosure obligations regarding executive compensation in our periodic reports and proxy statements, and exemptions from the requirements of holding a nonbinding advisory vote on executive compensation and stockholder approval of any golden parachute payments not previously approved. We could be an “emerging growth company” for up to five years after the completion of the IPO, although if the market value of our common stock that is held by non-affiliates exceeds $700 million as of any June 30 before that time or if we have total annual gross revenue of $1 billion or more during any fiscal year before that time, we would cease to be an “emerging growth company” as of the end of that fiscal year. If we issue more than $1 billion in non-convertible debt in a three-year period, we would cease to be an “emerging growth company” immediately. We cannot predict if investors will find our common stock less attractive if we choose to rely on these exemptions. If some investors find our common stock less attractive as a result of any choices to reduce future disclosure, there may be a less active trading market for our common stock and our stock price may be more volatile.
ITEM 1B. UNRESOLVED STAFF COMMENTS
None.
ITEM 2. PROPERTIES
As of December 31, 2016, we leased approximately 150,000 square feet of space in our domestic and international locations. Approximately 65% of our leased properties are located in the United States and are primarily located in Milpitas, California, which is where our corporate headquarters are located. Our international locations, which comprise approximately 35% of all our properties, are mainly located in China, the Netherlands and the United Kingdom. Our international properties
40
are primarily used for customer service centers, sales offices and research and development facilities. Our current office leases for our headquarters facilities in Milpitas, California will expire in June 2023. See Note 5, Commitments and Contingencies, of the Notes to our Consolidated Financial Statements for information regarding our lease obligations. We believe that our current facilities are suitable and adequate to meet our current needs.
We intend to add new facilities or expand existing facilities as necessary. As we add employees and support new geographic markets, we also intend to add new facilities. We believe that suitable additional or alternative space will be available as needed to accommodate ongoing operations and any such growth. However, such additional or alternative facilities may impose additional expenses on our ongoing operations.
ITEM 3. LEGAL PROCEEDINGS
The information set forth under the "Contingencies" subheading in Note 5 - Commitments and Contingencies of Notes to Consolidated Financial Statements in Part II, Item 8 of this Annual Report on Form 10-K is incorporated herein by reference.
Export Compliance
Our products are subject to U.S. export controls, specifically the Export Administration Regulations, and economic sanctions enforced by the Office of Foreign Assets Control. We incorporate standard encryption algorithms into our products, which, along with the underlying technology, may be exported outside of the United States only with the required export authorizations, including by license, license exception or other appropriate government authorizations. Each of these authorizations may require the filing of an encryption registration and classification request. Furthermore, U.S. export control and trade laws and economic sanctions prohibit the shipment of certain products and services to certain countries, as well as governments and persons targeted by U.S. sanctions. We take precautions to prevent our products and services from being exported in violation of these laws. However, in certain instances we or our channel partners may ship encryption products prior to obtaining the required export authorizations and/or submitting the required requests, including a classification request and request for an encryption registration number. For example, we filed in June 2013 a Voluntary Self Disclosure with the U.S. Department of Commerce’s Bureau of Industry and Security, or BIS, concerning these violations. BIS closed out this disclosure with a warning letter in May 2014 and did not assess penalties. Similar future instances could result in monetary penalties or other penalties assessed against us. Additionally, even though we take precautions to ensure that our channel partners comply with all relevant regulations, any failure by our channel partners to comply with such regulations could have negative consequences for us, including reputational harm, government investigations, and assessments of penalties against us.
ITEM 4. MINE SAFETY DISCLOSURES
Not applicable.
PART II
ITEM 5. MARKET FOR REGISTRANT'S COMMON EQUITY, RELATED STOCKHOLDER MATTERS, AND ISSUER PURCHASES OF EQUITY SECURITIES
Market Information
Our common stock, $0.001 par value per share, has been trading on the New York Stock Exchange since March 28, 2014, under the symbol “HIVE.”
Holders of Record
As of December 31, 2016, there were approximately 26 holders of record of our common stock. Because many of our shares of common stock are held by brokers and other institutions on behalf of stockholders, we are unable to estimate the total number of stockholders represented by these record holders.
Price Range of Our Common Stock
The following table sets forth the reported high and low sales prices of our common stock, as quoted on the New York Stock Exchange:
High | Low | ||||||
Year Ended December 31, 2015 | |||||||
First Quarter | $ | 4.90 | $ | 3.43 | |||
Second Quarter | $ | 8.35 | $ | 4.35 | |||
Third Quarter | $ | 8.10 | $ | 5.43 | |||
Fourth Quarter | $ | 7.48 | $ | 4.98 | |||
Year Ended December 31, 2016 | |||||||
First Quarter | $ | 5.35 | $ | 4.08 | |||
Second Quarter | $ | 6.92 | $ | 4.89 | |||
Third Quarter | $ | 7.45 | $ | 5.83 | |||
Fourth Quarter | $ | 6.30 | $ | 4.55 | |||
42
Stock Performance Graph
The following graph compares, for the period ending December 31, 2016, the cumulative total stockholder returns for our common stock, the NYSE Composite Index and the NYSE Arca Tech 100 Index. The graph assumes that $100 was invested on March 28, 2014 in each of our common stock, the NYSE Composite Index and the NYSE Arca Tech 100 Index and assumes reinvestment of any dividends. The stock price performance on the following graph is not necessarily indicative of future price performance of our stock. This performance graph shall not be deemed “filed” for purposes of Section 18 of the Securities Exchange Act of 1934, as amended, or the Exchange Act, or incorporated by reference into any of our filings under the Exchange Act or the Securities Act of 1933, as amended, except as shall be expressly set forth by specific reference in such filing.
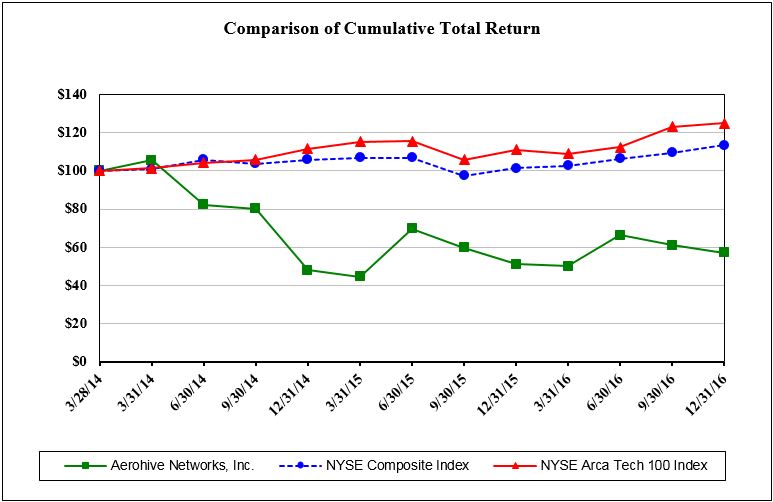
Dividend Policy
We have never declared or paid cash dividends on our common stock. Our various credit facilities currently restrict our ability to pay dividends while these facilities remain outstanding. We currently intend to retain all available funds and any future earnings for use in the operation of our business and do not anticipate paying any dividends on our common stock in the foreseeable future. Any future determination to declare dividends will be made at the discretion of our board of directors, in accordance with applicable law, will require the approval of certain of our lenders and will depend on our financial condition, operating results, capital requirements, general business conditions and other factors that our Board may deem relevant.
ITEM 6. SELECTED CONSOLIDATED FINANCIAL DATA
The following selected historical financial data below should be read in conjunction with Item 7, “Management’s Discussion and Analysis of Financial Condition and Results of Operations,” our financial statements, and the related notes appearing in Item 8, “Financial Statements and Supplementary Data,” of this Annual Report on Form 10-K to fully understand factors that may affect the comparability of the information presented below.
We derived the selected consolidated statement of operations data for the years ended December 31, 2016, 2015 and 2014, and the consolidated balance sheet data as of December 31, 2016 and 2015 from our audited consolidated financial statements included elsewhere in this report. We derived the selected consolidated statements of operations data for the years
43
ended December 31, 2013 and 2012, and the consolidated balance sheet data as of December 31, 2014, 2013, and 2012 from audited financial statements not included in this report. Our historical results are not necessarily indicative of the results that may be expected in the future.
Year Ended December 31, | |||||||||||||||||||
2016 | 2015 | 2014 | 2013 | 2012 | |||||||||||||||
(As Adjusted)* | (As Adjusted)* | (As Adjusted)* | (As Adjusted)* | ||||||||||||||||
(in thousands, except share and per share data) | |||||||||||||||||||
Consolidated Statements of Operations Data: | |||||||||||||||||||
Revenue: | |||||||||||||||||||
Product | $ | 136,570 | $ | 126,281 | $ | 120,507 | $ | 97,564 | $ | 66,631 | |||||||||
Software subscription and services | 33,255 | 25,378 | 16,785 | 9,571 | 4,584 | ||||||||||||||
Total revenue | 169,825 | 151,659 | 137,292 | 107,135 | 71,215 | ||||||||||||||
Cost of revenue(1): | |||||||||||||||||||
Product | 43,231 | 40,496 | 38,365 | 31,431 | 24,203 | ||||||||||||||
Software subscription and services | 12,066 | 9,897 | 6,400 | 4,250 | 1,797 | ||||||||||||||
Total cost of revenue | 55,297 | 50,393 | 44,765 | 35,681 | 26,000 | ||||||||||||||
Gross profit | 114,528 | 101,266 | 92,527 | 71,454 | 45,215 | ||||||||||||||
Operating expenses: | |||||||||||||||||||
Research and development(1) | 41,504 | 36,924 | 27,546 | 25,742 | 16,081 | ||||||||||||||
Sales and marketing(1) | 80,998 | 81,089 | 70,846 | 56,147 | 41,641 | ||||||||||||||
General and administrative(1) | 28,839 | 26,303 | 21,180 | 17,689 | 8,521 | ||||||||||||||
Total operating expenses | 151,341 | 144,316 | 119,572 | 99,578 | 66,243 | ||||||||||||||
Operating loss | (36,813 | ) | (43,050 | ) | (27,045 | ) | (28,124 | ) | (21,028 | ) | |||||||||
Interest income | 468 | 108 | 37 | 15 | 10 | ||||||||||||||
Interest expense | (474 | ) | (1,209 | ) | (1,843 | ) | (604 | ) | (221 | ) | |||||||||
Other income (expense), net | 177 | 285 | 255 | (2,462 | ) | (2,036 | ) | ||||||||||||
Loss before income taxes | (36,642 | ) | (43,866 | ) | (28,596 | ) | (31,175 | ) | (23,275 | ) | |||||||||
Income tax provision | 269 | 352 | 441 | 426 | 339 | ||||||||||||||
Net loss | $ | (36,911 | ) | $ | (44,218 | ) | $ | (29,037 | ) | $ | (31,601 | ) | $ | (23,614 | ) | ||||
Net loss per share allocable to common stockholders, basic and diluted | $ | (0.73 | ) | $ | (0.93 | ) | $ | (0.80 | ) | $ | (4.60 | ) | $ | (4.01 | ) | ||||
Weighted-average shares used in computing net loss per share allocable to common stockholders, basic and diluted | 50,332,872 | 47,323,253 | 36,097,405 | 6,866,839 | 5,884,751 | ||||||||||||||
(1)Stock-based compensation expense included in the consolidated statements of operations data above was as follows:
Year Ended December 31, | |||||||||||||||||||
2016 | 2015 | 2014 | 2013 | 2012 | |||||||||||||||
(in thousands) | |||||||||||||||||||
Cost of revenue | $ | 1,305 | $ | 902 | $ | 411 | $ | 64 | $ | 13 | |||||||||
Research and development | 5,393 | 4,651 | 2,419 | 929 | 264 | ||||||||||||||
Sales and marketing | 8,269 | 7,112 | 4,121 | 1,573 | 483 | ||||||||||||||
General and administrative | 6,735 | 5,706 | 3,301 | 1,721 | 346 | ||||||||||||||
Total stock-based compensation expense | $ | 21,702 | $ | 18,371 | $ | 10,252 | $ | 4,287 | $ | 1,106 | |||||||||
* Certain amounts have been adjusted for the retrospective changes in accounting policy for sales commissions (See Note 1 to our Consolidated Financial Statements). | |||
44
As of December 31, | |||||||||||||||||||
2016 | 2015 | 2014 | 2013 | 2012 | |||||||||||||||
(As Adjusted)* | (As Adjusted)* | (As Adjusted)* | (As Adjusted)* | ||||||||||||||||
(in thousands) | |||||||||||||||||||
Consolidated Balance Sheet Data: | |||||||||||||||||||
Cash and cash equivalents | $ | 34,346 | $ | 45,741 | $ | 98,044 | $ | 35,023 | $ | 29,585 | |||||||||
Short-term investments | 42,408 | 46,593 | — | — | — | ||||||||||||||
Working capital | 50,073 | 79,414 | 83,184 | 23,268 | 30,707 | ||||||||||||||
Total assets | 136,483 | 147,652 | 149,014 | 73,100 | 56,490 | ||||||||||||||
Total deferred revenue | 65,904 | 59,262 | 46,155 | 30,570 | 16,704 | ||||||||||||||
Total debt and capital lease obligations | 21,120 | 20,000 | 19,752 | 19,624 | 10,000 | ||||||||||||||
Convertible preferred stock warrant liability(1) | — | — | — | 3,903 | 3,352 | ||||||||||||||
Total stockholders’ equity (deficit)(1) | 28,688 | 40,931 | 62,916 | (102 | ) | 13,172 | |||||||||||||
(1)The outstanding convertible preferred stock converted to common shares following the close of the Company's initial public offering.
* Certain amounts have been adjusted for the retrospective changes in accounting policy for sales commissions (See Note 1 to our Consolidated Financial Statements). | |||
ITEM 7. MANAGEMENT’S DISCUSSION AND ANALYSIS OF FINANCIAL CONDITION AND RESULTS OF OPERATIONS
You should read the following discussion and analysis of our financial condition and results of operations together with the consolidated financial statements and related notes that are included elsewhere in this report. This discussion contains forward-looking statements based upon current expectations that involve risks and uncertainties. Our actual results may differ materially from those anticipated in these forward-looking statements as a result of various factors, including those set forth under Item 1A, “Risk Factors” and in other parts of this report.
Overview
Our goal is to be the leading independent cloud networking company that simplifies and transforms the connected experience through information, applications and insights. We have designed and developed a leading cloud-managed networking platform that enables enterprises to deploy and manage a mobile-centric network edge. Our platform builds on the foundation of our Wi-Fi and wired network infrastructure. Our platform also connects and stores valuable data about the network and the users of the network that can enable better IT and business applications. Customers around the world, from Fortune 500 businesses to small schools, have chosen our products.
In fiscal 2016, we continued our year-over-year revenue growth. For fiscal years 2016, 2015 and 2014, our revenue was $169.8 million, $151.7 million and $137.3 million, respectively, representing year-over-year growth of 12% from fiscal 2015 to fiscal 2016 and 10% from fiscal 2014 to fiscal 2015. In fiscal years 2016, 2015 and 2014, our net losses were $36.9 million, $44.2 million and $29.0 million, respectively.
We primarily conduct business in three geographic regions: (1) Americas, (2) Europe, the Middle East and Africa, or EMEA, and (3) Asia Pacific, or APAC. From a geographic perspective, year-over-year revenue increased by 5% in the Americas and 22% in EMEA and increased by 36% in APAC. For the fiscal year ended 2016, 60% of our total revenue was generated from Americas, 29% from EMEA and 11% from APAC.
Opportunities and Challenges
We believe that the growth of our business and our future success depends upon many factors, including our ability to continue to develop innovative technologies and timely provide new product offerings to the marketplace; increase our sales capabilities and develop our channel partner program; acquire new end-customers, expand our end-customer base and increase penetration within our existing end-customer base (including through new product offerings); demonstrate revenue growth to
45
our investors and financial analysts and at the same time demonstrate that we can achieve profitability on an acceptable timeline.
We operate in the highly competitive wired and wireless network access products market, which is characterized by rapid technological innovation. We will need to continue to innovate in order to achieve market adoption of our products and services. We have continued the expansion of our product portfolio with the release of new Wi-Fi access points, access switches and management software to allow us to deliver a unified wired and wireless network edge.
In the wireless market, we have seen almost all customer demand shift to the 802.11ac standard, which uses new radio hardware to deliver substantially higher wireless performance. In 2016, we continued the push towards higher performance with the release of our 802.11ac "Wave 2" access points. We continue to develop new functionality in our product offerings to take advantage of the changes to industry standards, including continued evolution of "Wave 2" and emerging work on the new 802.11ax standard.
We have developed a cloud services platform to provide network management and support additional value-added applications. HiveManager NG, the newest version of our network management application, provides a single management interface that customers use to configure network policies, monitor and troubleshoot performance, manage access and security, and run reports on network operations. We will continue to sell and support older version of HiveManager as well. Our focus is to continue to transition our business to HiveManager NG and make our cloud services platform and applications available to customers in either a subscription public cloud or on-premises private cloud deployment.
Our business is seasonal, with our product revenue typically decreasing in our first quarter but sequentially increasing from our fiscal first to second quarter. This has generally been due to annual budget cycles in the enterprise and spending seasonality in the education vertical. The buying cycle for K-12 schools in the United States historically has driven strong sequential growth for us in the second quarter, which we also see typically carry over from our second quarter to our third quarter. We also historically have seen a sequential increase in revenue in our fourth quarter from our third quarter due to end-of-year spending by enterprise customers.
Beginning in 2015, however, our seasonal trend changed as compared to prior years, primarily due to the change in timing of K-12 education spending in the United States based on the availability of funding under the E-Rate program. The program provides discounts to assist schools and libraries in the United States to obtain affordable telecommunications and Internet access. Significant funding for Wi-Fi products under the E-Rate program led certain schools to defer purchases depending on the timing of available E-Rate funding for their projects. As a result, we believe that beginning in 2015, E-Rate has increased seasonal variations in demand for our products and services in the education vertical and, based on the uncertain timing of availability of E-Rate funding, continues to cause schools to defer and delay purchasing decisions. This continues to make it more difficult for us to predict revenue from our education vertical during a particular period during the year. For example, on October 13, 2016, we provided preliminary revenue for our third quarter ending September 30, 2016 and a preliminary revenue outlook for our fourth quarter ending December 31, 2016, which we further discussed on our November 2, 2016 earnings call. Our third quarter revenue was below the estimates of financial analysts at that time, as was the revenue outlook we provided at that time for our fourth quarter. On February 14, 2017, we announced our revenue results for our fourth quarter of fiscal year 2016, which was below the revenue outlook we had provided for the period in November 2016.
We believe that the significantly slower pace of order volume in our education vertical in the third and fourth quarters, specifically due to slower pace of funding approvals under the federal E-Rate program, was one of the primary drivers of lower-than-expected order volume and revenue performance in our third quarter and our lowered revenue outlook for our fourth quarter. We also believe that we introduced our new HiveManager NG product to some of our larger and more complex customers before its feature set was able to fully address their requirements, which resulted in elongated sales cycles and reduced revenue opportunities, which specifically contributed to our lower revenue performance in the fourth quarter and our outlook for the first quarter of our fiscal year 2017. We believe that the lower-level of E-Rate funded transactions and lengthier sales cycle associated with our HiveManager NG offering will continue to affect our revenue opportunities and operating results into 2017.
We realize that our revenue-dependence on the volatile education market may continue to bring uncertainty to our results. For this reason, a priority for our business continues to expand and diversify our offerings and revenue opportunities into other verticals, with particular focus on enterprise customers. We also intend to continue to invest significant resources in the development of our innovative technologies and new product offerings, acquire new end-customers in new and existing geographies, and increase penetration within our existing end-customer base. We expect to continue to invest in our organization and our channel and strategic partnerships to meet the needs of our customers to pursue opportunities in new and existing markets. In particular, we are investing to increase our sales capacity as well as our channel program. As such, we will continue to incur expenses in the near term, due to our continuing investments to grow our business, including internationally, in advance of and in preparation for, our expected increase in sales and expansion of our customer base. As a result, we may not be profitable for the foreseeable future and our use of cash over this period could also be greater and extend over a longer
46
period as we make investments in areas of our operations, such as sales, marketing and research and product and channel partner development, which we feel may promote our growth and profitability over the long term. We believe that over the long term, we will be able to leverage these investments in the form of a higher revenue growth rate compared to the growth rate of our operating expenses.
Key Financial Metrics
We regularly review the following key financial metrics to evaluate growth trends in our business, measure our performance, identify trends affecting our business, formulate financial projections and make strategic decisions. Our key financial metrics include non-GAAP financial metrics. We discuss revenue under “Results of Operations.” We discuss cash used in operating activities, deferred revenue and non-GAAP financial measures immediately below the following table.
Year Ended December 31, | |||||||||||
2016 | 2015 | 2014 | |||||||||
(in thousands) | |||||||||||
Total revenue | $ | 169,825 | $ | 151,659 | $ | 137,292 | |||||
Total deferred revenue at period end | 65,904 | 59,262 | 46,155 | ||||||||
Cash used in operating activities | (14,554 | ) | (4,957 | ) | (8,748 | ) | |||||
Cash used in operating activities. We monitor cash used in operating activities as a measure of our overall business performance. Our largest uses of cash from operating activities are for employee-related expenditures and purchases of products from our contract manufactures. Our primary source of cash flows from operating activities is cash receipts from our channel partners. Monitoring net cash used in operating activities enables us to analyze our financial performance without the non-cash effects of certain items such as depreciation, amortization, and stock-based compensation costs, thereby allowing us to better understand and manage the cash needs of our business.
Deferred Revenue. Our deferred revenue consists of amounts that have either been invoiced or prepaid but that have not yet been recognized as revenue as of the period end. We consider deferred revenue to be a key financial metric, because it represents a significant portion of the revenue that we expect to recognize in future periods. In addition, we monitor the change in our deferred revenue balance, which, taken together with revenue, is an indication of sales activity in a given period. The vast majority of our deferred revenue comprises future software subscription and services revenue, primarily for PCS and SaaS, which we recognize ratably over the service term. The majority of our deferred product revenue comprises hardware products that we have shipped to our VADs in advance of shipment to our end-customers. The following table reconciles between the current and non-current deferred revenue:
As of December 31, | |||||||||||
2016 | 2015 | 2014 | |||||||||
(in thousands) | |||||||||||
Product | $ | 1,220 | $ | 3,199 | $ | 3,886 | |||||
Software Subscription and Services | 64,684 | 56,063 | 42,269 | ||||||||
Total deferred revenue | 65,904 | 59,262 | 46,155 | ||||||||
Less: current portion of deferred revenue | 31,727 | 27,893 | 22,014 | ||||||||
Non-current portion of deferred revenue | $ | 34,177 | $ | 31,369 | $ | 24,141 | |||||
Non-GAAP financial measures. We regularly review non-GAAP financial measures because they are key measures used by our management and our board of directors to evaluate the business, measure performance, identify trends affecting the business, formulate financial projections and make strategic decisions.
We define non-GAAP financial measures to exclude share-based compensation, adjustment to internal-use software amortization, amortization of acquired intangibles, one-time charges related to certain securities litigation, one-time charges related to headquarter relocation expense, and the periodic fair value re-measurements related to convertible preferred stock warrants. We believe that the exclusion of certain expenses in calculating these non-GAAP financial measures can provide a useful measure for period-to-period comparisons of our core business. Accordingly, we believe that non-GAAP financial measures provide useful information to investors and others in understanding and evaluating our operating results in the same manner as does our management and our board of directors.
The following table reconciles GAAP to non-GAAP measures:
47
Year Ended December 31, | |||||||||||
2016 | 2015 | 2014 | |||||||||
(in thousands) | |||||||||||
(As Adjusted)* | (As Adjusted)* | ||||||||||
GAAP net loss | $ | (36,911 | ) | $ | (44,218 | ) | $ | (29,037 | ) | ||
Amortization of stock-based compensation related to internal-use software - Cost of revenue | 140 | 105 | — | ||||||||
Amortization of acquired intangible assets - Cost of revenue | — | — | 149 | ||||||||
Stock-based compensation - Cost of revenue | 1,305 | 902 | 411 | ||||||||
Stock-based compensation - Research and development | 5,393 | 4,651 | 2,419 | ||||||||
Stock-based compensation - Sales and marketing | 8,269 | 7,112 | 4,121 | ||||||||
Stock-based compensation - General and administrative | 6,735 | 5,706 | 3,301 | ||||||||
One-time charges related to securities litigation - General and administrative | 1,446 | 784 | — | ||||||||
One-time charges related to headquarter relocation - General and administrative | 890 | — | — | ||||||||
Periodic re-measurement of convertible preferred stock warrants | — | — | (90 | ) | |||||||
Non-GAAP net loss | $ | (12,733 | ) | $ | (24,958 | ) | $ | (18,726 | ) | ||
Basic and diluted net loss per share on a Non-GAAP basis | $ | (0.25 | ) | $ | (0.53 | ) | $ | (0.52 | ) | ||
Weighted average shares used in computing non-GAAP basic and diluted net loss per share | 50,332,872 | 47,323,253 | 36,097,405 | ||||||||
* Certain amounts have been adjusted for the retrospective changes in accounting policy for sales commissions (See Note 1 to our Consolidated Financial Statements). | |||
Although investors frequently use non-GAAP financial measures in their evaluations of companies, these non-GAAP financial measures have limitations in that they do not reflect all of the amounts associated with our results of operations as determined in accordance with GAAP. Some of these limitations are:
• | the non-GAAP measures do not consider the expense related to stock-based compensation, which is an ongoing expense for us; |
• | although amortization is a non-cash charge, the assets being amortized often will have to be replaced in the future, and non-GAAP gross profit, non-GAAP gross margin, non-GAAP operating loss, non-GAAP operating loss percentage, non-GAAP net loss, and non-GAAP loss per share do not reflect any cash requirement for such replacements; |
• | non-GAAP net loss and non-GAAP net loss per share do not reflect our periodic fair value re-measurements related to convertible preferred stock warrants; |
• | securities litigation may continue for an extended duration and excluding the associated expense does not reflect the impact on our ongoing operations over this period of the cash requirement to defend such litigation; |
• | headquarter relocation expense includes one-time charges related to the cease-use loss upon vacating buildings of our prior headquarter and double rent and utilities expenses during the transition to our new headquarter facility and excluding those will provide a useful measure for period-to-period comparisons; and |
• | other companies, including companies in our industry, may calculate these non-GAAP financial measures differently, which reduces their usefulness as a comparative measure. |
Because of these limitations, you should consider non-GAAP financial measures only together with other financial performance measures, including various cash flow metrics, net loss and other GAAP results.
48
Results of Operations
The following table sets forth our results of operations for the periods presented in dollars (in thousands):
Year Ended December 31, | |||||||||||
2016 | 2015 | 2014 | |||||||||
Revenue: | (As Adjusted)* | (As Adjusted)* | |||||||||
Product | $ | 136,570 | $ | 126,281 | $ | 120,507 | |||||
Software subscription and services | 33,255 | 25,378 | 16,785 | ||||||||
Total revenue | 169,825 | 151,659 | 137,292 | ||||||||
Cost of revenue(1): | |||||||||||
Product | 43,231 | 40,496 | 38,365 | ||||||||
Software subscription and services | 12,066 | 9,897 | 6,400 | ||||||||
Total cost of revenue | 55,297 | 50,393 | 44,765 | ||||||||
Gross profit | 114,528 | 101,266 | 92,527 | ||||||||
Operating expenses: | |||||||||||
Research and development(1) | 41,504 | 36,924 | 27,546 | ||||||||
Sales and marketing(1) | 80,998 | 81,089 | 70,846 | ||||||||
General and administrative(1) | 28,839 | 26,303 | 21,180 | ||||||||
Operating loss | (36,813 | ) | (43,050 | ) | (27,045 | ) | |||||
Interest income | 468 | 108 | 37 | ||||||||
Interest expense | (474 | ) | (1,209 | ) | (1,843 | ) | |||||
Other income (expense), net | 177 | 285 | 255 | ||||||||
Loss before income taxes | (36,642 | ) | (43,866 | ) | (28,596 | ) | |||||
Provision for income taxes | 269 | 352 | 441 | ||||||||
Net loss | $ | (36,911 | ) | $ | (44,218 | ) | $ | (29,037 | ) | ||
(1)Includes stock-based compensation, as follows:
Year Ended December 31, | |||||||||||
2016 | 2015 | 2014 | |||||||||
(in thousands) | |||||||||||
Cost of revenue | $ | 1,305 | $ | 902 | $ | 411 | |||||
Research and development | 5,393 | 4,651 | 2,419 | ||||||||
Sales and marketing | 8,269 | 7,112 | 4,121 | ||||||||
General and administrative | 6,735 | 5,706 | 3,301 | ||||||||
Total stock-based compensation expense | $ | 21,702 | $ | 18,371 | $ | 10,252 | |||||
* Certain amounts have been adjusted for the retrospective changes in accounting policy for sales commissions (See Note 1 to our Consolidated Financial Statements). | |||
49
The following table sets forth our results of operations for the periods presented, as a percentage of our total revenue:
Year Ended December 31, | ||||||||
2016 | 2015 | 2014 | ||||||
Revenue: | (As Adjusted)* | (As Adjusted)* | ||||||
Product | 80 | % | 83 | % | 88 | % | ||
Software subscription and services | 20 | 17 | 12 | |||||
Total revenue | 100 | 100 | 100 | |||||
Cost of revenue: | ||||||||
Product | 26 | 26 | 28 | |||||
Software subscription and services | 7 | 7 | 5 | |||||
Total cost of revenue | 33 | 33 | 33 | |||||
Gross profit | 67 | 67 | 67 | |||||
Operating expenses: | ||||||||
Research and development | 24 | 24 | 21 | |||||
Sales and marketing | 48 | 54 | 52 | |||||
General and administrative | 17 | 17 | 15 | |||||
Operating loss | (22 | ) | (28 | ) | (20 | ) | ||
Interest income | — | — | — | |||||
Interest expense | — | (1 | ) | (1 | ) | |||
Other income (expense), net | — | — | — | |||||
Loss before income taxes | (22 | ) | (29 | ) | (21 | ) | ||
Provision for income taxes | — | — | — | |||||
Net loss | (22 | )% | (29 | )% | (21 | )% | ||
* Certain amounts have been adjusted for the retrospective changes in accounting policy for sales commissions (See Note 1 to our Consolidated Financial Statements). | |||
50
Revenue
We derive revenue from the sales of our products and services, and we recognize revenue when persuasive evidence of an arrangement exists, delivery has occurred, the fee is fixed or determinable, and collectability is reasonably assured. We expect our revenue to vary from quarter to quarter based on seasonal and cyclical factors.
Our total revenue comprises the following:
Product Revenue. We derive product revenue primarily from sales of our hardware products, which include wireless access points, branch routers, and switches, all of which are embedded with our proprietary operating system, HiveOS, and perpetual licenses of our unified network management system, HiveManager, and other software applications, as well as related accessories. We recognize product revenue at the time of shipment, provided that all other revenue recognition criteria have been met. For our VAD arrangements, where we permit our VADs to stock inventory, we recognize revenue when our VADs have shipped the products to our end-customers (or to VARs that have identified end-customers), provided that all other revenue recognition criteria have been met.
Software Subscription and Services Revenue. We derive software subscription and services revenue primarily from sales of our software subscription and services offerings that we deliver over a specified term. These offerings primarily include PCS related to our perpetual software licenses and subscriptions to HiveManager and other software applications delivered as SaaS, including related customer support, and from subsequent renewals of those contracts. To benefit fully from potential contract renewals, we plan to continue to invest in systems to better track existing customer support commitments and renewal opportunities and provide offerings which continue to be attractive to our customers. Our PCS includes tiered maintenance and support services under renewable, fee-based maintenance and support contracts, which include technical support, bug fixes, access to priority hardware replacement services and unspecified upgrades on a when-and-if available basis. Our SaaS subscriptions include comparable maintenance and support services. The higher the percentage of our end-customers that purchase SaaS subscriptions, as opposed to HiveManager and PCS, the higher our software subscription and services revenue will be as a percentage of our total revenue. We recognize software subscription and services revenue ratably over the term of the contract, which is typically one, three or five years. As a result, our recognition of software subscription and services revenue lags our recognition of related product revenue.
Year Ended December 31, | 2016 to 2015 | 2015 to 2014 | |||||||||||||||||||||||
2016 | 2015 | 2014 | $ Change | % Change | $ Change | % Change | |||||||||||||||||||
(dollars in thousands) | |||||||||||||||||||||||||
Revenue: | |||||||||||||||||||||||||
Product | $ | 136,570 | $ | 126,281 | $ | 120,507 | $ | 10,289 | 8 | % | $ | 5,774 | 5 | % | |||||||||||
Software subscription and services | 33,255 | 25,378 | 16,785 | 7,877 | 31 | % | 8,593 | 51 | % | ||||||||||||||||
Total revenue | $ | 169,825 | $ | 151,659 | $ | 137,292 | $ | 18,166 | 12 | % | $ | 14,367 | 10 | % | |||||||||||
Percentage of revenue: | |||||||||||||||||||||||||
Product | 80 | % | 83 | % | 88 | % | |||||||||||||||||||
Software subscription and services | 20 | % | 17 | % | 12 | % | |||||||||||||||||||
Total | 100 | % | 100 | % | 100 | % | |||||||||||||||||||
51
Year Ended December 31, | 2016 to 2015 | 2015 to 2014 | |||||||||||||||||||||||
2016 | 2015 | 2014 | $ Change | % Change | $ Change | % Change | |||||||||||||||||||
(dollars in thousands) | |||||||||||||||||||||||||
Revenue by geographic region: | |||||||||||||||||||||||||
Americas | $ | 102,458 | $ | 97,811 | $ | 86,946 | $ | 4,647 | 5 | % | $ | 10,865 | 12 | % | |||||||||||
EMEA | 49,681 | 40,876 | 36,317 | 8,805 | 22 | % | 4,559 | 13 | % | ||||||||||||||||
APAC | 17,686 | 12,972 | 14,029 | 4,714 | 36 | % | (1,057 | ) | (8 | )% | |||||||||||||||
Total revenue | $ | 169,825 | $ | 151,659 | $ | 137,292 | $ | 18,166 | 12 | % | $ | 14,367 | 10 | % | |||||||||||
Percentage of revenue by geographic region: | |||||||||||||||||||||||||
Americas | 60 | % | 64 | % | 64 | % | |||||||||||||||||||
EMEA | 29 | % | 27 | % | 26 | % | |||||||||||||||||||
APAC | 11 | % | 9 | % | 10 | % | |||||||||||||||||||
Total | 100 | % | 100 | % | 100 | % | |||||||||||||||||||
2016 Compared to 2015. Our total revenue increased $18.2 million, or 12% in fiscal 2016 as compared to fiscal 2015, due to the increasing demand for our products and software subscription and services offerings.
The increase in our product revenue was primarily the result of an aggregate increase in product unit shipments largely driven by sales of our intelligent Wi-Fi access points.
The increase in our software subscription and services revenue of $7.9 million in fiscal 2016 compared to fiscal 2015, was primarily driven by the increase in sales of PCS and SaaS, including our HiveManager NG cloud management platform that was introduced in early 2015, in connection with increased sales of products and an increase in the number of our end-customers, and our recognition of deferred revenue in the period.
The Americas and EMEA accounted for the majority of our total revenue and the increase of revenue in both regions was primarily due to increased demand for our products in these regions.
2015 Compared to 2014. Our total revenue increased $14.4 million, or 10%, in fiscal 2015 as compared to fiscal 2014, due to the increasing demand for our products and software subscription and services offerings.
The increase in our product revenue was primarily the result of an aggregate increase in product unit shipments largely driven by sales of our intelligent Wi-Fi access points.
The increase in our software subscription and services revenue of $8.6 million in fiscal 2015 compared to fiscal 2014 was primarily driven by the increase in sales of PCS and SaaS, including our HiveManager NG cloud management platform that was introduced in early 2015, in connection with increased sales of products and an increase in the number of our end-customers, and our recognition of deferred revenue in the period.
Cost of Revenue
Our cost of revenue includes the following:
Cost of Product Revenue. Our cost of product revenue primarily includes manufacturing costs of our products payable to third-party manufacturers. Our cost of product revenue also includes personnel costs, including stock-based compensation, shipping costs, third-party logistics costs, provisions for excess and obsolete inventory, warranty and replacement costs, the depreciation and amortization of testing and imaging equipment, inbound license fees, certain allocated facilities and information technology infrastructure costs, and other expenses associated with logistics and quality control.
Cost of Software Subscription and Services Revenue. Our cost of software subscription and services revenue primarily includes personnel costs, including stock-based compensation, certain allocated facilities information technology infrastructure costs, costs associated with our provision of PCS and SaaS and datacenter costs. Our cost of software subscription and services revenue also includes amortization of HiveManager NG, our internally developed, next-generation cloud services platform, which we completed and launched in April 2015.
52
Year Ended December 31, | 2016 to 2015 | 2015 to 2014 | |||||||||||||||||||||||
2016 | 2015 | 2014 | $ Change | % Change | $ Change | % Change | |||||||||||||||||||
(dollars in thousands) | |||||||||||||||||||||||||
Cost of revenue: | |||||||||||||||||||||||||
Product | $ | 43,231 | $ | 40,496 | $ | 38,365 | $ | 2,735 | 7 | % | $ | 2,131 | 6 | % | |||||||||||
Software subscription and services | 12,066 | 9,897 | 6,400 | 2,169 | 22 | % | 3,497 | 55 | % | ||||||||||||||||
Total cost of revenues | $ | 55,297 | $ | 50,393 | $ | 44,765 | $ | 4,904 | 10 | % | $ | 5,628 | 13 | % | |||||||||||
2016 Compared to 2015. We primarily attribute the increase in our cost of product revenue to an increase in sales of our products. We primarily relate the increase in our cost of software subscription and services revenue to an increase in cloud operations and support personnel headcount during the year as well as the amortization of our capitalized cloud service platform.
2015 Compared to 2014. We primarily attribute the increase in our cost of product revenue to an increase in sales of our products. We primarily relate the increase in our cost of software subscription and services revenue to an increase in cloud operations and support personnel headcount as well as the amortization of our capitalized cloud service platform.
Gross Margin
Our gross margin or gross profit has been and will continue to be affected by a variety of factors, including product shipment volumes, average sales prices of our products, discounts we offer to our VAR and VAD partners, the mix of revenue between products and software subscription and services, and the mix of hardware products sold, because our hardware products have varying gross margins depending on the product offering and the lifecycle of the product. Historically, our software subscription and services gross margin has been lower than our product gross margin; however, we expect our software subscription and services gross margin to increase over the long term because we expect our software subscription and services revenue to increase more quickly than our cost of software subscription and services revenue. We expect our gross margin to be volatile and may decrease in any given time in the event we experience additional competitive pricing pressure.
2016 | 2015 | 2014 | ||||||||||||||||||
Amount | Gross Margin | Amount | Gross Margin | Amount | Gross Margin | |||||||||||||||
(dollars in thousands) | ||||||||||||||||||||
Gross margin: | ||||||||||||||||||||
Product | $ | 93,339 | 68.3 | % | $ | 85,785 | 67.9 | % | $ | 82,142 | 68.2 | % | ||||||||
Software subscription and services | 21,189 | 63.7 | % | 15,481 | 61.0 | % | 10,385 | 61.9 | % | |||||||||||
Total gross margin | $ | 114,528 | 67.4 | % | $ | 101,266 | 66.8 | % | $ | 92,527 | 67.4 | % | ||||||||
2016 Compared to 2015. The increase in our product gross margin was primarily due to the product mix and continued improvement of cost efficiencies in our product design and supply chain management as well as efficiencies in the manufacturing costs. The increase in our software subscription and services gross margin was primarily due to higher growth in our software subscription and services revenue than our related cost of delivering these software subscription and services.
2015 Compared to 2014. The decrease of our product gross margin was primarily due to the product mix. The decrease in our software subscription and services gross margin was primarily due to the amortization of our capitalized cloud service platform, offset by higher growth in our software subscription and services revenue than our related cost of delivering these software subscription and services.
Research and Development
Our research and development expenses consist primarily of personnel costs, including bonuses, stock-based compensation, recruiting fees and travel expenses for employees engaged in research, design and development activities. Research and development expenses also include costs for prototype-related expenses, product certification, consulting services, depreciation and certain allocated facilities and information technology infrastructure costs. We believe that continued investment in research and development is important to attaining our strategic objectives. Over time, we expect our research and development expenses to continue to increase in absolute dollars for the foreseeable future as we continue to invest in the development of our products and services. Our research and development expenses may fluctuate as a percentage of our total
53
revenue from period to period due to the seasonality of our total revenue and the timing and extent of our research and development expenses.
Year Ended December 31, | 2016 to 2015 | 2015 to 2014 | |||||||||||||||||||||||
2016 | 2015 | 2014 | $ Change | % Change | $ Change | % Change | |||||||||||||||||||
(dollars in thousands) | |||||||||||||||||||||||||
Research and development | $ | 41,504 | $ | 36,924 | $ | 27,546 | $ | 4,580 | 12 | % | $ | 9,378 | 34 | % | |||||||||||
% of revenue | 24 | % | 24 | % | 21 | % | |||||||||||||||||||
2016 Compared to 2015. The increase in our research and development expenses was primarily due to an increase of $4.5 million in personnel and related costs, including stock-based compensation expense of $0.7 million, driven by our increased research and development headcount during the first half of the year to support continued investment in our future product and service offerings. The remaining increase in our research and development expenses was mainly due to higher costs related to product certifications.
2015 Compared to 2014. The increase in our research and development expenses was primarily due to an increase of $4.8 million personnel and related costs, including stock-based compensation expense of $2.2 million, driven by our increased research and development headcount to support continued investment in our future product and service offerings, and a $3.0 million higher capitalized personnel and related costs, including wages, bonuses and stock-based compensation, for development of our cloud services platform in fiscal 2014. In April 2015, we completed and launched such cloud services platform and began to amortize the capitalized development costs as part of the cost of software subscription and services, over an estimated useful life of 5 years.
The remaining increase in our research and development expenses was mainly due to higher costs related to our research and development activities and certain allocated facilities.
Sales and Marketing
Our sales and marketing expenses consist primarily of personnel costs, including commission costs, stock-based compensation, recruiting fees and travel expenses for employees engaged in sales and marketing activities. We historically based commission expenses on completed contracts, which might not match with revenue we recognized in the same period. In the first quarter of 2016, we voluntarily changed our accounting policy for sales commissions to defer the sales commission in proportion to the same period in which we recognize the related revenue. (See Note 1 of our Consolidated Financial Statements included elsewhere in this Form 10-K for more information about our accounting policy for sales commissions.) Sales and marketing expenses also include the cost of trade shows, marketing and training programs, promotional materials, demonstration equipment, consulting services, depreciation and certain allocated facilities and information technology infrastructure costs. Over time, we expect our sales and marketing expenses to continue to increase in absolute dollars as we increase the size of our sales and marketing organization, expand into new markets and further develop our channel program. Our sales and marketing expenses may fluctuate as a percentage of our total revenue from period to period due to the seasonality of our total revenue and the timing and extent of our sales and marketing expenses.
Year Ended December 31, | 2016 to 2015 | 2015 to 2014 | |||||||||||||||||||||||
2016 | 2015 | 2014 | $ Change | % Change | $ Change | % Change | |||||||||||||||||||
(dollars in thousands) | |||||||||||||||||||||||||
(As Adjusted)* | (As Adjusted)* | ||||||||||||||||||||||||
Sales and marketing | $ | 80,998 | $ | 81,089 | $ | 70,846 | $ | (91 | ) | — | % | $ | 10,243 | 14 | % | ||||||||||
% of revenue | 48 | % | 54 | % | 52 | % | |||||||||||||||||||
* Certain amounts have been adjusted for the retrospective changes in accounting policy for sales commissions (See Note 1 to our Consolidated Financial Statements). | |||||||||||||||||||||||||
2016 Compared to 2015. The decrease in our sales and marketing expenses was primarily due to decrease in spending for sales and marketing related programs and travel related expenses offset by increases in stock-based compensation expense.
2015 Compared to 2014. The increase in our sales and marketing expenses was primarily due to increases in personnel and related costs of $9.4 million, including increased headcount, bonuses, stock-based compensation expense and higher commissions. Our sales and marketing expenses also increased due to higher marketing program expenses of $0.5 million and increases in our other sales and marketing related activities of $0.3 million.
54
General and Administrative
Our general and administrative expenses consist primarily of personnel costs, including bonuses, stock-based compensation and travel expenses for our executive, finance, human resources, legal and operations employees, as well as compensation for our board of directors. General and administrative expenses also include fees for outside consulting, legal, audit, investor relations, and accounting service and insurance, as well as depreciation and certain allocated facilities and information technology infrastructure costs. Over time, we expect our general and administrative expenses to continue to increase in absolute dollars due to the additional legal, accounting, insurance, investor relations, information technology and other costs that we will continue to incur as a public company, as well as other costs associated with growing our business. Our general and administrative expenses may fluctuate as a percentage of our total revenue from period to period due to the seasonality of our total revenue and the timing and extent of our general and administrative expenses.
Year Ended December 31, | 2016 to 2015 | 2015 to 2014 | |||||||||||||||||||||||
2016 | 2015 | 2014 | $ Change | % Change | $ Change | % Change | |||||||||||||||||||
(dollars in thousands) | |||||||||||||||||||||||||
General and administrative | $ | 28,839 | $ | 26,303 | $ | 21,180 | $ | 2,536 | 10 | % | $ | 5,123 | 24 | % | |||||||||||
% of revenue | 17 | % | 17 | % | 15 | % | |||||||||||||||||||
2016 Compared to 2015. The increase in our general and administrative expenses was primarily due to increases of $1.8 million in legal expenses, including $1.2 million for a legal settlement payout for our class action complaint related to our Form S-1 filing, an increase of $0.9 million in expenses related to our headquarter relocation, which included lease abandonment costs of $0.6 million. The increase in general and administrative expense was offset by lower compensation and professional services costs.
2015 Compared to 2014. The increase in our general and administrative expenses was primarily due to increases in personnel and related costs of $4.1 million, including stock-based compensation expense of $2.4 million. The increase of general and administrative expenses was also due to higher costs of litigation and professional services.
Interest Income
Our interest income primarily consists of interest earned on our cash and cash equivalent and short-term investments. We have invested our cash in money-market funds and other short-term, high quality investments. Historically, our interest income has not been material.
Year Ended December 31, | 2016 to 2015 | 2015 to 2014 | |||||||||||||||||||||||
2016 | 2015 | 2014 | $ Change | % Change | $ Change | % Change | |||||||||||||||||||
(dollars in thousands) | |||||||||||||||||||||||||
Interest Income | $ | 468 | $ | 108 | $ | 37 | $ | 360 | 333 | % | $ | 71 | 192 | % | |||||||||||
2016 Compared to 2015. Interest income increased for fiscal 2016 compared to fiscal 2015 primarily due to income earned on our short-term investments. We started investing in short-term investments beginning in the fourth quarter of 2015.
2015 Compared to 2014. Interest income increased for fiscal 2015 compared to fiscal 2014 primarily due to income earned on our short-term investments
Interest Expense
Our interest expense consists primarily of interest on our indebtedness.
Year Ended December 31, | 2016 to 2015 | 2015 to 2014 | |||||||||||||||||||||||
2016 | 2015 | 2014 | $ Change | % Change | $ Change | % Change | |||||||||||||||||||
(dollars in thousands) | |||||||||||||||||||||||||
Interest expense | $ | (474 | ) | $ | (1,209 | ) | $ | (1,843 | ) | $ | 735 | (61 | )% | $ | 634 | (34 | )% | ||||||||
2016 Compared to 2015. The decrease in our interest expense for fiscal 2016 compared to fiscal 2015 was primarily due to decrease in interest rate associated with our revolving credit facility.
55
2015 Compared to 2014. Interest expense primarily consisted of interest expense from our loan credit facilities. The decrease in our interest expense was primarily due to the repayment of outstanding obligations under TriplePoint Capital LLC term loan credit facility partially offset by additional borrowing from Silicon Valley Bank under the Revolving Credit Facility as the interest rate is lower under the Silicon Valley Bank revolving credit facility than the former TriplePoint Capital LLC term loan credit facility.
See Note 4 of our Consolidated Financial Statements included elsewhere in this Form 10-K for more information about our debt.
Other Income, Net
Our other income, net primarily consists of gains and losses from foreign currency exchange transactions.
Year Ended December 31, | 2016 to 2015 | 2015 to 2014 | |||||||||||||||||||||||
2016 | 2015 | 2014 | $ Change | % Change | $ Change | % Change | |||||||||||||||||||
(dollars in thousands) | |||||||||||||||||||||||||
Other income, net | $ | 177 | $ | 285 | $ | 255 | $ | (108 | ) | (38 | )% | $ | 30 | 12 | % | ||||||||||
2016 Compared to 2015. The change in our other income is primarily related to changes due to foreign currency fluctuations.
2015 Compared to 2014. The change in our other income, net was not significant.
Provision for Income Taxes
Our provision for income taxes consists primarily of foreign tax expense due to our cost-plus agreements with our foreign entities, which guarantee these foreign entities a profit, and to a lesser extent federal and state income tax expense. We expect our provision for income taxes to increase in absolute dollars in future periods.
Year Ended December 31, | 2016 to 2015 | 2015 to 2014 | |||||||||||||||||||||||
2016 | 2015 | 2014 | $ Change | % Change | $ Change | % Change | |||||||||||||||||||
(dollars in thousands) | |||||||||||||||||||||||||
Provision for income taxes | $ | 269 | $ | 352 | $ | 441 | $ | (83 | ) | (24 | )% | $ | (89 | ) | (20 | )% | |||||||||
The change in our provision for income taxes were primarily related to foreign and state income taxes and were not significant. As of December 31, 2016, and 2015, respectively, we maintained a full valuation allowance against our domestic deferred tax assets, including net operating loss carryforwards and research and development and other tax credits.
56
Liquidity and Capital Resources
Capital Resources
As of December 31, 2016, we had cash and cash equivalents of $34.3 million and short-term investments of $42.4 million. $76.0 million of our cash, cash equivalents and short-term investments were held within the United States.
In June 2012, we entered into the Revolving Credit Facility with Silicon Valley Bank which matures on March 31, 2017. See Note 4 to the Consolidated Financial Statements included in Part II, Item 8 of this Annual Report on Form 10-K. We have been using the amount drawn under the Revolving Credit Facility for working capital and general corporate purposes.
As of December 31, 2016, we had $20.0 million of outstanding debt under our Revolving Credit Facility, and we were in compliance with all covenants under our loan agreement. We believe that our existing cash and cash equivalents will be sufficient to meet our anticipated working capital and capital expenditure needs for at least the next 12 months. Our future capital requirements will depend on many factors, including our growth rate, the timing and extent of our spending to support our research and development efforts, the expansion of our sales and marketing activities, the introduction of new and enhanced product and service offerings, the costs to ensure access to adequate manufacturing capacity, the level of market acceptance of our products and expenses we may incur in conjunction with our ongoing litigation. However, we may be required to raise additional funds in the future through public or private debt or equity financing to meet additional working capital requirements.
Cash Flows
The following table summarizes our cash flows for the periods indicated:
Year Ended December 31, | |||||||||||
2016 | 2015 | 2014 | |||||||||
(in thousands) | |||||||||||
Net cash used in operating activities | $ | (14,554 | ) | $ | (4,957 | ) | $ | (8,748 | ) | ||
Net cash provided by (used in) investing activities | 276 | (50,908 | ) | (6,749 | ) | ||||||
Net cash provided by financing activities | 2,883 | 3,562 | 78,518 | ||||||||
Net increase (decrease) in cash and cash equivalents | $ | (11,395 | ) | $ | (52,303 | ) | $ | 63,021 | |||
Operating Activities
We recently demonstrated positive cash flow in our third and fourth quarters of 2015 and our third quarter of 2016. However, we have historically experienced negative cash flows from operating activities as we continue to invest in our business. Our largest uses of cash from operating activities is for employee-related expenditures and purchases of finished products from our contract manufacturers. Our primary source of cash flows from operating activities is cash receipts from our channel partners. Our cash flows from operating activities will continue to be affected principally by the extent to which we grow our total revenue and our operating expenses, primarily in our sales and marketing and research and development functions, in order to grow our business.
For fiscal 2016, operating activities used $14.6 million of cash as a result of our net loss of $36.9 million, partially offset by non-cash charges of $25.5 million and a net change of $3.2 million in our net operating assets and liabilities. Non-cash charges consisted primarily of stock-based compensation of $21.7 million and depreciation and amortization expense of $3.5 million. The net change in our net operating assets and liabilities was primarily due to a $6.6 million increase in deferred revenue as a result of an increase in sales of PCS and SaaS, and $2.1 million decrease in prepaid expenses and other current assets, partially offset by a decrease of $4.5 million in accounts payable and $2.6 million in accrued liabilities, an increase of $3.4 million in accounts receivable and $1.9 million in cash used for inventory purchases. Our days sales outstanding, or DSO, was 58 days as of December 31, 2016, which we calculate by dividing net accounts receivable at the end of the quarter by revenue recognized during the quarter, multiplied by the total days in the quarter.
For fiscal 2015, operating activities used $5.0 million of cash as a result of our net loss of $44.2 million, partially offset by non-cash charges of $22.3 million and a net change of $17.0 million in our net operating assets and liabilities. Non-cash charges consisted primarily of stock-based compensation of $18.4 million and depreciation and amortization expense of $3.5 million. The net change in our net operating assets and liabilities was primarily due to a $13.1 million increase in deferred revenue as a result of an increase in sales of PCS and SaaS, an increase of $5.2 million in accounts payable, and an increase of $3.1 million in accrued liabilities, partially offset by an increase of $1.9 million in accounts receivable, $2.4 million in cash used for inventory purchases and $2.5 million increase in prepaid expenses and other current assets. Our DSO was 45 days as of December 31, 2015.
57
For fiscal 2014, operating activities used $8.7 million of cash as a result of our net loss of $29.0 million, partially offset by non-cash charges of $12.7 million and a net change of $7.6 million in our net operating assets and liabilities. Non-cash charges consisted primarily of stock-based compensation of $10.3 million and depreciation and amortization expense of $2.3 million. The net change in our net operating assets and liabilities was primarily due to a $15.6 million increase in deferred revenue as a result of an increase in sales of PCS and SaaS, an increase of $1.6 million in accrued liabilities, and an increase of $1.3 million in accounts payable, partially offset by an increase of $7.1 million in accounts receivable, $1.5 million in cash used for inventory purchases and $1.3 million increase in prepaid expenses and other current assets. Our DSO was 59 days as of December 31, 2014.
Investing Activities
Our investing activities have primarily consisted of purchases of property and equipment, capitalized internally-developed software for our cloud service platform, an investment in a privately held company and purchases and sales of marketable securities.
For fiscal 2016, cash provided by investing activities was $0.3 million, which we primarily attribute to maturities of marketable securities of $50.8 million offset by $46.8 million cash used for purchases of marketable securities, $1.5 million cash used to purchase our investment in a privately held company and $2.2 million cash used for purchases of property and equipment, relating primarily to manufacturing, research and development lab equipment.
For fiscal 2015, cash used in investing activities was $50.9 million, which we primarily attribute to purchases of marketable securities of $49.2 million offset by sale of marketable securities of $2.5 million, capitalization of internal software development costs for development of our cloud services platform of $1.9 million, and purchases of property and equipment of $2.3 million, relating primarily to manufacturing, research and development lab equipment. The capitalization of internal software development costs for development of our next generation cloud services platform, HiveManager NG, represents personnel and related costs including wages, bonuses and stock-based compensation expenses. We started to capitalize costs for development of such cloud platform from December 2013. In April 2015, we completed and launched our HiveManager NG cloud services platform and began to amortize the capitalized costs on a straight-line basis over the estimated useful life of 5 years, as part of the cost of software subscription and services.
For fiscal 2014, cash used in investing activities was $6.7 million, which we primarily attribute to capitalization of internal software development costs for development of our new SaaS infrastructure of $4.4 million, and purchases of property and equipment of $2.4 million, relating primarily to manufacturing, research and development lab equipment and purchased software. The capitalization of internal software development costs for development of our new SaaS infrastructure represents personnel and related costs including wages and bonuses. We started to capitalize costs for development of our new SaaS infrastructure from December, 2013.
Financing Activities
Our financing activities have primarily consisted of proceeds and repayments against our credit facility, proceeds from exercises of stock options and proceeds from employee stock purchase plan as well as proceeds from the sale of common stock in our IPO in April 2014, offset by our repurchases of treasury shares.
For fiscal 2016, financing activities provided $2.9 million of cash, primarily as a result of $5.3 million in proceeds from employee purchases under our stock purchase plan, $0.9 million in proceeds from exercise of stock options offset by $2.1 million cash used for repurchase of treasury shares, and $1.1 million cash used to satisfy our estimate of minimum employee tax withholding requirements on vesting of restricted stock units
For fiscal 2015, financing activities provided $3.6 million of cash, primarily as a result of a $3.2 million cash used to satisfy our estimate of minimum employee tax withholding requirements on vesting of restricted stock units, offset by $5.2 million in proceeds from employee stock purchase plan and $1.5 million in proceeds from exercise of stock options. In the first fiscal quarter of 2015, we paid-off in full the $10.0 million outstanding term loans with TriplePoint Capital LLC and borrowed an additional $10.0 million under our revolving credit facility with Silicon Valley Bank.
For fiscal 2014, financing activities provided $78.5 million of cash, primarily as a result of net proceeds of $80.2 million from our IPO in April 2014 (net of the underwriters' discounts and commissions), $0.9 million in proceeds from exercises of convertible preferred stock warrants and $1.7 million in proceeds from exercises of stock options, partially offset by $4.0 million payment of offering costs related to our IPO.
58
Contractual Obligations and Other Commitments
The following table summarizes our contractual obligations as of December 31, 2016:
Payments Due by Period | |||||||||||||||||||
Less Than 1 Year | 1 to 3 Years | 3 to 5 Years | More Than 5 Years | Total | |||||||||||||||
(in thousands) | |||||||||||||||||||
Contractual Obligations: | |||||||||||||||||||
Debt obligations(1) | $ | 20,000 | $ | — | $ | — | $ | — | $ | 20,000 | |||||||||
Interest expense on our debt obligations(2) | 125 | — | — | — | $ | 125 | |||||||||||||
Purchase commitments(3) | 9,540 | — | — | — | 9,540 | ||||||||||||||
Operating lease obligations(4) | 1,589 | 2,667 | 1,762 | 1,315 | 7,333 | ||||||||||||||
Capital lease obligations(5) | 179 | 359 | 338 | 244 | 1,120 | ||||||||||||||
Total contractual obligations | 31,433 | 3,026 | 2,100 | 1,559 | 38,118 | ||||||||||||||
(1) Debt includes $20.0 million in outstanding borrowings on our Revolving Credit Facility.
(2) Represents our estimated interest expense on our outstanding debt obligations based on the interest rate in effect as of December 31, 2016.
(3) Consists of minimum purchase commitments with our contract manufacturers that are non-cancelable and other open purchase orders. Such minimum purchase commitments are based on our forecasted manufacturing requirements and typically provide for fulfillment with agreed or commercially standard lead times for the particular part or product. The timing and amount of payments may change due to changing business needs and other factors.
(4) Operating leases include total future minimum rent payments under noncancelable operating lease agreements. In fiscal 2016, we made regular lease payments of $2.5 million under the operating lease agreements.
(5) Consists of future payments for office furniture and equipment classified as capital lease. The table above excludes liabilities for uncertain tax positions and related interest and penalties accrual as the amount is insignificant.
We subcontract with other companies to manufacture our products. During the normal course of our business, our contract manufacturers procure components based upon orders placed and forecasts provided by us. If we cancel all or part of an order, we may still be liable to the contract manufacturers for the cost of the components that they purchase in reliance on the orders or our forecasts. We periodically review our potential liability to our contract manufacturers, and as of December 31, 2016, we have no accruals recorded. Our financial position and results of operations could be negatively impacted if we were required to compensate the contract manufacturers for any unrecorded liabilities incurred.
Off-Balance Sheet Arrangements
Through December 31, 2016, we did not have any relationships with unconsolidated organizations or financial partnerships, such as structured finance or special purpose entities, that would have been established for the purpose of facilitating off-balance sheet arrangements or other contractually narrow or limited purposes.
We have entered into agreements with some of our channel partners and end-customers that contain indemnification provisions in the event of claims alleging that our products infringe the intellectual property rights of a third party. Under these agreements, we have, at our option and expense, the ability to resolve any infringement, replace our product with a non-infringing product that is equivalent-in-function, or refund to the partner or customers the total product price. Other guarantees or indemnification arrangements include guarantees of product and service performance. We have not recorded a liability related to these indemnification and guarantee provisions and our guarantees and indemnification arrangements have not had any impact on our consolidated financial statements to date.
Critical Accounting Policies and Estimates
We prepare our consolidated financial statements in accordance with generally accepted accounting principles in the United States. The preparation of these financial statements requires us to make estimates and assumptions that affect the reported amounts of assets, liabilities, revenue, costs and expenses, and related disclosures. We base our estimates on our historical experience and on various other assumptions that we believe to be reasonable. Actual results could differ significantly from our estimates. To the extent that there are material differences between these estimates and actual results, our future financial statement presentation, financial condition, results of operations and cash flows will be affected.
59
We believe that the assumptions and estimates associated with revenue recognition, inventory valuations, income taxes, stock-based compensation and warranty costs have the greatest potential impact on our consolidated financial statements. Therefore, we consider these to be our critical accounting policies and estimates. For further information on all of our significant accounting policies, see Note 1 of the Notes to Consolidated Financial Statements.
Revenue Recognition
We derive revenue from two sources: (i) product, which includes hardware and software revenue, and (ii) software subscription and services, which includes post-contract customer support, or PCS, and software delivered as a service, or SaaS. We recognize revenue when all of the following criteria are met:
Persuasive Evidence of an Arrangement Exists. Evidence of an arrangement generally consists of a purchase order issued pursuant to the terms and conditions of a VAD and VAR reseller agreement or, in limited cases, an end-customer agreement.
Delivery or Performance has Occurred. We use shipping and related documents and VAD sell-through reports from our VAD's with stocking rights to verify delivery or performance. We do not recognize product revenue until transfer of title and risk of loss, which generally is upon shipment to non-stocking VADs, VARs or end-customers.
The Sales Price is Fixed or Determinable. We assess whether the sales price is fixed or determinable based on payment terms and whether the sales price is subject to refund or adjustment.
Collection is Reasonably Assured. We assess probability of collection on a channel-partner-by-channel-partner basis. We subject our channel partner to a credit review process that evaluates its financial condition and ability to pay for our products and services. If we conclude that collection is not reasonably assured, we do not recognize revenue until cash is received.
Our product revenue consists of revenue from the sale of our hardware products (which each contains embedded software related to our proprietary operating system), and HiveManager network management software which is considered essential to the functionality of our hardware products. Therefore, we consider our hardware appliances together with the related HiveManager software as non-software elements and not subject to the industry-specific software revenue recognition guidance.
Our software subscription and services revenue consists of revenue from SaaS and PCS arrangements. Our SaaS arrangements with customers do not provide the right to take possession of the software at any time during the hosting period, have a defined contract term, and we recognize ratably over the contract term beginning on the provisioning date of the contract, which is typically one, three or five years. We have determined that hardware sold with SaaS arrangements has stand-alone value and, therefore, have concluded that the hardware represents a separate unit of accounting that we recognize as revenue upon shipment, assuming all other revenue recognition criteria are met. PCS arrangements include software updates, access to technical support personnel, and expedited replacement of defective hardware products. We recognize revenue for PCS services on a straight-line basis over the service contract term, which is typically one, three or five years.
We operate a multi-tier channel distribution model that includes VADs, VARs, MSPs and direct sales to end-customers. For sales to VARs and end-customers, we recognize product revenue upon transfer of title and risk of loss, which is generally upon shipment. It is our practice to identify an end-customer prior to shipment to a VAR. We make substantially all of our sales outside of North America through VADs. Some VAD agreements currently allow them to stock our products in their inventory, and provide price protection or rebates and limited rights of return for stock rotation. We initially defer product revenue on sales made through these VADs and recognize revenue upon sell-through as the VADs report to us. For VADs that do not have stocking rights, we recognize revenue upon shipment, assuming all other revenue criteria have been met.
Most of our arrangements, other than stand-alone renewals of SaaS and PCS arrangements, are multiple-element arrangements with a combination of product and service (as defined above). We allocate arrangement consideration to all deliverables in multiple-element revenue arrangements at the inception of an arrangement based on the relative selling price method in accordance with the selling price hierarchy, which includes (i) vendor-specific objective evidence (VSOE), of selling price, if available; (ii) third-party evidence (TPE) of selling price, if VSOE is not available; and (iii) best estimate of selling price (BESP), if neither VSOE nor TPE is available.
VSOE. We determine VSOE based on our historical pricing and discounting practices for the specific products and services when sold separately. In determining VSOE, we require that a substantial majority of the stand-alone selling prices falls within a reasonably narrow pricing range. We established VSOE for some of our sales of PCS for both VAD and VAR channels as our pricing is sufficiently concentrated (based on an analysis of separate sales of PCS) to conclude that we can demonstrate VSOE of selling price of PCS.
60
TPE. When we cannot establish VSOE for deliverables in multiple-element arrangements, we apply judgment with respect to whether we can establish a selling price based on TPE. We determine TPE based on competitor prices for interchangeable products or services when sold separately to similarly situated customers. However, because our products contain a significant element of proprietary technology and our solutions offer substantially different features and functionality, we cannot typically obtain the comparable pricing of products with similar functionality.
BESP. When we are unable to establish selling price using VSOE or TPE, we use BESP in our allocation of arrangement consideration. The objective of BESP is to determine the price at which we would transact a sale if the product or service was sold regularly on a stand-alone basis. As we have not been able to establish VSOE or TPE for our products and some of our services, we determine BESP for the purposes of allocating the arrangement, primarily based on historical transaction pricing. We segregated historical transactions based on our pricing model and go-to-market strategy, which includes factors such as type of sales channel (VAR, VAD or end-customer), the geographies in which our products and services were sold (domestic or international) and offering type (product series, software subscriptions and level of support for PCS).
We make certain estimates and maintain allowances for sales returns and other programs based on our historical experience. To date, these estimates have not been significant.
We include shipping charges billed to channel partners in product revenue and we include the related shipping costs in cost of product revenue.
Inventory
Our inventory consists of hardware products and related component parts and is stated at the lower of cost, which approximates actual cost computed on a first-in, first-out basis, or market value. We evaluate inventory for excess and obsolete products, based on management’s assessment of future demand and market conditions, and technological obsolescence of our products. We do not reverse inventory write-downs, once established, as they establish a new cost basis for the inventory. We include inventory write-downs as a component of cost of product revenue in the statements of operations.
Income Taxes
We account for income taxes under an asset and liability approach for deferred income taxes, which requires recognition of deferred income tax assets and liabilities for the expected future tax consequences of events that we have recognized in our consolidated financial statements, but have not been reflected in taxable income. We make estimates and judgments in the calculation of certain tax liabilities and in the determination of the recoverability of certain deferred income tax assets, which arise from temporary differences and carryforwards. We measure our deferred income tax assets and liabilities using the currently enacted tax rates that apply to taxable income in effect for the years in which we expect to realize or settle those tax assets. We regularly assess the likelihood that we will realize our deferred income tax assets based on our historical level of taxable income, projections for our future taxable income and tax planning strategies. To the extent that we believe that any amounts are not more likely than not to be realized, we record a valuation allowance to reduce our deferred income tax assets. We regularly review our tax positions and benefits to be realized. We recognize tax liabilities based upon estimates of whether, and the extent to which, additional taxes will be due when such estimates are more likely than not to be sustained. An uncertain income tax position will not be recognized if it has less than a 50% likelihood of being sustained. We recognize interest and penalties related to income tax matters as income tax expense in the statements of operations.
Stock-Based Compensation
We calculate compensation expense for all stock-based awards based on the estimated fair values on the date of grant. Our stock-based awards include stock options, restricted stock units, or RSUs, and purchase rights under the employee stock purchase plan, or ESPP. The fair value of each RSU granted is determined using the fair value of our common stock on the date of the grant. The fair value of each stock option is estimated using the Black-Scholes option pricing model. The fair value of each stock purchase right under our ESPP is calculated based on the closing price of our stock on the date of grant and the value of a call and put option estimated using the Black-Scholes pricing model. The Black-Scholes pricing model requires assumptions including the market value of our common stock, expected term of the award, expected volatility of the price of our common stock, risk-free interest rates, and expected dividend yield.
We determine the expected term of employee stock options using the simplified method as provided by the Securities and Exchange Commission. The simplified method is presumed to be the average of the time-to-vesting and the contractual life of the options. The expected term of ESPP is based on the contractual terms. Since we have not established sufficient public trading history of our common stock we derive the expected volatility from the historical stock volatilities of the common stock of several publicly traded comparable companies over a period approximately equal to the expected term of the expected life of the options. The risk-free interest rate is based on the U.S. treasury yield curve in effect at the time of grant for zero-coupon
61
U.S. treasury notes with maturities equal to the option's expected term. The expected dividend is assumed to be zero as we have never paid dividends and have no current plans to do so.
Recent Accounting Pronouncements
Refer to Recent Accounting Pronouncements, under Note 1, Description of Business and Summary of Significant Accounting Policies, of the Notes to Consolidated Financial Statements for recent accounting pronouncements that could have an effect on us.
ITEM 7A. QUANTITATIVE AND QUALITATIVE DISCLOSURES ABOUT MARKET RISK
Interest Rate Sensitivity
Our exposure to market risk for changes in interest rates relates primarily to our cash, cash equivalents, short-term investments and our outstanding debt obligations. We had cash, cash equivalents and short-term investments of $76.8 million and $92.3 million as of December 31, 2016 and December 31, 2015, respectively. We held these amounts primarily in bank deposits, money market funds, certificates of deposit, commercial paper and bonds issued by corporate institutions and U.S. government agencies. Such interest-earning instruments carry a degree of interest rate risk. To date, fluctuations in interest income have not been significant.
We have outstanding debt of $20.0 million as of December 31, 2016, consisting of our borrowing under our Revolving Credit Facility. The Revolving Credit Facility bears interest at a variable rate.
We do not enter into investments for trading or speculative purposes and have not used any derivative financial instruments to manage our interest rate risk exposure. We have not been exposed to material risks due to changes in interest rates. A hypothetical 10% change in interest rates during any of the periods we present in this report would not have had a material impact on our financial statements.
Foreign Currency Risk
We denominate all of our sales in U.S. dollars and, therefore, our revenues are not currently subject to significant foreign currency risk. However, the exchange rate of the U.S. dollar to foreign currencies continues to be strong, which could make the price of our products outside the United States less competitive, reducing our sales or requiring us to lower pricing for our products outside the United States in order to maintain sales and revenue performance. Our operating expenses are denominated in the currencies of the countries in which our operations are located, including in EMEA and APAC, and may be subject to fluctuations due to changes in foreign currency exchange rates. To date, we have not used derivative financial instruments to mitigate our exposure to foreign currency exchange risks. A hypothetical 10% change in foreign currency exchange rates applicable to our business would not have a material impact on our consolidated financial statements in any of the periods presented.
62
ITEM 8. FINANCIAL STATEMENTS AND SUPPLEMENTARY DATA
INDEX TO CONSOLIDATED FINANCIAL STATEMENTS
63
REPORT OF INDEPENDENT REGISTERED PUBLIC ACCOUNTING FIRM
To the Board of Directors and Stockholders of Aerohive Networks, Inc.
Milpitas, California
We have audited the accompanying consolidated balance sheets of Aerohive Networks, Inc. and subsidiaries (the "Company") as of December 31, 2016 and 2015, and the related consolidated statements of operations, comprehensive loss, stockholders' equity (deficit), and cash flows for each of the three years in the period ended December 31, 2016. These financial statements are the responsibility of the Company's management. Our responsibility is to express an opinion on these financial statements based on our audits.
We conducted our audits in accordance with the standards of the Public Company Accounting Oversight Board (United States). Those standards require that we plan and perform the audit to obtain reasonable assurance about whether the financial statements are free of material misstatement. The Company is not required to have, nor were we engaged to perform, an audit of its internal control over financial reporting. Our audits included consideration of internal control over financial reporting as a basis for designing audit procedures that are appropriate in the circumstances, but not for the purpose of expressing an opinion on the effectiveness of the Company's internal control over financial reporting. Accordingly, we express no such opinion. An audit also includes examining, on a test basis, evidence supporting the amounts and disclosures in the financial statements, assessing the accounting principles used and significant estimates made by management, as well as evaluating the overall financial statement presentation. We believe that our audits provide a reasonable basis for our opinion.
In our opinion, such consolidated financial statements present fairly, in all material respects, the financial position of Aerohive Networks, Inc. and subsidiaries as of December 31, 2016 and 2015, and the results of their operations and their cash flows for each of the three years in the period ended December 31, 2016, in conformity with accounting principles generally accepted in the United States of America.
As discussed in Note 1 to the consolidated financial statements, in the year ended December 31, 2016, the Company elected to change its method of accounting for sales commissions. The adoption of this accounting policy has been applied retrospectively to all periods presented.
/s/ DELOITTE & TOUCHE LLP
San Jose, California
February 24, 2017
64
AEROHIVE NETWORKS, INC.
Consolidated Balance Sheets
(in thousands, except share and per share amounts)
December 31, | December 31, | ||||||
2016 | 2015 | ||||||
ASSETS | (As Adjusted)* | ||||||
CURRENT ASSETS: | |||||||
Cash and cash equivalents | $ | 34,346 | $ | 45,741 | |||
Short-term investments | 42,408 | 46,593 | |||||
Accounts receivable, net of allowance for doubtful accounts of $61 and $15 as of December 31, 2016 and December 31, 2015, respectively | 26,190 | 22,824 | |||||
Inventories | 12,629 | 10,775 | |||||
Prepaid expenses and other current assets | 5,970 | 7,613 | |||||
Deferred cost of goods sold | 319 | 757 | |||||
Total current assets | 121,862 | 134,303 | |||||
Property and equipment, net | 9,008 | 9,156 | |||||
Goodwill | 513 | 513 | |||||
Other assets | 5,100 | 3,680 | |||||
Total assets | $ | 136,483 | $ | 147,652 | |||
LIABILITIES AND STOCKHOLDERS’ EQUITY | |||||||
CURRENT LIABILITIES: | |||||||
Accounts payable | $ | 10,762 | $ | 15,140 | |||
Accrued liabilities | 9,300 | 11,856 | |||||
Debt, current | 20,000 | — | |||||
Deferred revenue, current | 31,727 | 27,893 | |||||
Total current liabilities | 71,789 | 54,889 | |||||
Debt, non-current | — | 20,000 | |||||
Deferred revenue, non-current | 34,177 | 31,369 | |||||
Other liabilities | 1,829 | 463 | |||||
Total liabilities | 107,795 | 106,721 | |||||
Commitments and contingencies (Note 5) | |||||||
Stockholders’ equity: | |||||||
Preferred stock, par value of $0.001 per share - 25,000,000 shares authorized as of December 31, 2016 and December 31, 2015; no shares issued and outstanding as of December 31, 2016 and December 31, 2015 | — | — | |||||
Common stock, par value of $0.001 per share - 500,000,000 shares authorized as of December 31, 2016 and December 31, 2015; 52,245,252 and 49,017,293 shares issued and outstanding as of December 31, 2016 and December 31, 2015, respectively | 52 | 49 | |||||
Additional paid–in capital | 258,063 | 231,289 | |||||
Treasury stock - 364,627 shares as of December 31, 2016 | (2,139 | ) | — | ||||
Accumulated other comprehensive loss | (31 | ) | (61 | ) | |||
Accumulated deficit | (227,257 | ) | (190,346 | ) | |||
Total stockholders’ equity | 28,688 | 40,931 | |||||
Total liabilities and stockholders’ equity | $ | 136,483 | $ | 147,652 | |||
See notes to consolidated financial statements.
* Certain amounts have been adjusted for the retrospective changes in accounting policy for sales commissions (See Note 1). | |||
65
AEROHIVE NETWORKS, INC.
Consolidated Statements of Operations
(in thousands, except share and per share amounts)
Year Ended December 31, | |||||||||||
2016 | 2015 | 2014 | |||||||||
Revenue: | (As Adjusted)* | (As Adjusted)* | |||||||||
Product | $ | 136,570 | $ | 126,281 | $ | 120,507 | |||||
Software subscription and services | 33,255 | 25,378 | 16,785 | ||||||||
Total revenue | 169,825 | 151,659 | 137,292 | ||||||||
Cost of revenue (1): | |||||||||||
Product | 43,231 | 40,496 | 38,365 | ||||||||
Software subscription and services | 12,066 | 9,897 | 6,400 | ||||||||
Total cost of revenue | 55,297 | 50,393 | 44,765 | ||||||||
Gross profit | 114,528 | 101,266 | 92,527 | ||||||||
Operating expenses: | |||||||||||
Research and development (1) | 41,504 | 36,924 | 27,546 | ||||||||
Sales and marketing (1) | 80,998 | 81,089 | 70,846 | ||||||||
General and administrative (1) | 28,839 | 26,303 | 21,180 | ||||||||
Total operating expenses | 151,341 | 144,316 | 119,572 | ||||||||
Operating loss | (36,813 | ) | (43,050 | ) | (27,045 | ) | |||||
Interest income | 468 | 108 | 37 | ||||||||
Interest expense | (474 | ) | (1,209 | ) | (1,843 | ) | |||||
Other income, net | 177 | 285 | 255 | ||||||||
Loss before income taxes | (36,642 | ) | (43,866 | ) | (28,596 | ) | |||||
Provision for income taxes | 269 | 352 | 441 | ||||||||
Net loss | $ | (36,911 | ) | $ | (44,218 | ) | $ | (29,037 | ) | ||
Net loss attributable to common stockholders | $ | (36,911 | ) | $ | (44,218 | ) | $ | (29,037 | ) | ||
Net loss per share allocable to common stockholders, basic and diluted | $ | (0.73 | ) | $ | (0.93 | ) | $ | (0.80 | ) | ||
Weighted-average shares used in computing net loss per share allocable to common stockholders, basic and diluted | 50,332,872 | 47,323,253 | 36,097,405 | ||||||||
(1) Includes stock-based compensation as follows: | |||||||||||
Cost of revenue | $ | 1,305 | $ | 902 | $ | 411 | |||||
Research and development | 5,393 | 4,651 | 2,419 | ||||||||
Sales and marketing | 8,269 | 7,112 | 4,121 | ||||||||
General and administrative | 6,735 | 5,706 | 3,301 | ||||||||
Total stock-based compensation | $ | 21,702 | $ | 18,371 | $ | 10,252 | |||||
See notes to consolidated financial statements.
* Certain amounts have been adjusted for the retrospective changes in accounting policy for sales commissions (See Note 1). | |||
66
AEROHIVE NETWORKS, INC.
Consolidated Statements of Comprehensive Loss
(in thousands)
Year Ended December 31, | |||||||||||
2016 | 2015 | 2014 | |||||||||
(As Adjusted)* | (As Adjusted)* | ||||||||||
Net loss | $ | (36,911 | ) | $ | (44,218 | ) | $ | (29,037 | ) | ||
Unrealized gain (loss) on available-for-sale investments, net of tax | 30 | (61 | ) | — | |||||||
Comprehensive loss | $ | (36,881 | ) | $ | (44,279 | ) | $ | (29,037 | ) | ||
See notes to consolidated financial statements.
* Certain amounts have been adjusted for the retrospective changes in accounting policy for sales commissions (See Note 1). | |||
67
AEROHIVE NETWORKS, INC.
Consolidated Statements of Stockholders’ Equity (Deficit)
(in thousands, except share and per share data)
Convertible Preferred Stock | Common Stock | Treasury Stock | Additional paid-in capital | Accumulated deficit | Accumulated Other Comprehensive Income (Loss) | Total Stockholders’ Equity (Deficit) | |||||||||||||||||||||||||
Shares | Amount | Shares | Amount | Amount | |||||||||||||||||||||||||||
(As Adjusted)* | (As Adjusted)* | ||||||||||||||||||||||||||||||
Balances at December 31, 2013 | 27,861,009 | $ | 69 | 7,419,469 | $ | 18 | — | $ | 116,902 | $ | (117,091 | ) | — | $ | (102 | ) | |||||||||||||||
Cashless exercise of Series A convertible preferred stock warrants | 38,724 | — | — | — | — | — | — | — | — | ||||||||||||||||||||||
Issuance of Series C convertible preferred stock upon exercise of warrants | 327,795 | — | — | — | — | 907 | — | — | 907 | ||||||||||||||||||||||
Reclassification of convertible preferred stock warrants upon exercise | — | — | — | — | — | 3,202 | — | — | 3,202 | ||||||||||||||||||||||
Issuance of common stock upon initial public offering, net of issuance costs | — | — | 8,625,000 | 9 | — | 74,789 | — | — | 74,798 | ||||||||||||||||||||||
Conversion of preferred stock to common stock | (28,227,528 | ) | (69 | ) | 28,832,898 | 18 | — | 51 | — | — | — | ||||||||||||||||||||
Conversion of preferred stock warrants to common stock warrants | — | — | — | — | — | 611 | — | — | 611 | ||||||||||||||||||||||
Shares issued upon exercise of options | — | — | 915,563 | 1 | — | 1,720 | — | — | 1,721 | ||||||||||||||||||||||
Vesting of common stock from early exercised options | — | — | 113,500 | — | — | 435 | — | — | 435 | ||||||||||||||||||||||
Issuance of common stock upon vesting of RSUs | — | — | 187,699 | — | — | — | — | — | — | ||||||||||||||||||||||
Shares repurchased for tax withholdings on vesting of RSUs | — | — | (65,221 | ) | — | — | (316 | ) | — | — | (316 | ) | |||||||||||||||||||
Stock-based compensation | — | — | — | — | — | 10,697 | — | — | 10,697 | ||||||||||||||||||||||
Net loss | — | — | — | — | — | — | (29,037 | ) | — | (29,037 | ) | ||||||||||||||||||||
Balances at December 31, 2014 | — | $ | — | 46,028,908 | $ | 46 | — | $ | 208,998 | $ | (146,128 | ) | — | $ | 62,916 | ||||||||||||||||
Shares issued upon exercise of options | — | — | 678,533 | 1 | — | 1,523 | — | — | 1,524 | ||||||||||||||||||||||
Common stock issued under ESPP | — | — | 1,226,012 | 1 | — | 5,195 | — | — | 5,196 | ||||||||||||||||||||||
Vesting of common stock from early exercised options | — | — | 27,000 | — | — | 45 | — | — | 45 | ||||||||||||||||||||||
Issuance of common stock upon vesting of RSUs | — | — | 1,580,206 | 2 | — | (2 | ) | — | — | — | |||||||||||||||||||||
Shares repurchased for tax withholdings on vesting of RSUs | — | — | (523,366 | ) | (1 | ) | — | (3,157 | ) | — | — | (3,158 | ) | ||||||||||||||||||
Modification for common stock warrants | — | — | — | — | — | 59 | — | — | 59 | ||||||||||||||||||||||
Stock-based compensation | — | — | — | — | — | 18,628 | — | — | 18,628 | ||||||||||||||||||||||
Unrealized loss on available for sale investments | — | — | — | — | — | — | — | (61 | ) | (61 | ) | ||||||||||||||||||||
Net loss | — | — | — | — | — | — | (44,218 | ) | — | (44,218 | ) | ||||||||||||||||||||
Balances at December 31, 2015 | — | $ | — | 49,017,293 | $ | 49 | — | $ | 231,289 | $ | (190,346 | ) | (61 | ) | $ | 40,931 | |||||||||||||||
68
Convertible Preferred Stock | Common Stock | Treasury Stock | Additional paid-in capital | Accumulated deficit | Accumulated Other Comprehensive Income (Loss) | Total Stockholders’ Equity (Deficit) | |||||||||||||||||||||||||
Shares | Amount | Shares | Amount | Amount | |||||||||||||||||||||||||||
Shares issued upon exercise of options | — | — | 444,660 | — | — | 870 | — | — | 870 | ||||||||||||||||||||||
Common stock issued under ESPP | — | — | 1,209,410 | 1 | — | 5,325 | — | — | 5,326 | ||||||||||||||||||||||
Issuance of common stock upon vesting of RSUs | — | — | 2,099,785 | 2 | — | (2 | ) | — | — | — | |||||||||||||||||||||
Shares repurchased for tax withholdings on vesting of RSUs | — | — | (188,984 | ) | — | — | (1,121 | ) | — | — | (1,121 | ) | |||||||||||||||||||
Repurchase of treasury stock | — | — | (364,627 | ) | — | (2,139 | ) | — | — | — | (2,139 | ) | |||||||||||||||||||
Exercise of common stock warrants | — | — | 27,715 | — | — | — | — | — | — | ||||||||||||||||||||||
Stock-based compensation | — | — | — | — | — | 21,702 | — | — | 21,702 | ||||||||||||||||||||||
Unrealized gain on available for sale investments | — | — | — | — | — | — | — | 30 | 30 | ||||||||||||||||||||||
Net loss | — | — | — | — | — | — | (36,911 | ) | — | (36,911 | ) | ||||||||||||||||||||
Balances at December 31, 2016 | — | $ | — | 52,245,252 | $ | 52 | (2,139 | ) | $ | 258,063 | $ | (227,257 | ) | (31 | ) | $ | 28,688 | ||||||||||||||
See notes to consolidated financial statements.
* Certain amounts have been adjusted for the retrospective changes in accounting policy for sales commissions (See Note 1). | |||
69
AEROHIVE NETWORKS, INC.
Consolidated Statements of Cash Flows
(in thousands)
Year Ended December 31, | |||||||||||
2016 | 2015 | 2014 | |||||||||
Cash flows from operating activities | (As Adjusted)* | (As Adjusted)* | |||||||||
Net loss | $ | (36,911 | ) | $ | (44,218 | ) | $ | (29,037 | ) | ||
Adjustments to reconcile net loss to net cash used in operating activities: | |||||||||||
Depreciation and amortization | 3,534 | 3,548 | 2,349 | ||||||||
Stock-based compensation | 21,702 | 18,371 | 10,252 | ||||||||
Remeasurement of convertible preferred stock warrant liability | — | — | (90 | ) | |||||||
Others | 278 | 378 | 178 | ||||||||
Changes in operating assets and liabilities: | |||||||||||
Accounts receivable, net | (3,366 | ) | 1,871 | (7,115 | ) | ||||||
Inventories | (1,854 | ) | (2,415 | ) | (1,544 | ) | |||||
Prepaid expenses and other current assets | 2,081 | (2,485 | ) | (1,255 | ) | ||||||
Other assets | 80 | (1,024 | ) | (1,094 | ) | ||||||
Accounts payable | (4,522 | ) | 5,237 | 1,295 | |||||||
Accrued liabilities | (2,643 | ) | 3,067 | 1,563 | |||||||
Other liabilities | 425 | (394 | ) | 165 | |||||||
Deferred revenue | 6,642 | 13,107 | 15,585 | ||||||||
Net cash used in operating activities | (14,554 | ) | (4,957 | ) | (8,748 | ) | |||||
Cash flows from investing activities | |||||||||||
Purchases of property and equipment | (2,161 | ) | (2,270 | ) | (2,385 | ) | |||||
Capitalized software development costs | — | (1,913 | ) | (4,364 | ) | ||||||
Maturities and sales of short-term investments | 50,761 | 2,498 | — | ||||||||
Purchases of short-term investments | (46,824 | ) | (49,223 | ) | — | ||||||
Investment in privately held company | (1,500 | ) | — | — | |||||||
Net cash provided by (used in) investing activities | 276 | (50,908 | ) | (6,749 | ) | ||||||
Cash flows from financing activities | |||||||||||
Proceeds from initial public offering, net of underwriting discounts | — | — | 80,213 | ||||||||
Payment of offering costs | — | — | (4,007 | ) | |||||||
Proceeds from exercise of convertible preferred stock warrants | — | — | 907 | ||||||||
Proceeds from exercise of vested stock options | 870 | 1,524 | 1,721 | ||||||||
Proceeds from employee stock purchase plan | 5,326 | 5,196 | — | ||||||||
Payment for shares withheld for tax withholdings on vesting of restricted stock units | (1,121 | ) | (3,158 | ) | (316 | ) | |||||
Payments to repurchase common stock | (2,139 | ) | — | — | |||||||
Payments on capital lease obligation | (53 | ) | — | — | |||||||
Proceeds from issuance of debt | — | 10,000 | — | ||||||||
Repayments of debt | — | (10,000 | ) | — | |||||||
Net cash provided by financing activities | 2,883 | 3,562 | 78,518 | ||||||||
Net increase (decrease) in cash and cash equivalents | (11,395 | ) | (52,303 | ) | 63,021 | ||||||
Cash and cash equivalents at beginning of period | 45,741 | 98,044 | 35,023 | ||||||||
Cash and cash equivalents at end of period | $ | 34,346 | $ | 45,741 | $ | 98,044 | |||||
Supplemental disclosure of cash flow information | |||||||||||
Income taxes paid | $ | 666 | $ | 519 | $ | 420 | |||||
Interest paid | $ | 484 | $ | 984 | $ | 1,428 | |||||
Supplemental disclosure of noncash investing and financing activities | |||||||||||
Conversion of convertible preferred stock warrants to common stock warrants upon IPO | $ | — | $ | — | $ | 611 | |||||
Unpaid property and equipment purchases | $ | 205 | $ | 60 | $ | 312 | |||||
Property and equipment purchased under capital lease | $ | 1,120 | $ | — | $ | — | |||||
Unpaid capitalized software development costs | $ | — | $ | 94 | $ | 439 | |||||
Reclassification of the convertible preferred stock warrant liability to additional paid-in capital on the exercise of the convertible preferred stock warrants | $ | — | $ | — | $ | 3,202 | |||||
Vesting of early exercised stock options | $ | — | $ | 45 | $ | 435 | |||||
Stock-based compensation in capitalized software development | $ | — | $ | 257 | $ | 445 | |||||
See notes to consolidated financial statements.
* Certain amounts have been adjusted for the retrospective changes in accounting policy for sales commissions (See Note 1). | |||
70
NOTES TO CONSOLIDATED FINANCIAL STATEMENTS
1. DESCRIPTION OF BUSINESS AND SUMMARY OF SIGNIFICANT ACCOUNTING POLICIES
Nature of Operations
Aerohive Networks, Inc. was incorporated in Delaware on March 15, 2006, and, together with its subsidiaries (the "Company"), has designed and developed a leading cloud and enterprise Wi-Fi solution that enables our customers to use the power of the Wi-Fi, cloud, analytics and applications to transform how they serve their customers. Our products include Wi-Fi access points, routers and switches required to build an edge-access network; a cloud services platform for centralized management; data collection and analytics; and applications that leverage the network to provide additional capabilities to the business and IT organization. Together, these products, service platforms and applications create a simple, scalable, and secure solution to deliver a better-connected experience.
The Company has offices in North America, Europe, the Middle East, Australia and Asia Pacific and employs staff around the world.
Basis of Presentation and Consolidation
The Company prepared the accompanying consolidated financial statements in accordance with generally accepted accounting principles in the United States ("GAAP"), which includes the accounts of Aerohive Networks, Inc. and its wholly owned subsidiaries. All intercompany accounts and transactions have been eliminated in consolidation.
Use of Estimates
The preparation of the accompanying consolidated financial statements in conformity with GAAP requires management to make estimates and assumptions that affect the amounts reported in the consolidated financial statements and accompanying notes. Those estimates and assumptions include, among others, the selling price of product, software and support services, determination of fair value of stock-based awards, inventory valuation, accounting for income taxes, including the valuation reserve on deferred tax assets and uncertain tax positions, allowance for sales reserves, allowance for doubtful accounts, and warranty costs. Management evaluates estimates and assumptions on an ongoing basis using historical experience and other factors and adjusts those estimates and assumptions when facts and circumstances dictate. As the Company cannot determine future events and their effects with precision, actual results could differ from these estimates and assumptions, and those differences could be material to the consolidated financial statements.
Changes in Accounting Policy
In the first quarter of 2016, the Company voluntarily changed its accounting policy for sales commissions related to products, which include hardware and software revenue, and software subscription and services, which include post-contract support ("PCS") and Software-as-a-Service (“SaaS”) contracts. The Company changed its accounting policy from recording an expense when incurred to deferral of the sales commissions in proportion to the consideration allocated to each element in the arrangement and amortization in, or over, the same period the revenue is recognized for each of the elements in the arrangement (i.e., upon delivery for the product deliverables and over the non-cancellable term of the contract for the PCS and SaaS deliverables).
The Company believes the deferral method described above is preferable primarily because the direct incremental sales commission charges are so closely related to obtaining the revenue from the non-cancellable contracts that they should be deferred and charged to expense over the same period that the related revenue is recognized. Deferred commission amounts are recoverable through the future revenue streams (including up-front payments) under the non-cancellable arrangements.
Short-term deferred commissions are included in prepaid expenses and other current assets, while long-term deferred commissions are included in other assets in the accompanying consolidated balance sheets. The amortization of deferred commissions is included in sales and marketing expense in the accompanying consolidated statements of operations.
The accompanying consolidated financial statements and related notes have been adjusted to reflect the impacts of this change with the associated deferred tax impacts retrospectively for all prior periods presented. Under the as-previously reported basis, there were no book/tax basis differences related to commission expense. Under the as-adjusted basis, the deferred commission asset creates a deferred tax liability related to commission expense. Creating this deferred tax liability reduces the valuation allowance on the deferred tax assets by the same amount. The increase in the deferred tax liability is fully offset by the reduction in the deferred tax asset valuation allowance and has no net impact to income tax provision in the consolidated statements of operations.
71
The cumulative effect of the change on accumulated deficit was $4.8 million as of January 1, 2015. The following tables present the effects of the retrospective application of the voluntary change in accounting principle for sales commissions related to non-cancellable product, PCS, and SaaS contracts for the current periods and the corresponding preceding periods presented (in thousands, except per share data):
Consolidated Balance Sheet (in thousands) | |||||||||||||||||||||||
December 31, 2016 | December 31, 2015 | ||||||||||||||||||||||
Computed
under Prior
Method | Impact of
Commission
Adjustment | As Reported | As
Previously
Reported | Impact of
Commission
Adjustment | As Adjusted | ||||||||||||||||||
Prepaid expenses and other current assets | $ | 3,038 | $ | 2,932 | $ | 5,970 | $ | 4,129 | $ | 3,484 | $ | 7,613 | |||||||||||
Total current assets | $ | 118,930 | $ | 2,932 | $ | 121,862 | $ | 130,819 | $ | 3,484 | $ | 134,303 | |||||||||||
Other assets | $ | 1,985 | $ | 3,115 | $ | 5,100 | $ | 426 | $ | 3,254 | $ | 3,680 | |||||||||||
Total assets | $ | 130,436 | $ | 6,047 | $ | 136,483 | $ | 140,914 | $ | 6,738 | $ | 147,652 | |||||||||||
Accumulated deficit | $ | (233,304 | ) | $ | 6,047 | $ | (227,257 | ) | $ | (197,084 | ) | $ | 6,738 | $ | (190,346 | ) | |||||||
Total stockholders' equity | $ | 22,641 | $ | 6,047 | $ | 28,688 | $ | 34,193 | $ | 6,738 | $ | 40,931 | |||||||||||
Total liabilities and stockholders' equity | $ | 130,436 | $ | 6,047 | $ | 136,483 | $ | 140,914 | $ | 6,738 | $ | 147,652 | |||||||||||
Consolidated Statements of Operations (in thousands, except share and per share amounts) | ||||||||||||
Year Ended December 31, 2016 | ||||||||||||
Computed under Prior Method | Impact of
Commission
Adjustment | As Reported | ||||||||||
Sales and marketing | $ | 80,307 | $ | 691 | $ | 80,998 | ||||||
Operating loss | $ | (36,122 | ) | $ | (691 | ) | $ | (36,813 | ) | |||
Net loss | $ | (36,220 | ) | $ | (691 | ) | $ | (36,911 | ) | |||
Net loss per share allocable to common stockholders, basic and diluted | $ | (0.72 | ) | $ | (0.01 | ) | $ | (0.73 | ) | |||
Weighted-average shares used in computing net loss per share allocable to common stockholders, basic and diluted | 50,332,872 | — | 50,332,872 | |||||||||
Year Ended December 31, 2015 | ||||||||||||
As
Previously
Reported | Impact of
Commission
Adjustment | As Adjusted | ||||||||||
Sales and marketing | $ | 83,066 | $ | (1,977 | ) | $ | 81,089 | |||||
Operating loss | $ | (45,027 | ) | $ | 1,977 | $ | (43,050 | ) | ||||
Net loss | $ | (46,195 | ) | $ | 1,977 | $ | (44,218 | ) | ||||
Net loss per share allocable to common stockholders, basic and diluted | $ | (0.98 | ) | $ | 0.05 | $ | (0.93 | ) | ||||
Weighted-average shares used in computing net loss per share allocable to common stockholders, basic and diluted | 47,323,253 | — | 47,323,253 | |||||||||
72
Year Ended December 31, 2014 | ||||||||||||
As
Previously
Reported | Impact of
Commission
Adjustment | As Adjusted | ||||||||||
Sales and marketing | $ | 72,364 | $ | (1,518 | ) | $ | 70,846 | |||||
Operating loss | $ | (28,563 | ) | $ | 1,518 | $ | (27,045 | ) | ||||
Net loss | $ | (30,555 | ) | $ | 1,518 | $ | (29,037 | ) | ||||
Net loss per share allocable to common stockholders, basic and diluted | $ | (0.85 | ) | $ | 0.05 | $ | (0.80 | ) | ||||
Weighted-average shares used in computing net loss per share allocable to common stockholders, basic and diluted | 36,097,405 | — | 36,097,405 | |||||||||
Consolidated Statements of Comprehensive Loss (in thousands) | ||||||||||||
Year Ended December 31, 2016 | ||||||||||||
Computed
under Prior
Method | Impact of
Commission
Adjustment | As Reported | ||||||||||
Net loss | $ | (36,220 | ) | $ | (691 | ) | $ | (36,911 | ) | |||
Comprehensive loss | $ | (36,190 | ) | $ | (691 | ) | $ | (36,881 | ) | |||
Year Ended December 31, 2015 | ||||||||||||
As
Previously
Reported | Impact of
Commission
Adjustment | As Adjusted | ||||||||||
Net loss | $ | (46,195 | ) | $ | 1,977 | $ | (44,218 | ) | ||||
Comprehensive loss | $ | (46,256 | ) | $ | 1,977 | $ | (44,279 | ) | ||||
Year Ended December 31, 2014 | ||||||||||||
As
Previously
Reported | Impact of
Commission
Adjustment | As Adjusted | ||||||||||
Net loss | $ | (30,555 | ) | $ | 1,518 | $ | (29,037 | ) | ||||
Comprehensive loss | $ | (30,555 | ) | $ | 1,518 | $ | (29,037 | ) | ||||
Consolidated Statements of Cash Flows (in thousands) | ||||||||||||
Year Ended December 31, 2016 | ||||||||||||
Computed
under Prior
Method | Impact of
Commission
Adjustment | As Reported | ||||||||||
Net loss | $ | (36,220 | ) | $ | (691 | ) | $ | (36,911 | ) | |||
Prepaid expenses and other current assets | $ | 1,529 | $ | 552 | $ | 2,081 | ||||||
Other assets | $ | (59 | ) | $ | 139 | $ | 80 | |||||
Net cash used in operating activities | $ | (14,554 | ) | $ | — | $ | (14,554 | ) | ||||
73
Year Ended December 31, 2015 | ||||||||||||
As
Previously
Reported | Impact of
Commission
Adjustment | As Adjusted | ||||||||||
Net loss | $ | (46,195 | ) | $ | 1,977 | $ | (44,218 | ) | ||||
Prepaid expenses and other current assets | $ | (1,275 | ) | $ | (1,210 | ) | $ | (2,485 | ) | |||
Other assets | $ | (257 | ) | $ | (767 | ) | $ | (1,024 | ) | |||
Net cash used in operating activities | $ | (4,957 | ) | $ | — | $ | (4,957 | ) | ||||
Year Ended December 31, 2014 | ||||||||||||
As
Previously
Reported | Impact of
Commission
Adjustment | As Adjusted | ||||||||||
Net loss | $ | (30,555 | ) | $ | 1,518 | $ | (29,037 | ) | ||||
Prepaid expenses and other current assets | $ | (733 | ) | $ | (522 | ) | $ | (1,255 | ) | |||
Other assets | $ | (98 | ) | $ | (996 | ) | $ | (1,094 | ) | |||
Net cash used in operating activities | $ | (8,748 | ) | $ | — | $ | (8,748 | ) | ||||
Foreign Currency
The functional currency of the Company’s foreign subsidiaries is the U.S. dollar. The Company remeasures the transactions denominated in currencies other than the functional currency at the average exchange rate in effect during the period. At the end of each reporting period, the Company remeasures its subsidiaries’ monetary assets and liabilities to the U.S. dollar using exchange rates in effect at the end of the reporting period. The Company remeasures its non-monetary assets and liabilities at historical exchange rates. The Company records gains and losses related to remeasurement in other income (expense), net in the consolidated statements of operations. Foreign currency exchange losses have not been significant in any period presented and the Company has not undertaken any hedging transactions related to foreign currency exposure.
Concentrations of Credit Risk and Significant Customers
Financial instruments that potentially subject the Company to concentrations of credit risk consist primarily of cash and cash equivalents, short-term investments and accounts receivable. The Company maintains cash equivalents in money market funds. The amount on deposit at any time with money market funds may exceed the insured limits provided on such funds.
The Company sells its products primarily to channel partners, which include value-added resellers, or VARs, value-added distributors, or VADs and managed service providers, or MSPs. The Company’s accounts receivable are typically unsecured and are derived from revenue earned from customers located in the Americas, Europe, the Middle East and Africa, and Asia Pacific. The Company performs ongoing credit evaluations to determine customer credit, but generally does not require collateral from its customers. The Company maintains reserves for estimated credit losses and these losses have historically been within management’s expectations.
Significant customers are those that represent more than 10% of the Company’s total revenue or gross accounts receivable balance at each respective balance sheet date. The Company has entered into separate agreements with certain individual VADs that are part of a consolidated group of entities which collectively constitutes greater than 10% of the Company’s total revenue or gross accounts receivable balance for certain periods, as presented in the tables below.
The percentages of revenue from a consolidated group of entities (VAD A) and from an individual entity (VAD B) greater than 10% of total consolidated revenue were as follows:
Year Ended December 31, | |||||||||
2016 | 2015 | 2014 | |||||||
VAD A | 14.9 | % | 13.8 | % | 13.6 | % | |||
VAD B | 12.2 | % | * | * | |||||
* Less than 10% | |||||||||
74
The percentages of receivables from VAD A and individual entities (VAD B, VAD C and VAD D) greater than 10% of total consolidated accounts receivable were as follows:
As of December 31, | ||||||
2016 | 2015 | |||||
VAD A | 22.4 | % | 18.5 | % | ||
VAD B | 14.4 | % | * | |||
VAD C | * | 11.2 | % | |||
VAD D | 15.3 | % | * | |||
* Less than 10% | ||||||
Fair Value Measurements
The Company’s financial instruments consist of cash and cash equivalents, short-term investments, accounts receivable, accounts payable, accrued liabilities and short-term debt. Accounts receivable, accounts payable and accrued liabilities are stated at their carrying value, which approximates fair value due to the short time to the expected receipt or payment. The carrying amount of the Company’s short-term debt approximates its fair value as the stated interest rate approximates market rates currently available to the Company. As of December 31, 2016, the Company has not elected the fair value option for any financial assets and liabilities for which such an election would have been permitted.
Cash and Cash Equivalents
The Company considers all highly liquid investments with maturities of three months or less when purchased to be cash equivalents. Cash and cash equivalents consist of cash on hand and highly liquid investments in money market funds, including overnight investments. Due to the short-term nature and liquidity of these financial instruments, the carrying value of these assets approximates fair value.
Short-Term Investments
The Company classifies all its investments as available-for-sale at the time of purchase since it is management's intent that these investments be available for current operations, and as such, includes these investments as short-term investments on its balance sheets. These investments consist of investments with original maturities longer than three months, including commercial paper, investment-grade corporate and government debt securities with Moody's and S&P ratings of A-/A3 or better. Short-term investments classified as available-for-sale are recorded at fair market value with the related unrealized gains and losses included in accumulated other comprehensive income (loss), a component of stockholders' equity. Realized gains and losses are recorded in the consolidated statements of operations. The investments are adjusted for amortization of premiums and discounts to maturity and such amortization is included in interest income (expense), net. The Company periodically assesses whether its investments with unrealized loss positions are other than temporarily impaired. Other-than-temporary impairment charges exists when the entity has the intent to sell the security, it will more likely than not be required to sell the security before anticipated recovery or it does not expect to recover the entire amortized cost basis of the security. Other-than-temporary impairments are determined based on the specific identification method and are reported in the consolidated statements of operations.
Allowance for Doubtful Accounts
Accounts receivable are recorded at invoiced amounts, net of allowances for doubtful accounts. The Company evaluates the collectability of its accounts receivable based on known collection risks and historical experience. In circumstances where the Company is aware of a specific customer’s inability to meet its financial obligations (e.g., bankruptcy filings or substantial downgrading of credit ratings), the Company records a specific reserve for bad debts against amounts due to reduce the net recognized receivable to the amount the Company reasonably believes will be collected. For all other customers, the Company records reserves for bad debts based on the length of time the receivables are past due and the Company’s historical experience of collections and write-offs. If circumstances change, such as higher-than-expected defaults or an unexpected material adverse change in a major customer’s ability to meet its financial obligations, the Company may reduce the estimate of the recoverability of the amounts due, potentially by a significant amount.
Amounts recorded in the consolidated statements of operations relating to allowance for doubtful accounts were immaterial for the years ended December 31, 2016, 2015, and 2014, respectively.
75
Inventory
Inventory consists of hardware products and related component parts and is stated at the lower of cost, which approximates actual cost computed on a first-in, first-out basis, or market value. The Company evaluates inventory for excess and obsolete products, based on management’s assessment of future demand and market conditions, and technological obsolescence of its products. Inventory write-downs, once established, are not reversed as they establish a new cost basis for the inventory. Inventory write-downs are included as a component of cost of product revenue in the accompanying consolidated statements of operations. For the years ended December 31, 2016, 2015 and 2014, the provisions for excess and obsolete inventories were $1.7 million, $0.7 million and $0.3 million, respectively. The Company uses contract manufacturers to provide manufacturing services for its products.
Software Development Costs
The costs to develop the Company’s perpetual license software offerings have not been capitalized because the Company’s current software development process is essentially completed concurrent with the establishment of technological feasibility. As such, all related software development costs are expensed as incurred and included in research and development expenses in the consolidated statements of operations.
Research and development costs incurred during the preliminary project stage related to the Company’s cloud-managed networking platform are expensed as incurred. Capitalization begins when the preliminary project stage is complete, management with the relevant authority authorizes and commits to the funding of the software project, and it is probable the project will be completed. Capitalization ceases when the project is substantially complete and ready for its intended purpose. The Company amortizes the capitalized costs on a straight-line basis over the estimated useful life, generally three to five years.
For the years ended December 31, 2015 and 2014, $1.8 million, and $5.2 million software development costs were capitalized, respectively. The capitalized software development costs include $0.3 million and $0.4 million capitalized stock-based compensation expense for fiscal 2015 and 2014. There were no software developments costs that were capitalized for the year ended December 31, 2016.
In April 2015, the Company completed and launched its next generation cloud services platform, and began to amortize the capitalized software development costs to cost of software subscription and services on a straight-line basis over an estimated useful life of five years. Such internal-use software is included in the software category in property and equipment.
Property and Equipment, net
Property and equipment, including computer and other equipment, laboratory and research and development equipment, purchased software, internal-use software, office furniture and equipment, and construction in progress, are stated at cost, less accumulated depreciation and amortization. Depreciation is computed using the straight-line method over the estimated useful lives of the related assets. Leasehold improvements are amortized on a straight-line basis over the shorter of the estimated useful lives of the assets or the remaining lease term. Depreciation on property and equipment ranges from two to seven years.
Leasehold improvements are amortized on a straight-line basis over the shorter of the estimated useful lives of the assets or the remaining lease term. The amortization period for the leasehold improvements primarily ranges from two to seven years.
Goodwill
Goodwill represents the excess purchase consideration of an acquired entity over the fair value of the net tangible and intangible assets acquired.
The Company has determined that it operates as one reporting unit and performs its annual impairment test of goodwill during the fourth quarter of each fiscal year or whenever events or circumstances change that would indicate that goodwill might be impaired. Triggering events that may indicate impairment include, but are not limited to, a significant adverse change in the business climate, unanticipated competition, loss of key personnel, significant changes in the manner the Company uses the acquired assets or the strategy for the overall business, significant negative industry or economic trends or significant underperformance relative to historical operations or projected future results of operations.
In conducting the impairment test, the Company first assesses qualitative factors to determine whether it is more likely than not that the fair value of a reporting unit is less than its carrying amount as a basis for determining whether it is necessary to perform the two-step goodwill impairment test. If the qualitative step is not passed, the Company performs a two-step impairment test whereby in the first step, the Company must compare the fair value of the reporting unit with its carrying amount. If the carrying amount exceeds its fair value, the Company performs the second step of the goodwill impairment test to
76
determine the amount of impairment. The second step, measuring the impairment loss, compares the implied fair value of the goodwill with the carrying value of the goodwill. Any excess of the goodwill carrying value over the implied fair value is recognized as an impairment loss. No impairment of goodwill was identified during the years ended December 31, 2016, 2015 and 2014.
Impairment of Long-Lived Assets
The carrying amounts of long-lived assets, including property and equipment and intangible assets subject to depreciation and amortization, are periodically reviewed for impairment whenever events or changes in circumstances indicate that the carrying value of these assets may not be recoverable or that the useful life is shorter than the Company had originally estimated. Recoverability of these assets is measured by comparing the carrying amount of each asset to the future undiscounted cash flows the asset is expected to generate over their remaining lives. If the asset is considered to be impaired, the amount of any impairment is measured as the difference between the carrying value and the fair value of the impaired asset. If the useful life is shorter than originally estimated, the Company amortizes the remaining carrying value over the new shorter useful life.
No impairment of any long-lived assets was identified for the years ended December 31, 2016, 2015 and 2014.
Revenue Recognition
The Company derives revenue from two sources: (i) product, which includes hardware and software revenue, and (ii) software subscription and services, which includes post-contract customer support, or PCS, and software delivered as a service, or SaaS. Revenue is recognized when all of the following criteria are met.
Persuasive Evidence of an Arrangement Exists. Evidence of an arrangement generally consists of a purchase order issued pursuant to the terms and conditions of a VAD and VAR reseller agreement or, in limited cases, an end-customer agreement.
Delivery or Performance has Occurred. The Company uses shipping and related documents and VAD sell-through reports from our VAD's with stocking rights to verify delivery or performance. We do not recognize product revenue until transfer of title and risk of loss, which generally is upon shipment to non-stocking VADs, VARs or end-customers.
The Sales Price is Fixed or Determinable. The Company assesses whether the sales price is fixed or determinable based on payment terms and whether the sales price is subject to refund or adjustment.
Collection is Reasonably Assured. The Company assesses probability of collection on a channel partner-by-channel partner basis. The Company subjects its channel partners to a credit review process that evaluates their financial condition and ability to pay for the Company’s products and services. If the Company concludes that collection is not reasonably assured, the Company does not recognize revenue until cash is received.
The Company’s product revenue consists of revenue from the sale of the Company’s hardware products (which each contain embedded software related to its proprietary operating system) and HiveManager network management software which is considered essential to the functionality of the Company’s hardware products. Therefore, the Company’s hardware appliances together with related HiveManager software are considered non-software elements and are not subject to the industry-specific software revenue recognition guidance.
The Company’s software subscription and services revenue consists of revenue from SaaS and PCS arrangements. SaaS arrangements with customers do not provide the right to take possession of the software at any time during the hosting period, have a defined contract term, and are recognized ratably over the contract term beginning on the provisioning date of the contract, which is typically one, three or five years. The Company has determined that hardware sold with SaaS arrangements has stand-alone value and therefore has concluded that the hardware represents a separate unit of accounting that is recognized as revenue upon shipment assuming all other revenue recognition criteria are met. PCS arrangements include software updates, access to technical support personnel, and expedited replacement of defective hardware products. Revenue for PCS services is recognized on a straight-line basis over the service contract term, which is typically one, three or five years.
The Company operates a multiple-tier channel distribution model that includes VADs, VARs, MSPs and direct sales to end-customers. For sales to VARs and end-customers, the Company recognizes product revenue upon transfer of title and risk of loss, which is generally upon shipment. It is the Company’s practice to identify an end-customer prior to shipment to a VAR. Substantially all of the Company’s sales outside of North America are made through VADs. Some VAD agreements currently allow them to stock of the Company’s products in their inventory and provide price protection or rebates and limited rights of return for stock rotation. The Company initially defers product revenue on sales made through these VADs and recognizes
77
revenue upon sell-through as the VADs report to the Company. For VADs that do not have stocking rights, the Company recognizes revenue upon shipment, assuming all other revenue criteria have been met.
Most of the Company’s arrangements, other than stand-alone renewals of SaaS and PCS arrangements, are multiple-element arrangements with a combination of product and service (as defined above). The Company allocates arrangement consideration in multiple-element revenue arrangements at the inception of an arrangement to all deliverables based on the relative selling price method in accordance with the selling price hierarchy, which includes (i) vendor-specific objective evidence (VSOE) of selling price, if available; (ii) third-party evidence (TPE) of selling price, if VSOE is not available; and (iii) best estimate of selling price (BESP), if neither VSOE nor TPE is available.
VSOE. The Company determines VSOE based on its historical pricing and discounting practices for the specific products and services when sold separately. In determining VSOE, the Company requires that a substantial majority of the stand-alone selling prices fall within a reasonably narrow pricing range. The Company established VSOE for some of its sales of PCS for both VAD and VAR channels as the Company's pricing is sufficiently concentrated (based on an analysis of separate sales of PCS) to conclude that it can demonstrate VSOE of selling price of PCS.
TPE. When VSOE cannot be established for deliverables in multiple-element arrangements, the Company applies judgment with respect to whether it can establish a selling price based on TPE. TPE is determined based on competitor prices for interchangeable products or services when sold separately to similarly situated customers. However, because the Company’s products contain a significant element of proprietary technology and the Company’s solutions offer substantially different features and functionality, the comparable pricing of products with similar functionality typically cannot be obtained.
BESP. When the Company is unable to establish selling price using VSOE or TPE, the Company uses BESP in its allocation of arrangement consideration. The objective of BESP is to determine the price at which the Company would transact a sale if the product or service was sold regularly on a stand-alone basis. As the Company has not been able to establish VSOE or TPE for its products and some of its services, the Company determines BESP for the purposes of allocating the arrangement, primarily based on historical transaction pricing. Historical transactions are segregated based on the Company’s pricing model and go-to-market strategy, which include factors such as type of sales channel (VAR, VAD or end-customer), the geographies in which the Company’s products and services were sold (domestic or international) and offering type (product series, software subscriptions and level of support for PCS).
The Company makes certain estimates and maintains allowances for sales returns and other programs based on its historical experience. To date, these estimates have not been significant.
Shipping charges billed to channel partners are included in product revenue and the related shipping costs are included in cost of product revenue.
Deferred Costs of Goods Sold
When the Company’s products have been delivered, but the product revenue associated with the arrangement has been deferred as a result of not meeting the revenue recognition criteria (see “Revenue Recognition” above), the related product costs are also deferred.
Warranty Liability
The Company maintains a warranty accrual for estimated future warranty obligations based on unit volumes by hardware product family together with anticipated future warranty costs. The Company’s Wi-Fi access points, branch routers and switches are generally covered by a limited lifetime warranty, and other hardware accessory products are generally covered for a period of one year.
Advertising Costs
Advertising costs are charged to sales and marketing expenses as incurred in the consolidated statements of operations. Advertising expense was immaterial for the fiscal years ended December 31, 2016, 2015 and 2014.
Research and Development Expenses
Research and development costs, other than capitalized software development costs, are charged to operations as incurred, which consist primarily of personnel costs (including compensation costs and stock-based compensation), outside services, expensed materials, depreciation and an allocation of overhead expenses (including facilities and information technology infrastructure costs).
78
Comprehensive Income (Loss)
Comprehensive income (loss) consists of all components of net income (loss) and all components of other comprehensive income (loss) within stockholders’ equity. The Company’s other comprehensive income (loss) includes unrealized gains and losses from its available-for-sale securities that are not considered other-than-temporarily impaired, net of taxes.
Stock-Based Compensation
The Company measures compensation expense for all stock-based awards based on the estimated fair values on the date of grant. The Company’s stock-based awards include stock options, restricted stock units (RSU) and purchase rights under the employee stock purchase plan (ESPP). The fair value of each RSU granted is determined using the fair value of the Company’s common stock on the date of the grant. The fair value of each stock option is estimated using the Black-Scholes option pricing model. The fair value of each stock purchase right under the Company's ESPP is calculated based on the closing price of the Company's stock on the date of grant and the value of a call and put option estimated using the Black-Scholes pricing model. The Black-Scholes pricing model requires assumptions including the market value of the Company's common stock, expected term of the award, expected volatility of the price of the Company's common stock, risk-free interest rates, and expected dividend yield.
Stock-based compensation is recognized on a straight-line basis over the requisite service period, net of estimated forfeitures. The forfeiture rate is based on an analysis of the Company’s actual historical forfeitures.
Income Taxes
The Company accounts for income taxes under an asset and liability approach for deferred income taxes, which require recognition of deferred income tax assets and liabilities for the expected future tax consequences of events that have been recognized in the consolidated financial statements, but have not been reflected in taxable income. Estimates and judgments occur in the calculation of certain tax liabilities and in the determination of the recoverability of certain deferred income tax assets, which arise from temporary differences and carryforwards. Deferred income tax assets and liabilities are measured using the currently enacted tax rates that apply to taxable income in effect for the years in which those tax assets are expected to be realized or settled. The Company regularly assesses the likelihood that deferred income tax assets will be realized based on historical levels of taxable income, projections for future taxable income, and tax planning strategies. To the extent that the Company believes any amounts are not more likely than not to be realized, the Company records a valuation allowance to reduce the deferred income tax assets. The Company regularly assesses the need for a valuation allowance on its deferred tax assets, and to the extent that the Company determines that an adjustment is needed, such adjustment will be recorded in the period that the determination is made.
The Company regularly reviews its tax positions and benefits to be realized. The Company recognizes tax liabilities based upon estimates of whether, and the extent to which, additional taxes will be due when such estimates are more likely than not to be sustained. An uncertain income tax position will not be recognized if it has less than a 50% likelihood of being sustained. The Company recognizes interest and penalties related to income tax matters as income tax expense in the accompanying consolidated statements of operations.
Recent Accounting Pronouncements
In May 2014, the Financial Accounting Standards Board ("FASB") issued Accounting Standard Update ("ASU") 2014-09, Revenue from contracts with customers (Topic 606), which supersedes the revenue recognition requirements in Revenue Recognition (Topic 605) and most industry-specific guidance. This standard requires entities to recognize revenue when they transfer promised goods or services to customers in an amount that reflects the consideration to which the entity expects to be entitled to in exchange for those goods or services. In August 2015, the FASB issued ASU 2015-14 deferring the effective date of this standard by one year to December 15, 2017, and, thus, the new standard will be effective for the Company on January 1, 2018. This standard may be adopted using either the full or modified retrospective methods. In April 2016 and May 2016, the FASB issued ASU 2016-10 and ASU 2016-12, respectively, which clarify guidance on identifying performance obligations, collectability criterion and noncash consideration. The Company preliminary plans to adopt these standards on a retrospective basis; however, the Company has not yet made a final decision on the adoption methodology and is currently in the process of determining the potential impact that these standards will have on the Company's financial statements.
In January 2016, the FASB issued ASU 2016-01, Recognition and Measurement of Financial Assets and Financial Liabilities, which provides guidance for the recognition, measurement, presentation, and disclosure of financial assets and liabilities. This ASU will be effective for the Company beginning in the first quarter of fiscal year 2019. The Company is currently evaluating the potential impact of this standard on the financial statements.
79
In February 2016, the FASB issued ASU 2016-02, Leases (Topic 842), which supersedes the lease accounting requirements in Topic 840. ASU 2016-02 requires a dual approach for lessee accounting under which a lessee would account for leases as finance leases or operating leases. Both finance leases and operating leases will result in the lessee recognizing a right-of-use asset and a corresponding lease liability. For finance leases, the lessee would recognize interest expense and amortization of the right-of-use asset, and for operating leases, the lessee would recognize a straight-line total lease expense. The standard also requires qualitative and specific quantitative disclosures to supplement the amounts recorded in the financial statements so that users can understand more about the nature of an entity’s leasing activities, including significant judgments and changes in judgments. This standard is effective beginning in fiscal year 2019. The Company is currently evaluating the potential impact of this standard on the financial statements.
In March 2016, the FASB issued ASU 2016-09, Improvements to Employee Share-Based Payment Accounting, which is intended to simplify several aspects of the accounting for share-based payment transactions, including the accounting for income taxes, forfeitures, and statutory tax withholding requirements, as well as classification in the statement of cash flows. This standard is effective beginning after December 15, 2016, with early adoption permitted. The Company is currently assessing the impact of the adoption of this standard, however it is not expected to have a material impact on the financial statements and disclosures.
In August 2016, the FASB issued ASU 2016-15, Statement of Cash Flows - Classification of Certain Cash Receipts and Cash Payments, which provides guidance to decrease the diversity in practice in how certain cash receipts and cash payments are presented and classified in the statement of cash flows. The standard is effective for fiscal years beginning after December 15, 2017, with early adoption permitted. The Company does not anticipate that the adoption of this standard will have a material impact on the financial statements.
80
2. FAIR VALUE MEASUREMENTS
The Company records its financial assets and liabilities at fair value. The Company categorizes these assets and liabilities based upon the level of judgment associated with inputs used to measure the fair value. The categories are as follows:
Level 1 | Quoted prices (unadjusted) in active markets that are accessible at the measurement date for identical assets or liabilities. | |
Level 2 | Observable prices that are based on inputs not quoted on active markets, but corroborated by market data. | |
Level 3 | Unobservable inputs are used when little or no market data is available. | |
The Company classified its cash equivalents and short-term marketable investments within Level 1 and Level 2 in the fair value hierarchy as of December 31, 2016 and 2015. Level 1 assets include highly liquid money market funds that are included in cash and cash equivalents. The Company generally classifies these instruments within Level 1 of the fair value hierarchy because they are valued based on quoted market prices in active markets. Level 2 assets include U.S. treasuries, corporate securities and commercial paper that are included in short-term investments. The Company uses inputs such as actual trade data, benchmark yields, broker/dealer quotes or alternative pricing sources with reasonable levels of price transparency which are obtained from quoted market prices, independent pricing vendors, or other sources, to determine the ultimate fair value of these assets.
As of December 31, 2016, the Company held a convertible note from a privately held company, which the Company classified it as Level 3 in the fair value hierarchy (Note 3).
The components of the Company’s Level 1 and Level 2 assets are as follows:
December 31, 2016 | |||||||||||||||||||
Amortized Cost | Gross Unrealized Gain (Loss) | Estimated Fair Value | Cash equivalents | Short-term investments | |||||||||||||||
(in thousands) | |||||||||||||||||||
Level 1: | |||||||||||||||||||
Money market funds | 25,244 | — | 25,244 | 25,244 | — | ||||||||||||||
$ | 25,244 | $ | — | $ | 25,244 | $ | 25,244 | $ | — | ||||||||||
Level 2: | |||||||||||||||||||
U.S. treasuries | 22,516 | (19 | ) | 22,497 | — | 22,497 | |||||||||||||
Corporate securities | 7,353 | (12 | ) | 7,341 | — | 7,341 | |||||||||||||
Commercial paper | 12,570 | — | 12,570 | — | 12,570 | ||||||||||||||
$ | 42,439 | $ | (31 | ) | $ | 42,408 | $ | — | $ | 42,408 | |||||||||
Total | $ | 67,683 | $ | (31 | ) | $ | 67,652 | $ | 25,244 | $ | 42,408 | ||||||||
December 31, 2015 | |||||||||||||||||||
Amortized Cost | Gross Unrealized Gain (Loss) | Estimated Fair Value | Cash equivalents | Short-term investments | |||||||||||||||
(in thousands) | |||||||||||||||||||
Level 1: | |||||||||||||||||||
Money market funds | 33,436 | — | 33,436 | 33,436 | — | ||||||||||||||
$ | 33,436 | $ | — | $ | 33,436 | $ | 33,436 | — | |||||||||||
Level 2: | |||||||||||||||||||
U.S. treasuries | 15,988 | (21 | ) | 15,967 | — | 15,967 | |||||||||||||
Corporate securities | 23,679 | (40 | ) | 23,639 | — | 23,639 | |||||||||||||
Commercial paper | 6,987 | — | 6,987 | — | 6,987 | ||||||||||||||
$ | 46,654 | $ | (61 | ) | $ | 46,593 | $ | — | 46,593 | ||||||||||
Total | $ | 80,090 | $ | (61 | ) | $ | 80,029 | $ | 33,436 | $ | 46,593 | ||||||||
All Level 1 and 2 short-term investments the Company held as of December 31, 2016 and December 31, 2015, contractually mature within one year from these respective dates.
81
Unrealized gains and losses related to these investments are due to interest rate fluctuations as opposed to credit quality. In addition, the Company does not intend to sell, and it is not more likely than not that the Company would be required to sell, these investments before recovery of their cost basis. As a result, there is no other-than-temporary impairment for these investments as of December 31, 2016 and December 31, 2015.
3. CONSOLIDATED BALANCE SHEET COMPONENTS
Prepaid expenses and other current assets
Prepaid expenses and other current assets consist of the following:
As of December 31, | |||||||||
2016 | 2015 | ||||||||
(in thousands) | |||||||||
Deferred sales commissions, current portion (Note 1) | $ | 2,932 | $ | 3,484 | |||||
Prepaid expenses | 2,032 | 2,950 | |||||||
Other | 1,006 | 1,179 | |||||||
Total prepaid expenses and other current assets | $ | 5,970 | $ | 7,613 | |||||
Property and Equipment, net
Property and equipment, net consists of the following:
As of December 31, | ||||||||||
Estimated Useful Lives | 2016 | 2015 | ||||||||
(in thousands) | ||||||||||
Computer and other equipment | 3 years | $ | 1,920 | $ | 1,704 | |||||
Manufacturing, research and development laboratory equipment | 3 years | 4,314 | 4,476 | |||||||
Software | 2 to 5 years | 8,217 | 8,470 | |||||||
Office furniture and equipment | 3 to 7 years | 2,070 | 1,041 | |||||||
Leasehold improvements | shorter of useful life or lease term | 1,008 | 614 | |||||||
Property and equipment, gross | 17,529 | 16,305 | ||||||||
Less: Accumulated depreciation and amortization | (8,521 | ) | (7,149 | ) | ||||||
Property and equipment, net | $ | 9,008 | $ | 9,156 | ||||||
Software category includes the capitalized internal-use software for the Company's cloud service platform. In April 2015, the Company completed and launched the next generation of its cloud services platform, and began to amortize these capitalized costs to cost of software subscription and services revenue on a straight-line basis over an estimated useful life of the software of five years.
Depreciation and amortization expense was $3.5 million, $3.5 million and $2.2 million for the years ended December 31, 2016, 2015 and 2014, respectively.
Office furniture and equipment classified under capital lease at December 31, 2016 was $1.2 million and the related accumulated depreciation was $0.2 million.
Other assets
Other assets consist of the following:
As of December 31, | |||||||||
2016 | 2015 | ||||||||
(in thousands) | |||||||||
Deferred sales commissions, non-current portion (Note 1) | $ | 3,115 | $ | 3,254 | |||||
Investment in privately held company | 1,500 | — | |||||||
Other | 485 | 426 | |||||||
Total other assets | $ | 5,100 | $ | 3,680 | |||||
82
In January 2016, the Company paid $1.5 million in cash to purchase a convertible note issued by a privately held company, which provides Wi-Fi application and analytics. The Company currently has no voting rights, investor rights or significant influence over the privately held company. The convertible note has been recorded at carrying value. Since the convertible note has no readily determinable market value, the Company has categorized it as a Level 3 asset in the fair value hierarchy. As of December 31, 2016, the fair value of the convertible note approximated its carrying value. The Company did not recognize an impairment for the year ended December 31, 2016, as there were no identified events or changes in circumstances that might have a significant adverse impact on the carrying values of the investment. Since the convertible note has a two-year contractual term and the Company does not intend to liquidate it in the next 12 months, the Company has classified the convertible note as other assets on the consolidated balance sheet.
Accrued Liabilities
Accrued liabilities consist of the following:
As of December 31, | |||||||
2016 | 2015 | ||||||
(in thousands) | |||||||
Accrued compensation | $ | 7,230 | $ | 9,410 | |||
Accrued expenses and other liabilities | 1,445 | 1,801 | |||||
Warranty liability, current portion | 625 | 645 | |||||
Total accrued liabilities | $ | 9,300 | $ | 11,856 | |||
Deferred Revenue
Deferred revenue consists of the following:
As of December 31, | |||||||
2016 | 2015 | ||||||
(in thousands) | |||||||
Products | $ | 1,220 | $ | 3,199 | |||
Software subscription and services | 64,684 | 56,063 | |||||
Total deferred revenue | 65,904 | 59,262 | |||||
Less: current portion of deferred revenue | 31,727 | 27,893 | |||||
Non-current portion of deferred revenue | $ | 34,177 | $ | 31,369 | |||
Warranty Liability
The following table summarizes the activity related to the Company’s accrued liability for estimated future warranty:
As of December 31, | |||||||||||
2016 | 2015 | 2014 | |||||||||
(in thousands) | |||||||||||
Beginning balance | $ | 978 | $ | 891 | $ | 923 | |||||
Charges to operations | 672 | 1,079 | 536 | ||||||||
Obligations fulfilled | (457 | ) | (578 | ) | (557 | ) | |||||
Changes in existing warranty | (218 | ) | (414 | ) | (11 | ) | |||||
Total product warranties | $ | 975 | $ | 978 | $ | 891 | |||||
Current portion | $ | 625 | $ | 645 | $ | 285 | |||||
Non-current portion | $ | 350 | $ | 333 | $ | 606 | |||||
Changes in existing warranty reflect a combination of changes in expected warranty claims and changes in the related costs to service such claims.
83
4. DEBT
Financing Agreements
In June 2012, the Company entered into a revolving credit facility with Silicon Valley Bank (the "Revolving Credit Facility). The Revolving Credit Facility is collateralized by substantially all of the Company’s property, other than intellectual property. Prior to March 31, 2015, the Revolving Credit Facility bore monthly interest at a floating rate equal to the greater of (i) 4.00% or (ii) prime rate plus 0.75%. By amendment in March 2015, interest on the Revolving Credit Facility adjusted as of March 31, 2015 to a floating rate equal to the lesser of (i) LIBOR rate plus 2.25% or (ii) prime rate minus 0.5%. In November 2015, the Company further amended the Revolving Credit Facility to revise the floating interest rate to the lesser of (i) LIBOR rate plus 1.75% or (ii) prime rate minus 1.0%, which was effective January 1, 2016. The weighted-average interest rate of the Revolving Credit Facility was 2.37% and 2.99% for the years ended December 31, 2016 and 2015 respectively.
The Revolving Credit Facility currently provides among other things, (i) a maturity date of March 31, 2017; (ii) a revolving line up to $20.0 million, subject to certain conditions.
The Revolving Credit Facility contains customary negative covenants which, unless approved by SVB, limit the Company’s ability to, among other things, incur additional indebtedness, grant liens, make investments, repurchase stock, pay dividends, transfer assets and merge or consolidate, as well as requiring the Company to maintain a minimum adjusted quick ratio of 1.25 to 1.00 and minimum cash balances as of the last day of each month. The Revolving Credit Facility also contains customary events of default, subject to customary cure periods for certain defaults, that include, among other things, non-payment defaults, covenant defaults, material judgment defaults, bankruptcy and insolvency defaults, cross-defaults to certain other material indebtedness, and defaults due to inaccuracy of representation and warranties. Upon an event of default, the lender may declare all or a portion of the outstanding obligations payable by the Company to be immediately due and payable and exercise other rights and remedies provided for under the Revolving Credit Facility. During the existence of an event of default, interest on the obligations under the Revolving Credit Facility could be increased by 5.0%. As of December 31, 2016 and December 31, 2015, the Company was in compliance with these covenants.
As of December 31, 2016, $20.0 million remains outstanding under the Revolving Credit Facility, and is included in current liabilities in the consolidated balance sheets. The outstanding principal and the interest are payable within the next 12 months.
5. COMMITMENTS AND CONTINGENCIES
Lease Commitments
The Company currently leases its main office facility in Milpitas, California, which commenced on April 1, 2016 and is set to expire in June 2023. The Company pays rent on a monthly basis, which will increase incrementally over the term of the lease for an aggregate net base rent of approximately $6.5 million. In addition to the monthly base rent, the Company is responsible for payment of certain operating expenses, including utilities and real estate taxes. The Company incurred lease abandonment costs of $0.6 million in June 2016, which included remaining lease obligation and other contractual obligations including utilities and real estate taxes related to its previous facilities. The lease abandonment costs are included in general and administrative expenses in the Company's consolidated statements of operations.
In addition, the Company leases office space for its subsidiaries in the United Kingdom, the Netherlands, Australia and China under non-cancelable operating leases that expire at various times through August 2021. The Company has also entered into various lease agreements in other locations in the United States and globally to support its sales and research and development functions. The Company recognizes rent expense on a straight-line basis over the lease period. Future minimum lease payments by year under operating leases as of December 31, 2016 are as follows:
84
Amount | |||
Year Ending December 31, | (in thousands) | ||
2017 | $ | 1,589 | |
2018 | 1,487 | ||
2019 | 1,180 | ||
2020 | 878 | ||
2021 | 884 | ||
Thereafter | 1,315 | ||
Total | $ | 7,333 | |
Rent expense was $2.4 million, $2.5 million and $2.1 million for the years ended December 31, 2016, 2015 and 2014, respectively.
Capital Lease Obligations
The Company has certain office furniture and equipment that are classified as capital leases. The terms of the capital leases range from three years to seven years. The interest is immaterial. Future minimum lease payments by year under capital lease obligations as of December 31, 2016 are as follows:
Amount | |||
Year Ending December 31, | (in thousands) | ||
2017 | $ | 179 | |
2018 | 184 | ||
2019 | 175 | ||
2020 | 170 | ||
2021 | 168 | ||
Thereafter | 244 | ||
Total | $ | 1,120 | |
Less: current portion of capital lease obligations | 179 | ||
Non-current portion of capital lease obligations | $ | 941 | |
Manufacturing Commitments
The Company subcontracts with manufacturing companies to manufacture its hardware products. The contract manufacturers procure components based on non-cancellable orders the Company places with them. If the Company cancels all or part of an order, the Company is liable to the contract manufacturers for the cost of the related components they purchased under such orders.
As of December 31, 2016 and December 31, 2015, the Company had manufacturing commitments with contract manufacturers for inventory totaling approximately $9.5 million and $14.0 million, respectively.
Contingencies
The Company may be subject to legal proceedings and litigation arising from time to time. The Company will record a liability when it believes that it is both probable that a loss has been incurred and the amount can be reasonably estimated. The Company expects to periodically evaluate developments in its legal matters that could affect the amount of liability that it has previously accrued, if any, and make adjustments as appropriate. The Company exercises significant judgment to determine both likelihood of there being, and the estimated amount of, a loss related to such matters, and the Company’s judgment may be incorrect. The outcome of any proceeding is not determinable in advance. Until the final resolution of any such matter for which the Company may be required to accrue, there may be an exposure to loss in excess of the amount accrued and such excess amount could be significant.
The Company is currently engaged in the following separate litigations which allege that the Company’s products infringe certain patents.
85
• | Linex Technologies, or Linex, filed on March 19, 2013 a Complaint in the U.S. District Court, Southern District of Florida, asserting that some or all of the Company’s products infringe U.S. Patents Nos. #6,493,377, or the ‘377 Patent, and #7,167,503, or the ’503 Patent. The Company filed an answer and counterclaims for declaratory judgment against Linex asserting that the Company’s products do not infringe the ‘377 and ‘503 Patents, and that the ‘377 and ‘503 Patents are, in any case, invalid and not enforceable. The Company separately filed with the U.S. Patent and Trademark Office, or the PTO, petitions to initiate reexamination of the ‘377 and ‘503 Patents, which the PTO granted. In the PTO reexaminations, all claims under the ‘377 and '503 Patents have been rejected and Linex has appealed the final rejections of the claims. This case is currently stayed pending the reexaminations. |
• | Chrimar Systems, or Chrimar, filed in July 2015 a complaint in the U.S. District Court, Eastern District of Texas, asserting that certain of the Company’s products which utilize Power over Ethernet (POE) functionality infringe United States Patent Nos. 8,155,012, or the '012 Patent, 8,902,760, or the '760 Patent, 8,942,107, or the '107 Patent and 9,019,838, or the '838 Patent. A jury trial was conducted in January 2017, following which the court entered an order finding non-infringement as to the Company's products under all patents in suit. The court subsequently entered a final judgment as to non-infringement under the patents in suit, which neither party challenged or appealed prior to the lapsing of the period for any such timely challenges or appeals. The Company separately filed with the PTO petitions to initiate reexamination of the '012 Patent and the '760 Patent, which petitions the PTO granted. The PTO has rejected all claims of the '012 Patent and is considering the Company's petition regarding the '760 Patent. |
• | Mobile Telecommunications Technologies LLC, or Mobile, filed in May 2016 a complaint in the U.S. District Court, Eastern District of Texas, asserting that certain of the Company’s products which utilize MIMO systems or frequency structures and functionality infringe United States Patent Nos. 5,590,403, 5,659,891, and 5,915,210. The case was consolidated with several other cases involving the same patents and transferred to U.S. District Court, Delaware, for pretrial purposes. |
The Company intends to defend these lawsuits vigorously, and is not able to predict or estimate any range of reasonably possible loss related to these lawsuits. If these matters have an adverse outcome, they may have a material impact on the Company’s financial position, results of operations or cash flows.
The Company was recently in litigation asserting claims under federal securities laws.
In June 2015, a class action complaint was filed in the Superior Court of the State of California, County of San Mateo, against the Company and certain of its current and former officers and directors. This action was subsequently related and consolidated with two identical, follow-on complaints and is captioned Hunter v. Aerohive Networks, Inc., et al., Shareholder Litigation, Master File No. 534070. The consolidated complaint alleged claims under federal securities laws that the Registration Statement which the Company filed with the Securities and Exchange Commission on Form S-1 in connection with its initial public offering in March 2014 contained false and/or misleading statements or omissions. The consolidated action also named as defendants the investment firms who underwrote the Company’s initial public offering.
The consolidated complaint alleged that the Registration Statement failed to disclose, among other things, product deficiencies, poor sales, and a decline in sales-related personnel. The complaint additionally alleged that the Company improperly recognized revenue, including by booking certain sales with rights of return. The consolidated complaint sought unspecified compensatory damages and other relief. The Company advanced certain defense costs with respect to individual defendants, including the underwriting investment firms, under written indemnification agreements.
During mediation, the parties reached a settlement, providing for payment to the class of plaintiffs in the amount of $5.75 million in return for a release of all claims against the defendants, including Aerohive and its current and former officers and directors. In September 2016, the Court approved the settlement and dismissed the action with prejudice. Pursuant to the terms of the settlement, Aerohive paid approximately $1.22 million of the $5.75 million settlement amount (reflecting the amount remaining under Aerohive’s insurance retention), and the Company’s insurance carrier paid the remainder of the settlement amount.
Guarantees
The Company has entered into agreements with some of its partners and customers that contain indemnification provisions in the event of claims alleging that the Company’s products infringe the intellectual property rights of a third party. The Company has, at its option and expense, the ability to repair any infringement, replace product with a non-infringing product that is equivalent-in-function, or refund to the partner or the customer the total product price. The Company's other guarantees or indemnification arrangements include guarantees of product and service performance. The Company has not recorded a liability related to these indemnifications and guarantee provisions and the Company’s guarantees and indemnification arrangements have not had any impact on the consolidated financial statements to date.
86
6. STOCKHOLDERS' EQUITY
Initial Public Offering and Conversion of Convertible Preferred Stock
Prior to the closing of the Company's initial public offering, or IPO, on April 2, 2014, the Company had outstanding 5,680,096 shares designated as Series A convertible preferred stock, 4,929,749 shares designated as Series B convertible preferred stock, 9,052,344 shares designated as Series C convertible preferred stock, 5,619,234 shares designated as Series D convertible preferred stock, and 2,946,105 shares designated as Series E convertible preferred stock.
In April 2014, the Company completed its IPO, in which the Company issued 8,625,000 shares of the Company's common stock, inclusive of 1,125,000 shares of common stock sold upon the underwriters' exercise in full of the overallotment option, at an offering price of $10.00 per share. The Company received proceeds of $80.2 million after deducting the underwriters’ discounts and commissions of $6.0 million. Upon completion of the IPO, the Company reclassified $5.4 million deferred offering costs to additional paid-in capital.
In connection with the IPO, 28,227,528 outstanding shares of the Company’s convertible preferred stock automatically converted into 28,832,898 shares of common stock, and the warrants to purchase 103,034 shares of convertible preferred stock became warrants to purchase 107,876 shares of common stock.
Common Stock and Preferred Stock
On April 2, 2014, in connection with the IPO, the Company filed an amended and restated certificate of incorporation to increase the amount of common stock authorized for issuance to 500 million shares at par value of $0.001 per share, and to increase the amount of preferred stock authorized for issuance to 25 million shares with a $0.001 par value per share.
Each holder of common stock is entitled to one vote for each share of common stock held. As of December 31, 2016 and 2015, the Company had 52,245,252 and 49,017,293 of common stock issued and outstanding, respectively. As of December 31, 2016 and 2015, the Company had no shares of preferred stock issued or outstanding.
Common Stock reserved for Future Issuance
As of December 31, 2016, the Company had, on an as-if converted basis, reserved shares of common stock for future issuance as follows:
As of December 31, | ||
2016 | ||
Common stock reserved for future grants under the 2014 Equity Incentive Plan | 5,116,753 | |
Common stock reserved for purchase under the 2014 Employee Stock Purchase Plan | 1,575,605 | |
Options and Restricted Stock Units issued and outstanding | 10,585,444 | |
Total reserved shares of common stock for future issuance | 17,277,802 | |
Common Stock Warrants
Upon the closing of the Company’s IPO, all of the outstanding 103,034 shares of convertible preferred stock warrants automatically converted into an aggregate of 107,876 shares of common stock warrants on a 1:1.1228 basis for Series B convertible preferred stock warrants, and on a 1:1 basis for Series C and Series E convertible preferred stock warrants, as a result of which the Company reclassified the related liability ($0.6 million carrying value) to additional paid-in capital in stockholders’ equity.
On February 27, 2015, in connection with the amendment of the Company's loan agreement with TriplePoint Capital LLC, the Company provided TriplePoint Capital LLC a term extension of one additional year for its common stock warrants to purchase 73,883 shares of its common stock that were scheduled to expire on March 27, 2015. In March 2015, 33,993 shares of common stock warrants expired.
As of December 31, 2015, 44,280 shares and 29,603 shares of the Company's common stock warrants remained outstanding and exercisable at exercise prices of $4.057 and $2.768 per share. On March 25, 2016, TriplePoint Capital LLC net exercised common stock warrants to purchase 27,715 shares of common stock, and 46,168 shares of common stock warrants used to satisfy the exercise price were cancelled.
As of December 31, 2016, no shares of the Company's common stock warrants remained outstanding.
87
7. STOCK-BASED COMPENSATION
2014 Equity Incentive Plan
On March 26, 2014, the Company's 2014 Equity Incentive Plan ("2014 Plan") became effective. On March 27, 2014, the Company's earlier 2006 Global Share Plan ("2006 Plan") was terminated and all reserved-but-unissued shares under the 2006 Plan were added to the 2014 Plan and all shares underlying stock awards granted under the 2006 Plan that otherwise would return to the 2006 Plan instead were rolled into the 2014 Plan. The Company may not grant additional awards under the 2006 Plan, but the 2006 Plan will continue to govern outstanding awards previously granted under the 2006 Plan.
The 2014 Plan provides for the grant of incentive stock options within the meaning of Section 422 of the Internal Revenue Code (ISO), only to employees of the Company or any parent or subsidiary of the Company, and for the grant of nonstatutory stock options (NSO), restricted stock, restricted stock units, stock appreciation rights, performance units and performance shares to employees, directors and consultants of the Company, and the employees and consultants of any parent or subsidiary of the Company.
The 2014 Plan provides for automatic annual increases in the number of shares reserved for issuance. On the first day of each fiscal year beginning January 1, 2017 through January 1, 2024, the number of shares of common stock reserved for issuance under the 2014 Plan may increase by an amount equal to the lesser of (i) 4,000,000 Shares, (ii) 5% of the Company’s outstanding shares on the last day of the immediately preceding fiscal year, or (iii) such number of shares determined by the board of directors. In January 2016, the Company effected an increase of the 2,450,865 number of shares reserved under the 2014 Plan. As of December 31, 2016, the Company had 5,116,753 total shares of common stock reserved and available for grant under the 2014 Plan.
The following table summarizes the total number of shares available for grant under the 2014 Plan as of December 31, 2016:
Shares Available for Grant | ||
Balance, December 31, 2015 | 5,017,525 | |
Authorized | 2,450,865 | |
Options granted | (936,000 | ) |
Options canceled | 814,728 | |
Awards granted | (3,286,825 | ) |
Awards canceled | 1,056,460 | |
Balance, December 31, 2016 | 5,116,753 | |
Stock Options
The following table summarizes the information about outstanding stock option activity:
Options Outstanding | ||||||||||||
Number of Shares Underlying Outstanding Options | Weighted Average Exercise Price | Weighted Average Remaining Contractual Term (Years) | Aggregate Intrinsic Value | |||||||||
(in thousands) | ||||||||||||
Balance, December 31, 2015 | 6,543,162 | $ | 6.05 | 7.03 | $ | 6,570 | ||||||
Options granted | 936,000 | 6.13 | ||||||||||
Options exercised | (444,660 | ) | 2.01 | |||||||||
Options canceled | (814,728 | ) | 7.57 | |||||||||
Balance, December 31, 2016 | 6,219,774 | $ | 6.15 | 6.42 | $ | 6,056 | ||||||
Options exercisable, December 31, 2016 | 4,086,597 | $ | 5.67 | 5.62 | $ | 5,903 | ||||||
Options vested and expected to vest, December 31, 2016 | 5,964,671 | $ | 6.12 | 6.35 | $ | 6,046 | ||||||
88
The weighted-average-grant -date fair value of options granted was $3.15, $3.42 and $5.01 per share for the years ended December 31, 2016, 2015 and 2014, respectively. The aggregate-grant-date fair value of the Company's stock options granted was $3.0 million, $6.0 million and $6.2 million for the years ended December 31, 2016, 2015 and 2014, respectively.
The aggregate intrinsic value of stock options exercised was $1.8 million, $2.4 million and $6.7 million for the years ended December 31, 2016, 2015 and 2014, respectively. The intrinsic value for each share underlying an option represents the difference between the option exercise price per share and the closing stock price of a share of the Company’s common stock. The total grant-date fair value of the options vested was $7.0 million, $4.1 million and $5.1 million for the years ended December 31, 2016, 2015 and 2014, respectively.
The stock options outstanding and exercisable under its stock option plan as of December 31, 2016, are as follows:
Options Outstanding | Options Vested and Exercisable | |||||||||||||||
Range of Exercise Prices | Number of Options Outstanding | Weighted Average Remaining Contractual Term (Years) | Weighted Average Exercise Price per Share | Number of Options Exercisable | Weighted Average Exercise Price per Share | |||||||||||
$0.25 - $2.05 | 1,183,702 | 3.86 | $ | 1.30 | 1,160,368 | $ | 1.28 | |||||||||
$2.28 - $6.00 | 1,358,528 | 6.37 | 5.27 | 1,104,796 | 5.22 | |||||||||||
$6.09 - $6.85 | 1,041,000 | 8.62 | 6.26 | 215,308 | 6.28 | |||||||||||
$7.15 - $7.48 | 1,039,063 | 7.40 | 7.17 | 417,772 | 7.17 | |||||||||||
$7.98 - $9.56 | 73,826 | 5.73 | 8.38 | 58,638 | 8.31 | |||||||||||
$9.58 - $11.31 | 1,523,655 | 6.34 | 9.81 | 1,129,715 | 9.82 | |||||||||||
6,219,774 | 6.42 | $ | 6.15 | 4,086,597 | $ | 5.67 | ||||||||||
Restricted Stock Units
The Company currently grants Restricted Stock Units ("RSUs") to certain employees and directors. The RSUs typically vest over a period of time, generally one year to four years, and are subject to the participant’s continuing service to the Company over that period. Until vested, RSUs do not have the voting and dividend participation rights of common stock and the shares underlying the awards are not considered issued and outstanding.
The following is a summary of the Company’s RSU activity and related information for the year ended December 31, 2016:
Restricted Stock Units Outstanding | ||||||
Shares | Weighted Average Grant Date Fair Value Per Share | |||||
Balance, December 31, 2015 | 4,046,106 | $ | 6.49 | |||
Awards granted | 3,286,825 | 6.20 | ||||
Awards vested | (2,099,785 | ) | $ | 6.54 | ||
Awards canceled | (867,476 | ) | $ | 6.57 | ||
Balance, December 31, 2016 | 4,365,670 | $ | 6.23 | |||
The weighted average grant date fair value of RSUs granted was $6.20, $6.45 and $7.16 per share for the years ended December 31, 2016, 2015 and 2014, respectively. The aggregate grant date fair value of RSUs granted for the years ended December 31, 2016, 2015 and 2014 was $20.4 million, $21.4 million and $23.5 million, respectively. The aggregate fair value of shares vested as of the respective vesting dates, was $12.5 million, $9.6 million and $0.9 million, respectively, for the years ended December 31, 2016, 2015 and 2014.
The number of RSUs vested includes shares that the Company withheld on behalf of certain employees to satisfy the minimum statutory tax withholding requirements, as determined by the Company. During the years ended December 31, 2016
89
2015 and 2014, the Company withheld 188,984, 523,366 and 65,221 shares of stock, respectively, for an aggregate value of $1.1 million, $3.2 million and $0.3 million, respectively. The Company returned such shares to the 2014 Plan, which are available under the plan terms for future issuance.
The number of RSUs granted includes 222,875 shares of performance-based restricted stock units ("PBRSUs") that the Company granted to certain executives in March 2016 pursuant to the 2014 Plan. Each PBRSU represents the right to receive one share of the Company's common stock upon vesting, subject to the Company's achievement of a specified revenue target measured over our fiscal year 2016 and the recipient's continued service through the applicable vesting date. As of December 31, 2016, the Company expects the minimum revenue target to be met. Accordingly, the Company recorded expense related to the PBRSUs expected to vest, net of estimated forfeitures, on a straight-line basis.
The number of RSUs granted also includes 404,000 shares of market-based restricted stock units ("MBRSUs") that the Company granted to certain executives effective June 2016 pursuant to the 2014 Plan. Each MBRSU represents the right to receive one share of the Company's common stock upon vesting subject to the Company's achievement of specified stock price targets and the recipient's continued service through the applicable vesting date. The Company estimates the fair value of the MBRSUs using the Monte Carlo option-pricing model on the date of grant as the MBRSUs contain both market and service conditions. The Company recorded the expense related to all of the MBRSUs, net of estimated forfeitures, on a graded-vesting method.
2014 Employee Stock Purchase Plan
The 2014 Employee Stock Purchase Plan ("ESPP") is a 10-year plan, effective in March 2014. The ESPP authorizes the Company to issue shares of common stock pursuant to purchase rights it grants to the Company's employees and those of its designated subsidiaries. The ESPP provides for automatic annual increases in the number of shares reserved for issuance. Under the ESPP, on the first day of fiscal year 2017, the number of shares of common stock reserved and available for issuance may increase in an amount equal to the lesser of (i) 1,000,000 Shares, (ii) 2.0% of the Company’s outstanding shares on January 1, 2017, or (iii) such number of shares determined by the board of directors. On the first day of each fiscal year beginning January 1, 2018 through January 1, 2024, the number of shares of common stock reserved for issuance may increase in an amount equal to the lesser of (i) 1,000,000 shares, (ii) 1.0% of the Company’s outstanding shares on the first day of the applicable fiscal year, or (iii) such number of shares determined by the board of directors. In January 2016, the Company effected an increase of 980,346 shares reserved under the ESPP. As of December 31, 2016, the Company had 1,575,605 total shares of common stock reserved for issuance under the ESPP.
Under the ESPP, the Company grants stock purchase rights to all eligible employees, currently covering a one-year offering period ending December 1, 2017, with purchase dates at the end of each interim six-month purchase period. ESPP participants purchase shares using employee payroll deductions at purchase prices equal to 85% of the lesser of the fair market value of the Company’s common stock at either the first day of each offering period or the date of purchase. The ESPP currently has a reset provision: If the closing price of the Company’s common stock on the last day of any purchase period during an offering period is lower than the closing sales price on the first day of the related offering period, that offering period will terminate upon the purchase of shares for such purchase period and participants will automatically re-enroll in the immediately following offering period. As a result, the reference price for purposes of determining the purchase price of shares for subsequent purchase periods for all participants of the new offering period resets to such lower price. No participant may purchase more than $25,000 worth of common stock in any calendar year, or 5,000 shares of common stock in any six-month purchase period. For the years ended December 31, 2016 and 2015, the Company issued 1,209,410 and 1,226,012 shares under the ESPP. No shares were issued to employees under the ESPP for the year ended December 31, 2014.
Stock Repurchase Program
In February 2016, the Company's board of directors authorized a stock repurchase program of up to $10.0 million, with stock purchases made from time to time in compliance with applicable securities laws in the open market or in privately negotiated transactions. The timing and amounts of any purchases will be based on market conditions and other factors including price, regulatory requirements and capital availability. The authorization does not require the purchase of any minimum number of shares, and the Company may suspend, modify or discontinue the program at any time without prior notice. Unless modified, or earlier suspended or discontinued, the authorization will expire as of June 30, 2017, without the Company's further action.
For the year ended December 31, 2016, the Company repurchased a total of 364,627 shares of its common stock on the open market at a total cost of $2.1 million with an average price per share of $5.87.
90
Determination of Fair Values
The Company determines the expected term of employee stock options using the simplified method as provided by the Securities and Exchange Commission. The simplified method is presumed to be the average of the time-to-vesting and the contractual life of the options. The expected term of ESPP is based on the contractual terms. Since the Company has not had sufficient public trading history of its common stock, the expected volatility is derived from the historical stock volatilities of the common stock of several publicly traded comparable companies over a period approximately equal to the expected term of the expected life of the options. The risk-free interest rate is based on the U.S. treasury yield curve in effect at the time of grant for zero-coupon U.S. treasury notes with maturities equal to the option's expected term. The expected dividend is assumed to be zero as the Company has never paid dividends and has no current plans to do so.
Prior to the IPO, the fair value of the shares of common stock underlying the stock-based awards was historically determined by the board of directors, with input from management. Because there was no public market for the Company’s common stock, the board of directors determined the fair value of the common stock on the grant-date of the stock-based award by considering a number of objective and subjective factors, including valuations of comparable companies, sales of the Company’s convertible preferred stock to unrelated third parties, operating and financial performance, the lack of liquidity of the Company’s capital stock, and general and industry-specific economic outlook. Subsequent to the completion of the Company’s IPO, the fair value of common stock underlying stock-based awards is determined based on the closing stock price of the Company’s shares on the date of grant.
Weighted average assumptions used to value the Company's stock options granted were as follows:
Year Ended December 31, | ||||||||
2016 | 2015 | 2014 | ||||||
Stock options: | ||||||||
Expected term (in years) | 5.78 | 6.04 | 5.56 | |||||
Expected volatility | 55 | % | 51 | % | 49 | % | ||
Risk free interest rate | 1.49 | % | 1.75 | % | 1.85 | % | ||
Dividend rate | — | — | — | |||||
Weighted average assumptions used to value MBRSUs under the Monte Carlo model were as follows:
Year Ended December 31, | ||||||
2016 | 2015 | 2014 | ||||
MBRSUs: | ||||||
Expected volatility | 53 | % | N/A | N/A | ||
Risk free interest rate | 1.07 | % | N/A | N/A | ||
N/A - Not applicable. No MBRSUs granted in those years. | ||||||
Weighted average assumptions used to value employee stock purchase rights under the Black-Scholes model were as follows:
Year Ended December 31, | |||||
2016 | 2015 | 2014 | |||
ESPP purchase rights: | |||||
Expected term (in years) | 0.5 - 1.00 | 0.5 - 2.00 | 0.68 - 2.00 | ||
Expected volatility | 34% - 44% | 35% - 55% | 35% - 40% | ||
Risk free interest rate | 0.49% - 0.82% | 0.07% - 0.51% | 0.08% - 0.49% | ||
Stock-based Compensation Expense
The total stock-based compensation the Company recognized for stock-based awards in the consolidated statements of operations is as follows:
91
Year Ended December 31, | |||||||||||
2016 | 2015 | 2014 | |||||||||
(in thousands) | |||||||||||
Cost of revenue | $ | 1,305 | $ | 902 | $ | 411 | |||||
Research and development | 5,393 | 4,651 | 2,419 | ||||||||
Sales and marketing | 8,269 | 7,112 | 4,121 | ||||||||
General and administrative | 6,735 | 5,706 | 3,301 | ||||||||
Total stock-based compensation | $ | 21,702 | $ | 18,371 | $ | 10,252 | |||||
The following table presents stock-based compensation expense by award-type:
Year Ended December 31, | |||||||||||
2016 | 2015 | 2014 | |||||||||
(in thousands) | |||||||||||
Stock Options | $ | 4,933 | $ | 4,733 | $ | 5,780 | |||||
Restricted Stock Units | 14,316 | 11,652 | 3,188 | ||||||||
Employee Stock Purchase Plan | 2,453 | 1,986 | 1,284 | ||||||||
Total stock-based compensation | $ | 21,702 | $ | 18,371 | $ | 10,252 | |||||
As of December 31, 2016, unrecognized stock-based compensation related to outstanding stock options, RSUs (including PBRSUs and MBRSUs) and ESPP purchase rights, net of estimated forfeitures, was $6.5 million, $20.2 million and $1.5 million, respectively, which the Company expects to recognize over weighted-average periods of 2.17 years, 2.30 years and 0.92 years, respectively. For the years ended December 31, 2015 and 2014, the Company capitalized $0.3 million and $0.4 million stock-based compensation expense, respectively, to internal-use cloud services platform. There was no capitalized stock-based compensation expense for the year ended 2016.
8. NET LOSS PER SHARE
The Company calculates basic and diluted net loss per share of common stock allocable to common stockholders by dividing the net loss allocable to common stockholders by the weighted average number of common shares outstanding during the period. Diluted net loss per share of common stock is the same as basic net loss per share of common stock, since the effects of potentially dilutive securities are antidilutive. Upon completion of the IPO, all outstanding convertible preferred stock were converted to common stock and were included in the weighted average number of common shares used to compute net loss per share from the conversion date.
The following table presents the computation of basic and diluted net loss per share allocable to common stockholders:
Year Ended December 31, | |||||||||||
2016 | 2015 | 2014 | |||||||||
(in thousands, except for share and per share data) | |||||||||||
Numerator: | |||||||||||
Net loss | $ | (36,911 | ) | $ | (44,218 | ) | $ | (29,037 | ) | ||
Denominator: | |||||||||||
Weighted-average shares used to compute net loss per share, basic and diluted | 50,332,872 | 47,323,253 | 36,097,405 | ||||||||
Net loss per share: | |||||||||||
Basic and diluted | $ | (0.73 | ) | $ | (0.93 | ) | $ | (0.80 | ) | ||
92
The Company excluded the following period-end outstanding common stock equivalents from the computation of diluted net loss per share for the periods presented because including them would have been antidilutive:
Year Ended December 31, | ||||||||
2016 | 2015 | 2014 | ||||||
Shares of common stock issuable under the Equity Incentive Plan | 10,585,444 | 10,589,268 | 9,776,124 | |||||
Common stock subject to repurchase | — | — | 27,000 | |||||
Common stock issuable upon exercise of warrants | — | 73,883 | 107,876 | |||||
Employee Stock Purchase Plan | 99,680 | 133,113 | 106,184 | |||||
Total | 10,685,124 | 10,796,264 | 10,017,184 | |||||
9. INCOME TAXES
The geographical breakdown of the Company’s loss before income taxes for the years ended December 31, 2016, 2015 and 2014 is as follows:
Year Ended December 31, | |||||||||||
2016 | 2015 | 2014 | |||||||||
(in thousands) | |||||||||||
(As Adjusted)* | (As Adjusted)* | ||||||||||
Domestic | $ | (27,520 | ) | $ | (37,658 | ) | $ | (22,145 | ) | ||
Foreign | (9,122 | ) | (6,208 | ) | (6,451 | ) | |||||
Loss before income Taxes | $ | (36,642 | ) | $ | (43,866 | ) | $ | (28,596 | ) | ||
* Certain amounts have been adjusted for the retrospective changes in accounting policy for sales commissions (See Note 1). | |||
The components of the income tax provision are as follows:
Year Ended December 31, | |||||||||||
2016 | 2015 | 2014 | |||||||||
(in thousands) | |||||||||||
Current: | |||||||||||
State | $ | 23 | $ | (39 | ) | $ | 93 | ||||
Federal | — | — | — | ||||||||
Foreign | 237 | 638 | 337 | ||||||||
Total current | $ | 260 | $ | 599 | $ | 430 | |||||
Deferred: | |||||||||||
State | $ | — | $ | — | $ | (1 | ) | ||||
Federal | 12 | 12 | 12 | ||||||||
Foreign | (3 | ) | (259 | ) | — | ||||||
Total deferred | $ | 9 | $ | (247 | ) | $ | 11 | ||||
Total income tax provision | $ | 269 | $ | 352 | $ | 441 | |||||
The Company has intercompany services agreements with its subsidiaries located in the United Kingdom, Netherlands, New Zealand, Australia, Canada and China, which require payment for services rendered by these subsidiaries at an arm’s-length transaction price. The foreign tax expense represents foreign income tax payable by these subsidiaries on profit generated on intercompany services agreements.
Undistributed earnings of the Company's foreign subsidiaries were approximately $10.0 million, $7.9 million and $4.1 million as of December 31, 2016, 2015 and 2014, respectively, and are considered to be permanently reinvested outside of the United States, and no U.S. income taxes have been provided for on these earnings.
93
The reconciliation of federal statutory income tax provision to the Company’s effective income tax provision is as follows:
Year Ended December 31, | |||||||||||
2016 | 2015 | 2014 | |||||||||
(in thousands) | |||||||||||
(As Adjusted)* | (As Adjusted)* | ||||||||||
U.S. federal taxes at statutory tax rate | $ | (12,458 | ) | $ | (14,915 | ) | $ | (9,723 | ) | ||
State taxes, net of federal benefit | 15 | (26 | ) | 61 | |||||||
Change in valuation allowance | 8,618 | 11,637 | 6,146 | ||||||||
Foreign tax rate differential | 3,334 | 2,752 | 2,509 | ||||||||
Warrant revaluation | — | — | (31 | ) | |||||||
Stock-based compensation | 1,805 | 1,775 | 2,025 | ||||||||
Tax credits | (947 | ) | (785 | ) | (627 | ) | |||||
Other | (98 | ) | (86 | ) | 81 | ||||||
Provision for income taxes | $ | 269 | $ | 352 | $ | 441 | |||||
* Certain amounts have been adjusted for the retrospective changes in accounting policy for sales commissions (See Note 1). | |||
Foreign tax rate differential is primarily due to losses incurred in foreign jurisdictions that are subject to tax rates that are lower than the United States tax rate.
The tax effects of temporary differences that give rise to significant components of the Company's deferred tax assets for federal and state income taxes are as follows:
As of December 31, | |||||||
2016 | 2015 | ||||||
(in thousands) | |||||||
Deferred tax assets: | (As Adjusted)* | ||||||
Net operating loss carryforwards | 43,482 | 40,357 | |||||
Research and development credits | 6,901 | 5,192 | |||||
Accruals and reserves | 3,682 | 3,044 | |||||
Deferred revenue | 12,006 | 10,068 | |||||
Stock-based compensation | 3,641 | 2,290 | |||||
Other | 113 | 440 | |||||
Gross deferred tax assets | 69,825 | 61,391 | |||||
Valuation allowance | (65,791 | ) | (56,352 | ) | |||
Total deferred tax assets | $ | 4,034 | $ | 5,039 | |||
Deferred tax liabilities: | |||||||
Internally developed software | $ | (1,590 | ) | $ | (2,303 | ) | |
Deferred Commission | $ | (2,192 | ) | $ | (2,486 | ) | |
Goodwill | $ | (74 | ) | $ | (63 | ) | |
Gross deferred tax liabilities | $ | (3,856 | ) | $ | (4,852 | ) | |
Net deferred tax asset (liabilities) | $ | 178 | $ | 187 | |||
* Certain amounts have been adjusted for the retrospective changes in accounting policy for sales commissions (See Note 1). | |||
Realization of deferred tax assets is dependent on future taxable income, the existence and timing of which is uncertain. Based on the Company’s history of losses, management has determined it cannot conclude that it is more likely than not that the deferred tax assets will be realized, and accordingly has placed a valuation allowance on the net deferred tax assets. The Company recorded a valuation allowance of $65.8 million and $56.4 million against its deferred tax assets as of December 31, 2016 and 2015.
94
The undistributed earnings from the Company’s foreign subsidiaries are not subject to a U.S. tax provision because it is management’s intention to permanently reinvest such undistributed earnings outside of the United States. The Company evaluates its circumstances and reassesses this determination on a periodic basis. As of December 31, 2016, the determination of the unrecorded deferred tax liability related to these earnings was immaterial. If circumstances change and it becomes apparent that some or all of the undistributed earnings of the Company’s foreign subsidiaries will be remitted in the foreseeable future, the Company will be required to recognize a deferred tax liability on those amounts.
The net operating loss and tax credit carryforwards as of December 31, 2016, are as follows:
Amount | Year Begin to Expire | |||
(in thousands) | ||||
Net operating losses, federal | 115,331 | 2026 | ||
Net operating losses, state | 79,084 | 2017 | ||
Research and development credits, federal | 5,816 | 2026 | ||
Research and development credits, state | 6,712 | No expiration | ||
Utilization of the net operating loss carryforwards and credits may be subject to a substantial annual limitation due to the ownership change limitations provided by the Internal Revenue Code of 1986, as amended (“Code”), and similar state provisions. The annual limitation may result in the expiration of net operation losses and credits before utilization. The Company completed an analysis under Sections 382 and 383 of the Code through the year ended December 31, 2016 and determined that an ownership change, as defined under Sections 382 and 383 of the Code, has not occurred. Future ownership changes may limit the Company's ability to utilize its net operating loss and credit carryforwards.
Uncertain Tax Positions
The following is a reconciliation of the beginning and ending amount of the Company’s total gross unrecognized tax benefit liabilities:
Year Ended December 31, | |||||||||||
2016 | 2015 | 2014 | |||||||||
(in thousands) | |||||||||||
Gross unrecognized tax benefit - beginning balance | $ | 3,316 | $ | 2,539 | $ | 1,797 | |||||
Decreases related to tax positions from prior years | (21 | ) | — | — | |||||||
Increases related to tax positions taken during current year | 1,146 | 777 | 742 | ||||||||
Gross unrecognized tax benefit - ending balance | $ | 4,441 | $ | 3,316 | $ | 2,539 | |||||
The Company maintains liabilities for uncertain tax positions. These liabilities involve considerable judgment and estimation and are continuously monitored by management based on the best information available, including changes in tax regulations, the outcome of relevant court cases, and other information. The Company recognizes potential accrued interest and penalties related to unrecognized tax benefits as income tax expense. During the years ended December 31, 2016, 2015 and 2014, the Company accrued an insignificant amount of interest and penalties related to unrecognized tax benefits.
The Company’s total unrecognized tax benefit, if recognized, would affect its effective tax rate by $0.07 million. The remainder of the unrecognized tax benefits would be offset by a change in the valuation allowance. While it is often difficult to predict the final outcome of any particular uncertain tax position, the Company does not believe that the amount of unrecognized tax benefits will change significantly in the next 12 months.
The Company files income tax returns in the U.S. federal, various U.S. state and foreign tax jurisdictions. The Company is subject to U.S. federal and various state income tax examinations for the 2006 through 2016 calendar tax years.
Fiscal years outside the normal statutes of limitation remain open to audit by tax authorities due to tax attributes generated in those early years which have been carried forward and may be audited in subsequent years when utilized. The Company is not currently being audited in any jurisdiction.
Tax attributes related to stock option windfall deductions are not recorded until they result in a reduction of cash tax payable. The Company's federal and state net operating losses from windfall deductions were excluded from its deferred tax asset balance as of December 31, 2016. As of December 31, 2016, the benefit of the federal and state net operating loss deferred tax assets of $1.0 million and $0.04 million, respectively, will be recorded to additional paid-in capital when they reduce cash tax payable.
95
10. SEGMENT INFORMATION
The Company’s chief operating decision maker (CODM) is its Chief Executive Officer. The Company derives its revenue primarily from sales of hardware products and software subscription and services. The Company’s CODM reviews financial information presented on a consolidated basis for purposes of allocating resources and evaluating financial performance. Accordingly, the Company determined that it operates as one reportable and operating segment.
The following table represents the Company's revenue based on the billing address of the respective VAR or the VAD:
Year Ended December 31, | |||||||||||
2016 | 2015 | 2014 | |||||||||
(in thousands) | |||||||||||
Americas | $ | 102,458 | $ | 97,811 | $ | 86,946 | |||||
Europe, Middle East and Africa | 49,681 | 40,876 | 36,317 | ||||||||
Asia Pacific | 17,686 | 12,972 | 14,029 | ||||||||
Total revenues | $ | 169,825 | $ | 151,659 | $ | 137,292 | |||||
Included within the Americas in the above table is revenue from sales in the United States of $94.7 million, $93.7 million and $82.0 million during the years ended December 31, 2016, 2015 and 2014, respectively. Aside from the United States, no country comprised 10% or more of the Company's total revenue for each of the years ended December 31, 2016, 2015 and 2014.
The following table summarizes the property and equipment, net by location:
As of December 31, | |||||||
2016 | 2015 | ||||||
(in thousands) | |||||||
United States | $ | 7,685 | $ | 7,561 | |||
People's Republic of China | 1,096 | 1,360 | |||||
United Kingdom | 227 | 235 | |||||
Total property and equipment, net | $ | 9,008 | $ | 9,156 | |||
11. SUBSEQUENT EVENTS
In January 2017, the Company authorized an increase of approximately 2.6 million shares of common stock reserved for issuance under the 2014 Equity Incentive Plan and an increase of 1.0 million shares of common stock reserved for issuance under the 2014 Employee Stock Purchase Plan. The increases had been approved by the Company’s board of directors pursuant to the “evergreen” provisions of the respective plans.
In January 2017, the Company effected a reduction in its global workforce, as a part of the Company's ongoing action to reduce operating expenses and improve financial results. The workforce reduction is expected to be completed by February 28, 2017. The Company expects to incur in the first quarter of fiscal year 2017 approximately $1.5 million restructuring charges related to employee termination costs, contract termination costs and other associated costs.
96
12. UNAUDITED SELECTED QUARTERLY FINANCIAL DATA
The following table sets forth the Company’s consolidated statements of operations data for the eight quarters ended December 31, 2016. This unaudited quarterly information has been prepared on the same basis as the Company’s audited consolidated financial statements and, in the opinion of management, includes all adjustments, consisting only of normal recurring adjustments, necessary for the fair presentation of this data.
Three Months Ended | |||||||||||||||||||||||||||||||
Dec 31, 2016 | Sept 30, 2016 | June 30, 2016 | March 31, 2016 | Dec 31, 2015 | Sept 30, 2015 | June 30, 2015 | March 31, 2015 | ||||||||||||||||||||||||
(In thousands) | |||||||||||||||||||||||||||||||
Revenue: | (As Adjusted)* | (As Adjusted)* | (As Adjusted)* | (As Adjusted)* | |||||||||||||||||||||||||||
Product | $ | 32,887 | $ | 31,691 | $ | 39,536 | $ | 32,456 | $ | 38,920 | $ | 36,130 | $ | 30,751 | $ | 20,480 | |||||||||||||||
Software subscription and services | 8,810 | 8,678 | 8,095 | 7,672 | 7,306 | 6,650 | 6,085 | 5,337 | |||||||||||||||||||||||
Total revenue | 41,697 | 40,369 | 47,631 | 40,128 | 46,226 | 42,780 | 36,836 | 25,817 | |||||||||||||||||||||||
Cost of revenue: | |||||||||||||||||||||||||||||||
Product | 10,309 | 10,070 | 12,413 | 10,439 | 12,362 | 11,707 | 9,619 | 6,808 | |||||||||||||||||||||||
Software subscription and services | 3,018 | 3,095 | 3,050 | 2,903 | 2,857 | 2,686 | 2,526 | 1,828 | |||||||||||||||||||||||
Total cost of revenue | 13,327 | 13,165 | 15,463 | 13,342 | 15,219 | 14,393 | 12,145 | 8,636 | |||||||||||||||||||||||
Gross profit | 28,370 | 27,204 | 32,168 | 26,786 | 31,007 | 28,387 | 24,691 | 17,181 | |||||||||||||||||||||||
Operating expenses: | |||||||||||||||||||||||||||||||
Research and development | 10,047 | 10,685 | 10,562 | 10,210 | 10,433 | 10,098 | 8,883 | 7,510 | |||||||||||||||||||||||
Sales and marketing | 18,961 | 19,647 | 21,322 | 21,068 | 21,035 | 21,364 | 20,195 | 18,495 | |||||||||||||||||||||||
General and administrative | 6,704 | 6,515 | 7,725 | 7,895 | 6,638 | 7,212 | 6,206 | 6,247 | |||||||||||||||||||||||
Operating loss | (7,342 | ) | (9,643 | ) | (7,441 | ) | (12,387 | ) | (7,099 | ) | (10,287 | ) | (10,593 | ) | (15,071 | ) | |||||||||||||||
Interest income | 123 | 109 | 117 | 119 | 54 | 21 | 19 | 14 | |||||||||||||||||||||||
Interest expense | (123 | ) | (115 | ) | (110 | ) | (126 | ) | (142 | ) | (140 | ) | (173 | ) | (754 | ) | |||||||||||||||
Other income (expense), net | 49 | 22 | 90 | 16 | 72 | 59 | 19 | 135 | |||||||||||||||||||||||
Loss before income taxes | (7,293 | ) | (9,627 | ) | (7,344 | ) | (12,378 | ) | (7,115 | ) | (10,347 | ) | (10,728 | ) | (15,676 | ) | |||||||||||||||
Provision for (benefit from) income taxes | (29 | ) | 85 | 68 | 145 | (70 | ) | 215 | 99 | 108 | |||||||||||||||||||||
Net loss | $ | (7,264 | ) | $ | (9,712 | ) | $ | (7,412 | ) | $ | (12,523 | ) | $ | (7,045 | ) | $ | (10,562 | ) | $ | (10,827 | ) | $ | (15,784 | ) | |||||||
* Certain amounts have been adjusted for the retrospective changes in accounting policy for sales commissions (See Note 1). | |||
ITEM 9. CHANGES IN AND DISAGREEMENTS WITH ACCOUNTANTS ON ACCOUNTING AND FINANCIAL DISCLOSURE
None.
ITEM 9A. CONTROLS AND PROCEDURES
Evaluation of Disclosure Controls and Procedures
Our management is responsible for establishing and maintaining adequate internal control over financial reporting. Management, with the participation of our chief executive officer and our chief financial officer, evaluated the effectiveness of our disclosure controls and procedures as of December 31, 2016. The term “disclosure controls and procedures,” as defined in Rules 13a-15(e) and 15d-15(e) under the Exchange Act, means controls and other procedures of a company that are designed to ensure that information required to be disclosed by a company in the reports that it files or submits under the Exchange Act is recorded, processed, summarized and reported, within the time periods specified in the SEC's rules and forms. Disclosure
97
controls and procedures include, without limitation, controls and procedures designed to ensure that information required to be disclosed by a company in the reports that it files or submits under the Exchange Act is accumulated and communicated to the company's management, including its principal executive and principal financial officers, as appropriate to allow timely decisions regarding required disclosure. Management recognizes that any controls and procedures, no matter how well-designed and operated, can provide only reasonable assurance of achieving their objectives, and management necessarily applies its judgment in evaluating the cost-benefit relationship of possible controls and procedures. Based on the evaluation of our disclosure controls and procedures as of December 31, 2016, our chief executive officer and chief financial officer concluded that, as of such date, our disclosure controls and procedures were effective at the reasonable assurance level.
Management’s Annual Report on Internal Control Over Financial Reporting
Our management is responsible for establishing and maintaining adequate internal control over financial reporting (as defined in Rule 13a-15(f) under the Exchange Act). Management conducted an assessment of the effectiveness of our internal control over financial reporting based on the criteria set forth in Internal Control - Integrated Framework issued by the Committee of Sponsoring Organizations of the Treadway Commission (2013 framework). Based on the assessment, management has concluded that its internal control over financial reporting was effective as of December 31, 2016 to provide reasonable assurance regarding the reliability of financial reporting and the preparation of financial statements in accordance with U.S. GAAP.
Changes in Internal Control over Financial Reporting
There were no changes in our internal control over financial reporting identified in connection with the evaluation required by Rule 13a-15(d) and 15d-15(d) of the Exchange Act that occurred during the quarter ended December 31, 2016 that have materially affected, or are reasonably likely to materially affect, our internal control over financial reporting.
ITEM 9B. OTHER INFORMATION
None.
98
PART III
ITEM 10. DIRECTORS, EXECUTIVE OFFICERS, AND CORPORATE GOVERNANCE
The information required by this item is incorporated by reference to our Proxy Statement for our 2017 Annual Meeting of Stockholders to be filed with the SEC within 120 days after the end of the fiscal year ended December 31, 2016.
ITEM 11. EXECUTIVE COMPENSATION
The information required by this item is incorporated by reference to our Proxy Statement for our 2017 Annual Meeting of Stockholders to be filed with the SEC within 120 days after the end of the fiscal year ended December 31, 2016.
ITEM 12. SECURITY OWNERSHIP OF CERTAIN BENEFICIAL OWNERS AND MANAGEMENT AND RELATED STOCKHOLDER MATTERS
The information required by this item is incorporated by reference to our Proxy Statement for our 2017 Annual Meeting of Stockholders to be filed with the SEC within 120 days after the end of the fiscal year ended December 31, 2016.
ITEM 13. CERTAIN RELATIONSHIPS AND RELATED TRANSACTIONS, AND DIRECTOR INDEPENDENCE
The information required by this item is incorporated by reference to our Proxy Statement for our 2017 Annual Meeting of Stockholders to be filed with the SEC within 120 days after the end of the fiscal year ended December 31, 2016.
ITEM 14. PRINCIPAL ACCOUNTANT FEES AND SERVICES
The information required by this item is incorporated by reference to our Proxy Statement for our 2017 Annual Meeting of Stockholders to be filed with the SEC within 120 days after the end of the fiscal year ended December 31, 2016.
PART IV
ITEM 15. EXHIBITS AND FINANCIAL STATEMENT SCHEDULES
Documents filed as part of this report are as follows:
1. | Consolidated Financial Statements |
Our Consolidated Financial Statements are listed in the “Index to Consolidated Financial Statements” Under Part II, Item 8 of this report.
2. | Financial Statement Schedules |
All financial statement schedules are omitted because the information called for is not required or is shown either in the consolidated financial statements or in the notes thereto.
3. | Exhibits |
The documents listed in the Exhibit Index of this report are incorporated by reference or are filed with this report, in each case as indicated therein (numbered in accordance with Item 601 of Regulation S-K).
SIGNATURES
Pursuant to the requirements of Section 13 or 15(d) of the Securities Exchange Act of 1934, the registrant has duly caused this report to be signed on its behalf by the undersigned, thereunto duly authorized, on the 24th day of February 2017.
AEROHIVE NETWORKS, INC. | |||||
By: | /s/ David K. Flynn | ||||
David K. Flynn | |||||
President and Chief Executive Officer | |||||
101
POWER OF ATTORNEY
KNOW ALL PERSONS BY THESE PRESENTS, that each person whose signature appears below constitutes and appoints David K. Flynn and John Ritchie and each of them, his attorneys-in-fact, each with the power of substitution, for him in any and all capacities, to sign any and all amendments to this Annual Report on Form 10-K and to file the same, with exhibits thereto and other documents in connection therewith, with the Securities and Exchange Commission, hereby ratifying and confirming all that each of said attorneys-in-fact, or his substitute or substitutes, may do or cause to be done by virtue hereof.
Pursuant to the requirements of the Securities Exchange Act of 1934, this report has been signed below by the following persons on behalf of the registrant and in the capacities and on the dates indicated:
Signature | Title | Date | |||||
/s/ David K. Flynn | President, Chief Executive Officer and Chair of the Board (Principal Executive Officer) | February 24, 2017 | |||||
David K. Flynn | |||||||
/s/ John Ritchie | Chief Financial Officer (Principal Accounting and Financial Officer) | February 24, 2017 | |||||
John Ritchie | |||||||
/s/ Remo Canessa | Director | February 24, 2017 | |||||
Remo Canessa | |||||||
/s/ Curt Garner | Director | February 24, 2017 | |||||
Curt Garner | |||||||
/s/ Changming Liu | Director | February 24, 2017 | |||||
Changming Liu | |||||||
/s/ Frank J. Marshall | Director | February 24, 2017 | |||||
Frank J. Marshall | |||||||
/s/ John Gordon Payne | Director | February 24, 2017 | |||||
John Gordon Payne | |||||||
/s/ Conway 'Todd' Rulon-Miller | Director | February 24, 2017 | |||||
Conway 'Todd' Rulon-Miller | |||||||
/s/ Christopher J. Schaepe | Director | February 24, 2017 | |||||
Christopher J. Schaepe | |||||||
102
EXHIBIT INDEX
Exhibit No. | Exhibit | Form | File No. | Filing Date | Exhibit No. | Filed Herewith | ||||||
3.1 | Eighth Amended and Restated Certificate of Incorporation of the Company, as amended, as currently in effect. | 10-Q | 001-36355 | 05/13/14 | 3.1 | |||||||
3.2 | Amended and Restated Bylaws of the Company. | 10-Q | 001-36355 | 05/13/14 | 3.2 | |||||||
4.7 | Specimen common stock certificate of the Company. | S-1 | 333-193939 | 02/13/14 | 4.6 | |||||||
10.1+ | Form of Indemnification Agreement between the Company and each of its directors and executive officers. | S-1 | 333-193939 | 02/13/14 | 10.1 | |||||||
10.2+ | 2006 Global Share Plan, as amended, and forms of agreements thereunder. | S-1/A | 333-193939 | 03/17/14 | 10.2 | |||||||
10.3+ | 2014 Equity Incentive Plan and forms of agreements thereunder. | S-1/A | 333-193939 | 03/17/14 | 10.3 | |||||||
10.4+ | 2014 Employee Stock Purchase Plan and form of agreement thereunder. | S-1/A | 333-193939 | 03/17/14 | 10.4 | |||||||
10.5+ | Offer Letter, dated January 16, 2007, by and between the Company and David K. Flynn. | S-1 | 333-193939 | 02/13/14 | 10.5 | |||||||
10.6+ | Offer Letter, effective December 11, 2012, by and between the Company and Steve Debenham. | S-1 | 333-193939 | 02/13/14 | 10.8 | |||||||
10.7+ | Offer Letter, dated August 20, 2013, by and between the Company and David Greene. | S-1 | 333-193939 | 02/13/14 | 10.9 | |||||||
10.8+ | Offer Letter, dated April 1, 2015, by and between the Company and Tom Wilburn. | 10-Q | 001-36355 | 08/12/15 | 10.3 | |||||||
10.9+ | Offer Letter dated August 27, 2015 by and between the Company and John Ritchie. | 8-K | 001-36355 | 11/09/15 | 10.1 | |||||||
10.10+ | Form of Separation and Change in Control Severance Agreement, entered into by and between the Company and certain executive officers. | S-1 | 333-193939 | 02/13/14 | 10.10 | |||||||
10.11+ | Form of Amendment to Separation and Change in Control Agreement, entered into by and between the Company and certain executive officers. | 10-K | 001-36355 | 03/17/15 | 10.11 | |||||||
10.12+ | Separation and Change in Control Severance Agreement, effective as of October 1, 2013, by and between the Company and David K. Flynn. | S-1 | 333-193939 | 02/13/14 | 10.11 | |||||||
10.13+ | Separation and Change in Control Severance Agreement, effective as of October 1, 2013, by and between the Company and Steve Debenham. | S-1 | 333-193939 | 02/13/14 | 10.12 | |||||||
10.14+ | Separation and Change in Control Severance Agreement, effective as of October 1, 2013, by and between the Company and David Greene. | S-1 | 333-193939 | 02/13/14 | 10.13 | |||||||
10.15+ | Form of Separation and Change in Control Severance Agreement, entered into by and between the Company and certain of its senior officers. | S-1 | 333-193939 | 02/13/14 | 10.16 | |||||||
10.16+ | Separation and Change in Control Severance Agreement, effective as of August 31, 2015, by and between the Company and John Ritchie. | 10-Q | 001-36355 | 11/09/15 | 10.2 | |||||||
103
10.17 | Amended and Restated Lease, dated March 1, 2011, by and between the Company and Batton Associates, LLC. | S-1 | 333-193939 | 02/13/14 | 10.17 | |||||||
10.18 | First Amendment, dated February 1, 2015, to Amended and Restated Lease, dated March 1, 2011, by and between the Company and Batton Associates, LLC. | 10-K | 001-36355 | 03/17/15 | 10.19 | |||||||
10.19 | Lease Agreement, dated May 2, 2013, by and between the Company and Hanover Properties Ltd., as amended May 23, 2013. | S-1 | 333-193939 | 02/13/14 | 10.18 | |||||||
10.20 | Premises Lease Contract, effective October 1, 2013, by and between CECEP Industry Development C.I.C., Ltd. and Aerohive Networks (Hangzhou) Co., Ltd. | S-1 | 333-193939 | 02/13/14 | 10.19 | |||||||
10.21 | Lease of West Block, The Courtyard, 17-18 West Street, Farnham, Surrey, GU9 7DR, dated May 31, 2012, by and between Ecclesiastical Insurance Office PLC and Aerohive Networks Europe Limited. | S-1 | 333-193939 | 02/13/14 | 10.20 | |||||||
10.22 | Amended and Restated Loan and Security Agreement, dated as of February 18, 2016, by and between the Company and Silicon Valley Bank. | 10-K | 001-36355 | 02/26/16 | 10.34 | |||||||
10.23+ | Executive Incentive Compensation Plan. | S-1 | 333-193939 | 02/13/14 | 10.24 | |||||||
10.24+ | Outside Director Compensation Policy. | 10-K | 001-36355 | 03/17/15 | 10.27 | |||||||
10.25+ | Outside Director Compensation Policy (Amended as of May 10, 2016). | 10-Q | 001-36355 | 08/04/16 | 10.1 | |||||||
10.26 | Form of Stock Option Agreement. | 10-Q | 001-36355 | 08/12/14 | 10.1 | |||||||
10.27 | Form of Restricted Stock Unit Agreement. | 10-Q | 001-36355 | 08/12/14 | 10.2 | |||||||
10.28 | Form of Performance-Based Stock Option Agreement. | 10-Q | 001-36355 | 5/5/2016 | 10.1 | |||||||
10.29 | Form of Performance-Based Restricted Stock Unit Agreement. | 10-Q | 001-36355 | 5/5/2016 | 10.2 | |||||||
10.30 | Sublease Agreement, dated February 3, 2016, by and between Bayer Healthcare LLC and Aerohive Networks, Inc. | 10-Q | 001-36355 | 5/5/2016 | 10.3 | |||||||
21.1 | List of subsidiaries of the Company. | X | ||||||||||
23.1 | Consent of Deloitte and Touche LLP, Independent Registered Public Accounting Firm. | X | ||||||||||
24.1 | Power of Attorney (included on the signature page to the 10-K). | X | ||||||||||
31.1^ | Certification of Chief Executive Officer pursuant to Section 302 of the Sarbanes-Oxley Act of 2002. | X | ||||||||||
31.2^ | Certification of Chief Financial Officer pursuant to Section 302 of the Sarbanes-Oxley Act of 2002. | X | ||||||||||
32.1^ | Certification of Chief Executive Officer pursuant to 18 U.S.C. Section 1350, as adopted pursuant to Section 906 of the Sarbanes-Oxley Act of 2002. | X | ||||||||||
32.2^ | Certification of Chief Financial Officer pursuant to 18 U.S.C. Section 1350, as adopted pursuant to Section 906 of the Sarbanes-Oxley Act of 2002. | X | ||||||||||
101.INS | XBRL Instance Document. | X | ||||||||||
104
101.SCH | XBRL Taxonomy Extension Schema Document. | X | ||||||||||
101.CAL | XBRL Taxonomy Extension Calculation Linkbase Document. | X | ||||||||||
101.DEF | XBRL Taxonomy Extension Definition Linkbase Document. | X | ||||||||||
101.LAB | XBRL Taxonomy Extension Labels Linkbase Document. | X | ||||||||||
101.PRE | XBRL Taxonomy Extension Presentation Linkbase Document. | X | ||||||||||
+ Indicates a management contract or compensation plan.
^ In accordance with Item 601(b)(32)(ii) of Regulation S-K and SEC Release Nos. 33-8238 and 34-47986, Final Rule; Management’s Reports on Internal Control over Financial Reporting and Certification of Disclosure in Exchange Act Periodic Reports, the Certification furnished in Exhibit 32.1 and 32.2 hereto is deemed to accompany this Form 10-K and will not be filed for purposes of Section 18 of the Exchange Act. Such certification will not be deemed incorporated by reference into any filing under the Securities Act or the Exchange Act, except to the extent that the Registrant specifically incorporates it by reference.
105