Attached files
| file | filename |
|---|---|
| EX-99.1 - EXHIBIT 99.1 - TELEFLEX INC | ex991to2-23x20178kreearnin.htm |
| 8-K - 8-K - TELEFLEX INC | a2-23x20178xkreearningsrel.htm |

1
Teleflex Incorporated
Fourth Quarter 2016
Earnings Conference Call

2
Conference Call Logistics
The release, accompanying slides, and replay webcast are available online at
www.teleflex.com (click on “Investors”)
Telephone replay available by dialing 855-859-2056 or for international calls, 404-
537-3406, pass code number 65576607

3
Introductions
Benson Smith
Chairman and CEO
Liam Kelly
President and COO
Thomas Powell
Executive Vice President and CFO
Jake Elguicze
Treasurer and Vice President of Investor Relations

4
Note on Forward-Looking Statements
This presentation and our discussion contain forward-looking information and statements including, but not
limited to, expected 2017 revenue growth from new product sales; our expectation that our acquisition of
Vascular Solutions, Inc. will be accretive to our 2017 adjusted earnings per share results; forecasted 2017
GAAP and constant currency revenue growth, GAAP and adjusted gross and operating margins and adjusted
earnings per share and the items that are expected to impact each of those forecasted results; our
assumptions with respect to the euro to U.S. dollar exchange rate for 2017 and our adjusted weighted
average shares for 2017; estimated pre-tax charges we expect to incur and annualized pre-tax savings we
expect to realize in connection with our restructuring programs; our expectations with respect to when we
will begin to realize savings from our restructuring programs and when those programs will be substantially
completed; and other matters which inherently involve risks and uncertainties which could cause actual
results to differ from those projected or implied in the forward–looking statements. These risks and
uncertainties are addressed in our SEC filings, including our most recent Form 10-K.
Note on Non-GAAP Financial Measures
This presentation refers to certain non-GAAP financial measures, including, but not limited to, constant
currency revenue growth, adjusted diluted earnings per share, adjusted gross and operating margins and
adjusted tax rate. These non-GAAP financial measures should not be considered replacements for, and
should be read together with, the most comparable GAAP financial measures. Tables reconciling these
non-GAAP financial measures to the most comparable GAAP financial measures are contained within the
appendices to this presentation.
Additional Notes
Unless otherwise noted, the following slides reflect continuing operations.

5
Executive Summary
Fourth quarter 2016 revenue of $513.9 million
• Up 6.1% vs. prior year period on an as-reported basis
• Up 6.9% vs. prior year period on a constant currency basis
Fourth quarter 2016 Earnings Per Share
• GAAP EPS of $1.29, down 31.4% vs. prior year period
• Adjusted EPS of $2.13, up 6.0% vs. prior year period
Full year 2016 revenue of $1.87 billion
• Up 3.2% vs. prior year on an as-reported basis
• Up 4.1% vs. prior year on a constant currency basis
Full year 2016 Earnings Per Share
• GAAP EPS of $4.98, up 1.4% vs. prior year
• Adjusted EPS of $7.34, up 16.0% vs. prior year
Note: See appendices for reconciliations of non-GAAP information

6
Executive Summary
Succession Planning Update
• Benson Smith to retire as Chief Executive Officer effective December 31, 2017
• Mr. Smith, a Teleflex Board member since 2005, will continue to serve as Teleflex’s
Chairman of the Board. He has been nominated by Teleflex’s Board of Directors to
serve for another three year term if elected by Teleflex’s stockholders at the 2017
annual meeting to be held in May, 2017
• Liam Kelly, who currently serves as Teleflex’s President and Chief Operating Officer,
has been named by the Teleflex Board of Directors to succeed Mr. Smith as Chief
Executive Officer following Mr. Smith’s retirement

7
Fourth Quarter Highlights
Fourth quarter 2016 constant currency revenue growth of 6.9%
• Sales volume of existing products contribute 4.5% of constant currency growth
• Sales volume of new products contribute 1.6% of constant currency growth
• Acquisitions contribute 0.4% of constant currency revenue growth
• Pricing increases contribute 0.4% of constant currency growth
Note: See appendices for reconciliations of non-GAAP information
8
Segment Revenue Review
Q4’16 Q4’15
Constant Currency Revenue Commentary
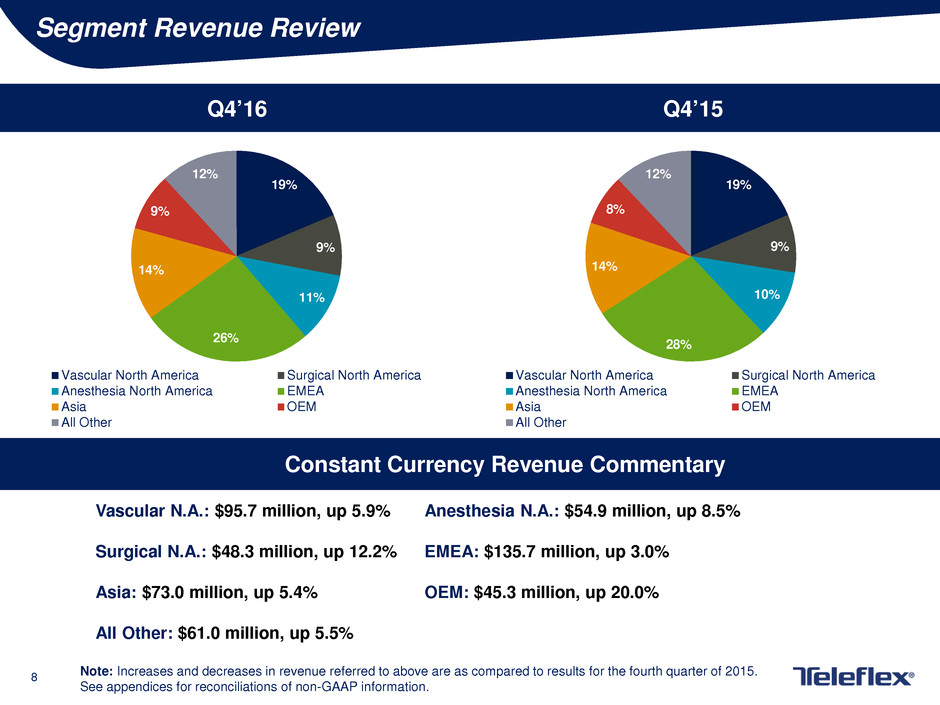
Vascular N.A.: $95.7 million, up 5.9% Anesthesia N.A.: $54.9 million, up 8.5%
Surgical N.A.: $48.3 million, up 12.2% EMEA: $135.7 million, up 3.0%
Asia: $73.0 million, up 5.4% OEM: $45.3 million, up 20.0%
All Other: $61.0 million, up 5.5%
Note: Increases and decreases in revenue referred to above are as compared to results for the fourth quarter of 2015.
See appendices for reconciliations of non-GAAP information.
19%
9%
11%
26%
14%
9%
12%
Vascular North America Surgical North America
Anesthesia North America EMEA
Asia OEM
All Other
19%
9%
10%
28%
14%
8%
12%
Vascular North America Surgical North America
Anesthesia North America EMEA
Asia OEM
All Other

9
Group Purchasing Organization and IDN Review
Track record of expansion of contractual agreements continues in Q4’16
Group Purchasing Organization Update
• 3 renewed agreements
• 1 existing agreement not renewed
IDN Update
• 15 renewed agreements
• 4 new agreements
• 3 existing agreements not renewed

10
Product Introductions and Regulatory Approvals
Arrow® VPS Rhythm™ Device with Optional TipTracker™ Technology
PRODUCT DESCRIPTION
Recently received FDA 510(k) clearance for the
Arrow ® VPS Rhythm ™ Device expands Teleflex’s
Catheter Tip Navigation and Placement portfolio
to now include familiar ECG-only technology for
the elimination of confirmatory chest X-ray.
The Arrow® VPS Rhythm™ Device assists in
placement and confirmation of a catheter tip in
the SVC-CAJ (superior vena-cava-cavoatrial
junction); it may be used with a broad range of
catheter types and brands. Intravascular P-wave
changes are saved as the catheter approaches the
SVC, helping to identify the lower 1/3 of the SVC,
near the CAJ, eliminating the need for
confirmatory chest X-ray or fluoroscopy in adult
patients. When paired with the single-use
TipTracker™ Stylet for insertion of peripherally-
inserted central catheters (PICCs), the Arrow® VPS
Rhythm™ Device provides real-time visual
navigation by tracing the catheter pathway with a
blue line on a color screen. The Device has an
expansive sphere of visual navigation to provide
easy navigation of the PICC during insertion.
11
Product Introductions and Regulatory Approvals
LMA® Gastro™ Airway with Cuff Pilot™ Technology
PRODUCT DESCRIPTION
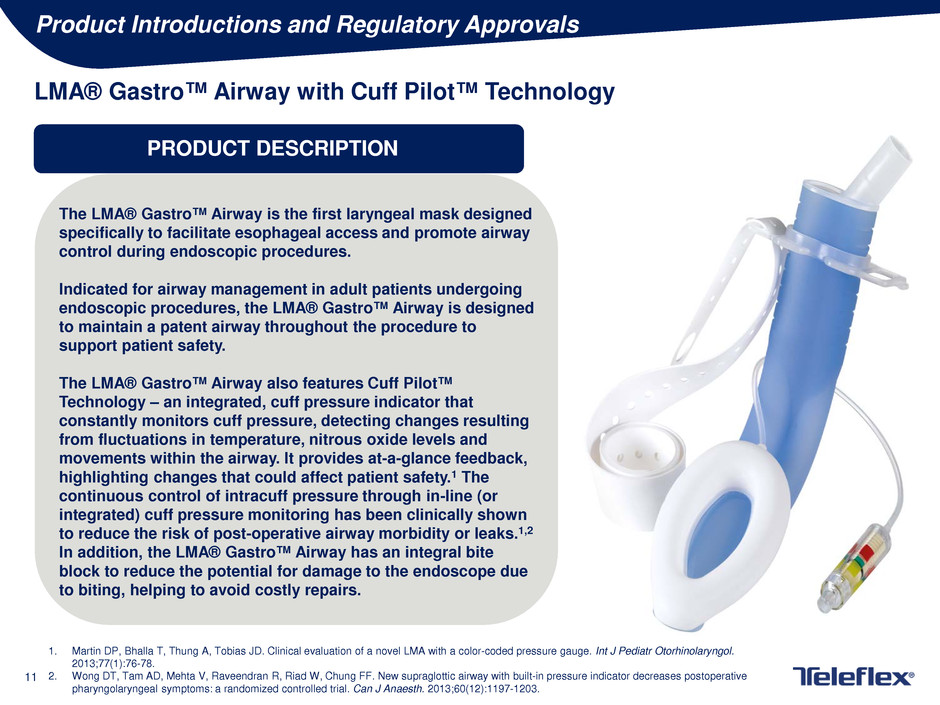
The LMA® Gastro™ Airway is the first laryngeal mask designed
specifically to facilitate esophageal access and promote airway
control during endoscopic procedures.
Indicated for airway management in adult patients undergoing
endoscopic procedures, the LMA® Gastro™ Airway is designed
to maintain a patent airway throughout the procedure to
support patient safety.
The LMA® Gastro™ Airway also features Cuff Pilot™
Technology – an integrated, cuff pressure indicator that
constantly monitors cuff pressure, detecting changes resulting
from fluctuations in temperature, nitrous oxide levels and
movements within the airway. It provides at-a-glance feedback,
highlighting changes that could affect patient safety.1 The
continuous control of intracuff pressure through in-line (or
integrated) cuff pressure monitoring has been clinically shown
to reduce the risk of post-operative airway morbidity or leaks.1,2
In addition, the LMA® Gastro™ Airway has an integral bite
block to reduce the potential for damage to the endoscope due
to biting, helping to avoid costly repairs.
1. Martin DP, Bhalla T, Thung A, Tobias JD. Clinical evaluation of a novel LMA with a color-coded pressure gauge. Int J Pediatr Otorhinolaryngol.
2013;77(1):76-78.
2. Wong DT, Tam AD, Mehta V, Raveendran R, Riad W, Chung FF. New supraglottic airway with built-in pressure indicator decreases postoperative
pharyngolaryngeal symptoms: a randomized controlled trial. Can J Anaesth. 2013;60(12):1197-1203.

12
New Product Revenue Growth Trend
25 new products and line extensions introduced in 2016 and 88 since 2013
Revenue growth acceleration from new product introductions expected to continue in 2017
driven by contributions from MiniLap, Percuvance, VPS CG+, VPS Rhythm, AC3, LMA Protector
0.9%
1.1%
1.3%
1.4%
to
1.6%
0.4%
0.9%
2.0%
0.0%
0.5%
1.0%
1.5%
2.0%
2.5%
2014 2015 2016 2017E
Total Company North America

13
Acquisition Update
Completed Acquisition of Vascular Solutions
1. Highly strategic and complementary acquisition
− Significantly advances Teleflex’s offering of vascular and interventional solutions
− Adds over 90 proprietary products and services that are sold to interventional cardiologists,
interventional radiologists, electrophysiologists and vein specialists
2. Accelerates Teleflex’s sales growth trajectory and provides sales channel opportunity
− Vascular Solutions has consistently generated > 10% revenue growth per year
− Ability to capitalize on Teleflex’s existing international infrastructure to drive further O.U.S.
penetration of Vascular Solutions product offerings
3. Improves R&D pipeline
− Acquisition provides a robust pipeline of new and next-generation products that address
complex interventions, radial artery catheterizations and embolization procedures
4. Compelling financial profile that substantially improves Teleflex’s revenue growth,
margins, earnings and cash flow generation capabilities
− Expected to be accretive to adjusted earnings per share1 in 2017, including the impact of
incremental interest expense associated with financing the transaction
− Fits into existing strategic business unit franchises and call points allowing for synergies
1 - Adjusted earnings per share excludes specified items such as amortization of acquired intangibles, inventory step-up, restructuring costs and other costs incurred
to execute the transaction. Adjusted earnings per share is a non-GAAP financial measure and should not be considered a replacement for GAAP results.

14
Fourth Quarter Financial Review
Revenue of $513.9 million
• Up 6.1% vs. prior year period on an as-reported basis
• Up 6.9% vs. prior year period on a constant currency basis
Gross Margin
• GAAP gross margin of 53.1%, down 60 bps vs. prior year period
• Adjusted gross margin of 53.8%, down 30 bps vs. prior year period
Operating Margin
• GAAP operating margin of 13.0%, down 700 bps vs. prior year period
• Adjusted operating margin of 25.0%, up 130 bps vs. prior year period
Tax Rate
• GAAP tax rate of (19.8%), down 1,070 bps vs. prior year period
• Adjusted tax rate of 16.5%, up 290 bps vs. prior year period
Earnings Per Share
• GAAP EPS of $1.29, down 31.4% vs. prior year period
• Adjusted EPS of $2.13, up 6.0% vs. prior year period
Note: See appendices for reconciliations of non-GAAP information
15
2017 Financial Outlook Assumptions
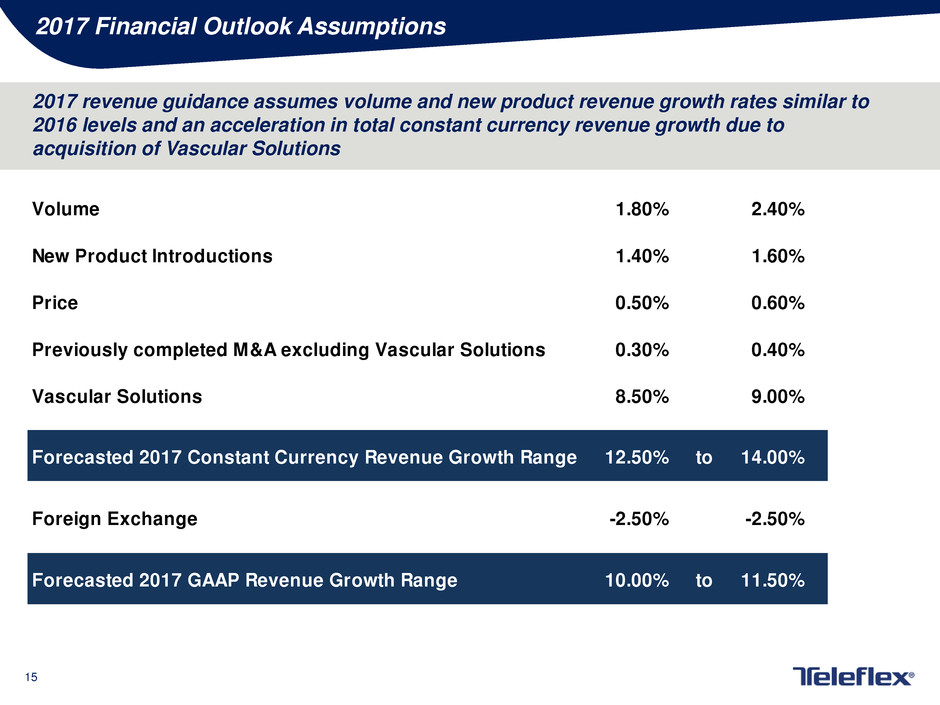
2017 revenue guidance assumes volume and new product revenue growth rates similar to
2016 levels and an acceleration in total constant currency revenue growth due to
acquisition of Vascular Solutions
Volume 1.80% 2.40%
New Product Introductions 1.40% 1.60%
Price 0.50% 0.60%
Previously completed M&A excluding Vascular Solutions 0.30% 0.40%
Vascular Solutions 8.50% 9.00%
Forecasted 2017 Constant Currency Revenue Growth Range 12.50% to 14.00%
Foreign Exchange -2.50% -2.50%
Forecasted 2017 GAAP Revenue Growth Range 10.00% to 11.50%

16
2017 Financial Outlook Assumptions
2017 Adjusted Gross Margin Drivers
Gross margin expansion in 2017 as compared to 2016
expected to be driven by:
• Cost improvement programs
• Benefits from 2014 and 2016 restructuring plans
• Favorable product mix
• Improved pricing
• New product introductions
• Vascular Solutions acquisition
Gross margin impacted negatively in 2017 as compared
to 2016 due to:
• Foreign currency exchange rates
Note: figures represent adjusted gross margin. See Appendices for reconciliation of actual and forecasted GAAP
results to actual and forecasted adjusted results.
+140 bps

17
2017 Financial Outlook Assumptions
2017 Adjusted Operating Margin Drivers
Improved financial leverage generated during
2015 and 2016 expected to continue in 2017
Adjusted gross margin improvement expected to
contribute between 130 and 190 basis points
SG&A expense cost control allows for
investment into R&D productivity initiatives
while still driving more than a one-for-one flow
through between adjusted gross and operating
margin expansion:
• Additional R&D investments in both Vascular and
Surgical product development
• Additional investments in sales force in North
America and Asia
• Reduced spending due to benefits from 2016
SG&A focused restructuring initiative
Note: figures represent adjusted operating margin. See Appendices for reconciliation of actual and forecasted
GAAP results to actual and forecasted adjusted results.
+260 bps

18
2017 Financial Outlook Assumptions
Base business portfolio capable of generating consistent revenue growth and operating leverage, coupled
with addition of Vascular Solutions, expected to lead to 2017 adjusted EPS growth of 9.0% to 11.0%
Note: see Appendices for tables reconciling actual and forecasted adjusted earnings per share results to actual and
forecasted GAAP earnings per share results.
2016 Adjusted Earnings per Share $7.34 $7.34
Base business $1.12 to $1.17
China Go-Direct ($0.15) to ($0.12)
Interest expense base TFX excluding Vascular Solutions ($0.09) to ($0.08)
Weighted average shares ($0.12) to ($0.11)
Foreign currency exchange rates ($0.30) to ($0.30)
Vascular Solutions $0.20 to $0.25
2017 Adjusted Earnings per Share Outlook $8.00 to $8.15

19
Any Questions?

20
Thank You

21
Appendices

22
Non-GAAP Financial Measures
The following appendices include, among other things, tables reconciling the following non-GAAP financial
measures to the most comparable GAAP financial measure:
• Constant currency revenue growth. This measure excludes the impact of translating the results of
international subsidiaries at different currency exchange rates from period to period.
• Adjusted diluted earnings per share. This measure excludes, depending on the period presented (i)
restructuring and other impairment charges; (ii) certain losses and other charges, including charges
related to acquisition and facility consolidations, net of reversals related to contingent consideration
liabilities and the medical device tax; (iii) amortization of the debt discount on the Company’s convertible
notes; (iv) intangible amortization expense; and (v) tax benefits resulting primarily from the expiration of
applicable statutes of limitations for prior year returns and/or the resolution of audits or filing of emended
returns with respect to prior tax years, and tax law changes affecting the Company’s deferred tax liability.
In addition, the calculation of diluted shares within adjusted earnings per share gives effect to the anti-
dilutive impact of the Company’s convertible note hedge agreements, which reduce the potential economic
dilution that otherwise would occur upon conversion of the Company’s senior subordinated convertible
notes (under GAAP, the anti-dilutive impact of the convertible note hedge agreements is not reflected in
diluted shares).
• Adjusted gross margin. This measure excludes, depending on the period presented, certain losses, other
charges and charge reversals, primarily related to facility consolidations.
• Adjusted operating margin. This measure excludes, depending on the period presented, (i) the impact of
restructuring and other impairment charges; (ii) losses and other charges primarily related to acquisition
and facility consolidations, net of reversals related to contingent consideration liabilities and the medical
device tax; and (iii) intangible amortization expense.
• Adjusted tax rate. This measure is the percentage of the Company’s adjusted taxes on income from
continuing operations to its adjusted income from continuing operations before taxes. Adjusted taxes on
income from continuing operations excludes, depending on the period presented, the impact of tax
benefits or costs associated with (i) restructuring and impairment charges; (ii) amortization of the debt
discount on the Company’s convertible notes; (iii) intangible amortization expense; (iv) the resolution of, or
expiration of statutes of limitations with respect to, various prior years’ tax matters and tax law changes
affecting our deferred tax liability; and (vii) losses and other charges primarily related to acquisition and
facility consolidation charges, net of reversals related to contingent consideration liabilities and the
medical device excise tax.

23
APPENDIX A –
RECONCILIATION OF CONSTANT CURRENCY REVENUE GROWTH
DOLLARS IN MILLIONS
December 31, 2016 December 31, 2015 Constant Currency Currency Total
Vascular North America 95.7$ 90.3$ 5.9% 0.0% 5.9%
Anesthesia North America 54.9 50.6 8.5% 0.0% 8.5%
Surgical North America 48.3 43.1 12.2% 0.0% 12.2%
EMEA 135.7 135.2 3.0% (2.6%) 0.4%
Asia 73.0 69.2 5.4% 0.0% 5.4%
OEM 45.3 37.8 20.0% (0.2%) 19.8%
All Other 61.0 58.3 5.5% (0.8%) 4.7%
Net Revenues 513.9$ 484.5$ 6.9% (0.8%) 6.1%
Three Months Ended % Increase / (Decrease)

24
APPENDIX B –
RECONCILIATION OF CONSTANT CURRENCY REVENUE GROWTH
DOLLARS IN MILLIONS
December 31, 2016 December 31, 2015 Constant Currency Currency Total
Vascular North America 350.5$ 334.9$ 4.8% (0.2%) 4.6%
Anesthesia North America 198.8 189.2 5.2% (0.2%) 5.0%
Surgical North America 172.2 161.3 7.1% (0.3%) 6.8%
EMEA 510.9 514.5 1.1% (1.8%) (0.7%)
Asia 249.4 241.7 4.3% (1.1%) 3.2%
OEM 161.0 149.4 7.8% 0.0% 7.8%
All Other 225.2 218.7 4.2% (1.2%) 3.0%
Net Revenues 1,868.0$ 1,809.7$ 4.1% (0.9%) 3.2%
Twelve Months Ended % Increase / (Decrease)

25
APPENDIX C –
RECONCILIATION OF REVENUE GROWTH
DOLLARS IN MILLIONS
% Basis Points
Three Months Ended December 31, 2015 Revenue As-Reported $484.5
Foreign Currency (3.9) -0.8% (81)
Sales Volume Existing Products 21.6 4.5% 445
New Product Sales 7.8 1.6% 161
Pricing 1.8 0.4% 37
Acquisitions 2.2 0.4% 44
Three Months Ended December 31, 2016 Revenue As-Reported $513.9 6.1%
Year-over-year growth

26
APPENDIX D –
RECONCILIATION OF ADJUSTED GROSS PROFIT AND MARGIN
DOLLARS IN THOUSANDS
December 31, 2016 December 31, 2015
Teleflex gross profit as-reported 273,052$ 260,316$
Teleflex gross margin as-reported 53.1% 53.7%
Losses and other charges, net (A) 3,686 1,895
Adjusted Teleflex gross profit 276,738$ 262,211$
Adjusted Teleflex gross margin 53.8% 54.1%
Teleflex revenue as-reported 513,933$ 484,501$
Three Months Ended
(A) In 2016 and 2015, losses and other charges, net related primarily to facility consolidations.

27
APPENDIX E –
RECONCILIATION OF ADJUSTED GROSS PROFIT AND MARGIN
DOLLARS IN THOUSANDS
12/31/16 12/31/15 12/31/14
Teleflex gross profit as-reported 996,200$ 944,403$ 942,428$
Teleflex gross margin as-reported 53.3% 52.2% 51.2%
Losses and other charges, net (A) 14,559 9,449 4,886
Adjusted Teleflex gross profit 1,010,759$ 953,852$ 947,314$
Adjusted Teleflex gross margin 54.1% 52.7% 51.5%
Teleflex revenue as-reported 1,868,027$ 1,809,690$ 1,839,832$
Year Ended
(A) In 2016, 2015 and 2014, losses and other charges, net related primarily to facility consolidations.

28
APPENDIX F –
RECONCILIATION OF ADJUSTED OPERATING PROFIT AND MARGIN
DOLLARS IN THOUSANDS
(A) In 2016, “other impairment charges” included pre-tax, non-cash impairment charges of $41.0 million related to the Company’s Semprus
technology and $2.4 million related to two properties, one of which was classified as an asset held for sale. In 2015, there were no “other impairment
charges”.
(B) In 2016, losses and other charges, net related primarily to reversals related to contingent consideration liabilities, including $8.3 million related to
the Company’s Semprus technology, somewhat offset by acquisition and facility consolidation costs. In 2015 losses and other charges, net related
primarily to facility consolidations and reflect reversals of previously recorded charges related to contingent consideration liabilities and the medical
device excise tax.
December 31, 2016 December 31, 2015
Teleflex income from continuing operations before interest and taxes 67,028$ 96,747$
Teleflex income from continuing operations before interest and taxes margin 13.0% 20.0%
Restructuring and other impairment charges (A) 46,351 2,131
Losses and other charges, net (B) (919) (1,189)
Intangible amortization expense 16,005 17,102
Adjusted Teleflex income from continuing operations before interest, taxes and
intangible amortization expense 128,465$ 114,791$
Adjusted Teleflex income from continuing operations before interest, taxes and
intangible amortization expense margin 25.0% 23.7%
Teleflex revenue as-reported 513,933$ 484,501$
Three Months Ended

29
APPENDIX G –
RECONCILIATION OF ADJUSTED OPERATING PROFIT AND MARGIN
DOLLARS IN THOUSANDS
(A) In 2016, “other impairment charges” included pre-tax, non-cash impairment charges of $41.0 million related to the Company’s Semprus
technology and $2.4 million related to two properties, one of which was classified as an asset held for sale. In 2015, there were no “other impairment
charges”.
(B) In 2016 losses and other charges, net related primarily to facility consolidation and acquisition costs, net of reversals related to contingent
consideration liabilities, including $8.3 million related to the Company’s Semprus technology, and the gain on sale of assets. In 2015 losses and
other charges, net related primarily to facility consolidation costs and reflects reversals of previously recorded charges related to contingent
consideration liabilities, the medical device excise tax and a litigation verdict against the Company with respect to a non-operating joint venture. In
2014, losses and other charges, net related primarily to facility consolidations.
12/31/16 12/31/15 12/31/14
Teleflex income from continuing operations before interest and taxes 319,453$ 315,891$ 284,862$
Teleflex income from continuing operations before interest and taxes margin 17.1% 17.5% 15.5%
Restructuring and other impairment charges (A) 59,227 7,819 17,869
Losses and other charges, net (B) 8,504 2,957 3,931
Intangible amortization expense 63,491 62,380 60,926
Adjusted Teleflex income from continuing operations before interest, taxes and
intangible amortization expense 450,675$ 389,047$ 367,588$
Adjusted Teleflex income from continuing operations before interest, taxes and
intangible amortization expense margin 24.1% 21.5% 20.0%
Teleflex revenue as-reported 1,868,027$ 1,809,690$ 1,839,832$
Year Ended

30
APPENDIX H –
RECONCILIATION OF ADJUSTED EPS FROM CONTINUING OPERATIONS
QUARTER ENDED – DECEMBER 31, 2016
DOLLARS IN MILLIONS, EXCEPT PER SHARE DATA
Cost of
goods
sold
Selling, general
and
administrative
expenses
Research and
development
expenses
Restructuring
and other
impairment
charges
(Gain) loss on
sale of business
and assets
Interest
expense, net
Income
taxes
Net income (loss)
attributable to common
shareholders from
continuing operations
Diluted earnings
per share available
to common
shareholders
Shares used in
calculation of GAAP
and adjusted
earnings per share
GAAP Basis $240.9 $144.2 $15.7 $46.4 ($0.2) $16.2 ($10.1) $60.9 $1.29 47,112
Adjustments
Restructuring and
other impairment
charges (A)
— — — 46.4 — — 16.5 29.8 $0.63 —
Losses and other
charges, net (B)
3.7 (4.4) 0.0 — (0.2) 3.4 3.4 (1.0) ($0.01) —
Amortization of debt
discount on
convertible notes
— — — — — 1.1 0.4 0.7 $0.02 —
Intangible
amortization
expense
— 15.9 0.1 — — — 4.0 12.0 $0.26 —
Tax adjustment (C) — — — — — — 4.9 (4.9) ($0.10) —
Shares due to
Teleflex under note
hedge (D)
— — — — — — — — $0.06 (1,343)
Adjusted basis $237.2 $132.7 $15.6 — — $11.7 $19.3 $97.5 $2.13 45,769
(B) In 2016, losses and other charges, net related primarily to reversals related to contingent consideration liabilities, including $8.3 million related to the Company's Semprus technology,
somewhat offset by acquisition and facility consolidation costs.
(C) The tax adjustment represents a net benefit resulting primarily from (1) the expiration of applicable statutes of limitations for prior year returns and/or the resolution of audits or filing of
amended returns with respect to prior tax years, and (2) tax law changes affecting our deferred tax liability.
(D) Adjusted diluted shares are calculated by giving effect to the anti-dilutive impact of the Company’s convertible note hedge agreements, which reduce the potential economic dilution that
otherwise would occur upon conversion of the Company's convertible notes. Under GAAP, the anti-dilutive impact of the convertible note hedge agreements is not reflected in diluted shares.
(A) In 2016, "other impairment charges" included (1) a pre-tax, non-cash $41.0 million impairment charge and $14.9 million reduction in related deferred tax liabilities in connection with the
Company's Semprus technology; and (2) $2.4 million in pre-tax, non-cash impairment charges related to two properties, one of which was classified as an asset held for sale and $0.7 million
reduction in related deferred tax liabilities.

31
APPENDIX I –
RECONCILIATION OF ADJUSTED EPS FROM CONTINUING OPERATIONS
QUARTER ENDED – DECEMBER 31, 2015
DOLLARS IN MILLIONS, EXCEPT PER SHARE DATA
Cost of
goods
sold
Selling, general
and
administrative
expenses
Research and
development
expenses
Restructuring
and other
impairment
charges
Interest
expense,
net
Income
taxes
Net income (loss)
attributable to common
shareholders from
continuing operations
Diluted earnings
per share available
to common
shareholders
Shares used in
calculation of GAAP
and adjusted
earnings per share
GAAP Basis $224.2 $148.2 $13.2 $2.1 $13.6 ($7.6) $90.6 $1.88 48,323
Adjustments
Restructuring and
other impairment
charges
— — — 2.1 — 0.8 1.3 $0.03 —
Losses and other
charges, net (A)
1.9 (3.1) — — — 0.3 (1.5) ($0.03) —
Amortization of
debt discount on
convertible notes
— — — — 3.4 1.2 2.1 $0.04 —
Intangible
amortization
expense
— 17.1 — — — 4.6 12.5 $0.26 —
Tax adjustment (B) — — — — — 14.9 (14.9) ($0.31) —
Shares due to
Teleflex under note
hedge (C)
— — — — — — — $0.14 (3,440)
Adjusted basis $222.3 $134.2 $13.2 — $10.2 $14.2 $90.2 $2.01 44,883
(A) In 2015 losses and other charges, net related primarily to facility consolidations and reflect reversals of previously recorded charges related to contingent
consideration liabilities and the medical device excise tax.
(B) The tax adjustment represents a net benefit resulting primarily from (1) the expiration of applicable statutes of limitations for prior year returns and/or the resolution
of audits or filing of amended returns with respect to prior tax years, and (2) tax law changes affecting our deferred tax liability.
(C) Adjusted diluted shares are calculated by giving effect to the anti-dilutive impact of the Company’s convertible note hedge agreements, which reduce the potential
economic dilution that otherwise would occur upon conversion of our senior subordinated convertible notes. Under GAAP, the anti-dilutive impact of the convertible note
hedge agreements is not reflected in diluted shares.
32
APPENDIX J –
RECONCILIATION OF ADJUSTED EPS FROM CONTINUING OPERATIONS
YEAR ENDED – DECEMBER 31, 2016
DOLLARS IN MILLIONS, EXCEPT PER SHARE DATA
Cost of
goods
sold
Selling, general
and
administrative
expenses
Research and
development
expenses
Restructuring
and other
impairment
charges
(Gain) loss on
sale of business
and assets
Interest
expense, net
Loss on
extinguishment
of debt, net
Income
taxes
Net income (loss)
attributable to common
shareholders from
continuing operations
Diluted earnings
per share available
to common
shareholders
Shares used in
calculation of GAAP
and adjusted
earnings per share
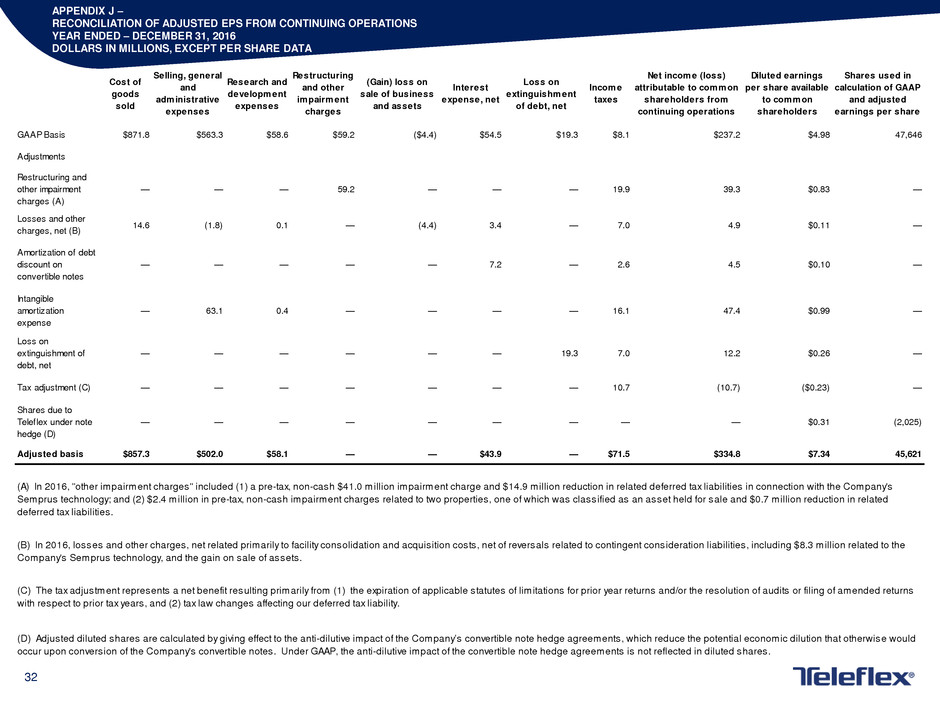
GAAP Basis $871.8 $563.3 $58.6 $59.2 ($4.4) $54.5 $19.3 $8.1 $237.2 $4.98 47,646
Adjustments
Restructuring and
other impairment
charges (A)
— — — 59.2 — — — 19.9 39.3 $0.83 —
Losses and other
charges, net (B)
14.6 (1.8) 0.1 — (4.4) 3.4 — 7.0 4.9 $0.11 —
Amortization of debt
discount on
convertible notes
— — — — — 7.2 — 2.6 4.5 $0.10 —
Intangible
amortization
expense
— 63.1 0.4 — — — — 16.1 47.4 $0.99 —
Loss on
extinguishment of
debt, net
— — — — — — 19.3 7.0 12.2 $0.26 —
Tax adjustment (C) — — — — — — — 10.7 (10.7) ($0.23) —
Shares due to
Teleflex under note
hedge (D)
— — — — — — — — — $0.31 (2,025)
Adjusted basis $857.3 $502.0 $58.1 — — $43.9 — $71.5 $334.8 $7.34 45,621
(A) In 2016, "other impairment charges" included (1) a pre-tax, non-cash $41.0 million impairment charge and $14.9 million reduction in related deferred tax liabilities in connection with the Company's
Semprus technology; and (2) $2.4 million in pre-tax, non-cash impairment charges related to two properties, one of which was classified as an asset held for sale and $0.7 million reduction in related
deferred tax liabilities.
(B) In 2016, losses and other charges, net related primarily to facility consolidation and acquisition costs, net of reversals related to contingent consideration liabilities, including $8.3 million related to the
Company's Semprus technology, and the gain on sale of assets.
(C) The tax adjustment represents a net benefit resulting primarily from (1) the expiration of applicable statutes of limitations for prior year returns and/or the resolution of audits or filing of amended returns
with respect to prior tax years, and (2) tax law changes affecting our deferred tax liability.
(D) Adjusted diluted shares are calculated by giving effect to the anti-dilutive impact of the Company’s convertible note hedge agreements, which reduce the potential economic dilution that otherwise would
occur upon conversion of the Company's convertible notes. Under GAAP, the anti-dilutive impact of the convertible note hedge agreements is not reflected in diluted shares.

33
APPENDIX K –
RECONCILIATION OF ADJUSTED EPS FROM CONTINUING OPERATIONS
YEAR ENDED – DECEMBER 31, 2015
DOLLARS IN MILLIONS, EXCEPT PER SHARE DATA
Cost of
goods
sold
Selling, general
and
administrative
expenses
Research and
development
expenses
Restructuring
and other
impairment
charges
(Gain) loss
on sale of
business
and
assets
Interest
expense,
net
Loss on
extinguishment
of debt, net
Income
taxes
Net income (loss)
attributable to common
shareholders from
continuing operations
Diluted earnings
per share available
to common
shareholders
Shares used in
calculation of GAAP
and adjusted
earnings per share
GAAP Basis $865.3 $569.0 $52.1 $7.8 ($0.4) $60.8 $10.5 $7.8 $236.0 $4.91 48,058
Adjustments:
Restructuring and
other impairment
charges
— — — 7.8 — — — 2.9 4.9 $0.10 —
Losses and other
charges, net (A)
9.4 (6.1) — — (0.4) — — 2.5 0.4 $0.01 —
Amortization of debt
discount on
convertible notes
— — — — — 13.2 — 4.8 8.4 $0.17 —
Intangible
amortization
expense
— 62.4 — — — — — 16.6 45.8 $0.95 —
Loss on extinguish-
ment of debt, net
— — — — — — 10.5 3.8 6.6 $0.14 —
Tax adjustment (B) — — — — — — — 19.0 (19.0) ($0.39) —
Shares due to
Teleflex under note
hedge (C)
— — — — — — — — — $0.44 (3,350)
Adjusted basis $855.8 $512.7 $52.1 — — $47.6 — $57.4 $283.2 $6.33 44,708
(A) In 2015 losses and other charges, net primarily related to facility consolidation costs and reflect reversals of previously recorded charges related to contingent consideration liabilities, the medical
device excise tax and a litigation verdict against the Company with respect to a non-operating joint venture.
(B) The tax adjustment represents a net benefit resulting primarily from (1) the expiration of applicable statutes of limitations for prior year returns and/or the resolution of audits or filing of amended
returns with respect to prior tax years, and (2) tax law changes affecting our deferred tax liability.
(C) Adjusted diluted shares are calculated by giving effect to the anti-dilutive impact of the Company’s convertible note hedge agreements, which reduce the potential economic dilution that otherwise
would occur upon conversion of our senior subordinated convertible notes. Under GAAP, the anti-dilutive impact of the convertible note hedge agreements is not reflected in diluted shares.

34
APPENDIX L –
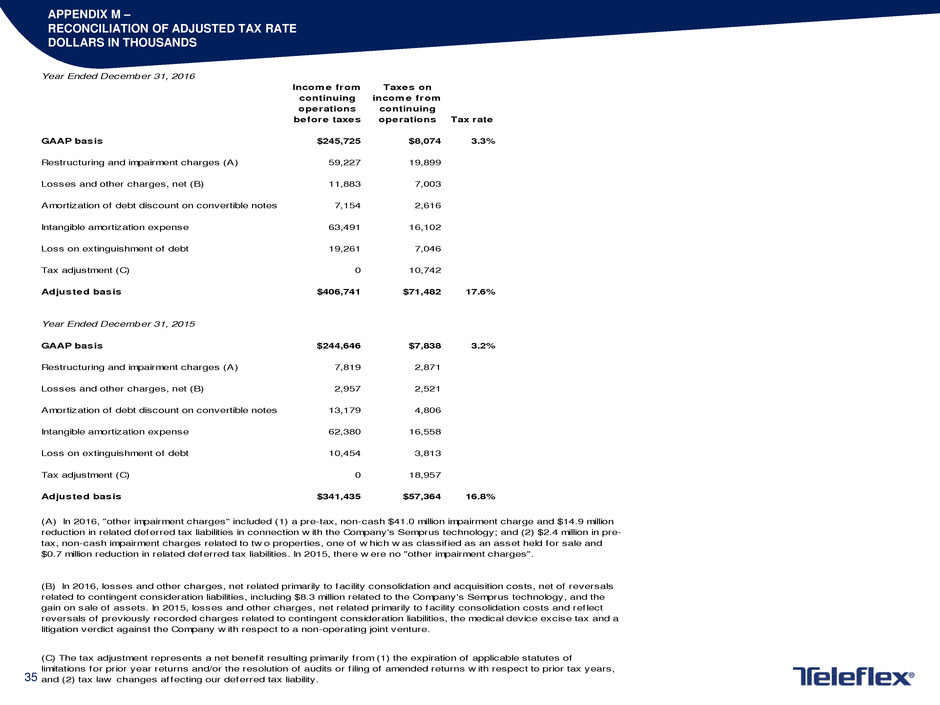
RECONCILIATION OF ADJUSTED TAX RATE
DOLLARS IN THOUSANDS
Three Months Ended December 31, 2016
Income from
continuing
operations
before taxes
Taxes on
income from
continuing
operations Tax rate
GAAP basis $50,816 ($10,060) -19.8%
Restructuring and impairment charges (A) 46,351 16,505
Losses and other charges, net (B) 2,460 3,469
Amortization of debt discount on convertible notes 1,125 418
Intangible amortization expense 16,005 3,984
Tax adjustment (C) 0 4,942
Adjusted basis $116,757 $19,258 16.5%
Three Months Ended December 31, 2015
GAAP basis $83,188 ($7,577) -9.1%
Restructuring and impairment charges (A) 2,131 797
Losses and other charges, net (B) (1,189) 306
Amortization of debt discount on convertible notes 3,379 1,232
Intangible amortization expense 17,102 4,576
Tax adjustment (C) 0 14,885
Adjusted basis $104,611 $14,219 13.6%
(A) In 2016, "other impairment charges" included (1) a pre-tax, non-cash $41.0 million impairment charge and $14.9 million
reduction in related deferred tax liabilities in connection w ith the Company's Semprus technology; and (2) $2.4 million in pre-
tax, non-cash impairment charges related to tw o properties, one of w hich w as classif ied as an asset held for sale and
$0.7 million reduction in related deferred tax liabilities. In 2015, there w ere no "other impairment charges".
(C) The tax adjustment represents a net benefit resulting primarily from (1) the expiration of applicable statutes of
limitations for prior year returns and/or the resolution of audits or f iling of amended returns w ith respect to prior tax years,
and (2) tax law changes affecting our deferred tax liability.
(B) In 2016, losses and other charges, net related primarily to reversals related to contingent consideration liabilities,
including $8.3 million related to the Company's Semprus technology, somew hat offset by acquisition and facility
consolidation costs. In 2015, losses and other charges, net related primarily to facility consolidations and reflect reversals
of previously recorded charges related to contingent consideration liabilities and the medical device excise tax.
35
APPENDIX M –
RECONCILIATION OF ADJUSTED TAX RATE
DOLLARS IN THOUSANDS
Year Ended December 31, 2016
Income from
continuing
operations
before taxes
Taxes on
income from
continuing
operations Tax rate
GAAP basis $245,725 $8,074 3.3%
Restructuring and impairment charges (A) 59,227 19,899
Losses and other charges, net (B) 11,883 7,003
Amortization of debt discount on convertible notes 7,154 2,616
Intangible amortization expense 63,491 16,102
Loss on extinguishment of debt 19,261 7,046
Tax adjustment (C) 0 10,742
Adjusted basis $406,741 $71,482 17.6%
Year Ended December 31, 2015
GAAP basis $244,646 $7,838 3.2%
Restructuring and impairment charges (A) 7,819 2,871
Losses and other charges, net (B) 2,957 2,521
Amortization of debt discount on convertible notes 13,179 4,806
Intangible amortization expense 62,380 16,558
Loss on extinguishment of debt 10,454 3,813
Tax adjustment (C) 0 18,957
Adjusted basis $341,435 $57,364 16.8%
(A) In 2016, "other impairment charges" included (1) a pre-tax, non-cash $41.0 million impairment charge and $14.9 million
reduction in related deferred tax liabilities in connection w ith the Company's Semprus technology; and (2) $2.4 million in pre-
tax, non-cash impairment charges related to tw o properties, one of w hich w as classif ied as an asset held for sale and
$0.7 million reduction in related deferred tax liabilities. In 2015, there w ere no "other impairment charges".
(C) The tax adjustment represents a net benefit resulting primarily from (1) the expiration of applicable statutes of
limitations for prior year returns and/or the resolution of audits or f iling of amended returns w ith respect to prior tax years,
and (2) tax law changes affecting our deferred tax liability.
(B) In 2016, losses and other charges, net related primarily to facility consolidation and acquisition costs, net of reversals
related to contingent consideration liabilities, including $8.3 million related to the Company's Semprus technology, and the
gain on sale of assets. In 2015, losses and other charges, net related primarily to facility consolidation costs and reflect
reversals of previously recorded charges related to contingent consideration liabilities, the medical device excise tax and a
litigation verdict against the Company w ith respect to a non-operating joint venture.

36
APPENDIX N –
RECONCILIATION OF 2017 CONSTANT CURRENCY REVENUE GROWTH GUIDANCE
Low High
Forecasted GAAP Revenue Growth 10.0% 11.5%
Estimated Impact of Foreign Currency Exchange Rate Fluctuations 2.5% 2.5%
Forecasted Constant Currency Revenue Growth 12.5% 14.0%

37
APPENDIX O –
RECONCILIATION OF 2017 ADJUSTED GROSS MARGIN GUIDANCE
Note: In 2017, estimated losses and other charges, net relate primarily to facility consolidation and acquisition related
expenses.
Low High
Forecasted GAAP Gross Margin 54.15% 54.70%
Estimated losses and other charges, net 1.25% 1.30%
Forecasted Adjusted Gross Margin 55.40% 56.00%

38
APPENDIX P –
RECONCILIATION OF 2017 ADJUSTED OPERATING MARGIN GUIDANCE
Note: In 2017, estimated losses and other charges, net relate primarily to facility consolidation and acquisition related
expenses.
Low High
Forecasted GAAP Operating Margin 16.50% 17.10%
Estimated losses and other charges, net 3.85% 3.90%
Estimated intangible amortization expense 5.25% 5.30%
Forecasted Adjusted Operating Margin 25.60% 26.30%
39
APPENDIX Q –
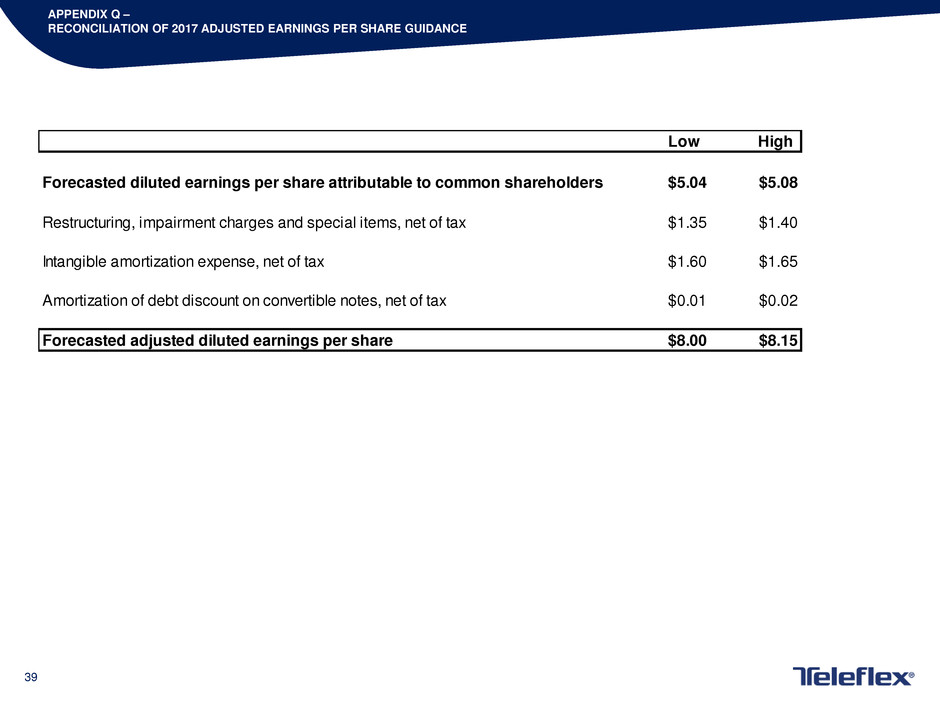
RECONCILIATION OF 2017 ADJUSTED EARNINGS PER SHARE GUIDANCE
Low High
Forecasted diluted earnings per share attributable to common shareholders $5.04 $5.08
Restructuring, impairment charges and special items, net of tax $1.35 $1.40
Intangible amortization expense, net of tax $1.60 $1.65
Amortization of debt discount on convertible notes, net of tax $0.01 $0.02
Forecasted adjusted diluted earnings per share $8.00 $8.15

40
Euro to U.S. Dollar exchange rate assumed to be ~1.04 for full year 2017
Adjusted weighted average shares expected to be approximately 46.3 to 46.4
million for full year 2017
Calendar of shipping days:
• 5 additional shipping days in Q1’17 vs. Q1’16
• 1 less shipping day in Q2’17 vs. Q2’16
• 5 less shipping days in Q4’17 vs. Q4’16
APPENDIX R –
2017 FINANCIAL OUTLOOK ASSUMPTIONS

41
APPENDIX S –
TELEFLEX RESTRUCTURING PLAN SUMMARY
Program
Estimated Pre-Tax Charges
Range
Estimated Annualized Pre-Tax
Savings Range Once Program
is Substantially Complete
Year Savings
Expected to Begin
Year Program Expected to
be Substantially Complete
2014 Manufacturing Footprint Realignment Plan $43.0 million to $48.0 million $28.0 million to $33.0 million 1 2015 End of First Half of 2020
2015 Restructuring Programs $6.4 million $15.0 million to $18.0 million 2015 End of 2017
2016 Manufacturing Footprint Realignment Plan $34.0 million to $44.0 million $12.0 million to $16.0 million 2017 End of 2018
Other 2016 Restructuring Programs $5.3 million to $6.2 million $6.9 million to $8.5 million 2017 End of Q1 2018
Total $88.7 million to $104.6 million $61.9 million to $75.5 million
1 = includes expected increase in annual revenues resulting from improved pricing on Vascular kits of between $5 million to $6 million.
