Attached files
| file | filename |
|---|---|
| EX-32.2 - EXHIBIT 32.2 - TELEFLEX INC | tfx-ex322_20161231x10k.htm |
| EX-32.1 - EXHIBIT 32.1 - TELEFLEX INC | tfx-ex321_20161231x10k.htm |
| EX-31.2 - EXHIBIT 31.2 - TELEFLEX INC | tfx-ex312_20161231x10k.htm |
| EX-31.1 - EXHIBIT 31.1 - TELEFLEX INC | tfx-ex311_20161231x10k.htm |
| EX-23 - EXHIBIT 23 - TELEFLEX INC | tfx-ex23_20161231x10k.htm |
| EX-21 - EXHIBIT 21 - TELEFLEX INC | exhibit21-subsidiaries.htm |
UNITED STATES SECURITIES AND EXCHANGE COMMISSION
WASHINGTON, D.C. 20549
_________________________________________________
FORM 10-K
_________________________________________________
(Mark One) | |
x | ANNUAL REPORT PURSUANT TO SECTION 13 OR 15(d) OF THE SECURITIES EXCHANGE ACT OF 1934 |
For the fiscal year ended December 31, 2016 or
¨ | TRANSITION REPORT PURSUANT TO SECTION 13 OR 15(d) OF THE SECURITIES EXCHANGE ACT OF 1934 |
For the transition period from to .
Commission file number 1-5353
_________________________________________________
TELEFLEX INCORPORATED
(Exact name of registrant as specified in its charter)
_________________________________________________
Delaware | 23-1147939 | |
(State or other jurisdiction of incorporation or organization) | (I.R.S. employer identification no.) | |
550 East Swedesford Road, Suite 400, Wayne, Pennsylvania | 19087 | |
(Address of principal executive offices) | (Zip Code) | |
Registrant’s telephone number, including area code: (610) 225-6800
Securities registered pursuant to Section 12(b) of the Act:
Title of Each Class | Name of Each Exchange On Which Registered | |
Common Stock, par value $1 per share | New York Stock Exchange | |
Securities registered pursuant to Section 12(g) of the Act:
NONE
_________________________________________________
Indicate by check mark if the registrant is a well-known seasoned issuer, as defined in Rule 405 of the Securities Act. Yes ý No ¨ |
Indicate by check mark if the registrant is not required to file reports pursuant to Section 13 or Section 15(d) of the Act. Yes ¨ No ý |
Indicate by check mark whether the registrant (1) has filed all reports required to be filed by Section 13 or 15(d) of the Securities Exchange Act of 1934 during the preceding 12 months (or for such shorter period that the registrant was required to file such reports), and (2) has been subject to such filing requirements for the past 90 days. Yes x No ¨ |
Indicate by check mark whether the registrant has submitted electronically and posted on its corporate Web site, if any, every Interactive Data File required to be submitted and posted pursuant to Rule 405 of Regulation S-T during the preceding 12 months (or for such shorter period that the registrant was required to submit and post such files). Yes x No ¨ |
Indicate by check mark if disclosure of delinquent filers pursuant to Item 405 of Regulation S-K is not contained herein, and will not be contained, to the best of the registrant’s knowledge, in definitive proxy or information statements incorporated by reference in Part III of this Form 10-K or any amendment to this Form 10-K. x |
Indicate by check mark whether the registrant is a large accelerated filer, an accelerated filer, a non-accelerated filer, or a smaller reporting company. See the definitions of “large accelerated filer,” “accelerated filer” and “smaller reporting company” in Rule 12b-2 of the Exchange Act. |
Large accelerated filer x | Accelerated filer ¨ | Non-accelerated filer ¨ | Smaller reporting company ¨ | |||
Indicate by check mark whether the registrant is a shell company (as defined in Rule 12b-2 of the Act). Yes ¨ No x | ||||||
The aggregate market value of the Common Stock of the registrant held by non-affiliates of the registrant (31,133,991 shares) on June 24, 2016 (the last business day of the registrant’s most recently completed fiscal second quarter) was $5,331,695,959 (1) . The aggregate market value was computed by reference to the closing price of the Common Stock on such date, as reported by the New York Stock Exchange. | ||||||
The registrant had 44,905,133 Common Shares outstanding as of February 20, 2017. | ||||||
DOCUMENT INCORPORATED BY REFERENCE:
Certain provisions of the registrant’s definitive proxy statement in connection with its 2017 Annual Meeting of Stockholders, to be filed within 120 days of the close of the registrant’s fiscal year, are incorporated by reference in Part III hereof. |
(1) For purposes of this computation only, the registrant has defined “affiliate” as including executive officers and directors of the registrant and owners of more than five percent of the common stock of the registrant, without conceding that all such persons are “affiliates” for purposes of the federal securities laws. |
TELEFLEX INCORPORATED
ANNUAL REPORT ON FORM 10-K
FOR THE YEAR ENDED DECEMBER 31, 2016
TABLE OF CONTENTS
Page | ||
2
Information Concerning Forward-Looking Statements
All statements made in this Annual Report on Form 10-K, other than statements of historical fact, are forward-looking statements. The words “anticipate,” “believe,” “estimate,” “expect,” “intend,” “may,” “plan,” “will,” “would,” “should,” “guidance,” “potential,” “continue,” “project,” “forecast,” “confident,” “prospects” and similar expressions typically are used to identify forward-looking statements. Forward-looking statements are based on the then-current expectations, beliefs, assumptions, estimates and forecasts about our business and the industry and markets in which we operate. These statements are not guarantees of future performance and are subject to risks and uncertainties, which are difficult to predict. Therefore, actual outcomes and results may differ materially from what is expressed or implied by these forward-looking statements due to a number of factors, including:
• | changes in business relationships with and purchases by or from major customers or suppliers, including delays or cancellations in shipments; |
• | demand for and market acceptance of new and existing products; |
• | our ability to integrate acquired businesses into our operations, realize planned synergies and operate such businesses profitably in accordance with our expectations; |
• | our ability to effectively execute our restructuring programs; |
• | our inability to realize savings resulting from restructuring plans and programs at anticipated levels; |
• | the impact of recently passed healthcare reform legislation and changes in Medicare, Medicaid and third-party coverage and reimbursements, as well as additional changes that may result due to policy initiatives under the new presidential administration; |
• | competitive market conditions and resulting effects on revenues and pricing; |
• | increases in raw material costs that cannot be recovered in product pricing; |
• | global economic factors, including currency exchange rates, interest rates and sovereign debt issues; |
• | difficulties entering new markets; and |
• | general economic conditions. |
For a further discussion of the risks relating to our business, see Item 1A “Risk Factors” in this Annual Report on Form 10-K. We expressly disclaim any obligation to update these forward-looking statements, except as otherwise specifically stated by us or as required by law or regulation.
3
PART I
ITEM 1. | BUSINESS |
Teleflex Incorporated is referred to herein as “we,” “us,” “our,” “Teleflex” and the “Company.”
THE COMPANY
Teleflex is a global provider of medical technology products that enhance clinical benefits, improve patient and provider safety and reduce total procedural costs. We primarily design, develop, manufacture and supply single-use medical devices used by hospitals and healthcare providers for common diagnostic and therapeutic procedures in critical care and surgical applications. We market and sell our products to hospitals and healthcare providers worldwide through a combination of our direct sales force and distributors. Because our products are used in numerous markets and for a variety of procedures, we are not dependent upon any one end-market or procedure. We manufacture our products at approximately 30 manufacturing sites, with major manufacturing operations located in the Czech Republic, Germany, Malaysia, Mexico and the United States.
We are focused on achieving consistent, sustainable and profitable growth and improving our financial performance by increasing our market share and improving our operating efficiencies through:
• | development of new products and product line extensions; |
• | investment in new technologies and broadening their applications; |
• | expansion of the use of our products in existing markets and introduction of our products into new geographic markets; |
• | achievement of economies of scale as we continue to expand by leveraging our direct sales force and distribution network for new products, as well as increasing efficiencies in our sales and marketing and research and development structures and our manufacturing and distribution facilities; and |
• | expansion of our product portfolio through select acquisitions, licensing arrangements and business partnerships that enhance, extend or expedite our development initiatives or our ability to increase our market share. |
Our research and development capabilities, commitment to engineering excellence and focus on low-cost manufacturing enable us to bring cost effective, innovative products to market that improve the safety, efficacy and quality of healthcare. Our research and development initiatives focus on developing these products for both existing and new therapeutic applications, as well as enhancements to, and line extensions of, existing products. We introduced 25 new products and line extensions during 2016. Our portfolio of existing products and products under development consists primarily of Class I and Class II devices, most of which require 510(k) clearance by the United States Food and Drug Administration ("FDA"), for sale in the United States, and some of which are exempt from the requirement to obtain 510(k) clearance. We believe that 510(k) clearance (or 510(k)-exempt status) reduces our research and development costs and risks, and typically results in a shorter timetable for new product introductions as compared to the premarket approval, or PMA, process that would be required for Class III devices. See "Government Regulation" below.
OUR SEGMENTS
We have the following six reportable operating segments: Vascular North America, Anesthesia North America, Surgical North America, EMEA (Europe, Middle East and Africa), Asia and OEM (Original Equipment Manufacturer and Development Services). In connection with our presentation of segment information for our reportable segments, we also present, in the "All other" category, information pertaining to several immaterial operating segments. The following charts depict our net revenues by reportable operating segment and by the operating segments in the "all other" category as a percentage of our total consolidated net revenues for the years ended December 31, 2016, 2015 and 2014.
4
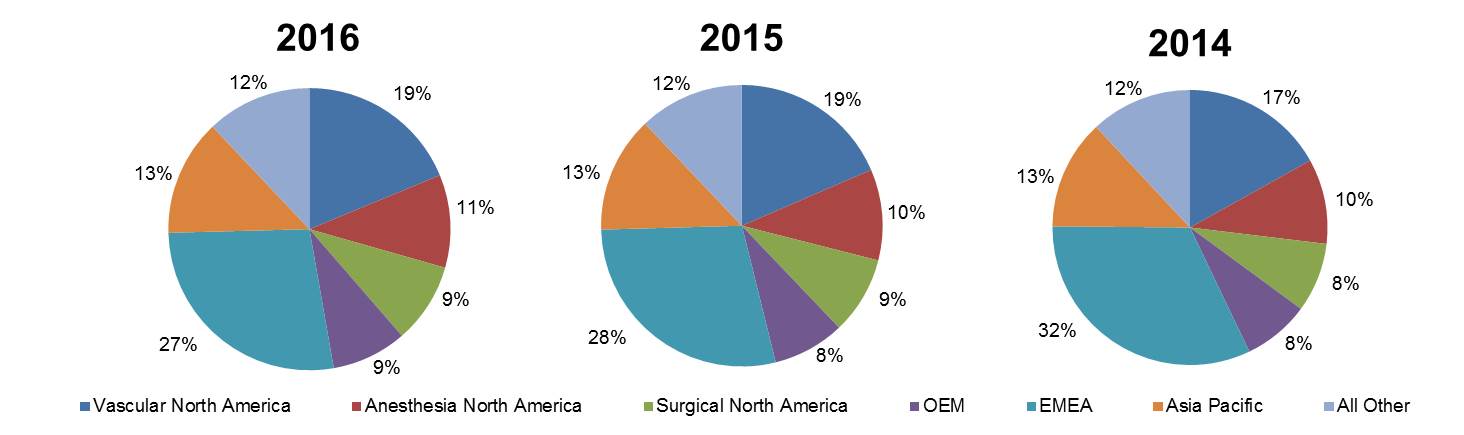
Vascular North America: Our Vascular North America segment is comprised of our North American vascular and interventional access businesses, which offer products that facilitate a variety of critical care therapies and other applications.
Vascular Access Products
Our vascular access products primarily consist of our Arrow branded catheters and related devices, including catheter positioning systems, that are used in a wide range of procedures, including the administration of intravenous medications and other therapies, the measurement of blood pressure and the withdrawal of blood samples through a single puncture site.
The vascular access product portfolio principally consists of the following products:
• | Arrow Central Venous Catheters (CVCs): Arrow CVCs are inserted in the neck or shoulder area and come in multiple lengths and up to four channels, or lumens. The Arrow CVC has a pressure injectable option which gives clinicians who perform contrast-enhanced CT scans the ability to use an indwelling (in the body) pressure injectable Arrow CVC to inject contrast dye for the scan without having to insert a second catheter. |
• | Arrow EZ-IO Intraosseous Vascular Access System: The Arrow EZ-IO system provides vascular access for the delivery of medications and fluids via intraosseous, or in the bone, infusion when traditional vascular access is difficult or impossible. Sales of the Arrow EZ-IO system to our hospital customers are included in our Vascular North America segment results. As discussed below, sales of the Arrow EZ-IO to pre-hospital care customers, such as emergency medical service providers, are included in our Anesthesia North America segment results. |
• | Arrow Peripherally Inserted Central Catheters (PICCs): Arrow PICCs are soft, flexible catheters that are inserted in the upper arm and advanced into a vein that carries blood to the heart to administer various types of intravenous medications and therapies. Arrow PICCs have a pressure injectable option that can withstand the higher pressures required by the injection of contrast media for CT scans. |
• | Arrow Jugular Axillo-subclavian Central Catheters (JACCs): Arrow JACCs are designed to be inserted in the neck or shoulder area and provide an alternative to traditional CVCs and PICCs for acute care. Arrow JACCs may be used for short or long term periods to treat patients who may have poor peripheral circulation. |
• | Arrow Midline Catheters (Midlines): Arrow Midlines are made of medical grade, flexible polyurethane material and are inserted in the upper arm. Midlines are appropriate when patients face difficult intravenous catheter insertions or therapy will last no longer than one to four weeks. |
• | Arrow® Catheter Tip Positioning Systems: We offer two distinct catheter tip positioning systems that are designed to facilitate precise placement of catheters within the heart. The first is our VPS G4 Vascular Positioning System, which is an advanced vascular positioning system designed to facilitate precise placement of CVCs within the heart. Indicated as an alternative to chest x-ray confirmation for CVC tip placement confirmation in adult patients, the VPS G4 analyzes multiple metrics, in real time, to help clinicians navigate through the circulatory system and identify the correct catheter tip placement in the heart. We also offer the Arrow® VPS Rhythm™ System, which provides electrocardiogram (ECG)-based tip confirmation in a highly portable, lightweight and versatile design. ECG technology facilitates catheter tip placement and confirmation within the superior vena-cava-cavatorial junction in the heart, and can be used with a broad range of catheter types. When paired with our VPS TipTracker™ |
5
stylet for insertion of PICCS, the Arrow VPS Rhythm System provides real-time visual navigation by tracing the catheter pathway with a blue line on a color screen.
• | Arrow Arterial Catheterization Sets: Our Arrow arterial catheterization sets facilitate arterial pressure monitoring and blood withdrawal for glucose, blood-gas and electrolyte measurement in a wide variety of critical care and intensive care settings. |
• | Arrow Multi-Lumen Access Catheters (MAC): The Arrow MAC combines the access of a sheath introducer with the high-flow lumens of a central line. The MAC's hemostasis valve allows for easy access for additional devices, such as a thermodilution catheter or ARROW® MAC Companion Catheter, adding up to three additional lumens. |
• | Arrow Percutaneous Sheath Introducers: Our Arrow percutaneous sheath introducers are used to insert cardiovascular and other catheterization devices into the vascular system during critical care procedures. |
The large majority of our CVCs are treated with solutions based on our ARROWg+ard or ARROWg+ard Blue Plus antimicrobial technology, which have been shown to reduce the risk of catheter related bloodstream infection. Our Chlorag+ard technology, available on our PICCs, JACCs and Midlines, provides antimicrobial and antithrombogenic protection on inner and outer catheter surfaces as well as the entire fluid pathway of the catheter. Chlorag+ard technology has been shown to be effective in reducing microbial colonization and thrombus accumulation on catheter surfaces.
We also offer many of our vascular access catheters in Maximal Barrier Precautions trays, which are designed to assist healthcare providers in complying with clinical guidelines for reducing catheter-related bloodstream infections. These trays are available for CVCs, PICCs and multi access catheters and include a full body drape, coated or non-coated catheters and other accessories. In addition, our ErgoPACK system offers clinicians a broad range of tray configurations with components packaged in the tray in the order in which they will be needed during the procedure, and incorporates features designed to promote ease of use and patient and provider safety.
Interventional Access Products
Our interventional access products are used in a wide range of applications, including dialysis, oncology and critical care therapies. Our interventional access portfolio also includes several Arrow branded products, such as diagnostic and drainage kits, embolectomy balloons, and reinforced percutaneous sheath introducers. Our interventional access products include:
• | Arrow OnControl® Powered Bone Marrow / Bone Access System: The Arrow OnControl powered bone access system enables access for hematology and oncology diagnostic procedures. The system is used to obtain bone marrow samples, aspirate the bone and access bone lesions. |
• | Arrow Trerotola™ Percutaneous Thrombectomy Device ("PTD"): The Arrow Trerotola PTD is used for declotting of dialysis grafts and fistulas. |
• | Arrow Chronic Hemodialysis Catheters: The Arrow chronic hemodialysis catheters include both antegrade and retrograde insertion options for split, step and symmetrical tip configurations. |
• | ARROW-Clark™ VectorFlow™ Hemodialysis Catheter: The Arrow-Clark VectorFlow catheter is a symmetrical tip tunneled hemodialysis catheter designed to reduce loss of lock solution (which is used on catheters to reduce the risk of thrombosis), give sustained high flows and reduce the risk of thrombus accumulation due to platelet activation. Additionally, the specially designed catheter tip allows for placement flexibility with minimal impact on recirculation. |
• | Arrow Acute Hemodialysis Catheters: Similar to the Arrow CVC portfolio, the Arrow Acute hemodialysis catheters are offered with or without ARROWg+ard antimicrobial surface treatment. |
• | Arrow Polysite® Low Profile Hybrid Ports: The Arrow Polysite Low Profile Hybrid Port is used for long-term access to the central nervous system and to facilitate repeated vascular access. It is available in multiple standard French sizes. The hybrid design provides a strong titanium reservoir and lightweight plastic body delivering the strength and the comfort needed for long-term treatment in patients of all sizes. |
Anesthesia North America: Our Anesthesia North America segment is comprised of our North American airway management and pain management products.
6
Airway Management Products
Our airway management products and related devices consist principally of the following:
• | LMA® Airways: Our LMA laryngeal masks are used by anesthesiologists and emergency responders to establish an airway to channel anesthesia gas or oxygen to a patient's lungs during surgery or trauma. The LMA Protector™ Airway, our latest airway management device, is the first single-use laryngeal mask with a dual gastric drainage channel and pharyngeal chamber designed specifically to channel high volume, high pressure gastric contents away from the airway. It also integrates our Second Seal™ technology to isolate the respiratory tract from the digestive tract, reducing the risk of aspiration of gastric contents. The LMA Protector Airway also includes our Cuff Pilot™ technology, which enables clinicians to confirm that the inserted cuff is properly inflated and to monitor pressure levels. |
• | LMA® Atomization: Our LMA atomization portfolio includes products designed to facilitate atomized delivery of certain medications. Included in the portfolio is our LMA MAD Nasal™, an intranasal mucosal atomization device that is designed to provide a safe and painless way to deliver medications approved for intranasal delivery to a patient's blood stream without an intravenous line or needle. |
• | RUSCH® Endotracheal Tubes and Laryngoscopes: We offer a broad portfolio of products to facilitate and support endotracheal intubation to administer oxygen, and anesthetic gases in multiple settings (surgery, critical care and emergency settings). We also provide a broad range of products for laryngoscopy, a procedure that is primarily used to obtain a view of the airway to facilitate tracheal intubation during general anesthesia or cardiopulmonary resuscitation ("CPR"). Among these products is the Rusch DispoLED™ Laryngoscope Handle and Green Rusch Lite Blade, a single-use system designed to help facilities comply with standards designed to reduce the potential for patient cross-contamination associated with reusable devices during intubation. |
Pain Management Products
Our pain management products, which are designed for use in a broad range of surgical and obstetric procedures, consist principally of the following:
• | Arrow Epidural Catheters, Needles and Kits: We offer a broad range of Arrow epidural products, including the Arrow FlexTip Plus epidural catheter, to facilitate epidural analgesia. Epidural analgesia may be used separately for pain management, as an adjunct to general anesthesia, as a sole technique for surgical anesthesia and for post-operative pain management. |
• | Arrow Peripheral Nerve Block ("PNB") Catheters, Pumps, Needles and Kits: Our portfolio of Arrow PNB products, which includes the Arrow Stimucath and FlexBlock catheters, are designed to be used by anesthesiologists to provide localized pain relief by injecting anesthetics to deliberately interrupt the signals traveling along a nerve. Nerve blocks are used in a variety of different procedures, including orthopedics. |
• | AutoFuser Disposable Pain Pumps: Our AutoFuser Disposable Pain Pumps are designed for general infusion use, which includes regional anesthesia and pain management. Routes of administration include percutaneous, subcutaneous and epidural, and into the intra-operative (soft tissue/body cavity) sites. The AutoFuser offers multiple reservoir sizes and configurations to meet a variety of clinical demands. |
• | Arrow EZ-IO System: The EZ-IO system, as described in the Vascular North America segment summary above, complements our pain management product portfolio when administered in pre-hospital emergency settings. |
Surgical North America: Our surgical products are designed to provide surgeons with a comprehensive range of devices for use in a variety of surgical procedures. Our portfolio consists of single-use and reusable products, including the following:
• | Weck®Ligation Systems: Our Weck Ligation Systems feature the Weck Ligating Clips and Hem-o-lok® Ligating Clips. Weck Ligating Clips are intended for use in procedures involving vessels or anatomic structures and are sold in various sizes, types and materials. Our Hem-o-lok Ligating Clips are intended for use in procedures involving ligation of vessels or tissue structures and are sold in various sizes. |
7
• | Weck EFx Fascial Closure Systems: Our Weck fascial closure systems are used in laparoscopic surgical procedures and are intended to facilitate placement and withdrawal of suture loops to repair port site defects following laparoscopic surgery. Our Weck EFx endo fascial closure system is a port site closure device intended to minimize complications and costs associated with port-site herniation. We expanded this product line in 2015 to include the EFx Shield fascial closure system, which uses a shielded wing design for enhanced sharps protection, and a more basic cone and suture system called EFx Classic. |
• | Percutaneous Surgical Systems: Our Mini-Lap surgical instruments, which we added to our product portfolio through our December 2014 acquisition of Mini-Lap Technologies, Inc. ("Mini-Lap"), are designed to be inserted percutaneously (through the skin) to enable surgeons to perform laparoscopic surgery without the need for a trocar. The MiniLap family of surgical instruments consists of a ThumbGrip option on a 2.3mm shaft or a pistol design called MiniGrip option on a 2.4mm shaft. In addition, we have developed the PercuvanceTM percutaneous surgical system - 2.9mm device shaft with 5 mm operating tips. Percuvance, is used to penetrate soft tissue to access certain areas of the human abdomen and to grasp, hold and manipulate tissue, and, like Minilap, enables surgeon to access the abdominal cavity without the need for access ports. We received 510(k) clearance for this product in January 2015 and initiated a controlled launch of the product in the United States and Europe in 2015. In 2016, we initiated a limited market release in the United States and Europe. |
Our other branded surgical products include our Weck Vista bladeless access ports, Deknatel sutures and our Pilling® and Kmedic® surgical instruments.
Europe, the Middle East and Africa (“EMEA”): Our EMEA segment designs, manufactures and distributes medical devices primarily used in critical care, surgical applications and cardiac care and generally serves two end markets: hospitals and healthcare providers, and home health. The products offered by our EMEA segment are most widely used in acute care settings for a range of diagnostic and therapeutic procedures and in general and specialty surgical applications, such as urology.
Asia: Our Asia segment, like our EMEA segment, designs, manufactures and distributes medical devices primarily used in critical care, surgical applications and cardiac care and generally serves hospitals and healthcare providers. The products offered by our Asia segment are most widely used in acute care settings for a range of diagnostic and therapeutic procedures and in general and specialty surgical applications.
OEM: Our OEM segment designs, manufactures and supplies devices and instruments for other medical device manufacturers. Our OEM division, which includes the TFX OEM® and Deknatel® OEM brands, provides custom-engineered extrusions, diagnostic and interventional catheters, balloon sheath/dilator sets (introducers) and kits, sutures, performance fibers, and bioresorbable resins and fibers. We offer an extensive portfolio of integrated capabilities, including engineering, material selection, regulatory affairs, prototyping, testing and validation, manufacturing, assembly and packing.
All other businesses: Our other operating segments do not meet the threshold for separate disclosure under applicable accounting guidance and are therefore included in the “All other” line item in tabular presentations of segment information. Products offered by these operating segments include single-use respiratory, urology and cardiac care products, as well as capital equipment, which are provided to hospitals and other alternative channels of care. Also included in the "All other" line item is our Latin American business.
Respiratory/Urology Product Portfolio
In 2015, we combined our respiratory and urology businesses. Our respiratory products are used in a variety of care settings and include oxygen therapy products, aerosol therapy products, spirometry products, and ventilation management products. Our Hudson RCI brand has been a prominent name in respiratory care for over 65 years.
Our urology product portfolio provides bladder management for patients in the hospital and individuals in the home care markets. The product portfolio consists principally of a wide range of catheters (including Foley, intermittent, external and suprapubic), urine collectors, catheterization accessories and products for operative endourology marketed under the Rusch brand name.
8
Cardiac Care Product Portfolio
Products in this portfolio include diagnostic and intra-aortic balloon catheters and capital equipment. Our diagnostic catheters include thermodilution and wedge pressure catheters; specialized catheters used during the x-ray examination of blood vessels, such as Berman and Reverse Berman catheters; therapeutic delivery catheters, such as temporary pacing catheters; sheaths for femoral and trans-radial aortic access used in diagnostic and therapeutic procedures; and intra-aortic balloon, or IAB, catheters. Capital equipment includes our intra-aortic balloon pump, or IABP, consoles. IABP products are used to augment oxygen delivery to the cardiac muscle and reduce the oxygen demand after cardiac surgery, serious heart attack or interventional procedures. We market our cardiac care products under the Arrow brand name.
Latin America
Our Latin America business generally engages in the same type of operations, and serves the same type of end markets, as the EMEA and Asia segments.
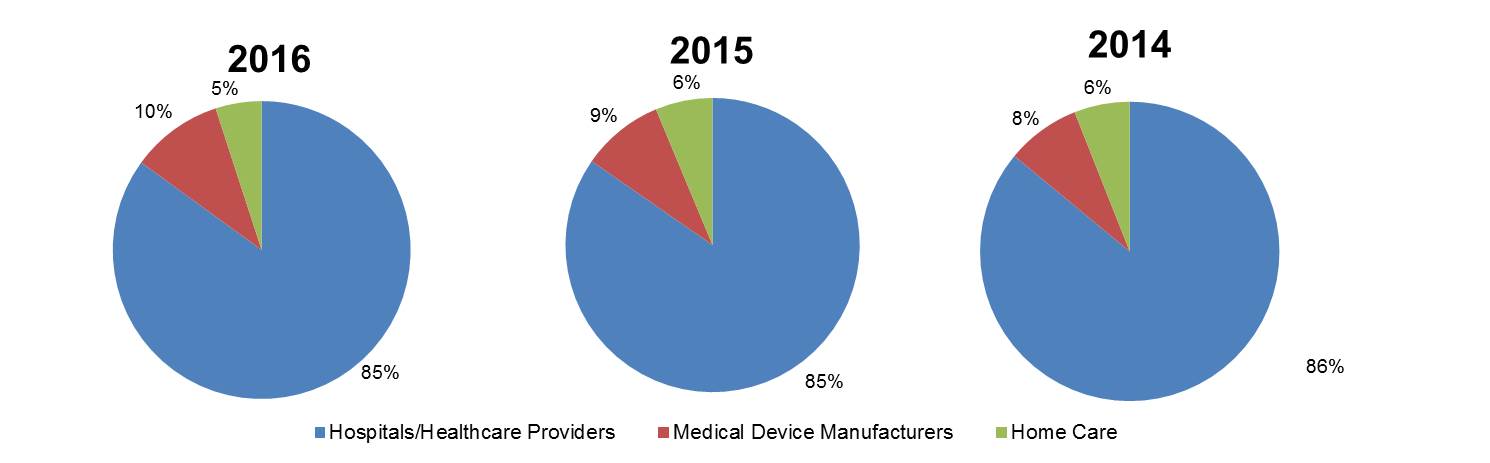
OUR MARKETS
We generally serve three end-markets: hospitals and healthcare providers, medical device manufacturers and home care. These markets are affected by a number of factors, including demographics, utilization and reimbursement patterns. The following charts depict the percentage of net revenues for the years ended December 31, 2016, 2015 and 2014 derived from each of our end markets.
HISTORY AND RECENT DEVELOPMENTS
Teleflex was founded in 1943 as a manufacturer of precision mechanical push/pull controls for military aircraft. From this original single market, single product orientation, we expanded and evolved through entries into new businesses, development of new products, introduction of products into new geographic or end-markets and acquisitions and dispositions of businesses. Throughout our history, we have continually focused on providing innovative, technology-driven, specialty-engineered products that help our customers meet their business requirements.
Beginning in 2007, we significantly changed the composition of our portfolio of businesses, expanding our presence in the medical device industry, while divesting all of our other businesses, which served the aerospace, automotive, industrial and marine markets. Following the divestitures of our marine business and cargo container and systems businesses in 2011, we became exclusively a medical device company.
We expect to continue to increase the size of our business through a combination of acquisitions and organic growth initiatives.
9
Acquisition of Vascular Solutions
On February 17, 2017, we acquired Vascular Solutions, Inc., a medical device company focused on developing clinical solutions for minimally invasive coronary and peripheral vascular procedures (“Vascular Solutions”). See Note 19 to the consolidated financial statements included in this Annual Report on Form 10-K for additional information.
Distributor-to-Direct Sales Conversions and Restructuring Programs
We have completed conversions from distributor sales to direct sales in several countries, including Australia, Korea, Japan and certain countries within our EMEA segment. We recently determined to undertake a distributor to direct sales conversion in China as a result of our decision to eliminate a key distributor within that sales channel. See Item 7 "Management's Discussion and Analysis of Financial Condition and Results of Operations - Segment Results - Comparison of 2016 and 2015 - Asia" for further information regarding this initiative. These distributor to direct sales conversions generally involve eliminating a distributor from the sales channel, either by acquiring the distributor or terminating the distribution relationship. In some instances, particularly in Asia, the conversions relate to our acquisition or termination of a master distributor and the continued sale of our products through third party sub-distributors or through new distributors. The distributor to direct sales conversions enable us to obtain improved product pricing and more direct access to the end users of our products within the sales channel. Additionally, we continue to execute restructuring programs to improve efficiencies in our sales and marketing and research and development organizations and in our manufacturing and distribution facilities.
GOVERNMENT REGULATION
We are subject to comprehensive government regulation both within and outside the United States relating to the development, manufacture, sale and distribution of our products.
Regulation of Medical Devices in the United States
All of our medical devices manufactured or sold in the United States are subject to the Federal Food, Drug, and Cosmetic Act (“FDC Act”), and its implementing regulations, which are enforced by the FDA. The FDA and, in some cases, other government agencies administer requirements for the design, testing, safety, effectiveness, manufacturing, labeling, storage, record keeping, clearance, approval, advertising and promotion, distribution, post-market surveillance, import and export of our medical devices.
Unless an exemption or pre-amendment grandfather status applies, each medical device that we market must first receive either clearance as a Class I or Class II device (by submitting a premarket notification (“510(k)”) or approval as a Class III device (by filing a premarket approval application (“PMA”)) from the FDA pursuant to the FDC Act. To obtain 510(k) clearance, a manufacturer must demonstrate that the proposed device is substantially equivalent to a legally marketed 510(k)-cleared device (or pre-amendment device for which FDA has not called for PMAs), referred to as the "predicate device." Substantial equivalence is established by the applicant showing that the proposed device has the same intended use as the predicate device, and it either has the same technological characteristics or has been shown to be equally safe and effective and does not raise different questions of safety and effectiveness as compared to the predicate device. The FDA’s 510(k) clearance process usually takes from four to twelve months, but it can last longer. A device that is not eligible for the 510(k) process because there is no predicate device may be reviewed through the de novo process (the process for approval when no substantially equivalent device exists) if the FDA agrees it is a low to moderate risk device. A device not eligible for 510(k) clearance or de novo clearance is categorized as Class III and must follow the PMA approval pathway, which requires proof of the safety and effectiveness of the device to the FDA’s satisfaction. The process of obtaining PMA approval is much more costly, lengthy and uncertain than the 510(k) process. It generally takes from one to three years or even longer. Our portfolio of existing products and pipeline of potential new products consist primarily of Class I and Class II devices that require 510(k) clearance, although a few are 510(k) exempt. In addition, modifications made to devices after they receive clearance or approval may require a new 510(k) clearance or approval of a PMA or PMA supplement. We cannot be sure that 510(k) clearance or PMA approval will be obtained in a timely matter if at all for any device that we propose to market.
A clinical trial is almost always required to support a PMA application and is sometimes required for a 510(k) clearance. The sponsor of a clinical study must comply with and conduct the study in accordance with the applicable federal regulations, including FDA’s investigational device exemption (“IDE”) requirements, and good clinical practice (“GCP”). Clinical trials must also be approved by an institutional review board ("IRB"), which is an appropriately constituted group that has been formally designated to review biomedical research involving human subjects and which
10
has the authority to approve, require modifications in, or disapprove research to protect the rights, safety, and welfare of the human research subject. The FDA may order the temporary, or permanent, discontinuation of a clinical trial at any time, or impose other sanctions, if it believes that the clinical trial either is not being conducted in accordance with FDA requirements or presents an unacceptable risk to the clinical trial patients. An IRB may also require the clinical trial at the site to be halted for failure to comply with the IRB’s requirements, or may impose other conditions.
A device placed on the market must comply with numerous regulatory requirements. Those regulatory requirements include the following:
• | device listing and establishment registration; |
• | adherence to the Quality System Regulation (“QSR”) which requires stringent design, testing, control, documentation, complaint handling and other quality assurance procedures; |
• | labeling requirements; |
• | FDA prohibitions against the promotion of off-label uses or indications; |
• | adverse event and malfunction reporting; |
• | post-approval restrictions or conditions, potentially including post-approval clinical trials or other required testing; |
• | post-market surveillance requirements; |
• | the FDA’s recall authority, whereby it can require or ask for the recall of products from the market; and |
• | voluntary corrections or removals reporting and documentation. |
In September 2013, the FDA issued final regulations and draft guidance documents regarding the Unique Device Identification (“UDI”) System, which requires manufacturers to mark certain medical devices with unique identifiers. While the FDA expects that the UDI System will help track products during recalls and improve patient safety, it will require us to make changes to our manufacturing and labeling, which could increase our costs. The UDI System is being implemented in stages based on device risk, with the first requirements having taken effect in September 2014 and the last taking effect in September 2018.
Certain of our medical devices are sold in convenience kits that include a drug component, such as lidocaine. These types of kits are generally regulated as combination products within the Center for Devices and Radiological Health (or "CDRH") under the device regulations because the device provides the primary mode of action of the kit. Although the kit as a whole is regulated as a medical device, it may be subject to certain drug requirements such as current good manufacturing practices (“cGMPs”) to the extent applicable to the drug-component repackaging activities and subject to inspection to verify compliance with cGMPs as well as other regulatory requirements.
Our manufacturing facilities, as well as those of certain of our suppliers, are subject to periodic and for-cause inspections to verify compliance with the QSR as well as other regulatory requirements. If the FDA were to find that we or certain of our suppliers have failed to comply with applicable regulations, it could institute a wide variety of enforcement actions, ranging from issuance of a warning or untitled letter to more severe sanctions, such as product recalls or seizures, civil penalties, consent decrees, injunctions, criminal prosecution, operating restrictions, partial suspension or total shutdown of production, refusal to permit importation or exportation, refusal to grant, or delays in granting, clearances or approvals or withdrawal or suspension of existing clearances or approvals. The FDA also has the authority to request repair, replacement or refund of the cost of any medical device manufactured or distributed by us. Any of these actions could have an adverse effect on our business.
Regulation of Medical Devices Outside of the United States
Medical device laws also are in effect in many of the markets outside of the United States in which we do business. These laws range from comprehensive device approval requirements for some or all of our products to requests for product data or certifications. Inspection of and controls over manufacturing, as well as monitoring of device-related adverse events, are components of most of these regulatory systems.
Healthcare Laws
We are subject to various federal, state and local laws in the United States targeting fraud and abuse in the healthcare industry. These laws prohibit us from, among other things, soliciting, offering, receiving or paying any
11
remuneration to induce the referral or use of any item or service reimbursable under Medicare, Medicaid or other federally or state financed healthcare programs. Violations of these laws are punishable by imprisonment, criminal fines, civil monetary penalties and exclusion from participation in federal healthcare programs. In addition, we are subject to federal and state false claims laws in the United States that prohibit the submission of false payment claims under Medicare, Medicaid or other federally or state funded programs. Certain marketing practices, such as off-label promotion, and violations of federal anti-kickback laws may also constitute violations of these laws.
We are also subject to various federal and state reporting and disclosure requirements related to the healthcare industry. Recent rules issued by the Centers for Medicare & Medicaid Services ("CMS") require us to collect and report information on payments or transfers of value to physicians and teaching hospitals, as well as investment interests held by physicians and their immediate family members. The reported data is available to the public on the CMS website. Failure to submit required information may result in civil monetary penalties. In addition, several states now require medical device companies to report expenses relating to the marketing and promotion of device products and to report gifts and payments to individual physicians in these states. Other states prohibit various other marketing-related activities. The federal government and certain other states require the posting of information relating to clinical studies and their outcomes. The shifting commercial compliance environment and the need to build and maintain robust and expandable systems to comply with the different compliance and/or reporting requirements among a number of jurisdictions increases the possibility that a healthcare company may violate one or more of the requirements, resulting in increased compliance costs that could adversely impact our results of operations.
Other Regulatory Requirements
We are also subject to the United States Foreign Corrupt Practices Act and similar anti-bribery laws applicable in jurisdictions outside the United State that generally prohibit companies and their intermediaries from improperly offering or paying anything of value to non-United States government officials for the purpose of obtaining or retaining business. Because of the predominance of government-sponsored healthcare systems around the world, most of our customer relationships outside of the United States are with government entities and are therefore subject to such anti-bribery laws. Our policies mandate compliance with these anti-bribery laws. We operate in many parts of the world that have experienced government corruption to some degree, and in certain circumstances strict compliance with anti-bribery laws may conflict with local customs and practices. In the sale, delivery and servicing of our medical devices and software outside of the United States, we must also comply with various export control and trade embargo laws and regulations, including those administered by the Department of Treasury’s Office of Foreign Assets Control (“OFAC”) and the Department of Commerce’s Bureau of Industry and Security (“BIS”) which may require licenses or other authorizations for transactions relating to certain countries and/or with certain individuals identified by the United States government. Despite our global trade and compliance program, our internal control policies and procedures may not always protect us from reckless or criminal acts committed by our employees, distributors or other agents. Violations of these requirements are punishable by criminal or civil sanctions, including substantial fines and imprisonment.
COMPETITION
The medical device industry is highly competitive. We compete with many companies, ranging from small start-up enterprises to companies that are larger and more established than us and have access to significantly greater financial resources. Furthermore, extensive product research and development and rapid technological advances characterize the market in which we compete. We must continue to develop and acquire new products and technologies for our businesses to remain competitive. We believe that we compete primarily on the basis of clinical superiority and innovative features that enhance patient benefit, product reliability, performance, customer and sales support, and cost-effectiveness. Our major competitors include C. R. Bard, Inc., Medtronic plc and Becton, Dickinson and Company.
SALES AND MARKETING
Our product sales are made directly to hospitals, healthcare providers, distributors and to original equipment manufacturers of medical devices through our own sales forces, independent representatives and independent distributor networks.
BACKLOG
Most of our products are sold to hospitals or healthcare providers on orders calling for delivery within a few days or weeks, with longer order times for products sold to medical device manufacturers. Therefore, our backlog of orders is not indicative of revenues to be anticipated in any future 12-month period.
12
PATENTS AND TRADEMARKS
We own a portfolio of patents, patents pending and trademarks. We also license various patents and trademarks. Patents for individual products extend for varying periods according to the date of patent filing or grant and the legal term of patents in the various countries where patent protection is obtained. Trademark rights may potentially extend for longer periods of time and are dependent upon national laws and use of the marks. All product names throughout this document are trademarks owned by, or licensed to, us or our subsidiaries. Although these have been of value and are expected to continue to be of value in the future, we do not consider any single patent or trademark, except for the Teleflex and Arrow brands, to be essential to the operation of our business.
SUPPLIERS AND MATERIALS
Materials used in the manufacture of our products are purchased from a large number of suppliers in diverse geographic locations. We are not dependent on any single supplier for a substantial amount of the materials used or components supplied for our overall operations. Most of the materials and components we use are available from multiple sources, and where practical, we attempt to identify alternative suppliers. Volatility in commodity markets, particularly aluminum, steel and plastic resins, can have a significant impact on the cost of producing certain of our products. We may not be able to successfully pass cost increases through to all of our customers, particularly original equipment manufacturers.
RESEARCH AND DEVELOPMENT
We are engaged in both internal and external research and development. Our research and development costs principally relate to our efforts to bring innovative new products to the markets we serve, and our efforts to enhance the clinical value, ease of use, safety and reliability of our existing product lines. Our research and development efforts support our strategic objectives to provide safe and effective products that reduce infections, improve patient and clinician safety, enhance patient outcomes and enable less invasive procedures. Our research and development expenditures were $58.6 million, $52.1 million and $61.0 million for the years ended December 31, 2016, 2015 and 2014, respectively.
We also acquire or license products and technologies that are consistent with our strategic objectives and enhance our ability to provide a full range of product and service options to our customers.
SEASONALITY
Portions of our revenues are subject to seasonal fluctuations. Incidence of flu and other disease patterns as well as the frequency of elective medical procedures affect revenues related to single-use products. Historically, we have experienced higher sales in the fourth quarter as a result of these factors.
EMPLOYEES
We employed approximately 12,600 full-time and temporary employees at December 31, 2016. Of these employees, approximately 2,900 were employed in the United States and 9,700 in countries other than the United States. Approximately 12% of our employees in the United States and in other countries were covered by union contracts or collective-bargaining arrangements. We believe we have good relationships with our employees.
ENVIRONMENTAL
We are subject to various environmental laws and regulations both within and outside the United States. Our operations, like those of other medical device companies, involve the use of substances regulated under environmental laws, primarily in manufacturing and sterilization processes. While we continue to make capital and operational expenditures relating to compliance with existing environmental laws and regulations, we cannot ensure that our costs of complying with current or future environmental protection, health and safety laws and regulations will not exceed our estimates or will not have a material adverse effect on our business, financial condition, results of operations and cash flows. Further, we cannot ensure that we will not be subject to environmental claims for personal injury or cleanup in the future based on our past, present or future business activities.
13
INVESTOR INFORMATION
We are subject to the reporting requirements of the Securities Exchange Act of 1934, as amended (the “Exchange Act”). Therefore, we file reports, proxy statements and other information with the Securities and Exchange Commission (SEC). Copies of these reports, proxy statements, and other information may be obtained by visiting the Public Reference Room of the SEC at 100 F Street, NE, Washington, DC 20549 or by calling the SEC at 1-800-SEC-0330. In addition, the SEC maintains a website (http://www.sec.gov) that contains reports, proxy and information statements and other information regarding issuers that file electronically with the SEC.
You can access financial and other information about us in the Investors section of our website, which can be accessed at www.teleflex.com. We make available through our website, free of charge, copies of our annual report on Form 10-K, quarterly reports on Form 10-Q, current reports on Form 8-K and amendments to those reports filed with or furnished to the SEC under Section 13(a) or 15(d) of the Exchange Act as soon as reasonably practicable after electronically filing or furnishing such material to the SEC. The information on our website is not part of this Annual Report on Form 10-K. The reference to our website address is intended to be an inactive textual reference only.
We are a Delaware corporation incorporated in 1943. Our executive offices are located at 550 East Swedesford Road, Suite 400, Wayne, PA 19087.
EXECUTIVE OFFICERS
The names and ages of our executive officers and the positions and offices held by each such officer are as follows:
Name | Age | Positions and Offices with Company | |||
Benson F. Smith | 69 | Chairman, Chief Executive Officer and Director | |||
Liam J. Kelly | 50 | President and Chief Operating Officer | |||
Thomas E. Powell | 55 | Executive Vice President and Chief Financial Officer | |||
Thomas A. Kennedy | 54 | Senior Vice President, Global Operations | |||
Karen T. Boylan | 45 | Vice President, Global RA/QA | |||
Cameron P. Hicks | 52 | Vice President, Global Human Resources | |||
James J. Leyden | 50 | Vice President, General Counsel and Secretary | |||
Mr. Smith has been our Chairman and Chief Executive Officer since January 2011, and has served as a Director since April 2005. He also served as our President from January 2011 to April 2016. Prior to January 2011, Mr. Smith was the managing partner of Sales Research Group, a research and consulting organization. From 1999 to January 2011, he also served as the Chief Executive Officer of BFS & Associates LLC, which specialized in strategic planning and venture investing. From 2000 until 2005, Mr. Smith also served as a speaker and author at The Gallup Organization, a global research-based consultancy firm. Previously, Mr. Smith worked for C.R. Bard, Inc., a company specializing in medical devices, for approximately 25 years, where he held various executive and senior level positions, most recently as President and Chief Operating Officer from 1994 to 1998.
Mr. Kelly has been our President and Chief Operating Officer since May 2016. From April 2015 to April 2016, he served as Executive Vice President and Chief Operating Officer. From April 2014 to April 2015, Mr. Kelly served as Executive Vice President and President, Americas. From June 2012 to April 2014 Mr. Kelly served as Executive Vice President and President, International. He also has held several positions with regard to our EMEA segment, including President from June 2011 to June 2012, Executive Vice President from November 2009 to June 2011, and Vice President of Marketing from April 2009 to November 2009. Prior to joining Teleflex, Mr. Kelly held various senior level positions with Hill-Rom Holdings, Inc., a medical device company, from October 2002 to April 2009, serving as its Vice President of International Marketing and R&D from August 2006 to February 2009.
Mr. Powell has been our Executive Vice President and Chief Financial Officer since February 2013. From March 2012 to February 2013, Mr. Powell was Senior Vice President and Chief Financial Officer. He joined Teleflex in August 2011 as Senior Vice President, Global Finance. Prior to joining Teleflex, Mr. Powell served as Chief Financial Officer and Treasurer of Tomotherapy Incorporated, a medical device company, from June 2009 until June 2011. In 2008, he served as Chief Financial Officer of Textura Corporation, a software provider. From April 2001 until
14
January 2008, Mr. Powell was employed by Midway Games, Inc., a software provider, serving as its Executive Vice President, Chief Financial Officer and Treasurer from September 2001 until January 2008. Mr. Powell has also held leadership positions with Dade Behring, Inc. (now Siemens Healthcare Diagnostics), PepsiCo, Bain & Company, Tenneco Inc. and Arthur Andersen & Company.
Mr. Kennedy has been our Senior Vice President, Global Operations since May 2013. He previously held the position of Vice President, International Operations from December 2012 to May 2013. From July 2007 to December 2012, he held the position of Vice President, EMEA Operations. Prior to joining Teleflex, Mr. Kennedy was a managing director for Saint Gobain Performance Plastics, a producer of engineered, high-performance polymer products, from September 2004 to May 2007. Mr. Kennedy also has held leadership positions with Bio-Medical Research Limited, Marconi Plc, Fore Systems, Inc. and American Power Conversion Corporation.
Ms. Boylan has been our Vice President, Global RA/QA since August 2014. She joined Teleflex in January 2013 as Vice President, International RA/QA. Prior to joining Teleflex, Ms. Boylan served as QA Vice President, Corporate Quality Systems for Boston Scientific Corporation, a developer, manufacturer and marketer of medical devices, from April 1996 to December 2012.
Mr. Hicks has been our Vice President, Global Human Resources since April 2013. Prior to joining Teleflex, Mr. Hicks served as Executive Vice President of Human Resources & Organizational Effectiveness for Harlan Laboratories, Inc., a private global provider of pre-clinical and non-clinical research services, from July 2010 to March 2013. From April 1990 to January 2010, Mr. Hicks held various leadership roles with MDS Inc., a provider of products and services for the development of drugs and the diagnosis and treatment of disease, including Senior Vice President of Human Resources for MDS’ global Pharma Services division from November 2000 to January 2010.
Mr. Leyden has been our Vice President, General Counsel and Secretary since February 2014. He previously held the positions of Acting General Counsel from November 2013 to February 2014, Deputy General Counsel from February 2013 to November 2013 and Associate General Counsel from December 2004 to February 2013. Prior to joining Teleflex, Mr. Leyden served as general counsel of InfraSource Services, Inc., a utility infrastructure construction company, from April 2004 to December 2004. From February 2002 to April 2004, he served as Associate General Counsel of Aramark Corporation, a provider of food, facility and uniform services.
Our officers are elected annually by our board of directors. Each officer serves at the discretion of the board.
ITEM 1A. RISK FACTORS
In addition to the other information set forth in this Annual Report on Form 10-K, you should carefully consider the following factors which could have a material adverse effect on our business, financial condition, results of operations or stock price. The risks below are not the only risks we face. Additional risks and uncertainties not currently known to us or that we currently deem to be immaterial may also adversely affect our business, financial condition, results of operations or stock price.
We face strong competition. Our failure to successfully develop and market new products could adversely affect our business.
The medical device industry is highly competitive. We compete with many domestic and foreign medical device companies ranging from small start-up enterprises that might sell only a single or limited number of competitive products or compete only in a specific market segment, to companies that are larger and more established than us, have a broad range of competitive products, participate in numerous markets and have access to significantly greater financial and marketing resources than we do.
In addition, the medical device industry is characterized by extensive product research and development and rapid technological advances. The future success of our business will depend, in part, on our ability to design and manufacture new competitive products and enhance existing products. Our product development efforts may require us to make substantial investments. There can be no assurance that we will be able to successfully develop new products, enhance existing products or achieve market acceptance of our products, due to, among other things, our inability to:
• | identify viable new products; |
• | obtain adequate intellectual property protection; |
15
• | gain market acceptance of new products; or |
• | successfully obtain regulatory approvals. |
In addition, our competitors currently may be developing, or may develop in the future, products that provide better features, clinical outcomes or economic value than those that we currently offer or subsequently develop. Our failure to successfully develop and market new products or enhance existing products could have a material adverse effect on our business, financial condition and results of operations.
Our customers depend on third party coverage and reimbursements and the failure of healthcare programs to provide coverage and reimbursement, or the reduction in reimbursement levels, for our medical products could adversely affect us.
The ability of our customers to obtain coverage and reimbursement for our products is important to our business. Demand for many of our existing and new medical products is, and will continue to be, affected by the extent to which government healthcare programs and private health insurers reimburse our customers for patients’ medical expenses in the countries where we do business. Even when we develop or acquire a promising new product, demand for the product may be limited unless reimbursement approval is obtained from private and government third party payors. Internationally, healthcare reimbursement systems vary significantly. In some countries, medical centers are constrained by fixed budgets, regardless of the volume and nature of patient treatment. Other countries require application for, and approval of, government or third party reimbursement. Without both favorable coverage determinations by, and the financial support of, government and third party insurers, the market for many of our medical products would be adversely affected. In this regard, we cannot be sure that third party payors will maintain the current level of coverage and reimbursement to our customers for use of our existing products. Adverse coverage determinations or any reduction in the amount of reimbursement could harm our business by discouraging customers’ selection of our products and reducing the prices they are willing to pay.
In addition, as a result of their purchasing power, third party payors are implementing cost cutting measures such as seeking discounts, price reductions or other incentives from medical products suppliers and imposing limitations on coverage and reimbursement for medical technologies and procedures. These trends could compel us to reduce prices for our products and could cause a decrease in the size of the market or a potential increase in competition that could negatively affect our business, financial condition and results of operations.
We may not be successful in achieving expected operating efficiencies and sustaining or improving operating expense reductions, and may experience business disruptions associated with restructuring, facility consolidations, realignment, cost reduction and other strategic initiatives.
Over the past several years we have implemented a number of restructuring, realignment and cost reduction initiatives, including facility consolidations, organizational realignments and reductions in our workforce. While we have realized some efficiencies from these actions, we may not realize the benefits of these initiatives to the extent we anticipated. Further, such benefits may be realized later than expected, and the ongoing difficulties in implementing these measures may be greater than anticipated, which could cause us to incur additional costs or result in business disruptions. In addition, if these measures are not successful or sustainable, we may be compelled to undertake additional restructuring, realignment and cost reduction efforts, which could result in significant additional charges. Moreover, if our restructuring, realignment and cost reduction efforts prove ineffective, our ability to achieve our other strategic and business plan goals may be adversely affected.
In addition, as part of our efforts to increase operating efficiencies, we have implemented a number of initiatives over the past several years to consolidate our enterprise resource planning, or ERP, systems. To date, we have not experienced any significant disruptions to our business or operations in connection with these initiatives. However, as we continue our efforts to further consolidate our ERP systems, we could experience business disruptions, which could adversely affect customer relationships and divert the attention of management away from daily operations. In addition, any delays in the implementation of these initiatives could cause us to incur additional unexpected costs. Should we experience such difficulties, our business, cash flows and results of operations could be adversely affected.
16
A significant portion of our United States revenues is derived from sales to distributors, and “destocking” activity by these distributors can adversely affect our revenues and results of operations.
A significant portion of our revenues in the United States is derived from sales to distributors, who, in turn, sell our products to hospitals and other health care institutions. From time to time, these distributors may decide to reduce their levels of inventory with regard to certain of our products, which we refer to as “destocking.” A distributor's decision to reduce inventory levels with respect to our products may be based on a number of factors, such as distributor expectations regarding demand for a particular product, distributor buying decisions (including with respect to competing products), changes in distributor policies regarding the maintenance of inventory levels, economic conditions and other factors. For example, during the third quarter of 2016, we experienced a decline in purchases by our United States distributors that adversely affected our revenues and results of operations. We believe the reduction resulted from the distributors' expectations of a less severe 2016-2017 flu season, which resulted in reduced levels of purchasing with respect to certain of our products that are used for treatment of hospitalized patients suffering from the flu. Following such instances of reduced purchases, distributors may revert to previous purchasing levels; nevertheless, we cannot assure that distributors will, in fact, increase purchases of our products in this manner. A decline in the level of product purchases by our United States distributors in the future could have a material adverse effect on our revenues and results of operations during a reporting period, and an extended decline in such product purchases could have a longer term material adverse effect.
We are subject to extensive government regulation, which may require us to incur significant expenses to ensure compliance. Our failure to comply with those regulations could have a material adverse effect on our business, results of operations, financial condition and cash flows.
Our products are classified as medical devices and are subject to extensive regulation in the United States by the FDA and by comparable government agencies in other countries. The regulations govern, among other things, the development, design, approval, manufacturing, labeling, importing and exporting and sale and marketing of many of our products. Moreover, these regulations are subject to future change.
In the United States, before we can market a new medical device, or a new use of, or claim for, or significant modification to, an existing product, we generally must first receive either 510(k) or de novo clearance or approval of a premarket approval application, or PMA, from the FDA. Similarly, most major markets for medical devices outside the United States also require clearance, approval or compliance with certain standards before a product can be commercially marketed. The process of obtaining regulatory clearances and approvals to market a medical device, particularly from the FDA and certain foreign government authorities, can be costly and time consuming, and clearances and approvals might not be granted for new products on a timely basis, if at all. In addition, once a device has been cleared or approved, a new clearance or approval may be required before the device may be modified or its labeling changed. Furthermore, the FDA or a foreign government authority may make its review and clearance or approval process more rigorous, which could require us to generate additional clinical or other data, and expend more time and effort, in obtaining future product clearances or approvals. The regulatory clearance and approval process may result in, among other things, delayed realization of product revenues, substantial additional costs or limitations on indicated uses of products, any one of which could have a material adverse effect on our financial condition and results of operations. Even after a product has received marketing approval or clearance, such product approval or clearance can be withdrawn or limited due to unforeseen problems with the device or issues relating to its application.
Failure to comply with applicable regulations could lead to adverse effects on our business, which could include:
• | partial suspension or total shutdown of manufacturing; |
• | product shortages; |
• | delays in product manufacturing; |
• | warning or untitled letters; |
• | fines or civil penalties; |
• | delays in obtaining new regulatory clearances or approvals; |
• | withdrawal or suspension of required clearances, approvals or licenses; |
• | product seizures or recalls; |
• | injunctions; |
• | criminal prosecution; |
17
• | advisories or other field actions; |
• | operating restrictions; and |
• | prohibitions against exporting of products to, or importing products from, countries outside the United States. |
We could be required to expend significant financial and human resources to remediate failures to comply with applicable regulations and quality assurance guidelines. In addition, civil and criminal penalties, including exclusion under Medicaid or Medicare, could result from regulatory violations. Any one or more of these events could have a material adverse effect on our business, financial condition and results of operations.
Medical devices are cleared or approved for one or more specific intended uses and performance claims must be adequately substantiated. Promoting a device for an off-label use or making misleading or unsubstantiated claims could result in government enforcement action.
Furthermore, our facilities are subject to periodic inspection by the FDA and other federal, state and foreign government authorities, which require manufacturers of medical devices to adhere to certain regulations, including the FDA’s Quality System Regulation, which requires periodic audits, design controls, quality control testing and documentation procedures, as well as complaint evaluations and investigation. In addition, any facilities assembling convenience kits that include drug components and are registered as drug repackaging establishments are also subject to current good manufacturing practices requirements for drugs. The FDA also requires the reporting of certain adverse events and product malfunctions and may require the reporting of recalls or other field safety corrective actions. Issues identified through such inspections and reports may result in FDA enforcement action through any of the actions discussed above. Moreover, issues identified through such inspections and reports may require significant resources to resolve.
We are subject to healthcare fraud and abuse laws, regulation and enforcement; our failure to comply with those laws could have a material adverse effect on our results of operations and financial condition.
We are subject to healthcare fraud and abuse regulation and enforcement by the federal government and the governments of those states and foreign countries in which we conduct our business. The laws that may affect our ability to operate include:
• | the federal healthcare anti-kickback statute, which, among other things, prohibits persons from knowingly and willfully offering or paying remuneration to induce either the referral of an individual for, or the purchase, order or recommendation of, any good or service for which payment may be made under federal healthcare programs such as Medicare and Medicaid, or soliciting payment for such referrals, purchases, orders and recommendations; |
• | federal false claims laws which, among other things, prohibit individuals or entities from knowingly presenting, or causing to be presented, false or fraudulent claims for payment from the federal government, including Medicare, Medicaid or other third-party payors; |
• | the federal Health Insurance Portability and Accountability Act of 1996 (“HIPAA”), which prohibits schemes to defraud any healthcare benefit program and false statements relating to healthcare matters; and |
• | state law equivalents of each of the above federal laws, such as anti-kickback and false claims laws which may apply to items or services reimbursed by any third-party payor, including commercial insurers. |
If our operations are found to be in violation of any of these laws or any other government regulations, we may be subject to penalties, including civil and criminal penalties, damages, fines, the curtailment or restructuring of our operations, the exclusion from participation in federal and state healthcare programs and imprisonment of personnel, any of which could adversely affect our ability to operate our business and our financial results. The risk of our being found to have violated these laws is increased by the fact that many of them have not been fully interpreted by the regulatory authorities or the courts, and their provisions are open to a variety of interpretations.
Further, the Patient Protection and Affordable Care Act, as amended by the Health Care and Education Reconciliation Act (collectively, the “Affordable Care Act”), imposed annual reporting and disclosure requirements on device manufacturers for any “transfer of value” made or distributed to physicians or teaching hospitals. Our first report was submitted in 2014, and the reported information was made publicly available in a searchable format in September 2014. In addition, device manufacturers are required to report and disclose any investment interests held by physicians and their immediate family members during the preceding calendar year. Failure to submit required information may result in civil monetary penalties for each payment, transfer of value or ownership or investment
18
interests not reported in an annual submission, up to an aggregate of $150,000 per year (and up to an aggregate of $1 million per year for “knowing failures”).
In addition, there has been a recent trend of increased federal and state regulation of payments made to healthcare providers. Some states, such as California, Connecticut, Nevada and Massachusetts, mandate implementation of compliance programs that include the tracking and reporting of gifts, compensation for consulting and other services, and other remuneration to healthcare providers. The shifting commercial compliance environment and the need to build and maintain robust and expandable systems to comply with the different compliance and/or reporting requirements among a number of jurisdictions increases the possibility that we may inadvertently violate one or more of the requirements, resulting in increased compliance costs that could adversely impact our results of operations.
We may incur material losses and costs as a result of product liability and warranty claims, as well as product recalls, any of which may adversely affect our results of operations and financial condition. Furthermore, our reputation as a medical device company may be damaged if one or more of our products are, or are alleged to be, defective.
Our businesses expose us to potential product liability risks that are inherent in the design, manufacture and marketing of our products. In particular, our medical device products are often used in surgical and intensive care settings for procedures involving seriously ill patients. In addition, many of our products are designed to be implanted in the human body for varying periods of time. Product defects or inadequate disclosure of product-related risks with respect to products we manufacture or sell could result in patient injury or death. In addition, in connection with the divestitures of our former non-medical businesses, we agreed to retain certain liabilities related to those businesses, which include, among other things, liability for products manufactured prior to the date on which we completed the sale of the business. Product liability and warranty claims often involve very large or indeterminate amounts, including punitive damages. The magnitude of potential losses from product liability lawsuits may remain unknown for substantial periods of time, and the related legal defense costs may be significant. We could experience material warranty or product liability losses in the future and incur significant costs to defend these claims.
In addition, if any of our products are, or are alleged to be, defective, we may voluntarily participate, or be required by regulatory authorities to participate, in a recall of that product. In the event of a recall, we may lose sales and be exposed to individual or class-action litigation claims. Moreover, negative publicity regarding a quality or safety issue, whether accurate or inaccurate, could harm our reputation, decrease demand for our products, lead to product withdrawals or impair our ability to successfully launch and market our products in the future. Product liability, warranty and recall costs may have a material adverse effect on our business, financial condition, results of operations and cash flows.
The ongoing volatility in the domestic and global financial markets, combined with a continuation of constrained global credit markets could adversely impact our results of operations, financial condition and liquidity.
We are subject to risks arising from adverse changes in general domestic and global economic conditions. The economic slowdown and disruption of credit markets that occurred in recent years led to recessionary conditions and depressed levels of consumer and commercial spending, resulting in reductions, delays or cancellations of purchases of our products and services. Despite some improvements in recent years, economic conditions continue to cause disruption in some financial markets, resulting in, among other things, diminished liquidity and credit availability. We cannot predict the duration or extent of any economic recovery or the extent to which our customers will return to more typical spending behaviors. The continuation of the present broadly applicable economic trends of weak economic growth, constricted credit, public sector austerity measures in response to public budget deficits and foreign currency volatility, particularly with respect to the euro, could have a material adverse effect on our results of operations, financial condition and liquidity.
Additionally, our customers, particularly in Italy, Spain, Portugal and Greece, have extended or delayed payments for products and services already provided, which has increased our focus on collectability with respect to our accounts receivable from these customers. To date, we have not experienced an inordinate amount of payment defaults by our customers, and we have sufficient lending commitments in place to enable us to fund our foreseeable additional operating needs. However, the ongoing uncertainty in the European financial markets, combined with a continuation of constrained European credit markets creates a risk that some of our European customers and suppliers may be unable to access liquidity. As of December 31, 2016 and 2015, our net current and long term trade accounts receivable in Italy, Spain, Portugal and Greece were $51.1 million and $62.3 million, respectively. In 2016, 2015 and 2014, net
19
revenues from these countries were approximately 7%, 7% and 8% of total net revenues, respectively, and average days that accounts receivable from these countries were outstanding were 182, 204 and 223 days, respectively. Although we maintain allowances for doubtful accounts to cover the estimated losses which may occur when customers cannot make their required payments, we cannot assure that we will continue to experience the same loss rate in the future given the volatility in the worldwide economy. If our allowance for doubtful accounts is insufficient to address receivables we ultimately determine are uncollectible, we would be required to incur additional charges, which could materially adversely affect our results of operations. Moreover, our inability to collect outstanding receivables could adversely affect our financial condition and cash flow from operations.
In addition, adverse economic and financial market conditions may result in future impairment charges with respect to our goodwill and other intangible assets, which would not directly affect our liquidity but could have a material adverse effect on our reported financial results.
Our strategic initiatives, including acquisitions, may not produce the intended growth in revenue and operating income.
Our strategic initiatives include making significant investments designed to achieve revenue growth and to enable us to meet or exceed margin improvement targets. If we do not achieve the expected benefits from these investments or otherwise fail to execute on our strategic initiatives, we may not achieve the growth improvement we are targeting and our results of operations may be adversely affected.
In addition, as part of our strategy for growth, we have made, and may continue to make, acquisitions and divestitures and enter into strategic alliances such as joint ventures and joint development agreements. However, we may not be able to identify suitable acquisition candidates, complete acquisitions or integrate acquisitions successfully, and our joint ventures or strategic alliances may not prove to be successful. In this regard, acquisitions involve numerous risks, including difficulties in the integration of acquired operations, technologies, services and products and the diversion of management’s attention from other business concerns. Even if we are successful in completing an acquisition, the products and technologies that we acquire may not be successful or may require significantly greater resources and investments than we anticipated. We could also experience negative effects on our results of operations and financial condition from acquisition-related charges, amortization of intangible assets and asset impairment charges, and other issues that could arise in connection with the acquisition of a company or business, including issues related to internal control over financial reporting, regulatory compliance and short-term effects of increased costs on results of operations. Although our management will endeavor to evaluate the risks inherent in any particular transaction, there can be no assurance that we will identify all such risks or the magnitude of the risks. In addition, prior acquisitions have resulted, and future acquisitions could result, in the incurrence of substantial additional indebtedness and expenditures. Future acquisitions may also result in potentially dilutive issuances of equity securities. There can be no assurance that difficulties encountered in connection with acquisitions will not have a material adverse effect on our business, financial condition and results of operations.
Health care reform may have a material adverse effect on our industry and our business.
Political, economic and regulatory developments have effected fundamental changes in the healthcare industry. The Affordable Care Act substantially changed the way health care is financed by both government and private insurers. It also encourages improvements in the quality of health care products and services and significantly impacts the United States pharmaceutical and medical device industries. Among other things, the Affordable Care Act:
• | established a 2.3% excise tax on sales of medical devices with respect to any entity that manufactures or imports specified medical devices offered for sale in the United States, although this tax has been suspended for 2016 and 2017 as a result of the enactment of the Consolidated Appropriations Act of 2016; |
• | established a new Patient-Centered Outcomes Research Institute to oversee, identify priorities in and conduct comparative clinical effectiveness research; |
• | implemented payment system reforms, including a national pilot program to encourage hospitals, physicians and other providers to improve the coordination, quality and efficiency of certain health care services through bundled payment models; and |
• | created an independent payment advisory board that will submit recommendations to reduce Medicare spending if projected Medicare spending exceeds a specified growth rate. |
20
In 2015 and 2014, we recorded expenses of $10.2 million and $12.7 million, respectively, with respect to the medical device excise tax. While the excise tax has been suspended in 2016 and 2017, unless the suspension is extended, we will again be subject to the excise tax in 2018. We cannot predict at this time the full impact of the Affordable Care Act or other healthcare reform measures that may be adopted in the future on our financial condition, results of operations and cash flows. In this regard, President Trump and several congressional leaders have expressed an intention to repeal the Affordable Care Act and adopt legislation to replace that act, although more recent statements by President Trump and several members of Congress indicate that some time may elapse before any legislative action with respect to the Affordable Care Act is effected. Therefore, the continued viability of, or the nature of any modification of, or legislative substitution for, the Affordable Care Act is highly uncertain, and we cannot predict the effect that any of these events would have on our financial condition, results of operations or cash flows.
We are subject to risks associated with our non-United States operations.
We have significant manufacturing and distribution facilities, research and development facilities, sales personnel and customer support operations in a number of countries outside the United States, including Belgium, the Czech Republic, Germany, Ireland, Malaysia, Mexico. In addition, a significant portion of our non-United States revenues are derived from sales to third party distributors. As of December 31, 2016, 77% of our full-time and temporary employees were employed in countries outside of the United States. As of December 31, 2016, and 2015, approximately 45% and 43%, respectively, of our net property, plant and equipment was located outside the United States. In addition, for the years ended December 31, 2016, 2015 and 2014 approximately 46%, 47% and 50%, respectively, of our net revenues (based on the Teleflex entity generating the sale) were derived from operations outside the United States.
Our international operations are subject to risks inherent in doing business outside the United States, including:
• | exchange controls, currency restrictions and fluctuations in currency values; |
• | trade protection measures; |
• | potentially costly and burdensome import or export requirements; |
• | laws and business practices that favor local companies; |
• | changes in foreign medical reimbursement policies and procedures; |
• | subsidies or increased access to capital for firms that currently are or may emerge as competitors in countries in which we have operations; |
• | substantial foreign tax liabilities, including potentially negative consequences resulting from changes in tax laws; |
• | restrictions and taxes related to the repatriation of foreign earnings; |
• | differing labor regulations; |
• | additional United States and foreign government controls or regulations; |
• | difficulties in the protection of intellectual property; and |
• | unsettled political and economic conditions and possible terrorist attacks against American interests. |
In addition, the United States Foreign Corrupt Practices Act (the “FCPA”) and similar worldwide anti-bribery laws in non-United States jurisdictions generally prohibit companies and their intermediaries from making improper payments to non-United States officials for the purpose of obtaining or retaining business. The FCPA also imposes accounting standards and requirements on publicly traded United States corporations and their foreign affiliates, which, among other things, are intended to prevent the diversion of corporate funds to the payment of bribes and other improper payments to government officials, and to prevent the establishment of “off the books” slush funds from which such improper payments can be made. Because of the predominance of government-sponsored health care systems around the world, many of our customer relationships outside of the United States are with government entities and are therefore subject to such anti-bribery laws. Our policies mandate compliance with these anti-bribery laws. However, we operate in many parts of the world that have experienced government corruption to some degree. Despite meaningful measures that we undertake to facilitate lawful conduct, which include training and compliance programs and internal control policies and procedures, we may not always prevent reckless or criminal acts by our employees, distributors or other agents. In addition, we may be exposed to liability due to pre-acquisition conduct of employees, distributors or other agents of businesses or operations we acquire. Violations of anti-bribery laws, or allegations of such violations, could disrupt our operations, involve significant management distraction and have a material adverse effect on our business, financial condition, results of operations and cash flows. We also could be subject to severe
21
penalties and other adverse consequences, including criminal and civil penalties, disgorgement, substantial expenditures related to further enhancements to our procedures, policies and controls, personnel changes and other remedial actions.
Furthermore, we are subject to the export controls and economic embargo rules and regulations of the United States, including the Export Administration Regulations and trade sanctions against embargoed countries, which are administered by the Office of Foreign Assets Control within the Department of the Treasury, as well as other laws and regulations administered by the Department of Commerce. These regulations limit our ability to market, sell, distribute or otherwise transfer our products or technology to prohibited countries or persons. While we train our employees and contractually obligate our distributors to comply with these regulations, we cannot assure that a violation will not occur, whether knowingly or inadvertently. Failure to comply with these rules and regulations may result in substantial civil and criminal penalties, including fines and the disgorgement of profits, the imposition of a court-appointed monitor, the denial of export privileges and debarment from participation in United States government contracts.
The risks relating to our foreign operations may have a material adverse effect on our international operations or on our business, results of operations, financial condition and cash flows.
Foreign currency exchange rate, commodity price and interest rate fluctuations may adversely affect our results.
We are exposed to a variety of market risks, including the effects of changes in foreign currency exchange rates, commodity prices and interest rates. Products manufactured in, and sold into, foreign markets represent a significant portion of our operations. Our consolidated financial statements reflect translation of financial statements denominated in non-United States currencies to United States dollars, our reporting currency, as well as the foreign currency exchange gains and losses resulting from the remeasurement of assets and liabilities as well as transactions denominated in currencies other than the primary currency of the country in which the entity operates, which we refer to as "non-functional currencies." A strengthening or weakening of the United States dollar in relation to the foreign currencies of the countries in which we sell or manufacture our products, such as the euro, will affect our United States dollar-reported revenue and income. Although we have entered into forward contracts with several major financial institutions to hedge a portion of our monetary assets and liabilities and projected cash flows denominated in non-functional currencies in order to reduce the effects of currency rate fluctuations, changes in the relative values of currencies may, in some instances, have a significant effect on our results of operations.
Many of our products have significant plastic resin content. We also use quantities of other commodities, such as aluminum and steel. Increases in the prices of these commodities could increase the costs of our products and services. We may not be able to pass on these costs to our customers, particularly with respect to those products we sell under group purchase agreements, which could have a material adverse effect on our results of operations and cash flows.
Increases in interest rates may adversely affect the financial health of our customers and suppliers, thereby adversely affecting their ability to buy our products and supply the components or raw materials we need. In addition, our borrowing costs could be adversely affected if interest rates increase. Any of these events could have a material adverse effect on our financial condition, results of operations and cash flows.
Fluctuations in our effective tax rate and changes to tax laws may adversely affect us.
As a global company, we are subject to taxation in numerous countries, states and other jurisdictions. Our effective tax rate is derived from a combination of applicable tax rates in the various countries, states and other jurisdictions in which we operate. In preparing our financial statements, we estimate the amount of tax that will become payable in each of these jurisdictions. Our effective tax rate may, however, differ from the estimated amount due to numerous factors, including a change in the mix of our profitability from country to country and changes in tax laws. Any of these factors could cause us to experience an effective tax rate significantly different from previous periods or our current expectations, which could have an adverse effect on our business, financial condition and results of operations and cash flows.
An interruption in our manufacturing or distribution operations or our supply of raw materials may adversely affect our business.
Many of our key products are manufactured at or distributed from single locations, and the availability of alternate facilities is limited. If operations at one or more of our facilities is suspended due to natural disasters or other events,
22
we may not be able to timely manufacture or distribute one or more of our products at previous levels or at all. Furthermore, our ability to establish replacement facilities or to substitute suppliers may be delayed due to regulations and requirements of the FDA and other regulatory authorities regarding the manufacture of our products. In addition, in the event of delays or cancellations in shipments of raw materials by our suppliers, we may not be able to timely manufacture or supply the affected products at previous levels or at all. The manufacture of our products is highly exacting and complex, due in part to strict regulatory requirements. Problems in the manufacturing process, including equipment malfunction, failure to follow specific protocols and procedures, defective raw materials and environmental factors, could lead to launch delays, product shortages, unanticipated costs, lost revenues and damage to our reputation. A failure to identify and address manufacturing problems prior to the release of products to our customers may also result in quality or safety issues. A reduction or interruption in manufacturing or distribution, or our inability to secure suitable alternative sources of raw materials or components, could have a material adverse effect on our business, results of operations, financial condition and cash flows.
Our ability to attract, train, develop and retain key employees is important to our success.
Our success depends, in part, on our ability to continue to retain our key personnel, including our executive officers and other members of our senior management team. Our success also depends, in part, on our ability to attract, train, develop and retain other key employees, including research and development, sales, marketing and operations personnel. We may experience difficulties in retaining executives and other employees due to many factors, including:
• | the intense competition for skilled personnel in our industry; |
• | fluctuations in global economic and industry conditions; |
• | changes in our organizational structure; |
• | our restructuring initiatives; |
• | competitors’ hiring practices; and |
• | the effectiveness of our compensation programs. |
Our inability to attract, train, develop and retain such personnel could have an adverse effect on our business, results of operations, financial condition and cash flows.
We depend upon relationships with physicians and other health care professionals.
Research and development for some of our products is dependent on our maintaining strong working relationships with physicians and other healthcare professionals. We rely on these professionals to provide us with considerable knowledge and advice regarding the development and use of our products. Physicians assist us as researchers, product consultants, inventors and public speakers. If we fail to maintain our working relationships with physicians and, as a result, no longer have the benefit of their knowledge and advice, our products may not be developed in a manner that is responsive to the needs and expectations of the professionals who use and support our products, which could have a material adverse effect on our business, financial condition, results of operations and cash flows.
Our technology is important to our success, and our failure to protect our intellectual property rights could put us at a competitive disadvantage.
We rely on the patent, trademark, copyright and trade secret laws of the United States and other countries to protect our proprietary rights. Although we own numerous United States and foreign patents and have submitted numerous patent applications, we cannot be assured that any pending patent applications will issue, or that any patents, issued or pending, will provide us with any competitive advantage or will not be challenged, invalidated or circumvented by third parties. In addition, we rely on confidentiality and non-disclosure agreements with employees and take other measures to protect our know-how and trade secrets. The steps we have taken may not prevent unauthorized use of our technology by competitors or other persons who may copy or otherwise obtain and use these products or technology, particularly in foreign countries where the laws may not protect our proprietary rights to the same extent as in the United States. We cannot assure that current and former employees, contractors and other parties will not breach their confidentiality agreements with us, misappropriate proprietary information, copy or otherwise obtain and use our information and proprietary technology without authorization or otherwise infringe on our intellectual property rights. Our inability to protect our proprietary technology could adversely affect our business, financial condition, results of operations and cash flows. Moreover, there can be no assurance that others will not independently develop know-how
23
and trade secrets comparable to ours or develop better technology than our own, which could reduce or eliminate any competitive advantage we have developed.
Our products or processes may infringe the intellectual property rights of others, which may cause us to pay unexpected litigation costs or damages or prevent us from selling our products.
We cannot be certain that our products do not and will not infringe issued patents or other intellectual property rights of third parties. We may be subject to legal proceedings and claims in the ordinary course of our business, including claims of alleged infringement of the intellectual property rights of third parties. Any such claims, whether or not meritorious, could result in litigation and divert the efforts of our personnel. If we are found liable for infringement, we may be required to enter into licensing agreements (which may not be available on acceptable terms or at all) or to pay damages or cease making or selling certain products. We may need to redesign some of our products or processes to avoid future infringement liability. Any of the foregoing events could be detrimental to our business.
Other pending and future litigation may involve significant costs and adversely affect our business.
We are party to various lawsuits and claims arising in the normal course of business involving, among other things, contracts, intellectual property, import and export regulations, employment and environmental matters. The defense of these lawsuits may divert our management’s attention, and we may incur significant expenses in defending these lawsuits. In addition, we may be required to pay damage awards or settlements, or become subject to injunctions or other equitable remedies, that could have a material adverse effect on our financial condition and results of operations. While we do not believe that any litigation in which we are currently engaged would have such an adverse effect, the outcome of litigation, including regulatory matters, is often difficult to predict, and we cannot assure that the outcome of pending or future litigation will not have a material adverse effect on our business, financial condition, results of operations or cash flows.
Our substantial indebtedness could adversely affect our business, financial condition or results of operations.
As of December 31, 2016, we had total consolidated indebtedness of 1,046 million.
Our substantial level of indebtedness increases the risk that we may be unable to generate cash sufficient to satisfy our debt obligations. It could also have significant effects on our business. For example, it could:
• | increase our vulnerability to general adverse economic and industry conditions; |
• | require us to dedicate a substantial portion of our cash flow from operations to payments on our indebtedness, thereby reducing the availability of our cash flow to fund working capital, capital expenditures, research and development efforts and other general corporate purposes; |
• | limit our ability to borrow additional funds for such general corporate purposes; |
• | limit our flexibility in planning for, or reacting to, changes in our business and the industry in which we operate; |
• | restrict us from exploiting business opportunities; and |
• | place us at a competitive disadvantage compared to our competitors that have less indebtedness. |
If we do not generate sufficient cash flow from operations or if future borrowings are not available to us in an amount sufficient to pay our indebtedness when due or to fund our other liquidity needs, we may be forced to:
• | refinance all or a portion of our indebtedness; |
• | sell assets; |
• | reduce or delay capital expenditures; or |
• | seek to raise additional capital. |
We may not be able to effect any of these actions on commercially reasonable terms or at all. Our ability to refinance our indebtedness will depend on our financial condition at the time, the restrictions in the instruments governing our outstanding indebtedness and other factors, including market conditions.
24
Our inability to generate sufficient cash flow to satisfy our debt service obligations, or to refinance or restructure our obligations on commercially reasonable terms or at all, could have a material adverse effect on our business, financial condition and results of operations.
Our debt agreements impose restrictions on our business, which could prevent us from capitalizing on business opportunities and taking some corporate actions and may adversely affect our ability to respond to changes in our business and manage our operations.
Our senior credit agreement and the indentures governing our 5.25% senior notes due 2024 (the "2024 Notes") and our 4.875% senior notes due 2026 (the "2026 Notes") contain covenants that, among other things, impose significant restrictions on our business. The restrictions that these covenants place on us and our restricted subsidiaries include limitations on our and their ability to, among other things:
• | incur additional indebtedness or issue preferred stock or otherwise disqualified stock; |
• | create liens; |
• | pay dividends, make investments or make other restricted payments; |
• | sell assets; |
• | use the proceeds of permitted sales of our assets; |
• | merge, consolidate, sell or otherwise dispose of all or substantially all of our assets; and |
• | enter into transactions with our affiliates. |
In addition, our senior credit agreement also contains financial covenants, including covenants requiring maintenance of a consolidated leverage ratio, a secured leverage ratio and a consolidated interest coverage ratio, calculated in accordance with the terms of the senior credit agreement. A breach of any covenants under any one or more of our debt agreements could result in a default, which if not cured or waived, could result in the acceleration of all of our debt. In addition, any debt agreements we enter into in the future may further limit our ability to enter into certain types of transactions.
The contingent conversion features of our convertible notes, if triggered, may adversely affect our financial condition.
In August 2010, we issued $400 million in aggregate principal amount of 3.875% convertible senior subordinated notes due 2017 (the “Convertible Notes”). The Convertible Notes are convertible under certain circumstances, including the attainment of a last reported sale price per share of our common stock equal to 130% of the conversion price (approximately $79.72) for at least 20 trading days during a period of 30 consecutive trading days ending on the last trading day of the immediately preceding fiscal quarter. Since the fourth quarter 2013 and in all subsequent fiscal quarters, the last reported sale price of our common stock exceeded the 130% threshold. Moreover, commencing on May 1, 2017 and through July 28, 2017, the Convertible Notes are convertible regardless of our stock price, and the Convertible Notes mature in August 2017. As a result, the Convertible Notes are classified as a current liability, which, in turn, has resulted in a material reduction of our net working capital. In April 2016 and January 2017, we exchanged $310.9 million aggregate principal amount of Convertible Notes in for cash and our common stock pursuant to the terms of separate, privately negotiated agreements with certain holders of the Convertible Notes. In addition, holders of $44.8 million aggregate principal amount of Convertible Notes have effected conversions in accordance with the terms of the Convertible Notes. See “Convertible Notes - Exchange Transactions” and “Convertible Notes - Conversions” within Note 8, and “Exchange Transactions” within Note 13, of our consolidated financial statements included in this Annual Report on Form 10-K for additional information. Following the exchange transactions and conversions, and as of February 13, 2017, $44.3 million in aggregate principal amount of the Convertible Notes remain outstanding. At this time, we have elected the net settlement method to satisfy the conversion obligation, under which we will settle the principal amount of the Convertible Notes converted in cash and settle the excess conversion value in shares, plus cash in lieu of fractional shares. While our conversion obligations have been substantially reduced as a result of the exchange transactions and conversions described above, and we believe we have sufficient liquidity to repay the principal amount due on the remaining outstanding Convertible Notes through a combination of our existing cash on hand, amounts available under our revolving credit facility and, if necessary, amounts provided through the capital markets, our use of these funds could adversely affect our results of operations and liquidity. See "Convertible Notes" within Note 8 to the consolidated financial statements included in this Annual Report on Form 10-K for a further discussion regarding the conversion terms of the Convertible Notes.
25
The convertible note hedge transactions and warrant transactions entered into in connection with the issuance of our Convertible Notes may adversely affect the value of our common stock.
In connection with our issuance of the Convertible Notes, we entered into privately negotiated hedge transactions with two counterparties, which we refer to as the "hedge counterparties." The hedge transactions cover, subject to customary anti-dilution adjustments, the number of shares of our common stock that underlie the Convertible Notes and reduce the dilution with respect to our common stock and/or cash payments that we may be required to make upon conversion of the Convertible Notes. Separately, we also entered into privately negotiated warrant transactions with the hedge counterparties under which we may be obligated to issues shares of our common stock. The warrants initially related to the same number of shares of our common stock as were initially subject to the hedge transactions and have an exercise price of $74.65, subject to customary anti-dilution adjustments. In connection with the exchange transactions referenced in the preceding risk factor, we entered into agreements with the hedge counterparties that reduced the scope of the hedge transactions so that they cover only the number of shares of our common stock underlying the Convertible Notes that remained outstanding following the exchange transactions. We also entered into agreements with the such dealer counterparties to reduce the number of shares subject to the warrants. Nevertheless, based on recent market prices of our common stock, the warrant transactions have a dilutive effect with respect to our common stock or, if we so elect, obligate us to make cash payments to the extent that the market price per share of our common stock exceeds the exercise price of the warrants on any expiration date of the warrants. In addition, under applicable accounting guidance, changes in the share price of our common stock can have a significant impact on the number of shares that we must include in the fully diluted earnings per share calculation with respect to the Convertible Notes and warrants, which, in turn, could impact our reported financial results. Based on the average market price of our common stock during 2016, 1.7 million shares issuable upon exercise of the warrants were included in the total diluted shares outstanding for the year ended December 31, 2016. For additional information, see “Financing Arrangements” under Item 7, Management’s Discussion and Analysis of Financial Condition and Results of Operations included in this Annual Report on Form 10-K.
In connection with establishing their positions under the convertible note hedge transactions and the warrant transactions, the hedge counterparties (and/or their affiliates) entered into various cash-settled over-the-counter derivative transactions with respect to our common stock concurrently with, or shortly following, the pricing of the Convertible Notes. The hedge counterparties (and/or their affiliates) may, in their sole discretion, with or without notice, modify their hedge positions from time to time (and are likely to do so during any conversion period related to the conversion of the Convertible Notes) by entering into or unwinding various over-the-counter derivative transactions with respect to shares of our common stock, and/or by purchasing or selling shares of our common stock or Convertible Notes in privately negotiated transactions and/or open market transactions. The effect, if any, of these transactions and activities on the market price of our common stock will depend in part on market conditions and cannot be ascertained at this time, but any of these activities could adversely affect the value of our common stock.
We are subject to counterparty risk with respect to the convertible note hedge transactions.
Each hedge counterparty is a financial institution or the affiliate of a financial institution, and we will be subject to the risk that one or more hedge counterparties may default under the Convertible Note hedge transactions. Our exposure to the credit risk of each hedge counterparty is not secured by any collateral. If a hedge counterparty becomes subject to insolvency proceedings, we will become an unsecured creditor in those proceedings with a claim equal to our exposure at that time under the Convertible Note hedge transaction with that hedge counterparty. Our exposure will depend on many factors but, generally, the increase in our exposure will be correlated to the increase in the market price of our common stock and in the volatility of our common stock. In addition, upon a default by a hedge counterparty, we may suffer adverse tax consequences and dilution with respect to our common stock. We can provide no assurances as to the financial stability or viability of the hedge counterparties.
We may issue additional shares of our common stock or instruments convertible into our common stock, including in connection with conversions of our Convertible Notes, which could lower the price of our common stock.
We are not restricted from issuing additional shares of our common stock or other instruments convertible into our common stock. As of December 31, 2016, we had outstanding approximately 44 million shares of our common stock, options to purchase approximately 1.6 million shares of our common stock (of which approximately 1.0 million were vested as of that date), restricted stock units covering approximately 0.3 million shares of our common stock
26
(which are expected to vest over the next three years) and approximately 12,000 shares of our common stock to be distributed from our deferred compensation plan. As of December 31, 2016, 14.2 million shares of our common stock are reserved for issuance upon the exercise of stock options, upon conversion of the Convertible Notes and upon the exercise of the warrants issued in connection with the Convertible Notes. We cannot predict the size of future issuances or the effect, if any, that they may have on the market price for our common stock.
If we issue additional shares of our common stock or instruments convertible into our common stock, such issuances may materially and adversely affect the price of our common stock. Furthermore, our issuance of shares following the exercise of some or all of the outstanding stock options and warrants, the vested of restricted stock units and the conversion of some or all of the Convertible Notes will dilute the ownership interests of existing stockholders, and any sales in the public market of such shares of our common stock could adversely affect prevailing market prices of our common stock. In addition, the issuance and sale of substantial amounts of our common stock, including common stock issued as a result of the exercise of stock options and warrants, vesting of restricted stock units or conversion of the Convertible Notes, could depress the price of our common stock.
Disruption of critical information systems or material breaches in the security of our systems may adversely affect our business and customer relationships.
We rely on information technology systems to process, transmit, and store electronic information in our day-to-day operations. We also rely on our technology infrastructure, among other functions, to enable us to interact with customers and suppliers, fulfill orders, generate invoices, collect and make payments, ship products, provide support to customers, fulfill contractual obligations and otherwise conduct business. Our internal information technology systems, as well as those systems maintained by third-party providers, may be subjected to computer viruses or other malicious codes, unauthorized access attempts, and cyber-attacks, any of which could result in data leaks or otherwise compromise our confidential or proprietary information and disrupt our operations. Cyber-attacks are becoming more sophisticated and frequent, and in some cases have caused significant harm. Although we have taken numerous measures to protect our information systems and enhance data security, we cannot assure that these measures will prevent security breaches that could have a significant impact on our business, reputation and financial results. If we fail to monitor, maintain or protect our information technology systems and data integrity effectively or fail to anticipate, plan for or manage significant disruptions to these systems, we could, among other things, lose customers, have difficulty preventing fraud, have disputes with customers, physicians and other health care professionals, be subject to regulatory sanctions or penalties, incur expenses or lose revenues or suffer other adverse consequences. Any of these events could have a material adverse effect on our business, results of operations, financial condition or cash flows.
Regulations related to conflict minerals may increase our costs and adversely affect our business.
In 2012, the SEC promulgated rules under the Dodd-Frank Wall Street Reform and Consumer Protection Act regarding disclosure of the use of tin, tantalum, tungsten and gold, known as "conflict minerals," included in components of products either manufactured by public companies or for which public companies have contracted to manufacture. These rules require that we undertake due diligence efforts to determine whether such minerals originated from the Democratic Republic of Congo (the “DRC”) or an adjoining country and, if so, whether such minerals helped finance armed conflict in the DRC or an adjoining country. In accordance with applicable regulations, we filed conflict minerals reports in 2014, 2015 and 2016. As discussed in these reports, we have determined that certain of our products contain the specified minerals, and we have undertaken, and continue to undertake, efforts to identify where such minerals originated. We have incurred, and expect to continue to incur, costs associated with complying with these disclosure requirements, including costs related to determining the sources of the specified minerals used in our products. These rules could adversely affect the sourcing, supply and pricing of materials used in our products. Our customers may require that our products be free of conflict minerals, and our revenues and margins may be adversely affected if we are unable to provide assurances to our customers that our products are “DRC conflict free” (generally, the product does not contain conflict minerals originating in the DRC or an adjoining country that directly or indirectly finance or benefit specified armed groups) due to, among other things, our inability to procure conflict free minerals at a reasonable price, or at all. Moreover, we may be adversely affected if we are unable to pass through any increased costs associated with meeting customer demands that we provide products that are DRC conflict free. We also may face reputational challenges if our due diligence efforts do not enable us to verify the origins of all conflict minerals or to determine that any conflict minerals used in products we manufacture or in products manufactured by others for us are DRC conflict-free.
27
Our operations expose us to the risk of material environmental liabilities.
We are subject to numerous foreign, federal, state and local environmental protection and health and safety laws governing, among other things:
• | the generation, storage, use and transportation of hazardous materials; |
• | emissions or discharges of substances into the environment; and |
• | the health and safety of our employees. |
These laws and regulations are complex, change frequently and have tended to become more stringent over time. We cannot provide assurance that our costs of complying with current or future environmental protection and health and safety laws, or our liabilities arising from past or future releases of, or exposures to, hazardous substances, which may include claims for personal injury or cleanup, will not exceed our estimates or will not adversely affect our financial condition and results of operations.
Our workforce covered by collective bargaining and similar agreements could cause interruptions in our provision of products and services.
As of December 31, 2016, approximately 12% of our employees in the United States and in other countries were covered by union contracts or collective bargaining arrangements. It is likely that a portion of our workforce will remain covered by collective bargaining and similar agreements for the foreseeable future. Strikes or work stoppages could occur that would adversely impact our relationships with our customers and our ability to conduct our business.
We may not pay dividends on our common stock in the future.
Holders of our common stock are entitled to receive dividends only as our board of directors may declare out of funds legally available for such payments. The declaration and payment of future dividends to holders of our common stock will be at the discretion of our board of directors and will depend upon many factors, including our financial condition, earnings, compliance with covenants in our debt instruments, legal requirements and other factors as our board of directors deems relevant. We cannot assure you that our cash dividend will not be reduced, or eliminated, in the future.
Certain provisions of our corporate governing documents, Delaware law and our Convertible Notes could discourage, delay, or prevent a merger or acquisition.
Provisions of our certificate of incorporation and bylaws could impede a merger, takeover or other business combination involving us or discourage a potential acquirer from making a tender offer for our common stock. For example, our certificate of incorporation authorizes our board of directors to determine the number of shares in a series, the consideration, dividend rights, liquidation preferences, terms of redemption, conversion or exchange rights and voting rights, if any, of unissued series of preferred stock, without any vote or action by our stockholders. Thus, our board of directors can authorize and issue shares of preferred stock with voting or conversion rights that could adversely affect the voting or other rights of holders of our common stock. We are also subject to Section 203 of the Delaware General Corporation Law, which imposes restrictions on mergers and other business combinations between us and any holder of 15% or more of our common stock. These provisions could have the effect of delaying or deterring a third party from acquiring us even if an acquisition might be in the best interest of our stockholders, and accordingly could reduce the market price of our common stock.
Certain provisions in the Convertible Notes and the indentures governing the Convertible Notes, the 2024 Notes and the 2026 Notes could make it more difficult or more expensive for a third party to acquire us. For example, if an acquisition event constitutes a “fundamental change,” as defined in the indenture governing the Convertible Notes, holders of the Convertible Notes will have the right to require us to purchase their notes in cash. Similarly, if an acquisition event constitutes a “change of control” as defined in the indenture governing the 2024 Notes and 2026 Notes, holders of such notes will have the right to require us to purchase their notes in cash. In addition, if an acquisition event constitutes a “make-whole fundamental change,” as defined in the indenture governing the Convertible Notes, we may be required, under certain circumstances, to increase the conversion rate for holders who convert their notes in connection with such acquisition event. In either case, and in other cases, our obligations under the Convertible Notes, the 2024 Notes and the 2026 Notes could increase the cost of acquiring us or otherwise discourage a third party from acquiring us or removing incumbent management, and accordingly could reduce the market price of our common stock.
28
ITEM 1B. | UNRESOLVED STAFF COMMENTS |
Not applicable.
29
ITEM 2. | PROPERTIES |
We own or lease approximately 85 properties consisting of plants, engineering and research centers, distribution warehouses, offices and other facilities. We believe that the properties are maintained in good operating condition and are suitable for their intended use. In general, our facilities meet current operating requirements for the activities currently conducted within the facilities.
Our major facilities (those with 50,000 or greater square feet) at December 31, 2016 are as follows:
Location | Square Footage | Owned or Leased | ||
Olive Branch, MS | 627,000 | Leased | ||
Nuevo Laredo, Mexico | 277,000 | Leased | ||
Asheboro, NC | 204,000 | Owned | ||
Reading, PA | 166,000 | Owned | ||
Tongeren, Belgium | 163,000 | Leased | ||
Chihuahua, Mexico | 153,000 | Owned | ||
Morrisville, NC | 162,000 | Leased | ||
Kernen, Germany | 112,000 | Leased | ||
Zdar nad Sazavou, Czech Republic | 108,000 | Owned | ||
Kamunting, Malaysia | 102,000 | Owned | ||
Chihuahua, Mexico | 100,000 | Leased | ||
Tecate, Mexico | 96,000 | Leased | ||
Hradec Kralove, Czech Republic | 92,000 | Owned | ||
Chelmsford, MA | 91,000 | Leased | ||
Kulim, Malaysia | 90,000 | Owned | ||
Kernen, Germany | 86,000 | Owned | ||
Arlington Heights, IL | 86,000 | Leased | ||
Wayne, PA | 84,000 | Leased | ||
Jaffrey, NH | 81,000 | Owned | ||
Kamunting, Malaysia | 77,000 | Leased | ||
Chihuahua, Mexico | 68,000 | Leased | ||
Chihuahua, Mexico | 63,000 | Owned | ||
Limerick, Ireland | 59,000 | Leased | ||
Everett, MA | 56,000 | Leased | ||
Bad Liebenzell, Germany | 53,000 | Leased | ||
Operations in each of our business segments are conducted at locations both in and outside of the United States. Of the facilities listed above, with the exception of Jaffrey, NH and Limerick, Ireland, which are used solely for the OEM segment, our facilities generally serve more than one business segment and are often used for multiple purposes, such as administrative/sales, manufacturing and/or warehousing/distribution.
In addition to the properties listed above, we own or lease approximately 630,000 square feet of additional warehousing, manufacturing and office space in the North America, South America, Europe, Asia and Africa. We also own or lease properties that are no longer used in our operations, which we are actively marketing for sale or sublease.
30
ITEM 3. | LEGAL PROCEEDINGS |
We are party to various lawsuits and claims arising in the normal course of business. These lawsuits and claims include actions involving product liability and product warranty, intellectual property, contracts, employment and environmental matters. As of December 31, 2016 and 2015, we have accrued liabilities of $2.5 million in connection with these matters, representing our best estimate of the cost within the range of estimated possible loss that will be incurred to resolve these matters. Of the $2.5 million accrued at December 31, 2016, $1.6 million pertains to discontinued operations. Based on information currently available, advice of counsel, established reserves and other resources, we do not believe that any such actions are likely to be, individually or in the aggregate, material to our business, financial condition, results of operations or liquidity. However, in the event of unexpected further developments, it is possible that the ultimate resolution of these matters, or other similar matters, if unfavorable, may be materially adverse to our business, financial condition, results of operations or cash flows. See Note 15 to the consolidated financial statements included in this Annual Report on Form 10-K for additional information.
ITEM 4. | MINE SAFETY DISCLOSURES |
Not applicable.
31
PART II
ITEM 5. | MARKET FOR REGISTRANT’S COMMON EQUITY, RELATED STOCKHOLDER MATTERS AND ISSUER PURCHASES OF EQUITY SECURITIES |
Our common stock is listed on the New York Stock Exchange, Inc. under the symbol “TFX.” Our quarterly high and low stock prices and dividends for 2016 and 2015 are shown below.
Price Range and Dividends of Common Stock
2016 | High | Low | Dividends | |||||||||
First Quarter | $ | 155.05 | $ | 125.28 | $ | 0.34 | ||||||
Second Quarter | $ | 176.84 | $ | 154.22 | $ | 0.34 | ||||||
Third Quarter | $ | 188.79 | $ | 168.00 | $ | 0.34 | ||||||
Fourth Quarter | $ | 170.92 | $ | 136.53 | $ | 0.34 | ||||||
2015 | High | Low | Dividends | |||||||||
First Quarter | $ | 123.09 | $ | 107.45 | $ | 0.34 | ||||||
Second Quarter | $ | 137.29 | $ | 118.83 | $ | 0.34 | ||||||
Third Quarter | $ | 140.50 | $ | 122.13 | $ | 0.34 | ||||||
Fourth Quarter | $ | 135.00 | $ | 122.14 | $ | 0.34 | ||||||
The terms of our senior credit facility as well as our 5.25% senior notes due 2024 and 4.875% notes due 2026, limit our ability to repurchase shares of our stock and pay cash dividends. Under the most restrictive of these provisions, on an annual basis $1.0 billion of retained earnings was available for dividends at December 31, 2016. On February 23, 2017, the Board of Directors declared a quarterly dividend of $0.34 per share on our common stock, which is payable on March 15, 2017 to holders of record on March 3, 2017. As of February 21, 2017, we had approximately 528 holders of record of our common stock.
32
Stock Performance Graph
The following graph provides a comparison of five year cumulative total stockholder returns of Teleflex common stock, the Standard & Poor’s (S&P) 500 Stock Index and the S&P 500 Healthcare Equipment & Supply Index. The annual changes for the five-year period shown on the graph are based on the assumption that $100 had been invested in Teleflex common stock and each index on December 31, 2011 and that all dividends were reinvested.
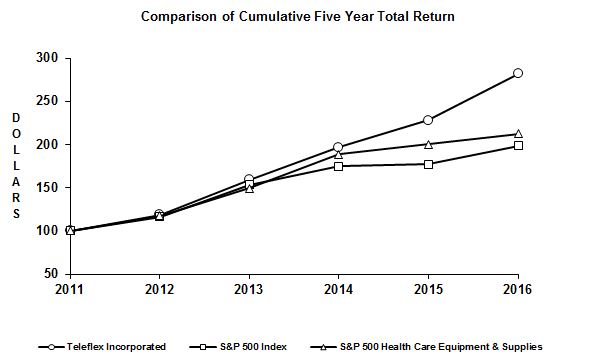
MARKET PERFORMANCE
Company / Index | 2011 | 2012 | 2013 | 2014 | 2015 | 2016 | ||||||||||||
Teleflex Incorporated | 100 | 119 | 159 | 197 | 228 | 282 | ||||||||||||
S&P 500 Index | 100 | 116 | 154 | 175 | 177 | 198 | ||||||||||||
S&P 500 Healthcare Equipment & Supply Index | 100 | 117 | 150 | 188 | 200 | 212 | ||||||||||||
33
ITEM 6. | SELECTED FINANCIAL DATA |
2016(1) | 2015(1) | 2014(1) | 2013(1) | 2012(1) | |||||||||||||||||
(Dollars in thousands, except per share) | |||||||||||||||||||||
Statement of Income Data: | |||||||||||||||||||||
Net revenues | $ | 1,868,027 | $ | 1,809,690 | $ | 1,839,832 | $ | 1,696,271 | $ | 1,551,009 | |||||||||||
Income (loss) from continuing operations before interest, loss on extinguishment of debt and taxes | $ | 319,453 | $ | 315,891 | $ | 284,862 | $ | 233,261 | $ | (97,375 | ) | (2) | |||||||||
Income (loss) from continuing operations | $ | 237,651 | $ | 236,808 | $ | 191,460 | $ | 152,183 | $ | (181,782 | ) | (2) | |||||||||
Amounts attributable to common shareholders for income (loss) from continuing operations | $ | 237,187 | $ | 235,958 | $ | 190,388 | $ | 151,316 | $ | (182,737 | ) | (2) | |||||||||
Per Share Data: | |||||||||||||||||||||
Income (loss) from continuing operations — basic | $ | 5.47 | $ | 5.68 | $ | 4.60 | $ | 3.68 | $ | (4.47 | ) | ||||||||||
Income (loss) from continuing operations — diluted | $ | 4.98 | $ | 4.91 | $ | 4.10 | $ | 3.46 | $ | (4.47 | ) | ||||||||||
Cash dividends | $ | 1.36 | $ | 1.36 | $ | 1.36 | $ | 1.36 | $ | 1.36 | |||||||||||
Balance Sheet Data: | |||||||||||||||||||||
Total assets(3) | $ | 3,891,213 | $ | 3,871,774 | $ | 3,912,431 | $ | 4,151,193 | $ | 3,674,449 | |||||||||||
Long-term borrowings (3) | $ | 850,252 | $ | 641,850 | $ | 693,720 | $ | 927,496 | $ | 954,291 | |||||||||||
Common shareholders’ equity | $ | 2,137,517 | $ | 2,009,272 | $ | 1,911,309 | $ | 1,913,527 | $ | 1,778,950 | |||||||||||
Statement of Cash Flows Data: | |||||||||||||||||||||
Net cash provided by operating activities from continuing operations | $ | 410,590 | $ | 303,446 | $ | 290,241 | $ | 231,299 | $ | 194,618 | |||||||||||
Net cash (used in) provided by investing activities from continuing operations | $ | (56,974 | ) | $ | (154,848 | ) | $ | (108,137 | ) | $ | (372,638 | ) | $ | (368,258 | ) | ||||||
Net cash (used in) provided by financing activities from continuing operations | $ | (118,692 | ) | $ | (85,583 | ) | $ | (287,703 | ) | $ | 231,170 | $ | (65,653 | ) | |||||||
Supplemental Data: | |||||||||||||||||||||
Free cash flow(4) | $ | 357,455 | $ | 241,998 | $ | 222,670 | $ | 167,719 | $ | 129,224 | |||||||||||
Certain financial information is presented on a rounded basis, which may cause minor differences.
(1) | Amounts include the impact of businesses acquired during the period. See Note 3 to the consolidated financial statements included in this Annual Report on Form 10-K for additional information. |
(2) | Includes a pretax goodwill impairment charge of $332.1 million, or $315.1 million net of tax. |
(3) | Includes the impact of adopting, as of January 1, 2016, the accounting guidance related to the classification of debt issuance costs. See Note 2 to the consolidated financial statements included in this Annual Report on Form 10-K for additional information. |
(4) | Free cash flow is calculated by subtracting capital expenditures from cash provided by operating activities from continuing operations. Free cash flow is considered a non-GAAP financial measure. This financial measure is used in addition to and in conjunction with results presented in accordance with generally accepted accounting principles in the United States, or GAAP, and should not be considered a substitute for net cash provided by operating activities from continuing operations, the most comparable GAAP financial measure. Management believes that free cash flow is a useful measure to investors because it facilitates an assessment of funds available to satisfy current and future obligations, pay dividends and fund acquisitions. We also use this financial measure for internal managerial purposes and to evaluate period-to-period comparisons. Free cash flow is not a measure of cash available for discretionary expenditures since we have certain non-discretionary obligations, such as debt service, that are not deducted from the measure. We strongly encourage investors to review our financial statements and publicly-filed reports in their entirety and not to rely on any single financial measure. The following is a reconciliation of free cash flow to the most comparable GAAP measure. |
2016 | 2015 | 2014 | 2013 | 2012 | |||||||||||||||
(Dollars in thousands) | |||||||||||||||||||
Net cash provided by operating activities from continuing operations | $ | 410,590 | $ | 303,446 | $ | 290,241 | $ | 231,299 | $ | 194,618 | |||||||||
Less: Capital expenditures | 53,135 | 61,448 | 67,571 | 63,580 | 65,394 | ||||||||||||||
Free cash flow | $ | 357,455 | $ | 241,998 | $ | 222,670 | $ | 167,719 | $ | 129,224 | |||||||||
34
ITEM 7. | MANAGEMENT’S DISCUSSION AND ANALYSIS OF FINANCIAL CONDITION AND RESULTS OF OPERATIONS |
Overview
We are a global provider of medical technology products that enhance clinical benefits, improve patient and provider safety and reduce total procedural costs. We primarily design, develop, manufacture and supply single-use medical devices used by hospitals and healthcare providers for common diagnostic and therapeutic procedures in critical care and surgical applications. We market and sell our products worldwide through a combination of our direct sales force and distributors. Because our products are used in numerous markets and for a variety of procedures, we are not dependent upon any one end-market or procedure. We are focused on achieving consistent, sustainable and profitable growth by increasing our market share and improving our operating efficiencies.
We evaluate our portfolio of products and businesses on an ongoing basis to ensure alignment with our overall objectives. Based on our evaluation, we may identify opportunities to expand our margins through strategic divestitures of existing businesses and product lines that do not meet our objectives. In addition, we may seek to optimize utilization of our facilities through restructuring initiatives designed to further reduce our cost base and enhance our competitive position. For a discussion of our ongoing restructuring programs, see "Restructuring and other impairment charges" under “Results of Operations” below. Finally, we may continue to explore opportunities to expand the size of our business and improve our margins through a combination of acquisitions and distributor to direct sales conversions, which generally involves eliminating a distributor from the sales channel, thereby enabling us to obtain improved product pricing and more direct access to the end users of our products within the sales channel.
During 2016, we completed acquisitions of businesses that complement our OEM and Asia reportable operating segments. In addition, during this period, we acquired the remaining 26% ownership interest in an Indian affiliate, Teleflex Medical Private Limited, from the noncontrolling shareholders. The total fair value of the consideration for these transactions was $22.8 million.
During 2015, we completed several acquisitions of businesses that complement the anesthesia, surgical ligation, vascular and OEM product portfolios, as well as several acquisitions of distributors of medical devices and supplies. The total fair value of consideration for these acquisitions was $96.5 million.
On February 17, 2017, the Company acquired all of the common stock and voting equity interest in Vascular Solutions, Inc. (“Vascular Solutions”) for $56.00 per share in cash, or a total of approximately $1.0 billion. Vascular Solutions is a medical device company that focuses on developing clinical solutions for minimally invasive coronary and peripheral vascular procedures. The acquisition is expected to meaningfully accelerate the growth of our vascular and interventional access product portfolios through increased revenue associated with entry into the coronary and peripheral vascular market, as well as increased cross-portfolio selling opportunities to both our and Vascular Solutions' customer bases.
Health Care Reform
In 2010, the Patient Protection and Affordable Care Act (as amended, the "Affordable Care Act") was signed into law. The legislation is far-reaching and is intended to expand access to health insurance coverage and improve the quality and reduce the costs of healthcare. For medical device companies such as Teleflex, the expansion of medical insurance coverage should lead to greater utilization of the products we manufacture, but the provisions of the legislation designed to contain the cost of healthcare could negatively affect pricing of our products and encourage patient outcome driven results. The overall impact of the Affordable Care Act on our business is yet to be determined, mainly due to uncertainties around future customer behaviors, which we believe will be affected by reimbursement factors such as insurance coverage, statistics, patient outcomes and patient satisfaction. Moreover, in light of the expressed intent of President Trump and several members of congressional leadership to repeal the Affordable Care Act and adopt a form of replacement legislation, the continued viability of, or the nature of any modification of, or legislative substitution for, the Affordable Care Act, as well as the effect of any of these events, if they occur, is highly uncertain.
The Affordable Care Act imposed a 2.3% excise tax on sales of medical devices, beginning in 2013. Although the excise tax has been suspended for 2016 and 2017, its status remains unclear for 2018 and subsequent years. For the years ended December 31, 2015 and 2014, we recorded medical device excise taxes of $10.2 million and $12.7 million, respectively, which are included in selling, general and administrative expenses.
35
Global Economic Conditions
Global economic conditions in recent years have had adverse impacts on market activities due to, among other things, failure of financial institutions, falling asset values, diminished liquidity, reduced demand for products and services and significant fluctuations in foreign currency exchange rates. In response, we adjusted production levels and engaged in new restructuring activities. We continue to review and evaluate our manufacturing, warehousing and distribution processes to maximize efficiencies through the elimination of redundancies in our operations and the consolidation of facilities. Although, on a consolidated basis, the consequences of economic conditions, other than fluctuations in foreign currency exchange rates, have not had a significant adverse impact on our financial position, results of operations or liquidity, healthcare policies and practice trends vary by country, and the impact of the global economic downturn was felt to varying degrees in each of our regional markets over the last several years. The continuation of the present broadly applicable economic trends of weak economic growth, constricted credit, public sector austerity measures in response to public budget deficits and foreign currency volatility, particularly with respect to the euro, could have a material adverse effect on our results of operations and our liquidity.
In recent years, hospitals in some regions of the United States experienced a decline in admissions, a weaker payor mix, and a reduction in elective procedures. Consequently, hospitals took actions to reduce their costs, including limiting their capital spending. More recently, the economic environment has improved somewhat, but has not returned to pre-recession levels, and challenges persist, particularly in some European countries, as discussed below. Approximately 94% of our net revenues come from single-use products primarily used in critical care and surgical applications, and our sales volume could be negatively impacted if hospital admission rates or payor mix change. Conversely, our sales volume could be positively impacted due to increases in the number of insured individuals as a result of the Affordable Care Act, which has had the effect of facilitating medical insurance coverage for many persons who previously were not covered, although, as noted above, the Affordable Care Act may be subject to repeal, modification or replacement.
A number of European countries continue to contend with considerable government debt, annual deficits and high levels of unemployment. Despite some indications of a more positive economic outlook in Europe, the healthcare sector remains weak. In particular, budgetary restraints among European countries have led to cost control measures, such as delays in approvals for elective surgeries.The public healthcare systems in certain countries in Western Europe, most notably Greece, Spain, Portugal and Italy, have experienced significantly reduced liquidity due to recessionary conditions, which continues to result in delays in payments to us by customers in these countries. Moreover, the impact of Brexit, economic and trade policies of the Trump administration and the results of several 2017 elections in European nations, including Germany and France, are uncertain and could have a profound economic effect in Europe and elsewhere.
In Asia, governments have intensified efforts to manage the cost of healthcare in response to an uncertain economic environment that has resulted in moderate growth rates across the region. We are experiencing an increasing trend of government-driven price management and reimbursement controls, particularly in China, Japan and Indonesia. There also has been an increase in government initiatives to help local manufacturers access a bigger share of the local market. Moreover, many countries in the region have become more proactive with respect to regulatory requirements, and as a result, we expect longer, costlier and more complicated regulatory approval processes in these countries.
In Latin America, some highly regulated economies such as Argentina and Venezuela have experienced unusually high inflation rates and weakening currencies. This has impacted the budgets of the public healthcare systems resulting in delays in the importation of medical devices. Although Latin America does not represent a significant portion of our business, our operations in this region may be adversely affected by these factors.
Results of Operations
As used in this discussion, "new products" are products that we have sold for 36 months or less, and “existing products” are products that we have sold for more than 36 months. Discussion of results of operations items that reference the effect of one or more acquired businesses (except as noted below with respect to acquired distributors) generally reflects the impact of the acquisitions within the first 12 months following the date of the acquisition. In addition to increases and decreases in the per unit selling prices of our products to our customers, our discussion of the impact of product price increases and decreases also reflects, for the first 12 months following the acquisition of a distributor, the impact on the pricing of our products resulting from the elimination of the distributor from the sales channel. To the extent an acquired distributor had pre-acquisition sales of products other than ours, the impact of the post-acquisition
36
sales of those products on our results of operations is included within our discussion of the impact of acquired businesses.
Certain financial information is presented on a rounded basis, which may cause minor differences.
Revenues
2016 | 2015 | 2014 | |||||||||
(Dollars in millions) | |||||||||||
Net Revenues | $ | 1,868.0 | $ | 1,809.7 | $ | 1,839.8 | |||||
Comparison of 2016 and 2015
Net revenues for the year ended December 31, 2016 increased 3.2%, or $58.3 million, compared to the prior year. The increase is primarily attributable to an increase in sales volumes of existing products of $37.3 million and an increase in new product sales of $24.2 million, both across all of our segments. The increase was partially offset by unfavorable fluctuations in foreign currency exchange rates.
Comparison of 2015 and 2014
Net revenues for the year ended December 31, 2015 decreased 1.6%, or $30.1 million, compared to the prior year. The decrease is primarily attributable to unfavorable fluctuations in foreign currency exchange rates of $129.1 million, primarily in the EMEA and Asia segments. The decrease in net revenues was partially offset by a net increase in sales volumes of existing products in most of our segments of $51.9 million, and a net increase in new product sales in most of our segments of $19.4 million. In addition, the decrease was further offset by sales by acquired businesses, primarily Human Medics Co., Ltd. (“Human Medics”), a distributor of medical devices and supplies primarily in the Korean market, Mini-Lap, a developer of micro-laparoscopic instrumentation, Mayo Healthcare Pty Limited, ("Mayo Healthcare"), a distributor of medical devices and supplies, primarily in the Australian market, N. Stenning & Co. Pty. Ltd. ("Stenning"), a distributor of medical devices and supplies primarily in the Australian market, and Truphatek Holdings (1993) Limited ("Truphatek"), a manufacturer of a broad range of disposable and reusable laryngoscope devices, which generated $14.8 million, and net price increases, primarily in the Asia and Surgical North America segments, which generated $12.8 million.
Gross profit
2016 | 2015 | 2014 | |||||||||
(Dollars in millions) | |||||||||||
Gross profit | $ | 996.2 | $ | 944.4 | $ | 942.4 | |||||
Percentage of revenues | 53.3 | % | 52.2 | % | 51.2 | % | |||||
Comparison of 2016 and 2015
For the year ended December 31, 2016, gross profit as a percentage of revenues increased 110 basis points, or 2.1%, compared to the prior year. The increase in gross margin is primarily attributable to the impact of an increase in sales of higher margin products, primarily in the Anesthesia North America and EMEA segments, as well as lower manufacturing costs resulting from cost improvement initiatives, including the 2014 Manufacturing Footprint Realignment Plan.
Comparison of 2015 and 2014
For the year ended December 31, 2015, gross profit as a percentage of revenues increased 100 basis points, or 2.0%, compared to the prior year. The increase in gross margin is primarily attributable to the 70 basis point impact of a net increase in sales of higher margin products, primarily in the Surgical North America and OEM segments, the 60 basis point impact of a net increase in sales volumes of existing products, primarily in the Vascular North America, EMEA and Asia segments and the 30 basis point impact of net price increases, primarily in the Asia and Surgical North America segments. Gross margin was negatively impacted by the 80 basis point impact of net unfavorable fluctuations in foreign currency exchange rates and costs associated with product recalls and quality issues first identified during the second quarter 2015 partially offset by lower manufacturing costs resulting from cost improvement initiatives.
37
Selling, general and administrative
2016 | 2015 | 2014 | |||||||||
(Dollars in millions) | |||||||||||
Selling, general and administrative | $ | 563.3 | $ | 569.0 | $ | 578.7 | |||||
Percentage of revenues | 30.2 | % | 31.4 | % | 31.5 | % | |||||
Comparison of 2016 and 2015
Selling, general and administrative expenses decreased $5.7 million during the year ended December 31, 2016 compared to the prior year. The decrease is primarily attributable to the favorable impact of the suspension of the excise tax on medical devices under the Affordable Care Act of $10.2 million and the favorable impact of fluctuations in foreign currency exchanges rates of $2.7 million, partially offset by an increase in selling and marketing expenses of $7.5 million.
Comparison of 2015 and 2014
Selling, general and administrative expenses decreased $9.7 million during the year ended December 31, 2015 compared to the prior year. The decrease is due to the favorable impact of foreign currency exchange rate fluctuations of $28.5 million and a reduction in medical device excise tax of $2.5 million. These declines were partially offset by expenses associated with our 2015 acquisitions and distributor-to-direct sales conversions of $11.4 million, an increase in selling expenses of $5.4 million, primarily related to higher sales commissions, a reduction, as compared to 2014, in the benefit resulting from the reversal of contingent consideration liabilities of $2.9 million and higher amortization expense of $2.6 million.
Research and development
2016 | 2015 | 2014 | |||||||||
(Dollars in millions) | |||||||||||
Research and development | $ | 58.6 | $ | 52.1 | $ | 61.0 | |||||
Percentage of revenues | 3.1 | % | 2.9 | % | 3.3 | % | |||||
Comparison of 2016 and 2015
The increase in research and development expenses for the year ended December 31, 2016 is primarily attributable to increased spending on new product development with respect to several of our segments.
Comparison of 2015 and 2014
The decrease in research and development expenses for the year ended December 31, 2015 resulted from efficiencies realized through our integration of research and development projects commenced by certain businesses acquired in 2013 that were reflected in research and development expenses for the year ended December 31, 2014. The decrease is also attributable to the late stage technology acquisitions made in 2015, which supplement our organic research and development initiatives.
38
Restructuring and other impairment charges
2016 | 2015 | 2014 | |||||||||
(Dollars in millions) | |||||||||||
Other 2016 restructuring programs | $ | 3.2 | $ | — | $ | — | |||||
2016 Manufacturing footprint realignment plan | 12.5 | — | — | ||||||||
2015 Restructuring programs | 0.1 | 6.3 | — | ||||||||
2014 Manufacturing footprint realignment plan | 0.1 | 1.7 | 9.3 | ||||||||
2014 European restructuring plan | — | (0.1 | ) | 7.8 | |||||||
Other 2014 restructuring programs | — | — | 3.6 | ||||||||
LMA restructuring program | — | — | (3.3 | ) | |||||||
Other restructuring programs | (0.1 | ) | (0.1 | ) | 0.5 | ||||||
Other impairment charges | 43.4 | — | $ | — | |||||||
Total | $ | 59.2 | $ | 7.8 | $ | 17.9 | |||||
2016 Restructuring charges
For the year ended December 31, 2016, the restructuring charges primarily related to the 2016 Manufacturing Footprint Realignment Plan and, to a lesser extent, to other restructuring programs, which are described below. The restructuring charges recognized for the year ended December 31, 2016 included termination benefits and contract termination costs of $13.2 million and $1.7 million, respectively.
2016 Manufacturing Footprint Realignment Plan
On February 23, 2016, our Board of Directors approved a restructuring plan involving the consolidation of operations and a related workforce reduction at certain of our facilities (the "2016 Manufacturing Footprint Realignment Plan"). We estimate that we will incur aggregate pre-tax charges in connection with these restructuring activities of approximately $34 million to $44 million, of which we estimate $27 million to $31 million will result in future cash outlays. Additionally, we expect to incur aggregate capital expenditures of approximately $17 million to $19 million in connection with the 2016 Manufacturing Footprint Realignment Plan. We currently expect to achieve annualized savings of $12 million to $16 million once the plan is fully implemented and currently expect to realize plan-related savings beginning in 2017.
2016 Other Restructuring Programs
During 2016, we committed to certain actions designed to further improve operating efficiencies and reduce costs. These actions include the consolidation of global administrative functions and manufacturing operations. These programs commenced in the second half of 2016 and are expected to be substantially complete by the end of the first quarter of 2018. We estimate that we will record aggregate pre-tax charges of $3.8 million to $4.7 million related to these programs, substantially all of which constitute termination benefits and lease termination costs that will result in future cash outlays. Additionally, we expect to incur approximately $1.5 million of accelerated depreciation and other costs directly related to the programs, which will be recognized in cost of goods sold; we anticipate that approximately $0.6 million of this amount will result in future outlays. We expect to achieve annualized pre-tax savings of $6.9 million to $8.5 million once this program has been fully implemented and anticipate that we will begin realizing savings related to the programs in 2017.
2015 Restructuring charges
For the year ended December 31, 2015, the restructuring charges primarily related to restructuring programs that were initiated in conjunction with the reorganization of certain of our businesses and shared service center functions as well as the consolidation of certain of our facilities in North America. The restructuring charges recognized for the year ended December 31, 2015 included termination benefits and contract termination costs of $5.8 million and $1.4 million, respectively.
39
2014 Restructuring charges
For the year ended December 31, 2014, we recognized restructuring charges related to several programs including the 2014 Manufacturing Footprint Realignment Plan, the 2014 European Restructuring Plan and other 2014 restructuring programs, which are described below. The restructuring charges recorded for the year ended December 31, 2014 included termination benefits and contract termination costs of $16.9 million and $3.3 million, respectively. The restructuring charges were partially offset by a net credit of $3.2 million resulting from the reversal of contract termination costs due to the favorable settlement of a terminated distributor agreement related to the LMA restructuring program, which was initiated following our acquisition of substantially all of the assets of LMA International N.V. (the "LMA Business") in 2012 to integrate the LMA business into our other businesses.
2014 Manufacturing Footprint Realignment Plan
In April 2014, our Board of Directors approved a restructuring plan (the "2014 Manufacturing Footprint Realignment Plan") involving the consolidation of operations and a related reduction in workforce at certain facilities, and the relocation of manufacturing operations from certain higher-cost locations to existing lower-cost locations. These actions commenced in the second quarter 2014 and were initially expected to be substantially completed by the end of 2017.
To date, we have completed the consolidation and relocation of a significant portion of the operations subject to the 2014 Manufacturing Footprint Realignment Plan, and achieved annualized savings of $17 million at December 31, 2016 directly related to these actions. With respect to the remaining actions to be taken under the plan, we revised our savings, expense and timing estimates during the third quarter 2016 to reflect the impact of changes we have implemented with respect to medication delivery devices included in certain kits primarily sold by our Vascular North America operating segment and, to a lesser extent, certain kits primarily sold by our Anesthesia North America operating segment. As a result of these changes, we have reduced our estimate with respect to the overall annualized savings we expect to realize under the plan from our prior estimate of $28 million to $35 million to a range of $23 million to $27 million. We anticipate that this decrease in projected savings will be offset, in large part, by an expected increase in annual revenues resulting from improved pricing on the affected Vascular kits directly related to the changes described above. We anticipate that this projected increase in annual revenues, taken together with the projected annualized savings we expect to realize under the 2014 Manufacturing Footprint Realignment Plan, should enable us to improve our pre-tax income on an annualized basis by approximately $28 million to $33 million once the plan has been completed.
As a result of the changes described above, we also revised our estimates with respect to the charges we expect to incur in connection with the plan. Specifically, we now estimate that we will incur $43 million to $48 million in aggregate pre-tax charges associated with the 2014 Manufacturing Footprint Realignment Plan, compared to our prior estimate of approximately $37 million to $44 million. In addition, we expect cash outlays associated with the plan to be in the range of $33 million to $38 million, compared to our prior estimate of approximately $26 million to $31 million. We continue to expect to incur $24 million to $30 million in aggregate capital expenditures under the plan.
We currently expect that the 2014 Manufacturing Footprint Realignment Plan will be substantially complete by the end of the first half of 2020 rather than the end of 2017, which we previously anticipated.
We currently are evaluating the feasibility of alternative measures designed to mitigate the loss of expected savings and accelerate the currently estimated timetable for completion of the plan.
2014 European Restructuring Plan
In 2014, we committed to a restructuring plan, which impacts certain administrative functions in Europe and involves the consolidation of operations and a related reduction in workforce at certain of our European facilities. We expect future restructuring charges, if any, to be nominal and we expect to complete this plan in 2017.
Other 2014 Restructuring Programs
In June 2014, we initiated programs to consolidate locations in Australia and terminate certain European distributor agreements in an effort to reduce costs. We completed these programs in 2015.
40
Other impairment charges
IPR&D impairment charge
In May 2012, we acquired Semprus BioSciences Corp. (“Semprus”), a biomedical research and development company that developed a polymer surface treatment technology intended to reduce thrombus-related complications. Through 2016, we continued to engage in research and development activities designed to support an application for regulatory approval and achieve commercialization of the technology. However, upon considering the continuing challenges, remaining risks and uncertainties and significant additional resources required in connection with the development and commercialization of the technology, as well as the availability and advances made with respect to other technologies, during the fourth quarter of 2016, we determined it would not be commercially reasonable to continue our efforts to develop the Semprus technology. As a result, we significantly reduced, and over the course of 2017 will discontinue, our research and development efforts with regard to the Semprus technology. Consequently, we recognized a pre-tax impairment charge of $41.0 million ($26.1 million after tax) for the year ended December 31, 2016.
Long-lived asset impairment charges
During the fourth quarter we recorded $2.4 million in impairment charges related to two properties, one of which was classified as a held for sale building asset.
There were no impairment charges for the years ended December 31, 2015 or 2014.
For additional information regarding our restructuring programs and other impairment charges, see Note 4, and Note 18 to the consolidated financial statements included in this Annual Report on Form 10-K.
Interest expense
2016 | 2015 | 2014 | |||||||||
(Dollars in millions) | |||||||||||
Interest expense | $ | 54.9 | $ | 61.3 | $ | 65.5 | |||||
Average interest rate on debt during the year | 3.80 | % | 3.84 | % | 4.10 | % | |||||
Comparison of 2016 and 2015
The decrease in interest expense for the year ended December 31, 2016 compared to the prior year was primarily due to the repurchase through exchange transactions with holders of our 3.875% Convertible Senior Subordinated Notes due 2017 (the "Convertible Notes") and conversions of the Convertible Notes, each of which is described in more detail in Note 8 to the consolidated financial statements included in this Annual Report on Form 10-K, resulting in lower average amounts of debt outstanding compared to the prior period. The decrease was also the result of a lower average interest rate due to our June 1, 2015 redemption of our 6.875% Senior Subordinated Notes due 2019 (the "2019 Notes"), which were replaced by borrowings under our revolving credit facility and subsequently by our issuance of 4.875% Senior Notes due 2026 (the “2026 Notes”). Both the revolving credit facility and the 2026 Notes carry interest rates that are lower than the 2019 Notes. The decrease in interest expense was partially offset by financing fees of $3.4 million incurred for the year ended December 31, 2016 to secure the bridge financing commitments, as described in more detail in "Liquidity and Capital Resources" section below and Note 19 to the consolidated financial statements included in this Annual Report on Form 10-K.
Comparison of 2015 and 2014
The decrease in interest expense for the year ended December 31, 2015 compared to the prior year reflects the benefit of the redemption, on June 1, 2015, of our 6.875% Senior Subordinated Notes due 2019, which had a fixed interest rate. Proceeds from our revolving credit facility, which bear a lower variable interest rate, were utilized to redeem the 2019 Notes.
41
Loss on extinguishment of debt
2016 | 2015 | 2014 | |||||||||
(Dollars in millions) | |||||||||||
Loss on extinguishment of debt | $ | 19.3 | $ | 10.5 | $ | — | |||||
For the year ended December 31, 2016, we recognized a loss on the extinguishment of debt of $19.3 million, of which, $16.3 million related to our repurchase of Convertible Notes through exchange transactions we entered into with certain holders of the Convertible Notes and $3.0 million related to the conversions of $44.4 million in aggregate principal amount of the Convertible Notes. See Note 8 to the consolidated financial statements included in this report for additional information.
On June 1, 2015, we prepaid the $250 million aggregate outstanding principal amount under the 2019 Notes. In addition to our prepayment of principal, we paid to the holders of the 2019 Notes an $8.6 million prepayment make-whole amount plus accrued and unpaid interest. We recognized the prepayment make-whole amount and a $1.9 million write-off of unamortized debt issuance costs as a loss on extinguishment of debt for the year ended December 31, 2015.
Gain on sale of assets
2016 | 2015 | 2014 | |||||||||
(Dollars in millions) | |||||||||||
Gain on sale of assets | $ | 4.4 | $ | 0.4 | $ | — | |||||
During the year ended December 31, 2016, we recognized a gain of $4.4 million, primarily as a result of the sale, for $8.9 million, of two buildings, one of which was previously classified as held for sale.
Taxes on income from continuing operations
2016 | 2015 | 2014 | ||||||
Effective income tax rate | 3.3 | % | 3.2 | % | 13.0 | % | ||
Comparison of 2016 and 2015
The effective income tax rate in 2016 was 3.3% compared to 3.2% in 2015. Taxes on income from continuing operations in 2016 were $8.1 million compared to $7.8 million in 2015. The effective income tax rate for 2016 was impacted by a tax benefit associated with U.S. federal tax return filings, a benefit resulting from the reduction of German tax reserves as a result of the conclusion of an audit, a benefit resulting from the expiration of various statutes of limitation and a benefit associated with the Semprus IPR&D asset impairment.
Comparison of 2015 and 2014
The effective income tax rate in 2015 was 3.2% compared to 13.0% in 2014. Taxes on income from continuing operations in 2015 were $7.8 million compared to $28.7 million in 2014. The effective tax rate for 2015 was impacted by a tax benefit associated with U.S. federal tax return filings, a benefit associated with legislative tax rate changes, a benefit resulting from a reduction in our U.S. reserves as a result of the conclusion of an audit and a benefit associated with a reduction in the estimated deferred tax with respect to non-permanently reinvested income due to an increase in the estimated foreign tax credits available to reduce the U.S. tax on a future repatriation.
42
Segment Results
Segment Net Revenues
Year Ended December 31 | % Increase/(Decrease) | ||||||||||||||||
2016 | 2015 | 2014 | 2016 vs 2015 | 2015 vs 2014 | |||||||||||||
(Dollars in millions) | |||||||||||||||||
Vascular North America | $ | 350.5 | $ | 334.9 | $ | 311.1 | 4.6 | 7.6 | |||||||||
Anesthesia North America | 198.8 | 189.2 | 183.9 | 5.0 | 2.9 | ||||||||||||
Surgical North America | 172.2 | 161.3 | 150.1 | 6.8 | 7.4 | ||||||||||||
EMEA | 510.9 | 514.5 | 593.1 | (0.7 | ) | (13.3 | ) | ||||||||||
Asia | 249.4 | 241.7 | 237.7 | 3.2 | 1.7 | ||||||||||||
OEM | 161.0 | 149.4 | 144.0 | 7.8 | 3.8 | ||||||||||||
All other | 225.2 | 218.7 | 219.9 | 3.0 | (0.6 | ) | |||||||||||
Segment Net Revenues | $ | 1,868.0 | $ | 1,809.7 | $ | 1,839.8 | 3.2 | (1.6 | ) | ||||||||
Segment Operating Profit
Year Ended December 31, | % Increase/(Decrease) | ||||||||||||||||
2016 | 2015 | 2014 | 2016 vs 2015 | 2015 vs 2014 | |||||||||||||
(Dollars in millions) | |||||||||||||||||
Vascular North America | $ | 97.1 | $ | 73.3 | $ | 53.8 | 32.5 | 36.2 | |||||||||
Anesthesia North America | 55.6 | 48.3 | 34.6 | 15.0 | 39.8 | ||||||||||||
Surgical North America | 56.6 | 52.5 | 49.6 | 7.8 | 5.9 | ||||||||||||
EMEA | 84.4 | 92.3 | 114.6 | (8.6 | ) | (19.5 | ) | ||||||||||
Asia | 75.7 | 67.9 | 62.2 | 11.6 | 9.2 | ||||||||||||
OEM | 33.6 | 33.2 | 30.6 | 1.4 | 8.2 | ||||||||||||
All other | 19.8 | 20.4 | 19.8 | (2.8 | ) | 3.0 | |||||||||||
Segment Operating Profit(1) | $ | 422.8 | $ | 387.9 | $ | 365.2 | 9.0 | 6.2 | |||||||||
(1) | See Note 16 to the consolidated financial statements included in this Annual Report on Form 10-K for a reconciliation of segment operating profit to our consolidated income from continuing operations before interest, loss on extinguishment of debt and taxes. |
Comparison of 2016 and 2015
Vascular North America
Vascular North America net revenues for the year ended December 31, 2016 increased $15.6 million, or 4.6%, compared to the prior year. The increase is primarily attributable to an increase in sales volumes of existing products of $9.9 million and, to a lesser extent, price increases and an increase in new product sales.
Vascular North America operating profit for the year ended December 31, 2016 increased $23.8 million, or 32.5%, compared to the prior year. The increase is primarily attributable to an increase in gross profit, reflecting the impact of an increase in sales volumes of existing products and price increases, a benefit resulting from contingent consideration liability reversals as well as lower administrative expenses and the favorable impact of the suspension of the excise tax on medical devices under the Affordable Care Act.
Anesthesia North America
Anesthesia North America net revenues for the year ended December 31, 2016 increased $9.6 million, or 5.0%, compared to the prior year. The increase is primarily attributable to an increase in sales volumes of existing products of $5.8 million and an increase in new product sales of $3.5 million.
Anesthesia North America operating profit for the year ended December 31, 2016 increased $7.3 million, or 15.0%, compared to the prior year. The increase is primarily attributable to an increase in gross profit, mainly due to the impact of an increase in sales of higher margin products and an increase in sales volumes of existing products. The increase in operating profit was also attributable to the favorable impact of the suspension of the excise tax on medical devices
43
under the Affordable Care Act. The impact of these factors was partially offset by higher amortization and marketing expenses, as well as unfavorable fluctuations in foreign currency exchange rates.
Surgical North America
Surgical North America net revenues for the year ended December 31, 2016 increased $10.9 million, or 6.8%, compared to the prior year. The increase is primarily attributable to an increase in new product sales of $6.7 million and price increases of $3.9 million.
Surgical North America operating profit for the year ended December 31, 2016 increased $4.1 million, or 7.8%, compared to the prior year. The increase is primarily attributable to an increase in gross profit principally reflecting increased new product sales. The increase in operating profit was also attributable to lower amortization expense and the favorable impact of the suspension of the excise tax on medical devices under the Affordable Care Act. The impact of these factors was partially offset by higher selling expense, primarily related to new product sales, the unfavorable effect of an increase in contingent consideration liabilities and unfavorable fluctuations in foreign currency exchange rates.
EMEA
EMEA net revenues for the year ended December 31, 2016 decreased $3.6 million, or 0.7%, compared to the prior year. The decrease is primarily attributable to unfavorable fluctuations in foreign currency exchange rates of $9.3 million, partially offset by an increase in sales volumes of existing products and an increase in new products sales.
EMEA operating profit for the year ended December 31, 2016 decreased $7.9 million, or 8.6%, compared to the prior year. The decrease is primarily attributable to a decrease in gross profit principally due to unfavorable fluctuations in foreign currency exchange rates. The decrease in operating profit was also attributable to higher operating expenses, across most categories, despite the favorable impact of fluctuations in foreign currency exchanges rates on these expenses.
Asia
Asia net revenues for the year ended December 31, 2016 increased $7.7 million, or 3.2%, compared to the prior year. The increase was primarily attributable to price increases of $4.0 million and an increase in sales volumes of existing products of $3.6 million, which were partially offset by unfavorable fluctuations in foreign currency exchange rates.
Asia operating profit for the year ended December 31, 2016 increased $7.8 million, or 11.6%, compared to the prior year. The increase is primarily attributable to an increase in gross profit, primarily reflecting price increases. The increase in operating profit was also attributable to favorable fluctuations in foreign currency exchange rates, partially offset by an increase in marketing expense.
During the first quarter of 2017, we decided to eliminate a key distributor within our sales channel in China, that distributed our vascular access, interventional access and cardiac care products. As a result, we will be undertaking a distributor to direct sales conversion under which we will distribute these products through alternative third party sub-distributors. See Item 1 “Business - History and Recent Developments - Distributor-to-Direct Sales Conversions and Restructuring Programs” for further information regarding our distributor-to-direct sales conversions. We expect to experience a decline in our 2017 sales and operating profit in our Asia segment as the former distributor liquidates its remaining inventory of our products and we implement our new structure to support these sales. While the effects of this initiative are very difficult to predict, we currently anticipate that our Asia segment net revenues in 2017 as compared to 2016 will decline by $4 million to $8 million and Asia segment operating profit in 2017 as compared to 2016 will decline by $6 million to $9 million.
OEM
OEM net revenues for the year ended December 31, 2016 increased $11.6 million, or 7.8%, compared to the prior year. The increase is primarily attributable to an increase in sales volumes of existing products of $6.1 million and net revenues generated by the acquired businesses of $3.6 million.
OEM operating profit for the year ended December 31, 2016 increased $0.4 million, or 1.4%, compared to the prior year. The increase is primarily attributable to an increase in gross profit, reflecting increased sales volumes of existing products, which was partially offset by higher selling, general and administrative expenses.
44
All other
Net revenues for the other businesses for the year ended December 31, 2016 increased $6.5 million, or 3.0%, compared to the prior year. The increase is primarily attributable to an increase in sales volumes of existing products of $6.3 million and an increase in new product sales of $3.5 million, partially offset by unfavorable fluctuations in foreign currency exchange rates.
Operating profit for the other businesses for the year ended December 31, 2016 decreased $0.6 million, or 2.8%, compared to the prior year. The decrease is primarily attributable to administrative expenses and a reduction in the benefit resulting from the reversal of contingent consideration liabilities as compared to the benefit realized in the prior year. The decrease in operating profits was partially offset by the favorable impact of the suspension of the excise tax on medical devices under the Affordable Care Act.
Comparison of 2015 and 2014
Vascular North America
Vascular North America net revenues for the year ended December 31, 2015 increased $23.8 million, or 7.6%, compared to the prior year. The increase is primarily attributable to an increase in sales volumes of existing products of $26.9 million, which was partially offset by unfavorable fluctuations in foreign currency exchange rates of $1.9 million and a reduction in new product sales of $1.5 million.
Vascular North America operating profit for the year ended December 31, 2015 increased $19.5 million, or 36.2%, compared to the prior year. The increase is primarily attributable to the $17.2 million impact of increased sales volumes of existing products, a $2.3 million reduction with respect to the medical excise tax, a $2.6 million reduction in manufacturing costs, a $2.1 million reduction in research and development costs, including employee related costs, and the impact of increased sales of higher margin products. The increases to operating profit were partially offset by a $4.2 million net increase in non-research and development employee related costs, including higher sales commissions and healthcare benefits, net of restructuring savings and unfavorable fluctuations in foreign currency exchange rates.
Anesthesia North America
Anesthesia North America net revenues for the year ended December 31, 2015 increased $5.3 million, or 2.9%, compared to the prior year. The increase is primarily attributable to an increase in sales volumes of existing products of $3.9 million and an increase in new product sales of $2.7 million, which were partially offset by unfavorable fluctuations in foreign currency exchange rates of $1.1 million.
Anesthesia North America operating profit for the year ended December 31, 2015 increased $13.7 million, or 39.8%, compared to the prior year. The increase is primarily attributable to a $7.5 million net decrease in selling, general and administrative expenses, which was primarily the result of lower amortization, selling and regulatory expenses, the $2.3 million impact of an increase in sales volumes of existing products, a $1.4 million reduction in manufacturing costs and the $1.4 million impact of an increase in new product sales.
Surgical North America
Surgical North America net revenues for the year ended December 31, 2015 increased $11.2 million, or 7.4%, compared to the prior year. The increase is primarily attributable to net revenues generated by Mini-Lap products of $4.3 million, an increase in new product sales of $4.3 million and price increases of $3.9 million. The increase in net revenues was partially offset by unfavorable fluctuations in foreign currency exchange rates of $2.0 million.
Surgical North America operating profit for the year ended December 31, 2015 increased $2.9 million, or 5.9%, compared to 2014. The increase is primarily attributable to the $3.9 million impact of price increases, the $3.1 million impact of increased sales of higher margin products, the impact of an increase in new product sales and income generated by Mini-Lap. These increases were partially offset by higher selling, general and administrative expenses, which was primarily caused by a $5.6 million increase in amortization expense that resulted from the commencement of amortization of certain intellectual property assets and a $1.6 million increase in employee related costs.
EMEA
EMEA net revenues for the year ended December 31, 2015 decreased $78.6 million, or 13.3%, compared to the prior year. The decrease is primarily attributable to unfavorable fluctuations in foreign currency exchange rates of
45
$91.4 million and price decreases of $1.6 million. The decrease in net revenues was partially offset by an increase in sales volumes of existing products of $8.4 million, an increase in new product sales of $4.7 million and net revenues generated by acquired businesses, primarily Truphatek, of $1.2 million.
EMEA operating profit for the year ended December 31, 2015 decreased $22.3 million, or 19.5%, compared to the prior year. The decrease is primarily attributable to the $25.8 million impact of unfavorable fluctuations in foreign currency exchange rates, a $7.8 million increase in raw material costs due to United States dollar sourced raw materials, an increase in marketing expenses, primarily related to clinical education activities, and price decreases, partially offset by the $6.9 million impact of an increase in sales volumes of existing products, a $3.3 million reduction in research and development expenses, the impact of an increase in new product sales and increased sales of higher margin products.
Asia
Asia net revenues for the year ended December 31, 2015 increased $4.0 million, or 1.7%, compared to the prior year. The increase is primarily attributable to prices increases of $9.7 million, an increase in sales volumes of existing products of $7.6 million, net revenues generated by acquired businesses, including Human Medics, Mayo Healthcare, Truphatek and Stenning, of $8.4 million and an increase in new product sales of $2.2 million. The increase in net revenues was partially offset by unfavorable fluctuations in foreign currency exchange rates of $23.8 million.
Asia operating profit for the year ended December 31, 2015 increased $5.7 million, or 9.2%, compared to the prior year. The increase is primarily attributable to the $9.7 million impact of price increases, the $7.6 million impact of increase in sales volumes of existing products, the $4.5 million impact of income generated by the businesses we acquired in 2015, the impact of increased sales of higher margin products and the impact of an increase in new product sales. These increases were partially offset by the $14.4 million impact of unfavorable fluctuations in foreign currency exchange rates, $3.1 million in expenses associated with distributor-to-direct sales conversions and higher logistics and distribution costs.
OEM
OEM net revenues for the year ended December 31, 2015 increased $5.4 million, or 3.8%, compared to the prior year. The increase is primarily attributable to an increase in sales volumes of existing products of $5.6 million, an increase in new product sales of $3.8 million and net revenues generated by the acquisition of Trintris Medical Inc., which were partially offset by unfavorable fluctuations in foreign currency exchange rates of $4.6 million.
OEM operating profit for the year ended December 31, 2015 increased $2.6 million, or 8.2%, compared to the prior year. The increase is primarily attributable to the $3.1 million impact of an increase in sales of higher margin products, the $2.8 million impact of increases in sales volumes of existing products and an increase in new product sales of $1.9 million, which were partially offset by a $1.9 million increase in selling expenses, the $1.2 million impact of unfavorable fluctuations in foreign currency exchange rates and an increase in research and development expenses.
All other
Net revenues for the other businesses for the year ended December 31, 2015 decreased $1.2 million, or 0.6%, compared to the prior year. The decrease was primarily attributable to unfavorable fluctuations in foreign currency exchange rates of $4.2 million and a decrease in sales volumes of existing products of $1.0 million, which were partially offset by an increase in new product sales of $3.2 million.
Operating profit for the other businesses for the year ended December 31, 2015 increased $0.6 million, or 3.0%, compared to the prior year. The increase in operating profit is primarily attributable to lower research and development expense, the impact of an increase in new product sales and sales of higher margin products and reduced manufacturing costs. These increases were partially offset by a reduction in the benefit resulting from reversals of contingent consideration liabilities and the unfavorable impact of foreign currency exchange rate fluctuations.
Liquidity and Capital Resources
We assess our liquidity in terms of our ability to generate cash to fund our operating, investing and financing activities. Our principal source of liquidity is operating cash flows. In addition to operating cash flows, other significant factors that affect our overall management of liquidity include: capital expenditures, acquisitions, pension funding,
46
dividends, taxes, scheduled principal and interest payments with respect to outstanding indebtedness, adequacy of available bank lines of credit and access to capital markets.
We believe our cash flow from operations, available cash and cash equivalents and borrowings under our revolving credit and accounts receivable securitization facilities will enable us to fund our operating requirements, capital expenditures and debt obligations for the next 12 months and the foreseeable future.
Of our $543.8 million of cash and cash equivalents at December 31, 2016, $527.5 million was held at foreign subsidiaries. We manage our worldwide cash requirements by monitoring the funds available among our subsidiaries and determining the extent to which we can access those funds on a cost effective basis. We are not aware of any restrictions on repatriation of these funds and, subject to cash payment of additional United States income taxes or foreign withholding taxes, these funds could be repatriated, if necessary. Any additional taxes could be offset, at least in part, by foreign tax credits. The amount of any taxes required to be paid, which could be significant, and the application of tax credits would be determined based on income tax laws in effect at the time of such repatriation. We do not expect any such repatriation to result in additional tax expense because taxes have been provided for on unremitted foreign earnings that we do not consider permanently reinvested.
We have not experienced significant payment defaults by our customers and we have sufficient lending commitments in place to enable us to fund our anticipated operating needs. However, as discussed above in "Global Economic Conditions", although there have been recent improvements in certain countries, global financial markets remain volatile and the global credit markets are constrained, which creates risk that our customers and suppliers may be unable to access liquidity. Consequently, we continue to monitor our credit risk, particularly with respect to customers in Greece, Italy, Portugal and Spain, as well as consider other risk mitigation strategies. In January 2017, we sold $16.1 million of receivables payable from publicly funded hospitals in Italy for $16.0 million.
As of December 31, 2016 and 2015, our net trade receivables from publicly funded hospitals in Greece, Italy, Portugal and Spain were $29.2 million and $37.4 million, respectively. For the years ended December 31, 2016, 2015 and 2014, net revenues from customers in these countries were approximately 7%, 7% and 8%, respectively, of total net revenues, and average days that current and long-term accounts receivable were outstanding were 182, 204 and 223 days, respectively. As of December 31, 2016 and 2015, net current and long-term accounts receivable from these countries were approximately 19% and 24%, respectively, of our consolidated net current and long-term accounts receivable. If economic conditions in these countries deteriorate, we may experience significant credit losses related to the public hospital systems in these countries. Moreover, if global economic conditions generally deteriorate, we may experience further delays in customer payments, reductions in our customers’ purchases and higher credit losses, which could have a material adverse effect on our results of operations and cash flows in 2017 and future years. See "Critical Accounting Policies and Estimates" below for additional information regarding the critical accounting estimates related to our accounts receivable.
On February 17, 2017, we acquired Vascular Solutions for $1.0 billion in cash, which we financed through a combination of borrowings under our increased revolving credit facility and a new senior secured term loan facility, both of which were provided under our amended and restated credit agreement. See "Financing Arrangements" below for additional information regarding these facilities. However, in December 2016, concurrent with our entry into the agreement to acquire Vascular Solutions, we secured bridge financing commitments to ensure our ability to pay the purchase price for the Vascular Solutions acquisition and fees, costs and expenses related to the acquisition. In connection with the bridge commitments, we incurred $5.5 million in financing costs, of which, $3.4 million was recognized as of December 31, 2016 and the remainder was recognized in 2017. These financing costs were paid in February 2017. The bridge commitments terminated upon our execution of an amendment and restatement of our credit agreement.
The aggregate total fair value of consideration for the acquisitions we made in 2016 and 2015 was $22.8 million and $96.5 million, respectively. See Note 3 and Note 19 to the consolidated financial statements included in this Annual Report on Form 10-K for additional information regarding our acquisitions.
In April 2016 and January 2017, we exchanged $219.2 million and $91.7 million, respectively, aggregate outstanding principal amount of the Convertible Notes for an aggregate of $313.9 million in cash (which amount includes approximately $3.0 million in accrued and previously unpaid interest) and approximately 3.10 million shares of our common stock (the “Exchange Transactions”). We funded the cash portion of the consideration paid through borrowings under our revolving credit facility. In addition, during 2016, we delivered $44.4 million in cash and 0.4 million shares of our common stock to holders of $44.4 million aggregate principal amount of the Convertible Notes who
47
exercised their conversion rights under the Convertible Notes. We funded the cash portion of the conversion obligation through borrowings under our revolving credit facility. As of February 13, 2017 the outstanding balance of the Convertible Notes, after giving effect to January 2017 Exchange Transactions, was $44.3 million. Our Convertible Notes are scheduled to mature in 2017 and we intend to repay the Convertible Notes with funds available under our revolving credit facility and cash on hand.
We may at any time, from time to time, repurchase our outstanding debt securities in open market purchases or by tender at any price or in privately negotiated transactions, exchange transactions or otherwise. Such purchases or exchanges, if any, will depend on prevailing market conditions, our liquidity requirements, contractual restrictions and other factors and may be commenced or suspended at any time.
See "Financing Arrangements" below as well as Note 8 to the consolidated financial statements included in this Annual Report on Form 10-K for further information related to our borrowings.
Cash Flows
The following table provides a summary of our cash flows for the periods presented:
Year Ended December 31, | |||||||||||
2016 | 2015 | 2014 | |||||||||
(Dollars in millions) | |||||||||||
Cash flows from continuing operations provided by (used in): | |||||||||||
Operating activities | $ | 410.6 | $ | 303.4 | $ | 290.2 | |||||
Investing activities | (57.0 | ) | (154.8 | ) | (108.1 | ) | |||||
Financing activities | (118.7 | ) | (85.6 | ) | (287.7 | ) | |||||
Cash flows used in discontinued operations | (2.1 | ) | (2.6 | ) | (3.7 | ) | |||||
Effect of exchange rate changes on cash and cash equivalents | (27.4 | ) | (25.3 | ) | (19.4 | ) | |||||
Increase (decrease) in cash and cash equivalents | $ | 205.4 | $ | 35.1 | $ | (128.7 | ) | ||||
Comparison of 2016 and 2015
Cash Flow from Operating Activities
Net cash provided by operating activities from continuing operations was $410.6 million during 2016 compared to $303.4 million during 2015. The $107.2 million increase is primarily attributable to improved operating results, a net favorable impact from changes in working capital and a reduction in income tax payments.
The net cash inflow from working capital is primarily the result of an increase in accounts payable and accrued expenses and a decrease in inventories partially offset by an increase in accounts receivable. The cash inflow for accounts payable and accrued expenses was $15.4 million for the year ended December 31, 2016 as compared to a cash outflow of $0.1 million for the year ended December 31, 2015. The cash inflow for accounts payable and accrued expenses, excluding the impact of the net increase in the restructuring reserve, is attributable to certain non-recurring accrued expense payments made during the year ended December 31, 2015. The cash inflow for inventories was $6.4 million in 2016 as compared to a $8.4 million net cash outflow in 2015. The lower inventory levels in 2016 are primarily the result of higher than expected net revenues in the fourth quarter and fewer inventory builds in support of distributor to direct sales conversions. The cash outflow related to accounts receivable was $11.0 million in 2016 as compared to a cash inflow of $0.4 million in 2015. The increase in accounts receivable for the year ended December 31, 2016 is attributable to higher fourth quarter net revenues as compared to 2015, partially offset by stronger collections, particularly in Europe.
Cash Flow from Investing Activities
Net cash used in investing activities from continuing operations was $57.0 million during 2016, primarily resulting from capital expenditures of $53.1 million and payments for businesses and intangibles acquired of $14.0 million. The acquired business and intangibles included certain assets of CarTika Medical, Inc. and certain distributors in New
48
Zealand, which were comprised primarily of intangible assets, including goodwill, and inventory. These payments were partially offset by proceeds from asset sales of $10.2 million, primarily related to two buildings.
Cash Flow from Financing Activities
Net cash used in financing activities from continuing operations was $118.7 million during 2016, primarily resulting from dividends paid of $59.0 million and a net reduction in borrowings of $42.9 million. The net reduction in borrowings was comprised of $263.6 million in reductions resulting from exchange and conversion transactions related to the 3.875% Convertible Senior Subordinated Notes and the net reduction in our revolving credit facility of $186.0 million, partially offset by the issuance of the $400.0 million of our 4.875% Senior Notes due 2026 and increased borrowings against the securitization program of $6.7 million. Net cash used in financing activities was also impacted by a $9.2 million payment for our acquisition of the remaining 26% noncontrolling interest of Teleflex Medical Private Limited, our Indian affiliate, debt extinguishment, issuance and amendment fees, including transaction fees associated with the issuance of the 2026 Notes of $9.0 million and contingent consideration payments of $7.3 million. These cash outflows were partially offset by $9.1 million of net proceeds from share-based compensation plans and the related tax benefits, primarily related to stock option exercises.
Comparison of 2015 to 2014
Cash Flow from Operating Activities
Net cash provided by operating activities from continuing operations was $303.4 million during 2015 compared to $290.2 million during 2014. The $13.2 million increase is primarily due to improved operating results partially offset by an increase in contributions to pension plans of $3.3 million, an increase in income tax payments, net of refunds, of $3.2 million, an increase in payments associated with restructuring programs and other unfavorable working capital items.
The net cash outflow from the other working capital items is primarily the result of cash outflows for inventories and accounts payable and accrued expenses partially offset by a cash inflow for accounts receivable. The net cash outflow for the purchase of inventories was $8.4 million in 2015 as compared to a $15.5 million net cash outflow in 2014. The reduction in the cash outflow is primarily due to service level improvements and the consolidation of distribution facilities associated with restructuring initiatives as well as fewer inventory builds in support of distributor to direct conversions. The accounts payable and accrued expenses net cash outflow was $0.1 million in 2015 as compared to cash outflow of $9.8 million in 2014. The decrease in the cash outflow is primarily a result of the timing of vendor and employee related benefit payments as well as a $4.0 million decrease in interest payments year-over-year. The net cash inflow for accounts receivable was $0.4 million during 2015 as compared to a cash inflow of $9.4 million in 2014, which was primarily the result of increased collections in the EMEA region in 2014.
Cash Flow from Investing Activities
Net cash used in investing activities from continuing operations was $154.8 million during 2015, primarily due to net payments of $93.8 million for the businesses acquired in 2015, which included Nostix, LLC, a developer of catheter tip confirmation systems, Truphatek Holdings Limited and Atsina Surgical, LLC, a developer of surgical clips, among others, and capital expenditures of $61.4 million.
Cash Flow from Financing Activities
Net cash used in financing activities from continuing operations was $85.6 million during 2015, primarily resulting from repayments of outstanding debt totaling $303.8 million, including the redemption of the entire $250 million outstanding principal amount of the 2019 Notes and the repayment of $50 million and $3.5 million under our revolving credit facility and accounts receivable securitization facility, respectively. Additionally, we paid $56.5 million in dividends and $8.0 million in contingent consideration related to our acquisition of Mini-Lap. We also incurred $9.0 million of debt extinguishment, issuance and amendment fees, primarily as a result of a make whole payment in connection with the redemption of the 2019 Notes. These cash outflows were partially offset by $288.1 million of proceeds from borrowings, including $246.0 million of borrowings under our revolving credit facility and $42.1 million of borrowings under our accounts receivable securitization facility. In addition, we realized net cash inflows of $5.0 million from share-based compensation activity, which included proceeds from the exercise and vesting of share-based awards under our stock compensation plans and the related tax benefits, partially offset by tax withholdings that we remitted on behalf of
49
employees who have elected to have shares withheld by us to satisfy their minimum tax withholding obligations arising from the exercise and vesting of their share-based awards.
Financing Arrangements
The following table provides our net debt to total capital ratio:
2016 | 2015 | ||||||
(Dollars in millions) | |||||||
Net debt includes: | |||||||
Current borrowings | $ | 183.1 | $ | 417.4 | |||
Long-term borrowings | 850.3 | 641.8 | |||||
Unamortized debt discount | 2.7 | 23.0 | |||||
Unamortized debt issuance costs | 10.0 | 6.7 | |||||
Total debt | 1,046.1 | 1,088.9 | |||||
Less: Cash and cash equivalents | 543.8 | 338.4 | |||||
Net debt | 502.3 | 750.5 | |||||
Total capital includes: | |||||||
Net debt | 502.3 | 750.5 | |||||
Common shareholders’ equity | 2,137.5 | 2,009.3 | |||||
Total capital | $ | 2,639.8 | $ | 2,759.8 | |||
Percent of net debt to total capital | 19.0 | % | 27.2 | % | |||
Fixed rate debt comprised 75.1% and 59.7% of total debt at December 31, 2016 and 2015, respectively. The increase in fixed rate borrowings as of December 31, 2016 compared to the prior year is primarily due to the issuance of the 2026 Notes and the decrease in variable rate borrowings under our senior credit facility.
Former senior credit facility
At December 31, 2016, we had $210.0 million in borrowings outstanding and approximately $3.2 million in outstanding standby letters of credit under our $850 million revolving credit facility, which was made available to us under a senior credit agreement. This facility, which was replaced with an increased revolving credit facility under the amended and restated credit agreement described below, was used principally for working capital needs and, at certain times, to help fund acquisitions. See Note 8 to the consolidated financial statements included in this Annual Report on Form 10-K for additional information regarding our former senior credit facility.
Amended and restated senior credit facility
On January 20, 2017 (the “Effective Date”), we amended and restated our then-existing senior credit agreement by entering into an Amended and Restated Credit Agreement (“2017 Credit Agreement”). The 2017 Credit Agreement provides for a five-year revolving credit facility of $1.0 billion and a term loan facility of $750.0 million. The term loan facility and borrowings under the revolving credit facility were used to finance the acquisition of Vascular Solutions. The obligations under the 2017 Credit Agreement are guaranteed (subject to certain exceptions and limitations) by substantially all of our material domestic subsidiaries and are secured by a lien on substantially all of our and each guarantor's owned assets. The revolving credit facility and the term loan facility will mature on January 20, 2022 and February 17, 2022, respectively.
The 2017 Credit Agreement contains customary representations and warranties and covenants that, among other things and subject to certain exceptions, qualifications and thresholds, place limitations on our ability, and the ability of our subsidiaries, to incur additional indebtedness, create additional liens, enter into a merger, consolidation or amalgamation, dispose of certain assets, make certain investments or acquisitions, pay dividends on, repurchase or make distributions in respect of capital stock and enter into swap agreements. Additionally, the 2017 Credit Agreement contains financial covenants that require us to maintain a consolidated total leverage ratio (generally, the ratio of Consolidated Total Funded Indebtedness to Consolidated EBITDA, each as defined in the 2017 Credit Agreement) of not more than 4.50 to 1, a secured leverage ratio (generally, the ratio of Consolidated Senior Secured Funded Indebtedness to Consolidated EBITDA, each as defined in the 2017 Credit Agreement) of not
50
more than 3.50 to 1 and a consolidated interest coverage ratio (generally, the ratio of Consolidated EBITDA to Consolidated Interest Expense, each as defined in the 2017 Credit Agreement) of not less than 3.50 to 1, in each case, for the four consecutive fiscal quarters ending on or most recently ended prior to the determination date, and calculated in accordance with the definitions and methodologies set forth in the 2017 Credit Agreement.
See Note 19 to the consolidated financial statements included in this Annual Report on Form 10-K for additional information regarding this new credit facility.
2024 and 2026 Notes
As of December 31, 2016, the outstanding principal of the 2024 Notes and 2026 Notes were $250.0 million and $400.0 million, respectively. The indenture governing the 2024 and 2026 Notes contains covenants that, among other things, limit or restrict our ability, and the ability of our subsidiaries, to incur debt, create liens, consolidate, merge or dispose of certain assets, make certain investments, engage in acquisitions, and pay dividends on, repurchase or make distributions in respect of capital stock, subject to specified conditions. The obligations under the 2024 and 2026 Notes are fully and unconditionally guaranteed, jointly and severally, by each of our existing and future 100% owned domestic subsidiaries that are a guarantor or other obligor under our senior credit agreement and by certain of our other 100% owned domestic subsidiaries. As of December 31, 2016, we were in compliance with all of the terms of our 2024 and 2026 Notes.
Convertible notes
Our Convertible Notes are included in the dilutive earnings per share calculation using the treasury stock method. Under the treasury stock method, we must calculate the number of shares of common stock issuable under the terms of the Convertible Notes based on the average market price of our common stock during the applicable reporting period, and include that number in the total diluted shares figure for the period. At the time we issued the Convertible Notes, we entered into convertible note hedge and warrant agreements that together were designed to have the economic effect of reducing the net number of shares that will be issued upon conversion of the Convertible Notes by, in effect, increasing the conversion price of the Convertible Notes, from our economic standpoint, to $74.65. However, under accounting principles generally accepted in the United States of America ("GAAP”), since the impact of the convertible note hedge agreements is anti-dilutive, we exclude from the calculation of fully diluted shares the number of shares of our common stock that we would receive from the counterparties to these agreements upon settlement.
Under the treasury stock method, changes in the price per share of our common stock can have a significant impact on the number of shares that we must include in the fully diluted earnings per share calculation, although the impact of such potential changes has been substantially reduced as a result of our repurchase of $310.9 million principal amount of Convertible Notes in the Exchange Transactions and aggregate conversions totaling $44.8 million principal amount of Convertible Notes through February 13, 2017, as described below. The following table illustrates how, based on the $44.3 million aggregate principal amount of Convertible Notes outstanding as of February 13, 2017, changes in our stock price would affect (i) the number of shares issuable upon conversion of the Convertible Notes, (ii) the number of shares issuable upon exercise of the warrants subject to the warrant agreements, (iii) the number of additional shares deemed outstanding with respect to the Convertible Notes, after applying the treasury stock method, for purposes of calculating diluted earnings per share ("Total Treasury Stock Method Incremental Shares"), (iv) the number of shares of common stock deliverable to us upon settlement of the hedge agreements and (v) the number of shares issuable upon concurrent conversion of the Convertible Notes, exercise of the warrants and settlement of the convertible note hedge agreements:
51
Market Price Per Share | Shares Issuable Upon Conversion of Convertible Notes | Shares Issuable Upon Exercise of Warrants | Total Treasury Stock Method Incremental Shares(1) | Shares Deliverable to Teleflex upon Settlement of the Hedge Agreements | Incremental Shares Issuable upon Concurrent Conversion of Convertible Notes, Exercise of Warrants and Settlement of the Hedge Agreements | ||||||||||
(Shares in thousands) | |||||||||||||||
$70 | 90 | — | 90 | (90 | ) | — | |||||||||
$85 | 201 | 88 | 289 | (201 | ) | 88 | |||||||||
$100 | 280 | 184 | 464 | (280 | ) | 184 | |||||||||
$115 | 337 | 254 | 591 | (337 | ) | 254 | |||||||||
$130 | 382 | 309 | 691 | (382 | ) | 309 | |||||||||
$145 | 417 | 352 | 769 | (417 | ) | 352 | |||||||||
$160 | 446 | 387 | 833 | (446 | ) | 387 | |||||||||
$175 | 470 | 416 | 886 | (470 | ) | 416 | |||||||||
$190 | 490 | 440 | 930 | (490 | ) | 440 | |||||||||
$205 | 507 | 460 | 967 | (507 | ) | 460 | |||||||||
(1) | Represents the number of incremental shares that must be included in the calculation of fully diluted shares under GAAP. |
Our Convertible Notes are convertible under certain circumstances, including in any fiscal quarter following an immediately preceding fiscal quarter in which the last reported sales price of our common stock for at least 20 days during a period of 30 consecutive trading days ending on the last day of such preceding fiscal quarter exceeds 130% of the conversion price of the Convertible Notes (approximately $79.72). Since the fourth quarter of 2013 and in all subsequent periods through December 31, 2016, the last reported sale price of our common stock exceeded the established 130% threshold. Moreover, commencing on May 1, 2017 and through July 28, 2017, the Convertible Notes are convertible regardless of our stock price. The Convertible Notes will mature in August 2017. In April 2016 and January 2017, as described above in this "Liquidity and Capital Resources" section, we exchanged cash and common stock for $310.9 million aggregate outstanding principal amount of the Convertible Notes in the Exchange Transactions.
Accounts receivable securitization
We have an accounts receivable securitization facility under which we sell a security interest in domestic accounts receivable for consideration of up to $50.0 million to a commercial paper conduit. As of December 31, 2016, we borrowed the maximum amount available of $50.0 million under this facility. This facility is utilized to provide increased flexibility in funding short term working capital requirements. The agreement governing the accounts receivable securitization facility contains certain covenants and termination events. An occurrence of an event of default or a termination event under this facility may give rise to the right of our counterparty to terminate this facility. As of December 31, 2016, we were in compliance with the covenants and none of the termination events had occurred. As of December 31, 2015, we had $43.3 million of outstanding borrowings under our accounts receivable securitization facility.
For additional information regarding our indebtedness, see Note 8 to the consolidated financial statements included in this Annual Report on Form 10-K.
52
Contractual Obligations
Contractual obligations at December 31, 2016 are as follows:
Payments due by period | |||||||||||||||||||
Total | Less than 1 year | 1-3 years | 3-5 years | More than 5 years | |||||||||||||||
(Dollars in thousands) | |||||||||||||||||||
Total borrowings | $ | 1,046,076 | $ | 186,076 | $ | 210,000 | $ | — | $ | 650,000 | |||||||||
Interest obligations(1) | 298,698 | 46,345 | 68,712 | 65,250 | 118,391 | ||||||||||||||
Operating lease obligations | 140,988 | 29,546 | 43,573 | 31,205 | 36,664 | ||||||||||||||
Purchase and other obligations(2) | 109,314 | 107,013 | 2,196 | 105 | — | ||||||||||||||
Pension and other postretirement benefits | 43,576 | 4,048 | 8,062 | 8,448 | 23,018 | ||||||||||||||
Total contractual obligations | $ | 1,638,652 | $ | 373,028 | $ | 332,543 | $ | 105,008 | $ | 828,073 | |||||||||
(1) | Interest payments on floating rate debt are based on the interest rate in effect on December 31, 2016. |
(2) Purchase and other obligations are defined as an unconditional commitment to purchase goods or services that are legally binding and that specifies all significant terms, including: quantities to be purchased; price provisions; and the approximate timing of the transaction. The amounts include commitments for inventory purchases and capital expenditures that do not exceed our projected requirements in the normal course of business, penalties due upon cancellation of cancellable agreements, and excludes operating lease obligations. The table was amended in 2016 to include purchases orders open at December 31, 2016.
We recorded a noncurrent liability for uncertain tax positions of $17.5 million and $40.4 million as of December 31, 2016 and 2015, respectively. Due to uncertainties regarding the ultimate resolution of ongoing or future tax examinations, we are not able to reasonably estimate the amount of any income tax payments that will be required to settle uncertain income tax positions or the periods in which any such payments will be made and as a result, these amounts are excluded from the contractual obligations table above.
We recorded contingent consideration liabilities of $7.1 million and $20.8 million as of December 31, 2016 and 2015, respectively, of which, $0.6 million and $7.3 million as of December 31, 2016 and 2015, respectively, were recorded as the current portion of contingent consideration. Due to uncertainty regarding the timing and amount of future payments related to these liabilities, these amounts are excluded from the contractual obligations table above.
See Notes 10, 13 and 14 to the consolidated financial statements included in this Annual Report on Form 10-K for additional information.
Critical Accounting Policies and Estimates
The preparation of consolidated financial statements in conformity with GAAP requires management to make estimates and assumptions that affect the reported amounts of assets and liabilities and disclosure of contingent assets and liabilities at the date of the financial statements and the reported amounts of revenues and expenses during the reporting period. Actual results could differ materially from the amounts derived from those estimates and assumptions.
We have identified the following as critical accounting estimates, which are defined as those that are reflective of significant judgments and uncertainties, are the most pervasive and important to the presentation of our financial condition and results of operations and could potentially result in materially different results under different assumptions and conditions. The following discussion should be considered in conjunction with the description of our accounting policies in Note 1 to the consolidated financial statements in this Annual Report on Form 10-K.
Accounting for Allowance for Doubtful Accounts
In the ordinary course of business, we grant non-interest bearing trade credit to our customers on normal credit terms. In an effort to reduce our credit risk, we (i) establish credit limits for all of our customer relationships, (ii) perform ongoing credit evaluations of our customers’ financial condition, (iii) monitor the payment history and aging of our customers’ receivables, and (iv) monitor open orders against an individual customer’s outstanding receivable balance.
An allowance for doubtful accounts is maintained for trade accounts receivable based on the Company's historical collection experience and expected collectability of accounts receivable, considering the length of time an account is outstanding, the financial position of the customer and information provided by credit rating services. The adequacy
53
of this allowance is reviewed each reporting period and adjusted as necessary. Our allowance for doubtful accounts was $8.6 million and $8.0 million at December 31, 2016 and 2015, respectively, which constituted 3.0% and 2.9% of gross trade accounts receivable at December 31, 2016 and 2015, respectively.
In light of the volatility in global economic markets in recent years, we have measures in place within countries where we have collectability concerns to facilitate customer-by-customer risk assessment when estimating the allowance for doubtful accounts. Such measures include monthly credit control committee meetings, at which customer credit risks are identified after review of, among other things, accounts that exceed specified credit limits, payment delinquencies and other customer issues. In addition, with respect to certain of our non-government customers, we have instituted measures designed to reduce our risk exposures, including reducing credit limits and requiring that payments accompany orders. With respect to government customers, we evaluate receivables for potential collection risks associated with any limitations on the availability of government funding and reimbursement practices. Some of our customers, particularly in Greece, Italy, Spain and Portugal, have extended or delayed payments for products and services already provided resulting in collectability concerns regarding our accounts receivable from these customers. If the financial condition of these customers or the healthcare systems in these countries deteriorate to the extent that the ability of an increasing number of customers to make payments is uncertain, additional allowances may be required in future periods.
Although we maintain allowances for doubtful accounts to cover the estimated losses which may occur when customers cannot make their required payments, we cannot be assured that we will continue to experience the same loss rate in the future given the volatility in the worldwide economy. If our allowance for doubtful accounts is insufficient to address receivables we ultimately determine are uncollectible, we would be required to incur additional charges, which could materially adversely affect our results of operations. Moreover, our inability to collect outstanding receivables could adversely affect our financial condition and cash flow from operations.
Distributor Rebates
We offer rebates to certain distributors and record a reserve with respect to the estimated amount of the rebates as a reduction of revenues at the time of sale. In estimating rebates, we consider the lag time between the point of sale and the payment of the distributor’s rebate claim, distributor-specific trend analyses, contractual commitments, including stated rebate rates, historical experience and other relevant information. When necessary, we adjust the reserves, with a corresponding adjustment to revenue, to reflect differences between estimated and actual experience. Historical adjustments to recorded reserves have not been significant and we do not expect significant revisions of these estimates in the future. The reserve for estimated rebates was $11.6 million and $11.1 million at December 31, 2016 and 2015, respectively. We expect amounts subject to the reserve as of December 31, 2016 to be paid within 90 days subsequent to year-end.
Inventory Utilization
Inventories are valued at the lower of cost or market. We maintain a reserve for excess and obsolete inventory that reduces the carrying value of our inventories to reflect the diminution of value resulting from product obsolescence, damage or other issues affecting marketability by an amount equal to the difference between the cost of the inventory and its estimated market value. Factors utilized in the determination of estimated market value include (i) current sales data and historical return rates, (ii) estimates of future demand, (iii) competitive pricing pressures, (iv) new product introductions, (v) product expiration dates, and (vi) component and packaging obsolescence.
The adequacy of this reserve is reviewed each reporting period and adjusted as necessary. We regularly compare inventory quantities on hand against historical usage or forecasts related to specific items in order to evaluate obsolescence and excessive quantities. In assessing historical usage, we also qualitatively assess business trends to evaluate the reasonableness of using historical information in estimating future usage.
Our inventory reserve was $36.4 million and $36.5 million at December 31, 2016 and 2015, respectively, which represents 10.3% and 10.0% of gross inventories at those respective dates.
Accounting for Long-Lived Assets
We assess the remaining useful life and recoverability of long-lived assets whenever events or circumstances indicate the carrying value of an asset may not be recoverable. For example, such an assessment may be initiated if, as a result of a change in expectations, we believe it is more likely than not that the asset will be sold or disposed of
54
significantly before the end of its useful life or if an adverse change occurs in the business employing the asset. Significant judgments in this area involve determining whether such events or circumstances have occurred and determining the appropriate asset group requiring evaluation. The recoverability evaluation is based on various analyses, including undiscounted cash flow projections, which involve significant management judgment. Any impairment loss, if indicated, equals the amount by which the carrying amount of the asset exceeds the estimated fair value of the asset.
Accounting for Goodwill and Other Intangible Assets
Intangible assets include indefinite-lived assets (such as goodwill, certain trade names and in-process research and development ("IPR&D")), as well as finite-lived intangibles (such as trade names that do not have indefinite lives, customer relationships, intellectual property and distribution rights). The costs of finite-lived intangibles are amortized to expense over their estimated life. Determining the useful life of an intangible asset requires considerable judgment as different types of intangible assets typically will have different useful lives. Goodwill and other indefinite-lived intangible assets, primarily certain trade names, are not amortized; we test these assets annually for impairment during the fourth quarter, using the first day of the quarter as the measurement date, or earlier upon the occurrence of certain events or substantive changes in circumstances that indicate an impairment may have occurred. Such conditions may include an economic downturn in a geographic market or a change in the assessment of future operations. Our impairment testing for goodwill is performed separately from our impairment testing of indefinite-lived intangibles.
Considerable management judgment is necessary in making the assumptions used in the impairment analysis including evaluating the impact of operating and macroeconomic changes and estimating future cash flows, which are key elements in determining fair value. Assumptions used in our impairment evaluations, such as forecasted growth rates and cost of capital, are consistent with internal projections and operating plans. We believe such assumptions and estimates are also comparable to those that would be used by other marketplace participants.
Goodwill
Goodwill impairment assessments are performed at a reporting unit level. For purposes of this assessment, a reporting unit is an operating segment, or a business one level below that operating segment. We have a total of ten reporting units, nine of which have goodwill. In applying the goodwill impairment test, we may assess qualitative factors to determine whether it is more likely than not that the fair value of a reporting unit is less than its carrying value. Qualitative factors may include, but are not limited to, macroeconomic conditions, industry conditions, the competitive environment, changes in the market for our products and services, regulatory and political developments, and entity specific factors such as strategies and financial performance. If, after completing the qualitative assessment, we determine it is more likely than not that the fair value of a reporting unit is less than its carrying value, we proceed to a two-step quantitative impairment test, described below. Alternatively, we may proceed directly to testing goodwill for impairment through the two-step quantitative impairment test without conducting the qualitative analysis. In the fourth quarter 2016, we performed a qualitative assessment on six of our reporting units and determined that the fair value of each reporting unit was more likely than not higher than its carrying value and, therefore, concluded that goodwill was not impaired. For the three remaining reporting units whose assets included goodwill, we elected to forgo the qualitative assessment and perform the two-step quantitative impairment test.
The first step of the two-step impairment test is to compare the fair value of a reporting unit to the carrying value. In performing the first step, we calculate the fair value of the reporting unit using equal weighting of two methods; one which estimates the discounted cash flows of the reporting unit based on projected earnings in the future (the Income Approach) and one which is based on sales of similar businesses to those of the reporting unit in actual transactions (the Market Approach). If the fair value of the reporting unit exceeds the carrying value, there is no impairment. If the reporting unit carrying value exceeds the fair value, we recognize an impairment loss based on the amount by which the carrying value of goodwill exceeds its implied fair value, which we determine in the second step of the two-step test. The implied fair value of goodwill is determined by deducting the fair value of a reporting unit's identifiable assets and liabilities from the fair value of the reporting unit as a whole, as if that reporting unit had just been acquired and the fair value of the individual assets acquired and liabilities assumed were being determined initially.
Determining fair value requires the exercise of significant judgment. The more significant judgments and assumptions used in the Income Approach include (1) the amount and timing of expected future cash flows, which are based primarily on our estimates of future sales, operating income, industry trends and the regulatory environment of the individual reporting units, (2) the expected long-term growth rates for each of our reporting units, which approximate the expected long-term growth rate of the global economy and of the medical device industry, and (3) discount rates
55
that are used to discount future cash flows to their present values, which are based on an assessment of the risk inherent in the future cash flows of the respective reporting units along with various market based inputs. The more significant judgments and assumptions used in the Market Approach include (1) determination of appropriate revenue and EBITDA multiples used to estimate a reporting unit’s fair value and (2) the selection of appropriate comparable companies to be used for purposes of determining those multiples. There were no changes to the underlying methods used in 2016 as compared to the valuations of our reporting units in 2015. The discount rate was 10.0% for all reporting units. A perpetual growth rate of 2.5% was assumed for all reporting units.
Our expected future growth rates estimated for purposes of the goodwill impairment test are based on our estimates of future sales, operating income and cash flow and are consistent with our internal budgets and business plans, which reflect a modest amount of core revenue growth coupled with the successful launch of new products each year; the effect of these growth indicators more than offset volume losses from products that are expected to reach the end of their life cycle. Changes in assumptions underlying the Income Approach could cause a reporting unit's carrying value to exceed its fair value. While we believe the assumed growth rates of sales and cash flows are reasonable, the possibility remains that the revenue growth of a reporting unit may not be as high as expected, and, as a result, the estimated fair value of that reporting unit may decline. In this regard, if our strategy and new products are not successful and we do not achieve anticipated core revenue growth in the future with respect to a reporting unit, the goodwill in the reporting unit may become impaired and, in such case, we may incur material impairment charges. Moreover, changes in revenue and EBITDA multiples in actual transactions from those historically present could result in an assessment that a reporting unit’s carrying value exceeds its fair value, in which case we also may incur material impairment charges.
No impairment was recorded as a result of the annual goodwill impairment testing performed during the fourth quarter 2016.
Other Intangible Assets
Intangible assets are assets acquired that lack physical substance and that meet the specified criteria for recognition apart from goodwill. Management tests indefinite-lived intangible assets for impairment annually, and more frequently if events or changes in circumstances indicate that an impairment may have occurred. Similar to the goodwill impairment test process, we may assess qualitative factors to determine whether it is more likely than not that the fair value of an indefinite-lived intangible asset is less than its carrying value. If, after completing the qualitative assessment, we determine it is more likely than not that the fair value of the indefinite-lived intangible asset is greater than its carrying amount, the asset is not impaired. If we conclude it is more likely than not that the fair value of the indefinite-lived intangible asset is less than the carrying value, we then proceed to a quantitative impairment test, which consists of a comparison of the fair value of the intangible asset to its carrying amount. Alternatively, we may elect to forgo the qualitative analysis and proceed directly to testing the indefinite-lived intangible asset for impairment through the quantitative impairment test. In the fourth quarter 2016, we performed a qualitative assessment on one of our indefinite lived assets and determined that its fair value was more likely than not higher than its carrying value. For the remaining four indefinite-lived intangible assets, we elected to test impairment through the quantitative method.
In connection with the quantitative impairment test, since quoted market prices are seldom available for intangible assets, we utilize several present value techniques to estimate fair value. The fair value of trade names and IPR&D is estimated by the use of a relief from royalty method, a form of income approach that values an intangible asset by estimating the royalties saved through the ownership of an asset. Under this method, an owner of an intangible asset determines the arm’s length royalty that likely would have been charged if the owner had to license the asset from a third party. The value of the hypothetical royalty, which is based on the estimated royalty rate applied against forecasted sales, is tax-effected and discounted to present value using a discount rate commensurate with the relative risk of achieving the cash flow attributable to the asset. Management must estimate the volume of sales, hypothetical royalty rate, discount rate, and terminal growth rate to estimate the hypothetical royalty associated with the asset.
Discount rates and perpetual growth rates utilized in the impairment test of the trade names during the fourth quarter 2016 are comparable to the rates utilized in the impairment test of goodwill and we assumed a royalty rate of 4%. Discount rate assumptions are based on an assessment of the risk inherent in the future cash flows generated from the intangible asset. Assumptions about royalty rates are based on the rates at which similar trade names are being licensed in the marketplace.
No impairment was recorded as a result of the annual trade name impairment testing performed during the fourth quarter 2016. For the year ended December 31, 2016, we recognized a pre-tax IPR&D impairment charge of $41.0
56
million. See "Restructuring and other impairment charges" within the "Result of Operations" above as well as Note 4 to the consolidated financial statements included in this Annual Report on Form 10-K for additional information on this charge.
Accounting for Pensions and Other Postretirement Benefits
We provide a range of benefits to eligible employees and retired employees, including under plans that provide pension and postretirement healthcare benefits. Several statistical and other factors that are designed to project future events are used in calculating the expense and liability related to these plans. These factors include actuarial assumptions about discount rates, expected rates of return on plan assets, compensation increases, turnover rates and healthcare cost trend rates. We review the actuarial assumptions on an annual basis and make modifications to the assumptions based on current rates and trends when appropriate.
Significant differences in our actual experience or significant changes in our assumptions may materially affect our pension and other postretirement obligations and our future expense. The following table shows the sensitivity of plan expenses and benefit obligations to changes in the weighted average assumptions:
Assumed Discount Rate | Expected Return on Plan Assets | Assumed Healthcare Trend Rate | |||||||||||||||||
50 Basis Point Increase | 50 Basis Point Decrease | 50 Basis Point Change | 1.0% Increase | 1.0% Decrease | |||||||||||||||
(Dollars in millions) | |||||||||||||||||||
Net periodic pension and postretirement healthcare expense | $ | (0.2 | ) | $ | 0.2 | $ | 1.5 | $ | 0.2 | $ | (0.2 | ) | |||||||
Projected benefit obligation | $ | (28.0 | ) | $ | 30.9 | N/A | $ | 3.4 | $ | (3.0 | ) | ||||||||
For additional information on assumptions pertaining to pension and other postretirement benefit plans, refer to Note 14 to the consolidated financial statements included in this Annual Report on Form 10-K.
Share-based Compensation
We estimate the fair value of share-based awards on the date of grant using an option pricing model. The value of the portion of the award that is ultimately expected to vest is recognized as expense over the requisite service periods. Share-based compensation expense related to stock options is measured using a Black-Scholes option pricing model that takes into account subjective and complex assumptions with respect to expected life of options, volatility, risk-free interest rate and expected dividend yield. The expected life of options granted represents the period of time that options are expected to be outstanding, which is derived from the vesting period of the award, as well as historical exercise behavior. Expected volatility is based on a blend of historical volatility and implied volatility derived from publicly traded options to purchase our common stock, which we believe is more reflective of market conditions and a better indicator of expected volatility than solely using historical volatility. The risk-free interest rate is the implied yield currently available on United States Treasury zero-coupon issues with a remaining term equal to the expected life of the option. Share based compensation expense for 2016, 2015 and 2014 was $16.9 million, $14.5 million and $12.2 million, respectively.
Accounting for Contingent Consideration Liabilities
In connection with an acquisition, we may be required to pay future consideration that is contingent upon the achievement of specified objectives, such as receipt of regulatory approval, commercialization of a product or achievement of sales targets. As of the acquisition date, we record a contingent liability representing the estimated fair value of the contingent consideration we expect to pay. The fair value of the contingent consideration liability at December 31, 2016 is calculated based on a discounted cash flow analysis using significant inputs not observable in the market and thus represents a Level 3 measurement. We remeasure this liability each reporting period and recognize the change in the liability's fair value in selling, general and administrative expenses in our consolidated statement of income. An increase or decrease in the fair value can result from changes in the estimated sales royalties and the discount rate. As of December 31, 2016 and 2015, we accrued $7.1 million and $20.8 million of contingent consideration, respectively. For the years ended December 31, 2016, 2015 and 2014 we recorded reductions to contingent consideration of $8.3 million, $4.4 million and $8.2 million, respectively, resulting from changes in estimated probabilities associated with certain regulatory and sales milestones.
57
Accounting for Income Taxes
Our annual provision for income taxes and determination of the deferred tax assets and liabilities require management to assess uncertainties, make judgments regarding outcomes and utilize estimates. We conduct a broad range of operations around the world, subjecting us to complex tax regulations in numerous international jurisdictions, resulting at times in tax audits, disputes with tax authorities and potential litigation, the outcome of which is uncertain. In connection with its estimates of our tax assets and liabilities, management must, among other things, make judgments about the outcome of these uncertain matters. Deferred tax assets and liabilities are measured and recorded using currently enacted tax rates, which we expect will apply to taxable income in the years in which differences between the financial statement carrying amounts of existing assets and liabilities and their tax bases are recovered or settled. The likelihood of a material change in our expected realization of these assets is dependent on future taxable income, our ability to use foreign tax credit carryforwards and carrybacks, final United States and foreign tax settlements, changes in tax law, and the effectiveness of our tax planning strategies in the various relevant jurisdictions. While management believes that its judgments and interpretations regarding income taxes are appropriate, significant differences in actual experience may require future adjustments to our tax assets and liabilities, which could be material.
In assessing the realizability of our deferred tax assets, we evaluate all positive and negative evidence and use judgments regarding past and future events, including results of operations and available tax planning strategies that could be implemented to realize the deferred tax assets. Based on this assessment, we determine when it is more likely than not that all or some portion of our deferred tax assets may not be realized, in which case we apply a valuation allowance to offset the amount of such deferred tax assets. To the extent facts and circumstances change in the future, adjustments to the valuation allowances may be required.
The valuation allowance for deferred tax assets of $104.5 million and $103.5 million at December 31, 2016 and 2015, respectively, relates principally to the uncertainty of the utilization of tax loss and credit carryforwards in various jurisdictions.
Significant judgment is required in determining income tax provisions and in evaluating tax positions. We establish additional provisions for income taxes when, despite the belief that tax positions are supportable, there remain certain positions that do not meet the minimum probability threshold, which is a tax position that is more likely than not to be sustained upon examination by the applicable taxing authority. In the normal course of business, we are examined by various federal, state and foreign tax authorities. We regularly assess the potential outcomes of these examinations and any future examinations for the current or prior years in determining the adequacy of our provision for income taxes. We adjust the income tax provision, the current tax liability and deferred taxes in any period in which we become aware of facts that necessitate an adjustment. We are currently under examination by the Canadian tax authorities with respect to our income tax returns for various tax years. The ultimate outcome of the examination could result in increases or decreases to our recorded tax liabilities, which would affect our financial results.
See Note 13 to the consolidated financial statements in this Annual Report on Form 10-K for additional information regarding our uncertain tax positions.
New Accounting Standards
See Note 2 to the consolidated financial statements included in this Annual Report on Form 10-K for a discussion of recently issued accounting standards, including estimated effects, if any, of the adoption of those standards on our consolidated financial statements.
ITEM 7A. QUANTITATIVE AND QUALITATIVE DISCLOSURES ABOUT MARKET RISK
Market Risk
We are exposed to certain financial risks, specifically fluctuations in market interest rates, foreign currency exchange rates and, to a lesser extent, commodity prices. We use derivative financial instruments to manage or reduce the impact of some of these risks. We do not enter into derivative instruments for trading purposes. We are also exposed to changes in the market traded price of our common stock as it influences the valuation of stock options and their effect on earnings.
Interest Rate Risk
We are exposed to changes in interest rates as a result of our borrowing activities and our cash balances. The table below provides information regarding the interest rates by year of maturity for our fixed and variable rate debt
58
obligations. Variable interest rates on December 31, 2016 were determined using a base rate of the one-month LIBOR rate plus the applicable spread.
Year of Maturity | |||||||||||||||||||||||||||
2017 | 2018 | 2019 | 2020 | 2021 | Thereafter | Total | |||||||||||||||||||||
(Dollars in thousands) | |||||||||||||||||||||||||||
Fixed rate debt | $ | 136,076 | $ | — | $ | — | $ | — | $ | — | $ | 650,000 | $ | 786,076 | |||||||||||||
Average interest rate | 3.875 | % | — | % | — | % | — | % | — | % | 5.019 | % | 4.821 | % | |||||||||||||
Variable rate debt | $ | 50,000 | $ | 210,000 | $ | — | $ | — | $ | — | $ | — | $ | 260,000 | |||||||||||||
Average interest rate | 1.522 | % | 2.270 | % | — | % | — | % | — | % | — | % | 2.126 | % | |||||||||||||
A change of 1.0% in variable interest rates would increase or decrease annual interest expense by approximately $1.6 million based on our outstanding debt as of December 31, 2016.
Foreign Currency Risk
We are exposed to currency fluctuations in connection with transactions, as well as monetary assets and liabilities, denominated in currencies other than the functional currencies of certain subsidiaries. We enter into forward contracts with several major financial institutions to hedge the risk associated with these exposures; these contracts generally involve the purchase or sale, at designated future dates, of specified amounts of a foreign currency while simultaneously committing to an opposite way sale or purchase of a specified amount of U.S. dollars or euros, based on the exchange rate at the time of entry into the contract. The contracts we enter into to hedge transactions denominated in non-functional currencies are designated as cash flow hedges. The contracts to hedge monetary asset and liabilities denominated in non-functional currencies are not designated as cash flow, fair value or net investment hedges. See Note 9 to the consolidated financial statements included in this Annual Report on Form 10-K for information regarding the accounting treatment of designated and non-designated hedge contracts.
The following table provides information regarding our open foreign currency forward contracts at December 31, 2016, which mature during 2017. As of December 31, 2016, the total notional amount for the designated and non-designated contracts, expressed in U.S. dollars, is $101.8 million and $73.4 million, respectively. As of December 31, 2015, the total notional amount for the designated and non-designated contracts, expressed in U.S. dollars, is $49.5 million and $69.1 million, respectively. Forward contract notional amounts presented below are expressed in the stated currencies.
Forward Currency Contracts:
Buy/(Sell) | ||||
(in thousands) | ||||
Designated | Non-designated | |||
Australian dollar | (8,341 | ) | 4,240 | |
British pound | (4,300 | ) | (5,115 | ) |
Canadian dollar | (8,496 | ) | (7,793 | ) |
Chinese renminbi | (96,770 | ) | (85,679 | ) |
Czech koruna | 305,880 | 83,751 | ||
Euro | 5,461 | 48,738 | ||
Japanese yen | (785,010 | ) | (1,538,166 | ) |
Korean won | (3,581,250 | ) | (2,595,892 | ) |
Malaysian ringgit | 66,440 | 9,525 | ||
Mexican peso | 354,640 | 78,786 | ||
Singapore dollar | 7,945 | — | ||
South African rand | (40,750 | ) | (37,236 | ) |
Swiss franc | (3,410 | ) | — | |
United States dollar | (9,091 | ) | (14,859 | ) |
59
ITEM 8. | FINANCIAL STATEMENTS AND SUPPLEMENTARY DATA |
The financial statements and supplementary data required by this Item are included herein, commencing on page F-1.
ITEM 9. | CHANGES IN AND DISAGREEMENTS WITH ACCOUNTANTS ON ACCOUNTING AND FINANCIAL DISCLOSURE |
None.
ITEM 9A. | CONTROLS AND PROCEDURES |
(a) Evaluation of Disclosure Controls and Procedures
Our management, with the participation of our Chief Executive Officer and Chief Financial Officer, evaluated the effectiveness of our disclosure controls and procedures as of the end of the period covered by this report. Based on that evaluation, the Chief Executive Officer and Chief Financial Officer concluded that our disclosure controls and procedures as of the end of the period covered by this report are functioning effectively to provide reasonable assurance that the information required to be disclosed by us in reports filed under the Securities Exchange Act of 1934 is (i) recorded, processed, summarized and reported within the time periods specified in the SEC’s rules and forms and (ii) accumulated and communicated to our management, including the Chief Executive Officer and Chief Financial Officer, as appropriate to allow timely decisions regarding disclosure. A controls system cannot provide absolute assurance, however, that the objectives of the controls system are met, and no evaluation of controls can provide absolute assurance that all control issues and instances of fraud, if any, within a company have been detected.
(b) Management’s Report on Internal Control Over Financial Reporting
Our management’s report on internal control over financial reporting is set forth on page F-2 of this Annual Report on Form 10-K and is incorporated by reference herein.
(c) Change in Internal Control over Financial Reporting
No change in our internal control over financial reporting occurred during our most recent fiscal quarter that has materially affected, or is reasonably likely to materially affect, our internal control over financial reporting.
ITEM 9B. | OTHER INFORMATION |
None.
60
PART III
ITEM 10. | DIRECTORS, EXECUTIVE OFFICERS AND CORPORATE GOVERNANCE |
For the information required by this Item 10, other than information with respect to our Executive Officers contained at the end of Part I, Item 1 of this report, see “Election Of Directors,” “Nominees for Election to the Board of Directors,” “Corporate Governance” and “Section 16(a) Beneficial Ownership Reporting Compliance,” in the Proxy Statement for our 2017 Annual Meeting, which information is incorporated herein by reference. The Proxy Statement for our 2017 Annual Meeting will be filed within 120 days after the end of the fiscal year covered by this Annual Report on Form 10-K.
For the information required by this Item 10 with respect to our Executive Officers, see Part I, Item 1. of this report.
ITEM 11. | EXECUTIVE COMPENSATION |
For the information required by this Item 11, see “Compensation Discussion and Analysis,” “Compensation Committee Report,” and “Executive Compensation” in the Proxy Statement for our 2017 Annual Meeting, which information is incorporated herein by reference.
ITEM 12. | SECURITY OWNERSHIP OF CERTAIN BENEFICIAL OWNERS AND MANAGEMENT AND RELATED STOCKHOLDER MATTERS |
For the information required by this Item 12 with respect to beneficial ownership of our common stock, see “Security Ownership of Certain Beneficial Owners and Management” in the Proxy Statement for our 2017 Annual Meeting, which information is incorporated herein by reference.
The following table sets forth certain information as of December 31, 2016 regarding our equity plans :
Plan Category | Number of Securities to be Issued Upon Exercise of Outstanding Options, Warrants and Rights | Weighted-Average Exercise Price of Outstanding Options, Warrants and Rights | Number of Securities Remaining Available for Future Issuance Under Equity Compensation Plans (Excluding Securities Reflected in Column (A)) | |||
(A) | (B) | (C) | ||||
Equity compensation plans approved by security holders | 1,607,745 | $99.51 | 3,999,156 | |||
ITEM 13. | CERTAIN RELATIONSHIPS AND RELATED TRANSACTIONS, AND DIRECTOR INDEPENDENCE |
For the information required by this Item 13, see “Certain Transactions” and “Corporate Governance” in the Proxy Statement for our 2017 Annual Meeting, which information is incorporated herein by reference.
ITEM 14. | PRINCIPAL ACCOUNTING FEES AND SERVICES |
For the information required by this Item 14, see “Audit and Non-Audit Fees” and “Audit Committee Pre-Approval Procedures” in the Proxy Statement for our 2017 Annual Meeting, which information is incorporated herein by reference.
61
PART IV
ITEM 15. | EXHIBITS, FINANCIAL STATEMENT SCHEDULES |
(a) | Consolidated Financial Statements: |
The Index to Consolidated Financial Statements and Schedule is set forth on page F-1 of this Annual Report on Form 10-K.
(b) | Exhibits: |
The Exhibits are listed in the Index to Exhibits.
ITEM 16. | FORM 10-K SUMMARY |
Registrants may voluntarily include a summary of information required by Form 10-K under this Item 16. We have elected not to include such summary information.
62
SIGNATURES
Pursuant to the requirements of Section 13 or 15(d) of the Securities Exchange Act of 1934, the registrant has duly caused this Annual Report to be signed on its behalf by the undersigned, thereunto duly authorized as of the date indicated below.
TELEFLEX INCORPORATED | |||
By: | /s/ Benson F. Smith | ||
Benson F. Smith | |||
Chairman and Chief Executive Officer (Principal Executive Officer) | |||
Pursuant to the requirements of the Securities Exchange Act of 1934, this report has been signed below by the following persons on behalf of the registrant and in the capacities and as of the date indicated below.
By: | /s/ Thomas E. Powell | ||
Thomas E. Powell | |||
Executive Vice President and Chief Financial Officer | |||
(Principal Financial and Accounting Officer) | |||
By: | /s/ George Babich, Jr. | By: | /s/ Jeffrey A. Graves | |||
George Babich, Jr. Director | Jeffrey A. Graves Director | |||||
By: | /s/ Patricia C. Barron | By: | /s/ Gretchen R. Haggerty | |||
Patricia C. Barron Director | Gretchen Haggerty Director | |||||
By: | /s/ William R. Cook | By: | /s/ Dr. Stephen K. Klasko | |||
William R. Cook Director | Dr. Stephen K. Klasko Director | |||||
By: | /s/ Candace H. Duncan | By: | /s/ Stuart A. Randle | |||
Candace H. Duncan Director | Stuart A. Randle Director | |||||
By: | /s/ W. Kim Foster | By: | /s/ Benson F. Smith | |||
W. Kim Foster Director | Benson F. Smith Chairman, Chief Executive Officer & Director (Principal Executive Officer) | |||||
Dated: February 23, 2017
63
TELEFLEX INCORPORATED
INDEX TO CONSOLIDATED FINANCIAL STATEMENTS
Page | |
Management's Report on Internal Control Over Financial Reporting | F-2 |
Report of Independent Registered Public Accounting Firm | F-3 |
Consolidated Statements of Income for 2016, 2015 and 2014 | F-4 |
Consolidated Statements of Comprehensive Income for 2016, 2015 and 2014 | F-5 |
Consolidated Balance Sheets as of December 31, 2016 and December 31, 2015 | F-6 |
Consolidated Statements of Cash Flows for 2016, 2015 and 2014 | F-7 |
Consolidated Statements of Changes in Equity for 2016, 2015 and 2014 | F-8 |
Notes to Consolidated Financial Statements | F-9 |
Quarterly Data | 62 |
FINANCIAL STATEMENT SCHEDULE
Page | |
Schedule II Valuation and qualifying accounts | 63 |
F-1
MANAGEMENT’S REPORT ON INTERNAL CONTROL OVER FINANCIAL REPORTING
The management of Teleflex Incorporated and its subsidiaries (the “Company”) is responsible for establishing and maintaining adequate internal control over financial reporting. Internal control over financial reporting is a process designed by, or under the supervision of our Chief Executive Officer and Chief Financial Officer and effected by the Company's board of directors, management and other personnel, to provide reasonable assurance regarding the reliability of financial reporting and the preparation of financial statements for external purposes in accordance with generally accepted accounting principles. A company’s internal control over financial reporting includes those policies and procedures that pertain to the maintenance of records that, in reasonable detail, accurately and fairly reflect the transactions and dispositions of the assets of the company; provide reasonable assurance that transactions are recorded as necessary to permit preparation of financial statements in accordance with generally accepted accounting principles, and that receipts and expenditures of the company are being made only in accordance with authorizations of management and directors of the company; and provide reasonable assurance regarding prevention or timely detection of unauthorized acquisition, use, or disposition of the company’s assets that could have a material effect on the financial statements.
Because of its inherent limitations, internal control over financial reporting may not prevent or detect misstatements. Also, projections of any evaluation of effectiveness to future periods are subject to the risk that controls may become inadequate because of changes in conditions, or that the degree of compliance with the policies or procedures may deteriorate.
Management assessed the effectiveness of the Company’s internal control over financial reporting as of December 31, 2016. In making this assessment, management used the framework established in Internal Control — Integrated Framework (2013) issued by the Committee of Sponsoring Organizations of the Treadway Commission (COSO). As a result of this assessment and based on the criteria in the COSO framework, management has concluded that, as of December 31, 2016, the Company’s internal control over financial reporting was effective.
The effectiveness of the Company’s internal control over financial reporting as of December 31, 2016 has been audited by PricewaterhouseCoopers LLP, an independent registered public accounting firm, as stated in their report which appears herein.
/s/ Benson F. Smith | /s/ Thomas E. Powell | |
Benson F. Smith Chairman and Chief Executive Officer | Thomas E. Powell Executive Vice President and Chief Financial Officer | |
February 23, 2017
F-2
REPORT OF INDEPENDENT REGISTERED PUBLIC ACCOUNTING FIRM
To the Board of Directors and Shareholders of Teleflex Incorporated:
In our opinion, the consolidated financial statements listed in the accompanying index appearing on page F-1 present fairly, in all material respects, the financial position of Teleflex Incorporated at December 31, 2016 and 2015, and the results of their operations and their cash flows for each of the three years in the period ended December 31, 2016 in conformity with accounting principles generally accepted in the United States of America. In addition, in our opinion, the financial statement schedule listed in the accompanying index appearing on page F-1 presents fairly, in all material respects, the information set forth therein when read in conjunction with the related consolidated financial statements. Also in our opinion, the Company maintained, in all material respects, effective internal control over financial reporting as of December 31, 2016, based on criteria established in Internal Control — Integrated Framework (2013) issued by the Committee of Sponsoring Organizations of the Treadway Commission (COSO). The Company’s management is responsible for these financial statements and financial statement schedule, for maintaining effective internal control over financial reporting and for its assessment of the effectiveness of internal control over financial reporting, included in “Management’s Report on Internal Control over Financial Reporting” appearing on page F-2. Our responsibility is to express opinions on these financial statements, on the financial statement schedule, and on the Company’s internal control over financial reporting based on our integrated audits. We conducted our audits in accordance with the standards of the Public Company Accounting Oversight Board (United States). Those standards require that we plan and perform the audits to obtain reasonable assurance about whether the financial statements are free of material misstatement and whether effective internal control over financial reporting was maintained in all material respects. Our audits of the financial statements included examining, on a test basis, evidence supporting the amounts and disclosures in the financial statements, assessing the accounting principles used and significant estimates made by management, and evaluating the overall financial statement presentation. Our audit of internal control over financial reporting included obtaining an understanding of internal control over financial reporting, assessing the risk that a material weakness exists, and testing and evaluating the design and operating effectiveness of internal control based on the assessed risk. Our audits also included performing such other procedures as we considered necessary in the circumstances. We believe that our audits provide a reasonable basis for our opinions.
A company’s internal control over financial reporting is a process designed to provide reasonable assurance regarding the reliability of financial reporting and the preparation of financial statements for external purposes in accordance with generally accepted accounting principles. A company’s internal control over financial reporting includes those policies and procedures that (i) pertain to the maintenance of records that, in reasonable detail, accurately and fairly reflect the transactions and dispositions of the assets of the company; (ii) provide reasonable assurance that transactions are recorded as necessary to permit preparation of financial statements in accordance with generally accepted accounting principles, and that receipts and expenditures of the company are being made only in accordance with authorizations of management and directors of the company; and (iii) provide reasonable assurance regarding prevention or timely detection of unauthorized acquisition, use, or disposition of the company’s assets that could have a material effect on the financial statements.
Because of its inherent limitations, internal control over financial reporting may not prevent or detect misstatements. Also, projections of any evaluation of effectiveness to future periods are subject to the risk that controls may become inadequate because of changes in conditions, or that the degree of compliance with the policies or procedures may deteriorate.
/s/ PricewaterhouseCoopers LLP
Philadelphia, Pennsylvania
February 23, 2017
F-3
TELEFLEX INCORPORATED
CONSOLIDATED STATEMENTS OF INCOME
Year Ended December 31, | |||||||||||
2016 | 2015 | 2014 | |||||||||
(Dollars and shares in thousands, except per share) | |||||||||||
Net revenues | $ | 1,868,027 | $ | 1,809,690 | $ | 1,839,832 | |||||
Cost of goods sold | 871,827 | 865,287 | 897,404 | ||||||||
Gross profit | 996,200 | 944,403 | 942,428 | ||||||||
Selling, general and administrative expenses | 563,308 | 568,982 | 578,657 | ||||||||
Research and development expenses | 58,579 | 52,119 | 61,040 | ||||||||
Restructuring and other impairment charges | 59,227 | 7,819 | 17,869 | ||||||||
Gain on sale of assets | (4,367 | ) | (408 | ) | — | ||||||
Income from continuing operations before interest, loss on extinguishment of debt and taxes | 319,453 | 315,891 | 284,862 | ||||||||
Interest expense | 54,941 | 61,323 | 65,458 | ||||||||
Interest income | (474 | ) | (532 | ) | (706 | ) | |||||
Loss on extinguishment of debt | 19,261 | 10,454 | — | ||||||||
Income from continuing operations before taxes | 245,725 | 244,646 | 220,110 | ||||||||
Taxes on income from continuing operations | 8,074 | 7,838 | 28,650 | ||||||||
Income from continuing operations | 237,651 | 236,808 | 191,460 | ||||||||
Operating loss from discontinued operations | (922 | ) | (1,730 | ) | (3,407 | ) | |||||
Tax benefit on loss from discontinued operations | (1,112 | ) | (10,635 | ) | (698 | ) | |||||
Income (loss) on discontinued operations | 190 | 8,905 | (2,709 | ) | |||||||
Net income | 237,841 | 245,713 | 188,751 | ||||||||
Less: Income from continuing operations attributable to noncontrolling interest | 464 | 850 | 1,072 | ||||||||
Net income attributable to common shareholders | $ | 237,377 | $ | 244,863 | $ | 187,679 | |||||
Earnings per share available to common shareholders: | |||||||||||
Basic: | |||||||||||
Income from continuing operations | $ | 5.47 | $ | 5.68 | $ | 4.60 | |||||
Income (loss) on discontinued operations | 0.01 | 0.21 | (0.06 | ) | |||||||
Net income | $ | 5.48 | $ | 5.89 | $ | 4.54 | |||||
Diluted: | |||||||||||
Income from continuing operations | $ | 4.98 | $ | 4.91 | $ | 4.10 | |||||
Income (loss) on discontinued operations | — | 0.19 | (0.06 | ) | |||||||
Net income | $ | 4.98 | $ | 5.10 | $ | 4.04 | |||||
Dividends per share | $ | 1.36 | $ | 1.36 | $ | 1.36 | |||||
Weighted average common shares outstanding: | |||||||||||
Basic | 43,325 | 41,558 | 41,366 | ||||||||
Diluted | 47,646 | 48,058 | 46,470 | ||||||||
Amounts attributable to common shareholders: | |||||||||||
Income from continuing operations, net of tax | $ | 237,187 | $ | 235,958 | $ | 190,388 | |||||
Income (loss) from discontinued operations, net of tax | 190 | 8,905 | (2,709 | ) | |||||||
Net income | $ | 237,377 | $ | 244,863 | $ | 187,679 | |||||
The accompanying notes are an integral part of the consolidated financial statements.
F-4
TELEFLEX INCORPORATED
CONSOLIDATED STATEMENTS OF COMPREHENSIVE INCOME
Year Ended December 31, | |||||||||||
2016 | 2015 | 2014 | |||||||||
(Dollars in thousands) | |||||||||||
Net income | $ | 237,841 | $ | 245,713 | $ | 188,751 | |||||
Other comprehensive income, net of tax: | |||||||||||
Foreign currency: | |||||||||||
Foreign currency translation continuing operations adjustments, net of tax of $10,977, $24,150, and $24,818, respectively | (69,162 | ) | (110,671 | ) | (105,410 | ) | |||||
Foreign currency translation, net of tax | (69,162 | ) | (110,671 | ) | (105,410 | ) | |||||
Pension and other postretirement benefits plans: | |||||||||||
Prior service cost recognized in net periodic cost, net of tax of $(20), $0, and $9 respectively | 36 | — | (12 | ) | |||||||
Unamortized (loss) gain arising during the period, net of tax of $1,849, $1,469, and $26,624, respectively | (3,255 | ) | (2,137 | ) | (48,245 | ) | |||||
Net loss recognized in net periodic cost, net of tax of $(2,489), $(2,242), and $(1,544), respectively | 4,476 | 4,133 | 2,841 | ||||||||
Foreign currency translation, net of tax of $(373), $(316), and $(265), respectively | 1,034 | 861 | 709 | ||||||||
Pension and other postretirement benefits plans adjustment, net of tax | 2,291 | 2,857 | (44,707 | ) | |||||||
Derivatives qualifying as hedges: | |||||||||||
Unrealized gain (loss) on derivatives arising during the period, net of tax $1,359, $379, and $(111), respectively | (3,434 | ) | (2,974 | ) | 594 | ||||||
Reclassification adjustment on derivatives included in net income, net of tax of $(1,010), $(196), and $111, respectively | 3,501 | 483 | (594 | ) | |||||||
Derivatives qualifying as hedges, net of tax | 67 | (2,491 | ) | — | |||||||
Other comprehensive (loss) income, net of tax | (66,804 | ) | (110,305 | ) | (150,117 | ) | |||||
Comprehensive income | 171,037 | 135,408 | 38,634 | ||||||||
Less: comprehensive income attributable to noncontrolling interest | 421 | 774 | 995 | ||||||||
Comprehensive income attributable to common shareholders | $ | 170,616 | $ | 134,634 | $ | 37,639 | |||||
The accompanying notes are an integral part of the consolidated financial statements.
F-5
TELEFLEX INCORPORATED
CONSOLIDATED BALANCE SHEETS
December 31, | |||||||
2016 | 2015 | ||||||
(Dollars, except per share amounts, and shares in thousands) | |||||||
ASSETS | |||||||
Current assets | |||||||
Cash and cash equivalents | $ | 543,789 | $ | 338,366 | |||
Accounts receivable, net | 271,993 | 262,416 | |||||
Inventories, net | 316,171 | 330,275 | |||||
Prepaid expenses and other current assets | 40,382 | 34,915 | |||||
Prepaid taxes | 8,179 | 30,895 | |||||
Assets held for sale | 2,879 | 6,972 | |||||
Total current assets | 1,183,393 | 1,003,839 | |||||
Property, plant and equipment, net | 302,899 | 316,123 | |||||
Goodwill | 1,276,720 | 1,295,852 | |||||
Intangibles assets, net | 1,091,663 | 1,199,975 | |||||
Deferred tax assets | 1,712 | 2,341 | |||||
Other assets | 34,826 | 53,644 | |||||
Total assets | $ | 3,891,213 | $ | 3,871,774 | |||
LIABILITIES AND EQUITY | |||||||
Current liabilities | |||||||
Current borrowings | $ | 183,071 | $ | 417,350 | |||
Accounts payable | 69,400 | 66,305 | |||||
Accrued expenses | 65,149 | 64,017 | |||||
Current portion of contingent consideration | 587 | 7,291 | |||||
Payroll and benefit-related liabilities | 82,679 | 84,658 | |||||
Accrued interest | 10,450 | 7,480 | |||||
Income taxes payable | 7,908 | 8,059 | |||||
Other current liabilities | 8,402 | 8,960 | |||||
Total current liabilities | 427,646 | 664,120 | |||||
Long-term borrowings | 850,252 | 641,850 | |||||
Deferred tax liabilities | 271,377 | 315,983 | |||||
Pension and postretirement benefit liabilities | 133,062 | 149,441 | |||||
Noncurrent liability for uncertain tax positions | 17,520 | 40,400 | |||||
Other liabilities | 52,015 | 48,887 | |||||
Total liabilities | 1,751,872 | 1,860,681 | |||||
Commitments and contingencies | |||||||
Convertible notes - redeemable equity component (Note 19) | 1,824 | — | |||||
Mezzanine equity | 1,824 | — | |||||
Common shareholders’ equity | |||||||
Common shares, $1 par value Issued: 2016 — 45,814 shares; 2015 — 43,517 shares | 45,814 | 43,517 | |||||
Additional paid-in capital | 506,800 | 440,127 | |||||
Retained earnings | 2,194,593 | 2,016,176 | |||||
Accumulated other comprehensive loss | (438,717 | ) | (371,124 | ) | |||
2,308,490 | 2,128,696 | ||||||
Less: Treasury stock, at cost | 170,973 | 119,424 | |||||
Total common shareholders’ equity | 2,137,517 | 2,009,272 | |||||
Noncontrolling interest | — | 1,821 | |||||
Total equity | 2,137,517 | 2,011,093 | |||||
Total liabilities and equity | $ | 3,891,213 | $ | 3,871,774 | |||
The accompanying notes are an integral part of the consolidated financial statements.
F-6
TELEFLEX INCORPORATED
CONSOLIDATED STATEMENTS OF CASH FLOWS
Year Ended December 31, | |||||||||||
2016 | 2015 | 2014 | |||||||||
(Dollars in thousands) | |||||||||||
Cash flows from operating activities of continuing operations: | |||||||||||
Net income | $ | 237,841 | $ | 245,713 | $ | 188,751 | |||||
Adjustments to reconcile net income to net cash provided by operating activities: | |||||||||||
(Income) loss from discontinued operations | (190 | ) | (8,905 | ) | 2,709 | ||||||
Depreciation expense | 54,415 | 46,013 | 50,207 | ||||||||
Amortization expense of intangible assets | 63,491 | 62,380 | 60,926 | ||||||||
Amortization expense of deferred financing costs and debt discount | 10,440 | 16,941 | 15,897 | ||||||||
Loss on extinguishment of debt | 19,261 | 10,454 | — | ||||||||
Changes in contingent consideration | (6,445 | ) | (4,576 | ) | (7,418 | ) | |||||
Impairment of long-lived assets | 2,356 | — | — | ||||||||
In-process research and development impairment charge | 41,000 | — | — | ||||||||
Stock-based compensation | 16,871 | 14,467 | 12,227 | ||||||||
Net gain on sales of businesses and assets | (4,367 | ) | (408 | ) | — | ||||||
Deferred income taxes, net | (29,346 | ) | (54,413 | ) | (14,153 | ) | |||||
Other | (13,311 | ) | (20,775 | ) | (8,968 | ) | |||||
Changes in operating assets and liabilities, net of effects of acquisitions and disposals: | |||||||||||
Accounts receivable | (11,029 | ) | 398 | 9,394 | |||||||
Inventories | 6,408 | (8,371 | ) | (15,531 | ) | ||||||
Prepaid expenses and other current assets | (3,613 | ) | (3,027 | ) | 1,422 | ||||||
Accounts payable and accrued expenses | 15,422 | (117 | ) | 9,818 | |||||||
Income taxes receivable and payable, net | 11,386 | 7,672 | (15,040 | ) | |||||||
Net cash provided by operating activities from continuing operations | 410,590 | 303,446 | 290,241 | ||||||||
Cash flows from investing activities of continuing operations: | |||||||||||
Expenditures for property, plant and equipment | (53,135 | ) | (61,448 | ) | (67,571 | ) | |||||
Payments for businesses and intangibles acquired, net of cash acquired | (14,040 | ) | (93,808 | ) | (45,777 | ) | |||||
Proceeds from sales of businesses and assets | 10,201 | 408 | 5,251 | ||||||||
Investments in affiliates | — | — | (40 | ) | |||||||
Net cash used in investing activities from continuing operations | (56,974 | ) | (154,848 | ) | (108,137 | ) | |||||
Cash flows from financing activities of continuing operations: | |||||||||||
Proceeds from new borrowings | 671,700 | 288,100 | 250,000 | ||||||||
Reduction in borrowings | (714,565 | ) | (303,757 | ) | (480,102 | ) | |||||
Debt extinguishment, issuance and amendment fees | (8,958 | ) | (9,017 | ) | (4,494 | ) | |||||
Proceeds from share based compensation plans and the related tax impacts | 9,068 | 4,994 | 4,245 | ||||||||
Payments to noncontrolling interest shareholders | (464 | ) | (1,343 | ) | (1,094 | ) | |||||
Payments for acquisition of noncontrolling interest | (9,231 | ) | — | — | |||||||
Payments for contingent consideration | (7,282 | ) | (8,028 | ) | — | ||||||
Dividends | (58,960 | ) | (56,532 | ) | (56,258 | ) | |||||
Net cash used in financing activities from continuing operations | (118,692 | ) | (85,583 | ) | (287,703 | ) | |||||
Cash flows from discontinued operations: | |||||||||||
Net cash used in operating activities | (2,110 | ) | (2,636 | ) | (3,676 | ) | |||||
Net cash used in discontinued operations | (2,110 | ) | (2,636 | ) | (3,676 | ) | |||||
Effect of exchange rate changes on cash and cash equivalents | (27,391 | ) | (25,249 | ) | (19,473 | ) | |||||
Net increase (decrease) in cash and cash equivalents | 205,423 | 35,130 | (128,748 | ) | |||||||
Cash and cash equivalents at the beginning of the year | 338,366 | 303,236 | 431,984 | ||||||||
Cash and cash equivalents at the end of the year | $ | 543,789 | $ | 338,366 | $ | 303,236 | |||||
Supplemental cash flow information: | |||||||||||
Cash interest paid | $ | 44,203 | $ | 45,973 | $ | 49,797 | |||||
Income taxes paid, net of refunds | $ | 23,955 | $ | 56,079 | $ | 52,869 | |||||
Non cash financing activities of continuing operations: | |||||||||||
Settlement and exchange of convertible notes with common or treasury stock | $ | 35,286 | $ | 133 | $ | 43 | |||||
Acquisition of treasury stock associated with settlement and exchange of convertible note hedge and warrant agreements | $ | 86,046 | $ | 269 | $ | 77 | |||||
The accompanying notes are an integral part of the consolidated financial statements.
F-7
TELEFLEX INCORPORATED
CONSOLIDATED STATEMENTS OF CHANGES IN EQUITY
Common Stock | Additional Paid in Capital | Retained Earnings | Accumulated Other Comprehensive Income (loss) | Treasury Stock | Non- controlling Interest | Total Equity | |||||||||||||||||||||||||||
Shares | Dollars | Shares | Dollars | ||||||||||||||||||||||||||||||
(Dollars and shares in thousands, except per share) | |||||||||||||||||||||||||||||||||
Balance at December 31, 2013 | 43,243 | $ | 43,243 | $ | 409,338 | $ | 1,696,424 | $ | (110,855 | ) | 2,064 | $ | (124,623 | ) | $ | 2,489 | $ | 1,916,016 | |||||||||||||||
Net income | 187,679 | 1,072 | 188,751 | ||||||||||||||||||||||||||||||
Cash dividends ($1.36 per share) | (56,258 | ) | (56,258 | ) | |||||||||||||||||||||||||||||
Other comprehensive loss | (150,040 | ) | (77 | ) | (150,117 | ) | |||||||||||||||||||||||||||
Distributions to noncontrolling interest shareholders | (1,094 | ) | (1,094 | ) | |||||||||||||||||||||||||||||
Settlement of convertible notes | (42 | ) | (1 | ) | 43 | 1 | |||||||||||||||||||||||||||
Settlement of note hedges associated with convertible notes | 79 | 1 | (77 | ) | 2 | ||||||||||||||||||||||||||||
Shares issued under compensation plans | 177 | 177 | 13,019 | (81 | ) | 3,081 | 16,277 | ||||||||||||||||||||||||||
Deferred compensation | — | (2 | ) | 121 | 121 | ||||||||||||||||||||||||||||
Balance at December 31, 2014 | 43,420 | 43,420 | 422,394 | 1,827,845 | (260,895 | ) | 1,981 | (121,455 | ) | 2,390 | 1,913,699 | ||||||||||||||||||||||
Net income | 244,863 | 850 | 245,713 | ||||||||||||||||||||||||||||||
Cash dividends ($1.36 per share) | (56,532 | ) | (56,532 | ) | |||||||||||||||||||||||||||||
Other comprehensive loss | (110,229 | ) | (76 | ) | (110,305 | ) | |||||||||||||||||||||||||||
Distributions to noncontrolling interest shareholders | (1,343 | ) | (1,343 | ) | |||||||||||||||||||||||||||||
Settlement of convertible notes | (128 | ) | (2 | ) | 133 | 5 | |||||||||||||||||||||||||||
Settlement of note hedges associated with convertible notes | 270 | 2 | (269 | ) | 1 | ||||||||||||||||||||||||||||
Shares issued under compensation plans | 97 | 97 | 17,591 | (70 | ) | 2,094 | 19,782 | ||||||||||||||||||||||||||
Deferred compensation | (3 | ) | 73 | 73 | |||||||||||||||||||||||||||||
Balance at December 31, 2015 | 43,517 | 43,517 | 440,127 | 2,016,176 | (371,124 | ) | 1,908 | (119,424 | ) | 1,821 | 2,011,093 | ||||||||||||||||||||||
Net income | 237,377 | 464 | 237,841 | ||||||||||||||||||||||||||||||
Cash dividends ($1.36 per share) | (58,960 | ) | (58,960 | ) | |||||||||||||||||||||||||||||
Other comprehensive loss | (66,761 | ) | (43 | ) | (66,804 | ) | |||||||||||||||||||||||||||
Distributions to noncontrolling interest shareholders | (464 | ) | (464 | ) | |||||||||||||||||||||||||||||
Acquisition of noncontrolling interest | (6,621 | ) | (832 | ) | (1,778 | ) | (9,231 | ) | |||||||||||||||||||||||||
Settlement of convertible notes | 2,168 | 2,168 | (32,004 | ) | (430 | ) | 33,132 | 3,296 | |||||||||||||||||||||||||
Settlement of note hedges associated with convertible notes and warrants | 86,048 | 316 | (86,046 | ) | 2 | ||||||||||||||||||||||||||||
Reclassification of convertible notes to mezzanine equity | (1,824 | ) | (1,824 | ) | |||||||||||||||||||||||||||||
Shares issued under compensation plans | 129 | 129 | 21,074 | (51 | ) | 1,289 | 22,492 | ||||||||||||||||||||||||||
Deferred compensation | (2 | ) | 76 | 76 | |||||||||||||||||||||||||||||
Balance at December 31, 2016 | 45,814 | $ | 45,814 | $ | 506,800 | $ | 2,194,593 | $ | (438,717 | ) | 1,741 | $ | (170,973 | ) | $ | — | $ | 2,137,517 | |||||||||||||||
The accompanying notes are an integral part of the consolidated financial statements.
F-8
TELEFLEX INCORPORATED
NOTES TO CONSOLIDATED FINANCIAL STATEMENTS
Note 1 — Summary of significant accounting policies
Consolidation: The consolidated financial statements include the accounts of Teleflex Incorporated and its subsidiaries (the “Company”). Intercompany transactions are eliminated in consolidation. Investments in affiliates over which the Company has significant influence but not a controlling equity interest, including variable interest entities for which the Company is not the primary beneficiary, are accounted for using the equity method. Investments in affiliates over which the Company does not have significant influence are accounted for using the cost method of accounting. These consolidated financial statements have been prepared in conformity with accounting principles generally accepted in the United States of America ("GAAP") and reflect management’s estimates and assumptions that affect the recorded amounts.
Use of estimates: The preparation of financial statements in conformity with GAAP requires management to make estimates and assumptions that affect the reported amounts of assets and liabilities and disclosure of contingent assets and liabilities at the date of the financial statements and the reported amounts of net revenues and expenses during the reporting period. Actual results could differ from those estimates.
Cash and cash equivalents: All highly liquid debt instruments with an original maturity of three months or less are classified as cash equivalents. The carrying value of cash equivalents approximates the current market value.
Accounts receivable: Accounts receivable represent amounts due from customers related to the sale of products and provision of services. An allowance for doubtful accounts is maintained and represents the Company’s estimate of the amount of uncollectible receivables. The allowance is provided at such time as management believes reasonable doubt exists that such balances will be collected within a reasonable period of time. The allowance is based on the Company’s historical collection experience with respect to the customer, the length of time an account is outstanding, the financial position of the customer and information provided by credit rating services. In addition, the Company maintains a reserve for returns and allowances based on its historical experience. See Note 9 for information on the Company’s concentration of credit risk with respect to trade accounts receivable, as well as the Company's allowance for doubtful accounts.
Inventories: Inventories are valued at the lower of cost or market. The cost of the Company’s inventories is determined using the average cost method. Elements of cost in inventory include raw materials, direct labor, and manufacturing overhead. In estimating market value, the Company evaluates inventory for excess and obsolete quantities based on estimated usage and sales among other factors.
Property, plant and equipment: Property, plant and equipment are stated at cost, net of accumulated depreciation. Costs incurred to develop internal-use computer software during the application development stage generally are capitalized. Costs of enhancements to internal-use computer software are capitalized, provided that these enhancements result in additional functionality. Other additions and those improvements which increase the capacity or lengthen the useful lives of the assets are also capitalized. Composite useful lives for categories of property, plant and equipment, which are depreciated on a straight-line basis, are as follows: buildings — 30 years; machinery and equipment — 3 to 10 years; computer equipment and software — 3 to 10 years. Leasehold improvements are depreciated over the lesser of the useful lives of the leasehold improvements or the remaining lease term. Repairs and maintenance costs are expensed as incurred.
Goodwill and other intangible assets: Goodwill and other indefinite-lived intangible assets are not amortized but are tested for impairment annually during the fourth quarter or more frequently if events or changes in circumstances indicate that an impairment may exist. Impairment losses, if any, are included in income from operations. The goodwill impairment test is applied to each of the Company’s reporting units whose assets include goodwill. For purposes of this assessment, a reporting unit is an operating segment, or a business one level below that operating segment (also known as a component) if discrete financial information is prepared for that business and regularly reviewed by segment management. However, separate components are aggregated as a single reporting unit if they have similar economic characteristics.
In applying the goodwill impairment test, the Company may assess qualitative factors to determine whether it is more likely than not that the fair value of a reporting unit is less than its carrying value. Qualitative factors may include, but are not limited to, macroeconomic conditions, industry conditions, the competitive environment, changes in the
F-9
TELEFLEX INCORPORATED
NOTES TO CONSOLIDATED FINANCIAL STATEMENTS — (Continued)
market for the Company’s products and services, regulatory and political developments, and entity specific factors such as strategies and financial performance. If, after completing the qualitative assessment, the Company determines it is more likely than not that the fair value of a reporting unit is less than its carrying value, the Company proceeds to a two-step quantitative impairment test, described below. Alternatively, the Company may bypass the qualitative assessment and proceed directly to the two-step quantitative impairment test. The first step of the two-step impairment test is to compare the fair value of a reporting unit to its carrying value. If the reporting unit fair value exceeds the carrying value, there is no impairment. If the reporting unit carrying value exceeds the fair value, the Company would perform the second step of the goodwill impairment test, in which the Company would measure the amount of an impairment loss, if any, based on the amount by which the carrying value of goodwill exceeds its implied fair value. The implied fair value of goodwill is determined by deducting the fair value of a reporting unit's identifiable assets and liabilities from the fair value of the reporting unit as a whole, as if that reporting unit had just been acquired and the fair value of the individual assets acquired and liabilities assumed were being determined initially. During 2016, the Company performed a qualitative assessment on six reporting units and performed a quantitative assessment on the remaining three reporting units. The Company did not record a goodwill impairment charge for the year ended December 31, 2016.
The Company’s intangible assets consist of customer lists, intellectual property, distribution rights, in-process research and development ("IPR&D") and trade names. The Company defines IPR&D as the value of technology acquired for which the related projects have substance and are incomplete. IPR&D acquired in a business acquisition is recognized at fair value and is required be capitalized as an indefinite-lived intangible asset until completion of the IPR&D project or upon abandonment. Upon completion of the development project (generally when regulatory approval to market the product is obtained), an impairment assessment is performed prior to amortizing the asset over its estimated useful life. If the IPR&D projects are abandoned, the related IPR&D assets would be written off.
The Company tests its indefinite-lived intangible assets for impairment annually, and more frequently if events or changes in circumstances indicate that an impairment may have occurred. Similar to the goodwill impairment test process, the Company may elect to perform a qualitative assessment. If, after completing the qualitative assessment, the Company determines it is more likely than not that the fair value of the indefinite-lived intangible asset is greater than its carrying amount, the asset is not impaired. If the Company concludes it is more likely than not that the fair value of the indefinite-lived intangible asset is less than the carrying value, the Company then proceeds to a quantitative impairment test, which consists of a comparison of the fair value of the intangible asset to its carrying amount. During 2016, the Company performed a quantitative assessment on three indefinite-lived intangible assets and a qualitative assessment on the remaining indefinite-lived intangible asset. See Note 4 for further information on the results of the indefinite-lived intangibles impairment testing performed in 2016.
Intangible assets consisting of intellectual property, customer lists, distribution rights and trade names do not have indefinite lives and are being amortized over their estimated useful lives, which are as follows: intellectual property, 3 to 20 years; customer lists, 5 to 30 years; distribution rights, 3 to 22 years; trade names, 1 to 30 years. The weighted average remaining amortization period with respect to the Company's intangible assets is approximately 15 years. The Company periodically evaluates the reasonableness of the useful lives of these assets.
Long-lived assets: The Company assesses the remaining useful life and recoverability of long-lived assets whenever events or changes in circumstances indicate the carrying value of an asset may not be recoverable. The assessment is based on various analyses, including undiscounted cash flow and profitability projections that incorporate, as applicable, the impact on the existing business. Therefore, the evaluation involves significant management judgment. Any impairment loss, if indicated, is measured as the amount by which the carrying amount of the asset exceeds the estimated fair value of the asset.
Foreign currency translation: Assets and liabilities of subsidiaries with non-United States dollar denominated functional currencies are translated into United States dollars at the rates of exchange at the balance sheet date; income and expenses are translated at the average rates of exchange prevailing during the year. The translation adjustments are reported as a component of accumulated other comprehensive loss.
Derivative financial instruments: The Company uses derivative financial instruments primarily for purposes of hedging exposures to fluctuations in foreign currency exchange rates. All instruments are entered into for other than trading purposes. All derivatives are recognized on the balance sheet at fair value. Changes in the fair value of derivatives are recorded in the consolidated statement of comprehensive income as other comprehensive income (loss), if the instrument is designated as part of a hedge transaction. Gains or losses on derivative instruments reported in other comprehensive income (loss) are reclassified to the consolidated statement of income in the period in which
F-10
TELEFLEX INCORPORATED
NOTES TO CONSOLIDATED FINANCIAL STATEMENTS — (Continued)
earnings are affected by the underlying hedged item. Gains or losses on derivative instruments representing hedge ineffectiveness or hedge components excluded from the assessment of effectiveness, if any, are recognized in the consolidated statement of income for the period in which such gains and losses occur. If the hedging relationship ceases to be highly effective or it becomes probable that an expected transaction will no longer occur, gains or losses on the derivative instrument are recorded in the consolidated statement of income for the period in which either such event occurs. For non-designated derivatives, gains and losses are reported in selling, general and administrative expenses. The receipt or payment of funds upon settlement of derivative financial instruments is classified as cash flows from operating activities.
Share-based compensation: The Company estimates the fair value of share-based awards on the date of grant using an option pricing model. The value of the portion of the award that is ultimately expected to vest is recognized as expense over the requisite service periods. Share-based compensation expense related to stock options is measured using a Black-Scholes option pricing model that takes into account subjective and complex assumptions with respect to the expected life of the options, volatility, risk-free interest rate and expected dividend yield. The expected life of options granted is derived from the vesting period of the award, as well as historical exercise behavior, and represents the period of time that options granted are expected to be outstanding. Expected volatility is based on a blend of historical volatility and implied volatility derived from publicly traded options to purchase the Company’s common stock, which the Company believes is more reflective of the market conditions and a better indicator of expected volatility than would be the case if the Company only used historical volatility. The risk-free interest rate is the implied yield currently available on United States Treasury zero-coupon issues with a remaining term equal to the expected life of the option.
Share-based compensation expense recognized is based on the value of the portion of stock-based awards that is ultimately expected to vest during the period less estimated forfeitures. Forfeitures are required to be estimated at the time of grant. Management reviews and revises the estimate of forfeitures for all share-based awards on a quarterly basis, based on management’s expectations regarding the extent to which awards ultimately will vest.
Income taxes: The provision for income taxes is determined using the asset and liability approach of accounting for income taxes. Under this approach, deferred tax assets and liabilities are recognized to reflect the future tax consequences attributable to the differences between the financial statement carrying amounts of existing assets and liabilities and their tax bases, and to reflect operating loss and tax credit carryforwards. The provision for income taxes represents income taxes paid or payable for the current year plus the change in deferred taxes during the year. Provision has been made for income taxes on unremitted earnings of subsidiaries and affiliates, except to the extent that such earnings are deemed to be permanently reinvested.
Significant judgment is required in determining income tax provisions and in evaluating tax positions. The Company establishes additional provisions for income taxes when, despite the belief that tax positions are supportable, there remain certain positions that do not meet the minimum probability threshold, which is a tax position that is more likely than not to be sustained upon examination by the applicable taxing authority. In the normal course of business, the Company and its subsidiaries are examined by various federal, state and foreign tax authorities. The Company regularly assesses the potential outcomes of these examinations and any future examinations for the current or prior years in determining the adequacy of its provision for income taxes. Interest accrued with respect to unrecognized tax benefits and income tax related penalties are both included in taxes on income from continuing operations. The Company periodically assesses the likelihood and amount of potential adjustments and adjusts the income tax provision, the current tax liability and deferred taxes in the period in which the facts that give rise to an adjustment become known.
Pensions and other postretirement benefits: The Company provides a range of benefits to eligible employees and retired employees, including under plans that provide pension and postretirement healthcare benefits. The Company records annual amounts relating to these plans based on calculations which include various actuarial assumptions such as discount rates, expected rates of return on plan assets, compensation increases, turnover rates and healthcare cost trend rates. The Company reviews its actuarial assumptions on an annual basis and makes modifications to the assumptions based on current rates and trends when appropriate. The effect of the modifications is generally amortized over future periods.
Restructuring costs: Restructuring costs, which include termination benefits, facility closure costs, contract termination costs and other restructuring costs are recorded at estimated fair value. Key assumptions used in calculating the restructuring costs include the terms of, and payments under, agreements to terminate certain contractual obligations and the timing of reductions in force.
F-11
TELEFLEX INCORPORATED
NOTES TO CONSOLIDATED FINANCIAL STATEMENTS — (Continued)
Contingent consideration related to business acquisitions: In connection with business acquisitions, the Company may be required to pay future consideration that is contingent upon the achievement of specified objectives such as receipt of regulatory approval, commercialization of a product or achievement of sales targets. As of the acquisition date, the Company records a contingent liability representing the estimated fair value of the contingent consideration that it expects to pay. The Company remeasures the fair value of its contingent consideration arrangements each reporting period and, based on new developments, records changes in fair value until either the contingent consideration obligation is satisfied through payment upon the achievement of the specified objectives or the obligation no longer exists due to the failure to achieve the specified objectives. The change in the fair value is recorded in the consolidated statement of income. A contingent consideration payment is classified as a financing activity in the consolidated statement of cash flows to the extent it was recorded as a liability as of the acquisition date. Any additional amount paid in excess of the amount initially accrued is classified as an operating activity in the consolidated statement of cash flows.
Revenue recognition: The Company recognizes revenues from product sales, including sales to distributors, or services provided when the following revenue recognition criteria are met: persuasive evidence of an arrangement exists, delivery has occurred or services have been rendered, the selling price is fixed or determinable and collectability is reasonably assured. This generally occurs when products are shipped, when services are rendered or upon customers’ acceptance. Revenues are net of estimated returns and other allowances, including rebates.
The Company’s normal policy is to accept returns only in cases in which the product is defective and covered under the Company’s standard warranty provisions. With respect to the limited cases where an arrangement provides a right of return to the customer, including a distributor, the Company believes it has the ability to reasonably estimate the amount of returns based on its substantial historical experience with respect to these arrangements. The Company accrues any costs or losses that may be expected in connection with any returns pursuant to the Financial Accounting Standards Board ("FASB") guidance on accounting for contingencies. Revenues and cost of goods sold are reduced to reflect estimated returns. The reserve for returns and allowances was $4.4 million and $4.9 million as of December 31, 2016 and 2015, respectively.
Allowances related to customer incentive programs, which include discounts or rebates, are estimated and provided for in the period that the related sales are recorded. These allowances are recorded as a reduction of revenue. The Company also offers rebates to certain distributors and records the estimated rebate as a reduction of revenue at the time of sale. In estimating rebates, the Company considers the lag time between the point of sale and the payment of the distributor’s rebate claim, distributor-specific trend analyses, contractual commitments, including stated rebate rates, historical experience with respect to specific customers and other relevant information. The Company adjusts estimated rebates based on actual experience and records the adjustment to revenue in the period of adjustment. The reserve for the customer incentive programs, including distributor rebates, was $11.6 million and $11.1 million at December 31, 2016 and 2015, respectively. The Company expects the amounts subject to the reserve as of December 31, 2016 to be paid within 90 days subsequent to year-end.
Note 2 — Recently issued accounting standards
In May 2014, the FASB, in a joint effort with the International Accounting Standards Board ("IASB"), issued new accounting guidance to clarify the principles for recognizing revenue. The new guidance is designed to enhance the comparability of revenue recognition practices across entities, industries, jurisdictions and capital markets, and will affect any entity that enters into contracts with customers or enters into contracts for the transfer of nonfinancial assets, unless those contracts are within the scope of other standards. The new guidance establishes principles for reporting information to users of financial statements about the nature, amount, timing, and uncertainty of revenue and cash flows arising from an entity's contracts with customers. The core principle of the new guidance is that an entity recognizes revenue to depict the transfer of promised goods or services to customers in an amount that reflects the consideration to which the entity expects to be entitled in exchange for those goods and services. In August 2015, the FASB issued an amendment to the new guidance that deferred the effective date. The amendment provides that the new guidance is effective for annual periods beginning after December 15, 2017 and interim periods within those years; early application is permitted for annual periods beginning after December 15, 2016. Although the Company's evaluation of this guidance is ongoing, the Company's preliminary assessment indicates that the adoption of this guidance will not have a material impact on the Company’s results of operations, cash flows and financial position.
In April 2015, the FASB issued guidance for the reporting of debt issuance costs within the balance sheet. Under the new guidance, debt issuance costs related to term loans are to be presented in the balance sheet as a direct
F-12
TELEFLEX INCORPORATED
NOTES TO CONSOLIDATED FINANCIAL STATEMENTS — (Continued)
deduction from the associated debt liability, consistent with the presentation of a debt discount. Previously, debt issuance costs were presented as a deferred charge (i.e., an asset) on the balance sheet. The guidance provides uniform treatment for debt issuance costs and debt discounts and eliminates inconsistencies that previously existed with other FASB guidance. The Company retrospectively adopted this guidance as of January 1, 2016, which resulted in the reclassification of $2.6 million from prepaid expenses and other current assets to current borrowings and the reclassification of $4.2 million from other assets to long-term borrowings as of December 31, 2015.
In February 2016, the FASB issued guidance that will change the requirements for accounting for leases. The principal change under the new accounting guidance is that lessees under leases classified as operating leases will recognize a right-of-use asset and a lease liability. Current lease accounting does not require lessees to recognize assets and liabilities arising under operating leases on the balance sheet. Under the new guidance, lessees (including lessees under leases classified as finance leases and operating leases) will recognize a right-to-use asset and a lease liability on the balance sheet, initially measured as the present value of lease payments under the lease. Expense recognition and cash flow presentation guidance will be based upon whether the lease is classified as an operating lease or a finance lease (the classification criteria for distinguishing between finance leases and operating leases is substantially similar to the classification criteria for distinguishing between capital leases and operating leases under current guidance). The standard is effective for fiscal years, and interim periods within those fiscal years, beginning after December 15, 2018. Early adoption is permitted. The new standard must be adopted using a modified retrospective transition approach for capital and operating leases existing at, or entered into after, the beginning of the earliest comparative period presented in the financial statements; the guidance provides certain practical expedients. The Company is currently evaluating this guidance to determine its impact on the Company’s results of operations, cash flows and financial position.
In March 2016, the FASB issued new guidance designed to simplify several aspects of the accounting for share-based payment transactions, including guidance providing generally that excess tax benefits and deficiencies related to share-based awards should be recorded within income tax expense (currently, excess tax benefits and deficiencies generally are recorded as additional-paid-in-capital) and addressing other, related guidance on accounting for income taxes with respect to share-based payment awards; providing generally that excess tax benefits related to share-based awards should be classified along with other income tax cash flows as an operating activity (currently, excess tax benefits generally are separated from other income tax cash flows and classified as a financing activity); providing that an entity may make an accounting policy election either to base compensation cost accruals on the number of awards expected to vest (as required by current guidance) or to account for forfeitures when they occur; modifying the current exception to liability classification such that partial cash settlement of an award for tax withholding purposes would not result, by itself, in liability classification of the award if the amount withheld does not exceed the maximum statutory tax rate in the employees' applicable jurisdictions (currently, an award cannot qualify for equity classification, rather than liability classification, if the amount withheld exceeds the minimum statutory withholding requirements); and providing that cash paid by an employer when directly withholding shares for tax withholding purposes should be classified as a financing activity on the statement of cash flows (currently there is no authoritative guidance addressing this classification issue). The guidance is effective for fiscal years, and interim periods within those fiscal years, beginning after December 15, 2016. Early adoption is permitted (if early adoption occurs in an interim period, any adjustments will be reflected as of the beginning of the fiscal year that includes the interim period). Depending on the particular issue addressed by the guidance, application of the guidance will be made prospectively, retrospectively or subject to a retrospective transition method. The Company adopted this guidance effective January 1, 2017.
In August 2016, the FASB issued new guidance with regard to eight specific issues pertaining to the classification of certain cash receipts and cash payments within the statement of cash flows. The guidance is effective for fiscal years, and interim periods within those fiscal years, beginning after December 15, 2017. Early adoption is permitted, including adoption in an interim period. The new guidance should be, generally, adopted using a retrospective transition method for each period presented. Although the Company's evaluation of this guidance is ongoing, the Company's preliminary assessment indicates that the adoption of this guidance will not have a material impact on the Company’s cash flows.
In October 2016, the FASB issued new guidance requiring companies to recognize the income tax effects of intra-entity sales and transfers of assets, other than inventory, in the income statement as income tax expense (or benefit) in the period in which the transfer occurs. Previously, recognition was prohibited until the assets were sold to an outside party or otherwise utilized. The guidance is effective for annual periods beginning after December 15, 2017 and early adoption is permitted as of the beginning of an annual reporting period. The guidance should be applied on a modified retrospective basis through a cumulative-effect adjustment to retained earnings as of the
F-13
TELEFLEX INCORPORATED
NOTES TO CONSOLIDATED FINANCIAL STATEMENTS — (Continued)
beginning of the annual period of adoption. The Company is currently evaluating the impact of the adoption of this guidance on its consolidated financial position and results of operations.
In January 2017, the FASB issued new guidance to clarify the definition of a “business,” with the objective of assisting entities in evaluating whether a transaction should be accounted for as an acquisition (or disposal) of assets or as an acquisition of a business. The definition of a business affects many areas of accounting, including acquisitions, disposals, goodwill and consolidation. The guidance generally defines a business as an integrated set of activities and assets (collectively referred to as a “set”) that is capable of being conducted and managed for the purpose of providing a return to investors or other owners, members, or participants. The guidance further provides that, to be considered a business, a set must meet specified requirements. However, the guidance also states that, if substantially all of the fair value of gross assets acquired (subject to specified exceptions) is concentrated in a single identifiable asset or group of similar identifiable assets, the set is not considered a business and no further analysis is required. The guidance is effective for fiscal years, and interim periods within those fiscal years, beginning after December 15, 2017. Early application is permitted under limited circumstances with respect to specified categories of transactions.
On January 26, 2017, the FASB issued guidance to simplify the accounting for goodwill impairment. The guidance removes Step 2 of the goodwill impairment test, which requires a hypothetical purchase price allocation. A goodwill impairment will now be the amount by which a reporting unit’s carrying value exceeds its fair value, not to exceed the carrying amount of goodwill. All other goodwill impairment guidance will remain largely unchanged. The revised guidance is effective for fiscal years, and any interim goodwill impairment tests within those fiscal years, beginning after December 15, 2019. Early adoption is permitted for any impairment tests performed after January 1, 2017. The Company is currently evaluating the impact of the adoption of this guidance, but at current, does not anticipate the guidance will have a material impact on its consolidated financial position or results of operations.
From time to time, new accounting guidance is issued by the FASB or other standard setting bodies that is adopted by the Company as of the specified effective date. The Company has assessed recently issued guidance that is not yet effective and believes the new guidance will not have a material impact on the Company’s results of operations, cash flows or financial position.
Note 3 — Acquisitions
Acquisition of Vascular Solutions, Inc.
In February 2017, the Company acquired Vascular Solutions, Inc. (“Vascular Solutions”). See Note 19 for additional information related to this acquisition.
2016 Acquisitions
The Company made the following acquisitions during 2016 (the "2016 acquisitions"), which, with the exception of the acquisition of the outstanding noncontrolling interest in Teleflex Medical Private Limited, were accounted for as business combinations:
• | On September 2, 2016, the Company acquired certain assets of CarTika Medical, Inc. ("CarTika"), an original equipment manufacturer (OEM) of catheters and other medical devices that complement the Company's OEM product portfolio. |
• | On July 1, 2016, the Company, which previously owned a 74% controlling interest in its Indian affiliate, Teleflex Medical Private Limited, acquired the remaining 26% ownership interest from the noncontrolling shareholders. Teleflex Medical Private Limited is part of the Company's Asia reportable operating segment. As this acquisition did not result in a change in the Company's control of the entity, the Company recognized the $7.5 million excess of the purchase price of the noncontrolling interest over its carrying value as equity. |
• | During the second quarter 2016, the Company acquired certain assets of two medical device and supplies distributors in New Zealand. |
The aggregate purchase price paid in connection with the 2016 acquisitions was $22.8 million. Transaction expenses associated with the acquisitions, which are included in selling, general and administrative expenses in the consolidated statements of income, were $0.4 million for the year ended December 31, 2016. The results of operations and assets of the acquired businesses are included in the consolidated statements of income from their respective
F-14
TELEFLEX INCORPORATED
NOTES TO CONSOLIDATED FINANCIAL STATEMENTS — (Continued)
acquisition dates. For the year ended December 31, 2016, the Company recorded post-acquisition revenue and operating income of $4.2 million and $0.9 million, respectively, related to the businesses acquired in 2016. Pro forma information with respect to the acquired businesses is not presented as the operations of the acquired businesses are not significant to the overall operations of the Company.
The following table presents the preliminary fair value determination of the assets acquired and liabilities assumed with respect to those 2016 acquisitions that were accounted for as a business combination:
(Dollars in thousands) | |||
Assets | |||
Current assets | $ | 2,544 | |
Property, plant and equipment | 662 | ||
Intangible assets: | |||
Customer relationships | 6,465 | ||
Noncompete agreements | 608 | ||
Goodwill | 3,689 | ||
Total assets acquired | 13,968 | ||
Less: | |||
Current liabilities | 589 | ||
Liabilities assumed | 589 | ||
Net assets acquired | $ | 13,379 | |
The Company is continuing to evaluate the 2016 acquisitions, and further adjustments may be necessary as a result of the Company's assessment of additional information related to the fair values of the assets acquired and liabilities assumed, primarily deferred tax liabilities and goodwill. Among the acquired assets, customer lists have useful lives ranging from 10 to 16 years and non-compete arrangements have useful lives of 2 years. The goodwill resulting from the acquisitions primarily reflects synergies currently expected to be realized from the integration of the acquired businesses.
2015 Acquisitions
The Company made the following acquisitions during 2015 (the "2015 acquisitions"), which, with the exception of the Company's acquisition of certain assets of Ace Medical US, LLC ("Ace Medical"), were accounted for as business combinations:
• | On January 20, 2015, the Company acquired Human Medics Co., Ltd., (“Human Medics”), a distributor of medical devices and supplies primarily in the Korean market. |
• | On March 30, 2015, the Company acquired Trintris Medical, Inc. ("Trintris"), an original equipment manufacturer (OEM) of balloons and catheters that complement the Company's OEM product portfolio. |
• | On April 8, 2015, the Company acquired Truphatek Holdings (1993) Limited ("Truphatek"), a manufacturer of a broad range of disposable and reusable laryngoscope devices that complement the Company's anesthesia product portfolio. Previously, the Company held a noncontrolling, 6% interest in Truphatek. |
• | On June 26, 2015, the Company acquired certain assets of N. Stenning & Co. Pty. Ltd. ("Stenning"), a distributor of medical devices and supplies primarily in the Australian market. |
• | On June 29, 2015, the Company acquired certain assets, primarily distribution rights, of Ace Medical, a distributor of medical devices and supplies in the United States of America. |
• | On August 26, 2015, the Company acquired certain assets of Atsina Surgical, LLC ("Atsina") related to the development of surgical clips that complement the Company's surgical ligation portfolio. |
• | On December 22, 2015, the Company acquired all of the membership interests of, and voting equity interest in, Nostix, LLC, a developer of catheter tip placement confirmation systems that complement the Company's vascular product portfolio. |
F-15
TELEFLEX INCORPORATED
NOTES TO CONSOLIDATED FINANCIAL STATEMENTS — (Continued)
The total fair value of consideration for the 2015 acquisitions was $96.5 million. The results of operations of the acquired businesses and assets are included in the consolidated statements of income from their respective acquisition dates. Pro forma information is not presented as the operations of the acquired businesses are not significant to the overall operations of the Company.
Note 4 — Restructuring and other impairment charges
The restructuring and other impairment charges recognized for the years ended December 31, 2016, 2015 and 2014 consisted of the following:
2016 | |||||||||||||||
Termination benefits | Facility closure and other exit costs | Contract termination costs | Total | ||||||||||||
(Dollars in thousands) | |||||||||||||||
Other 2016 restructuring programs | $ | 2,531 | $ | 12 | $ | 671 | $ | 3,214 | |||||||
2016 Manufacturing footprint realignment plan | 11,176 | 468 | 866 | 12,510 | |||||||||||
2014 Manufacturing footprint realignment plan | 81 | 38 | — | 119 | |||||||||||
Other restructuring programs (1) | (558 | ) | 398 | 188 | 28 | ||||||||||
Total restructuring charges | 13,230 | 916 | 1,725 | 15,871 | |||||||||||
Other impairment charges | — | 43,356 | — | 43,356 | |||||||||||
Total restructuring and other impairment charges | $ | 13,230 | $ | 44,272 | $ | 1,725 | $ | 59,227 | |||||||
(1) | Other restructuring programs include the 2015 restructuring programs, the 2014 European Restructuring Plan and the 2012 restructuring programs. |
2015 | |||||||||||||||
Termination benefits | Facility closure and other exit costs | Contract termination costs | Total | ||||||||||||
(Dollars in thousands) | |||||||||||||||
2015 Restructuring programs | $ | 5,009 | $ | 295 | $ | 1,000 | $ | 6,304 | |||||||
2014 Manufacturing footprint realignment plan | 1,007 | 289 | 389 | 1,685 | |||||||||||
Other restructuring programs (2) | (194 | ) | 37 | (13 | ) | (170 | ) | ||||||||
Total restructuring charges | $ | 5,822 | $ | 621 | $ | 1,376 | $ | 7,819 | |||||||
(2) | Other restructuring programs include the 2014 European Restructuring Plan, the Other 2014 restructuring programs, the 2013 restructuring programs and the LMA Restructuring Program. |
2014 | |||||||||||||||
Termination benefits | Facility closure and other exit costs | Contract termination costs | Total | ||||||||||||
(Dollars in thousands) | |||||||||||||||
2014 Manufacturing footprint realignment plan | $ | 9,200 | $ | 60 | $ | — | $ | 9,260 | |||||||
2014 European restructuring plan | 7,237 | 226 | 345 | 7,808 | |||||||||||
Other 2014 restructuring programs | 552 | 244 | 2,754 | 3,550 | |||||||||||
LMA restructuring program | (29 | ) | (112 | ) | (3,188 | ) | (3,329 | ) | |||||||
Other restructuring programs (3) | (57 | ) | 388 | 249 | 580 | ||||||||||
Total restructuring charges | $ | 16,903 | $ | 806 | $ | 160 | $ | 17,869 | |||||||
(3) | Other restructuring programs include the 2013 and 2012 restructuring programs. |
Termination benefits include employee retention, severance and benefit payments for terminated employees. Facility closure costs include general operating costs incurred subsequent to production shutdown as well as equipment relocation and other associated costs. Contract termination costs include costs associated with terminating existing leases and distributor agreements. Other exit costs include legal, outplacement and employee relocation costs and other employee-related costs.
F-16
TELEFLEX INCORPORATED
NOTES TO CONSOLIDATED FINANCIAL STATEMENTS — (Continued)
Restructuring Charges
2016 Manufacturing Footprint Realignment Plan
During the first quarter 2016, the Board of Directors of the Company approved a restructuring plan (the “2016 Manufacturing Footprint Realignment Plan") designed to reduce costs, improve operating efficiencies and enhance the Company’s long term competitive position. The plan primarily involves the relocation of certain manufacturing operations, the relocation and outsourcing of certain distribution operations and a related workforce reduction at certain of the Company's facilities. These actions commenced in the first quarter 2016 and are expected to be substantially completed by the end of 2018.
The Company estimates that it will incur aggregate pre-tax charges in connection with the 2016 Manufacturing Footprint Realignment Plan of between approximately $34 million to $44 million, of which an estimated $27 million to $31 million are expected to result in future cash outlays. Most of these charges, and the related cash outlays, are expected to be made prior to the end of 2018.
Type of expense | Total estimated amount expected to be incurred |
Termination benefits | $14 million to $15 million |
Facility closure and other exit costs (1) | $2 million to $3 million |
Accelerated depreciation charges | $10 million to $13 million |
Other (2) | $8 million to $13 million |
$34 million to $44 million | |
(1) | Includes costs to transfer product lines among facilities and outplacement and employee relocation costs. |
(2) | Consists of other costs directly related to the plan, including project management, legal and regulatory costs. |
As the 2016 Plan progresses, management will reevaluate the estimated expenses set forth above, and may revise its estimates, as appropriate, consistent with GAAP.
The following table summarizes the activity related to the 2016 Manufacturing Footprint Realignment Plan restructuring reserve:
Termination benefits | Facility closure and other exit costs | Contract termination costs | Total | ||||||||||||
(Dollars in thousands) | |||||||||||||||
Balance at December 31, 2015 | $ | — | $ | — | $ | — | $ | — | |||||||
Subsequent accruals | 11,176 | 468 | 866 | 12,510 | |||||||||||
Cash payments | (3,220 | ) | (469 | ) | (95 | ) | (3,784 | ) | |||||||
Translation | 179 | 1 | (11 | ) | 169 | ||||||||||
Balance at December 31, 2016 | $ | 8,135 | $ | — | $ | 760 | $ | 8,895 | |||||||
For the year ended December 31, 2016, the Company also recognized restructuring related costs of $6.4 million related to this plan, the majority of which constituted accelerated depreciation and other costs and was primarily reported within cost of goods sold.
2016 Other Restructuring Programs
During 2016, the Company committed to programs designed to improve operating efficiencies and reduce costs. The programs involve the consolidation of certain global administrative functions and manufacturing operations (the "Other 2016 Restructuring Programs"). The programs commenced in the second half of 2016 and are expected to be substantially complete by the end of the first quarter 2018. The Company estimates that it will record aggregate pre-tax charges of $3.8 million to $4.7 million related to these programs, which constitute termination benefits and contract termination costs that will result in cash outlays. Additionally, the Company expects to incur approximately $1.5 million of accelerated depreciation and other costs directly related to these programs and anticipates that these costs will be recognized as cost of goods sold, approximately $0.6 million of which is expected to result in cash outlays. As of December 31, 2016, the Company has a reserve of $1.9 million related to these programs.
F-17
TELEFLEX INCORPORATED
NOTES TO CONSOLIDATED FINANCIAL STATEMENTS — (Continued)
2014 Manufacturing Footprint Realignment Plan
In April 2014, the Company's Board of Directors approved a restructuring plan (the "2014 Manufacturing Footprint Realignment Plan") involving the consolidation of operations and a related reduction in workforce at certain facilities, and the relocation of manufacturing operations from certain higher-cost locations to existing lower-cost locations. These actions commenced in the second quarter 2014.
During the third quarter 2016, the Company revised its expense and timing estimates related to the 2014 Manufacturing Footprint Realignment Plan to reflect the impact of changes the Company has implemented with respect to medication delivery devices included in certain of the kits primarily sold by the Company’s Vascular North America operating segment and, to a lesser extent, the Company's Anesthesia North America operating segment. The Company estimates that it will incur aggregate pre-tax charges in connection with the 2014 Manufacturing Footprint Realignment Plan of approximately $43 million to $48 million, compared to the Company’s prior estimate of approximately $37 million to $44 million. The Company expects aggregate cash outlays associated with the plan to be in the range of $33 million to $38 million, compared to its prior estimate of approximately $26 million to $31 million. Most of these charges and cash outlays are expected to be incurred prior to 2020. Additionally, the Company continues to expect that it will incur $24 million to $30 million in aggregate capital expenditures under the plan.
The Company currently expects that the 2014 Manufacturing Footprint Realignment Plan will be substantially complete by the end of the first half of 2020 rather than the end of 2017, as was previously estimated.
The following table provides a summary of the Company’s cost estimates by major type of expense associated with the 2014 Manufacturing Footprint Realignment Plan, which reflect the revised estimates:
Type of expense | Total estimated amount expected to be incurred |
Termination benefits | $11 million to $12 million |
Facility closure and other exit costs (1) | $1 million to $2 million |
Accelerated depreciation charges | $10 million to $10 million |
Other (2) | $21 million to $24 million |
$43 million to $48 million | |
(1) | Includes costs to transfer product lines among facilities and outplacement and employee relocation costs. |
(2) | Consists of other costs directly related to the plan, including project management, legal and regulatory costs. |
As the 2014 Manufacturing Footprint Realignment Plan progresses, management will reevaluate the estimated expenses and charges set forth above, and may revise its estimates, as appropriate, consistent with generally accepted accounting principles.
The following table summarizes the activity related to the 2014 Manufacturing Footprint Realignment Plan restructuring reserve:
Termination benefits | Facility closure and other exit costs | Contract termination costs | Total | ||||||||||||
(Dollars in thousands) | |||||||||||||||
Balance at December 31, 2014 | $ | 9,097 | $ | — | $ | — | $ | 9,097 | |||||||
Subsequent accruals | 1,007 | 289 | 389 | 1,685 | |||||||||||
Cash payments | (2,657 | ) | (289 | ) | (389 | ) | (3,335 | ) | |||||||
Balance at December 31, 2015 | 7,447 | — | — | 7,447 | |||||||||||
Subsequent accruals | 81 | 38 | — | 119 | |||||||||||
Cash payments | (2,158 | ) | (38 | ) | — | (2,196 | ) | ||||||||
Balance at December 31, 2016 | $ | 5,370 | $ | — | $ | — | $ | 5,370 | |||||||
For the years ended December 31, 2016, 2015 and 2014 the Company reported restructuring related costs of $8.5 million, $9.5 million and $4.9 million, respectively, related to this plan within cost of goods sold. These costs related to accelerated depreciation and certain other costs, primarily for the transfer of manufacturing operations from the existing locations to the new locations in connection with the plan.
F-18
TELEFLEX INCORPORATED
NOTES TO CONSOLIDATED FINANCIAL STATEMENTS — (Continued)
As of December 31, 2016, the Company has incurred net aggregate restructuring expenses related to the plan of $11.1 million. Additionally, as of December 31, 2016, the Company has incurred net aggregate accelerated depreciation and certain other costs in connection with the plan of $22.9 million, which were included in cost of goods sold.
Other Restructuring Programs
2015 Restructuring Programs
During 2015, the Company committed to programs associated with the reorganization of certain businesses and shared service center functions as well as the consolidation of certain facilities in North America. As of December 31, 2016, the Company incurred net aggregate restructuring charges under these programs of $6.4 million. The Company expects future restructuring expenses associated with these programs, if any, to be nominal. As of December 31, 2016, the Company had a reserve of $0.1 million related to these programs. The Company expects to complete these programs in 2017.
2014 European Restructuring Plan
In February 2014, the Company committed to a restructuring plan (the “2014 European Restructuring Plan”), which impacts certain administrative functions in Europe and involves the consolidation of operations and a related reduction in workforce at certain of the Company’s European facilities. As of December 31, 2016, the Company incurred net aggregate restructuring charges under the plan of $7.7 million. The Company expects future restructuring expenses associated with the 2014 European Restructuring Plan, if any, to be nominal. As of December 31, 2016, the Company has a reserve of $0.2 million in connection with the program. The Company expects to complete this plan in 2017.
Other 2014 Restructuring Programs
In June 2014, the Company initiated programs to consolidate locations in Australia and terminate certain European distributor agreements in an effort to reduce costs. The Company incurred aggregate restructuring charges of $3.6 million related to these programs, which were completed in 2015.
2013 Restructuring Programs
In 2013, the Company initiated restructuring programs to consolidate administrative and manufacturing facilities in North America and warehouse facilities in Europe and terminate certain European distributor agreements in an effort to reduce costs. The Company incurred net aggregate restructuring charges of $10.9 million related to these programs, which were completed in 2015.
LMA Restructuring Program
In connection with the acquisition of substantially all of the assets of LMA International N.V. (the “LMA business”) in 2012, the Company commenced a program (the "LMA Restructuring Program") related to the integration of the LMA business and the Company’s other businesses. The program was focused on the closure of the LMA business’ corporate functions and the consolidation of manufacturing, sales, marketing, and distribution functions in North America, Europe and Asia. The Company incurred net aggregate restructuring charges related to the LMA Restructuring Program of $11.3 million. The Company completed the program in 2015. For the year ended December 31, 2014, the Company recorded a net credit of $3.3 million, primarily resulting from the reversal of contract termination costs following the favorable settlement of a terminated distributor agreement.
2012 Restructuring Program
In 2012, the Company identified opportunities to improve its supply chain strategy by consolidating its three North American warehouses into one centralized warehouse, and lower costs and improve operating efficiencies through the termination of certain distributor agreements in Europe, the closure of certain North American facilities and workforce reductions. As of December 31, 2016, the Company has incurred net aggregate restructuring and impairment charges of $6.2 million in connection with this program, and expects future restructuring expenses associated with the program, if any, to be nominal. As of December 31, 2016, the Company has a reserve of $0.2 million in connection with the program. The Company expects to complete this program in 2017.
F-19
TELEFLEX INCORPORATED
NOTES TO CONSOLIDATED FINANCIAL STATEMENTS — (Continued)
Restructuring Charges by Segment
Restructuring charges by reportable operating segment for the years ended December 31, 2016, 2015, and 2014 are set forth in the following table:
2016 | 2015 | 2014 | |||||||||
(Dollars in thousands) | |||||||||||
Vascular North America | $ | 5,906 | $ | 3,742 | $ | 8,057 | |||||
Anesthesia North America | 1,839 | 384 | 1,379 | ||||||||
Surgical North America | 151 | 397 | — | ||||||||
EMEA | 4,423 | 4 | 6,375 | ||||||||
Asia | — | 313 | 1,305 | ||||||||
OEM | 795 | 61 | — | ||||||||
All other | 2,757 | 2,918 | 753 | ||||||||
Total restructuring charges | $ | 15,871 | $ | 7,819 | $ | 17,869 | |||||
Other Impairment Charges
IPR&D Impairment Charge
In May 2012, the Company acquired Semprus BioSciences Corp. (“Semprus”), a biomedical research and development company that developed a polymer surface treatment technology intended to reduce thrombus-related complications. Through 2016, the Company continued to engage in research and development activities designed to support an application for regulatory approval and achieve commercialization of the technology. However, upon considering the continuing challenges, remaining risks and uncertainties and significant additional resources required in connection with the development and commercialization of the technology, as well as the availability and advances made with respect to other technologies, during the fourth quarter of 2016, the Company determined it would not be commercially reasonable to continue its efforts to develop the Semprus technology. As a result, the Company has significantly reduced, and over the course of 2017 will discontinue, its research and development efforts with regard to the Semprus technology. Consequently, the Company recognized a pre-tax impairment charge of $41.0 million ($26.1 million after tax) for the year ended December 31, 2016.
See Note 10 for the impacts to contingent consideration resulting from the developments described above.
Long-lived Asset Impairment Charges
During the fourth quarter the Company recorded $2.4 million in impairment charges related to two properties, one of which was classified as a held for sale building asset.
The asset impairment charges were measured at fair value based on the sales contract with the buyer, adjusted to reflect associated disposition costs, which is considered a significant unobservable inputs and categorized as Level 3 under the fair value hierarchy as defined in Note 10.
There were no impairment charges for the years ended December 31, 2015 or 2014.
Note 5 — Inventories
Inventories, net at December 31, 2016 and 2015 consist of the following:
2016 | 2015 | ||||||
(Dollars in thousands) | |||||||
Raw materials | $ | 65,319 | $ | 68,460 | |||
Work-in-process | 54,555 | 57,079 | |||||
Finished goods | 196,297 | 204,736 | |||||
Inventories, net | 316,171 | 330,275 | |||||
F-20
TELEFLEX INCORPORATED
NOTES TO CONSOLIDATED FINANCIAL STATEMENTS — (Continued)
Note 6 — Property, plant and equipment
The major classes of property, plant and equipment, at cost, at December 31, 2016 and 2015 are as follows:
2016 | 2015 | ||||||
(Dollars in thousands) | |||||||
Land, buildings and leasehold improvements | $ | 188,679 | $ | 197,365 | |||
Machinery and equipment | 319,471 | 313,404 | |||||
Computer equipment and software | 108,547 | 99,343 | |||||
Construction in progress | 47,428 | 45,945 | |||||
664,125 | 656,057 | ||||||
Less: Accumulated depreciation | (361,226 | ) | (339,934 | ) | |||
Property, plant and equipment, net | $ | 302,899 | $ | 316,123 | |||
Note 7 — Goodwill and other intangible assets
Changes in the carrying amount of goodwill, by reportable operating segment, for the years ended December 31, 2016 and 2015 are as follows:
Vascular North America | Anesthesia North America | Surgical North America | EMEA | Asia | OEM | All other | Total | ||||||||||||||||||||||||
(Dollars in thousands) | |||||||||||||||||||||||||||||||
Balance as of December 31, 2015 | $ | 345,546 | $ | 141,122 | $ | 250,912 | $ | 306,009 | $ | 141,067 | $ | 1,194 | $ | 110,002 | $ | 1,295,852 | |||||||||||||||
Goodwill related to acquisitions | — | — | — | — | — | 3,689 | — | 3,689 | |||||||||||||||||||||||
Translation adjustment | — | 131 | — | (15,968 | ) | (2,882 | ) | — | (4,102 | ) | (22,821 | ) | |||||||||||||||||||
Balance as of December 31, 2016 | $ | 345,546 | $ | 141,253 | $ | 250,912 | $ | 290,041 | $ | 138,185 | $ | 4,883 | $ | 105,900 | $ | 1,276,720 | |||||||||||||||
Vascular North America | Anesthesia North America | Surgical North America | EMEA | Asia | OEM | All other | Total | ||||||||||||||||||||||||
(Dollars in thousands) | |||||||||||||||||||||||||||||||
Balance as of December 31, 2014 | |||||||||||||||||||||||||||||||
Goodwill | $ | 564,177 | $ | 214,429 | $ | 250,912 | $ | 339,029 | $ | 144,712 | $ | — | $ | 142,422 | $ | 1,655,681 | |||||||||||||||
Accumulated impairment losses | (219,527 | ) | (84,531 | ) | — | — | — | — | (28,070 | ) | (332,128 | ) | |||||||||||||||||||
344,650 | 129,898 | 250,912 | 339,029 | 144,712 | — | 114,352 | 1,323,553 | ||||||||||||||||||||||||
Goodwill related to acquisitions | 896 | 12,398 | — | 1,142 | 4,095 | 1,194 | — | 19,725 | |||||||||||||||||||||||
Translation adjustment | — | (1,174 | ) | — | (34,162 | ) | (7,740 | ) | — | (4,350 | ) | (47,426 | ) | ||||||||||||||||||
Balance as of December 31, 2015 | $ | 345,546 | $ | 141,122 | $ | 250,912 | $ | 306,009 | $ | 141,067 | $ | 1,194 | $ | 110,002 | $ | 1,295,852 | |||||||||||||||
F-21
TELEFLEX INCORPORATED
NOTES TO CONSOLIDATED FINANCIAL STATEMENTS — (Continued)
Intangible assets at December 31, 2016 and 2015 consisted of the following:
Gross Carrying Amount | Accumulated Amortization | ||||||||||||||
2016 | 2015 | 2016 | 2015 | ||||||||||||
(Dollars in thousands) | |||||||||||||||
Customer lists | $ | 622,428 | $ | 621,078 | $ | (239,055 | ) | $ | (214,924 | ) | |||||
In-process research and development | 16,532 | 58,908 | — | — | |||||||||||
Intellectual property | 519,962 | 522,374 | (203,390 | ) | (173,903 | ) | |||||||||
Distribution rights | 23,021 | 23,279 | (15,239 | ) | (14,393 | ) | |||||||||
Trade names | 379,724 | 384,821 | (13,974 | ) | (8,929 | ) | |||||||||
Noncompete agreements | 2,692 | 2,186 | (1,038 | ) | (522 | ) | |||||||||
$ | 1,564,359 | $ | 1,612,646 | $ | (472,696 | ) | $ | (412,671 | ) | ||||||
As of December 31, 2016, trade names having a carrying value of $280.6 million are considered indefinite-lived. Acquired IPR&D is indefinite-lived until the completion of the associated efforts, at which point amortization of the carrying value of the technology will commence.
See Note 4 for information on the Company's IPR&D impairment charge.
Amortization expense related to intangible assets was $63.5 million, $62.4 million, and $60.9 million for the years ended December 31, 2016, 2015 and 2014, respectively. Estimated annual amortization expense for each of the five succeeding years is as follows:
(Dollars in thousands) | |||
2017 | $ | 62,900 | |
2018 | 62,500 | ||
2019 | 62,200 | ||
2020 | 61,800 | ||
2021 | 61,400 | ||
F-22
TELEFLEX INCORPORATED
NOTES TO CONSOLIDATED FINANCIAL STATEMENTS — (Continued)
Note 8 — Borrowings
The Company's borrowings at December 31, 2016 and 2015 were as follows:
2016 | 2015 | ||||||
(Dollars in thousands) | |||||||
Senior Credit Facility: | |||||||
Revolving credit facility, at a rate of 2.27% at December 31, 2016 and 2.17% at December 31, 2015, due 2018 | $ | 210,000 | $ | 396,000 | |||
3.875% Convertible Senior Subordinated Notes due 2017 | 136,076 | 399,641 | |||||
4.875% Senior Notes due 2026 | 400,000 | — | |||||
5.25% Senior Notes due 2024 | 250,000 | 250,000 | |||||
Securitization program, at a rate of 1.52% at December 31, 2016 and 1.18% at December 31, 2015 | 50,000 | 43,300 | |||||
1,046,076 | 1,088,941 | ||||||
Less: Unamortized debt discount on 3.875% Convertible Senior Subordinated Notes due 2017 | (2,707 | ) | (22,999 | ) | |||
Less: Unamortized debt issuance costs | (10,046 | ) | (6,742 | ) | |||
1,033,323 | 1,059,200 | ||||||
Current portion of borrowings | (183,071 | ) | (417,350 | ) | |||
Long-term borrowings | $ | 850,252 | $ | 641,850 | |||
Vascular Solutions Acquisition Financing
On February 17, 2017, the Company acquired Vascular Solutions. The Company financed the acquisition through a combination of borrowings under its revolving credit facility and a senior secured term loan facility, both provided under its senior credit agreement, as amended and restated in January 2017. See Note 19 for additional information regarding the acquisition and related financing.
Senior Credit Facility
On July 16, 2013, the Company entered into an agreement (the "Senior Credit Agreement") under which the Company was provided an $850 million revolving credit facility (the "Revolving Credit Facility"). In 2016, the Company used $265 million in borrowings under the Revolving Credit Facility to fund the exchange transactions (the "Exchange Transactions") and conversions associated with the Convertible Notes that are described below under "Exchange Transactions," and used proceeds from the issuance of the 2026 Notes to repay, in part, $451 million in borrowings under the Senior Credit Facility. In 2015, the Company used $246 million in borrowings under the Revolving Credit Facility to help fund the prepayment of the 2019 Notes. The Senior Credit Agreement was amended and restated in January 2017. See Note 19 for additional information. The discussion below relates to the Senior Credit Agreement as in effect prior to the amendment and restatement.
The Revolving Credit Facility bore interest at an applicable rate elected by the Company generally equal to either the “base rate” (the greater of either the federal funds effective rate plus 0.5%, the prime rate or one month LIBOR plus 1.0%) plus an applicable margin of 0.25% to 1.00%, or a “LIBOR rate” for the period corresponding to the applicable interest period of the borrowings plus an applicable margin of 1.25% to 2.00%. As of December 31, 2016, the interest rate on the Revolving Credit Facility was 2.27% (comprised of the LIBOR rate of 0.77% plus a margin of 1.50%).
The Senior Credit Agreement contained covenants that, among other things, limited or restricted the Company's ability, and the ability of its subsidiaries, to incur debt, create liens, consolidate, merge or dispose of certain assets, make certain investments, engage in acquisitions, pay dividends on, repurchase or make distributions in respect of capital stock and enter into swap agreements. The Senior Credit Agreement also required the Company to maintain a consolidated leverage ratio (generally, the ratio of Consolidated Total Indebtedness to Consolidated EBITDA, each as defined in the Senior Credit Agreement) of not more than 4.0:1 and a consolidated interest coverage ratio (generally, Consolidated EBITDA to Consolidated Interest Expense, each as defined in the Senior Credit Agreement) of not less
F-23
TELEFLEX INCORPORATED
NOTES TO CONSOLIDATED FINANCIAL STATEMENTS — (Continued)
than 3.50:1 as of the last day of any period of consecutive fiscal quarters calculated in accordance with the definitions and methodology set forth in the Senior Credit Agreement and, during the six month period prior to the maturity of our Convertible Notes, a minimum liquidity of $400 million. At December 31, 2016, the Company's consolidated leverage ratio was 2.00:1 and its consolidated interest coverage ratio was 11.22:1, both of which were in compliance with the limits described in the preceding sentence. The obligations under the Senior Credit Agreement were guaranteed (subject to certain exceptions) by substantially all of the material domestic subsidiaries of the Company and (subject to certain exceptions and limitations) secured by a pledge on substantially all of the equity interests owned by the Company and each guarantor.
As of December 31, 2016 and 2015, the Company had outstanding irrevocable standby letters of credit of approximately $3.2 million and $3.8 million, respectively, with various third parties. The letters of credit reduced the amount of available funds under the Revolving Credit Facility by an equal amount.
Convertible Notes
On August 9, 2010, the Company issued $400.0 million of its 3.875% Convertible Senior Subordinated Notes due 2017 (the “Convertible Notes”). The Company pays interest on the Convertible Notes semi-annually on February 1 and August 1 of each year at a rate of 3.875% per year. The Convertible Notes mature on August 1, 2017. The Convertible Notes are the Company’s unsecured senior subordinated obligations and are (i) not guaranteed by any of the Company’s subsidiaries; (ii) subordinated in right of payment to all of the Company’s existing and future senior indebtedness; and (iii) junior to the Company’s existing and future secured indebtedness to the extent of the value of the assets securing such indebtedness.
The Convertible Notes are convertible into shares of the Company's common stock at the option of the holder upon the occurrence of any of the following circumstances (i) during any fiscal quarter, if the last reported sale price of the Company’s common stock for at least 20 trading days during a period of 30 consecutive trading days ending on the last trading day of the immediately preceding fiscal quarter exceeds 130% of the conversion price on each applicable trading day; or (ii) during the five business day period after any five consecutive trading day period (the “measurement period”) in which the trading price per $1,000 principal amount of Convertible Notes is less than 98% of the product of the last reported sale price of the common stock and the applicable conversion rate on each trading day during the measurement period; or (iii) upon the occurrence of specified corporate events; or (iv) at any time on or after May 1, 2017 up to and including July 28, 2017. The Convertible Notes are convertible at a conversion rate of 16.3084 shares of common stock per $1,000 principal amount of Convertible Notes, which is equivalent to a conversion price of approximately $61.32 per share. The conversion rate is subject to adjustment upon certain events. Upon conversion, the Company’s conversion obligation may be satisfied, at the Company’s option, in shares of common stock, cash or a combination of cash and shares of common stock. The Company has elected a net-settlement method to satisfy its conversion obligation. Under the net-settlement method, the Company will settle the $1,000 principal amount of the Convertible Notes in cash and settle the excess conversion value in shares, plus cash in lieu of fractional shares.
Since the fourth quarter 2013, the Company's last reported sale price has exceeded the 130% threshold described above and accordingly the Convertible Notes have been classified as a current liability as of December 31, 2016 and 2015. Further, as of December 31, 2016, the Convertible Notes mature in less than one year. While the Company believes it has sufficient liquidity to repay the principal amount due (which already has been substantially reduced as a result of the Exchange Transactions and conversions described below) through a combination of utilizing its existing cash on hand and accessing its credit facility, the Company's use of these funds could adversely affect its results of operations and liquidity.
In connection with the issuance of the Convertible Notes, the Company entered into convertible note hedge transactions with two counterparties pursuant to which it purchased call options for $88.0 million ($56.0 million net of tax) in private transactions. The call options enable the Company to receive, in effect for no additional consideration, shares of the Company’s common stock and/or cash from counterparties equal to the amounts of common stock and/or cash related to the excess value over the conversion price that it would pay to the holders of the Convertible Notes upon conversion. The call options will terminate on the earlier of July 28, 2017 or the first day upon which all of the Convertible Notes are no longer outstanding.
The Company also entered into privately negotiated warrant transactions with the same counterparties generally relating to the same number of shares of common stock as are subject to the call options. Under certain circumstances, the Company may be required under the terms of the warrant transactions to issue up to 7,981,422 shares of Company
F-24
TELEFLEX INCORPORATED
NOTES TO CONSOLIDATED FINANCIAL STATEMENTS — (Continued)
common stock (subject to adjustments). The warrants were divided into components that expire ratably over a 180 day period commencing November 1, 2017. The exercise price of the warrants is approximately $74.65 per share of Company common stock, subject to customary anti-dilution adjustments. Proceeds received from the issuance of the warrants totaled approximately $59.4 million.
The convertible note hedge and warrant transactions described above are intended to reduce the potential dilution with respect to the Company’s common stock and/or reduce the Company’s exposure to potential cash payments that the Company may be required to make upon conversion of the Convertible Notes by, in effect, increasing the conversion price, from the Company’s economic standpoint, to $74.65 per share. However, the warrant transactions could have a dilutive effect with respect to the Company's common stock or, if the Company so elects, obligate the Company to make cash payments to the extent that the market price per share of common stock exceeds $74.65 per share on any date upon which the warrants are exercised.
The Company allocated the proceeds of the Convertible Notes between the liability and equity components of the debt. The initial $316.3 million liability component was determined based on the fair value of a similar debt instrument excluding the conversion feature. The initial $83.7 million ($53.3 million net of tax) equity component represented the difference between the fair value or carrying value of $316.3 million of the debt and the $400.0 million of proceeds. The related debt discount of $83.7 million is being amortized under the interest method over the remaining life of the Convertible Notes. An effective interest rate of 7.814% was used to calculate the debt discount on the Convertible Notes.
As a result of the April 2016 Hedge Unwind Agreements described below under “Exchange Transactions,” the number of shares subject to outstanding call options was reduced to reflect proportionately the reduction in the outstanding principal amount of the Convertible Notes following the Exchange Transactions. The remaining call options will terminate upon the earlier of July 28, 2017 or the first day all of the related Convertible Notes are no longer outstanding due to conversion or otherwise. In addition, the Company entered into warrant unwind agreements (the “Warrant Unwind Agreements”) with the dealer counterparties to reduce the number of warrants initially issued to the dealer counterparties in connection with the initial issuance of the Convertible Notes. On a net basis, after giving effect to the Hedge Unwind Agreements and Warrant Unwind Agreements, the Company received 0.3 million shares of Company common stock from such dealer counterparties.
Exchange Transactions
On April 4, 2016, pursuant to separate, privately negotiated agreements between the Company and certain of the holders (the "Holders") of the "Convertible Notes, the Company paid cash and common stock (the "Exchange Consideration") to the Holders in exchange for $219.2 million aggregate principal amount of the Convertible Notes (the "Exchange Transactions"). The Exchange Consideration paid to each of the Holders per $1,000 principal amount of Convertible Notes is equal to: (i) $1,000 in cash, (ii) a number of shares of the Company’s common stock equal to the amount of the conversion value of the Convertible Notes in excess of the $1,000 principal amount (the "Conversion Shares"), calculated on the basis of the average daily volume weighted average price per share of Company common stock over a specified period (the "Average Daily VWAP"), (iii) an inducement payment in additional shares of common stock (the "Inducement Shares"), calculated based on the Average Daily VWAP and (iv) cash in an amount equal to accrued and unpaid interest to, but not including, the closing date. As a result of the Exchange Transactions, the Company paid the Holders aggregate cash consideration of $220.7 million (which includes $1.5 million in accrued but previously unpaid interest) and issued and delivered to the Holders 2.17 million shares of Company common stock (including both Conversion Shares and Inducement Shares).The Company funded the $220.7 million cash payment constituting part of the Exchange Consideration through borrowings under the Revolving Credit Facility. The issuance of the shares of the Company’s common stock to the Holders pursuant to the Exchange Transactions was made pursuant to the exemption from the registration requirements of the Securities Act of 1933, as amended (the "Securities Act"), under Section 3(a)(9) of the Securities Act. As a result of the Exchange Transactions, the Company recognized a loss on extinguishment of debt of $16.3 million.
In connection with entering into the Exchange Transactions, the Company also entered into bond hedge unwind agreements (the "Hedge Unwind Agreements") with the dealer counterparties to the convertible note hedge transactions that were effected at the time of the initial issuance of the Convertible Notes. Under the Hedge Unwind Agreements, the number of call options subject to the Convertible Note hedge transactions was reduced to reflect proportionately the reduction in the outstanding principal amount of the Convertible Notes following the Exchange Transactions. In addition, the Company entered into warrant unwind agreements (the “Warrant Unwind Agreements”) with the dealer counterparties to reduce the number of warrants initially issued to the dealer counterparties, also in connection with
F-25
TELEFLEX INCORPORATED
NOTES TO CONSOLIDATED FINANCIAL STATEMENTS — (Continued)
the initial issuance of the Convertible Notes. On a net basis, after giving effect to the Hedge Unwind Agreements and Warrant Unwind Agreements, the Company received 0.3 million shares of Company common stock from such dealer counterparties.
See Note 19 for information regarding Convertible Note exchange transactions that settled in January 2017.
Conversions
During 2016, $44.4 million in aggregate principal amount of the Convertible Notes (the "Converted Notes") were tendered to the Company for conversion. In connection with these conversions, the Company delivered to each holder of the Converted Notes (the "Converting Holders") a combination of cash and shares of Company common stock, based on the conversion methodology set forth in the supplemental indenture relating to the Convertible Notes. The Company provided the Converting Holders, in the aggregate, $44.4 million in cash and 0.4 million shares of Company common stock. As a result of the conversions, the Company recognized a loss on extinguishment of debt of $3.0 million. Prior to 2016, approximately $0.4 million in aggregate principal amount of Convertible Notes had been converted.
Under the terms of the agreements related to the Convertible Note hedge transactions, and in connection with the conversions described above, the counterparties to the Convertible Note hedge transactions delivered to the Company 0.4 million shares of Company common stock, which was equal to the number of shares of Company common stock delivered to the Converting Holders. Additionally, the Company entered into warrant unwind agreements with the dealer counterparties to reduce the number of warrants initially issued. The Company delivered 0.4 million shares of Company common stock to the dealer counterparties in connection with the warrant unwind agreements.
5.25% Senior Notes due 2024
On May 21, 2014, the Company issued $250 million of 5.25% Senior Notes due 2024 (which, as originally issued, or in the substantially identical form issued April 2015 in exchange for the originally issued notes (as discussed below), are referred to as the "2024 Notes"). The Company pays interest on the 2024 Notes semi-annually on June 15 and December 15, at a rate of 5.25% per year. The 2024 Notes will mature on June 15, 2024, unless earlier redeemed by the Company at its option, as described below, or purchased by the Company at the holder’s option under specified circumstances following a Change of Control or Asset Sale (each as defined in the indenture related to the 2024 Notes).
The Company's obligations under the 2024 Notes are fully and unconditionally guaranteed, jointly and severally, by each of the Company’s existing and future 100% owned domestic subsidiaries that is a guarantor or other obligor under the Company’s revolving credit facility and by certain of the Company’s other 100% owned domestic subsidiaries. The guarantees are subject to certain customary automatic release provisions. See Note 17 for further information regarding the guarantors under the 2024 Notes.
At any time on or after June 15, 2019, the Company may, on one or more occasions, redeem some or all of the 2024 Notes at a redemption price of 102.625% of the principal amount of the 2024 Notes subject to redemption, declining, in annual increments of 0.875%, to 100% of the principal amount on June 15, 2022, plus accrued and unpaid interest. In addition, at any time prior to June 15, 2019, the Company may, on one or more occasions, redeem some or all of the 2024 Notes at a redemption price equal to 100% of the principal amount of the 2024 Notes redeemed, plus a “make-whole” premium and any accrued and unpaid interest. The “make-whole” premium is the greater of (a) 1.0% of the principal amount of the 2024 Notes subject to redemption or (b) the excess, if any, over the principal amount of the 2024 Notes of the present value, on the redemption date, of the sum of (i) the June 15, 2019 optional redemption price plus (ii) all required interest payments on the 2024 Notes through June 15, 2019 (other than accrued and unpaid interest to the redemption date), calculated based on a specified Treasury rate, generally for the period most nearly equal to the period from the redemption date to June 15, 2019, plus 50 basis points.
In addition, at any time prior to June 15, 2017, the Company may, on one or more occasions, redeem up to 35% of the aggregate principal amount of the 2024 Notes, using the proceeds of specified types of Company equity offerings and subject to specified conditions, at a redemption price equal to 105.25% of the principal amount of the Notes redeemed, plus accrued and unpaid interest.
The indenture relating to the 2024 Notes contains covenants that, among other things, limit or restrict the Company’s ability, and the ability of its subsidiaries, to incur debt, create liens, consolidate, merge or dispose of certain
F-26
TELEFLEX INCORPORATED
NOTES TO CONSOLIDATED FINANCIAL STATEMENTS — (Continued)
assets, make certain investments, engage in acquisitions, and pay dividends on, repurchase or make distributions in respect of capital stock.
On March 30, 2015, the Company commenced an exchange offer with respect to the 5.25% Senior Notes due 2024 that initially were issued in May 2014 (the "Old 2024 Notes"), under which the holders of the Old 2024 Notes, which were issued in a private placement, were provided an opportunity to exchange the Old 2024 Notes for new notes (the "New 2024 Notes") issued pursuant to a registration statement under the Securities Act of 1933. Other than the absence of registration rights for the holders of the New 2024 Notes, the terms of the New 2024 Notes are essentially identical to the terms of the Old 2024 Notes.The exchange offer was completed on April 24, 2015; all of the holders of the Old 2024 Notes exchanged their Old 2024 Notes for New 2024 Notes.
4.875% Senior Notes due 2026
On May 16, 2016, the Company issued $400.0 million of 4.875% Senior Notes due 2026 (the "2026 Notes"). The Company pays interest on the 2026 Notes semi-annually on June 1 and December 1, commencing on December 1, 2016, at a rate of 4.875% per year. The 2026 Notes mature on June 1, 2026 unless earlier redeemed by the Company at its option, as described below, or purchased by the Company at the holder’s option under specified circumstances following a Change of Control or Asset Sale (each as defined in the Indenture related to the 2026 Notes) or upon the Company’s election to exercise its optional redemption rights, as described below. The Company incurred transaction fees of approximately $6.5 million, including underwriters’ discounts and commissions, in connection with the offering of the 2026 Notes, which were recorded as a reduction to long-term borrowings and are being amortized over the term of the 2026 Notes. The Company used the net proceeds from the offering to repay borrowings under the Revolving Credit Facility.
The Company's obligations under the 2026 Notes are fully and unconditionally guaranteed, jointly and severally, by each of the Company’s existing and future 100% owned domestic subsidiaries that is a guarantor or other obligor under the Revolving Credit Facility and by certain of the Company’s other 100% owned domestic subsidiaries.
At any time on or after June 1, 2021, the Company may, on one or more occasions, redeem some or all of the 2026 Notes at a redemption price of 102.438% of the principal amount of the 2026 Notes subject to redemption, declining, in annual increments of 0.813%, to 100% of the principal amount on June 1, 2024, plus accrued and unpaid interest. In addition, at any time prior to June 1, 2021, the Company may, on one or more occasions, redeem some or all of the 2026 Notes at a redemption price equal to 100% of the principal amount of the 2026 Notes redeemed, plus a “make-whole” premium and any accrued and unpaid interest. The “make-whole” premium is the greater of (a) 1.0% of the principal amount of the 2026 Notes subject to redemption or (b) the excess, if any, over the principal amount of the 2026 Notes of the present value, on the redemption date of the sum of (i) the June 1, 2021 optional redemption price plus (ii) all required interest payments on the 2026 Notes through June 1, 2021 (other than accrued and unpaid interest to the redemption date), generally computed using a discount rate equal to the yield to maturity of U.S. Treasury securities with a constant maturity for the period most nearly equal to the period from the redemption date to June 1, 2021, plus 50 basis points.
In addition, at any time prior to June 1, 2019, the Company may, on one or more occasions, redeem up to 40% of the aggregate principal amount of the 2026 Notes, using the proceeds of specified types of Company equity offerings and subject to specified conditions, at a redemption price equal to 104.875% of the principal amount of the Notes redeemed, plus accrued and unpaid interest.
The 2026 Notes contain covenants that, among other things, limit or restrict the Company’s ability, and the ability of its subsidiaries, to incur additional debt, or issue preferred stock or other disqualified stock; create liens; pay dividends, make investments or make other restricted payments; sell assets; merge, consolidate, sell or otherwise dispose of all or substantially all of the Company's assets; or enter into transactions with the Company's affiliates.
Prepayment of 6.875% Senior Subordinated Notes due 2019
On June 13, 2011, the Company issued $250 million of 6.875% Senior Subordinated Notes due 2019 (the “2019 Notes”). The Company paid interest on the 2019 Notes semi-annually on June 1 and December 1. On June 1, 2015, the Company prepaid the $250 million aggregate outstanding principal amount under the 2019 Notes. In addition to its prepayment of principal, the Company paid the holders of the 2019 Notes an $8.6 million prepayment make-whole amount plus accrued and unpaid interest. The Company recognized the prepayment make-whole amount and a $1.9 million write-off of unamortized debt issuance costs as a loss on extinguishment of debt in the consolidated statement
F-27
TELEFLEX INCORPORATED
NOTES TO CONSOLIDATED FINANCIAL STATEMENTS — (Continued)
of income for the year ended December 31, 2015. The Company used $246 million in borrowings under the Revolving Credit Facility, $12.1 million in borrowings under the Company's accounts receivable securitization program (described below) and available cash to fund the prepayment of the 2019 Notes.
Securitization Program
The Company has an accounts receivable securitization facility under which accounts receivable of certain domestic subsidiaries are sold on a non-recourse basis to a special purpose entity (“SPE”), which is a bankruptcy-remote, consolidated subsidiary of Teleflex. Accordingly, the assets of the SPE are not available to satisfy the obligations of Teleflex or any of its subsidiaries. The SPE sells undivided interests in those receivables to an asset backed commercial paper conduit for consideration of up to $50.0 million. This facility is utilized from time to time to provide increased flexibility in funding short term working capital requirements. The agreement governing the accounts receivable securitization facility contains certain covenants and termination events. An occurrence of an event of default or a termination event under this facility may give rise to the right of its counterparty to terminate this facility. As of December 31, 2016, the Company was in compliance with the covenants, and none of the termination events had occurred. As of December 31, 2016 and 2015, the Company had $50.0 million (the maximum amount available) and $43.3 million, respectively, of outstanding borrowings under its accounts receivable securitization facility.
Fair Value of Long-Term Debt
The carrying amount of current and long-term borrowings as reported in the consolidated balance sheet as of December 31, 2016 is $1,033.3 million. To determine the fair value of its debt for which quoted prices are not available, the Company uses a discounted cash flow technique that incorporates a market interest yield curve with adjustments for duration, optionality and risk profile. The Company’s implied credit rating is a factor in determining the market interest yield curve. The following table provides the fair value of the Company’s debt as of December 31, 2016 and 2015, categorized by the level of inputs within the fair value hierarchy used to measure fair value (see Note 10 to the consolidated financial statements for further information):
Fair value of debt | |||||||
December 31, 2016 | December 31, 2015 | ||||||
(Dollars in thousands) | |||||||
Level 1 | $ | 344,765 | $ | 858,709 | |||
Level 2 | 929,362 | 687,072 | |||||
Total | $ | 1,274,127 | $ | 1,545,781 | |||
Debt Maturities
As of December 31, 2016, the aggregate amounts of long-term debt, demand loans and debt under the Company’s securitization program that will mature during each of the next four years and thereafter were as follows:
(Dollars in thousands) | |||
2017 | $ | 186,076 | |
2018 | 210,000 | ||
2019 | — | ||
2020 | — | ||
2021 and thereafter | 650,000 | ||
Note 9 — Financial instruments
Foreign Currency Forward Contracts Designated as Cash Flow Hedges
The Company uses derivative instruments for risk management purposes. Foreign currency forward contracts are used to manage foreign currency transaction exposure. These derivative instruments are designated as cash flow hedges and are recognized at fair value. The effective portion of the gains or losses on derivatives is reported as a component of other comprehensive loss and thereafter is recognized in the consolidated statement of income in the period or periods during which the hedged transaction affects earnings. Gains and losses on the derivatives representing
F-28
TELEFLEX INCORPORATED
NOTES TO CONSOLIDATED FINANCIAL STATEMENTS — (Continued)
either hedge ineffectiveness or hedge components excluded from the assessment of effectiveness, if any, are recognized in the consolidated statement of income in the period in which such gains and losses occur.
Non-designated Foreign Currency Forward Contracts
During the third quarter 2015, the Company began using foreign currency forward contracts as part of its strategy to manage exposure related to near term foreign currency denominated monetary assets and liabilities. These currency forward contracts are not designated as cash flow, fair value or net investment hedges; therefore, the changes in fair value of these currency forward contracts are recognized in the consolidated statements of income as a selling, general and administrative expense. The Company enters into foreign currency forward contracts for periods consistent with its currency translation exposures, which generally approximate one month. For the years ended December 31, 2016 and 2015, the Company recognized a loss related to non-designated foreign currency forward contracts of $2.3 million and $1.5 million, respectively.
The following table presents the locations in the consolidated balance sheet and fair value of derivative instruments as of December 31, 2016 and 2015:
December 31, 2016 | December 31, 2015 | ||||||
Fair Value | |||||||
(Dollars in thousands) | |||||||
Asset derivatives: | |||||||
Designated foreign currency forward contracts | $ | 667 | $ | 285 | |||
Non-designated foreign currency forward contracts | 490 | 44 | |||||
Prepaid expenses and other current assets | 1,157 | 329 | |||||
Total asset derivatives | 1,157 | 329 | |||||
Liability derivatives: | |||||||
Designated foreign currency forward contracts | 2,139 | 807 | |||||
Non-designated foreign currency forward contracts | 118 | 491 | |||||
Other current liabilities | 2,257 | 1,298 | |||||
Total liability derivatives | $ | 2,257 | $ | 1,298 | |||
The total notional amount for all open foreign currency forward contracts designated as cash flow hedges as of December 31, 2016 and 2015 was $101.8 million and $49.5 million, respectively. The total notional amount for all open non-designated foreign currency forward contracts as of December 31, 2016 and 2015 was $73.4 million and $69.1 million, respectively. All open foreign currency forward contracts as of December 31, 2016 have durations of twelve months or less.
The following table provides information as to the gains and losses attributable to derivatives that were designated as cash flow hedges and reported in other comprehensive income (loss) (“OCI”) for the years ended December 31, 2016, 2015 and 2014:
After Tax Gain (Loss) Recognized in OCI | |||||||||||
2016 | 2015 | 2014 | |||||||||
(Dollars in thousands) | |||||||||||
Foreign currency exchange contracts | $ | 67 | $ | (2,491 | ) | $ | — | ||||
See Note 11 for information on the location and amount of gains and losses attributable to derivatives that were reclassified from accumulated other comprehensive income (loss) (“AOCI”) to expense (income), net of tax.
For the years ended December 31, 2016, 2015 and 2014, there was no ineffectiveness related to the Company’s hedging derivatives.
F-29
TELEFLEX INCORPORATED
NOTES TO CONSOLIDATED FINANCIAL STATEMENTS — (Continued)
Concentration of Credit Risk
Concentrations of credit risk with respect to trade accounts receivable is generally limited due to the Company’s large number of customers and their diversity across many geographic areas. However, a portion of the Company’s trade accounts receivable outside the United States include sales to government-owned or supported healthcare systems in several countries which are subject to payment delays. Payment is dependent upon the creditworthiness of the healthcare systems in those countries and the financial stability of their economies.
In the ordinary course of business, the Company grants non-interest bearing trade credit to its customers on normal credit terms. In an effort to reduce its credit risk, the Company (i) establishes credit limits for all of its customer relationships, (ii) performs ongoing credit evaluations of its customers’ financial condition, (iii) monitors the payment history and aging of its customers’ receivables, and (iv) monitors open orders against an individual customer’s outstanding receivable balance.
An allowance for doubtful accounts is maintained for trade accounts receivable based on the Company's historical collection experience and expected collectability of accounts receivable, considering the length of time an account is outstanding, the financial position of the customer and information provided by credit rating services. The adequacy of this allowance is reviewed each reporting period and adjusted as necessary. The allowance for doubtful accounts was $8.6 million and $8.0 million at December 31, 2016 and 2015, respectively. The current portion of the allowance for doubtful accounts at December 31, 2016 and 2015 of $2.0 million and $2.0 million, respectively, was reported within accounts receivable, net. The allowance for doubtful accounts on receivables outstanding for greater than one year at December 31, 2016 and 2015 of $6.6 million and $6.0 million, respectively, is recognized in other assets.
Certain of the Company’s customers, particularly in Greece, Italy, Portugal and Spain have extended or delayed payments for products and services already provided, raising collectability concerns regarding the Company’s trade accounts receivable from these customers. As a result, the Company continues to closely monitor the allowance for doubtful accounts with respect to these customers and uses other risk mitigation strategies such as selling receivables. The aggregate net current and long-term trade accounts receivable for customers in Greece, Italy, Spain and Portugal and the percentage of the Company’s total net current and long-term trade accounts receivable represented by the net current and long-term trade accounts receivable for customers in those countries at December 31, 2016 and 2015 are as follows:
December 31, 2016 | December 31, 2015 | ||||||
(Dollars in thousands) | |||||||
Current and long-term trade accounts receivable (net of allowances of $7.7 million and $7.2 million in 2016 and 2015, respectively) in Greece, Italy, Spain and Portugal (1) | $ | 51,098 | $ | 62,272 | |||
Percentage of total net current and long-term trade accounts receivables | 19.3 | % | 23.9 | % | |||
(1) The long-term portion of trade accounts receivable, net from customers in Greece, Italy, Spain and Portugal at December 31, 2016 and 2015 was $2.7 million and $8.1 million, respectively. In January 2017, the Company sold $16.1 million of receivables outstanding with publicly funded hospitals in Italy for $16.0 million.
For the years ended December 31, 2016, 2015 and 2014, net revenues from customers in Greece, Italy, Spain and Portugal were $125.3 million, $126.2 million and $150.5 million, respectively.
Note 10 — Fair value measurement
Fair value is the price that would be received from the sale of an asset or paid to transfer a liability, using assumptions that market participants would use in pricing an asset or liability. The FASB's fair value guidance establishes a three-level hierarchy of the inputs (i.e., assumptions that market participants would use in pricing an asset or liability) used to measure fair value, giving the highest priority to quoted prices in active markets and the lowest priority to unobservable inputs in measuring fair value. The categorization within the valuation hierarchy is based on the lowest level of input that is significant to the entire fair value measurement. The levels of inputs within the hierarchy used to measure fair value are as follows:
Level 1 — inputs to the fair value measurement that are quoted prices (unadjusted) in active markets for identical assets or liabilities.
F-30
TELEFLEX INCORPORATED
NOTES TO CONSOLIDATED FINANCIAL STATEMENTS — (Continued)
Level 2 — inputs to the fair value measurement that include quoted prices for similar assets or liabilities in active markets; quoted prices for identical or similar assets or liabilities in markets that are not active; inputs other than quoted prices that are observable for the asset or liability; and inputs that are derived principally from or corroborated by observable market data by correlation or other means.
Level 3 — inputs to the fair value measurement that are unobservable inputs for the asset or liability.
The following tables provide information regarding the Company's financial assets and liabilities measured at fair value on a recurring basis as of December 31, 2016 and 2015:
Total carrying value at December 31, 2016 | Quoted prices in active markets (Level 1) | Significant other observable inputs (Level 2) | Significant unobservable inputs (Level 3) | ||||||||||||
(Dollars in thousands) | |||||||||||||||
Investments in marketable securities | $ | 7,660 | $ | 7,660 | $ | — | $ | — | |||||||
Derivative assets | 1,157 | — | 1,157 | — | |||||||||||
Derivative liabilities | 2,257 | — | 2,257 | — | |||||||||||
Contingent consideration liabilities | 7,102 | — | — | 7,102 | |||||||||||
Total carrying value at December 31, 2015 | Quoted prices in active markets (Level 1) | Significant other observable inputs (Level 2) | Significant unobservable inputs (Level 3) | ||||||||||||
(Dollars in thousands) | |||||||||||||||
Investments in marketable securities | $ | 6,922 | $ | 6,922 | $ | — | $ | — | |||||||
Derivative assets | 329 | — | 329 | — | |||||||||||
Derivative liabilities | 1,298 | — | 1,298 | — | |||||||||||
Contingent consideration liabilities | 20,829 | — | — | 20,829 | |||||||||||
There were no changes in the inputs used to measure fair value of financial assets or liabilities among Level 1, Level 2 or Level 3 within the fair value hierarchy during the years ended December 31, 2016 or 2015.
The following table provides information regarding changes in the Company's contingent consideration liabilities for the years ended December 31, 2016 and 2015:
Contingent consideration | |||||||
2016 | 2015 | ||||||
(Dollars in thousands) | |||||||
Beginning balance – January 1 | $ | 20,829 | $ | 33,433 | |||
Payment | (7,282 | ) | (8,054 | ) | |||
Revaluations | (6,445 | ) | (4,550 | ) | |||
Ending balance – December 31 | $ | 7,102 | $ | 20,829 | |||
The Company reduced contingent consideration liabilities and selling, general and administrative expense by $8.3 million and $4.4 million for the years ended December 31, 2016 and 2015, respectively, after determining that relevant
conditions for the payment of certain contingent consideration is unlikely to be satisfied. This reduction is included within Revaluations in the above table.
See Note 8 for a discussion of the fair value of the Company’s borrowings and Note 4 for a discussion of non-recurring fair value measurements associated with long lived assets.
F-31
TELEFLEX INCORPORATED
NOTES TO CONSOLIDATED FINANCIAL STATEMENTS — (Continued)
Valuation Techniques
The Company’s financial assets valued based upon Level 1 inputs are comprised of investments in marketable securities held in trust, which are available to satisfy benefit obligations under Company benefit plans and other arrangements. The investment assets of the trust are valued using quoted market prices.
The Company’s financial assets and liabilities valued based upon Level 2 inputs are comprised of foreign currency forward contracts. The Company uses foreign currency forward contracts to manage foreign currency transaction exposure as well as exposure to foreign currency denominated monetary assets and liabilities. The Company measures the fair value of the foreign currency forward contracts by calculating the amount required to enter into offsetting contracts with similar remaining maturities, based on quoted market prices, and taking into account the creditworthiness of the counterparties.
The Company’s financial liabilities valued based upon Level 3 inputs are comprised of contingent consideration arrangements pertaining to the Company’s acquisitions. As of December 31, 2016, the Company recorded $7.1 million of total liabilities for contingent consideration, of which $0.6 million was recorded as the current portion of contingent consideration and $6.5 million was recorded as other liabilities in the consolidated balance sheet. The Company determines the fair value of the liabilities for contingent consideration based on discounted cash flow analysis. This fair value measurement is based on significant inputs unobservable in the market, primarily estimated sales royalties and the discount rate and, therefore, constitutes a Level 3 measurement within the fair value hierarchy.
Note 11 — Shareholders' equity
The authorized capital of the Company is comprised of 200 million common shares, $1 par value, and 500,000 preference shares. No preference shares have been outstanding during the last three years.
Basic earnings per share is computed by dividing net income by the weighted average number of common shares outstanding during the period. Diluted earnings per share is computed in the same manner except that the weighted average number of shares is increased to include dilutive securities. The following table provides a reconciliation of basic to diluted weighted average shares outstanding:
2016 | 2015 | 2014 | ||||||
(Shares in thousands) | ||||||||
Basic | 43,325 | 41,558 | 41,366 | |||||
Dilutive effect of share based awards | 570 | 488 | 450 | |||||
Dilutive effect of 3.875% Convertible Notes and warrants | 3,751 | 6,012 | 4,654 | |||||
Diluted | 47,646 | 48,058 | 46,470 | |||||
Weighted average shares that were antidilutive and therefore not included in the calculation of earnings per share were approximately 3.4 million, 5.6 million and 6.3 million for the years ended December 31, 2016, 2015 and 2014, respectively.
During periods in which the average market price of the Company's common stock is above the applicable conversion price of the Convertible Notes, or $61.32 per share, the impact of conversion would be dilutive and the dilutive effect of conversion of the Convertibles Notes is reflected in diluted earnings per share. As described in Note 8, the Company has elected the net settlement method of accounting for these conversions, under which the Company will settle the principal amount of the Convertible Notes in cash, and settle the excess conversion value in shares. As a result, in periods where the average market price of the Company's common stock is above $61.32 per share, under the treasury stock method, the Company calculates the number of shares issuable under the terms of the Convertible Notes based on the average market price of the stock during the period, and includes that number in the total diluted shares outstanding for the period.
In connection with the issuance of the Convertible Notes, the Company entered into convertible note hedge and warrant agreements. The convertible note hedge agreements economically reduce the dilutive impact of the Convertible Notes. However, applicable accounting guidance requires the Company to separately analyze the impact of the warrant agreements on diluted weighted average shares outstanding, without giving effect to the anti-dilutive impact of the convertible note hedge agreements. The reductions in diluted shares that would result from giving effect to the anti-dilutive impact of the convertible note hedge agreements would have been 2.0 million, 3.3 million, and 2.7 million for
F-32
TELEFLEX INCORPORATED
NOTES TO CONSOLIDATED FINANCIAL STATEMENTS — (Continued)
the years ended December 31, 2016, 2015 and 2014, respectively. The treasury stock method is applied when the exercise price of the warrants is less than the average of the market prices during the period and assumes the proceeds from the exercise of the warrants are used to repurchase shares based on the average stock price during the period. The exercise price of the warrants is approximately $74.65 per share of common stock. Shares issuable upon exercise of the warrants that were included in the total diluted shares outstanding were 1.7 million, 2.7 million and 1.9 million for the years ended December 31, 2016, 2015 and 2014, respectively. For additional information regarding the convertible notes and convertible note hedge and warrant agreements, see Note 8.
See Notes 8 and 19 for information regarding the reduction in the outstanding principal amount of Convertible Notes as a result of the Company's acquisition of Convertibles Notes in exchange for cash and shares of Company common stock, as well as the conversion of a portion of the Convertible Notes, and the related reduction in the number of call options and warrants outstanding under the convertible note hedge and warrant agreements either through unwinding of the agreements (in the case of exchange transactions) or exercise of call options and warrants under the convertible note hedge and warrant agreements, respectively.
The following tables provide information relating to the changes in accumulated other comprehensive income (loss), net of tax, for the years ended December 31, 2016 and 2015:
Cash Flow Hedges | Pension and Other Postretirement Benefit Plans | Foreign Currency Translation Adjustment | Accumulated Other Comprehensive Income (Loss) | ||||||||||||
(Dollars in thousands) | |||||||||||||||
Balance at December 31, 2014 | $ | — | $ | (141,744 | ) | $ | (119,151 | ) | $ | (260,895 | ) | ||||
Other comprehensive income (loss) before reclassifications | (2,974 | ) | (1,276 | ) | (110,595 | ) | (114,845 | ) | |||||||
Amounts reclassified from accumulated other comprehensive income (loss) | 483 | 4,133 | — | 4,616 | |||||||||||
Net current-year other comprehensive income (loss) | (2,491 | ) | 2,857 | (110,595 | ) | (110,229 | ) | ||||||||
Balance at December 31, 2015 | (2,491 | ) | (138,887 | ) | (229,746 | ) | (371,124 | ) | |||||||
Other comprehensive income (loss) before reclassifications | (3,434 | ) | (2,221 | ) | (69,119 | ) | (74,774 | ) | |||||||
Amounts reclassified from accumulated other comprehensive income | 3,501 | 4,512 | — | 8,013 | |||||||||||
Net current-year other comprehensive (loss) income | 67 | 2,291 | (69,119 | ) | (66,761 | ) | |||||||||
Reclassification related to acquisition of noncontrolling interest | — | — | (832 | ) | (832 | ) | |||||||||
Balance at December 31, 2016 | $ | (2,424 | ) | $ | (136,596 | ) | $ | (299,697 | ) | $ | (438,717 | ) | |||
F-33
TELEFLEX INCORPORATED
NOTES TO CONSOLIDATED FINANCIAL STATEMENTS — (Continued)
The following table provides information relating to the reclassifications of losses/(gains) in accumulated other comprehensive (loss) income into expense/(income), net of tax, for the years ended December 31, 2016, 2015 and 2014 :
December 31, 2016 | December 31, 2015 | December 31, 2014 | |||||||||
(Dollars in thousands) | |||||||||||
Losses (gains) on designated foreign exchange contracts: | |||||||||||
Cost of goods sold | $ | 4,511 | $ | 679 | $ | (705 | ) | ||||
Total before tax | 4,511 | 679 | (705 | ) | |||||||
Taxes | (1,010 | ) | (196 | ) | 111 | ||||||
Net of tax | $ | 3,501 | $ | 483 | $ | (594 | ) | ||||
Amortization of pension and other postretirement benefits items: | |||||||||||
Actuarial losses (1) | $ | 6,965 | $ | 6,375 | $ | 4,385 | |||||
Prior-service credits (1) | 56 | — | (21 | ) | |||||||
Total before tax | 7,021 | 6,375 | 4,364 | ||||||||
Tax benefit | (2,509 | ) | (2,242 | ) | (1,535 | ) | |||||
Net of tax | $ | 4,512 | $ | 4,133 | $ | 2,829 | |||||
Total reclassifications, net of tax | $ | 8,013 | $ | 4,616 | $ | 2,235 | |||||
(1) | These accumulated other comprehensive (loss) income components are included in the computation of net benefit cost of pension and other postretirement benefit plans (see Note 14 for additional information). |
Note 12 — Stock compensation plans
In May of 2014, the shareholders of the Company approved the Teleflex Incorporated 2014 Stock Incentive Plan (the "2014 Plan") which replaced the Company's 2008 Stock Incentive Plan and 2000 Stock Compensation Plan (the "Prior Plans"), under which stock options and restricted stock awards previously were granted. The 2014 Plan provides for several different kinds of awards, including stock options, stock appreciation rights, stock awards and other stock-based awards to directors, officers and key employees. Under the 2014 Plan, the Company is authorized to issue up to 5.3 million shares of common stock, subject to adjustment in accordance with special share counting rules in the 2014 Plan that, among other things, (i) count shares underlying a stock option or stock appreciation right (each, an "option award") as one share and each share underlying any other type of award (a "stock award") as 1.8 shares, (ii) increases the shares the Company is authorized to issue by one or 1.8 shares for each share underlying an option award or stock award, respectively, under the Prior Plans that have been canceled, expired, settled in cash or forfeited after December 31, 2013 and (iii) decrease the number of shares the Company is authorized to issue by one share and 1.8 shares for each share underlying an option award or stock award, respectively, granted under the Prior Plans between January 1, 2014 and the May 2, 2014 adoption of the 2014 Plan by the Company's stockholders. Options granted under the 2014 Plan have an exercise price equal to the closing price of the Company's common stock on the date of the grant. In 2016, the Company granted non-qualified options to purchase 338,902 shares of common stock and granted restricted stock units relating to 93,367 shares of common stock under the 2014 Plan. The unrecognized compensation expense for these awards as of the grant date was $22.6 million, which will be recognized over the vesting period of the awards. As of December 31, 2016, 3,999,156 shares were available for future grants under the 2014 Plan.
Share-based compensation expense for 2016, 2015 and 2014 was $16.9 million, $14.5 million and $12.2 million, respectively, and is included in selling, general and administrative expenses. The total income tax benefit recognized for share-based compensation arrangements for 2016, 2015 and 2014 was $5.5 million, $4.4 million and $3.3 million, respectively.
F-34
TELEFLEX INCORPORATED
NOTES TO CONSOLIDATED FINANCIAL STATEMENTS — (Continued)
The fair value of options granted in 2016, 2015 and 2014 was estimated at the date of grant using a Black-Scholes option pricing model. The following weighted-average assumptions were used:
2016 | 2015 | 2014 | ||||||
Risk-free interest rate | 1.30 | % | 1.44 | % | 1.45 | % | ||
Expected life of option | 4.91 years | 4.87 years | 4.89 years | |||||
Expected dividend yield | 0.94 | % | 1.12 | % | 1.34 | % | ||
Expected volatility | 21.64 | % | 20.68 | % | 21.44 | % | ||
The fair value for non-vested equity awards granted in 2016, 2015 and 2014 was estimated at the date of grant based on the market price for the underlying stock on the grant date discounted for the risk free interest rate and the present value of expected dividends over the vesting period. The following weighted-average assumptions were used:
2016 | 2015 | 2014 | ||||||
Risk-free interest rate | 0.94 | % | 0.94 | % | 0.65 | % | ||
Expected dividend yield | 0.93 | % | 1.12 | % | 1.34 | % | ||
The Company applied a simplified method to establish the beginning balance of the additional paid-in capital pool (“APIC Pool”) related to the tax effects of employee stock-based compensation and to determine the subsequent impact on the APIC Pool and consolidated statements of cash flows of the tax effects of employee stock-based compensation awards that are outstanding.
The following table summarizes the option activity during 2016:
Shares Subject to Options | Weighted Average Exercise Price | Weighted Average Remaining Contractual Life In Years | Aggregate Intrinsic Value | |||||||||
(Dollars in thousands) | ||||||||||||
Outstanding, beginning of the year | 1,442,912 | $ | 86.98 | |||||||||
Granted | 338,902 | 145.99 | ||||||||||
Exercised | (152,491 | ) | 80.56 | |||||||||
Forfeited or expired | (21,578 | ) | 125.71 | |||||||||
Outstanding, end of the year | 1,607,745 | 99.51 | 6.8 | $ | 99,180 | |||||||
Exercisable, end of the year | 1,003,895 | $ | 80.64 | 5.7 | $ | 80,823 | ||||||
The weighted average grant date fair value for options granted during 2016, 2015 and 2014 was $27.42, $21.44 and $18.01, respectively. The total intrinsic value of options exercised during 2016, 2015 and 2014 was $11.3 million, $6.3 million and $15.4 million, respectively.
The Company recorded $6.9 million of expense related to the portion of the shares underlying options that vested during 2016, which is included in selling, general and administrative expenses. As of December 31, 2016, the unamortized share-based compensation cost related to non-vested stock options, net of expected forfeitures, was $7.8 million, which is expected to be recognized over a weighted-average period of 1.8 years. Authorized but unissued shares of the Company’s common stock are issued upon exercises of options.
F-35
TELEFLEX INCORPORATED
NOTES TO CONSOLIDATED FINANCIAL STATEMENTS — (Continued)
The following table summarizes the non-vested restricted stock unit activity during 2016:
Number of Non-Vested Shares | Weighted Average Grant-Date Fair Value | Weighted Average Remaining Contractual Life In Years | Aggregate Intrinsic Value | |||||||||
(Dollars in thousands) | ||||||||||||
Outstanding, beginning of the year | 281,408 | $ | 96.59 | |||||||||
Granted | 93,367 | 142.71 | ||||||||||
Vested | (103,512 | ) | 80.98 | |||||||||
Forfeited | (20,874 | ) | 105.59 | |||||||||
Outstanding, end of the year | 250,389 | 119.44 | 1.2 | $ | 40,350 | |||||||
The Company issued 93,367, 105,239 and 116,258 of non-vested restricted stock units in 2016, 2015 and 2014, respectively, the majority of which provide for vesting as to all underlying shares on the third anniversary of the grant date. The weighted average grant-date fair value for non-vested restricted stock units granted during 2016, 2015 and 2014 was $142.71, $118.00 and $97.87, respectively.
The Company recorded $10.0 million of expense related to the portion of the restricted stock units that vested during 2016, which is included in selling, general and administrative expenses. The unamortized share-based compensation cost related to non-vested restricted stock units, net of expected forfeitures, was $11.3 million, which is expected to be recognized over a weighted-average period of 1.8 years. The Company uses treasury stock to provide shares of common stock in connection with vesting of the restricted stock units.
Note 13 — Income taxes
The following table summarizes the components of the provision for income taxes from continuing operations:
2016 | 2015 | 2014 | |||||||||
(Dollars in thousands) | |||||||||||
Current: | |||||||||||
Federal | $ | 2,344 | $ | (4,700 | ) | $ | 12,348 | ||||
State | 5,230 | 2,377 | 1,912 | ||||||||
Foreign | 28,842 | 53,151 | 30,748 | ||||||||
Deferred: | |||||||||||
Federal | (25,784 | ) | (37,504 | ) | (6,593 | ) | |||||
State | (1,194 | ) | (3,258 | ) | 3,435 | ||||||
Foreign | (1,364 | ) | (2,228 | ) | (13,200 | ) | |||||
$ | 8,074 | $ | 7,838 | $ | 28,650 | ||||||
At December 31, 2016, the cumulative unremitted earnings of subsidiaries outside the United States that are considered non-permanently reinvested and for which U.S. taxes have been provided, approximated $471.2 million. At December 31, 2016, the cumulative unremitted earnings of subsidiaries outside the United States that are considered permanently reinvested and, accordingly, for which no income or withholding taxes have been provided, approximated $1,214.9 million. Earnings considered permanently reinvested are expected to be reinvested indefinitely and, as a result, no deferred tax liability has been recognized with regard to these earnings. It is not practical to determine the deferred income tax liability on these earnings if, in the future, they are remitted to the United States because the income tax liability to be incurred, if any, is dependent on circumstances existing when remittance occurs.
F-36
TELEFLEX INCORPORATED
NOTES TO CONSOLIDATED FINANCIAL STATEMENTS — (Continued)
The following table summarizes the United States and non-United States components of income from continuing operations before taxes:
2016 | 2015 | 2014 | |||||||||
(Dollars in thousands) | |||||||||||
United States | $ | (29,988 | ) | $ | (19,550 | ) | $ | (23,875 | ) | ||
Other | 275,713 | 264,196 | 243,985 | ||||||||
$ | 245,725 | $ | 244,646 | $ | 220,110 | ||||||
Reconciliations between the statutory federal income tax rate and the effective income tax rate are as follows:
2016 | 2015 | 2014 | ||||||
Federal statutory rate | 35.0 | % | 35.0 | % | 35.0 | % | ||
Tax effect of international items | (27.5 | ) | (28.4 | ) | (22.6 | ) | ||
State taxes, net of federal benefit | 0.9 | (0.7 | ) | 2.1 | ||||
Uncertain tax contingencies | (3.6 | ) | (1.9 | ) | (0.8 | ) | ||
Contingent consideration reversals | (1.2 | ) | (0.7 | ) | (1.2 | ) | ||
Other, net | (0.3 | ) | (0.1 | ) | 0.5 | |||
3.3 | % | 3.2 | % | 13.0 | % | |||
The effective income tax rate for 2016 was 3.3% compared to 3.2% for 2015. The effective income tax rate for 2016 was impacted by a tax benefit associated with U.S. federal tax return filings, a benefit resulting from the reduction of German tax reserves as a result of the conclusion of an audit, a benefit resulting from the expiration of various statutes of limitation and a benefit associated with the Semprus IPR&D asset impairment.
The effective income tax rate for 2015 was impacted by a tax benefit associated with U.S. federal tax return filings, a benefit associated with legislative tax rate changes, a benefit resulting from a reduction in the Company's U.S. reserves as a result of the conclusion of an audit and a benefit associated with a reduction in the estimated deferred tax with respect to non-permanently reinvested income due to an increase in the estimated foreign tax credits available to reduce the U.S. tax on a future repatriation.
The Company and its subsidiaries are routinely subject to examinations by various taxing authorities. In conjunction with these examinations and as a regular practice, the Company establishes and adjusts reserves with respect to its uncertain tax positions to address developments related to those positions. The Company realized a net benefit of approximately $8.8 million in 2016 as a result of reducing its reserves with respect to uncertain tax positions, principally due to the conclusion of a tax audit in Germany and the expiration of various statutes of limitations. The Company realized a net benefit of approximately $4.6 million in 2015, which resulted from a reduction in the Company's U.S. reserves due to the conclusion of a tax audit, offset by an increase in the Company's foreign reserves with respect to developments in the tax audit in Germany discussed above. The Company realized a net benefit of approximately $1.8 million in 2014, which resulted from the expiration of a number of applicable statutes of limitations.
F-37
TELEFLEX INCORPORATED
NOTES TO CONSOLIDATED FINANCIAL STATEMENTS — (Continued)
The following table summarizes significant components of the Company’s deferred tax assets and liabilities at December 31, 2016 and 2015:
2016 | 2015 | ||||||
(Dollars in thousands) | |||||||
Deferred tax assets: | |||||||
Tax loss and credit carryforwards | $ | 136,046 | $ | 123,328 | |||
Pension | 46,563 | 57,610 | |||||
Reserves and accruals | 52,343 | 47,755 | |||||
Other | 17,704 | 34,568 | |||||
Less: valuation allowances | (104,520 | ) | (103,475 | ) | |||
Total deferred tax assets | 148,136 | 159,786 | |||||
Deferred tax liabilities: | |||||||
Property, plant and equipment | 32,209 | 33,824 | |||||
Intangibles — stock acquisitions | 321,707 | 361,132 | |||||
Unremitted foreign earnings | 63,419 | 78,019 | |||||
Other | 466 | 453 | |||||
Total deferred tax liabilities | 417,801 | 473,428 | |||||
Net deferred tax liability | $ | (269,665 | ) | $ | (313,642 | ) | |
Under the tax laws of various jurisdictions in which the Company operates, deductions or credits that cannot be fully utilized for tax purposes during the current year may be carried forward, subject to statutory limitations, to reduce taxable income or taxes payable in a future tax year. At December 31, 2016, the tax effect of such carryforwards approximated $136.0 million. Of this amount, $11.0 million has no expiration date, $1.6 million expires after 2016 but before the end of 2021 and $123.4 million expires after 2021. A portion of these carryforwards consists of tax losses and credits obtained by the Company as a result of acquisitions; the utilization of these carryforwards are subject to an annual limitation imposed by Section 382 of the Internal Revenue Code, which limits a company’s ability to deduct prior net operating losses following a more than 50 percent change in ownership. It is not expected that the Section 382 limitation will prevent the Company ultimately from utilizing the applicable loss carryforwards. The determination of state net operating loss carryforwards is dependent upon the United States subsidiaries’ taxable income or loss, the state’s proportion of each subsidiary's taxable net income and the application of state laws, which can change from year to year and impact the amount of such carryforward.
The valuation allowance for deferred tax assets of $104.5 million and $103.5 million at December 31, 2016 and 2015, respectively, relates principally to the uncertainty of the Company’s ability to utilize certain deferred tax assets, primarily tax loss and credit carryforwards in various jurisdictions. The valuation allowance was calculated in accordance with applicable accounting standards, which require that a valuation allowance be established and maintained when it is “more likely than not” that all or a portion of deferred tax assets will not be realized.
F-38
TELEFLEX INCORPORATED
NOTES TO CONSOLIDATED FINANCIAL STATEMENTS — (Continued)
Uncertain Tax Positions: The following table is a reconciliation of the beginning and ending balances for liabilities associated with unrecognized tax benefits for the twelve month periods ending December 31, 2016, 2015 and 2014:
2016 | 2015 | 2014 | |||||||||
(Dollars in thousands) | |||||||||||
Balance at January 1 | $ | 34,381 | $ | 51,084 | $ | 55,771 | |||||
Increase in unrecognized tax benefits related to prior years | — | 2,077 | — | ||||||||
Decrease in unrecognized tax benefits related to prior years | (13,083 | ) | (15,372 | ) | — | ||||||
Unrecognized tax benefits related to the current year | 705 | 647 | 910 | ||||||||
Reductions in unrecognized tax benefits due to settlements | (2,121 | ) | — | (132 | ) | ||||||
Reductions in unrecognized tax benefits due to lapse of applicable statute of limitations | (4,840 | ) | (2,337 | ) | (3,235 | ) | |||||
Increase (decrease) in unrecognized tax benefits due to foreign currency translation | 12 | (1,718 | ) | (2,230 | ) | ||||||
Balance at December 31 | $ | 15,054 | $ | 34,381 | $ | 51,084 | |||||
The total liabilities associated with the unrecognized tax benefits that, if recognized, would impact the effective tax rate for continuing operations, were $10.4 million at December 31, 2016.
The Company accrues interest and penalties associated with unrecognized tax benefits in income tax expense in the consolidated statements of income, and the corresponding liability is included in the consolidated balance sheets. The net interest expense (benefit) and penalties reflected in income from continuing operations for the year ended December 31, 2016 was $0.2 million and $(0.5) million, respectively; for the year ended December 31, 2015 was $1.6 million and $(0.4) million, respectively; and for the year ended December 31, 2014 was $1.0 million and $(0.8) million, respectively. The corresponding liabilities in the consolidated balance sheets for interest and penalties at December 31, 2016 were $0.7 million and $2.7 million, respectively, and at December 31, 2015 were $6.5 million and $3.2 million, respectively.
The taxable years for which the applicable statute of limitations remains open by major tax jurisdictions are as follows:
Beginning | Ending | ||
United States | 2010 | 2016 | |
Canada | 2005 | 2016 | |
China | 2011 | 2016 | |
Czech Republic | 2013 | 2016 | |
France | 2014 | 2016 | |
Germany | 2011 | 2016 | |
India | 2002 | 2016 | |
Ireland | 2012 | 2016 | |
Italy | 2011 | 2016 | |
Malaysia | 2012 | 2016 | |
Singapore | 2012 | 2016 | |
The Company and its subsidiaries are routinely subject to income tax examinations by various taxing authorities. As of December 31, 2016, the most significant tax examination in process is in Canada. The date at which this examination may be concluded and the ultimate outcome of the examination is uncertain. As a result of the uncertain outcome of this ongoing examination, future examinations or the expiration of statutes of limitation, it is reasonably possible that the related unrecognized tax benefits for tax positions taken could materially change from those recorded as liabilities at December 31, 2016. Due to the potential for resolution of certain examinations, and the expiration of various statutes of limitation, it is reasonably possible that the Company’s unrecognized tax benefits may change within the next year by a range of zero to $6.5 million.
F-39
TELEFLEX INCORPORATED
NOTES TO CONSOLIDATED FINANCIAL STATEMENTS — (Continued)
Note 14 — Pension and other postretirement benefits
The Company has a number of defined benefit pension and postretirement plans covering eligible U.S. and non-U.S. employees. The defined benefit pension plans are noncontributory. The benefits under these plans are based primarily on years of service and employees’ pay near retirement. The Company’s funding policy for U.S. plans is to contribute annually, at a minimum, amounts required by applicable laws and regulations. Obligations under non-U.S. plans are systematically provided for by depositing funds with trustees or by book reserves. As of December 31, 2016, no further benefits are being accrued under the Company’s U.S. defined benefit pension plans and the Company’s other postretirement benefit plans, other than certain postretirement benefit plans covering employees subject to a collective bargaining agreement.
The Company and certain of its subsidiaries provide medical, dental and life insurance benefits to pensioners or their survivors. The associated plans are unfunded and approved claims are paid from Company funds.
The following table provides information regarding the components of the net benefit expense (income) of the Company's pension and postretirement benefit plans:
Pension | Other Benefits | ||||||||||||||||||||||
2016 | 2015 | 2014 | 2016 | 2015 | 2014 | ||||||||||||||||||
(Dollars in thousands) | |||||||||||||||||||||||
Service cost | $ | 2,615 | $ | 1,880 | $ | 1,794 | $ | 355 | $ | 495 | $ | 424 | |||||||||||
Interest cost | 15,711 | 17,948 | 18,000 | 1,595 | 1,967 | 2,169 | |||||||||||||||||
Expected return on plan assets | (24,786 | ) | (25,940 | ) | (25,006 | ) | — | — | — | ||||||||||||||
Net amortization and deferral | 6,567 | 6,159 | 4,371 | 454 | 216 | (7 | ) | ||||||||||||||||
Net benefit expense (income) | $ | 107 | $ | 47 | $ | (841 | ) | $ | 2,404 | $ | 2,678 | $ | 2,586 | ||||||||||
The following table provides the weighted average assumptions for United States and foreign plans used in determining net benefit cost:
Pension | Other Benefits | ||||||||||||||||
2016 | 2015 | 2014 | 2016 | 2015 | 2014 | ||||||||||||
Discount rate | 4.5 | % | 4.1 | % | 5.0 | % | 4.3 | % | 4.0 | % | 4.7 | % | |||||
Rate of return | 8.1 | % | 8.1 | % | 8.3 | % | |||||||||||
Initial healthcare trend rate | 8.4 | % | 7.3 | % | 7.5 | % | |||||||||||
Ultimate healthcare trend rate | 5.0 | % | 5.0 | % | 5.0 | % | |||||||||||
F-40
TELEFLEX INCORPORATED
NOTES TO CONSOLIDATED FINANCIAL STATEMENTS — (Continued)
The following table provides summarized information with respect to the Company’s pension and postretirement benefit plans, measured as of December 31, 2016 and 2015:
Pension | Other Benefits | ||||||||||||||
2016 | 2015 | 2016 | 2015 | ||||||||||||
Under Funded | Under Funded | ||||||||||||||
(Dollars in thousands) | |||||||||||||||
Benefit obligation, beginning of year | $ | 421,736 | $ | 447,964 | $ | 48,616 | $ | 53,154 | |||||||
Service cost | 2,615 | 1,880 | 355 | 495 | |||||||||||
Interest cost | 15,711 | 17,948 | 1,595 | 1,967 | |||||||||||
Actuarial loss (gain) | 16,315 | (22,880 | ) | 646 | (3,914 | ) | |||||||||
Currency translation | (4,300 | ) | (2,721 | ) | — | — | |||||||||
Benefits paid | (18,887 | ) | (18,682 | ) | (3,946 | ) | (3,216 | ) | |||||||
Medicare Part D reimbursement | — | — | 221 | 130 | |||||||||||
Curtailments | (23 | ) | — | — | — | ||||||||||
Administrative costs | (2,593 | ) | (1,773 | ) | — | — | |||||||||
Projected benefit obligation, end of year | 430,574 | 421,736 | 47,487 | 48,616 | |||||||||||
Fair value of plan assets, beginning of year | 315,951 | 328,830 | |||||||||||||
Actual return on plan assets | 36,620 | (4,460 | ) | ||||||||||||
Contributions | 12,752 | 12,797 | |||||||||||||
Benefits paid | (18,887 | ) | (18,682 | ) | |||||||||||
Administrative costs | (2,593 | ) | (1,773 | ) | |||||||||||
Currency translation | (3,578 | ) | (761 | ) | |||||||||||
Fair value of plan assets, end of year | 340,265 | 315,951 | |||||||||||||
Funded status, end of year | $ | (90,309 | ) | $ | (105,785 | ) | $ | (47,487 | ) | $ | (48,616 | ) | |||
The following table sets forth the amounts recognized in the consolidated balance sheet with respect to the Company's pension and postretirement plans:
Pension | Other Benefits | ||||||||||||||
2016 | 2015 | 2016 | 2015 | ||||||||||||
(Dollars in thousands) | |||||||||||||||
Other assets | $ | 106 | $ | — | $ | — | $ | — | |||||||
Payroll and benefit-related liabilities | (1,640 | ) | (1,653 | ) | (3,200 | ) | (3,307 | ) | |||||||
Pension and postretirement benefit liabilities | (88,775 | ) | (104,132 | ) | (44,287 | ) | (45,309 | ) | |||||||
Accumulated other comprehensive loss | 209,785 | 213,301 | 4,415 | 4,223 | |||||||||||
$ | 119,476 | $ | 107,516 | $ | (43,072 | ) | $ | (44,393 | ) | ||||||
F-41
TELEFLEX INCORPORATED
NOTES TO CONSOLIDATED FINANCIAL STATEMENTS — (Continued)
The following tables set forth the amounts recognized in accumulated other comprehensive loss with respect to the plans:
Pension | |||||||||||||||
Prior Service Cost | Net (Gain) or Loss | Deferred Taxes | Accumulated Other Comprehensive Loss, Net of Tax | ||||||||||||
(Dollars in thousands) | |||||||||||||||
Balance at December 31, 2014 | $ | 148 | $ | 212,969 | $ | (76,807 | ) | $ | 136,310 | ||||||
Reclassification adjustments related to components of Net Periodic Benefit Cost recognized during the period: | |||||||||||||||
Net amortization and deferral | (35 | ) | (6,124 | ) | 2,164 | (3,995 | ) | ||||||||
Amounts arising during the period: | |||||||||||||||
Actuarial changes in benefit obligation | — | 7,520 | (2,928 | ) | 4,592 | ||||||||||
Impact of currency translation | — | (1,177 | ) | 316 | (861 | ) | |||||||||
Balance at December 31, 2015 | 113 | 213,188 | (77,255 | ) | 136,046 | ||||||||||
Reclassification adjustments related to components of Net Periodic Benefit Cost recognized during the period: | |||||||||||||||
Net amortization and deferral | (34 | ) | (6,533 | ) | 2,339 | (4,228 | ) | ||||||||
Amounts arising during the period: | |||||||||||||||
Actuarial changes in benefit obligation | — | 4,481 | (1,603 | ) | 2,878 | ||||||||||
Curtailments | — | (23 | ) | 6 | (17 | ) | |||||||||
Impact of currency translation | — | (1,407 | ) | 373 | (1,034 | ) | |||||||||
Balance at December 31, 2016 | $ | 79 | $ | 209,706 | $ | (76,140 | ) | $ | 133,645 | ||||||
Other Benefits | |||||||||||||||
Prior Service Cost | Net (Gain) or Loss | Deferred Taxes | Accumulated Other Comprehensive Loss, Net of Tax | ||||||||||||
(Dollars in thousands) | |||||||||||||||
Balance at December 31, 2014 | $ | 72 | $ | 8,281 | $ | (2,919 | ) | $ | 5,434 | ||||||
Reclassification adjustments related to components of Net Periodic Benefit Cost recognized during the period: | |||||||||||||||
Net amortization and deferral | 35 | (251 | ) | 78 | (138 | ) | |||||||||
Amounts arising during the period: | |||||||||||||||
Actuarial changes in benefit obligation | — | (3,914 | ) | 1,459 | (2,455 | ) | |||||||||
Balance at December 31, 2015 | 107 | 4,116 | (1,382 | ) | 2,841 | ||||||||||
Reclassification adjustments related to components of Net Periodic Benefit Cost recognized during the period: | |||||||||||||||
Net amortization and deferral | (22 | ) | (432 | ) | 170 | (284 | ) | ||||||||
Amounts arising during the period: | |||||||||||||||
Actuarial changes in benefit obligation | — | 646 | (252 | ) | 394 | ||||||||||
Balance at December 31, 2016 | $ | 85 | $ | 4,330 | $ | (1,464 | ) | $ | 2,951 | ||||||
F-42
TELEFLEX INCORPORATED
NOTES TO CONSOLIDATED FINANCIAL STATEMENTS — (Continued)
The following table provides the weighted average assumptions for United States and foreign plans used in determining benefit obligations:
Pension | Other Benefits | ||||||||||
2016 | 2015 | 2016 | 2015 | ||||||||
Discount rate | 4.2 | % | 4.5 | % | 4.1 | % | 4.3 | % | |||
Rate of compensation increase | 2.8 | % | 2.8 | % | |||||||
Initial healthcare trend rate | 7.9 | % | 8.4 | % | |||||||
Ultimate healthcare trend rate | 5.0 | % | 5.0 | % | |||||||
The discount rate represents the interest rate used to determine the present value of future cash flows currently expected to be required to settle the Company’s pension and other benefit obligations. The weighted average discount rates for United States pension plans and other benefit plans of 4.35% and 4.06%, respectively, were established by comparing the projection of expected benefit payments to the AA Above Median yield curve as of December 31, 2016. The expected benefit payments are discounted by each corresponding discount rate on the yield curve. For payments beyond 30 years, the Company extends the curve assuming that the discount rate derived in year 30 is extended to the end of the plan’s payment expectations. Once the present value of the string of benefit payments is established, the Company determines the single rate on the yield curve that, when applied to all obligations of the plan, will exactly match the previously determined present value.
As part of the evaluation of pension and other postretirement assumptions, the Company applied assumptions for mortality and healthcare cost trends that incorporate generational white and blue collar mortality trends. In determining its benefit obligations, the Company used generational tables that take into consideration increases in plan participant longevity.
The Company’s assumption for the Expected Return on Plan Assets is primarily based on the determination of an expected return for its current portfolio. This determination is made using assumptions for return and volatility of the portfolio. Asset class assumptions are set using a combination of empirical and forward-looking analysis. To the extent historical results have been affected by unsustainable trends or events, the effects of those trends are quantified and removed. The Company applies a variety of models for filtering historical data and isolating the fundamental characteristics of asset classes. These models provide empirical return estimates for each asset class, which are then reviewed and combined with a qualitative assessment of long term relationships between asset classes before a return estimate is finalized. The qualitative analysis is intended to provide an additional means for addressing the effect of unrealistic or unsustainable short-term valuations or trends, resulting in return levels and behavior the Company believes are more likely to prevail over long periods.
An increase in the assumed healthcare trend rate of 1% would increase the benefit obligation at December 31, 2016 by $3.4 million and would increase the 2016 benefit expense by $0.2 million. Decreasing this assumed rate by 1% would decrease the benefit obligation at December 31, 2016 by $3.0 million and would decrease the 2016 benefit expense by $0.2 million.
The accumulated benefit obligation for all United States and foreign defined benefit pension plans was $430.0 million and $421.2 million for 2016 and 2015, respectively. All of the Company's pension plans had accumulated benefit obligations in excess of their respective plan assets as of December 31, 2016 and 2015.
The Company’s investment objective is to achieve an enhanced long-term rate of return on plan assets, subject to a prudent level of portfolio risk, for the purpose of enhancing the availability of benefits for participants. These investments are primarily comprised of equity and fixed income mutual funds. The Company’s other investments are largely comprised of a hedge fund of funds and a structured credit fund. The equity funds are diversified in terms of domestic and international equity securities, as well as small, middle and large capitalization stocks. The Company’s target allocation percentage is as follows: equity securities (45%); fixed-income securities (35%) and other securities (20%). Equity funds are held for their expected return over inflation. Fixed-income funds are held for diversification relative to equities and as a partial hedge of interest rate risk with respect to plan liabilities. The other investments are held to further diversify assets within the plans and are designed to provide a mix of equity and bond like return with a bond like risk profile. The plans may also hold cash to meet liquidity requirements. Actual performance may not be consistent with the respective investment strategies. Investment risks and returns are measured and monitored on an
F-43
TELEFLEX INCORPORATED
NOTES TO CONSOLIDATED FINANCIAL STATEMENTS — (Continued)
ongoing basis through annual liability measurements and investment portfolio reviews to determine whether the asset allocation targets continue to represent an appropriate balance of expected risk and reward.
The following table provides the fair values of the Company’s pension plan assets at December 31, 2016 by asset category:
Fair Value Measurements | ||||||||||||||||
Asset Category (a) | Total | Quoted Prices in Active Markets for Identical Assets (Level 1) | Significant Observable Inputs (Level 2) | Significant Unobservable Inputs (Level 3) | ||||||||||||
(Dollars in thousands) | ||||||||||||||||
Cash | $ | 437 | $ | 437 | ||||||||||||
Money market funds | 76 | 76 | ||||||||||||||
Equity securities: | ||||||||||||||||
Managed volatility (b) | 88,051 | 88,051 | ||||||||||||||
United States small/mid-cap equity (c) | 24,785 | 24,785 | ||||||||||||||
World Equity (excluding United States) (d) | 33,376 | 33,376 | ||||||||||||||
Common Equity Securities – Teleflex Incorporated | 18,838 | 18,838 | ||||||||||||||
Diversified Global | 5,086 | 5,086 | ||||||||||||||
Fixed income securities: | ||||||||||||||||
Long duration bond fund (e) | 73,544 | 73,544 | ||||||||||||||
High yield bond fund (f) | 15,451 | 15,451 | ||||||||||||||
Emerging markets debt fund (g) | 9,412 | $ | 9,412 | |||||||||||||
Corporate, government and foreign bonds | 1,864 | 1,792 | 72 | |||||||||||||
Asset backed – home loans | 527 | 527 | ||||||||||||||
Other types of investments: | ||||||||||||||||
Structured credit (h) | 35,066 | $ | 35,066 | |||||||||||||
Hedge fund of funds (i) | 22,748 | 22,748 | ||||||||||||||
UK Property Fund (j) | 1,377 | 1,377 | ||||||||||||||
Multi asset funds (k) | 9,622 | 5,460 | 4,162 | |||||||||||||
Other | 5 | 5 | ||||||||||||||
Total | $ | 340,265 | $ | 266,896 | $ | 15,550 | $ | 57,819 | ||||||||
F-44
TELEFLEX INCORPORATED
NOTES TO CONSOLIDATED FINANCIAL STATEMENTS — (Continued)
The following table provides the fair values of the Company’s pension plan assets at December 31, 2015 by asset category:
Fair Value Measurements | ||||||||||||||||
Asset Category (a) | Total | Quoted Prices in Active Markets for Identical Assets (Level 1) | Significant Observable Inputs (Level 2) | Significant Unobservable Inputs (Level 3) | ||||||||||||
(Dollars in thousands) | ||||||||||||||||
Cash | $ | 664 | $ | 664 | ||||||||||||
Money market funds | 184 | 184 | ||||||||||||||
Equity securities: | ||||||||||||||||
Managed volatility (b) | 80,052 | 80,052 | ||||||||||||||
United States small/mid-cap equity (c) | 18,549 | 18,549 | ||||||||||||||
World Equity (excluding United States) (d) | 29,632 | 29,632 | ||||||||||||||
Common Equity Securities – Teleflex Incorporated | 15,366 | 15,366 | ||||||||||||||
Diversified United Kingdom Equity | 845 | 845 | ||||||||||||||
Diversified Global | 2,948 | 2,948 | ||||||||||||||
Emerging Markets | 1,055 | 1,055 | ||||||||||||||
Fixed income securities: | ||||||||||||||||
Long duration bond fund (e) | 80,855 | 80,855 | ||||||||||||||
UK corporate bond fund | 2,467 | 2,467 | ||||||||||||||
UK Government bond fund | 4,838 | 4,838 | ||||||||||||||
High yield bond fund (f) | 10,702 | 10,702 | ||||||||||||||
Emerging markets debt fund (g) | 10,060 | $ | 10,060 | |||||||||||||
Corporate, government and foreign bonds | 75 | 75 | ||||||||||||||
Asset backed – home loans | 655 | 655 | ||||||||||||||
Other types of investments: | ||||||||||||||||
Structured credit (h) | 29,591 | $ | 29,591 | |||||||||||||
Hedge fund of funds (i) | 22,599 | 22,599 | ||||||||||||||
UK Property Fund (j) | 1,654 | 1,654 | ||||||||||||||
Multi asset funds (k) | 3,155 | 3,155 | ||||||||||||||
Other | 5 | 5 | ||||||||||||||
Total | $ | 315,951 | $ | 251,312 | $ | 12,444 | $ | 52,195 | ||||||||
(a) | Information on asset categories described in notes (b)-(k) is derived from prospectuses and other material provided by the respective funds comprising the respective asset categories. |
(b) | This category comprises mutual funds that invest in securities of United States and non-United States companies of all capitalization ranges that exhibit relatively low volatility. |
(c) | This category comprises a mutual fund that invests at least 80% of its net assets in equity securities of small and mid-sized companies. The fund invests in common stocks or exchange traded funds holding common stock of United States companies with market capitalizations in the range of companies in the Russell 2500 Index. |
(d) | This category comprises a mutual fund that invests at least 80% of its net assets in equity securities of foreign companies. These securities may include common stocks, preferred stocks, warrants, exchange traded funds based on an international equity index, derivative instruments whose value is based on an international equity index and derivative instruments whose value is based on an underlying equity security or a basket of equity securities. The fund invests in securities of foreign issuers located in developed and emerging market countries. However, the fund will not invest more than 35% of its assets in the common stocks or other equity securities of issuers located in emerging market countries. |
F-45
TELEFLEX INCORPORATED
NOTES TO CONSOLIDATED FINANCIAL STATEMENTS — (Continued)
(e) | This category comprises a mutual fund that invests in instruments or derivatives having economic characteristics similar to fixed income securities. The fund invests in investment grade fixed income instruments, including securities issued or guaranteed by the United States Government and its agencies and instrumentalities, corporate bonds, asset-backed securities, exchange traded funds, mortgage-backed securities and collateralized mortgage-backed securities. The fund invests primarily in long duration government and corporate fixed income securities, and uses derivative instruments, including interest rate swap agreements and Treasury futures contracts, for the purpose of managing the overall duration and yield curve exposure of the Fund’s portfolio of fixed income securities. |
(f) | This category comprises a mutual fund that invests at least 80% of its net assets in higher-yielding fixed income securities, including corporate bonds and debentures, convertible and preferred securities and zero coupon obligations. |
(g) | This category comprises a mutual fund that invests at least 80% of its net assets in fixed income securities of emerging market issuers, primarily in United States dollar-denominated debt of foreign governments, government-related and corporate issuers in emerging market countries and entities organized to restructure the debt of those issuers. |
(h) | This category comprises a fund that invests primarily in collateralized debt obligations (“CDOs”) and other structured credit vehicles. The fund investments may include fixed income securities, loan participants, credit-linked notes, medium-term notes, pooled investment vehicles and derivative instruments. |
(i) | This category comprises a hedge fund that invests in various other hedge funds. As of December 31, 2016 and 2015: |
• | approximately 43% and 41%, respectively, of the assets of the hedge fund were invested in equity hedge based funds, including equity long/short and equity market neutral strategies; |
• | approximately 14% and 12%, respectively, of the assets were held in tactical/directional based funds, including global macro, long/short equity, commodity and systematic quantitative strategies; |
• | approximately 19% and 19%, respectively, of the assets were held in relative value based funds, including convertible and fixed income arbitrage, credit long/short and volatility arbitrage strategies; and |
• | approximately 24% and 28%, respectively, of the assets were held in funds with an event driven strategy. |
(j) | This category comprises a fund that invests primarily in UK freehold and leasehold property. The fund does not invest in higher risk activities such as developments. The fund may invest in indirect vehicles and property derivatives. |
(k) | This category comprises a fund that may invest in equities, bonds, or derivatives. |
The following table provides a reconciliation of changes in pension assets measured at fair value on a recurring basis, using Level 3 inputs, from December 31, 2014 through December 31, 2016:
(Dollars in thousands) | |||
Balance at December 31, 2014 | $ | 54,352 | |
Unrealized gain on assets | (2,157 | ) | |
Balance at December 31, 2015 | 52,195 | ||
Unrealized gain on assets | 5,624 | ||
Balance at December 31, 2016 | $ | 57,819 | |
The Company’s contributions to United States and foreign pension plans during 2017 are expected to be approximately $12.6 million. Contributions to postretirement healthcare plans during 2017 are expected to be approximately $3.2 million.
F-46
TELEFLEX INCORPORATED
NOTES TO CONSOLIDATED FINANCIAL STATEMENTS — (Continued)
The following table provides information about the Company’s expected benefit payments under its U.S. and foreign plans for each of the five succeeding years and the aggregate of the five years thereafter, net of the annual average Medicare Part D subsidy of approximately $0.2 million:
Pension | Other Benefits | ||||||
(Dollars in thousands) | |||||||
2017 | $ | 19,495 | $ | 3,200 | |||
2018 | 19,932 | 3,171 | |||||
2019 | 20,739 | 3,214 | |||||
2020 | 21,356 | 3,413 | |||||
2021 | 22,104 | 3,396 | |||||
Years 2022 — 2026 | 121,404 | 18,238 | |||||
The Company maintains a number of defined contribution savings plans covering eligible United States and non-United States employees. The Company partially matches employee contributions. Costs related to these plans were $12.0 million, $12.6 million and $11.5 million for 2016, 2015 and 2014, respectively.
Note 15 — Commitments and contingent liabilities
Operating leases: The Company uses various leased facilities and equipment in its operations. The lease terms for these leased assets vary depending on the terms of the applicable lease agreement. At December 31, 2016, the Company had no residual value guarantees related to its operating leases.
Future minimum lease payments as of December 31, 2016 under noncancellable operating leases are as follows:
Future Lease Payments | |||
(Dollars in thousands) | |||
2017 | $ | 29,546 | |
2018 | 23,224 | ||
2019 | 20,349 | ||
2020 | 16,887 | ||
2021 | 14,318 | ||
2022 and thereafter | 36,664 | ||
Rental expense under operating leases was $34.0 million, $34.6 million and $29.4 million in 2016, 2015 and 2014, respectively.
Environmental: The Company is subject to contingencies as a result of environmental laws and regulations that in the future may require the Company to take further action to correct the effects on the environment of prior disposal practices or releases of chemical or petroleum substances by the Company or other parties. Much of this liability results from the U.S. Comprehensive Environmental Response, Compensation and Liability Act, often referred to as Superfund, the U. S. Resource Conservation and Recovery Act and similar state laws. These laws require the Company to undertake certain investigative and remedial activities at sites where the Company conducts or once conducted operations or at sites where Company-generated waste was disposed.
Remediation activities vary substantially in duration and cost from site to site. The nature of these activities, and their associated costs, depend on the mix of unique site characteristics, evolving remediation technologies, the regulatory agencies involved and their enforcement policies, as well as the presence or absence of other potentially responsible parties. At December 31, 2016 and 2015, the Company has recorded $1.1 million and $1.2 million, respectively, in accrued liabilities and $5.8 million and $6.1 million, respectively, in other liabilities relating to these matters, in each case discounted to consider the time value of money. Considerable uncertainty exists with respect to these liabilities and, if adverse changes in circumstances occur, potential liability may exceed the amount accrued as of December 31, 2016. The time frame over which the accrued amounts may be paid out, based on past history, is estimated to be 15-20 years.
F-47
TELEFLEX INCORPORATED
NOTES TO CONSOLIDATED FINANCIAL STATEMENTS — (Continued)
Litigation: The Company is a party to various lawsuits and claims arising in the normal course of business. These lawsuits and claims include actions involving product liability, intellectual property, employment, environmental and other matters. As of December 31, 2016 and 2015, the Company has recorded accrued liabilities of $2.5 million in connection with such contingencies, representing its best estimate of the cost within the range of estimated possible losses that will be incurred to resolve these matters. Of the amounts accrued as of December 31, 2016 and 2015, $1.6 million and $1.5 million, respectively, pertain to discontinued operations.
In 2006, the Company was named as a defendant in a wrongful death product liability lawsuit filed in the Louisiana State District Court for the Parish of Calcasieu, involving a product manufactured by the Company’s former marine business. In September 2014, the case was tried before a jury, which returned a verdict in favor of the Company. The plaintiff subsequently filed a motion for a new trial, which was granted, and the case was re-tried before a jury in December 2014. On December 5, 2014, the jury returned a verdict in favor of the plaintiff, awarding $0.1 million in compensatory damages and $23.0 million in punitive damages, plus pre- and post-judgment interest on the compensatory damages and post-judgment interest on the punitive damages. The Company's post-trial motions seeking to overturn the verdict or reduce the amount of damages were denied in June 2015. The Company filed an appeal with the Louisiana Court of Appeal, and the plaintiff filed a cross-appeal, seeking to overturn the trial court’s denial of pre-judgment interest on the punitive damages award. On June 29, 2016, the Louisiana Court of Appeal affirmed the trial court verdict in all respects. The Company filed a motion for rehearing with the Louisiana Court of Appeal, which was denied on August 3, 2016. The Company and the plaintiff filed applications for a writ of certiorari (a request for review) to the Louisiana Supreme Court. On January 13, 2017, the Louisiana Supreme Court granted the Company's writ application. A date for oral arguments has not yet been set. As of December 31, 2016, the Company has accrued a liability representing its best estimate of any probable loss associated with this matter, which is included in the Company’s accrued liabilities for litigation matters relating to discontinued operations discussed in the preceding paragraph. The Company believes that any liability arising from this matter that is not covered by the Company's product liability insurance will not exceed $10.0 million.
Based on information currently available, advice of counsel, established reserves and other resources, the Company does not believe that the outcome of any outstanding litigation and claims is likely to be, individually or in the aggregate, material to its business, financial condition, results of operations or liquidity. However, in the event of unexpected further developments, it is possible that the ultimate resolution of these matters, or other similar matters, if unfavorable, may be materially adverse to the Company’s business, financial condition, results of operations or liquidity. Legal costs such as outside counsel fees and expenses are charged to selling, general and administrative expenses in the period incurred.
Tax audits and examinations: The Company and its subsidiaries are routinely subject to tax examinations by various tax authorities. As of December 31, 2016, the most significant tax examination in process is in Canada. The Company may establish reserves with respect to uncertain tax positions, after which it adjusts the reserves to address developments with respect to its uncertain tax positions, including developments in this examination. Accordingly, developments in tax audits and examinations, including resolution of uncertain tax positions, could result in increases or decreases to the Company’s recorded tax liabilities, which could impact the Company’s financial results.
Other: The Company has various purchase commitments for materials, supplies and items of permanent investment incident to the ordinary conduct of business. On average, such commitments are not at prices in excess of current market prices.
Note 16 — Business segments and other information
An operating segment is a component of the Company (a) that engages in business activities from which it may earn revenues and incur expenses, (b) whose operating results are regularly reviewed by the Company’s chief operating decision maker to make decisions about resources to be allocated to the segment and to assess its performance, and (c) for which discrete financial information is available. The Company does not evaluate its operating segments using discrete asset information.
The Company has the following six reportable operating segments: Vascular North America, Anesthesia North America, Surgical North America, EMEA, Asia and OEM. In connection with its presentation of segment information for its reportable operating segments, the Company also presents certain information pertaining to several immaterial operating segments in the “All other” category.
F-48
TELEFLEX INCORPORATED
NOTES TO CONSOLIDATED FINANCIAL STATEMENTS — (Continued)
The Company’s reportable segments, other than the Original Equipment Manufacturer and Development Services ("OEM") segment, design, manufacture and distribute medical devices primarily used in critical care, surgical applications and cardiac care, and generally serve two end markets: hospitals and healthcare providers, and home health. The products of these segments are most widely used in the acute care setting for a range of diagnostic and therapeutic procedures and in general and specialty surgical applications. The Company’s OEM segment designs, manufactures and supplies devices and instruments for other medical device manufacturers.
The following tables present the Company’s segment results for the years ended December 31, 2016, 2015 and 2014:
Year Ended December 31, | |||||||||||
2016 | 2015 | 2014 | |||||||||
(Dollars in thousands) | |||||||||||
Revenue | |||||||||||
Vascular North America | $ | 350,486 | $ | 334,938 | $ | 311,163 | |||||
Anesthesia North America | 198,772 | 189,297 | 183,909 | ||||||||
Surgical North America | 172,223 | 161,230 | 150,121 | ||||||||
EMEA | 510,934 | 514,443 | 593,065 | ||||||||
Asia | 249,416 | 241,726 | 237,696 | ||||||||
OEM | 160,990 | 149,399 | 143,966 | ||||||||
All other | 225,206 | 218,657 | 219,912 | ||||||||
Consolidated net revenues | $ | 1,868,027 | $ | 1,809,690 | $ | 1,839,832 | |||||
Year Ended December 31, | |||||||||||
2016 | 2015 | 2014 | |||||||||
(Dollars in thousands) | |||||||||||
Operating Profit | |||||||||||
Vascular North America | $ | 97,088 | $ | 73,284 | $ | 53,807 | |||||
Anesthesia North America | 55,544 | 48,311 | 34,566 | ||||||||
Surgical North America | 56,608 | 52,529 | 49,592 | ||||||||
EMEA | 84,392 | 92,326 | 114,650 | ||||||||
Asia | 75,770 | 67,887 | 62,152 | ||||||||
OEM | 33,641 | 33,162 | 30,635 | ||||||||
All other | 19,784 | 20,356 | 19,762 | ||||||||
Total segment operating profit (1) | 422,827 | 387,855 | 365,164 | ||||||||
Unallocated expenses (2) | (103,374 | ) | (71,964 | ) | (80,302 | ) | |||||
Income from continuing operations before interest, loss on extinguishment of debt and taxes | $ | 319,453 | $ | 315,891 | $ | 284,862 | |||||
(1) | Segment operating profit includes segment net revenues from external customers reduced by its standard cost of goods sold, adjusted for fixed manufacturing cost absorption variances, selling, general and administrative expenses, research and development expenses and an allocation of corporate expenses. Corporate expenses are allocated among the segments in proportion to the respective amounts of one of several items (such as sales, numbers of employees, and amount of time spent), depending on the category of expense involved. |
(2) | Unallocated expenses primarily include manufacturing variances, with the exception of fixed manufacturing cost absorption variances, restructuring and other impairment charges and gain on sale of assets. |
F-49
TELEFLEX INCORPORATED
NOTES TO CONSOLIDATED FINANCIAL STATEMENTS — (Continued)
Year Ended December 31, | |||||||||||
2016 | 2015 | 2014 | |||||||||
(Dollars in thousands) | |||||||||||
Depreciation and Amortization | |||||||||||
Vascular North America | $ | 36,260 | $ | 37,159 | $ | 35,701 | |||||
Anesthesia North America | 10,932 | 7,089 | 11,815 | ||||||||
Surgical North America | 10,459 | 12,289 | 6,316 | ||||||||
EMEA | 30,505 | 32,178 | 38,062 | ||||||||
Asia | 11,275 | 11,382 | 8,515 | ||||||||
OEM | 8,404 | 6,834 | 6,175 | ||||||||
All other | 20,511 | 18,403 | 20,446 | ||||||||
Consolidated depreciation and amortization | $ | 128,346 | $ | 125,334 | $ | 127,030 | |||||
Geographic data
The following tables provide total net revenues and total net property, plant and equipment by geographic region for the years ended December 31, 2016, 2015 and 2014:
Year Ended December 31, | |||||||||||
2016 | 2015 | 2014 | |||||||||
(Dollars in thousands) | |||||||||||
Net revenues (based on the Company's selling location): | |||||||||||
United States | $ | 1,018,786 | $ | 967,819 | $ | 916,619 | |||||
Other Americas | 56,339 | 56,500 | 60,736 | ||||||||
Europe | 567,320 | 570,672 | 664,982 | ||||||||
All other | 225,582 | 214,699 | 197,495 | ||||||||
$ | 1,868,027 | $ | 1,809,690 | $ | 1,839,832 | ||||||
Net property, plant and equipment: | |||||||||||
United States | $ | 167,167 | $ | 178,895 | $ | 174,893 | |||||
Malaysia | 31,415 | 33,777 | 36,427 | ||||||||
Ireland | 36,569 | 33,219 | 29,746 | ||||||||
Czech Republic | 30,843 | 32,305 | 35,655 | ||||||||
All other | 36,905 | 37,927 | 40,714 | ||||||||
$ | 302,899 | $ | 316,123 | $ | 317,435 | ||||||
Note 17 — Condensed consolidating guarantor financial information
The 2024 and 2026 Notes are issued by Teleflex Incorporated (the “Parent Company”), and payment of the Parent Company's obligations under the 2024 and 2026 Notes is guaranteed, jointly and severally, by certain of the Parent Company’s subsidiaries (each, a “Guarantor Subsidiary” and collectively, the “Guarantor Subsidiaries”). The guarantees are full and unconditional, subject to certain customary release provisions. Each Guarantor Subsidiary is directly or indirectly 100% owned by the Parent Company. The Company’s condensed consolidating statements of income and comprehensive income and condensed consolidating statements of cash flows for the years ended December 31, 2016, 2015 and 2014 and condensed consolidating balance sheets as of December 31, 2016 and 2015 provide consolidated information for:
F-50
TELEFLEX INCORPORATED
NOTES TO CONSOLIDATED FINANCIAL STATEMENTS — (Continued)
a. | Parent Company, the issuer of the guaranteed obligations; |
b. | Guarantor Subsidiaries, on a combined basis; |
c. | Non-Guarantor Subsidiaries (i.e., those subsidiaries of the Parent Company that have not guaranteed payment of the 2024 Notes and 2026 Notes), on a combined basis; and |
d. | Parent Company and its subsidiaries on a consolidated basis. |
The same accounting policies as described in Note 1 are used by the Parent Company and each of its subsidiaries in connection with the condensed consolidating financial information, except for the use of the equity method of accounting to reflect ownership interests in subsidiaries, which are eliminated upon consolidation.
Consolidating entries and eliminations in the following condensed consolidated financial statements represent adjustments to (a) eliminate intercompany transactions between or among the Parent Company, the Guarantor Subsidiaries and the Non-Guarantor Subsidiaries, (b) eliminate the investments in subsidiaries and (c) record consolidating entries.
F-51
TELEFLEX INCORPORATED
NOTES TO CONSOLIDATED FINANCIAL STATEMENTS — (Continued)
TELEFLEX INCORPORATED AND SUBSIDIARIES
CONDENSED CONSOLIDATING STATEMENTS OF INCOME AND COMPREHENSIVE INCOME
Year Ended December 31, 2016 | |||||||||||||||||||
Parent Company | Guarantor Subsidiaries | Non-Guarantor Subsidiaries | Eliminations | Condensed Consolidated | |||||||||||||||
(Dollars in thousands) | |||||||||||||||||||
Net revenues | $ | — | $ | 1,112,464 | $ | 1,124,958 | $ | (369,395 | ) | $ | 1,868,027 | ||||||||
Cost of goods sold | — | 652,442 | 588,110 | (368,725 | ) | 871,827 | |||||||||||||
Gross profit | — | 460,022 | 536,848 | (670 | ) | 996,200 | |||||||||||||
Selling, general and administrative expenses | 43,602 | 328,263 | 191,916 | (473 | ) | 563,308 | |||||||||||||
Research and development expenses | 547 | 33,080 | 24,952 | — | 58,579 | ||||||||||||||
Restructuring and other impairment charges | 173 | 50,183 | 8,871 | — | 59,227 | ||||||||||||||
Gain on sale of assets | (2,707 | ) | (155 | ) | (1,505 | ) | — | (4,367 | ) | ||||||||||
(Loss) income from continuing operations before interest, loss on extinguishment of debt and taxes | (41,615 | ) | 48,651 | 312,614 | (197 | ) | 319,453 | ||||||||||||
Interest, net | 153,830 | (103,465 | ) | 4,102 | — | 54,467 | |||||||||||||
Loss on extinguishment of debt | 19,261 | — | — | — | 19,261 | ||||||||||||||
(Loss) income from continuing operations before taxes | (214,706 | ) | 152,116 | 308,512 | (197 | ) | 245,725 | ||||||||||||
(Benefit) taxes on (loss) income from continuing operations | (78,478 | ) | 46,758 | 39,875 | (81 | ) | 8,074 | ||||||||||||
Equity in net income of consolidated subsidiaries | 374,048 | 243,987 | 528 | (618,563 | ) | — | |||||||||||||
Income from continuing operations | 237,820 | 349,345 | 269,165 | (618,679 | ) | 237,651 | |||||||||||||
Operating (loss) income from discontinued operations | (1,300 | ) | — | 378 | — | (922 | ) | ||||||||||||
Tax benefit on (loss) income from discontinued operations | (857 | ) | — | (255 | ) | — | (1,112 | ) | |||||||||||
(Loss) income from discontinued operations | (443 | ) | — | 633 | — | 190 | |||||||||||||
Net income | 237,377 | 349,345 | 269,798 | (618,679 | ) | 237,841 | |||||||||||||
Less: Income from continuing operations attributable to noncontrolling interest | — | — | 464 | — | 464 | ||||||||||||||
Net income attributable to common shareholders | 237,377 | 349,345 | 269,334 | (618,679 | ) | 237,377 | |||||||||||||
Other comprehensive loss attributable to common shareholders | (66,761 | ) | (76,098 | ) | (80,700 | ) | 156,798 | (66,761 | ) | ||||||||||
Comprehensive income attributable to common shareholders | $ | 170,616 | $ | 273,247 | $ | 188,634 | $ | (461,881 | ) | $ | 170,616 | ||||||||
F-52
TELEFLEX INCORPORATED
NOTES TO CONSOLIDATED FINANCIAL STATEMENTS — (Continued)
Year Ended December 31, 2015 | |||||||||||||||||||
Parent Company | Guarantor Subsidiaries | Non-Guarantor Subsidiaries | Eliminations | Condensed Consolidated | |||||||||||||||
(Dollars in thousands) | |||||||||||||||||||
Net revenues | $ | — | $ | 1,079,180 | $ | 1,107,565 | $ | (377,055 | ) | $ | 1,809,690 | ||||||||
Cost of goods sold | — | 646,427 | 593,855 | (374,995 | ) | 865,287 | |||||||||||||
Gross profit | — | 432,753 | 513,710 | (2,060 | ) | 944,403 | |||||||||||||
Selling, general and administrative expenses | 42,435 | 336,049 | 191,029 | (531 | ) | 568,982 | |||||||||||||
Research and development expenses | — | 30,359 | 21,760 | — | 52,119 | ||||||||||||||
Restructuring charges | — | 6,731 | 1,088 | — | 7,819 | ||||||||||||||
Gain on sale of assets | — | — | (408 | ) | — | (408 | ) | ||||||||||||
(Loss) income from continuing operations before interest, loss on extinguishment of debt and taxes | (42,435 | ) | 59,614 | 300,241 | (1,529 | ) | 315,891 | ||||||||||||
Interest, net | 132,711 | (76,873 | ) | 4,953 | — | 60,791 | |||||||||||||
Loss on extinguishment of debt | 10,454 | — | — | — | 10,454 | ||||||||||||||
(Loss) income from continuing operations before taxes | (185,600 | ) | 136,487 | 295,288 | (1,529 | ) | 244,646 | ||||||||||||
(Benefit) taxes on (loss) income from continuing operations | (66,264 | ) | 27,260 | 46,804 | 38 | 7,838 | |||||||||||||
Equity in net income of consolidated subsidiaries | 355,138 | 235,810 | 1,086 | (592,034 | ) | — | |||||||||||||
Income from continuing operations | 235,802 | 345,037 | 249,570 | (593,601 | ) | 236,808 | |||||||||||||
Operating (loss) income from discontinued operations | (1,734 | ) | — | 4 | — | (1,730 | ) | ||||||||||||
(Benefit) taxes on (loss) income from discontinued operations | (10,795 | ) | — | 160 | — | (10,635 | ) | ||||||||||||
Income (loss) from discontinued operations | 9,061 | — | (156 | ) | — | 8,905 | |||||||||||||
Net income | 244,863 | 345,037 | 249,414 | (593,601 | ) | 245,713 | |||||||||||||
Less: Income from continuing operations attributable to noncontrolling interests | — | — | 850 | — | 850 | ||||||||||||||
Net income attributable to common shareholders | 244,863 | 345,037 | 248,564 | (593,601 | ) | 244,863 | |||||||||||||
Other comprehensive loss attributable to common shareholders | (110,229 | ) | (110,604 | ) | (120,439 | ) | 231,043 | (110,229 | ) | ||||||||||
Comprehensive income attributable to common shareholders | $ | 134,634 | $ | 234,433 | $ | 128,125 | $ | (362,558 | ) | $ | 134,634 | ||||||||
F-53
TELEFLEX INCORPORATED
NOTES TO CONSOLIDATED FINANCIAL STATEMENTS — (Continued)
Year Ended December 31, 2014 | |||||||||||||||||||
Parent Company | Guarantor Subsidiaries | Non-Guarantor Subsidiaries | Eliminations | Condensed Consolidated | |||||||||||||||
(Dollars in thousands) | |||||||||||||||||||
Net revenues | $ | — | $ | 1,078,851 | $ | 1,132,152 | $ | (371,171 | ) | $ | 1,839,832 | ||||||||
Cost of goods sold | — | 652,742 | 608,256 | (363,594 | ) | 897,404 | |||||||||||||
Gross profit | — | 426,109 | 523,896 | (7,577 | ) | 942,428 | |||||||||||||
Selling, general and administrative expenses | 42,829 | 326,282 | 209,930 | (384 | ) | 578,657 | |||||||||||||
Research and development expenses | — | 40,546 | 20,494 | — | 61,040 | ||||||||||||||
Restructuring charges | — | 10,189 | 7,680 | — | 17,869 | ||||||||||||||
(Loss) income from continuing operations before interest and taxes | (42,829 | ) | 49,092 | 285,792 | (7,193 | ) | 284,862 | ||||||||||||
Interest, net | 144,869 | (85,886 | ) | 5,769 | — | 64,752 | |||||||||||||
(Loss) income from continuing operations before taxes | (187,698 | ) | 134,978 | 280,023 | (7,193 | ) | 220,110 | ||||||||||||
(Benefit) taxes on (loss) income from continuing operations | (68,307 | ) | 68,690 | 28,159 | 108 | 28,650 | |||||||||||||
Equity in net income of consolidated subsidiaries | 308,396 | 233,827 | 252 | (542,475 | ) | — | |||||||||||||
Income from continuing operations | 189,005 | 300,115 | 252,116 | (549,776 | ) | 191,460 | |||||||||||||
Operating loss from discontinued operations | (2,196 | ) | — | (1,211 | ) | — | (3,407 | ) | |||||||||||
(Benefit) taxes on loss from discontinued operations | (870 | ) | — | 172 | — | (698 | ) | ||||||||||||
Loss from discontinued operations | (1,326 | ) | — | (1,383 | ) | — | (2,709 | ) | |||||||||||
Net income | 187,679 | 300,115 | 250,733 | (549,776 | ) | 188,751 | |||||||||||||
Less: Income from continuing operations attributable to noncontrolling interests | — | — | 1,072 | — | 1,072 | ||||||||||||||
Net income attributable to common shareholders | 187,679 | 300,115 | 249,661 | (549,776 | ) | 187,679 | |||||||||||||
Other comprehensive loss attributable to common shareholders | (150,040 | ) | (105,872 | ) | (126,317 | ) | 232,189 | (150,040 | ) | ||||||||||
Comprehensive income attributable to common shareholders | $ | 37,639 | $ | 194,243 | $ | 123,344 | $ | (317,587 | ) | $ | 37,639 | ||||||||
F-54
TELEFLEX INCORPORATED
NOTES TO CONSOLIDATED FINANCIAL STATEMENTS — (Continued)
TELEFLEX INCORPORATED AND SUBSIDIARIES
CONDENSED CONSOLIDATING BALANCE SHEETS
December 31, 2016 | |||||||||||||||||||
Parent Company | Guarantor Subsidiaries | Non-Guarantor Subsidiaries | Eliminations | Condensed Consolidated | |||||||||||||||
(Dollars in thousands) | |||||||||||||||||||
ASSETS | |||||||||||||||||||
Current assets | |||||||||||||||||||
Cash and cash equivalents | $ | 14,571 | $ | 1,031 | $ | 528,187 | $ | — | $ | 543,789 | |||||||||
Accounts receivable, net | 2,551 | 8,768 | 255,815 | 4,859 | 271,993 | ||||||||||||||
Accounts receivable from consolidated subsidiaries | 4,861 | 2,176,059 | 309,149 | (2,490,069 | ) | — | |||||||||||||
Inventories, net | — | 200,852 | 140,406 | (25,087 | ) | 316,171 | |||||||||||||
Prepaid expenses and other current assets | 14,239 | 5,332 | 17,474 | 3,337 | 40,382 | ||||||||||||||
Prepaid taxes | — | — | 7,766 | 413 | 8,179 | ||||||||||||||
Assets held for sale | — | — | 2,879 | — | 2,879 | ||||||||||||||
Total current assets | 36,222 | 2,392,042 | 1,261,676 | (2,506,547 | ) | 1,183,393 | |||||||||||||
Property, plant and equipment, net | 2,566 | 163,847 | 136,486 | — | 302,899 | ||||||||||||||
Goodwill | — | 708,546 | 568,174 | — | 1,276,720 | ||||||||||||||
Intangibles assets, net | — | 640,999 | 450,664 | — | 1,091,663 | ||||||||||||||
Deferred tax assets | 73,051 | — | 5,185 | (76,524 | ) | 1,712 | |||||||||||||
Notes receivable and other amounts due from consolidated subsidiaries | 1,387,615 | 2,085,538 | — | (3,473,153 | ) | — | |||||||||||||
Other assets | 6,044,337 | 1,525,285 | 29,962 | (7,564,758 | ) | 34,826 | |||||||||||||
Total assets | $ | 7,543,791 | $ | 7,516,257 | $ | 2,452,147 | $ | (13,620,982 | ) | $ | 3,891,213 | ||||||||
LIABILITIES AND EQUITY | |||||||||||||||||||
Current liabilities | |||||||||||||||||||
Current borrowings | $ | 133,071 | $ | — | $ | 50,000 | $ | — | $ | 183,071 | |||||||||
Accounts payable | 4,540 | 30,924 | 33,936 | — | 69,400 | ||||||||||||||
Accounts payable to consolidated subsidiaries | 2,242,814 | 214,203 | 33,052 | (2,490,069 | ) | — | |||||||||||||
Accrued expenses | 16,827 | 18,126 | 30,196 | — | 65,149 | ||||||||||||||
Current portion of contingent consideration | — | 587 | — | — | 587 | ||||||||||||||
Payroll and benefit-related liabilities | 20,610 | 26,672 | 35,397 | — | 82,679 | ||||||||||||||
Accrued interest | 10,429 | — | 21 | — | 10,450 | ||||||||||||||
Income taxes payable | 1,246 | — | 6,577 | 85 | 7,908 | ||||||||||||||
Other current liabilities | 2,262 | 3,643 | 2,497 | — | 8,402 | ||||||||||||||
Total current liabilities | 2,431,799 | 294,155 | 191,676 | (2,489,984 | ) | 427,646 | |||||||||||||
Long-term borrowings | 850,252 | — | — | — | 850,252 | ||||||||||||||
Deferred tax liabilities | — | 316,526 | 31,375 | (76,524 | ) | 271,377 | |||||||||||||
Pension and postretirement benefit liabilities | 85,645 | 31,561 | 15,856 | — | 133,062 | ||||||||||||||
Noncurrent liability for uncertain tax positions | 1,169 | 13,684 | 2,667 | — | 17,520 | ||||||||||||||
Notes payable and other amounts due to consolidated subsidiaries | 2,011,737 | 1,264,004 | 197,412 | (3,473,153 | ) | — | |||||||||||||
Other liabilities | 23,848 | 15,695 | 12,472 | — | 52,015 | ||||||||||||||
Total liabilities | 5,404,450 | 1,935,625 | 451,458 | (6,039,661 | ) | 1,751,872 | |||||||||||||
Convertible notes - redeemable equity component (Note 19) | 1,824 | — | — | — | 1,824 | ||||||||||||||
Mezzanine Equity | 1,824 | — | — | — | 1,824 | ||||||||||||||
Total common shareholders' equity | 2,137,517 | 5,580,632 | 2,000,689 | (7,581,321 | ) | 2,137,517 | |||||||||||||
Total liabilities and equity | $ | 7,543,791 | $ | 7,516,257 | $ | 2,452,147 | $ | (13,620,982 | ) | $ | 3,891,213 | ||||||||
F-55
TELEFLEX INCORPORATED
NOTES TO CONSOLIDATED FINANCIAL STATEMENTS — (Continued)
December 31, 2015 | |||||||||||||||||||
Parent Company | Guarantor Subsidiaries | Non-Guarantor Subsidiaries | Eliminations | Condensed Consolidated | |||||||||||||||
(Dollars in thousands) | |||||||||||||||||||
ASSETS | |||||||||||||||||||
Current assets | |||||||||||||||||||
Cash and cash equivalents | $ | 21,612 | $ | — | $ | 316,754 | $ | — | $ | 338,366 | |||||||||
Accounts receivable, net | 2,538 | 4,326 | 251,166 | 4,386 | 262,416 | ||||||||||||||
Accounts receivable from consolidated subsidiaries | 5,276 | 2,412,079 | 289,697 | (2,707,052 | ) | — | |||||||||||||
Inventories, net | — | 205,163 | 149,705 | (24,593 | ) | 330,275 | |||||||||||||
Prepaid expenses and other current assets | 10,511 | 4,702 | 16,037 | 3,665 | 34,915 | ||||||||||||||
Prepaid taxes | 16,686 | — | 14,622 | (413 | ) | 30,895 | |||||||||||||
Assets held for sale | 2,901 | — | 4,071 | — | 6,972 | ||||||||||||||
Total current assets | 59,524 | 2,626,270 | 1,042,052 | (2,724,007 | ) | 1,003,839 | |||||||||||||
Property, plant and equipment, net | 2,931 | 174,674 | 138,518 | — | 316,123 | ||||||||||||||
Goodwill | — | 705,753 | 590,099 | — | 1,295,852 | ||||||||||||||
Intangibles assets, net | — | 762,084 | 437,891 | — | 1,199,975 | ||||||||||||||
Deferred tax assets | 91,432 | — | 8,042 | (97,133 | ) | 2,341 | |||||||||||||
Notes receivable and other amounts due from consolidated subsidiaries | 1,358,446 | 1,658,092 | — | (3,016,538 | ) | — | |||||||||||||
Other assets | 5,746,828 | 1,366,660 | 47,340 | (7,107,184 | ) | 53,644 | |||||||||||||
Total assets | $ | 7,259,161 | $ | 7,293,533 | $ | 2,263,942 | $ | (12,944,862 | ) | $ | 3,871,774 | ||||||||
LIABILITIES AND EQUITY | |||||||||||||||||||
Current liabilities | |||||||||||||||||||
Current borrowings | $ | 374,050 | $ | — | $ | 43,300 | $ | — | $ | 417,350 | |||||||||
Accounts payable | 1,945 | 27,527 | 36,833 | — | 66,305 | ||||||||||||||
Accounts payable to consolidated subsidiaries | 2,478,109 | 201,400 | 27,543 | (2,707,052 | ) | — | |||||||||||||
Accrued expenses | 15,399 | 22,281 | 26,337 | — | 64,017 | ||||||||||||||
Current portion of contingent consideration | — | 7,291 | — | — | 7,291 | ||||||||||||||
Payroll and benefit-related liabilities | 21,617 | 29,305 | 33,736 | — | 84,658 | ||||||||||||||
Accrued interest | 7,455 | — | 25 | — | 7,480 | ||||||||||||||
Income taxes payable | — | — | 8,144 | (85 | ) | 8,059 | |||||||||||||
Other current liabilities | 1,300 | 2,679 | 4,981 | — | 8,960 | ||||||||||||||
Total current liabilities | 2,899,875 | 290,483 | 180,899 | (2,707,137 | ) | 664,120 | |||||||||||||
Long-term borrowings | 641,850 | — | — | — | 641,850 | ||||||||||||||
Deferred tax liabilities | — | 376,738 | 36,378 | (97,133 | ) | 315,983 | |||||||||||||
Pension and postretirement benefit liabilities | 100,355 | 32,274 | 16,812 | — | 149,441 | ||||||||||||||
Noncurrent liability for uncertain tax positions | 1,151 | 17,722 | 21,527 | — | 40,400 | ||||||||||||||
Notes payable and other amounts due to consolidated subsidiaries | 1,585,727 | 1,253,189 | 177,622 | (3,016,538 | ) | — | |||||||||||||
Other liabilities | 20,931 | 15,685 | 12,271 | — | 48,887 | ||||||||||||||
Total liabilities | 5,249,889 | 1,986,091 | 445,509 | (5,820,808 | ) | 1,860,681 | |||||||||||||
Total common shareholders' equity | 2,009,272 | 5,307,442 | 1,816,612 | (7,124,054 | ) | 2,009,272 | |||||||||||||
Noncontrolling interest | — | — | 1,821 | — | 1,821 | ||||||||||||||
Total equity | 2,009,272 | 5,307,442 | 1,818,433 | (7,124,054 | ) | 2,011,093 | |||||||||||||
Total liabilities and equity | $ | 7,259,161 | $ | 7,293,533 | $ | 2,263,942 | $ | (12,944,862 | ) | $ | 3,871,774 | ||||||||
F-56
TELEFLEX INCORPORATED
NOTES TO CONSOLIDATED FINANCIAL STATEMENTS — (Continued)
TELEFLEX INCORPORATED AND SUBSIDIARIES
CONDENSED CONSOLIDATING STATEMENTS OF CASH FLOWS
Year Ended December 31, 2016 | |||||||||||||||||||
Parent Company | Guarantor Subsidiaries | Non-Guarantor Subsidiaries | Eliminations | Condensed Consolidated | |||||||||||||||
(Dollars in thousands) | |||||||||||||||||||
Net cash (used in) provided by operating activities from continuing operations | $ | (85,088 | ) | $ | 169,400 | $ | 328,553 | $ | (2,275 | ) | $ | 410,590 | |||||||
Cash flows from investing activities of continuing operations: | |||||||||||||||||||
Expenditures for property, plant and equipment | (279 | ) | (24,753 | ) | (28,103 | ) | — | (53,135 | ) | ||||||||||
Payments for businesses and intangibles acquired, net of cash acquired | — | (10,305 | ) | (50,572 | ) | 46,837 | (14,040 | ) | |||||||||||
Proceeds from sale of assets | 5,607 | 49,571 | 1,860 | (46,837 | ) | 10,201 | |||||||||||||
Investments in affiliates | — | (5,600 | ) | — | 5,600 | — | |||||||||||||
Net cash provided by (used in) investing activities from continuing operations | 5,328 | 8,913 | (76,815 | ) | 5,600 | (56,974 | ) | ||||||||||||
Cash flows from financing activities of continuing operations: | |||||||||||||||||||
Proceeds from new borrowings | 665,000 | — | 6,700 | — | 671,700 | ||||||||||||||
Reduction in borrowings | (714,565 | ) | — | — | — | (714,565 | ) | ||||||||||||
Debt extinguishment, issuance and amendment fees | (8,958 | ) | — | — | — | (8,958 | ) | ||||||||||||
Proceeds from share based compensation plans and the related tax impacts | 9,068 | — | — | — | 9,068 | ||||||||||||||
Payments to noncontrolling interest shareholders | — | — | (464 | ) | — | (464 | ) | ||||||||||||
Payments for acquisition of noncontrolling interest | — | — | (9,231 | ) | — | (9,231 | ) | ||||||||||||
Payments for contingent consideration | — | (7,282 | ) | — | — | (7,282 | ) | ||||||||||||
Proceeds from issuance of shares | — | — | 5,600 | (5,600 | ) | — | |||||||||||||
Dividends paid | (58,960 | ) | — | — | — | (58,960 | ) | ||||||||||||
Intercompany transactions | 183,244 | (170,000 | ) | (13,244 | ) | — | — | ||||||||||||
Intercompany dividends paid | — | — | (2,275 | ) | 2,275 | — | |||||||||||||
Net cash provided by (used in) financing activities from continuing operations | 74,829 | (177,282 | ) | (12,914 | ) | (3,325 | ) | (118,692 | ) | ||||||||||
Cash flows from discontinued operations: | |||||||||||||||||||
Net cash used in operating activities | (2,110 | ) | — | — | — | (2,110 | ) | ||||||||||||
Net cash used in discontinued operations | (2,110 | ) | — | — | — | (2,110 | ) | ||||||||||||
Effect of exchange rate changes on cash and cash equivalents | — | — | (27,391 | ) | — | (27,391 | ) | ||||||||||||
Net (decrease) increase in cash and cash equivalents | (7,041 | ) | 1,031 | 211,433 | — | 205,423 | |||||||||||||
Cash and cash equivalents at the beginning of the year | 21,612 | — | 316,754 | — | 338,366 | ||||||||||||||
Cash and cash equivalents at the end of the year | $ | 14,571 | $ | 1,031 | $ | 528,187 | $ | — | $ | 543,789 | |||||||||
F-57
TELEFLEX INCORPORATED
NOTES TO CONSOLIDATED FINANCIAL STATEMENTS — (Continued)
Year Ended December 31, 2015 | |||||||||||||||||||
Parent Company | Guarantor Subsidiaries | Non-Guarantor Subsidiaries | Eliminations | Condensed Consolidated | |||||||||||||||
(Dollars in thousands) | |||||||||||||||||||
Net cash (used in) provided by operating activities from continuing operations | $ | (147,704 | ) | $ | 134,817 | $ | 320,145 | $ | (3,812 | ) | $ | 303,446 | |||||||
Cash flows from investing activities of continuing operations: | |||||||||||||||||||
Expenditures for property, plant and equipment | (124 | ) | (32,797 | ) | (28,527 | ) | — | (61,448 | ) | ||||||||||
Payments for businesses and intangibles acquired, net of cash acquired | — | (60,336 | ) | (33,472 | ) | — | (93,808 | ) | |||||||||||
Proceeds from sale of assets | 408 | — | — | — | 408 | ||||||||||||||
Investments in affiliates | — | — | (121,850 | ) | 121,850 | — | |||||||||||||
Net cash provided by (used in) investing activities from continuing operations | 284 | (93,133 | ) | (183,849 | ) | 121,850 | (154,848 | ) | |||||||||||
Cash flows from financing activities of continuing operations: | |||||||||||||||||||
Proceeds from new borrowings | 288,100 | — | — | — | 288,100 | ||||||||||||||
Reduction in borrowings | (303,757 | ) | — | — | — | (303,757 | ) | ||||||||||||
Debt extinguishment, issuance and amendment fees | (9,017 | ) | — | — | — | (9,017 | ) | ||||||||||||
Proceeds from share based compensation plans and related tax impacts | 4,994 | — | — | — | 4,994 | ||||||||||||||
Payments to noncontrolling interest shareholders | — | — | (1,343 | ) | — | (1,343 | ) | ||||||||||||
Payments for contingent consideration | — | (8,028 | ) | — | — | (8,028 | ) | ||||||||||||
Proceeds from issuance of shares | — | 121,850 | — | (121,850 | ) | — | |||||||||||||
Dividends paid | (56,532 | ) | — | — | — | (56,532 | ) | ||||||||||||
Intercompany transactions | 219,035 | (155,506 | ) | (63,529 | ) | — | — | ||||||||||||
Intercompany dividends paid | — | — | (3,812 | ) | 3,812 | — | |||||||||||||
Net cash provided by (used in) financing activities from continuing operations | 142,823 | (41,684 | ) | (68,684 | ) | (118,038 | ) | (85,583 | ) | ||||||||||
Cash flows from discontinued operations: | |||||||||||||||||||
Net cash used in operating activities | (1,787 | ) | — | (849 | ) | — | (2,636 | ) | |||||||||||
Net cash used in discontinued operations | (1,787 | ) | — | (849 | ) | — | (2,636 | ) | |||||||||||
Effect of exchange rate changes on cash and cash equivalents | — | — | (25,249 | ) | — | (25,249 | ) | ||||||||||||
Net (decrease) increase in cash and cash equivalents | (6,384 | ) | — | 41,514 | — | 35,130 | |||||||||||||
Cash and cash equivalents at the beginning of the year | 27,996 | — | 275,240 | — | 303,236 | ||||||||||||||
Cash and cash equivalents at the end of the year | $ | 21,612 | $ | — | $ | 316,754 | $ | — | $ | 338,366 | |||||||||
F-58
TELEFLEX INCORPORATED
NOTES TO CONSOLIDATED FINANCIAL STATEMENTS — (Continued)
Year Ended December 31, 2014 | |||||||||||||||||||
Parent Company | Guarantor Subsidiaries | Non-Guarantor Subsidiaries | Eliminations | Condensed Consolidated | |||||||||||||||
(Dollars in thousands) | |||||||||||||||||||
Net cash (used in) provided by operating activities from continuing operations | $ | (105,467 | ) | $ | 347,503 | $ | 52,634 | $ | (4,429 | ) | $ | 290,241 | |||||||
Cash flows from investing activities of continuing operations: | |||||||||||||||||||
Expenditures for property, plant and equipment | (2,273 | ) | (30,586 | ) | (34,712 | ) | — | (67,571 | ) | ||||||||||
Payments for businesses and intangibles acquired, net of cash acquired | — | (17,241 | ) | (28,536 | ) | — | (45,777 | ) | |||||||||||
Proceeds from sale of assets and investments | 1,669 | 3,421 | 161 | — | 5,251 | ||||||||||||||
Investments in affiliates | (60 | ) | 20 | — | — | (40 | ) | ||||||||||||
Net cash used in investing activities from continuing operations | (664 | ) | (44,386 | ) | (63,087 | ) | — | (108,137 | ) | ||||||||||
Cash flows from financing activities of continuing operations: | |||||||||||||||||||
Proceeds from new borrowings | 250,000 | — | — | — | 250,000 | ||||||||||||||
Reduction in borrowings | (480,102 | ) | — | — | — | (480,102 | ) | ||||||||||||
Debt issuance and amendment fees | (4,494 | ) | — | — | — | (4,494 | ) | ||||||||||||
Proceeds from share based compensation plans and the related tax impacts | 4,245 | — | — | — | 4,245 | ||||||||||||||
Payments to noncontrolling interest shareholders | — | — | (1,094 | ) | — | (1,094 | ) | ||||||||||||
Dividends paid | (56,258 | ) | — | — | — | (56,258 | ) | ||||||||||||
Intercompany transactions | 381,663 | (317,617 | ) | (64,046 | ) | — | — | ||||||||||||
Intercompany dividends paid | — | — | (4,429 | ) | 4,429 | — | |||||||||||||
Net cash provided by (used in) financing activities from continuing operations | 95,054 | (317,617 | ) | (69,569 | ) | 4,429 | (287,703 | ) | |||||||||||
Cash flows from discontinued operations: | |||||||||||||||||||
Net cash used in operating activities | (3,676 | ) | — | — | — | (3,676 | ) | ||||||||||||
Net cash used in discontinued operations | (3,676 | ) | — | — | — | (3,676 | ) | ||||||||||||
Effect of exchange rate changes on cash and cash equivalents | — | — | (19,473 | ) | — | (19,473 | ) | ||||||||||||
Net decrease in cash and cash equivalents | (14,753 | ) | (14,500 | ) | (99,495 | ) | — | (128,748 | ) | ||||||||||
Cash and cash equivalents at the beginning of the year | 42,749 | 14,500 | 374,735 | — | 431,984 | ||||||||||||||
Cash and cash equivalents at the end of the year | $ | 27,996 | $ | — | $ | 275,240 | $ | — | $ | 303,236 | |||||||||
F-59
TELEFLEX INCORPORATED
NOTES TO CONSOLIDATED FINANCIAL STATEMENTS — (Continued)
Note 18 — Divestiture-related activities
Assets Held for Sale
The table below provides information regarding assets held for sale at December 31, 2016 and 2015. At December 31, 2016, these assets consisted of one building, which was sold on January 12, 2017.
2016 | 2015 | ||||||
Assets held for sale: | (Dollars in thousands) | ||||||
Property, plant and equipment | $ | 2,879 | $ | 6,972 | |||
Total assets held for sale | $ | 2,879 | $ | 6,972 | |||
For the year ended December 31, 2016, the Company disposed of one held for sale building for $6.0 million, which resulted in a gain of $2.8 million. Additionally, the Company recorded an impairment charge of $1.0 million associated with a building held for sale for the year ended December 31, 2016.
Discontinued Operations
The results of the Company’s discontinued operations for the years ended December 31, 2016, 2015 and 2014 were as follows:
2016 | 2015 | 2014 | |||||||||
(Dollars in thousands) | |||||||||||
Costs and other expenses (1) | $ | 922 | $ | 1,730 | $ | 3,407 | |||||
Loss from discontinued operations before income taxes | (922 | ) | (1,730 | ) | (3,407 | ) | |||||
Tax benefit on loss from discontinued operations (2) | 1,112 | 10,635 | 698 | ||||||||
Income (loss) from discontinued operations | $ | 190 | $ | 8,905 | $ | (2,709 | ) | ||||
(1) | Includes expenses associated with retained liabilities related to divested businesses. |
(2) | The tax benefit on loss from discontinued operations recognized in 2015 reflects a reduction in U.S. liabilities associated with unrecognized tax benefits as a result of the conclusion of an audit. |
F-60
TELEFLEX INCORPORATED
NOTES TO CONSOLIDATED FINANCIAL STATEMENTS — (Continued)
Note 19 — Subsequent events
Acquisition of Vascular Solutions, Inc.
On February 17, 2017, the Company acquired all of the common stock, and voting equity interest in, Vascular Solutions, Inc. (“Vascular Solutions”) for $56.00 per share in cash, or a total of approximately $1.0 billion. Vascular Solutions is a medical device company that focuses on developing clinical solutions for minimally invasive coronary and peripheral vascular procedures.
Concurrent with the execution of the agreement to acquire Vascular Solutions, the Company entered into a $750 million senior unsecured 364 day bridge loan facility (the “Bridge Facility”) and obtained a commitment (the “Backstop Commitment”) from a lender to backstop an amendment to the Revolving Credit Facility in order to permit the Bridge Facility and make certain other changes thereto. The Bridge Facility and the Backstop Commitment were put in place to ensure the Company's ability to refinance certain existing indebtedness, to pay the purchase price for the Vascular Solutions acquisition, and to pay fees, costs and expenses incurred in connection with the acquisition. In connection with the Bridge Facility and the Backstop Commitment, the Company incurred, for the year ended December 31, 2016, financing costs of $3.4 million, which were recognized in interest expense in the consolidated statement of income. The Bridge Facility and Backstop Commitment were terminated upon the execution of the Company's amended and restated credit agreement, which is described more fully below under "Amended and restated senior credit facility."
For the year ended December 31, 2016, the Company incurred integration and transaction costs of $3.0 million in connection with the acquisition, which were recognized in selling, general and administrative expenses in the consolidated statement of income.
Amended and restated senior credit facility
On January 20, 2017 (the “Effective Date”), the Company amended and restated its then-existing senior credit agreement, dated July 16, 2013 (the "2013 Credit Agreement"), by entering into an Amended and Restated Credit Agreement (the “2017 Credit Agreement”). The 2017 Credit Agreement provides for a five-year revolving credit facility of $1.0 billion and a term loan facility of $750.0 million. The term loan facility and borrowings under the revolving credit facility were used to finance the acquisition of Vascular Solutions. The obligations under the 2017 Credit Agreement are guaranteed (subject to certain exceptions and limitations) by substantially all of the material domestic subsidiaries of the Company and are secured by a lien on substantially all of the assets owned by the Company and each guarantor. The maturity date of the revolving credit facility under the 2017 Credit Agreement is January 20, 2022 and the term loan facility will mature on February 17, 2022.
At the Company’s option, loans under the 2017 Credit Agreement will bear interest at a rate equal to adjusted LIBOR plus an applicable margin ranging from 1.25% to 2.50% or at an alternate base rate, which is defined as the highest of the administrative agent’s publicly announced prime rate, 0.5% above the federal funds rate and 1% above adjusted LIBOR for a one month interest period on such day, plus an applicable margin ranging from 0.25% to 1.50%, in each case subject to adjustment based on the Company’s consolidated leverage ratio (generally, the ratio of consolidated total funded indebtedness to consolidated adjusted EBITDA for the four most recent fiscal quarters preceding the date of determination). Overdue loans will bear interest at the rate otherwise applicable to such loans plus 2.00%.
The 2017 Credit Agreement contains customary representations and warranties and covenants that, among other things and subject to certain exceptions, qualifications and thresholds, place limitations on the Company and its subsidiaries regarding its ability, and the ability of its subsidiaries, to incur additional indebtedness, create additional liens, enter into a merger, consolidation or amalgamation, dispose of certain assets, make certain investments or acquisitions, pay dividends on, repurchase or make distributions in respect of capital stock and enter into swap agreements. The Company is required to maintain a maximum consolidated leverage ratio of 4.50 to 1.00 and a maximum secured leverage ratio (generally, consolidated senior secured funded indebtedness on the date of determination to adjusted consolidated EBITDA for the four most recent quarters preceding the date of determination) of 3.50 to 1.00. The Company is further required to maintain a consolidated interest coverage ratio (generally, consolidated adjusted EBITDA for the four most recent fiscal quarters preceding the date of determination to consolidated interest expense paid in cash for such period) of not less than 3.50 to 1.00.
As a result of the Company's entry into the 2017 Credit Agreement, which was considered a partial extinguishment of the 2013 Credit Agreement, the Company recognized a loss on extinguishment of debt of $0.4 million in January
F-61
TELEFLEX INCORPORATED
NOTES TO CONSOLIDATED FINANCIAL STATEMENTS — (Continued)
2017. Additionally, in January 2017, the Company capitalized an estimated $12.0 million related to transaction fees, including underwriters’ discounts and commissions, incurred in connection with the 2017 Credit Agreement.
Exchange transactions
On January 5, 2017, pursuant to separate, privately negotiated agreements between the Company and certain holders of the Convertible Notes, the Company paid cash and common stock in exchange for $91.7 million aggregate principal amount of the Convertible Notes. The structure of the exchange transactions was substantially identical to those of the Exchange Transactions described in Note 8 (i.e., the exchange consideration per $1,000 principal amount of Convertible Notes included (i) $1,000 in cash, (ii) a number of shares of Company common stock equal to the amount of the conversion value in excess of $1,000, calculated on the basis of the Average Daily VWAP, (iii) Inducement Shares; and (iv) cash in an amount equal to accrued and unpaid interest to, but not including, the closing date). As a result of these exchanges, the Company paid to the holders who exchanged their Convertible Notes aggregate cash consideration of approximately $93.2 million (which includes approximately $1.5 million in accrued but previously unpaid interest) and issued and delivered to the exchanging holders approximately 0.93 million shares of Company common stock. The Company funded the cash payment through borrowings under its revolving credit facility. Following this transaction, $44.3 million aggregate principal amount of the Convertible Notes continue to be outstanding.
As of December 31, 2016, the Company reclassified $1.8 million from additional paid-in capital to convertible notes in the mezzanine equity section of the Company's consolidated balance sheet. The reclassified amount represents the aggregate difference between the principal amount and the carrying value of the Convertible Notes purchased by the Company pursuant to this exchange transaction that were entered into prior to December 31,2016, but not settled until January 5, 2017. In addition, as a result of this exchange transaction, the Company recognized a loss on extinguishment of debt of $5.2 million in January 2017.
In addition, in connection with the exchange transaction described above, the Company and the dealer counterparties to the convertible note hedge transactions that were effected at the time of the initial issuance of the Convertible Notes entered into bond hedge unwind and warrant unwind agreements. The bond hedge unwind and warrant unwind agreements were structured in substantially identical form to the Hedge Unwind Agreements and Warrant Unwind Agreements described in Note 8. On a net basis, after giving effect to the January 2017 unwind agreements, the Company received 0.12 million shares of Company common stock from the dealer counterparties.
F-62
QUARTERLY DATA (UNAUDITED)
First Quarter | Second Quarter | Third Quarter | Fourth Quarter | ||||||||||||
(Dollars in thousands, except per share) | |||||||||||||||
2016: | |||||||||||||||
Net revenues | $ | 424,893 | $ | 473,553 | $ | 455,648 | $ | 513,933 | |||||||
Gross profit | 225,147 | 256,399 | 241,602 | 273,052 | |||||||||||
Income from continuing operations before interest, loss on extinguishment of debt and taxes | 67,497 | 98,441 | 86,487 | 67,028 | |||||||||||
Income from continuing operations | 51,180 | 59,395 | 66,200 | 60,876 | |||||||||||
Income (Loss) from discontinued operations | (312 | ) | 193 | 122 | 187 | ||||||||||
Net income | 50,868 | 59,588 | 66,322 | 61,063 | |||||||||||
Less: Income from continuing operations attributable to noncontrolling interest | 179 | 285 | — | — | |||||||||||
Net income attributable to common shareholders | 50,689 | 59,303 | 66,322 | 61,063 | |||||||||||
Earnings per share available to common shareholders — basic(1): | |||||||||||||||
Income from continuing operations | $ | 1.22 | $ | 1.36 | $ | 1.50 | $ | 1.38 | |||||||
Loss from discontinued operations | — | — | 0.01 | 0.01 | |||||||||||
Net income | $ | 1.22 | $ | 1.36 | $ | 1.51 | $ | 1.39 | |||||||
Earnings per share available to common shareholders — diluted(1): | |||||||||||||||
Income from continuing operations | $ | 1.05 | $ | 1.25 | $ | 1.40 | $ | 1.29 | |||||||
Loss from discontinued operations | (0.01 | ) | 0.01 | — | 0.01 | ||||||||||
Net income | $ | 1.04 | $ | 1.26 | $ | 1.40 | $ | 1.30 | |||||||
2015: | |||||||||||||||
Net revenues | $ | 429,430 | $ | 452,045 | $ | 443,714 | $ | 484,501 | |||||||
Gross profit | 222,637 | 233,237 | 228,213 | 260,316 | |||||||||||
Income from continuing operations before interest and taxes | 65,608 | 76,986 | 76,550 | 96,747 | |||||||||||
Income from continuing operations | 39,273 | 45,199 | 61,571 | 90,765 | |||||||||||
Loss from discontinued operations | (703 | ) | (190 | ) | (719 | ) | 10,517 | ||||||||
Net income | 38,570 | 45,009 | 60,852 | 101,282 | |||||||||||
Less: Income from continuing operations attributable to noncontrolling interest | 218 | 446 | 28 | 158 | |||||||||||
Net income attributable to common shareholders | 38,352 | 44,563 | 60,824 | 101,124 | |||||||||||
Earnings per share available to common shareholders — basic(1): | |||||||||||||||
Income from continuing operations | $ | 0.94 | $ | 1.08 | $ | 1.48 | $ | 2.18 | |||||||
Loss from discontinued operations | (0.02 | ) | (0.01 | ) | (0.02 | ) | 0.25 | ||||||||
Net income | $ | 0.92 | $ | 1.07 | $ | 1.46 | $ | 2.43 | |||||||
Earnings per share available to common shareholders — diluted(1): | |||||||||||||||
Income from continuing operations | $ | 0.83 | $ | 0.93 | $ | 1.27 | $ | 1.88 | |||||||
Loss from discontinued operations | (0.02 | ) | — | (0.02 | ) | 0.21 | |||||||||
Net income | $ | 0.81 | $ | 0.93 | $ | 1.25 | $ | 2.09 | |||||||
(1) Each quarter is calculated as a discrete period; the sum of the four quarters may not equal the calculated full year amount.
62
TELEFLEX INCORPORATED
SCHEDULE II — VALUATION AND QUALIFYING ACCOUNTS
(Dollars in thousands)
ALLOWANCE FOR DOUBTFUL ACCOUNTS
Balance at Beginning of Year | Additions Charged to Income | Accounts Receivable Write-offs | Translation and Other | Balance at End of Year | |||||||||||||||
December 31, 2016 | $ | 8,026 | $ | 2,156 | $ | (862 | ) | $ | (684 | ) | $ | 8,636 | |||||||
December 31, 2015 | $ | 8,783 | $ | 1,618 | $ | (1,387 | ) | $ | (988 | ) | $ | 8,026 | |||||||
December 31, 2014 | $ | 10,722 | $ | 1,882 | $ | (2,738 | ) | $ | (1,083 | ) | $ | 8,783 | |||||||
INVENTORY RESERVE
Balance at Beginning of Year | Additions Charged to Income | Inventory Write-offs | Translation and Other | Balance at End of Year | |||||||||||||||
December 31, 2016 | |||||||||||||||||||
Raw material | $ | 7,577 | $ | 1,446 | $ | (1,645 | ) | $ | (823 | ) | $ | 6,555 | |||||||
Work-in-process | 3,139 | (76 | ) | (213 | ) | 3 | 2,853 | ||||||||||||
Finished goods | 25,800 | 12,909 | (11,150 | ) | (609 | ) | 26,950 | ||||||||||||
$ | 36,516 | $ | 14,279 | $ | (13,008 | ) | $ | (1,429 | ) | $ | 36,358 | ||||||||
December 31, 2015 | |||||||||||||||||||
Raw material | $ | 6,891 | $ | 4,102 | $ | (1,611 | ) | $ | (1,805 | ) | $ | 7,577 | |||||||
Work-in-process | 509 | 579 | (554 | ) | 2,605 | 3,139 | |||||||||||||
Finished goods | 26,474 | 15,060 | (13,653 | ) | (2,081 | ) | 25,800 | ||||||||||||
$ | 33,874 | $ | 19,741 | $ | (15,818 | ) | $ | (1,281 | ) | $ | 36,516 | ||||||||
December 31, 2014 | |||||||||||||||||||
Raw material | $ | 5,687 | $ | 1,840 | $ | (2,391 | ) | $ | 1,755 | $ | 6,891 | ||||||||
Work-in-process | 1,729 | 1,239 | (1,720 | ) | (739 | ) | 509 | ||||||||||||
Finished goods | 24,957 | 10,135 | (7,317 | ) | (1,301 | ) | 26,474 | ||||||||||||
$ | 32,373 | $ | 13,214 | $ | (11,428 | ) | $ | (285 | ) | $ | 33,874 | ||||||||
DEFERRED TAX ASSET VALUATION ALLOWANCE
Balance at Beginning of Year | Additions Charged to Expense | Reductions Credited to Expense | Translation and Other | Balance at End of Year | |||||||||||||||
December 31, 2016 | $ | 103,475 | $ | 2,046 | $ | (725 | ) | $ | (276 | ) | $ | 104,520 | |||||||
December 31, 2015 | $ | 99,141 | $ | 5,681 | $ | (190 | ) | $ | (1,157 | ) | $ | 103,475 | |||||||
December 31, 2014 | $ | 86,510 | $ | 13,331 | $ | (3,741 | ) | $ | 3,041 | $ | 99,141 | ||||||||
63
The following exhibits are filed as part of, or incorporated by reference into, this report:
Exhibit No. | Description | |
*3.1.1 | — | Articles of Incorporation of the Company are incorporated by reference to Exhibit 3(a) to the Company’s Form 10-Q for the period ended June 30, 1985. |
*3.1.2 | — | Amendment to Article Thirteenth of the Company’s Articles of Incorporation is incorporated by reference to Exhibit 3 of the Company’s Form 10-Q for the period ended June 28, 1987. |
*3.1.3 | — | Amendment to the first paragraph of Article Fourth of the Company’s Articles of Incorporation is incorporated by reference to Proposal 2 of the Company’s Proxy Statement filed on March 29, 2007. |
*3.2 | — | Amended and Restated Bylaws of the Company (incorporated by reference to Exhibit 3.2 to the Company’s Form 8-K filed on May 7, 2009). |
*4.1.1 | — | Indenture, dated August 2, 2010, between the Company and Wells Fargo Bank, N.A., as trustee (incorporated by reference to Exhibit 4.4 to the Company’s registration statement on Form S-3 (Registration No. 333-168464) filed on August 2, 2010). |
*4.1.2 | — | First Supplemental Indenture, dated August 9, 2010, between the Company and Wells Fargo Bank, N.A., as trustee, relating to the Company’s 3.875% Convertible Subordinated Debentures due 2017 (incorporated by reference to Exhibit 4.2 to the Company’s Form 8-K filed on August 9, 2010). |
*4.1.3 | — | Form of 3.875% Convertible Senior Subordinated Notes due 2017 (incorporated by reference to Exhibit A in Exhibit 4.2 to the Company’s Form 8-K filed on August 9, 2010). |
*4.2.1 | — | Indenture, dated as of May 21, 2014, among the Company, the Guarantors party thereto and Wells Fargo Bank, N.A., as trustee, relating to the Company's 5.25% Senior Notes due 2024 (incorporated by reference to Exhibit 4.1 to the Company's Form 8-K filed on May 22, 2014). |
*4.2.2 | — | Form of 5.25% Senior Notes due 2024 (incorporated by reference to Exhibit A in Exhibit 4.1 to the Company’s Form 8-K filed on May 22, 2014). |
*4.3.1 | Indenture, dated May 16, 2016, by and between Teleflex Incorporated and Wells Fargo Bank, National Association (incorporated by reference to Exhibit 4.2 to the Company’s Registration Statement on Form S-3 (File No 333-211276) filed with the Securities and Exchange Commission on May 11, 2016). | |
*4.3.2 | First Supplemental Indenture, dated May 16, 2016, by and among Teleflex Incorporated, the guarantors party thereto and Wells Fargo Bank, National Association, relating to Teleflex Incorporated’s 4.875% Senior Notes due 2026 (incorporated by reference to Exhibit 4.2 to the Company’s Current Report on Form 8-K (File No. 1-5353), filed with the Securities and Exchange Commission on May 16, 2016). | |
*4.3.3 | Form of 4.875% Senior Note due 2026 (included in Exhibit 4.2). | |
+*10.1 | — | Teleflex Incorporated Retirement Income Plan, as amended and restated effective January 1, 2014 (incorporated by reference to Exhibit 10.1 to the Company’s Form 10-K filed on February 20, 2015). |
+*10.2.1 | — | Amended and Restated Teleflex Incorporated Deferred Compensation Plan, dated December 26, 2012 (incorporated by reference to Exhibit 10.2 to the Company’s Form 10-K filed on February 22, 2013). |
+*10.2.2 | — | First Amendment to the Teleflex Incorporated Deferred Compensation Plan, dated December 11, 2015 (incorporated by reference to Exhibit 10.2.2 to the Company’s Form 10-K filed on February 25, 2016). |
*10.3.1 | — | Amended and Restated Teleflex 401(k) Savings Plan, effective as of January 1, 2014 (incorporated by reference to Exhibit 10.2 to the Company’s Form 10-K filed on February 22, 2013). |
*10.3.2 | — | Special Amendment to Teleflex 401(k) Savings Plan, dated August 12, 2015 (incorporated by reference to Exhibit 10.3.2 to the Company’s Form 10-K filed on February 25, 2016). |
+*10.4.1 | — | 2000 Stock Compensation Plan (incorporated by reference to the Company’s registration statement on Form S-8 (Registration No. 333-38224), filed on May 31, 2000). |
+*10.4.2 | — | Amendment dated March 28, 2012, to 2000 Stock Compensation Plan (incorporated by reference to Exhibit 10.2 to the Company’s Form 10-Q filed on May 1, 2012). |
+*10.5.1 | — | 2008 Stock Incentive Plan (incorporated by reference to Appendix A to the Company’s definitive Proxy Statement for the 2008 Annual Meeting of Stockholders filed on March 21, 2008). |
+*10.5.2 | — | Amendment dated March 28, 2012, to 2008 Stock Incentive Plan (incorporated by reference to Exhibit 10.3 to the Company’s Form 10-Q filed on May 1, 2012). |
Exhibit No. | Description | |
*10.5.3 | — | Form of Stock Option Agreement for stock options granted on or after January 1, 2013 under the Company’s 2008 Stock Incentive Plan (incorporated by reference to Exhibit 10.5.3 to the Company's Form 10-K filed on February 24, 2014). |
*10.5.4 | — | Form of Restricted Stock Award Agreement for restricted stock awards granted on or after January 1, 2013 under the Company’s 2008 Stock Incentive Plan (incorporated by reference to Exhibit 10.5.4 to the Company's Form 10-K filed on February 24, 2014). |
+*10.5.5 | — | Restricted Stock Award Agreement between the Company and Benson F. Smith for restricted stock award granted on March 14, 2013 (incorporated by reference to Exhibit 10.5.5 to the Company's Form 10-K filed on February 24, 2014). |
+*10.5.6 | — | Form of Stock Option Agreement for stock options granted to Benson F. Smith under the Company's 2014 Stock Incentive Plan (incorporated by reference to Exhibit 10.5.6 to the Company’s Form 10-K filed on February 25, 2016). |
+*10.5.7 | — | Form of Restricted Stock Award Agreement for restricted stock awards granted to Benson F. Smith under the Company's 2014 Stock Incentive Plan (incorporated by reference to Exhibit 10.5.7 to the Company’s Form 10-K filed on February 25, 2016). |
+*10.6 | — | Teleflex Incorporated 2011 Executive Incentive Plan (incorporated by reference to Appendix A to the Company’s definitive Proxy Statement for the 2011 Annual Meeting of Stockholders filed on March 25, 2011). |
+*10.7 | — | Teleflex Incorporated 2014 Stock Incentive Plan (incorporated by reference to Appendix A to the Company's definitive Proxy Statement for the 2014 Annual Meeting of Stockholders filed on March 28, 2014). |
+*10.8 | — | Executive Change In Control Agreement, dated December 15, 2011, between the Company and Benson F. Smith (incorporated by reference to Exhibit 10.1 to the Company’s Form 8-K filed on December 16, 2011). |
+*10.9 | — | Senior Executive Officer Severance Agreement, dated March 25, 2011, between the Company and Benson F. Smith (incorporated by reference to Exhibit 10.1 to the Company’s Form 10-Q filed on April 26, 2011). |
+*10.10 | — | Executive Change In Control Agreement, dated May 1, 2015, between the Company and Liam Kelly (incorporated by reference to Exhibit 10.3 to the Company’s Form 10-Q filed on July 30, 2015). |
+*10.11 | — | Senior Executive Officer Severance Agreement, dated May 1, 2015, between the Company and Liam Kelly (incorporated by reference to Exhibit 10.2 to the Company’s Form 10-Q filed on July 30, 2015). |
+*10.12.1 | — | Letter Agreement, dated as of May 1, 2015, between the Company and Liam Kelly, relating to compensation and benefits to be provided to Mr. Kelly in connection with his appointment as Executive Vice President and Chief Operating Officer (incorporated by reference to Exhibit 10.1 to the Company's Form 10-Q filed on July 30, 2015). |
+*10.13 | — | Senior Executive Officer Severance Agreement, dated March 26, 2013, between the Company and Thomas E. Powell (incorporated by reference to Exhibit 10.1 to the Company’s Form 10-Q filed on April 30, 2013). |
+*10.14 | — | Executive Change In Control Agreement, dated March 26, 2013, between the Company and Thomas E. Powell (incorporated by reference to Exhibit 10.2 to the Company’s Form 10-Q filed on April 30, 2013). |
+*10.15.1 | — | Contract of Employment, dated September 27, 2011, between the Company and Thomas Anthony Kennedy (incorporated by reference to Exhibit 10.15.1 to the Company’s Form 10-K filed on February 20, 2015). |
+*10.15.2 | — | Letter Agreement, dated April 29, 2013, between the Company and Thomas Anthony Kennedy, relating to Mr. Kennedy's appointment as Senior Vice President, Global Operations (incorporated by reference to Exhibit 10.15.2 to the Company’s Form 10-K filed on February 20, 2015). |
+*10.16 | — | Letter Agreement, dated March 8, 2013, between the Company and Cameron Hicks relating to Mr. Hicks' employment as Vice President, Global Human Resources (incorporated by reference to Exhibit 10.16 to the Company’s Form 10-K filed on February 20, 2015). |
+*10.17 | — | Contract of Employment, dated November 26, 2012, between the Company and Karen Boylan (incorporated by reference to Exhibit 10.17 to the Company’s Form 10-K filed on February 20, 2015). |
+*10.18 | — | Senior Executive Officer Severance Agreement, dated February 17, 2016, between the Company and James J. Leyden (incorporated by reference to Exhibit 10.18 to the Company’s Form 10-K filed on February 25, 2016). |
Exhibit No. | Description | |
+*10.19 | — | Executive Change In Control Agreement, dated February 17, 2016, between the Company and James J. Leyden (incorporated by reference to Exhibit 10.19 to the Company’s Form 10-K filed on February 25, 2016). |
+*10.20 | — | Senior Executive Officer Severance Agreement, dated February 17, 2016, between the Company and Cameron P. Hicks (incorporated by reference to Exhibit 10.20 to the Company’s Form 10-K filed on February 25, 2016). |
+*10.21 | — | Executive Change In Control Agreement, dated February 17, 2016, between the Company and Cameron P. Hicks (incorporated by reference to Exhibit 10.21 to the Company’s Form 10-K filed on February 25, 2016). |
+*10.22 | — | Senior Executive Officer Severance Agreement, dated March 31, 2016, between the Company and Tony Kennedy (incorporated by reference to Exhibit 10.1 to the Company’s Form 10-Q filed on April 28, 2016). |
+*10.23 | — | Executive Change In Control Agreement, dated March 31, 2016, between the Company and Tony Kennedy (incorporated by reference to Exhibit 10.2 to the Company’s Form 10-Q filed on April 28, 2016). |
+*10.24 | — | Senior Executive Officer Severance Agreement, dated March 31, 2016, between the Company and Karen Boylan (incorporated by reference to Exhibit 10.3 to the Company’s Form 10-Q filed on April 28, 2016). |
+*10.25 | — | Executive Change In Control Agreement, dated March 31, 2016, between the Company and Karen Boylan (incorporated by reference to Exhibit 10.4 to the Company’s Form 10-Q filed on April 28, 2016). |
*10.26.1 | — | Credit Agreement, dated July 16, 2013, among the Company, JPMorgan Chase Bank, N.A., as administrative agent, Bank of America, N.A., as syndication agent, the guarantors party thereto, the lenders party thereto and each other party thereto (incorporated by reference to Exhibit 10.1 to the Company’s Form 8-K filed on July 22, 2013). |
*10.26.2 | — | Consent and Amendment No. 1, dated March 27, 2014, to Credit Agreement dated as of July 16, 2013 among the Company, the Guarantors party thereto, the Lenders party thereto and JPMorgan Chase Bank, N.A., as Administrative Agent (incorporated by reference to Exhibit 10.1 to the Company's Form 8-K filed on April 2, 2014). |
*10.27 | — | Convertible Bond Hedge Transaction Confirmation, dated August 3, 2010, between the Company and Bank of America, National Association, as dealer (incorporated by reference to Exhibit 10.1 to the Company’s Form 8-K filed on August 9, 2010). |
*10.28 | — | Convertible Bond Hedge Transaction Confirmation, dated August 3, 2010, between the Company and J.P. Morgan Securities Inc., as agent for JPMorgan Chase Bank, National Association, as dealer (incorporated by reference to Exhibit 10.2 to the Company’s Form 8-K filed on August 9, 2010). |
*10.29 | — | Issuer Warrant Transaction Confirmation, dated August 3, 2010, between the Company and Bank of America, National Association, as dealer (incorporated by reference to Exhibit 10.3 to the Company’s Form 8-K filed on August 9, 2010). |
*10.30 | — | Issuer Warrant Transaction Confirmation, dated August 3, 2010, between the Company and J.P. Morgan Securities Inc., as agent for JPMorgan Chase Bank, National Association, as dealer (incorporated by reference to Exhibit 10.4 to the Company’s Form 8-K filed on August 9, 2010). |
*14 | — | Code of Ethics policy applicable to the Company’s Chief Executive Officer and senior financial officers (incorporated by reference to Exhibit 14 of the Company’s Form 10-K filed on March 11, 2004). |
21 | — | Subsidiaries of the Company. |
23 | — | Consent of Independent Registered Public Accounting Firm. |
31.1 | — | Certification of Chief Executive Officer pursuant to Rule 13a-14(a) under the Exchange Act. |
31.2 | — | Certification of Chief Financial Officer pursuant to Rule 13a-14(a) under the Exchange Act. |
32.1 | — | Certification of Chief Executive Officer pursuant to Rule 13a-14(b) under the Exchange Act. |
32.2 | — | Certification of Chief Financial Officer pursuant to Rule 13a-14(b) under the Exchange Act. |
Exhibit No. | Description | |
101.1 | — | The following materials from the Company’s Annual Report on Form 10-K for the year ended December 31, 2016, formatted in XBRL (eXtensible Business Reporting Language): (i) the Consolidated Statements of Income for the years ended December 31, 2016, December 31, 2015 and December 31, 2014; (ii) the Consolidated Statements of Comprehensive Income for the years ended December 31, 2016, December 31, 2015 and December 31, 2014; (iii) the Consolidated Balance Sheets as of December 31, 2016 and December 31, 2015; (iv) the Consolidated Statements of Cash Flows for the years ended December 31, 2016, December 31, 2015 and December 31, 2014; (v) the Consolidated Statements of Changes in Equity for the years ended December 31, 2016, December 31, 2015 and December 31, 2014; and (vi) Notes to Consolidated Financial Statements. |
_____________________________________________________
* | Each such exhibit has previously been filed with the Securities and Exchange Commission as part of the filing indicated and is incorporated herein by reference. |
+ | Indicates management contract or compensatory plan or arrangement required to be filed pursuant to Item 15(b) of this report. |