Attached files
| file | filename |
|---|---|
| EX-99.1 - EXHIBIT 99.1 - SM Energy Co | exhibit991-ryderscottlette.htm |
| EX-32.1 - EXHIBIT 32.1 - SM Energy Co | exhibit321-906ceritificati.htm |
| EX-31.2 - EXHIBIT 31.2 - SM Energy Co | exhibit312-certificationwp.htm |
| EX-31.1 - EXHIBIT 31.1 - SM Energy Co | exhibit311-certificationjo.htm |
| EX-23.2 - EXHIBIT 23.2 - SM Energy Co | exhibit232-consentofindepe.htm |
| EX-23.1 - EXHIBIT 23.1 - SM Energy Co | exhibit231-consentofpublic.htm |
| EX-21.1 - EXHIBIT 21.1 - SM Energy Co | exhibit211-subsidiaries123.htm |
| EX-12.1 - EXHIBIT 12.1 - SM Energy Co | exhibit121-ratioofearnings.htm |
| EX-10.26 - EXHIBIT 10.26 - SM Energy Co | exhibit1026-summaryofcompe.htm |
| EX-4.13 - EXHIBIT 4.13 - SM Energy Co | exhibit413-lockxupandregis.htm |
| EX-3.2 - EXHIBIT 3.2 - SM Energy Co | exhibit32-amendedandrestat.htm |
UNITED STATES
SECURITIES AND EXCHANGE COMMISSION
Washington, D.C. 20549
FORM 10-K
þ Annual Report Pursuant to Section 13 or 15(d) of the Securities Exchange Act of 1934
For the fiscal year ended December 31, 2016
or
o Transition Report Pursuant to Section 13 or 15(d) of the Securities Exchange Act of 1934
Commission file number 001-31539
SM ENERGY COMPANY
(Exact name of registrant as specified in its charter)
Delaware (State or other jurisdiction of incorporation or organization) | 41-0518430 (I.R.S. Employer Identification No.) |
1775 Sherman Street, Suite 1200, Denver, Colorado (Address of principal executive offices) | 80203 (Zip Code) |
(303) 861-8140
(Registrant’s telephone number, including area code)
Securities registered pursuant to Section 12(b) of the Act:
Title of each class | Name of each exchange on which registered | |
Common stock, $.01 par value | New York Stock Exchange | |
Securities registered pursuant to Section 12(g) of the Act: None
Indicate by check mark if the registrant is a well-known seasoned issuer, as defined in Rule 405 of the Securities Act. Yes þ No o
Indicate by check mark if the registrant is not required to file reports pursuant to Section 13 or Section 15(d) of the Act. Yes o No þ
Indicate by check mark whether the registrant (1) has filed all reports required to be filed by Section 13 or 15(d) of the Securities Exchange Act of 1934 during the preceding 12 months (or for such shorter period that the registrant was required to file such reports), and (2) has been subject to such filing requirements for the past 90 days. Yesþ Noo
Indicate by check mark whether the registrant has submitted electronically and posted on its corporate Web site, if any, every Interactive Data File required to be submitted and posted pursuant to Rule 405 of Regulation S-T (§232.405 of this chapter) during the preceding 12 months (or for such shorter period that the registrant was required to submit and post such files). Yesþ Noo
Indicate by check mark if disclosure of delinquent filers pursuant to Item 405 of Regulation S-K (§229.405 of this chapter) is not contained herein, and will not be contained, to the best of registrant’s knowledge, in definitive proxy or information statements incorporated by reference in Part III of this Form 10-K or any amendment to this Form 10-K.þ
Indicate by check mark whether the registrant is a large accelerated filer, an accelerated filer, a non-accelerated filer, or a smaller reporting company. See the definitions of “large accelerated filer,” “accelerated filer” and “smaller reporting company” in Rule 12b-2 of the Exchange Act.
Large accelerated filer þ | Accelerated filer o |
Non-accelerated filer o (Do not check if a smaller reporting company) | Smaller reporting company o |
Indicate by check mark whether the registrant is a shell company (as defined in Rule 12b-2 of the Act). Yes o No þ
The aggregate market value of the 67,398,312 shares of voting stock held by non-affiliates of the registrant, based upon the closing sale price of the registrant’s common stock on June 30, 2016, the last business day of the registrant’s most recently completed second fiscal quarter, of $27.00 per share, as reported on the New York Stock Exchange, was $1,819,754,424. Shares of common stock held by each director and executive officer and by each person who owns 10 percent or more of the outstanding common stock or who is otherwise believed by the registrant to be in a control position have been excluded. This determination of affiliate status is not necessarily a conclusive determination for other purposes.
As of February 15, 2017, the registrant had 111,257,703 shares of common stock outstanding.
DOCUMENTS INCORPORATED BY REFERENCE
Certain information required by Items 10, 11, 12, 13, and 14 of Part III is incorporated by reference from portions of the registrant’s Definitive Proxy Statement on Schedule 14A relating to its 2017 annual meeting of stockholders to be filed within 120 days after December 31, 2016.
1
TABLE OF CONTENTS | ||
ITEM | PAGE | |
2
TABLE OF CONTENTS | ||
(Continued) | ||
ITEM | PAGE | |
3
PART I
When we use the terms “SM Energy,” “the Company,” “we,” “us,” or “our,” we are referring to SM Energy Company and its subsidiaries unless the context otherwise requires. We have included certain technical terms important to an understanding of our business under Glossary of Oil and Gas Terms. Throughout this document we make statements that may be classified as “forward-looking.” Please refer to the Cautionary Information about Forward-Looking Statements section of this document for an explanation of these types of statements.
ITEMS 1. and 2. BUSINESS and PROPERTIES
General
We are an independent energy company engaged in the acquisition, exploration, development, and production of crude oil and condensate, natural gas, and natural gas liquids (also respectively referred to as “oil,” “gas,” and “NGLs” throughout the document) in onshore North America. We were founded in 1908 and incorporated in Delaware in 1915. Our initial public offering of common stock was in December 1992. Our common stock trades on the New York Stock Exchange under the ticker symbol “SM.”
Our principal offices are located at 1775 Sherman Street, Suite 1200, Denver, Colorado 80203, and our telephone number is (303) 861-8140.
Strategy
Our strategic objective is to profitably build our ownership and operatorship of North American oil, gas, and NGL producing assets that have high operating margins and significant opportunities for additional economic investment. We pursue growth opportunities through both acquisitions and exploration, and seek to maximize the value of our assets through industry-leading technology application and outstanding operational execution. We focus on achieving high full-cycle economic returns on our investments and maintaining a simple, strong balance sheet.
Significant Developments in 2016
• | Acquisition Activity. During 2016, we acquired approximately 62,000 net acres in the Midland Basin in Howard and Martin Counties, Texas with producing and prospective intervals in the Lower and Middle Spraberry and Wolfcamp A and B shale formations and 15.0 MMBOE of existing proved reserves. We acquired these properties for total consideration of approximately $2.6 billion, which included $2.2 billion in cash and the issuance of 13.4 million shares of our common stock. |
• | Divestiture Activity. During 2016, we divested a total of 47.7 MMBOE of proved reserves in multiple transactions for total net cash proceeds of approximately $946.1 million. Our most significant divestiture was the sale of our Williston Basin assets outside of Divide County, North Dakota (referred to as “Raven/Bear Den” throughout this report) in the fourth quarter of 2016. |
• | Reserves and Capital Investment. Our estimated proved reserves decreased 16 percent to 395.8 MMBOE at December 31, 2016, from 471.3 MMBOE at December 31, 2015, of which 47.7 MMBOE related to the divestiture of proved reserves, as discussed above. We had strong reserve additions of 108.2 MMBOE as a result of our success in reducing costs, optimizing and enhancing completions, and generating better well results. These successes were offset by negative reserve revisions due to lower commodity prices and the removal of certain longer term proved undeveloped reserves that reflects our shift to develop our predominately unproven Midland Basin properties. Costs incurred for development and exploration activities, excluding acquisitions, decreased 48 percent to $713.6 million in 2016 when compared with 2015. Our proved reserve life index decreased slightly to 7.2 years in 2016. Please refer to Reserves and Core Operational Areas below for additional discussion. |
• | Liquidity. During 2016, we issued $500.0 million in aggregate principal amount of 6.75% Senior Notes due September 15, 2026, at par, for net proceeds of $491.6 million. Additionally, we issued $172.5 million in aggregate principal amount of 1.50% Senior Convertible Notes due July 1, 2021, for net proceeds of $166.6 million. During 2016, we also repurchased a total of $46.3 million in aggregate principal amount of a portion of our Senior Notes in open market transactions and paid down the entire $202.0 million outstanding balance on our |
4
credit facility as of December 31, 2015. Further, our borrowing base and lender commitments were reduced to $1.17 billion as of December 31, 2016. Please refer to Overview of Liquidity and Capital Resources in Part II, Item 7 of this report for additional discussion on our current and future liquidity.
• | Equity Market Activities. During 2016, we issued approximately 29.3 million shares of our common stock in two public equity offerings and received $934.1 million in net proceeds. These issuances were in addition to the approximate 13.4 million shares of our common stock issued as partial consideration for certain acquired properties as discussed above. |
• | Production. Our average daily production in 2016 consisted of 45.4 MBbl of oil, 401.5 MMcf of gas, and 38.8 MBbl of NGLs, for an average equivalent production rate of 151.0 MBOE per day, which represents a 14 percent decrease on an equivalent basis compared with 2015. This decrease in production was driven by our reduced drilling and completion activity and divestiture of assets. Please refer to Core Operational Areas below for additional discussion. |
• | Impairments. We recorded impairments of proved and unproved properties totaling $435.0 million for the year ended December 31, 2016. These impairments were largely due to the continued decline in commodity prices in early 2016 impacting our outside-operated Eagle Ford shale assets and negative performance revisions on our Powder River Basin assets at year-end 2016. |
Outlook for 2017
Our priorities for 2017 are to:
• | demonstrate the value of our 2016 acquisitions in the Midland Basin; |
• | generate high margin production growth from our operated acreage positions in the Midland Basin and Eagle Ford shale; |
• | successfully execute the sale of our outside-operated Eagle Ford shale and Divide County assets; and |
• | reduce our outstanding debt. |
Our capital program for 2017, excluding acquisitions, is expected to be approximately $875 million with the focus on our core operated acreage positions in the Midland Basin and Eagle Ford shale. We plan to continue our focus on conducting safe operations even as we ramp up activity. Please refer to Outlook for 2017 under Part II, Item 7 of this report for additional discussion concerning our capital plans for 2017.
5
Core Operational Areas
Our 2016 operations were concentrated in three onshore operating areas in the United States. The following table summarizes estimated proved reserves, production, and costs incurred in oil and gas activities for the year ended December 31, 2016, for our core operating areas:
South Texas & Gulf Coast | Permian | Rocky Mountain | Total (1) | ||||||||||||
Proved Reserves | |||||||||||||||
Oil (MMBbl) | 35.4 | 37.9 | 31.6 | 104.9 | |||||||||||
Gas (Bcf) | 989.3 | 94.6 | 27.2 | 1,111.1 | |||||||||||
NGLs (MMBbl) | 105.2 | 0.1 | 0.5 | 105.7 | |||||||||||
MMBOE (1)(2) | 305.4 | 53.8 | 36.5 | 395.8 | |||||||||||
Relative percentage | 77 | % | 14 | % | 9 | % | 100 | % | |||||||
Proved Developed % | 55 | % | 40 | % | 53 | % | 53 | % | |||||||
Production | |||||||||||||||
Oil (MMBbl) | 5.5 | 2.7 | 8.3 | 16.6 | |||||||||||
Gas (Bcf) | 130.9 | 6.0 | 10.0 | 146.9 | |||||||||||
NGLs (MMBbl) | 13.9 | — | 0.3 | 14.2 | |||||||||||
MMBOE (1)(2) | 41.2 | 3.8 | 10.3 | 55.3 | |||||||||||
Avg. Daily Equivalents (MBOE/d) (1) | 112.6 | 10.2 | 28.2 | 151.0 | |||||||||||
Relative percentage | 74 | % | 7 | % | 19 | % | 100 | % | |||||||
Costs Incurred (in millions)(3) | $ | 254.6 | $ | 2,874.1 | $ | 226.0 | $ | 3,373.9 | |||||||
____________________________________________
(1) | Totals may not sum or calculate due to rounding. |
(2) | As of December 31, 2016, our outside-operated Eagle Ford shale assets were held for sale. Subsequent to year-end, we entered into a definitive agreement with an expected closing date in the first quarter of 2017. These assets represented approximately 74.0 MMBOE of our proved reserves as of December 31, 2016, and approximately 9.7 MMBOE of 2016 production on an equivalent basis. Additionally, subsequent to December 31, 2016, we announced our plans to sell our Divide County, North Dakota assets. |
(3) | Amounts do not sum to total costs incurred due primarily to corporate overhead charges incurred on exploration activity that is excluded from the regional table above. Please refer to the caption Costs Incurred in Oil and Gas Producing Activities in the Supplemental Oil and Gas Information section in Part II, Item 8 of this report. |
Outside of acquisition activity in our Permian region, we reduced our capital spending activity in 2016 in light of the low commodity price environment. We had strong proved reserve additions as a result of our success in reducing costs, optimizing and enhancing completions, and generating better well results in our core development programs. However, total estimated proved reserves decreased from year-end 2015 due to divestitures, a negative price revision, and removal of proved undeveloped reserves as a result of changes in our development plan.
South Texas & Gulf Coast Region. Operations in our South Texas & Gulf Coast region are managed from our office in Houston, Texas. Within this region, we have both an operated and outside-operated Eagle Ford shale program. Our operated Eagle Ford shale position includes approximately 161,000 net acres and accounted for approximately 75 percent of our total Eagle Ford shale production in 2016. Our outside-operated Eagle Ford shale program includes approximately 36,000 net acres. Our acreage position covers a significant portion of the western Eagle Ford shale play, including acreage in the oil/condensate, NGL-rich gas, and dry gas windows of the play. Our outside-operated Eagle Ford shale assets, including the associated midstream assets, were held for sale as of December 31, 2016, with the sale expected to close in the first quarter of 2017.
6
In 2016, we focused our capital on completing wells that were drilled but not completed at year-end 2015 and drilling wells required to satisfy lease obligations. We incurred $253.6 million of costs to add approximately 66.7 MMBOE of estimated proved reserves through our drilling activities. Overall, estimated proved reserves decreased 11 percent to 305.4 MMBOE at December 31, 2016, from 342.4 MMBOE at year-end 2015. Production decreased 15 percent year-over-year to 41.2 MMBOE for 2016 due to reduced drilling activity during the year. As of December 31, 2016, we had 47 gross and net wells that had been drilled but not completed in our operated Eagle Ford shale program.
Permian Region. Operations in our Permian region are managed from our office in Midland, Texas. In 2016, we closed multiple transactions in the Midland Basin in west Texas acquiring approximately 62,000 net acres and 15.0 MMBOE of existing proved reserves in Howard and Martin Counties (referred to as our “RockStar” program throughout this report).
The table above reflects costs incurred on acquisitions totaling $2.6 billion, including $2.2 billion in cash consideration and the issuance of approximately 13.4 million shares of our common stock valued at $437.2 million. Additionally, for the year ended December 31, 2016, we incurred $216.7 million of costs to add approximately 24.0 MMBOE of estimated proved reserves through our drilling activities. The majority of this capital was deployed on our Sweetie Peck assets in Upton County, Texas, where we ran two drilling rigs throughout 2016. We added two drilling rigs on our acquired RockStar acreage in the fourth quarter of 2016, and expect to add two additional rigs on this acreage in early 2017 with the focus on delineating and developing the acreage. Estimated proved reserves increased 159 percent to 53.8 MMBOE at year-end 2016 from 20.8 MMBOE at year-end 2015. Production increased 40 percent year-over-year to 3.8 MMBOE for 2016. As of December 31, 2016, we had 17 gross and net wells that had been drilled but not completed in our operated Midland Basin program.
Rocky Mountain Region. Operations in our Rocky Mountain region were managed from our office in Billings, Montana until November 2016, at which time we closed that office and began managing our Rocky Mountain regional operations from our corporate office in Denver, Colorado. As of December 31, 2016, we had approximately 124,000 net acres in Divide County, North Dakota, and approximately 156,000 net acres in the Powder River Basin.
In 2016, we incurred $223.9 million of costs to add approximately 17.4 MMBOE of estimated proved reserves in our Rocky Mountain region through our drilling activities. Estimated proved reserves decreased to 36.5 MMBOE at year-end 2016 from 108.1 MMBOE at year-end 2015, primarily due to the divestiture of our Raven/Bear Den assets and other non-core Rocky Mountain region assets. Production decreased nine percent year-over-year to 10.3 MMBOE for 2016. Current activities in our Powder River Basin program are under an acquisition and development funding agreement with a third party in which our costs to drill and complete a specified number of initial wells are being carried by such party. As of December 31, 2016, we had 20 gross (17 net) drilled but not completed wells in our operated Bakken/Three Forks program. Subsequent to December 31, 2016, we announced our plans to sell our remaining Williston Basin assets in Divide County, North Dakota by mid-2017.
7
Reserves
The table below presents summary information with respect to the estimates of our proved reserves for each of the years in the three-year period ended December 31, 2016. We engaged Ryder Scott Company, L.P. (“Ryder Scott”) to audit at least 80 percent of our total calculated proved reserve PV-10 for each year presented. The prices used in the calculation of proved reserve estimates reflect the 12-month average of the first-day-of-the-month prices in accordance with Securities and Exchange Commission (“SEC”) rules, and were $42.75 per Bbl for oil, $2.47 per MMBtu for natural gas, and $19.50 per Bbl for NGLs for the year ended December 31, 2016. We then adjust these prices to reflect appropriate quality and location differentials over the period in estimating our proved reserves.
Reserve estimates are inherently imprecise and estimates for new discoveries and undeveloped locations are more imprecise than reserve estimates for producing oil and gas properties. Accordingly, we expect these estimates to change as new information becomes available. PV-10 shown in the following table is a non-GAAP financial measure, and generally differs from the standardized measure of discounted future net cash flows, the most directly comparable GAAP financial measure, because it does not include the effects of income taxes on future net revenues. Neither PV-10 nor the standardized measure of discounted future net cash flows represents the fair market value of our oil and gas properties. We and others in the oil and gas industry use PV-10 as a measure to compare the relative size and value of proved reserves held without regard to the specific tax characteristics of such entities. Please refer to the Glossary of Oil and Gas Terms section of this report for additional information regarding these measures. The actual quantities and present value of our estimated proved reserves may be more or less than we have estimated. No estimates of our proved reserves have been filed with or included in reports to any federal authority or agency, other than the SEC, since the beginning of the last fiscal year. The following table should be read along with the section entitled Risk Factors – Risks Related to Our Business below.
Our ability to replace our production is critical to us. Please refer to the reserve replacement term in the Glossary of Oil and Gas Terms section of this report for information describing how this metric is calculated.
8
The following table summarizes estimated proved reserves, the standardized measure of discounted future net cash flows, and PV-10 as of December 31, 2016, 2015, and 2014:
As of December 31, | |||||||||||
2016 | 2015 | 2014 | |||||||||
Reserve data: | |||||||||||
Proved developed | |||||||||||
Oil (MMBbl) | 48.5 | 75.6 | 89.3 | ||||||||
Gas (Bcf) | 609.1 | 644.4 | 784.6 | ||||||||
NGLs (MMBbl) | 58.6 | 61.5 | 66.7 | ||||||||
MMBOE (1) | 208.7 | 244.5 | 286.8 | ||||||||
Proved undeveloped | |||||||||||
Oil (MMBbl) | 56.4 | 69.6 | 80.4 | ||||||||
Gas (Bcf) | 502.0 | 619.7 | 682.0 | ||||||||
NGLs (MMBbl) | 47.1 | 53.9 | 66.8 | ||||||||
MMBOE (1) | 187.1 | 226.8 | 260.9 | ||||||||
Total proved (1) | |||||||||||
Oil (MMBbl) | 104.9 | 145.3 | 169.7 | ||||||||
Gas (Bcf) (2) | 1,111.1 | 1,264.0 | 1,466.5 | ||||||||
NGLs (MMBbl) | 105.7 | 115.4 | 133.5 | ||||||||
MMBOE (1)(3) | 395.8 | 471.3 | 547.7 | ||||||||
Proved developed reserves % | 53 | % | 52 | % | 52 | % | |||||
Proved undeveloped reserves % | 47 | % | 48 | % | 48 | % | |||||
Reserve data (in millions): | |||||||||||
Standardized measure of discounted future net cash flows (GAAP) | $ | 1,152.1 | $ | 1,790.5 | $ | 5,698.8 | |||||
PV-10 (non-GAAP): | |||||||||||
Proved developed PV-10 | $ | 1,051.1 | $ | 1,593.0 | $ | 5,253.0 | |||||
Proved undeveloped PV-10 | 101.0 | 197.5 | 2,363.9 | ||||||||
Total proved PV-10 | $ | 1,152.1 | $ | 1,790.5 | $ | 7,616.9 | |||||
Reserve life index (years) | 7.2 | 7.3 | 9.9 | ||||||||
____________________________________________
(1) | Totals may not sum or calculate due to rounding. |
(2) | For the years ended December 31, 2016, and 2015, proved gas reserves contained 43.7 Bcf and 48.1 Bcf of gas, respectively, that we expect to produce and use as field fuel (primarily for compressors). |
(3) | As of December 31, 2016, our outside-operated Eagle Ford shale assets were held for sale. Subsequent to year-end, we entered into a definitive agreement with an expected closing date in the first quarter of 2017. These assets represented approximately 74.0 MMBOE of our estimated proved reserves as of December 31, 2016. Additionally, subsequent to December 31, 2016, we announced our plans to sell our Divide County, North Dakota assets. |
9
The following table reconciles the standardized measure of discounted future net cash flows (GAAP) to the pre-tax PV-10 (Non-GAAP) of total proved reserves. Please see the definitions of standardized measure of discounted future net cash flows and PV-10 in the Glossary of Oil and Gas Terms section of this report.
As of December 31, | |||||||||||
2016 | 2015 | 2014 | |||||||||
(in millions) | |||||||||||
Standardized measure of discounted future net cash flows (GAAP) | $ | 1,152.1 | $ | 1,790.5 | $ | 5,698.8 | |||||
Add: 10 percent annual discount, net of income taxes | 937.1 | 1,307.1 | 3,407.2 | ||||||||
Add: future undiscounted income taxes | — | — | 3,511.4 | ||||||||
Undiscounted future net cash flows | 2,089.2 | 3,097.6 | 12,617.4 | ||||||||
Less: 10 percent annual discount without tax effect | (937.1 | ) | (1,307.1 | ) | (5,000.5 | ) | |||||
PV-10 (non-GAAP) | $ | 1,152.1 | $ | 1,790.5 | $ | 7,616.9 | |||||
Proved Undeveloped Reserves
Proved undeveloped reserves include those reserves that are expected to be recovered from new wells on undrilled acreage or from existing wells where a relatively major expenditure is required for recompletion. Undeveloped reserves may be classified as proved reserves on undrilled acreage directly offsetting development areas that are reasonably certain of production when drilled or where reliable technology provides reasonable certainty of economic producibility. Undrilled locations may be classified as having proved undeveloped reserves only if a development plan has been adopted indicating that they are scheduled to be drilled within five years, unless specific circumstances justify a longer time period. As of December 31, 2016, we did not have any proved undeveloped reserves that had been on our books in excess of five years.
For locations that are more than one location removed from developed producing locations, we utilized reliable geologic and engineering technology to add approximately 44.4 MMBOE of proved undeveloped reserves in the more developed portions of our Eagle Ford shale position, 8.3 MMBOE of proved undeveloped reserves in the more developed portion of our Wolfcamp and Lower Spraberry shale positions in the Midland Basin, and 0.9 MMBOE of proved undeveloped reserves in the more developed portions of our Bakken/Three Forks shale position. We incorporated public and proprietary data from multiple sources to establish geologic continuity of each formation and their producing properties. This included seismic data and interpretations (3-D and micro seismic), open hole log information (both vertically and horizontally collected) and petrophysical analysis of that log data, mud logs, gas sample analysis, measurements of total organic content, thermal maturity, test production, fluid properties, and core data as well as significant statistical performance data yielding predictable and repeatable reserve estimates within certain analogous areas. These locations were limited to only those areas where both established geologic consistency and sufficient statistical performance data could be demonstrated to provide reasonably certain results. In all other areas, we restricted proved undeveloped locations to immediate offsets to producing wells.
10
As of December 31, 2016, we had 187.1 MMBOE of proved undeveloped reserves, which is a decrease of 39.7 MMBOE, or 18 percent, from 226.8 MMBOE at December 31, 2015. The following table provides a reconciliation of our proved undeveloped reserves for the year ended December 31, 2016:
Total (MMBOE) | ||
Total proved undeveloped reserves: | ||
Beginning of year | 226.8 | |
Revisions of previous estimates (1) | (34.3 | ) |
Additions from discoveries, extensions, and infill (2) | 89.4 | |
Sales of reserves | (17.1 | ) |
Purchases of minerals in place (3) | 8.1 | |
Removed for five-year rule (4) | (43.0 | ) |
Conversions to proved developed (5) | (42.8 | ) |
End of year (6) | 187.1 | |
(1) | Revisions of previous estimates relate to a negative price revision of 25.5 MMBOE due to the decline in commodity prices during 2016 and a negative performance revision of 8.8 MMBOE. |
(2) | We added 78.4 MMBOE of infill proved undeveloped reserves and an additional 11.0 MMBOE of proved undeveloped reserves through extensions and discoveries primarily in our Eagle Ford shale program. |
(3) | We acquired 8.1 MMBOE of proved undeveloped reserves primarily in the Midland Basin. As of December 31, 2016, a relatively small portion of our future development capital was allocated to proved reserve locations. The remainder of capital allocated was to delineate our extensive acquired Midland Basin acreage position, still classified as unproven. We expect reserve growth over time as additional acreage is classified as proven and capital is allocated to offset locations. |
(4) | Proved undeveloped reserves were reduced by 43.0 MMBOE due to changes in our development plan, which caused these locations to be reclassified primarily to the probable reserves category due to the five-year rule. These locations were replaced by higher quality proved undeveloped reserves, which are classified as extensions or infills in the table above, and resulted from our testing and delineation programs. |
(5) | Conversions of proved undeveloped reserves to proved developed reserves were primarily in our Eagle Ford shale and Bakken/Three Forks programs. Our 2016 track record was slightly below 20 percent due to fewer conversions of proved undeveloped reserves in our Raven/Bear Den program, which we sold during the fourth quarter of 2016, and in our outside-operated Eagle Ford shale program due to the operator curtailing activity in 2016. Our 2016 development pace and our multi-year historical track record were both in excess of 20 percent. During 2016, we incurred approximately $268 million on projects associated with reserves booked as proved undeveloped reserves at the end of 2015, of which approximately $226 million was spent on proved undeveloped reserves converted to proved developed reserves by December 31, 2016. At December 31, 2016, drilled but not completed wells represented 28.0 MMBOE of total proved undeveloped reserves. We expect to incur approximately $145 million of capital expenditures in completing these wells, and we expect all of these wells to be completed within five years from their initial booking as proved undeveloped reserves. |
(6) | As of December 31, 2016, none of our proved undeveloped reserves were on acreage expected to expire before their targeted completion date. |
As of December 31, 2016, estimated future development costs relating to our proved undeveloped reserves were approximately $181 million, $378 million, and $402 million in 2017, 2018, and 2019, respectively.
Internal Controls Over Proved Reserves Estimates
Our internal controls over the recording of proved reserves are structured to objectively and accurately estimate our reserve quantities and values in compliance with the SEC’s regulations. Our process for managing and monitoring our proved reserves is delegated to our corporate reserves group and is coordinated by our Corporate Business Development Director, subject to the oversight of our management and the Audit Committee of our Board of Directors, as discussed below. Our Corporate Business Development Director has over 25 years of experience in the energy industry, and holds a Bachelor of Science Degree in Petroleum Engineering from Montana Tech of The University of Montana. He is also a member of the
11
Society of Petroleum Engineers. Technical, geological, and engineering reviews of our assets are performed throughout the year by our regional staff. This data, in conjunction with economic data and our ownership information, is used in making a determination of estimated proved reserve quantities. Our regional engineering technical staff do not report directly to our Corporate Business Development Director; they report to either their respective regional technical managers or directly to the regional manager. This design is intended to promote objective and independent analysis within our regions in the proved reserves estimation process.
Third-party Reserves Audit
Ryder Scott performed an independent audit using its own engineering assumptions, but with economic and ownership data we provided. Ryder Scott audits a minimum of 80 percent of our total calculated proved reserve PV-10. In the aggregate, the proved reserve amounts of our audited properties determined by Ryder Scott are required to be within 10 percent of our proved reserve amounts for the total company, as well as for each respective region. Ryder Scott is an independent petroleum engineering consulting firm that has been providing petroleum engineering consulting services throughout the world for over 70 years. The technical person at Ryder Scott primarily responsible for overseeing our reserves audit is an Advising Senior Vice President who received a Bachelor of Science Degree in Chemical Engineering from Purdue University in 1979 and a Master of Science Degree in Chemical Engineering from the University of California, Berkeley in 1981. He is a licensed Professional Engineer in the State of Texas, a member of the Society of Petroleum Engineers, and the Society of Petroleum Evaluation Engineers. The Ryder Scott 2016 report concerning our reserves is included as Exhibit 99.1.
In addition to a third-party audit, our reserves are reviewed by our management with the Audit Committee of our Board of Directors. Management, which includes our President and Chief Executive Officer, Executive Vice President and Chief Financial Officer, and Executive Vice President - Operations, is responsible for reviewing and verifying that the estimate of proved reserves is reasonable, complete, and accurate. The Audit Committee reviews a summary of the final reserves estimate in conjunction with Ryder Scott’s results and also meets with Ryder Scott representatives from time to time to discuss processes and findings.
12
Production
The following table summarizes the volumes and realized prices of oil, gas, and NGLs produced and sold from properties in which we held an interest during the periods indicated. Realized prices presented below exclude the effects of derivative contract settlements. Also presented is a summary of related production costs on a per BOE basis.
For the Years Ended December 31, | |||||||||||
2016 | 2015 | 2014 | |||||||||
Net production (2) | |||||||||||
Oil (MMBbl) | 16.6 | 19.2 | 16.7 | ||||||||
Gas (Bcf) | 146.9 | 173.6 | 152.9 | ||||||||
NGLs (MMBbl) | 14.2 | 16.1 | 13.0 | ||||||||
MMBOE (3) | 55.3 | 64.2 | 55.1 | ||||||||
Eagle Ford net production (1)(2) | |||||||||||
Oil (MMBbl) | 5.4 | 7.6 | 6.9 | ||||||||
Gas (Bcf) | 129.9 | 147.2 | 120.6 | ||||||||
NGLs (MMBbl) | 13.8 | 15.6 | 12.7 | ||||||||
MMBOE (3) | 40.9 | 47.7 | 39.7 | ||||||||
Realized price, before the effect of derivative settlements | |||||||||||
Oil (per Bbl) | $ | 36.85 | $ | 41.49 | $ | 80.97 | |||||
Gas (per Mcf) | $ | 2.30 | $ | 2.57 | $ | 4.58 | |||||
NGLs (per Bbl) | $ | 16.16 | $ | 15.92 | $ | 33.34 | |||||
Per BOE | $ | 21.32 | $ | 23.36 | $ | 45.01 | |||||
Production costs per BOE | |||||||||||
Lease operating expense | $ | 3.51 | $ | 3.73 | $ | 4.28 | |||||
Transportation costs | $ | 6.16 | $ | 6.02 | $ | 6.11 | |||||
Production taxes | $ | 0.94 | $ | 1.13 | $ | 2.13 | |||||
Ad valorem tax expense | $ | 0.21 | $ | 0.39 | $ | 0.46 | |||||
____________________________________________
(1) | In each of the years 2016, 2015, and 2014, total estimated proved reserves attributed to our Eagle Ford shale properties exceeded 15 percent of our total proved reserves expressed on an equivalent basis. |
(2) | As of December 31, 2016, our outside-operated Eagle Ford shale assets were held for sale. Subsequent to year-end, we entered into a definitive agreement with an expected closing date in the first quarter of 2017. These assets represented approximately 9.7 MMBOE of production on an equivalent basis for the year ended December 31, 2016. |
(3) | Amounts may not calculate due to rounding. |
Productive Wells
As of December 31, 2016, we had working interests in 1,027 gross (841 net) productive oil wells and 1,882 gross (704 net) productive gas wells. Productive wells are either wells producing in commercial quantities or wells mechanically capable of commercial production, but are temporarily shut-in. Multiple completions in the same wellbore are counted as one well. As of December 31, 2016, three of these wells had multiple completions. A well is categorized under state reporting regulations as an oil well or a gas well based on the ratio of gas to oil when it first commenced production, but such designation may not be indicative of current production.
13
Drilling and Completion Activity
All of our drilling and completion activities are conducted by independent contractors. We do not own any drilling or completion equipment. The following table summarizes the number of operated and outside-operated wells drilled and completed or recompleted on our properties in 2016, 2015, and 2014, excluding non-consented projects, active injector wells, salt water disposal wells, and any wells in which we own only a royalty interest:
For the Years Ended December 31, | |||||||||||||||||
2016 | 2015 | 2014 | |||||||||||||||
Gross | Net | Gross | Net | Gross | Net | ||||||||||||
Development wells: | |||||||||||||||||
Oil | 100 | 73.0 | 87 | 56.5 | 133 | 66.1 | |||||||||||
Gas | 114 | 56.1 | 272 | 100.8 | 476 | 165.5 | |||||||||||
Non-productive | 2 | 1.1 | — | — | 8 | 5.3 | |||||||||||
216 | 130.2 | 359 | 157.3 | 617 | 236.9 | ||||||||||||
Exploratory wells: | |||||||||||||||||
Oil | 7 | 6.8 | 5 | 3.5 | 5 | 3.0 | |||||||||||
Gas | — | — | 1 | 1.0 | 7 | 4.8 | |||||||||||
Non-productive | — | — | 5 | 4.1 | 4 | 3.3 | |||||||||||
7 | 6.8 | 11 | 8.6 | 16 | 11.1 | ||||||||||||
Total | 223 | 137.0 | 370 | 165.9 | 633 | 248.0 | |||||||||||
A productive well is an exploratory, development, or extension well that is producing or capable of commercial production of oil, gas, and/or NGLs. A non-productive well, frequently referred to within the industry as a dry hole, is an exploratory, development, or extension well that proves to be incapable of producing oil, gas, and/or NGLs in commercial quantities to justify completion, or upon completion, the economic operation of a well.
As defined by the SEC, an exploratory well is a well drilled to find a new field or to find a new reservoir in a field previously found to be productive of oil or gas in another reservoir. A development well is a well drilled within the proved area of an oil or natural gas reservoir to the depth of a stratigraphic horizon known to be productive. The number of wells drilled refers to the number of wells completed at any time during the respective year, regardless of when drilling was initiated. Completion refers to the installation of equipment for production of oil, gas, and/or NGLs, or in the case of a dry well, the reporting to the appropriate authority that the well has been plugged and abandoned.
In addition to the wells drilled and completed in 2016 (included in the table above), see the table below for additional drilling and completion activity in progress as of the date noted below:
As of January 31, 2017 | |||||
Gross | Net | ||||
Drilling: (2) | |||||
Operated | 9 | 8.9 | |||
Outside-operated | 24 | 5.0 | |||
Total | 33 | 13.9 | |||
Drilled but not completed: (1) (2) | |||||
Operated | 81 | 77.7 | |||
Outside-operated | 133 | 24.8 | |||
Total | 214 | 102.5 | |||
(1) | Represents wells that were being completed or waiting on completion as of January 31, 2017. |
14
(2) | Subsequent to December 31, 2016, we executed a definitive sales agreement for our outside-operated Eagle Ford shale assets and announced our plans to sell our remaining Williston Basin assets in Divide County, North Dakota in 2017. As of January 31, 2017, we were participating in the drilling of 22 gross (4 net) outside-operated wells related to these assets. The drilled but not completed wells presented above include 20 gross (17 net) operated wells and 132 gross (24 net) outside-operated wells related to these assets. |
Acreage
The following table sets forth the gross and net acres of developed and undeveloped oil and gas leasehold, fee properties, and mineral servitudes that we held as of December 31, 2016. Undeveloped acreage includes leasehold interests containing proved undeveloped reserves.
Developed Acres (1) | Undeveloped Acres (2)(3) | Total | |||||||||||||||
Gross | Net | Gross | Net | Gross | Net | ||||||||||||
South Texas & Gulf Coast: | |||||||||||||||||
Operated Eagle Ford | 69,777 | 67,960 | 97,175 | 93,525 | 166,952 | 161,485 | |||||||||||
Outside-operated Eagle Ford (5) | 139,383 | 24,893 | 89,900 | 10,929 | 229,283 | 35,822 | |||||||||||
Other | 5,780 | 869 | 7,783 | 5,771 | 13,563 | 6,640 | |||||||||||
Permian: | |||||||||||||||||
RockStar (4) | 32,641 | 26,632 | 48,419 | 35,338 | 81,060 | 61,970 | |||||||||||
Sweetie Peck | 15,020 | 14,409 | 361 | 192 | 15,381 | 14,601 | |||||||||||
Halff East | 9,080 | 5,468 | 1,490 | 516 | 10,570 | 5,984 | |||||||||||
Rocky Mountain: | |||||||||||||||||
North Rockies: | |||||||||||||||||
Divide (6) | 165,510 | 110,625 | 24,283 | 12,943 | 189,793 | 123,568 | |||||||||||
Other (7) | — | — | 244,371 | 172,148 | 244,371 | 172,148 | |||||||||||
South Rockies: | |||||||||||||||||
PRB Cretaceous | 50,429 | 38,625 | 141,116 | 117,637 | 191,545 | 156,262 | |||||||||||
Other (7) | 1,316 | 987 | 103,921 | 85,126 | 105,237 | 86,113 | |||||||||||
Other (8) | 10,499 | 10,499 | 18,891 | 16,232 | 29,390 | 26,731 | |||||||||||
Total | 499,435 | 300,967 | 777,710 | 550,357 | 1,277,145 | 851,324 | |||||||||||
____________________________________________
(1) | Developed acreage is acreage assigned to producing wells for the state approved spacing unit for the producing formation. Our developed acreage that includes multiple formations with different well spacing requirements may be considered undeveloped for certain formations, but has been included only as developed acreage in the presentation above. |
(2) | Undeveloped acreage is acreage on which wells have not been drilled or completed to a point that would permit the production of commercial quantities of oil, gas, and/or NGLs regardless of whether such acreage contains estimated net proved reserves. |
(3) | As of the filing date of this report, approximately 35,900, 20,200, and 7,900 net acres of undeveloped acreage are scheduled to expire by December 31, 2017, 2018, and 2019, respectively, if production is not established or we take no other action to extend the terms of the applicable lease or leases. |
(4) | Refers to our recently acquired Midland Basin acreage in Howard and Martin Counties, Texas. |
(5) | Our outside-operated Eagle Ford shale assets were held for sale as of December 31, 2016. Subsequent to year-end 2016, we entered into a definitive agreement with an expected closing date in the first quarter of 2017. |
(6) | Subsequent to December 31, 2016, we announced our plans to sell our Divide County, North Dakota assets. |
(7) | Includes other non-core acreage located in North Dakota, Montana, Wyoming, and Utah. |
(8) | Includes Louisiana fee and other non-core acreage. |
15
Delivery Commitments
As of December 31, 2016, we had gathering, processing, and transportation throughput commitments with various third parties that have aggregate minimum commitments to deliver 1,461 Bcf of natural gas, 70 MMBbl of crude oil, 13 MMBbl of NGLs, and 25 MMBbl of water through 2034. We are required to make periodic deficiency payments for any shortfalls in delivering the minimum volume commitments. If a shortfall in the minimum volume commitment for natural gas is projected, we have rights under certain contracts to arrange for third party gas to be delivered, and such volume will count toward our minimum volume commitment. Our current production is insufficient to offset these aggregate contractual liabilities, but we expect to fulfill the delivery commitments with production from the future development of our proved undeveloped reserves and from the future development of resources not yet characterized as proved reserves or through arranging for the delivery of third party gas. In the event that no product is delivered in accordance with these agreements, the aggregate undiscounted deficiency payments would have been approximately $970.9 million as of December 31, 2016. Please refer to Note 6 - Commitments and Contingencies in Part II, Item 8 for additional discussion.
Subsequent to December 31, 2016, we entered into a definitive agreement for the sale of our outside-operated Eagle Ford shale assets held for sale at December 31, 2016, and expect to close the transaction in the first quarter of 2017. Upon closing the sale, we would no longer be subject to transportation throughput commitments totaling 514 Bcf of natural gas, 52 MMBbl of oil, and 13 MMBbl of NGLs, or $501.9 million of potential undiscounted deficiency payments. Please refer to the caption Major Customers below, as our operator in our outside-operated Eagle Ford shale program is identified as a major customer under the various marketing agreements we were party to as of December 31, 2016.
As of the filing date of this report, we do not expect any material shortfalls.
Major Customers
We do not believe the loss of any single purchaser of our crude oil, natural gas, and NGLs would materially impact our operating results, as these are products with well-established markets and numerous purchasers are present in our operating regions.
We had the following major customer and sales to entities under common ownership, which accounted for 10 percent or more of our total oil, gas, and NGL production revenue for at least one of the periods presented:
For the Years Ended December 31, | ||||||||
2016 | 2015 | 2014 | ||||||
Major customer (1) | 18 | % | 21 | % | 19 | % | ||
Group #1 of entities under common ownership (2) | 15 | % | 10 | % | 14 | % | ||
Group #2 of entities under common ownership (2) | 8 | % | 11 | % | 9 | % | ||
____________________________________________
(1) | This major customer is our operator in our outside-operated Eagle Ford shale program, which we entered into various marketing agreements with during 2013, whereby we are subject to certain gathering, transportation, and processing throughput commitments for up to 10 years pursuant to each contract. Because we share with our operator the risk of non-performance by its counterparty purchasers, we have included our operator as a major customer in the table above. Several of the operator’s counterparty purchasers under these contracts are also direct purchasers of our production from other areas. As of December 31, 2016, our outside-operated Eagle Ford shale assets were classified as held for sale. |
(2) | In the aggregate, these groups of entities under common ownership represent more than 10 percent of total production revenue for the period(s) shown; however, none of the entities comprising either group individually represented more than 10 percent of our production revenue. |
16
Employees and Office Space
As of February 15, 2017, we had 607 full-time employees. This is a 23 percent decrease from the 786 reported full-time employees as of February 17, 2016. None of our employees are subject to a collective bargaining agreement, and we consider our relations with our employees to be good.
The following table summarizes the approximate square footage of office space leased by us, as of December 31, 2016, including our corporate headquarters and regional offices:
Region | Approximate Square Footage Leased | ||
Corporate | 108,000 | ||
Permian | 54,000 | ||
South Texas & Gulf Coast | 64,000 | ||
Rocky Mountain (1) | — | ||
Mid-Continent (2) | 50,000 | ||
Total | 276,000 | ||
____________________________________________
(1) | During the fourth quarter of 2016, we closed our office in Billings, Montana, and we executed an agreement to terminate the lease effective November 11, 2016. Please refer to Note 14 - Exit and Disposal Costs in Part II, Item 8 for additional discussion. |
(2) | During the third quarter of 2015, we closed our office in Tulsa, Oklahoma. We have subleased this space through 2019 and our lease expires in 2022. Please refer to Note 14 - Exit and Disposal Costs in Part II, Item 8 for additional discussion. |
In addition to the leased office space summarized in the table above, we own a total of 58,500 square feet of office space in our South Texas & Gulf Coast and Rocky Mountain regions.
Title to Properties
Substantially all of our interests are held pursuant to oil and gas leases from third parties. We usually obtain title opinions prior to commencing our initial drilling operations on our properties. We have obtained title opinions or have conducted other title review on substantially all of our producing properties and believe we have satisfactory title to such properties in accordance with standards generally accepted in the oil and gas industry. Most of our producing properties are subject to mortgages securing indebtedness under our Credit Agreement, royalty and overriding royalty interests, liens for current taxes, and other burdens that we believe do not materially interfere with the use of, or affect the value of, such properties. We typically perform only minimal title investigation before acquiring undeveloped leasehold acreage.
Seasonality
Generally, but not always, the demand and price levels for natural gas increase during winter months and decrease during summer months. To lessen the impact of seasonal demand fluctuations, pipelines, utilities, local distribution companies, and industrial users utilize natural gas storage facilities and forward purchase some of their anticipated winter requirements during the summer. However, increased summertime demand for electricity can divert gas that traditionally is placed into storage. This could reduce the typical seasonal price differential. Demand for oil and heating oil is also generally higher in the winter and the summer driving season, although oil prices are impacted more significantly by global supply and demand. Seasonal anomalies, such as mild winters, sometimes lessen these fluctuations. Recently, the impact of seasonality on oil has been somewhat muted by overall supply and demand economics attributable to worldwide production in excess of existing worldwide demand. Certain of our drilling, completion, and other operations are also subject to seasonal limitations. Seasonal weather conditions, government regulations, and lease stipulations adversely affect our ability to conduct drilling activities in some of the areas where we operate. See Risk Factors - Risks Related to Our Business below for additional discussion.
17
Competition
The oil and gas industry is intensely competitive, particularly with respect to acquiring prospective oil and natural gas properties. We believe our acreage positions provide a foundation for development activities that we expect to fuel our future growth. Our competitive position also depends on our geological, geophysical, and engineering expertise, as well as our financial resources. We believe the location of our acreage; our exploration, drilling, operational, and production expertise; available technologies; our financial resources and expertise; and the experience and knowledge of our management and technical teams enable us to compete in our core operating areas. However, we face intense competition from a substantial number of major and independent oil and gas companies, which in some cases have larger technical staffs and greater financial and operational resources than we do. Many of these companies not only engage in the acquisition, exploration, development, and production of oil and natural gas reserves, but also have gathering, processing or refining operations, market refined products, own drilling rigs or other equipment, or generate electricity.
We also compete with other oil and gas companies in securing drilling rigs and other equipment and services necessary for the drilling, completion, and maintenance of wells, as well as for the gathering, transporting, and processing of crude oil, natural gas, and NGLs. Consequently, we may face shortages, delays, or increased costs in securing these services from time to time. The oil and gas industry also faces competition from alternative fuel sources, including other fossil fuels such as coal and imported liquefied natural gas. Competitive conditions may be affected by future energy, climate-related, financial, or other policies, legislation, and regulations.
In addition, we compete for people, including experienced geologists, geophysicists, engineers, and other professionals. Throughout the oil and gas industry, the need to attract and retain talented people has grown at a time when the availability of individuals with these skills is becoming more limited due to the evolving demographics of our industry. We are not insulated from the competition for quality people, and we must compete effectively in order to be successful.
Government Regulations
Our business is extensively controlled by numerous federal, state, and local laws and governmental regulations. These laws and regulations may be changed from time to time in response to economic or political conditions, or other developments, and our regulatory burden may increase in the future. Laws and regulations have the potential to increase our cost of doing business and consequently could affect our profitability. However, we do not believe that we are affected to a materially greater or lesser extent than others in our industry.
Energy Regulations. Many of the states in which we conduct our operations have adopted laws and regulations governing the exploration for and production of oil, gas, and NGLs, including laws and regulations requiring permits for the drilling of wells, imposing bond requirements in order to drill or operate wells, and governing the timing of drilling and location of wells, the method of drilling and casing wells, the surface use and restoration of properties upon which wells are drilled, and the plugging and abandonment of wells. Our operations are also subject to various state conservation laws and regulations, including regulations governing the size of drilling and spacing units or proration units, the number of wells that may be drilled in an area, the spacing of wells, and the unitization or pooling of oil and gas properties. In addition, state conservation laws sometimes establish maximum rates of production from oil and gas wells, generally limit or prohibit the venting or flaring of gas, and may impose certain requirements regarding the ratability or fair apportionment of production from fields and individual wells.
Some of our operations are conducted on federal lands pursuant to oil and gas leases administered by the Bureau of Land Management (“BLM”). These leases contain relatively standardized terms and require compliance with detailed regulations and orders that are subject to change. In addition to permits required from other regulatory agencies, lessees must obtain a permit from the BLM before drilling and must comply with regulations governing, among other things, engineering and construction specifications for production facilities, safety procedures, the valuation of production and payment of royalties, the removal of facilities, and the posting of bonds to ensure that lessee obligations are met. Under certain circumstances, the BLM may suspend or terminate our operations on federal leases.
18
Our sales of natural gas are affected by the availability, terms, and cost of gas pipeline transportation. The Federal Energy Regulatory Commission (“FERC”) has jurisdiction over the transportation and sale for resale of natural gas in interstate commerce. FERC’s current regulatory framework generally provides for a competitive and open access market for sales and transportation of natural gas. However, FERC regulations continue to affect the midstream and transportation segments of the industry, and thus can indirectly affect the sales prices we receive for natural gas production.
Environmental, Health and Safety Matters
General. Our operations are subject to stringent and complex federal, state, tribal, and local laws and regulations governing protection of the environment and worker health and safety as well as the discharge of materials into the environment. These laws and regulations may, among other things:
• | require the acquisition of various permits before drilling commences; |
• | restrict the types, quantities and concentration of various substances that can be released into the environment in connection with oil and natural gas drilling and production and saltwater disposal activities; |
• | limit or prohibit drilling activities on certain lands lying within wilderness, wetlands and other protected areas, including areas containing certain wildlife or threatened and endangered plant and animal species; and |
• | require remedial measures to mitigate pollution from former and ongoing operations, such as closing pits and plugging abandoned wells. |
These laws, rules and regulations may also restrict the rate of oil and natural gas production below the rate that would otherwise be possible. The regulatory burden on the oil and natural gas industry increases the cost of doing business in the industry and consequently affects profitability. Additionally, environmental laws and regulations are revised frequently, and any changes may result in more stringent permitting, waste handling, disposal, and cleanup requirements for the oil and natural gas industry and could have a significant impact on our operating costs.
The following is a summary of some of the existing laws, rules and regulations to which our business is subject.
Waste handling. The Resource Conservation and Recovery Act (“RCRA”) and comparable state statutes regulate the generation, transportation, treatment, storage, disposal, and cleanup of hazardous and non-hazardous wastes. Under the auspices of the United States Environmental Protection Agency (“EPA”), individual states administer some or all of the provisions of RCRA, sometimes in conjunction with their own, more stringent requirements. Drilling fluids, produced water, and most of the other wastes associated with the exploration, development, and production of oil or natural gas are currently regulated under RCRA’s non-hazardous waste provisions. However, it is possible that certain oil and natural gas exploration and production wastes now classified as non-hazardous could be classified as hazardous wastes in the future. Any such change could result in an increase in our costs to manage and dispose of wastes, which could have a material adverse effect on our results of operations and financial position.
Comprehensive Environmental Response, Compensation and Liability Act. The Comprehensive Environmental Response, Compensation and Liability Act (“CERCLA”), also known as the Superfund law, imposes joint and several liability, without regard to fault or legality of conduct, on classes of persons who are considered to be responsible for the release of a hazardous substance into the environment. These persons include the owner or operator of the site where the release occurred, and anyone who disposed or arranged for the disposal of a hazardous substance released at the site. Under CERCLA, such persons may be subject to joint and several liability for the costs of cleaning up the hazardous substances that have been released into the environment, for damages to natural resources and for the costs of certain health studies. In addition, it is not uncommon for third parties to file claims for personal injury and property damage allegedly caused by the hazardous substances released into the environment.
19
We currently own, lease, or operate numerous properties that have been used for oil and natural gas exploration and production for many years. Although we believe we have utilized operating and waste disposal practices that were standard in the industry at the time, hazardous substances, wastes, or hydrocarbons may have been released on or under the properties owned or leased by us, or on or under other locations, including off-site locations, where such substances have been taken for disposal. In addition, some of our properties have been operated by third parties or by previous owners or operators whose treatment and disposal of hazardous substances, wastes, or hydrocarbons were not under our control. These properties and the substances disposed or released on them may be subject to CERCLA, RCRA, and analogous state laws. Under such laws, we could be required to remove previously disposed substances and wastes, pay fines, remediate contaminated property, or perform remedial operations to prevent future contamination.
Water discharges. The federal Water Pollution Control Act (“Clean Water Act”) and analogous state laws impose restrictions and strict controls with respect to the discharge of pollutants, including spills and leaks of oil and other substances, into waters of the United States and states. The discharge of pollutants into regulated waters is prohibited, except in accordance with the terms of a permit issued by the EPA, U.S. Army Corps of Engineers or analogous state agencies. Federal and state regulatory agencies can impose administrative, civil and criminal penalties for non-compliance with discharge permits or other requirements of the Clean Water Act and analogous state laws and regulations.
The Oil Pollution Act of 1990 (“OPA”) addresses prevention, containment and cleanup, and liability associated with oil pollution. OPA applies to vessels, offshore platforms, and onshore facilities. OPA subjects owners of such facilities to strict liability for containment and removal costs, natural resource damages and certain other consequences of oil spills into jurisdictional waters. Any unpermitted release of petroleum or other pollutants from our operations could result in governmental penalties and civil liability.
Air emissions. The federal Clean Air Act (“CAA”) and comparable state laws regulate emissions of various air pollutants through air emissions permitting programs and the imposition of other requirements. In addition, the EPA has developed, and continues to develop, stringent regulations governing emissions of toxic air pollutants at specified sources. Federal and state regulatory agencies can impose administrative, civil and criminal penalties for non-compliance with air permits or other requirements of the CAA and associated state laws and regulations.
Climate change. In December 2009, the EPA determined that emissions of carbon dioxide, methane and other “greenhouse gases” present an endangerment to public health and the environment because emissions of such gases are, according to the EPA, contributing to warming of the earth’s atmosphere and other climatic changes. Based on these findings, the EPA has begun adopting and implementing a comprehensive suite of regulations to restrict emissions of greenhouse gases under existing provisions of the CAA. Legislative and regulatory initiatives related to climate change could have an adverse effect on our operations and the demand for oil and gas. See Risk Factors - Risks Related to Our Business - Legislative and regulatory initiatives related to global warming and climate change could have an adverse effect on our operations and the demand for crude oil, natural gas, and NGLs. In addition to the effects of regulation, the meteorological effects of global climate change could pose additional risks to our operations, including physical damage risks associated with more frequent, more intensive storms and flooding, and could adversely affect the demand for our products.
Endangered species. The federal Endangered Species Act and analogous state laws regulate activities that could have an adverse effect on threatened or endangered species. Some of our operations are conducted in areas where protected species are known to exist. In these areas, we may be obligated to develop and implement plans to avoid potential adverse impacts on protected species, and we may be prohibited from conducting operations in certain locations or during certain seasons, such as breeding and nesting seasons, when our operations could have an adverse effect on these species. It is also possible that a federal or state agency could order a complete halt to activities in certain locations if it is determined that such activities may have a serious adverse effect on a protected species. The presence of a protected species in areas where we perform drilling, completion, and production activities could impair our ability to timely complete well drilling and development and could adversely affect our future production from those areas.
National Environmental Policy Act. Oil and natural gas exploration and production activities on federal lands are subject to the National Environmental Policy Act (“NEPA”). NEPA requires federal agencies, including the Department of Interior, to evaluate major agency actions having the potential to significantly impact the environment. In the course of such evaluations, an agency will prepare an environmental assessment to determine the potential direct, indirect, and cumulative impacts of a proposed project and, if necessary, will prepare a more detailed environmental impact statement that may be made available for public review and comment. All of our current exploration and production activities, as well as proposed
20
exploration and development plans, on federal lands require governmental permits subject to the requirements of NEPA. This process has the potential to delay development of some of our oil and natural gas projects.
OSHA and other laws and regulations. We are subject to the requirements of the federal Occupational Safety and Health Act (“OSHA”) and comparable state statutes. The OSHA hazard communication standard, the EPA community right-to-know regulations under Title III of CERCLA and similar state statutes require that we organize and/or disclose information about hazardous materials used or produced in our operations. Also, pursuant to OSHA, the Occupational Safety and Health Administration has established a variety of standards relating to workplace exposure to hazardous substances and employee health and safety. We believe we are in substantial compliance with the applicable requirements of OSHA and comparable laws.
Hydraulic fracturing. Hydraulic fracturing is an important and common practice used to stimulate production of hydrocarbons from tight formations. We routinely utilize hydraulic fracturing techniques in most of our drilling and completion programs. The process involves the injection of water, sand and chemicals under pressure into the formation to fracture the surrounding rock and stimulate production. The process is typically regulated by state oil and natural gas commissions. However, the EPA has asserted federal regulatory authority over hydraulic fracturing involving diesel additives under the Safe Drinking Water Act’s Underground Injection Control Program. The federal Safe Drinking Water Act protects the quality of the nation’s public drinking water through the adoption of drinking water standards and controlling the injection of waste fluids, including saltwater disposal fluids, into below-ground formations that may adversely affect drinking water sources.
Increased regulation and attention given to the hydraulic fracturing process could lead to greater opposition to oil and gas activities using hydraulic fracturing techniques, which could potentially cause a decrease in the completion of new oil and gas wells, increased compliance costs, and delays, all of which could adversely affect our financial position, results of operations and cash flows. As new laws or regulations that significantly restrict hydraulic fracturing are adopted, such laws could make it more difficult or costly for us to perform fracturing to stimulate production from tight formations. In addition, if hydraulic fracturing becomes regulated at the federal level as a result of federal legislation or regulatory initiatives by the EPA or other federal agencies, our fracturing activities could become subject to additional permitting requirements, which could result in additional permitting delays and potential increases in costs. Restrictions on hydraulic fracturing could also reduce the amount of oil and natural gas that we are ultimately able to produce from our reserves.
We believe it is reasonably likely that the trend in local and state environmental legislation and regulation will continue toward stricter standards, while the trend in federal environmental legislation and regulation faces an uncertain future under the Trump administration. While we believe we are in substantial compliance with existing environmental laws and regulations applicable to our current operations and that our continued compliance with existing requirements will not have a material adverse impact on our financial condition and results of operations, we cannot give any assurance that we will not be adversely affected in the future.
Environmental, Health and Safety Initiatives. We are committed to conducting our business in a manner that protects the environment and the health and safety of our employees, contractors and the public. We set annual goals for our environmental, health and safety program focused on reducing the number of safety related incidents that occur and the number and impact of spills of produced fluids. We also periodically conduct regulatory compliance audits of our operations to ensure our compliance with all regulations and provide appropriate training for our employees. Reducing air emissions as a result of leaks, venting, or flaring of natural gas during operations has become a major focus area for regulatory efforts and for our compliance efforts. While flaring is sometimes necessary, releases of natural gas to the environment and flaring is an economic waste and reducing these volumes is a priority for us. To avoid flaring where possible, we restrict testing periods and make every effort to ensure that our production is connected to gas pipeline infrastructure as quickly as possible after well completions. We have cooperated with other producers in North Dakota in the ongoing development of recommendations to reduce the amount of flaring that is occurring there as a result of area wide infrastructure limitations that are beyond our control. Another focus for our environmental effort has been reduction of water use through recycling of flowback water in south Texas for use as frac fluid. We have incurred in the past, and expect to incur in the future, capital costs related to environmental compliance. Such expenditures are included within our overall capital budget and are not separately itemized.
Cautionary Information about Forward-Looking Statements
This Annual Report on Form 10-K (“Form 10-K”) contains “forward-looking statements” within the meaning of Section 27A of the Securities Act of 1933, as amended (the “Securities Act”) and Section 21E of the Securities Exchange Act of
21
1934, as amended (the “Exchange Act”). All statements, other than statements of historical facts, included in this Form 10-K that address activities, events, or developments with respect to our financial condition, results of operations, or economic performance that we expect, believe, or anticipate will or may occur in the future, or that address plans and objectives of management for future operations, are forward-looking statements. The words “anticipate,” “assume,” “believe,” “budget,” “estimate,” “expect,” “forecast,” “intend,” “plan,” “project,” “will,” and similar expressions are intended to identify forward-looking statements. Forward-looking statements appear throughout this Form 10-K, and include statements about such matters as:
• | the amount and nature of future capital expenditures and the availability of liquidity and capital resources to fund capital expenditures; |
• | our outlook on future oil, gas, and NGL prices, well costs, and service costs; |
• | the drilling of wells and other exploration and development activities and plans, as well as possible or expected acquisitions or divestitures; |
• | the possible divestiture or farm-down of, or joint venture relating to, certain properties; |
• | proved reserve estimates and the estimates of both future net revenues and the present value of future net revenues associated with those reserve estimates; |
• | future oil, gas, and NGL production estimates; |
• | cash flows, anticipated liquidity, and the future repayment of debt; |
• | business strategies and other plans and objectives for future operations, including plans for expansion and growth of operations or to defer capital investment, and our outlook on our future financial condition or results of operations; and |
• | other similar matters such as those discussed in the Management’s Discussion and Analysis of Financial Condition and Results of Operations section in Part II, Item 7 of this Form 10-K. |
Our forward-looking statements are based on assumptions and analyses made by us in light of our experience and our perception of historical trends, current conditions, expected future developments, and other factors that we believe are appropriate under the circumstances. These statements are subject to a number of known and unknown risks and uncertainties, which may cause our actual results and performance to be materially different from any future results or performance expressed or implied by the forward-looking statements. Some of these risks are described in the Risk Factors section of this Form 10-K, and include such factors as:
• | the volatility of oil, gas, and NGL prices, and the effect it may have on our profitability, financial condition, cash flows, access to capital, and ability to grow production volumes and/or proved reserves; |
• | weakness in economic conditions and uncertainty in financial markets; |
• | our ability to replace reserves in order to sustain production; |
• | our ability to raise the substantial amount of capital required to develop and/or replace our reserves; |
• | our ability to compete against competitors that have greater financial, technical, and human resources; |
• | our ability to attract and retain key personnel; |
• | the imprecise estimations of our actual quantities and present value of proved oil, gas, and NGL reserves; |
• | the uncertainty in evaluating recoverable reserves and estimating expected benefits or liabilities; |
• | the possibility that exploration and development drilling may not result in commercially producible reserves; |
22
• | our limited control over activities on outside-operated properties; |
• | our reliance on the skill and expertise of third-party service providers on our operated properties; |
• | the possibility that title to properties in which we claim an interest may be defective; |
• | our planned drilling in existing or emerging resource plays using some of the latest available horizontal drilling and completion techniques is subject to drilling and completion risks and may not meet our expectations for reserves or production; |
• | the uncertainties associated with acquisitions, divestitures, joint ventures, farm-downs, farm-outs and similar transactions with respect to certain assets, including whether such transactions will be consummated or completed in the form or timing and for the value that we anticipate; |
• | the uncertainties associated with enhanced recovery methods; |
• | our commodity derivative contracts may result in financial losses or may limit the prices we receive for oil, gas, and NGL sales; |
• | the inability of one or more of our service providers, customers, or contractual counterparties to meet their obligations; |
• | our ability to deliver required quantities of crude oil, natural gas, natural gas liquids, or water to contractual counterparties; |
• | price declines or unsuccessful exploration efforts resulting in write-downs of our asset carrying values; |
• | the impact that depressed oil, gas, or NGL prices could have on our borrowing capacity under our Credit Agreement; |
• | the possibility our amount of debt may limit our ability to obtain financing for acquisitions, make us more vulnerable to adverse economic conditions, and make it more difficult for us to make payments on our debt; |
• | the possibility that covenants in our Credit Agreement or the indentures governing the Senior Notes and Senior Convertible Notes may limit our discretion in the operation of our business, prohibit us from engaging in beneficial transactions or lead to the accelerated payment of our debt; |
• | operating and environmental risks and hazards that could result in substantial losses; |
• | the impact of seasonal weather conditions and lease stipulations on our ability to conduct drilling activities; |
• | our ability to acquire adequate supplies of water and dispose of or recycle water we use at a reasonable cost in accordance with environmental and other applicable rules; |
• | complex laws and regulations, including environmental regulations, that result in substantial costs and other risks; |
• | the availability and capacity of gathering, transportation, processing, and/or refining facilities; |
• | our ability to sell and/or receive market prices for our oil, gas, and NGLs; |
• | new technologies may cause our current exploration and drilling methods to become obsolete; |
• | the possibility of security threats, including terrorist attacks and cybersecurity breaches, against, or otherwise impacting, our facilities and systems; and |
• | litigation, environmental matters, the potential impact of legislation and government regulations, and the use of management estimates regarding such matters. |
23
We caution you that forward-looking statements are not guarantees of future performance and actual results or performance may be materially different from those expressed or implied in the forward-looking statements. The forward-looking statements in this report speak as of the filing date of this report. Although we may from time to time voluntarily update our prior forward-looking statements, we disclaim any commitment to do so except as required by securities laws.
Available Information
Our internet website address is www.sm-energy.com. We routinely post important information for investors on our website. Within our website’s investor relations section, we make available free of charge our annual report on Form 10-K, quarterly reports on Form 10-Q, current reports on Form 8-K, and amendments to those reports filed with or furnished to the SEC under applicable securities laws. These materials are made available as soon as reasonably practical after we electronically file such materials with or furnish such materials to the SEC. We also make available through our website our Corporate Governance Guidelines, Code of Business Conduct and Conflict of Interest Policy, Financial Code of Ethics, and the Charters of the Audit, Compensation, Executive, and Nominating and Corporate Governance Committees of our Board of Directors. Information on our website is not incorporated by reference into this report and should not be considered part of this document.
Glossary of Oil and Gas Terms
The oil and gas terms defined in this section are used throughout this report. The definitions of the terms developed reserves, exploratory well, field, proved reserves, and undeveloped reserves have been abbreviated from the respective definitions under Rule 4-10(a) of Regulation S-X. The entire definitions of those terms under Rule 4-10(a) of Regulation S-X can be located through the SEC’s website at www.sec.gov.
Ad valorem tax. A tax based on the value of real estate or personal property.
Bbl. One stock tank barrel, or 42 U.S. gallons liquid volume, used in reference to oil, NGLs, water, or other liquid hydrocarbons.
Bcf. Billion cubic feet, used in reference to natural gas.
BOE. Barrels of oil equivalent. Oil equivalents are determined using the ratio of six Mcf of natural gas to one Bbl of oil or NGLs.
BTU. One British thermal unit, the quantity of heat required to raise the temperature of a one-pound mass of water by one degree Fahrenheit.
Developed acreage. The number of acres that are allocated or assignable to productive wells or wells capable of production.
Developed reserves. Reserves that can be expected to be recovered: (i) through existing wells with existing equipment and operating methods or in which the cost of the required equipment is relatively minor compared to the cost of a new well; and (ii) through installed extraction equipment and infrastructure operational at the time of the reserves estimate if the extraction is by means not involving a well.
Development well. A well drilled within the proved area of an oil or natural gas reservoir to the depth of a stratigraphic horizon known to be productive.
Dry hole. A well found to be incapable of producing either oil, natural gas, and/or NGLs in commercial quantities.
Exploratory well. A well drilled to find and produce oil or natural gas in an unproved area, to find a new reservoir in a field previously found to be productive of oil or natural gas in another reservoir, or to extend a known reservoir beyond its known horizon.
Fee properties. The most extensive interest that can be owned in land, including surface and mineral (including oil and natural gas) rights.
24
Field. An area consisting of a single reservoir or multiple reservoirs all grouped on or related to the same individual geological structural feature and/or stratigraphic condition.
Finding and development cost. Expressed in dollars per BOE. Finding and development cost metrics provide information as to the cost of adding proved reserves from various activities, and are widely utilized within the exploration and production industry, as well as by investors and analysts. The information used to calculate these metrics is included in the Supplemental Oil and Gas Information section in Part II, Item 8 of this report. It should be noted that finding and development cost metrics have limitations. For example, exploration efforts related to a particular set of proved reserve additions may extend over several years. As a result, the exploration costs incurred in earlier periods are not included in the amount of exploration costs incurred during the period in which that set of proved reserves is added. In addition, consistent with industry practice, future capital costs to develop proved undeveloped reserves are not included in costs incurred. Since the additional development costs that will need to be incurred in the future before the proved undeveloped reserves are ultimately produced are not included in the amount of costs incurred during the period in which those reserves were added, those development costs in future periods will be reflected in the costs associated with adding a different set of reserves.
Formation. A succession of sedimentary beds that were deposited under the same general geologic conditions.
Frac spread. Hydraulic fracturing requires custom-designed and purpose-built equipment. A “frac spread” is the equipment necessary to carry out a fracturing job.
Gross acre. An acre in which a working interest is owned.
Gross well. A well in which a working interest is owned.
Horizontal wells. Wells that are drilled at angles greater than 70 degrees from vertical.
Lease operating expenses. The expenses incurred in the lifting of crude oil, natural gas, and/or associated liquids from a producing formation to the surface, constituting part of the current operating expenses of a working interest, and also including labor, superintendence, supplies, repairs, maintenance, allocated overhead costs, and other expenses incidental to production, but not including lease acquisition, drilling, or completion costs.
MBbl. One thousand barrels of crude oil, NGLs, water, or other liquid hydrocarbons.
MBOE. One thousand barrels of oil equivalent.
Mcf. One thousand cubic feet, used in reference to natural gas.
MMBbl. One million barrels of oil, NGLs, water, or other liquid hydrocarbons.
MMBOE. One million barrels of oil equivalent.
MMBtu. One million British thermal units.
MMcf. One million cubic feet, used in reference to natural gas.
Net acres or net wells. Sum of our fractional working interests owned in gross acres or gross wells.
NGLs. The combination of ethane, propane, butane, and natural gasolines that when removed from natural gas become liquid under various levels of higher pressure and lower temperature.
NYMEX WTI. New York Mercantile Exchange West Texas Intermediate, a common industry benchmark price for crude oil.
NYMEX Henry Hub. New York Mercantile Exchange Henry Hub, a common industry benchmark price for natural gas.
OPIS. Oil Price Information Service, a common industry benchmark for NGL pricing at Mont Belvieu, Texas.
25
PV-10 (Non-GAAP). PV-10 is a non-GAAP measure. The present value of estimated future revenue to be generated from the production of estimated net proved reserves, net of estimated production and future development costs, based on prices used in estimating the proved reserves and costs in effect as of the date indicated (unless such costs are subject to change pursuant to contractual provisions), without giving effect to non-property related expenses such as general and administrative expenses, debt service, future income tax expenses, or depreciation, depletion, and amortization, discounted using an annual discount rate of 10 percent. While this measure does not include the effect of income taxes as it would in the use of the standardized measure of discounted future net cash flows calculation, it does provide an indicative representation of the relative value of the Company on a comparative basis to other companies and from period to period.
Productive well. A well that is producing crude oil, natural gas, and/or NGLs or that is capable of commercial production of those products.
Proved reserves. Those quantities of oil, gas, and NGLs which, by analysis of geoscience and engineering data, can be estimated with reasonable certainty to be economically producible – from a given date forward, from known reservoirs, and under existing economic conditions, operating methods, and government regulations – prior to the time at which contracts providing the right to operate expire, unless evidence indicates that renewal is reasonably certain, regardless of whether deterministic or probabilistic methods are used for the estimation. Existing economic conditions include prices and costs at which economic producibility from a reservoir is to be determined, and the price to be used is the average price during the 12-month period prior to the ending date of the period covered by the report, determined as an unweighted arithmetic average of the first-day-of-the-month price for each month within such period, unless prices are defined by contractual arrangements, excluding escalations based upon future conditions.
Recompletion. The completion of an existing wellbore in a formation other than that in which the well has previously been completed.
Reserve life index. Expressed in years, represents the estimated net proved reserves at a specified date divided by actual production for the preceding 12-month period.
Reserve replacement. Reserve replacement metrics are used as indicators of a company’s ability to replenish annual production volumes and grow its reserves, and provide information related to how successful a company is at growing its proved reserve base. These are believed to be useful non-GAAP measures that are widely utilized within the exploration and production industry, as well as by investors and analysts. They are easily calculable metrics, and the information used to calculate these metrics is included in the Supplemental Oil and Gas Information section of Part II, Item 8 of this report. It should be noted that reserve replacement metrics have limitations. They are limited because they typically vary widely based on the extent and timing of new discoveries and property acquisitions. Their predictive and comparative value is also limited for the same reasons. In addition, because the metrics do not embed the cost or timing of future production of new reserves, they cannot be used as a measure of value creation.
Reservoir. A porous and permeable underground formation containing a natural accumulation of producible crude oil, natural gas, and/or associated liquid resources that is confined by impermeable rock or water barriers and is individual and separate from other reservoirs.
Resource play. A term used to describe an accumulation of crude oil, natural gas, and/or associated liquid resources known to exist over a large areal expanse, which when compared to a conventional play typically has lower expected geological risk.
Royalty. The amount or fee paid to the owner of mineral rights, expressed as a percentage or fraction of gross income from crude oil, natural gas, and NGLs produced and sold unencumbered by expenses relating to the drilling, completing, and operating of the affected well.
Royalty interest. An interest in an oil and natural gas property entitling the owner to shares of crude oil, natural gas, and NGL production free of costs of exploration, development, and production operations.
Seismic. The sending of energy waves or sound waves into the earth and analyzing the wave reflections to infer the type, size, shape, and depth of subsurface rock formations.
Shale. Fine-grained sedimentary rock composed mostly of consolidated clay or mud. Shale is the most frequently occurring sedimentary rock.
26
Standardized measure of discounted future net cash flows. The discounted future net cash flows relating to proved reserves based on prices used in estimating the reserves, year-end costs, and statutory tax rates, and a 10 percent annual discount rate. The information for this calculation is included in Supplemental Oil and Gas Information located in Part II, Item 8 of this report.
Undeveloped acreage. Lease acreage on which wells have not been drilled or completed to a point that would permit the production of commercial quantities of oil, natural gas, and associated liquids regardless of whether such acreage contains estimated net proved reserves.
Undeveloped reserves. Reserves that are expected to be recovered from new wells on undrilled acreage, or from existing wells where a relatively major expenditure is required for recompletion. The applicable SEC definition of undeveloped reserves provides that undrilled locations can be classified as having undeveloped reserves only if a development plan has been adopted indicating that they are scheduled to be drilled within five years, unless the specific circumstances justify a longer time.
Working interest. The operating interest that gives the owner the right to drill, produce, and conduct operating activities on the property and to share in the production, sales, and costs.
27
ITEM 1A. RISK FACTORS
In addition to the other information included in this report, the following risk factors should be carefully considered when evaluating an investment in us.
Risks Related to Our Business
Crude oil, natural gas, and NGL prices are volatile, and declines in prices adversely affect our profitability, financial condition, cash flows, access to capital, and ability to grow.
Our revenues, operating results, profitability, future rate of growth, and the carrying value of our oil and natural gas properties depend heavily on the prices we receive for crude oil, natural gas, and NGL sales. Crude oil, natural gas, and NGL prices also affect our cash flows available for capital expenditures and other items, our borrowing capacity, and the volume and amount of our crude oil, natural gas, and NGL reserves. For example, the amount of our borrowing base under our Credit Agreement is subject to periodic redeterminations based on crude oil, natural gas, and NGL prices specified by our bank group at the time of redetermination. In addition, we may have crude oil and natural gas property impairments or downward revisions of estimates of proved reserves if prices fall significantly. The decline in commodity prices during 2016 resulted in reductions to our proved reserve volumes and PV-10; reductions in revenues received from the sale of oil, gas, and NGLs, and thus cash flow from operating activities; and impairments of proved and unproved properties. Please refer to the captions Significant Developments in 2016 and Reserves within Part I, Items 1 and 2, Comparison of Financial Results and Trends between 2016 and 2015 and between 2015 and 2014 within Part II, Item 7, and Note 1 – Summary of Significant Accounting Policies, Note 11 – Fair Value Measurements, and Supplemental Oil and Gas Information in Part II, Item 8 for specific discussion.
Historically, the markets for crude oil, natural gas, and NGLs have been volatile, and they are likely to continue to be volatile. Wide fluctuations in crude oil, natural gas, and NGL prices may result from relatively minor changes in the supply of and demand for crude oil, natural gas, and NGLs, market uncertainty, and other factors that are beyond our control, including:
• | global and domestic supplies of crude oil, natural gas, and NGLs, and the productive capacity of the industry as a whole; |
• | the level of consumer demand for crude oil, natural gas, and NGLs; |
• | overall global and domestic economic conditions; |
• | weather conditions; |
• | the availability and capacity of gathering, transportation, processing, and/or refining facilities in regional or localized areas that may affect the realized prices for crude oil, natural gas, or NGLs; |
• | liquefied natural gas deliveries to and from the United States; |
• | the price and level of imports and exports of crude oil, refined petroleum products, and liquefied natural gas; |
• | the price and availability of alternative fuels; |
• | technological advances and regulations affecting energy consumption and conservation; |
• | the ability of the members of the Organization of Petroleum Exporting Countries and other exporting countries to agree to and maintain crude oil price and production controls; |
• | political instability or armed conflict in crude oil or natural gas producing regions; |
• | strengthening and weakening of the United States dollar relative to other currencies; and |
• | governmental regulations and taxes. |
28
These factors and the volatility of crude oil, natural gas, and NGL markets make it extremely difficult to predict future crude oil, natural gas, and NGL price movements with any certainty. Declines in crude oil, natural gas, and NGL prices would reduce our revenues and could also reduce the amount of crude oil, natural gas, and NGLs that we can produce economically, which could have a materially adverse effect on us.
Weakness in economic conditions or uncertainty in financial markets may have material adverse impacts on our business that we cannot predict.
In recent years, the United States and global economies and financial systems have experienced turmoil and upheaval characterized by extreme volatility in prices of equity and debt securities, periods of diminished liquidity and credit availability, inability to access capital markets, the bankruptcy, failure, collapse, or sale of financial institutions, increased levels of unemployment, and an unprecedented level of intervention by the United States federal government and other governments. Although the United States economy appears to have stabilized, the extent and timing of a recovery, and whether it can be sustained, are uncertain. Renewed weakness in the United States or other large economies could materially adversely affect our business and financial condition. For example:
• | crude oil, natural gas, and NGL prices have recently been lower than at various times in the last decade because of increased supply resulting from, among other things, increased drilling in unconventional reservoirs, leading to lower revenues, which could affect our financial condition and results of operations; |
• | the tightening of credit or lack of credit availability to our customers could adversely affect our ability to collect our trade receivables; |
• | the liquidity available under our Credit Agreement could be reduced if any lender is unable to fund its commitment; |
• | our ability to access the capital markets may be restricted at a time when we would like, or need, to raise capital for our business, including for the exploration and/or development of reserves; |
• | our commodity derivative contracts could become economically ineffective if our counterparties are unable to perform their obligations or seek bankruptcy protection; and |
• | variable interest rate spread levels, including for LIBOR and the prime rate, could increase significantly, resulting in higher interest costs for unhedged variable interest rate based borrowings under our Credit Agreement. |
If we are unable to replace reserves, we will not be able to sustain production.
Our future operations depend on our ability to find, develop, or acquire crude oil, natural gas, and NGL reserves that are economically producible. Our properties produce crude oil, natural gas, and NGLs at a declining rate over time. In order to maintain current production rates, we must locate and develop or acquire new crude oil, natural gas, and NGL reserves to replace those being depleted by production. Without successful drilling or acquisition activities, our reserves and production will decline over time. In addition, competition for crude oil and natural gas properties is intense, and many of our competitors have financial, technical, human, and other resources necessary to evaluate and integrate acquisitions that are substantially greater than those available to us.
For our recent acquisitions or any future acquisitions we may complete, a successful impact on our business will depend on a number of factors, many of which are beyond our control. These factors include the purchase price for the acquisition, future crude oil, natural gas, and NGL prices, the ability to reasonably estimate or assess the recoverable volumes of reserves, rates of future production and future net revenues attainable from reserves, future operating and capital costs, results of future exploration, exploitation, and development activities on the acquired properties, and future abandonment and possible future environmental or other liabilities. There are numerous uncertainties inherent in estimating quantities of proved oil and gas reserves, actual future production rates, and associated costs and potential liabilities with respect to prospective acquisition targets. Actual results may vary substantially from those assumed in the estimates. A customary review of subject properties will not necessarily reveal all existing or potential problems.
29
Additionally, significant acquisitions can change the nature of our operations and business depending upon the character of the acquired properties if they have substantially different operating and geological characteristics or are in different geographic locations than our existing properties. To the extent that acquired properties are substantially different than our existing properties, our ability to efficiently realize the expected economic benefits of such transactions may be limited.
Integrating acquired businesses and properties involves a number of special risks. These risks include the possibility that management may be distracted from regular business concerns by the need to integrate operations and systems and that unforeseen difficulties can arise in integrating operations and systems and in retaining and assimilating employees. Any of these or other similar risks could lead to potential adverse short-term or long-term effects on our operating results and may cause us to not be able to realize any or all of the anticipated benefits of the acquisitions.
Substantial capital is required to develop and replace our reserves.
We must make substantial capital expenditures to find, acquire, develop, and produce crude oil, natural gas, and NGL reserves. Future cash flows and the availability of financing are subject to a number of factors, such as the level of production from existing wells, prices received for crude oil, natural gas, and NGL sales, our success in locating and developing and acquiring new reserves, and the orderly functioning of credit and capital markets. If crude oil, natural gas, and NGL prices further decrease or if we encounter operating difficulties that result in our cash flows from operations being less than expected, we may further reduce our planned capital expenditures unless we can raise additional funds through debt or equity financing or the divestment of assets. Debt or equity financing may not always be available to us in sufficient amounts or on acceptable terms, and the proceeds offered to us for potential divestitures may not always be of acceptable value to us. Any downgrades to our credit ratings may make it more difficult or expensive for us to borrow additional funds.
During 2016, our revenues decreased from 2015 due to continued declines in commodity prices and lower production; however, we were able to fund our capital program through cash flows from operations, proceeds from divestitures, and financing activities. If our revenues continue to decrease in the future due to lower crude oil, natural gas, or NGL prices, decreased production, or other reasons, and if we cannot obtain funding through our Credit Agreement, other acceptable debt or equity financing arrangements, or through the sale of assets, our ability to execute development plans, replace our reserves, maintain our acreage, or maintain production levels could be greatly limited.
Downgrades in our credit ratings by various credit rating agencies could impact our access to capital and materially adversely affect our business and financial condition.
In February 2016, Moody’s Investors Service and Standard & Poor’s downgraded our credit ratings (“Debt Rating”). Our Debt Rating levels could have materially adverse consequences on our business and future prospects and could:
• | limit our ability to access debt markets, including for the purpose of refinancing our existing debt; |
• | cause us to refinance or issue debt with less favorable terms and conditions, which debt may restrict, among other things, our ability to make any dividend distributions or repurchase shares; |
• | negatively impact current and prospective customers’ willingness to transact business with us; |
• | impose additional insurance, guarantee and collateral requirements; |
• | limit our access to bank and third-party guarantees, surety bonds and letters of credit; and |
• | cause our suppliers and financial institutions to lower or eliminate the level of credit provided through payment terms or intraday funding when dealing with us, thereby increasing the need for higher levels of cash on hand, which would decrease our ability to repay outstanding indebtedness. |
We cannot provide assurance that any of our current Debt Ratings will remain in effect for any given period of time or that a Debt Rating will not be further lowered or withdrawn entirely by a rating agency if, in its judgment, circumstances warrant.
30
Competition in our industry is intense, and many of our competitors have greater financial, technical, and human resources than we do.
We face intense competition from major oil and gas companies, independent oil and gas exploration and production companies, and institutional and individual investors who seek oil and gas investments throughout the world, as well as the equipment, expertise, labor, and materials required to operate crude oil and natural gas properties. Many of our competitors have financial, technical, and other resources exceeding those available to us, and many crude oil and natural gas properties are sold in a competitive bidding process in which our competitors may be able and willing to pay more for exploratory and development prospects and productive properties, or in which our competitors have technological information or expertise that is not available to us to evaluate and successfully bid for properties. We may not be successful in acquiring and developing profitable properties in the face of this competition. In addition, other companies may have a greater ability to continue drilling activities during periods of low natural gas or oil prices and to absorb the burden of current and future governmental regulations and taxation. In addition, shortages of equipment, labor, or materials as a result of intense competition may result in increased costs or the inability to obtain those resources as needed. Also, we compete for human resources. Our inability to compete effectively with companies in any area of our business could have a material adverse impact on our business activities, financial condition and results of operations.
The loss of key personnel could adversely affect our business.
We depend to a large extent on the efforts and continued employment of our executive management team and other key personnel. The loss of their services could adversely affect our business. Our drilling success and the success of other activities integral to our operations will depend, in part, on our ability to attract and retain experienced geologists, engineers, landmen and other professionals. Competition for many of these professionals can be intense. If we cannot retain our technical personnel or attract additional experienced technical personnel and professionals, our ability to compete could be harmed.
The actual quantities and present value of our proved crude oil, natural gas, and NGL reserves may be less than we have estimated.
This report and certain of our other SEC filings contain estimates of our proved crude oil, natural gas, and NGL reserves and the estimated future net revenues from those reserves. These estimates are based on various assumptions, including assumptions required by the SEC relating to crude oil, natural gas, and NGL prices, drilling and completion costs, gathering and transportation costs, operating expenses, capital expenditures, effects of governmental regulation, taxes, timing of operations, and availability of funds. The process of estimating crude oil, natural gas, and NGL reserves is complex. The process involves significant decisions and assumptions in the evaluation of available geological, geophysical, engineering, and economic data for each reservoir. These estimates depend on many variables, and changes often occur as our knowledge of these variables evolve. Therefore, these estimates are inherently imprecise. In addition, our reserve estimates for properties that do not have a significant production history may be less reliable than estimates for properties with lengthy production histories. A lack of production history may contribute to inaccuracy in our estimates of proved reserves, future production rates, and the timing and/or amount of development expenditures.
Actual future production; prices for crude oil, natural gas, and NGLs; revenues; production taxes; development expenditures; operating expenses; and quantities of producible crude oil, natural gas, and NGL reserves will most likely vary from those estimated. Any significant variance of any nature could materially affect the estimated quantities of and present value related to proved reserves disclosed by us, and the actual quantities and present value may be significantly less than we have previously estimated. In addition, we may adjust estimates of proved reserves to reflect production history, results of exploration, operations and development activity, prevailing crude oil, natural gas, and NGL prices, costs to develop and operate properties, and other factors, many of which are beyond our control. Our properties may also be susceptible to hydrocarbon drainage from production on adjacent properties, which we may not control.
As of December 31, 2016, 47 percent, or 187.1 MMBOE, of our estimated proved reserves were proved undeveloped. In order to develop our proved undeveloped reserves, as of December 31, 2016, we estimate approximately $1.5 billion of capital expenditures would be required. Although we have estimated our proved reserves and the costs associated with these proved reserves in accordance with industry standards, estimated costs may not be accurate, development may not occur as scheduled, and actual results may not occur as estimated.
31
You should not assume that the PV-10 and standardized measure of discounted future net cash flows included in this report represent the current market value of our estimated proved crude oil, natural gas, and NGL reserves. Management has based the estimated discounted future net cash flows from proved reserves on price and cost assumptions required by the SEC, whereas actual future prices and costs may be materially higher or lower. For example, the present value of our proved reserves as of December 31, 2016, was estimated using calculated 12-month average sales prices of $42.75 per Bbl of oil (NYMEX WTI spot price), $2.47 per MMBtu of natural gas (NYMEX Henry Hub spot price), and $19.50 per Bbl of NGL (OPIS spot price). We then adjust these prices to reflect appropriate basis, quality, and location differentials over the period in estimating our proved reserves. During 2016, our monthly average realized crude oil prices before the effect of derivative settlements were as high as $45.94 per Bbl and as low as $21.72 per Bbl, and were as high as $21.81 per Bbl and as low as $11.07 per Bbl for NGLs. For the same period, our monthly average realized natural gas prices, excluding the effect of derivative settlements, were as high as $3.12 per Mcf and as low as $1.51 per Mcf. Many other factors will affect actual future net cash flows, including:
• | amount and timing of actual production; |
• | supply and demand for crude oil, natural gas, and NGLs; |
• | curtailments or increases in consumption by oil purchasers and natural gas pipelines; |
• | changes in government regulations or taxes, including severance and excise taxes; and |
• | escalations or reductions in service provider and equipment costs resulting from changes in supply and demand. |
The timing of production from oil and natural gas properties and of related expenses affects the timing of actual future net cash flows from proved reserves, and thus their actual present value. Our actual future net cash flows could be less than the estimated future net cash flows for purposes of computing PV-10. In addition, the 10 percent discount factor required by the SEC to be used to calculate PV-10 for reporting purposes is not necessarily the most appropriate discount factor given actual interest rates, costs of capital, and other risks to which our business and the oil and natural gas industry in general are subject.
Our property acquisitions may not be worth what we paid due to uncertainties in evaluating recoverable reserves and other expected benefits, as well as potential liabilities.
Successful property acquisitions require an assessment of a number of factors, some of which are beyond our control. These factors include exploration potential, future crude oil, natural gas, and NGL prices, operating costs, title to acquired properties, and potential environmental and other liabilities. These assessments are not precise and their accuracy is inherently uncertain.
In connection with our acquisitions, we typically perform a customary review of the acquired properties that will not necessarily reveal all existing or potential problems. In addition, our review may not allow us to fully assess the potential deficiencies of the properties. We do not inspect every well, and even when we inspect a well, we may not discover structural, subsurface, title, or environmental problems that may exist or arise. We may not be entitled to contractual indemnification for pre-closing liabilities, including environmental liabilities. We often acquire interests in properties on an “as is” basis with limited remedies for breaches of representations and warranties.
Our disposition activities may be subject to factors beyond our control, and in certain cases we may retain unforeseen liabilities for certain matters.
We regularly sell non-core assets in order to increase capital resources available for core assets and to create organizational and operational efficiencies. We also occasionally sell interests in core assets for the purpose of accelerating the development and increasing efficiencies in other core assets. Various factors could materially affect our ability to dispose of such assets, including the approvals of governmental agencies or third parties and the availability of purchasers willing to acquire the assets or terms we deem acceptable. We at times may be required to retain certain liabilities or agree to indemnify buyers for certain matters related to the sold assets. The magnitude of any such retained liabilities or of the indemnification obligations may be difficult to quantify at the time of the transaction and ultimately could be material.
32
We have limited control over the activities on properties we do not operate.
Some of our properties, including a portion of our interests in the Eagle Ford shale in south Texas, are operated by other companies and involve third-party working interest owners. As a result, we have limited ability to influence or control the operation or future development of such properties, including the nature and timing of drilling and operational activities, the operator’s skill and expertise, compliance with environmental, safety and other regulations, the approval of other participants in such properties, the selection and application of suitable technology, or the amount of expenditures that we will be required to fund with respect to such properties. Moreover, we are dependent on the other working interest owners of such projects to fund their contractual share of the expenditures of such properties. These limitations and our dependence on the operator and other working interest owners in these projects could cause us to incur unexpected future costs and materially and adversely affect our financial condition and results of operations.
We rely on third-party service providers to conduct drilling and completion and other related operations on properties we operate.
Where we are the operator of a property, we rely on third-party service providers to perform necessary drilling and completion and other related operations. The ability of third-party service providers to perform such operations will depend on those service providers’ ability to compete for and retain qualified personnel, financial condition, economic performance, and access to capital, which in turn will depend upon the supply and demand for oil, natural gas, and NGLs, prevailing economic conditions and financial, business, and other factors. In addition, continued low commodity prices may cause third-party service providers to consolidate or declare bankruptcy, which could limit our options for engaging such providers. The failure of a third-party service provider to adequately perform operations could delay drilling or completion or reduce production from the property and adversely affect our financial condition and results of operations.
Title to the properties in which we have an interest may be impaired by title defects.
We generally rely on title reports in acquiring oil and gas leasehold interests and obtain title opinions only on significant properties that we drill. There is no assurance that we will not suffer a monetary loss from title defects or title failure. Additionally, undeveloped acreage has greater risk of title defects than developed acreage. Title insurance is not generally available for oil and gas properties. As is customary in our industry, we rely upon the judgment of staff and independent landmen who perform the field work of examining records in the appropriate governmental offices and title abstract facilities before acquiring a specific mineral interest and/or undertaking drilling activities. We, in some cases, perform curative work to correct deficiencies in the marketability of the title to us. Generally, under the terms of the operating agreements affecting our properties, any monetary loss attributable to a loss of title is to be borne by all parties to any such agreement in proportion to their interests in such property. A material title defect can reduce the value of a property or render it worthless, thus adversely affecting our financial condition, results of operations, and operating cash flow if such property is of sufficient value.
Exploration and development drilling may not result in commercially producible reserves.
Crude oil and natural gas drilling, completion, and production activities are subject to numerous risks, including the risk that no commercially producible crude oil, natural gas, or associated liquids will be found. The cost of drilling and completing wells is often uncertain, and crude oil, natural gas, or associated liquids drilling and production activities may be shortened, delayed, or canceled as a result of a variety of factors, many of which are beyond our control. These factors include:
• | unexpected adverse drilling or completion conditions; |
• | title problems; |
• | disputes with owners or holders of surface interests on or near areas where we operate; |
• | pressure or geologic irregularities in formations; |
• | engineering and construction delays; |
• | equipment failures or accidents; |
33
• | hurricanes, tornadoes, flooding, or other adverse weather conditions; |
• | governmental permitting delays; |
• | compliance with environmental and other governmental requirements; and |
• | shortages or delays in the availability of or increases in the cost of drilling rigs and crews, fracture stimulation crews and equipment, pipe, chemicals, water, sand, and other supplies. |
The prevailing prices for crude oil, natural gas, and NGLs affect the cost of and the demand for drilling rigs, completion and production equipment, and other related services. However, changes in costs may not occur simultaneously with corresponding changes in commodity prices. The availability of drilling rigs can vary significantly from region to region at any particular time. Although land drilling rigs can be moved from one region to another in response to changes in levels of demand, an undersupply of rigs in any region may result in drilling delays and higher drilling costs for the available rigs in that region.
Another significant risk inherent in our drilling plans is the need to obtain drilling permits from state, local, and other governmental authorities. Delays in obtaining regulatory approvals and drilling permits, including delays that jeopardize our ability to realize the potential benefits from leased properties within the applicable lease periods, the failure to obtain a drilling permit for a well, or the receipt of a permit with unreasonable conditions or costs could have a materially adverse effect on our ability to explore or develop our properties.
The wells we drill may not be productive, and we may not recover all or any portion of our investment in such wells. The seismic data and other technologies we use do not allow us to know conclusively prior to drilling a well if crude oil, natural gas, or NGLs are present, or whether they can be produced economically. The cost of drilling, completing, and operating a well is often uncertain, and cost factors can adversely affect the economics of a project. Drilling activities can result in dry holes or wells that are productive but do not produce sufficient net revenues after operating and other costs to cover drilling and completion costs. Even if sufficient amounts of crude oil, natural gas, or NGLs exist, we may damage a potentially productive hydrocarbon-bearing formation or experience mechanical difficulties while drilling or completing a well, which could result in reduced or no production from the well, significant expenditure to repair the well, and/or the loss and abandonment of the well.
Results in our newer resource plays, including those plays where we have recently acquired acreage, may be more uncertain than results in resource plays that are more developed and have longer established production histories. We and the industry generally have less information with respect to the ultimate recoverability of reserves and the production decline rates in newer resource plays than other areas with longer histories of development and production. Drilling and completion techniques that have proven to be successful in other resource plays are being used in the early development of new plays; however, we can provide no assurance of the ultimate success of these drilling and completion techniques.
In addition, a significant part of our strategy involves increasing our inventory of drilling locations. Such multi-year drilling inventories can be more susceptible to long-term uncertainties that could materially alter the occurrence or timing of actual drilling. Because of these uncertainties, we do not know if the potential drilling locations we have identified will ever be drilled, although we have the present intent to do so for locations booked as proved undeveloped locations, or if we will be able to produce crude oil, natural gas, or NGLs from these potential drilling locations.
Our future drilling activities may not be successful. Our overall drilling success rate or our drilling success rate within a particular area may decline. In addition, we may not be able to obtain any options or lease rights in potential drilling locations that we identify. Unless production is established within the spacing units covering undeveloped acres on which our drilling locations are identified, the leases for such acreage will expire and we will lose our right to develop the related properties. Our total net acreage expiring in the next three years represents approximately 12 percent of our total net undeveloped acreage at December 31, 2016. Although we have identified numerous potential drilling locations, we may not be able to economically drill for and produce crude oil, natural gas, or NGLs from all of them, and our actual drilling activities may materially differ from those presently identified, which could adversely affect our financial condition, results of operations and operating cash flow.
34
Part of our strategy involves drilling in existing or emerging resource plays using some of the latest available horizontal drilling and completion techniques. The results of our planned exploratory and delineation drilling in these plays are subject to drilling and completion technique risks, and results may not meet our expectations for reserves or production. As a result, we may incur material write-downs, and the value of our undeveloped acreage could decline if drilling results are unsuccessful.
Many of our operations involve utilizing the latest drilling and completion techniques as developed by us and our service providers in order to maximize production and ultimate recoveries and therefore generate the highest possible returns. Risks we face while drilling include, but are not limited to, landing our well bore outside the desired drilling zone, deviating from the desired drilling zone while drilling horizontally through the formation, the inability to run our casing the entire length of the well bore, and the inability to run tools and recover equipment consistently through the horizontal well bore. Risks we face while completing our wells include, but are not limited to, the inability to fracture stimulate the planned number of stages, the inability to run tools and other equipment the entire length of the well bore during completion operations, the inability to recover such tools and other equipment, and the inability to successfully clean out the well bore after completion of the final fracture stimulation.
Ultimately, the success of these drilling and completion techniques can only be evaluated over time as more wells are drilled and production profiles are established over a sufficiently long time period. If our drilling results are less than anticipated or we are unable to execute our drilling program because of capital constraints, lease expirations, limited access to gathering systems and takeaway capacity, and/or prices for crude oil, natural gas, and NGLs decline, then the return on our investment for a particular project may not be as attractive as we anticipated and we could incur material write-downs of oil and gas properties and the value of our undeveloped acreage could decline in the future.
Many of our properties are in areas that may have been partially depleted or drained by offset wells and certain of our wells may be adversely affected by actions other operators may take when drilling, completing or operating wells that they own.
Many of our properties are in areas that may have already been partially depleted or drained by earlier offset drilling. The owners of leasehold interests adjoining any of our properties could take actions, such as drilling and completing additional wells, which could adversely affect our operations. When a new well is completed and produced, the pressure differential in the vicinity of the well causes the migration of reservoir fluids toward the new wellbore (and potentially away from existing wellbores). As a result, the drilling and production of these potential locations could cause a depletion of our proved reserves and may inhibit our ability to further develop our proved reserves. In addition, completion operations and other activities conducted on adjacent or nearby wells could cause production from our wells to be shut in for indefinite periods of time, could result in increased lease operating expenses and could adversely affect the production and reserves from our wells after they re-commence production. We have no control over the operations or activities of offsetting operators.
Our commodity derivative contract activities may result in financial losses or may limit the prices we receive for crude oil, natural gas, and NGL sales.
To mitigate a portion of the exposure to potentially adverse market changes in crude oil, natural gas, and NGL prices and the associated impact on cash flows, we have entered into various derivative contracts. Our derivative contracts in place include swap arrangements for natural gas and NGLs, and both swap and collar arrangements for crude oil. As of December 31, 2016, we were in a net accrued liability position of $91.7 million with respect to our crude oil, natural gas, and NGL derivative activities. These activities may expose us to the risk of financial loss in certain circumstances, including instances in which:
• | our production is less than expected; |
• | one or more counterparties to our commodity derivative contracts default on their contractual obligations; or |
• | there is a widening of price differentials between delivery points for our production and the delivery point assumed in the commodity derivative contract arrangement. |
The risk of one or more counterparties defaulting on their obligations is heightened by depressed crude oil, natural gas, and NGL prices. These circumstances may adversely affect the ability of our counterparties to meet their obligations to us pursuant to derivative transactions, which could reduce our revenues and cash flows from derivative settlements. As a result, our financial condition, results of operations, and cash flows could be materially affected in an adverse way if our counterparties default on their contractual obligations under our commodity derivative contracts.
35
In addition, commodity derivative contracts may limit the prices we receive for our crude oil, natural gas and NGL sales if crude oil, natural gas, or NGL prices rise substantially over the price established by the commodity derivative contract.
The inability of customers or co-owners of assets to meet their obligations may adversely affect our financial results.
Substantially all of our accounts receivable result from crude oil, natural gas, and NGL sales or joint interest billings to co-owners of oil and gas properties we operate. This concentration of customers and joint interest owners may impact our overall credit risk because these entities may be similarly affected by various economic and other conditions, including declines in crude oil, natural gas, and NGL prices. The loss of one or more of these customers could reduce competition for our products and negatively impact the prices of commodities we sell. We do not believe the loss of any single purchaser would materially impact our operating results, as we have numerous options for purchasers in each of our operating regions for our crude oil, natural gas, and NGL production. Please refer to Note 1 - Summary of Significant Accounting Policies, under the heading Concentration of Credit Risk and Major Customers in Part II, Item 8 of this report for further discussion of our concentration of credit risk and major customers. Additionally, the inability of our co-owners to pay joint interest billings could negatively impact our cash flow and financial ability to drill and complete current and future wells.
We have entered into firm transportation contracts that require us to pay fixed sums of money to our counterparties regardless of quantities actually shipped, processed, or gathered. If we are unable to deliver the necessary quantities of natural gas, crude oil, natural gas liquids, or water to our counterparties, our results of operations, financial position, and liquidity could be adversely affected.
As of December 31, 2016, we were contractually committed to deliver 1,461 Bcf of natural gas, 70 MMBbl of crude oil, 13 MMBbl of natural gas liquids, and 25 MMBbl of water. These contracts expire at various dates through 2034. We may enter into additional firm transportation agreements as the development of our resource plays expands. At the current time, we do not have enough proved developed reserves to offset these contractual liabilities, but we expect to develop reserves that will meet or exceed the commitments and therefore do not expect any material shortfalls. In the event we encounter delays in drilling and completing our wells or otherwise due to construction, interruptions of operations, or delays in connecting new volumes to gathering systems or pipelines for an extended period of time, or if we further limit our capital expenditures due to further commodity price declines, the requirements to pay for quantities not delivered could have a material impact on our results of operations, financial position, and liquidity.
Future crude oil, natural gas, and NGL price declines or unsuccessful exploration efforts may result in write-downs of our asset carrying values.
We follow the successful efforts method of accounting for our crude oil and natural gas properties. All property acquisition costs and costs of exploratory and development wells are capitalized when incurred, pending the determination of whether proved reserves have been discovered. If commercial quantities of hydrocarbons are not discovered with an exploratory well, the costs of drilling the well are expensed.
The capitalized costs of our oil and gas properties, on a depletion pool basis, cannot exceed the estimated undiscounted future net cash flows of that depletion pool. If net capitalized costs exceed undiscounted future net cash flows, we generally must write down the costs of each depletion pool to the estimated discounted future net cash flows of that depletion pool. Unproved properties are evaluated at the lower of cost or fair market value. We incurred impairment of proved properties expense and impairment of unproved properties expense totaling $354.6 million and $80.4 million, respectively, during 2016, $468.7 million and $78.6 million, respectively, during 2015, and $84.5 million and $75.6 million, respectively, during 2014. We also incurred impairment of other property, plant, and equipment expense totaling $49.4 million during 2015. Commodity prices have declined in recent years starting in late 2014. If the prices of crude oil, natural gas, or NGLs continue to remain depressed or decline further, or we have unsuccessful exploration efforts, it could cause additional proved and/or unproved property impairments in the future.
We review the carrying values of our properties for indicators of impairment on a quarterly basis using the prices in effect as of the end of each quarter. Once incurred, a write-down of oil and natural gas properties held for use cannot be reversed at a later date, even if crude oil, natural gas, or NGL prices increase.
36
Lower crude oil, natural gas, or NGL prices could limit our ability to borrow under our Credit Agreement.
Our Credit Agreement has a current commitment amount of $1.17 billion, subject to a borrowing base that the lenders redetermine semi-annually based on the bank group’s assessment of the value of our proved reserves, which in turn is impacted by crude oil, natural gas, and NGL prices. The borrowing base under our Credit Agreement is $1.17 billion, down from $2.0 billion at December 31, 2015. This reduction was primarily a result of the sale of our Raven/Bear Den assets in the fourth quarter of 2016, non-core asset sales in the third quarter of 2016, as well as adjustments consistent with lower commodity prices. We expect a further reduction to our borrowing base during the next semi-annual redetermination scheduled for April 1, 2017, as a result of the anticipated sale of our outside-operated Eagle Ford shale assets, as well as the decrease in our proved reserves at December 31, 2016. Divestitures of additional properties, incurrence of additional debt, or a further decline in commodity prices could limit our borrowing base and reduce the amount we can borrow under our Credit Agreement.
The amount of our debt may limit our ability to obtain financing for acquisitions, make us more vulnerable to adverse economic conditions, and make it more difficult for us to make payments on our debt.
As of December 31, 2016, we had $172.5 million in aggregate principal amount of long-term senior unsecured convertible debt outstanding relating to our 1.50% Senior Convertible Notes due July 1, 2021 (“Senior Convertible Notes”) that we issued on August 12, 2016. As of December 31, 2016, we had $347.0 million of long-term senior unsecured debt outstanding relating to our 6.50% Senior Notes due 2021 (“2021 Notes”) that we issued on November 8, 2011; $561.8 million of long-term senior unsecured debt outstanding relating to our 6.125% Senior Notes due 2022 (“2022 Notes”) that we issued on November 17, 2014; $395.0 million of long-term senior unsecured debt outstanding relating to our 6.50% Senior Notes due 2023 (“2023 Notes”) that we issued on June 29, 2012; $500.0 million of long-term senior unsecured debt outstanding relating to our 5.0% Senior Notes due 2024 (“2024 Notes”) that we issued on May 20, 2013; $500.0 million of long-term senior unsecured debt outstanding relating to our 5.625% Senior Notes due 2025 (“2025 Notes”) that we issued on May 21, 2015; and $500.0 million of long-term senior unsecured debt outstanding relating to our 6.75% Senior Notes due 2026 (“2026 Notes”) that we issued on September 12, 2016 (collectively, the 2021 Notes, 2022 Notes, 2023 Notes, 2024 Notes, 2025 Notes, and 2026 Notes are referred to as our “Senior Notes”); and no outstanding borrowings under our secured credit facility. We had one outstanding letter of credit in the aggregate amount of $200,000 (which reduces the amount available for borrowing under the facility on a dollar-for-dollar basis), resulting in $1.2 billion of available borrowing capacity under our Credit Agreement, assuming the borrowing conditions will be met. Our long-term debt represented 54 percent of our total book capitalization as of December 31, 2016.
Our indebtedness could have important consequences for our operations, including:
• | making it more difficult for us to obtain additional financing in the future for our operations and potential acquisitions, working capital requirements, capital expenditures, debt service, or other general corporate requirements; |
• | requiring us to dedicate a substantial portion of our cash flows from operations to the repayment of our debt and the service of interest costs associated with our debt, rather than to productive investments; |
• | limiting our operating flexibility due to financial and other restrictive covenants, including restrictions on incurring additional debt, making acquisitions, and paying dividends; |
• | placing us at a competitive disadvantage compared to our competitors with less debt; and |
• | making us more vulnerable in the event of adverse economic or industry conditions or a downturn in our business. |
Our ability to make payments on our debt, refinance our debt, and fund planned capital expenditures will depend on our ability to generate cash in the future. This, to a certain extent, is subject to general economic, financial, competitive, legislative, regulatory, and other factors that are beyond our control. If our business does not generate sufficient cash flow from operations or future sufficient borrowings are not available to us under our Credit Agreement or from other sources, we might not be able to service our debt or fund our other liquidity needs. If we are unable to service our debt, due to inadequate liquidity or otherwise, we may have to delay or cancel acquisitions, defer capital expenditures, sell equity securities, divest assets, and/or restructure or refinance our debt. We might not be able to sell our equity, sell our assets, or restructure or refinance our debt on a timely basis or on satisfactory terms or at all. In addition, the terms of our existing or future debt agreements, including our Credit Agreement and any future credit agreements, may prohibit us from pursuing any of these
37
alternatives. Further, changes in the credit ratings of our debt may negatively affect the cost, terms, conditions, and availability of future financing.
Our debt agreements, including the Credit Agreement and the indentures governing our Senior Convertible Notes and our Senior Notes, permit us to incur additional debt in the future, subject to compliance with restrictive covenants under those agreements. In addition, entities we may acquire in the future could have significant amounts of debt outstanding that we could be required to assume, and in some cases accelerate repayment thereof, in connection with the acquisition, or we may incur our own significant indebtedness to consummate an acquisition.
As discussed above, our Credit Agreement is subject to periodic borrowing base redeterminations. We could be forced to repay a portion of our bank borrowings in the event of a downward redetermination of our borrowing base, and we may not have sufficient funds to make such repayment at that time. If we do not have sufficient funds and are otherwise unable to negotiate renewals of our borrowing base or arrange new financing, we may be forced to sell significant assets.
The agreements governing our debt contain various covenants that limit our discretion in the operation of our business, could prohibit us from engaging in transactions we believe to be beneficial, and could lead to the accelerated repayment of our debt.
Our debt agreements contain restrictive covenants that limit our ability to engage in activities that may be in our long-term best interests. Our ability to borrow under our Credit Agreement is subject to compliance with certain financial covenants. Financial covenants under the Credit Agreement require, as of the last day of each of the Company’s fiscal quarters, our (a) ratio of senior secured debt to 12-month trailing adjusted EBITDAX to be not more than 2.75 to 1.0; (b) adjusted current ratio to be not less than 1.0 to 1.0; and (c) ratio of 12-month trailing adjusted EBITDAX to interest expense to be not less than 2.0 to 1.0. Our Credit Agreement also requires us to comply with certain financial covenants, including requirements that we maintain certain levels of stockholders’ equity and limit our annual cash dividends to no more than $50.0 million. These restrictions on our ability to operate our business could seriously harm our business by, among other things, limiting our ability to take advantage of financings, mergers and acquisitions, and other corporate opportunities.
The respective indentures governing the Senior Notes and Senior Convertible Notes also contain covenants that, among other things, limit our ability and the ability of our subsidiaries to:
• | incur additional debt; |
• | make certain dividends or pay dividends or distributions on our capital stock or purchase, redeem, or retire capital stock; |
• | sell assets, including capital stock of our subsidiaries; |
• | restrict dividends or other payments of our subsidiaries; |
• | create liens that secure debt; |
• | enter into transactions with affiliates; and |
• | merge or consolidate with another company. |
Our failure to comply with these covenants could result in an event of default that, if not cured or waived, could result in the acceleration of all or a portion of our indebtedness. We do not have sufficient working capital to satisfy our debt obligations in the event of an acceleration of all or a significant portion of our outstanding indebtedness.
38
We are subject to operating and environmental risks and hazards that could result in substantial losses or liabilities that may not be fully insured.
Oil and gas operations are subject to many risks, including human error and accidents, that could cause personal injury, death, property damage, well blowouts, craterings, explosions, uncontrollable flows of crude oil, natural gas and associated liquids, or well fluids, releases or spills of completion fluids, spills or releases from facilities and equipment used to deliver or store these materials, spills or releases of brine or other produced or flowback water, subsurface conditions that prevent us from stimulating the planned number of completion stages, accessing the entirety of the wellbore with our tools during completion, or removing materials from the wellbore to allow production to begin, fires, adverse weather such as hurricanes or tornadoes, freezing conditions, floods, droughts, formations with abnormal pressures, pipeline ruptures or spills, pollution, releases of toxic gas such as hydrogen sulfide, and other environmental risks and hazards. If any of these types of events occurs, we could sustain substantial losses.
Furthermore, if we experience any of the problems with well stimulation and completion activities referenced above, our ability to explore for and produce crude oil, natural gas, or NGLs may be adversely affected. We could incur substantial losses or otherwise fail to realize reserves in particular formations as a result of the need to shutdown, abandon, or relocate drilling operations, the need to modify drill sites to lessen the risk of spills or releases, the need to investigate and/or remediate any spills, releases or ground water contamination that might have occurred, and the need to suspend our operations.
There is inherent risk of incurring significant environmental costs and liabilities in our operations due to our current and past generation, handling and disposal of materials, including solid and hazardous wastes and petroleum hydrocarbons. We may incur joint and several, strict liability under applicable United States federal and state environmental laws in connection with releases of petroleum hydrocarbons and other hazardous substances at, on, under or from our leased or owned properties, some of which have been used for natural gas and oil exploration and production activities for a number of years, often by third parties not under our control. For our outside-operated properties, we are dependent on the operator for operational and regulatory compliance, and could be subject to liabilities in the event of non-compliance. These properties and the wastes disposed thereon or therefrom could be subject to stringent and costly investigatory or remedial requirements under applicable laws, some of which are strict liability laws without regard to fault or the legality of the original conduct, including the CERCLA or the Superfund law, the RCRA, the Clean Water Act, the CAA, the OPA, and analogous state laws. Under any implementing regulations, we could be required to remove or remediate previously disposed wastes (including wastes disposed of or released by prior owners or operators) or property contamination (including groundwater contamination), to perform natural resource mitigation or restoration practices, or to perform remedial plugging or closure operations to prevent future contamination. In addition, it is not uncommon for neighboring landowners and other third parties to file claims for personal injury or property damage, including induced seismicity damage, allegedly caused by the release of petroleum hydrocarbons or other hazardous substances into the environment. As a result, we may incur substantial liabilities to third parties or governmental entities, which could reduce or eliminate funds available for exploration, development, or acquisitions, or cause us to incur losses.
We maintain insurance against some, but not all, of these potential risks and losses. We have significant but limited coverage for sudden environmental damage. We do not believe that insurance coverage for the full potential liability that could be caused by environmental damage that occurs gradually over time is appropriate for us at this time given the nature of our operations and the nature and cost of such coverage. Further, we may elect not to obtain insurance coverage under circumstances where we believe that the cost of available insurance is excessive relative to the risks to which we are subject. Accordingly, we may be subject to liability or may lose substantial assets in the event of environmental or other damages. If a significant accident or other event occurs and is not fully covered by insurance, we could suffer a material loss.
Our operations are subject to complex laws and regulations, including environmental regulations that result in substantial costs and other risks.
Federal, state, tribal, and local authorities extensively regulate the oil and natural gas industry. Legislation and regulations affecting the industry are under constant review for amendment or expansion, raising the possibility of changes that may become more stringent and, as a result, may affect, among other things, the pricing or marketing of crude oil, natural gas, and NGL production. Noncompliance with statutes and regulations and more vigorous enforcement of such statutes and regulations by regulatory agencies may lead to substantial administrative, civil, and criminal penalties, including the assessment of natural resource damages, the imposition of significant investigatory and remedial obligations and may also result in the suspension or termination of our operations. The overall regulatory burden on the industry increases the cost to place, design, drill, complete, install, operate, and abandon wells and related facilities and, in turn, decreases profitability.
39
Governmental authorities regulate various aspects of drilling for and the production of crude oil, natural gas, and NGLs, including the permit and bonding requirements of drilling wells, the spacing of wells, the unitization or pooling of interests in crude oil and natural gas properties, rights-of-way and easements, environmental matters, occupational health and safety, the sharing of markets, production limitations, plugging, abandonment, and restoration standards, and oil and gas operations. Public interest in environmental protection has increased in recent years, and environmental organizations have opposed, with some success, certain projects. Under certain circumstances, regulatory authorities may deny a proposed permit or right-of-way grant or impose conditions of approval to mitigate potential environmental impacts, which could, in either case, negatively affect our ability to explore or develop certain properties. Federal authorities also may require any of our ongoing or planned operations on federal leases to be delayed, suspended, or terminated. Any such delay, suspension, or termination could have a materially adverse effect on our operations.
Our operations are also subject to complex and constantly changing environmental laws and regulations adopted by federal, state, tribal and local governmental authorities in jurisdictions where we are engaged in exploration or production operations. New laws or regulations, or changes to current requirements, including the designation of previously unprotected wildlife or plant species as threatened or endangered in areas we operate in, could result in material costs or claims with respect to properties we own or have owned. We will continue to be subject to uncertainty associated with new regulatory interpretations and inconsistent interpretations between state and federal agencies. Under existing or future environmental laws and regulations, we could incur significant liability, including joint and several, strict liability under federal, state, and tribal environmental laws for noise emissions and for discharges of crude oil, natural gas, and associated liquids or other pollutants into the air, soil, surface water, or groundwater. We could be required to spend substantial amounts on investigations, litigation, and remediation for these emissions and discharges and other compliance issues. Any unpermitted release of petroleum or other pollutants from our operations could result not only in cleanup costs, but also natural resources, real or personal property and other damages and civil and criminal liabilities. The listing of additional wildlife or plant species as federally endangered or threatened could result in limitations on exploration and production activities in certain locations. Existing environmental laws or regulations, as currently interpreted or enforced, or as they may be interpreted, enforced, or altered in the future, may have a materially adverse effect on us.
Seasonal weather conditions and lease stipulations adversely affect our ability to conduct drilling activities in some of the areas where we operate.
Operations in certain of our regions, such as our Rocky Mountain and Permian regions, are adversely affected by seasonal weather conditions and lease stipulations designed to protect various wildlife or plant species. In certain areas on federal lands, drilling and other oil and natural gas activities can only be conducted during limited times of the year. This limits our ability to operate in those areas and can intensify competition during those times for drilling rigs, oil field equipment, services, supplies and qualified personnel, which may lead to periodic shortages. Wildlife seasonal restrictions may limit access to federal leases or across federal lands. Possible restrictions may include seasonal restrictions in greater sage-grouse habitat during breeding and nesting seasons, within a certain distance of active raptor nests during fledging, and in big game winter or parturition ranges during winter or calving seasons. These constraints and the resulting shortages or high costs could delay our operations and materially increase our operating and capital costs.
Proposed federal and state legislative and regulatory initiatives relating to hydraulic fracturing could result in increased costs and additional operating restrictions or delays.
Hydraulic fracturing is a common practice in the oil and gas industry used to stimulate the production of oil, natural gas, and NGLs from dense subsurface rock formations. We routinely apply hydraulic fracturing techniques to many of our oil and natural gas properties, including our unconventional resource plays in the Wolfcamp and Spraberry shale intervals in the Midland Basin, the Eagle Ford shale of south Texas, and the Bakken/Three Forks formations in North Dakota. Hydraulic fracturing involves injecting water, sand and certain chemicals under pressure to fracture the hydrocarbon-bearing rock formation to allow the flow of hydrocarbons into the wellbore. The process is typically regulated by state oil and natural gas commissions. However, the EPA and other federal agencies have asserted federal regulatory authority over certain aspects of hydraulic fracturing activities, as outlined below.
The EPA has authority to regulate underground injections that contain diesel in the fluid system under the SDWA. The EPA has published an interpretive memorandum and permitting guidance related to regulation of fracturing fluids using this regulatory authority. In June 2016, the EPA issued regulations under the Federal Clean Water Act establishing federal pre-treatment standards for wastewater generated during the hydraulic fracturing process in the Federal Register. If adopted, the new pre-treatment rules will require shale gas operations to pre-treat wastewater before transferring it to publicly-owned
40
treatment facilities. Under a recent settlement, the EPA will decide by March 2019 whether to initiate rulemaking governing the disposal of wastewater from oil and gas development. If the EPA implements further regulations of hydraulic fracturing, we may incur additional costs to comply with such requirements that may be significant in nature, experience delays or curtailment in the pursuit of exploration, development, or production activities, and could even be prohibited from drilling and/or completing certain wells.
Certain states in which we operate, including Texas and Wyoming, have adopted, and other states are considering adopting, regulations that could impose more stringent permitting, public disclosure, waste disposal, and well construction requirements on hydraulic fracturing operations or otherwise seek to ban fracturing activities altogether. In addition to state laws, local land use restrictions, such as city ordinances, may restrict or prohibit the performance of drilling in general and/or hydraulic fracturing in particular. Recently, several municipalities have passed or proposed zoning ordinances that ban or strictly regulate hydraulic fracturing within city boundaries, setting the stage for challenges by state regulators and third-parties. Similar events and processes are playing out in several cities, counties, and townships across the United States. In the event state, local, or municipal legal restrictions are adopted in areas where we are currently conducting, or in the future plan to conduct, operations, we may incur additional costs to comply with such requirements that may be significant in nature, experience delays or curtailment in the pursuit of exploration, development, or production activities, and could even be prohibited from drilling and/or completing certain wells.
Several federal governmental agencies are actively involved in studies or reviews that focus on environmental aspects and impacts of hydraulic fracturing practices. A number of federal agencies are analyzing, or have been requested to review, a variety of environmental issues associated with hydraulic fracturing. In December 2016, the EPA issued a final assessment of potential impacts to drinking water resources from hydraulic fracturing. The EPA’s inspector general released a report on July 16, 2015 recommending increased EPA oversight of permit issuances as well as the chemicals used in hydraulic fracturing. The United States Department of Energy is also actively involved in research on hydraulic fracturing practices, including groundwater protection.
On March 26, 2015, the Bureau of Land Management (“BLM”) published a final rule governing hydraulic fracturing on federal and Indian lands, including private surface lands with underlying federal minerals. The rule was scheduled to become effective on June 24, 2015, but was temporarily stayed by a federal court. The rule requires public disclosure of chemicals used in hydraulic fracturing on federal and Indian lands, confirmation that wells used in hydraulic fracturing operations meet certain construction standards, development of appropriate plans for managing flowback water that returns to the surface, heightened standards for interim storage of recovered waste fluids, and submission of detailed information to the BLM regarding the geology, depth and location of pre-existing wells. Although several states, tribes, and industry groups filed several pending lawsuits challenging the rule and the BLM’s authority to regulate hydraulic fracturing, the outcome of this litigation is uncertain. If the rule becomes effective, we expect to incur additional costs to comply with such requirements that may be significant in nature, and we could experience delays or even curtailment in the pursuit of hydraulic fracturing activities in certain wells on federal and Indian lands. The rule could also affect drilling units that include both private and federal mineral resources.
Legislation has been introduced before Congress to provide for federal regulation of hydraulic fracturing and to require disclosure of the chemicals used in the hydraulic fracturing process. If hydraulic fracturing becomes regulated at the federal level, our fracturing activities could become subject to additional permit or disclosure requirements, associated permitting delays, operational restrictions, litigation risk, and potential cost increases. Additionally, certain members of Congress have called upon the United States Government Accountability Office to investigate how hydraulic fracturing might adversely affect water resources, the SEC to investigate the natural gas industry and any possible misleading of investors or the public regarding the economic feasibility of pursuing natural gas deposits in shales by means of hydraulic fracturing, and the United States Energy Information Administration to provide a better understanding of that agency’s estimates regarding natural gas reserves, including reserves from shale formations, as well as uncertainties associated with those estimates. The United States Geological Survey Offices of Energy Resources Program, Water Resources and Natural Hazards and Environmental Health Offices also have ongoing research projects on hydraulic fracturing. These ongoing studies, depending on their course and outcomes, could spur initiatives to further regulate hydraulic fracturing under the SDWA or other regulatory processes.
Further, on August 16, 2012, the EPA issued final rules subjecting all new and modified oil and gas operations (production, processing, transmission, storage, and distribution) to regulation under the New Source Performance Standards (“NSPS”) and all existing and new operations to the National Emission Standards for Hazardous Air Pollutants (“NESHAP”) programs. The EPA rules also include NSPS standards for completions of hydraulically fractured gas wells. These standards require the use of reduced emission completion (“REC”) techniques developed in the EPA’s Natural Gas STAR program along
41
with the pit flaring of gas not sent to the gathering line beginning in January 2015. The standards are applicable to newly drilled and fractured wells as well as existing wells that are refractured. Further, the regulations under NESHAP include maximum achievable control technology (“MACT”) standards for those glycol dehydrators and certain storage vessels at major sources of hazardous air pollutants not currently subject to MACT standards. These rules will require additional control equipment, changes to procedure, and extensive monitoring and reporting. The EPA stated in January 2013, however, that it intends to reconsider portions of the final rule. On September 23, 2013, the EPA published new standards for storage tanks subject to the NSPS. In December 2014, the EPA finalized additional updates to the 2012 NSPS. The amendments clarified stages for flowback and the point at which green completion equipment is required and updated requirements for storage tanks and leak detection requirements for processing plants. In October 2016, the EPA denied the remaining petitions for reconsideration with respect to the issues not otherwise addressed in the previous reconsideration actions. As part of the EPA’s strategy to reduce methane and ozone-forming VOC emissions from the oil and gas industry, on May 12, 2016, the EPA issued final regulations that amend and expand the 2012 regulations by setting emission limits for greenhouse gases, or GHGs, and added requirements for previously unregulated sources. The 2016 NSPS requires reduction of greenhouse gases in the form of methane and VOCs from certain activities in oil and gas production, processing, transmission and storage and applies to facilities constructed, modified, or reconstructed after September 18, 2015. The final regulation requires, among other things, GHG and VOC emission limits for certain equipment, such as centrifugal compressors and reciprocating compressors; semi-annual leak detection and repair for well sites and quarterly for boosting and garnering compressor stations and natural gas transmission compressor stations; control requirements and emission limits for pneumatic pumps; and additional requirements for control of GHGs and VOCs from well completions. Both the 2012 and 2016 rules are the subjects of Petitions for Review before the U.S. Circuit Court of Appeals for the District of Columbia. In a related action, in November of 2016, the EPA issued oil and gas companies a final information request as part of an effort to develop standards under the Clean Air Act NSPS provisions for methane and other emissions from existing sources in the oil and natural gas industry. The request requires companies to provide the EPA with a wide range of information related to operations, equipment, and emissions controls within 180 days of receipt. It is unclear whether the Trump Administration will proceed with developing an existing source rule based on the information collected through this request.
In October 2015, the EPA revised and lowered the ambient air quality standard for ozone in the U.S. under the Clean Air Act, from 75 parts per billion to 70 parts per billion, which is likely to result in more, and expanded, ozone non-attainment areas, which in turn will require states to adopt implementation plans to reduce emissions of ozone-forming pollutants, like VOCs and nitrogen oxides, that are emitted from, among others, the oil and gas industry. In October 2016, the EPA finalized Control Techniques Guidelines for VOC emissions from existing oil and natural gas equipment and processes in moderate ozone non-attainment areas. These Control Techniques Guidelines provide recommendations for states and local air agencies to consider when determining what emissions requirements apply to sources in the non-attainment areas. On May 12, 2016, the EPA also issued a final rule named the “Source Determination Rule” that was issued to clarify when multiple pieces of oil and gas equipment and activities must be aggregated as a single source for determining whether major source permitting programs apply. This action can expand the permitting and related control requirements to sources that were not previously subject to permitting requirements.
Increased regulation and attention given to the hydraulic fracturing process could lead to greater opposition, including litigation, to oil and gas production activities using hydraulic fracturing techniques. Disclosure of chemicals used in the hydraulic fracturing process could make it easier for third parties opposing such activities to pursue legal proceedings against producers and service providers based on allegations that specific chemicals used in the fracturing process could adversely affect human health or the environment, including groundwater. Over the past year, several court cases have addressed aspects of hydraulic fracturing. In a case that could delay operations on public lands, a court in California held that the BLM did not adequately consider the impact of hydraulic fracturing and horizontal drilling before issuing leases. Courts in New York and Colorado reduced the level of evidence required before a court will agree to consider alleged damage claims from hydraulic fracturing by property owners. Litigation resulting in financial compensation for damages linked to hydraulic fracturing, including damages from induced seismicity, could spur future litigation and bring increased attention to the practice of hydraulic fracturing. Judicial decisions could also lead to increased regulation, permitting requirements, enforcement actions, and penalties. Additional legislation or regulation could also lead to operational delays or restrictions or increased costs in the exploration for, and production of, oil, natural gas, and associated liquids, including from the development of shale plays, or could make it more difficult to perform hydraulic fracturing. The adoption of additional federal, state, or local laws, or the implementation of new regulations, regarding hydraulic fracturing could potentially cause a decrease in the completion of new oil and gas wells, or an increase in compliance costs and delays, which could adversely affect our financial position, results of operations, and cash flows.
42
Requirements to reduce gas flaring could have an adverse effect on our operations.
Wells in the Bakken and Three Forks formations in North Dakota, where we have significant operations, produce natural gas as well as crude oil. Constraints in the current gas gathering and processing network in certain areas have resulted in some of that natural gas being flared instead of gathered, processed and sold. In June 2014, the North Dakota Industrial Commission, North Dakota’s chief energy regulator, adopted a policy to reduce the volume of natural gas flared from oil wells in the Bakken and Three Forks formations. The Commission is requiring operators to develop gas capture plans that describe how much natural gas is expected to be produced, how it will be delivered to a processor and where it will be processed. Production caps or penalties will be imposed on certain wells that cannot meet the capture goals. In November 2016, the BLM finalized regulations to address methane emissions from oil and gas operations on federal and tribal lands. The regulations prohibit venting gas except in limited situations and limit the flaring of gas. These capture requirements, and any similar future obligations in North Dakota or our other locations, may increase our operational costs or restrict our production, which could materially and adversely affect our financial condition, results of operations and cash flows.
Our ability to produce crude oil, natural gas, and associated liquids economically and in commercial quantities could be impaired if we are unable to acquire adequate supplies of water for our drilling operations and/or completions or are unable to dispose of or recycle the water we use at a reasonable cost and in accordance with applicable environmental rules.
The hydraulic fracturing process on which we and others in our industry depend to complete wells that will produce commercial quantities of crude oil, natural gas, and NGLs requires the use and disposal of significant quantities of water.
Our inability to secure sufficient amounts of water, or to dispose of or recycle the water used in our operations, could adversely impact our operations. Moreover, the imposition of new environmental initiatives and regulations could include restrictions on our ability to conduct certain operations such as hydraulic fracturing or disposal of wastes, including, but not limited to, produced water, drilling fluids, and other wastes associated with the exploration, development, or production of crude oil, natural gas, and NGLs.
Compliance with environmental regulations and permit requirements governing the withdrawal, storage, and use of surface water or groundwater necessary for hydraulic fracturing of wells may increase our operating costs and cause delays, interruptions, or termination of our operations, the extent of which cannot be predicted, all of which could have an adverse effect on our operations and financial condition.
Certain United States federal income tax deductions currently available with respect to oil and natural gas exploration and production could be eliminated or modified as a result of future legislation.
Budget proposals in recent years, if enacted into law, would have eliminated certain key United States federal income tax incentives available to oil and natural gas exploration and production companies. The proposals included:
• | the elimination of current deductions for intangible drilling and development costs; |
• | the repeal of the percentage depletion allowance for oil and natural gas properties; |
• | the elimination of the deduction for certain domestic production activities; and |
• | an extension of the amortization period for certain geological and geophysical expenditures. |
Congress is currently considering tax reform proposals which could have a significant impact on business taxes and it could be that none of these or similar changes will be enacted. The passage of legislation eliminating or postponing certain tax deductions currently available with respect to oil and natural gas exploration and development could have an adverse effect on our financial position, results of operations and cash flows.
43
Legislative and regulatory initiatives related to global warming and climate change could have an adverse effect on our operations and the demand for crude oil, natural gas, and NGLs.
In December 2009, the EPA made a finding that emissions of carbon dioxide, methane, and other “greenhouse gases” endanger public health and the environment because emissions of such gases contribute to warming of the earth’s atmosphere and other climatic changes. Based on this finding, the EPA adopted and implemented a comprehensive suite of regulations to restrict and otherwise regulate emissions of greenhouse gases under existing provisions of the CAA. In particular, the EPA has adopted two sets of rules regulating greenhouse gas emissions under the CAA. One rule requires a reduction in greenhouse gas emissions from motor vehicles, and the other regulates permitting and greenhouse gas emissions from certain large stationary sources. These EPA regulatory actions have been challenged by various industry groups, initially in the D.C. Circuit, which in 2012 ruled in favor of the EPA in all respects. However, in June 2014, the United States Supreme Court reversed the D.C. Circuit and struck down the EPA’s greenhouse gas permitting rules to the extent they impose a requirement to obtain a permit based solely on emissions of greenhouse gases. The EPA proposed a rule in 2016 to comply with the U.S. Supreme Court’s ruling by limiting the requirement to obtain permits addressing emissions of greenhouse gases to large sources of other air pollutants, such as volatile organic compounds or nitrogen oxides, which also emit 100,000 tons per year or more of CO2 (or modifications of these sources that result in an emissions increase of 75,000 tons per year or more of CO2e). If finalized, large sources of air pollutants other than greenhouse gases will be required to implement the best available capture technology for greenhouse gases. The EPA has also adopted reporting rules for greenhouse gas emissions from specified greenhouse gas emission sources in the United States, including petroleum refineries as well as certain onshore oil and natural gas extraction and production facilities.
Several other kinds of cases on greenhouse gases have been heard by the courts in recent years. While courts have generally declined to assign direct liability for climate change to large sources of greenhouse gas emissions, some have required increased scrutiny of such emissions by federal agencies and permitting authorities. There is a continuing risk of claims being filed against companies that have significant greenhouse gas emissions, and new claims for damages and increased government scrutiny will likely continue. Such cases often seek to challenge air emissions permits that greenhouse gas emitters apply for, seek to force emitters to reduce their emissions, or seek damages for alleged climate change impacts to the environment, people, and property. Any court rulings, laws or regulations that restrict or require reduced emissions of greenhouse gases could lead to increased operating and compliance costs, and could have an adverse effect on demand for the oil and natural gas that we produce.
The United States Congress has from time to time considered adopting legislation to reduce emissions of greenhouse gases, and almost one-half of the states have already taken measures to reduce emissions of greenhouse gases, primarily through the planned development of greenhouse gas emission inventories and/or regional greenhouse gas “cap and trade” programs. Most of these cap and trade programs work by requiring major sources of emissions, such as electric power plants, or major producers of fuels, such as refineries and gas processing plants, to acquire and surrender emission allowances. The number of allowances available for purchase is reduced each year in an effort to achieve the overall greenhouse gas emission reduction goal. Recently, the Congressional Budget Office provided Congress with a study on the potential effects on the United States economy of a tax on greenhouse gas emissions. While “carbon tax” legislation has been introduced in the Senate, the prospects for passage of such legislation are highly uncertain at this time.
On June 25, 2013, President Obama outlined plans to address climate change through a variety of executive actions, including reduction of methane emissions from oil and gas production and processing operations as well as pipelines and coal mines (the “Climate Plan”). The President’s Climate Plan, along with recent regulatory initiatives and ongoing litigation filed by states and environmental groups, signal a new focus on methane emissions, which could pose substantial regulatory risk to our operations. In March 2014, President Obama released a strategy to reduce methane emissions, which directed the EPA to consider additional regulations to reduce methane emissions from the oil and gas sector. On January 14, 2015, the Obama Administration announced additional steps to reduce methane emissions from the oil and gas sector by 40 to 45 percent by 2025. These actions include a commitment from the EPA to issue new source performance standards for methane emissions from the oil and gas sector. Pursuant to this commitment, in October 2016, the EPA finalized emission standards for methane and VOC for sources in the oil and gas sector constructed or modified after September 1, 2015. See Proposed federal and state legislative and regulatory initiatives relating to hydraulic fracturing could result in increased costs and additional operating restrictions or delays for more information on this rule and steps the EPA has taken to address existing sources. On November 16, 2016, the BLM finalized regulations to address methane emissions from oil and gas operations on federal and tribal lands, as part of the Climate Plan. The regulations, named the Methane and Waste Prevention Rule, are intended to reduce the waste of natural gas from flaring, venting, and leaks by oil and gas production. The rule includes requirements that prohibit venting gas except in limited circumstances and limit flaring of gas and includes requirements for leak detection and
44
repair. The rule also increases royalty payments for “waste” gas that is released in contravention of the rule requirements. The rule, which was immediately challenged in federal district court, faces an uncertain future in the Trump Administration and is a potential target of rescission through the Congressional Review Act. The focus on legislating methane also could eventually result in:
•requirements for methane emission reductions from existing oil and gas equipment;
•increased scrutiny for sources emitting high levels of methane, including during permitting processes;
•analysis, regulation and reduction of methane emissions as a requirement for project approval; and
•actions taken by one agency for a specific industry establishing precedents for other agencies and
industry sectors.
In relation to the Climate Plan, both assumed Global Warming Potential (“GWP”) and assumed social costs associated with methane and other greenhouse gas emissions have been finalized, including a 20% increase in the GWP of methane. Changes to these measurement tools could adversely impact permitting requirements, application of agencies’ existing regulations for source categories with high methane emissions, and determinations of whether a source qualifies for regulation under the CAA. The continued use of the social cost of carbon under the Trump Administration is uncertain.
Finally, it should be noted that some scientists have predicted that increasing concentrations of greenhouse gases in the earth’s atmosphere may produce climate changes that have significant physical effects, such as increased frequency and severity of storms, droughts, and floods and other climatic events. Some scientists refute these predictions. However, President Obama’s Climate Plan emphasizes preparation for such events. If such effects were to occur, our operations could be adversely affected. Potential adverse effects could include disruption of our production activities, including, for example, damages to our facilities from flooding or increases in our costs of operation or reductions in the efficiency of our operations, as well as potentially increased costs for insurance coverage in the aftermath of such events. Significant physical effects of climate change could also have an indirect effect on our financing and operations by disrupting the transportation or process-related services provided by midstream companies, service companies or suppliers with whom we have a business relationship. We may not be able to recover through insurance some or any of the damages, losses or costs that may result from potential physical effects of climate change. Federal regulations or policy changes regarding climate change preparation requirements could also impact our costs and planning requirements.
Our ability to sell crude oil, natural gas, and NGLs, and/or receive market prices for our production, may be adversely affected by constraints on gathering systems, processing facilities, pipelines and other transportation systems owned or operated by others or by other interruptions.
The marketability of our crude oil, natural gas, and NGL production depends in part on the availability, proximity, and capacity of gathering systems, processing facilities, pipelines, and other transportation systems owned or operated by third parties. Any significant interruption in service from, damage to, or lack of available capacity in these systems and facilities can result in the shutting-in of producing wells, the delay or discontinuance of development plans for our properties, or lower price realizations. Although we have some contractual control over the processing and transportation of our operated production, material changes in these business relationships could materially affect our operations. Federal and state regulation of crude oil, natural gas, and NGL production and transportation, tax and energy policies, changes in supply and demand, pipeline pressures, damage to or destruction of pipelines, infrastructure or capacity constraints, and general economic conditions could adversely affect our ability to produce, gather, process, and transport crude oil, natural gas, and NGLs.
In particular, if drilling in the Midland Basin continues to be successful, the amount of crude oil, natural gas, and NGLs being produced by us and others could exceed the capacity of, and result in strains on, the various gathering and transportation systems, pipelines, processing facilities, and other infrastructure available in that area. It will be necessary for additional infrastructure, pipelines, gathering and transportation systems and processing facilities to be expanded, built or developed to accommodate anticipated production from these areas. Because of the current commodity price environment, certain processing, pipeline, and other gathering or transportation projects that might be, or are being, considered for these areas may not be developed timely or at all due to lack of financing or other constraints, including permitting constraints. Capital and other constraints could also limit our ability to build or access intrastate gathering and transportation systems necessary to transport our production to interstate pipelines or other points of sale or delivery. In such event, we might have to delay or discontinue development activities or shut in our wells to wait for sufficient infrastructure development or capacity
45
expansion and/or sell production at significantly lower prices, which would adversely affect our results of operations and cash flows. In addition, the operations of the third parties on whom we rely for gathering and transportation services are subject to complex and stringent laws and regulations, which require obtaining and maintaining numerous permits, approvals, and certifications from various federal, state, tribal and local government authorities. These third parties may incur substantial costs in order to comply with existing laws and regulations. If existing laws and regulations governing such third-party services are revised or reinterpreted, or if new laws and regulations become applicable to their operations, these changes may affect the amounts we pay for such services. Similarly, a failure to comply with such laws and regulations by the third parties on whom we rely could have a material adverse effect on our business, financial condition and results of operations.
A portion of our production in any region may be interrupted, or shut in, from time to time for numerous reasons, including as a result of weather conditions, accidents, loss of pipeline, gathering, processing or transportation system access or capacity, field labor issues or strikes, or we might voluntarily curtail production in response to market conditions. If a substantial amount of our production is interrupted at the same time, it could temporarily and adversely affect our cash flows and results of operations.
New technologies may cause our current exploration and drilling methods to become obsolete.
The oil and gas industry is subject to rapid and significant advancements in technology, including the introduction of new products and services that use new technologies. As competitors use or develop new technologies, we may be placed at a competitive disadvantage, and competitive pressures may force us to implement new technologies at a substantial cost. In addition, competitors may have greater financial, technical, and personnel resources that allow them to enjoy technological advantages and may in the future allow them to implement new technologies before we can. One or more of the technologies we currently use or implement in the future may become obsolete. We cannot be certain we will be able to implement technologies on a timely basis or at a cost that is acceptable to us. If we are unable to maintain technological advancements consistent with industry standards, our operations and financial condition may be adversely affected.
Our business could be negatively impacted by security threats, including cybersecurity threats, terrorism, armed conflict, and other disruptions.
As a crude oil, natural gas, and NGLs producer, we face various security threats, including cybersecurity threats to gain unauthorized access to sensitive information or to render data or systems unusable; threats to the safety of our employees; threats to the security of our facilities and infrastructure or third party facilities and infrastructure, such as processing plants and pipelines; and threats from terrorist acts. Although we utilize various procedures and controls to monitor these threats and mitigate our exposure to such threats, there can be no assurance that these procedures and controls will be sufficient in preventing security threats from materializing. If any of these events were to materialize, they could lead to losses of sensitive information, critical infrastructure, personnel or capabilities essential to our operations and could have a material adverse effect on our reputation, financial position, results of operations, or cash flows.
Cybersecurity attacks in particular are evolving and include, but are not limited to, malicious software, attempts to gain unauthorized access to data, and other electronic security breaches that could lead to disruptions in critical systems, unauthorized release of confidential or otherwise protected information, and corruption of data. These events could damage our reputation and lead to financial losses from remedial actions, loss of business or potential liability.
The threat of terrorism and the impact of military and other action have caused instability in world financial markets and could lead to increased volatility in prices for crude oil, natural gas, and NGLs, all of which could adversely affect the markets for our operations. Energy assets might be specific targets of terrorist attacks. These developments have subjected our operations to increased risk and, depending on their occurrence and ultimate magnitude, could have a material adverse effect on our business.
46
Risks Related to Our Common Stock
The price of our common stock may fluctuate significantly, which may result in losses for investors.
From January 1, 2016, to February 15, 2017, the low and high intraday trading prices per share of our common stock as reported by the New York Stock Exchange ranged from a low of $6.99 per share in February 2016 to a high of $43.09 per share in October 2016. We expect our stock to continue to be subject to fluctuations as a result of a variety of factors, including factors beyond our control. These factors include:
• | changes in crude oil, natural gas, or NGL prices; |
• | variations in drilling, recompletion, and operating activity; |
• | changes in financial estimates by securities analysts; |
• | changes in market valuations of comparable companies; |
• | additions or departures of key personnel; |
• | future sales of our common stock; and |
• | changes in the national and global economic outlook. |
We may not meet the expectations of our stockholders and/or of securities analysts at some time in the future, and our stock price could decline as a result.
Our certificate of incorporation and by-laws have provisions that discourage corporate takeovers and could prevent stockholders from receiving a takeover premium on their investment, which could adversely affect the price of our common stock.
Delaware corporate law and our certificate of incorporation and by-laws contain provisions that may have the effect of delaying or preventing a change of control of us or our management. These provisions, among other things, provide for non-cumulative voting in the election of members of the Board of Directors and impose procedural requirements on stockholders who wish to make nominations for the election of directors or propose other actions at stockholder meetings. These provisions, alone or in combination with each other, may discourage transactions involving actual or potential changes of control, including transactions that otherwise could involve payment of a premium over prevailing market prices to stockholders for their common stock. As a result, these provisions could make it more difficult for a third party to acquire us, even if doing so would benefit our stockholders, which may limit the price investors are willing to pay in the future for shares of our common stock.
Shares eligible for future sale may cause the market price of our common stock to drop significantly, even if our business is doing well.
The potential for sales of substantial amounts of our common stock in the public market may have a materially adverse effect on our stock price. As of February 15, 2017, 97,871,754 shares of our common stock were freely tradable without substantial restriction or the requirement of future registration under the Securities Act. In addition, (a) approximately 13.4 million shares issued pursuant to the QStar Acquisition were subject to a Lock-Up and Registration Rights Agreement that prohibits sale of such stock until no earlier than the 90th day after issuance; (b) restricted stock units (“RSUs”) providing for the issuance of up to a total of 591,380 shares of our common stock were outstanding; and (c) 865,598 performance share units (“PSUs”) were outstanding. The PSUs represent the right to receive, upon settlement of the PSUs after the completion of a three-year performance period, a number of shares of our common stock that may be from zero to two times the number of PSUs granted, depending on the extent to which the underlying performance criteria have been achieved and the extent to which the PSUs have vested. As of February 15, 2017, there were 111,257,703 shares of our common stock outstanding.
47
We may not always pay dividends on our common stock.
Payment of future dividends remains at the discretion of our Board of Directors, and will continue to depend on our earnings, capital requirements, financial condition, and other factors. In addition, the payment of dividends is subject to a covenant in our Credit Agreement limiting our annual cash dividends to no more than $50.0 million, and to covenants in the indentures for our Senior Notes and Senior Convertible Notes that limit our ability to pay dividends beyond a certain amount. Our Board of Directors may determine in the future to reduce the current semi-annual dividend rate of $0.05 per share, or discontinue the payment of dividends altogether.
ITEM 1B. UNRESOLVED STAFF COMMENTS
We have no unresolved comments from the SEC staff regarding our periodic or current reports under the Exchange Act.
ITEM 3. LEGAL PROCEEDINGS
From time to time, we may be involved in litigation relating to claims arising out of our business and operations in the normal course of business. As of the filing date of this report, no legal proceedings are pending against us that we believe individually or collectively could have a materially adverse effect upon our financial condition, results of operations or cash flows.
ITEM 4. MINE SAFETY DISCLOSURES
These disclosures are not applicable to us.
48
PART II
ITEM 5. | MARKET FOR REGISTRANT’S COMMON EQUITY, RELATED STOCKHOLDER MATTERS AND ISSUER PURCHASES OF EQUITY SECURITIES |
Market Information. Our common stock is currently traded on the New York Stock Exchange under the ticker symbol “SM.” The following table presents the range of high and low intraday sales prices per share for the indicated quarterly periods in 2016 and 2015, as reported by the New York Stock Exchange:
Quarter Ended | High | Low | ||||||
December 31, 2016 | $ | 43.09 | $ | 30.25 | ||||
September 30, 2016 | $ | 40.39 | $ | 23.58 | ||||
June 30, 2016 | $ | 35.60 | $ | 17.04 | ||||
March 31, 2016 | $ | 20.65 | $ | 6.99 | ||||
December 31, 2015 | $ | 42.23 | $ | 18.06 | ||||
September 30, 2015 | $ | 45.98 | $ | 18.21 | ||||
June 30, 2015 | $ | 60.28 | $ | 43.70 | ||||
March 31, 2015 | $ | 53.31 | $ | 31.01 | ||||
PERFORMANCE GRAPH
The following performance graph compares the cumulative return on our common stock, for the period beginning December 31, 2011, and ending on December 31, 2016, with the cumulative total returns of the Dow Jones U.S. Exploration and Production Index, and the Standard & Poor’s 500 Stock Index.
COMPARISON OF 5-YEAR CUMULATIVE TOTAL RETURNS
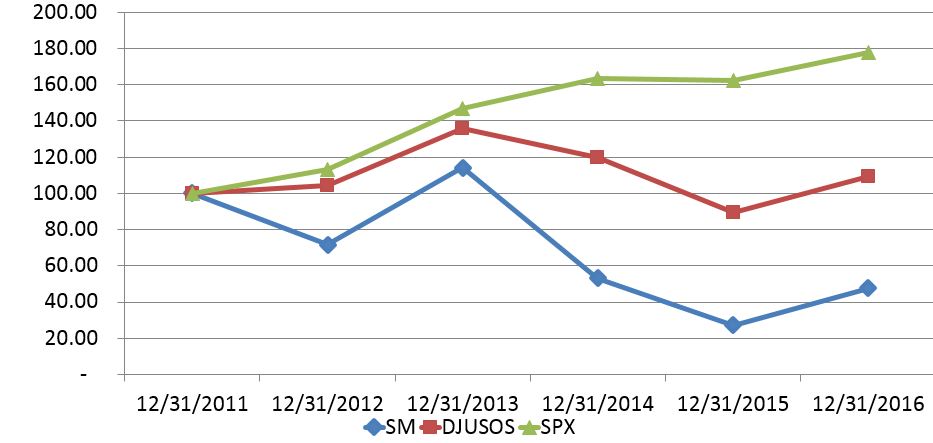
The preceding information under the caption Performance Graph shall be deemed to be furnished, but not filed with the SEC.
Holders. As of February 15, 2017, the number of record holders of our common stock was 85. Based upon inquiry, management believes that the number of beneficial owners of our common stock is approximately 25,700.
49
Dividends. We have paid cash dividends to our stockholders every year since 1940. Annual dividends of $0.05 per share were paid in each of the years 1998 through 2004. Annual dividends of $0.10 per share were paid in each of the years 2005 through 2016. We expect our practice of paying dividends on our common stock to continue, although the payment and amount of future dividends will continue to depend on our earnings, cash flow, capital requirements, financial condition, and other factors, including the discretion of our Board of Directors. In addition, the payment of dividends is subject to covenants in our Credit Agreement that limit our annual dividend payment to no more than $50.0 million per year. We are also subject to certain covenants under the indentures governing our Senior Notes and Senior Convertible Notes that restrict certain payments, including dividends; however, the first $6.5 million of dividends paid each year are not restricted by this covenant. Based on our current performance, we do not anticipate that these covenants will restrict future annual dividend payments in amounts not to exceed $0.10 per share of common stock. Dividends are currently paid on a semi-annual basis. Dividends paid totaled $7.8 million, $6.8 million, and $6.7 million for the years ended December 31, 2016, 2015, and 2014, respectively.
Purchases of Equity Securities by the Issuer and Affiliated Purchasers. The following table provides information about purchases made by us and any affiliated purchaser (as defined in Rule 10b-18(a)(3) under the Exchange Act) during the indicated quarters and year ended December 31, 2016, of shares of our common stock, which is the sole class of equity securities registered by us pursuant to Section 12 of the Exchange Act.
____________________________________________
ISSUER PURCHASES OF EQUITY SECURITIES | ||||||||||||
Total Number of Shares Purchased(1) | Weighted Average Price Paid per Share | Total Number of Shares Purchased as Part of Publicly Announced Program | Maximum Number of Shares that May Yet be Purchased Under the Program (2) | |||||||||
January 1, 2016 - March 31, 2016 | 176 | $ | 14.87 | — | 3,072,184 | |||||||
April 1, 2016 - June 30, 2016 | 1,053 | $ | 28.99 | — | 3,072,184 | |||||||
July 1, 2016 - September 30, 2016 | 85,418 | $ | 27.02 | — | 3,072,184 | |||||||
October 1, 2016 - October 31, 2016 | 343 | $ | 39.37 | — | 3,072,184 | |||||||
November 1, 2016 - November 30, 2016 | — | $ | — | — | 3,072,184 | |||||||
December 1, 2016 - December 31, 2016 | — | $ | — | — | 3,072,184 | |||||||
Total October 1, 2016 - December 31, 2016 | 343 | $ | 39.37 | — | 3,072,184 | |||||||
Total | 86,990 | $ | 27.07 | — | 3,072,184 | |||||||
(1) | All shares purchased by us in 2016 offset tax withholding obligations that occurred upon the delivery of outstanding shares underlying RSUs and PSUs delivered under the terms of grants under the Equity Incentive Compensation Plan (“Equity Plan”). |
(2) | In July 2006, our Board of Directors approved an increase in the number of shares that may be repurchased under the original August 1998 authorization to 6,000,000 as of the effective date of the resolution. Accordingly, as of the date of this filing, subject to the approval of our Board of Directors, we may repurchase up to 3,072,184 shares of common stock on a prospective basis. The shares may be repurchased from time to time in open market transactions or privately negotiated transactions, subject to market conditions and other factors, including certain provisions of our Credit Agreement, the indentures governing our Senior Notes and Senior Convertible Notes, and compliance with securities laws. Stock repurchases may be funded with existing cash balances, internal cash flow, or borrowings under our Credit Agreement. The stock repurchase program may be suspended or discontinued at any time. Please refer to Dividends above for a description of our dividend limitations. |
50
ITEM 6. SELECTED FINANCIAL DATA
The following table sets forth selected supplemental financial and operating data as of the dates and periods indicated. The financial data for each of the five years presented were derived from our consolidated financial statements. The following data should be read in conjunction with Management’s Discussion and Analysis of Financial Condition and Results of Operations in Part II, Item 7 of this report, which includes a discussion of factors materially affecting the comparability of the information presented, and in conjunction with our consolidated financial statements included in this report.
Years Ended December 31, | |||||||||||||||||||
2016 | 2015 | 2014 | 2013 | 2012 | |||||||||||||||
(in millions, except per share data) | |||||||||||||||||||
Statement of Operations Data: | |||||||||||||||||||
Total operating revenues and other income | $ | 1,217.5 | $ | 1,557.0 | $ | 2,522.3 | $ | 2,293.4 | $ | 1,505.1 | |||||||||
Net income (loss) | $ | (757.7 | ) | $ | (447.7 | ) | $ | 666.1 | $ | 170.9 | $ | (54.2 | ) | ||||||
Net income (loss) per share: | |||||||||||||||||||
Basic | $ | (9.90 | ) | $ | (6.61 | ) | $ | 9.91 | $ | 2.57 | $ | (0.83 | ) | ||||||
Diluted | $ | (9.90 | ) | $ | (6.61 | ) | $ | 9.79 | $ | 2.51 | $ | (0.83 | ) | ||||||
Balance Sheet Data (at end of period): | |||||||||||||||||||
Total assets | $ | 6,393.5 | $ | 5,621.6 | $ | 6,483.1 | $ | 4,678.1 | $ | 4,179.0 | |||||||||
Long-term debt: | |||||||||||||||||||
Revolving credit facility | $ | — | $ | 202.0 | $ | 166.0 | $ | — | $ | 340.0 | |||||||||
Senior Notes, net of unamortized deferred financing costs | $ | 2,766.7 | $ | 2,316.0 | $ | 2,166.4 | $ | 1,572.9 | $ | 1,079.5 | |||||||||
Senior Convertible Notes, net of unamortized discount and deferred financing costs | $ | 130.9 | $ | — | $ | — | $ | — | $ | — | |||||||||
Cash dividends declared and paid per common share | $ | 0.10 | $ | 0.10 | $ | 0.10 | $ | 0.10 | $ | 0.10 | |||||||||
51
Supplemental Selected Financial and Operations Data | |||||||||||||||||||
For the Years Ended December 31, | |||||||||||||||||||
2016 | 2015 | 2014 | 2013 | 2012 | |||||||||||||||
Balance Sheet Data (in millions): | |||||||||||||||||||
Total working capital (deficit) | $ | (190.5 | ) | $ | 216.5 | $ | (39.6 | ) | $ | 8.4 | $ | (201.0 | ) | ||||||
Total stockholders’ equity | $ | 2,497.1 | $ | 1,852.4 | $ | 2,286.7 | $ | 1,606.8 | $ | 1,414.5 | |||||||||
Weighted-average common shares outstanding (in thousands): | |||||||||||||||||||
Basic | 76,568 | 67,723 | 67,230 | 66,615 | 65,138 | ||||||||||||||
Diluted | 76,568 | 67,723 | 68,044 | 67,998 | 65,138 | ||||||||||||||
Reserves: | |||||||||||||||||||
Oil (MMBbl) | 104.9 | 145.3 | 169.7 | 126.6 | 92.2 | ||||||||||||||
Gas (Bcf) | 1,111.1 | 1,264.0 | 1,466.5 | 1,189.3 | 833.4 | ||||||||||||||
NGLs (MMBbl) | 105.7 | 115.4 | 133.5 | 103.9 | 62.3 | ||||||||||||||
MMBOE | 395.8 | 471.3 | 547.7 | 428.7 | 293.4 | ||||||||||||||
Production and Operations (in millions): | |||||||||||||||||||
Oil, gas, and NGL production revenue | $ | 1,178.4 | $ | 1,499.9 | $ | 2,481.5 | $ | 2,199.6 | $ | 1,473.9 | |||||||||
Oil, gas, and NGL production expense | $ | 597.6 | $ | 723.6 | $ | 715.9 | $ | 597.0 | $ | 391.9 | |||||||||
Depletion, depreciation, amortization, and asset retirement obligation liability accretion | $ | 790.7 | $ | 921.0 | $ | 767.5 | $ | 822.9 | $ | 727.9 | |||||||||
General and administrative | $ | 126.4 | $ | 157.7 | $ | 167.1 | $ | 149.6 | $ | 119.8 | |||||||||
Production Volumes: | |||||||||||||||||||
Oil (MMBbl) | 16.6 | 19.2 | 16.7 | 13.9 | 10.4 | ||||||||||||||
Gas (Bcf) | 146.9 | 173.6 | 152.9 | 149.3 | 120.0 | ||||||||||||||
NGLs (MMBbl) | 14.2 | 16.1 | 13.0 | 9.5 | 6.1 | ||||||||||||||
MMBOE | 55.3 | 64.2 | 55.1 | 48.3 | 36.5 | ||||||||||||||
Realized price, before the effect of derivative settlements: | |||||||||||||||||||
Oil (per Bbl) | $ | 36.85 | $ | 41.49 | $ | 80.97 | $ | 91.19 | $ | 85.45 | |||||||||
Gas (per Mcf) | $ | 2.30 | $ | 2.57 | $ | 4.58 | $ | 3.93 | $ | 2.98 | |||||||||
NGLs (per Bbl) | $ | 16.16 | $ | 15.92 | $ | 33.34 | $ | 35.95 | $ | 37.61 | |||||||||
Expense per BOE: | |||||||||||||||||||
Lease operating expense | $ | 3.51 | $ | 3.73 | $ | 4.28 | $ | 4.49 | $ | 4.54 | |||||||||
Transportation costs | $ | 6.16 | $ | 6.02 | $ | 6.11 | $ | 5.34 | $ | 3.81 | |||||||||
Production taxes | $ | 0.94 | $ | 1.13 | $ | 2.13 | $ | 2.19 | $ | 2.00 | |||||||||
Ad valorem tax expense | $ | 0.21 | $ | 0.39 | $ | 0.46 | $ | 0.33 | $ | 0.39 | |||||||||
Depletion, depreciation, amortization, and asset retirement obligation liability accretion | $ | 14.30 | $ | 14.34 | $ | 13.92 | $ | 17.02 | $ | 19.95 | |||||||||
General and administrative | $ | 2.29 | $ | 2.46 | $ | 3.03 | $ | 3.09 | $ | 3.28 | |||||||||
Statement of Cash Flow Data (in millions): | |||||||||||||||||||
Provided by operating activities | $ | 552.8 | $ | 978.4 | $ | 1,456.6 | $ | 1,338.5 | $ | 922.0 | |||||||||
Used in investing activities | $ | (1,870.6 | ) | $ | (1,144.6 | ) | $ | (2,478.7 | ) | $ | (1,192.9 | ) | $ | (1,457.3 | ) | ||||
Provided by financing activities | $ | 1,327.2 | $ | 166.2 | $ | 740.0 | $ | 130.7 | $ | 422.1 | |||||||||
52
ITEM 7. | MANAGEMENT’S DISCUSSION AND ANALYSIS OF FINANCIAL CONDITION AND RESULTS OF OPERATIONS |
This discussion includes forward-looking statements. Please refer to Cautionary Information about Forward-Looking Statements in Part I, Items 1 and 2 of this report for important information about these types of statements.
Overview of the Company
General Overview
We are an independent energy company engaged in the acquisition, exploration, development, and production of oil, gas, and NGLs in onshore North America. We currently have development positions in the Midland Basin, Eagle Ford shale, and Bakken/Three Forks resource plays. Our strategic objective is to become a premier operator of top tier assets. During 2016, we cored up our portfolio through several acquisitions in the Midland Basin where we expanded our footprint to approximately 82,550 net acres. We were able to accomplish this through the divestiture of non-core assets and through successful financing transactions. Our Midland Basin assets, as well as our operated Eagle Ford shale assets, have high operating margins and significant opportunities for additional economic investment. We seek to maximize the value of our assets through industry leading technology application and outstanding operational execution. Our portfolio is comprised of properties with prospective drilling opportunities and unconventional resource prospects, which we believe provide for long-term production and reserves growth. We focus on achieving high full-cycle economic returns on our investments and maintaining a simple, strong balance sheet.
Oil, Gas, and NGL Prices
Our financial condition and the results of our operations are significantly affected by the prices we receive for our oil, gas, and NGL production, which can fluctuate dramatically. We sell the majority of our gas under contracts using first-of-the-month index pricing, which means gas produced in a given month is sold at the first-of-the-month price regardless of the spot price on the day the gas is produced. For assets where high BTU gas is sold at the wellhead, we also receive additional value for the higher energy content contained in the gas stream. Our NGL production is generally sold using contracts paying us a monthly average of the posted OPIS daily settlement prices, adjusted for processing, transportation, and location differentials. Our oil is sold using the calendar month average of the NYMEX WTI daily contract settlement prices, excluding weekends, during the month of production, adjusted for quality, transportation, American Petroleum Institute (“API”) gravity, and location differentials. When we refer to realized oil, gas, and NGL prices below, the disclosed price represents the average price for the respective period, before the effects of derivative settlements, unless otherwise indicated.
53
The following table summarizes commodity price data, as well as the effects of derivative settlements as further discussed under the caption Derivative Activity below, for the years ended December 31, 2016, 2015, and 2014:
For the Years Ended December 31, | |||||||||||
2016 | 2015 | 2014 | |||||||||
Crude Oil (per Bbl): | |||||||||||
Average NYMEX contract monthly price | $ | 43.32 | $ | 48.68 | $ | 93.03 | |||||
Realized price, before the effect of derivative settlements | $ | 36.85 | $ | 41.49 | $ | 80.97 | |||||
Effect of oil derivative settlements | $ | 14.63 | $ | 18.85 | $ | 1.71 | |||||
Natural Gas: | |||||||||||
Average NYMEX monthly settle price (per MMBtu) | $ | 2.46 | $ | 2.61 | $ | 4.35 | |||||
Realized price, before the effect of derivative settlements (per Mcf) | $ | 2.30 | $ | 2.57 | $ | 4.58 | |||||
Effect of natural gas derivative settlements (per Mcf) (1) | $ | 0.64 | $ | 0.71 | $ | (0.18 | ) | ||||
NGLs (per Bbl): | |||||||||||
Average OPIS price (2) | $ | 19.98 | $ | 19.76 | $ | 38.93 | |||||
Realized price, before the effect of derivative settlements | $ | 16.16 | $ | 15.92 | $ | 33.34 | |||||
Effect of NGL derivative settlements | $ | (0.60 | ) | $ | 1.69 | $ | 0.84 | ||||
____________________________________________
(1) | Natural gas derivative settlements for the years ended December 31, 2015, and 2014, include $15.3 million and $5.6 million, respectively, of early settlements of futures contracts as a result of divesting assets in our Mid-Continent region. These early settlements increased the effect of derivative settlements by $0.09 per Mcf and $0.04 per Mcf for the years ended December 31, 2015, and 2014, respectively. |
(2) | Average OPIS prices per barrel of NGL, historical or strip, are based on a product mix of 37% Ethane, 32% Propane, 6% Isobutane, 11% Normal Butane, and 14% Natural Gasoline for all periods presented. This product mix represents the industry standard composite barrel and does not necessarily represent our product mix for NGL production. Realized prices reflect our actual product mix. |
While quoted NYMEX oil and gas and OPIS NGL prices are generally used as a basis for comparison within our industry, the prices we receive are affected by quality, energy content, location, and transportation differentials for these products.
We expect future prices for oil, gas, and NGLs to continue to be volatile. In addition to supply and demand fundamentals, as a global commodity, the price of oil is affected by real or perceived geopolitical risks in all regions of the world as well as the relative strength of the U.S. dollar compared to other currencies. Oil markets continue to be unstable as a result of over-supply with global demand remaining the biggest source of uncertainty for future prices. The recent increase in oil prices is primarily attributable to the Organization of Petroleum Exporting Countries (OPEC) and non-OPEC exporting countries agreeing to cut production in 2017, although there is still uncertainty as to whether these cuts will actually occur or be sustained. Drilling activity in the U.S. has increased in recent months putting continued downward pressure on oil prices in the near term.
Natural gas pricing increased during 2016, partially as a result of demand growth from gas fired power generation and both LNG exports and exports to Mexico exceeding prior expectations. We expect prices to remain near current levels in the near term as drilling rigs in operation have increased in recent months leading to increased supply, which we expect will be offset by continued demand growth from LNG exports and exports to Mexico. We also expect prices to fluctuate with changes in demand resulting from the weather.
NGL prices have recovered in recent months due to oil and natural gas price recovery. We expect NGL prices to remain near current levels through 2017, as increased demand from export and petrochemical markets is offset by increased drilling activity.
54
The following table summarizes 12-month strip prices for NYMEX WTI oil, NYMEX Henry Hub gas, and OPIS NGLs (same product mix as discussed under the table above) as of February 15, 2017, and December 31, 2016:
As of February 15, 2017 | As of December 31, 2016 | ||||||
NYMEX WTI oil (per Bbl) | $ | 54.53 | $ | 56.01 | |||
NYMEX Henry Hub gas (per MMBtu) | $ | 3.25 | $ | 3.63 | |||
OPIS NGLs (per Bbl) | $ | 27.39 | $ | 27.14 | |||
We use financial derivative instruments as part of our financial risk management program. We have a financial risk
management policy governing our use of derivatives. The amount of our production covered by derivatives is driven by the amount of debt on our balance sheet, the level of capital commitments and long-term obligations we have in place, and our ability to enter into favorable derivative commodity contracts. With our current derivative contracts, we believe we have partially reduced our exposure to volatility in commodity prices in the near term. Our use of costless collars for a portion of our derivatives allows us to participate in some of the upward movements in oil prices while also setting a price floor for a portion of our production. Please refer to Note 10 - Derivative Financial Instruments in Part II, Item 8 of this report and the caption titled Commodity Price Risk in Overview of Liquidity and Capital Resources below for additional information regarding our oil, gas, and NGL derivatives.
Due to the depressed commodity price environment in recent years, and our belief that commodity prices will remain near current levels, we cored up our portfolio in 2016 through various acquisitions and divestitures. As noted below, we expect additional divestitures in 2017, proceeds from which will partially fund the development of our recently acquired Midland Basin assets, as well as pay down debt should market conditions be favorable.
Costs Incurred in Oil and Gas Producing Activities. Costs incurred in oil and gas property acquisition, exploration and development activities, whether capitalized or expensed, are summarized as follows:
For the Year Ended | |||
December 31, 2016 | |||
(in millions) | |||
Development costs | $ | 595.3 | |
Exploration costs | 118.2 | ||
Acquisitions | |||
Proved properties | 201.7 | ||
Unproved properties | 2,458.7 | ||
Total, including asset retirement obligation (1) | $ | 3,373.9 | |
____________________________________________
(1) | Please refer to the section Costs Incurred in Oil and Gas Producing Activities in Supplemental Oil and Gas Information in Part II, Item 8 of this report. |
Outside of acquisition activity in the Permian region, our costs relating to exploration and development activities were incurred evenly across our core development programs in the Eagle Ford shale, Midland Basin, and Bakken/Three Forks for the year ended December 31, 2016.
Acquisition Activity:
• | On October 4, 2016, we closed our Rock Oil Acquisition in Howard County, Texas, for an adjusted purchase price of approximately $991.0 million, subject to customary post-closing adjustments. |
• | On December 21, 2016, we closed our QStar Acquisition in Howard and Martin Counties, Texas, for an adjusted purchase price of approximately $1.6 billion, subject to customary post-closing adjustments. |
These acquisitions significantly increased our footprint in the Midland Basin, with the acquired acreage having producing and prospective intervals in the Lower and Middle Spraberry and Wolfcamp A and B shale formations.
55
In order to fund our 2016 acquisition activity and a portion of the future development of acquired assets, we divested of assets in 2016, have additional divestitures in process, and executed certain financing transactions, as discussed below.
Divestiture Activity:
• | On December 1, 2016, we completed our Raven/Bear Den asset divestiture for net divestiture proceeds of $756.2 million, subject to customary post-closing adjustments, as discussed in Note 3 – Acquisitions, Divestitures, and Assets Held for Sale in Part II, Item 8 of this report. |
• | During the third quarter of 2016, we closed the divestitures of certain non-core properties in southeast New Mexico and in the Williston and Powder River Basins for total net divestiture proceeds of $165.2 million, subject to customary post-closing adjustments. |
• | We began marketing our outside-operated Eagle Ford shale assets during the third quarter of 2016. Subsequent to December 31, 2016, we executed a definitive sales agreement for a gross purchase price of $800 million, subject to customary purchase price adjustments, with the sale expected to close in the first quarter of 2017. |
• | Subsequent to December 31, 2016, we announced our plans to sell our remaining Williston Basin assets in Divide County, North Dakota. |
Please refer to Note 3 – Acquisitions, Divestitures, and Assets Held for Sale in Part II, Item 8 of this report for additional discussion.
Equity Offerings:
• | On August 12, 2016, we issued approximately 18.4 million shares of common stock in a public offering for net proceeds of $530.9 million. |
• | On December 7, 2016, we issued an additional approximately 10.9 million shares of common stock in a public offering for net proceeds of $403.2 million. |
• | On December 21, 2016, to partially fund the QStar Acquisition, we issued to the sellers approximately 13.4 million shares of common stock valued at $437.2 million. |
Please refer to Note 15 - Equity in Part II, Item 8 of this report for additional discussion.
Long-Term Debt:
• | Senior Convertible Notes. On August 12, 2016, we issued $172.5 million in aggregate principal amount of 1.50% Senior Convertible Notes due 2021 for net proceeds of $166.6 million. In conjunction with this issuance, we paid $24.2 million for capped call transactions, which are generally expected to reduce the potential dilution and/or partially offset any cash payments required upon conversion. |
• | 2026 Notes. On September 12, 2016, we issued $500.0 million in aggregate principal amount of 6.75% Senior Notes due 2026 and received net proceeds of $491.6 million. |
• | Repurchased Notes. During the first quarter of 2016, we repurchased a total of $46.3 million in aggregate principal amount of certain of our Senior Notes in open market transactions for a settlement amount of $29.9 million, excluding interest, which resulted in a net gain on extinguishment of debt of approximately $15.7 million. |
• | Credit Agreement. Our borrowing base and aggregate lender commitments changed throughout 2016 due to the normal redetermination process, amendments to the Credit Agreement, and significant transactions that occurred. As of December 31, 2016, our borrowing base and aggregate lender commitments under the Credit Agreement were $1.17 billion. |
Please refer to Overview of Liquidity and Capital Resources below and Note 5 - Long-Term Debt in Part II, Item 8 of this report for additional discussion.
56
2016 Operational Activity and Financial Results
Operational Activities. During 2016, we focused on coring up our portfolio to high-grade assets and build long-term inventory. Please refer to the table below summarizing our operated drilling and completion activities for the year ended December 31, 2016. We incurred capital expenditures, excluding asset acquisitions, below adjusted EBITDAX in 2016.
In our Midland Basin program, we began operating one drilling rig in early 2016 and added a second drilling rig in the second quarter of 2016, both focused on developing the Wolfcamp and Spraberry shale intervals on our Sweetie Peck property in Upton County, Texas. We closed our Rock Oil and QStar acquisitions during the fourth quarter of 2016 and added two operated rigs on the acquired acreage. During the third quarter of 2016, we sold our non-core assets in southeast New Mexico.
In our operated Eagle Ford shale program, we began 2016 operating three drilling rigs and released all three rigs during the year. In addition, we utilized one frac crew through the third quarter of 2016. In 2016, our capital was primarily spent on wells that were drilled but not completed at year-end 2015 and to meet lease obligations.
In our outside-operated Eagle Ford shale program, the operator began 2016 running one drilling rig, which was released in the first quarter of 2016 with no further drilling activity for the remainder of the year. The operator completed 69 gross (11 net) wells during 2016, all of which were completed prior to mid-year. Our outside-operated Eagle Ford shale assets, including the associated midstream assets, were held for sale as of December 31, 2016, with the sale expected to close in the first quarter of 2017. Please refer to Note 3 – Acquisitions, Divestitures, and Assets Held for Sale in Part II, Item 8 of this report for additional information.
In our Bakken/Three Forks program, we started the year operating two drilling rigs. We released one drilling rig during the second quarter of 2016 and ran the second rig through November 2016. During the third quarter of 2016, we sold non-core Williston Basin assets, and on December 1, 2016, we completed the divestiture of our Raven/Bear Den assets. Subsequent to December 31, 2016, we announced our plans to sell our remaining Williston Basin assets in Divide County, North Dakota with closing expected by mid-year 2017.
In our Powder River Basin program, we began 2016 operating one drilling rig and released the rig during the first quarter. We added a drilling rig during the third quarter of 2016 for activities under an acquisition and development funding agreement with a third party, under which our costs to drill and complete a specified number of initial wells are being carried by the third party.
The table below provides a summary of changes in our drilled but not completed well count and current year drilling and completion activity in our operated programs during the year ended December 31, 2016.
Eagle Ford Shale | Midland Basin | Bakken/Three Forks | Total | ||||||||||||||||||||
Gross | Net | Gross | Net | Gross | Net | Gross | Net | ||||||||||||||||
Wells drilled but not completed at December 31, 2015 | 76 | 76 | 9 | 9 | 47 | 39 | 132 | 124 | |||||||||||||||
Wells drilled | 16 | 16 | 27 | 25 | 24 | 23 | 67 | 64 | |||||||||||||||
Wells acquired (1) | — | — | 11 | 11 | — | — | 11 | 11 | |||||||||||||||
Wells completed (2) | (45 | ) | (45 | ) | (30 | ) | (28 | ) | (51 | ) | (45 | ) | (126 | ) | (118 | ) | |||||||
Wells drilled but not completed at December 31, 2016 (3) | 47 | 47 | 17 | 17 | 20 | 17 | 84 | 81 | |||||||||||||||
_________________________________________
(1) | Represents in-progress wells acquired in the Rock Oil and QStar acquisitions. In all cases, the sellers initiated the drilling of the well. Of these acquired in-progress wells, we completed six gross and net wells after the closing dates and before year-end 2016. |
(2) | Of the wells we completed in 2016, 11 gross (eight net) wells were divested in the fourth quarter of 2016. |
(3) | Subsequent to December 31, 2016, we announced plans to sell our remaining Bakken/Three Forks assets in Divide County, North Dakota. |
57
Production Results. The table below provides a regional breakdown of our production for 2016:
____________________________________________
South Texas & Gulf Coast | Permian | Rocky Mountain | Total (1) | ||||||||
Production: | |||||||||||
Oil (MMBbl) | 5.5 | 2.7 | 8.3 | 16.6 | |||||||
Gas (Bcf) | 130.9 | 6.0 | 10.0 | 146.9 | |||||||
NGLs (MMBbl) | 13.9 | — | 0.3 | 14.2 | |||||||
Equivalent (MMBOE) (1) | 41.2 | 3.8 | 10.3 | 55.3 | |||||||
Avg. Daily Equivalents (MBOE/d) | 112.6 | 10.2 | 28.2 | 151.0 | |||||||
Relative percentage | 74 | % | 7 | % | 19 | % | 100 | % | |||
(1) | Amounts may not calculate due to rounding. |
Production decreased for the year ended December 31, 2016, compared with the same period in 2015, driven by the reduction in our drilling and completion activity and the divestitures of properties in our Rocky Mountain and Permian regions in the last half of 2016, as well as the impact of the sale of our Mid-Continent properties in the second quarter of 2015. Please refer to the table above for a summary of wells drilled, acquired, and completed in our operated programs during the year ended December 31, 2016.
Please refer to Comparison of Financial Results and Trends Between 2016 and 2015 and Between 2015 and 2014 and A Year-to-Year Overview of Selected Production and Financial Information, Including Trends below for additional discussion on production.
Financial Results for 2016
• | We recorded a net loss of $757.7 million, or $9.90 per diluted share, for the year ended December 31, 2016. This compares with a net loss of $447.7 million, or $6.61 per diluted share, for the year ended December 31, 2015. The net loss in 2016 was driven largely by decreased production revenue due to sustained low commodity prices, discussed in detail above and a decrease in the fair value of commodity derivative contracts. Additionally, we recorded proved and unproved property impairments of $354.6 million and $80.4 million, respectively, for the year ended December 31, 2016. These impairments were largely due to the continued decline in commodity prices in early 2016 impacting our outside-operated Eagle Ford shale assets and negative reserve performance revisions on our Powder River Basin assets at year-end 2016. Please refer to the caption Comparison of Financial Results and Trends Between 2016 and 2015 and Between 2015 and 2014 below for additional discussion regarding the components of net income (loss). |
• | At year-end 2016, we had estimated proved reserves of 395.8 MMBOE, of which 53 percent were liquids (oil and NGLs) and 53 percent were characterized as proved developed. During 2016, we added 108.2 MMBOE through our drilling program and acquired 15.5 MMBOE, as discussed above. We divested of 47.7 MMBOE of proved reserves and had negative revisions totaling 96.2 MMBOE, consisting of a negative 18.1 MMBOE performance revision, a negative 35.1 MMBOE price revision due to the decline in commodity prices in 2016, and 43.0 MMBOE of proved undeveloped reserves removed due to the five-year rule. Our proved reserve life index decreased slightly to 7.2 years in 2016. Please refer to Reserves included in Part I, Items 1 and 2 of this report for additional discussion. |
• | The standardized measure of discounted future net cash flows was $1.2 billion as of December 31, 2016, compared with $1.8 billion as of December 31, 2015. Please refer to the Supplemental Oil and Gas Information section located in Part II, Item 8 of this report. |
• | We had net cash provided by operating activities of $552.8 million for the year ended December 31, 2016, compared with $978.4 million for the year ended December 31, 2015, which was a decrease of 43 percent year-over-year. Please refer to Analysis of Cash Flow Changes Between 2016 and 2015 and Between 2015 and 2014 below for additional discussion. |
58
• | Adjusted EBITDAX, a non-GAAP financial measure, for the year ended December 31, 2016, was $790.8 million, compared with $1.1 billion for the same period in 2015. Please refer to Non-GAAP Financial Measures below for additional discussion, including our definition of adjusted EBITDAX and a reconciliation of our net income (loss) and net cash provided by operating activities to adjusted EBITDAX. |
Outlook for 2017
Our priorities for 2017 are to:
• | demonstrate the value of our 2016 acquisitions in the Midland Basin; |
• | generate high margin production growth from our operated acreage positions in the Midland Basin and Eagle Ford shale; |
• | successfully execute the sale of our outside-operated Eagle Ford shale and Divide County assets; and |
• | reduce our outstanding debt. |
Our capital program for 2017, excluding acquisitions, is expected to be approximately $875 million. By concentrating our capital on the highest return programs and operating at strong performance levels, we believe we will generate higher company-wide margins, cash flow growth, and value creation for our stockholders going forward.
In our Midland Basin program, we entered 2017 operating four drilling rigs and plan to increase to six drilling rigs in early 2017 and continue with six drilling rigs in operation through the year. In 2017, our focus will be on developing the Wolfcamp and Spraberry shale intervals on our Sweetie Peck property in Upton County, Texas, as well as delineating and developing the Lower and Middle Spraberry and Wolfcamp A and B shale intervals on our recently acquired acreage in Howard and Martin Counties, Texas. Subsequent to December 31, 2016, we acquired approximately 2,900 additional net acres in Howard County, Texas for approximately $60.0 million.
In our operated Eagle Ford shale program, we began operating a drilling rig in February 2017, and plan to run a one to two rig program throughout 2017. We will remain focused on reducing our drilled but not completed well count and meeting lease obligations.
We expect the sale of our outside-operated Eagle Ford shale assets, including our ownership interest in related midstream assets, to close in the first quarter of 2017 under the executed definitive agreement for a gross purchase price of $800 million, subject to customary closing adjustments.
Subsequent to December 31, 2016, we announced our plans to sell our remaining Bakken/Three Forks assets in Divide County, North Dakota. We expect this sale to be completed by mid-2017.
In our Powder River Basin program, we intend to continue running one drilling rig in 2017 under an acquisition and development funding agreement with a third party, in which the third party is carrying our drilling and completion costs, as discussed above.
Please refer to Overview of Liquidity and Capital Resources below for additional discussion on how we expect to fund our 2017 capital program.
59
Financial Results of Operations and Additional Comparative Data
The tables below provide information regarding selected production and financial information for the quarter ended December 31, 2016, and the immediately preceding three quarters. A detailed discussion follows.
For the Three Months Ended | |||||||||||||||
December 31, | September 30, | June 30, | March 31, | ||||||||||||
2016 | 2016 | 2016 | 2016 | ||||||||||||
(in millions, except for production data) | |||||||||||||||
Production (MMBOE) | 13.4 | 14.2 | 14.3 | 13.4 | |||||||||||
Oil, gas, and NGL production revenue | $ | 346.3 | $ | 329.2 | $ | 291.1 | $ | 211.8 | |||||||
Oil, gas, and NGL production expense | $ | 151.9 | $ | 152.5 | $ | 148.6 | $ | 144.5 | |||||||
Depletion, depreciation, amortization, and asset retirement obligation liability accretion | $ | 171.6 | $ | 194.0 | $ | 211.0 | $ | 214.2 | |||||||
Exploration | $ | 23.7 | $ | 13.5 | $ | 13.2 | $ | 15.3 | |||||||
General and administrative | $ | 33.3 | $ | 32.7 | $ | 28.2 | $ | 32.2 | |||||||
Net income (loss) | $ | (200.9 | ) | $ | (40.9 | ) | $ | (168.7 | ) | $ | (347.2 | ) | |||
____________________________________________
Note: Amounts may not calculate due to rounding.
Selected Performance Metrics:
For the Three Months Ended | |||||||||||||||
December 31, | September 30, | June 30, | March 31, | ||||||||||||
2016 | 2016 | 2016 | 2016 | ||||||||||||
Average net daily production equivalent (MBOE per day) | 145.6 | 153.9 | 157.2 | 147.5 | |||||||||||
Lease operating expense (per BOE) | $ | 3.67 | $ | 3.29 | $ | 3.31 | $ | 3.79 | |||||||
Transportation costs (per BOE) | $ | 6.39 | $ | 6.24 | $ | 5.95 | $ | 6.06 | |||||||
Production taxes as a percent of oil, gas, and NGL production revenue | 4.3 | % | 4.5 | % | 4.6 | % | 4.2 | % | |||||||
Ad valorem tax expense (per BOE) | $ | 0.17 | $ | 0.21 | $ | 0.19 | $ | 0.27 | |||||||
Depletion, depreciation, amortization, and asset retirement obligation liability accretion (per BOE) | $ | 12.81 | $ | 13.70 | $ | 14.75 | $ | 15.96 | |||||||
General and administrative (per BOE) | $ | 2.49 | $ | 2.31 | $ | 1.97 | $ | 2.40 | |||||||
____________________________________________
Note: Amounts may not calculate due to rounding.
60
A Year-to-Year Overview of Selected Production and Financial Information, Including Trends:
For the Years Ended December 31, | Amount Change Between | Percent Change Between | |||||||||||||||||||||||||
2016 | 2015 | 2014 | 2016/2015 | 2015/2014 | 2016/2015 | 2015/2014 | |||||||||||||||||||||
Net production volumes (1) | |||||||||||||||||||||||||||
Oil (MMBbl) | 16.6 | 19.2 | 16.7 | (2.6 | ) | 2.6 | (14 | )% | 15 | % | |||||||||||||||||
Gas (Bcf) | 146.9 | 173.6 | 152.9 | (26.7 | ) | 20.7 | (15 | )% | 14 | % | |||||||||||||||||
NGLs (MMBbl) | 14.2 | 16.1 | 13.0 | (1.9 | ) | 3.1 | (12 | )% | 24 | % | |||||||||||||||||
Equivalent (MMBOE) | 55.3 | 64.2 | 55.1 | (8.9 | ) | 9.1 | (14 | )% | 16 | % | |||||||||||||||||
Average net daily production (1) | |||||||||||||||||||||||||||
Oil (MBbl per day) | 45.4 | 52.7 | 45.6 | (7.3 | ) | 7.0 | (14 | )% | 15 | % | |||||||||||||||||
Gas (MMcf per day) | 401.5 | 475.7 | 419.0 | (74.2 | ) | 56.7 | (16 | )% | 14 | % | |||||||||||||||||
NGLs (MBbl per day) | 38.8 | 44.0 | 35.6 | (5.2 | ) | 8.4 | (12 | )% | 24 | % | |||||||||||||||||
Equivalent (MBOE per day) | 151.0 | 175.9 | 151.1 | (24.9 | ) | 24.9 | (14 | )% | 16 | % | |||||||||||||||||
Oil, gas, and NGL production revenue (in millions) | |||||||||||||||||||||||||||
Oil production revenue | $ | 611.8 | $ | 797.3 | $ | 1,348.3 | $ | (185.5 | ) | $ | (551.0 | ) | (23 | )% | (41 | )% | |||||||||||
Gas production revenue | 337.3 | 447.0 | 699.8 | (109.7 | ) | (252.8 | ) | (25 | )% | (36 | )% | ||||||||||||||||
NGL production revenue | 229.3 | 255.6 | 433.4 | (26.3 | ) | (177.8 | ) | (10 | )% | (41 | )% | ||||||||||||||||
Total | $ | 1,178.4 | $ | 1,499.9 | $ | 2,481.5 | $ | (321.5 | ) | $ | (981.6 | ) | (21 | )% | (40 | )% | |||||||||||
Oil, gas, and NGL production expense (in millions) | |||||||||||||||||||||||||||
Lease operating expense | $ | 194.0 | $ | 239.6 | $ | 235.8 | $ | (45.6 | ) | $ | 3.8 | (19 | )% | 2 | % | ||||||||||||
Transportation costs | 340.3 | 386.6 | 337.1 | (46.3 | ) | 49.5 | (12 | )% | 15 | % | |||||||||||||||||
Production taxes | 51.9 | 72.4 | 117.2 | (20.5 | ) | (44.8 | ) | (28 | )% | (38 | )% | ||||||||||||||||
Ad valorem tax expense | 11.4 | 25.0 | 25.8 | (13.6 | ) | (0.8 | ) | (54 | )% | (3 | )% | ||||||||||||||||
Total | $ | 597.6 | $ | 723.6 | $ | 715.9 | $ | (126.0 | ) | $ | 7.7 | (17 | )% | 1 | % | ||||||||||||
Realized price, before the effect of derivative settlements | |||||||||||||||||||||||||||
Oil (per Bbl) | $ | 36.85 | $ | 41.49 | $ | 80.97 | $ | (4.64 | ) | $ | (39.48 | ) | (11 | )% | (49 | )% | |||||||||||
Gas (per Mcf) | $ | 2.30 | $ | 2.57 | $ | 4.58 | $ | (0.27 | ) | $ | (2.01 | ) | (11 | )% | (44 | )% | |||||||||||
NGLs (per Bbl) | $ | 16.16 | $ | 15.92 | $ | 33.34 | $ | 0.24 | $ | (17.42 | ) | 2 | % | (52 | )% | ||||||||||||
Per BOE | $ | 21.32 | $ | 23.36 | $ | 45.01 | $ | (2.04 | ) | $ | (21.65 | ) | (9 | )% | (48 | )% | |||||||||||
Per BOE data (1) | |||||||||||||||||||||||||||
Production costs: | |||||||||||||||||||||||||||
Lease operating expense | $ | 3.51 | $ | 3.73 | $ | 4.28 | $ | (0.22 | ) | $ | (0.55 | ) | (6 | )% | (13 | )% | |||||||||||
Transportation costs | $ | 6.16 | $ | 6.02 | $ | 6.11 | $ | 0.14 | $ | (0.09 | ) | 2 | % | (1 | )% | ||||||||||||
Production taxes | $ | 0.94 | $ | 1.13 | $ | 2.13 | $ | (0.19 | ) | $ | (1.00 | ) | (17 | )% | (47 | )% | |||||||||||
Ad valorem tax expense | $ | 0.21 | $ | 0.39 | $ | 0.46 | $ | (0.18 | ) | $ | (0.07 | ) | (46 | )% | (15 | )% | |||||||||||
General and administrative | $ | 2.29 | $ | 2.46 | $ | 3.03 | $ | (0.17 | ) | $ | (0.57 | ) | (7 | )% | (19 | )% | |||||||||||
Depletion, depreciation, amortization, and asset retirement obligation liability accretion | $ | 14.30 | $ | 14.34 | $ | 13.92 | $ | (0.04 | ) | $ | 0.42 | — | % | 3 | % | ||||||||||||
Derivative settlement gain (2) | $ | 5.96 | $ | 7.98 | $ | 0.22 | $ | (2.02 | ) | $ | 7.76 | (25 | )% | 3,527 | % | ||||||||||||
Earnings per share information | |||||||||||||||||||||||||||
Basic net income (loss) per common share | $ | (9.90 | ) | $ | (6.61 | ) | $ | 9.91 | $ | (3.29 | ) | $ | (16.52 | ) | 50 | % | (167 | )% | |||||||||
Diluted net income (loss) per common share | $ | (9.90 | ) | $ | (6.61 | ) | $ | 9.79 | $ | (3.29 | ) | $ | (16.40 | ) | 50 | % | (168 | )% | |||||||||
Basic weighted-average common shares outstanding (in thousands) | 76,568 | 67,723 | 67,230 | 8,845 | 493 | 13 | % | 1 | % | ||||||||||||||||||
Diluted weighted-average common shares outstanding (in thousands) | 76,568 | 67,723 | 68,044 | 8,845 | (321 | ) | 13 | % | — | % | |||||||||||||||||
61
____________________________________________
(1) | Amounts and percentage changes may not calculate due to rounding. |
(2) | Natural gas derivative settlements for the years ended December 31, 2015, and 2014, include $15.3 million and $5.6 million, respectively, of early settlements of futures contracts as a result of divesting assets in our Mid-Continent region. These early settlements increased the effect of derivative settlements by $0.24 and $0.10 per BOE for the years ended December 31, 2015, and 2014, respectively. |
We present per BOE information because we use this information to evaluate our performance relative to our peers and to identify and measure trends we believe may require additional analysis. Average net daily production for the year ended December 31, 2016, decreased 14 percent compared with the same period in 2015, driven by our reduced drilling and completion activity and the divestiture of assets. Overall, we expect 2017 total net production to decrease compared with 2016 due to the impact of closed and anticipated divestitures, which will be partially offset by the increase in development activity in our Midland Basin program. Our average net daily production for assets sold and assets expected to be sold by mid-2017, specifically our outside-operated Eagle Ford shale and Divide County assets, was approximately 52.6 MBOE per day during 2016. Please refer to Comparison of Financial Results and Trends Between 2016 and 2015 and Between 2015 and 2014 below for additional discussion.
Changes in production volumes, revenues, and costs reflect the highly volatile nature of our industry. Our realized price on a per BOE basis for the year ended December 31, 2016, decreased nine percent compared with 2015 as a result of declines in commodity prices in the first half of 2016. Our derivative contracts resulted in a $5.96 settlement gain on a per BOE basis for the year ended December 31, 2016, which decreased 25 percent compared with 2015 settlements.
Lease operating expense (“LOE”) on a per BOE basis for the year ended December 31, 2016, decreased six percent compared with the same period in 2015 due to lower service provider costs and reduced workover activity. We experience volatility in our LOE as a result of the impact industry activity has on service provider costs and seasonality in workover expense. Throughout 2015 and into 2016, industry activity decreased in light of the low commodity price environment resulting in service providers lowering costs. For 2017, we expect LOE on a per BOE basis to be relatively flat compared with 2016. We expect that any increase in service provider costs resulting from increased development activity in the Midland Basin will be offset by the executed and planned divestitures of our higher cost Williston Basin properties.
Transportation costs on a per BOE basis for the year ended December 31, 2016, remained relatively flat compared with the same period in 2015. We expect transportation costs on a per BOE basis to decrease in 2017 upon selling our outside-operated Eagle Ford shale assets in the early part of the year and our Midland Basin assets becoming a larger portion of our production mix. The majority of our Midland Basin production is sold at the wellhead under current contracts, and therefore, there is minimal transportation expense separately recorded on the accompanying statements of operations.
Production taxes on a per BOE basis for the year ended December 31, 2016, decreased 17 percent compared with the same period in 2015 driven by the decrease in production revenues, as well as a decrease in our company-wide production tax rate. Our production tax rate for the years ended December 31, 2016, and 2015, was 4.4 percent and 4.8 percent, respectively. We generally expect production tax expense to trend with oil, gas, and NGL production revenue on an absolute and per BOE basis. Product mix, the location of production, and incentives to encourage oil and gas development can all impact the amount of production tax we recognize. For 2017, we generally expect our production tax rate to decrease year-over-year as a result of our closed and anticipated divestitures; however, we expect an increase in production taxes on a per BOE basis in line with improved commodity prices.
Ad valorem tax expense on a per BOE basis for the year ended December 31, 2016, decreased 46 percent compared with the same period in 2015 due to the lower valuation of properties subject to ad valorem taxes in 2016 as a result of declining commodity prices. We expect ad valorem tax expense on a per BOE basis to increase in 2017 as a result of changes in our asset and production base year-over-year. The majority of our ad valorem tax expense is related to our Texas properties. Since we have acquired producing properties in Texas and divested properties in our Rocky Mountain region, we expect ad valorem tax expense on an absolute and per BOE basis to increase in 2017. Additionally, we expect an increase in commodity price assumptions used in 2017 property tax valuations.
General and administrative (“G&A”) expense decreased seven percent on a per BOE basis for the year ended December 31, 2016, compared with the same period in 2015 as our absolute G&A expense decreased at a faster rate than the decrease in production volumes. The 20 percent decrease in absolute G&A expense is due largely to lower
62
headcount in 2016. We closed our Tulsa, Oklahoma regional office upon selling our Mid-Continent assets in the second quarter of 2015, conducted a company-wide workforce reduction in the third quarter of 2016, and closed our Billings, Montana regional office in the fourth quarter of 2016. These events resulted in a reduction in headcount; however, we incurred $5.1 million and $9.3 million in related exit and disposal costs for the years ended December 31, 2016, and 2015, respectively. We expect G&A expense on an absolute basis to remain relatively flat in 2017 compared with 2016 due to reduced headcount in 2016 being offset by headcount changes resulting from recent and anticipated acquisition and divestiture activity and an expected increase in base and short-term incentive compensation. However, we expect an overall increase in G&A expense on a per BOE basis in 2017 due to a decrease in production volumes.
Depletion, depreciation, amortization, and asset retirement obligation liability accretion (“DD&A”) expense remained flat on a per BOE basis for the year ended December 31, 2016, compared with the same period in 2015. Our DD&A rate fluctuates as a result of impairments, planned and closed divestitures, and changes in the mix of our production and the underlying proved reserve volumes. In the beginning of 2016, our DD&A rate was higher as a result of the decrease in our proved reserve volumes at December 31, 2015. This increase was offset by the impact of assets held for sale throughout the year, as these assets were not depleted while classified as held for sale. In general, we expect DD&A expense on a per BOE basis to decrease in 2017 due to selling our higher cost Raven/Bear Den assets in late 2016 and our Divide County assets being classified as held for sale in the first quarter of 2017 with no recorded DD&A expense until the sale is finalized (assuming a definitive agreement is executed and all customary closing conditions are met). Please refer to Comparison of Financial Results and Trends Between 2016 and 2015 and Between 2015 and 2014 for additional discussion.
Please refer to the section Earnings per Share in Note 1 - Summary of Significant Accounting Policies in Part II, Item 8 of this report for additional discussion on the types of shares included in our basic and diluted net income (loss) per common share calculations. Our basic and diluted weighted-average share count has increased in 2016 compared with 2015 due to the public and private equity offerings of our common stock made in the last half of 2016. We recorded a net loss for the years ended December 31, 2016, and 2015. Consequently, our unvested RSUs and contingent PSUs were anti-dilutive for the years ended December 31, 2016, and 2015.
Comparison of Financial Results and Trends Between 2016 and 2015 and Between 2015 and 2014
Oil, Gas, and NGL production
The following table presents the regional changes in our oil, gas, and NGL production, production revenues, and production costs between the years ended December 31, 2016, and 2015:
Average Net Daily Production Increase (Decrease) | Production Revenue Increase (Decrease) | Production Costs Decrease | ||||||||
(MBOE/d) | (in millions) | (in millions) | ||||||||
South Texas & Gulf Coast | (20.3 | ) | $ | (240.8 | ) | $ | (93.6 | ) | ||
Rocky Mountain | (2.9 | ) | (90.7 | ) | (19.6 | ) | ||||
Permian | 2.9 | 35.9 | (0.6 | ) | ||||||
Mid-Continent (1) | (4.6 | ) | (25.9 | ) | (12.2 | ) | ||||
Total | (24.9 | ) | $ | (321.5 | ) | $ | (126.0 | ) | ||
(1) | We divested our Mid-Continent assets in the second quarter of 2015. |
We experienced a 14 percent decrease in equivalent production volumes in 2016 from 2015 due to a reduction in our drilling and completion activity and assets divested in both years. Additionally, our realized price on a per BOE basis decreased nine percent in 2016 from 2015. Both of these factors resulted in a 21 percent decrease in oil, gas, and NGL production revenue between the two periods. Please refer to A Year-to-Year Overview of Selected Production and Financial Information, Including Trends above for discussion of the expected downward trend in production in 2017 due to assets sold in 2016 and expected to be sold in 2017. Please refer to the caption Oil, gas, and NGL production expense below for discussion of the reasons for the decrease in total production costs in 2016 compared with 2015.
63
The following table presents the regional changes in our oil, gas, and NGL production, production revenues, and production costs between the years ended December 31, 2015, and 2014:
Average Net Daily Production Increase (Decrease) | Production Revenue Decrease | Production Costs Increase (Decrease) | ||||||||
(MBOE/d) | (in millions) | (in millions) | ||||||||
South Texas & Gulf Coast | 22.8 | $ | (587.8 | ) | $ | 54.0 | ||||
Rocky Mountain | 7.2 | (230.5 | ) | (8.2 | ) | |||||
Permian | (0.2 | ) | (98.8 | ) | (16.6 | ) | ||||
Mid-Continent (1) | (4.9 | ) | (64.5 | ) | (21.5 | ) | ||||
Total | 24.9 | $ | (981.6 | ) | $ | 7.7 | ||||
(1) | We divested our Mid-Continent assets in the second quarter of 2015. |
We experienced a 16 percent increase in equivalent production volumes in 2015 from 2014 despite selling our Mid-Continent assets in the second quarter of 2015. This increase was primarily driven by continued development in our Eagle Ford shale and Bakken/Three Forks programs. However, oil, gas, and NGL production revenue between the two periods decreased 40 percent due to a 48 percent decrease in realized price on a per BOE basis. Please refer to the caption Oil, gas, and NGL production expense below for discussion on the reasons for the change in production costs in 2015 from 2014.
Please refer to A Year-to-Year Overview of Selected Production and Financial Information, Including Trends above for realized prices received before the effects of derivative settlements for the years ended December 31, 2016, 2015, and 2014, and discussion of trends on a per BOE basis.
Net gain on divestiture activity
For the Years Ended December 31, | |||||||||||
2016 | 2015 | 2014 | |||||||||
(in millions) | |||||||||||
Net gain on divestiture activity | $ | 37.1 | $ | 43.0 | $ | 0.6 | |||||
The net gain on divestiture activity recorded for the year ended December 31, 2016, is primarily a result of the approximate $29.5 million net gain recorded on our Raven/Bear Den assets sold in the fourth quarter of 2016, as well as a $6.3 million total net gain recorded on the non-core Williston Basin, Powder River Basin, and southeast New Mexico asset divestitures in the third quarter of 2016. Certain of these sold assets were written down in the first quarter of 2016 and subsequently written up in the second quarter of 2016 based on changes in the estimated fair value less costs to sell. Subsequent to December 31, 2016, we announced our plan to sell our remaining Williston Basin assets in Divide County, North Dakota. Please refer to Critical Accounting Policies and Estimates below for additional discussion regarding the expected write-down to be recorded in the first quarter of 2017 upon these assets being classified as held for sale.
The net gain on divestiture activity recorded for the year ended December 31, 2015, is due to the $108.4 million net gain recorded on the sale of our Mid-Continent assets in the second quarter, partially offset by losses on certain other non-core assets sold during 2015.
The minimal net gain on divestiture activity recorded for the year ended December 31, 2014, is due to the $26.9 million gain recorded on the sale of non-core Williston Basin properties during the second quarter of 2014, which was mostly offset by write-downs to fair value recorded on other unrelated assets held for sale.
Please refer to Note 3 – Acquisitions, Divestitures, and Assets Held for Sale in Part II, Item 8 of this report for additional discussion.
64
Marketed gas system revenue and expense
For the Years Ended December 31, | |||||||||||
2016 | 2015 | 2014 | |||||||||
(in millions) | |||||||||||
Marketed gas system revenue | $ | — | $ | 9.5 | $ | 24.9 | |||||
Marketed gas system expense | $ | — | $ | 13.9 | $ | 24.5 | |||||
There was no marketed gas system revenue or expense in 2016, and there was a decrease in marketed gas system revenue and expense in 2015 from 2014, due to the sale of our Mid-Continent gas assets in the second quarter of 2015, which eliminated all marketing activities for gas produced by third parties.
Other operating revenues
For the Years Ended December 31, | |||||||||||
2016 | 2015 | 2014 | |||||||||
(in millions) | |||||||||||
Other operating revenues | $ | 2.0 | $ | 4.5 | $ | 15.2 | |||||
There were no material other operating revenues recorded for the years ended December 31, 2016, or 2015.
Other operating revenues for the year ended December 31, 2014, included a $10.7 million gain related to our settlement with Endeavour Operating Corporation (“Endeavour”), in which we, our working interest partners, and Endeavour agreed to mutually release all claims and dismiss certain litigation in exchange for certain cash payments and other consideration from Endeavour.
Oil, gas, and NGL production expense
For the Years Ended December 31, | |||||||||||
2016 | 2015 | 2014 | |||||||||
(in millions) | |||||||||||
Oil, gas, and NGL production expense | $ | 597.6 | $ | 723.6 | $ | 715.9 | |||||
Total production costs for the year ended December 31, 2016, decreased $126.0 million, or 17 percent, from the same period in 2015, primarily due to a 14 percent decrease in net equivalent production volumes, continued declines in service provider costs, and a decrease in production taxes due to lower commodity prices. Please refer to the caption A Year-to-Year Overview of Selected Production and Financial Information, Including Trends above for discussion of production costs on a per BOE basis.
Total production costs for the year ended December 31, 2015, slightly increased compared with the same period in 2014 due to a 16 percent increase in net equivalent production volumes and a 15 percent increase in transportation expense resulting from the continued development of our Eagle Ford shale program, largely offset by lower service provider costs and a decrease in production taxes due to lower commodity prices.
Depletion, depreciation, amortization, and asset retirement obligation liability accretion
For the Years Ended December 31, | |||||||||||
2016 | 2015 | 2014 | |||||||||
(in millions) | |||||||||||
Depletion, depreciation, amortization, and asset retirement obligation liability accretion | $ | 790.7 | $ | 921.0 | $ | 767.5 | |||||
65
DD&A expense for the year ended December 31, 2016, decreased 14 percent compared with the same period in 2015 due to a 14 percent decrease in production volumes, and the impact of assets sold or classified as held for sale throughout 2016 since no DD&A expense is recorded after the point the assets were classified as held for sale. The impact from assets divested and held for sale was mostly offset by a higher DD&A rate in the beginning year due to a reduction in our proved reserves at December 31, 2015. Please refer to the caption A Year-to-Year Overview of Selected Production and Financial Information, Including Trends above for discussion of DD&A expense on a per BOE basis.
DD&A expense for the year ended December 31, 2015, increased 20 percent compared with the same period in 2014 due to an increase in production volumes and a higher DD&A rate in 2015, partially offset by our Mid-Continent assets held for sale in the beginning of 2015 and sold in the second quarter of 2015.
Exploration
For the Years Ended December 31, | |||||||||||
2016 | 2015 | 2014 | |||||||||
(in millions) | |||||||||||
Geological and geophysical expenses | $ | 11.0 | $ | 7.5 | $ | 11.4 | |||||
Exploratory dry hole | — | 36.6 | 44.4 | ||||||||
Overhead and other expenses | 54.6 | 76.5 | 74.1 | ||||||||
Total | $ | 65.6 | $ | 120.6 | $ | 129.9 | |||||
Exploration expense for the year ended December 31, 2016, decreased 46 percent compared with 2015 primarily due to exploratory dry holes being expensed in 2015 (described in the next paragraph) with none recorded in 2016, as well as reduced overhead costs as a result of reduced exploration activity in 2016. These decreases were partially offset by expenses incurred for a seismic study performed on our recently acquired Midland Basin acreage in the fourth quarter of 2016. An exploratory project resulting in non-commercial quantities of oil, gas, or NGLs is deemed an exploratory dry hole and impacts the amount of exploration expense we record. In 2017, we expect to focus on testing and delineating our acquired Midland Basin acreage, and as a result, expect increased exploration activity and related expenses compared with 2016.
Exploration expense for the year ended December 31, 2015, decreased seven percent compared with 2014 mainly due to decreases in exploratory dry hole expense and geological and geophysical costs (“G&G”) expenses in 2015. During 2015, we expensed one exploratory dry hole in our Rocky Mountain region and three lower cost non-Eagle Ford exploratory dry holes in our South Texas & Gulf Coast region, compared to three higher cost exploratory non-Eagle Ford dry holes expensed in our South Texas & Gulf Coast region in 2014. During the first quarter of 2014, we performed a seismic study in our Powder River Basin program, which resulted in higher G&G expenses in 2014 compared with 2015.
Impairment of proved properties and Abandonment and impairment of unproved properties
For the Years Ended December 31, | |||||||||||
2016 | 2015 | 2014 | |||||||||
(in millions) | |||||||||||
Impairment of proved properties | $ | 354.6 | $ | 468.7 | $ | 84.5 | |||||
Abandonment and impairment of unproved properties | $ | 80.4 | $ | 78.6 | $ | 75.6 | |||||
The majority of our proved property impairment expense for the year ended December 31, 2016, was recorded in the first quarter of 2016 in our outside-operated Eagle Ford shale program as a result of continued commodity price declines. In the fourth quarter of 2016, we recorded proved and unproved property impairment expense on our Powder River Basin assets as a result of negative performance reserve revisions at year-end 2016 and lower market prices on recent third-party acreage transactions. Additionally, we allowed certain leases to expire throughout the year ended December 31, 2016. We expect proved property impairments to be more likely to occur in periods of declining or depressed commodity prices, and unproved property impairments to fluctuate with the timing of lease expirations, unsuccessful exploration activities, and changing economics associated with volatile commodity prices. Additionally, changes in drilling plans, downward engineering revisions, or unsuccessful exploration efforts may result in proved and unproved property impairments. Any amount of future impairment is difficult to predict, but based on updated commodity price assumptions as of February 15, 2017, we do not expect any
66
material impairments on assets held for use in the first quarter of 2017 due to commodity price impacts. Please refer to Critical Accounting Policies and Estimates below for additional discussion.
Proved and unproved property impairments recorded in 2015 were due to continued commodity price declines, largely impacting our Powder River Basin program and certain legacy and non-core assets, as well as our decision to reduce capital invested in the development of our east Texas exploration program in light of the sustained, low commodity price environment.
Proved and unproved property impairments recorded in 2014 were due to the significant decline in commodity prices in late 2014 resulting in changes in our drilling plans and the abandonment of certain acreage, as well as recognition of the outcomes of exploration and delineation wells in certain prospects in our South Texas & Gulf Coast and Permian regions.
Impairment of other property and equipment
For the Years Ended December 31, | |||||||||||
2016 | 2015 | 2014 | |||||||||
(in millions) | |||||||||||
Impairment of other property and equipment | $ | — | $ | 49.4 | $ | — | |||||
We impaired our gas gathering system assets in our east Texas program during the year ended December 31, 2015, in conjunction with the impairment of the associated proved and unproved properties resulting from our decision not to allocate additional capital to the program in light of sustained low commodity prices. We did not record impairments of other property and equipment for the years ended December 31, 2016, and 2014.
General and administrative
For the Years Ended December 31, | |||||||||||
2016 | 2015 | 2014 | |||||||||
(in millions) | |||||||||||
General and administrative | $ | 126.4 | $ | 157.7 | $ | 167.1 | |||||
Exit and disposal costs (1) | $ | 5.1 | $ | 9.3 | $ | — | |||||
___________________________________________
(1) | Exit and disposal costs are recorded in general and administrative expense in the accompanying statements of operations. |
G&A expense for the year ended December 31, 2016, decreased $31.3 million, or 20 percent, from 2015 primarily due to lower headcount and overhead costs in 2016 resulting from the closure of our Tulsa, Oklahoma regional office in the beginning of the third quarter of 2015, the company-wide workforce reduction that occurred in the third quarter of 2016, and the closure of our Billings, Montana regional office in the fourth quarter of 2016. For the years ended December 31, 2016, and 2015, $5.1 million and $9.3 million, respectively, of exit and disposal costs related to these events was included in G&A expense. Please refer to Note 14 - Exit and Disposal Costs in Part II, Item 8 of this report for additional discussion. Additionally, refer to the caption A Year-to-Year Overview of Selected Production and Financial Information, Including Trends above for discussion of G&A costs on a per BOE basis.
G&A expense decreased $9.4 million, or six percent, in 2015 from 2014 due to lower short-term incentive compensation and reduced headcount and overhead costs resulting from the closing of our Tulsa office in the beginning of the third quarter of 2015.
Change in Net Profits Plan liability
For the Years Ended December 31, | |||||||||||
2016 | 2015 | 2014 | |||||||||
(in millions) | |||||||||||
Change in Net Profits Plan liability | $ | (7.2 | ) | $ | (19.5 | ) | $ | (29.8 | ) | ||
67
This non-cash expense (benefit) generally relates to the change in the estimated value of the associated liability between the reporting periods resulting from settlements made or accrued during the period and changes in assumptions used in valuing the remaining liability. The non-cash benefit for 2016 was primarily due to the divestiture of assets subject to the Net Profits Plan in 2016. Please refer to Note 11 - Fair Value Measurements in Part II, Item 8 of this report for tabular presentation of the change in the Net Profits Plan liability.
The non-cash benefit for 2015 and 2014 was a result of a 72 percent and 52 percent respective decrease in the corresponding liability, resulting from the continued decline in commodity prices and cash payments made or accrued under the plan.
Net derivative (gain) loss
For the Years Ended December 31, | |||||||||||
2016 | 2015 | 2014 | |||||||||
(in millions) | |||||||||||
Net derivative (gain) loss | $ | 250.6 | $ | (408.8 | ) | $ | (583.3 | ) | |||
We recognized a net derivative loss of $250.6 million for the year ended December 31, 2016. For contracts settled during 2016, the fair value was a net asset of $367.7 million at December 31, 2015, and net cash settlements totaled $329.5 million, resulting in a $38.2 million loss. Additionally, we recorded a $212.4 million mark-to-market loss on remaining contracts as of December 31, 2016, resulting from the increase in commodity strip prices.
We recognized a net derivative gain of $408.8 million for the year ended December 31, 2015. For contracts settled during 2015, the fair value was a net asset of $402.7 million at December 31, 2014, and net cash settlements totaled $512.6 million, resulting in a $109.9 million gain. Additionally, we recorded a $298.9 million mark-to-market gain on remaining contracts as of December 31, 2015, resulting from the decrease in commodity strip prices.
We recognized a net derivative gain of $583.3 million for the year ended December 31, 2014. For contracts settled during 2014, the fair value was a net liability of $4.8 million at December 31, 2013, and net cash settlements totaled $12.6 million, resulting in a $17.4 million gain. Additionally, we recorded a $565.9 million mark-to-market gain on remaining contracts as of December 31, 2014, resulting from the decrease in commodity strip prices.
Please refer to Note 10 - Derivative Financial Instruments in Part II, Item 8 of this report for additional discussion.
Other operating expenses
For the Years Ended December 31, | |||||||||||
2016 | 2015 | 2014 | |||||||||
(in millions) | |||||||||||
Other operating expenses | $ | 18.0 | $ | 30.6 | $ | 4.7 | |||||
Other operating expenses for the year ended December 31, 2016, consisted primarily of drilling rig termination and standby fees of $8.7 million, $2.4 million of materials inventory write-downs, and $3.2 million paid to the lessor to terminate our office lease in Billings, Montana. Other operating expenses for the year ended December 31, 2015, consisted primarily of drilling rig termination and standby fees of $13.7 million, $5.3 million of expense related to estimated claims for payment of royalties on certain Federal and Indian leases, and $4.1 million of materials inventory write-downs. There were no individually material other operating expenses in 2014.
Gain (loss) on extinguishment of debt
For the Years Ended December 31, | |||||||||||
2016 | 2015 | 2014 | |||||||||
(in millions) | |||||||||||
Gain (loss) on extinguishment of debt | $ | 15.7 | $ | (16.6 | ) | $ | — | ||||
68
For the year ended December 31, 2016, we recorded a $15.7 million net gain on the early extinguishment of a portion of our Senior Notes (as defined and discussed in Note 5 - Long-Term Debt in Part II, Item 8 of this report), which includes approximately $16.4 million associated with the discount realized upon repurchase, slightly offset by approximately $700,000 related to the acceleration of unamortized deferred financing costs.
For the year ended December 31, 2015, we recorded a $16.6 million loss on the early extinguishment of our 6.625% Senior Notes due 2019, which included approximately $12.5 million associated with the premium paid for the tender offer and redemption of the notes and approximately $4.1 million for the acceleration of unamortized deferred financing costs.
Interest expense
For the Years Ended December 31, | |||||||||||
2016 | 2015 | 2014 | |||||||||
(in millions) | |||||||||||
Interest expense | $ | (158.7 | ) | $ | (128.1 | ) | $ | (98.6 | ) | ||
The $30.6 million, or 24 percent, increase in interest expense for the year ended December 31, 2016, compared with the same period in 2015, was due to the additional debt issued in 2016, as presented in Note 5 - Long-Term Debt in Part II, Item 8 of this report, as well as $10.0 million paid to terminate a second lien facility that was not necessary to fund the Rock Oil Acquisition.
The $29.5 million, or 30 percent, increase in interest expense for the year ended December 31, 2015, compared with the same period in 2014, was primarily due to a larger outstanding debt balance in 2015, partially offset by a slight reduction in our weighted-average interest rate.
Please refer to Overview of Liquidity and Capital Resources below for additional discussion of weighted-average interest and borrowing rates for the years presented.
Income tax (expense) benefit
For the Years Ended December 31, | |||||||||||
2016 | 2015 | 2014 | |||||||||
(in millions, except tax rate) | |||||||||||
Income tax (expense) benefit | $ | 444.2 | $ | 275.2 | $ | (398.6 | ) | ||||
Effective tax rate | 37.0 | % | 38.1 | % | 37.4 | % | |||||
The decrease in the effective tax rate in 2016 compared with 2015 reflects the tax benefit of Oklahoma permanent tax benefits and claimed research and development credits recognized in 2015. The effective tax benefit rate realized in 2016 primarily includes a positive effect from the divestiture of properties in high marginal rate states and acquisition of properties in a lower marginal rate state, as well as a positive effect from the release of certain valuation allowances on utilized tax assets. The tax gain recognized on the Raven/Bear Den divestiture, which closed in the fourth quarter of 2016, is much larger than the estimated and recorded book gain. The same is true for announced property sales scheduled to occur in 2017. As a result, we were able to consider tax planning strategies which would allow for the utilization of net operating loss carryovers in certain states which we previously determined would expire before they could be used, as well as utilization of certain carryover federal tax deductions, limited based upon taxable income, which were also expected to expire. As of this date, we intend to implement these planning strategies to utilize deferred tax assets, but cannot ensure that future events will not change these plans and cause the valuation allowances to be reestablished. In general, our historical effective tax rate has not varied significantly year-over-year, but like all companies, our effective tax rate will be impacted by the effect of those permanent items consistently reported compared to reported income or loss. As a result of our divestitures and acquisitions, our base rate has been decreasing over the last three years and has now settled at a rate we expect to be consistent in future periods. Please refer to Critical Accounting Policies and Estimates below and Note 4 - Income Taxes in Part II, Item 8 of this report for further discussion.
The increase in the effective tax rate in 2015 compared with 2014 resulted from a tax benefit effect of Oklahoma permanent tax benefits, enacted state rate changes in Texas and North Dakota, and claimed research and development credits added to the benefit created by a pre-tax loss recorded for the year ended December 31, 2015.
69
Overview of Liquidity and Capital Resources
Based on the current commodity price environment, we believe we have sufficient liquidity and capital resources to execute our business plan for the foreseeable future. We continue to manage the duration and level of our drilling and completion service commitments to maintain the flexibility to adjust our activity and capital expenditures in periods of prolonged weak commodity prices or to respond should commodity prices recover further.
Sources of Cash
We currently expect our 2017 capital program to be funded by cash flows from operations and proceeds from the divestiture of properties.
Although we anticipate cash flows from these sources will be sufficient to fund our expected 2017 capital program, we may also elect to borrow under our Credit Agreement and/or raise funds through debt or equity financings or from other sources or enter into carrying cost funding and sharing arrangements with third parties for particular exploration and/or development programs. Decreases in commodity prices have limited our industry’s access to capital markets in recent periods. If we raise additional funds through the issuance of equity or convertible debt securities, the percentage ownership of our stockholders could be diluted, and these newly-issued securities may have rights, preferences, or privileges senior to those of existing stockholders. During the first quarter of 2016, our credit ratings were downgraded by two major rating agencies. These downgrades and any future downgrades may make it more difficult or expensive for us to borrow additional funds. All of our sources of liquidity can be impacted by the general condition of the broader economy and by fluctuations in commodity prices, operating costs, and volumes produced, all of which affect us and our industry. Our Credit Agreement borrowing base could be further reduced as a result of lower commodity prices, divestitures of proved properties, or newly issued debt. See Credit Agreement below for a discussion of recent changes to our borrowing base and the expected reduction as part of the upcoming redetermination process.
We have no control over the market prices for oil, gas, or NGLs, although we may be able to influence the amount of our realized revenues from our oil, gas, and NGL sales through the use of derivative contracts as part of our commodity price risk management program. During 2016, cash received from the settlement of commodity derivative contracts provided a significant positive source of cash, which is reflected in net cash provided by operating activities on our consolidated statements of cash flows. The fair value of our commodity derivative contracts was a net liability of $91.7 million at December 31, 2016. Please refer to Note 10 – Derivative Financial Instruments in Part II, Item 8 of this report for additional information about our oil, gas, and NGL derivative contracts currently in place and the timing of settlement of those contracts.
Please refer to the section Uses of Cash below for discussion of financing activities in 2016, including the issuances of our Senior Convertible Notes and 2026 Notes, and public equity offerings, and the use of these proceeds in funding acquisition activities.
Proposals to reform the Internal Revenue Code of 1986 (“IRC”), as amended, which include eliminating or reducing current tax deductions for intangible drilling costs, depreciation of equipment acquisition costs, the domestic production activities deduction, percentage depletion, and other deductions which reduce our taxable income, have been discussed in past years. Although we believe this possibility has decreased with the recent congressional discussions on tax reform, we expect that future legislation eliminating these deductions would reduce net operating cash flows over time, thereby reducing funding available for our exploration and development capital programs, as well as funding available to our peers in the industry for similar programs. If enacted, reductions in available deductions could have a significant adverse effect on drilling in the United States for a number of years.
70
Credit Agreement
Our Credit Agreement provides a maximum loan amount of $2.5 billion and has a maturity date of December 10, 2019. As of December 31, 2016, our borrowing base and the current aggregate lender commitments were $1.17 billion. Our borrowing base is subject to regular semi-annual redeterminations, as well as periodic adjustments as a result of significant transactions made by the Company. Please refer to Note 5 - Long-Term Debt in Part II, Item 8 of this report for additional discussion of changes in our borrowing capacity throughout 2016 resulting from our debt and equity issuances and our acquisitions and divestitures. The borrowing base redetermination process considers the value of both our (a) proved oil and gas properties reflected in our most recent reserve report and (b) commodity derivative contracts, each as determined by our lender group. The Sixth Amendment to the Credit Agreement revised certain of our covenants under the Credit Agreement and modified the borrowing base utilization grid. On December 1, 2016, the borrowing base was reduced as a result of closing the Raven/Bear Den asset divestiture. We expect a further reduction to our borrowing base during the next semi-annual redetermination scheduled for April 1, 2017, as a result of the anticipated sale of our outside-operated Eagle Ford shale assets, as well as the decrease in our proved reserves at December 31, 2016. We do not expect to be negatively impacted by this anticipated borrowing base reduction, as we expect to have ample cash on hand upon the closings of planned divestitures and believe the revised borrowing base amount will be sufficient to meet any other anticipated liquidity and operating needs. We had a zero outstanding balance under our Credit Agreement as of December 31, 2016. No individual bank participating in our Credit Agreement represents more than 10 percent of the lender commitments under the Credit Agreement. Please refer to Note 5 - Long-Term Debt in Part II, Item 8 of this report for additional discussion as well as the presentation of the outstanding balance, total amount of letters of credit, and available borrowing capacity under our Credit Agreement as of February 15, 2017, December 31, 2016, and December 31, 2015.
We must comply with certain financial and non-financial covenants under the Credit Agreement, including covenants limiting dividend payments and requiring the Company to maintain certain financial ratios, as defined by the Credit Agreement. Financial covenants under the Credit Agreement require, as of the last day of each of the Company’s fiscal quarters, our (a) ratio of senior secured debt to 12-month trailing adjusted EBITDAX to be not more than 2.75 to 1.0; (b) adjusted current ratio to be not less than 1.0 to 1.0; and (c) ratio of 12-month trailing adjusted EBITDAX to interest expense to be not less than 2.0 to 1.0. We were in compliance with all financial and non-financial covenants under the Credit Agreement as of December 31, 2016, and through the filing date of this report. Please refer to the caption Non-GAAP Financial Measures below for the calculation of adjusted EBITDAX, and a reconciliation of adjusted EBITDAX to net income (loss) and to net cash provided by operating activities.
Our daily weighted-average credit facility debt balance was approximately $183.8 million, $253.7 million, and $86.6 million for the years ended December 31, 2016, 2015, and 2014, respectively. Cash flows provided by our operating activities, proceeds received from divestitures of properties, capital markets activities, and the amount of our capital expenditures, including acquisitions, all impact the amount we have borrowed under our Credit Agreement.
Weighted-Average Interest Rates
Our weighted-average interest rates include paid and accrued interest, fees on the unused portion of the credit facility’s aggregate commitment amount, letter of credit fees, the non-cash amortization of deferred financing costs and the non-cash amortization of the discount related to the Senior Convertible Notes. Our weighted-average borrowing rates include paid and accrued interest only.
The following table presents our weighted-average interest rates and our weighted-average borrowing rates for the years ended December 31, 2016, 2015, and 2014.
For the Years Ended December 31, | ||||||||
2016 | 2015 | 2014 | ||||||
Weighted-average interest rate | 6.2 | % | 6.0 | % | 6.5 | % | ||
Weighted-average borrowing rate | 5.7 | % | 5.5 | % | 5.9 | % | ||
Our weighted-average interest rates and weighted average borrowing rates for the years ended December 31, 2016, 2015, and 2014, have been impacted by the timing of Senior Notes and Senior Convertible Notes issuances and redemptions, the average balance on our revolving credit facility, and the fees paid on the unused portion of our aggregate commitment. The rates disclosed in the above table for the year ended December 31, 2016, do not reflect the approximate $16.4 million discount
71
realized upon repurchase of certain of our Senior Notes during 2016, the approximate $700,000 acceleration of unamortized deferred financing costs expensed upon repurchase, or the $10.0 million fee paid to terminate an unused second lien facility. The rates disclosed for the year ended December 31, 2015, do not reflect the approximate $12.5 million premium paid for the tender offer and redemption of the 2019 Notes or the approximate $4.1 million of unamortized deferred financing costs expensed upon extinguishment of these notes during 2015. Please refer to Note 5 - Long-Term Debt in Part II, Item 8 of this report for additional discussion.
Uses of Cash
We use cash for the acquisition, exploration, and development of oil and gas properties and for the payment of operating and general and administrative costs, income taxes, dividends, and debt obligations, including interest. Expenditures for the acquisition, exploration, and development of oil and gas properties are the primary use of our capital resources. During 2016, we spent $2.8 billion in capital expenditures and in acquiring proved and unproved oil and gas properties. These amounts differ from the costs incurred amounts, which are accrual-based and include asset retirement obligations, geological and geophysical expenses, exploration overhead amounts, and the fair value of the equity consideration given to the sellers of the QStar Acquisition.
The amount and allocation of future capital expenditures will depend upon a number of factors, including the number and size of acquisition opportunities, our cash flows from operating, investing, and financing activities, and our ability to assimilate acquisitions and execute our drilling program. In addition, the impact of oil, gas, and NGL prices on investment opportunities, the availability of capital, and the timing and results of our operated and outside-operated exploration and development activities may lead to changes in funding requirements for future development. We periodically review our capital expenditure budget to assess changes in current and projected cash flows, acquisition and divestiture activities, debt requirements, and other factors.
We may from time to time repurchase certain amounts of our outstanding debt securities for cash and/or through exchanges for other securities. Such repurchases or exchanges may be made in open market transactions, privately negotiated transactions, or otherwise. Any such repurchases or exchanges will depend on prevailing market conditions, our liquidity requirements, contractual restrictions, compliance with securities laws, and other factors. The amounts involved in any such transaction may be material. Repurchases or exchanges are reviewed as part of the allocation of our capital. During 2016, we repurchased a portion of our Senior Notes in open market transactions at a discount, resulting in a $15.7 million net gain on extinguishment of debt. Please refer to Note 5 - Long-Term Debt in Part II, Item 8 of this report for additional discussion. As part of our strategy for 2017, we plan to reduce debt by repurchasing a portion of our Senior Notes.
As of the filing date of this report, we could repurchase up to 3,072,184 shares of our common stock under our stock repurchase program, subject to the approval of our Board of Directors. Shares may be repurchased from time to time in the open market, or in privately negotiated transactions, subject to market conditions and other factors, including certain provisions of our Credit Agreement, the indentures governing our Senior Notes, the indenture governing our Senior Convertible Notes, compliance with securities laws, and the terms and provisions of our stock repurchase program. Our Board of Directors periodically reviews this program as part of the allocation of our capital. During 2016, we did not repurchase any shares of our common stock, and we currently do not plan to repurchase any outstanding shares.
During 2016, we paid $7.8 million in dividends to our stockholders, reflecting a dividend of $0.10 per share. Our current intention is to continue to make dividend payments for the foreseeable future, subject to our future earnings, our financial condition, Credit Agreement, indentures governing our Senior Convertible Notes and Senior Notes, other covenants, and other factors which could arise. The payment and amount of future dividends remains at the discretion of our Board of Directors.
Analysis of Cash Flow Changes Between 2016 and 2015 and Between 2015 and 2014
The following tables present changes in cash flows between the years ended December 31, 2016, 2015, and 2014, for our operating, investing, and financing activities. The analysis following each table should be read in conjunction with our consolidated statements of cash flows in Part II, Item 8 of this report.
72
Operating Activities
For the Years Ended December 31, | Amount Change Between | Percent Change Between | ||||||||||||||||||||||||
2016 | 2015 | 2014 | 2016/2015 | 2015/2014 | 2016/2015 | 2015/2014 | ||||||||||||||||||||
(in millions) | ||||||||||||||||||||||||||
Net cash provided by operating activities | $ | 552.8 | $ | 978.4 | $ | 1,456.6 | $ | (425.6 | ) | $ | (478.2 | ) | (43 | )% | (33 | )% | ||||||||||
Cash received from oil, gas, and NGL production revenues, net of transportation costs and production taxes, including derivative cash settlements, decreased $588.0 million, or 35 percent, to $1.1 billion for the year ended December 31, 2016, compared with the same period in 2015. This decrease was a result of the decline in production volumes, realized commodity prices, and derivative cash settlements. Cash paid for LOE in 2016 decreased $52.6 million, or 21 percent, to $199.9 million compared with the same period in 2015 due primarily to a 14 percent decrease in production volumes and a reduction in service provider costs. During 2016, we paid $10.0 million to terminate a second lien facility that was not needed to fund the Rock Oil Acquisition. During 2015, we paid approximately $12.5 million associated with the premium for the tender offer and redemption of the 2019 Notes. The remaining change was related to decreases in cash G&A expense, exploration overhead, and ad valorem taxes, as well as changes in working capital balances.
Cash received from oil, gas, and NGL production revenues, net of transportation costs and production taxes, including derivative cash settlements, decreased $366.1 million, or 18 percent, to $1.7 billion for the year ended December 31, 2015, compared with the same period in 2014. Cash paid for LOE in 2015 increased $22.2 million, or 10 percent, to $252.5 million compared with the same period in 2014, due primarily to a 16 percent increase in production volumes, partially offset by a reduction in service provider costs. Cash paid for interest, net of capitalized interest, increased $37.8 million during 2015 compared with 2014 due to making, in 2015, the first interest payment on our 2022 Notes issued at the end of 2014. Additionally, we paid approximately $12.5 million associated with the premium for the tender offer and redemption of the 2019 Notes.
Investing Activities
For the Years Ended December 31, | Amount Change Between | Percent Change Between | ||||||||||||||||||||||||
2016 | 2015 | 2014 | 2016/2015 | 2015/2014 | 2016/2015 | 2015/2014 | ||||||||||||||||||||
(in millions) | ||||||||||||||||||||||||||
Net cash used in investing activities | $ | (1,870.6 | ) | $ | (1,144.6 | ) | $ | (2,478.7 | ) | $ | (726.0 | ) | $ | 1,334.1 | 63 | % | (54 | )% | ||||||||
Net cash used in investing activities increased for the year ended December 31, 2016, compared with the same period in 2015. During 2016, cash paid to acquire proved and unproved properties in the Midland Basin totaled $2.2 billion, whereas we had no significant acquisition activity in 2015. Net proceeds from the sale of oil and gas properties increased $588.1 million for the year ended December 31, 2016, compared with the same period in 2015, due to proceeds from the divestitures of our Raven/Bear Den assets and other non-core assets in 2016 exceeding proceeds from the sale of our Mid-Continent assets in 2015. Capital expenditures in 2016 decreased $863.7 million, or 58 percent, compared with 2015 as a result of reduced drilling and completion activities and lower service provider costs, as well as a significant amount of accrued 2014 drilling and completion payables paid in early 2015.
Capital expenditures in 2015 decreased $481.2 million, or 24 percent, compared with 2014. Drilling capital incurred decreased approximately 38 percent in 2015 compared with 2014 as a result of reduced operated and non-operated rig count and lower service provider costs. Partially offsetting this decrease in capital activity was our payment, in 2015, of a significant amount of accrued drilling and completion payables at year-end 2014. Additionally, we did not have significant acquisition activity during 2015, whereas we acquired $544.6 million of proved and unproved properties in our Gooseneck prospect area and in the Powder River Basin during 2014. Net proceeds from the sale of oil and gas properties increased $314.1 million in 2015 compared with 2014 due primarily to the divestiture of our remaining Mid-Continent assets during the second quarter of 2015.
73
Financing Activities
For the Years Ended December 31, | Amount Change Between | Percent Change Between | ||||||||||||||||||||||||
2016 | 2015 | 2014 | 2016/2015 | 2015/2014 | 2016/2015 | 2015/2014 | ||||||||||||||||||||
(in millions) | ||||||||||||||||||||||||||
Net cash provided by financing activities | $ | 1,327.2 | $ | 166.2 | $ | 740.0 | $ | 1,161.0 | $ | (573.8 | ) | 699 | % | (78 | )% | |||||||||||
During 2016, we received $934.1 million of net proceeds from two public equity offerings, $491.6 million of net proceeds from our 2026 Notes issuance, and $166.6 million of net proceeds from our Senior Convertible Notes issuance. These proceeds were used to partially fund the Rock Oil and QStar acquisitions, as well as to pay down our credit facility balance. As a result, we had net repayments under our credit facility of $202.0 million during the year ended December 31, 2016, compared with net borrowings of $36.0 million during 2015. During 2015, we received $491.0 million of net proceeds from the issuance of our 2025 Notes, which were used for the tender and redemption of the $350.0 million principal amount of our 2019 Notes. Additionally, in 2016, we paid $24.2 million for capped call transactions related to our Senior Convertible Notes and paid $29.9 million for the repurchase of $46.3 million in aggregate principal amount of a portion of our Senior Notes. Please refer to Note 5 - Long-Term Debt in Part II, Item 8 of this report for additional discussion.
We received $491.0 million of net proceeds from the issuance of our 2025 Notes in 2015, compared with $590.0 million of net proceeds from the issuance of our 2022 Notes during 2014. The 2015 proceeds were primarily used for the tender and redemption of our 2019 Notes. We had net borrowings under our credit facility of $36.0 million during the year ended December 31, 2015, compared with net borrowings of $166.0 million in 2014.
Interest Rate Risk
We are exposed to market risk due to the floating interest rate on our revolving credit facility. Our Credit Agreement allows us to fix the interest rate for all or a portion of the principal balance of our revolving credit facility for a period up to six months. To the extent that the interest rate is fixed, interest rate changes will affect the credit facility’s fair market value, but will not impact results of operations or cash flows. Conversely, for the portion of the credit facility that has a floating interest rate, interest rate changes will not affect the fair market value, but will impact future results of operations and cash flows. Changes in interest rates do not impact the amount of interest we pay on our fixed-rate Senior Notes or fixed-rate Senior Convertible Notes, but can impact their fair market values. As of December 31, 2016, our fixed-rate debt outstanding totaled $3.0 billion, however, we had no floating-rate debt outstanding, thus we had no exposure to market risk related to floating interest rates at that date. Please refer to Note 11 - Fair Value Measurements in Part II, Item 8 of this report for additional discussion on the fair value of our Senior Notes and Senior Convertible Notes.
Commodity Price Risk
The prices we receive for our oil, gas, and NGL production directly impact our revenue, overall profitability, access to capital, and future rate of growth. Oil, gas, and NGL prices are subject to wide fluctuations in response to changes in supply and demand and other factors. The markets for oil, gas, and NGLs have been volatile, especially over the last several years, and these markets will likely continue to be volatile in the future. The prices we receive for our production depend on numerous factors beyond our control. Based on our 2016 production, a 10 percent decrease in our average realized oil, gas, and NGL prices, before the effects of derivative settlements, would have reduced our oil, gas, and NGL production revenues by approximately $61.2 million, $33.7 million, and $22.9 million, respectively. If our 2016 realized prices, before the effects of derivative settlements, had been 10 percent lower, our derivative settlements would have been higher, partially offsetting the decrease in production revenues quantified above.
74
We enter into commodity derivative contracts in order to reduce the impact of fluctuations in commodity prices. The fair values of our commodity derivative contracts are largely determined by estimates of the forward curves of the relevant price indices. At December 31, 2016, a 10 percent increase or decrease in the forward curves associated with our oil, gas, and NGL commodity derivative instruments would have changed our net liability positions by approximately $56 million, $47 million, and $27 million, respectively.
Schedule of Contractual Obligations
The following table summarizes our contractual obligations at December 31, 2016, for the periods specified (in millions):
Contractual Obligations | Total | Less than 1 year | 1-3 years | 3-5 years | More than 5 years | |||||||||||||||
Long-term debt (1) | $ | 2,976.2 | $ | — | $ | — | $ | 519.4 | $ | 2,456.8 | ||||||||||
Interest payments (2) | 1,275.8 | 174.3 | 351.2 | 347.6 | 402.7 | |||||||||||||||
Delivery commitments (3) | 970.9 | 105.7 | 274.9 | 269.0 | 321.3 | |||||||||||||||
Operating leases and contracts (3) | 87.2 | 39.4 | 17.7 | 13.7 | 16.4 | |||||||||||||||
Asset retirement obligations (4) | 161.2 | 6.8 | 34.8 | 2.2 | 117.4 | |||||||||||||||
Derivative liability (5) | 214.4 | 115.6 | 97.4 | 1.4 | — | |||||||||||||||
Other (6) | 38.4 | 7.9 | 15.6 | 14.9 | — | |||||||||||||||
Total | $ | 5,724.1 | $ | 449.7 | $ | 791.6 | $ | 1,168.2 | $ | 3,314.6 | ||||||||||
____________________________________________
(1) | Long-term debt consists of our Senior Notes and Senior Convertible Notes, and assumes no principal repayment until the due dates of the instruments. The actual payments may vary significantly. As of December 31, 2016, we had a zero balance on our revolving credit facility. |
(2) | Interest payments on our Senior Notes and Senior Convertible Notes are estimated assuming no principal repayment until the due dates of the instruments. As our credit facility balance was zero at December 31, 2016, the above table reflects only the fee that would be paid on the unused credit facility’s aggregate lender commitment amount through the maturity date of the Credit Agreement. The actual interest payments on our Senior Notes, Senior Convertible Notes, and credit facility may vary significantly. |
(3) | Please refer to Note 6 – Commitments and Contingencies in Part II, Item 8 of this report for additional discussion. The amount relating to our gathering, processing, and transportation throughput commitments in the table above reflects the aggregate undiscounted deficiency payments assuming we delivered no product. Subsequent to December 31, 2016, we entered into a definitive agreement for the sale of our outside-operated Eagle Ford shale assets held for sale at December 31, 2016, and expect to close the transaction in the first quarter of 2017, at which point we would no longer be subject to throughput commitments totaling $501.9 million of the deficiency payments presented in the table above. |
(4) | Amounts shown represent estimated future undiscounted plugging and abandonment costs. The discounted obligations are recorded as liabilities on our accompanying consolidated balance sheets as of December 31, 2016. The timing and amount of the ultimate settlement of these obligations is unknown and can be impacted by economic factors, a change in development plans, and federal and state regulations. Obligations related to inactive wells or wells that are not economic at current commodity price levels as of December 31, 2016, are shown as an obligation in 1-3 years due to the substantial uncertainty on the timing of plugging or re-entering these wells. Please refer to Note 9 – Asset Retirement Obligations in Part II, Item 8 of this report for additional discussion. |
(5) | Amounts shown represent only the liability portion of the marked-to-market value of our commodity derivatives based on future market prices as of December 31, 2016, and exclude estimated oil, gas, and NGL commodity derivative receipts. This amount varies from the liability amounts presented on the accompanying balance sheets, as those amounts are presented at fair value, which considers time value, volatility, and the risk of non-performance for us and for our counterparties. The ultimate settlement amounts under our derivative contracts are unknown, as they are subject to continuing market risk and commodity price volatility. Please refer to Note 10 – Derivative Financial Instruments in Part II, Item 8 of this report for additional discussion. |
(6) | The majority of this amount is related to the unfunded portion of our estimated pension liability of $37.9 million, for which we have estimated the timing of future payments based on historical annual contribution amounts. |
75
Off-Balance Sheet Arrangements
As part of our ongoing business, we have not participated in transactions that generate relationships with unconsolidated entities or financial partnerships, such as entities often referred to as structured finance or special purpose entities (“SPEs”), which would have been established for the purpose of facilitating off-balance sheet arrangements or other contractually narrow or limited purposes.
We evaluate our transactions to determine if any variable interest entities exist. If it is determined that we are the primary beneficiary of a variable interest entity, that entity is consolidated into our consolidated financial statements. We have not been involved in any unconsolidated SPE transactions in 2016 or 2015.
Critical Accounting Policies and Estimates
Our discussion of financial condition and results of operations is based upon the information reported in our consolidated financial statements. The preparation of these consolidated financial statements in conformity with accounting principles generally accepted in the United States (“GAAP”) requires us to make assumptions and estimates that affect the reported amounts of assets, liabilities, revenues, and expenses, as well as the disclosure of contingent assets and liabilities as of the date of our financial statements. We base our assumptions and estimates on historical experience and various other sources that we believe to be reasonable under the circumstances. Actual results may differ from the estimates we calculate due to changes in circumstances, global economics and politics, and general business conditions. A summary of our significant accounting policies is detailed in Note 1 – Summary of Significant Accounting Policies in Part II, Item 8 of this report. We have outlined below those policies identified as being critical to the understanding of our business and results of operations and that require the application of significant management judgment.
Successful Efforts Method of Accounting. GAAP provides for two alternative methods for the oil and gas industry to use in accounting for oil and gas producing activities. These two methods are generally known in our industry as the full cost method and the successful efforts method. Both methods are widely used. The methods are different enough that in many circumstances the same set of facts will provide materially different financial statement results within a given year. We have chosen the successful efforts method of accounting for our oil and gas producing activities. A more detailed description is included in Note 1 - Summary of Significant Accounting Policies of Part II, Item 8 of this report.
Oil and Gas Reserve Quantities. Our estimated proved reserve quantities and future net cash flows are critical to understanding the value of our business. They are used in comparative financial ratios and are the basis for significant accounting estimates in our financial statements, including the calculations of depletion and impairment of proved oil and gas properties. Future cash inflows and future production and development costs are determined by applying prices and costs, including transportation, quality differentials, and basis differentials, applicable to each period to the estimated quantities of proved reserves remaining to be produced as of the end of that period. Expected cash flows are discounted to present value using an appropriate discount rate. For example, the standardized measure of discounted future net cash flows calculation requires a 10 percent discount rate to be applied. Although reserve estimates are inherently imprecise, and estimates of new discoveries and undeveloped locations are more imprecise than those of established producing oil and gas properties, we make a considerable effort in estimating our reserves. We engage Ryder Scott, an independent reservoir-evaluation consulting firm, to audit at least 80 percent of our total calculated proved reserve PV-10. We expect proved reserve estimates will change as additional information becomes available and as commodity prices and operating and capital costs change. We evaluate and estimate our proved reserves each year-end. It should not be assumed that the standardized measure of discounted future net cash flows (GAAP) or PV-10 (non-GAAP) as of December 31, 2016, is the current market value of our estimated proved reserves. In accordance with SEC requirements, we based these measures on a 12-month average of the first-day-of-the-month prices for the year ended December 31, 2016. Actual future prices and costs may be materially higher or lower than the prices and costs utilized in the estimates. Please refer to Risk Factors in Part I, Item 1A of this report.
Our estimates of proved reserves materially impact depletion expense and impairment of proved and unproved properties. If the estimates of proved reserves decline, the rate at which we record depletion expense will increase, reducing future earnings. Such a decline may result from lower commodity prices, which may make it uneconomical to drill for or produce higher cost fields. In addition, a decline in proved reserve estimates may impact the outcome of our assessment of proved properties for impairment. Changes in depletion or impairment calculations caused by changes in reserve quantities or net cash flows are recorded in the period the reserve estimates change.
76
The following table presents information about proved reserve changes from period to period due to items we do not control, such as price, and from changes due to production history and well performance. These changes do not require a capital expenditure on our part, but may have resulted from capital expenditures we incurred to develop other estimated proved reserves.
For the Years Ended December 31, | ||||||||
2016 | 2015 | 2014 | ||||||
MMBOE | MMBOE | MMBOE | ||||||
Change | Change | Change | ||||||
Revisions resulting from performance | (18.1 | ) | 47.3 | 11.3 | ||||
Removal of proved undeveloped reserves no longer in our five-year development plan | (43.0 | ) | (79.4 | ) | (4.3 | ) | ||
Revisions resulting from price changes | (35.1 | ) | (116.5 | ) | 3.4 | |||
Total | (96.2 | ) | (148.6 | ) | 10.4 | |||
As previously noted, commodity prices are volatile and estimates of reserves are inherently imprecise. Consequently, we expect to continue experiencing these types of changes.
The Company cannot reasonably predict future commodity prices, although we believe that together, the below analyses provide reasonable information regarding the impact of changes in pricing and trends on total proved reserves. The following table reflects the estimated MMBOE change and percentage change to our total reported proved reserve volumes from the described hypothetical changes:
For the Year Ended December 31, 2016 | |||||
MMBOE | Percentage | ||||
Change | Change | ||||
10 percent decrease in SEC pricing (1) | (81 | ) | (21 | )% | |
Average NYMEX strip pricing as of fiscal year end (2) | 163 | 41 | % | ||
10 percent decrease in proved undeveloped reserves (3) | (19 | ) | (5 | )% | |
___________________________________________
(1) | The change solely reflects the impact of a 10 percent decrease in SEC pricing to the total reported proved reserve volumes as of December 31, 2016, and does not include additional impacts to our proved reserves that may result from our internal intent to drill hurdles or changes in future service or equipment costs. |
(2) | The change reflects the impact of replacing SEC pricing with the calculated average of the five year NYMEX strip pricing for each product as of December 31, 2016. The five year average NYMEX strip prices used in the analysis were $56.19 per Bbl for oil, $3.09 per MMBtu for gas, and $27.44 per Bbl for NGL. Other impacts modeled in the analysis resulting from the hypothetical improved pricing include: 1) management’s estimate of escalation in future service and equipment costs at the commodity price level noted above 2) extension of economic lives and increase in economically recoverable volumes; 3) additional proved undeveloped reserve locations that pass the PV-0 hurdle; and 4) additional proved undeveloped reserve locations that could be reasonably drilled within five years given additional capital that would be available for development at the commodity price level noted above. We did not add any proved undeveloped reserve locations in our outside-operated Eagle Ford shale or Bakken/Three Forks program in Divide County, North Dakota given our intent to sell these properties in 2017. |
(3) | The change solely reflects a 10 percent decrease in proved undeveloped reserves as of December 31, 2016, and does not include any additional impacts to our proved reserves. |
Additional reserve information can be found in the Reserves section in Part I, Items 1 and 2 of this report, and in Supplemental Oil and Gas Information in Part II, Item 8 of this report.
77
Impairment of Oil and Gas Properties. Proved properties are evaluated periodically for impairment on a pool-by-pool basis and when events or changes in circumstances indicate that a decline in the recoverability of their carrying value may have occurred. We estimate the expected future cash flows of our oil and gas properties and compare these undiscounted cash flows to the carrying amount to determine if the carrying amount is recoverable. If the carrying amount exceeds the estimated undiscounted future cash flows, we will write down the carrying amount of the oil and gas properties to fair value (or discounted future cash flows). Management estimates future cash flows from all proved reserves and risk adjusted probable and possible reserves using various factors, which are subject to our judgment and expertise, and include, but are not limited to, commodity price forecasts, estimated future operating and capital costs, development plans, and discount rates to incorporate the risk and current market conditions associated with realizing the expected cash flows projects.
Unproved oil and gas properties are evaluated periodically for impairment on a prospect-by-prospect basis and when there is an indication that the carrying costs may not be recoverable. We estimate the fair value of unproved properties, using a market approach, which takes into account the following significant assumptions: remaining lease terms, future development plans, risk weighted potential resource recovery, estimated reserve values, and estimated acreage value based on price(s) received for similar, recent acreage transactions by us or other market participants. Unproved oil and gas properties are impaired when we determine that the property will not be developed or the carrying value will not be realized.
Proved and unproved oil and gas properties are classified as held for sale when we commit to a plan to sell the assets and there is reasonable certainty the sale will take place within one year. Upon classification as held for sale, long-lived assets are no longer depreciated or depleted, and a measurement for impairment is performed to identify and expense any excess of carrying value over fair value less costs to sell.
We cannot predict when or if future impairment charges will be recorded because of the uncertainty in the factors discussed above. Despite any amount of future impairment being difficult to predict, based on updated commodity price assumptions as of February 15, 2017, we do not expect any material impairments on assets held for use in the first quarter of 2017 due to commodity price impacts. We do, however, anticipate recognizing an impairment in the first quarter of 2017 upon the reclassification of our remaining Williston Basin assets in Divide County, North Dakota as assets held for sale. We announced the plan to sell these assets subsequent to December 31, 2016. At year-end 2016, the estimated undiscounted cash flows for the Divide County assets exceeded the carrying amount. Based on preliminary estimates of fair value less costs to sell, we expect an impairment in the range of $200 million to $400 million to be recorded in the first quarter of 2017.
Please refer to Note 1 - Summary of Significant Accounting Policies and Note 11 - Fair Value Measurements in Part II, Item 8 of this report for impairments of oil and gas properties and other property and equipment recorded for the years ended December 31, 2016, 2015, and 2014.
Purchase Price Allocation. Accounting for the acquisition of a business requires the allocation of the purchase price to the various assets and liabilities acquired based on their estimated fair value as of the acquisition date. Various assumptions are made when estimating fair values assigned to proved and unproved oil and gas properties including: (i) reserves; (ii) production rates; (iii) future operating and development costs; (iv) future commodity prices, including price differentials; (v) future cash flows; and (vi) a market participant-based weighted average cost of capital rate. These inputs require significant judgment by management at the time of the valuation.
Asset Retirement Obligations. We are required to recognize an estimated liability for future costs associated with the abandonment of our oil and gas properties. We base our estimate of the liability on our historical experience in abandoning oil and gas wells and our current understanding of federal and state regulatory requirements. Our present value calculations require us to estimate the cost, estimate the economic lives and timing of abandonment of our properties, estimate future inflation rates, and determine what credit-adjusted risk-free discount rate to use. The impact to the accompanying consolidated statements of operations from these estimates is reflected in our depletion, depreciation, and amortization calculations and occurs over the remaining life of our respective oil and gas properties. Please refer to Note 9 – Asset Retirement Obligations in Part II, Item 8 of this report for additional discussion.
Revenue Recognition. Our revenue recognition policy is a critical accounting policy because revenue is a key component of our results of operations and our forward-looking statements contained in our analysis of liquidity and capital resources. We derive our revenue primarily from the sale of produced oil, gas, and NGLs. Revenue is recognized when our production is delivered to the purchaser, but payment is generally received between 30 and 90 days after the date of production. No revenue is recognized unless it is determined that title to the product has transferred to a purchaser. At the end of each month, we make estimates of the amount of production delivered to the purchaser and the price we will receive. We use our knowledge of our properties, contractual arrangements, their historical performance, NYMEX, local spot market, and OPIS prices, and other factors as the basis for these estimates. Variances between our estimates and the actual amounts received are
78
recorded in the month payment is received. A 10 percent change in our year-end revenue accrual would have impacted total operating revenues by approximately $10 million in 2016.
Derivative Financial Instruments. We periodically enter into commodity derivative contracts to manage our exposure to oil, gas and NGL price volatility. We recognize all gains and losses from changes in commodity derivative fair values immediately in earnings rather than deferring any such amounts in accumulated other comprehensive loss. The estimated fair value of our derivative instruments requires substantial judgment. These values are based upon, among other things, option pricing models, futures prices, volatility, time to maturity, and credit risk. The values we report in our financial statements change as these estimates are revised to reflect actual results, changes in market conditions or other factors, many of which are beyond our control.
Income Taxes. We provide for deferred income taxes on the difference between the tax basis of an asset or liability and its carrying amount in our financial statements. This difference will result in taxable income or deductions in future years when the reported amount of the asset or liability is recovered or settled, respectively. Considerable judgment is required in predicting when these events may occur and whether recovery of an asset is more likely than not. Additionally, our federal and state income tax returns are generally not filed before the consolidated financial statements are prepared. Therefore, we estimate the tax basis of our assets and liabilities at the end of each period, as well as the effects of tax rate changes, tax credits, and net operating and capital loss carryforwards and carrybacks. Adjustments related to differences between the estimates we use and actual amounts we report are recorded in the periods in which we file our income tax returns. These adjustments and changes in our estimates of asset recovery and liability settlement could have an impact on our results of operations. A one percent change in our effective tax rate would have changed our calculated income tax benefit by approximately $12 million for the year ended December 31, 2016.
Accounting Matters
Please refer to the section entitled Recently Issued Accounting Standards under Note 1 – Summary of Significant Accounting Policies in Part II, Item 8 of this report for additional information on the recent adoption of new authoritative accounting guidance.
Environmental
We believe we are in substantial compliance with environmental laws and regulations and do not currently anticipate that material future expenditures will be required under the existing regulatory framework. However, environmental laws and regulations are subject to frequent changes and we are unable to predict the impact that compliance with future laws or regulations, such as those currently being considered as discussed below, may have on future capital expenditures, liquidity, and results of operations.
Hydraulic Fracturing. Hydraulic fracturing is an important and common practice that is used to stimulate production of hydrocarbons from tight formations. For additional information about hydraulic fracturing and related environmental matters, see Risk Factors – Risks Related to Our Business – Proposed federal and state legislative and regulatory initiatives relating to hydraulic fracturing could result in increased costs and additional operating restrictions or delays.
Climate Change. In June 2013, President Obama announced a Climate Action Plan designed to further reduce greenhouse gas emissions and prepare the nation for the physical effects that may occur as a result of climate change. The Plan targets methane reductions from the oil and gas sector as part of a comprehensive interagency methane strategy. On January 14, 2015, the Obama Administration announced additional steps to reduce methane emissions from the oil and gas sector by 40 to 45 percent by 2025. Pursuant to this commitment, on May 12, 2016, the EPA issued final regulations that amend and expand the 2012 regulations by setting emission limits for greenhouse gases, or GHGs, and added requirements for previously unregulated sources. The 2016 NSPS requires reduction of greenhouse gases in the form of methane and VOCs from certain activities in oil and gas production, processing, transmission and storage and applies to facilities constructed, modified, or reconstructed after September 18, 2015. The final regulation requires, among other things, greenhouse gas and VOC emission limits for certain equipment, such as centrifugal compressors and reciprocating compressors; semi-annual leak detection and repair for well sites and quarterly for boosting and garnering compressor stations and natural gas transmission compressor stations; control requirements and emission limits for pneumatic pumps; and additional requirements for control of greenhouse gases and VOCs from well completions. Both the 2012 and 2016 rules are the subjects of Petitions for Review before the U.S. Circuit Court of Appeals for the District of Columbia. The rule does not extend to existing sources and the EPA has not indicated when it will propose existing source standards. Additionally, on November 16, 2016, the Bureau of Land Management finalized regulations to address methane emissions from oil and gas operations on federal and tribal lands, as part of President Obama’s Climate Action Plan. The regulations, named the Methane and Waste Prevention Rule, is intended to
79
reduce the waste of natural gas from flaring, venting, and leaks by oil and gas production. The rule includes requirements that prohibits venting gas except in limited circumstances and limits flaring of gas and includes requirements for leak detection and repair. The rule also increases royalty payments for “waste” gas that is released in contravention of the rule requirements. The rule, which was immediately challenged in federal district court, faces an uncertain future in the Trump Administration and is a target of rescission through the Congressional Review Act.
In August of 2015, the EPA finalized existing source performance standards as stringent state emission “goals” for utilities to reduce greenhouse gas emissions. The proposed standards focus on re-dispatching electricity from coal-fired units to natural gas combined cycle plants and renewables. In February 2016, however, the Supreme Court stayed these rules pending judicial review and the rule is expected to be significantly weakened or rescinded by the Trump Administration.
In addition, the United States Congress has from time to time considered adopting legislation to reduce emissions of greenhouse gases and almost one-half of the states have already taken legal measures to reduce emissions of greenhouse gases primarily through the planned development of greenhouse gas emission inventories and/or regional greenhouse gas cap and trade programs. Most of these cap and trade programs work by requiring major sources of emissions, such as electric power plants, or major producers of fuels, such as refineries and gas processing plants, to acquire and surrender emission allowances. The number of allowances available for purchase is reduced each year in an effort to achieve the overall greenhouse gas emission reduction goal.
The adoption of legislation or regulatory programs to reduce emissions of greenhouse gases could require us to incur increased operating costs, such as costs to purchase and operate emissions control systems, to acquire emissions allowances, or comply with new regulatory or reporting requirements. Any such legislation or regulatory programs could also increase the cost of consuming, and thereby reduce demand for, the oil and natural gas we produce. Consequently, legislation and regulatory programs to reduce emissions of greenhouse gases could have an adverse effect on our business, financial condition, and results of operations. Finally, it should be noted that some scientists have concluded that increasing concentrations of greenhouse gases in the earth’s atmosphere may produce climate changes that have significant physical effects, such as increased frequency and severity of storms, droughts, floods, and other climatic events. If any such effects were to occur, they could have an adverse effect on our financial condition and results of operations.
In terms of opportunities, the regulation of greenhouse gas emissions and the introduction of alternative incentives, such as enhanced oil recovery, carbon sequestration, and low carbon fuel standards, could benefit us in a variety of ways. For example, although federal regulation and climate change legislation could reduce the overall demand for the oil and natural gas that we produce, the relative demand for natural gas may increase because the burning of natural gas produces lower levels of emissions than other readily available fossil fuels such as oil and coal. In addition, if renewable resources, such as wind or solar power become more prevalent, natural gas-fired electric plants may provide an alternative backup to maintain consistent electricity supply. Also, if states adopt low-carbon fuel standards, natural gas may become a more attractive transportation fuel. Approximately 44 and 45 percent of our production on a BOE basis in 2016 and 2015, respectively, was natural gas. Market-based incentives for the capture and storage of carbon dioxide in underground reservoirs, particularly in oil and natural gas reservoirs, could also benefit us through the potential to obtain greenhouse gas emission allowances or offsets from or government incentives for the sequestration of carbon dioxide.
80
Non-GAAP Financial Measures
Adjusted EBITDAX represents net income (loss) before interest expense, other non-operating income or expense, income taxes, depletion, depreciation, amortization and asset retirement obligation liability accretion expense, exploration expense, property impairments, non-cash stock-based compensation expense, derivative gains and losses net of settlements, change in the Net Profits Plan liability, gains and losses on divestitures, gains or losses on extinguishment of debt, and materials inventory impairments. Adjusted EBITDAX excludes certain items that we believe affect the comparability of operating results and can exclude items that are generally one-time in nature or whose timing and/or amount cannot be reasonably estimated. Adjusted EBITDAX is a non-GAAP measure that we present because we believe it provides useful additional information to investors and analysts, as a performance measure, for analysis of our ability to internally generate funds for exploration, development, acquisitions, and to service debt. We are also subject to financial covenants under our Credit Agreement based on adjusted EBITDAX ratios as further described in Note 5 - Long-Term Debt in Part II, Item 8 of this report. In addition, adjusted EBITDAX is widely used by professional research analysts and others in the valuation, comparison, and investment recommendations of companies in the oil and gas exploration and production industry, and many investors use the published research of industry research analysts in making investment decisions. Adjusted EBITDAX should not be considered in isolation or as a substitute for net income (loss), income (loss) from operations, net cash provided by operating activities, or profitability or liquidity measures prepared under GAAP. Because adjusted EBITDAX excludes some, but not all items that affect net income (loss) and may vary among companies, the adjusted EBITDAX amounts presented may not be comparable to similar metrics of other companies. Our credit facility provides a material source of liquidity for us. Under the terms of our Credit Agreement, if we fail to comply with the covenants that establish a maximum permitted ratio of senior secured debt to adjusted EBITDAX and a minimum permitted ratio of adjusted EBITDAX to interest, we will be in default, an event that would prevent us from borrowing under our credit facility and would therefore materially limit our sources of liquidity. In addition, if we default under our credit facility and are unable to obtain a waiver of that default from our lenders, lenders under that facility and under indentures governing our outstanding Senior Notes and Senior Convertible Notes would be entitled to exercise all of their remedies for default.
81
The following table provides reconciliations of our net income (loss) and net cash provided by operating activities to adjusted EBITDAX for the periods presented:
For the Years Ended December 31, | ||||||||||||
2016 | 2015 | 2014 | ||||||||||
(in thousands) | ||||||||||||
Net income (loss) (GAAP) | $ | (757,744 | ) | $ | (447,710 | ) | $ | 666,051 | ||||
Interest expense | 158,685 | 128,149 | 98,554 | |||||||||
Other non-operating (income) expense, net | (362 | ) | (649 | ) | 2,561 | |||||||
Income tax expense (benefit) | (444,172 | ) | (275,151 | ) | 398,648 | |||||||
Depletion, depreciation, amortization, and asset retirement obligation liability accretion | 790,745 | 921,009 | 767,532 | |||||||||
Exploration (1) | 59,194 | 113,158 | 122,577 | |||||||||
Impairment of proved properties | 354,614 | 468,679 | 84,480 | |||||||||
Abandonment and impairment of unproved properties | 80,367 | 78,643 | 75,638 | |||||||||
Impairment of other property and equipment | — | 49,369 | — | |||||||||
Stock-based compensation expense | 26,897 | 27,467 | 32,694 | |||||||||
Net derivative (gain) loss | 250,633 | (408,831 | ) | (583,264 | ) | |||||||
Derivative settlement gain (2) | 329,478 | 512,566 | 12,615 | |||||||||
Change in Net Profits Plan liability | (7,200 | ) | (19,525 | ) | (29,849 | ) | ||||||
Net gain on divestiture activity | (37,074 | ) | (43,031 | ) | (646 | ) | ||||||
(Gain) loss on extinguishment of debt | (15,722 | ) | 16,578 | — | ||||||||
Materials inventory impairment | 2,436 | 4,054 | — | |||||||||
Adjusted EBITDAX (Non-GAAP) | 790,775 | 1,124,775 | 1,647,591 | |||||||||
Interest expense | (158,685 | ) | (128,149 | ) | (98,554 | ) | ||||||
Other non-operating income (expense), net | 362 | 649 | (2,561 | ) | ||||||||
Income tax (expense) benefit | 444,172 | 275,151 | (398,648 | ) | ||||||||
Exploration (1) | (59,194 | ) | (113,158 | ) | (122,577 | ) | ||||||
Exploratory dry hole expense | (16 | ) | 36,612 | 44,427 | ||||||||
Amortization of discount and deferred financing costs | 9,938 | 7,710 | 6,146 | |||||||||
Deferred income taxes | (448,643 | ) | (276,722 | ) | 397,780 | |||||||
Plugging and abandonment | (6,214 | ) | (7,496 | ) | (8,796 | ) | ||||||
Loss on extinguishment of debt | — | (12,455 | ) | — | ||||||||
Other, net | 1,063 | 9,707 | 1,069 | |||||||||
Changes in current assets and liabilities | (20,754 | ) | 61,728 | (9,302 | ) | |||||||
Net cash provided by operating activities (GAAP) | $ | 552,804 | $ | 978,352 | $ | 1,456,575 | ||||||
____________________________________________
(1) | Stock-based compensation expense is a component of exploration expense and general and administrative expense on the accompanying statements of operations. Therefore, the exploration line items shown in the reconciliation above will vary from the amount shown on the accompanying statements of operations for the component of stock-based compensation expense recorded to exploration expense. |
(2) | Derivative settlement gain for the years ended December 31, 2015, and 2014, includes $15.3 million and $5.6 million, respectively, of gains on the early settlement of futures contracts as a result of divesting our Mid-Continent assets. |
82
ITEM 7A. | QUANTITATIVE AND QUALITATIVE DISCLOSURES ABOUT MARKET RISK |
The information required by this item is provided under the captions Commodity Price Risk and Interest Rate Risk in Item 7 above, as well as under the section entitled Summary of Oil, Gas, and NGL Derivative Contracts in Place under Note 10 – Derivative Financial Instruments in Part II, Item 8 of this report and is incorporated herein by reference.
83
ITEM 8. FINANCIAL STATEMENTS AND SUPPLEMENTARY DATA
Report of Independent Registered Public Accounting Firm
The Board of Directors and Stockholders of SM Energy Company and subsidiaries
We have audited the accompanying consolidated balance sheets of SM Energy Company and subsidiaries as of December 31, 2016 and 2015, and the related consolidated statements of operations, comprehensive income (loss), stockholders’ equity, and cash flows for each of the three years in the period ended December 31, 2016. These financial statements are the responsibility of the Company’s management. Our responsibility is to express an opinion on these financial statements based on our audits.
We conducted our audits in accordance with the standards of the Public Company Accounting Oversight Board (United States). Those standards require that we plan and perform the audit to obtain reasonable assurance about whether the financial statements are free of material misstatement. An audit includes examining, on a test basis, evidence supporting the amounts and disclosures in the financial statements. An audit also includes assessing the accounting principles used and significant estimates made by management, as well as evaluating the overall financial statement presentation. We believe that our audits provide a reasonable basis for our opinion.
In our opinion, the financial statements referred to above present fairly, in all material respects, the consolidated financial position of SM Energy Company and subsidiaries at December 31, 2016 and 2015, and the consolidated results of their operations and their cash flows for each of the three years in the period ended December 31, 2016, in conformity with U.S. generally accepted accounting principles.
We also have audited, in accordance with the standards of the Public Company Accounting Oversight Board (United States), SM Energy Company and subsidiaries’ internal control over financial reporting as of December 31, 2016, based on criteria established in Internal Control-Integrated Framework issued by the Committee of Sponsoring Organizations of the Treadway Commission (2013 framework), and our report dated February 23, 2017 expressed an unqualified opinion thereon.
/s/ Ernst & Young LLP
Denver, Colorado
February 23, 2017
84
SM ENERGY COMPANY AND SUBSIDIARIES
CONSOLIDATED BALANCE SHEETS
(in thousands, except share amounts)
December 31, | |||||||
2016 | 2015 | ||||||
ASSETS | |||||||
Current assets: | |||||||
Cash and cash equivalents | $ | 9,372 | $ | 18 | |||
Accounts receivable | 151,950 | 134,124 | |||||
Derivative asset | 54,521 | 367,710 | |||||
Prepaid expenses and other | 8,799 | 17,137 | |||||
Total current assets | 224,642 | 518,989 | |||||
Property and equipment (successful efforts method): | |||||||
Proved oil and gas properties | 5,700,418 | 7,606,405 | |||||
Less - accumulated depletion, depreciation, and amortization | (2,836,532 | ) | (3,481,836 | ) | |||
Unproved oil and gas properties | 2,471,947 | 284,538 | |||||
Wells in progress | 235,147 | 387,432 | |||||
Oil and gas properties held for sale, net | 372,621 | 641 | |||||
Other property and equipment, net of accumulated depreciation of $42,882 and $32,956, respectively | 137,753 | 153,100 | |||||
Total property and equipment, net | 6,081,354 | 4,950,280 | |||||
Noncurrent assets: | |||||||
Derivative asset | 67,575 | 120,701 | |||||
Other noncurrent assets | 19,940 | 31,673 | |||||
Total other noncurrent assets | 87,515 | 152,374 | |||||
Total Assets | $ | 6,393,511 | $ | 5,621,643 | |||
LIABILITIES AND STOCKHOLDERS’ EQUITY | |||||||
Current liabilities: | |||||||
Accounts payable and accrued expenses | $ | 299,708 | $ | 302,517 | |||
Derivative liability | 115,464 | 8 | |||||
Total current liabilities | 415,172 | 302,525 | |||||
Noncurrent liabilities: | |||||||
Revolving credit facility | — | 202,000 | |||||
Senior Notes, net of unamortized deferred financing costs | 2,766,719 | 2,315,970 | |||||
Senior Convertible Notes, net of unamortized discount and deferred financing costs | 130,856 | — | |||||
Asset retirement obligation | 96,134 | 137,284 | |||||
Asset retirement obligation associated with oil and gas properties held for sale | 26,241 | 241 | |||||
Deferred income taxes | 315,672 | 758,279 | |||||
Derivative liability | 98,340 | — | |||||
Other noncurrent liabilities | 47,244 | 52,943 | |||||
Total noncurrent liabilities | 3,481,206 | 3,466,717 | |||||
Commitments and contingencies (note 6) | |||||||
Stockholders’ equity: | |||||||
Common stock, $0.01 par value - authorized: 200,000,000 shares; issued and outstanding: 111,257,500 and 68,075,700 shares, respectively | 1,113 | 681 | |||||
Additional paid-in capital | 1,716,556 | 305,607 | |||||
Retained earnings | 794,020 | 1,559,515 | |||||
Accumulated other comprehensive loss | (14,556 | ) | (13,402 | ) | |||
Total stockholders’ equity | 2,497,133 | 1,852,401 | |||||
Total Liabilities and Stockholders’ Equity | $ | 6,393,511 | $ | 5,621,643 | |||
The accompanying notes are an integral part of these consolidated financial statements.
85
SM ENERGY COMPANY AND SUBSIDIARIES
CONSOLIDATED STATEMENTS OF OPERATIONS
(in thousands, except per share amounts)
For the Years Ended December 31, | |||||||||||
2016 | 2015 | 2014 | |||||||||
Operating revenues and other income: | |||||||||||
Oil, gas, and NGL production revenue | $ | 1,178,426 | $ | 1,499,905 | $ | 2,481,544 | |||||
Net gain on divestiture activity | 37,074 | 43,031 | 646 | ||||||||
Marketed gas system revenue | — | 9,485 | 24,897 | ||||||||
Other operating revenues | 1,950 | 4,544 | 15,220 | ||||||||
Total operating revenues and other income | 1,217,450 | 1,556,965 | 2,522,307 | ||||||||
Operating expenses: | |||||||||||
Oil, gas, and NGL production expense | 597,565 | 723,633 | 715,878 | ||||||||
Depletion, depreciation, amortization, and asset retirement obligation liability accretion | 790,745 | 921,009 | 767,532 | ||||||||
Exploration | 65,641 | 120,569 | 129,857 | ||||||||
Impairment of proved properties | 354,614 | 468,679 | 84,480 | ||||||||
Abandonment and impairment of unproved properties | 80,367 | 78,643 | 75,638 | ||||||||
Impairment of other property and equipment | — | 49,369 | — | ||||||||
General and administrative | 126,428 | 157,668 | 167,103 | ||||||||
Change in Net Profits Plan liability | (7,200 | ) | (19,525 | ) | (29,849 | ) | |||||
Net derivative (gain) loss | 250,633 | (408,831 | ) | (583,264 | ) | ||||||
Marketed gas system expense | — | 13,922 | 24,460 | ||||||||
Other operating expenses | 17,972 | 30,612 | 4,658 | ||||||||
Total operating expenses | 2,276,765 | 2,135,748 | 1,356,493 | ||||||||
Income (loss) from operations | (1,059,315 | ) | (578,783 | ) | 1,165,814 | ||||||
Non-operating income (expense): | |||||||||||
Interest expense | (158,685 | ) | (128,149 | ) | (98,554 | ) | |||||
Gain (loss) on extinguishment of debt | 15,722 | (16,578 | ) | — | |||||||
Other, net | 362 | 649 | (2,561 | ) | |||||||
Income (loss) before income taxes | (1,201,916 | ) | (722,861 | ) | 1,064,699 | ||||||
Income tax (expense) benefit | 444,172 | 275,151 | (398,648 | ) | |||||||
Net income (loss) | $ | (757,744 | ) | $ | (447,710 | ) | $ | 666,051 | |||
Basic weighted-average common shares outstanding | 76,568 | 67,723 | 67,230 | ||||||||
Diluted weighted-average common shares outstanding | 76,568 | 67,723 | 68,044 | ||||||||
Basic net income (loss) per common share | $ | (9.90 | ) | $ | (6.61 | ) | $ | 9.91 | |||
Diluted net income (loss) per common share | $ | (9.90 | ) | $ | (6.61 | ) | $ | 9.79 | |||
The accompanying notes are an integral part of these consolidated financial statements.
86
SM ENERGY COMPANY AND SUBSIDIARIES
CONSOLIDATED STATEMENTS OF COMPREHENSIVE INCOME (LOSS)
(in thousands)
For the Years Ended December 31, | |||||||||||
2016 | 2015 | 2014 | |||||||||
Net income (loss) | $ | (757,744 | ) | $ | (447,710 | ) | $ | 666,051 | |||
Other comprehensive loss, net of tax: | |||||||||||
Pension liability adjustment (1) | (1,154 | ) | (2,090 | ) | (5,896 | ) | |||||
Total other comprehensive loss, net of tax | (1,154 | ) | (2,090 | ) | (5,896 | ) | |||||
Total comprehensive income (loss) | $ | (758,898 | ) | $ | (449,800 | ) | $ | 660,155 | |||
____________________________________________
(1) | Refer to Note 1 - Summary of Significant Accounting Policies for detail of the pension amount reclassified to general and administrative expense on the Company’s consolidated statements of operations. |
The accompanying notes are an integral part of these consolidated financial statements.
87
SM ENERGY COMPANY AND SUBSIDIARIES
CONSOLIDATED STATEMENTS OF STOCKHOLDERS’ EQUITY
(in thousands, except share amounts)
Additional Paid-in Capital | Accumulated Other Comprehensive Loss | Total Stockholders’ Equity | |||||||||||||||||||||||||||
Common Stock | Treasury Stock | Retained Earnings | |||||||||||||||||||||||||||
Shares | Amount | Shares | Amount | ||||||||||||||||||||||||||
Balances, January 1, 2014 | 67,078,853 | $ | 671 | $ | 257,720 | (22,412 | ) | $ | (823 | ) | $ | 1,354,669 | $ | (5,416 | ) | $ | 1,606,821 | ||||||||||||
Net income | — | — | — | — | — | 666,051 | — | 666,051 | |||||||||||||||||||||
Other comprehensive loss | — | — | — | — | — | — | (5,896 | ) | (5,896 | ) | |||||||||||||||||||
Cash dividends, $ 0.10 per share | — | — | — | — | — | (6,723 | ) | — | (6,723 | ) | |||||||||||||||||||
Issuance of common stock under Employee Stock Purchase Plan | 83,136 | 1 | 4,060 | — | — | — | — | 4,061 | |||||||||||||||||||||
Issuance of common stock upon vesting of RSUs and settlement of PSUs, net of shares used for tax withholdings | 256,718 | 3 | (10,627 | ) | — | — | — | — | (10,624 | ) | |||||||||||||||||||
Issuance of common stock upon stock option exercises | 39,088 | — | 816 | — | — | — | — | 816 | |||||||||||||||||||||
Stock-based compensation expense | 5,265 | — | 31,871 | 22,412 | 823 | — | — | 32,694 | |||||||||||||||||||||
Other income tax expense | — | — | (545 | ) | — | — | — | — | (545 | ) | |||||||||||||||||||
Balances, December 31, 2014 | 67,463,060 | $ | 675 | $ | 283,295 | — | $ | — | $ | 2,013,997 | $ | (11,312 | ) | $ | 2,286,655 | ||||||||||||||
Net loss | — | — | — | — | — | (447,710 | ) | — | (447,710 | ) | |||||||||||||||||||
Other comprehensive loss | — | — | — | — | — | — | (2,090 | ) | (2,090 | ) | |||||||||||||||||||
Cash dividends, $ 0.10 per share | — | — | — | — | — | (6,772 | ) | — | (6,772 | ) | |||||||||||||||||||
Issuance of common stock under Employee Stock Purchase Plan | 197,214 | 2 | 4,842 | — | — | — | — | 4,844 | |||||||||||||||||||||
Issuance of common stock upon vesting of RSUs and settlement of PSUs, net of shares used for tax withholdings | 375,523 | 4 | (8,682 | ) | — | — | — | — | (8,678 | ) | |||||||||||||||||||
Stock-based compensation expense | 39,903 | — | 27,467 | — | — | — | — | 27,467 | |||||||||||||||||||||
Other income tax expense | — | — | (1,315 | ) | — | — | — | — | (1,315 | ) | |||||||||||||||||||
Balances, December 31, 2015 | 68,075,700 | $ | 681 | $ | 305,607 | — | $ | — | $ | 1,559,515 | $ | (13,402 | ) | $ | 1,852,401 | ||||||||||||||
Net loss | — | — | — | — | — | (757,744 | ) | — | (757,744 | ) | |||||||||||||||||||
Other comprehensive loss | — | — | — | — | — | — | (1,154 | ) | (1,154 | ) | |||||||||||||||||||
Cash dividends, $ 0.10 per share | — | — | — | — | — | (7,751 | ) | — | (7,751 | ) | |||||||||||||||||||
Issuance of common stock under Employee Stock Purchase Plan | 218,135 | 2 | 4,196 | — | — | — | — | 4,198 | |||||||||||||||||||||
Issuance of common stock upon vesting of RSUs and settlement of PSUs, net of shares used for tax withholdings | 199,243 | 2 | (2,356 | ) | — | — | — | — | (2,354 | ) | |||||||||||||||||||
Stock-based compensation expense | 53,473 | 1 | 26,896 | — | — | — | — | 26,897 | |||||||||||||||||||||
Issuance of common stock from stock offerings, net of tax | 42,710,949 | 427 | 1,382,666 | — | — | — | — | 1,383,093 | |||||||||||||||||||||
Equity component of 1.50% Senior Convertible Notes due 2021 issuance, net of tax | — | — | 33,575 | — | — | — | — | 33,575 | |||||||||||||||||||||
Purchase of capped call transactions | — | — | (24,195 | ) | — | — | — | — | (24,195 | ) | |||||||||||||||||||
Other income tax expense | — | — | (9,833 | ) | — | — | — | — | (9,833 | ) | |||||||||||||||||||
Balances, December 31, 2016 | 111,257,500 | $ | 1,113 | $ | 1,716,556 | — | $ | — | $ | 794,020 | $ | (14,556 | ) | $ | 2,497,133 | ||||||||||||||
The accompanying notes are an integral part of these consolidated financial statements.
88
SM ENERGY COMPANY AND SUBSIDIARIES
CONSOLIDATED STATEMENTS OF CASH FLOWS
(in thousands)
For the Years Ended December 31, | |||||||||||
2016 | 2015 | 2014 | |||||||||
Cash flows from operating activities: | |||||||||||
Net income (loss) | $ | (757,744 | ) | $ | (447,710 | ) | $ | 666,051 | |||
Adjustments to reconcile net income (loss) to net cash provided by operating activities: | |||||||||||
Net gain on divestiture activity | (37,074 | ) | (43,031 | ) | (646 | ) | |||||
Depletion, depreciation, amortization, and asset retirement obligation liability accretion | 790,745 | 921,009 | 767,532 | ||||||||
Exploratory dry hole expense | (16 | ) | 36,612 | 44,427 | |||||||
Impairment of proved properties | 354,614 | 468,679 | 84,480 | ||||||||
Abandonment and impairment of unproved properties | 80,367 | 78,643 | 75,638 | ||||||||
Impairment of other property and equipment | — | 49,369 | — | ||||||||
Stock-based compensation expense | 26,897 | 27,467 | 32,694 | ||||||||
Change in Net Profits Plan liability | (7,200 | ) | (19,525 | ) | (29,849 | ) | |||||
Net derivative (gain) loss | 250,633 | (408,831 | ) | (583,264 | ) | ||||||
Derivative settlement gain | 329,478 | 512,566 | 12,615 | ||||||||
Amortization of discount and deferred financing costs | 9,938 | 7,710 | 6,146 | ||||||||
Non-cash (gain) loss on extinguishment of debt | (15,722 | ) | 4,123 | — | |||||||
Deferred income taxes | (448,643 | ) | (276,722 | ) | 397,780 | ||||||
Plugging and abandonment | (6,214 | ) | (7,496 | ) | (8,796 | ) | |||||
Other, net | 3,499 | 13,761 | 1,069 | ||||||||
Changes in current assets and liabilities: | |||||||||||
Accounts receivable | (10,562 | ) | 140,200 | 24,088 | |||||||
Prepaid expenses and other | 8,478 | 2,563 | (1,822 | ) | |||||||
Accounts payable and accrued expenses | (53,210 | ) | (86,267 | ) | 9,466 | ||||||
Accrued derivative settlements | 34,540 | 5,232 | (41,034 | ) | |||||||
Net cash provided by operating activities | 552,804 | 978,352 | 1,456,575 | ||||||||
Cash flows from investing activities: | |||||||||||
Net proceeds from the sale of oil and gas properties | 946,062 | 357,938 | 43,858 | ||||||||
Capital expenditures | (629,911 | ) | (1,493,608 | ) | (1,974,798 | ) | |||||
Acquisition of proved and unproved oil and gas properties | (2,183,790 | ) | (7,984 | ) | (544,553 | ) | |||||
Other, net | (3,000 | ) | (985 | ) | (3,256 | ) | |||||
Net cash used in investing activities | (1,870,639 | ) | (1,144,639 | ) | (2,478,749 | ) | |||||
Cash flows from financing activities: | |||||||||||
Proceeds from credit facility | 947,000 | 1,872,500 | 1,285,500 | ||||||||
Repayment of credit facility | (1,149,000 | ) | (1,836,500 | ) | (1,119,500 | ) | |||||
Debt issuance costs related to credit facility | (3,132 | ) | — | (3,388 | ) | ||||||
Net proceeds from Senior Notes | 491,640 | 490,951 | 589,991 | ||||||||
Cash paid to repurchase Senior Notes | (29,904 | ) | (350,000 | ) | — | ||||||
Net proceeds from Senior Convertible Notes | 166,617 | — | — | ||||||||
Cash paid for capped call transactions | (24,195 | ) | — | — | |||||||
Net proceeds from sale of common stock | 938,268 | 4,844 | 4,877 | ||||||||
Dividends paid | (7,751 | ) | (6,772 | ) | (6,723 | ) | |||||
Net share settlement from issuance of stock awards | (2,354 | ) | (8,678 | ) | (10,624 | ) | |||||
Other, net | — | (160 | ) | (87 | ) | ||||||
Net cash provided by financing activities | 1,327,189 | 166,185 | 740,046 | ||||||||
Net change in cash and cash equivalents | 9,354 | (102 | ) | (282,128 | ) | ||||||
Cash and cash equivalents at beginning of period | 18 | 120 | 282,248 | ||||||||
Cash and cash equivalents at end of period | $ | 9,372 | $ | 18 | $ | 120 | |||||
The accompanying notes are an integral part of these consolidated financial statements.
89
SM ENERGY COMPANY AND SUBSIDIARIES
CONSOLIDATED STATEMENTS OF CASH FLOWS (Continued)
Supplemental schedule of additional cash flow information and non-cash activities:
For the Years Ended December 31, | |||||||||||
2016 | 2015 | 2014 | |||||||||
(in thousands) | |||||||||||
Supplemental Cash Flow Information: | |||||||||||
Operating activities: | |||||||||||
Cash paid for interest, net of capitalized interest | $ | 129,761 | $ | 126,988 | $ | 89,145 | |||||
Net cash (refunded) paid for income taxes | $ | (4,690 | ) | $ | 1,630 | $ | 1,936 | ||||
Investing activities: | |||||||||||
Changes in capital expenditure accruals and other | $ | 8,044 | $ | (210,819 | ) | $ | 130,143 | ||||
Supplemental Non-Cash Investing Activities: | |||||||||||
Fair value of properties exchanged | $ | 733 | $ | — | $ | 6,164 | |||||
Supplemental Non-Cash Financing Activities: | |||||||||||
Issuance of common stock for an asset acquisition (1) | $ | 437,194 | $ | — | $ | — | |||||
____________________________________________
(1) | Refer to Note 3 - Acquisitions, Divestitures, and Assets Held for Sale and Note 15 - Equity for additional discussion. |
90
SM ENERGY COMPANY AND SUBSIDIARIES
NOTES TO CONSOLIDATED FINANCIAL STATEMENTS
Note 1 – Summary of Significant Accounting Policies
Description of Operations
SM Energy Company is an independent energy company engaged in the acquisition, exploration, development, and production of crude oil and condensate, natural gas, and NGLs in onshore North America.
Basis of Presentation
The accompanying consolidated financial statements include the accounts of the Company and its wholly-owned subsidiaries and have been prepared in accordance with GAAP and the instructions to Form 10-K and Regulation S-X. Intercompany accounts and transactions have been eliminated. In connection with the preparation of the consolidated financial statements, the Company evaluated subsequent events after the balance sheet date of December 31, 2016, through the filing date of this report. Additionally, certain prior period amounts have been reclassified to conform to current period presentation in the consolidated financial statements.
Use of Estimates in the Preparation of Financial Statements
The preparation of financial statements in conformity with GAAP requires management to make estimates and assumptions that affect the reported amounts of proved oil and gas reserves, assets and liabilities, disclosure of contingent assets and liabilities at the date of the financial statements, and the reported amounts of revenues and expenses during the reporting period. Actual results could differ from those estimates. Estimates of proved oil and gas reserve quantities provide the basis for the calculation of depletion, depreciation, and amortization expense, impairment of proved properties, and asset retirement obligations, each of which represents a significant component of the accompanying consolidated financial statements.
Cash and Cash Equivalents
The Company considers all liquid investments purchased with an initial maturity of three months or less to be cash equivalents. The carrying value of cash and cash equivalents approximates fair value due to the short-term nature of these instruments.
Accounts Receivable
The Company’s accounts receivable consist mainly of receivables from oil, gas, and NGL purchasers and from joint interest owners on properties the Company operates. For receivables from joint interest owners, the Company typically has the ability to withhold future revenue disbursements to recover non-payment of joint interest billings. Generally, the Company’s oil and gas receivables are collected within two months and the Company has had minimal bad debts.
Although diversified among many companies, collectability is dependent upon the financial wherewithal of each individual company and is influenced by the general economic conditions of the industry. Receivables are not collateralized. The Company’s allowance for doubtful accounts as of December 31, 2016, and 2015, totaled $1.7 million and $1.1 million, respectively, primarily for receivables from joint interest owners.
Concentration of Credit Risk and Major Customers
The Company is exposed to credit risk in the event of nonpayment by counterparties, a significant portion of which are concentrated in energy related industries. The creditworthiness of customers and other counterparties is subject to regular review.
91
The Company does not believe the loss of any single purchaser of its production would materially impact its operating results, as crude oil, natural gas, and NGLs are products with well-established markets and numerous purchasers in the Company’s operating regions. The Company had the following major customer and sales to entities under common ownership, which accounted for 10 percent or more of its total oil, natural gas, and NGL production revenue for at least one of the periods presented:
For the Years Ended December 31, | ||||||||
2016 | 2015 | 2014 | ||||||
Major customer (1) | 18 | % | 21 | % | 19 | % | ||
Group #1 of entities under common ownership (2) | 15 | % | 10 | % | 14 | % | ||
Group #2 of entities under common ownership (2) | 8 | % | 11 | % | 9 | % | ||
____________________________________________
(1) | This major customer is the operator of the Company’s outside-operated Eagle Ford shale program, in which the Company entered into various marketing agreements with during 2013, whereby the Company is subject to certain gathering, transportation, and processing throughput commitments for up to 10 years pursuant to each contract. Because the Company shares with its operator the risk of non-performance by its counterparty purchasers, the Company has included its operator as a major customer in the table above. Several of the operator’s counterparty purchasers under these contracts are also direct purchasers of the Company’s production from other areas. As of December 31, 2016, the Company’s outside-operated Eagle Ford shale assets were classified as held for sale. |
(2) | In the aggregate these groups of entities under common ownership represent more than 10 percent of total production revenue for the period(s) shown, however, none of the entities comprising either group individually represented more than 10 percent of the Company’s production revenue. |
The Company’s policy is to use the commodity affiliates of the lenders under its Credit Agreement as its derivative counterparties, and each counterparty must have investment grade senior unsecured debt ratings. Each of the Company’s 10 derivative counterparties meet both of these requirements as of the filing date of this report.
The Company has accounts in the following locations with a national bank: Denver, Colorado; Houston, Texas; Midland, Texas; and Billings, Montana. The Company’s policy is to invest in highly-rated instruments and to limit the amount of credit exposure at each individual institution.
Oil and Gas Producing Activities
Proved properties. The Company follows the successful efforts method of accounting for its oil and gas properties. Under this method, the costs of development wells are capitalized whether those wells are successful or unsuccessful. Capitalized drilling costs, including lease and well equipment and intangible development costs, are depleted as a group of assets (properties aggregated with a common geological structure) using the units-of-production method based on estimated proved developed oil and gas reserves. Similarly, producing leasehold costs are depleted on the same group asset basis; however, the units-of-production method is based on estimated total proved oil and gas reserves. The computation of DD&A takes into consideration restoration, dismantlement, and abandonment costs as well as the anticipated proceeds from salvaging equipment.
Proved oil and gas property costs are evaluated for impairment and reduced to fair value when there is an indication that the carrying costs may not be recoverable. Expected future discounted cash flows are calculated on all proved reserves and risk adjusted probable and possible reserves using discount rates and price forecasts that management believes are representative of current market conditions. The prices for oil and gas are forecasted based on NYMEX strip pricing, adjusted for basis differentials, for the first five years, after which a flat terminal price is used for each commodity stream. The prices for NGLs are forecasted using OPIS pricing, adjusted for basis differentials, for as long as the market is actively trading, after which a flat terminal price is used. Future operating costs are also adjusted as deemed appropriate for these estimates. Please refer to Note 11 – Fair Value Measurements for additional discussion.
The partial sale of a proved property within an existing field is accounted for as a normal retirement and no net gain or loss on divestiture activity is recognized as long as the treatment does not significantly affect the units-of-production depletion rate. The sale of a partial interest in an individual proved property is accounted for as a recovery of cost. A net gain or loss on divestiture activity is recognized in the accompanying consolidated statements of operations (“accompanying statements of operations”) for all other sales of proved properties.
92
Unproved properties. Unproved properties consist of costs to acquire undeveloped leases as well as acquisitions of unproved reserves. When successful wells are drilled on undeveloped leaseholds, unproved property costs are reclassified to proved properties and depleted on a units-of-production basis. An impairment is recorded on unproved property when the Company determines that either the property will not be developed or the carrying value is not realizable. Please refer to Note 11 – Fair Value Measurements for additional discussion.
The partial sale of unproved property is accounted for as a recovery of cost when substantial uncertainty exists as to the ultimate recovery of the cost applicable to the interest retained. A net gain on divestiture activity is recognized to the extent that the sales price exceeds the carrying amount of the unproved property. A net gain or loss on divestiture activity is recognized in the accompanying statements of operations for all other sales of unproved property.
Exploratory. G&G, including exploratory seismic studies, and the costs of carrying and retaining unproved acreage are expensed as incurred. Under the successful efforts method, exploratory well costs are capitalized pending further evaluation of whether economically recoverable reserves have been found. If economically recoverable reserves are not found, exploratory well costs are expensed as dry holes. The application of the successful efforts method of accounting requires management’s judgment to determine the proper designation of wells as either development or exploratory, which will ultimately determine the proper accounting treatment of costs of dry holes. Once a well is drilled, the determination that economic proved reserves have been discovered may take considerable time and judgment. Exploratory dry hole costs are included in cash flows from investing activities as part of capital expenditures within the accompanying consolidated statements of cash flows.
Other Property and Equipment
Other property and equipment such as facilities, office furniture and equipment, buildings, and computer hardware and software are recorded at cost. The Company capitalizes certain software costs incurred during the application development stage. The application development stage generally includes software design, configuration, testing and installation activities. Costs of renewals and improvements that substantially extend the useful lives of the assets are capitalized. Maintenance and repair costs are expensed when incurred. Depreciation is calculated using either the straight-line method over the estimated useful lives of the assets, which range from three to 30 years, or the unit of output method where appropriate. When other property and equipment is sold or retired, the capitalized costs and related accumulated depreciation are removed from the accounts.
A long-lived asset is evaluated for impairment and reduced to fair value when there is an indication that the carrying costs may not be recoverable. The Company uses an income valuation technique if there is not a market-observable price for the asset. Please refer to Note 11 - Fair Value Measurements for additional discussion.
Assets Held for Sale
Any properties held for sale as of the balance sheet date have been classified as assets held for sale and are separately presented on the accompanying consolidated balance sheets (“accompanying balance sheets”) at the lower of carrying value or fair value less the cost to sell. Please refer to Note 3 – Acquisitions, Divestitures, and Assets Held for Sale and Note 11 - Fair Value Measurements for additional discussion.
Asset Retirement Obligations
The Company recognizes an estimated liability for future costs associated with the abandonment of its oil and gas properties, including facilities requiring decommissioning. A liability for the fair value of an asset retirement obligation and corresponding increase to the carrying value of the related long-lived asset are recorded at the time a well is drilled or acquired and a facility is constructed. The increase in carrying value is included in proved oil and gas properties in the accompanying balance sheets. The Company depletes the amount added to proved oil and gas property costs and recognizes expense in connection with the accretion of the discounted liability over the remaining estimated economic lives of the respective oil and gas properties. Cash paid to settle asset retirement obligations is included in the operating section of the Company’s accompanying consolidated statements of cash flows.
93
The Company’s estimated asset retirement obligation liability is based on historical experience in plugging and abandoning wells, estimated economic lives, estimated plugging and abandonment cost, and federal and state regulatory requirements. The liability is discounted using the credit-adjusted risk-free rate estimated at the time the liability is incurred or revised. The credit-adjusted risk-free rates used to discount the Company’s plugging and abandonment liabilities range from 5.5 percent to 12 percent. In periods subsequent to initial measurement of the liability, the Company must recognize period-to-period changes in the liability resulting from the passage of time, revisions to either the amount of the original estimate of undiscounted cash flows or changes in inflation factors or the Company’s credit-adjusted risk-free rate as market conditions warrant. Please refer to Note 9 – Asset Retirement Obligations for a reconciliation of the Company’s total asset retirement obligation liability as of December 31, 2016, and 2015.
Derivative Financial Instruments
The Company seeks to manage or reduce commodity price risk on its production by entering into derivative contracts. The Company seeks to minimize its basis risk and indexes its oil derivative contracts to NYMEX prices, its NGL derivative contracts to OPIS prices, and its gas derivative contracts to various regional index prices associated with pipelines into which the Company’s gas production is sold. The Company does not designate its derivative instruments to qualify for hedge accounting. Accordingly, the Company reflects changes in the fair value of its derivative instruments in its accompanying statements of operations as they occur. For additional discussion on derivatives, please see Note 10 – Derivative Financial Instruments.
Revenue Recognition
The Company derives revenue primarily from the sale of produced oil, gas, and NGLs. Revenue is recognized when the Company’s production is delivered to the purchaser, but payment is generally received between 30 and 90 days after the date of production. No revenue is recognized unless it is determined that title to the product has transferred to the purchaser. At the end of each month, the Company estimates the amount of production delivered to the purchaser and the price the Company will receive. The Company uses knowledge of its properties and historical performance, contractual agreements, NYMEX, OPIS, and local spot market prices, quality and transportation differentials, and other factors as the basis for these estimates. The Company follows the sales method of accounting for natural gas production imbalances. If the Company’s sales volumes for a well exceed the Company’s proportionate share of production from the well, a liability is recognized to the extent that the Company’s share of estimated remaining recoverable reserves from the well is insufficient to satisfy this imbalance.
Stock-Based Compensation
At December 31, 2016, the Company had stock-based employee compensation plans that included RSUs and PSUs issued to employees and restricted stock issued to non-employee directors, as well as an employee stock purchase plan available to eligible employees. These are more fully described in Note 7 - Compensation Plans. The Company records expense associated with the fair value of stock-based compensation in accordance with authoritative accounting guidance, which is based on the estimated fair value of these awards determined at the time of grant, and included within general and administrative expense and exploration expense in the accompanying statements of operations.
Income Taxes
The Company accounts for deferred income taxes whereby deferred tax assets and liabilities are recognized based on the tax effects of temporary differences between the carrying amounts on the financial statements and the tax basis of assets and liabilities, as measured using current enacted tax rates. These differences will result in taxable income or deductions in future years when the reported amounts of the assets or liabilities are recorded or settled, respectively. The Company records deferred tax assets and associated valuation allowances, when appropriate, to reflect amounts more likely than not to be realized based upon Company analysis.
94
Earnings per Share
Basic net income (loss) per common share is calculated by dividing net income or loss available to common stockholders by the basic weighted-average common shares outstanding for the respective period. The earnings per share calculations reflect the impact of any repurchases of shares of common stock made by the Company.
Diluted net income (loss) per common share is calculated by dividing adjusted net income or loss by the diluted weighted-average common shares outstanding, which includes the effect of potentially dilutive securities. Potentially dilutive securities for this calculation consist of unvested RSUs, contingent PSUs, shares issuable upon the conversion of the Senior Convertible Notes, and in-the-money outstanding stock options, which are measured using the treasury stock method. All outstanding stock options were exercised during the year ended December 31, 2014. When the Company recognizes a loss from continuing operations, as was the case for the years ended December 31, 2016, and 2015, all potentially dilutive shares are anti-dilutive and are consequently excluded from the calculation of diluted earnings per share.
PSUs represent the right to receive, upon settlement of the PSUs after the completion of the three-year performance period, a number of shares of the Company’s common stock that may range from zero to two times the number of PSUs granted on the award date. The number of potentially dilutive shares related to PSUs is based on the number of shares, if any, which would be issuable at the end of the respective reporting period, assuming that date was the end of the contingency period applicable to such PSUs. For additional discussion on PSUs, please refer to Note 7 – Compensation Plans under the heading Performance Share Units.
On August 12, 2016, the Company issued $172.5 million in aggregate principal amount of Senior Convertible Notes due 2021. Upon conversion, the Senior Convertible Notes may be settled, at the Company’s election, in shares of the Company’s common stock, cash, or a combination of cash and common stock. The Company has initially elected a net-settlement method to satisfy its conversion obligation, which allows the Company to settle the principal amount of the Senior Convertible Notes in cash and to settle the excess conversion value in shares, as well as cash in lieu of fractional shares. However, the Company reserves the right to settle the Senior Convertible Notes in any manner allowed under the indenture as business conditions warrant. Shares of the Company’s common stock traded at an average closing price below the $40.50 conversion price for the portion of the year ended December 31, 2016, during which the Senior Convertible Notes were outstanding. In connection with the Senior Convertible Notes offering, the Company entered into capped call transactions with affiliates of the underwriters that effectively prevent dilution upon settlement up to the $60.00 cap price. The capped call transactions are not reflected in diluted net income per share, nor will they ever be, as they are anti-dilutive. Please refer to Note 5 - Long-Term Debt for additional discussion.
The following table details the weighted-average dilutive and anti-dilutive securities for the years presented:
For the Years Ended December 31, | ||||||||
2016 | 2015 | 2014 | ||||||
(in thousands) | ||||||||
Dilutive | — | — | 814 | |||||
Anti-dilutive | 280 | 256 | — | |||||
95
The following table sets forth the calculations of basic and diluted earnings per share:
For the Years Ended December 31, | |||||||||||
2016 | 2015 | 2014 | |||||||||
(in thousands, except per share amounts) | |||||||||||
Net income (loss) | $ | (757,744 | ) | $ | (447,710 | ) | $ | 666,051 | |||
Basic weighted-average common shares outstanding | 76,568 | 67,723 | 67,230 | ||||||||
Add: dilutive effect of unvested RSUs, contingent PSUs, and stock options (1) | — | — | 814 | ||||||||
Add: dilutive effect of 1.50% Senior Convertible Notes (2) | — | — | — | ||||||||
Diluted weighted-average common shares outstanding | 76,568 | 67,723 | 68,044 | ||||||||
Basic net income (loss) per common share | $ | (9.90 | ) | $ | (6.61 | ) | $ | 9.91 | |||
Diluted net income (loss) per common share | $ | (9.90 | ) | $ | (6.61 | ) | $ | 9.79 | |||
____________________________________________
(1) | For the years ended December 31, 2016, and 2015, the shares were anti-dilutive and excluded from the calculation of diluted earnings per share. |
(2) | For the year ended December 31, 2016, shares of the Company’s common stock traded at an average closing price below the $40.50 conversion price, and therefore, had no dilutive impact and were excluded from the calculation of diluted earnings per share. |
Comprehensive Income (Loss)
Comprehensive income (loss) is used to refer to net income (loss) plus other comprehensive income (loss). Other comprehensive income (loss) is comprised of revenues, expenses, gains, and losses that under GAAP are reported as separate components of stockholders’ equity instead of net income (loss). Comprehensive income (loss) is presented net of income taxes in the accompanying consolidated statements of comprehensive income (loss).
The changes in the balances of components comprising other comprehensive income (loss) are presented in the following table:
Pension Liability Adjustments | |||
(in thousands) | |||
For the year ended December 31, 2014 | |||
Net actuarial loss | $ | (10,062 | ) |
Reclassification to earnings | 706 | ||
Tax benefit | 3,460 | ||
Loss, net of tax | $ | (5,896 | ) |
For the year ended December 31, 2015 | |||
Net actuarial loss | $ | (4,990 | ) |
Reclassification to earnings | 1,853 | ||
Tax benefit | 1,047 | ||
Loss, net of tax | $ | (2,090 | ) |
For the year ended December 31, 2016 | |||
Net actuarial loss | $ | (3,322 | ) |
Reclassification to earnings | 1,598 | ||
Tax benefit | 570 | ||
Loss, net of tax | $ | (1,154 | ) |
96
Fair Value of Financial Instruments
The Company’s financial instruments including cash and cash equivalents, accounts receivable, and accounts payable are carried at cost, which approximates fair value due to the short-term maturity of these instruments. The recorded value of the Company’s credit facility approximates its fair value as it bears interest at a floating rate that approximates a current market rate. The Company had a zero balance under its credit facility as of December 31, 2016, compared with $202.0 million of outstanding loans as of December 31, 2015. The Company’s Senior Notes and Senior Convertible Notes are recorded at cost, net of any unamortized discount and deferred financing costs, and the respective fair values are disclosed in Note 11 - Fair Value Measurements. The Company has derivative financial instruments that are recorded at fair value. Considerable judgment is required to develop estimates of fair value. The estimates provided are not necessarily indicative of the amounts the Company would realize upon the sale or refinancing of such instruments.
Industry Segment and Geographic Information
The Company operates in the exploration and production segment of the oil and gas industry within the United States. The Company reports as a single industry segment. Prior to the sale of the Company’s Mid-Continent assets in 2015, the Company acted as the first purchaser of natural gas and natural gas liquids produced by third parties in certain cases. The Company considered this function as ancillary to its oil and gas producing activities. The amount of income these operations generated from marketing gas produced by third parties was not material to the Company’s results of operations, and segmentation of such activity would not have provided a better understanding of the Company’s performance. However, gross revenue and expense related to marketing activities for gas produced by third parties is presented in the marketed gas system revenue and marketed gas system expense line items in the accompanying statements of operations. There was no marketed gas system revenue or expense recorded for the year ended December 31, 2016.
Off-Balance Sheet Arrangements
The Company has not participated in transactions that generate relationships with unconsolidated entities or financial partnerships, such as entities often referred to as structured finance or special purpose entities (“SPE”), which would have been established for the purpose of facilitating off-balance sheet arrangements or other contractually narrow or limited purposes.
The Company evaluates its transactions to determine if any variable interest entities exist. If it is determined that the Company is the primary beneficiary of a variable interest entity, that entity is consolidated. The Company has not been involved in any unconsolidated SPE transactions in 2016 or 2015.
Recently Issued Accounting Standards
Effective January 1, 2016, the Company adopted, on a retrospective basis, Financial Accounting Standards Board (“FASB”) Accounting Standards Update (“ASU”) No. 2015-02, Consolidation (Topic 810): Amendments to the Consolidation Analysis. This ASU clarifies the consolidation reporting guidance in GAAP. There was no impact to the Company’s financial statements or disclosures from the adoption of this standard.
Effective December 31, 2016, the Company adopted FASB ASU No. 2014-15, Presentation of Financial Statements-Going Concern (Subtopic 205-40): Disclosure of Uncertainties about an Entity’s Ability to Continue as a Going Concern. This ASU requires management to evaluate whether there are conditions or events that raise substantial doubt about an entity’s ability to continue as a going concern within one year after the date that the entity’s financial statements are issued, or within one year after the date the entity’s financial statements are available to be issued, and to provide disclosures when certain criteria are met. There was no impact to the Company’s financial statements or disclosures from the adoption of this standard.
In May 2014, the FASB issued ASU No. 2014-09, Revenue from Contracts with Customers (Topic 606) (“ASU 2014-09”) for the recognition of revenue from contracts with customers. Subsequent to the issuance of this ASU, the FASB issued additional related ASUs as follows:
• | In August 2015, the FASB issued ASU No. 2015-14, Revenue from Contracts with Customers (Topic 606): Deferral of the Effective Date. This ASU deferred the effective date of ASU 2014-09 by one year. |
• | In March 2016, the FASB issued ASU No. 2016-08, Revenue from Contracts with Customers (Topic 606): Principal versus Agent Considerations (Reporting Revenue Gross versus Net). This ASU amends the principal versus agent guidance in ASU No. 2014-09. |
97
• | In April 2016, the FASB issued ASU No. 2016-10, Revenue from Contracts with Customers (Topic 606): Identifying Performance Obligations and Licensing. This ASU amends the identification of performance obligations and accounting for licenses in ASU 2014-09. |
• | In May 2016, the FASB issued ASU No. 2016-12, Revenue from Contracts with Customers (Topic 606): Narrow-Scope Improvements and Practical Expedients. This ASU amends certain issues in ASU 2014-09 on transition, collectibility, noncash consideration, and the presentation of sales taxes and other similar taxes. |
• | In December 2016, the FASB issued ASU No. 2016-20, Technical Corrections and Improvements to Topic 606, Revenue from Contracts with Customers. This ASU is meant to improve and clarify or to correct unintended application of narrow aspects of the guidance in ASU 2014-09. |
ASU 2014-09 and each update have the same effective date and transition requirements. That is, the guidance under these standards is to be applied using a full retrospective method or a modified retrospective method, as outlined in ASU 2014-09, and is effective for annual periods, and interim periods within those annual periods, beginning after December 15, 2017. Early adoption is permitted only for annual periods, and interim periods within those annual periods, beginning after December 15, 2016. The Company has established a cross-functional implementation team that is currently evaluating the provisions of each of these standards, analyzing their impact on the Company’s contract portfolio, reviewing current accounting policies and practices to identify potential differences that would result from applying the requirements of these standards to the Company’s revenue contracts, and assessing their potential impact on the Company’s financial statements and disclosures. The Company currently plans to apply the modified retrospective method upon adoption and plans to adopt the guidance on the effective date of January 1, 2018.
In February 2016, the FASB issued ASU No. 2016-02, Leases (Topic 842), which changes the accounting for leases. This guidance is to be applied using a modified retrospective method and is effective for annual periods, and interim periods within those annual periods, beginning after December 15, 2018. Early adoption is permitted. The Company is currently evaluating the provisions of this guidance and assessing its potential impact on the Company’s financial statements and disclosures.
In March 2016, the FASB issued ASU No. 2016-09, Compensation-Stock Compensation (Topic 718): Improvements to Employee Share-Based Payment Accounting. This ASU makes targeted amendments to the accounting for employee share-based payments. This guidance is to be applied using various transition methods, such as full retrospective, modified retrospective, and prospective, based on the criteria for the specific amendments as outlined in the guidance. The guidance is effective for annual periods, and interim periods within those annual periods, beginning after December 15, 2016. Early adoption is permitted, as long as all of the amendments are adopted in the same period; however, the Company plans on adopting in the first quarter of 2017. The Company is currently evaluating the provisions of this guidance and assessing its potential impact on the Company’s financial statements and disclosures.
In August 2016, the FASB issued ASU No. 2016-15, Statement of Cash Flows (Topic 230): Classification of Certain Cash Receipts and Cash Payments. This ASU is intended to reduce diversity in practice in how certain transactions are classified in the statement of cash flows. This guidance is to be applied using a retrospective method. The guidance is effective for annual periods, and interim periods within those annual periods, beginning after December 15, 2017. Early adoption is permitted, as long as all of the amendments are adopted in the same period. The Company is currently evaluating the provisions of this guidance and assessing its potential impact on the Company’s financial statements and disclosures.
In November 2016, the FASB issued ASU No. 2016-18, Statement of Cash Flows (Topic 230): Restricted Cash. This ASU clarifies how entities should present restricted cash and restricted cash equivalents in the statement of cash flows. This guidance is to be applied using a retrospective method and is effective for annual periods, and interim periods within those annual periods, beginning after December 15, 2017. Early adoption is permitted. The Company is currently evaluating the provisions of this guidance and assessing its potential impact on the Company’s financial statements and disclosures.
In January 2017, the FASB issued ASU No. 2017-01, Business Combinations (Topic 805): Clarifying the Definition of a Business (“ASU 2017-01”). This ASU clarifies the definition of a business with the objective of adding guidance to assist entities with evaluating whether transactions should be accounted for as acquisitions (or disposals) of assets or businesses. This guidance is to be applied using a prospective method and is effective for annual periods, and interim periods within those annual periods, beginning after December 15, 2017. Early adoption is permitted as outlined in ASU 2017-01. The Company is currently evaluating the provisions of this guidance and assessing its potential impact on the Company’s financial statements and disclosures.
98
In February 2017, the FASB issued ASU No. 2017-05, Other Income-Gains and Losses from the Derecognition of Nonfinancial Assets (Subtopic 610-20): Clarifying the Scope of Asset Derecognition Guidance and Accounting for Partial Sales of Nonfinancial Assets. This ASU is meant to clarify the scope of ASC Subtopic 610-20, Other Income-Gains and Losses from the Derecognition of Nonfinancial Assets and to add guidance for partial sales of nonfinancial assets. This guidance is to be applied using a full retrospective method or a modified retrospective method as outlined in the guidance and is effective at the same time as ASU 2014-09. Further, the Company is required to adopt this guidance at the same time that it adopts the guidance in ASU 2014-09. The Company is currently evaluating the provisions of this guidance and assessing its potential impact on the Company’s financial statements and disclosures.
There are no other accounting standards applicable to the Company that would have a material effect on the Company’s financial statements and disclosures that have been issued but not yet adopted by the Company as of December 31, 2016, and through the filing date of this report.
Note 2 – Accounts Receivable and Accounts Payable and Accrued Expenses
Accounts receivable are comprised of the following:
As of December 31, | |||||||
2016 | 2015 | ||||||
(in thousands) | |||||||
Accrued oil, gas, and NGL production revenue | $ | 96,101 | $ | 58,256 | |||
Amounts due from joint interest owners | 29,669 | 22,269 | |||||
State severance tax refunds | 15,320 | 12,072 | |||||
Accrued derivative settlements | 6,512 | 34,579 | |||||
Other | 4,348 | 6,948 | |||||
Total accounts receivable | $ | 151,950 | $ | 134,124 | |||
Accounts payable and accrued expenses are comprised of the following:
As of December 31, | |||||||
2016 | 2015 | ||||||
(in thousands) | |||||||
Accrued capital expenditures | $ | 107,009 | $ | 97,355 | |||
Revenue and severance tax payable | 39,617 | 44,387 | |||||
Accrued lease operating expense | 15,956 | 21,943 | |||||
Accrued property taxes | 6,606 | 14,078 | |||||
Accrued compensation | 34,761 | 41,154 | |||||
Accrued derivative settlements | 6,473 | — | |||||
Accrued interest | 45,059 | 34,378 | |||||
Other | 44,227 | 49,222 | |||||
Total accounts payable and accrued expenses | $ | 299,708 | $ | 302,517 | |||
99
Note 3 – Acquisitions, Divestitures, and Assets Held for Sale
2016 Acquisition Activity
• | Rock Oil Acquisition. On October 4, 2016, the Company acquired all membership interests of JPM EOC Opal, LLC, which owned proved and unproved properties in the Midland Basin, from Rock Oil Holdings, LLC (referred to as the “Rock Oil Acquisition”) for an adjusted purchase price of $991.0 million. The effective date of the acquisition was September 1, 2016. The Company funded the acquisition with proceeds from divestitures in 2016 and the Senior Convertible Notes and equity offerings in August 2016, as discussed in Note 5 - Long-Term Debt and Note 15 - Equity, respectively. |
The Company determined that the Rock Oil Acquisition met the criteria of a business combination under ASC Topic 805, Business Combinations. The Company allocated the preliminary adjusted purchase price to the acquired assets and liabilities based on fair value as of the acquisition date, as summarized in the table below. This measurement resulted in no goodwill or bargain purchase gain being recognized. Refer to Note 11 - Fair Value Measurements for additional discussion on the valuation techniques used in determining the fair value of the acquired properties. The acquisition costs were insignificant and were expensed as incurred.
As of October 4, 2016 | |||
(in thousands) | |||
Cash consideration | $ | 991,038 | |
Fair value of assets and liabilities acquired: | |||
Wells in progress | $ | 5,672 | |
Proved oil and gas properties | 81,917 | ||
Unproved oil and gas properties | 913,594 | ||
Other assets | 5,338 | ||
Total fair value of oil and gas properties acquired | 1,006,521 | ||
Working capital | (7,888 | ) | |
Asset retirement obligation | (7,595 | ) | |
Total fair value of net assets acquired | $ | 991,038 | |
• | QStar Acquisition. On December 21, 2016, the Company acquired additional proved and unproved properties in the Midland Basin from QStar LLC and RRP-QStar, LLC (referred to as the “QStar Acquisition”) for $1.6 billion, consisting of $1.2 billion in cash consideration and the issuance of approximately 13.4 million shares of the Company’s common stock. The cash consideration was funded by proceeds from the recent Raven/Bear Den divestiture and the December 2016 equity offering. Please refer to Note 15 - Equity for additional discussion. The effective date of the acquisition was September 1, 2016. Under authoritative accounting guidance, the transaction was considered an asset acquisition, and therefore, the properties were recorded based on the fair value of the total consideration transferred on the acquisition date and transaction costs were capitalized as a component of the cost of the assets acquired. |
100
The Company allocated the preliminary adjusted purchase price to the acquired assets and liabilities, as summarized in the table below.
As of December 21, 2016 | |||
(in thousands) | |||
Cash consideration, including acquisition costs paid | $ | 1,167,373 | |
Fair value of equity consideration (1) | 437,194 | ||
Total consideration at closing | $ | 1,604,567 | |
Assets and liabilities acquired: | |||
Wells in progress | $ | 21,812 | |
Proved oil and gas properties | 61,614 | ||
Unproved oil and gas properties | 1,537,923 | ||
Total oil and gas properties acquired | 1,621,349 | ||
Working capital | (9,141 | ) | |
Asset retirement obligation | (7,641 | ) | |
Total net assets acquired | $ | 1,604,567 | |
____________________________________________
(1) | The Company issued approximately 13.4 million shares of common stock, par value $0.01 per share, in a private placement to the sellers in the QStar Acquisition on December 21, 2016. The equity consideration was valued on this date using Level 1 and Level 2 inputs with a discount applied due to the lack of marketability in the near term in accordance with the Lock-Up and Registration Rights Agreement that prohibits the sale of such stock until no earlier than the 90th day after issuance. |
The Rock Oil Acquisition and QStar Acquisition are each subject to normal post-closing adjustments expected to occur in the first half of 2017. These post-closing adjustments are estimated as of December 31, 2016, and reflected in the tables above.
• | Other Acquisitions. During the fourth quarter of 2016, the Company entered into a definitive purchase agreement to acquire approximately 2,900 net acres of oil and gas assets in the Midland Basin for a gross purchase price of $60 million, subject to customary purchase price adjustments. This acquisition closed subsequent to December 31, 2016. |
2015 Acquisition Activity
There was no significant acquisition activity during the year ended December 31, 2015.
2014 Acquisition Activity
• | Gooseneck Property Acquisitions |
On September 24, 2014, the Company acquired approximately 61,000 net acres of proved and unproved oil and gas properties in its Gooseneck area in North Dakota, along with related equipment, contracts, records, and other assets. Total cash consideration paid by the Company after final closing adjustments was $321.8 million and the effective date for the acquisition was July 1, 2014.
On October 15, 2014, the Company acquired additional interests in proved and unproved oil and gas properties in its Gooseneck area. Total cash consideration paid by the Company was $84.8 million and the effective date for the acquisition was August 1, 2014.
Each of these acquisitions qualified as a business combination under ASC Topic 805, Business Combinations. The Company allocated the final adjusted purchase prices to the acquired assets and liabilities based on fair value as of the respective acquisition dates, as summarized in the table below. These measurements resulted in no goodwill or bargain purchase gain being recognized.
101
Acquisition #1 | Acquisition #2 | ||||||
As of September 24, 2014 | As of October 15, 2014 | ||||||
(in thousands) | |||||||
Cash consideration | $ | 321,807 | $ | 84,836 | |||
Fair value of assets and liabilities acquired: | |||||||
Proved oil and gas properties | $ | 203,467 | $ | 54,612 | |||
Unproved oil and gas properties | 126,588 | 29,610 | |||||
Total fair value of oil and gas properties acquired | 330,055 | 84,222 | |||||
Working capital | (6,135 | ) | 2,232 | ||||
Asset retirement obligation | (2,113 | ) | (1,618 | ) | |||
Total fair value of net assets acquired | $ | 321,807 | $ | 84,836 | |||
• | Rocky Mountain Acquisitions. In addition to the Gooseneck property acquisitions discussed above, the Company acquired other proved and unproved properties in its Rocky Mountain region during 2014, primarily in the Powder River Basin, in multiple transactions for approximately $135.5 million in total cash consideration after final closing adjustments, plus approximately 7,000 net acres of non-core assets in the Company’s Rocky Mountain region. |
2016 Divestiture Activity
• | Rocky Mountain Divestitures. During the third quarter of 2016, the Company divested certain non-core properties in the Williston Basin and Powder River Basin in two separate packages for total cash received at closing, net of commissions and payments to Net Profits Plan participants (referred throughout this report as “net divestiture proceeds”), of $110.6 million. The Company recorded a net gain of $16.4 million related to these divested assets for the year ended December 31, 2016. |
During the fourth quarter of 2016, the Company divested certain Williston Basin assets located outside of Divide County, North Dakota (referred to as “Raven/Bear Den” throughout this report) for net divestiture proceeds of $756.2 million. The Company recorded a net gain of $29.5 million related to these divested assets for the year ended December 31, 2016. In conjunction with the divestiture of certain Rocky Mountain assets, the Company closed its Billings, Montana office. Please refer to Note 14 - Exit and Disposal Costs for additional discussion.
The following table presents income (loss) before income taxes of the Raven/Bear Den assets sold on December 1, 2016, for the years ended December 31, 2016, 2015, and 2014. This divestiture is considered a disposal of a significant asset group.
For the Years Ended December 31, | |||||||||||
2016 | 2015 | 2014 | |||||||||
(in thousands) | |||||||||||
Income (loss) before income taxes (1) | $ | (6,601 | ) | $ | (12,530 | ) | $ | 197,256 | |||
____________________________________________
(1) | Income (loss) before income taxes reflects oil, gas, and NGL production revenue, less oil, gas, and NGL production expense and depletion, depreciation, amortization, and asset retirement obligation liability accretion. Additionally, income (loss) before income taxes includes impairment of proved properties expense of approximately $17.8 million for the year ended December 31, 2015. |
• | Permian Divestiture. During the third quarter of 2016, the Company divested its non-core properties in southeast New Mexico for net divestiture proceeds of $54.6 million and recorded a net loss of $10.1 million for the year ended December 31, 2016. |
Each of these divestitures are subject to normal post-closing adjustments, and the respective post-closings are expected to occur in the first half of 2017.
102
2015 Divestiture Activity
• | Mid-Continent Divestiture. During the second quarter of 2015, the Company divested its Mid-Continent assets in multiple transactions for total net divestiture proceeds of $310.3 million and a final net gain of $108.4 million. In conjunction with the divestiture of its Mid-Continent assets, the Company closed its Tulsa, Oklahoma office. Please refer to Note 14 - Exit and Disposal Costs for additional discussion. |
• | Permian Divestiture. During the fourth quarter of 2015, the Company divested certain non-core assets in its Permian region. Net divestiture proceeds were $25.1 million and the final net gain on this divestiture was $2.3 million. |
Write-downs on certain other assets held for sale and subsequently sold during the year ended December 31, 2015, totaled $68.6 million, which partially offset the net gain on the Mid-Continent and Permian divestitures discussed above.
2014 Divestiture Activity
• | Rocky Mountain Divestiture. During the second quarter of 2014, the Company divested certain non-core assets in the Montana portion of the Williston Basin. Net divestiture proceeds were $42.0 million and the final net gain on this divestiture was $26.9 million. |
The Company recorded $27.6 million of write-downs to fair value less estimated costs to sell for assets that were held for sale during the year ended December 31, 2014, which offset the net gain on the Rocky Mountain Divestiture discussed above.
Assets Held for Sale
Assets are classified as held for sale when the Company commits to a plan to sell the assets and there is reasonable certainty the sale will take place within one year. Upon classification as held for sale, long-lived assets are no longer depreciated or depleted, and a measurement for impairment is performed to identify and expense any excess of carrying value over fair value less costs to sell. Any subsequent changes to the fair value less estimated costs to sell impact the measurement of assets held for sale, with any gain or loss reflected in the net gain on divestiture activity line item in the accompanying statements of operations.
As of December 31, 2016, the accompanying balance sheets present $372.6 million of assets held for sale, net of accumulated depletion, depreciation, and amortization expense, which consists of the Company’s outside-operated Eagle Ford shale assets. A corresponding aggregate asset retirement obligation liability of $26.2 million is separately presented. There were no material assets held for sale as of December 31, 2015.
Subsequent to December 31, 2016, the Company entered into a definitive agreement with Venado EF LLC (“Venado”) for the sale of its outside-operated Eagle Ford shale assets, including its ownership interest in related midstream assets (the “Eagle Ford Transaction”) for a gross purchase price of $800 million, subject to customary purchase price adjustments. The Company expects to close the Eagle Ford Transaction in the first quarter of 2017.
Pursuant to the Venado definitive agreement, the Company entered into certain NYMEX swap contracts to be novated to Venado at closing, as summarized below:
• | Oil swap contracts through the fourth quarter of 2021 for a total of 4.3 million Bbls of oil production at contract prices ranging from $54.05 to $57.00 per Bbl. |
• | Gas swap contracts through the fourth quarter of 2021 for a total of 4.6 million MMBtu of gas production at contract prices ranging from $2.82 to $2.99 per MMBtu. |
• | NGL swap contracts through the fourth quarter of 2019 for a total of 4.5 million Bbls of NGL production at contract prices ranging from $11.81 to $48.51 per Bbl. |
The Company is not at risk of a net financial obligation with the derivative counterparties should the value of the contracts become negative, unless the Eagle Ford Transaction is terminated because the Company did not comply in all material respects with its covenants under the definitive agreement or because of a material inaccuracy of the Company’s representations and warranties.
103
The closing of the Eagle Ford Transaction is subject to the satisfaction of customary closing conditions, and there can be no assurance that it will close on the expected closing date or at all.
The following table presents income (loss) before income taxes for the years ended December 31, 2016, 2015, and 2014, of the Company’s outside-operated Eagle Ford shale assets held for sale as of December 31, 2016, which is considered a significant asset disposal group.
For the Years Ended December 31, | |||||||||||
2016 | 2015 | 2014 | |||||||||
(in thousands) | |||||||||||
Income (loss) before income taxes (1) | $ | (218,506 | ) | $ | 71,556 | $ | 294,376 | ||||
____________________________________________
(1) | Income (loss) before income taxes reflects oil, gas, and NGL production revenue less oil, gas, and NGL production expense and depletion, depreciation, amortization, and asset retirement obligation liability accretion expense. Additionally, loss before income taxes for the year ended December 31, 2016, includes $269.6 million of proved property impairment expense. |
Subsequent to December 31, 2016, the Company announced its plans to sell its remaining Williston Basin assets in the Divide County, North Dakota area (referred to as “Divide County” throughout this report) by mid-year 2017. These assets were classified as held and used as of December 31, 2016. Based on preliminary estimates of fair value less selling costs as of the filing date of this report, the Company expects to record a write down in the range of $200 million to $400 million in the first quarter of 2017 upon the Divide County assets being reclassified to held for sale.
The Company determined that neither these planned nor executed asset sales qualify for discontinued operations accounting under financial statement presentation authoritative guidance.
104
Note 4 – Income Taxes
The provision for income taxes consists of the following:
For the Years Ended December 31, | ||||||||||||
2016 | 2015 | 2014 | ||||||||||
(in thousands) | ||||||||||||
Current portion of income tax expense | ||||||||||||
Federal | $ | 2,932 | $ | — | $ | — | ||||||
State | 1,539 | 1,571 | 868 | |||||||||
Deferred portion of income tax expense (benefit) | (448,643 | ) | (276,722 | ) | 397,780 | |||||||
Total income tax expense (benefit) | $ | (444,172 | ) | $ | (275,151 | ) | $ | 398,648 | ||||
Effective tax rate | 37.0 | % | 38.1 | % | 37.4 | % | ||||||
The components of the net deferred income tax liabilities are as follows:
As of December 31, | ||||||||
2016 | 2015 | |||||||
(in thousands) | ||||||||
Deferred tax liabilities: | ||||||||
Oil and gas properties | $ | 518,394 | $ | 854,029 | ||||
Derivative asset | — | 179,543 | ||||||
Other | 7,733 | 1,233 | ||||||
Total deferred tax liabilities | 526,127 | 1,034,805 | ||||||
Deferred tax assets: | ||||||||
Federal and state tax net operating loss carryovers | 151,343 | 244,942 | ||||||
Derivative liability | 31,349 | — | ||||||
Stock compensation | 10,083 | 14,529 | ||||||
Credit carryover | 12,448 | 6,952 | ||||||
Other liabilities | 10,567 | 20,497 | ||||||
Total deferred tax assets | 215,790 | 286,920 | ||||||
Valuation allowance | (5,335 | ) | (10,394 | ) | ||||
Net deferred tax assets | 210,455 | 276,526 | ||||||
Total net deferred tax liabilities | $ | 315,672 | $ | 758,279 | ||||
Current federal income tax refundable | $ | 644 | $ | 5,378 | ||||
Current state income tax refundable | $ | — | $ | 65 | ||||
Current state income tax payable | $ | 1,181 | $ | — | ||||
At December 31, 2016, the Company estimated its federal net operating loss (“NOL”) carryforward at $540.2 million, which includes unrecognized excess income tax benefits associated with stock awards of $126.7 million. The Company also has federal R&D credit carryforwards of $7.2 million. The federal NOL carryforward begins to expire in 2031 and the federal R&D credit carryforwards expire between 2028 and 2033. The Company’s alternative minimum tax (“AMT”) credit carryforward of $5.6 million does not expire. State NOL carryforwards were $184.6 million and state tax credits were $528,000 as of December 31, 2016. State NOLs and credits expire between 2017 and 2037. The Company’s current valuation allowance relates to state NOL carryforwards and state tax credits, which the Company anticipates will expire before they can be utilized. The change in the valuation allowance from 2015 to 2016 primarily relates to anticipated utilization of accumulated charitable contributions and an allocable change to the Company’s mix of state apportioned losses and the anticipated utilization of state cumulative NOLs.
105
Federal income tax expense differs from the amount that would be provided by applying the statutory United States federal income tax rate to income before income taxes primarily due to the effect of state income taxes, changes in valuation allowances, R&D credits, and accumulated impacts of other smaller permanent differences, reported as follows:
For the Years Ended December 31, | |||||||||||
2016 | 2015 | 2014 | |||||||||
(in thousands) | |||||||||||
Federal statutory tax expense (benefit) | $ | (420,671 | ) | $ | (253,001 | ) | $ | 372,644 | |||
Increase (decrease) in tax resulting from: | |||||||||||
State tax expense (benefit) (net of federal benefit) | (17,549 | ) | (21,583 | ) | 21,350 | ||||||
Change in valuation allowance | (5,059 | ) | 3,148 | 2,245 | |||||||
Research and development credit | — | (1,971 | ) | — | |||||||
Other | (893 | ) | (1,744 | ) | 2,409 | ||||||
Income tax expense (benefit) | $ | (444,172 | ) | $ | (275,151 | ) | $ | 398,648 | |||
Acquisitions, divestitures, drilling activity, and basis differentials impacting the prices received for oil, gas, and NGLs impact the apportionment of taxable income to the states where the Company owns oil and gas properties. As these factors change, the Company’s state income tax rate changes. This change, when applied to the Company’s total temporary differences, impacts the total state income tax expense (benefit) reported in the current year. Items affecting state apportionment factors are evaluated upon completion of the prior year income tax return, and after significant acquisitions, divestitures, or changes in drilling activity or estimated state revenue occurs during the year. In 2016, most of this activity occurred in the fourth quarter.
The Company and its subsidiaries file federal income tax returns and various state income tax returns. With an exception for activity related to its 2003 tax year, the Company is no longer subject to United States federal or state income tax examinations by these tax authorities for years before 2013. The Company recorded an additional $2.0 million net R&D credit in 2015 as a result of its R&D credit settlement with the IRS Appeals Office. During 2016, the Company’s 2007 - 2011 IRS examination was finalized, as was the 2013 IRS audit of the SM-Mitsui Tax Partnership with no material adjustments to previously recorded amounts.
The Company complies with authoritative accounting guidance regarding uncertain tax provisions. The entire amount of unrecognized tax benefit reported by the Company would affect its effective tax rate if recognized. Interest expense in the accompanying statements of operations includes a negligible amount associated with income taxes. The Company does not expect a significant change to the recorded unrecognized tax benefits in 2017.
The total amount recorded for unrecognized tax benefits is presented below:
For the Years Ended December 31, | |||||||||||
2016 | 2015 | 2014 | |||||||||
(in thousands) | |||||||||||
Beginning balance | $ | 2,782 | $ | 1,582 | $ | 2,358 | |||||
Additions for tax positions of prior years | 9 | 1,200 | 140 | ||||||||
Settlements | (2,345 | ) | — | (916 | ) | ||||||
Ending balance | $ | 446 | $ | 2,782 | $ | 1,582 | |||||
106
Note 5 – Long-Term Debt
Revolving Credit Facility
The Company’s Fifth Amended and Restated Credit Agreement (the “Credit Agreement”) provides for a maximum loan amount of $2.5 billion and has a maturity date of December 10, 2019. During 2016, the following amendments were made to the Credit Agreement:
• | On April 8, 2016, as part of the regular, semi-annual borrowing base redetermination process, the Company entered into a Sixth Amendment to the Credit Agreement, which reduced the Company’s borrowing base to $1.25 billion from $2.0 billion at December 31, 2015. This expected reduction was primarily due to a decline in commodity prices, which resulted in a decrease in the Company’s proved reserves as of December 31, 2015. The amendment also reduced the aggregate lender commitments to $1.25 billion, and changed the required percentage of oil and gas properties subject to a mortgage to at least 90 percent of the total PV-9 of the Company’s proved oil and gas properties evaluated in the most recent reserve report. Further, this amendment revised certain of the Company’s covenants under the Credit Agreement and modified the borrowing base utilization grid, as discussed below. The Company incurred approximately $3.1 million in deferred financing costs associated with this amendment to the Credit Agreement. |
• | On August 8, 2016, the Company entered into a Seventh Amendment to the Credit Agreement to allow for capped call transactions. |
• | Upon issuing the Senior Convertible Notes and 2026 Notes (as defined and discussed below) during the third quarter of 2016, the Company’s borrowing base and aggregate lender commitments were reduced to $1.1 billion. |
• | On September 30, 2016, as part of the regular, semi-annual borrowing base redetermination process, the Company entered into an Eighth Amendment to the Credit Agreement, which increased the Company’s borrowing base to $1.35 billion and the aggregate lender commitments to $1.25 billion due to an increase in commodity prices and the value of the proved reserves associated with the Rock Oil Acquisition. |
• | On December 1, 2016, the Company’s borrowing base and aggregate lender commitments were reduced to $1.17 billion as a result of closing the sale of the Company’s Raven/Bear Den assets. |
As a result of the various reductions to the Company’s borrowing base and aggregate lender commitments throughout 2016, the Company recorded approximately $2.5 million of expense related to the acceleration of unamortized deferred financing costs for the year ended December 31, 2016.
The borrowing base redetermination process considers the value of both the Company’s (a) proved oil and gas properties reflected in the Company’s most recent reserve report and (b) commodity derivative contracts, each as determined by the Company’s lender group. The next scheduled redetermination date is April 1, 2017, and the Company expects a reduction to its borrowing base as a result of the anticipated sale of its outside-operated Eagle Ford shale assets and the decrease in proved reserves at December 31, 2016.
The Company must comply with certain financial and non-financial covenants under the terms of the Credit Agreement, including covenants limiting dividend payments and requiring the Company to maintain certain financial ratios, as defined by the Credit Agreement. Financial covenants under the Credit Agreement require, as of the last day of each of the Company’s fiscal quarters, the Company’s (a) ratio of senior secured debt to 12-month trailing adjusted EBITDAX to be not more than 2.75 to 1.0; (b) adjusted current ratio to be not less than 1.0 to 1.0; and (c) ratio of 12-month trailing adjusted EBITDAX to interest expense to be not less than 2.0 to 1.0. The Company was in compliance with all financial and non-financial covenants under the Credit Agreement as of December 31, 2016, and through the filing date of this report.
107
Interest and commitment fees are accrued based on a borrowing base utilization grid set forth in the Credit Agreement. Eurodollar loans accrue interest at the London Interbank Offered Rate plus the applicable margin from the utilization table below, and Alternate Base Rate (“ABR”) and swingline loans accrue interest at the prime rate, plus the applicable margin from the utilization table below. Commitment fees are accrued on the unused portion of the aggregate lender commitment amount and are included in interest expense in the accompanying statements of operations. The borrowing base utilization grid under the Credit Agreement is as follows:
Borrowing Base Utilization Percentage | <25% | ≥25% <50% | ≥50% <75% | ≥75% <90% | ≥90% | ||||||||||
Eurodollar Loans | 1.750 | % | 2.000 | % | 2.250 | % | 2.500 | % | 2.750 | % | |||||
ABR Loans or Swingline Loans | 0.750 | % | 1.000 | % | 1.250 | % | 1.500 | % | 1.750 | % | |||||
Commitment Fee Rate | 0.300 | % | 0.300 | % | 0.350 | % | 0.375 | % | 0.375 | % | |||||
The following table presents the outstanding balance, total amount of letters of credit, and available borrowing capacity under the Credit Agreement as of February 15, 2017, December 31, 2016, and December 31, 2015:
As of February 15, 2017 | As of December 31, 2016 | As of December 31, 2015 | |||||||||
(in thousands) | |||||||||||
Credit facility balance (1) | $ | 103,500 | $ | — | $ | 202,000 | |||||
Letters of credit (2) | 200 | 200 | 200 | ||||||||
Available borrowing capacity | 1,061,300 | 1,164,800 | 1,297,800 | ||||||||
Total aggregate lender commitment amount | $ | 1,165,000 | $ | 1,165,000 | $ | 1,500,000 | |||||
____________________________________________
(1) | Unamortized deferred financing costs attributable to the credit facility are presented as a component of other noncurrent assets on the accompanying balance sheets and totaled $5.9 million and $4.9 million as of December 31, 2016, and 2015, respectively. |
(2) | Letters of credit reduce the amount available under the credit facility on a dollar-for-dollar basis. |
Senior Notes
The Company’s Senior Notes consist of 6.50% Senior Notes due 2021, 6.125% Senior Notes due 2022, 6.50% Senior Notes due 2023, 5.0% Senior Notes due 2024, 5.625% Senior Notes due 2025, and 6.75% Senior Notes due 2026 (collectively referred to as “Senior Notes”). The Senior Notes, net of unamortized deferred financing costs line on the accompanying balance sheets as of December 31, 2016, and 2015, consisted of the following:
As of December 31, | |||||||||||||||||||||||
2016 | 2015 | ||||||||||||||||||||||
Principal Amount | Unamortized Deferred Financing Costs | Senior Notes, Net of Unamortized Deferred Financing Costs | Principal Amount | Unamortized Deferred Financing Costs | Senior Notes, Net of Unamortized Deferred Financing Costs | ||||||||||||||||||
(in thousands) | |||||||||||||||||||||||
6.50% Senior Notes due 2021 | $ | 346,955 | $ | 3,372 | $ | 343,583 | $ | 350,000 | $ | 4,106 | $ | 345,894 | |||||||||||
6.125% Senior Notes due 2022 | 561,796 | 6,979 | 554,817 | 600,000 | 8,714 | 591,286 | |||||||||||||||||
6.50% Senior Notes due 2023 | 394,985 | 4,436 | 390,549 | 400,000 | 5,231 | 394,769 | |||||||||||||||||
5.0% Senior Notes due 2024 | 500,000 | 6,533 | 493,467 | 500,000 | 7,455 | 492,545 | |||||||||||||||||
5.625% Senior Notes due 2025 | 500,000 | 7,619 | 492,381 | 500,000 | 8,524 | 491,476 | |||||||||||||||||
6.75% Senior Notes due 2026 | 500,000 | 8,078 | 491,922 | — | — | — | |||||||||||||||||
Total | $ | 2,803,736 | $ | 37,017 | $ | 2,766,719 | $ | 2,350,000 | $ | 34,030 | $ | 2,315,970 | |||||||||||
108
The Senior Notes are unsecured senior obligations and rank equal in right of payment with all of the Company’s existing and any future unsecured senior debt, and are senior in right of payment to any future subordinated debt. There are no subsidiary guarantors of the Senior Notes. The Company is subject to certain covenants under the indentures governing the Senior Notes that limit the Company’s ability to incur additional indebtedness, issue preferred stock, and make restricted payments, including dividends; however, the first $6.5 million of dividends paid each year are not restricted by the restricted payment covenant. The Company was in compliance with all covenants under its Senior Notes as of December 31, 2016, and through the filing date of this report. All Senior Notes are registered under the Securities Act as of December 31, 2016. The Company may redeem some or all of its Senior Notes prior to their maturity at redemption prices based on a premium, plus accrued and unpaid interest, as described in the indentures governing the Senior Notes.
During the first quarter of 2016, the Company repurchased in open market transactions a total of $46.3 million in aggregate principal amount of certain of its 6.50% Senior Notes due 2021, 6.125% Senior Notes due 2022, and 6.50% Senior Notes due 2023 for a settlement amount of $29.9 million, excluding interest, which resulted in a net gain on extinguishment of debt of approximately $15.7 million. This amount includes a gain of $16.4 million associated with the discount realized upon repurchase, which was partially offset by approximately $700,000 related to the acceleration of unamortized deferred financing costs. The Company canceled all repurchased Senior Notes upon cash settlement.
2019 Notes. On May 7, 2015, the Company commenced a cash tender offer for any and all of its outstanding 6.625% Senior Notes due 2019 (“2019 Notes”) at a price of $1,036.88 per $1,000 of principal amount for all 2019 Notes tendered by May 20, 2015 (“Consent Payment Deadline”), and at a price of $1,006.88 per $1,000 of principal amount for all 2019 Notes properly tendered thereafter. On the Consent Payment Deadline, the Company received tenders and consents from the holders of approximately $242.9 million in aggregate principal amount, or approximately 69%, of its outstanding 2019 Notes in connection with the cash tender offer. Following its entry into the supplemental indenture dated as of May 21, 2015, to the indenture dated as of February 7, 2011, between the Company and U.S. Bank National Association, as trustee, the Company accepted the 2019 Notes tendered as of the Consent Payment Deadline in exchange for payment of total consideration, including accrued interest, of approximately $256.2 million under the Tender Offer and Consent Solicitation. On June 5, 2015, the Company accepted $1.5 million of 2019 Notes tendered after the Consent Payment Deadline in exchange for payment of total consideration, including accrued interest, of approximately $1.6 million. On June 22, 2015, the Company redeemed the remaining outstanding 2019 Notes at a redemption price of 103.313% of the principal amount for payment of total consideration, including accrued interest, of approximately $111.5 million.
The Company recorded a loss on extinguishment of debt related to the tender offer and redemption of its 2019 Notes of approximately $16.6 million for the year ended December 31, 2015. This amount includes approximately $12.5 million associated with the premium paid for the tender offer and redemption of the 2019 Notes and approximately $4.1 million related to the acceleration of unamortized deferred financing costs.
2021 Notes. On November 8, 2011, the Company issued $350.0 million in aggregate principal amount of 6.50% Senior Notes due 2021 at par, which mature on November 15, 2021. The Company received net proceeds of $343.1 million after deducting fees of $6.9 million, which are being amortized as deferred financing costs over the life of the 2021 Notes. During the first quarter of 2016, the Company repurchased $3.1 million in aggregate principal amount of its 2021 Notes for a settlement amount of $2.3 million, excluding interest.
2022 Notes. On November 17, 2014, the Company issued $600.0 million in aggregate principal amount of 6.125% Senior Notes due 2022 at par, which mature on November 15, 2022. The Company received net proceeds of $590.0 million after deducting fees of $10.0 million, which are being amortized as deferred financing costs over the life of the 2022 Notes. The net proceeds were used to repay outstanding borrowings under the Company’s credit facility and for general corporate purposes. During the first quarter of 2016, the Company repurchased $38.2 million in aggregate principal amount of its 2022 Notes for a settlement amount of $24.3 million, excluding interest.
2023 Notes. On June 29, 2012, the Company issued $400.0 million in aggregate principal amount of 6.50% Senior Notes due 2023 at par, which mature on January 1, 2023. The Company received net proceeds of $392.1 million after deducting fees of $7.9 million, which are being amortized as deferred financing costs over the life of the 2023 Notes. During the first quarter of 2016, the Company repurchased $5.0 million in aggregate principal amount of its 2023 Notes for a settlement amount of $3.3 million, excluding interest.
109
2024 Notes. On May 20, 2013, the Company issued $500.0 million in aggregate principal amount of 5.0% Senior Notes due 2024 at par, which mature on January 15, 2024. The Company received net proceeds of $490.2 million after deducting fees of $9.8 million, which are being amortized as deferred financing costs over the life of the 2024 Notes.
2025 Notes. On May 21, 2015, the Company issued $500.0 million in aggregate principal amount of 5.625% Senior Notes due 2025 at par, which mature on June 1, 2025. The Company received net proceeds of $491.0 million after deducting fees of $9.0 million, which are being amortized as deferred financing costs over the life of the 2025 Notes. The net proceeds were used to fund the consideration paid to the tendering holders of the 2019 Notes and to redeem the remaining untendered 2019 Notes, as well as repay outstanding borrowings under the Credit Agreement and for general corporate purposes.
2026 Notes. On September 12, 2016, the Company issued $500.0 million in aggregate principal amount of 6.75% Senior Notes due 2026, at par (the “2026 Notes”), which mature on September 15, 2026. The Company received net proceeds of $491.6 million after deducting fees of $8.4 million, which are being amortized as deferred financing costs over the life of the 2026 Notes. The net proceeds were used to partially fund the Rock Oil Acquisition that closed on October 4, 2016.
Senior Convertible Notes
On August 12, 2016, the Company issued $172.5 million in aggregate principal amount of 1.50% Senior Convertible Notes due 2021 (“the Senior Convertible Notes”), which mature on July 1, 2021. The Senior Convertible Notes are unsecured senior obligations and rank equal in right of payment with all of the Company’s existing and any future unsecured senior debt, and are senior in right of payment to any future subordinated debt. The Company received net proceeds of $166.6 million after deducting fees of $5.9 million, of which a portion is being amortized over the life of the Senior Convertible Notes. The net proceeds were used to partially fund the Rock Oil Acquisition that closed on October 4, 2016, as well as pay the cost of the capped call transactions discussed below.
The Senior Convertible Notes mature on July 1, 2021, unless earlier repurchased or converted. Holders may convert their Senior Convertible Notes at their option at any time prior to January 1, 2021, only under the following circumstances: (1) during any calendar quarter (and only during such calendar quarter) commencing after the calendar quarter ending on September 30, 2016, if the last reported sale price of the Company’s common stock for at least 20 trading days (whether or not consecutive) during a period of 30 consecutive trading days ending on the last trading day of the immediately preceding calendar quarter is greater than or equal to 130% of the conversion price on each applicable trading day; (2) during the five business day period after any five consecutive trading day period (the “measurement period”) in which the trading price (as defined in the indenture) per $1,000 principal amount of Notes for each trading day of the measurement period was less than 98% of the product of the last reported sale price of the Company’s common stock and the conversion rate on each such trading day; or (3) upon the occurrence of specified corporate events. On or after January 1, 2021, until the maturity date, holders may convert their Senior Convertible Notes at any time, regardless of the foregoing circumstances. The Company may not redeem the Senior Convertible Notes prior to the maturity date. Upon conversion, the Senior Convertible Notes may be settled, at the Company’s election, in shares of the Company’s common stock, cash, or a combination of cash and common stock. Holders may convert their notes based on a conversion rate of 24.6914 shares of the Company’s common stock per $1,000 principal amount of the Senior Convertible Notes, which is equal to an initial conversion price of approximately $40.50 per share, subject to adjustment.
The Company has initially elected a net-settlement method to satisfy its conversion obligation, which allows the Company to settle the principal amount of the Senior Convertible Notes in cash and to settle the excess conversion value in shares, as well as cash in lieu of fractional shares. The Senior Convertible Notes were not convertible at the option of holders as of December 31, 2016, or through the filing date of this report. Notwithstanding the inability to convert, the if-converted value of the Senior Convertible Notes as of December 31, 2016, did not exceed the principal amount.
In accounting for the Senior Convertible Notes at issuance, the Company allocated proceeds from the Senior Convertible Notes into debt and equity components according to the authoritative accounting guidance for convertible debt instruments that may be fully or partially settled in cash upon conversion. The initial carrying amount of the debt component, which approximates its fair value, was estimated using an interest rate for nonconvertible debt with terms similar to the Senior Convertible Notes. The effective interest rate used was 7.25%. The excess of the principal amount of the Senior Convertible Notes over the fair value of the debt component was recorded as a debt discount and a corresponding increase in additional paid-in capital. The Company incurred transaction costs of $5.9 million relating to the issuance of the Senior Convertible Notes, which were allocated between the debt and equity components in proportion to their determined fair value amounts. The debt discount and debt-related issuance costs are amortized to the carrying value of the Senior Convertible Notes as interest
110
expense through the maturity date of July 1, 2021. Upon issuance of the Senior Convertible Notes, the Company recorded $132.3 million as long-term debt and $40.2 million as additional paid-in capital in stockholders’ equity in the accompanying balance sheets. Interest expense recognized on the Senior Convertible Notes related to the stated interest rate and amortization of the debt discount totaled $3.7 million for the year ended December 31, 2016.
The net carrying amount of the liability component of the Senior Convertible Notes, as reflected on the accompanying balance sheets, consisted of the following as of December 31, 2016:
As of December 31, 2016 | |||
(in thousands) | |||
Principal amount of Senior Convertible Notes | $ | 172,500 | |
Unamortized debt discount | (37,513 | ) | |
Unamortized deferred financing costs | (4,131 | ) | |
Net carrying amount | $ | 130,856 | |
The net carrying amount of the equity component of the Senior Convertible Notes recorded in additional paid-in capital on the accompanying balance sheets consisted of the following as of December 31, 2016:
As of December 31, 2016 | |||
(in thousands) | |||
Equity component due to allocation of proceeds to equity | $ | 40,217 | |
Less: related issuance costs | (1,375 | ) | |
Less: deferred tax liability | (5,267 | ) | |
Net carrying amount | $ | 33,575 | |
If the Company undergoes a fundamental change, holders of the Senior Convertible Notes may require the Company to repurchase for cash all or any portion of their notes at a fundamental change repurchase price equal to 100% of the principal amount of the Senior Convertible Notes to be repurchased, plus accrued and unpaid interest. The indenture governing the Senior Convertible Notes contains customary events of default with respect to the Senior Convertible Notes, including that upon certain events of default, the trustee by notice to the Company, or the holders of at least 25% in principal amount of the outstanding Senior Convertible Notes by notice to the Company, may declare 100% of the principal and accrued and unpaid interest, if any, due and payable immediately. In case of certain events of bankruptcy, insolvency or reorganization involving the Company or a significant subsidiary, 100% of the principal and accrued and unpaid interest on the Senior Convertible Notes will automatically become due and payable.
The Company is subject to certain covenants under the indenture governing the Senior Convertible Notes and was in compliance with all covenants as of December 31, 2016, and through the filing date of this report.
Capped Call Transactions
In connection with the issuance of the Senior Convertible Notes, the Company entered into capped call transactions with affiliates of the underwriters of such issuance. The aggregate cost of the capped call transactions was approximately $24.2 million. The capped call transactions are generally expected to reduce the potential dilution upon conversion of the Senior Convertible Notes and/or partially offset any cash payments the Company is required to make in excess of the principal amount of converted Senior Convertible Notes in the event that the market price per share of the Company’s common stock, as measured under the terms of the capped call transactions (“market price per share”), is greater than the strike price of the capped call transactions, which initially corresponds to the approximate $40.50 per share conversion price of the Senior Convertible Notes and is subject to anti-dilution adjustments substantially similar to those applicable to the conversion rate of the Senior Convertible Notes. The cap price of the capped call transactions was initially $60.00 per share, and is subject to certain adjustments under the terms of the capped call transactions. If, however, the market price per share exceeds the cap price of the capped call transactions, there would be dilution and/or there would not be an offset of such potential cash payments, in each case, to the extent that such market price per share exceeds the cap price of the capped call transactions.
111
The Company evaluated the capped call transactions under authoritative accounting guidance and determined that they should be accounted for as separate transactions and classified as equity instruments with no recurring fair value measurement recorded.
Capitalized Interest
Capitalized interest costs for the Company for the years ended December 31, 2016, 2015, and 2014, were $17.0 million, $25.1 million, and $16.2 million, respectively.
Note 6 – Commitments and Contingencies
Commitments
The Company has entered into various agreements, which include drilling rig contracts of $31.1 million, gathering, processing, and transportation throughput commitments of $970.9 million, office leases, including maintenance, of $50.1 million, and other miscellaneous contracts and leases of $6.0 million. The annual minimum payments for the next five years and total minimum payments thereafter are presented below:
Years Ending December 31, | Amount (1) (in thousands) | |||
2017 | $ | 145,075 | ||
2018 | 148,240 | |||
2019 | 144,379 | |||
2020 | 141,010 | |||
2021 | 141,654 | |||
Thereafter | 337,745 | |||
Total | $ | 1,058,103 | ||
____________________________________________
(1) | During the third quarter of 2015, the Company closed its office in Tulsa, Oklahoma. These amounts include lease payments for the Tulsa office, net of sublease income. The Company expects to receive $2.7 million of total sublease income through 2019. |
Drilling Rig Contracts
The Company has several drilling rig contracts in place to facilitate drilling plans. Early termination of these rig contracts as of December 31, 2016, would have resulted in termination penalties of $14.2 million, which would be in lieu of paying the remaining drilling commitments of $31.1 million included in the table above. For the years ended December 31, 2016, and 2015, the Company incurred $8.7 million and $13.7 million, respectively, of expenses related to the early termination of drilling rig contracts or fees incurred for rigs placed on standby, which are recorded in the other operating expenses line item in the accompanying statements of operations.
Pipeline Transportation Commitments
The Company has gathering, processing, and transportation throughput commitments with various third parties that require delivery of a minimum amount of natural gas, crude oil, NGLs, and water. As of December 31, 2016, the Company has commitments to deliver a minimum of 1,461 Bcf of natural gas, 70 MMBbl of crude oil, 13 MMBbl of NGLs, and 25 MMBbl of water through 2034. The Company will be required to make periodic deficiency payments for any shortfalls in delivering the minimum volume commitments under certain agreements. As of December 31, 2016, if the Company delivered no further product, the aggregate undiscounted deficiency payments total approximately $970.9 million through 2034. If a shortfall in the minimum volume commitment for natural gas is projected, the Company has rights under certain contracts to arrange for third party gas to be delivered, and such volumes would count toward its minimum volume commitment.
Subsequent to December 31, 2016, the Company entered into a definitive agreement for the sale of its outside-operated Eagle Ford shale assets held for sale at December 31, 2016, and expects to close the transaction in the first quarter of 2017. Upon closing of the sale, the Company would no longer be subject to transportation throughput commitments totaling
112
514 Bcf of natural gas, 52 MMBbl of oil, and 13 MMBbl of NGLs, or $501.9 million of the potential undiscounted deficiency payments presented in the table above.
As of the filing date of this report, the Company does not expect to incur any material shortfalls.
Office Leases
The Company leases office space under various operating leases with terms extending as far as 2026. Rent expense, net of sublease income, for the years ended December 31, 2016, 2015, and 2014, was $5.2 million, $6.1 million, and $6.5 million, respectively. The Company closed its office in Billings, Montana in November 2016 and paid $3.2 million to the lessor to terminate the lease, which is not reflected in the rent expense amount above.
Contingencies
The Company is subject to litigation and claims arising in the ordinary course of business. The Company accrues for such items when a liability is both probable and the amount can be reasonably estimated. In the opinion of management, the results of such pending litigation and claims will not have a material effect on the results of operations, the financial position, or the cash flows of the Company.
Note 7 – Compensation Plans
Equity Plan
There are several components to the Company’s Equity Plan that are described in this section. Various types of equity awards have been granted by the Company in different periods.
As of December 31, 2016, approximately 5.5 million shares of common stock remained available for grant under the Equity Plan. The issuance of a direct share benefit, such as a share of common stock, a stock option, a restricted share, an RSU, or a PSU, counts as one share against the number of shares available to be granted under the Equity Plan. Each PSU has the potential to count as two shares against the number of shares available to be granted under the Equity Plan based on the final performance multiplier. Stock options were issued out of the St. Mary Land & Exploration Company Stock Option Plan and the St. Mary Land & Exploration Company Incentive Stock Option Plan, both predecessors to the Equity Plan, although the last grant was in 2004, and all remaining stock options were exercised during the year ended December 31, 2014.
Performance Share Units
The Company grants PSUs to eligible employees as part of its long-term equity compensation program. The number of shares of the Company’s common stock issued to settle PSUs ranges from 0% to 200% of the number of PSUs awarded and is determined based on certain performance criteria over a three-year measurement period. The performance criteria for the PSUs are based on a combination of the Company’s annualized Total Shareholder Return (“TSR”) for the performance period and the relative performance of the Company’s TSR compared with the annualized TSR of certain peer companies for the performance period. Compensation expense for PSUs is recognized within general and administrative and exploration expense over the vesting periods of the respective awards.
The fair value of PSUs was measured at the grant date with a stochastic process method using the Geometric Brownian Motion Model (“GBM Model”). A stochastic process is a mathematically defined equation that can create a series of outcomes over time. These outcomes are not deterministic in nature, which means that by iterating the equations multiple times, different results will be obtained for those iterations. In the case of the Company’s PSUs, the Company cannot predict with certainty the path its stock price or the stock prices of its peers will take over the three-year performance period. By using a stochastic simulation, the Company can create multiple prospective stock pathways, statistically analyze these simulations, and ultimately make inferences regarding the path the stock price will take. As such, because future stock prices are stochastic, or probabilistic with some direction in nature, the stochastic method, specifically the GBM Model, is deemed an appropriate method by which to determine the fair value of the PSUs. Significant assumptions used in this simulation include the Company’s expected volatility, dividend yield, and risk-free interest rate based on U.S. Treasury yield curve rates with maturities consistent with a three-year vesting period, as well as the volatilities and dividend yields for each of the Company’s peers.
113
The Company records compensation expense associated with the issuance of PSUs based on the fair value of the awards as of the date of grant. Total compensation expense recorded for PSUs was $11.0 million, $10.6 million, and $16.0 million for the years ended December 31, 2016, 2015, and 2014, respectively. As of December 31, 2016, there was $15.9 million of total unrecognized expense related to PSUs, which is being amortized through 2019.
A summary of the status and activity of non-vested PSUs is presented in the following table:
For the Years Ended December 31, | ||||||||||||||||||||
2016 | 2015 | 2014 | ||||||||||||||||||
PSUs | Weighted-Average Grant-Date Fair Value | PSUs | Weighted-Average Grant-Date Fair Value | PSUs | Weighted-Average Grant-Date Fair Value | |||||||||||||||
Non-vested at beginning of year (1) | 626,328 | $ | 61.81 | 433,660 | $ | 73.63 | 572,469 | $ | 66.07 | |||||||||||
Granted (1) | 447,971 | $ | 26.56 | 320,753 | $ | 45.34 | 202,404 | $ | 94.66 | |||||||||||
Vested (1) | (130,353 | ) | $ | 64.17 | (76,438 | ) | $ | 51.76 | (206,830 | ) | $ | 64.79 | ||||||||
Forfeited (1) | (115,023 | ) | $ | 55.59 | (51,647 | ) | $ | 73.62 | (134,383 | ) | $ | 86.72 | ||||||||
Non-vested at end of year(1) | 828,923 | $ | 43.25 | 626,328 | $ | 61.81 | 433,660 | $ | 73.63 | |||||||||||
____________________________________________
(1) | The number of awards assumes a multiplier of one. The final number of shares of common stock issued may vary depending on the three-year performance multiplier, which ranges from zero to two. |
The fair value of the PSUs granted in 2016, 2015, and 2014 was $11.9 million, $14.5 million, and $19.2 million, respectively. The PSUs granted in 2015 and 2014 will remain unvested until the third anniversary date of their issuance, at which time they will fully vest, unless the employee is retirement eligible in which case the PSUs vest immediately upon attainment of retirement age. PSUs granted in 2016 fully vest on the third anniversary of the date of the grant; however, employees who are retirement eligible at the time a PSU award was granted, vest in each portion of that award equally in six-month increments over a three-year period beginning at grant date. Retirement eligible employees must stay with the company through the entire six-month vesting period to receive that increment of vesting and any unvested portions of a PSU award will be forfeited when the employee leaves the company.
A summary of the shares of common stock issued to settle PSUs is presented in the table below:
For the Years Ended December 31, | ||||||||
2016 | 2015 | 2014 | ||||||
Shares of common stock issued to settle PSUs (1) | 44,870 | 288,962 | 130,163 | |||||
Less: shares of common stock withheld for income and payroll taxes | (14,809 | ) | (100,683 | ) | (45,042 | ) | ||
Net shares of common stock issued | 30,061 | 188,279 | 85,121 | |||||
Multiplier earned | 0.2 | 1.0 | 0.55 | |||||
____________________________________________
(1) | During the years ended December 31, 2016, 2015, and 2014, the Company issued shares of common stock for PSUs granted in 2013, 2012, and 2011. The Company and the majority of grant recipients mutually agreed to net share settle a portion of the awards to cover income and payroll tax withholdings in accordance with the Company’s Equity Plan and individual award agreements. |
The total fair value of PSUs that vested during the years ended December 31, 2016, 2015, and 2014 was $8.4 million, $4.0 million, and $13.4 million, respectively.
Restricted Stock Units
The Company grants RSUs to eligible employees as part of its long-term equity incentive compensation program. Each RSU represents a right to receive one share of the Company’s common stock upon settlement of the award at the end of the specified vesting period. Compensation expense for RSUs is recognized within general and administrative expense and exploration expense over the vesting periods of the award.
114
Total compensation expense recorded for RSUs for the years ended December 31, 2016, 2015, and 2014, was $11.9 million, $13.4 million, and $13.9 million, respectively. As of December 31, 2016, there was $14.4 million of total unrecognized expense related to unvested RSU awards, which is being amortized through 2019. The Company records compensation expense associated with the issuance of RSUs based on the fair value of the awards as of the date of grant. The fair value of an RSU is equal to the closing price of the Company’s common stock on the day of the grant.
A summary of the status and activity of non-vested RSUs is presented below:
For the Years Ended December 31, | ||||||||||||||||||||
2016 | 2015 | 2014 | ||||||||||||||||||
RSUs | Weighted- Average Grant-Date Fair Value | RSUs | Weighted- Average Grant-Date Fair Value | RSUs | Weighted- Average Grant-Date Fair Value | |||||||||||||||
Non-vested at beginning of year | 543,737 | $ | 55.01 | 515,724 | $ | 68.29 | 580,431 | $ | 57.05 | |||||||||||
Granted | 417,065 | $ | 28.08 | 356,246 | $ | 43.72 | 234,560 | $ | 83.98 | |||||||||||
Vested | (241,363 | ) | $ | 58.06 | (278,289 | ) | $ | 63.12 | (253,031 | ) | $ | 58.19 | ||||||||
Forfeited | (115,323 | ) | $ | 43.52 | (49,944 | ) | $ | 66.53 | (46,236 | ) | $ | 62.06 | ||||||||
Non-vested at end of year | 604,116 | $ | 37.39 | 543,737 | $ | 55.01 | 515,724 | $ | 68.29 | |||||||||||
The fair value of RSUs granted in 2016, 2015, and 2014 was $11.7 million, $15.6 million, and $19.7 million, respectively. The RSUs granted in 2015 and 2014 vest one-third of the total grant on each anniversary of the grant dates, unless the employee is retirement eligible in which case the RSUs vest immediately upon attainment of retirement age. The RSUs granted in 2016 vest one-third of the total grant on each anniversary of the grant dates, unless the employee is retirement eligible in which case the RSUs vest in each portion of that award equally in six-month increments over a three-year period beginning at grant date. Retirement eligible employees must stay with the company through the entire six-month vesting period to receive that increment of vesting and any unvested portions of a RSU award will be forfeited when the employee leaves the company.
A summary of the shares of common stock issued to settle RSUs is presented in the table below:
For the Years Ended December 31, | ||||||||
2016 | 2015 | 2014 | ||||||
Shares of common stock issued to settle RSUs (1) | 241,363 | 278,289 | 253,031 | |||||
Less: shares of common stock withheld for income and payroll taxes | (72,181 | ) | (91,045 | ) | (81,434 | ) | ||
Net shares of common stock issued | 169,182 | 187,244 | 171,597 | |||||
____________________________________________
(1) | During the years ended December 31, 2016, 2015, and 2014, the Company issued shares of common stock for RSUs granted in previous years. The Company and the majority of grant recipients mutually agreed to net share settle a portion of the awards to cover income and payroll tax withholdings in accordance with the Company’s Equity Plan and individual award agreements. |
The total fair value of RSUs that vested during the years ended December 31, 2016, 2015, and 2014 was $14.0 million, $17.6 million, and $14.7 million, respectively.
Stock Option Grants
The Company previously granted stock options under the St. Mary Land & Exploration Company Stock Option Plan and the St. Mary Land & Exploration Company Incentive Stock Option Plan. The last issuance of stock options occurred on December 31, 2004. Stock options to purchase shares of the Company’s common stock were granted to eligible employees and members of the Board of Directors. All options granted under the option plans were granted at exercise prices equal to the respective closing market price of the Company’s underlying common stock on the grant dates. All stock options granted under the option plans were exercisable for a period of up to 10 years from the date of grant. The remaining options from the 2004 grant were exercised during the year ended December 31, 2014, and thus there is no unrecognized compensation expense related to stock option awards.
115
A summary of activity associated with the Company’s Stock Option Plans during the year ended December 31, 2014, is presented in the following table:
Shares | Weighted-Average Exercise Price | Aggregate Intrinsic Value | ||||||||
For the year ended December 31, 2014 | ||||||||||
Outstanding, start of year | 39,088 | $ | 20.87 | $ | — | |||||
Exercised | (39,088 | ) | $ | 20.87 | $ | 1,993,726 | ||||
Forfeited | — | $ | — | $ | — | |||||
Outstanding, end of year | — | $ | — | $ | — | |||||
Vested and exercisable at end of year | — | $ | — | $ | — | |||||
The fair value of options was measured at the date of grant using the Black-Scholes-Merton option-pricing model. Cash received from stock options exercised for the year ended December 31, 2014, was $4.0 million.
Cash flows resulting from excess tax benefits are classified as part of cash flows from financing activities. Excess tax benefits are realized tax benefits from tax deductions for vested RSUs, settled PSUs, and exercised options in excess of the deferred tax asset attributable to stock compensation costs for such equity awards. The Company recorded no excess tax benefits for the years ended December 31, 2016, 2015, and 2014.
Director Shares
In 2016, 2015, and 2014, the Company issued 53,473, 39,903, and 27,677 shares, respectively, of its common stock to its non-employee directors under the Company’s Equity Plan. The Company recorded $2.0 million of compensation expense for the year ended December 31, 2016, related to director shares issued, and $1.6 million for each of the years ended December 31, 2015, and 2014.
Beginning with the awards granted in 2016, all shares issued to non-employee directors fully vest on December 31st of the year granted. Prior to 2016, all shares of common stock issued to the Company’s non-employee directors were earned over the one-year service period following the date of grant, unless five years of service had been provided to the Company by the director, in which case that director’s shares vested upon the earlier of the completion of the one year service period or the director retiring from the Board of Directors.
Employee Stock Purchase Plan
Under the Company’s Employee Stock Purchase Plan (“ESPP”), eligible employees may purchase shares of the Company’s common stock through payroll deductions of up to 15 percent of eligible compensation, without accruing in excess of $25,000 in value from purchases for each calendar year. The purchase price of the stock is the lower of 85% of the closing price of the stock on the first day of the offering period or 85% of the closing price of the stock on the purchase date, and shares issued under the ESPP have no restriction period. The ESPP is intended to qualify under Section 423 of the IRC. The Company had approximately 0.7 million shares available for issuance under the ESPP as of December 31, 2016. There were 218,135, 197,214, and 83,136 shares issued under the ESPP in 2016, 2015, and 2014, respectively. Total proceeds to the Company for the issuance of these shares were $4.2 million, $4.8 million, and $4.1 million for the years ended December 31, 2016, 2015, and 2014, respectively.
The fair value of ESPP grants is measured at the date of grant using the Black-Scholes-Merton option-pricing model. Expected volatility was calculated based on the Company’s historical daily common stock price, and the risk-free interest rate is based on U.S. Treasury yield curve rates with maturities consistent with a six-month vesting period.
116
The fair value of ESPP shares issued during the periods reported were estimated using the following weighted-average assumptions:
For the Years Ended December 31, | ||||||||
2016 | 2015 | 2014 | ||||||
Risk free interest rate | 0.4 | % | 0.1 | % | 0.1 | % | ||
Dividend yield | 0.4 | % | 0.2 | % | 0.1 | % | ||
Volatility factor of the expected market price of the Company’s common stock | 95.0 | % | 61.2 | % | 33.0 | % | ||
Expected life (in years) | 0.5 | 0.5 | 0.5 | |||||
The Company expensed $2.0 million, $1.8 million, and $1.1 million for the years ended December 31, 2016, 2015, and 2014, respectively, based on the estimated fair value of the ESPP grants.
401(k) Plan
The Company has a defined contribution plan (the “401(k) Plan”) that is subject to the Employee Retirement Income Security Act of 1974. The 401(k) Plan allows eligible employees to contribute a maximum of 60 percent of their base salaries up to the contribution limits established under the IRC. For employees hired before December 31, 2014, the Company matches each employee’s contribution up to six percent of the employee’s base salary and performance bonus, and may make additional contributions at its discretion. The Company matches contributions made by employees hired after December 31, 2014, up to nine percent of the employee’s base salary and performance bonus in lieu of pension plan benefits, and may make additional contributions at its discretion. Please refer to Note 8 - Pension Benefits for additional discussion of pension benefits. The Company’s matching contributions to the 401(k) Plan were $5.4 million, $5.6 million, and $6.4 million for the years ended December 31, 2016, 2015, and 2014, respectively.
Net Profits Plan
Under the Company’s Net Profits Plan, all oil and gas wells that were completed or acquired during each year were designated within a specific pool with key employees designated as participants that became entitled to payments under the Net Profits Plan after the Company has received net cash flows returning 100 percent of all costs associated with that pool. Thereafter, 10 percent of future net cash flows generated by the pool are allocated among the participants and distributed at least annually. The portion of net cash flows from the pool to be allocated among the participants increases to 20 percent after the Company has recovered 200 percent of the total costs for the pool, including payments made under the Net Profits Plan at the 10 percent level. In December 2007, the Board of Directors discontinued the creation of new pools under the Net Profits Plan. As a result, the 2007 pool was the last Net Profits Plan pool established by the Company.
The following table presents cash payments made or accrued under the Net Profits Plan related to periodic operations, of which the majority is recorded as general and administrative expense, and cash payments made or accrued as a result of divestitures of properties subject to the Net Profits Plan, which are recorded as a reduction to the net gain on divestiture activity line item in the accompanying statements of operations.
For the Years Ended December 31, | |||||||||||
2016 | 2015 | 2014 | |||||||||
(in thousands) | |||||||||||
Cash payments made or accrued related to operations | $ | 6,608 | $ | 3,498 | $ | 9,016 | |||||
Cash payments made or accrued related to divestitures | 24,349 | 3,789 | 8,341 | ||||||||
Total net settlements | $ | 30,957 | $ | 7,287 | $ | 17,357 | |||||
117
Note 8 – Pension Benefits
The Company has a non-contributory defined benefit pension plan covering substantially all employees who meet age and service requirements (the “Qualified Pension Plan”). The Company also has a supplemental non-contributory pension plan covering certain management employees (the “Nonqualified Pension Plan” and together with the Qualified Pension Plan, the “Pension Plans”). The Company froze the Pension Plans to new participants, effective as of December 31, 2015. Employees participating in the Pension Plans as of December 31, 2015, will continue to earn benefits.
Obligations and Funded Status for the Pension Plans
The Company recognizes the funded status (i.e. the difference between the fair value of plan assets and the projected benefit obligation) of the Company’s Pension Plans in the accompanying balance sheets as either an asset or a liability and recognizes a corresponding adjustment to accumulated other comprehensive loss, net of tax. The projected benefit obligation is the actuarial present value of the benefits earned to date by plan participants based on employee service and compensation including the effect of assumed future salary increases. The accumulated benefit obligation uses the same factors as the projected benefit obligation, but excludes the effects of assumed future salary increases. The Company’s measurement date for plan assets and obligations is December 31.
For the Years Ended December 31, | |||||||
2016 | 2015 | ||||||
(in thousands) | |||||||
Change in benefit obligation: | |||||||
Projected benefit obligation at beginning of year | $ | 62,547 | $ | 57,867 | |||
Service cost | 8,200 | 7,949 | |||||
Interest cost | 2,908 | 2,496 | |||||
Actuarial loss | 2,662 | 2,397 | |||||
Benefits paid | (6,658 | ) | (8,162 | ) | |||
Projected benefit obligation at end of year | 69,659 | 62,547 | |||||
Change in plan assets: | |||||||
Fair value of plan assets at beginning of year | 25,769 | 27,940 | |||||
Actual return on plan assets | 1,575 | (410 | ) | ||||
Employer contribution | 11,045 | 6,401 | |||||
Benefits paid | (6,658 | ) | (8,162 | ) | |||
Fair value of plan assets at end of year | 31,731 | 25,769 | |||||
Funded status at end of year | $ | (37,928 | ) | $ | (36,778 | ) | |
The Company’s underfunded status for the Pension Plans as of December 31, 2016, and 2015, is $37.9 million and $36.8 million, respectively, and is recognized in the accompanying balance sheets as a portion of other noncurrent liabilities. No plan assets of the Qualified Pension Plan were returned to the Company during the year ended December 31, 2016. There are no plan assets in the Nonqualified Pension Plan.
118
Accumulated Benefit Obligation in Excess of Plan Assets for the Pension Plans
As of December 31, | |||||||
2016 | 2015 | ||||||
(in thousands) | |||||||
Projected benefit obligation | $ | 69,659 | $ | 62,547 | |||
Accumulated benefit obligation | $ | 54,681 | $ | 46,439 | |||
Less: Fair value of plan assets | (31,731 | ) | (25,769 | ) | |||
Underfunded accumulated benefit obligation | $ | 22,950 | $ | 20,670 | |||
Pension expense is determined based upon the annual service cost of benefits (the actuarial cost of benefits earned during a period) and the interest cost on those liabilities, less the expected return on plan assets. The expected long-term rate of return on plan assets is applied to a calculated value of plan assets that recognizes changes in fair value over a five-year period. This practice is intended to reduce year-to-year volatility in pension expense, but it can have the effect of delaying recognition of differences between actual returns on assets and expected returns based on long-term rate of return assumptions. Amortization of the unrecognized net gain or loss resulting from actual experience different from that assumed and from changes in assumptions (excluding asset gains and losses not yet reflected in market-related value) is included as a component of net periodic benefit cost for a year. If, as of the beginning of the year, the unrecognized net gain or loss exceeds 10 percent of the greater of the projected benefit obligation and the market-related value of plan assets, then the amortization is the excess divided by the average remaining service period of participating employees expected to receive benefits under the plan.
Pre-tax amounts not yet recognized in net periodic pension costs, but rather recognized in accumulated other comprehensive loss during 2016, 2015, and 2014, were as follows:
For the Years Ended December 31, | |||||||||||
2016 | 2015 | 2014 | |||||||||
(in thousands) | |||||||||||
Unrecognized actuarial losses | $ | 22,708 | $ | 20,966 | $ | 17,812 | |||||
Unrecognized prior service costs | 83 | 101 | 118 | ||||||||
Unrecognized transition obligation | — | — | — | ||||||||
Accumulated other comprehensive loss | $ | 22,791 | $ | 21,067 | $ | 17,930 | |||||
The estimated net loss that will be amortized from accumulated other comprehensive loss into net periodic benefit cost over the next fiscal year is $1.6 million.
Pre-tax changes recognized in other comprehensive loss during 2016, 2015, and 2014, were as follows:
For the Years Ended December 31, | |||||||||||
2016 | 2015 | 2014 | |||||||||
(in thousands) | |||||||||||
Net actuarial loss | $ | (3,322 | ) | $ | (4,990 | ) | $ | (10,062 | ) | ||
Prior service cost | — | — | — | ||||||||
Less: | |||||||||||
Amortization of prior service cost | (16 | ) | (17 | ) | (17 | ) | |||||
Amortization of net actuarial loss | (1,582 | ) | (1,486 | ) | (689 | ) | |||||
Settlements | — | (350 | ) | — | |||||||
Total other comprehensive loss | $ | (1,724 | ) | $ | (3,137 | ) | $ | (9,356 | ) | ||
119
Components of Net Periodic Benefit Cost for the Pension Plans
For the Years Ended December 31, | |||||||||||
2016 | 2015 | 2014 | |||||||||
(in thousands) | |||||||||||
Components of net periodic benefit cost: | |||||||||||
Service cost | $ | 8,200 | $ | 7,949 | $ | 6,335 | |||||
Interest cost | 2,908 | 2,496 | 2,191 | ||||||||
Expected return on plan assets that reduces periodic pension cost | (2,235 | ) | (2,182 | ) | (1,978 | ) | |||||
Amortization of prior service cost | 16 | 17 | 17 | ||||||||
Amortization of net actuarial loss | 1,582 | 1,486 | 689 | ||||||||
Settlements | — | 350 | — | ||||||||
Net periodic benefit cost | $ | 10,471 | $ | 10,116 | $ | 7,254 | |||||
Pension Plan Assumptions
Weighted-average assumptions used to measure the Company’s projected benefit obligation and net periodic benefit cost are as follows:
As of December 31, | |||||
2016 | 2015 | 2014 | |||
Projected benefit obligation | |||||
Discount rate | 4.2% | 4.7% | 4.3% | ||
Rate of compensation increase | 6.2% | 6.2% | 6.2% | ||
Net periodic benefit cost | |||||
Discount rate | 4.7% | 4.3% | 5.0% | ||
Expected return on plan assets (1) | 7.5% | 7.5% | 7.5% | ||
Rate of compensation increase | 6.2% | 6.2% | 6.2% | ||
____________________________________________
(1) | There is no assumed expected return on plan assets for the Nonqualified Pension Plan because there are no plan assets in the Nonqualified Pension Plan. |
The Company’s pension investment policy includes various guidelines and procedures designed to ensure that assets are prudently invested in a manner necessary to meet the future benefit obligation of the Pension Plans. The policy does not permit the direct investment of plan assets in the Company’s securities. The Qualified Pension Plan’s investment horizon is long-term and accordingly the target asset allocations encompass a strategic, long-term perspective of capital markets, expected risk and return behavior and perceived future economic conditions. The key investment principles of diversification, assessment of risk, and targeting the optimal expected returns for given levels of risk are applied.
The Qualified Pension Plan’s investment portfolio contains a diversified blend of investments, which may reflect varying rates of return. The investments are further diversified within each asset classification. This portfolio diversification provides protection against a single security or class of securities having a disproportionate impact on aggregate investment performance. The actual asset allocations are reviewed and rebalanced on a periodic basis to maintain the target allocations. The weighted-average asset allocation of the Qualified Pension Plan is as follows:
120
Target | As of December 31, | |||||||
Asset Category | 2017 | 2016 | 2015 | |||||
Equity securities | 35.0 | % | 28.8 | % | 39.1 | % | ||
Fixed income securities | 43.0 | % | 35.5 | % | 34.0 | % | ||
Other securities | 22.0 | % | 35.7 | % | 26.9 | % | ||
Total | 100.0 | % | 100.0 | % | 100.0 | % | ||
There is no asset allocation of the Nonqualified Pension Plan since there are no plan assets in that plan. An expected return on plan assets of 7.5 percent was used to calculate the Company’s obligation under the Qualified Pension Plan for 2016 and 2015. Factors considered in determining the expected rate of return include the long-term historical rate of return provided by the equity and debt securities markets and input from the investment consultants and trustees managing the plan assets. The difference in investment income using the projected rate of return compared to the actual rates of return for the past two years was not material and is not expected to have a material effect on the accompanying statements of operations or cash flows from operating activities in future years.
121
Pension Plan Assets
The fair values of the Company’s Qualified Pension Plan assets as of December 31, 2016, and 2015, utilizing the fair value hierarchy discussed in Note 11 – Fair Value Measurements are as follows:
Fair Value Measurements Using: | ||||||||||||||||||
Actual Asset Allocation | Total | Level 1 Inputs | Level 2 Inputs | Level 3 Inputs | ||||||||||||||
(in thousands) | ||||||||||||||||||
As of December 31, 2016 | ||||||||||||||||||
Cash | — | % | $ | — | $ | — | $ | — | $ | — | ||||||||
Equity Securities: | ||||||||||||||||||
Domestic (1) | 18.7 | % | 5,945 | 4,471 | 1,474 | — | ||||||||||||
International (2) | 10.1 | % | 3,192 | 3,192 | — | — | ||||||||||||
Total Equity Securities | 28.8 | % | 9,137 | 7,663 | 1,474 | — | ||||||||||||
Fixed Income Securities: | ||||||||||||||||||
High-Yield Bonds (3) | 2.6 | % | 822 | 822 | — | — | ||||||||||||
Core Fixed Income (4) | 25.0 | % | 7,923 | 7,923 | — | — | ||||||||||||
Floating Rate Corp Loans (5) | 7.9 | % | 2,495 | 2,495 | — | — | ||||||||||||
Total Fixed Income Securities | 35.5 | % | 11,240 | 11,240 | — | — | ||||||||||||
Other Securities: | ||||||||||||||||||
Commodities (6) | 1.8 | % | 578 | 578 | — | — | ||||||||||||
Real Estate (7) | 5.1 | % | 1,629 | — | — | 1,629 | ||||||||||||
Collective Investment Trusts (8) | 17.5 | % | 5,562 | — | 5,562 | — | ||||||||||||
Hedge Fund (9) | 11.3 | % | 3,585 | — | — | 3,585 | ||||||||||||
Total Other Securities | 35.7 | % | 11,354 | 578 | 5,562 | 5,214 | ||||||||||||
Total Investments | 100.0 | % | $ | 31,731 | $ | 19,481 | $ | 7,036 | $ | 5,214 | ||||||||
As of December 31, 2015 | ||||||||||||||||||
Cash | — | % | $ | — | $ | — | $ | — | $ | — | ||||||||
Equity Securities: | ||||||||||||||||||
Domestic (1) | 26.1 | % | 6,729 | 4,943 | 1,786 | — | ||||||||||||
International (2) | 13.0 | % | 3,353 | 3,353 | — | — | ||||||||||||
Total Equity Securities | 39.1 | % | 10,082 | 8,296 | 1,786 | — | ||||||||||||
Fixed Income Securities: | ||||||||||||||||||
High-Yield Bonds (3) | 2.8 | % | 722 | 722 | — | — | ||||||||||||
Core Fixed Income (4) | 22.5 | % | 5,789 | 5,789 | — | — | ||||||||||||
Floating Rate Corp Loans (5) | 8.7 | % | 2,247 | 2,247 | — | — | ||||||||||||
Total Fixed Income Securities | 34.0 | % | 8,758 | 8,758 | — | — | ||||||||||||
Other Securities: | ||||||||||||||||||
Commodities (6) | 2.7 | % | 700 | 700 | — | — | ||||||||||||
Real Estate (7) | 5.8 | % | 1,499 | — | — | 1,499 | ||||||||||||
Collective Investment Trusts (8) | 4.6 | % | 1,184 | — | 1,184 | — | ||||||||||||
Hedge Fund (9) | 13.8 | % | 3,546 | — | — | 3,546 | ||||||||||||
Total Other Securities | 26.9 | % | 6,929 | 700 | 1,184 | 5,045 | ||||||||||||
Total Investments | 100.0 | % | $ | 25,769 | $ | 17,754 | $ | 2,970 | $ | 5,045 | ||||||||
122
____________________________________________
(1) | Level 1 equity securities consist of United States large and small capitalization companies, which are actively traded securities that can be sold upon demand. Level 2 equity securities are investments in a collective investment fund that is valued at net asset value based on the value of the underlying investments and total units outstanding on a daily basis. The objective of this fund is to approximate the S&P 500 by investing in one or more collective investment funds. |
(2) | International equity securities consists of a well-diversified portfolio of holdings of mostly large issuers organized in developed countries with liquid markets, commingled with investments in equity securities of issuers located in emerging markets and believed to have strong sustainable financial productivity at attractive valuations. |
(3) | High-yield bonds consist of non-investment grade fixed income securities. The investment objective is to obtain high current income. Due to the increased level of default risk, security selection focuses on credit-risk analysis. |
(4) | The objective of core fixed income funds is to achieve value added from sector or issue selection by constructing a portfolio to approximate the investment results of the Barclay’s Capital Aggregate Bond Index with a modest amount of variability in duration around the index. |
(5) | Investments consist of floating rate bank loans. The interest rates on these loans are typically reset on a periodic basis to account for changes in the level of interest rates. |
(6) | Investments with exposure to commodity price movements, primarily through the use of futures, swaps and other commodity-linked securities. |
(7) | The investment objective of direct real estate is to provide current income with the potential for long-term capital appreciation. Ownership in real estate entails a long-term time horizon, periodic valuations, and potentially low liquidity. |
(8) | Collective investment trusts invest in short-term investments and are valued at the net asset value of the collective investment trust. The net asset value, as provided by the trustee, is used as a practical expedient to estimate fair value. The net asset value is based on the fair value of the underlying investments held by the fund less its liabilities. |
(9) | The hedge fund portfolio includes an investment in an actively traded global mutual fund that focuses on alternative investments and a hedge fund of funds that invests both long and short using a variety of investment strategies. |
Included below is a summary of the changes in Level 3 plan assets (in thousands):
Balance at January 1, 2015 | $ | 4,864 | |
Purchases | — | ||
Realized gain on assets | 165 | ||
Unrealized gain on assets | 16 | ||
Balance at December 31, 2015 | $ | 5,045 | |
Purchases | 561 | ||
Realized gain on assets | 54 | ||
Unrealized gain on assets | 115 | ||
Disposition | (561 | ) | |
Balance at December 31, 2016 | $ | 5,214 | |
Contributions
The Company contributed $11.0 million, $6.4 million, and $5.3 million to the Pension Plans in the years ended December 31, 2016, 2015, and 2014, respectively. The Company expects to make a $7.8 million contribution to the Pension Plans in 2017.
123
Benefit Payments
The Pension Plans made actual benefit payments of $6.7 million, $8.2 million, and $2.8 million in the years ended December 31, 2016, 2015, and 2014, respectively. Expected benefit payments over the next 10 years are as follows:
Years Ending December 31, | (in thousands) | |||
2017 | $ | 6,532 | ||
2018 | $ | 3,256 | ||
2019 | $ | 4,480 | ||
2020 | $ | 4,778 | ||
2021 | $ | 5,772 | ||
2022 through 2026 | $ | 38,708 | ||
Note 9 – Asset Retirement Obligations
Please refer to Asset Retirement Obligations in Note 1 – Summary of Significant Accounting Policies for a discussion of the initial and subsequent measurements of asset retirement obligation liabilities and the significant assumptions used in the estimates.
A reconciliation of the Company’s total asset retirement obligation liability is as follows:
As of December 31, | |||||||
2016 | 2015 | ||||||
(in thousands) | |||||||
Beginning asset retirement obligation | $ | 140,874 | $ | 122,124 | |||
Liabilities incurred (1) | 21,293 | 14,471 | |||||
Liabilities settled (2) | (57,100 | ) | (24,781 | ) | |||
Accretion expense | 7,795 | 5,091 | |||||
Revision to estimated cash flows | 10,445 | 23,969 | |||||
Ending asset retirement obligation (3)(4) | $ | 123,307 | $ | 140,874 | |||
(1) | Reflects liabilities incurred through drilling activities and acquisitions of drilled wells. |
(2) | Reflects liabilities settled through plugging and abandonment activities and divestitures of properties. |
(3) | Balance as of December 31, 2016, included $26.2 million of asset retirement obligations associated with oil and gas properties held for sale, specifically the Company’s outside-operated Eagle Ford shale assets. There were no material asset retirement obligations related to assets held for sale as of December 31, 2015. |
(4) | Balances as of December 31, 2016, and 2015, included $932,000 and $3.3 million, respectively, related to the Company’s current asset retirement obligation liability, which is recorded in accounts payable and accrued expenses on the accompanying balance sheets. |
124
Note 10 – Derivative Financial Instruments
Summary of Oil, Gas, and NGL Derivative Contracts in Place
The Company has entered into various commodity derivative contracts to mitigate a portion of its exposure to potentially adverse market changes in commodity prices and the associated impact on cash flows. As of December 31, 2016, all derivative counterparties were members of the Company’s credit facility lender group and all contracts were entered into for other-than-trading purposes. The Company’s derivative contracts consist of swap and collar arrangements for oil, gas, and NGLs. In a typical commodity swap agreement, if the agreed upon published third-party index price (“index price”) is lower than the swap fixed price, the Company receives the difference between the index price and the agreed upon swap fixed price. If the index price is higher than the swap fixed price, the Company pays the difference. For collar arrangements, the Company receives the difference between an agreed upon index and the floor price if the index price is below the floor price. The Company pays the difference between the agreed upon ceiling price and the index price if the index price is above the ceiling price. No amounts are paid or received if the index price is between the floor and ceiling prices.
As of December 31, 2016, the Company had commodity derivative contracts outstanding through the second quarter of 2020 for a total of 11.3 million Bbls of oil production, 137.2 million MMBtu of net gas production, and 13.4 million Bbls of NGL production, as summarized in the tables below.
Oil Swaps
Contract Period | NYMEX WTI Volumes | Weighted- Average Contract Price | |||||
(MBbls) | (per Bbl) | ||||||
First quarter 2017 | 1,574 | $ | 46.41 | ||||
Second quarter 2017 | 1,444 | $ | 46.44 | ||||
Third quarter 2017 | 1,340 | $ | 46.66 | ||||
Fourth quarter 2017 | 1,254 | $ | 46.35 | ||||
Total | 5,612 | ||||||
Oil Collars
Contract Period | NYMEX WTI Volumes | Weighted- Average Floor Price | Weighted- Average Ceiling Price | ||||||||
(MBbls) | (per Bbl) | (per Bbl) | |||||||||
First quarter 2017 | 704 | $ | 45.00 | $ | 54.17 | ||||||
Second quarter 2017 | 636 | $ | 45.00 | $ | 54.10 | ||||||
Third quarter 2017 | 583 | $ | 45.00 | $ | 54.05 | ||||||
Fourth quarter 2017 | 540 | $ | 45.00 | $ | 54.01 | ||||||
2018 | 2,312 | $ | 50.00 | $ | 59.24 | ||||||
2019 | 943 | $ | 50.00 | $ | 61.15 | ||||||
Total | 5,718 | ||||||||||
125
Natural Gas Swaps
Contract Period | Sold Volumes | Weighted- Average Contract Price | Purchased Volumes (1) | Weighted- Average Contract Price | Net Volumes | ||||||||||||
(BBtu) | (per MMBtu) | (BBtu) | (per MMBtu) | (BBtu) | |||||||||||||
First quarter 2017 | 29,420 | $ | 3.76 | — | $ | — | 29,420 | ||||||||||
Second quarter 2017 | 26,205 | $ | 3.98 | — | $ | — | 26,205 | ||||||||||
Third quarter 2017 | 23,657 | $ | 4.01 | — | $ | — | 23,657 | ||||||||||
Fourth quarter 2017 | 22,001 | $ | 3.98 | — | $ | — | 22,001 | ||||||||||
2018 | 63,166 | $ | 3.68 | (30,606 | ) | $ | 4.27 | 32,560 | |||||||||
2019 | 27,743 | $ | 4.20 | (24,415 | ) | $ | 4.34 | 3,328 | |||||||||
Total (2) | 192,192 | (55,021 | ) | 137,171 | |||||||||||||
____________________________________________
(1) | During 2016, the Company restructured certain of its gas derivative contracts by buying fixed price volumes to offset existing 2018 and 2019 fixed price swap contracts totaling 55.0 million MMBtu. The Company then entered into new 2017 fixed price swap contracts totaling 38.6 million MMBtu with a contract price of $4.43 per MMBtu. No cash or other consideration was included as part of the restructuring. |
(2) | Total net volumes of natural gas swaps are comprised of IF El Paso Permian (3%), IF HSC (94%), and IF NNG Ventura (3%). |
NGL Swaps
OPIS Purity Ethane Mont Belvieu | OPIS Propane Mont Belvieu Non-TET | OPIS Normal Butane Mont Belvieu Non-TET | OPIS Isobutane Mont Belvieu Non-TET | OPIS Natural Gasoline Mont Belvieu Non-TET | ||||||||||||||||||||||||||
Contract Period | Volumes | Weighted-Average Contract Price | Volumes | Weighted-Average Contract Price | Volumes | Weighted-Average Contract Price | Volumes | Weighted-Average Contract Price | Volumes | Weighted-Average Contract Price | ||||||||||||||||||||
(MBbls) | (per Bbl) | (MBbls) | (per Bbl) | (MBbls) | (per Bbl) | (MBbls) | (per Bbl) | (MBbls) | (per Bbl) | |||||||||||||||||||||
First quarter 2017 | 847 | $ | 8.63 | 692 | $ | 21.90 | 122 | $ | 30.69 | 94 | $ | 31.12 | 156 | $ | 47.54 | |||||||||||||||
Second quarter 2017 | 787 | $ | 8.86 | 634 | $ | 21.90 | 112 | $ | 30.69 | 86 | $ | 31.12 | 143 | $ | 47.56 | |||||||||||||||
Third quarter 2017 | 736 | $ | 9.14 | 588 | $ | 21.91 | 104 | $ | 30.70 | 80 | $ | 31.12 | 133 | $ | 47.59 | |||||||||||||||
Fourth quarter 2017 | 692 | $ | 9.10 | 550 | $ | 21.91 | 98 | $ | 30.70 | 74 | $ | 31.12 | 124 | $ | 47.61 | |||||||||||||||
2018 | 2,434 | $ | 10.18 | 1,442 | $ | 22.86 | — | $ | — | — | $ | — | — | $ | — | |||||||||||||||
2019 | 2,176 | $ | 11.95 | — | $ | — | — | $ | — | — | $ | — | — | $ | — | |||||||||||||||
2020 | 539 | $ | 11.13 | — | $ | — | — | $ | — | — | $ | — | — | $ | — | |||||||||||||||
Total | 8,211 | 3,906 | 436 | 334 | 556 | |||||||||||||||||||||||||
126
Commodity Derivative Contracts Entered Into After December 31, 2016
Subsequent to December 31, 2016, and pursuant to a definitive agreement, the Company entered into certain NYMEX swap contracts on behalf of the buyer of its outside-operated Eagle Ford shale assets, which will be novated to the buyer at closing expected to occur in the first quarter of 2017. Please refer to Note 3 – Acquisitions, Divestitures, and Assets Held for Sale.
Additionally, subsequent to December 31, 2016, the Company entered into various derivative contracts, as summarized below:
• | derivative costless collar contracts through the fourth quarter of 2019 for a total of 2.7 million Bbls of oil production with contract floor prices of $50.00 per Bbl and contract ceiling prices ranging from $57.00 per Bbl to $58.40 per Bbl; |
• | derivative fixed price Midland-Cushing basis swap contracts through the fourth quarter of 2019 for a total of 3.7 million Bbls of oil production at contract prices ranging from ($1.23) per Bbl to ($1.45) per Bbl; and |
• | derivative fixed price swap contracts through the first quarter of 2018 for a total of 1.1 million Bbls of NGL production at contract prices ranging from $35.07 per Bbl to $49.88 per Bbl. |
Derivative Assets and Liabilities Fair Value
The Company’s commodity derivatives are measured at fair value and are included in the accompanying balance sheets as derivative assets and liabilities. The fair value of the commodity derivative contracts was a net liability of $91.7 million at December 31, 2016, and net asset of $488.4 million at December 31, 2015.
The following tables detail the fair value of derivatives recorded in the accompanying balance sheets, by category:
As of December 31, 2016 | |||||||||||
Derivative Assets | Derivative Liabilities | ||||||||||
Balance Sheet Classification | Fair Value | Balance Sheet Classification | Fair Value | ||||||||
(in thousands) | |||||||||||
Commodity contracts | Current assets | $ | 54,521 | Current liabilities | $ | 115,464 | |||||
Commodity contracts | Noncurrent assets | 67,575 | Noncurrent liabilities | 98,340 | |||||||
Derivatives not designated as hedging instruments | $ | 122,096 | $ | 213,804 | |||||||
As of December 31, 2015 | |||||||||||
Derivative Assets | Derivative Liabilities | ||||||||||
Balance Sheet Classification | Fair Value | Balance Sheet Classification | Fair Value | ||||||||
(in thousands) | |||||||||||
Commodity contracts | Current assets | $ | 367,710 | Current liabilities | $ | 8 | |||||
Commodity contracts | Noncurrent assets | 120,701 | Noncurrent liabilities | — | |||||||
Derivatives not designated as hedging instruments | $ | 488,411 | $ | 8 | |||||||
Offsetting of Derivative Assets and Liabilities
As of December 31, 2016, and 2015, all derivative instruments held by the Company were subject to master netting arrangements by various financial institutions. In general, the terms of the Company’s agreements provide for offsetting of amounts payable or receivable between it and the counterparty, at the election of both parties, for transactions that settle on the same date and in the same currency. The Company’s agreements also provide that in the event of an early termination, the counterparties have the right to offset amounts owed or owing under that and any other agreement with the same counterparty. The Company’s accounting policy is to not offset these positions in its accompanying balance sheets.
127
The following table provides a reconciliation between the gross assets and liabilities reflected on the accompanying balance sheets and the potential effects of master netting arrangements on the fair value of the Company’s derivative contracts:
Derivative Assets | Derivative Liabilities | |||||||||||||||
As of December 31, | As of December 31, | |||||||||||||||
Offsetting of Derivative Assets and Liabilities | 2016 | 2015 | 2016 | 2015 | ||||||||||||
(in thousands) | ||||||||||||||||
Gross amounts presented in the accompanying balance sheets | $ | 122,096 | $ | 488,411 | $ | (213,804 | ) | $ | (8 | ) | ||||||
Amounts not offset in the accompanying balance sheets | (118,080 | ) | (8 | ) | 118,080 | 8 | ||||||||||
Net amounts | $ | 4,016 | $ | 488,403 | $ | (95,724 | ) | $ | — | |||||||
The Company recognizes all gains and losses from changes in commodity derivative fair values immediately in earnings rather than deferring any such amounts in accumulated other comprehensive loss. The Company had no derivatives designated as hedging instruments for the years ended December 31, 2016, 2015, and 2014. Please refer to Note 11 - Fair Value Measurements for more information regarding the Company’s derivative instruments, including its valuation techniques.
The following table summarizes the components of net derivative (gain) loss presented in the accompanying statements of operations:
For the Years Ended December 31, | |||||||||||
2016 | 2015 | 2014 | |||||||||
(in thousands) | |||||||||||
Derivative settlement (gain) loss: | |||||||||||
Oil contracts | $ | (243,102 | ) | $ | (362,219 | ) | $ | (28,410 | ) | ||
Gas contracts (1) | (94,936 | ) | (123,180 | ) | 26,706 | ||||||
NGL contracts | 8,560 | (27,167 | ) | (10,911 | ) | ||||||
Total derivative settlement gain | $ | (329,478 | ) | $ | (512,566 | ) | $ | (12,615 | ) | ||
Total derivative (gain) loss: | |||||||||||
Oil contracts | $ | 85,370 | $ | (191,165 | ) | $ | (457,082 | ) | |||
Gas contracts | 81,060 | (189,734 | ) | (93,267 | ) | ||||||
NGL contracts | 84,203 | (27,932 | ) | (32,915 | ) | ||||||
Total net derivative (gain) loss | $ | 250,633 | $ | (408,831 | ) | $ | (583,264 | ) | |||
____________________________________________
(1) | Natural gas derivative settlements for the years ended December 31, 2015, and 2014, include $15.3 million and $5.6 million, respectively, of early settlements of futures contracts as a result of divesting assets in the Company’s Mid-Continent region. |
Credit Related Contingent Features
As of December 31, 2016, and through the filing date of this report, all of the Company’s derivative counterparties were members of the Company’s credit facility lender group. The Company’s obligations under its Credit Agreement and derivative contracts are secured by mortgages on assets having a value equal to at least 90 percent of the total PV-9 of the Company’s proved oil and gas properties evaluated in the most recent reserve report.
128
Note 11 – Fair Value Measurements
The Company follows fair value measurement accounting guidance for all assets and liabilities measured at fair value. This guidance defines fair value as the price that would be received to sell an asset or paid to transfer a liability (an exit price) in an orderly transaction between market participants at the measurement date. Market or observable inputs are the preferred sources of values, followed by assumptions based on hypothetical transactions in the absence of market inputs. The fair value hierarchy for grouping these assets and liabilities is based on the significance level of the following inputs:
• | Level 1 – quoted prices in active markets for identical assets or liabilities |
• | Level 2 – quoted prices in active markets for similar assets or liabilities, quoted prices for identical or similar instruments in markets that are not active, and model-derived valuations whose inputs are observable or whose significant value drivers are observable |
• | Level 3 – significant inputs to the valuation model are unobservable |
The following table is a listing of the Company’s assets and liabilities that are measured at fair value in the accompanying balance sheets and where they are classified within the fair value hierarchy as of December 31, 2016:
Level 1 | Level 2 | Level 3 | |||||||||
(in thousands) | |||||||||||
Assets: | |||||||||||
Derivatives (1) | $ | — | $ | 122,096 | $ | — | |||||
Total property and equipment, net (2) | $ | — | $ | — | $ | 88,205 | |||||
Liabilities: | |||||||||||
Derivatives (1) | $ | — | $ | 213,804 | $ | — | |||||
Net Profits Plan (1) | $ | — | $ | — | $ | 411 | |||||
____________________________________________
(1) | This represents a financial asset or liability that is measured at fair value on a recurring basis. |
(2) | This represents a non-financial asset that is measured at fair value on a nonrecurring basis. |
The following table is a listing of the Company’s assets and liabilities that are measured at fair value in the accompanying balance sheets and where they are classified within the fair value hierarchy as of December 31, 2015:
Level 1 | Level 2 | Level 3 | |||||||||
(in thousands) | |||||||||||
Assets: | |||||||||||
Derivatives (1) | $ | — | $ | 488,411 | $ | — | |||||
Total property and equipment, net (2) | $ | — | $ | — | $ | 124,813 | |||||
Liabilities: | |||||||||||
Derivatives (1) | $ | — | $ | 8 | $ | — | |||||
Net Profits Plan (1) | $ | — | $ | — | $ | 7,611 | |||||
____________________________________________
(1) | This represents a financial asset or liability that is measured at fair value on a recurring basis. |
(2) | This represents a non-financial asset that is measured at fair value on a nonrecurring basis. |
Both financial and non-financial assets and liabilities are categorized within the above fair value hierarchy based on the lowest level of input that is significant to the fair value measurement. The following is a description of the valuation methodologies used by the Company as well as the general classification of such instruments pursuant to the above fair value hierarchy.
129
Derivatives
The Company uses Level 2 inputs to measure the fair value of oil, gas, and NGL commodity derivatives. Fair values are based upon interpolated data. The Company derives internal valuation estimates taking into consideration forward commodity price curves, counterparties’ credit ratings, the Company’s credit rating, and the time value of money. These valuations are then compared to the respective counterparties’ mark-to-market statements. The considered factors result in an estimated exit-price that management believes provides a reasonable and consistent methodology for valuing derivative instruments. The derivative instruments utilized by the Company are not considered by management to be complex, structured, or illiquid. The oil, gas, and NGL commodity derivative markets are highly active.
Generally, market quotes assume that all counterparties have near zero, or low, default rates and have equal credit quality. However, an adjustment may be necessary to reflect the credit quality of a specific counterparty to determine the fair value of the instrument. The Company monitors the credit ratings of its counterparties and may require counterparties to post collateral if their ratings deteriorate. In some instances, the Company will attempt to novate the trade to a more stable counterparty. All of the Company’s derivative counterparties are members of the Company’s credit facility lender group.
Valuation adjustments are necessary to reflect the effect of the Company’s credit quality on the fair value of any derivative liability position. This adjustment takes into account any credit enhancements, such as collateral margin that the Company may have posted with a counterparty, as well as any letters of credit between the parties. The methodology to determine this adjustment is consistent with how the Company evaluates counterparty credit risk, taking into account the Company’s credit rating, current credit facility margins, and any change in such margins since the last measurement date.
The methods described above may result in a fair value estimate that may not be indicative of net realizable value or may not be reflective of future fair values and cash flows. While the Company believes that the valuation methods utilized are appropriate and consistent with authoritative accounting guidance and with other marketplace participants, the Company recognizes that third parties may use different methodologies or assumptions to determine the fair value of certain financial instruments that could result in a different estimate of fair value at the reporting date.
Refer to Note 10 - Derivative Financial Instruments for more information regarding the Company’s derivative instruments.
Proved and Unproved Oil and Gas Properties and Other Property and Equipment
Proved oil and gas properties. Proved oil and gas property costs are evaluated for impairment and reduced to fair value when there is an indication the carrying costs may not be recoverable. The Company uses Level 3 inputs and the income valuation technique, which converts future cash flow amounts to a single present value amount, to measure the fair value of proved properties through an application of discount rates and price forecasts representative of the current operating environment, as selected by the Company’s management. The calculation of the discount rates is based on the best information available and the rates used ranged from 10 percent to 15 percent based on the reservoir specific weightings of future estimated proved and unproved cash flows as of December 31, 2016, and 2015. The Company believes the discount rates are representative of current market conditions and consider estimates of future cash payments, reserve categories, expectations of possible variations in the amount and/or timing of cash flows, the risk premium, and nonperformance risk. The prices for oil and gas are forecast based on NYMEX strip pricing, adjusted for basis differentials, for the first five years, after which a flat terminal price is used for each commodity stream. The prices for NGLs are forecast using OPIS Mont Belvieu pricing, for as long as the market is actively trading, after which a flat terminal price is used. Future operating costs are also adjusted as deemed appropriate for these estimates.
The following table presents impairment of proved properties expense recorded for the periods presented:
For the Years Ended December 31, | |||||||||||
2016 | 2015 | 2014 | |||||||||
(in millions) | |||||||||||
Impairment of proved properties | $ | 354.6 | $ | 468.7 | $ | 84.5 | |||||
Impairments of proved properties during the year ended December 31, 2016, related primarily to the decline in expected reserve cash flows for the Company’s outside-operated Eagle Ford shale assets driven by commodity price declines during the first quarter of 2016, and downward performance reserve revisions in the fourth quarter of 2016 for the Company’s
130
Powder River Basin assets. Impairments of proved properties during the year ended December 31, 2015, were due to the decline in expected reserve cash flows driven by commodity price declines and were recorded mainly in the Company’s east Texas and Powder River Basin programs with smaller impacts on other legacy and non-core assets in the Rocky Mountain region. Impairments of proved properties during the year ended December 31, 2014, resulted from the significant decline in commodity prices in late 2014 and recognition of the outcomes of exploration and delineation wells in certain prospects in the Company’s South Texas & Gulf Coast and Permian regions.
Unproved oil and gas properties. Unproved oil and gas property costs are evaluated for impairment and reduced to fair value when there is an indication that the carrying costs may not be recoverable. To measure the fair value of unproved properties, the Company uses a market approach, which takes into account the following significant assumptions: remaining lease terms, future development plans, risk weighted potential resource recovery, estimated reserve values, and estimated acreage value based on price(s) received for similar, recent acreage transactions by the Company or other market participants.
The following table presents abandonment and impairment of unproved properties expense recorded for the periods presented:
For the Years Ended December 31, | |||||||||||
2016 | 2015 | 2014 | |||||||||
(in millions) | |||||||||||
Abandonment and impairment of unproved properties | $ | 80.4 | $ | 78.6 | $ | 75.6 | |||||
Abandonment and impairment of unproved properties during the year ended December 31, 2016, related primarily to a decrease in the fair value of the Company’s unproved Powder River Basin properties due to downward performance reserve revisions and lower market prices based on recent third-party acreage transactions. In all other periods, abandonment and impairment expense resulted from lease expirations and acreage the Company no longer intended to develop in light of changes in drilling plans in response to the decline in commodity prices.
Other property and equipment. Other property and equipment costs are evaluated for impairment and reduced to fair value when there is an indication the carrying costs may not be recoverable. To measure the fair value of other property and equipment, the Company uses an income valuation technique or market approach depending on the quality of information available to support management’s assumptions and the circumstances. The valuation includes consideration of the proved and unproved assets supported by the property and equipment, future cash flows associated with the assets, and fixed costs necessary to operate and maintain the assets. During the year ended December 31, 2015, the Company recorded impairment of other property and equipment expense of $49.4 million on the Company’s gathering system assets in its east Texas program. These assets were impaired in conjunction with the impairment of the associated proved and unproved properties, which the Company did not intend to develop and subsequently sold. There were no other property and equipment impairments in 2016 or 2014.
Oil and gas properties held for sale. Proved and unproved oil and gas properties classified as held for sale, including the corresponding asset retirement obligation liability, are valued using a market approach, based on an estimated net selling price, as evidenced by the most current bid prices received from third parties, if available. If an estimated selling price is not available, the Company utilizes the various income valuation techniques discussed above. Any initial write-down and subsequent changes to the fair value less estimated cost to sell is included within the net gain on divestiture activity line item in the accompanying statements of operations. There were no assets held for sale recorded at fair value as of December 31, 2016, or 2015, as the carrying values were below the estimated fair values less costs to sell. Please refer to Note 3 – Acquisitions, Divestitures, and Assets Held for Sale for additional discussion.
Acquisitions of proved and unproved properties. Assets acquired and liabilities assumed under transactions that meet the criteria of a business combination under ASC Topic 805, Business Combinations are recorded at fair value on the acquisition date using an income valuation technique based on inputs that are not observable in the market and therefore represent Level 3 inputs. Significant inputs to the valuation of acquired oil and gas properties include estimates of: (i) reserves; (ii) production rates; (iii) future operating and development costs; (iv) future commodity prices, including price differentials; (v) future cash flows; and (vi) a market participant-based weighted average cost of capital rate. These inputs require significant judgments and estimates by the Company’s management at the time of the valuation. The Rock Oil Acquisition closed on October 4, 2016, and therefore, was not recorded at fair value as of December 31. 2016.
131
Assets acquired and liabilities assumed under transactions that do not meet the criteria of a business combination under ASC Topic 805, Business Combinations are accounted for as an asset acquisition and are recorded based on the fair value of the total consideration transferred on the acquisition date using the lowest observable inputs available. In connection with the QStar Acquisition, the Company issued approximately 13.4 million shares of common stock as a component of the total consideration transferred to the sellers on December 21, 2016. Fair value of the equity consideration transferred was based on the closing price of the Company’s common stock on the date of acquisition, as adjusted using an option pricing model to account for the lack of marketability of the shares issued.
Please refer to Note 3 – Acquisitions, Divestitures, and Assets Held for Sale for additional discussion.
Net Profits Plan
The Net Profits Plan is a liability for which there is no available market price, principal market, or market participants. The inputs available for this instrument are unobservable and are therefore classified as Level 3 inputs. The Company employs the income valuation technique, which converts expected future cash flow amounts to a single present value amount. The estimate is highly dependent on commodity prices, cost assumptions, discount rates, and overall market conditions. Due to divestitures of assets subject to the Net Profits Plan in recent years, the liability has been significantly reduced and is no longer considered a significant accounting estimate. The Net Profits Plan liability is included in the other noncurrent liabilities line on the accompanying balance sheets.
The following table reflects the activity for the Company’s Net Profits Plan liability measured at fair value using Level 3 inputs:
For the Years Ended December 31, | |||||||||||
2016 | 2015 | 2014 | |||||||||
(in thousands) | |||||||||||
Beginning balance | $ | 7,611 | $ | 27,136 | $ | 56,985 | |||||
Net increase (decrease) in liability (1) | 23,757 | (12,238 | ) | (12,492 | ) | ||||||
Net settlements (1) (2) | (30,957 | ) | (7,287 | ) | (17,357 | ) | |||||
Transfers in (out) of Level 3 | — | — | — | ||||||||
Ending balance | $ | 411 | $ | 7,611 | $ | 27,136 | |||||
____________________________________________
(1) | Net changes in the Company’s Net Profits Plan liability are shown in the change in Net Profits Plan liability line item of the accompanying statements of operations. |
(2) | Settlements represent cash payments made or accrued under the Net Profits Plan and are recognized as compensation expense or a reduction to the net gain on divestiture activity line in the accompanying statements of operations, as discussed in Note 7 – Compensation Plans. |
132
Long-Term Debt
The following table reflects the fair value of the Senior Notes and Senior Convertible Notes measured using Level 1 inputs based on quoted secondary market trading prices. These notes were not presented at fair value on the accompanying balance sheets as of December 31, 2016, or 2015, as they are recorded at carrying value, net of any unamortized discounts and deferred financing costs. Please refer to Note 5 - Long-Term Debt for additional discussion.
As of December 31, | |||||||||||||||
2016 | 2015 | ||||||||||||||
Principal Amount | Fair Value | Principal Amount | Fair Value | ||||||||||||
(in thousands) | |||||||||||||||
6.50% Senior Notes due 2021 | $ | 346,955 | $ | 354,546 | $ | 350,000 | $ | 262,938 | |||||||
6.125% Senior Notes due 2022 | $ | 561,796 | $ | 570,925 | $ | 600,000 | $ | 440,250 | |||||||
6.50% Senior Notes due 2023 | $ | 394,985 | $ | 403,134 | $ | 400,000 | $ | 296,000 | |||||||
5.0% Senior Notes due 2024 | $ | 500,000 | $ | 475,975 | $ | 500,000 | $ | 334,065 | |||||||
5.625% Senior Notes due 2025 | $ | 500,000 | $ | 485,000 | $ | 500,000 | $ | 326,875 | |||||||
6.75% Senior Notes due 2026 | $ | 500,000 | $ | 516,565 | $ | — | $ | — | |||||||
1.50% Senior Convertible Notes due 2021 | $ | 172,500 | $ | 202,189 | $ | — | $ | — | |||||||
The carrying value of the Company’s credit facility approximates its fair value, as the applicable interest rates are floating, based on prevailing market rates.
Note 12 - Acquisition and Development Agreement
In June 2011, the Company entered into an Acquisition and Development Agreement with Mitsui E&P Texas LP (“Mitsui” and the “Acquisition and Development Agreement”). Pursuant to the Acquisition and Development Agreement, the Company agreed to transfer to Mitsui a 12.5 percent working interest in certain outside-operated oil and gas assets representing approximately 39,000 net acres in Dimmit, LaSalle, Maverick, and Webb Counties, Texas. As consideration for the oil and gas interests transferred, Mitsui agreed to pay, or carry, 90 percent of certain drilling and completion costs attributable to the Company’s remaining interest in these assets until Mitsui expended an aggregate $680.0 million on behalf of the Company. The Acquisition and Development Agreement also provided for reimbursement of capital expenditures and other costs, net of revenues, paid by the Company that were attributable to the transferred interest during the period between the effective date and the closing date, which the parties agreed would be applied over the carry period to cover the Company’s remaining 10 percent of drilling and completion costs for the affected acreage. During the second quarter of 2014, the remainder of the carry under the Acquisition and Development Agreement was expended.
133
Note 13 - Suspended Well Costs
The following table reflects the net changes in capitalized exploratory well costs during 2016, 2015, and 2014. The table does not include amounts that were capitalized and either subsequently expensed or reclassified to producing well costs in the same year:
For the Years Ended December 31, | |||||||||||
2016 | 2015 | 2014 | |||||||||
(in thousands) | |||||||||||
Beginning balance on January 1, | $ | 11,952 | $ | 43,589 | $ | 34,527 | |||||
Additions to capitalized exploratory well costs pending the determination of proved reserves | 19,846 | 11,952 | 43,589 | ||||||||
Divestitures | — | (809 | ) | — | |||||||
Reclassifications to wells, facilities, and equipment based on the determination of proved reserves | (11,952 | ) | (18,485 | ) | (33,340 | ) | |||||
Capitalized exploratory well costs charged to expense | — | (24,295 | ) | (1,187 | ) | ||||||
Ending balance at December 31, | $ | 19,846 | $ | 11,952 | $ | 43,589 | |||||
As of December 31, 2016, there were no exploratory well costs that were capitalized for more than one year.
Note 14 - Exit and Disposal Costs
2016 Activity. In the third quarter of 2016, the Company conducted a company-wide reduction in workforce and in the fourth quarter of 2016, the Company closed its Billings, Montana regional office and relocated certain employees to the Company’s corporate office in Denver, Colorado or other Company offices. This decision was made in an effort to reduce future costs and better position the Company for efficient growth in response to prolonged commodity price weakness. The Company expects to incur approximately $7.6 million of total exit and disposal costs related to termination benefits, relocation of certain employees, and other related matters, excluding lease expenses discussed below, all of which are included in general and administrative expense in the accompanying statements of operations. The Company incurred $5.1 million of exit and disposal costs during the year ended December 31, 2016, and expects to incur the remaining costs in early 2017. Upon closing the office in Billings, Montana, the Company paid $3.2 million to the lessor to terminate the lease.
2015 Activity. In conjunction with its Mid-Continent divestitures in 2015, the Company closed its Tulsa, Oklahoma regional office and incurred $9.3 million of exit and disposal costs, excluding the lease expenses discussed below, all of which were included in general and administrative expense in the accompanying statements of operations for the year ended December 31, 2015. The Company subsequently subleased its space for a portion of the remaining lease term. As of December 31, 2016, the Company is obligated to pay lease costs of approximately $3.8 million, net of expected income from subleased office space, which will be expensed over the remaining duration of the lease, which expires in 2022.
134
Note 15 - Equity
On August 12, 2016, the Company completed an underwritten public offering of approximately 18.4 million shares of its common stock at an offering price of $30.00 per share. Net proceeds from the offering totaled $530.9 million, after deducting underwriting discounts and commissions and offering expenses, which the Company used to partially fund the Rock Oil Acquisition that closed on October 4, 2016.
On December 7, 2016, the Company completed an underwritten public offering of approximately 10.9 million shares of its common stock at an offering price of $38.25 per share. Net proceeds from the offering totaled $403.2 million, after deducting underwriting discounts and commissions and offering expenses, which the Company used to partially fund the QStar Acquisition.
These public equity offerings were made pursuant to an effective shelf registration statement on Form S-3 filed with the SEC.
On December 21, 2016, and as part of the QStar Acquisition, the Company issued approximately 13.4 million shares of its common stock valued at approximately $437.2 million in a private placement to the sellers as partial consideration for the acquired properties. Please refer to Note 3 - Acquisitions, Divestitures, and Assets Held for Sale for additional discussion.
Supplemental Oil and Gas Information (unaudited)
Costs Incurred in Oil and Gas Producing Activities
Costs incurred in oil and gas property acquisition, exploration and development activities, whether capitalized or expensed, are summarized as follows:
For the Years Ended December 31, | |||||||||||
2016 | 2015 | 2014 | |||||||||
(in thousands) | |||||||||||
Development costs (1) | $ | 595,331 | $ | 1,234,114 | $ | 1,782,324 | |||||
Exploration costs | 118,224 | 132,465 | 288,270 | ||||||||
Acquisitions (2) | |||||||||||
Proved properties | 201,672 | 10,040 | 272,902 | ||||||||
Unproved properties (3) | 2,458,667 | 18,382 | 368,208 | ||||||||
Total, including asset retirement obligation (4)(5) | $ | 3,373,894 | $ | 1,395,001 | $ | 2,711,704 | |||||
____________________________________________
(1) | Includes facility costs of $25.9 million, $75.6 million, and $75.1 million for the years ended December 31, 2016, 2015, and 2014, respectively. |
(2) | Includes the $437.2 million value of the equity consideration given to the sellers of the QStar Acquisition. Please refer to Note 3 - Acquisitions, Divestitures, and Assets Held for Sale for additional discussion. |
(3) | Includes amounts related to leasing activity outside of acquisitions of proved and unproved properties totaling $7.5 million, $17.5 million, and $79.5 million for the years ended December 31, 2016, 2015, and 2014, respectively. |
(4) | Includes amounts relating to estimated asset retirement obligations of $32.1 million, $38.5 million, and $11.4 million for the years ended December 31, 2016, 2015, and 2014, respectively. For the year ended December 31, 2016, $16.5 million of the estimated asset retirement obligation amount relates to acquired proved properties. |
(5) | Includes capitalized interest of $17.0 million, $25.1 million, and $16.2 million for the years ended December 31, 2016, 2015, and 2014, respectively. |
Oil and Gas Reserve Quantities
The reserve estimates presented below were made in accordance with GAAP requirements for disclosures about oil and gas producing activities and SEC rules for oil and gas reporting of reserve estimation and disclosure.
Proved reserves are the estimated quantities of oil, gas, and NGLs, which, by analysis of geoscience and engineering data, can be estimated with reasonable certainty to be economically producible from a given date forward, from known reservoirs, and under existing economic conditions, operating methods, and government regulations prior to the time at which
135
contracts providing the right to operate expire, unless evidence indicates that renewal is reasonably certain, regardless of whether deterministic or probabilistic methods are used for the estimation. Existing economic conditions include prices and costs at which economic producibility from a reservoir is to be determined, and the price to be used is the average price during the 12-month period prior to the ending date of the period covered by the report, determined as an unweighted arithmetic average of the first-day-of-the-month price for each month within such period, unless prices are defined by contractual arrangements, excluding escalations based upon future conditions. All of the Company’s estimated proved reserves are located in the United States.
The table below presents a summary of changes in the Company’s estimated proved reserves for each of the years in the three-year period ended December 31, 2016. The Company engaged Ryder Scott to audit internal engineering estimates for at least 80 percent of the Company’s total calculated proved reserve PV-10 for each year presented. The Company emphasizes that reserve estimates are inherently imprecise and that estimates of new discoveries and undeveloped locations are more imprecise than estimates of established producing oil and gas properties. Accordingly, these estimates are expected to change as future information becomes available.
For the Years Ended December 31, | ||||||||||||||||||||||||||
2016 (1) | 2015 (2) | 2014 (3) | ||||||||||||||||||||||||
Oil | Gas | NGLs | Oil | Gas | NGLs | Oil | Gas | NGLs | ||||||||||||||||||
(MMBbl) | (Bcf) | (MMBbl) | (MMBbl) | (Bcf) | (MMBbl) | (MMBbl) | (Bcf) | (MMBbl) | ||||||||||||||||||
Total proved reserves: | ||||||||||||||||||||||||||
Beginning of year | 145.3 | 1,264.0 | 115.4 | 169.7 | 1,466.5 | 133.5 | 126.6 | 1,189.3 | 103.9 | |||||||||||||||||
Revisions of previous estimate | (36.0 | ) | (249.8 | ) | (18.6 | ) | (46.2 | ) | (369.6 | ) | (40.6 | ) | (5.1 | ) | 46.0 | 7.8 | ||||||||||
Discoveries and extensions | 7.8 | 42.5 | 4.1 | 16.9 | 122.3 | 9.3 | 15.0 | 103.5 | 10.5 | |||||||||||||||||
Infill reserves in an existing proved field | 32.3 | 228.1 | 18.9 | 24.9 | 356.2 | 29.7 | 32.0 | 270.8 | 24.1 | |||||||||||||||||
Sales of reserves (4) | (40.0 | ) | (46.7 | ) | — | (1.9 | ) | (138.4 | ) | (0.4 | ) | (1.9 | ) | (1.1 | ) | — | ||||||||||
Purchases of minerals in place (4) | 12.1 | 19.9 | 0.1 | 1.1 | 0.6 | — | 19.8 | 10.9 | 0.2 | |||||||||||||||||
Production | (16.6 | ) | (146.9 | ) | (14.2 | ) | (19.2 | ) | (173.6 | ) | (16.1 | ) | (16.7 | ) | (152.9 | ) | (13.0 | ) | ||||||||
End of year (5) | 104.9 | 1,111.1 | 105.7 | 145.3 | 1,264.0 | 115.4 | 169.7 | 1,466.5 | 133.5 | |||||||||||||||||
Proved developed reserves: | ||||||||||||||||||||||||||
Beginning of year | 75.6 | 644.4 | 61.5 | 89.3 | 784.6 | 66.7 | 70.2 | 569.2 | 43.8 | |||||||||||||||||
End of year | 48.5 | 609.1 | 58.6 | 75.6 | 644.4 | 61.5 | 89.3 | 784.6 | 66.7 | |||||||||||||||||
Proved undeveloped reserves: | ||||||||||||||||||||||||||
Beginning of year | 69.6 | 619.7 | 53.9 | 80.4 | 682.0 | 66.8 | 56.3 | 620.1 | 60.2 | |||||||||||||||||
End of year | 56.4 | 502.0 | 47.1 | 69.6 | 619.7 | 53.9 | 80.4 | 682.0 | 66.8 | |||||||||||||||||
____________________________________________
Note: Amounts may not calculate due to rounding.
136
(1) | For the year ended December 31, 2016, the Company added 108.2 MMBOE from its drilling program and acquired 15.5 MMBOE. These additions were offset by net negative engineering revisions of 96.2 MMBOE, consisting of 18.1 MMBOE of negative performance revisions, a 35.1 MMBOE negative price revision, and the removal of 43.0 MMBOE of certain longer term proved undeveloped reserves reflecting the Company’s shift to develop its predominately unproven Midland Basin properties. Additionally, the Company sold 47.7 MMBOE during 2016. |
(2) | For the year ended December 31, 2015, the Company added 160.6 MMBOE from its drilling program, the majority of which related to activity in the Eagle Ford shale and Bakken/Three Forks resource plays. The Company had net negative engineering revisions of 148.6 MMBOE, consisting of 47.3 MMBOE of positive performance revisions in the Eagle Ford shale and Bakken/Three Forks resource plays resulting from enhanced completions and reductions in operating expenses, offset by a 116.5 MMBOE negative price revision due to the decline in commodity prices in 2015 and the removal of 79.4 MMBOE of proved undeveloped reserves due to the five-year rule. Additionally, the Company sold 25.4 MMBOE in 2015. |
(3) | For the year ended December 31, 2014, the Company added 143.9 MMBOE from its drilling program and had upward engineering revisions of 10.4 MMBOE related primarily to improved performance and lower operating expenses in its operated Eagle Ford shale assets. |
(4) | Please refer to Note 3 – Acquisitions, Divestitures, and Assets Held for Sale for additional information. |
(5) | As of December 31, 2016, the Company’s outside-operated Eagle Ford shale assets were held for sale. Subsequent to year-end, the Company entered into a definitive agreement with an expected closing date in the first quarter of 2017. These assets represented approximately 74.0 MMBOE of the Company’s proved reserves as of December 31, 2016. Additionally, subsequent to December 31, 2016, the Company announced plans to sell its Divide County, North Dakota assets. |
Standardized Measure of Discounted Future Net Cash Flows
The Company computes a standardized measure of future net cash flows (“Standardized Measure”) and changes therein relating to estimated proved reserves in accordance with authoritative accounting guidance. Future cash inflows and production and development costs are determined by applying prices and costs, including transportation, quality, and basis differentials, to the year-end estimated future reserve quantities. Each property the Company operates is also charged with field-level overhead in the estimated reserve calculation. Estimated future income taxes are computed using the current statutory income tax rates, including consideration for estimated future statutory depletion. The resulting future net cash flows are reduced to present value amounts by applying a 10 percent annual discount factor.
Future operating costs are determined based on estimates of expenditures to be incurred in developing and producing the proved reserves in place at the end of the period using year-end costs and assuming continuation of existing economic conditions, plus Company overhead incurred by the central administrative office attributable to operating activities.
The assumptions used to compute the Standardized Measure are those prescribed by the FASB and the SEC. These assumptions do not necessarily reflect the Company’s expectations of actual revenues to be derived from those reserves, nor their present value amount. The limitations inherent in the reserve quantity estimation process, as discussed previously, are equally applicable to the Standardized Measure computations since these reserve quantity estimates are the basis for the valuation process. The following prices as adjusted for transportation, quality, and basis differentials were used in the calculation of the Standardized Measure:
For the Years Ended December 31, | |||||||||||
2016 | 2015 | 2014 | |||||||||
Oil (per Bbl) | $ | 37.22 | $ | 42.98 | $ | 84.65 | |||||
Gas (per Mcf) | $ | 2.45 | $ | 2.48 | $ | 4.63 | |||||
NGLs (per Bbl) | $ | 16.38 | $ | 16.99 | $ | 35.48 | |||||
137
The following summary sets forth the Company’s future net cash flows relating to proved oil, gas, and NGL reserves based on the Standardized Measure.
As of December 31, | |||||||||||
2016 | 2015 | 2014 | |||||||||
(in thousands) | |||||||||||
Future cash inflows | $ | 8,359,938 | $ | 11,337,865 | $ | 25,897,730 | |||||
Future production costs | (4,634,649 | ) | (6,234,687 | ) | (9,986,239 | ) | |||||
Future development costs | (1,636,077 | ) | (2,005,599 | ) | (3,294,164 | ) | |||||
Future income taxes (1) | — | — | (3,511,352 | ) | |||||||
Future net cash flows | 2,089,212 | 3,097,579 | 9,105,975 | ||||||||
10 percent annual discount | (937,099 | ) | (1,307,053 | ) | (3,407,192 | ) | |||||
Standardized measure of discounted future net cash flows | $ | 1,152,113 | $ | 1,790,526 | $ | 5,698,783 | |||||
(1) | Regarding the calculation as of December 31, 2016, and 2015, after evaluating all factors and giving effect to tax basis, future tax deductions, and available tax credits, the Company determined that at price levels for each respective period, future net cash flows would not be subject to federal or state income tax for the projected life of the reserves under authoritative tax legislation. |
The principle sources of changes in the Standardized Measure were:
For the Years Ended December 31, | |||||||||||
2016 | 2015 | 2014 | |||||||||
(in thousands) | |||||||||||
Standardized Measure, beginning of year | $ | 1,790,526 | $ | 5,698,783 | $ | 4,009,439 | |||||
Sales of oil, gas, and NGLs produced, net of production costs | (580,861 | ) | (776,272 | ) | (1,765,666 | ) | |||||
Net changes in prices and production costs | (315,725 | ) | (4,709,908 | ) | (75,966 | ) | |||||
Extensions, discoveries and other including infill reserves in an existing proved field, net of related costs | 242,556 | 386,069 | 1,819,657 | ||||||||
Sales of reserves in place | (377,607 | ) | (262,210 | ) | (49,736 | ) | |||||
Purchase of reserves in place | 115,270 | 4,686 | 413,175 | ||||||||
Previously estimated development costs incurred during the period | 290,837 | 449,738 | 1,015,694 | ||||||||
Changes in estimated future development costs | 27,961 | 191,447 | 138,247 | ||||||||
Revisions of previous quantity estimates | (124,845 | ) | (1,819,639 | ) | 167,500 | ||||||
Accretion of discount | 179,050 | 761,746 | 552,852 | ||||||||
Net change in income taxes | — | 1,918,670 | (399,587 | ) | |||||||
Changes in timing and other | (95,049 | ) | (52,584 | ) | (126,826 | ) | |||||
Standardized Measure, end of year | $ | 1,152,113 | $ | 1,790,526 | $ | 5,698,783 | |||||
138
Quarterly Financial Information (unaudited)
The Company’s quarterly financial information for fiscal years 2016 and 2015 is as follows (in thousands, except per share amounts):
First | Second | Third | Fourth | ||||||||||||
Quarter | Quarter | Quarter | Quarter | ||||||||||||
Year Ended December 31, 2016 (2) | |||||||||||||||
Total operating revenues and other income | $ | 143,076 | $ | 341,814 | $ | 352,660 | $ | 379,900 | |||||||
Total operating expenses | 669,801 | 572,363 | 370,314 | 664,287 | |||||||||||
Loss from operations | $ | (526,725 | ) | $ | (230,549 | ) | $ | (17,654 | ) | $ | (284,387 | ) | |||
Loss before income taxes | $ | (542,085 | ) | $ | (264,579 | ) | $ | (64,639 | ) | $ | (330,613 | ) | |||
Net loss | $ | (347,210 | ) | $ | (168,681 | ) | $ | (40,907 | ) | $ | (200,946 | ) | |||
Basic net loss per common share(1) | $ | (5.10 | ) | $ | (2.48 | ) | $ | (0.52 | ) | $ | (2.20 | ) | |||
Diluted net loss per common share(1) | $ | (5.10 | ) | $ | (2.48 | ) | $ | (0.52 | ) | $ | (2.20 | ) | |||
Dividends declared per common share | $ | 0.05 | $ | — | $ | 0.05 | $ | — | |||||||
Year Ended December 31, 2015 (3) | |||||||||||||||
Total operating revenues and other income | $ | 365,934 | $ | 516,146 | $ | 371,151 | $ | 303,734 | |||||||
Total operating expenses | 420,369 | 567,025 | 339,047 | 809,307 | |||||||||||
Income (loss) from operations | $ | (54,435 | ) | $ | (50,879 | ) | $ | 32,104 | $ | (505,573 | ) | ||||
Loss before income taxes | $ | (86,511 | ) | $ | (98,211 | ) | $ | (1,026 | ) | $ | (537,113 | ) | |||
Net income (loss) | $ | (53,058 | ) | $ | (57,508 | ) | $ | 3,114 | $ | (340,258 | ) | ||||
Basic net income (loss) per common share(1) | $ | (0.79 | ) | $ | (0.85 | ) | $ | 0.05 | $ | (5.01 | ) | ||||
Diluted net income (loss) per common share(1) | $ | (0.79 | ) | $ | (0.85 | ) | $ | 0.05 | $ | (5.01 | ) | ||||
Dividends declared per common share | $ | 0.05 | $ | — | $ | 0.05 | $ | — | |||||||
____________________________________________
(1) | Amounts may not sum due to rounding. |
(2) | First quarter of 2016 included the following: |
• | $272.1 million of proved and unproved property impairments on the Company’s outside-operated Eagle Ford shale assets due to declining commodity prices (see Note 11 - Fair Value Measurements) |
• | $69.0 million net pre-tax loss on divestiture activity related to write-downs on certain non-core assets held for sale (see Note 3 - Acquisitions, Divestitures, and Assets Held for Sale) |
• | $14.2 million net derivative gain (see Note 10 - Derivative Financial Instruments) |
• | $15.7 million net gain on the repurchase of a portion of the Company’s Senior Notes (see Note 5 - Long-Term Debt) |
Second quarter of 2016 included the following:
• | $50.0 million net pre-tax gain on divestiture activity related to an increase in fair value less costs to sell on assets held for sale (see Note 3 - Acquisitions, Divestitures, and Assets Held for Sale) |
• | $163.4 million net derivative loss (see Note 10 - Derivative Financial Instruments) |
Third quarter of 2016 included the following:
• | $11.6 million of proved and unproved property impairments (see Note 11 - Fair Value Measurements) |
• | $22.4 million net pre-tax gain on divestiture activity upon closing divestitures in the Company’s Rocky Mountain and Permian regions (see Note 3 - Acquisitions, Divestitures, and Assets Held for Sale) |
• | $28.0 million net derivative gain (see Note 10 - Derivative Financial Instruments) |
Fourth quarter of 2016 included the following:
• | $151.2 million of proved and unproved property impairments related primarily to negative performance revisions on the Company’s Powder River Basin assets (see Note 11 - Fair Value Measurements) |
• | $33.7 million net pre-tax gain on divestiture activity upon closing the Raven/Bear Den divestiture (see Note 3 - Acquisitions, Divestitures, and Assets Held for Sale) |
• | $129.5 million net derivative loss (see Note 10 - Derivative Financial Instruments) |
139
(3) | First quarter of 2015 included the following: |
• | $67.2 million of proved and unproved property impairments due to commodity price declines and the Company’s decision to reduce capital invested in the development of certain prospects in its South Texas & Gulf Coast and Permian regions and acreage it no longer intended to develop (see Note 11 - Fair Value Measurements) |
• | $16.3 million of expense relating to an exploratory dry hole |
• | $35.8 million net pre-tax loss on divestiture activity related to write-downs on certain assets held for sale in the Company’s Mid-Continent region (see Note 3 - Acquisitions, Divestitures, and Assets Held for Sale) |
• | $154.2 million net derivative gain (see Note 10 - Derivative Financial Instruments) |
Second quarter of 2015 included the following:
• | $18.7 million of proved and unproved property impairments (see Note 11 - Fair Value Measurements) |
• | $71.9 million net pre-tax gain on divestiture activity upon closing the sale of the Company’s Mid-Continent assets (see Note 3 - Acquisitions, Divestitures, and Assets Held for Sale) |
• | $80.9 million net derivative loss (see Note 10 - Derivative Financial Instruments) |
• | $16.6 million net loss on the early extinguishment of the Company’s 2019 Notes (see Note 5 - Long-Term Debt) |
Third quarter of 2015 included the following:
• | $62.6 million of proved and unproved property impairments primarily on legacy assets in the Company’s Rocky Mountain region as a result of the continued decline in commodity strip prices (see Note 11 - Fair Value Measurements) |
• | $212.3 million net derivative gain (see Note 10 - Derivative Financial Instruments) |
Fourth quarter of 2015 included the following:
• | $448.2 million of proved, unproved, and other property and equipment impairments due to continued commodity price declines, largely impacting the Company’s Powder River Basin program, as well as the Company’s decision to reduce capital invested in the development of its east Texas exploration program in its South Texas & Gulf Coast region (see Note 11 - Fair Value Measurements) |
• | $13.8 million expense relating to exploratory dry holes |
• | $123.3 million net derivative gain (see Note 10 - Derivative Financial Instruments) |
ITEM 9. | CHANGES IN AND DISAGREEMENTS WITH ACCOUNTANTS ON ACCOUNTING AND FINANCIAL DISCLOSURE |
None.
ITEM 9A. CONTROLS AND PROCEDURES
Evaluation of Disclosure Controls and Procedures
We maintain a system of disclosure controls and procedures that are designed to reasonably ensure that information required to be disclosed in our SEC reports is recorded, processed, summarized, and reported within the time periods specified in the SEC’s rules and forms, and to reasonably ensure that such information is accumulated and communicated to our management, including the Chief Executive Officer and the Chief Financial Officer, as appropriate, to allow for timely decisions regarding required disclosure.
Our management, including our Chief Executive Officer and Chief Financial Officer, does not expect that our disclosure controls and procedures (as defined in Rules 13a-15(e) and 15d-15(e) of the Exchange Act) (“Disclosure Controls”) will prevent all errors and all fraud. A control system, no matter how well conceived and operated, can provide only reasonable, not absolute, assurance that the objectives of the control system are met. Further, the design of a control system must reflect the fact that there are resource constraints, and the benefits of controls must be considered relative to their costs. Because of the inherent limitations in all control systems, no evaluation of controls can provide absolute assurance that all control issues and instances of fraud, if any, within the company have been detected. These inherent limitations include the realities that judgments in decision-making can be faulty, and that breakdowns can occur because of simple error or mistake. Additionally, controls can be circumvented by the individual acts of some persons, by collusion of two or more people, or by management override of the control. The design of any system of controls also is based in part upon certain assumptions about the likelihood of future events, and there can be no assurance that any design will succeed in achieving its stated goals under all
140
potential future conditions. Because of the inherent limitations in a cost-effective control system, misstatements due to error or fraud may occur and not be detected. We monitor our Disclosure Controls and make modifications as necessary; our intent in this regard is that the Disclosure Controls will be modified as systems change and conditions warrant.
An evaluation of the effectiveness of the design and operation of our Disclosure Controls was performed as of the end of the period covered by this report. This evaluation was performed under the supervision and with the participation of our management, including our Chief Executive Officer and Chief Financial Officer. Based upon that evaluation, our Chief Executive Officer and Chief Financial Officer concluded that these Disclosure Controls are effective at a reasonable assurance level.
Changes in Internal Control Over Financial Reporting
There have been no changes during the fourth quarter of 2016 that have materially affected, or are reasonably likely to materially affect, our internal control over financial reporting.
141
Management’s Report on Internal Control over Financial Reporting
Management of the Company is responsible for establishing and maintaining adequate internal control over financial reporting as defined in Rules 13a-15(f) and 15d-15(f) under the Securities Exchange Act of 1934, as amended. The Company’s internal control over financial reporting is designed to provide reasonable assurance regarding the reliability of financial reporting and the preparation of financial statements for external purposes in accordance with generally accepted accounting principles. The Company’s internal control over financial reporting includes those policies and procedures that:
(i) | pertain to the maintenance of records that, in reasonable detail, accurately and fairly reflect the transactions and dispositions of the assets of the Company; |
(ii) | provide reasonable assurance that transactions are recorded as necessary to permit preparation of financial statements in accordance with generally accepted accounting principles, and that receipts and expenditures of the Company are being made only in accordance with authorizations of management and directors of the Company; and |
(iii) | provide reasonable assurance regarding prevention or timely detection of unauthorized acquisition, use, or disposition of the Company’s assets that have a material effect on the financial statements. |
Because of the inherent limitations, internal controls over financial reporting may not prevent or detect misstatements. Even those systems determined to be effective can provide only reasonable assurance with respect to financial statement preparation and presentation. Also, projections of any evaluation of effectiveness to future periods are subject to the risk that controls may become inadequate because of the changes in conditions, or that the degree of compliance with the policies and procedures may deteriorate.
Management assessed the effectiveness of the Company’s internal control over financial reporting as of December 31, 2016. In making this assessment, management used the criteria set forth by the Committee of Sponsoring Organizations of the Treadway Commission in Internal Control-Integrated Framework (2013 framework).
Based on our assessment and those criteria, management believes that the Company maintained effective internal control over financial reporting as of December 31, 2016.
The Company’s independent registered public accounting firm has issued an attestation report on the Company’s internal control over financial reporting. That report immediately follows this report.
142
Report of Independent Registered Public Accounting Firm
The Board of Directors and Stockholders of SM Energy Company and subsidiaries
We have audited SM Energy Company and subsidiaries’ internal control over financial reporting as of December 31, 2016, based on criteria established in Internal Control-Integrated Framework issued by the Committee of Sponsoring Organizations of the Treadway Commission (2013 framework) (the COSO criteria). SM Energy Company and subsidiaries’ management is responsible for maintaining effective internal control over financial reporting, and for its assessment of the effectiveness of internal control over financial reporting included in the accompanying Management’s Report on Internal Control over Financial Reporting. Our responsibility is to express an opinion on the company’s internal control over financial reporting based on our audit.
We conducted our audit in accordance with the standards of the Public Company Accounting Oversight Board (United States). Those standards require that we plan and perform the audit to obtain reasonable assurance about whether effective internal control over financial reporting was maintained in all material respects. Our audit included obtaining an understanding of internal control over financial reporting, assessing the risk that a material weakness exists, testing and evaluating the design and operating effectiveness of internal control based on the assessed risk, and performing such other procedures as we considered necessary in the circumstances. We believe that our audit provides a reasonable basis for our opinion.
A company’s internal control over financial reporting is a process designed to provide reasonable assurance regarding the reliability of financial reporting and the preparation of financial statements for external purposes in accordance with generally accepted accounting principles. A company’s internal control over financial reporting includes those policies and procedures that (1) pertain to the maintenance of records that, in reasonable detail, accurately and fairly reflect the transactions and dispositions of the assets of the company; (2) provide reasonable assurance that transactions are recorded as necessary to permit preparation of financial statements in accordance with generally accepted accounting principles, and that receipts and expenditures of the company are being made only in accordance with authorizations of management and directors of the company; and (3) provide reasonable assurance regarding prevention or timely detection of unauthorized acquisition, use, or disposition of the company’s assets that could have a material effect on the financial statements.
Because of its inherent limitations, internal control over financial reporting may not prevent or detect misstatements. Also, projections of any evaluation of effectiveness to future periods are subject to the risk that controls may become inadequate because of changes in conditions, or that the degree of compliance with the policies or procedures may deteriorate.
In our opinion, SM Energy Company and subsidiaries maintained, in all material respects, effective internal control over financial reporting as of December 31, 2016, based on the COSO criteria.
We also have audited, in accordance with the standards of the Public Company Accounting Oversight Board (United States), the consolidated balance sheets of SM Energy Company and subsidiaries as of December 31, 2016 and 2015, and the related consolidated statements of operations, comprehensive income (loss), stockholders’ equity, and cash flows for each of the three years in the period ended December 31, 2016 of SM Energy Company and subsidiaries and our report dated February 23, 2017 expressed an unqualified opinion thereon.
/s/ Ernst & Young LLP
Denver, Colorado
February 23, 2017
143
ITEM 9B. OTHER INFORMATION
Amendment to By-Laws
Effective February 21, 2017, the Board of Directors amended and restated the Company’s by-laws (the “By-Laws”). The By-Laws include, among other things, the following changes:
• | provide the Board with explicit authority to cancel, postpone or reschedule a shareholder meeting; |
• | provide the chairman of the meeting with explicit authority to adjourn or recess a shareholder meeting; |
• | clarify the powers of the chairman of the meeting to conduct a shareholder meeting; |
• | provide for additional disclosure requirements for notices of director nominations and shareholder proposals; and |
• | clarify the procedural parameters governing the right of stockholders to take action by written consent. |
The foregoing description of the terms of the By-Laws do not purport to be complete and are subject to, and qualified in their entirety by, reference to the complete text of the By-Laws, a copy of which is filed as Exhibit 3.2 to this Annual Report on Form 10-K and incorporated by reference herein.
PART III
ITEM 10. DIRECTORS, EXECUTIVE OFFICERS, AND CORPORATE GOVERNANCE
The information required by this Item concerning SM Energy’s Directors, Executive Officers, and corporate governance is incorporated by reference to the information provided under the captions “Proposal 1 - Election of Directors,” “Information about Executive Officers,” and “Corporate Governance” in SM Energy’s definitive proxy statement for the 2017 annual meeting of stockholders to be filed within 120 days from December 31, 2016.
The information required by this Item concerning compliance with Section 16(a) of the Securities Exchange Act of 1934 is incorporated by reference to the information provided under the caption “Section 16(a) Beneficial Ownership Reporting Compliance” in SM Energy’s definitive proxy statement for the 2017 annual meeting of stockholders to be filed within 120 days from December 31, 2016.
ITEM 11. EXECUTIVE COMPENSATION
The information required by this Item is incorporated by reference to the information provided under the captions “Executive Compensation” and “Director Compensation” in SM Energy’s definitive proxy statement for the 2017 annual meeting of stockholders to be filed within 120 days from December 31, 2016.
ITEM 12. | SECURITY OWNERSHIP OF CERTAIN BENEFICIAL OWNERS AND MANAGEMENT AND RELATED STOCKHOLDER MATTERS |
The information required by this Item concerning security ownership of certain beneficial owners and management is incorporated by reference to the information provided under the caption “Security Ownership of Certain Beneficial Owners and Management” in SM Energy’s definitive proxy statement for the 2017 annual meeting of stockholders to be filed within 120 days from December 31, 2016.
144
Securities Authorized for Issuance Under Equity Compensation Plans. SM Energy has the Equity Plan under which options and shares of SM Energy common stock are authorized for grant or issuance as compensation to eligible employees, consultants, and members of the Board of Directors. Our stockholders have approved this plan. See Note 7 – Compensation Plans included in Part II, Item 8 of this report for further information about the material terms of our equity compensation plans. The following table is a summary of the shares of common stock authorized for issuance under equity compensation plans as of December 31, 2016:
(a) | (b) | (c) | ||||||||
Plan category | Number of securities to be issued upon exercise of outstanding options, warrants, and rights | Weighted-average exercise price of outstanding options, warrants, and rights | Number of securities remaining available for future issuance under equity compensation plans (excluding securities reflected in column (a)) | |||||||
Equity compensation plans approved by security holders: | ||||||||||
Equity Incentive Compensation Plan | ||||||||||
Stock options and incentive stock options (1) | — | $ | — | |||||||
Restricted stock (1)(3) | 604,116 | N/A | ||||||||
Performance share units (1)(3)(4) | 878,844 | N/A | ||||||||
Total for Equity Incentive Compensation Plan | 1,482,960 | $ | — | 5,531,614 | ||||||
Employee Stock Purchase Plan (2) | — | — | 731,572 | |||||||
Equity compensation plans not approved by security holders | — | — | — | |||||||
Total for all plans | 1,482,960 | $ | — | 6,263,186 | ||||||
(1) | In May 2006, the stockholders approved the Equity Plan to authorize the issuance of restricted stock, restricted stock units, non-qualified stock options, incentive stock options, stock appreciation rights, performance shares, performance units, and stock-based awards to key employees, consultants, and members of the Board of Directors of SM Energy or any affiliate of SM Energy. Our Board of Directors approved amendments to the Equity Plan in 2009, 2010, 2013, and 2016 and each amended plan was approved by stockholders at the respective annual stockholders’ meetings. The number of shares underlying awards granted in 2016, 2015, and 2014 under the Equity Plan were 918,509, 714,949, and 464,641, respectively. |
(2) | Under the SM Energy Company ESPP, eligible employees may purchase shares of our common stock through payroll deductions of up to 15 percent of their eligible compensation. The purchase price of the stock is 85 percent of the lower of the fair market value of the stock on the first or last day of the six-month offering period, and shares issued under the ESPP on or after December 31, 2011, have no minimum restriction period. The ESPP is intended to qualify under Section 423 of the IRC. Shares issued under the ESPP totaled 218,135, 197,214, and 83,136 in 2016, 2015, and 2014, respectively. |
(3) | RSUs and PSUs do not have exercise prices associated with them, but rather a weighted-average per share fair value, which is presented in order to provide additional information regarding the potential dilutive effect of the awards. The weighted-average grant date per share fair value for the outstanding RSUs and PSUs was $37.39 and $45.53, respectively. Please refer to Note 7 - Compensation Plans in Part II, Item 8 of this report for additional discussion. |
(4) | The number of awards vested assumes a one multiplier. The final number of shares issued upon settlement may vary depending on the three-year multiplier determined at the end of the performance period under the Equity Plan, which ranges from zero to two. |
145
ITEM 13. | CERTAIN RELATIONSHIPS AND RELATED TRANSACTIONS, AND DIRECTOR INDEPENDENCE |
The information required by this Item is incorporated by reference to the information provided under the captions “Certain Relationships and Related Transactions” and “Corporate Governance” in SM Energy’s definitive proxy statement for the 2017 annual meeting of stockholders to be filed within 120 days from December 31, 2016.
ITEM 14. PRINCIPAL ACCOUNTANT FEES AND SERVICES
The information required by this Item is incorporated by reference to the information provided under the captions “Independent Registered Public Accounting Firm” and “Audit Committee Preapproval Policy and Procedures” in SM Energy’s definitive proxy statement for the 2017 annual meeting of stockholders to be filed within 120 days from December 31, 2016.
146
PART IV
ITEM 15. EXHIBITS AND FINANCIAL STATEMENT SCHEDULES
(a)(1) and (a)(2) Financial Statements and Financial Statement Schedules:
Report of Independent Registered Public Accounting Firm | |
Consolidated Balance Sheets | |
Consolidated Statements of Operations | |
Consolidated Statements of Comprehensive Income (Loss) | |
Consolidated Statements of Stockholders’ Equity | |
Consolidated Statements of Cash Flows | |
Notes to Consolidated Financial Statements | |
All schedules are omitted because the required information is not applicable or is not present in amounts sufficient to require submission of the schedule or because the information required is included in the Consolidated Financial Statements and Notes thereto.
(b) Exhibits. The following exhibits are filed or furnished with or incorporated by reference into this report on Form 10-K:
Exhibit Number | Description |
1.1 | Underwriting Agreement dated May 7, 2015, among SM Energy Company, and Wells Fargo Securities, LLC, Merrill Lynch, Pierce, Fenner, & Smith Incorporated and J.P. Morgan Securities LLC, as representatives of the several underwriters (filed as Exhibit 1.1 to the registrant’s Current Report on Form 8-K filed on May 8, 2015, and incorporated herein by reference)
|
1.2 | Underwriting Agreement dated August 8, 2016 by and among SM Energy Company and Wells Fargo Securities, LLC, Merrill Lynch, Pierce, Fenner & Smith Incorporated and J.P. Morgan Securities LLC, as representatives of the several underwriters named therein (filed as Exhibit 1.1 to the registrant’s Current Report on Form 8-K filed on August 12, 2016, and incorporated herein by reference) |
1.3 | Underwriting Agreement dated August 8, 2016 by and among SM Energy Company and Wells Fargo Securities, LLC, Merrill Lynch, Pierce, Fenner & Smith Incorporated and J.P. Morgan Securities LLC, as representatives of the several underwriters named therein (filed as Exhibit 1.2 to the registrant’s Current Report on Form 8-K filed on August 12, 2016, and incorporated herein by reference) |
1.4 | Underwriting Agreement dated September 7, 2016 by and among SM Energy Company and Merrill Lynch, Pierce, Fenner & Smith Incorporated, Wells Fargo Securities, LLC, and J.P. Morgan Securities LLC, as representatives of the several underwriters named therein (filed as Exhibit 1.1 to the registrant’s Current Report on Form 8-K filed on September 12, 2016, and incorporated herein by reference) |
1.5 | Underwriting Agreement, dated December 1, 2016, by and among SM Energy Company and J.P. Morgan Securities LLC, Merrill Lynch, Pierce, Fenner & Smith Incorporated and Wells Fargo Securities, LLC, as representatives of the several underwriters named therein (filed as Exhibit 1.1 to the registrant’s Current Report on Form 8-K filed on December 7, 2016, and incorporated herein by reference) |
2.1 | Acquisition and Development Agreement dated June 29, 2011 between SM Energy Company and Mitsui E&P Texas LP (filed as Exhibit 2.2 to the registrant’s Quarterly Report on Form 10-Q for the quarter ended June 30, 2011, and incorporated herein by reference) |
2.2 | First Amendment to Acquisition and Development Agreement dated October 13, 2011 between SM Energy Company and Mitsui E&P Texas LP (filed as Exhibit 2.1 to the registrant’s Quarterly Report on Form 10-Q for the quarter ended September 30, 2011, and incorporated herein by reference) |
2.3*** | Purchase and Sale Agreement dated November 4, 2013, among SM Energy Company, EnerVest Energy Institutional Fund XIII-A, L.P., EnerVest Energy Institutional Fund XIII-WIB, L.P., and EnerVest Energy Institutional Fund XIII-WIC, L.P. (filed as Exhibit 2.4 to the registrant’s Amendment to the Annual Report on Form 10-K/A filed on May 9, 2014 for the year ended December 31, 2013, and incorporated herein by reference) |
147
2.4*** | Purchase and Sale Agreement dated July 29, 2014 between SM Energy Company and Baytex Energy USA LLC (filed as Exhibit 2.1 to the registrant’s Quarterly Report on Form 10-Q for the quarter ended September 30, 2014, and incorporated herein by reference) |
2.5 | Membership Interest Purchase Agreement dated August 8, 2016 between SM Energy Company and Rock Oil Holdings LLC (filed as Exhibit 2.1 to the registrant’s Current Report on Form 8-K filed on August 8, 2016, and incorporated herein by reference) |
2.6 | Purchase and Sale Agreement, dated October 17, 2016, by and between SM Energy Company and QStar LLC (filed as Exhibit 2.1 to the registrant’s Current Report on Form 8-K filed on October 21, 2016, and incorporated herein by reference) |
2.7 | Letter Agreement dated October 17, 2016, by and among SM Energy Company, QStar LLC, and RRP-QStar, LLC (filed as Exhibit 2.2 to the registrant’s Current Report on Form 8-K filed on October 21, 2016, and incorporated herein by reference) |
2.8 | Purchase and Sale Agreement dated October 17, 2016, by and between SM Energy Company and Oasis Petroleum North America LLC (filed as Exhibit 2.3 to the registrant’s Current Report on Form 8-K filed on October 21, 2016, and incorporated herein by reference) |
3.1 | Restated Certificate of Incorporation of SM Energy Company, as amended through June 1, 2010 (filed as Exhibit 3.1 to the registrant’s Quarterly Report on Form 10-Q for the quarter ended June 30, 2010, and incorporated herein by reference) |
3.2* | Amended and Restated By-Laws of SM Energy Company, effective as of February 21, 2017 |
4.1 | Indenture related to the 6.625% Senior Notes due 2019, dated February 7, 2011, by and between SM Energy Company, as issuer, and U.S. Bank National Association, as Trustee (filed as Exhibit 4.1 to the registrant’s Current Report on Form 8-K filed on February 10, 2011, and incorporated herein by reference) |
4.2 | Indenture related to the 6.50% Senior Notes due 2021, dated November 8, 2011, by and among SM Energy Company, as issuer, and U.S. Bank National Association, as Trustee (filed as Exhibit 4.1 to the registrant’s Current Report on Form 8-K filed on November 10, 2011, and incorporated herein by reference) |
4.3 | Indenture related to the 6.50% Senior Notes due 2023, dated June 29, 2012, between SM Energy Company, as Issuer, and U.S. Bank National Association, as Trustee (filed as Exhibit 4.1 to the registrant’s Current Report on Form 8-K filed on July 3, 2012, and incorporated herein by reference) |
4.4 | Indenture related to the 5.0% Senior Notes due 2024, dated May 20, 2013, by and between SM Energy Company, as issuer, and U.S. Bank National Association, as Trustee (filed as Exhibit 4.1 to the registrant’s Current Report on Form 8-K filed on May 20, 2013, and incorporated herein by reference) |
4.5 | Indenture related to the 6.125% Senior Notes due 2022, dated November 17, 2014, by and between SM Energy Company, as issuer, and U.S. Bank National Association, as Trustee (filed as Exhibit 4.1 to the registrant’s Current Report on Form 8-K filed on November 18, 2014, and incorporated herein by reference) |
4.6 | Indenture related to senior debt securities of SM Energy Company by and between SM Energy Company and U.S. Bank National Association, as trustee (filed as Exhibit 4.1 to the registrant’s Registration Statement on Form S-3 filed on May 7, 2015 (Registration No. 333-203936) and incorporated herein by reference) |
4.7 | 2025 Notes Supplemental Indenture (filed as Exhibit 4.2 to the registrant’s Current Report on Form 8-K filed on May 21, 2015, and incorporated herein by reference) |
4.8 | 2019 Notes Supplemental Indenture (filed as Exhibit 4.3 to the registrant’s Current Report on Form 8-K filed on May 21, 2015 and incorporated herein by reference) |
4.9 | Base Indenture, dated as of May 21, 2015, by and between SM Energy Company and U.S. Bank National Association, as trustee (filed as Exhibit 4.1 to the registrant’s Current Report on Form 8-K filed on August 12, 2016, and incorporated herein by reference) |
4.10 | Second Supplemental Indenture, dated August 12, 2016, by and between SM Energy Company and U.S. Bank, National Association, as trustee (filed as Exhibit 4.2 to the registrant’s Current Report on Form 8-K filed on August 12, 2016, and incorporated herein by reference) |
4.11 | Third Supplemental Indenture, dated September 12, 2016 by and between SM Energy Company and U.S. Bank National Association, as trustee (filed as Exhibit 4.2 to the registrant’s Current Report on Form 8-K filed on September 12, 2016, and incorporated herein by reference) |
4.12† | Equity Incentive Compensation Plan, amended and restated effective May 24, 2016 (filed as Exhibit 4.3 to the registrant’s Form S-8 filed on June 30, 2016, and incorporated herein by reference) |
4.13* | Lock-Up and Registration Rights Agreement, dated December 21, 2016, by and among SM Energy Company, QStar LLC and RRP-QStar, LLC |
10.1† | Stock Option Plan, as Amended on May 22, 2003 (filed as Exhibit 99.1 to the registrant’s Registration Statement on Form S-8 (Registration No. 333-106438) and incorporated herein by reference) |
148
10.2† | Incentive Stock Option Plan, as Amended on May 22, 2003 (filed as Exhibit 99.2 to the registrant’s Registration Statement on Form S-8 (Registration No. 333-106438) and incorporated herein by reference) |
10.3 | Supplement and Amendment to Deed of Trust, Mortgage, Line of Credit Mortgage, Assignment, Security Agreement, Fixture Filing and Financing Statement for the benefit of Wachovia Bank, National Association, as Administrative Agent, dated effective as of April 14, 2009 (filed as Exhibit 10.2 to the registrant’s Current Report on Form 8-K filed on April 20, 2009, and incorporated herein by reference) |
10.4 | Deed of Trust to Wachovia Bank, National Association, as Administrative Agent, dated effective as of April 14, 2009 (filed as Exhibit 10.3 to the registrant’s Current Report on Form 8-K filed on April 20, 2009, and incorporated herein by reference) |
10.5† | Form of Non-Employee Director Restricted Stock Award Agreement as of May 27, 2010 (filed as Exhibit 10.5 to the registrant’s Quarterly Report on Form 10-Q for the quarter ended June 30, 2010, and incorporated herein by reference) |
10.6*** | Gas Services Agreement effective as of July 1, 2010 between SM Energy Company and Eagle Ford Gathering LLC (filed as Exhibit 10.3 to the registrant’s Quarterly Report on Form 10-Q for the quarter ended September 30, 2010, and incorporated herein by reference) |
10.7s | Net Profits Interest Bonus Plan, As Amended by the Board of Directors on July 30, 2010 (filed as Exhibit 10.6 to the registrant’s Quarterly Report on Form 10-Q for the quarter ended September 30, 2010 and incorporated herein by reference) |
10.8† | Pension Plan for Employees of SM Energy Company as Amended and Restated as of January 1, 2010 (filed as Exhibit 10.30 to the registrant’s Annual Report on Form 10-K filed for the year ended December 31, 2010, and incorporated herein by reference) |
10.9+ | SM Energy Company Non-Qualified Unfunded Supplemental Retirement Plan as Amended as of November 9, 2010 (filed as Exhibit 10.31 to the registrant’s Annual Report on Form 10-K filed for the year ended December 31, 2010, and incorporated herein by reference) |
10.10 | Gas Gathering Agreement dated May 31, 2011 between Regency Field Services LLC and SM Energy Company (filed as Exhibit 10.2 to the registrant’s Quarterly Report on Form 10-Q for the quarter ended June 30, 2011, and incorporated herein by reference) |
10.11 | Gathering and Natural Gas Services Agreement effective as of April 1, 2011 between SM Energy Company and ETC Texas Pipeline, Ltd. (filed as Exhibit 10.3 to the registrant’s Quarterly Report on Form 10-Q for the quarter ended June 30, 2011, and incorporated herein by reference) |
10.12 | Gas Processing Agreement effective as of April 1, 2011 between ETC Texas Pipeline, Ltd. and SM Energy Company (filed as Exhibit 10.4 to the registrant’s Quarterly Report on Form 10-Q for the quarter ended June 30, 2011, and incorporated herein by reference) |
10.13† | Employee Stock Purchase Plan, As Amended and Restated as of June 10, 2011 (filed as Exhibit 10.5 to the registrant’s Quarterly Report on Form 10-Q for the quarter ended June 30, 2011, and incorporated herein by reference) |
10.14† | Amendment No. 1 to the Pension Plan for Employees of SM Energy Company amended as of January 1, 2011 (filed as Exhibit 10.41 to the registrant’s Annual Report on Form 10-K filed for the year ended December 31, 2011, and incorporated herein by reference) |
10.15† | Amendment No. 2 to the Pension Plan for Employees of SM Energy Company amended as of January 1, 2012 (filed as Exhibit 10.42 to the registrant’s Annual Report on Form 10-K filed for the year ended December 31, 2011, and incorporated herein by reference) |
10.16† | Equity Incentive Compensation Plan, As Amended as of May 22, 2013 (filed as Annex A to the registrant’s Schedule 14A filed on April 11, 2013, and incorporated herein by reference) |
10.17 | Fifth Amended and Restated Credit Agreement dated April 12, 2013, among SM Energy Company, as Borrower, Wells Fargo Bank, National Association, as Administrative Agent, and the Lenders party thereto (filed as Exhibit 10.1 to the registrant’s Current Report on Form 8-K filed on April 15, 2013, and incorporated herein by reference) |
10.18† | Form of Performance Stock Unit Award Agreement as of July 31, 2013 (filed as Exhibit 10.2 to the registrant’s Quarterly Report on Form 10-Q for the quarter ended June 30, 2013, and incorporated herein by reference) |
10.19† | Form of Restricted Stock Unit Award Agreement as of July 31, 2013 (filed as Exhibit 10.3 to the registrant’s Quarterly Report on Form 10-Q for the quarter ended June 30, 2013, and incorporated herein by reference) |
10.20† | Performance Stock Unit Award Agreement as of July 1, 2016 (filed as Exhibit 10.1 to the registrant’s Quarterly Report on Form 10-Q for the quarter ended June 30, 2016, and incorporated herein by reference) |
10.21† | Restricted Stock Unit Award Agreement as of July 1, 2016 (filed as Exhibit 10.2 to the registrant’s Quarterly Report on Form 10-Q for the quarter ended June 30, 2016, and incorporated herein by reference) |
149
10.22† | Non-Employee Director Restricted Stock Award Agreement as of May 25, 2016 (filed as Exhibit 10.3 to the registrant’s Quarterly Report on Form 10-Q for the quarter ended June 30, 2016, and incorporated herein by reference) |
10.23† | SM Energy Company Non-Qualified Deferred Compensation Plan as of March 10, 2014 (filed as Exhibit 10.1 to the registrant’s Current Report on Form 8-K filed on January 24, 2014, and incorporated herein by reference) |
10.24† | Cash Bonus Plan, As Amended and Restated as of February 1, 2014 (filed as Exhibit 10.41 to the registrant’s Annual Report on Form 10-K filed for the year ended December 31, 2013, and incorporated herein by reference) |
10.25† | Section 162(m) Cash Bonus Plan, effective as of May 21, 2014 (filed as Exhibit 10.1 to the registrant’s Current Report on Form 8-K filed on May 28, 2014, and incorporated herein by reference) |
10.26*† | Summary of Compensation Arrangements for Non-Employee Directors |
10.27 | Second Amendment to the Fifth Amended and Restated Credit Agreement dated December 10, 2014, among SM Energy Company, as Borrower, Wells Fargo Bank, National Association, as Administrative Agent, and the Lenders party thereto (filed as Exhibit 10.1 to the registrant’s Current Report on Form 8-K filed on December 16, 2014, and incorporated herein by reference) |
10.28 | Third Amendment to Fifth Amended and Restated Credit Agreement, dated May 20, 2015, among SM Energy Company, Wells Fargo Bank, National Association, as Administrative Agent, and the Lenders party thereto (filed as Exhibit 10.1 to the registrant’s Current Report on Form 8-K filed on May 27, 2015, and incorporated herein by reference) |
10.29 | Fourth Amendment to Fifth Amended and Restated Credit Agreement, dated October 7, 2015, among SM Energy Company, Wells Fargo Bank, National Association, as Administrative Agent, and the Lenders party thereto (filed as Exhibit 10.1 to the registrant’s Current Report on Form 8-K filed on October 8, 2015, and incorporated herein by reference) |
10.30 | Fifth Amendment to Fifth Amended and Restated Credit Agreement, dated November 11, 2015, among SM Energy Company, Wells Fargo Bank, National Association, as Administrative Agent, and the Lenders party thereto (filed as Exhibit 10.1 to the registrant’s Current Report on Form 8-K filed on November 11, 2015, and incorporated herein by reference) |
10.31 | Sixth Amendment to Fifth Amended and Restated Credit Agreement, dated April 8, 2016, among SM Energy Company, Wells Fargo Bank, National Association, as Administrative Agent, and the Lenders party thereto (filed as Exhibit 10.1 to the registrant’s Current Report on Form 8-K filed on April 13, 2016, and incorporated herein by reference) |
10.32 | Seventh Amendment to Fifth Amended and Restated Credit Agreement, dated August 8, 2016, among SM Energy Company, Wells Fargo Bank, National Association, as Administrative Agent, and the Lenders party thereto (filed as Exhibit 10.1 to the registrant’s Current Report on Form 8-K filed on August 9, 2016, and incorporated herein by reference) |
10.33 | Eighth Amendment to Fifth Amended and Restated Credit Agreement, dated September 30, 2016, among SM Energy Company, Wells Fargo Bank, National Association, as Administrative Agent, and the Lenders party thereto (filed as Exhibit 10.1 to the registrant’s Current Report on Form 8-K filed on October 6, 2016 and incorporated herein by reference) |
10.34† | Change of Control Executive Severance Agreement (filed as Exhibit 10.1 to the registrant’s Current Report on Form 8-K filed on October 20, 2015, and incorporated herein by reference) |
10.35† | Amendment No. 3 to the Pension Plan for Employees of SM Energy Company amended as of January 1, 2016 (filed as Exhibit 10.29 to the registrant’s Annual Report on Form 10-K filed for the year ended December 31, 2015, and incorporated herein by reference) |
10.36*** | Amendment to Amended and Restated Gas Gathering Agreement, effective as of September 1, 2015, by and between SM Energy Company and Regency Field Services LLC (filed as Exhibit 10.1 to the registrant’s Current Report on Form 8-K filed on September 15, 2015, and incorporated herein by reference) |
10.37 | Amendment to Amended and Restated Gas Gathering Agreement, effective as of February 1, 2016, by and between SM Energy Company and ETC Field Services LLC (filed as Exhibit 10.1 to the registrant’s Current Report on Form 8-K filed on February 22, 2016, and incorporated herein by reference) |
10.38 | Call Option Confirmation, dated August 8, 2016, by and between SM Energy Company and Wells Fargo Bank, National Association (filed as Exhibit 10.1 to the registrant’s Current Report on Form 8-K filed on August 12, 2016, and incorporated herein by reference) |
10.39 | Call Option Confirmation, dated August 8, 2016, by and between SM Energy Company and Bank of America, N.A. (filed as Exhibit 10.2 to the registrant’s Current Report on Form 8-K filed on August 12, 2016, and incorporated herein by reference) |
150
10.40 | Call Option Confirmation, dated August 8, 2016, by and between SM Energy Company and JPMorgan Chase Bank, National Association (filed as Exhibit 10.3 to the registrant’s Current Report on Form 8-K filed on August 12, 2016, and incorporated herein by reference) |
10.41 | Call Option Confirmation, dated August 10, 2016, by and between SM Energy Company and Wells Fargo Bank, National Association (filed as Exhibit 10.4 to the registrant’s Current Report on Form 8-K filed on August 12, 2016, and incorporated herein by reference) |
10.42 | Call Option Confirmation, dated August 10, 2016, by and between SM Energy Company and Bank of America, N.A. (filed as Exhibit 10.5 to the registrant’s Current Report on Form 8-K filed on August 12, 2016, and incorporated herein by reference) |
10.43 | Call Option Confirmation, dated August 10, 2016, by and between SM Energy Company and JPMorgan Chase Bank, National Association (filed as Exhibit 10.6 to the registrant’s Current Report on Form 8-K filed on August 12, 2016, and incorporated herein by reference) |
12.1* | Computation of Ratio of Earnings to Fixed Charges |
21.1* | Subsidiaries of Registrant |
23.1* | Consent of Ernst & Young LLP |
23.2* | Consent of Ryder Scott Company L.P. |
24.1* | Power of Attorney |
31.1* | Certification of Chief Executive Officer pursuant to Section 302 of the Sarbanes – Oxley Act of 2002 |
31.2* | Certification of Chief Financial Officer pursuant to Section 302 of the Sarbanes – Oxley Act of 2002 |
32.1** | Certification pursuant to 18 U.S.C. Section 1350 as adopted pursuant to Section 906 of the Sarbanes - Oxley Act of 2002 |
99.1* | Ryder Scott Audit Letter |
101.INS* | XBRL Instance Document |
101.SCH* | XBRL Schema Document |
101.CAL* | XBRL Calculation Linkbase Document |
101.LAB* | XBRL Label Linkbase Document |
101.PRE* | XBRL Presentation Linkbase Document |
101.DEF* | XBRL Taxonomy Extension Definition Linkbase Document |
* Filed with this Form 10-K.
** Furnished with this Form 10-K.
*** | Certain portions of this exhibit have been redacted and are subject to a confidential treatment order granted by the Securities and Exchange Commission pursuant to Rule 24b-2 under the Securities Exchange Act of 1934. |
† | Exhibit constitutes a management contract or compensatory plan or agreement. |
s | Exhibit constitutes a management contract or compensatory plan or agreement. This document was amended on July 30, 2010 primarily to reflect the change in the name of the registrant from St. Mary Land & Exploration Company to SM Energy Company. There were no material changes to the substantive terms and conditions in this document. |
+ | Exhibit constitutes a management contract or compensatory plan or agreement. This document was amended on November 9, 2010, in order to make technical revisions to ensure compliance with Section 409A of the Internal Revenue Code. There were no material changes to the substantive terms and conditions in this document. |
(c) Financial Statement Schedules. See Item 15(a) above.
151
SIGNATURES
Pursuant to the requirements of Section 13 or 15(d) of the Securities Exchange Act of 1934, the registrant has duly caused this report to be signed on its behalf by the undersigned, thereunto duly authorized.
SM ENERGY COMPANY | |||
(Registrant) | |||
Date: | February 23, 2017 | By: | /s/ JAVAN D. OTTOSON |
Javan D. Ottoson | |||
President and Chief Executive Officer | |||
(Principal Executive Officer) | |||
GENERAL POWER OF ATTORNEY
KNOW ALL PERSONS BY THESE PRESENTS, that each person whose signature appears below constitutes and appoints each of Javan D. Ottoson and A. Wade Pursell his or her true and lawful attorney-in-fact and agent with full power of substitution and resubstitution, and each with full power to act alone, for the undersigned and in his or her name, place and stead, in any and all capacities, to sign any amendments to this Annual Report on Form 10-K for the fiscal year ended December 31, 2016, and to file the same, with exhibits thereto and other documents in connection therewith, with the Securities and Exchange Commission, hereby ratifying and confirming all that each of said attorney-in-fact, or his substitute or substitutes, may do or cause to be done by virtue hereof.
Pursuant to the requirements of the Securities Exchange Act of 1934, this report has been signed below by the following persons on behalf of the registrant and in the capacities and on the dates indicated.
Signature | Title | Date | ||
/s/ JAVAN D. OTTOSON | President, Chief Executive Officer, and Director | February 23, 2017 | ||
Javan D. Ottoson | (Principal Executive Officer) | |||
/s/ A. WADE PURSELL | Executive Vice President and Chief Financial Officer | February 23, 2017 | ||
A. Wade Pursell | (Principal Financial Officer) | |||
/s/ MARK T. SOLOMON | Vice President - Controller and Assistant Secretary | February 23, 2017 | ||
Mark T. Solomon | (Principal Accounting Officer) | |||
152
Signature | Title | Date | ||
/s/ WILLIAM D. SULLIVAN | Chairman of the Board of Directors | February 23, 2017 | ||
William D. Sullivan | ||||
/s/ LARRY W. BICKLE | Director | February 23, 2017 | ||
Larry W. Bickle | ||||
/s/ STEPHEN R. BRAND | Director | February 23, 2017 | ||
Stephen R. Brand | ||||
/s/ LOREN M. LEIKER | Director | February 23, 2017 | ||
Loren M. Leiker | ||||
/s/ RAMIRO G. PERU | Director | February 23, 2017 | ||
Ramiro G. Peru | ||||
/s/ JULIO M. QUINTANA | Director | February 23, 2017 | ||
Julio M. Quintana | ||||
/s/ ROSE M. ROBESON | Director | February 23, 2017 | ||
Rose M. Robeson | ||||
153