Attached files
| file | filename |
|---|---|
| 8-K - FORM 8-K - PEGASYSTEMS INC | d350088d8k.htm |
Exhibit 99.1

Pegasystems Announces Financial Results for Fourth Quarter and Full Year 2016
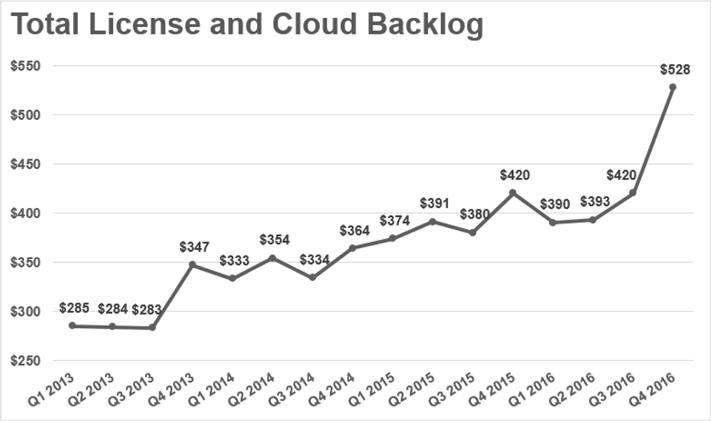
| • | Recurring revenue grows 15% year over year to $394 million, and total license and cloud backlog soars 26% year over year to $528 million. |
| • | 2017 Guidance: GAAP Revenue of $860 million or approximately 15% growth, GAAP EPS of $0.43, and Non-GAAP EPS of $1.00. |
| • | Increased focus in balancing revenue and margin growth, while shifting towards more predictable recurring revenue contracts. |
CAMBRIDGE, Mass. – February 23, 2017 – Pegasystems Inc. (NASDAQ: PEGA), the software company empowering customer engagement at the world’s leading enterprises, today announced results for its fourth quarter and full year ended December 31, 2016.
“We’re pleased with the solid results we delivered in 2016,” said Alan Trefler, founder and CEO, Pegasystems. “To remain competitive, enterprises need to think differently about how to deliver always-on personalized customer engagement and achieve increasing levels of operational excellence. Our solutions are unique in their ability to empower our clients to not just manage these challenges but to leverage them for competitive advantage.”
“It’s an exciting time at Pega,” said Ken Stillwell, CFO, Pegasystems. “The rapid growth of recurring contractual commitments led to record license and cloud backlog, reflecting our new client wins and the increased spend from existing clients. This significant trend improves the predictability of our business and supports expanding margins as we grow.”
SELECTED GAAP & NON-GAAP RESULTS (1)
| Three Months Ended December 31, | ||||||||||||||||||||||||
| ($ in thousands except per share amounts) | 2016 (2) | 2016 (2) | 2015 | 2015 | % Increase (Decrease) | |||||||||||||||||||
| GAAP | Non-GAAP | GAAP | Non-GAAP | GAAP | Non-GAAP | |||||||||||||||||||
|
|
||||||||||||||||||||||||
| Total Revenue |
$ | 199,610 | $ | 200,251 | $ | 204,355 | $ | 204,355 | (2%) | (2%) | ||||||||||||||
| License Revenue |
$ | 72,146 | $ | 72,164 | $ | 95,168 | $ | 95,168 | (24%) | (24%) | ||||||||||||||
| Cloud Revenue |
$ | 10,798 | $ | 10,828 | $ | 8,926 | $ | 8,926 | 21% | 21% | ||||||||||||||
| Net Income |
$ | 8,749 | $ | 15,556 | $ | 20,958 | $ | 29,582 | (58%) | (47%) | ||||||||||||||
| Diluted Earnings per share |
$ | 0.11 | $ | 0.20 | $ | 0.26 | $ | 0.37 | (58%) | (46%) | ||||||||||||||
| Year Ended December 31, | ||||||||||||||||||||||||
| ($ in thousands except per share amounts) | 2016 (2) | 2016 (2) | 2015 | 2015 | % Increase (Decrease) | |||||||||||||||||||
| GAAP | Non-GAAP | GAAP | Non-GAAP | GAAP | Non-GAAP | |||||||||||||||||||
|
|
||||||||||||||||||||||||
| Total Revenue |
$ | 750,266 | $ | 752,415 | $ | 682,695 | $ | 682,695 | 10% | 10% | ||||||||||||||
| License Revenue |
$ | 279,995 | $ | 280,042 | $ | 275,588 | $ | 275,588 | 2% | 2% | ||||||||||||||
| Cloud Revenue |
$ | 41,438 | $ | 41,592 | $ | 30,626 | $ | 30,626 | 35% | 36% | ||||||||||||||
| Net Income |
$ | 26,986 | $ | 61,059 | $ | 36,322 | $ | 63,960 | (26%) | (5%) | ||||||||||||||
| Diluted Earnings per share |
$ | 0.34 | $ | 0.77 | $ | 0.46 | $ | 0.81 | (26%) | (5%) | ||||||||||||||
(1) See a reconciliation of our GAAP to Non-GAAP measures contained in the financial schedules at the end of this release.
(2) We elected to early adopt Accounting Standards Update No. 2016-09, “Compensation-Stock Compensation (Topic 718): Improvement to Employee Share-based Payment Accounting” (“ASU 2016-09”) in the fourth quarter of 2016. See the financial schedules at the end of this release for further information.
1
License and Cloud Backlog: The Company computes license and cloud backlog by adding deferred license and cloud revenue as recorded on the Company’s balance sheet and license and cloud contractual commitments, which are not yet billed and not recorded on its balance sheet.
License and Cloud Backlog (1)
| December 31, | ||||||||||||||||||||
| ($ in thousands) | 2016 | 2015 | % Change | |||||||||||||||||
|
|
||||||||||||||||||||
| Deferred license and cloud revenue on the balance sheet: |
||||||||||||||||||||
| Term license and cloud |
$ | 30,725 | 50% | $ | 29,929 | 47% | 3% | |||||||||||||
| Perpetual license |
31,098 | 50% | 33,483 | 53% | (7%) | |||||||||||||||
|
|
|
|
|
|||||||||||||||||
| Total deferred license and cloud revenue |
61,823 | 100% | 63,412 | 100% | (3%) | |||||||||||||||
|
|
|
|
|
|||||||||||||||||
| License and cloud contractual commitments not on the balance sheet: (2) |
||||||||||||||||||||
| Term license and cloud |
434,323 | 93% | 322,844 | 91% | 35% | |||||||||||||||
| Perpetual license |
31,652 | 7% | 33,544 | 9% | (6%) | |||||||||||||||
|
|
|
|
|
|||||||||||||||||
| Total license and cloud contractual commitments |
465,975 | 100% | 356,388 | 100% | 31% | |||||||||||||||
|
|
|
|
|
|||||||||||||||||
| Total license (term and perpetual) and cloud backlog |
$ | 527,798 | $ | 419,800 | 26% | |||||||||||||||
|
|
|
|
|
|||||||||||||||||
| Total term license and cloud backlog |
$ | 465,048 | 88% | $ | 352,773 | 84% | 32% | |||||||||||||
|
|
|
|
|
|||||||||||||||||
(1) See historical quarterly license and cloud backlog amounts in a separate schedule at the end of this release.
(2) See future cash receipts from committed license and cloud arrangements in a separate schedule at the end of this release.
2
Recurring Revenue: The Company expects that our business will continue to shift away from perpetual licenses toward recurring revenue streams of term and cloud licenses.
Recurring Revenue (1)
| Year Ended December 31, | ||||||||||||||||||||||||
| ($ in thousands) | 2016 | 2016 | 2015 | 2015 | % Increase | |||||||||||||||||||
| GAAP | Non-GAAP | GAAP | Non-GAAP | GAAP | Non-GAAP | |||||||||||||||||||
|
|
||||||||||||||||||||||||
| Term license |
$ | 132,466 | $ | 132,513 | $ | 109,283 | $ | 109,283 | 21% | 21% | ||||||||||||||
| Cloud |
41,438 | 41,592 | 30,626 | 30,626 | 35% | 36% | ||||||||||||||||||
| Maintenance |
220,336 | 222,272 | 202,802 | 202,802 | 9% | 10% | ||||||||||||||||||
|
|
|
|
|
|
|
|
|
|||||||||||||||||
| Total recurring revenue |
$ | 394,240 | $ | 396,377 | $ | 342,711 | $ | 342,711 | 15% | 16% | ||||||||||||||
|
|
|
|
|
|
|
|
|
|||||||||||||||||
| As a percent of total revenue |
53% | 53% | 50% | 50% | ||||||||||||||||||||
Additional 2016 Performance Information (1):
| • | License and cloud contractual commitments grew by 31% year over year. |
| • | License and cloud backlog has continued to grow year over year, with significant growth of $135 million in the second half of 2016. |
| • | Recurring revenue, which is term license, cloud, and maintenance revenue, compounded annual growth rate (“CAGR”) was approximately 20% for the years 2013 through 2016, both GAAP and non-GAAP. |
| • | Term license and cloud revenue CAGR was approximately 30% for the years 2013 through 2016, both GAAP and non-GAAP. |
(1) See reconciliation of our GAAP to Non-GAAP measures contained in the financial schedules at the end of this release.
2017 Guidance: As of February 23, 2017, Pegasystems is providing revenue and EPS guidance for the full year 2017 as follows:
Full Year 2017 Revenue: GAAP and non-GAAP revenue for the full year 2017 is projected to be approximately $860 million.
Full Year 2017 Earnings Per Share (2): GAAP diluted earnings per share for the full year 2017 is expected to be approximately $0.43. Non-GAAP diluted earnings per share for the full year 2017 is expected to be approximately $1.00.
(2) See the reconciliation of our GAAP diluted EPS guidance to non-GAAP diluted EPS guidance for the full year of 2017 at the end of this release.
Quarterly Conference Call
Pegasystems will host a conference call and audio-only Webcast associated with this announcement at 5:00 p.m. EST today. A live audio Webcast of the conference call, together with detailed financial information, can be accessed through the Company’s Website at www.pega.com/about/investors. Dial-in information is as follows: 1-877-705-6003 (domestic) or 1-201-493-6725 (international). To listen to the Webcast, log onto www.pega.com at least five minutes prior to the event’s broadcast and click on the Webcast icon in the Investors section. A replay of the call will also be available on www.pega.com by clicking the Earnings Calls link in the Investors section.
Discussion of Non-GAAP Financial Measures:
To supplement financial results presented in accordance with Generally Accepted Accounting Principles in the U.S. (“GAAP”), the Company provides non-GAAP measures, including in this release. Pegasystems’ management utilizes a number of different financial measures, both GAAP and non-GAAP, in analyzing and assessing the overall performance of the business, for making operating decisions, and for forecasting and planning for future periods. The Company’s annual financial plan is prepared both on a GAAP and non-GAAP basis, and both are approved by our board of directors. In addition and as a consequence of the importance of these measures in managing the business, the Company uses non-GAAP measures and financial performance results in the evaluation process to establish management’s compensation.
3
The non-GAAP measures exclude the effects of certain business combination accounting entries, stock-based compensation expense, amortization of acquired intangibles, acquisition-related and restructuring expenses, and certain other adjustments. The Company believes that these non-GAAP measures are helpful in understanding its past financial performance and its anticipated future results. These non-GAAP financial measures are not meant to be considered in isolation or as a substitute for comparable GAAP measures and should be read only in conjunction with the Company’s consolidated financial statements prepared in accordance with GAAP. A reconciliation of the Company’s GAAP to non-GAAP measures is included in the financial schedules at the end of this release.
Forward-Looking Statements
“Safe harbor” statement under the Private Securities Litigation Reform Act of 1995: Certain statements contained in this press release may be construed as “forward-looking statements” as defined in the Private Securities Litigation Reform Act of 1995. The words “expect,” “anticipate,” “intend,” “plan,” “believe,” “could,” “estimate,” “may,” “target,” “strategy,” “is intended to,” “project,” “guidance”, “likely,” “usually,” or variations of such words and similar expressions, among others, identify forward-looking statements, which speak only as of the date the statement was made. These statements are based on current expectations and assumptions and involve various risks and uncertainties, which could cause the Company’s actual results to differ from those expressed in such forward-looking statements. These risks and uncertainties include, among others, variation in demand for our products and services and the difficulty in predicting the completion of product acceptance and other factors affecting the timing of our license revenue recognition; the ongoing consolidation in the financial services, insurance, healthcare, and communications markets; reliance on third party relationships; the potential loss of vendor specific objective evidence for our time and materials professional services arrangements; the inherent risks associated with international operations and the continued weakness in international economies; foreign currency exchange rates; the financial impact of the Company’s past acquisitions, including the OpenSpan acquisition, and any future acquisitions; the potential legal and financial liabilities and reputation damage due to cyber-attacks and security breaches; and management of the Company’s growth. Further information regarding these and other factors which could cause the Company’s actual results to differ materially from any forward-looking statements contained in this press release is contained in the Company’s recent filings with the Securities and Exchange Commission. These documents are available on the Company’s website at http://www.pega.com/about/investors. The forward-looking statements contained in this press release represent the Company’s views as of February 23, 2017. Investors are cautioned not to place undue reliance on such forward-looking statements and there are no assurances that the matters contained in such statements will be achieved. Although subsequent events may cause the Company’s view to change, except as required by applicable law, the Company does not undertake and specifically disclaims any obligation to publicly update or revise these forward-looking statements whether as the result of new information, future events or otherwise. The statements should therefore not be relied upon as representing the Company’s view as of any date subsequent to February 23, 2017.
About Pegasystems
Pegasystems Inc. (NASDAQ: PEGA) develops strategic applications for marketing, sales, service, and operations. Pega’s applications streamline critical business operations, connect enterprises to their customers seamlessly in real-time across channels, and adapt to meet rapidly changing requirements. Pega’s Global 3000 customers include many of the world’s most sophisticated and successful enterprises. Pega’s applications, available in the cloud or on-premises, are built on its unified Pega® Platform, which uses visual tools to easily extend and change applications to meet clients’ strategic business needs. Pega’s clients report that Pega software gives them the fastest time to value, extremely rapid deployment, efficient re-use, and global scale. For more information, please visit us at www.pega.com.
Press Contacts:
Lisa Pintchman
Pegasystems Inc.
lisa.pintchman@pega.com
(617) 866-6022
Twitter: @pega
Investor Contact:
Garo Toomajanian
ICR for Pegasystems
PegaInvestorRelations@pega.com
617-866-6077
All trademarks are the property of their respective owners.
4
Pegasystems Inc.
Consolidated Statements of Operations
($ in thousands, except per share amounts)
(Unaudited)
| Three Months Ended | Year Ended | |||||||||||||||
| December 31, | December 31, | |||||||||||||||
| 2016 (1) | 2015 | 2016 (1) | 2015 | |||||||||||||
| Revenue: |
||||||||||||||||
| Software license |
$ | 72,146 | $ | 95,168 | $ | 279,995 | $ | 275,588 | ||||||||
| Maintenance |
57,162 | 52,436 | 220,336 | 202,802 | ||||||||||||
| Services |
70,302 | 56,751 | 249,935 | 204,305 | ||||||||||||
|
|
|
|
|
|
|
|
|
|||||||||
| Total revenue |
199,610 | 204,355 | 750,266 | 682,695 | ||||||||||||
|
|
|
|
|
|
|
|
|
|||||||||
| Cost of revenue: |
||||||||||||||||
| Software license |
1,297 | 1,019 | 4,943 | 4,125 | ||||||||||||
| Maintenance |
6,616 | 5,603 | 25,505 | 21,903 | ||||||||||||
| Services |
54,296 | 46,543 | 208,808 | 187,418 | ||||||||||||
|
|
|
|
|
|
|
|
|
|||||||||
| Total cost of revenue (2) |
62,209 | 53,165 | 239,256 | 213,446 | ||||||||||||
|
|
|
|
|
|
|
|
|
|||||||||
| Gross profit |
137,401 | 151,190 | 511,010 | 469,249 | ||||||||||||
|
|
|
|
|
|
|
|
|
|||||||||
| Operating expenses: |
||||||||||||||||
| Selling and marketing |
76,723 | 71,623 | 278,849 | 241,387 | ||||||||||||
| Research and development |
37,018 | 32,126 | 145,548 | 126,374 | ||||||||||||
| General and administrative |
11,884 | 10,600 | 45,951 | 36,738 | ||||||||||||
| Acquisition-related |
- | 50 | 2,616 | 89 | ||||||||||||
| Restructuring |
- | - | 287 | - | ||||||||||||
|
|
|
|
|
|
|
|
|
|||||||||
| Total operating expenses (2) |
125,625 | 114,399 | 473,251 | 404,588 | ||||||||||||
|
|
|
|
|
|
|
|
|
|||||||||
| Income from operations |
11,776 | 36,791 | 37,759 | 64,661 | ||||||||||||
| Foreign currency transaction (loss) gain |
(517) | 174 | 2,247 | (4,168) | ||||||||||||
| Interest income, net |
126 | 249 | 776 | 1,056 | ||||||||||||
| Other expense, net |
(689) | (716) | (5,580) | (1,044) | ||||||||||||
|
|
|
|
|
|
|
|
|
|||||||||
| Income before provision for income taxes |
10,696 | 36,498 | 35,202 | 60,505 | ||||||||||||
| Provision for income taxes |
1,947 | 15,540 | 8,216 | 24,183 | ||||||||||||
|
|
|
|
|
|
|
|
|
|||||||||
| Net income |
$ | 8,749 | $ | 20,958 | $ | 26,986 | $ | 36,322 | ||||||||
|
|
|
|
|
|
|
|
|
|||||||||
| Earnings per share : |
||||||||||||||||
| Basic |
$ | 0.11 | $ | 0.27 | $ | 0.35 | $ | 0.47 | ||||||||
|
|
|
|
|
|
|
|
|
|||||||||
| Diluted |
$ | 0.11 | $ | 0.26 | $ | 0.34 | $ | 0.46 | ||||||||
|
|
|
|
|
|
|
|
|
|||||||||
| Weighted-average number of common shares outstanding: |
||||||||||||||||
| Basic |
76,403 | 76,466 | 76,343 | 76,507 | ||||||||||||
| Diluted |
80,725 | 79,456 | 79,732 | 79,043 | ||||||||||||
| Dividends declared per share |
$0.03 | $0.03 | $0.12 | $0.12 | ||||||||||||
|
|
|
|
|
|
|
|
|
|||||||||
| (1) We adopted ASU 2016-09 in the fourth quarter of 2016. Upon adoption, excess tax benefits generated when stock awards vest or settle are recognized as a reduction to the provision for income taxes instead of in equity. We are required to reflect any adjustments as of January 1, 2016, the beginning of the annual period that includes the interim period of adoption. As a result of the adoption, we recognized a reduction to our provision of income taxes of $6.7 million for the year ended December 31, 2016. | ||||||||||||||||
| (2) Includes stock-based compensation as follows: |
||||||||||||||||
| Cost of revenue |
$ | 2,748 | $ | 2,253 | $ | 11,459 | $ | 8,772 | ||||||||
| Operating expenses |
$ | 7,439 | $ | 4,796 | $ | 29,362 | $ | 21,282 | ||||||||
5
PEGASYSTEMS INC.
RECONCILIATION OF SELECTED GAAP MEASURES TO NON-GAAP MEASURES (1)
($ in thousands, except per share amounts)
(Unaudited)
| Three Months Ended December 31, | % Increase (Decrease) | |||||||||||||||||||||||||||||||||
| 2016 | 2016 | 2015 | 2015 | |||||||||||||||||||||||||||||||
| GAAP | Adj. | Non-GAAP | GAAP | Adj. | Non-GAAP | GAAP | Non-GAAP | |||||||||||||||||||||||||||
|
| ||||||||||||||||||||||||||||||||||
| TOTAL REVENUE | $ | 199,610 | $ | 641 | $ | 200,251 | $ | 204,355 | $ | - | $ | 204,355 | (2% | ) | (2%) | |||||||||||||||||||
| Software license |
72,146 | 18 | 72,164 | 95,168 | - | 95,168 | (24% | ) | (24%) | |||||||||||||||||||||||||
| Maintenance |
57,162 | 593 | 57,755 | 52,436 | - | 52,436 | 9% | 10% | ||||||||||||||||||||||||||
| Services |
70,302 | 30 | 70,332 | 56,751 | - | 56,751 | 24% | 24% | ||||||||||||||||||||||||||
| TOTAL COST OF REVENUE | $ | 62,209 | $ | (4,108 | ) | $ | 58,101 | $ | 53,165 | $ | (3,604 | ) | $ | 49,561 | 17% | 17% | ||||||||||||||||||
| Amortization of intangible assets (2) |
1,360 | (1,360 | ) | - | 1,351 | (1,351 | ) | - | ||||||||||||||||||||||||||
| Stock-based compensation |
2,748 | (2,748 | ) | - | 2,253 | (2,253 | ) | - | ||||||||||||||||||||||||||
| GROSS MARGIN % | 69% | 71% | 74% | 76% | (515 | ) bp | (476) | bp | ||||||||||||||||||||||||||
| TOTAL OPERATING EXPENSES (3) | $ | 125,625 | $ | (9,248 | ) | $ | 116,377 | $ | 114,399 | $ | (6,132 | ) | $ | 108,267 | 10% | 7% | ||||||||||||||||||
| Amortization of intangible assets (2) |
1,880 | (1,880 | ) | - | 1,615 | (1,615 | ) | - | ||||||||||||||||||||||||||
| Stock-based compensation |
7,439 | (7,439 | ) | - | 4,796 | (4,796 | ) | - | ||||||||||||||||||||||||||
| Other adjustments |
(71 | ) | 71 | - | (329 | ) | 329 | - | ||||||||||||||||||||||||||
| Acquisition-related |
- | - | - | 50 | (50 | ) | - | |||||||||||||||||||||||||||
| INCOME FROM OPERATIONS | $ | 11,776 | $ | 13,997 | $ | 25,773 | $ | 36,791 | $ | 9,736 | $ | 46,527 | (68%) | (45%) | ||||||||||||||||||||
| OPERATING MARGIN % | 6% | 13% | 18% | 23% | (1,210) | bp | (990) | bp | ||||||||||||||||||||||||||
| INCOME TAX EFFECTS (4) | $ | 1,947 | $ | 7,190 | $ | 9,137 | $ | 15,540 | $ | 1,112 | $ | 16,652 | (87%) | (45%) | ||||||||||||||||||||
| NET INCOME | $ | 8,749 | $ | 6,807 | $ | 15,556 | $ | 20,958 | $ | 8,624 | $ | 29,582 | (58%) | (47%) | ||||||||||||||||||||
| DILUTED EARNINGS PER SHARE | $ | 0.11 | $ | 0.09 | $ | 0.20 | $ | 0.26 | $ | 0.11 | $ | 0.37 | (58%) | (46%) | ||||||||||||||||||||
| DILUTED WEIGHTED-AVERAGE COMMON SHARES OUTSTANDING | 80,725 | - | 80,725 | 79,456 | - | 79,456 | 2% | 2% | ||||||||||||||||||||||||||
6
PEGASYSTEMS INC.
RECONCILIATION OF SELECTED GAAP MEASURES TO NON-GAAP MEASURES (1)
($ in thousands, except per share amounts)
(Unaudited)
| Year Ended December 31, | % Increase (Decrease) | |||||||||||||||||||||||||||||||||||
| 2016 | 2016 | 2015 | 2015 | |||||||||||||||||||||||||||||||||
| GAAP | Adj. | Non-GAAP | GAAP | Adj. | Non-GAAP | GAAP | Non-GAAP | |||||||||||||||||||||||||||||
|
| ||||||||||||||||||||||||||||||||||||
| TOTAL REVENUE | $ | 750,266 | $ | 2,149 | $ | 752,415 | $ | 682,695 | $ | - | $ | 682,695 | 10% | 10% | ||||||||||||||||||||||
| Software license |
279,995 | 47 | 280,042 | 275,588 | - | 275,588 | 2% | 2% | ||||||||||||||||||||||||||||
| Maintenance |
220,336 | 1,936 | 222,272 | 202,802 | - | 202,802 | 9% | 10% | ||||||||||||||||||||||||||||
| Services |
249,935 | 166 | 250,101 | 204,305 | - | 204,305 | 22% | 22% | ||||||||||||||||||||||||||||
| TOTAL COST OF REVENUE | $ | 239,256 | $ | (17,445) | $ | 221,811 | $ | 213,446 | $ | (14,089) | $ | 199,357 | 12% | 11% | ||||||||||||||||||||||
| Amortization of intangible assets (2) |
5,986 | (5,986) | - | 5,392 | (5,392) | - | ||||||||||||||||||||||||||||||
| Stock-based compensation |
11,459 | (11,459) | - | 8,772 | (8,772) | - | ||||||||||||||||||||||||||||||
| Other adjustments |
- | - | - | (75) | 75 | - | ||||||||||||||||||||||||||||||
| GROSS MARGIN % | 68% | 71% | 69% | 71% | (62) | bp | (28) | bp | ||||||||||||||||||||||||||||
| TOTAL OPERATING EXPENSES (3) | $ | 473,251 | $ | (39,054) | $ | 434,197 | $ | 404,588 | $ | (23,997) | $ | 380,591 | 17% | 14% | ||||||||||||||||||||||
| Amortization of intangible assets (2) |
7,422 | (7,422) | - | 6,810 | (6,810) | - | ||||||||||||||||||||||||||||||
| Stock-based compensation |
29,362 | (29,362) | - | 21,282 | (21,282) | - | ||||||||||||||||||||||||||||||
| Other adjustments |
(291) | 291 | - | (4,184) | 4,184 | - | ||||||||||||||||||||||||||||||
| Acquisition-related |
2,274 | (2,274) | - | 89 | (89) | - | ||||||||||||||||||||||||||||||
| Restructuring |
287 | (287) | - | - | - | - | ||||||||||||||||||||||||||||||
| INCOME FROM OPERATIONS | $ | 37,759 | $ | 58,648 | $ | 96,407 | $ | 64,661 | $ | 38,086 | $ | 102,747 | (42%) | (6%) | ||||||||||||||||||||||
| OPERATING MARGIN % | 5% | 13% | 9% | 15% | (444) | bp | (224) | bp | ||||||||||||||||||||||||||||
| INCOME TAX EFFECTS (4) | $ | 8,216 | $ | 24,575 | $ | 32,791 | $ | 24,183 | $ | 10,448 | $ | 34,631 | (66%) | (5%) | ||||||||||||||||||||||
| NET INCOME | $ | 26,986 | $ | 34,073 | $ | 61,059 | $ | 36,322 | $ | 27,638 | $ | 63,960 | (26%) | (5%) | ||||||||||||||||||||||
| DILUTED EARNINGS PER SHARE | $ | 0.34 | $ | 0.43 | $ | 0.77 | $ | 0.46 | $ | 0.35 | $ | 0.81 | (26%) | (5%) | ||||||||||||||||||||||
| DILUTED WEIGHTED-AVERAGE COMMON SHARES OUTSTANDING | 79,732 | - | 79,732 | 79,043 | - | 79,043 | 1% | 1% | ||||||||||||||||||||||||||||
7
PEGASYSTEMS INC.
FOOTNOTES FOR RECONCILIATION OF
SELECTED GAAP MEASURES TO NON-GAAP MEASURES
| (1) | This presentation includes non-GAAP measures. Our non-GAAP measures are not meant to be considered in isolation or as a substitute for comparable GAAP measures, and should be read only in conjunction with our consolidated financial statements prepared in accordance with GAAP. For a detailed explanation of the adjustments made to comparable GAAP measures, the reasons why management uses these measures, the usefulness of these measures, and the material limitations on the usefulness of these measures, see disclosure under Discussion of Non-GAAP Financial Measures included earlier in this release and below. Our non-GAAP financial measures reflect adjustments based on the following items, as well as the related income tax effects: |
Revenue: Business combination accounting rules require that we determine the fair value of the deferred revenue liability for contractual obligations assumed from our acquisition of OpenSpan in April 2016. In post-acquisition reporting periods, we recognize revenue for the fair value of these contracts, when all the revenue recognition criteria are satisfied, instead of the revenue that would have been recognized by OpenSpan as an independent company. We add back the effect of the deferred revenue fair value adjustment in non-GAAP revenue to reflect the full amount of these revenues to provide a more complete comparison of the revenue guidance to peer companies. No adjustments were made to revenue for 2015.
Amortization of intangible assets: We have excluded the amortization expense of intangible assets from our non-GAAP operating expenses and net earnings measures. Amortization of intangible assets is inconsistent in amount and frequency and is significantly affected by the timing and size of our acquisitions. Investors should note that the use of intangible assets contributed to our revenues earned during the periods presented and will contribute to our future period revenues as well. Amortization of intangible assets will recur in future periods.
Stock-based compensation expense: We have excluded stock-based compensation expense from our non-GAAP operating expenses and net earnings measures. Although stock-based compensation is a key incentive offered to our employees, and we believe such compensation contributed to the revenues earned during the periods presented and will contribute to the generation of future period revenues, we continue to evaluate our business performance excluding stock-based compensation expense.
Acquisition-related and restructuring expenses: We have excluded the effect of acquisition-related and restructuring expenses from our non-GAAP operating expenses and net earnings measures. We incurred direct and incremental expenses associated primarily with the OpenSpan acquisition. These acquisition-related expenses were primarily professional fees to affect the acquisition. We have also incurred restructuring expenses for one-time employee termination benefits related to the closure of one of our domestic offices, which we generally would not have otherwise incurred in the periods presented as a part of our continuing operations. We believe it is useful for investors to understand the effects of these items on our total operating expenses.
Other adjustments: We reached an agreement with the former shareholders of Antenna Software, Inc., which we acquired in October 2013 (“Antenna”), to release a portion of the funds held in escrow as security for their indemnification obligations to us in settlement of the outstanding indemnification claims. The settlement resulted in a benefit to cost of revenue and operating expenses in the first quarter of 2015. In addition, we favorably settled indirect tax liabilities related to the Antenna acquisition, which resulted in a benefit to operating expenses in the first quarter of 2015. We believe the benefits associated with these items are not representative of our ongoing business, and we have excluded the effects of these items from our non-GAAP operating results and net earnings measures.
8
| (2) | Estimated future annual amortization expense related to intangible assets as of December 31, 2016 is as follows: |
| (in thousands) | ||||
| 2017 | $ | 12,334 | ||
| 2018 | 11,334 | |||
| 2019 | 5,542 | |||
| 2020 | 2,646 | |||
| 2021 | 2,623 | |||
| 2022 and thereafter | 9,712 | |||
|
|
|
|||
| Total intangible assets subject to amortization |
$ | 44,191 | ||
|
|
|
| (3) | Below is a reconciliation of non-GAAP operating expenses: |
| Three Months Ended December 31, | ||||||||||||||||||||||||
| 2016 | 2016 | 2015 | 2015 | |||||||||||||||||||||
| (in thousands) | GAAP | Adj. | Non-GAAP | GAAP | Adj. | Non-GAAP | ||||||||||||||||||
|
|
||||||||||||||||||||||||
| Selling and marketing |
$ | 76,723 | $ | (4,869 | ) | $ | 71,854 | $ | 71,623 | $ | (3,824 | ) | $ | 67,799 | ||||||||||
| Amortization of intangible assets |
1,871 | (1,871 | ) | - | 1,525 | (1,525 | ) | - | ||||||||||||||||
| Stock-based compensation |
3,069 | (3,069 | ) | - | 2,628 | (2,628 | ) | - | ||||||||||||||||
| Other adjustments |
(71 | ) | 71 | - | (329 | ) | 329 | - | ||||||||||||||||
| Research and development |
$ | 37,018 | $ | (2,563 | ) | $ | 34,455 | $ | 32,126 | $ | (1,938 | ) | $ | 30,188 | ||||||||||
| Stock-based compensation |
2,563 | (2,563 | ) | - | 1,938 | (1,938 | ) | - | ||||||||||||||||
| General and administrative |
$ | 11,884 | $ | (1,816 | ) | $ | 10,068 | $ | 10,600 | $ | (320 | ) | $ | 10,280 | ||||||||||
| Amortization of intangible assets |
9 | (9 | ) | - | 90 | (90 | ) | - | ||||||||||||||||
| Stock-based compensation |
1,807 | (1,807 | ) | - | 230 | (230 | ) | - | ||||||||||||||||
| Acquisition-related |
$ | - | $ | - | $ | - | $ | 50 | $ | (50 | ) | $ | - | |||||||||||
| Acquisition-related |
- | - | - | 50 | (50 | ) | - | |||||||||||||||||
| TOTAL OPERATING EXPENSES |
$ | 125,625 | $ | (9,248 | ) | $ | 116,377 | $ | 114,399 | $ | (6,132 | ) | $ | 108,267 | ||||||||||
| Year Ended December 31, | ||||||||||||||||||||||||
| 2016 | 2016 | 2015 | 2015 | |||||||||||||||||||||
| (in thousands) | GAAP | Adj. | Non-GAAP | GAAP | Adj. | Non-GAAP | ||||||||||||||||||
|
|
||||||||||||||||||||||||
| Selling and marketing |
$ | 278,849 | $ | (19,318 | ) | $ | 259,531 | $ | 241,387 | $ | (14,702 | ) | $ | 226,685 | ||||||||||
| Amortization of intangible assets |
7,145 | (7,145 | ) | - | 6,127 | (6,127 | ) | - | ||||||||||||||||
| Stock-based compensation |
12,464 | (12,464 | ) | - | 8,911 | (8,911 | ) | - | ||||||||||||||||
| Other adjustments |
(291 | ) | 291 | - | (336 | ) | 336 | - | ||||||||||||||||
| Research and development |
$ | 145,548 | $ | (10,043 | ) | $ | 135,505 | $ | 126,374 | $ | (7,676 | ) | $ | 118,698 | ||||||||||
| Stock-based compensation |
10,043 | (10,043 | ) | - | 8,116 | (8,116 | ) | - | ||||||||||||||||
| Other adjustments |
- | - | - | (440 | ) | 440 | - | |||||||||||||||||
| General and administrative |
$ | 45,951 | $ | (6,790 | ) | $ | 39,161 | $ | 36,738 | $ | (1,530 | ) | $ | 35,208 | ||||||||||
| Amortization of intangible assets |
277 | (277 | ) | - | 683 | (683 | ) | - | ||||||||||||||||
| Stock-based compensation |
6,513 | (6,513 | ) | - | 4,255 | (4,255 | ) | - | ||||||||||||||||
| Other adjustments |
- | - | - | (3,408 | ) | 3,408 | - | |||||||||||||||||
| Acquisition-related |
$ | 2,616 | $ | (2,616 | ) | $ | - | $ | 89 | $ | (89 | ) | $ | - | ||||||||||
| Stock-based compensation |
342 | (342 | ) | - | - | - | - | |||||||||||||||||
| Acquisition-related |
2,274 | (2,274 | ) | - | 89 | (89 | ) | - | ||||||||||||||||
| Restructuring |
$ | 287 | $ | (287 | ) | $ | - | $ | - | $ | - | $ | - | |||||||||||
| TOTAL OPERATING EXPENSES |
$ | 473,251 | $ | (39,054 | ) | $ | 434,197 | $ | 404,588 | $ | (23,997 | ) | $ | 380,591 | ||||||||||
9
| (4) | The GAAP income tax effects were calculated using an effective GAAP tax rate of 18.2% and 42.6% for the fourth quarter of 2016 and 2015, respectively. The non-GAAP income tax effects were calculated using an effective non-GAAP tax rate of 37.0% and 36.0% for the fourth quarter of 2016 and 2015, respectively. |
The GAAP income tax effects were calculated using an effective GAAP tax rate of 23.3% and 40.0% for the full year 2016 and 2015, respectively. The non-GAAP income tax effects were calculated using an effective non-GAAP tax rate of 34.9% and 35.1% for the full year 2016 and 2015, respectively.
The differences between our GAAP and non-GAAP effective tax rates for the fourth quarter and full year 2016 and 2015 primarily relate to the impact of the adoption of ASU 2016-09 in the fourth quarter of 2016 and the impact of unfavorable foreign stock compensation adjustments on our GAAP effective tax rate.
10
Pegasystems Inc.
Condensed Consolidated Balance Sheets
(in thousands)
(Unaudited)
| As of | As of | |||||||
| December 31, 2016 | December 31, 2015 | |||||||
| Assets: |
||||||||
| Cash, cash equivalents, and marketable securities |
$ | 133,761 | $ | 219,078 | ||||
| Trade accounts receivable, net |
265,028 | 211,846 | ||||||
| Property and equipment, net |
38,281 | 31,319 | ||||||
| Deferred income taxes (1) |
69,898 | 65,730 | ||||||
| Goodwill and Intangible assets, net |
117,355 | 80,194 | ||||||
| Other assets (1) |
30,333 | 19,591 | ||||||
|
|
|
|
|
|||||
| Total assets |
$ |
654,656 |
|
$ |
627,758 |
| ||
|
|
|
|
|
|||||
| Liabilities and Stockholders’ Equity: |
||||||||
| Accrued expenses, including compensation and related expenses |
97,411 | 98,640 | ||||||
| Deferred revenue |
186,636 | 171,678 | ||||||
| Other liabilities |
34,720 | 34,581 | ||||||
| Stockholders’ equity |
335,889 | 322,859 | ||||||
|
|
|
|
|
|||||
| Total liabilities and stockholders’ equity |
$ |
654,656 |
|
$ |
627,758 |
| ||
|
|
|
|
|
|||||
(1) We retrospectively adopted ASU 2015-17 “Income Taxes (Topic 740): Balance Sheet Classification of Deferred Taxes” in the fourth quarter of 2016 and reclassified $12.4 million of current deferred tax assets to long-term deferred income tax assets at December 31, 2015 to conform with current year presentation.
11
Pegasystems Inc.
Condensed Consolidated Statements of Cash Flows
(in thousands)
(Unaudited)
| Year Ended | ||||||||
| December 31, | ||||||||
| 2016 | 2015 | |||||||
| Operating activities: |
||||||||
| Net income |
$ | 26,986 | $ | 36,322 | ||||
| Adjustments to reconcile net income to cash provided by operating activities: |
||||||||
| Deferred income taxes |
(5,810) | (2,099) | ||||||
| Depreciation and amortization, amortization of investments, foreign currency transaction (gain) loss, and other non-cash items |
22,370 | 30,321 | ||||||
| Stock-based compensation expense |
40,821 | 30,054 | ||||||
| Change in operating assets and liabilities, net |
(44,493) | (26,795) | ||||||
|
|
|
|
|
|||||
| Cash provided by operating activities |
39,874 | 67,803 | ||||||
|
|
|
|
|
|||||
| Cash used in investing activities |
(7,172) | (44,452) | ||||||
|
|
|
|
|
|||||
| Cash used in financing activities |
(51,716) | (40,659) | ||||||
|
|
|
|
|
|||||
| Effect of exchange rates on cash and cash equivalents | (3,418) | (4,251) | ||||||
|
|
|
|
|
|||||
| Net decrease increase in cash and cash equivalents | (22,432) | (21,559) | ||||||
| Cash and cash equivalents, beginning of period | 93,026 | 114,585 | ||||||
|
|
|
|
|
|||||
| Cash and cash equivalents, end of period | $ | 70,594 | $ | 93,026 | ||||
|
|
|
|
|
|||||
(1) We adopted ASU 2016-09 in the fourth quarter of 2016. Upon adoption, excess tax benefits generated when stock awards vest or settle are required to be presented as an operating activity rather than a financing activity in the statement of cash flows. We are required to reflect any adjustments as of January 1, 2016, the beginning of the annual period that includes the interim period of adoption. We retrospectively adopted this new guidance and reclassified $5.3 million from financing activities to operating activities for the year ended December 31, 2015.
12
Pegasystems Inc.
Historical License and Cloud Backlog
(in thousands)
|
|
||||||||||||||||||||||||||||||||
| 2016 | 2016 | 2016 | 2016 | 2015 | 2015 | 2015 | 2015 | |||||||||||||||||||||||||
| Q4 | Q3 | Q2 | Q1 | Q4 | Q3 | Q2 | Q1 | |||||||||||||||||||||||||
|
|
||||||||||||||||||||||||||||||||
| Deferred license and cloud revenue on the balance sheet: |
||||||||||||||||||||||||||||||||
| Term license and cloud |
$ | 30,725 | $ | 19,627 | $ | 19,021 | $ | 18,409 | $ | 29,929 | $ | 14,123 | $ | 16,398 | $ | 22,287 | ||||||||||||||||
| Perpetual license |
31,098 | 27,653 | 32,834 | 39,381 | 33,483 | 41,247 | 44,941 | 57,352 | ||||||||||||||||||||||||
|
|
|
|||||||||||||||||||||||||||||||
| Total deferred license and cloud revenue |
61,823 | 47,280 | 51,855 | 57,790 | 63,412 | 55,370 | 61,339 | 79,639 | ||||||||||||||||||||||||
|
|
|
|||||||||||||||||||||||||||||||
| License and cloud contractual commitments not on the balance sheet: | ||||||||||||||||||||||||||||||||
| Term license and cloud |
434,323 | 352,804 | 309,338 | 287,926 | 322,844 | 287,863 | 271,732 | 261,351 | ||||||||||||||||||||||||
| Perpetual license |
31,652 | 19,728 | 31,439 | 43,944 | 33,544 | 36,477 | 58,311 | 33,061 | ||||||||||||||||||||||||
|
|
|
|||||||||||||||||||||||||||||||
| Total license and cloud contractual commitments |
465,975 | 372,532 | 340,777 | 331,870 | 356,388 | 324,340 | 330,043 | 294,412 | ||||||||||||||||||||||||
|
|
|
|||||||||||||||||||||||||||||||
| Total license (term and perpetual) and cloud backlog |
$ | 527,798 | $ | 419,812 | $ | 392,632 | $ | 389,660 | $ | 419,800 | $ | 379,710 | $ | 391,382 | $ | 374,051 | ||||||||||||||||
|
|
|
|||||||||||||||||||||||||||||||
| Total term license and cloud backlog |
$ | 465,048 | $ | 372,431 | $ | 328,359 | $ | 306,335 | $ | 352,773 | $ | 301,986 | $ | 288,130 | $ | 283,638 | ||||||||||||||||
|
|
|
|||||||||||||||||||||||||||||||
| Term license and cloud backlog as a % of total license and cloud backlog | 88% | 89% | 84% | 79% | 84% | 80% | 74% | 76% | ||||||||||||||||||||||||
13
Pegasystems Inc.
Future Cash Receipts from Committed License and Cloud Arrangements
($ in thousands)
| Term and cloud contracts |
Perpetual contracts (1) |
|||||||||||
| As of December 31, |
Committed but not yet billed | Total | ||||||||||
| 2017 |
$ | 129,641 | $ | 17,751 | $ | 147,392 | ||||||
| 2018 |
121,944 | 10,233 | 132,177 | |||||||||
| 2019 |
93,826 | 2,931 | 96,757 | |||||||||
| 2020 |
63,278 | 737 | 64,015 | |||||||||
| 2021 |
21,841 | — | 21,841 | |||||||||
| 2022 and thereafter |
3,793 | — | 3,793 | |||||||||
|
|
|
|
|
|
|
|||||||
| Total |
$ | 434,323 | $ | 31,652 | $ | 465,975 | ||||||
|
|
|
|
|
|
|
|||||||
| As a percentage of total license and cloud contractual commitments |
93 | % | 7 | % | ||||||||
(1) These amounts are for perpetual licenses with extended payment terms and/or additional rights of use.
14
Pegasystems Inc.
FY 2017 Reconciliation of Forward-Looking Guidance
($ in thousands, except per share amounts)
| Full Year 2017 | ||||||||
| Net Income and Diluted EPS - GAAP basis |
$ | 33,609 | $ | 0.43 | ||||
| Adjustment to exclude amortization of intangible assets, net of tax |
8,697 | 0.11 | ||||||
| Adjustment to exclude stock-based compensation, net of tax |
36,300 | 0.46 | ||||||
|
|
|
|
|
|||||
| Net Income and Diluted EPS - Non-GAAP basis |
$ | 78,606 | $ | 1.00 | ||||
|
|
|
|
|
|||||
15