Attached files
| file | filename |
|---|---|
| EX-99.1 - EXHIBIT 99.1 - FIRST POTOMAC REALTY TRUST | fpo20161231ex-991.htm |
| 8-K - 8-K - FIRST POTOMAC REALTY TRUST | fpo201612318-k.htm |
 | Index to Supplemental Information | |
Page | |
Company Information | |
Earnings Release | |
Consolidated Statements of Operations | |
Consolidated Balance Sheets | |
Same Property Analysis | |
Highlights | |
Quarterly Financial Results | |
Quarterly Supplemental Financial Results | |
Quarterly Financial Measures | |
Annual Financial Results | |
Annual Supplemental Financial Results | |
Annual Financial Measures | |
Capitalization and Selected Ratios | |
Outstanding Debt | |
Debt Maturity Schedule | |
Selected Debt Covenants | |
Investment in Joint Ventures | |
Net Asset Value Analysis | |
Portfolio Summary | |
Leasing and Occupancy Summary | |
Portfolio by Size | |
Top Twenty-Five Tenants | |
Annual Lease Expirations | |
Quarterly Lease Expirations | |
Leasing Analysis | |
Retention Summary | |
Office Properties | |
Business Park / Industrial Properties | |
Management Statements on Non-GAAP Supplemental Measures | |
| Company Information | |
First Potomac Realty Trust is a leader in the ownership, management, development and redevelopment of office and business park properties in the greater Washington, D.C. region. Our focus is owning and operating properties that can benefit from our market knowledge and intensive operational skills with a focus on increasing their profitability and value.
Corporate Headquarters | 7600 Wisconsin Avenue | ||
11th Floor | |||
Bethesda, MD 20814 | |||
New York Stock Exchange |  | ||
Website | www.first-potomac.com | ||
Investor Relations | Randy Haugh | ||
Vice President, Finance | |||
(240) 235-5573 | |||
rhaugh@first-potomac.com | |||
The forward-looking statements contained in this supplemental financial information, including statements in our earnings release regarding our 2017 Core FFO guidance and related assumptions, execution of our strategic plan, potential dispositions and the timing and pricing of such dispositions, future acquisitions and growth opportunities, and the timing of future tenant occupancies, are subject to various risks and uncertainties. Although we believe the expectations reflected in any forward-looking statements contained herein are based on reasonable assumptions, there can be no assurance that our expectations will be achieved. Certain factors that could cause actual results to differ materially from our expectations include changes in general or regional economic conditions; our ability to timely lease or re-lease space at current or anticipated rents; changes in interest rates; changes in operating costs; our ability to complete acquisitions and dispositions on acceptable terms, or at all; our ability to manage our current debt levels and repay or refinance our indebtedness upon maturity or other required payment dates; our ability to maintain financial covenant compliance under our debt agreements; our ability to maintain effective internal controls over financial reporting and disclosure controls and procedures; our ability to obtain debt and/or financing on attractive terms, or at all; changes in the assumptions underlying our earnings and Core FFO guidance and other risks detailed in our Annual Report on Form 10-K and described from time to time in our filings with the Securities and Exchange Commission. Many of these factors are beyond our ability to control or predict. Forward-looking statements are not guarantees of performance. For forward-looking statements herein, we claim the protection of the safe harbor for forward-looking statements contained in the Private Securities Litigation Reform Act of 1995. We assume no obligation to update or supplement forward-looking statements that become untrue because of subsequent events. We do not intend to, and expressly disclaim any duty to, update or revise the forward-looking statements in this discussion to reflect changes in underlying assumptions or factors, new information, future events or otherwise, after the date hereof, except as may be required by law. In light of these risks and uncertainties, you should not rely upon these forward-looking statements after the date of this report and should keep in mind that any forward-looking statement made in this discussion, or elsewhere, might not occur.
Note that certain figures are rounded to the nearest thousands or to a tenth of a percent throughout the document, which may impact footing and/or crossfooting of totals and subtotals.
2
| Earnings Release | |
Company Contact: | First Potomac Realty Trust | |||
Randy Haugh | | 7600 Wisconsin Avenue | ||
Vice President, Finance | 11th Floor | |||
(240) 235-5573 | Bethesda, MD 20814 | |||
rhaugh@first-potomac.com | www.first-potomac.com | |||
FIRST POTOMAC REALTY TRUST REPORTS
FOURTH QUARTER AND FULL-YEAR 2016 RESULTS
Completed Total Asset Sales of $295 Million, Including Two Sales in 2017,
Toward Stated Goal of $350 million of Non-Core Assets
BETHESDA, MD. (February 23, 2017) - First Potomac Realty Trust (NYSE: FPO), a leader in the ownership, management, development and redevelopment of office and business park properties in the greater Washington, D.C. region, reported results for the three and twelve months ended December 31, 2016.
Fourth Quarter 2016 and Subsequent Highlights
• | Reported net loss attributable to common shareholders of $1.6 million, or $0.03 per diluted share. |
• | Reported Core Funds From Operations of $16.0 million, or $0.27 per diluted share. |
• | Increased occupied percentage to 92.6% from 90.3% at December 31, 2015. |
• | Increased leased percentage to 93.8% from 92.1% at December 31, 2015. |
• | Sold One Fair Oaks, a 214,000 square-foot office building located in Northern Virginia, for net proceeds of $13.3 million in January 2017 and sold Plaza 500, a 503,000 square-foot industrial property located in Northern Virginia, for net proceeds of $72.5 million in February 2017. |
• | Entered into a binding contract in January 2017 to sell Rivers Park I and II and Aviation Business Park, which are located in Maryland and are owned through unconsolidated joint ventures. |
Full-Year 2016 Highlights
• | Reported net loss attributable to common shareholders of $9.6 million, or $0.17 per diluted share. |
• | Reported Core Funds From Operations of $63.9 million, or $1.06 per diluted share. |
• | Increased same property net operating income ("Same Property NOI") by 2.4% on an accrual basis compared with the same period in 2015. |
• | Completed construction and commenced revenue recognition on the 167,000 square foot, fully-leased build-to-suit in Northern Virginia (the "NOVA build-to-suit"). |
• | Redeemed all 6.4 million outstanding 7.750% Series A Cumulative Redeemable Perpetual Preferred Shares (the "7.750% Series A Preferred Shares"). |
Bob Milkovich, Chief Executive Officer of First Potomac Realty Trust stated, “A year ago we announced our strategic plan to de-risk our portfolio, de-lever our balance sheet and maximize value for our shareholders, and I am pleased with the progress we have made to date. While there was an intense focus on executing the Strategic Plan, we were also able to deliver very strong operational and financial results in 2016. As we look forward, we know there is plenty of work to be done in 2017, including completing our targeted non-core asset dispositions and executing on our redevelopment projects, but we are prepared for those objectives and look forward to continuing to deliver value for our shareholders."
3
| Earnings Release - Continued | |
Reconciliation of Net Loss Attributable to Common Shareholders and FFO, FFO Available to Common Shareholders and Unitholders and Core FFO
(amounts in thousands, except per share amounts)
Three Months Ended December 31, | Twelve Months Ended December 31, | ||||||||||||||
2016 | 2015 | 2016 | 2015 | ||||||||||||
Net loss attributable to common shareholders | $ | (1,646 | ) | $ | (41,220 | ) | $ | (9,635 | ) | $ | (45,366 | ) | |||
Depreciation and amortization: | |||||||||||||||
Rental property(1) | 16,787 | 16,715 | 60,862 | 66,624 | |||||||||||
Discontinued operations | — | — | — | 1,222 | |||||||||||
Unconsolidated joint ventures | 940 | 867 | 3,610 | 3,916 | |||||||||||
Impairment of rental property(2) | — | 60,826 | 2,772 | 60,826 | |||||||||||
(Gain) loss on sale of rental property | — | (26,093 | ) | 1,155 | (30,334 | ) | |||||||||
Net loss attributable to noncontrolling interests in the Operating Partnership | (71 | ) | (1,870 | ) | (428 | ) | (2,056 | ) | |||||||
Dividends on preferred shares | — | 3,100 | 3,053 | 12,400 | |||||||||||
Issuance costs of redeemed preferred shares(3) | — | — | 5,515 | — | |||||||||||
Funds from operations ("FFO") | 16,010 | 12,325 | 66,904 | 67,232 | |||||||||||
Dividends on preferred shares | — | (3,100 | ) | (3,053 | ) | (12,400 | ) | ||||||||
Issuance costs of redeemed preferred shares(3) | — | — | (5,515 | ) | — | ||||||||||
FFO available to common shareholders and unitholders | 16,010 | 9,225 | 58,336 | 54,832 | |||||||||||
Issuance costs of redeemed preferred shares(3) | — | — | 5,515 | — | |||||||||||
Yield maintenance payment(4) | — | — | — | (2,426 | ) | ||||||||||
Personnel separation costs(5) | — | 6,057 | — | 6,462 | |||||||||||
Loss on debt extinguishment(6) | — | 1,824 | 48 | 2,313 | |||||||||||
Deferred abatement and straight-line amortization(7) | — | — | — | 854 | |||||||||||
Core FFO | $ | 16,010 | $ | 17,106 | $ | 63,899 | $ | 62,035 | |||||||
Net loss attributable to common shareholders per share - diluted | $ | (0.03 | ) | $ | (0.72 | ) | $ | (0.17 | ) | $ | (0.79 | ) | |||
Weighted average diluted common shares | 57,606 | 57,470 | 57,581 | 57,982 | |||||||||||
FFO available to common shareholders and unitholders per share – diluted | $ | 0.27 | $ | 0.15 | $ | 0.97 | $ | 0.90 | |||||||
Core FFO per share – diluted | $ | 0.27 | $ | 0.28 | $ | 1.06 | $ | 1.02 | |||||||
Weighted average diluted common shares and units | 60,383 | 60,209 | 60,325 | 60,704 | |||||||||||
(1) | In the fourth quarter of 2016, we wrote-off $2.0 million of lease-level assets associated with a defaulted tenant at 840 First Street, NE. |
(2) | In the second quarter of 2016, we recorded a $2.8 million impairment charge on Storey Park, which was sold in July 2016. In the fourth quarter of 2015, we recorded a $33.9 million impairment charge on One Fair Oaks, which was sold in January 2017, and a $26.9 million impairment charge on the NOVA Non-Core Portfolio (defined below under "Dispositions"), which was sold in March 2016. |
(3) | Represents original issuance costs associated with the 7.750% Series A Preferred Shares that were redeemed during the periods presented. |
(4) | On February 24, 2015, the owners of America’s Square, a 461,000 square foot office complex located in Washington, D.C., prepaid a mezzanine loan that had an outstanding balance of $29.7 million. We received a yield maintenance payment of $2.4 million associated with the prepayment of the loan. |
(5) | Primarily relate to the departure of the Company’s former Chief Executive Officer and former Chief Investment Officer during the fourth quarter of 2015. |
(6) | In the first quarter of 2016, we recorded a loss on debt extinguishment related to charges associated with the defeasance of the outstanding balance of the mortgage loan encumbering Gateway Centre Manassas, which was included in the NOVA Non-Core Portfolio (defined below under "Dispositions") and sold on March 25, 2016. In the fourth quarter of 2015, we recorded a loss on debt extinguishment related to the amendment and restatement of our unsecured revolving credit facility and unsecured term loan. During the three months ended March 31, 2015, we recorded $0.5 million in charges related to our prepayment of mortgage loans in connection with the sale of our Richmond portfolio. |
(7) | As a result of the sale of the Richmond Portfolio in March 2015, we accelerated the amortization of straight-line rents and deferred rent abatements related to those properties. |
4
| Earnings Release - Continued | |
The definitions of FFO, FFO available to common shareholders and unitholders and Core FFO, as well as the statements of purpose, are included below under “Non-GAAP Financial Measures.”
Fourth Quarter Results
Net loss attributable to common shareholders, Core FFO and FFO available to common shareholders and unitholders for the three and twelve months ended 2016 and 2015 are as follows (in thousands):
Three Months Ended December 31, | Twelve Months Ended December 31, | ||||||||||||||||||||||
2016 | 2015 | Change | 2016 | 2015 | Change | ||||||||||||||||||
Net loss attributable to common shareholders | $ | (1,646 | ) | $ | (41,220 | ) | $ | 39,574 | $ | (9,635 | ) | $ | (45,366 | ) | $ | 35,731 | |||||||
Core FFO | $ | 16,010 | $ | 17,106 | $ | (1,096 | ) | $ | 63,899 | $ | 62,035 | $ | 1,864 | ||||||||||
FFO available to common shareholders and unitholders | $ | 16,010 | $ | 9,225 | $ | 6,785 | $ | 58,336 | $ | 54,832 | $ | 3,504 | |||||||||||
Three months ended December 31, 2016 compared with the same period in 2015
Positive impacts to net loss attributable to common shareholders, Core FFO and FFO available to common shareholders and unitholders reflect the following:
• | an additional $1.2 million of net operating income resulting from rent commencement at the NOVA build-to-suit in August 2016; |
• | a $0.3 million decrease in general and administrative costs (which excludes $6.1 million of personnel severance costs related to the departure of the Company’s former Chief Executive Officer and former Chief Investment Officer during the fourth quarter of 2015) primarily due to a decline in compensation expense; and |
• | a $3.1 million reduction in accrued preferred dividends due to the redemption of our 7.750% Series A Preferred Shares prior to the fourth quarter of 2016. |
Net loss attributable to common shareholders, Core FFO and FFO available to common shareholders and unitholders were adversely impacted by the following:
• | a $1.3 million decrease in Same Property NOI due to a combined $1.4 million write-off of unamortized lease incentives and rent abatement associated with a defaulted tenant at 840 First Street, NE in Washington, D.C. The write-off is reflected as a reduction to rental revenue in our consolidated statement of operations for the three months ended December 31, 2016; |
• | a $3.5 million reduction in net operating income due to property dispositions; and |
• | a $0.9 million decrease in interest income due to the repayment of the $34.0 million mezzanine loan on 950 F Street, NW in the second quarter of 2016. |
Twelve months ended December 31, 2016 compared with the same period in 2015
Positive impacts to net loss attributable to common shareholders, Core FFO and FFO available to common shareholders and unitholders reflect the following:
• | a $2.3 million increase in Same Property NOI, which primarily relates to increases in occupancy in our comparable portfolio and is net of a $1.4 million write-off of unamortized lease incentives and rent abatement associated with a defaulted tenant at 840 First Street, NE; |
• | an additional $2.1 million of net operating income resulting from rent commencement at the NOVA build-to-suit in August 2016; |
5
| Earnings Release - Continued | |
• | a $2.0 million decrease in general and administrative costs (which excludes $6.5 million of personnel severance costs primarily related to the departure of the Company’s former Chief Executive Officer and former Chief Investment Officer during the fourth quarter of 2015) primarily due to a decline in compensation expense; and |
• | a $9.3 million reduction in accrued preferred dividends due to the redemption of our 7.750% Series A Preferred Shares in 2016. |
Net loss attributable to common shareholders, Core FFO and FFO available to common shareholders and unitholders were adversely impacted by the following:
• | a $12.8 million reduction in net operating income due to property dispositions; and |
• | a $2.1 million decrease in interest income due to the repayment of the $29.7 million mezzanine loan on America's Square in the first quarter of 2015 and the repayment of the $34.0 million mezzanine loan on 950 F Street, NW in the second quarter of 2016. |
Operating Performance - Leasing and Occupancy
At December 31, 2016, our consolidated portfolio consisted of 74 buildings totaling 6.7 million square feet. Leasing and occupancy highlights for our consolidated portfolio were as follows:
Leased and occupied % | |||||||||||
December 31, 2016 | December 31, 2015 | Year-over-year basis point increase | September 30, 2016 | ||||||||
Leased | 93.8 | % | 92.1 | % | 170 | 94.1 | % | ||||
Occupied | 92.6 | % | 90.3 | % | 230 | 92.8 | % | ||||
The increase in occupancy during the fourth quarter of 2016 compared with the same period in 2015 is primarily a result of tenant move-ins at 440 First Street, NW, Cloverleaf Center and Atlantic Corporate Park.
Leasing Activity (square feet) | |||
Three Months Ended December 31, 2016 | Twelve Months Ended December 31, 2016 | ||
Total new leases | 54,000 | 299,000 | |
Total renewal leases | 42,000 | 535,000 | |
Total leases executed | 96,000 | 834,000 | |
The 42,000 square feet of renewal leases in the fourth quarter reflected a tenant retention rate of 36%, which was primarily due to a low number of lease expirations during the quarter and the move-out of two tenants at Crossways Commerce Center and Ammendale Business Park who occupied a combined 58,000 square feet. We experienced negative net absorption of 31,000 square feet in the fourth quarter of 2016.
For the twelve months ended December 31, 2016, we achieved a tenant retention rate of 74% and had positive net absorption of 135,000 square feet. Our executed new and renewal leases for the twelve months ended December 31, 2016 do not include a one-year lease extension with the Bureau of Prisons at 500 First Street, NW, which is scheduled to expire in July 2017, or the 125,000 square feet of combined new and renewal leases at our unconsolidated joint venture properties.
6
| Earnings Release - Continued | |
Operating Performance - Same Properties
Same Property NOI increased (decreased) on an accrual basis as follows:
% Increase (Decrease) in Same Property NOI Compared with the Same Period in 2015 | |||||
Three Months Ended December 31, 2016 | Twelve Months Ended December 31, 2016 | ||||
Washington, D.C.(1) | (22.3 | )% | (2.8 | )% | |
Maryland | 1.6 | % | 7.1 | % | |
Northern Virginia | (2.6 | )% | (1.4 | )% | |
Southern Virginia | 3.6 | % | 7.0 | % | |
Total - accrual basis(2) | (5.2 | )% | 2.4 | % | |
(1) | Excluding the $1.4 million write-off of unamortized lease incentives and rent abatement associated with a defaulted tenant at 840 First Street, NE, Same Property NOI in Washington, D.C. would have decreased 0.4% and increased 2.8% for the three and twelve months ended December 31, 2016, respectively, compared with the same periods in 2015. |
(2) | Excluding the $1.4 million write-off of unamortized lease incentives and rent abatement associated with a defaulted tenant at 840 First Street, NE, total Same Property NOI would have increased 0.5% and 3.9% for the three and twelve months ended December 31, 2016, respectively, compared with the same periods in 2015. |
The decrease in total Same Property NOI for the three months ended December 31, 2016 compared with the same period in 2015 is due to the write-off of a combined $1.4 million of unamortized lease incentives and rent abatement associated with a defaulted tenant at 840 First Street, NE in Washington, D.C. Increases in Same Property NOI in Maryland and Southern Virginia for the three months ended December 31, 2016 compared with the same period in 2015 were primarily due to increases in occupancy, particularly at the following properties: Cloverleaf Center, which is located in Maryland, and Greenbrier Business Park, which is located in Southern Virginia. Same Property NOI decreased for the three months ended December 31, 2016 compared with the same period in 2015 in Washington D.C., due to the $1.4 million write-off at 840 First Street, NE and a tenant move out at 11 Dupont Circle, NW, and in Northern Virginia primarily due to an increase in certain operating costs and real estate tax expenses.
The increase in Same Property NOI for the twelve months ended December 31, 2016 compared with the same period in 2015 was primarily due to increases in occupancy at properties in Maryland and Southern Virgina. Same Property NOI decreased in Washington, D.C. due to the $1.4 million write-off of unamortized lease incentives and rent abatement discussed above. Same Property NOI decreased in Northern Virginia for the twelve months ended December 31, 2016 compared with the same period in 2015 primarily due to an increase in certain operating costs and real estate tax expenses.
A reconciliation of net loss from our consolidated statements of operations to Same Property NOI and a definition and statement of purpose are included below in the financial tables accompanying this press release and under “Non-GAAP Financial Measures,” respectively.
A list of our properties, as well as additional information regarding our results of operations, and our definition of “strategic hold,” “reposition” and “non-core” as they relate to our portfolio, can be found in our Fourth Quarter 2016 Supplemental Financial Information Report, which is posted on our website, www.first-potomac.com.
7
| Earnings Release - Continued | |
Strategic Plan Results
At the beginning of 2016, we completed an extensive underwriting of our business, our portfolio and our team. Based on this underwriting, we have been implementing our strategic plan to de-risk the portfolio, de-lever the balance sheet and maximize asset values (the “Strategic Plan”). As we near the completion of the Strategic Plan, the key action items of the Strategic Plan and our results on the action items are as follows:
• | Improve our portfolio composition by disposing of approximately $350 million of non-core assets. |
As of the date of this earnings release, aggregate gross proceeds from dispositions identified as part of our Strategic Plan total over $290 million.
• | Address three large upcoming lease expirations at single-tenant buildings through the sale of One Fair Oaks and the repositioning of 500 First Street, NW and 540 Gaither Road at Redland Corporate Center. |
On January 9, 2017, we sold One Fair Oaks for gross proceeds of $13.7 million. We have begun repositioning 540 Gaither Road at Redland Corporate Center, which is expected to be placed into redevelopment at the end of March 2017. In addition, we have re-leased two floors at 540 Gaither Road, which total 45,000 square feet, or approximately 34% of the building’s total square footage. The tenant at 500 First Street, NW extended their lease through July 2017. We are currently evaluating various strategies with respect to 500 First Street, which include repositioning the property and guaging new tenant interest.
• | Strengthen the balance sheet and improve liquidity by reducing leverage, limiting our floating rate debt exposure over time, and extending our debt maturities to better match our capital structure with our assets. |
At December 31, 2016, our debt plus preferred shares over the undepreciated book value of our real estate assets was 57.1% compared with 66.6% at December 31, 2015. During 2016, we redeemed all 6.4 million shares of our outstanding 7.750% Series A Preferred Shares with proceeds from property dispositions and from the prepayment of a note receivable.
• | Manage our cost structure by reducing corporate overhead and general and administrative expenses. |
For the year ended December 31, 2016, our corporate overhead expense (which is allocated between property operating and general and administrative expenses) was $23.4 million compared with $33.5 million for the same period in 2015, which included $6.5 million of separation costs. Excluding the separation costs recorded in 2015, corporate overhead expense decreased 14% for the year ended December 31, 2016 compared with the same period in 2015. The portion of our corporate overhead expense recorded as general and administrative expense was $17.0 million in 2016 compared with $25.5 million for the same period in 2015. The aforementioned $6.5 million of separation costs were recorded as general and administrative expense in 2015, and excluding these costs, our general and administrative expense decreased 11% in 2016 compared with the same period in 2015.
• | Reduce our targeted annualized common share dividend from $0.60 to $0.40. |
On April 26, 2016, the Board of Trustees declared a reduction of our dividend rate by 33% from $0.15 per common share to $0.10 per common share, which equates to an annualized dividend of $0.40 per common share and was effective for the dividends paid on and after May 16, 2016.
Dispositions
On January 9, 2017, we sold One Fair Oaks, a 214,000 square-foot office building located in Northern Virginia, for gross proceeds of $13.7 million, which generated net proceeds of $13.3 million. At
8
| Earnings Release - Continued | |
December 31, 2016, we classified One Fair Oaks as "held-for-sale" on our consolidated balance sheet. The operating results of One Fair Oaks are reflected in continuing operations in our consolidated statements of operations for each of the periods presented in this press release.
On February 17, 2017, we sold Plaza 500, a 503,000 square-foot industrial property located in Northern Virginia, for gross proceeds of $75.0 million, which generated net proceeds of $72.5 million.
Aggregate gross proceeds from dispositions identified as part of our Strategic Plan now total $294.6 million toward our stated goal of $350 million. This amount reflects the sales of the following properties: Plaza 500, which was sold in February 2017; One Fair Oaks, which was sold in January 2017; Storey Park, which was sold in the third quarter of 2016; the combined sale of Enterprise Center, Gateway Centre Manassas, Linden Business Center, Herndon Corporate Center, Prosperity Business Center, Reston Business Campus, Windsor at Battlefield and Van Buren Office Park (collectively, the “NOVA Non-Core Portfolio”), which was sold in the first quarter of 2016; and Cedar Hill I and III and Newington Business Park Center, which were both sold in the fourth quarter of 2015.
In addition, in January 2017, three of our unconsolidated joint ventures entered into binding contracts to collectively sell Aviation Business Park and Rivers Park I and II, which are located in Maryland. We anticipate completing the sale in March 2017; however, we can provide no assurances regarding the timing or pricing of such sale, or that such sale will ultimately occur.
Financing Activity
As previously disclosed, on October 6, 2016, we prepaid, without penalty, the $12.2 million loan encumbering Hillside I and II. The loan had a fixed interest rate of 5.75% and was scheduled to mature in December 2016. The prepayment was funded with a draw on the unsecured revolving credit facility and available cash.
Balance Sheet
We had $743.4 million of gross debt outstanding at December 31, 2016, of which $232.6 million was fixed-rate debt, $240.0 million was hedged variable-rate debt and $270.8 million was unhedged variable-rate debt. The weighted average interest rate of our debt was 3.5% at December 31, 2016.
During 2016, we redeemed all 6.4 million outstanding 7.750% Series A Preferred Shares, and on July 6, 2016, the 7.750% Series A Preferred Shares (NYSE: FPO-PA) were delisted from trading on the New York Stock Exchange.
Dividends
On January 24, 2017, we declared a dividend of $0.10 per common share, equating to an annualized dividend of $0.40 per common share. The dividend was paid on February 15, 2017 to common shareholders of record as of February 8, 2017.
9
| Earnings Release - Continued | |
2017 Core FFO Guidance
We expect our full-year 2017 Core FFO to be in the range of $0.78 to $0.84 per diluted share. The following is a summary of the assumptions that we used in arriving at our guidance (unaudited, amounts in thousands except percentages and per share amounts):
Expected Ranges | ||||||||
Portfolio Net Operating Income(1) | $ | 82,000 | - | $ | 88,000 | |||
Interest and Other Income | $ | 400 | - | $ | 500 | |||
FFO from Unconsolidated Joint Ventures(2) | $ | 4,500 | - | $ | 5,000 | |||
Interest Expense | $ | 23,000 | - | $ | 25,000 | |||
General and Administrative Expense | $ | 17,500 | - | $ | 18,500 | |||
Weighted Average Shares and OP Units | 60,400 | - | 60,800 | |||||
Year-End Occupancy(3) | 91.0 | % | - | 93.0 | % | |||
Same Property NOI Growth - Accrual Basis(4) | -1.0% | - | +1.0% | |||||
(1) | Reflects the sale of One Fair Oaks, which occurred on January 9, 2017, as well as the sale of Plaza 500, which occurred on February 17, 2017. No assumption for additional acquisitions or dispositions is included in the guidance range. |
(2) | Assumes Aviation Business Park and Rivers Park I and II are sold at the end of the first quarter of 2017; however, we can provide no assurances regarding the timing or pricing of such sale, or that the sale will ultimately occur. |
(3) | Assumes 500 First Street, NW and 540 Gaither Road at Redland are placed into redevelopment during 2017, and the square footage associated with the properties is excluded from reported portfolio metrics, including occupancy. |
(4) | Assumes 500 First Street, NW and 540 Gaither Road at Redland are placed into redevelopment during 2017, resulting in the properties being excluded from the full-year 2017 same property NOI calculation. |
Our guidance is also based on a number of other assumptions, many of which are outside our control and all of which are subject to change. We may change our guidance as actual and anticipated results vary from these assumptions.
Guidance Range for 2017 | Low Range | High Range | ||||||
Net loss attributable to common shareholders per diluted share | $ | (0.18 | ) | $ | (0.14 | ) | ||
Real estate depreciation(1) | 0.97 | 0.99 | ||||||
Net loss attributable to noncontrolling interests and items excluded from Core FFO per diluted share(2) | (0.01 | ) | (0.01 | ) | ||||
Core FFO per diluted share | $ | 0.78 | $ | 0.84 | ||||
(1) | Includes our pro-rata share of depreciation from our unconsolidated joint ventures and depreciation related to disposed properties. The depreciation associated with our unconsolidated joint ventures assumes Aviation Business Park and Rivers Park I and II are sold at the end of the first quarter of 2017; however, we can provide no assurances regarding the timing or pricing of such sale, or that the sale will ultimately occur. |
(2) | Items excluded from Core FFO consist of personnel separation costs, the gains or losses associated with disposed properties, property impairment, loss on debt extinguishment and other non-recurring items. |
Investor Conference Call and Webcast
We will host a conference call on February 24, 2017 at 9:00 AM ET to discuss the fourth quarter and full-year 2016 results and our 2017 Core FFO guidance. The conference call can be accessed by dialing (877) 705-6003 or (201) 493-6725 for international participants. A replay of the call will be available from 12:00 PM ET on February 24, 2017, until midnight ET on March 3, 2017. The replay can be accessed by dialing (844) 512-2921 or (412) 317-6671 for international callers, and entering pin number 13652088.
A live broadcast of the conference call will also be available online at the Company’s website, www.first-potomac.com, on February 24, 2017 beginning at 9:00 AM ET. An online replay will follow shortly after the call and will continue for 90 days.
10
| Earnings Release - Continued | |
About First Potomac Realty Trust
First Potomac Realty Trust is a self-administered, self-managed real estate investment trust that focuses on owning, operating, developing and redeveloping office and business park properties in the greater Washington, D.C. region. FPO common shares (NYSE: FPO) are publicly traded on the New York Stock Exchange. As of December 31, 2016, our consolidated portfolio totaled 6.7 million square feet. Based on annualized cash basis rent, our portfolio consists of 66% office properties and 34% business park and industrial properties. A key element of First Potomac's overarching strategy is its dedication to sustainability. Over one million square feet of First Potomac property is LEED Certified and over half of the portfolio's multi-story office square footage is LEED or Energy Star Certified.
Non-GAAP Financial Measures
Funds from Operations - Funds from operations (“FFO”), which is a non-GAAP measure used by many investors and analysts that follow the public real estate industry, represents net income (computed in accordance with U.S. generally accepted accounting principles (“GAAP”)), excluding gains (losses) on sales of rental property and impairments of rental property, plus real estate-related depreciation and amortization and after adjustments for unconsolidated partnerships and joint ventures. We also exclude from our FFO calculation the impact related to third parties from our consolidated joint venture. FFO available to common shareholders and unitholders is calculated as FFO less accumulated dividends on our preferred shares for the applicable periods presented. We compute FFO in accordance with standards established by the National Association of Real Estate Investment Trusts (“NAREIT”), which may differ from the methodology for calculating FFO, or similarly titled measures, utilized by other equity REITs and, accordingly, may not be comparable to such other REITs.
We consider FFO and FFO available to common shareholders and unitholders useful measures of performance for an equity real estate investment trust (“REIT”) as they facilitate an understanding of the operating performance of our properties without giving effect to real estate depreciation and amortization, which assume that the value of rental property diminishes predictably over time. Since real estate values have historically risen or fallen with market conditions, we believe that FFO provides a meaningful indication of our performance. We also consider FFO an appropriate supplemental performance measure given its wide use by investors and analysts. However, FFO does not represent amounts available for our discretionary use because of needed capital replacement or expansion, debt service obligations or other commitments and uncertainties, nor is it indicative of funds available to fund our cash needs, including our ability to make distributions. Our methodology for computing FFO adds back noncontrolling interests in the income from our Operating Partnership in determining FFO. We believe this is appropriate as common Operating Partnership units are presented on an as-converted, one-for-one basis for common shares in determining FFO per diluted share.
Our presentation of FFO in accordance with NAREIT’s definition should not be considered as an alternative to net (loss) income attributable to common shareholders (computed in accordance with GAAP) as an indicator of our financial performance.
Core FFO - We believe that the computation of FFO in accordance with NAREIT’s definition includes certain items that are not indicative of the results provided by our operating portfolio and affect the comparability of our period-over-period performance. These items include, but are not limited to, gains and losses on the retirement of debt, personnel separation costs, contingent consideration charges, acceleration of deferred abatement and straight-line amortization, gains on the receipt of yield maintenance payments from the prepayment of a note receivable, issuance costs of redeemed preferred shares and acquisition costs. Core FFO is presented less accumulated dividends on our preferred shares for all the periods presented.
11
| Earnings Release - Continued | |
Our presentation of Core FFO should not be considered as an alternative to net (loss) income attributable to common shareholders (computed in accordance with GAAP) as an indicator of our financial performance. Our FFO and Core FFO calculations are reconciled to (loss) income attributable to common shareholders in this release.
Same Property NOI - Same Property Net Operating Income (“Same Property NOI”), defined as property revenues (rental and tenant reimbursements and other revenues) less property operating expenses (real estate taxes, property operating and insurance expenses) from the consolidated properties owned by us and in-service for the entirety of the periods presented, is a primary performance measure we use to assess the results of operations at our properties. Same Property NOI is a non-GAAP measure. As an indication of our operating performance, Same Property NOI should not be considered an alternative to net income (loss) calculated in accordance with GAAP. A reconciliation of our Same Property NOI to net income is presented below. The Same Property NOI results exclude the collection of termination fees, as these items vary significantly period-over-period, thus impacting trends and comparability. Also, Same Property NOI includes a normalized management fee percentage in lieu of an administrative overhead allocation for comparative purposes. We eliminate depreciation and amortization expense, which are property level expenses, in computing Same Property NOI as these are non-cash expenses that are based on historical cost accounting assumptions and management believes these expenses do not offer the investor significant insight into the operations of the property. This presentation allows management and investors to determine whether growth or declines in net operating income are a result of increases or decreases in property operations or the acquisition or disposition of additional properties. While this presentation provides useful information to management and investors, the results below should be read in conjunction with the results from the consolidated statements of operations to provide a complete depiction of our total performance.
Forward-Looking Statements
The forward-looking statements contained in this press release, including statements regarding our 2017 Core FFO guidance and related assumptions, the execution of our strategic plan, potential dispositions and the timing and pricing of such dispositions, future acquisition and growth opportunities and the timing of future tenant occupancies, are subject to various risks and uncertainties. Although we believe the expectations reflected in any forward-looking statements contained herein are based on reasonable assumptions, there can be no assurance that our expectations will be achieved. Certain factors that could cause actual results to differ materially from our expectations include changes in general or regional economic conditions; our ability to timely lease or re-lease space at current or anticipated rents; changes in interest rates; changes in operating costs; our ability to complete acquisitions and dispositions on acceptable terms, or at all; our ability to manage our current debt levels and repay or refinance our indebtedness upon maturity or other required payment dates; our ability to maintain financial covenant compliance under our debt agreements; our ability to maintain effective internal controls over financial reporting and disclosure controls and procedures; our ability to obtain debt and/or financing on attractive terms, or at all; changes in the assumptions underlying our earnings and Core FFO guidance and other risks detailed in our Annual Report on Form 10-K and described from time to time in our filings with the Securities and Exchange Commission. Many of these factors are beyond our ability to control or predict. Forward-looking statements are not guarantees of performance. For forward-looking statements herein, we claim the protection of the safe harbor for forward-looking statements contained in the Private Securities Litigation Reform Act of 1995. We assume no obligation to update or supplement forward-looking statements that become untrue because of subsequent events. We do not intend to, and expressly disclaim any duty to, update or revise the forward-looking statements in this discussion to reflect changes in underlying assumptions or factors, new information, future events or otherwise, after the date hereof, except as may be required by law. In light of these risks and uncertainties, you should not rely upon these forward-looking statements after the date of this report and should keep in mind that any forward-looking statement made in this discussion, or elsewhere, might not occur.
12
| Earnings Release - Continued | |
Consolidated Statements of Operations
(unaudited, amounts in thousands, except per share amounts)
Three Months Ended December 31, | Twelve Months Ended December 31, | ||||||||||||||
2016 | 2015 | 2016 | 2015 | ||||||||||||
Revenues: | |||||||||||||||
Rental | $ | 31,411 | $ | 34,955 | $ | 129,225 | $ | 139,006 | |||||||
Tenant reimbursements and other | 7,561 | 8,149 | 31,109 | 33,840 | |||||||||||
Total revenues | 38,972 | 43,104 | 160,334 | 172,846 | |||||||||||
Operating expenses: | |||||||||||||||
Property operating | 8,974 | 9,417 | 38,554 | 44,093 | |||||||||||
Real estate taxes and insurance | 4,917 | 5,077 | 19,808 | 19,745 | |||||||||||
General and administrative | 3,980 | 10,340 | 16,976 | 25,450 | |||||||||||
Depreciation and amortization | 16,787 | 16,715 | 60,862 | 66,624 | |||||||||||
Impairment of rental property | — | 60,826 | 2,772 | 60,826 | |||||||||||
Total operating expenses | 34,658 | 102,375 | 138,972 | 216,738 | |||||||||||
Operating income (loss) | 4,314 | (59,271 | ) | 21,362 | (43,892 | ) | |||||||||
Other expenses (income): | |||||||||||||||
Interest expense | 6,571 | 6,576 | 26,370 | 26,797 | |||||||||||
Interest and other income | (129 | ) | (998 | ) | (2,348 | ) | (6,794 | ) | |||||||
Equity in earnings of affiliates | (411 | ) | (590 | ) | (2,294 | ) | (1,825 | ) | |||||||
(Gain) loss on sale of rental property | — | (26,093 | ) | 1,155 | (29,477 | ) | |||||||||
Loss on debt extinguishment | — | 1,824 | 48 | 1,824 | |||||||||||
Total other expenses (income) | 6,031 | (19,281 | ) | 22,931 | (9,475 | ) | |||||||||
Loss from continuing operations | (1,717 | ) | (39,990 | ) | (1,569 | ) | (34,417 | ) | |||||||
Discontinued operations: | |||||||||||||||
Loss from operations | — | — | — | (975 | ) | ||||||||||
Loss on debt extinguishment / modification | — | — | — | (489 | ) | ||||||||||
Gain on sale of rental property | — | — | — | 857 | |||||||||||
Loss from discontinued operations | — | — | — | (607 | ) | ||||||||||
Net loss | (1,717 | ) | (39,990 | ) | (1,569 | ) | (35,024 | ) | |||||||
Less: Net loss attributable to noncontrolling interests | 71 | 1,870 | 502 | 2,058 | |||||||||||
Net loss attributable to First Potomac Realty Trust | (1,646 | ) | (38,120 | ) | (1,067 | ) | (32,966 | ) | |||||||
Less: Dividends on preferred shares | — | (3,100 | ) | (3,053 | ) | (12,400 | ) | ||||||||
Less: Issuance costs of redeemed preferred shares | — | — | (5,515 | ) | — | ||||||||||
Net loss attributable to common shareholders | $ | (1,646 | ) | $ | (41,220 | ) | $ | (9,635 | ) | $ | (45,366 | ) | |||
Basic and diluted earnings per common share: | |||||||||||||||
Loss from continuing operations attributable to common shareholders | $ | (0.03 | ) | $ | (0.72 | ) | $ | (0.17 | ) | $ | (0.78 | ) | |||
Loss from discontinued operations attributable to common shareholders | — | — | — | (0.01 | ) | ||||||||||
Net loss attributable to common shareholders | $ | (0.03 | ) | $ | (0.72 | ) | $ | (0.17 | ) | $ | (0.79 | ) | |||
Weighted average common shares outstanding: | |||||||||||||||
Basic and diluted | 57,606 | 57,470 | 57,581 | 57,982 | |||||||||||
13
| Earnings Release - Continued | |
Consolidated Balance Sheets
(amounts in thousands, except per share amounts)
December 31, 2016 | December 31, 2015 | ||||||
(unaudited) | |||||||
Assets: | |||||||
Rental property, net | $ | 1,059,272 | $ | 1,130,266 | |||
Assets held-for-sale | 13,176 | 90,674 | |||||
Cash and cash equivalents | 14,144 | 13,527 | |||||
Escrows and reserves | 1,419 | 2,514 | |||||
Accounts and other receivables, net of allowance for doubtful accounts of $655 and $876, respectively | 6,892 | 9,868 | |||||
Accrued straight-line rents, net of allowance for doubtful accounts of $414 and $105, respectively | 42,745 | 36,888 | |||||
Notes receivable | — | 34,000 | |||||
Investment in affiliates | 49,392 | 48,223 | |||||
Deferred costs, net | 42,712 | 36,537 | |||||
Prepaid expenses and other assets | 5,389 | 6,950 | |||||
Intangibles assets, net | 25,106 | 32,959 | |||||
Total assets | $ | 1,260,247 | $ | 1,442,406 | |||
Liabilities: | |||||||
Mortgage loans, net | $ | 296,212 | $ | 307,769 | |||
Unsecured term loan, net | 299,404 | 299,404 | |||||
Unsecured revolving credit facility, net | 141,555 | 116,865 | |||||
Liabilities held-for-sale | — | 1,513 | |||||
Accounts payable and other liabilities | 43,904 | 47,972 | |||||
Accrued interest | 1,537 | 1,603 | |||||
Rents received in advance | 6,234 | 6,003 | |||||
Tenant security deposits | 4,982 | 4,982 | |||||
Deferred market rent, net | 1,792 | 2,154 | |||||
Total liabilities | 795,620 | 788,265 | |||||
Noncontrolling interests in the Operating Partnership | 28,244 | 28,813 | |||||
Equity: | |||||||
Preferred Shares, $0.001 par value per share, 50,000 shares authorized: | |||||||
7.750% Series A Preferred Shares, $25 per share liquidation preference, 0 and 6,400 shares issued and outstanding, respectively | — | 160,000 | |||||
Common shares, $0.001 par value per share, 150,000 shares authorized; 58,319 and 57,718 shares issued and outstanding, respectively | 58 | 58 | |||||
Additional paid-in capital | 913,367 | 907,220 | |||||
Noncontrolling interests in consolidated partnerships | — | 800 | |||||
Accumulated other comprehensive loss | (844 | ) | (2,360 | ) | |||
Dividends in excess of accumulated earnings | (476,198 | ) | (440,390 | ) | |||
Total equity | 436,383 | 625,328 | |||||
Total liabilities, noncontrolling interests and equity | $ | 1,260,247 | $ | 1,442,406 | |||
14
| Earnings Release - Continued | |
Same Property Analysis
(unaudited, dollars in thousands)
Reconciliation of net loss to Same Property NOI(1): | |||||||||||||||
Three Months Ended December 31, | Twelve Months Ended December 31, | ||||||||||||||
2016 | 2015 | 2016 | 2015 | ||||||||||||
Number of buildings | 73 | 73 | 73 | 73 | |||||||||||
Net loss | $ | (1,717 | ) | $ | (39,990 | ) | $ | (1,569 | ) | $ | (35,024 | ) | |||
Loss from discontinued operations | — | — | — | 607 | |||||||||||
Total other expenses (income) | 6,031 | (19,281 | ) | 22,931 | (9,475 | ) | |||||||||
Impairment of rental property | — | 60,826 | 2,772 | 60,826 | |||||||||||
Depreciation and amortization | 16,787 | 16,715 | 60,862 | 66,624 | |||||||||||
General and administrative expenses | 3,980 | 10,340 | 16,976 | 25,450 | |||||||||||
Non-comparable net operating income(2) | (1,328 | ) | (3,558 | ) | (3,888 | ) | (13,260 | ) | |||||||
Same Property NOI | $ | 23,753 | $ | 25,052 | $ | 98,084 | $ | 95,748 | |||||||
Same property revenues | |||||||||||||||
Rental(3) | $ | 30,371 | $ | 30,980 | $ | 124,997 | $ | 121,843 | |||||||
Tenant reimbursements and other(4) | 6,846 | 6,761 | 28,682 | 28,303 | |||||||||||
Total same property revenues | 37,217 | 37,741 | 153,679 | 150,146 | |||||||||||
Same property operating expenses | |||||||||||||||
Property(5) | 8,586 | 8,079 | 36,630 | 36,691 | |||||||||||
Real estate taxes and insurance | 4,878 | 4,610 | 18,965 | 17,707 | |||||||||||
Total same property operating expenses | 13,464 | 12,689 | 55,595 | 54,398 | |||||||||||
Same Property NOI | $ | 23,753 | $ | 25,052 | $ | 98,084 | $ | 95,748 | |||||||
Same Property NOI growth(6) | (5.2 | )% | 2.4 | % | |||||||||||
Weighted Average Occupancy for the Three Months Ended December 31, | Weighted Average Occupancy for the Twelve Months Ended December 31, | ||||||||||||||
2016 | 2015 | 2016 | 2015 | ||||||||||||
Same Properties | 92.5 | % | 92.0 | % | 92.3 | % | 90.3 | % | |||||||
Change in Same Property NOI (accrual basis) | |||||||||||||||
By Region | Three Months Ended December 31, 2016 | Percentage of Base Rent | Twelve Months Ended December 31, 2016 | Percentage of Base Rent | |||||||||||
Washington, D.C.(7) | (22.3)% | 29% | (2.8)% | 29% | |||||||||||
Maryland | 1.6% | 29% | 7.1% | 29% | |||||||||||
Northern Virginia | (2.6)% | 23% | (1.4)% | 23% | |||||||||||
Southern Virginia | 3.6% | 19% | 7.0% | 19% | |||||||||||
By Type | |||||||||||||||
Business Park / Industrial | 1.9% | 32% | 2.7% | 32% | |||||||||||
Office(8) | (9.2)% | 68% | 2.3% | 68% | |||||||||||
(1) | Same property comparisons are based upon those consolidated properties owned and in-service for the entirety of the periods presented. Same property results for the three and twelve months ended December 31, 2016 and 2015 exclude the operating results of all disposed properties and the results of the following non-same property that was owned as of December 31, 2016: the NOVA build-to-suit. |
(2) | Includes property results for the NOVA build-to-suit and all properties that were disposed of prior to December 31, 2016 and whose operations remained classified within continuing operations for the periods presented. Also includes an administrative overhead allocation, which was replaced by a normalized management fee for comparative purposes, and termination fee income. |
(3) | During the fourth quarter of 2016, we recorded a $1.4 million write-off of unamortized lease incentives and rent abatement associated with a defaulted tenant at 840 First Street, NE. The write-off is included in same property rental revenue for the three and twelve months ended December 31, 2016. |
(4) | Excludes termination fee income for comparative purposes. |
(5) | Same property operating expenses have been adjusted to reflect a normalized management fee in lieu of an administrative overhead allocation for comparative purposes. |
(6) | Excluding the $1.4 million write-off of unamortized lease incentives and rent abatement associated with a defaulted tenant at 840 First Street, NE, total Same Property NOI would have increased 0.5% and 3.9% for the three and twelve months ended December 31, 2016, respectively, compared with the same periods in 2015. |
(7) | Excluding the $1.4 million write-off of unamortized lease incentives and rent abatement associated with a defaulted at 840 First Street, NE, Same Property NOI for Washington D.C would have decreased 0.4% and increased 2.8% for the three and twelve months ended December 31, 2016, respectively, compared with the same periods in 2015. |
(8) | Excluding the $1.4 million write-off of unamortized lease incentives and rent abatement associated with a defaulted tenant at 840 First Street, NE, Same Property NOI for office properties would have decreased 0.3% and increased 4.6% for the three and twelve months ended December 31, 2016, respectively, compared with the same periods in 2015. |
15
| Highlights (unaudited, dollars in thousands, except per share data) | |
Performance Metrics | Q4-2016 | Q3-2016 | Q2-2016 | Q1-2016 | Q4-2015 | ||||||||||||||
Net (loss) income attributable to common shareholders | $ | (1,646 | ) | $ | 1,607 | $ | (5,491 | ) | $ | (4,106 | ) | $ | (41,220 | ) | |||||
Net (loss) income attributable to common shareholders per diluted common share | $ | (0.03 | ) | $ | 0.03 | $ | (0.10 | ) | $ | (0.07 | ) | $ | (0.72 | ) | |||||
FFO available to common shareholders and unitholders(1) | $ | 16,010 | $ | 16,501 | $ | 13,023 | $ | 12,803 | $ | 9,225 | |||||||||
Core FFO(1) | $ | 16,010 | $ | 17,018 | $ | 16,118 | $ | 14,755 | $ | 17,106 | |||||||||
FFO available to common shareholders and unitholders per diluted share | $ | 0.27 | $ | 0.27 | $ | 0.22 | $ | 0.21 | $ | 0.15 | |||||||||
Core FFO per diluted share | $ | 0.27 | $ | 0.28 | $ | 0.27 | $ | 0.24 | $ | 0.28 | |||||||||
Operating Metrics | |||||||||||||||||||
Change in Same Property NOI - Accrual Basis(2) | (5.2 | )% | 4.1 | % | 3.6 | % | 7.9 | % | 6.1 | % | |||||||||
Assets | |||||||||||||||||||
Total Assets(3) | $ | 1,260,247 | $ | 1,270,670 | $ | 1,320,046 | $ | 1,359,943 | $ | 1,442,406 | |||||||||
Debt Balances(3) | |||||||||||||||||||
Unhedged Variable-Rate Debt(4) | $ | 270,800 | $ | 259,799 | $ | 235,799 | $ | 171,635 | $ | 183,392 | |||||||||
Hedged Variable-Rate Debt(5) | 240,000 | 240,000 | 300,000 | 300,000 | 300,000 | ||||||||||||||
Fixed-Rate Debt(6) | 232,607 | 245,719 | 246,693 | 247,656 | 248,824 | ||||||||||||||
Total | 743,407 | 745,518 | 782,492 | 719,291 | 732,216 | ||||||||||||||
Preferred Shares | |||||||||||||||||||
7.750% Series A preferred shares, $25 per share liquidation preference(7) | — | — | 15,000 | 105,000 | 160,000 | ||||||||||||||
Total Debt and Preferred Shares | $ | 743,407 | $ | 745,518 | $ | 797,492 | $ | 824,291 | $ | 892,216 | |||||||||
Leasing Metrics | |||||||||||||||||||
Net Absorption (Square Feet)(8) | (30,779 | ) | 152,036 | (9) | 20,807 | (7,128 | ) | 77,661 | |||||||||||
Tenant Retention Rate | 36 | % | 81 | % | 90 | % | 71 | % | 79 | % | |||||||||
Leased % | 93.8 | % | 94.1 | % | 94.4 | % | 94.1 | % | 92.1 | % | |||||||||
Occupancy % | 92.6 | % | 92.8 | % | 93.1 | % | 92.3 | % | 90.3 | % | |||||||||
Total Portfolio Size (Square Feet) | 6,714,265 | 6,712,947 | 6,543,762 | 6,543,784 | 7,489,092 | ||||||||||||||
Total New Leases (Square Feet) | 54,000 | 74,000 | 126,000 | 45,000 | 104,000 | ||||||||||||||
Total Renewal Leases (Square Feet) | 42,000 | 206,000 | 167,000 | 121,000 | 186,000 | ||||||||||||||
(1) | See Quarterly Financial Measures for a reconciliation of our net (loss) income attributable to common shareholders to FFO, FFO available to common shareholders and unitholders and Core FFO. |
(2) | For the fourth quarter of 2016, Same Property NOI includes a $1.4 million write-off of unamortized lease incentives and rent abatement (reflected as a deduction to rental revenue) associated with a defaulted tenant at 840 First Street, NE. Excluding this write-off, Same Property NOI would have increased 0.5% for the three months ended December 31, 2016 compared with the same period in 2015. |
(3) | In the first quarter of 2016, we adopted Accounting Standards Update No. 2015-03, Simplifying the Presentation of Debt Issuance Costs ("ASU 2015-03"), which requires debt issuance costs to be presented in the balance sheet as a direct deduction from the carrying value of the respective debt liability and is applied on a retrospective basis. The debt balances for all periods presented exclude unamortized deferred financing costs and the total assets for all periods presented have been adjusted to exclude these deferred costs. |
(4) | For the three months ended June 30, 2016, we included variable-rate debt that encumbered the Storey Park land, which was classified as held-for-sale on our consolidated balance sheet at June 30, 2016 and was subsequently sold on July 25, 2016. |
(5) | As of December 31, 2016, we had fixed LIBOR at a weighted average interest rate of 1.4% on $240.0 million of our variable rate debt through nine interest rate swap agreements. Two swaps that together fixed LIBOR at weighted average interest rate of 1.8% on $60.0 million of our variable rate debt matured on July 18, 2016. |
(6) | For the three months ended December 31, 2015, we included fixed-rate debt that encumbered Gateway Centre Manassas, which, along with the remaining NOVA Non-Core Portfolio, was classified as held-for-sale at December 31, 2015 and was sold on March 25, 2016. |
(7) | All remaining 7.750% Series A Preferred Shares were redeemed in July 2016. |
(8) | Net absorption includes adjustments made for pre-leasing, deals signed in advance of existing lease expirations and unforeseen terminations. |
(9) | Includes 167,440 square fee from the NOVA build-to-suit being placed into service. |
16
 | Quarterly Financial Results (unaudited, dollars in thousands) | |
Three Months Ended | |||||||||||||||||||
December 31, 2016 | September 30, 2016 | June 30, 2016 | March 31, 2016 | December 31, 2015 | |||||||||||||||
Revenues: | |||||||||||||||||||
Rental(1) | $ | 31,411 | $ | 32,416 | $ | 31,554 | $ | 33,844 | $ | 34,955 | |||||||||
Tenant reimbursements and other | 7,561 | 7,756 | 6,939 | 8,853 | 8,149 | ||||||||||||||
Total revenues | 38,972 | 40,172 | 38,493 | 42,697 | 43,104 | ||||||||||||||
Operating expenses: | |||||||||||||||||||
Property operating | 8,974 | 9,500 | 8,543 | 11,537 | 9,417 | ||||||||||||||
Real estate taxes and insurance | 4,917 | 4,755 | 4,920 | 5,216 | 5,077 | ||||||||||||||
Net operating income | 25,081 | 25,917 | 25,030 | 25,944 | 28,610 | ||||||||||||||
Other (expenses) income | |||||||||||||||||||
General and administrative | (3,980 | ) | (4,112 | ) | (4,305 | ) | (4,578 | ) | (10,340 | ) | |||||||||
Interest and other income | 129 | 115 | 1,101 | 1,003 | 998 | ||||||||||||||
Equity in earnings of affiliates | 411 | 664 | 663 | 555 | 590 | ||||||||||||||
Adjusted EBITDA | 21,641 | 22,584 | 22,489 | 22,924 | 19,858 | ||||||||||||||
Loss on debt extinguishment / modification | — | — | — | (48 | ) | (1,824 | ) | ||||||||||||
Impairment of rental property(2) | — | — | (2,772 | ) | — | (60,826 | ) | ||||||||||||
(Loss) gain on sale of rental property(3) | — | — | — | (1,155 | ) | 26,093 | |||||||||||||
EBITDA | 21,641 | 22,584 | 19,717 | 21,721 | (16,699 | ) | |||||||||||||
Depreciation and amortization(4) | (16,787 | ) | (13,928 | ) | (15,141 | ) | (15,006 | ) | (16,715 | ) | |||||||||
Interest expense | (6,571 | ) | (6,414 | ) | (6,568 | ) | (6,816 | ) | (6,576 | ) | |||||||||
Net (loss) income | (1,717 | ) | 2,242 | (1,992 | ) | (101 | ) | (39,990 | ) | ||||||||||
Less: Net loss (income) attributable to noncontrolling interests | 71 | (107 | ) | 390 | 147 | 1,870 | |||||||||||||
Net loss attributable to First Potomac Realty Trust | (1,646 | ) | 2,135 | (1,602 | ) | 46 | (38,120 | ) | |||||||||||
Dividends on preferred shares | — | (11 | ) | (794 | ) | (2,248 | ) | (3,100 | ) | ||||||||||
Issuance costs of redeemed preferred shares(5) | — | (517 | ) | (3,095 | ) | (1,904 | ) | — | |||||||||||
Net (loss) income attributable to common shareholders | $ | (1,646 | ) | $ | 1,607 | $ | (5,491 | ) | $ | (4,106 | ) | $ | (41,220 | ) | |||||
(1) | Rental revenue for the three months ended December 31, 2016 includes a $1.4 million write-off of unamortized lease incentives and rent abatement associated with a defaulted tenant at 840 First Street, NE. |
(2) | For the three months ended June 30, 2016, we recorded an impairment charge of $2.8 million based on the anticipated sales price of Storey Park, which was classified as held-for-sale at June 30, 2016 and was sold on July 25, 2016. In the fourth quarter of 2015, we recorded an impairment charge of $26.9 million based on the anticipated sales price of the NOVA Non-core Portfolio, which we sold on March 25, 2016. In the fourth quarter of 2015, due to the anticipated move out of the sole tenant at our One Fair Oaks property on December 31, 2016, we recorded an impairment charge of $33.9 million on One Fair Oaks based on the estimated fair value of that property. One Fair Oaks was classified as held-for-sale at December 31, 2016 and was sold on January 9, 2017. |
(3) | Represents the loss or gain on sale of properties that were sold and did not meet the criteria to be classified as discontinued operations. For the three months ended March 31, 2016, we recorded a loss on sale of rental property related to the sale of the NOVA Non-Core Portfolio. For the three months ended December 31, 2015, the gain on sale of rental property related to the sales of Newington Business Park Center and Cedar Hill I and III. |
(4) | Depreciation and amortization for the three months ended December 31, 2016 includes a $2.0 million write-off of tenant improvements associated with a defaulted tenant at 840 First Street, NE. |
(5) | Represents the original issuance costs associated with the preferred shares that were redeemed during the respective periods. |
17
| Quarterly Supplemental Financial Results (unaudited, dollars in thousands) | |
Quarterly Supplemental Financial Results Items: | |||||||||||||||||||
The following items were included in the determination of net (loss) income: | |||||||||||||||||||
Three Months Ended | |||||||||||||||||||
December 31, 2016 | September 30, 2016 | June 30, 2016 | March 31, 2016 | December 31, 2015 | |||||||||||||||
Supplemental Operating Items(1) | |||||||||||||||||||
Termination fees | $ | 17 | $ | 55 | $ | 42 | $ | — | $ | 89 | |||||||||
Capitalized interest | — | 208 | 273 | 200 | 534 | ||||||||||||||
Snow and ice removal costs (excluding reimbursements)(2) | (82 | ) | — | — | (1,588 | ) | (5 | ) | |||||||||||
Reserves for bad debt expense | (40 | ) | (419 | ) | (266 | ) | (105 | ) | (55 | ) | |||||||||
Dispositions in Continuing Operations(3) | |||||||||||||||||||
Revenues | $ | 1,858 | $ | 1,952 | $ | 1,975 | $ | 5,372 | $ | 7,022 | |||||||||
Operating expenses | (588 | ) | (621 | ) | (842 | ) | (2,258 | ) | (2,149 | ) | |||||||||
Depreciation and amortization expense | (215 | ) | 918 | (831 | ) | (942 | ) | (2,339 | ) | ||||||||||
Interest expense, net of interest income | — | (44 | ) | (208 | ) | (184 | ) | (5 | ) | ||||||||||
Loss on debt extinguishment(4) | — | — | — | (48 | ) | — | |||||||||||||
Impairment of rental property(5) | — | — | (2,772 | ) | — | (60,826 | ) | ||||||||||||
(Loss) gain on sale of rental property(6) | — | — | — | (1,155 | ) | 26,093 | |||||||||||||
$ | 1,055 | $ | 2,205 | $ | (2,678 | ) | $ | 785 | $ | (32,204 | ) | ||||||||
(1) | Includes the operations of properties that were sold or classified as held-for-sale and did not have their operating results classified as discontinued operations. |
(2) | We recovered approximately 58% to 65% of these costs for the periods presented. |
(3) | Represents the operating results of properties that were sold or classified as held-for-sale and did not meet the criteria to be classified as discontinued operations. All periods presented include the operating results of One Fair Oaks, which was classified as held-for-sale at December 31, 2016 and was sold in January 2017, Storey Park, which was sold in July 2016, the NOVA Non-Core Portfolio, which was sold in March 2016, and Newington Business Park Center and Cedar Hill I and III, which were both sold in December 2015. |
(4) | Reflects charges associated with the defeasance of the outstanding balance of the mortgage loan encumbering Gateway Centre Manassas, which was included in the NOVA Non-Core Portfolio and sold on March 25, 2016. |
(5) | For the three months ended June 30, 2016, we recorded an impairment charge of $2.8 million based on the anticipated sales price of Storey Park, which was classified as held-for-sale at June 30, 2016 and was sold on July 25, 2016. In the fourth quarter of 2015, we recorded an impairment charge of $26.9 million based on the anticipated sales price of the NOVA Non-Core Portfolio, which was classified as held-for-sale at December 31, 2015 and was sold in March 2016. |
(6) | For the three months ended March 31, 2016, we recorded a loss on the sale of the NOVA Non-Core Portfolio. For the three months ended December 31, 2015, the gain on sale of rental property is related to Newington Business Park Center and Cedar Hill I and III, which were both sold in December 2015. |
18
| Quarterly Financial Measures (unaudited, amounts in thousands, except per share data) | |
Three Months Ended | |||||||||||||||||||
FUNDS FROM OPERATIONS ("FFO") AND CORE FFO | December 31, 2016 | September 30, 2016 | June 30, 2016 | March 30, 2016 | December 31, 2015 | ||||||||||||||
Net (loss) income attributable to common shareholders | $ | (1,646 | ) | $ | 1,607 | $ | (5,491 | ) | $ | (4,106 | ) | $ | (41,220 | ) | |||||
Depreciation and amortization: | |||||||||||||||||||
Rental property(1) | 16,787 | 13,928 | 15,141 | 15,006 | 16,715 | ||||||||||||||
Unconsolidated joint ventures | 940 | 895 | 895 | 881 | 867 | ||||||||||||||
Impairment of rental property | — | — | 2,772 | — | 60,826 | ||||||||||||||
Loss (gain) on sale of rental property | — | — | — | 1,155 | (26,093 | ) | |||||||||||||
Net (loss) income attributable to noncontrolling interests | |||||||||||||||||||
in the Operating Partnership | (71 | ) | 71 | (294 | ) | (133 | ) | (1,870 | ) | ||||||||||
FFO available to common shareholders and unitholders | 16,010 | 16,501 | 13,023 | 12,803 | 9,225 | ||||||||||||||
Dividends on preferred shares | — | 11 | 794 | 2,248 | 3,100 | ||||||||||||||
Issuance costs of redeemed shares(2) | — | 517 | 3,095 | 1,904 | — | ||||||||||||||
FFO | $ | 16,010 | $ | 17,029 | $ | 16,912 | $ | 16,955 | $ | 12,325 | |||||||||
FFO available to common shareholders and unitholders | $ | 16,010 | $ | 16,501 | $ | 13,023 | $ | 12,803 | $ | 9,225 | |||||||||
Issuance costs of redeemed shares(2) | — | 517 | 3,095 | 1,904 | — | ||||||||||||||
Personnel separation costs(3) | — | — | — | — | 6,057 | ||||||||||||||
Loss on debt extinguishment(4) | — | — | — | 48 | 1,824 | ||||||||||||||
Core FFO | $ | 16,010 | $ | 17,018 | $ | 16,118 | $ | 14,755 | $ | 17,106 | |||||||||
Diluted Per Share Metrics: | |||||||||||||||||||
Net (loss) income attributable to common shareholders | $ | (0.03 | ) | $ | 0.03 | $ | (0.10 | ) | $ | (0.07 | ) | $ | (0.72 | ) | |||||
FFO available to common shareholders and unitholders | $ | 0.27 | $ | 0.27 | $ | 0.22 | $ | 0.21 | $ | 0.15 | |||||||||
Core FFO | $ | 0.27 | $ | 0.28 | $ | 0.27 | $ | 0.24 | $ | 0.28 | |||||||||
Weighted average shares - diluted | 57,606 | 57,825 | 57,577 | 57,628 | 57,590 | ||||||||||||||
Weighted average shares and OP units - diluted | 60,383 | 60,402 | 60,230 | 60,234 | 60,209 | ||||||||||||||
Other Supplemental Information: | |||||||||||||||||||
Share-based compensation expense | $ | 693 | $ | 631 | $ | 506 | $ | 488 | $ | 468 | |||||||||
Straight-line rent, net(5) | 1,761 | 532 | 491 | 134 | (121 | ) | |||||||||||||
Deferred market rent, net | 64 | 81 | 76 | 79 | 6 | ||||||||||||||
Non-real estate depreciation and amortization(6) | 346 | 283 | 348 | 376 | 359 | ||||||||||||||
Debt fair value amortization | (118 | ) | (128 | ) | (125 | ) | (122 | ) | (133 | ) | |||||||||
Amortization of finance costs | 441 | 424 | 505 | 482 | 467 | ||||||||||||||
Tenant improvements(7) | (1,200 | ) | (1,155 | ) | (2,943 | ) | (3,338 | ) | (3,564 | ) | |||||||||
Leasing commissions(7) | (663 | ) | (781 | ) | (752 | ) | (621 | ) | (1,132 | ) | |||||||||
Capital expenditures(7) | (1,155 | ) | (818 | ) | (1,274 | ) | (700 | ) | (2,099 | ) | |||||||||
Total | $ | 169 | $ | (931 | ) | $ | (3,168 | ) | $ | (3,222 | ) | $ | (5,749 | ) | |||||
(1) | Depreciation and amortization for the three months ended December 31, 2016 includes a $2.0 million write-off of assets associated with a defaulted tenant at 840 First Street, NE. |
(2) | Represents the original issuance costs associated with the preferred shares that were redeemed during the respective periods. |
(3) | During the three months ended December 31, 2015, we recorded personnel separation costs of $6.1 million in connection with our former Chief Executive Officer and former Chief Investment Officer's separation from the Company in November 2015. |
(4) | During the three months ended March 31, 2016, we recorded $48 thousand in charges related to the defeasance of the Gateway Centre Manassas debt. During the three months ended December 31, 2015, we amended, restated and consolidated our existing unsecured revolving credit facility and unsecured term loan and recorded $1.8 million in debt extinguishment charges. |
(5) | Includes our amortization of the following: straight-line rents and associated uncollectable amounts, rent abatements and lease incentives, including the write-off of $1.4 million of unamortized lease incentives and rent abatement recorded during the fourth quarter of 2016, which was associated with a defaulted tenant at 840 First Street, NE. Also, beginning in third quarter of 2016, reflects a reduction in revenue related to the impact of accelerating tenant improvement reimbursement revenue recognized for the NOVA build-to-suit. |
(6) | Most non-real estate depreciation is classified in general and administrative expense. |
(7) | Does not include first-generation costs, which we define as tenant improvements, leasing commissions and capital expenditure costs that were taken into consideration when underwriting the purchase of a property or incurred to bring the property to operating standard for its intended use. |
Three Months Ended | |||||||||||||||||||
First-generation costs | December 31, 2016 | September 30, 2016 | June 30, 2016 | March 30, 2016 | December 31, 2015 | ||||||||||||||
Tenant improvements | $ | 2,073 | $ | 1,809 | (1) | $ | 6,391 | $ | 9,809 | $ | 5,843 | ||||||||
Leasing commissions | — | 1,043 | 837 | 17 | 264 | ||||||||||||||
Capital expenditures | 1,818 | 2,549 | 2,353 | 3,045 | 2,670 | ||||||||||||||
Total first-generation costs | 3,891 | 5,401 | 9,581 | 12,871 | 8,777 | ||||||||||||||
Development and redevelopment | 618 | 559 | 3,906 | 5,130 | 7,156 | ||||||||||||||
Total | $ | 4,509 | $ | 5,960 | $ | 13,487 | $ | 18,001 | $ | 15,933 | |||||||||
(1) | Excludes an $8.9 million reimbursement that we received in the third quarter of 2016 related to tenant improvement work done at the NOVA build-to-suit. |
19
| Annual Financial Results (unaudited, amounts in thousands) | |
Years Ended December 31, | |||||||||||
2016 | 2015 | 2014 | |||||||||
Revenues: | |||||||||||
Rental(1) | $ | 129,225 | $ | 139,006 | $ | 128,226 | |||||
Tenant reimbursements and other | 31,109 | 33,840 | 33,426 | ||||||||
Total revenues | 160,334 | 172,846 | 161,652 | ||||||||
Operating expenses: | |||||||||||
Property operating | 38,554 | 44,093 | 43,252 | ||||||||
Real estate taxes and insurance | 19,808 | 19,745 | 17,360 | ||||||||
Net operating income | 101,972 | 109,008 | 101,040 | ||||||||
Other (expenses) income | |||||||||||
General and administrative | (16,976 | ) | (25,450 | ) | (21,156 | ) | |||||
Acquisition costs | — | — | (2,681 | ) | |||||||
Interest and other income | 2,348 | 6,794 | 6,799 | ||||||||
Equity in earnings of affiliates | 2,294 | 1,825 | 775 | ||||||||
Adjusted EBITDA | 89,638 | 92,177 | 84,777 | ||||||||
Loss on debt extinguishment / modification | (48 | ) | (1,824 | ) | — | ||||||
Impairment of rental property(2) | (2,772 | ) | (60,826 | ) | (3,956 | ) | |||||
(Loss) gain on sale of rental property(3) | (1,155 | ) | 29,477 | 21,230 | |||||||
EBITDA | 85,663 | 59,004 | 102,051 | ||||||||
Depreciation and amortization(4) | (60,862 | ) | (66,624 | ) | (61,796 | ) | |||||
Interest expense | (26,370 | ) | (26,797 | ) | (24,696 | ) | |||||
(Loss) income from continuing operations | (1,569 | ) | (34,417 | ) | 15,559 | ||||||
Discontinued operations(5): | |||||||||||
(Loss) income from operations | — | (975 | ) | 146 | |||||||
Loss on debt extinguishment | — | (489 | ) | — | |||||||
Gain on sale of rental property | — | 857 | 1,338 | ||||||||
(Loss) income from discontinued operations | — | (607 | ) | 1,484 | |||||||
Net (loss) income | (1,569 | ) | (35,024 | ) | 17,043 | ||||||
Less: Net loss (income) attributable to noncontrolling interests | 502 | 2,058 | (199 | ) | |||||||
Net loss attributable to First Potomac Realty Trust | (1,067 | ) | (32,966 | ) | 16,844 | ||||||
Dividends on preferred shares | (3,053 | ) | (12,400 | ) | (12,400 | ) | |||||
Issuance costs of redeemed preferred shares(6) | (5,515 | ) | — | — | |||||||
Net (loss) income attributable to common shareholders | $ | (9,635 | ) | $ | (45,366 | ) | $ | 4,444 | |||
(1) | Rental revenue for 2016 includes a $1.4 million write-off of unamortized lease incentives and rent abatement associated with a defaulted tenant at 840 First Street, NE. |
(2) | In the second quarter of 2016, we recorded an impairment charge of $2.8 million based on the anticipated sales price of Storey Park, which was sold on July 25, 2016. In the fourth quarter of 2015, we recorded an impairment charge of $26.9 million based on the anticipated sales price of the NOVA Non-Core Portfolio, which we sold on March 25, 2016. In the fourth quarter of 2015, due to the anticipated move out of the sole tenant at our One Fair Oaks property on December 31, 2016, we recorded an impairment charge of $33.9 million on One Fair Oaks based on the estimated fair value of that property. One Fair Oaks was classified as held-for-sale at December 31, 2016 and was sold on January 9, 2017. |
(3) | Represents the loss or gain on sale of properties that were sold and did not meet the criteria to be classified as discontinued operations. During 2016, the loss on sale of rental property related to the sale of the NOVA Non-Core Portfolio. During 2015, the gain on sale of rental property related to the sales of Rumsey Center, Newington Business Park Center and Cedar Hill I and III. During 2014, the gain on sale of rental property related to the sale of Corporate Campus at Ashburn Center. |
(4) | Depreciation and amortization for 2016 includes a $2.0 million write-off of assets associated with a defaulted tenant at 840 First Street, NE. |
(5) | Results for 2015 and 2014 include the operating results of the Richmond portfolio, which was sold during the first quarter of 2015. The sale of our Richmond Portfolio represented a strategic shift away from a geographical market, as we exited the Richmond market, and, therefore, qualified to be classified as discontinued operations. The results for 2015 and 2014 also include the operating results of properties sold or classified as held-for-sale prior to our adoption of Accounting Standards Update 2014-08 ("ASU 2014-08") in the second quarter of 2014. |
(6) | Represents the original issuance costs associated with the preferred shares that were redeemed during 2016. |
20
| Annual Supplemental Financial Results (unaudited, amounts in thousands, except per share data) | |
Annual Supplemental Financial Results Items: | ||||||||||||
The following items were included in the determination of net (loss) income: | ||||||||||||
Years Ended December 31, | ||||||||||||
2016 | 2015 | 2014 | ||||||||||
Supplemental Operating Items(1) | ||||||||||||
Termination fees | $ | 114 | $ | 144 | $ | 1,149 | ||||||
Capitalized interest | 681 | 1,864 | 3,233 | |||||||||
Snow and ice removal costs (excluding reimbursements)(2) | (1,670 | ) | (2,009 | ) | (2,096 | ) | ||||||
Reserves for bad debt expense | (830 | ) | (621 | ) | (1,076 | ) | ||||||
Personnel separation costs | — | (6,462 | ) | — | ||||||||
Dispositions in Continuing Operations(3) | ||||||||||||
Revenues | $ | 11,156 | $ | 29,773 | $ | 31,027 | ||||||
Operating expenses | (4,307 | ) | (10,353 | ) | (11,055 | ) | ||||||
Depreciation and amortization expense | (1,070 | ) | (10,310 | ) | (11,289 | ) | ||||||
Interest expense, net of interest income | (436 | ) | (465 | ) | (843 | ) | ||||||
Loss on debt extinguishment(4) | (48 | ) | — | — | ||||||||
Impairment of rental property(5) | (2,772 | ) | (60,826 | ) | — | |||||||
(Loss) gain on sale of rental property(6) | (1,155 | ) | 29,477 | 21,230 | ||||||||
$ | 1,368 | $ | (22,704 | ) | $ | 29,070 | ||||||
Dispositions in Discontinued Operations(7) | ||||||||||||
Revenues(8) | $ | — | $ | 877 | $ | 7,688 | ||||||
Operating expenses | — | (638 | ) | (3,612 | ) | |||||||
Depreciation and amortization expense | — | (1,222 | ) | (3,662 | ) | |||||||
Interest expense, net of interest income | — | 8 | (268 | ) | ||||||||
Loss on debt extinguishment | — | (489 | ) | — | ||||||||
Gain on sale of rental property | — | 857 | 1,338 | |||||||||
$ | — | $ | (607 | ) | $ | 1,484 | ||||||
(1) | Includes the operations of properties that were sold or classified as held-for-sale and did not have their operating results classified as discontinued operations. |
(2) | We recovered approximately 58% to 65% of these costs for the periods presented. |
(3) | Represents the operating results of properties that were sold or classified as held-for-sale and did not meet the criteria to be classified as discontinued operations. All periods presented include the operating results of One Fair Oaks, which was classified as held-for-sale at December 31, 2016 and was sold in January 2017, Storey Park, which was sold in July 2016, and the NOVA Non-Core Portfolio, which was sold in March 2016. The years ended December 31, 2015 and 2014 also include the operating results of Newington Business Park Center and Cedar Hill I and III, which were sold in December 2015, and Rumsey Center, which was sold in July 2015. In addition, the operating results of Corporate Campus at Ashburn Center and Owings Mills Business Park, which were sold in June and October 2014, respectively, are reflected in 2014. |
(4) | Reflects charges associated with the defeasance of the outstanding balance of the mortgage loan encumbering Gateway Centre Manassas, which was included in the NOVA Non-Core Portfolio and sold on March 25, 2016. |
(5) | In June 2016, we recorded an impairment charge of $2.8 million based on the anticipated sales price of Storey Park, which was sold on July 25, 2016. In the fourth quarter of 2015, we recorded an impairment charge of $26.9 million based on the anticipated sales price of the NOVA Non-Core Portfolio, which was sold in the first quarter of 2016. |
(6) | During 2016, we recorded a $1.2 million loss on the sale of the NOVA Non-Core Portfolio. During 2015, the gain on sale of rental property is related to Rumsey Center, Newington Business Park Center and Cedar Hill I and III. During 2014, the gain on sale of rental property is related to Corporate Campus at Ashburn Center. |
(7) | Includes the operating results of the Richmond portfolio, which was sold during the first quarter of 2015. The sale of our Richmond Portfolio represented a strategic shift away from a geographical market, as we exited the Richmond market, and, therefore, qualified to be classified as discontinued operations. Also includes the operating results of properties sold or classified as held-for-sale prior to our adoption of ASU 2014-08 in the second quarter of 2014. |
(8) | For the year ended December 31, 2015, we accelerated $0.9 million of unamortized straight-line rent and deferred abatement costs due to the sale of the Richmond Portfolio in March 2015. As the result of the sale of Girard Business Center and Gateway Center in January 2014, we accelerated $1.0 million of unamortized straight-line rent and deferred abatement costs during the first quarter of 2014. |
21
| Annual Financial Measures (unaudited, amounts in thousands, except per share data) | |
Years Ended December 31, | ||||||||||||
FUNDS FROM OPERATIONS ("FFO") | 2016 | 2015 | 2014 | |||||||||
Net (loss) income attributable to common shareholders | $ | (9,635 | ) | $ | (45,366 | ) | $ | 4,444 | ||||
Depreciation and amortization: | ||||||||||||
Rental property(1) | 60,862 | 66,624 | 61,796 | |||||||||
Discontinued operations | — | 1,222 | 3,662 | |||||||||
Unconsolidated joint ventures | 3,610 | 3,916 | 4,466 | |||||||||
Impairment of rental property | 2,772 | 60,826 | 3,957 | |||||||||
Loss (gain) on sale of rental property | 1,155 | (30,334 | ) | (22,568 | ) | |||||||
Net (loss) income attributable to noncontrolling interests | ||||||||||||
in the Operating Partnership | (428 | ) | (2,056 | ) | 199 | |||||||
FFO available to common shareholders and unitholders | 58,336 | 54,832 | 55,956 | |||||||||
Dividends on preferred shares | 3,053 | 12,400 | 12,400 | |||||||||
Issuance costs of redeemed preferred shares(2) | 5,515 | — | — | |||||||||
FFO | $ | 66,904 | $ | 67,232 | $ | 68,356 | ||||||
FFO available to common shareholders and unitholders | $ | 58,336 | $ | 54,832 | $ | 55,956 | ||||||
Acquisition costs | — | — | 2,681 | |||||||||
Yield maintenance payment(3) | — | (2,426 | ) | — | ||||||||
Loss on debt extinguishment / modification(4) | 48 | 2,313 | — | |||||||||
Personnel separation costs(5) | — | 6,462 | — | |||||||||
Deferred abatement and straight-line amortization(6) | — | 854 | 1,045 | |||||||||
Issuance costs of redeemed preferred shares(2) | 5,515 | — | — | |||||||||
Core FFO | $ | 63,899 | $ | 62,035 | $ | 59,682 | ||||||
Diluted Per Share Metrics: | ||||||||||||
Net (loss) income attributable to common shareholders | $ | (0.17 | ) | $ | (0.79 | ) | $ | 0.07 | ||||
FFO available to common shareholders and unitholders | $ | 0.97 | $ | 0.90 | $ | 0.92 | ||||||
Core FFO | $ | 1.06 | $ | 1.02 | $ | 0.98 | ||||||
Weighted average shares - diluted | 57,581 | 58,081 | 58,220 | |||||||||
Weighted average shares and OP units - diluted | 60,325 | 60,704 | 60,851 | |||||||||
Other Supplemental Information | ||||||||||||
Non-cash share-based compensation expense | $ | 2,318 | $ | 2,805 | $ | 3,732 | ||||||
Straight-line rent, net(7) | 2,918 | (734 | ) | (1,529 | ) | |||||||
Deferred market rent, net | 300 | 138 | 43 | |||||||||
Non-real estate depreciation and amortization(8) | 1,353 | 1,423 | 1,368 | |||||||||
Debt fair value amortization | (493 | ) | (582 | ) | (532 | ) | ||||||
Amortization of finance costs | 1,852 | 1,658 | 1,227 | |||||||||
Tenant improvements(9) | (8,636 | ) | (15,612 | ) | (14,296 | ) | ||||||
Leasing commissions(9) | (2,817 | ) | (4,099 | ) | (5,017 | ) | ||||||
Capital expenditures(9) | (3,947 | ) | (5,953 | ) | (7,074 | ) | ||||||
Total | $ | (7,152 | ) | $ | (20,956 | ) | $ | (22,078 | ) | |||
(1) | During the fourth quarter of 2016, we wrote off $2.0 million of tenant improvements associated with a defaulted tenant at 840 First Street, NE. During the fourth quarter of 2014, we wrote off lease-level intangible assets and liabilities associated with a tenant at 1401 K Street, NW, who vacated effective January 2015. The accelerated amortization for the three months ended December 31, 2014 resulted in a net increase in depreciation and amortization expense of $0.1 million, which included a $0.6 million decrease in depreciation and amortization related to the aggregate deferred market rent assets and liabilities. |
(2) | Represents the original issuance costs associated with the preferred shares that were redeemed during the respective periods. These costs are deducted from net (loss) income to arrive at net (loss) income attributable to common shareholders. |
(3) | In February 2015, the owners of America's Square prepaid a mezzanine loan that had an outstanding balance of $29.7 million. We received a yield maintenance payment of $2.4 million along with the repayment of the loan. |
(4) | During the first quarter of 2016, we recorded $48 thousand in charges related to the defeasance of the Gateway Centre Manassas debt. During 2015, we amended, restated and consolidated our existing unsecured revolving credit facility and unsecured term loan and recorded $1.8 million in debt extinguishment charges. We also recorded $0.5 million in charges related to our prepayment of mortgage loans in connection with the sale of the Richmond portfolio. |
(5) | During the fourth quarter of 2015, we recorded personnel separation costs of $6.1 million in connection with our former Chief Executive Officer and former Chief Investment Officer's separation from the Company in November 2015. During the first quarter of 2015, we recorded $0.4 million of personnel separation costs as a result of moving to a vertically integrated structure with a greater focus on high quality D.C. office properties. |
(6) | During 2015, we accelerated $0.9 million of unamortized straight-line rent and deferred abatement costs due to the sale of the Richmond Portfolio in March 2015. During 2014, we accelerated $1.0 million of unamortized straight-line rent and deferred abatement costs due to the sale of Girard Business Center and Gateway Center in January 2014. |
(7) | Includes our amortization of the following: straight-line rents and associated uncollectable amounts, rent abatements and lease incentives, including the write-off of $1.4 million of unamortized lease incentives and rent abatement recorded during the fourth quarter of 2016, which was associated with a defaulted tenant at 840 First Street, NE. Also, beginning in the third quarter of 2016, reflects a reduction in revenue related to the impact of accelerating tenant improvement reimbursement revenue recognized for the NOVA build-to-suit. |
(8) | Most non-real estate depreciation is classified in general and administrative expense. |
(9) | Does not include first-generation costs, which we define as tenant improvements, leasing commissions and capital expenditure costs that were taken into consideration when underwriting the purchase of a property or incurred to bring the property to operating standard for its intended use. |
22
| Annual Financial Measures (unaudited, amounts in thousands, except per share data) | |
Years Ended December 31, | ||||||||||||
First-generation costs | 2016 | 2015 | 2014 | |||||||||
Tenant improvements | $ | 20,082 | (1) | $ | 22,588 | $ | 8,245 | |||||
Leasing commissions | 1,897 | 862 | 4,178 | |||||||||
Capital expenditures | 9,765 | 5,598 | 8,415 | |||||||||
Total first-generation costs | 31,744 | 29,048 | 20,838 | |||||||||
Development and redevelopment | 10,213 | 19,107 | 8,146 | |||||||||
$ | 41,957 | $ | 48,155 | $ | 28,984 | |||||||
(1) | Excludes an $8.9 million reimbursement that we received in the third quarter of 2016 related to tenant improvement work done at the NOVA build-to-suit. |
23
| Capitalization and Selected Ratios (unaudited, amounts in thousands, except per share data, percentages and ratios) | |
Percent of Total Market Capitalization | ||||||
Common Shares and Units | ||||||
Total common shares outstanding | 58,319 | |||||
Operating Partnership ("OP") units held by third parties | 2,546 | |||||
Total common shares and OP units outstanding | 60,865 | |||||
Market price per share at December 31, 2016 | $ | 10.97 | ||||
Market Value of Common Equity | $ | 667,689 | 47.3 | % | ||
Debt(1) | ||||||
Fixed-rate debt | $ | 232,607 | 16.5 | % | ||
Hedged variable-rate debt(2) | 240,000 | 17.0 | % | |||
Unhedged variable-rate debt | 270,800 | 19.2 | % | |||
Total debt | $ | 743,407 | 52.7 | % | ||
Total Market Capitalization at December 31, 2016 | $ | 1,411,096 | 100.0 | % | ||
Selected Ratios | |||||||||||||||||||||||
Three Months Ended | |||||||||||||||||||||||
December 31, 2016 | September 30, 2016 | June 30, 2016 | March 31, 2016 | December 31, 2015 | Twelve Months Ended December 31, 2016 | ||||||||||||||||||
Coverage Ratios | |||||||||||||||||||||||
Interest Coverage Ratio | |||||||||||||||||||||||
Adjusted EBITDA, less personnel separation costs(3) | $ | 21,641 | $ | 22,584 | $ | 22,489 | $ | 22,924 | $ | 25,915 | $ | 89,638 | |||||||||||
Interest expense | 6,571 | 6,414 | 6,568 | 6,816 | 6,576 | 26,370 | |||||||||||||||||
3.29x | 3.52x | 3.42x | 3.36x | 3.94x | 3.40x | ||||||||||||||||||
Fixed Charge Coverage Ratio | |||||||||||||||||||||||
Adjusted EBITDA, less personnel separation costs(3) | $ | 21,641 | $ | 22,584 | $ | 22,489 | $ | 22,924 | $ | 25,915 | $ | 89,638 | |||||||||||
Fixed charges(4) | 7,452 | 7,353 | 8,279 | 10,025 | 10,628 | 33,093 | |||||||||||||||||
2.90x | 3.07x | 2.72x | 2.29x | 2.44x | 2.71x | ||||||||||||||||||
Overhead Ratio | |||||||||||||||||||||||
General and administrative expense, less personnel separation costs(3) | $ | 3,980 | $ | 4,112 | $ | 4,305 | $ | 4,578 | $ | 4,283 | $ | 16,976 | |||||||||||
Total revenues | 38,972 | 40,172 | 38,493 | 42,697 | 43,104 | 160,334 | |||||||||||||||||
10.2 | % | 10.2 | % | 11.2 | % | 10.7 | % | 9.9 | % | 10.6 | % | ||||||||||||
Leverage Ratios | |||||||||||||||||||||||
Debt and Preferred Shares/Total Market Capitalization | |||||||||||||||||||||||
Total debt and preferred shares(1)(5) | $ | 743,407 | $ | 745,518 | $ | 797,492 | $ | 824,291 | $ | 892,216 | |||||||||||||
Total market capitalization | 1,411,096 | 1,302,680 | 1,355,941 | 1,375,803 | 1,581,978 | ||||||||||||||||||
52.7 | % | 57.2 | % | 58.8 | % | 59.9 | % | 56.4 | % | ||||||||||||||
Debt and Preferred Shares/Undepreciated Book Value | |||||||||||||||||||||||
Total debt and preferred shares(1)(5)(6) | $ | 743,407 | $ | 745,518 | $ | 775,492 | $ | 824,291 | $ | 892,216 | |||||||||||||
Undepreciated book value(6) | 1,301,834 | 1,321,517 | 1,316,947 | 1,361,312 | 1,340,050 | ||||||||||||||||||
57.1 | % | 56.4 | % | 58.9 | % | 60.6 | % | 66.6 | % | ||||||||||||||
(1) | In the first quarter of 2016, we adopted ASU 2015-03, which requires debt issuance costs to be presented in the balance sheet as a direct deduction from the carrying value of the respective debt liability and is applied on a retrospective basis. Our total debt balances exclude unamortized deferred financing costs for all periods presented. |
(2) | As of December 31, 2016, we had fixed LIBOR at a weighted average interest rate of 1.4% on $240.0 million of our variable rate debt through nine interest rate swap agreements. |
(3) | For the purpose of calculating the selected ratios above, Adjusted EBITDA and General and administrative expense for the three months ended December 31, 2015 exclude $6.1 million of personnel separation costs that were incurred in connection with our former CEO and former CIO's separation from the Company in November 2015. |
(4) | Fixed charges include interest expense, debt principal amortization and quarterly accumulated dividends on our preferred shares. Fixed charges exclude the final lump sum principal loan payments made upon the extinguishment of outstanding debt. |
(5) | In July 2016, we redeemed the remaining 0.6 million shares of our 7.750% Series A Preferred Shares. |
(6) | For the three months ended December 31, 2016, we excluded the assets related to One Fair Oaks, which was classified as held-for-sale at December 31, 2016 and was sold on January 9, 2017. For the three months ended June 30, 2016, we excluded the assets and debt related to Storey Park, which was classified as held-for-sale at June 30, 2016 and was sold on July 25, 2016. |
24
| Outstanding Debt (unaudited, dollars in thousands) | |
Fixed-Rate Debt | Effective Interest Rate | Balance at December 31, 2016 | Annualized Debt Service | Maturity Date | Balance at Maturity | ||||||||||
Encumbered Properties | |||||||||||||||
Redland II and III | 4.64% | 63,214 | 4,014 | 11/1/2017 | 62,064 | ||||||||||
840 First Street, NE | 6.01% | 35,201 | 2,722 | 7/1/2020 | 32,000 | ||||||||||
Battlefield Corporate Center | 4.40% | 3,353 | 320 | 11/1/2020 | 2,618 | ||||||||||
1211 Connecticut Avenue, NW | 4.47% | 28,503 | 1,823 | 7/1/2022 | 24,668 | ||||||||||
1401 K Street, NW | 4.93% | 35,556 | 2,392 | 6/1/2023 | 30,414 | ||||||||||
11 Dupont Circle(1) | 4.22% | 66,780 | 2,705 | 9/1/2030 | 60,449 | ||||||||||
Total Fixed-Rate Debt | 4.75%(2) | $ | 232,607 | $ | 13,976 | $ | 212,213 | ||||||||
Variable-Rate Debt(3) | |||||||||||||||
440 First Street, NW Construction Loan(4) | LIBOR + 2.50% | 32,216 | 1,053 | 5/30/2017 | 32,216 | ||||||||||
Northern Virginia Construction Loan(5) | LIBOR + 1.85% | 34,584 | 906 | 9/1/2019 | 34,584 | ||||||||||
Unsecured Revolving Credit Facility(6) | LIBOR + 1.50% | 144,000 | 3,269 | 12/4/2019 | 144,000 | ||||||||||
Unsecured Term Loan(6) | |||||||||||||||
Tranche A | LIBOR + 1.45% | 100,000 | 2,220 | 12/4/2020 | 100,000 | ||||||||||
Tranche B | LIBOR + 1.45% | 100,000 | 2,220 | 6/4/2021 | 100,000 | ||||||||||
Tranche C | LIBOR + 1.80% | 100,000 | 2,570 | 12/4/2022 | 100,000 | ||||||||||
Total Unsecured Term Loan | 2.38%(2) | $ | 300,000 | $ | 7,010 | $ | 300,000 | ||||||||
Total Variable-Rate Debt | 2.93%(2)(7) | $ | 510,800 | $ | 12,238 | $ | 510,800 | ||||||||
Total Debt at December 31, 2016(8) | 3.50%(2)(7) | $ | 743,407 | $ | 26,214 | (9) | $ | 723,013 | |||||||
(1) | The loan is interest only until September 1, 2025. |
(2) | Represents the weighted average interest rate. |
(3) | All of our variable rate debt is based on one-month LIBOR. For the purposes of calculating the annualized debt service and the effective interest rate, we used the one-month LIBOR rate at December 31, 2016, which was 0.77%. |
(4) | In May 2016, we extended the loan's maturity date one year to May 30, 2017. We can repay all or a portion of the 440 First Street, NW Construction Loan, without penalty, at any time during the term of the loan. |
(5) | The loan has a borrowing capacity of up to $43.7 million and is collateralized by the NOVA build-to-suit, which was place in-service in August 2016. We can repay all or a portion of the Northern Virginia Construction Loan, without penalty, at any time during the term of the loan. |
(6) | Based on our leverage ratio at December 31, 2016, the applicable interest rate spreads associated with the unsecured revolving credit facility and unsecured term loan remained unchanged. |
(7) | The effective interest rate reflects the impact of our interest rate swap agreements. As of December 31, 2016, we had fixed LIBOR at a weighted average interest rate of 1.4% on $240.0 million of our variable rate debt through nine interest rate swap agreements. |
(8) | In the first quarter of 2016, we adopted ASU 2015-03, which requires debt issuance costs to be presented in the balance sheet as a direct deduction from the carrying value of the respective debt liability and is applied on a retrospective basis. Our total debt balance at December 31, 2016 excludes $6.2 million of unamortized deferred financing costs. |
(9) | During the fourth quarter of 2016, we paid approximately $0.9 million in principal payments on our consolidated mortgage debt. |
25
| Debt Maturity Schedule (unaudited, dollars in thousands) | |
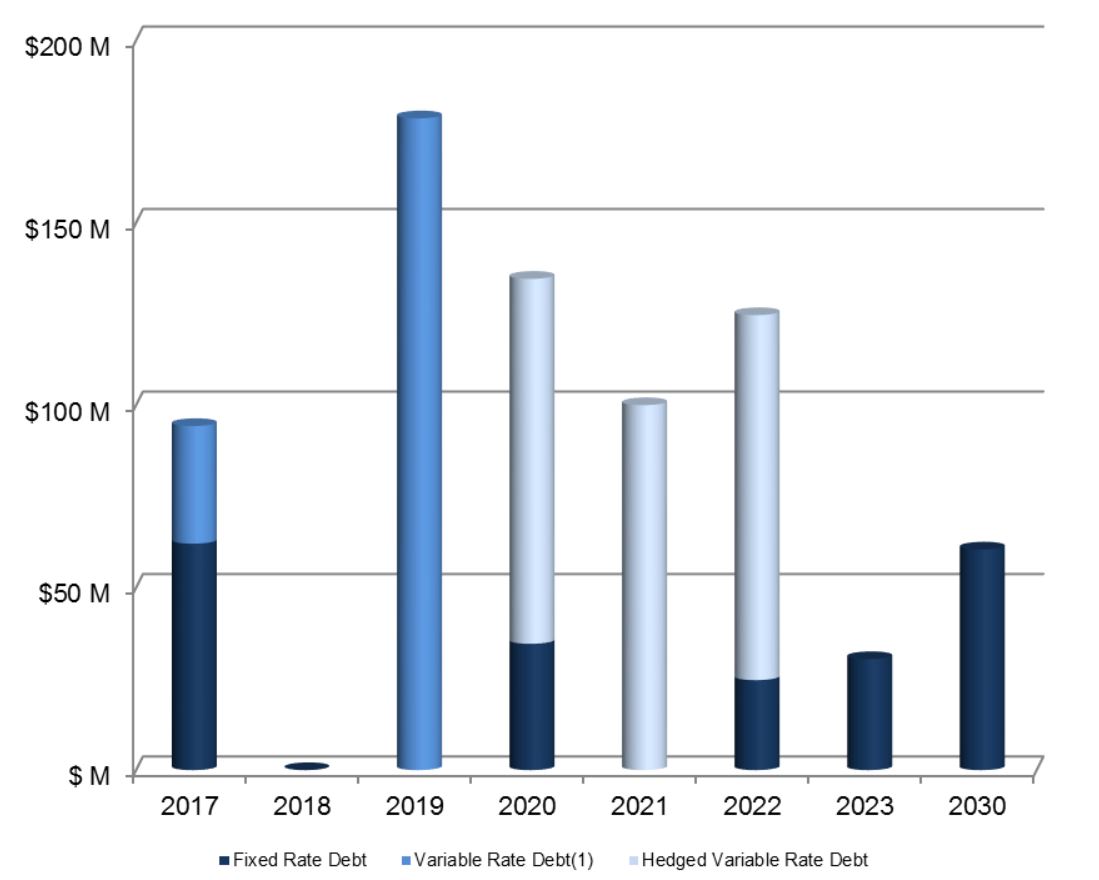
NOI of Pledged Properties and Supported Indebtedness
Year of Maturity | Type | Annualized NOI(2) | Total Maturing Indebtedness | Total Supported Indebtedness | Debt Yield | |||||||||
2017 | Construction Loan | 3,094 | 32,216 | 32,216 | 9.6 | % | ||||||||
2017 | Secured Property Debt | 9,391 | 62,064 | 62,064 | 15.1 | % | ||||||||
2019 | Construction Loan | 4,196 | 34,584 | 34,584 | 12.1 | % | ||||||||
2019 | Unsecured Revolving Credit Facility | 72,952 | 144,000 | 444,000 | 16.4 | % | ||||||||
2020 | Unsecured Term Loan | 72,952 | 100,000 | 444,000 | 16.4 | % | ||||||||
2020 | Secured Property Debt | 8,516 | 34,618 | 34,618 | 24.6 | % | ||||||||
2021 | Unsecured Term Loan | 72,952 | 100,000 | 444,000 | 16.4 | % | ||||||||
2022 | Secured Property Debt | 3,443 | 24,668 | 24,668 | 14.0 | % | ||||||||
2022 | Unsecured Term Loan | 72,952 | 100,000 | 444,000 | 16.4 | % | ||||||||
2023 | Secured Property Debt | 2,115 | 30,414 | 30,414 | 7.0 | % | ||||||||
2030 | Secured Property Debt | 4,659 | 60,449 | 60,449 | 7.7 | % | ||||||||
(1) | As of December 31, 2016, we had fixed LIBOR at a weighted average interest rate of 1.4% on $240.0 million of our variable rate debt through nine interest rate swap agreements. |
(2) | NOI is calculated in accordance with the covenants governing our consolidated unsecured revolving credit facility and unsecured term loan. |
26
| Selected Debt Covenants (unaudited, dollars in thousands) | |
Unsecured Credit Facility / Unsecured Term Loan / Construction Loans | |||||
Covenants | Quarter Ended December 31, 2016 | Covenant | |||
Consolidated Total Leverage Ratio(1) | 47.0 | % | ≤ 60% | ||
Tangible Net Worth(1) | $ | 895,915 | ≥ $601,202 | ||
Fixed Charge Coverage Ratio(1) | 2.82x | ≥ 1.50x | |||
Maximum Dividend Payout Ratio | 47.7 | % | ≤ 95% | ||
Restricted Indebtedness: | |||||
Maximum Secured Debt | 20.6 | % | ≤ 40% | ||
Unencumbered Pool Leverage (1) | 44.3 | % | ≤ 60% | ||
Unencumbered Pool Interest Coverage Ratio (1) | 5.91x | ≥ 1.75x | |||
(1) | These are the only covenants that apply to our 440 First Street, NW Construction Loan and Northern Virginia Construction Loan, which are calculated in accordance with the amended, restated and consolidated unsecured revolving credit facility and unsecured term loan facility. |
27
| Investment in Joint Ventures (unaudited, dollars in thousands) | |
Unconsolidated Joint Ventures | FPO Ownership | FPO Investment at December 31, 2016 | Property Type | Location | Square Feet | Leased at December 31, 2016 | Occupied at December 31, 2016 | ||||||||||||||||||
Rivers Park I and II(1) | 25% | $ | 2,413 | Business Park | Columbia, MD | 307,984 | 82.9% | 82.9% | |||||||||||||||||
Aviation Business Park(1) | 50% | 5,941 | Office | Glen Burnie, MD | 120,284 | 79.3% | 69.8% | ||||||||||||||||||
1750 H Street, NW | 50% | 14,625 | Office | Washington, DC | 113,131 | 94.6% | 91.1% | ||||||||||||||||||
Prosperity Metro Plaza | 51% | 26,414 | Office | Fairfax, VA | 326,197 | 100.0% | 100.0% | ||||||||||||||||||
Total / Weighted Average | $ | 49,392 | 867,596 | 90.3% | 88.6% | ||||||||||||||||||||
Outstanding Debt | FPO Ownership | Effective Interest Rate | Principal Balance at December 31, 2016(2) | Annualized Debt Service | Maturity Date | Balance at Maturity(2) | FPO Share of Principal Balance(3) | ||||||||||||||||||
Rivers Park I and II(1) | 25% | LIBOR + 1.90%(4) | $ | 28,000 | $ | 748 | 9/26/2017 | $ | 28,000 | $ | 7,000 | ||||||||||||||
1750 H Street, NW | 50% | 3.92% | 32,000 | 1,254 | 8/1/2024 | 32,000 | 16,000 | ||||||||||||||||||
Prosperity Metro Plaza | 51% | 3.91% | 50,000 | 1,955 | 12/1/2029(5) | 45,246 | 25,500 | ||||||||||||||||||
Total / Weighted Average | 3.60% | $ | 110,000 | $ | 3,957 | $ | 105,246 | $ | 48,500 | ||||||||||||||||
Three Months Ended December 31, 2016 | |||||||||||||||||||||||||
Results of Operations - Unconsolidated Joint Ventures (6) | Rivers Park I and II | Aviation Business Park | 1750 H St, NW | Prosperity Metro Plaza | Total | ||||||||||||||||||||
Equity in earnings from affiliates | $ | 35 | $ | 51 | $ | 91 | $ | 234 | $ | 411 | |||||||||||||||
Other expense, net(7) | 156 | 97 | 383 | 763 | 1,399 | ||||||||||||||||||||
Net operating income | 191 | 148 | 474 | 997 | 1,810 | ||||||||||||||||||||
Straight-line and deferred market rents(8) | (4 | ) | (2 | ) | 21 | 236 | 251 | ||||||||||||||||||
Management fee adjustment(9) | 2 | 2 | (12 | ) | (27 | ) | (35 | ) | |||||||||||||||||
Adjusted NOI | $ | 189 | $ | 148 | $ | 483 | $ | 1,206 | $ | 2,026 | |||||||||||||||
(1) | In January 2017, we entered into a binding contract to sell Rivers Park I and II and Aviation Business Park. We anticipate completing the sale in March 2017; however, we can provide no assurances regarding the timing or pricing of such sale, or that such sale will ultimately occur. |
(2) | Reflects the entire balance of the debt secured by the properties, not our portion of the debt. |
(3) | Reflects our proportionate share of the principal debt balances based on our ownership percentage of the respective joint venture, of which $2.8 million, related to the Rivers Park I and II debt, is recourse to us. |
(4) | For the purposes of calculating the annualized debt service and the effective interest rate, we used the one-month LIBOR rate at December 31, 2016, which was 0.77%. |
(5) | The mortgage loan requires interest-only payments through December 2024, at which time the loan requires principal and interest payments through its maturity date. |
(6) | Reflects our proportionate share of operating results for the three months ended December 31, 2016 based on our ownership percentage of the respective joint ventures. |
(7) | Includes depreciation and interest expense, net of other income. |
(8) | Includes straight-line rents and the amortization of lease incentives, rent abatements and deferred market rents. |
(9) | A standard management fee is used in lieu of the actual management fee earned. |
28
| Net Asset Value Analysis (unaudited, amounts in thousands, except percentages) | |
Three Months Ended December 31, 2016 | |||
Income Statement Items | |||
Adjusted NOI - Consolidated Portfolio | |||
Total revenues | $ | 38,972 | |
Property operating expenses | (8,974 | ) | |
Real estate taxes and insurance expenses | (4,917 | ) | |
Net Operating Income(1) | 25,081 | ||
Straight-line and deferred market rents, net(2) | 1,825 | ||
Management fee adjustment(3) | 48 | ||
Disposed or held-for-sale properties(4) | (1,270 | ) | |
Adjusted NOI - Consolidated Portfolio | $ | 25,684 | |
Occupancy at December 31, 2016 | 92.6 | % | |
Balance Sheet Items | |||
Rental Property, net | |||
Gross rental property | $ | 1,301,834 | |
Accumulated depreciation | (242,562 | ) | |
Total Rental Property, net | $ | 1,059,272 | |
Development & Redevelopment Assets | |||
Original cost basis of land held for future development | $ | 16,212 | |
Construction costs to date for current development | 985 | ||
Total Development & Redevelopment Assets | $ | 17,197 | |
Other Assets | |||
Unconsolidated investment in affiliates | $ | 49,392 | |
Net Liabilities | |||
Mortgage and senior debt, cash principal balances | $ | (743,407 | ) |
Accrued interest | (1,537 | ) | |
Rents received in advance | (6,234 | ) | |
Tenant security deposits | (4,982 | ) | |
Accounts payable and other liabilities | (43,904 | ) | |
Cash, cash equivalents, escrows and reserves | 15,563 | ||
Accounts and other receivables, net of allowance for doubtful accounts | 6,892 | ||
Prepaid expenses and other assets | 5,389 | ||
Total Net Liabilities | $ | (772,220 | ) |
Weighted Average Diluted Shares and OP Units Outstanding for the quarter ended December 31, 2016 | 60,383 | ||
Unconsolidated Joint Ventures(5) | |||
Adjusted NOI(6) | $ | 2,026 | |
Principal balance of outstanding debt at December 31, 2016 | $ | 48,500 | |
(1) | For a reconciliation of net operating income to net loss, see Quarterly Financial Results. |
(2) | Includes straight-line rents and the amortization of deferred market rents, lease incentives, rent abatements, including the write-off of $1.4 million of unamortized lease incentives and rent abatement recorded during the fourth quarter of 2016, which was associated with a defaulted tenant at 840 First Street, NE. Also, reflects a reduction in revenue related to the impact of accelerating tenant improvement reimbursement revenue recognized for the NOVA build-to-suit. |
(3) | A standard management fee is used in lieu of an administrative overhead allocation. |
(4) | Reflects the operating results for One Fair Oaks, which was classified as held-for-sale at December 31, 2016 and was sold on January 9, 2017. The property did not meet the requirements to be classified as discontinued operations and its operating results therefore remained in continuing operations. Proceeds from the sale of One Fair Oaks and available cash were used to pay down $14.0 million of the outstanding balance under our unsecured revolving credit facility. |
(5) | Represents our proportional share of Adjusted NOI and debt of our unconsolidated joint ventures. |
(6) | See Investment in Joint Ventures for a reconciliation of our proportional share of adjusted NOI for our unconsolidated joint ventures to equity in earnings of affiliates. |
29
| Portfolio Summary (unaudited) | |
Consolidated Portfolio | |||||||||||||||||||
Number of Buildings | Square Feet(1) | % Leased(1) | % Occupied(1) | Annualized Cash Basis Rent(2)(3) | % of Annualized Cash Basis Rent | ||||||||||||||
By Region | |||||||||||||||||||
Washington DC | 6 | 918,266 | 91.4 | % | 90.8 | % | $ | 28,160,056 | 25.1 | % | |||||||||
Maryland | 34 | 1,886,183 | 92.5 | % | 91.6 | % | 32,100,447 | 28.6 | % | ||||||||||
Northern VA | 15 | 1,885,958 | 94.5 | % | 92.8 | % | 29,887,114 | 26.7 | % | ||||||||||
Southern VA | 19 | 2,023,858 | 95.4 | % | 94.2 | % | 21,919,796 | 19.6 | % | ||||||||||
Total / Weighted Average | 74 | 6,714,265 | 93.8 | % | 92.6 | % | $ | 112,067,414 | 100.0 | % | |||||||||
By Strategic Category(4) | |||||||||||||||||||
Strategic Hold | 34 | 3,698,266 | 95.7 | % | 94.9 | % | $ | 64,308,193 | 57.4 | % | |||||||||
Reposition | 4 | 533,357 | 92.0 | % | 90.9 | % | 15,590,311 | 13.9 | % | ||||||||||
Non-Core | 36 | 2,482,642 | 91.3 | % | 89.6 | % | 32,168,909 | 28.7 | % | ||||||||||
Total / Weighted Average | 74 | 6,714,265 | 93.8 | % | 92.6 | % | $ | 112,067,414 | 100.0 | % | |||||||||
Value Creation Pipeline(5) | |||||||||||||||||||
(dollars in millions) | Region | Square Feet | % Leased | % Occupied | Total Project Cost(6) | Cost To Date(7) | Return on Investment(8) | ||||||||||||
Placed in Service | |||||||||||||||||||
440 First Street, NW | Washington DC | 138,603 | 81.5 | % | 81.5 | % | $76.0 | $72.7 | 7% | ||||||||||
NOVA build-to-suit | Northern VA | 167,440 | 100.0 | % | 100.0 | % | $54.1 | $54.1 | 7% | ||||||||||
Unconsolidated Joint Ventures(9) | |||||||||||||||||||
Number of Buildings | Square Feet(1) | % Leased(1) | % Occupied(1) | Annualized Cash Basis Rent(2)(3) | |||||||||||||||
Total / Weighted Average | 12 | 867,596 | 90.3 | % | 88.6 | % | $ | 18,107,560 | |||||||||||
(1) | Does not include space in development or redevelopment. |
(2) | Annualized cash basis rent at the end of the quarter, which is calculated as the contractual rent due under the terms of the lease, without taking into account rent abatements, is reflected on a triple-net equivalent basis, by deducting estimated operating expense reimbursements that are included, along with base rent, in the contractual payments of our full service leases. This amount differs from Adjusted NOI due to items such as rent abatement, unreimbursed expenses, non-recurring revenues and expenses, differences in leased vs. occupied space, and timing differences related to tenant activity. |
(3) | Includes leased spaces that are not yet occupied. |
(4) | "Strategic Category" reflects management's categorization of the property based on the Strategic Plan. "Strategic Hold" represents properties that are highly aligned with the Strategic Plan. "Reposition" represents strategic hold properties to which we intend to add value through lease-up, development and/or redevelopment. "Non-Core" represents properties that are no longer a strategic fit, properties in submarkets where we do not have asset concentration or operating efficiencies and/or properties where we believe we have maximized value. |
(5) | We own land that can accommodate up to 638,085 square feet of additional development. |
(6) | Reflects the total projected costs, net of tenant reimbursements, required to achieve stabilization, which includes, but is not limited to, the original cost basis of the property (or applicable portion thereof), projected base building costs, projected leasing commissions, projected tenant improvements, and projected capitalized expenses. |
(7) | Reflects the Total Project Costs incurred through December 31, 2016, which excludes an estimate of costs incurred by us that will be reimbursed by the tenant under the terms of the lease for the NOVA build-to-suit. |
(8) | Reflects the projected adjusted NOI after the rent abatement period ends, divided by Total Project Costs. |
(9) | Represents operating results of the unconsolidated joint ventures, not our economic interest in the properties. |
30
| Leasing and Occupancy Summary (unaudited) | |
Portfolio by Property Type and Strategic Category(1) | ||||||||||||||||||||||||||||||||||
Occupied Portfolio by Property Type and Strategic Category | Leased Portfolio by Property Type and Strategic Category | |||||||||||||||||||||||||||||||||
Square Feet | % of Total Portfolio | Number of Buildings | Occupied Square Feet | % Occupied | Annualized Cash Basis Rent(2) | % of Annualized Cash Basis Rent | Leased Square Feet(3) | % Leased | Annualized Cash Basis Rent(2)(3) | % of Annualized Cash Basis Rent | ||||||||||||||||||||||||
By Property Type | ||||||||||||||||||||||||||||||||||
Office | 3,176,236 | 47.3 | % | 30 | 2,988,981 | 94.1 | % | $ | 73,106,612 | 65.8 | % | 3,002,608 | 94.5 | % | $ | 73,436,324 | 65.5 | % | ||||||||||||||||
Business Park / Industrial | 3,538,029 | 52.7 | % | 44 | 3,229,206 | 91.3 | % | 37,953,662 | 34.2 | % | 3,295,113 | 93.1 | % | 38,631,090 | 34.5 | % | ||||||||||||||||||
Total / Weighted Average | 6,714,265 | 100.0 | % | 74 | 6,218,187 | 92.6 | % | $ | 111,060,274 | 100.0 | % | 6,297,721 | 93.8 | % | $ | 112,067,414 | 100.0 | % | ||||||||||||||||
By Strategic Category(4) | ||||||||||||||||||||||||||||||||||
Strategic Hold | 3,698,266 | 55.1 | % | 34 | 3,508,189 | 94.9 | % | $ | 63,968,214 | 57.6 | % | 3,540,646 | 95.7 | % | $ | 64,308,193 | 57.4 | % | ||||||||||||||||
Reposition | 533,357 | 7.9 | % | 4 | 484,877 | 90.9 | % | 15,347,825 | 13.8 | % | 490,597 | 92.0 | % | 15,590,311 | 13.9 | % | ||||||||||||||||||
Non-Core | 2,482,642 | 37.0 | % | 36 | 2,225,121 | 89.6 | % | 31,744,234 | 28.6 | % | 2,266,478 | 91.3 | % | 32,168,909 | 28.7 | % | ||||||||||||||||||
Total / Weighted Average | 6,714,265 | 100.0 | % | 74 | 6,218,187 | 92.6 | % | $ | 111,060,274 | 100.0 | % | 6,297,721 | 93.8 | % | $ | 112,067,414 | 100.0 | % | ||||||||||||||||
Market Concentration by Annualized Cash Basis Rent(2)(3) | ||||||||||||||||||||||||||||||||||
Washington DC | Maryland | Northern VA | Southern VA | |||||||||||||||||||||||||||||||
Total | ||||||||||||||||||||||||||||||||||
Office | 25.1 | % | 20.5 | % | 18.2 | % | 1.7 | % | 65.5 | % | ||||||||||||||||||||||||
Business Park / Industrial | — | 8.2 | % | 8.5 | % | 17.8 | % | 34.5 | % | |||||||||||||||||||||||||
Total / Weighted Average | 25.1 | % | 28.6 | % | 26.7 | % | 19.6 | % | 100.0 | % | ||||||||||||||||||||||||
(1) | Does not include space in development or redevelopment. |
(2) | Annualized cash basis rent at the end of the quarter, which is calculated as the contractual rent due under the terms of the lease, without taking into account rent abatements, is reflected on a triple-net equivalent basis, by deducting estimated operating expense reimbursements that are included, along with base rent, in the contractual payments of our full service leases. This amount differs from Adjusted NOI due to items such as rent abatement, unreimbursed expenses, non-recurring revenues and expenses, differences in leased vs. occupied space, and timing differences related to tenant activity. |
(3) | Includes leased spaces that are not yet occupied. |
(4) | "Strategic Category" reflects management's categorization of the property based on the Strategic Plan. "Strategic Hold" represents properties that are highly aligned with the Strategic Plan. "Reposition" represents strategic hold properties to which we intend to add value through lease-up, development and/or redevelopment. "Non-Core" represents properties that are no longer a strategic fit, properties in submarkets where we do not have asset concentration or operating efficiencies and/or properties where we believe we have maximized value. |
31
| Portfolio by Size(1) (unaudited) | |
Square Feet Under Lease | Number of Leases | Leased Square Feet | % of Total Square Feet | Annualized Cash Basis Rent(2) | % of Annualized Cash Basis Rent | Average Base Rent per Square Foot(2) | ||||||||||||||
0-2,500 | 88 | 140,730 | 2.2 | % | $ | 3,005,720 | 2.7 | % | $ | 21.36 | ||||||||||
2,501-10,000 | 188 | 1,034,124 | 16.4 | % | 17,955,682 | 16.0 | % | 17.36 | ||||||||||||
10,001-20,000 | 73 | 1,007,411 | 16.0 | % | 19,248,241 | 17.2 | % | 19.11 | ||||||||||||
20,001-40,000 | 42 | 1,133,830 | 18.0 | % | 17,408,316 | 15.5 | % | 15.35 | ||||||||||||
40,001-100,000 | 16 | 1,003,483 | 15.9 | % | 13,641,622 | 12.2 | % | 13.59 | ||||||||||||
100,001 + | 14 | 1,978,143 | 31.4 | % | 40,807,833 | 36.4 | % | 20.63 | ||||||||||||
Total / Weighted Average | 421 | 6,297,721 | 100.0 | % | $ | 112,067,414 | 100.0 | % | $ | 17.79 | ||||||||||
(1) | Assumes no exercise of tenant renewal options or early terminations. |
(2) | Annualized cash basis rent at the end of the quarter, which is calculated as the contractual rent due under the terms of the lease, without taking into account rent abatements, is reflected on a triple-net equivalent basis, by deducting estimated operating expense reimbursements that are included, along with base rent, in the contractual payments of our full service leases. This amount differs from Adjusted NOI due to items such as rent abatement, unreimbursed expenses, non-recurring revenues and expenses, differences in leased vs. occupied space, and timing differences related to tenant activity. |
(3) | Reflects contractual expiration of the following: CACI International at One Fair Oaks on December 31, 2016 (presented as a 2017 expiration), Department of Health and Human Services at Redland Corporate Center on March 22, 2017, and Bureau of Prisons at 500 First Street, NW on July 31, 2017. One Fair Oaks was sold on January 9, 2017. |
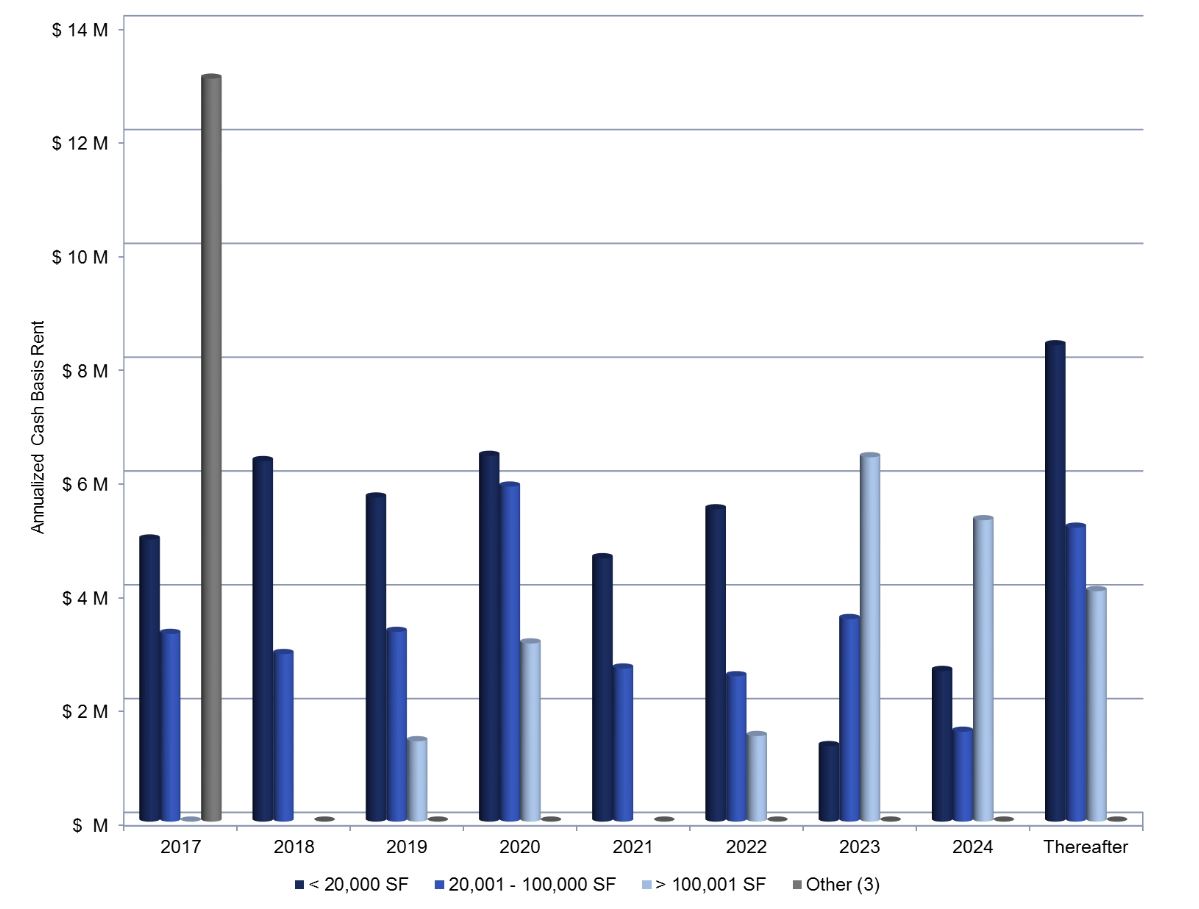
32
| Top Twenty-Five Tenants(1) (unaudited) | |
Ranking | Tenant | Number of Leases | Total Leased Square Feet | Annualized Cash Basis Rent(2) | % of Annualized Cash Basis Rent | Weighted Average Remaining Lease Years | |||||||||
1 | U.S. Government | 16 | 786,887 | $ | 17,632,405 | 15.7 | % | 5.3 | |||||||
2 | BlueCross BlueShield | 1 | 204,314 | 6,403,201 | 5.7 | % | 6.7 | ||||||||
3 | CACI International(3) | 1 | 214,214 | 5,707,301 | 5.1 | % | — | ||||||||
4 | BAE Systems Technology Solutions & Services | 2 | 165,004 | 4,217,339 | 3.8 | % | 3.7 | ||||||||
5 | ICF Consulting Group Inc. | 1 | 127,946 | 3,638,784 | 3.2 | % | 7.5 | ||||||||
6 | Sentara Healthcare | 5 | 283,760 | 2,723,684 | 2.4 | % | 3.7 | ||||||||
7 | Stock Building Supply, Inc.(4) | 1 | 171,996 | 2,106,951 | 1.9 | % | 5.7 | ||||||||
8 | Montgomery County, Maryland | 3 | 77,522 | 1,937,347 | 1.7 | % | 5.9 | ||||||||
9 | Vocus, Inc. | 1 | 93,000 | 1,761,944 | 1.6 | % | 6.2 | ||||||||
10 | State of Maryland - AOC | 1 | 101,113 | 1,757,997 | 1.6 | % | 3.0 | ||||||||
11 | First Data Corporation | 1 | 117,336 | 1,412,725 | 1.3 | % | 2.9 | ||||||||
12 | Siemens Corporation | 3 | 100,745 | 1,354,891 | 1.2 | % | 3.7 | ||||||||
13 | Odin, Feldman & Pittleman | 1 | 53,918 | 1,312,903 | 1.2 | % | 10.8 | ||||||||
14 | Affiliated Computer Services, Inc. | 1 | 107,422 | 1,278,322 | 1.1 | % | 5.0 | ||||||||
15 | CVS Pharmacy | 1 | 11,692 | 1,052,280 | 0.9 | % | 11.3 | ||||||||
16 | DRS Defense Solutions, LLC | 2 | 51,997 | 1,000,957 | 0.9 | % | 1.5 | ||||||||
17 | General Dynamics | 1 | 147,248 | 943,685 | 0.8 | % | 3.1 | ||||||||
18 | Telogy Networks, Inc. | 1 | 52,145 | 839,534 | 0.7 | % | 1.4 | ||||||||
19 | National Women's Law Center | 1 | 24,760 | 806,635 | 0.7 | % | 6.2 | ||||||||
20 | Zenith Education Group, Inc. | 1 | 39,250 | 794,420 | 0.7 | % | 2.6 | ||||||||
21 | Internet Society | 1 | 30,037 | 774,837 | 0.7 | % | 2.3 | ||||||||
22 | Stewart Lender Services | 1 | 57,476 | 724,772 | 0.6 | % | 5.8 | ||||||||
23 | ValueOptions, Inc. | 1 | 37,850 | 703,253 | 0.6 | % | 2.0 | ||||||||
24 | Washington Sports Club | 1 | 21,047 | 697,913 | 0.6 | % | 7.9 | ||||||||
25 | Notable Solutions | 1 | 24,477 | 677,279 | 0.6 | % | 3.5 | ||||||||
Subtotal Top 25 Tenants | 50 | 3,103,156 | $ | 62,261,360 | 55.6 | % | 4.8 | ||||||||
All Remaining Tenants | 371 | 3,194,565 | 49,806,054 | 44.4 | % | 4.4 | |||||||||
Total / Weighted Average | 421 | 6,297,721 | $ | 112,067,414 | 100.0 | % | 4.6 | ||||||||
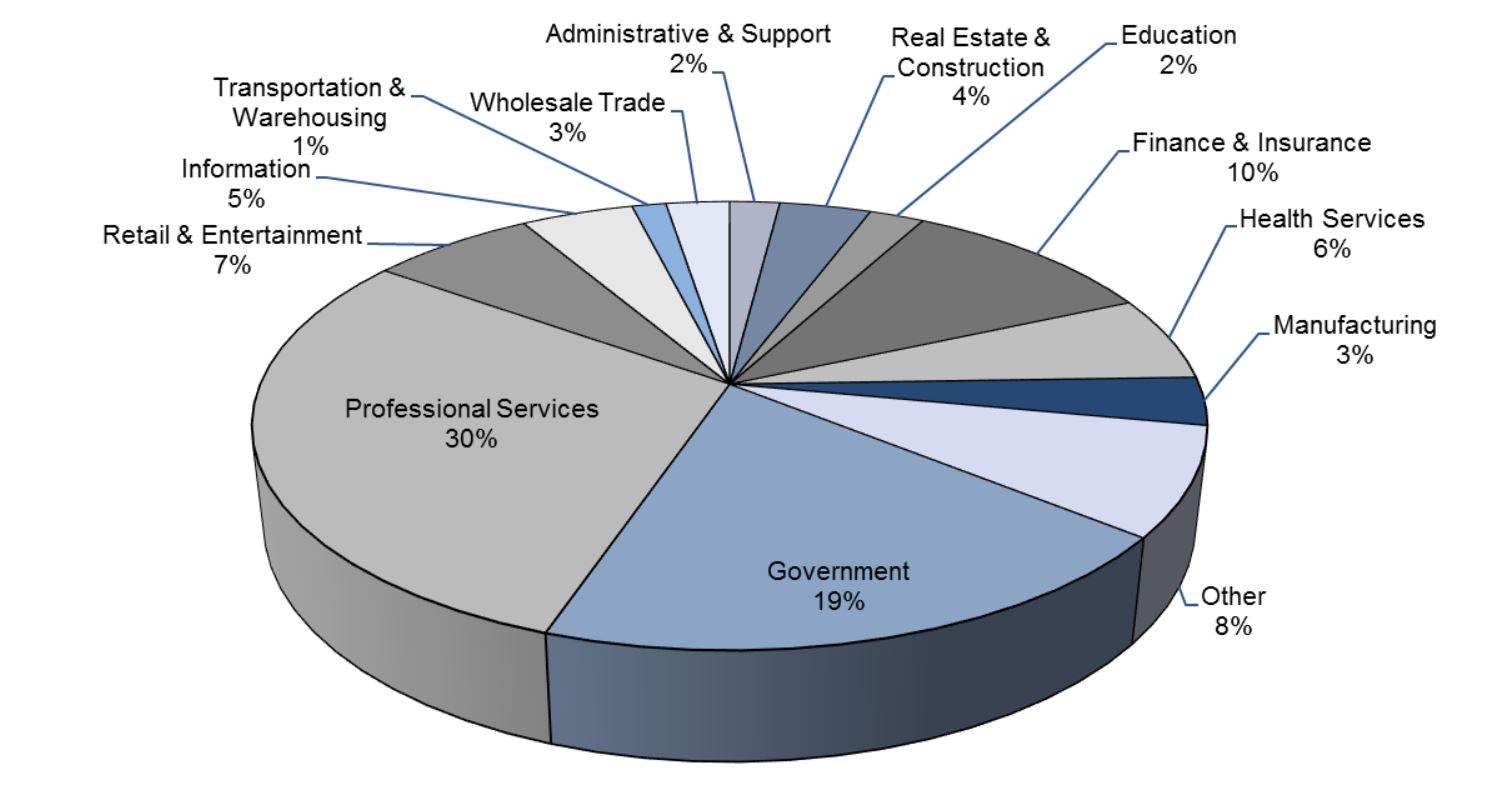
(1) | Assumes no exercise of tenant renewal options or early terminations. |
(2) | Annualized cash basis rent at the end of the quarter, which is calculated as the contractual rent due under the terms of the lease, without taking into account rent abatements, is reflected on a triple-net equivalent basis, by deducting estimated operating expense reimbursements that are included, along with base rent, in the contractual payments of our full service leases. This amount differs from Adjusted NOI due to items such as rent abatement, unreimbursed expenses, non-recurring revenues and expenses, differences in leased vs. occupied space, and timing differences related to tenant activity. |
(3) | CACI International fully occupied One Fair Oaks; however, its lease expired on December 31, 2016 and the property was sold on January 9, 2017. |
(4) | Stock Building Supply, Inc. is a tenant at Plaza 500, which was sold on February 17, 2017. |
33
| Annual Lease Expirations(1) (unaudited) | |
Total Portfolio | Property Type | ||||||||||||||||||||||||||||||
Office | Business Park / Industrial | ||||||||||||||||||||||||||||||
Year of Lease Expiration(2) | Number of Leases Expiring | Leased Square Feet | % of Leased Square Feet | Annualized Cash Basis Rent(3) | % of Annualized Cash Basis Rent | Average Base Rent per Square Foot(3) | Leased Square Feet | Average Base Rent per Square Foot(3) | Leased Square Feet | Average Base Rent per Square Foot(3) | |||||||||||||||||||||
2017 | 61 | 964,882 | 15.3 | % | 21,312,550 | (4) | 19.0 | % | 22.09 | 656,061 | 27.10 | 308,821 | 11.45 | ||||||||||||||||||
2018 | 63 | 651,458 | 10.3 | % | 9,602,083 | 8.6 | % | 14.74 | 236,800 | 19.31 | 414,658 | 12.13 | |||||||||||||||||||
2019 | 60 | 725,573 | 11.5 | % | 10,441,894 | 9.3 | % | 14.39 | 182,798 | 19.84 | 542,775 | 12.56 | |||||||||||||||||||
2020 | 56 | 968,619 | 15.4 | % | 15,446,140 | 13.8 | % | 15.95 | 437,930 | 22.07 | 530,689 | 10.89 | |||||||||||||||||||
2021 | 48 | 505,811 | 8.0 | % | 7,318,623 | 6.5 | % | 14.47 | 125,293 | 21.36 | 380,518 | 12.20 | |||||||||||||||||||
2022 | 50 | 699,816 | 11.1 | % | 9,546,837 | 8.5 | % | 13.64 | 169,457 | 23.50 | 530,359 | 10.49 | |||||||||||||||||||
2023 | 16 | 479,800 | 7.6 | % | 11,288,883 | 10.1 | % | 23.53 | 277,915 | 30.02 | 201,885 | 14.59 | |||||||||||||||||||
2024 | 21 | 519,230 | 8.2 | % | 9,523,937 | 8.5 | % | 18.34 | 258,911 | 25.52 | 260,319 | 11.20 | |||||||||||||||||||
2025 | 15 | 250,193 | 4.0 | % | 4,546,727 | 4.1 | % | 18.17 | 221,705 | 19.03 | 28,488 | 11.52 | |||||||||||||||||||
2026 | 14 | 147,358 | 2.3 | % | 3,268,575 | 2.9 | % | 22.18 | 89,910 | 28.80 | 57,448 | 11.83 | |||||||||||||||||||
Thereafter | 17 | 384,981 | 6.1 | % | 9,771,163 | 8.7 | % | 25.38 | 345,828 | 27.12 | 39,153 | 10.05 | |||||||||||||||||||
Total / Weighted Average | 421 | 6,297,721 | 100.0 | % | $ | 112,067,414 | 100.0 | % | $ | 17.79 | 3,002,608 | $ | 24.46 | 3,295,113 | $ | 11.72 | |||||||||||||||
(1) | Assumes no exercise of tenant renewal options or early terminations. |
(2) | We classify leases that expired or were terminated on the last day of the year as leased square footage since the tenant is contractually entitled to the space. |
(3) | Annualized cash basis rent at the end of the quarter, which is calculated as the contractual rent due under the terms of the lease, without taking into account rent abatements, is reflected on a triple-net equivalent basis, by deducting estimated operating expense reimbursements that are included, along with base rent, in the contractual payments of our full service leases. This amount differs from Adjusted NOI due to items such as rent abatement, unreimbursed expenses, non-recurring revenues and expenses, differences in leased vs. occupied space, and timing differences related to tenant activity. |
(4) | Includes contractual expiration of the following: CACI International at One Fair Oaks on December 31, 2016 (presented as a 2017 expiration), Department of Health and Human Services at Redland Corporate Center on March 22, 2017, and Bureau of Prisons at 500 First Street, NW on July 31, 2017. One Fair Oaks was sold on January 9, 2017. |
34
| Quarterly Lease Expirations(1) (unaudited) | |
Quarter of Lease Expiration(2) | Number of Leases Expiring | Leased Square Feet | % of Total Leased Square Feet | Annualized Cash Basis Rent(3) | Average Base Rent per Square Foot (3) | ||||||||||||
2017 - Q1 | 20 | 535,071 | 8.5 | % | $ | 11,279,497 | (4) | $ | 21.08 | ||||||||
2017 - Q2 | 10 | 44,617 | 0.7 | % | 777,113 | 17.42 | |||||||||||
2017 - Q3 | 17 | 286,796 | 4.6 | % | 7,767,909 | (5) | 27.09 | ||||||||||
2017 - Q4 | 14 | 98,398 | 1.6 | % | 1,488,031 | 15.12 | |||||||||||
Total / Weighted Average | 61 | 964,882 | 15.3 | % | $ | 21,312,550 | $ | 22.09 | |||||||||
(1) | Assumes no exercise of tenant renewal options or early terminations. |
(2) | We classify leases that expired or were terminated on the last day of the quarter as leased square footage since the tenant is contractually entitled to the space. |
(3) | Annualized cash basis rent at the end of the quarter, which is calculated as the contractual rent due under the terms of the lease, without taking into account rent abatements, is reflected on a triple-net equivalent basis, by deducting estimated operating expense reimbursements that are included, along with base rent, in the contractual payments of our full service leases. This amount differs from Adjusted NOI due to items such as rent abatement, unreimbursed expenses, non-recurring revenues and expenses, differences in leased vs. occupied space, and timing differences related to tenant activity. |
(4) | Includes the contractual expiration of CACI International at One Fair Oaks on December 31, 2016 (presented as a first quarter 2017 expiration), and the contractual expiration of the Department of Health and Human Services at Redland Corporate Center on March 22, 2017. One Fair Oaks was sold on January 9, 2017. |
(5) | Includes the contractual expiration of the Bureau of Prisons at 500 First Street, NW on July 31, 2017. |
35
| Leasing Analysis (unaudited) | |
Lease Summary(1) | ||||||||||||||||||||||||||||||
All Comparable and Non-comparable Leases | ||||||||||||||||||||||||||||||
Three Months Ended December 31, 2016 | ||||||||||||||||||||||||||||||
Square Footage | Number of Leases Signed | Cash Basis Base Rent(2) | GAAP Basis Base Rent(2) | Average Lease Term | Average Capital Cost Per Sq. Ft.(3) | Average Capital Cost per Sq. Ft. per Year (3) | ||||||||||||||||||||||||
New Leases | 53,822 | 10 | $ | 15.03 | $ | 15.17 | 5.4 | $ | 23.91 | $ | 4.44 | |||||||||||||||||||
First Generation New Leases | — | — | — | — | — | — | — | |||||||||||||||||||||||
Second Generation New Leases | 53,822 | 10 | 15.03 | 15.17 | 5.4 | 23.91 | 4.44 | |||||||||||||||||||||||
Renewal Leases | 42,098 | 3 | 12.42 | 12.83 | 3.7 | 2.64 | 0.70 | |||||||||||||||||||||||
Total / Weighted Average | 95,920 | 13 | $ | 13.88 | $ | 14.14 | 4.7 | $ | 14.57 | $ | 3.12 | |||||||||||||||||||
Twelve Months Ended December 31, 2016 | ||||||||||||||||||||||||||||||
Square Footage | Number of Leases Signed | Cash Basis Base Rent(2) | GAAP Basis Base Rent(2) | Average Lease Term | Average Capital Cost Per Sq. Ft.(3) | Average Capital Cost per Sq. Ft. per Year (3) | ||||||||||||||||||||||||
New Leases | 299,013 | 40 | $ | 16.43 | $ | 16.96 | 7.0 | $ | 31.71 | $ | 4.53 | |||||||||||||||||||
First Generation New Leases | 90,709 | 5 | 22.32 | 22.50 | 9.0 | 55.07 | 6.12 | |||||||||||||||||||||||
Second Generation New Leases | 208,304 | 35 | 13.87 | 14.54 | 6.1 | 21.53 | 3.51 | |||||||||||||||||||||||
Renewal Leases | 535,456 | 40 | 12.13 | 12.59 | 3.6 | 8.76 | 2.42 | |||||||||||||||||||||||
Total / Weighted Average | 834,469 | 80 | $ | 13.67 | $ | 14.15 | 4.8 | $ | 16.98 | $ | 3.51 | |||||||||||||||||||
Lease Comparison(1) | ||||||||||||||||||||||||||||||
Comparable Leases Only (4) | ||||||||||||||||||||||||||||||
Three Months Ended December 31, 2016 | ||||||||||||||||||||||||||||||
Cash Basis | GAAP Basis | |||||||||||||||||||||||||||||
Square Footage | Number of Leases Signed | Base Rent(2) | Previous Base Rent(2) | Percent Change | Base Rent(2) | Previous Base Rent(2) | Percent Change | Average Lease Term | ||||||||||||||||||||||
New Leases | 30,489 | 6 | $ | 18.54 | $ | 16.92 | 9.6 | % | $ | 18.56 | $ | 15.54 | 19.4 | % | 5.6 | |||||||||||||||
Renewal Leases | 42,098 | 3 | 12.42 | 12.47 | -0.4 | % | 12.83 | 11.98 | 7.1 | % | 3.7 | |||||||||||||||||||
Total / Weighted Average | 72,587 | 9 | $ | 14.99 | $ | 14.34 | 4.5 | % | $ | 15.24 | $ | 13.48 | 13.1 | % | 4.5 | |||||||||||||||
Twelve Months Ended December 31, 2016 | ||||||||||||||||||||||||||||||
Cash Basis | GAAP Basis | |||||||||||||||||||||||||||||
Square Footage | Number of Leases Signed | Base Rent(2) | Previous Base Rent(2) | Percent Change | Base Rent(2) | Previous Base Rent(2) | Percent Change | Average Lease Term | ||||||||||||||||||||||
New Leases | 99,283 | 14 | $ | 13.91 | $ | 14.81 | -6.1 | % | $ | 14.55 | $ | 14.07 | 3.4 | % | 6.3 | |||||||||||||||
Renewal Leases | 535,456 | 40 | 12.13 | 12.53 | -3.2 | % | 12.59 | 11.78 | 6.9 | % | 3.6 | |||||||||||||||||||
Total / Weighted Average | 634,739 | 54 | $ | 12.41 | $ | 12.88 | -3.7 | % | $ | 12.90 | $ | 12.14 | 6.2 | % | 4.0 | |||||||||||||||
(1) | Excludes any leases that have an extension, or initial term, of less than one year, as well as leasing activity for any time periods in which a property was under contract to be sold. Also excluded is the one-year extension of the Bureau of Prisons at 500 First Street, NW to July 31, 2017, which took place during the second quarter of 2016. |
(2) | Rent amounts are reflected on triple-net equivalent basis, without taking into account rent abatements for the Cash Basis calculation, by deducting estimated operating expense reimbursements that are included, along with base rent, in the contractual payments of our full service leases. |
(3) | The average capital cost includes leasing commissions and tenant improvements, but does not include base building improvements needed to (1) bring a space up to code, (2) create building-standard operating efficiency, or (3) add demising walls and define the separate operations of a suite. |
(4) | Comparable lease comparisons do not include comparable data for first generation spaces or suites that have been vacant for over twelve months. |
36
| Retention Summary (unaudited) | |
Three Months Ended December 31, 2016 (1) | Twelve Months Ended December 31, 2016 (1) | |||||||||||||||||
Square Footage Expiring(2) | Square Footage Renewed | Retention Rate | Square Footage Expiring(2) | Square Footage Renewed | Retention Rate | |||||||||||||
Total Portfolio | 115,779 | 42,098 | 36 | % | 726,230 | 535,456 | 74 | % | ||||||||||
Washington DC | 6,674 | — | 0 | % | 46,295 | 5,154 | 11 | % | ||||||||||
Maryland | 29,729 | 7,111 | 24 | % | 189,554 | 149,470 | 79 | % | ||||||||||
Northern Virginia | 14,498 | 7,098 | 49 | % | 187,553 | 155,659 | 83 | % | ||||||||||
Southern Virginia | 64,878 | 27,889 | 43 | % | 302,828 | 225,173 | 74 | % | ||||||||||
(1) | Excludes any leases that have an extension, or initial term, of less than one year, as well as leasing activity for any time periods in which a property was under contract to be sold. Also excluded is the one-year extension of the Bureau of Prisons at 500 First Street, NW to July 31, 2017, which took place during the second quarter of 2016. |
(2) | Leases that expire or are terminated on the last day of the quarter are classified as leased square footage and are not reported as expired until the following quarter. |
37
| Office Properties (unaudited) | |
Property(1) | Buildings | Location | Strategic Category(2) | Square Feet | Annualized Cash Basis Rent(3) | % Leased | % Occupied | Average Base Rent per Square Foot(3) | |||||||||||||||
Washington DC | |||||||||||||||||||||||
11 Dupont Circle, NW | 1 | CBD(4) | Reposition | 151,144 | $ | 5,086,064 | 88.1 | % | 88.1 | % | $ | 38.22 | |||||||||||
440 First Street, NW | 1 | Capitol Hill | Strategic Hold | 138,603 | 3,856,319 | 81.5 | % | 81.5 | % | 34.15 | |||||||||||||
500 First Street, NW | 1 | Capitol Hill | Reposition | 129,035 | 4,638,171 | 100.0 | % | 100.0 | % | 35.95 | |||||||||||||
840 First Street, NE | 1 | NoMA(4) | Strategic Hold | 248,536 | 7,718,535 | 100.0 | % | 100.0 | % | 31.06 | |||||||||||||
1211 Connecticut Avenue, NW | 1 | CBD(4) | Strategic Hold | 131,665 | 3,705,802 | 92.1 | % | 92.1 | % | 30.56 | |||||||||||||
1401 K Street, NW | 1 | East End | Reposition | 119,283 | 3,155,165 | 79.3 | % | 74.5 | % | 33.36 | |||||||||||||
Total / Weighted Average | 6 | 918,266 | $ | 28,160,056 | 91.4 | % | 90.8 | % | $ | 33.55 | |||||||||||||
Maryland | |||||||||||||||||||||||
Annapolis Business Center | 2 | Annapolis | Non-Core | 101,113 | $ | 1,757,997 | 100.0 | % | 100.0 | % | $ | 17.39 | |||||||||||
Cloverleaf Center | 4 | Germantown | Non-Core | 173,916 | 2,625,632 | 89.8 | % | 89.8 | % | 16.81 | |||||||||||||
Hillside I and II | 2 | Columbia | Strategic Hold | 87,267 | 991,295 | 87.6 | % | 82.3 | % | 12.97 | |||||||||||||
Metro Park North | 4 | Rockville | Non-Core | 191,211 | 2,942,289 | 87.3 | % | 87.3 | % | 17.63 | |||||||||||||
Redland II & III(5) | 2 | Rockville | Strategic Hold | 349,267 | 9,737,236 | 100.0 | % | 100.0 | % | 27.88 | |||||||||||||
Redland I (540 Gaither)(5) | 1 | Rockville | Reposition | 133,895 | 2,710,912 | 100.0 | % | 100.0 | % | 20.25 | |||||||||||||
TenThreeTwenty | 1 | Columbia | Strategic Hold | 138,950 | 2,153,477 | 94.4 | % | 94.4 | % | 16.42 | |||||||||||||
Total / Weighted Average | 16 | 1,175,619 | $ | 22,918,839 | 94.8 | % | 94.5 | % | $ | 20.56 | |||||||||||||
Northern Virginia | |||||||||||||||||||||||
Atlantic Corporate Park | 2 | Sterling | Strategic Hold | 218,250 | $ | 3,964,363 | 96.2 | % | 96.2 | % | $ | 18.89 | |||||||||||
NOVA build-to-suit | 1 | Not Disclosed | Strategic Hold | 167,440 | 4,050,490 | 100.0 | % | 100.0 | % | 24.19 | |||||||||||||
One Fair Oaks(6) | 1 | Fairfax | Non-Core | 214,214 | 5,707,301 | 100.0 | % | 100.0 | % | 26.64 | |||||||||||||
Three Flint Hill | 1 | Oakton | Strategic Hold | 180,699 | 3,713,782 | 97.9 | % | 97.9 | % | 21.00 | |||||||||||||
Wiehle Avenue | 1 | Reston | Strategic Hold | 129,982 | 2,972,585 | 95.5 | % | 95.5 | % | 23.94 | |||||||||||||
Total / Weighted Average | 6 | 910,585 | $ | 20,408,520 | 98.0 | % | 98.0 | % | $ | 22.87 | |||||||||||||
Southern Virginia | |||||||||||||||||||||||
Greenbrier Towers | 2 | Chesapeake | Strategic Hold | 171,766 | $ | 1,948,908 | 90.6 | % | 88.7 | % | $ | 12.52 | |||||||||||
Total / Weighted Average | 30 | 3,176,236 | $ | 73,436,324 | 94.5 | % | 94.1 | % | $ | 24.46 | |||||||||||||
Strategic Category(2) | |||||||||||||||||||||||
Strategic Hold | 15 | 1,962,425 | $ | 44,812,793 | 95.5 | % | 95.1 | % | $ | 23.92 | |||||||||||||
Reposition | 4 | 533,357 | 15,590,311 | 92.0 | % | 90.9 | % | 31.78 | |||||||||||||||
Non-Core | 11 | 680,454 | 13,033,220 | 93.8 | % | 93.8 | % | 20.41 | |||||||||||||||
Total / Weighted Average | 30 | 3,176,236 | $ | 73,436,324 | 94.5 | % | 94.1 | % | $ | 24.46 | |||||||||||||
Unconsolidated Joint Ventures | |||||||||||||||||||||||
1750 H Street, NW | 1 | CBD - DC | 113,131 | $ | 4,123,246 | 94.6 | % | 91.1 | % | $ | 38.54 | ||||||||||||
Aviation Business Park(7) | 3 | Glen Burnie - MD | 120,284 | 1,457,880 | 79.3 | % | 69.8 | % | 15.28 | ||||||||||||||
Prosperity Metro Plaza | 2 | Merrifield - NOVA | 326,197 | 8,815,809 | 100.0 | % | 100.0 | % | 27.03 | ||||||||||||||
Total / Weighted Average | 6 | 559,612 | $ | 14,396,935 | 94.5 | % | 91.7 | % | $ | 27.24 | |||||||||||||
(1) | Does not include space undergoing substantial development or redevelopment. |
(2) | "Strategic Category" reflects management's categorization of the property based on the Strategic Plan. "Strategic Hold" represents properties that are highly aligned with the Strategic Plan. "Reposition" represents strategic hold properties to which we intend to add value through lease-up, development and/or redevelopment. "Non-Core" represents properties that are no longer a strategic fit, properties in submarkets where we do not have asset concentration or operating efficiencies and/or properties where we believe we have maximized value. |
(3) | Annualized cash basis rent at the end of the quarter, which is calculated as the contractual rent due under the terms of the lease, without taking into account rent abatements, is reflected on a triple-net equivalent basis, by deducting estimated operating expense reimbursements that are included, along with base rent, in the contractual payments of our full service leases. This amount differs from Adjusted NOI due to items such as rent abatement, unreimbursed expenses, non-recurring revenues and expenses, differences in leased vs. occupied space, and timing differences related to tenant activity. |
(4) | CBD refers to the Central Business District and NoMa refers to North of Massachusetts Avenue. |
(5) | Redland II & III (520 and 530 Gaither Road) was acquired in November 2010. Redland I (540 Gaither Road) was acquired in October 2013, and is currently fully occupied by the Department of Health and Human Services whose lease will expire on March 22, 2017. The three buildings are collectively referred to as Redland. |
(6) | One Fair Oaks was sold on January 9, 2017. |
(7) | In January 2017, we entered into a binding contract to sell Aviation Business Park and Rivers Park I and II. We anticipate completing the sale in March 2017; however, we can provide no assurances regarding the timing or pricing of such sale, or that such sale will ultimately occur. |
38
| Business Park / Industrial Properties (unaudited) | |
Property(1) | Buildings | Location | Strategic Category(2) | Square Feet | Annualized Cash Basis Rent(3) | % Leased | % Occupied | Average Base Rent per Square Foot(3) | ||||||||||||||
Maryland | ||||||||||||||||||||||
Ammendale Business Park(4) | 7 | Beltsville | Non-Core | 312,846 | $ | 3,698,746 | 80.5 | % | 80.5 | % | $ | 14.69 | ||||||||||
Gateway 270 West | 6 | Clarksburg | Non-Core | 252,295 | 3,242,204 | 92.9 | % | 89.2 | % | 13.84 | ||||||||||||
Snowden Center | 5 | Columbia | Strategic Hold | 145,423 | 2,240,658 | 99.1 | % | 96.5 | % | 15.56 | ||||||||||||
Total / Weighted Average | 18 | 710,564 | $ | 9,181,608 | 88.7 | % | 86.8 | % | $ | 14.57 | ||||||||||||
Northern Virginia | ||||||||||||||||||||||
Plaza 500(5) | 2 | Alexandria | Non-Core | 502,830 | 5,088,841 | 90.5 | % | 90.5 | % | 11.18 | ||||||||||||
Sterling Park Business Center(6) | 7 | Sterling | Non-Core | 472,543 | 4,389,753 | 92.1 | % | 85.4 | % | 10.08 | ||||||||||||
Total / Weighted Average | 9 | 975,373 | $ | 9,478,594 | 91.3 | % | 88.0 | % | $ | 10.64 | ||||||||||||
Southern Virginia | ||||||||||||||||||||||
Battlefield Corporate Center | 1 | Chesapeake | Strategic Hold | 96,720 | $ | 861,036 | 100.0 | % | 100.0 | % | $ | 8.90 | ||||||||||
Crossways Commerce Center(7) | 9 | Chesapeake | Strategic Hold | 1,082,461 | 11,825,177 | 96.1 | % | 94.9 | % | 11.37 | ||||||||||||
Greenbrier Business Park(8) | 4 | Chesapeake | Strategic Hold | 411,237 | 4,568,531 | 94.0 | % | 92.0 | % | 11.82 | ||||||||||||
Norfolk Commerce Park(9) | 3 | Norfolk | Non-Core | 261,674 | 2,716,145 | 96.1 | % | 96.1 | % | 10.80 | ||||||||||||
Total / Weighted Average | 17 | 1,852,092 | $ | 19,970,888 | 95.8 | % | 94.7 | % | $ | 11.25 | ||||||||||||
Total / Weighted Average | 44 | 3,538,029 | $ | 38,631,090 | 93.1 | % | 91.3 | % | $ | 11.72 | ||||||||||||
Strategic Category(2) | ||||||||||||||||||||||
Strategic Hold | 19 | 1,735,841 | $ | 19,495,401 | 96.0 | % | 94.6 | % | $ | 11.69 | ||||||||||||
Reposition | 0 | — | — | NA | NA | NA | ||||||||||||||||
Non-Core | 25 | 1,802,188 | 19,135,689 | 90.3 | % | 88.0 | % | 11.75 | ||||||||||||||
Total / Weighted Average | 44 | 3,538,029 | $ | 38,631,090 | 93.1 | % | 91.3 | % | $ | 11.72 | ||||||||||||
Unconsolidated Joint Ventures | ||||||||||||||||||||||
Rivers Park I and II(10) | 6 | Columbia - MD | 307,984 | $ | 3,710,625 | 82.9 | % | 82.9 | % | $ | 14.54 | |||||||||||
(1) | Does not include space undergoing substantial development or redevelopment. |
(2) | "Strategic Category" reflects management's categorization of the property based on the Strategic Plan. "Strategic Hold" represents properties that are highly aligned with the Strategic Plan. "Reposition" represents strategic hold properties to which we intend to add value through lease-up, development and/or redevelopment. "Non-Core" represents properties that are no longer a strategic fit, properties in submarkets where we do not have asset concentration or operating efficiencies and/or properties where we believe we have maximized value. |
(3) | Annualized cash basis rent at the end of the quarter, which is calculated as the contractual rent due under the terms of the lease, without taking into account rent abatements, is reflected on a triple-net equivalent basis, by deducting estimated operating expense reimbursements that are included, along with base rent, in the contractual payments of our full service leases. This amount differs from Adjusted NOI due to items such as rent abatement, unreimbursed expenses, non-recurring revenues and expenses, differences in leased vs. occupied space, and timing differences related to tenant activity. |
(4) | Ammendale Business Park consists of Ammendale Commerce Center and Indian Creek Court. |
(5) | Plaza 500 is classified as an Industrial property and was sold on February 17, 2017. |
(6) | Sterling Park Business Center consists of 22370/22400/22446/22455 Davis Drive and 403/405/22560 Glenn Drive. |
(7) | Crossways Commerce Center consists of the Coast Guard Building, Crossways Commerce Center I, Crossways Commerce Center II, Crossways Commerce Center IV, Crossways I, Crossways II, and 1434 Crossways Boulevard. |
(8) | Greenbrier Business Park consists of Greenbrier Technology Center I, Greenbrier Technology Center II and Greenbrier Circle Corporate Center. |
(9) | Norfolk Commerce Park consists of Norfolk Business Center, Norfolk Commerce Park II and Gateway II. |
(10) | In January 2017, we entered into a binding contract to sell Rivers Park I and II and Aviation Business Park. We anticipate completing the sale in March 2017; however, we can provide no assurances regarding the timing or pricing of such sale, or that such sale will ultimately occur. |
39
| Management Statements on Non-GAAP Supplemental Measures | |
Investors and analysts following the real estate industry utilize FFO, Core FFO, net operating income ("NOI"), Same Property NOI, earnings before interest, taxes, depreciation and amortization ("EBITDA"), Adjusted EBITDA and adjusted funds from operations ("AFFO"), variously defined, as supplemental performance measures. We believe NOI, Same Property NOI, EBITDA, Adjusted EBITDA, FFO, Core FFO and AFFO are appropriate measures given their wide use by and relevance to investors and analysts. FFO and Core FFO, reflecting the assumption that real estate asset values rise or fall with market conditions, principally adjust for the effects of GAAP depreciation/amortization, gains/losses on sale and impairments of real estate assets. NOI provides a measure of rental operations and does not factor in depreciation/amortization and non-property specific expenses such as general and administrative expenses. EBITDA and Adjusted EBITDA provide performance metrics that adjust for the effects of non-property operating expenses, such as depreciation/amortization and interest expense. In addition, FFO, NOI and EBITDA are commonly used in various ratios, pricing multiples/yields and returns and valuation calculations used to measure financial position, performance and value.
NOI
We believe net operating income (“NOI”) is a useful measure of our property operating performance. We define NOI as property revenues (rental, and tenant reimbursements and other revenues) less property operating expenses (property operating, and real estate taxes and insurance expenses). Other REITs may use different methodologies for calculating NOI, and accordingly, our NOI may not be comparable to other REITs.
Since NOI excludes general and administrative expenses, interest expense, depreciation and amortization, gains and losses from property dispositions, discontinued operations and extraordinary items, it provides a performance measure that, when compared year over year, reflects the revenues and expenses directly associated with owning and operating commercial real estate properties and the impact to operations from trends in occupancy rates, rental rates and operating costs, providing perspective not immediately apparent from net income. We use NOI to evaluate our operating performance since NOI allows us to evaluate the impact that factors such as occupancy levels, lease structure, lease rates and tenant base have on our results, margins and returns. In addition, we believe that NOI provides useful information to the investment community about our property and operating performance when compared to other REITs since NOI is generally recognized as a standard measure of property performance in the real estate industry. However, NOI should not be viewed as a measure of our overall financial performance since it does not reflect general and administrative expenses, interest expense, depreciation and amortization costs, the level of capital expenditures and leasing costs necessary to maintain the operating performance of our properties. Our NOI calculations are reconciled to net (loss) income in this release.
On our Net Asset Value Analysis page, we provide an Adjusted NOI figure, which is our total revenues calculated in accordance with GAAP, less property operating expenses, real estate taxes and insurance expenses, straight-line rents and the amortization of lease incentives, rent abatements and deferred market rents. We also, adjust for properties that were sold or classified as held-for-sale at the end of the current period, and did not have their operating results classified as held-for-sale for the period presented. Also, Adjusted NOI reflects a reduction in revenue related to the impact of accelerating tenant improvement reimbursement revenue recognized for the NOVA build-to-suit. The presentation on our Net Asset Value Analysis page reconciles our total revenues, which can be derived from our consolidated statement of operations for the current quarter, to Adjusted NOI. However, Adjusted NOI is not indicative of future results and should not be used in place of net income calculated in accordance with GAAP. Further, we provide an Adjusted NOI figure that reflects our proportionate share of Adjusted NOI from our unconsolidated joint ventures. For a reconciliation of Adjusted NOI from our unconsolidated joint ventures to equity in earnings from affiliates, see Investment in Joint Ventures.
SAME PROPERTY NOI
Same Property Net Operating Income (“Same Property NOI”), defined as property revenues (rental and tenant reimbursements and other revenues) less property operating expenses (real estate taxes, property operating and insurance expenses) from the consolidated properties owned by us and in-service for the entirety of the periods presented, is a primary performance measure we use to assess the results of operations at our properties. Same Property NOI is a non-GAAP measure. As an indication of our operating performance, Same Property NOI should not be considered an alternative to net income calculated in accordance with GAAP. A reconciliation of our Same Property NOI to net (loss) income is presented below. The Same Property NOI results exclude the collection of termination fees, as these items vary significantly period-over-period, thus impacting trends and comparability. Also, Same Property NOI includes a normalized management fee percentage in lieu of an administrative overhead allocation for comparative purposes. We eliminate depreciation and amortization expense, which are property level expenses, in computing Same Property NOI as these are non-cash expenses that are based on historical cost accounting assumptions and management believes these expenses do not offer the investor significant insight into the operations of the property. This presentation allows management and investors to determine whether growth or declines in net operating income are a result of increases or decreases in property operations or the acquisition or disposition of additional properties. While this presentation provides useful information to management and investors, the results below should be read in conjunction with the results from the consolidated statements of operations to provide a complete depiction of our total performance.
EBITDA
EBITDA is defined as earnings before interest, taxes, depreciation and amortization. We consider EBITDA to be an appropriate supplemental performance measure since it represents earnings prior to the impact of depreciation, amortization, gain (loss) from property dispositions and gains or losses on retirement of debt. This calculation facilitates the review of income from operations without considering the effect of non-cash depreciation and amortization or the cost of debt.
Adjusted EBITDA
We believe Adjusted EBITDA is a useful measure of our operating performance. The calculation of EBITDA includes certain items, such as loss on debt extinguishment, impairment to rental property and gain on the sale of property, that impact the comparability of period-over-period results. Our presentation of Adjusted EBITDA should not be considered as an alternative to net income (computed in accordance with GAAP) as an indicator of our financial performance. Our Adjusted EBITDA calculations are reconciled to net income (loss) in this release.
FFO
FFO, which is a non-GAAP measure used by many investors and analysts that follow the public real estate industry, represents net income (computed in accordance with U.S. generally accepted accounting principles (“GAAP”)), excluding gains (losses) on sales of rental property and impairments of rental property, plus real estate-related depreciation and amortization and after adjustments for unconsolidated partnerships and joint ventures. We also exclude from our FFO calculation, the impact related to third parties from our consolidated joint venture. FFO available to common shareholders and unitholders is calculated as FFO less accumulated dividends on our preferred shares for the applicable periods presented. We compute FFO in accordance with standards established by the National Association of Real Estate Investment Trusts (“NAREIT”), which may differ from the methodology for calculating FFO, or similarly titled measures, utilized by other equity REITs and, accordingly, may not be comparable to such other REITs.
40
| Management Statements on Non-GAAP Supplemental Measures | |
We consider FFO and FFO available to common shareholders and unitholders useful measures of performance for an equity real estate investment trust (“REIT”) as they facilitate an understanding of the operating performance of our properties without giving effect to real estate depreciation and amortization, which assume that the value of rental property diminishes predictably over time. Since real estate values have historically risen or fallen with market conditions, we believe that FFO provides a meaningful indication of our performance. We also consider FFO an appropriate supplemental performance measure given its wide use by investors and analysts. However, FFO does not represent amounts available for our discretionary use because of needed capital replacement or expansion, debt service obligations or other commitments and uncertainties, nor is it indicative of funds available to fund our cash needs, including our ability to make distributions. Our methodology for computing FFO adds back noncontrolling interests in the income from our Operating Partnership in determining FFO. We believe this is appropriate as common Operating Partnership units are presented on an as-converted, one-for-one basis for shares of stock in determining FFO per diluted share.
Our presentation of FFO in accordance with NAREIT’s definition should not be considered as an alternative to net (loss) income attributable to common shareholders (computed in accordance with GAAP) as an indicator of our financial performance.
CORE FFO
We believe that the computation of FFO in accordance with NAREIT’s definition includes certain items that are not indicative of the results provided by our operating portfolio and affect the comparability of our period-over-period performance. These items include, but are not limited to, gains and losses on the retirement of debt, personnel separation costs, contingent consideration charges, acceleration of deferred abatement and straight-line amortization, gains on the receipt of yield maintenance payments from the prepayment of a note receivable and acquisition costs. Core FFO is presented less accumulated dividends on our preferred shares for all the periods presented.
Our presentation of Core FFO should not be considered as an alternative to net income attributable to common shareholders (computed in accordance with GAAP) as an indicator of our financial performance. Our FFO and Core FFO calculations are reconciled to net (loss) income attributable to common shareholders in this release.
41