Attached files
| file | filename |
|---|---|
| EX-32.1 - EXHIBIT 32.1 - CABELAS INC | exhibit321q42016.htm |
| EX-31.2 - EXHIBIT 31.2 - CABELAS INC | exhibit312q42016.htm |
| EX-31.1 - EXHIBIT 31.1 - CABELAS INC | exhibit311q42016.htm |
| EX-24.1 - EXHIBIT 24.1 - CABELAS INC | exhibit241q42016.htm |
| EX-23.1 - EXHIBIT 23.1 - CABELAS INC | exhibit231q42016.htm |
| EX-21.1 - EXHIBIT 21.1 - CABELAS INC | exhibit211q42016.htm |
UNITED STATES
SECURITIES AND EXCHANGE COMMISSION
Washington, D. C. 20549
Form 10-K
_________________
(Mark One)
x ANNUAL REPORT PURSUANT TO SECTION 13 OR 15(d) OF THE SECURITIES EXCHANGE ACT OF 1934
For the fiscal year ended December 31, 2016
OR
o TRANSITION REPORT PURSUANT TO SECTION 13 OR 15(d) OF THE SECURITIES EXCHANGE ACT OF 1934
Commission File Number: 1-32227
CABELA’S INCORPORATED
(Exact name of registrant as specified in its charter)
Delaware | 20-0486586 | |
(State or other jurisdiction of | (I.R.S. Employer | |
incorporation or organization) | Identification Number) | |
One Cabela Drive, Sidney, Nebraska | 69160 | |
(Address of principal executive offices) | (Zip Code) | |
Registrant’s telephone number, including area code: (308) 254-5505
Securities registered pursuant to Section 12 (b) of the Act:
Title of each class | Name of each exchange on which registered | |
Class A Common Stock, par value $0.01 per share | New York Stock Exchange | |
Securities registered pursuant to Section 12 (g) of the Act: None
Indicate by check mark if the registrant is a well-known seasoned issuer, as defined in Rule 405 of the Securities Act. Yes x No o
Indicate by check mark if the registrant is not required to file reports pursuant to Section 13 or 15(d) of the Act. Yes o No x
Indicate by check mark whether the registrant (1) has filed all reports required to be filed by Section 13 or 15(d) of the Securities Exchange Act of 1934 during the preceding 12 months (or for such shorter period that the registrant was required to file such reports), and (2) has been subject to such filing requirements for the past 90 days. Yes x No o
Indicate by check mark whether the registrant has submitted electronically and posted on its corporate Web site, if any, every Interactive Data File required to be submitted and posted pursuant to Rule 405 of Regulation S-T (§232.405 of this chapter) during the preceding 12 months (or for such shorter period that the registrant was required to submit and post such files). Yes x No o
Indicate by check mark if disclosure of delinquent filers pursuant to Item 405 of Regulation S-K (§229.405 of this chapter) is not contained herein, and will not be contained, to the best of the registrant’s knowledge, in definitive proxy or information statements incorporated by reference in Part III of this Form 10-K or any amendment to this Form 10-K. x
Indicate by check mark whether the registrant is a large accelerated filer, an accelerated filer, a non-accelerated filer, or a smaller reporting company. See the definitions of “large accelerated filer,” “accelerated filer” and “smaller reporting company” in Rule 12b-2 of the Exchange Act.
Large accelerated filer x | Accelerated filer o |
Non-accelerated filer o (Do not check if a smaller reporting company) | Smaller reporting company o |
Indicate by check mark whether the registrant is a shell company (as defined in Rule 12b-2 of the Act). Yes o No x
The aggregate market value of the voting common equity held by non-affiliates of the registrant was approximately $1,404,776,989 as of July 2, 2016 (the last business day of the registrant’s most recently completed second fiscal quarter), based upon the closing price of the registrant’s Class A Common Stock on that date as reported on the New York Stock Exchange.
Indicate the number of shares outstanding of each of the registrant’s classes of common stock, as of the latest practicable date.
Common stock, $0.01 par value: 68,518,091 shares as of February 13, 2017.
Special Note Regarding Forward-Looking Statements
Cabela’s Incorporated and its wholly-owned subsidiaries are referred to herein as “Cabela’s,” “Company,” “we,” “our,” or “us.” This report contains “forward-looking statements” that are based on our beliefs, assumptions, and expectations of future events, taking into account the information currently available to us. All statements other than statements of current or historical fact contained in this report are forward-looking statements within the meaning of the Private Securities Litigation Reform Act. The words “believe,” “may,” “should,” “anticipate,” “estimate,” “expect,” “intend,” “objective,” “seek,” “plan,” “confident,” and similar statements are intended to identify forward-looking statements. Forward-looking statements involve risks and uncertainties that may cause our actual results, performance, or financial condition to differ materially from the expectations of future results, performance, or financial condition we express or imply in any forward-looking statements. These risks and uncertainties include, but are not limited to:
• | the satisfaction of the conditions precedent to the consummation of the proposed merger by and among Bass Pro Group, LLC, Prairie Merger Sub, Inc., a wholly owned subsidiary of Bass Pro Group, LLC, and the Company, including, without limitation, the receipt of stockholder and regulatory approvals, including as a result of the inability of Capital One, National Association, to timely obtain regulatory approvals for its consummation of its purchase of World’s Foremost Bank; |
• | unanticipated difficulties or expenditures relating to the proposed merger; legal proceedings, judgments, or settlements, including those that may be instituted against the Company, the Company’s board of directors, executive officers, and others following the announcement of the proposed merger; disruptions of current plans and operations caused by the announcement and pendency of the proposed merger; potential difficulties in employee retention due to the announcement and pendency of the proposed merger; the response of customers, suppliers, business partners, and regulators to the announcement of the proposed merger; |
• | the state of the economy and the level of discretionary consumer spending, including changes in consumer preferences, demand for firearms and ammunition, and demographic trends; |
• | adverse changes in the capital and credit markets or the availability of capital and credit; |
• | our ability to successfully execute our omni-channel strategy; |
• | increasing competition in the outdoor sporting goods industry and for credit card products and reward programs; |
• | the cost of our products, including increases in fuel prices; |
• | the availability of our products due to political or financial instability in countries where the goods we sell are manufactured; |
• | supply and delivery shortages or interruptions, and other interruptions or disruptions to our systems, processes, or controls, caused by system changes or other factors; |
• | increased or adverse government regulations, including regulations relating to firearms and ammunition; |
• | our ability to protect our brand, intellectual property, and reputation; |
• | our ability to prevent cybersecurity breaches and mitigate cybersecurity risks; |
• | the outcome of litigation, administrative, and/or regulatory matters (including the ongoing audits by tax authorities and compliance examinations by the Federal Deposit Insurance Corporation); |
• | our ability to manage credit, liquidity, interest rate, operational, legal, regulatory capital, and compliance risks; |
• | our ability to increase credit card receivables while managing credit quality; |
• | our ability to securitize our credit card receivables at acceptable rates or access the deposits market at acceptable rates; |
• | the impact of legislation, regulation, and supervisory regulatory actions in the financial services industry; and |
• | other risks, relevant factors, and uncertainties identified in the “Risk Factors” section of this report. |
Given the risks and uncertainties surrounding forward-looking statements, you should not place undue reliance on these statements. Our forward-looking statements speak only as of the date of this report. Other than as required by law, we undertake no obligation to update or revise forward-looking statements, whether as a result of new information, future events, or otherwise.
2
CABELA’S INCORPORATED
FORM 10-K
FOR THE FISCAL YEAR ENDED DECEMBER 31, 2016
TABLE OF CONTENTS
PART I | Page | |
Item 1. | Business | |
Item 1A. | Risk Factors | |
Item 1B. | Unresolved Staff Comments | |
Item 2. | Properties | |
Item 3. | Legal Proceedings | |
Item 4. | Mine Safety Disclosures | |
PART II | ||
Item 5. | Market for Registrant’s Common Equity, Related Stockholder Matters and Issuer Purchases of Equity Securities | |
Item 6. | Selected Financial Data | |
Item 7. | Management’s Discussion and Analysis of Financial Condition and Results of Operations | |
Item 7A. | Quantitative and Qualitative Disclosures About Market Risk | |
Item 8. | Financial Statements and Supplementary Data | |
Item 9. | Changes in and Disagreements With Accountants on Accounting and Financial Disclosure | |
Item 9A. | Controls and Procedures | |
Item 9B. | Other Information | |
PART III | ||
Item 10. | Directors, Executive Officers and Corporate Governance | |
Item 11. | Executive Compensation | |
Item 12. | Security Ownership of Certain Beneficial Owners and Management and Related Stockholder Matters | |
Item 13. | Certain Relationships and Related Transactions, and Director Independence | |
Item 14. | Principal Accounting Fees and Services | |
PART IV | ||
Item 15. | Exhibits, Financial Statement Schedules | |
SIGNATURES | ||
3
PART I
ITEM 1. BUSINESS
Recent Developments
On October 3, 2016, the Company entered into an Agreement and Plan of Merger (the “Merger Agreement”), by and among Bass Pro Group, LLC, a Delaware limited liability company (“Bass Pro Group”), Prairie Merger Sub, Inc., a Delaware corporation and a wholly owned subsidiary of Bass Pro Group (“Sub”), and the Company. The Merger Agreement provides for the merger of Sub with and into the Company, on the terms and subject to the conditions set forth in the Merger Agreement (the “Merger”), with the Company continuing as the surviving corporation in the Merger. As a result of the Merger, the Company would become a wholly owned subsidiary of Bass Pro Group. In connection with the entry into the Merger Agreement, the Company also entered into a Sale and Purchase Agreement, dated as of October 3, 2016 (the “Bank Purchase Agreement”), by and among the Company, World’s Foremost Bank (“WFB,” “Financial Services segment,” or “Cabela’s CLUB”), and Capital One, National Association (“Capital One”) relating to the assets of WFB. The Bank Purchase Agreement provides for, in connection with the closing of the Merger, the sale to Capital One of the business of WFB, which includes the credit card program operated by the Company, using WFB as the issuer (the “Bank Transaction”).
For additional information related to the Merger Agreement, the Bank Purchase Agreement, and related transactions, refer to Item 1A, “Risk Factors” – “Risk Factors Related to the Proposed Merger with Bass Pro Group, LLC and the Related Bank Transaction,” our Current Reports on Form 8-K filed with the SEC on October 7, 2016, November 29, 2016, and December 30, 2016, and subsequent filings, and Note 2 “Merger Agreement” of the Notes to Consolidated Financial Statements.
Overview
We are a leading specialty omni-channel retailer of hunting, fishing, camping, shooting sports, and related outdoor merchandise. Since our founding in 1961, Cabela’s® has become one of the most well-known outdoor recreation brands in the world, and we have long been recognized as the “World’s Foremost Outfitter®.” We believe we offer the widest and most distinctive selection of high-quality outdoor products at competitive prices. We provide a superior quality of service to our customers who are able to access our multiple channels when making a purchase, including retail stores, online, and mobile channels. We supply our customers products through our multi-channel merchandising distribution network consisting of in-store customer pickup or by direct shipment to the customer from one of our distribution centers, retail stores, or vendor drop-ship. We also issue the Cabela’s CLUB® Visa credit card, which serves as our primary customer loyalty rewards program. Cabela’s CLUB plays an integral role in supporting our merchandising business.
Effective the beginning of fiscal year 2016, we realigned our organizational structure and updated our reportable operating segments into two segments - Merchandising and Financial Services. Results of operations for fiscal years 2015 and 2014 have been recast to reflect these new segments and are presented in our “Management’s Discussion and Analysis of Financial Condition and Results of Operations,” presented herein, and in Note 23 “Segment Reporting” of the Notes to Consolidated Financial Statements. For additional financial information regarding our Merchandising and Financial Services business segments and on this change in segments see Note 23 “Segment Reporting” of the Notes to Consolidated Financial Statements.
Merchandising Business
At the end of 2016, we operated 85 retail stores, 74 stores in 36 states and 11 stores in six provinces of Canada. During 2016, we opened eight retail stores, six stores in the United States and two in Canada. The opening of these retail stores increased our total retail square footage to 8.5 million at the end of 2016, up 7% over 2015.
Our Merchandising segment generated revenue of $3.6 billion in 2016 compared to $3.5 billion in 2015. During 2016, retail store sales totaled $2.8 billion, or 78.3%, of total merchandise revenue and Internet and catalog sales totaled $772 million, or 21.7%, of total merchandise revenue compared to 2015, which consisted of 53 weeks, with retail store sales of $2.7 billion, or 76.4%, and Internet and catalog sales of $823 million, or 23.6 %, of total merchandise revenue. The impact of the 53rd week in 2015 was to increase total revenue and revenue from our Merchandising segment by $84 million.
Retail Store Formats. Our retail store concept is designed to appeal to customers from a broad geographic and demographic range. Our retail stores range in size from 40,000 to 246,000 square feet. We have two basic store formats, one which is our large-format traditional retail stores that were opened in August 2008 and earlier and offer a tourist-type experience. We have 28 of these large-format stores that we refer to as our legacy stores.
4
Our current store format, with more standardized store sizes, expedites store development time and allows us to pursue the best retail locations, is adaptable to more markets, improves time to market, and allows us to be more efficient in our operations by reducing our capital investment requirements and increasing sales per square foot. We have 57 of these new format stores that range in size from approximately 40,000 to 100,000 square feet. The flexibility in the size of this format allows us to serve both large and small markets with large concentrations of Cabela’s customers.
Retail Store Expansion and Innovation. Our strategy of new store growth is primarily focused on the location of new stores strategically sized to match their markets. We consider the impact of larger market locations with an established competitor as well as the increased competition in urban markets in determining the size of a new store, its location, and the flexibility in its layout to appeal to customers. We believe it is imperative to continue innovating how we select, design, and build our retail stores, while applying best-in-class omni-channel retail practices to improve customer experience and reduce expenses from groundbreaking to grand opening. Ongoing efforts are using learnings from our legacy in destination retail, our extensive internal customer analytics capabilities, and relationships with external partners and industry leaders to triangulate solutions that will satisfy customers and shareholders. The new format stores, on average, generate a higher profit per square foot compared to the legacy store base. We expect that the planned openings of future stores will continue, on average, to generate a higher profit per square foot compared to our legacy store base. The new stores allow us to enter a broader choice of markets with our goal to have a store model that is more predictable in order to maximize sales, margins, cash flows, and an acceptable return on invested capital.
We are currently evaluating store locations and new stores to open beyond 2016, but we plan to open fewer stores than we have in the recent past. As of the date of this filing, we have announced plans to open six new stores located in Gainesville, Virginia; Halifax, Nova Scotia, Canada; McDonough, Georgia; Albuquerque, New Mexico; Chesterfield Township, Michigan; and El Paso, Texas. These six new stores will have total retail square footage of approximately 400,000.
Store Locations and Ownership. We own 78 of our 85 retail stores, with 24 stores subject to ground leases. In connection with some of the economic development packages received from state or local governments where our stores are located, we have entered into agreements granting ownership of the taxidermy, diorama, or other portions of our stores to these state and local governments. Refer to Item 2 – “Properties” for additional information on our stores.
Internet and Catalog Business. The Internet and catalog business sells products through our e-commerce websites (Cabelas.com and Cabelas.ca), mobile devices, and print catalog distributions. We believe that mobile marketing and social networking technologies will continue to build our brand, build our customer database, and enhance the management of contacts with our customers. The amount of traffic coming through mobile devices is growing significantly. We continue to improve our customers' digital shopping experiences on Cabelas.com and via mobile devices as we strive to provide a best-in-class level of service to our customers. Our marketing focus continues to be on developing a seamless omni-channel experience for our customers regardless of their transaction channel. Our digital transformation continues with efforts around enhancing our website to support the Internet and catalog business. Cabelas.com and the mobile website run off a single operating platform, allowing us to manage the desktop and mobile sites using one system. Our omni-channel marketing efforts and retail store growth, as well as successes in our social marketing initiatives, are resulting in increased customer engagement across multiple channels and a more consistent experience across all channels.
Our Cabelas.com website is a cost-effective medium designed to offer a convenient, highly visual, user-friendly, and secure online shopping option for new and existing customers. In addition to the ability to order the same products available in our catalogs, our website gives customers the ability to review product information, purchase gift certificates, research general information on the outdoor lifestyle and outdoor activities, provide product reviews and read product reviews by other customers to assist in making buying decisions, purchase highly specialized merchandise, and choose from other services we provide. Cabelas.com continues to be the most visited website in the sporting goods industry according to Hitwise, Inc., an online measurement company.
We intend to expand our drop-ship sales program from our 2016 levels through our high traffic website, which will increase the exposure of national brands, provide low risk expansion of product lines, and provide faster distribution of products. Our drop-ship sales program requires no inventory investment and delivers the shopping experience customers trust from Cabela’s.
5
We have transformed our legacy catalog business into an omni-channel enterprise supporting new emerging digital technologies, e-commerce, and mobile capabilities while optimizing the customer experience with our growing retail footprint. We use our customer database to ensure that customers receive catalogs matching their merchandise preferences and to cross-sell merchandise to existing customers. We use the catalogs to prompt customers to go to retail stores and our website or to our call centers to place orders directly. We have continued to refine our catalog strategy toward specialty catalogs, micro-season catalogs, and smaller catalogs with more seasonal themes or focusing on one specific outdoor activity.
Financial Services Business
Our Financial Services segment provides customers with a rewards program that enhances revenue, operating profitability, and customer loyalty in our Merchandising segment. Through WFB, our wholly-owned bank subsidiary, we issue and manage the Cabela’s CLUB Visa credit card, a rewards based credit card program. We believe the Cabela’s CLUB Visa credit card loyalty rewards program is an effective vehicle for strengthening our relationships with our customers, enhancing our brand name, and increasing our merchandise revenue. Our rewards program is a simple loyalty program that allows customers to earn points whenever and wherever they use their Cabela’s CLUB Visa credit card and then redeem earned points for products and services through our merchandising business. The percentage of our merchandise sold to customers using the Cabela’s CLUB Visa credit card, including the redemption of points, was 30% for 2016.
WFB is a special purpose Nebraska state-chartered bank, insured by the Federal Deposit Insurance Corporation (“FDIC”), which is limited to issuing only consumer credit cards and certificates of deposit of one hundred thousand dollars or more. During 2016, we had an average of 2,064,517 active credit card accounts with an average balance of $2,480 compared to an average of 1,940,534 active credit card accounts with an average balance of $2,301 during 2015. We define an active credit card account as any account with an outstanding debit or credit balance at the end of any respective month during the past 12 months.
Cabela’s CLUB Marketing. We have a low cost, efficient, and tailored credit card marketing program that leverages the Cabela’s brand name. We market the Cabela’s CLUB Visa credit card through a number of channels, including retail stores, our website, inbound telemarketing, and our catalogs. Our customers can apply for the Cabela’s CLUB Visa credit card at our retail stores and website through our instant credit process and, if approved, receive reward points available for use on merchandise purchases the same day. When a customer’s application is approved through the retail store instant credit process, the customer’s new credit card is produced and given to the customer immediately thereafter. Maintaining the growth of our credit card program, while continuing to underwrite high-quality customers, actively manage our credit card delinquencies and charge-offs, and provide exclusive experiences is key to the successful performance of our Financial Services segment. The growth of Cabela’s CLUB program is dependent, in part, on the success of our merchandising business to generate additional sales and to attract additional Cabela’s CLUB customers.
Underwriting and Credit Criteria. We underwrite high-quality credit customers and have historically maintained attractive credit statistics compared to industry averages. The scores of Fair Isaac Corporation (“FICO”) are a widely-used financial metric for assessing a person’s credit rating. Our credit cardholders had a median FICO score of 793 at the end of 2016 compared to 794 at the end of 2015. We believe the median FICO scores of our cardholders are well above the industry average. Our net charge-offs as a percentage of total outstanding balances were 2.35% in 2016, compared to 1.70% in 2015 and 1.69% in 2014. Refer to “Asset Quality of Cabela’s CLUB” for additional information regarding our credit card loan charge-offs and delinquencies on our credit card loans.
Products and Merchandising
We offer our customers a comprehensive selection of high-quality, competitively priced, national and regional brand products, including our own Cabela’s brand. Our product assortment includes merchandise and equipment for hunting, fishing, marine use, camping, and recreational sport shooting, along with casual and outdoor apparel and footwear, optics, vehicle accessories, and gifts and home furnishings with an outdoor theme.
6
The following table sets forth the percentage of our merchandise revenue contributed by major product categories for our Merchandising segment for the last three years.
2016 | 2015 | 2014 | ||||||
Hunting Equipment | 48.1 | % | 45.5 | % | 44.3 | % | ||
General Outdoors | 30.9 | 31.2 | 30.3 | |||||
Clothing and Footwear | 21.0 | 23.3 | 25.4 | |||||
Total | 100.0 | % | 100.0 | % | 100.0 | % | ||
Hunting Equipment. The hunting equipment merchandise category includes a wide variety of firearms, ammunition, optics, archery products, and related accessories and supplies for almost every type of hunting and recreational sport shooting. Our hunting equipment products are supported by in-house services such as gun bore sighting, scope mounting, and bow tuning to serve the complete needs of our customers.
General Outdoors. The general outdoors merchandise category includes a full range of equipment and accessories supporting all outdoor activities, including all types of fishing and tackle products; a wide selection of boats, electronics, and marine accessories and equipment; camping gear and equipment for various experience levels of outdoor enthusiasts; food preparation and outdoor cooking products; all-terrain vehicles and accessories for automobiles and all-terrain vehicles; and gifts and home furnishings.
Clothing and Footwear. The clothing and footwear merchandise category includes fieldwear apparel and footwear, sportswear apparel and footwear, including technical gear for the active outdoor enthusiast, apparel and footwear for the casual customer, and workwear products.
Cabela’s Branded Products. In addition to national brands, we offer our exclusive Cabela’s branded merchandise. Sales of our branded merchandise are included in the preceding table that shows the percentage of merchandise revenue contributed by major product categories for our Merchandising segment and in total. We have a significant penetration of Cabela’s branded merchandise in casual apparel and footwear as well as in selected hard goods categories such as camping, fishing, and optics. Where possible, we seek to protect our Cabela’s branded products by applying for trademark or patent protection for these products. Our Cabela’s branded products typically generate higher gross profit margins compared to our other branded products. Our Cabela’s branded merchandise accounted for approximately 23% of our merchandise revenue in 2016. By having an appropriate mix of Cabela’s branded and other branded merchandise, we strive to meet the expectations and needs of our customers and expand the recognition of the Cabela’s brand.
Marketing
We seek to increase the amount each customer spends on our merchandise through enhanced customer targeting, expanded use of digital marketing channels in mobile marketing and social networking and other technology-based approaches, the development and marketing of new products, and continued focus on specialty catalogs. Our Cabela’s brand platform “It’s In Your Nature,” creates a connection between us and our customers by focusing on our common appreciation for the outdoors. We have taken advantage of web-based technologies such as targeted promotional e-mails, online shopping engines, and Internet affiliate programs to renew efforts in local markets and to increase sales. We also have continued to improve our customer relationship management system, which allows us to better manage our customer relationships and more effectively tailor our marketing programs. We will continue to capture additional customer purchase history and information through retail store growth.
In addition to the use of our website and our catalogs, we use a combination of promotional events, traditional advertising, and media programs as marketing tools. We engage in certain promotional activities by sponsoring sportsmen and women advocacy groups and wildlife conservation organizations, as well as regional and local events and organizations. We also provide sponsorship of fishing tournaments and other related habitat and wildlife conservation activities. We have historically received extensive local publicity from the unique Cabela’s shopping experience when we open a new store. As we enter into larger metropolitan markets, where the opening of a Cabela’s store may not be major news, we supplement any publicity with additional advertising to increase consumer awareness of new store openings.
7
Competition
We compete in a number of large and highly competitive markets, including the outdoor recreation and casual apparel and footwear markets. The outdoor recreation market is comprised of several categories, including hunting, fishing, camping, and wildlife watching, and we believe it crosses over a wide range of geographic and demographic segments. We compete directly or indirectly with other broad-line merchants, large-format sporting goods stores and chains, mass merchandisers, warehouse clubs, discount and department stores, small specialty retailers, and catalog and Internet-based retailers.
We believe that we compete effectively with our competitors on the basis of our wide and distinctive merchandise selection, our strong credit card loyalty rewards program for our customers, the superior customer service we offer our customers, and the quality associated with the Cabela’s brand, as well as our commitment to understanding and providing merchandise that is relevant to our targeted customer base. We cater to the outdoor enthusiast and the casual customer, and believe we have an appealing and inspiring store environment. We also believe that our omni-channel model enhances our ability to compete by allowing our customers to choose the most convenient medium to interact and transact with us. This model also allows us to reach a broader audience in existing and new markets and to continue to build on our internationally recognized Cabela’s brand.
Customer Service
Since our founding in 1961, we have been deeply committed to serving our customers by selling high-quality products through outfitters who deliver excellent customer service and in-depth product knowledge. We strive to provide superior customer service at the time of sale and after the sale. In order to better serve our customers, we continue focusing our efforts on offering customers integrated opportunities to access and use our retail stores, web and social media channels, and catalogs. Our customers have access to well-trained, friendly, and knowledgeable outfitters to answer product use and merchandise selection questions. We believe our ability to establish and maintain long-term relationships with our customers and encourage repeat visits and purchases is due, in part, to the strength of our customer support, product information, and service operations.
Our omni-channel model employs the same merchandising team, distribution centers, customer database, and infrastructure, which we continue to leverage by building on the strengths of each channel. Customer service venues include in-store pick-up for website orders, in-store Cabela’s website kiosks, and catalog order desks. Our in-store kiosks provide our customers access to our entire inventory assortment, allowing customers to place orders for items that may be out of stock in our retail stores or to purchase items only available on our website. Our in-store pick-up program allows customers to order products through our website and catalogs and have them delivered without incurring shipping costs to the retail store of their choice, which increases traffic to our stores. In addition, our retail stores introduce customers to our website and catalog channels.
Distribution and Fulfillment
We operate distribution centers in Sidney, Nebraska; Prairie du Chien, Wisconsin; Wheeling, West Virginia; Tooele, Utah; and Puyallup, Washington. These distribution centers comprise approximately 3.7 million square feet of warehouse space for our retail store replenishment and Internet and catalog business activities. In November 2015, we opened a 98,000 square foot distribution center located in Puyallup, Washington, which is near Tacoma, Washington. This leased facility allowed us to eliminate third party warehousing services on the west coast beginning in January 2016, and to timely prioritize in-bound international freight destined for our inland distribution centers and stores, which has increased our internal service levels and delivered our products throughout our network more efficiently. Our merchandise distribution in Canada is processed by a third-party logistics provider through a leased facility in Calgary, Alberta, Canada.
We ship merchandise to our Internet and catalog business customers via United Parcel Service, Federal Express, Canada Post, and the United States Postal Service. We use common carriers and typically deliver inventory two to three times per week for replenishment of our retail stores. We also operate a merchandise return center in Oshkosh, Nebraska.
We have added our retail stores to our distribution network through the omni-channel fulfillment process, so customers who order through our call centers or website are no longer solely dependent upon the stock we have in our distribution centers. We now ship products to our customers from both our distribution centers and our retail stores. In-store pick-up services are also available at our distribution center in Tooele, Utah.
8
Information Technology Systems
Our information technology and operational systems are an integral function of our Merchandising and Financial Services business segments. Our information is processed in a secure environment to protect both the physical assets and the actual data from security breaches and cyber attacks. These systems are designed to process customer orders, track customer data and demographics, order, monitor, and maintain sufficient amounts of inventory, facilitate vendor transactions, and provide financial reporting. We continually evaluate, modify, and update our information technology systems supporting our supply chain, including our design, sourcing, merchandise planning, forecasting and purchase order, inventory, distribution, transportation, and price management systems. We continue to make modifications to our technology that will involve updating or replacing certain systems with successor systems, including improvements to our systems for omni-channel merchandise and financial planning, e-commerce, and customer relationship management.
Employees
At the end of 2016, we employed approximately 19,100 employees. We use part-time and temporary workers to supplement our labor force at peak times during our third and fourth quarters. None of our employees are represented by a labor union or are party to a collective bargaining agreement. We have not experienced any work stoppages and consider our relationship with our employees to be good.
Seasonality
We experience seasonal fluctuations in our revenue and operating results. Due to buying patterns around the holidays and the opening of hunting seasons, our merchandise revenue is traditionally higher in the third and fourth quarters than in the first and second quarters, and we typically earn a disproportionate share of our operating income in the fourth quarter. Because of our retail store growth, and fixed costs associated with retail stores, our quarterly operating income may be further impacted by these seasonal fluctuations. We anticipate our sales will continue to be seasonal in nature. Refer to Note 26 “Quarterly Financial Information” of the Notes to Consolidated Financial Statements for financial information by quarter for 2016 and 2015.
Government Regulation
We are subject to numerous laws and regulations covering a wide variety of subject matter, including consumer protection, firearms and ammunition, Federal Trade Commission (“FTC”), and banking regulations. New laws and regulations (or new interpretations of existing laws and regulations) may also impact our business. The costs of compliance with these laws and regulations are high and are likely to increase in the future and any failure on our part to comply with these laws and regulations may subject us to significant liabilities and other penalties.
We pay applicable corporate income, franchise, sales, and other taxes to states where we have physical nexus. As we open more retail stores, we will be subject to tax in an increasing number of state and local taxing jurisdictions.
Intellectual Property
Cabela’s®, Cabela’s CLUB®, Cabelas.com®, World’s Foremost Outfitter®, World’s Foremost Bank®, and Bargain Cave® are among our registered service marks or trademarks with the United States Patent and Trademark Office. We have numerous pending applications for trademarks. In addition, we own other registered and unregistered trademarks and service marks involving advertising slogans and other names and phrases used in our business. We own certain patents associated with various products. We also own trade secrets, domain names, and copyrights, which have been registered for each of our catalogs.
We believe that our trademarks are valid and valuable and intend to maintain our trademarks and any related registrations. We do not know of any material pending claims of infringement or other challenges to our right to use our marks in the United States or elsewhere. We have no franchises or other concessions which are material to our operations.
9
Available Information
Our website address is www.cabelas.com. We make available on our website our annual reports on Form 10-K, quarterly reports on Form 10-Q, current reports on Form 8-K, and any amendments to those reports, proxy statements, and annual reports to shareholders, and, from time to time, other documents, free of charge, as soon as reasonably practicable after we electronically file such material with or furnish it to the Securities and Exchange Commission (the “SEC”). Our SEC reports can be accessed through the investor relations section of our website. The information on our website, whether currently posted or in the future, is not part of this or any other report we file with or furnish to the SEC. Additionally, the public may read and copy any of the materials we file with the SEC at the SEC’s Public Reference Room at 100 F Street, NE, Washington, DC 20549. The public may obtain information on the operation of the Public Reference Room by calling the SEC at 1-800-SEC-0330. The SEC maintains an Internet site that contains reports, proxy and information statements, and other information regarding issuers, such as Cabela’s, that file electronically with the SEC. The address of the SEC’s website is www.sec.gov.
10
ITEM 1A. RISK FACTORS
Risk Factors Related to the Proposed Merger with Bass Pro Group, LLC and the Related Bank Transaction
The announcement and pendency of the proposed Merger and the related Bank Transaction (the “Transactions”) may adversely affect our business, financial condition, and results of operations.
Uncertainty about the effect of the proposed Transactions on our employees, customers, and other parties may have an adverse effect on our business, financial condition, and results of operations regardless of whether the Transactions are completed. These risks to our business include the following, all of which could be exacerbated by a delay in the completion of the proposed Transactions:
• | the impairment of our ability to attract, retain, and motivate our employees, including key personnel; |
• | the diversion of significant management time and resources towards the completion of the proposed Transactions; |
• | difficulties maintaining relationships with customers, suppliers, and other business partners; |
• | delays or deferments of certain business decisions by our customers, suppliers, and other business partners; |
• | the inability to pursue alternative business opportunities or make appropriate changes to our business because of requirements in the Merger Agreement and the Bank Purchase Agreement that we conduct our business in the ordinary course of business consistent with past practice and not engage in certain kinds of transactions prior to the completion of the proposed Transactions; |
• | litigation relating to the proposed Transactions and the costs related thereto; and |
• | the incurrence of significant costs, expenses, and fees for professional services and other transaction costs in connection with the proposed Transactions. |
Failure to consummate the proposed Transactions within the expected timeframe or at all could have a material adverse impact on our business, financial condition, and results of operations.
There can be no assurance that the proposed Transactions will occur. Consummation of the Merger is subject to specified conditions, including:
• | the affirmative vote in favor of the adoption of the Merger Agreement by the holders of a majority of the outstanding shares of Company common stock entitled to vote thereon; |
• | the consummation of the purchase and sale of the banking business of WFB in accordance with the Bank Purchase Agreement or an alternative agreement in accordance with the Merger Agreement and merger of WFB into the Company or another subsidiary of the Company and termination of its bank charter; |
• | any applicable waiting periods (or extensions thereof) under the Hart-Scott-Rodino Antitrust Improvements Act of 1976 (“HSR Act”) having expired or been terminated; |
• | the absence of any order by any governmental entity rendering the Merger illegal, or prohibiting, enjoining or otherwise preventing the Merger; and |
• | other customary closing conditions. |
The Bank Transaction is also subject to a variety of closing conditions, including:
• | the filing of required notices and the obtainment of required consents from the Office of the Comptroller of the Currency (“OCC”), the FDIC, and the Nebraska Department of Banking and Finance; |
• | the absence of any order prohibiting or making illegal the transactions; |
• | the continued effectiveness of the associated Bank Program Agreement; |
• | the satisfaction or waiver of conditions set forth in the Merger Agreement; |
• | in the case of Capital One, the absence of a Materially Burdensome Regulatory Condition (as defined in the Bank Purchase Agreement); |
• | receipt of written notice from each of S&P Global Ratings, Fitch Ratings, Inc., and DBRS, Inc. that the transaction described in the Bank Purchase Agreement and related transaction documents will not result in a reduction or withdrawal of its then-existing rating with respect to any outstanding series or class with respect to which it is a rating agency; |
• | termination of each outstanding series of variable funding notes issued by Cabela’s Credit Card Master Note Trust; |
• | the receipt of legal and tax opinions and other customary documentation required in connection with the transfer of securitization vehicles; and |
• | customary closing conditions. |
11
There can be no assurance that these conditions will be satisfied in a timely manner or at all. For further information, see our Current Reports on Form 8-K filed with the SEC on October 7, 2016, November 29, 2016, and December 30, 2016, and subsequent filings.
The Merger Agreement also contains certain termination rights for both us and Bass Pro Group, and in certain specified circumstances upon termination of the Merger Agreement we would be required to pay Bass Pro Group a termination fee of $126 million. The Bank Purchase Agreement also contains certain termination rights for both us and Capital One, and in certain circumstances we would be required to pay Capital One a termination fee of $14 million. If we are required to make these payments, doing so may materially adversely affect our business, financial condition, and results of operations.
There can be no assurance that a remedy will be available to us in the event of a breach of the Merger Agreement by Bass Pro Group or the Bank Purchase Agreement by Capital One. Further, any disruptions to our business resulting from the announcement and pendency of the Transactions, including any adverse changes in our relationships with our customers, suppliers, and employees, could continue or accelerate in the event of a failed transaction. In addition, if the Transactions are not completed, and there are no other parties willing and able to acquire the Company at a price of $65.50 per share or higher, on terms acceptable to us, the share price of our common stock will likely decline to the extent that the current market price of our common stock reflects an assumption that the Transactions will be completed. Also, we have incurred, and will continue to incur, significant costs, expenses, and fees for professional services and other transaction costs in connection with the proposed Transactions, for which we will have received little or no benefit if the Transactions are not completed. Many of these fees and costs will be payable by us even if the Transactions are not completed and may relate to activities that we would not have undertaken other than to complete the Transactions.
Risks Related to Our Merchandising Business
A decline in discretionary consumer spending could reduce our revenue.
Our revenue depends on discretionary consumer spending, which may decrease due to a variety of factors beyond our control, including:
• | unfavorable general business conditions; |
• | increases in interest rates; |
• | increases in inflation; |
• | wars, fears of war, and terrorist attacks and organizing activities; |
• | increases in consumer debt levels and decreases in the availability of consumer credit; |
• | adverse or unseasonal weather conditions or events; |
• | increases in gasoline prices reducing the willingness to travel to our retail stores; |
• | changes in demographic trends; |
• | changes in consumer preferences, including demand for firearms and ammunition; |
• | increases in taxation; |
• | adverse fluctuations of foreign currencies; |
• | adverse unemployment trends; |
• | adverse conditions in the mortgage and housing markets; and |
• | other factors that adversely influence consumer confidence and spending. |
Our customers’ purchases of discretionary items, including our products, could decline during periods when disposable income is lower or periods of actual or perceived unfavorable economic conditions. If this occurs, our revenue could decline.
12
Competition in the outdoor recreation and casual apparel and footwear markets could reduce our revenue and profitability.
The outdoor recreation and casual apparel and footwear markets are highly fragmented and competitive. We compete directly or indirectly with the following types of companies:
• | other specialty retailers that compete with us across a significant portion of our merchandising categories through retail store or direct businesses, such as Bass Pro Shops, Gander Mountain, Orvis, The Sportsman’s Guide, and Sportsman’s Warehouse; |
• | large-format sporting goods stores and chains, such as Academy Sports + Outdoors, Dick’s Sporting Goods, and Big 5 Sporting Goods; |
• | retailers that currently compete with us through retail businesses that may enter the direct business; |
• | mass merchandisers, warehouse clubs, discount stores, and department stores, such as Wal-Mart, Target, and Amazon; and |
• | casual outdoor apparel and footwear retailers, such as L.L. Bean, Lands’ End, and REI. |
Many of our competitors have a larger number of stores, and some of them have substantially greater market presence, name recognition, and financial, distribution, marketing, and other resources than we have. In addition, if our competitors reduce their prices, we may have to reduce our prices in order to compete. Furthermore, some of our competitors have aggressively built new stores in locations with high concentrations of our Internet and catalog business customers. As a result of this competition, we may need to spend more on advertising and promotion. Some of our mass merchandising competitors, such as Wal-Mart and Amazon, do not currently compete in many of the product lines we offer. If these competitors were to begin offering a broader array of competing products, or if any of the other factors listed above occurred, our revenue could be reduced or our costs could be increased, resulting in reduced profitability.
We may not be able to raise additional capital or obtain additional financing if needed.
We regularly review and evaluate our liquidity and capital needs. We currently believe that our available cash, cash equivalents, and cash flow from operations will be sufficient to finance our operations and expected capital requirements for at least the next 12 months. However, we might experience periods during which we encounter additional cash needs, and we might need additional external funding to support our operations. Although we were able to enter into a $550 million private placement of senior unsecured notes during 2015 and a $775 million revolving credit facility during 2014 on acceptable terms, in the event we require additional liquidity, we cannot be certain that additional funds will be available if needed and to the extent required or, if available, on acceptable terms. If we cannot raise necessary additional funds on acceptable terms, there could be a material adverse impact on our business and results of operations. We also may not be able to fund expansion, take advantage of future opportunities, meet our existing debt obligations, or respond to competitive pressures or unanticipated requirements.
Our comparable store sales will fluctuate and may not be a meaningful indicator of future performance.
Changes in our comparable store sales results could affect the price of our common stock. A number of factors have historically affected, and will continue to affect, our comparable store sales results, including:
• | competition; |
• | new store openings; |
• | general regional and national economic conditions; |
• | actions taken by our competitors; |
• | consumer trends and preferences, including demand for firearms and ammunition; |
• | new product introductions and changes in our product mix; |
• | timing and effectiveness of promotional events; and |
• | weather conditions. |
Our comparable store sales may vary from quarter to quarter, and an unanticipated decline in revenues or comparable store sales may cause the price of our common stock to fluctuate significantly.
13
If we fail to maintain the strength and value of our brand, our revenue is likely to decline.
Our success depends on the value and strength of the Cabela’s brand. The Cabela’s name is integral to our business as well as to the implementation of our strategies for expanding our business. Maintaining, promoting, and positioning our brand will depend largely on the success of our marketing and merchandising efforts and our ability to provide high quality merchandise and a consistent, high quality customer experience. Our brand could be adversely affected if we fail to achieve these objectives or if our public image or reputation were to be tarnished by negative publicity. Any of these events could result in decreases in revenue.
Disruptions in our information technology systems could have a material adverse impact on our operating results.
Our Merchandising and Financial Services business segments are dependent upon the integrity, security, and consistent operations of our information technology systems. We rely heavily on our information technology systems to manage and replenish inventory, to take customer orders, to deliver products to our customers in an efficient manner, to collect payments from our customers, and to provide accurate financial data and reporting for our business. Although we continually maintain security measures to protect our information, any disruption, failure, or breach of our information technology systems may have a material adverse effect on our business or results of operations. We also expect to continue to make significant technology investments in the coming years, which are key to our business. There are inherent risks associated with these system changes, and we may be unable to successfully implement these system changes. Our failure to successfully implement these system changes could have a material adverse effect on our business or results of operations. Additionally, there is no assurance that successful implementation of these system changes will deliver value to us.
We are subject to security breaches and cybersecurity risks which could damage our reputation, result in lost sales, and increase our costs in an effort to protect against such breaches and cybersecurity risks.
Our business necessarily depends upon the operation and security of our website. Additionally, the nature of our business requires that we collect and maintain personal information about our customers. In addition, cybersecurity risks are a significant area of focus within our Financial Services business segment. We use third-party systems, software, and tools in order to protect the customer data we obtain through the course of our business, which data includes financial and credit card information about our customers.
Although we maintain security measures to protect such customer information, security breaches, computer viruses, cyber attacks, acts of vandalism, human error, or other similar events may result in the unauthorized disclosure and use of confidential customer information. Such a security breach could attract substantial media attention, damage our reputation with our customers, result in lost sales, expose us to monetary damages, fines, and litigation, and increase costs in order to combat and prevent such breaches. Such a breach could have a material adverse impact on our business and results of operations.
14
If we cannot successfully implement our retail store expansion strategy, our growth and profitability would be adversely impacted.
We continue to seek additional locations to open new retail stores. Our ability to open new retail stores in a timely manner and operate them profitably depends on a number of factors, many of which are beyond our control, including:
• | our ability to manage the financial and operational aspects of our retail growth strategy; |
• | our ability to identify suitable locations, including our ability to gather and assess demographic and marketing data to determine consumer demand for our products in the locations we select; |
• | our ability to negotiate favorable lease agreements; |
• | our ability to properly assess the profitability of potential new retail store locations; |
• | the availability of financing on favorable terms; |
• | our ability to secure required governmental permits and approvals; |
• | our ability to hire and train skilled store operating personnel, especially management personnel; |
• | the availability of construction materials and labor and the absence of significant construction delays or cost overruns; |
• | our ability to provide a satisfactory mix of merchandise that is responsive to the needs of our customers living in the areas where new retail stores are built; |
• | our ability to supply new retail stores with inventory in a timely manner; |
• | our ability to properly assess operational and regulatory challenges involved in opening and successfully operating retail stores in Canada; |
• | our competitors building or leasing stores near our retail stores or in locations we have identified as targets for a new retail store; |
• | consumer demand for our products, particularly firearms and ammunition, which drives traffic to our retail stores; and |
• | general economic and business conditions affecting consumer confidence and spending and the overall strength of our business. |
We may not be able to sustain the growth in the number of our retail stores, the revenue growth historically achieved by our retail stores, or to maintain consistent levels of profitability in our merchandising business, particularly as we expand into markets now served by other large-format sporting goods retailers and mass merchandisers. In addition, the substantial management time and resources which our retail store expansion strategy requires may result in disruption to our existing business operations which may decrease our profitability.
Retail store growth could adversely affect the operating results of our merchandising business and reduce our Internet and catalog revenue.
As the number of our retail stores increase, our stores will become more highly concentrated in the geographic regions we serve. As a result, the number of customers and related revenue at individual stores may decline and the average amount of sales per square foot at our stores may be reduced. In addition, as we open more retail stores and as our competitors open stores with similar formats, our retail store legacy format may become less unique and may be less attractive to customers as tourist and entertainment shopping locations. If either of these events occurs, the operating results of our merchandising business could be materially adversely affected. The growth in the number of our retail stores may also draw customers away from our Internet and catalog business, which could materially adversely affect our Internet and catalog revenue.
15
Our failure to successfully manage our Internet and catalog business could have a material adverse effect on our operating results and cash flows.
During 2016, our Internet and catalog business accounted for 21.7% of our total merchandise revenue. Our Internet and catalog business is subject to a number of risks and uncertainties, including:
• | failures to timely fill customer orders; |
• | changes in consumer preferences, willingness to purchase goods through catalogs or our website, weak economic conditions and economic uncertainty, and unseasonal weather in key geographic markets; |
• | increases in software filters that may inhibit our ability to market our products through e-mail messages to our customers and increases in consumer privacy concerns relating to the Internet; |
• | supply and delivery shortages or interruptions, including reduced service levels from the United States Postal Service; |
• | changes in applicable federal and state regulation; |
• | breaches of our website security; |
• | failures in our website infrastructure or the failure of systems of third parties, such as telephone or electric power service, resulting in website downtime, customer care center closures, or other problems; |
• | failures to properly design, print, and mail our catalogs in a timely manner; |
• | failures to introduce new product specific catalog titles; |
• | lower and less predictable response rates for catalogs sent to prospective customers; |
• | our inability to properly adjust the fixed costs of a catalog mailing to reflect subsequent sales of the products marketed in the catalog; and |
• | increases in United States Postal Service rates, paper costs, and printing costs resulting in higher catalog production costs and lower profits for our Internet and catalog business. |
Any one or more of these factors could result in lower-than-expected revenue for our Internet and catalog business. These factors could also result in increased costs, increased merchandise returns, slower turning inventories, inventory write-downs, and working capital constraints. Any significant performance shortcomings experienced by our Internet and catalog business could have a material adverse effect on our operating results and cash flows.
Any disruption of the supply of products and services from our vendors could have an adverse impact on our revenue and profitability.
Our vendors and the products and services they provide include the following:
• | vendors to supply our merchandise in sufficient quantities at competitive prices in a timely manner; |
• | outside printers and catalog production vendors to print and mail our catalogs and to convert our catalogs to digital format for website posting; |
• | shipping companies, such as United Parcel Service, the United States Postal Service, and common carriers, for timely delivery of our catalogs, shipment of merchandise to our customers, and delivery of merchandise from our vendors to us and from our distribution centers to our retail stores; |
• | ports and other infrastructure necessary to transfer our products; |
• | telephone companies to provide telephone service to our in-house customer care centers; |
• | communications providers to provide Internet users with access to our website and a website hosting service provider to host and manage our website; |
• | software providers to provide software and related services to run our operating systems for our Merchandising and Financial Services business segments; and |
• | third-party card processors to provide processing for all credit and debit card transactions. |
We cannot predict when, or the extent to which, we will experience any disruption in the supply of products and services from our vendors. Any such disruption could have an adverse impact on our revenue and profitability.
16
Any disruption in these services could have a negative impact on our ability to market and sell our products, and serve our customers. Our 10 largest trade vendors collectively represented approximately 19% of our total merchandise purchases in 2016. If we are unable to acquire suitable merchandise or lose one or more key vendors, we may not be able to offer products that are important to our merchandise assortment. We also are subject to risks, such as the price and availability of raw materials and fabrics, labor disputes, union organizing activity, strikes, inclement weather, natural disasters, war and terrorism, and adverse general economic and political conditions that might limit our vendors’ ability to provide us with quality merchandise on a timely basis. We have no contractual arrangements providing for continued supply from our key vendors and our vendors may discontinue selling to us at any time. We may not be able to develop relationships with new vendors, and products from alternative sources, if any, may be of a lesser quality and more expensive than those we currently purchase. Any delay or failure in offering products to our customers could have a material adverse impact on our revenue and profitability. We also rely on our vendors to comply with our social responsibility program, and the failure of a vendor to comply with our social responsibility program could harm our brand or cause us to terminate a vendor prior to securing an alternative source for the terminated vendor’s products or services. In addition, if the cost of fuel rises, the cost to deliver merchandise to the customers of our Internet and catalog business and from our distribution centers to our retail stores may rise which could have a material adverse impact on our profitability.
In addition, the SEC has adopted rules regarding disclosure of the use of conflict minerals (commonly referred to as tantalum, tin, tungsten, and gold), which are mined from the Democratic Republic of the Congo and surrounding countries. We expect to incur costs to maintain a process to discover the origin of the tantalum, tin, tungsten, and gold used in the products we sell, and may incur costs to audit our conflict minerals disclosures. Our reputation may also suffer if the products we sell contain conflict minerals originating in the Democratic Republic of the Congo or surrounding countries.
Political and economic uncertainty and unrest in foreign countries where our merchandise vendors are located and trade restrictions upon imports from these foreign countries could adversely affect our ability to source merchandise and operating results.
In 2016, we imported 58% of our Cabela’s branded merchandise directly from vendors located in foreign countries, with a substantial portion of the imported merchandise being obtained directly from vendors located in China, Southeast Asia, Germany, and Guatemala. In addition, we believe that a significant portion of our other vendors obtain their products from foreign countries that may also be subject to political and economic uncertainty. We are subject to risks and uncertainties associated with changing economic and political conditions in foreign countries where our vendors are located, such as:
• | increased import duties, tariffs, trade restrictions, and quotas; |
• | work stoppages; |
• | economic uncertainties; |
• | adverse foreign government regulations; |
• | wars, fears of war, and terrorist attacks and organizing activities; |
• | adverse fluctuations of foreign currencies; and |
• | political unrest. |
We cannot predict when, or the extent to which, the countries in which our products are manufactured will experience any of the above events. Any event causing a disruption or delay of imports from foreign locations would likely increase the cost or reduce the supply of merchandise available to us and would adversely affect our operating results, particularly if imports of our Cabela’s branded merchandise were adversely affected as our margins are higher on our Cabela’s branded merchandise.
In addition, trade restrictions, including increased tariffs or quotas, embargoes, safeguards, and customs restrictions against apparel items, as well as United States or foreign labor strikes, work stoppages, or boycotts, could increase the cost or reduce the supply of merchandise available to us or may require us to modify our current business practices, any of which could hurt our profitability.
17
Due to the seasonality of our business, our annual operating results would be adversely affected if our revenue during the fourth quarter was substantially below expectations.
We experience seasonal fluctuations in our revenue and operating results. Historically, we have realized a significant portion of our revenue and earnings for the year in the fourth quarter. In 2016 and 2015, respectively, we generated 32.4% and 35.2% of our revenue, and 39.5% and 41.6% of our net income, in the fourth quarter. We incur significant additional expenses in the fourth quarter due to higher customer purchase volumes and increased staffing. If we miscalculate the demand for our products generally or for our product mix during the fourth quarter, our revenue could decline, which would harm our financial performance. In addition, abnormally warm weather conditions during the fourth quarter can reduce sales of many of the products normally sold during this time period and inclement weather can reduce store traffic or cause us to temporarily close stores causing a reduction in revenue. Because a substantial portion of our operating income is derived from our fourth quarter revenue, a shortfall in expected fourth quarter revenue would cause our annual operating results to suffer significantly.
If we lose key management or are unable to attract and retain the talent required for our business, our operating results could suffer.
Our future success depends to a significant degree on the skills, experience, and efforts of our senior executive management and merchandising teams. With the exception of our Chairman, James W. Cabela, none of our senior management have employment agreements other than our Management Change of Control Severance Agreements. We do not carry key-man life insurance on any of our executives or key management personnel. In addition, our corporate headquarters is located in a sparsely populated rural area, which may make it difficult to attract and retain qualified individuals for key management positions. The loss of the services of any of these individuals or the inability to attract and retain qualified individuals for our key management positions could cause our operating results to suffer.
Our business depends on our ability to meet our labor needs, and if we are unable to do so, our retail store expansion strategy may be delayed and our revenue growth may suffer.
Our success depends on hiring, training, managing, and retaining quality managers, outfitters, and employees in our retail stores and customer care centers. Our corporate headquarters, distribution centers, return center, and some of our retail stores are located in sparsely populated rural areas. It may be difficult to attract and retain qualified personnel, especially management and technical personnel, in these areas. Competition for qualified management and technical employees could require us to pay higher wages or grant above market levels of stock compensation to attract a sufficient number of employees. If we are unable to attract and retain qualified personnel as needed, the implementation of our retail store expansion strategy may be delayed and our revenue growth may suffer.
A natural disaster or other disruption at our distribution centers or return facility could cause us to lose merchandise and be unable to effectively deliver to our Internet and catalog customers and retail stores.
We currently rely on distribution centers in Sidney, Nebraska; Prairie du Chien, Wisconsin; Wheeling, West Virginia, Tooele, Utah; Puyallup, Washington; and Calgary, Alberta, Canada, to handle our distribution needs. We operate a return center in Oshkosh, Nebraska; and our Wheeling, West Virginia, distribution center also processes returns. Any natural disaster or other serious disruption to these centers due to fire, tornado, or any other calamity could damage a significant portion of our inventory and materially impair our ability to adequately stock our retail stores, deliver merchandise to customers, and process returns to vendors and could result in lost revenue, increased costs, and reduced profits.
In addition, as we implement our retail store expansion strategy, we will need to construct additional distribution centers or expand the size of our existing distribution centers to support our growing number of retail stores. If we are unable to find suitable locations for new distribution centers or to timely integrate new or expanded distribution centers into our inventory control process, we may not be able to deliver inventory to our retail stores in a timely manner, which could have a material adverse effect on the revenue and cash flows of our merchandising business.
18
We do not collect sales taxes in some jurisdictions, which could result in substantial tax liabilities and cause our future Internet and catalog business sales to decrease.
An increasing number of states have considered or adopted laws that attempt to impose tax collection obligations on out-of-state retailers. We believe that these initiatives are inconsistent with the United States Supreme Court’s holding that states, absent congressional legislation, may not impose tax collection obligations on out-of-state direct marketers unless the out-of-state direct marketer has nexus with the state. A successful assertion by one or more states requiring us to collect taxes where we do not do so could result in substantial tax liabilities, including for past sales, as well as penalties and interest. The imposition by state governments of sales tax collection obligations on out-of-state direct marketers who participate in Internet commerce could also create additional administrative burdens for us, put us at a competitive disadvantage if they do not impose similar obligations on our competitors, and decrease our future Internet and catalog sales, which could have a material adverse impact on our business and results of operations.
We must successfully order and manage our inventory to reflect customer demand and anticipate changing consumer preferences and buying trends or our revenue and profitability will be adversely affected.
Our success depends upon our ability to successfully manage our inventory and to anticipate and respond to merchandise trends and customer demands in a timely manner. We cannot predict consumer preferences with certainty and they may change over time. We usually must order merchandise well in advance of the applicable selling season. The extended lead times for many of our purchases may make it difficult for us to respond rapidly to new or changing product trends or changes in prices. If we misjudge either the market for our merchandise or our customers’ purchasing habits, our revenue may decline significantly and we may not have sufficient quantities of merchandise to satisfy customer demand or we may be required to mark down excess inventory, either of which would result in lower profit margins.
We may incur costs from litigation relating to products that we sell, particularly tree stands, firearms, and ammunition, which could adversely affect our revenue and profitability.
We may incur damages due to lawsuits relating to products we sell, including lawsuits relating to tree stands, firearms, and ammunition. We may incur losses due to lawsuits, including potential class actions, relating to our performance of background checks on firearms purchases and compliance with other sales laws as mandated by state and federal law. We may also incur losses from lawsuits relating to the improper use of firearms or ammunition sold by us, including lawsuits by municipalities or other organizations attempting to recover costs from manufacturers and retailers of firearms and ammunition. Our insurance coverage and the insurance provided by our vendors for certain products they sell to us may be inadequate to cover claims and liabilities related to products that we sell. In addition, claims or lawsuits related to products that we sell, or the unavailability of insurance for product liability claims, could result in the elimination of these products from our product line, thereby reducing revenue. If one or more successful claims against us are not covered by or exceed our insurance coverage, or if insurance coverage is no longer available, our available working capital may be impaired and our operating results could be materially adversely affected. Even unsuccessful claims could result in the expenditure of funds and management time and could have a negative impact on our profitability and on future premiums we would be required to pay on our insurance policies.
Legal proceedings may increase our costs and have a material adverse effect on our results of operations.
We are involved in legal proceedings that are incidental to our business. For example, significant judgment is required in determining our provision for income taxes, and we are regularly under audit by tax authorities. Although we believe our tax estimates are reasonable, the final determination of tax audits and any related litigation could be materially different from our historical income tax provisions and accruals. Beyond this, WFB is regularly subject to FDIC compliance examinations and has been required in the past to pay monetary damages as a result of FDIC examinations and may be required to pay monetary damages resulting from FDIC compliance examinations in the future. The defense and resolution of lawsuits, audits, examinations, and other proceedings may involve significant expense, divert management’s attention and resources from other matters, and have a material adverse effect on our results of operations.
19
Current and future government regulation may negatively impact the demand for our products and our ability to conduct our business.
Federal, state, and local laws and regulations can affect our business and the demand for products. These laws and regulations include:
• | FTC regulations governing the manner in which orders may be solicited and prescribing other obligations in fulfilling orders and consummating sales; |
• | state or federal laws and regulations or executive orders that prohibit or limit the sale of certain items we offer such as firearms, black powder firearms, ammunition, bows, knives, and similar products; |
• | the Bureau of Alcohol, Tobacco, Firearms and Explosives governing the manner in which we sell firearms and ammunition; |
• | laws and regulations governing hunting and fishing; |
• | laws and regulations relating to the collecting and sharing of non-public customer information; and |
• | United States customs laws and regulations pertaining to proper item classification, quotas, payment of duties and tariffs, and maintenance of documentation and internal control programs which relate to importing taxidermy which we display in our retail stores. |
Changes in these laws and regulations or additional regulation, particularly new laws or increased regulations regarding sales and ownership of firearms and ammunition, could cause the demand for and sales of our products to decrease and could materially adversely impact our revenue and profitability. Moreover, complying with increased or changed regulations could cause our operating expenses to increase.
Our inability or failure to protect our intellectual property could have a negative impact on our operating results.
Our trademarks, service marks, copyrights, patents, trade secrets, domain names, and other intellectual property are valuable assets that are critical to our success. Effective trademark and other intellectual property protection may not be available in every country in which our products are made available. The unauthorized reproduction or other misappropriation of our intellectual property could diminish the value of our brands or goodwill and cause a decline in our revenue. Any infringement or other intellectual property claim made against us, whether or not it has merit, could be time-consuming, result in costly litigation, cause product delays, or require us to enter into royalty or licensing agreements. As a result, any such claim could have a material adverse effect on our operating results.
Risks Related to Our Financial Services Business
We may experience limited availability of financing or variation in funding costs for our Financial Services segment, which could limit growth of the business and decrease our profitability.
Our Financial Services segment requires a significant amount of cash to operate. These cash requirements will increase if our credit card originations increase or if our cardholders’ balances or spending increase. Historically, we have relied upon external financing sources to fund these operations, and we intend to continue to access external sources to fund our growth. A number of factors such as our financial results, changes within our organization, disruptions in the capital markets, increased competition in the deposits market, our corporate and regulatory structure, interest rate fluctuations, general economic conditions, possible negative credit ratings affecting our asset-backed securities, and accounting and regulatory changes and regulations could make such financing more difficult or impossible to obtain or more expensive. In addition, several rules and regulations have been proposed by the SEC that may substantially affect issuers of asset-backed securities.
We have been and will continue to be particularly reliant on funding from securitization transactions for our Financial Services segment. Securitization funding sources include both variable funding facilities and fixed and floating rate term securitizations. A failure to renew these facilities, to refinance the term securitizations as they mature, or to add additional term securitizations and variable funding facilities on favorable terms as it becomes necessary could increase our financing costs and potentially limit our ability to grow our Financial Services segment. In addition, the ability of our Financial Services segment to engage in securitization transactions on favorable terms or at all could be adversely affected by disruptions in the capital markets or other events, which could adversely affect our business and cause our Financial Services segment to lose an important source of funding.
20
The funding options available to our Financial Services segment may be adversely affected as a result of the Bank Purchase Agreement and the Bank Transaction. The terms of the Bank Purchase Agreement limit the ability of our Financial Services segment to engage in variable funding and term securitization transactions under certain circumstances prior to the closing of the Bank Transaction. In addition, the Bank Transaction may adversely affect the ability of our Financial Services segment to access the securitization markets for funding on favorable terms or at all.
In response to certain liquidity requirements recommended under the Basel Committee on Banking Supervision in December 2010, commonly referred to as “Basel III,” the noteholders under all of the variable funding facilities issued under WFB’s securitization program have requested and obtained amendments to their respective transaction documents. In one case, the amendments permit the noteholders to delay funding an advance requested under that facility for up to 35 days. In the other cases, the amendments require WFB to provide 35 days’ prior notice in connection with requests for some or all of the advances. These changes and any similar changes requested by the noteholders under any other variable funding facility could delay or disrupt access to funding under the variable funding facilities. Moreover, the liquidity requirements under Basel III could result in an increase in the borrowing costs under the variable funding facilities.
Furthermore, even if we are able to securitize our credit card loans consistent with past practice, poor performance of our loans, including increased delinquencies and credit losses, lower payment rates, or a decrease in excess spreads below certain thresholds, could result in a downgrade or withdrawal of the ratings on the outstanding securities issued in our securitization transactions, cause “early amortization” or “early redemption” of these securities, or result in higher required credit enhancement levels. This could jeopardize our ability to complete other securitization transactions on acceptable terms, decrease our liquidity, and force us to rely on other potentially more expensive funding sources, to the extent available, which would decrease our profitability.
Our current funding strategy also includes a continued reliance on certificates of deposit to help fund growth and maturing securitizations. If there is an increase in other financial institutions relying on the certificates of deposit market for liquidity and funding, competition in the deposits market may increase. Also, some of the certificates of deposit are eligible to be withdrawn prior to their maturity dates. Early withdrawal is subject to a penalty. In addition, FDIC deposit insurance coverage may be reduced. Any of these events could result in less funds available or replacement funds at unattractive rates. In addition to the non-brokered certificates of deposit market to fund growth and maturing securitizations, we have access to the brokered certificates of deposit market through multiple financial institutions for liquidity and funding purposes. Our ability to issue certificates of deposit is reliant on our current regulatory capital levels. If WFB were to be classified as an “adequately-capitalized” bank, we would be required to obtain a waiver from the FDIC in order to continue to issue certificates of deposit and would be limited to what interest rate we can pay on deposits. At the end of 2016, WFB met the requirements for a “well-capitalized” institution, the highest of the Federal Deposit Insurance Corporation Improvement Act’s five capital ratio levels.
We may have to reallocate capital from our Merchandising segment to meet the capital needs of our Financial Services segment, which could alter our retail store expansion program.
WFB must satisfy the capital maintenance requirements of government regulators and its agreement with Visa U.S.A., Inc. (“Visa”). At the end of 2016, WFB was classified as a “well-capitalized” bank, the highest category under the regulatory framework for prompt corrective action. Although WFB satisfied the requirements for the “well-capitalized” classification at the end of 2016, no assurances can be given that WFB will continue to satisfy such requirements. A variety of factors could cause the capital requirements of WFB to exceed our ability to generate capital internally or from third party sources. For example, government regulators or Visa could unilaterally increase their minimum capital requirements. On July 9, 2013, the FDIC adopted interim final rules which revised its risk-based and leverage capital requirements for FDIC-supervised institutions. These interim final rules are substantially identical to the joint final rules issued by the OCC and the Board of Governors of the Federal Reserve System on July 2, 2013. The interim final rules and the joint final rules implement the regulatory capital reforms recommended by Basel III, and capital reforms required by the Dodd-Frank Wall Street Reform and Consumer Protection Act (the “Reform Act”). Among other things, the interim final rules and the joint final rules revise the agencies’ prompt corrective action framework by introducing a common equity tier 1 capital requirement and a higher minimum tier 1 capital requirement. In addition, the interim final rules and the joint final rules include a supplementary leverage ratio for depository institutions subject to the advanced approaches capital rules. The phase-in period for the interim final rules began in January 2015 for WFB. Also, we have significant potential obligations in the form of the unused credit lines of our cardholders. At the end of 2016, these unfunded amounts totaled approximately $36 billion. Draws on these lines of credit could materially exceed predicted line usage. If WFB ceases to qualify as well-capitalized, WFB would become subject to regulatory restrictions that could materially adversely affect its liquidity, cost of funds, and ability to conduct normal operations. If WFB’s capital requirements were to increase, we may have to contribute capital to WFB, which may require us to raise additional debt or equity capital and/or divert capital from our Merchandising segment, which in turn could significantly alter our retail store expansion strategy.
21
It may be difficult to sustain the historical growth and profitability of our Financial Services segment, and we will be subject to various risks as we continue to grow the business.
We may not be able to retain existing cardholders, grow account balances, or attract new cardholders and the profits from our Financial Services segment could decline, for a variety of reasons, many of which are beyond our control, including:
• | credit risk related to the loans we make to cardholders and the charge-off levels of our credit card accounts; |
• | inability of cardholders to make payments to us due to economic conditions and limited access to other credit sources; |
• | inability to manage credit risk and keep credit models up to date with current consumer credit trends; |
• | lack of growth of potential new customers generated by our merchandising business; |
• | liquidity and funding risk relating to our ability to create the liquidity necessary to extend credit to our cardholders and provide the capital necessary to meet the requirements of government regulators and Visa; |
• | operational risk related to our ability to acquire the necessary operational and organizational infrastructure, manage expenses as we expand, and recruit management and operations personnel with the experience to run an increasingly complex and highly-regulated business; and |
• | the credit card industry is highly competitive with increased use of advertising, target marketing, reward programs, mobile payment solutions, and pricing competition in interest rates and cardholder fees as both traditional and new credit card issuers seek to expand or to enter the market and compete for customers. |
Economic downturns and social and other factors could cause our credit card charge-offs and delinquencies to increase, or credit card balances to decrease, which would decrease our profitability.
The general economic environment may worsen, unemployment may increase, the housing market may decline, and consumer credit availability may decrease. The ability and willingness of cardholders to pay could be adversely affected, which would increase delinquencies and charge-offs. In addition, if economic conditions deteriorate, the number of transactions and average purchase amount of transactions on the credit card accounts may be reduced, which would reduce the revenue of our Financial Services segment. A variety of social and other factors also may cause changes in credit card use, payment patterns, and the rate of defaults by cardholders. These social factors include changes in consumer confidence levels, the public’s perception of the use of credit cards, changing attitudes about incurring debt, and the stigma of personal bankruptcy. Our underwriting criteria and portfolio management, product design, and collection operations may be insufficient to protect the growth and profitability of our Financial Services segment during a sustained period of economic downturn or recession or a material shift in social attitudes, and may be insufficient to protect against these additional negative factors.
The performance of our Financial Services segment may be negatively affected by the performance of our merchandising business.
Negative developments in our merchandising business could affect our ability to grow or maintain our Financial Services segment. We believe our ability to maintain cardholders and attract new cardholders is highly correlated with customer loyalty to our merchandising business and to the strength of the Cabela’s brand. In addition, transactions on cardholder accounts produce loyalty points which the cardholder may apply to future purchases from us. Adverse changes in the desirability of products we sell, negative trends in retail customer service and satisfaction, or the modification of the loyalty program could have a negative impact on the ability of Cabela’s CLUB to grow its account base.
Our Financial Services segment faces the risk of a complex and changing regulatory and legal environment.
Our Financial Services segment operates in a heavily regulated industry and is therefore subject to a wide array of banking and consumer lending laws and regulations. Failure to comply with banking and consumer lending laws and regulations could result in financial, structural, and operational penalties being imposed.
In addition, as a Visa member bank, WFB must comply with rules and regulations imposed by Visa. For example, WFB and Cabela’s could be fined by Visa for failing to comply with Visa’s data security standards. Our Financial Services segment, like our merchandising business, also faces cybersecurity risks. A security breach in our Financial Services segment could have a material adverse impact on our business and results of operations.
22
Further, certain acquisitions of our common stock may be subject to regulatory approval or notice under federal or state law because WFB is a special purpose, FDIC insured, Nebraska state-chartered bank. This requirement could limit or impede a merger or other change of control transaction. Investors are responsible for ensuring that they do not, directly or indirectly or acting in concert with others, acquire shares of our common stock in excess of the amount that can be acquired without regulatory approval or notice under the Change in Bank Control Act and Nebraska acquisition of bank control provisions. Investors and potential investors are advised to consult with their own legal counsel regarding applicable laws, regulations, and requirements.
The Dodd-Frank Wall Street Reform and Consumer Protection Act may impact the practices of our Financial Services segment and could have a material adverse effect on our results of operations.
In July 2010, the Reform Act was signed into law. The Reform Act, as well as other legislative and regulatory changes, could have a significant impact on us by, for example, requiring the Financial Services segment to change its business practices, imposing additional costs on the Financial Services segment, limiting fees the Financial Services segment can charge for services, impacting the value of the Financial Services segment and its assets, or otherwise adversely affecting the Financial Services segment’s business. A description of the Reform Act and other legislative and regulatory developments is contained in “Management’s Discussion and Analysis of Financial Condition and Results of Operations - Developments in Legislation and Regulation.”
As directed by the Reform Act, the United States Government Accountability Office released a report on January 20, 2012, that examines the potential implications of eliminating certain exceptions under the Bank Holding Company Act of 1956, as amended (“BHCA”), including the exception for credit card banks. It is unclear whether this report will lead to any additional legislative or regulatory action. If the credit card bank exception were eliminated or modified, we may be required to divest our ownership of WFB unless we were willing and able to become a bank holding company under the BHCA. Any such forced divestiture may materially adversely affect our business and results of operations.
The Reform Act will also affect a number of significant changes relating to asset-backed securities, including additional oversight and regulation of credit rating agencies and additional reporting and disclosure requirements. In addition, the Reform Act will prohibit issuers and payment card networks from placing certain restrictions on vendors relating to credit card transactions, which could affect consumer behavior and the use of credit cards as a form of payment.
The Reform Act also established the Consumer Financial Protection Bureau (the “Bureau”) within the Federal Reserve, a new consumer protection regulator. The Bureau has broad rulemaking and enforcement authority over providers of credit, savings, and payment services and products, and WFB is subject to its regulation. The Bureau has enforcement authority over certain non-depository institutions and depository institutions with total assets greater than $10 billion. While the Bureau does not currently examine WFB, it receives information from the FDIC, WFB’s primary regulator. The Bureau also has rulemaking and interpretive authority under existing and future consumer financial services laws. The Bureau is specifically authorized to issue rules identifying as unlawful acts or practices it defines as “unfair, deceptive, or abusive acts or practices” in connection with the offer or provision of a consumer financial product or service to a customer. Compliance with applicable law is costly and can affect operating results. Compliance requires forms, processes, procedures, controls and infrastructure to support these requirements. Compliance may create operational constraints and place limits on pricing. Laws in the financial services industry are designed primarily for the protection of consumers. The failure to comply could result in specific statutory civil and criminal penalties, monetary damages and attorneys’ fees and costs.
The Bureau, the FDIC, and other agencies have announced several high-profile enforcement actions against credit card issuers for deceptive marketing and other illegal practices related to the advertising of ancillary products, collection practices, and other matters. By these public enforcement actions, the Bureau and the FDIC have signaled a heightened scrutiny of credit card issuers. We anticipate increased activity by regulators in pursuing consumer protection claims going forward.
The Reform Act also limits the ability of federal laws to preempt state and local consumer protection laws. This legislation could have a material adverse effect on WFB, for example, if a new consumer protection agency, or state officials, were to impose new restrictions on risk management, pricing, disclosure, or other aspects of the credit card business.
23
The Reform Act also requires fees charged for debit card transactions to be both “reasonable and proportional” to the cost incurred by the card issuer. Although the Reform Act applies this restriction only to debit cards, Congress has expressed its desire to regulate interchange fees for credit cards. From time to time, Congress or state legislatures may consider legislation to regulate interchange fees for credit cards. In addition, Visa may reduce interchange rates applicable to certain merchants, which would reduce our interchange income. If any such limitations on credit card interchange fees were adopted, as a result of regulation, reductions by Visa, or credit card industry litigation, it could have a material adverse effect on our business, results of operations, and financial condition.
Many provisions of the Reform Act require the adoption of rules to implement. In addition, the Reform Act mandates multiple studies, which could result in additional legislative or regulatory action. The effect of the Reform Act and its implementing regulations on the Financial Services segment’s business and operations could be significant. In addition, we may be required to invest significant management time and resources to address the various provisions of the Reform Act and the numerous regulations that are required to be issued under it. The Reform Act, any related legislation, and any implementing regulations could have a material adverse effect on our business, results of operations, and financial condition.
Changes in interest rates could have a negative impact on our earnings.
In connection with our Financial Services segment, we borrow money from institutions and accept funds by issuing brokered and non-brokered certificates of deposit and securitizations, which we then lend to cardholders. We earn interest on the cardholders’ account balances, and pay interest on the certificates of deposit and borrowings we use to fund those loans. Changes in these two interest rates affect the value of the assets and liabilities of our Financial Services segment. If the rate of interest we pay on borrowings increases more (or more rapidly) than the rate of interest we earn on loans, our net interest income, and therefore our earnings, could fall. Our earnings could also be materially adversely affected if the rates on our credit card account balances fall more quickly than those on our borrowings. In the event interest rates rise, the spread between the interest rate we pay on our borrowings and the fees we earn from these accounts may change and our profitability may be materially adversely affected.
ITEM 1B. UNRESOLVED STAFF COMMENTS
None.
24
ITEM 2. PROPERTIES
In addition to our retail stores, our operations also include our corporate headquarters, administrative offices, distribution centers, a merchandise return center, and customer care centers. All of our properties are owned except as noted in the following table, which also provides information regarding the general location, use, and approximate size of our principal non-retail properties at the end of 2016:
Property | Location | Square Footage | Segment That Uses Property | ||||
Distribution Center (1) | Wheeling, West Virginia | 1,165,000 | Merchandising | ||||
Distribution Center | Prairie du Chien, Wisconsin | 1,055,000 | Merchandising | ||||
Distribution Center | Sidney, Nebraska | 761,000 | Merchandising | ||||
Distribution Center | Tooele, Utah | 600,000 | Merchandising | ||||
Distribution Center (1) | Puyallup, Washington | 98,000 | Merchandising | ||||
Total for Distribution Centers | 3,679,000 | ||||||
Corporate Headquarters | Sidney, Nebraska | 454,000 | Merchandising | ||||
Customer Care Center and Administrative Offices | Sidney, Nebraska | 94,000 | Merchandising | ||||
Administrative Offices | Sidney, Nebraska | 42,000 | Merchandising | ||||
Merchandise Return Center | Oshkosh, Nebraska | 52,000 | Merchandising | ||||
Customer Care Center | North Platte, Nebraska | 12,000 | Merchandising | ||||
Customer Care Center and Administrative Offices | Kearney, Nebraska | 151,000 | Merchandising | ||||
Customer Care Center (1) | Grand Island, Nebraska | 12,000 | Financial Services and Merchandising | ||||
Customer Care Center, Bank Operations, and Administrative Offices (2) | Lincoln, Nebraska | 126,000 | Financial Services and Merchandising | ||||
Data Information Center (1) | La Vista, Nebraska | 33,000 | Merchandising | ||||
Data Information Center | Papillion, Nebraska | 16,000 | Financial Services and Merchandising | ||||
Marketing and Information Technology Center (1) | Westminster, Colorado | 12,000 | Merchandising | ||||
Canada Headquarters, Customer Care Center and Administrative Offices | Winnipeg, Manitoba | 53,000 | Merchandising | ||||
(1) | Leased property. |
(2) | Includes 10,000 square feet of leased property. |
25
The following table shows, by number of stores in the United States and Canada, the retail square footage used in our Merchandising segment operations for stores owned, stores subject to ground leases, and retail stores leased by store format, all at the end of 2016.
Number of Stores and Square Footage by Store Format (1) | ||||||||||||||||||
New Format Stores | Legacy Stores | Total | ||||||||||||||||
Location | No. of Stores | Square Footage | No. of Stores | Square Footage | No. of Stores | Square Footage | ||||||||||||
Stores in the United States (36 states): | ||||||||||||||||||
Owned | 26 | 2,099,000 | 24 | 3,660,000 | 50 | 5,759,000 | ||||||||||||
Owned - with ground lease (2) | 17 | 1,256,000 | 1 | 182,000 | 18 | 1,438,000 | ||||||||||||
Leased (3) | 3 | 256,000 | 3 | 393,000 | 6 | 649,000 | ||||||||||||
Totals | 46 | 3,611,000 | 28 | 4,235,000 | 74 | 7,846,000 | ||||||||||||
Stores in Canada (six provinces): | ||||||||||||||||||
Owned | 4 | 240,000 | — | — | 4 | 240,000 | ||||||||||||
Owned - with ground lease (2) | 6 | 382,000 | — | — | 6 | 382,000 | ||||||||||||
Leased (3) | 1 | 50,000 | — | — | 1 | 50,000 | ||||||||||||
Totals | 11 | 672,000 | — | — | 11 | 672,000 | ||||||||||||
Totals | 57 | 4,283,000 | 28 | 4,235,000 | 85 | 8,518,000 | ||||||||||||
(1) | Our new format stores range in size from approximately 40,000 to 100,000 square feet. Legacy stores refer to our large-format traditional retail stores that opened in August 2008 and earlier. |
(2) | Store locations with ground leases in the United States are: East Hartford, Connecticut; Christiana, Delaware; Ammon, Idaho; Bowling Green, Kentucky; Lexington, Kentucky; Louisville, Kentucky; Berlin, Massachusetts; Kalispell, Montana; Missoula, Montana; Cheektowaga, New York; Garner, North Carolina; Tualatin, Oregon; Greenville, South Carolina; Lubbock, Texas; Short Pump, Virginia; Union Gap, Washington; Charleston, West Virginia; and Green Bay, Wisconsin. |
Store locations with ground leases in Canada are: Calgary, Alberta; North Edmonton, Alberta; South Edmonton, Alberta; Abbotsford, British Columbia; Barrie, Ontario; and Saskatoon, Saskatchewan.
(3) | We lease the following stores in the United States: Grand Junction, Colorado; Boise, Idaho; Scarborough, Maine; Hazelwood, Missouri; Springfield, Oregon; and Tulalip, Washington. We also lease a store in Nanaimo, British Columbia, Canada. |
Also, in connection with some of the economic development packages received from state or local governments where our stores are located, we have entered into agreements granting ownership of the taxidermy, diorama, or other portions of our stores to these state and local governments. At December 31, 2016, the total net book value of our property and equipment was $1.8 billion, and we believe that our properties and equipment were suitable for their intended use.
ITEM 3. LEGAL PROCEEDINGS
For a discussion of legal proceedings, see Note 17 “Commitments and Contingencies - Litigation and Claims” of the Notes to Consolidated Financial Statements included in Part II, Item 8 of this Form 10-K, which is incorporated herein by reference.
ITEM 4. MINE SAFETY DISCLOSURES
Not applicable.
26
PART II
ITEM 5. MARKET FOR REGISTRANT’S COMMON EQUITY, RELATED STOCKHOLDER MATTERS AND ISSUER PURCHASES OF EQUITY SECURITIES
Price Range of Common Stock
The common stock of Cabela’s Incorporated is listed for trading on the New York Stock Exchange under the symbol “CAB.” As of February 13, 2017, there were 733 holders of record of our common stock. This number does not include persons who hold our common stock in nominee or “street name” accounts through brokers or banks.
The following table sets forth, for the fiscal quarters indicated, the high and low sales prices per share of our common stock as reported on the New York Stock Exchange:
2016 | 2015 | ||||||||||||||
High | Low | High | Low | ||||||||||||
First Quarter | $ | 49.71 | $ | 38.90 | $ | 58.90 | $ | 49.65 | |||||||
Second Quarter | 53.79 | 46.22 | 58.56 | 50.07 | |||||||||||
Third Quarter | 55.07 | 47.78 | 52.19 | 39.52 | |||||||||||
Fourth Quarter | 63.60 | 57.36 | 48.99 | 33.03 | |||||||||||
Issuer Purchases of Equity Securities
On August 23, 2011, our Board of Directors authorized a share repurchase program that provides for share repurchases on an ongoing basis to offset dilution resulting from equity awards under the Company’s current or future equity compensation plans. These shares are to be repurchased from time to time in open market transactions or privately negotiated transactions at our discretion, subject to market conditions, customary blackout periods, and other factors. This share repurchase program does not obligate us to repurchase any outstanding shares, and the program may be limited or terminated at any time.
On September 1, 2015, we announced that our Board of Directors approved a share repurchase program authorizing the Company to repurchase up to $500 million of its common stock over a two-year period. This authorization was in addition to the standing annual authorization to repurchase shares to offset dilution resulting from equity-based awards issued under the Company’s equity compensation plans. The total amount of share repurchases that the Company can make in a year is limited to 75% of its prior year consolidated earnings before interest, taxes, depreciation and amortization, as defined, pursuant to a covenant requirement of its credit agreement. We did not engage in any stock repurchase activity in any of the three fiscal months in the fourth fiscal quarter ended December 31, 2016, nor did we engage in any stock repurchase activity in 2016. As of December 31, 2016, up to $426 million of authorization to repurchase our common stock remained under this program. Under this authorization, we repurchased 1,989,305 shares of our common stock at a total cost of $74 million in 2015.
Pursuant to the terms of the Merger Agreement, the Company generally may not repurchase shares of its common stock, except in connection with the exercise of outstanding stock options or the settlement of restricted stock unit awards. As a result, the Company does not anticipate repurchasing any further shares under the above-referenced programs.
27
Stock Performance Graph
The following stock performance graph and table show Cabela’s cumulative total shareholder return on a semi-annual basis as of the last respective trading date for the five fiscal years ended December 31, 2016. The graph and table also show the cumulative total returns of the Standard and Poor’s (“S&P”) 500 Retailing Index and the S&P 500 Index. The graph and table assume that $100 was invested on December 30, 2011.
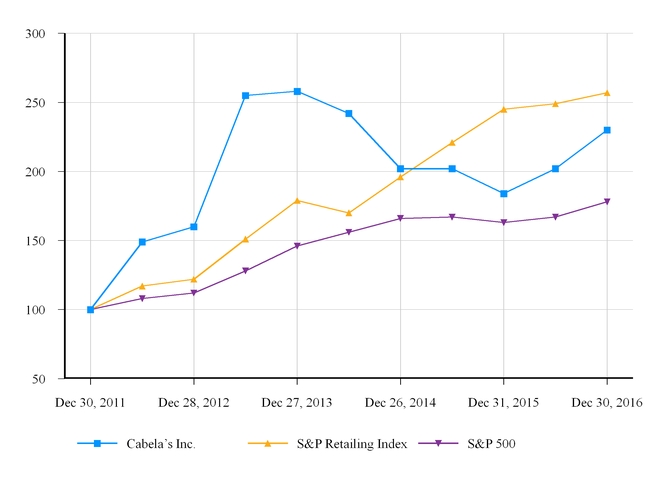
Dec 30, 2011 | Jun 29, 2012 | Dec 28, 2012 | Jun 28, 2013 | Dec 27, 2013 | Jun 27, 2014 | Dec 26, 2014 | Jun 26, 2015 | Dec 31, 2015 | Jul 1, 2016 | Dec 30, 2016 | ||||||||||||||||||||||||||||||||||
Cabela’s Inc. | $ | 100 | $ | 149 | $ | 160 | $ | 255 | $ | 258 | $ | 242 | $ | 202 | $ | 202 | $ | 184 | $ | 202 | $ | 230 | ||||||||||||||||||||||
S&P Retailing Index | 100 | 117 | 122 | 151 | 179 | 170 | 196 | 221 | 245 | 249 | 257 | |||||||||||||||||||||||||||||||||
S&P 500 | 100 | 108 | 112 | 128 | 146 | 156 | 166 | 167 | 163 | 167 | 178 | |||||||||||||||||||||||||||||||||
Dividend Policy
We have never declared or paid any cash dividends on our common stock and do not anticipate paying any cash dividends on our common stock in the foreseeable future. Pursuant to the terms of the Merger Agreement, the Company is also prohibited from declaring or paying any dividends or other distributions on its common stock. In addition, our revolving credit facility and our senior notes limit our ability to pay dividends to our stockholders. We do not anticipate paying any dividends or other distributions on our common stock in the foreseeable future.
Equity Compensation Plans
For information on securities authorized for issuance under our equity compensation plans, see “Item 12 - Security Ownership of Certain Beneficial Owners and Management and Related Stockholder Matters.”
28
ITEM 6. SELECTED FINANCIAL DATA
Fiscal Year (1) | |||||||||||||||||||
2016 | 2015 | 2014 | 2013 | 2012 | |||||||||||||||
Operations Data: | (In Thousands Except Earnings per Share and Number of Stores) | ||||||||||||||||||
Revenue: | |||||||||||||||||||
Merchandise sales | $ | 3,558,019 | $ | 3,481,375 | $ | 3,200,219 | $ | 3,205,632 | $ | 2,778,903 | |||||||||
Financial Services revenue | 543,061 | 502,543 | 430,385 | 375,810 | 319,399 | ||||||||||||||
Other revenue | 28,279 | 13,784 | 17,046 | 18,135 | 14,380 | ||||||||||||||
Total revenue | 4,129,359 | 3,997,702 | 3,647,650 | 3,599,577 | 3,112,682 | ||||||||||||||
Total cost of revenue | 2,426,985 | 2,286,932 | 2,060,289 | 2,030,829 | 1,769,798 | ||||||||||||||
Selling, distribution, and administrative expenses | 1,414,312 | 1,387,647 | 1,251,325 | 1,201,519 | 1,046,861 | ||||||||||||||
Impairment and restructuring charges | 14,122 | 15,331 | 641 | 5,868 | 20,324 | ||||||||||||||
Operating income | 273,940 | 307,792 | 335,395 | 361,361 | 275,699 | ||||||||||||||
Interest expense, net | (31,481 | ) | (22,882 | ) | (21,842 | ) | (21,854 | ) | (20,123 | ) | |||||||||
Other non-operating income, net | 5,141 | 9,717 | 4,924 | 4,021 | 6,138 | ||||||||||||||
Income before provision for income taxes | 247,600 | 294,627 | 318,477 | 343,528 | 261,714 | ||||||||||||||
Provision for income taxes | 100,653 | 105,297 | 116,762 | 119,138 | 88,201 | ||||||||||||||
Net income | $ | 146,947 | $ | 189,330 | $ | 201,715 | $ | 224,390 | $ | 173,513 | |||||||||
Earnings per basic share | $ | 2.15 | $ | 2.70 | $ | 2.84 | $ | 3.18 | $ | 2.48 | |||||||||
Earnings per diluted share | $ | 2.13 | $ | 2.67 | $ | 2.81 | $ | 3.13 | $ | 2.42 | |||||||||
Selected Balance Sheet Data: | |||||||||||||||||||
Cash and cash equivalents (2) | $ | 263,825 | $ | 315,066 | $ | 142,758 | $ | 199,072 | $ | 288,750 | |||||||||
Credit card loans, net (3) | 5,579,575 | 5,035,267 | 4,421,185 | 3,938,630 | 3,497,472 | ||||||||||||||
Inventories | 860,360 | 819,271 | 760,293 | 644,883 | 552,575 | ||||||||||||||
Working capital (2)(5) | 4,346,808 | 4,009,369 | 3,816,820 | 3,873,732 | 3,159,678 | ||||||||||||||
Total assets (5) | 8,970,824 | 8,463,004 | 7,667,595 | 6,389,101 | 5,741,593 | ||||||||||||||
Total debt excluding Financial Services segment (5) | 751,186 | 859,350 | 499,558 | 330,825 | 336,213 | ||||||||||||||
Total debt of Financial Services segment (5) | 5,160,118 | 4,765,831 | 4,325,741 | 3,564,089 | 3,194,270 | ||||||||||||||
Total stockholders’ equity | 2,011,599 | 1,828,643 | 1,817,510 | 1,606,334 | 1,375,979 | ||||||||||||||
Other Data: | |||||||||||||||||||
Depreciation and amortization | $ | 150,163 | $ | 132,572 | $ | 113,097 | $ | 93,407 | $ | 79,269 | |||||||||
Property and equipment additions (4) | $ | 152,123 | $ | 361,186 | $ | 435,636 | $ | 347,956 | $ | 230,009 | |||||||||
Retail store square footage, at year end | 8,518 | 7,932 | 6,911 | 5,890 | 5,142 | ||||||||||||||
Number of stores, at year end | 85 | 77 | 64 | 50 | 40 | ||||||||||||||
(1) | The Company follows a 52/53 week fiscal year-end cycle. Fiscal years 2016, 2014, 2013, and 2012 each consisted of 52 weeks and fiscal year 2015 consisted of 53 weeks. The fiscal year end of WFB is December 31st. |
(2) | Includes amounts for the Financial Services segment totaling $150 million, $157 million, $49 million, $94 million, and $91 million at years ended 2016, 2015, 2014, 2013, and 2012, respectively. Regulatory restrictions limit our ability to use this cash for non-banking operations, including its use as working capital or for retail store growth. |
(3) | Includes restricted credit card loans of the Cabela’s Master Credit Card Trust and related entities, of which WFB is the primary beneficiary, net of allowance for loan losses and deferred loan origination costs. |
(4) | Includes accrued property and equipment additions. |
(5) | The balances for years 2012 through 2015 were revised to reflect the effects of adopting in 2016 the guidance of Accounting Standards Update 2015-03, “Simplifying the Presentation of Debt Issuance Costs,” which required that debt issuance costs related to a recognized debt liability be presented in the balance sheet as a direct deduction from the carrying amount of that debt liability. Working capital for years 2015 and 2014 only were impacted by this revision. |
29
ITEM 7. MANAGEMENT’S DISCUSSION AND ANALYSIS OF FINANCIAL CONDITION AND RESULTS OF OPERATIONS
The following discussion and analysis of financial condition, results of operations, liquidity, and capital resources should be read in conjunction with our audited consolidated financial statements and notes thereto appearing elsewhere in this report. Cabela’s Incorporated and its wholly-owned subsidiaries are referred to herein as “Cabela’s,” “Company,” “we,” “our,” or “us.”
Forward Looking Statements – Our discussion contains forward-looking statements with respect to our plans and strategies for our businesses and the business environment that are impacted by risks and uncertainties. Refer to “Special Note Regarding Forward-Looking Statements” preceding Part I, Item 1, and to Item 1A, “Risk Factors” for information regarding certain of the risks and uncertainties that affect our business and the industries in which we operate. Please note that our actual results may differ materially from those we may estimate or project in any of these forward-looking statements.
Recent Developments
On October 3, 2016, the Company entered into an Agreement and Plan of Merger (the “Merger Agreement”), by and among Bass Pro Group, LLC, a Delaware limited liability company (“Bass Pro Group”), Prairie Merger Sub, Inc., a Delaware corporation and a wholly owned subsidiary of Bass Pro Group (“Sub”), and the Company. The Merger Agreement provides for the merger of Sub with and into the Company, on the terms and subject to the conditions set forth in the Merger Agreement (the “Merger”), with the Company continuing as the surviving corporation in the Merger. As a result of the Merger, the Company would become a wholly owned subsidiary of Bass Pro Group. In connection with the entry into the Merger Agreement, the Company also entered into a Sale and Purchase Agreement, dated as of October 3, 2016 (the “Bank Purchase Agreement”), by and among the Company, World’s Foremost Bank (“WFB,” “Financial Services segment,” or “Cabela’s CLUB”), and Capital One, National Association (“Capital One”) relating to the assets of WFB. The Bank Purchase Agreement provides for, in connection with the closing of the Merger, the sale to Capital One of the business of WFB, which includes the credit card program operated by the Company, using WFB as the issuer (the “Bank Transaction”).
For additional information related to the Merger Agreement, the Bank Purchase Agreement, and related transactions, refer to Item 1A, “Risk Factors” – “Risk Factors Related to the Proposed Merger with Bass Pro Group, LLC and the Related Bank Transaction,” our Current Reports on Form 8-K filed with the SEC on October 7, 2016, November 29, 2016, and December 30, 2016, and subsequent filings, and Note 2 “Merger Agreement” of the Notes to Consolidated Financial Statements.
Fiscal 2016 Executive Overview
We are a leading specialty omni-channel retailer of hunting, fishing, camping, shooting sports, and related outdoor merchandise. We provide a quality service to our customers who are able to access our multiple channels when making a purchase, including retail stores, online, and mobile channels. We supply our customers products through our multi-channel merchandising distribution network consisting of in-store customer pickup or by direct shipment to the customer from one of our distribution centers, retail stores, or vendor drop-ship. Our Internet and catalog business is comprised of our highly acclaimed website and supplemented by our catalog distributions as a selling and marketing tool. Our Financial Services segment is comprised of our credit card services, which reinforces our strong brand, strengthens our customer loyalty through our credit card loyalty programs and plays an integral role in supporting our merchandising business.
Our Vision 2020 is to be the world’s best omni-channel retailer and is anchored by six strategic focus areas: (i) improve top-line sales, (ii) increase bottom-line profits, (iii) retail store expansion, (iv) customers first, (v) focus on all outfitters, and (vi) grow Cabela’s CLUB. Results relating to these focus areas are discussed below and in “Management’s Discussion and Analysis of Financial Condition and Results of Operations” – “2016 Compared to 2015.”
As of December 31, 2016, we operated 85 stores, including the eight new stores that we opened in 2016 as follows:
• | Lexington, Kentucky; and League City, Texas; in March; |
• | Short Pump, Virginia; Centerville, Ohio; and Farmington, Utah; in April; |
• | Abbotsford, British Columbia, Canada; in June; |
• | Avon, Ohio; in August; and |
• | Ottawa, Ontario, Canada; in September. |
30
At December 31, 2016, we had 74 stores located in the United States and 11 in Canada with total retail square footage of 8.5 million, an increase of 7% over 2015. We are currently evaluating store locations and new stores to open beyond 2016, but we plan to open fewer stores than we have in the recent past. We have announced plans to open new stores in Gainesville, Virginia; Halifax, Nova Scotia, Canada; McDonough, Georgia; Albuquerque, New Mexico; Chesterfield Township, Michigan; and El Paso, Texas.
Effective the beginning of fiscal year 2016, we realigned our organizational structure and updated our reportable operating segments into two segments - Merchandising and Financial Services. Results of operations for fiscal years 2015 and 2014 have been recast to reflect these new segments and are presented in our “Management’s Discussion and Analysis of Financial Condition and Results of Operations” and in Note 23 “Segment Reporting” of the Notes to Consolidated Financial Statements. For more information on this change in segments see Note 23 “Segment Reporting” of the Notes to Consolidated Financial Statements.
Comparisons and analysis of selected financial data are presented below for the years ended:
Increase (Decrease) | % Change | |||||||||||||
2016 | 2015 | |||||||||||||
(Dollars in Thousands Except Earnings Per Diluted Share) | ||||||||||||||
Revenue: | ||||||||||||||
Merchandise sales | $ | 3,558,019 | $ | 3,481,375 | $ | 76,644 | 2.2 | % | ||||||
Financial Services | 543,061 | 502,543 | 40,518 | 8.1 | ||||||||||
Other revenue | 28,279 | 13,784 | 14,495 | 105.2 | ||||||||||
Total revenue | $ | 4,129,359 | $ | 3,997,702 | $ | 131,657 | 3.3 | |||||||
Operating income | $ | 273,940 | $ | 307,792 | $ | (33,852 | ) | (11.0 | ) | |||||
Net income | $ | 146,947 | $ | 189,330 | $ | (42,383 | ) | (22.4 | ) | |||||
Earnings per diluted share | $ | 2.13 | $ | 2.67 | $ | (0.54 | ) | (20.2 | ) | |||||
Revenues for 2016 totaled $4.1 billion, an increase of $132 million, or 3.3%, compared to 2015, primarily due to increases in total merchandise sales of $77 million and Financial Services revenue of $41 million. Amounts for 2015 reflected in the table above consisted of 53 weeks.
Total merchandise sales increased $77 million, or 2.2%, in 2016 compared to 2015. The most significant factors contributing to the net increase in total merchandise sales comparing 2016 to 2015 included the following:
• | An increase of $251 million due to the addition of new retail stores. |
• | The 53rd week in 2015 totaled $83 million in total merchandise sales (retail store sales increased by $67 million and Internet and catalog sales increased by $16 million). |
• | Comparable store sales on a consolidated basis for 2016, on a shift-adjusted calendar basis, decreased $82 million, or 3.3%, compared to 2015. Comparable store sales results for our stores in the United States, which exclude Canada results and the impact of foreign currency exchange rate fluctuations, decreased 3.0% compared to 2015 mostly due to decreases in the clothing and footwear and general outdoors product categories. The decrease in comparable store sales for our stores in the United States comparing the respective years was driven by a decrease in the number of customer transactions of 7.5%, partially offset by an increase in the average sales per transaction of 5.0%. |
• | A decrease of $35 million (adjusted for 52 weeks) in Internet and catalog sales compared to 2015, primarily due to decreases in the clothing and footwear and general outdoors product categories. |
• | A net increase of $26 million primarily attributable to adjustments year over year in the allowance for sales returns that were estimated at the time merchandise sales were recognized based upon the Company’s evaluation of anticipated merchandise sales returns. |
31
As mentioned above, fiscal 2015 consisted of 53 weeks and fiscal 2016 consisted of 52 weeks. The table below presents revenue results for 2015 excluding the effect of revenue earned in the last week of 2015 in order to show comparable data with 2016 and reconciles our presentation of total revenue in accordance with generally accepted accounting principles ("GAAP") to the non-GAAP presentation excluding the 53rd week results. Management believes these non-GAAP financial results for 2016 provide useful supplemental information to investors regarding revenues and trends and performance of our ongoing operations and are useful for year-over-year comparisons of such results. In addition, management evaluates results using non-GAAP adjusted total revenue. These non-GAAP results should not be considered in isolation or as a substitute for total revenue calculated in accordance with GAAP. Financial Services was not adjusted because its reporting periods end on a calendar year.
2016 | 2015 (GAAP, as reported) | 2015 (53rd week) | 2015 (Non-GAAP, as adjusted) | Increase (Decrease) | % Change | |||||||||||||||||
(Dollars in Thousands) | ||||||||||||||||||||||
Revenue: | ||||||||||||||||||||||
Merchandise sales | $ | 3,558,019 | $ | 3,481,375 | $ | (83,085 | ) | $ | 3,398,290 | $ | 159,729 | 4.7 | % | |||||||||
Financial Services | 543,061 | 502,543 | — | 502,543 | 40,518 | 8.1 | ||||||||||||||||
Other revenue | 28,279 | 13,784 | (900 | ) | 12,884 | 15,395 | 119.5 | |||||||||||||||
Total revenue | $ | 4,129,359 | $ | 3,997,702 | $ | (83,985 | ) | $ | 3,913,717 | $ | 215,642 | 5.5 | ||||||||||
The 53rd week in 2015 increased merchandise sales by $83 million; therefore, adjusted for 52 weeks, merchandise sales increased $160 million in 2016 compared to 2015. Comparing 2016 to 2015, adjusted to be on a comparable 52-week year, total revenue for 2016 increased 5.5% compared to 2015, and total revenue (merchandise sales plus other revenue) in our merchandising business for 2016 increased $175 million, or 5.1%, compared to 2015.
We will continue in 2017 to monitor and take steps that are needed to respond to any number of consumer-related factors that may impact our planned improvement in comparable store sales on an annual basis. These steps may include the timing of discounts offered and promotional events to meet consumer preferences or actions taken by our competitors. In addition, we will also continue to look at our strategic space allocation and improve space utilization within our stores, as well as changing our brand assortment between national brands and Cabela’s brand. We will also keep working closely with our vendors and actively manage our inventory levels to ensure that we have the adequate quantity and assortment of necessary products available to meet any such consumer-related factors.
Financial Services revenue increased $41 million, or 8.1%, in 2016 compared to 2015. The increase in Financial Services revenue was primarily due to increases in interest and fee income and interchange income. The increase in interest and fee income was primarily due to increases in credit card loans and the revolving rate, and the increase in interchange income was primarily due to increases in credit card purchases. Partially offsetting these increases were increases in the provision for loan losses and interest expense. The increase to the provision for loan losses of $63 million was due to increases in loan delinquencies and, to a lesser extent, growth in the average outstanding balance of credit card loans. The increase in interest expense was due to increases to debt as a result of financing the growth of receivables and liquidity needs.
Merchandise gross profit decreased $51 million, or 4.2%, to $1.1 billion in 2016 compared to 2015 primarily due to an aggressive pricing, promotion, and markdown strategy. Merchandise gross profit as a percentage of merchandise sales decreased 210 basis points to 32.2% in 2016 from 34.3% in 2015. The decrease in 2016 compared to 2015 was primarily due to an aggressive pricing, promotion, and markdown strategy, as well as an effort to right size inventory levels, which had an impact of approximately 140 basis points, and increased sales of lower margin firearms, ammunition, and powersports products combined with lower sales in our higher margin soft goods and apparel categories, which had an impact of approximately 70 basis points.
The following discussions related to selling, distribution, and administrative (“SD&A”) expenses; impairment and restructuring charges; operating income; and operating income of the Merchandising segment are presented in accordance with GAAP and as non-GAAP adjusted financial measures. In light of the nature and magnitude, we believe these items should be presented separately to enhance a reader’s overall understanding of the Company’s ongoing operations. These non-GAAP adjusted financial measures should be considered in conjunction with the GAAP financial measures.
32
Accordingly, to supplement the following discussions related to SD&A expenses; SD&A expenses as a percentage of total revenue; impairment and restructuring charges; operating income; operating income as a percentage of total revenue; operating income of the Merchandising segment; and operating income of the Merchandising segment as a percentage of total Merchandising segment revenue presented in accordance with GAAP, we are providing related non-GAAP adjusted financial measures that exclude certain items, which are presented below both as GAAP reported and non-GAAP financial measures excluding:
• | consulting fees and certain other expenses totaling $30 million in 2016 compared to $6 million in 2015 primarily related to costs associated with the Company’s corporate restructuring initiatives incurred in both years and the review of strategic alternatives incurred in 2016; |
• | a charge recognized on a settlement totaling $4 million relating to a lawsuit in California state court (a “lawsuit settlement”) in 2016; |
• | impairment and restructuring charges totaling $14 million in 2016 compared to $15 million in 2015; |
• | a penalty of $1 million associated with the Company’s settlement with the Securities and Exchange Commission (“SEC”) in 2015; and |
• | incremental expenses of $1 million related to the transition and closing of our distribution center in Canada in 2015. |
We believe these non-GAAP adjusted financial measures provide useful supplemental information to investors regarding the underlying business trends and performance of our ongoing operations and are useful for year-over-year comparisons of such operations. In addition, we evaluate results using non-GAAP adjusted operating income. These non-GAAP adjusted financial measures should not be considered in isolation or as a substitute for operating income, or any other measure calculated in accordance with GAAP.
The following table reconciles these financial measures to the related GAAP adjusted financial measures for the years ended 2016 and 2015.
Reconciliation of GAAP Reported to Non-GAAP Adjusted Financial Measures (1) | |||||||||||||||||||||||
2016 | 2015 | ||||||||||||||||||||||
GAAP Basis as Reported | Non-GAAP Adjustments | Non-GAAP Amounts | GAAP Basis as Reported | Non-GAAP Adjustments | Non-GAAP Amounts | ||||||||||||||||||
(Dollars in Thousands Except Earnings Per Share) | |||||||||||||||||||||||
Total revenue (2) | $ | 4,129,359 | $ | (10,000 | ) | $ | 4,119,359 | $ | 3,997,702 | $ | — | $ | 3,997,702 | ||||||||||
Total cost of revenue (2) | 2,426,985 | (5,638 | ) | 2,421,347 | 2,286,932 | — | 2,286,932 | ||||||||||||||||
SD&A expenses (3) | 1,414,312 | (34,050 | ) | 1,380,262 | 1,387,647 | (8,626 | ) | 1,379,021 | |||||||||||||||
SD&A expenses as a percentage of total revenue | 34.3 | % | (0.8 | )% | 33.5 | % | 34.7 | % | (0.2 | )% | 34.5 | % | |||||||||||
Impairment and restructuring charges (4) | $ | 14,122 | $ | (14,122 | ) | $ | — | $ | 15,331 | $ | (15,331 | ) | $ | — | |||||||||
Operating income (2) (3) (4) | 273,940 | 43,810 | 317,750 | 307,792 | 23,957 | 331,749 | |||||||||||||||||
Operating income as a percentage of total revenue | 6.6 | % | 1.1 | % | 7.7 | % | 7.7 | % | 0.6 | % | 8.3 | % | |||||||||||
Merchandising segment: | |||||||||||||||||||||||
Operating income (2) (3) (4) | $ | 73,494 | $ | 43,810 | $ | 117,304 | $ | 134,804 | $ | 23,957 | $ | 158,761 | |||||||||||
Operating income as a percentage of total segment revenue | 2.0 | % | 1.3 | % | 3.3 | % | 3.9 | % | 0.6 | % | 4.5 | % | |||||||||||
(1) | The presentation includes non-GAAP financial measures. These non-GAAP financial measures are not prepared under any comprehensive set of accounting rules or principles, and do not reflect all of the amounts associated with the Company's results of operations as determined in accordance with GAAP. |
(2) | Reflects the selling price, classified in other revenue, and related cost (basis) of a property which was sold in 2016. This sale and pre-tax gain on sale is shown as a non-GAAP item since this property had been impaired in previous years with the impairment losses shown as a non-GAAP item. |
33
(3) Consists of the following for the years ended:
2016 | 2015 | ||||||
Consulting fees and certain other expenses primarily related to costs associated with the Company’s corporate restructuring initiatives incurred in both years and the review of strategic alternatives incurred in 2016 | $ | 30,200 | $ | 6,419 | |||
Charge related to a lawsuit settlement | 3,850 | — | |||||
Penalty associated with the Company’s settlement with the SEC | — | 1,000 | |||||
Incremental expenses related to the transition and closing of the distribution center in Canada | — | 1,207 | |||||
$ | 34,050 | $ | 8,626 | ||||
(4) Consists of the following for the years ended:
2016 | 2015 | ||||||
Charges for employee severance agreements and termination benefits related to the Company’s corporate restructuring and reduction in the number of personnel | $ | 4,003 | $ | 5,556 | |||
Impairment losses on property, equipment, and other assets | 6,971 | 5,901 | |||||
Accumulated amortization of deferred grant income relating to fair value adjustments on economic development bonds | 2,252 | — | |||||
Write-off of costs pertaining to store sites previously identified as future retail store locations but decided not to develop | 896 | 3,874 | |||||
$ | 14,122 | $ | 15,331 | ||||
SD&A expenses increased $27 million in 2016 compared to 2015 primarily due to a net increase in costs totaling $28 million related to corporate restructuring initiatives, the review of strategic alternatives, and a charge recognized on a lawsuit settlement in 2016, as well as additional costs from increases in the number of new stores and costs in related support areas. Although operating expenses increased $27 million comparing the respective years, operating expenses as a percentage of total revenue decreased 40 basis points as a result of our expense and process improvement initiatives. On a non-GAAP basis, excluding the impact of certain expenses, as reflected in the table above entitled “Reconciliation of GAAP Reported to Non-GAAP Adjusted Financial Measures,” SD&A expenses increased $1 million comparing the respective years, and as a percentage of total revenue, decreased 100 basis points in 2016 compared to 2015.
In the second half of 2015, we launched a major multi-year corporate restructuring project that continued throughout 2016 aimed at lowering the Company’s operating expense base to increase our return on invested capital. We have identified numerous meaningful savings opportunities across the Company, including information technology process improvement, indirect procurement, retail labor optimization, merchandise sourcing, retail support functions, and supply chain enhancements, some of which we have already implemented. Such opportunities are expected to result in a reduction of operating expenses as a percentage of total revenue of up to 150 basis points over the next three years compared to the 2015 base year of 34.5% on a non-GAAP basis. As we focus on expense management controls consistent with our multi-year corporate restructuring project, we plan to continue our omni-channel initiatives, our Cabela’s branded product investments, and our retail growth. We will continue to manage our operating costs accordingly into fiscal year 2017 and beyond.
Operating income decreased $34 million, or 11.0%, in 2016 compared to 2015, and operating income as a percentage of revenue decreased 110 basis points to 6.6% in 2016 compared to 7.7% in 2015. The decrease in operating income was primarily attributable to decreases in our merchandise gross profit and increases in consolidated operating expenses, partially offset by a decrease in impairment and restructuring charges. On a non-GAAP basis, excluding the impact of certain expenses and charges, as reflected in the table above entitled “Reconciliation of GAAP Reported to Non-GAAP Adjusted Financial Measures,” operating income decreased $14 million and operating income as a percentage of total revenue decreased 60 basis points comparing 2016 to 2015.
34
The following summarizes the operating results of our business segments. For a more detailed discussion, see “Results of Operations - 2016 Compared to 2015”.
Merchandising segment results for 2016 compared to 2015 were as follows:
• | total merchandise sales and other revenue increased $91 million, or 2.6% (adjusted for the 53rd week in 2015, total merchandise sales and other revenue increased $175 million, or 5.1%); |
• | operating income decreased $61 million, or 45.5%; |
• | operating income as a percentage of Merchandising segment revenue decreased 190 basis points to 2.0%; and |
• | comparable store sales on a consolidated basis decreased 3.3%, and for our United States locations decreased 3.0%, both percentages adjusted to be on a comparable 52-week year with 2015. |
On a non-GAAP basis, excluding the impact of certain expenses and charges as reflected in the table above entitled “Reconciliation of GAAP Reported to Non-GAAP Adjusted Financial Measures,” the Merchandising segment operating income decreased $41 million, to $117 million, comparing 2016 to 2015. On a non-GAAP basis, operating income as a percentage of Merchandising segment revenue decreased 120 basis points, to 3.3%, comparing 2016 to 2015.
Cabela’s CLUB continues to manage its credit card delinquencies and charge-offs through active account management. Comparing Cabela’s CLUB results for 2016 to 2015:
• | the average number of active accounts increased 6.4% to 2.1 million, and the average balance per active account increased $179; |
• | the average balance of our credit card loans increased 14.7% to $5.1 billion; |
• | net purchases on credit card accounts increased 5.2% to $21.3 billion; and |
• | net charge-offs as a percentage of average credit card loans increased 65 basis points to 2.35%. |
During 2016, the Financial Services segment also issued $507 million in certificates of deposit, completed a term securitization totaling $1.0 billion, and increased three variable funding facilities from $1.1 billion to $3.0 billion. In addition, the maturity dates of two of the variable funding facilities were extended to March 2019 and September 2019.
Current Business Environment
Macroeconomic Environment – In 2016, the consumer environment continued to be challenging across our business channels. To address these issues, we increased our promotional activity, adjusted our marketing spending, and implemented operating expense controls to levels consistent with how our business was performing. In addition, in the last half of 2015, we launched a major multi-year corporate restructuring project that we continued through 2016 aimed at lowering the Company's operating expenses. The Financial Services segment continues to monitor developments in the securitization and certificates of deposit markets to ensure adequate access to liquidity. Cabela’s CLUB continues to manage its credit card delinquencies and charge-offs through active account management.
Developments in Legislation and Regulation – Since the latter part of 2012, there has been significant discussion regarding enacted gun control legislation and potential gun control legislation, primarily aimed at modern sporting rifles, certain semiautomatic pistols, and high capacity magazines. For example, the States of Colorado, Connecticut, Maryland, and New York have enacted legislation that prohibits the sale of certain high capacity magazines and, in some cases, the sale of certain firearms. We do not expect this state legislation to have a significant impact on our business. In addition any new federal legislation that prohibits the sale of certain modern sporting rifles, semiautomatic pistols, or ammunition could negatively impact our hunting equipment sales.
Pursuant to certain liquidity requirements under the interim final rules and the joint final rules implemented under the regulatory capital reforms recommended by the Basel Committee on Banking Supervision in December 2010 (referred to as “Basel III”), the noteholders under all of the variable funding facilities issued under WFB’s securitization program have requested and obtained amendments to their respective transaction documents. In one case, the amendments permit the noteholders to delay funding an advance requested under that facility for up to 35 days. In the other cases, the amendments require WFB to provide 35 days’ prior notice in connection with requests for some or all of the advances. These changes and any similar changes requested by the noteholders under any other variable funding facility could delay or disrupt access to funding under the variable funding facilities. Moreover, the liquidity requirements under Basel III could result in an increase in the borrowing costs under the variable funding facilities.
35
The Dodd-Frank Wall Street Reform and Consumer Protection Act (the “Reform Act”) was signed into law in July 2010 and has made extensive changes to the laws regulating financial services firms and credit rating agencies and requires significant rule-making. The changes resulting from the Reform Act may impact our profitability, require changes to certain Financial Services segment business practices, impose upon the Financial Services segment more stringent capital, liquidity, and leverage ratio requirements, increase the Federal Deposit Insurance Corporation’s (“FDIC”) deposit insurance premiums, or otherwise adversely affect the Financial Services segment’s business. These changes may also require the Financial Services segment to invest significant management attention and resources to evaluate and make necessary changes.
The Reform Act also established the Consumer Financial Protection Bureau (the “Bureau”) within the Federal Reserve, a new federal consumer protection regulator. The Bureau has broad rulemaking and enforcement authority over providers of credit, savings, and payment services and products, and WFB is subject to its regulation. While the Bureau does not currently examine WFB, it receives information from the FDIC, WFB’s primary regulator. The Bureau also has rulemaking and interpretive authority under existing and future consumer financial services laws. The Bureau is specifically authorized to issue rules identifying as unlawful acts or practices it defines as “unfair, deceptive, or abusive acts or practices” in connection with a consumer or in connection with a consumer financial product or service.
The Bureau, the FDIC, and other agencies have announced several high-profile enforcement actions against credit card issuers for deceptive marketing and other illegal practices related to the advertising of ancillary products, collection practices, and other matters. By these recent public enforcement actions, the Bureau and the FDIC have signaled a heightened scrutiny of credit card issuers. Across the industry, we anticipate increased activity by regulators in pursuing consumer protection claims going forward.
Several rules and regulations have been proposed or adopted that may substantially affect issuers of asset-backed securities. On December 10, 2013, the Federal Reserve, the Office of the Comptroller of the Currency, the FDIC, and the SEC approved joint final regulations implementing the provisions of the Reform Act commonly referred to as the “Volcker Rule.” Generally, the Volcker Rule and the implementing regulations prohibit any banking entity from engaging in proprietary trading and from investing in, sponsoring, or having certain relationships with a hedge fund or private equity fund, subject to exemptions for certain permitted activities. These regulations limit our ability to engage in the types of transactions covered by the Volcker Rule, and may impose compliance, monitoring, and reporting obligations on us and WFB under certain circumstances. Although the effective date of the regulations was April 1, 2014, the Federal Reserve approved an extension of the conformance period until July 21, 2016, and has further extended the conformance period until July 21, 2017. We are continuing to assess the impact, if any, that the Volcker Rule and the implementing regulation will have on our Merchandising and Financial Services segments, but we do not expect the Volcker Rule to have a material impact on WFB’s securitization program.
The Cabela’s Master Credit Card Trust and related entities (collectively referred to as the “Trust”) is structured to qualify for the exemption from the Investment Company Act of 1940, as amended (the “Investment Company Act”) provided by Investment Company Act Rule 3a-7. On August 31, 2011, the SEC issued an advance notice of proposed rulemaking regarding possible amendments to Investment Company Act Rule 3a-7. At this time, it is uncertain what form the related proposed and final rules will take, whether the Trust would continue to be eligible to rely on the exemption provided by Investment Company Act Rule 3a-7, and whether the Trust would qualify for any other Investment Company Act exemption.
On August 27, 2014, the SEC adopted certain rules (“SEC Regulation AB II”) that changed the disclosure, reporting, and offering process for public offerings of asset-backed securities, including those issued under WFB’s securitization program. SEC Regulation AB II had been originally proposed by the SEC on April 7, 2010, and was reproposed by the SEC on July 26, 2011. Among other things, SEC Regulation AB II imposes as a condition for the shelf registration of asset-backed securities the filing of a certification concerning the disclosure contained in the prospectus and the design of the securitization at the time of each offering off the shelf and the appointment of a credit risk manager to review assets when credit enhancement requirements are not met or at the direction of investors. As originally proposed and re-proposed, SEC Regulation AB II would have required the disclosure of group-level data regarding the receivables in a credit card securitization, but this requirement was not included in the final rule as adopted. There can be no assurances that the SEC will not require disclosure of group-level data in credit card securitizations in the future. We are continuing to assess the impact of SEC Regulation AB II on WFB’s securitization program.
36
On October 22, 2014, pursuant to the provisions of the Reform Act, the FDIC, the SEC, the Federal Reserve, and certain other federal agencies adopted regulations that impose a five percent risk retention requirement for credit card securitization transactions that are issued after December 2016. The regulations provide sponsors with several options on how to satisfy the risk retention requirement. Subject to certain exceptions, these regulations prohibit the sponsor of the securitization transaction from selling, hedging, or otherwise transferring the interests retained by the sponsor to satisfy the risk retention obligation. We have not yet determined which option WFB would choose to satisfy its risk retention obligation with respect to any future securitization transaction or whether the risk retention requirement will impact the Financial Services segment’s ability or desire to continue to rely on the securitization market for funding.
On September 19, 2011, the SEC proposed a new rule under the Securities Act of 1933, as amended, to implement certain provisions of the Reform Act. Under the proposed rule, an underwriter, placement agent, initial purchaser, or sponsor of an asset-backed security, or any affiliate of any such person, shall not at any time within one year after the first closing of the sale of the asset-backed security engage in any transaction that would involve or result in any material conflict of interest with respect to any investor in a transaction arising out of such activity. The proposed rule would exempt certain risk mitigating hedging activities, liquidity commitments, and bona fide market-making activity. It is not clear how the final rule will differ from the proposed rule, if at all. The final rule’s impact on the securitization market and the Financial Services segment is also unclear at this time.
Operations Review
Our operating results expressed as a percentage of revenue were as follows for the years ended:
2016 | 2015 | 2014 | ||||||
Revenue | 100.00 | % | 100.00 | % | 100.00 | % | ||
Cost of revenue (exclusive of depreciation and amortization) | 58.77 | 57.21 | 56.48 | |||||
Gross profit (exclusive of depreciation and amortization) | 41.23 | 42.79 | 43.52 | |||||
Selling, distribution, and administrative expenses | 34.25 | 34.71 | 34.30 | |||||
Impairment and restructuring charges | 0.34 | 0.38 | 0.02 | |||||
Operating income | 6.64 | 7.70 | 9.20 | |||||
Other income (expense): | ||||||||
Interest expense, net | (0.76 | ) | (0.57 | ) | (0.60 | ) | ||
Other income, net | 0.12 | 0.24 | 0.13 | |||||
Total other income (expense), net | (0.64 | ) | (0.33 | ) | (0.47 | ) | ||
Income before provision for income taxes | 6.00 | 7.37 | 8.73 | |||||
Provision for income taxes | 2.44 | 2.63 | 3.20 | |||||
Net income | 3.56 | % | 4.74 | % | 5.53 | % | ||
37
Results of Operations – 2016 Compared to 2015
Revenues
Merchandise revenue includes sales realized and customer services performed at our retail stores, sales from orders placed through our retail store Internet kiosks, sales from customers utilizing our in-store pick-up program, and Internet and call center (catalog) sales from orders placed through our website, over the phone, and by mail where the merchandise is shipped through our omni-channel fulfillment process to our customers at locations of their choice. Merchandise revenue also includes sales from the redemption of loyalty points earned by Cabela’s CLUB Visa cardholders of our Financial Services segment. Financial Services revenue is comprised of interest and fee income, interchange income, other non-interest income, interest expense, provision for loan losses, and customer rewards costs from our credit card operations. Other revenue sources include the value of unredeemed points earned that are associated with the Company’s loyalty rewards programs for Cabela’s CLUB issued credit cards, net of the estimated costs of the points; fees for hunting and fishing outfitter services; real estate rental income and land sales; and other complementary business services.
In order to better serve our customers, we continue to focus our efforts on offering customers integrated opportunities to access and use our retail stores, web and social media channels, and catalogs. We have pro-staff programs connecting influential industry leaders and local experts with Cabela’s customers in our retail stores. We have continued to partner with top brands to increase sales by providing more customer service and expertise in retail stores without increasing expenses. We have made it easier and simpler than ever before for customers to complete an order online on any device, check inventory availability at their local stores, and connect to Cabela’s on all types of social media. Multiple channel order delivery capabilities also allow us to optimize delivery expectations for customers while minimizing transportation costs. We have the capability to deliver distribution center to customer, retail store to customer, vendor to customer, in-store-pickup from retail store inventory, and in-store-pickup from distribution center inventory. Our customers have access to well-trained, friendly, and knowledgeable outfitters to answer product use and merchandise selection questions. We promote diversity and have built an employee base of outfitters that embrace people of all backgrounds and viewpoints, because there is greater value in multiple perspectives and varied experiences. We provide opportunities for outfitters to enjoy the outdoor lifestyle and to learn first-hand about core outdoor pursuits, which helps them to interact with our customers. We believe our ability to establish and maintain long-term relationships with our customers and encourage repeat visits and purchases is due, in part, to the strength of our customer support, product information, and service operations.
Comparisons and analysis of our revenues are presented below for the years ended:
Increase (Decrease) | % Change | |||||||||||||||||||
2016 | % | 2015 | % | |||||||||||||||||
(Dollars in Thousands) | ||||||||||||||||||||
Merchandise | $ | 3,558,019 | 86.2 | % | $ | 3,481,375 | 87.1 | % | $ | 76,644 | 2.2 | % | ||||||||
Financial Services | 543,061 | 13.1 | 502,543 | 12.6 | 40,518 | 8.1 | ||||||||||||||
Other | 28,279 | 0.7 | 13,784 | 0.3 | 14,495 | 105.2 | ||||||||||||||
Total | $ | 4,129,359 | 100.0 | % | $ | 3,997,702 | 100.0 | % | $ | 131,657 | 3.3 | |||||||||
Merchandise Sales – Comparisons and analysis of our merchandise sales are presented below for the years ended:
Increase (Decrease) | % Change | |||||||||||||||||||
2016 | % | 2015 | % | |||||||||||||||||
(Dollars in Thousands) | ||||||||||||||||||||
Retail store sales | $ | 2,785,865 | 78.3 | % | $ | 2,658,089 | 76.4 | % | $ | 127,776 | 4.8 | % | ||||||||
Internet and catalog sales | 772,154 | 21.7 | 823,286 | 23.6 | (51,132 | ) | (6.2 | ) | ||||||||||||
Total merchandise sales | $ | 3,558,019 | 100.0 | % | $ | 3,481,375 | 100.0 | % | $ | 76,644 | 2.2 | |||||||||
38
Product Sales Mix – The following table sets forth the percentage of our merchandise sales contributed by major product categories for our Merchandising segment for the years ended:
2016 | 2015 | ||||
Hunting Equipment (1) | 48.1 | % | 45.5 | % | |
General Outdoors (2) | 30.9 | 31.2 | |||
Clothing and Footwear (3) | 21.0 | 23.3 | |||
Total | 100.0 | % | 100.0 | % | |
(1) | Includes firearms, ammunition, optics, archery products, and related accessories and supplies. |
(2) | Includes equipment and accessories to support outdoor activities, including all types of fishing and tackle products, boats and marine equipment, camping gear and equipment, food preparation cooking products, all-terrain vehicles and accessories, and gifts and home furnishings. |
(3) | Includes fieldwear apparel and footwear, sportswear, casual clothing and footwear, and workwear products. |
Total merchandise sales increased $77 million, or 2.2%, in 2016 compared to 2015, primarily due to an increase of $251 million in sales from the addition of new retail stores and a net increase of $26 million primarily attributable to adjustments year over year in the allowance for sales returns that were estimated at the time merchandise sales were recognized based upon the Company’s evaluation of anticipated merchandise sales returns. These increases were partially offset by decreases of $82 million in comparable store sales and $35 million in Internet and catalog sales. In addition, the 53rd week in 2015 increased merchandise sales by $83 million (retail store sales increased by $67 million and Internet and catalog sales increased by $16 million); therefore, adjusted for 52 weeks, merchandise sales increased $160 million in 2016 compared to 2015.
The increase in revenue from new retail stores was partially offset by a decrease in comparable store sales of $82 million. A store is included in our comparable store sales base on the first day of the month following the fifteen month anniversary of (i) its opening or acquisition, or (ii) any changes to retail store space greater than 25% of total square footage of the store.
Comparable store sales and analysis, calculated on a shift-adjusted calendar basis, are presented below for the years ended:
Increase (Decrease) | % Change | |||||||||||||
2016 | 2015 (1) | |||||||||||||
(Dollars in Thousands) | ||||||||||||||
Comparable stores sales on a consolidated basis | $ | 2,398,296 | $ | 2,480,201 | $ | (81,905 | ) | (3.3 | )% | |||||
Comparable stores sales - United States stores only | 2,252,726 | 2,321,788 | (69,062 | ) | (3.0 | ) | ||||||||
Comparable stores sales on a constant currency basis (2) | (3.1 | ) | ||||||||||||
(1) | Excludes the 53rd week in 2015 to present on a comparable 52-week basis. |
(2) | Reflects the elimination of fluctuations in foreign currency exchange rates. |
Comparable store sales on a consolidated basis decreased $82 million, or 3.3%, compared to 2015. Comparable store sales results for our stores in the United States, which exclude Canada results and the impact of foreign currency exchange rate fluctuations, decreased 3.0% compared to 2015 due to decreases of approximately $56 million in the clothing and footwear product category and $15 million in the general outdoors product category, partially offset by a $2 million increase in the hunting equipment product category. The adjustment of comparable store sales on a shift-adjusted calendar basis provides a more accurate performance of our comparable store sales by aligning the weeks of operation in the current fiscal year to the most comparable weeks in the prior fiscal year.
39
The decrease in comparable store sales for our stores in the United States comparing 2016 to 2015 was driven by a decrease in the number of transactions of 7.5% partially offset by an increase in the average sales per transaction of 5.0%. In response to the softness of sales in our clothing and footwear categories, we have taken a number of actions, including testing national brand shops in a number of stores, testing alternate labor strategies in our apparel areas aimed at providing better sales coverage during peak selling times, and focusing more on marketing the “better category” selection of our merchandise assortments. We will continue in 2017 to monitor and take steps that are needed to respond to any number of consumer-related factors that may impact our planned improvement in comparable store sales on an annual basis. These steps may include the timing of discounts offered and promotional events to meet consumer preferences or actions taken by our competitors. In addition, we will also continue to look at our strategic space allocation and improve space utilization within our stores, as well as changing our brand assortment between national brands and Cabela’s brand. We will also keep working closely with our vendors and actively manage our inventory levels to ensure that we have the adequate quantity and assortment of necessary products available to meet any such consumer-related factors.
Average sales per square foot for stores that were open during the entire year were $344 for both 2016 and 2015. The new format stores generate, on average, a higher profit per square foot compared to the legacy store base and allow us to enter a broader choice of markets. We expect that the planned openings of future stores will continue to generate, on average, a higher profit per square foot compared to our legacy store base. Our goal is to have a store model that is more predictable in order to maximize sales, margins, cash flows, and an acceptable return on invested capital.
Internet and catalog sales decreased $51 million, or 6.2%, to $772 million, in 2016 (52 weeks), compared to 2015 (53 weeks). The net decrease was primarily due to decreases of approximately $43 million in the clothing and footwear product category and $16 million in the general outdoors product category, partially offset by an increase of $8 million in the hunting equipment product category. The 53rd week in 2015 increased Internet and catalog sales by $16 million; therefore, adjusted for 52 weeks, Internet and catalog sales decreased $35 million in 2016 compared to 2015. The number of visitors to our website decreased 2% in 2016 compared to an increase of 15% in 2015. We intend to expand our drop-ship sales program from our 2016 levels through our high traffic website, which will increase the exposure of national brands, provide low risk expansion of product lines, and provide faster distribution of products.
Our Cabela’s branded products continue to be a core focus for us. In 2016, our Cabela’s branded merchandise accounted for approximately 23% of total merchandise revenue. By having an appropriate mix of Cabela’s branded and other branded merchandise, we strive to meet the expectations and needs of our customers and expand the recognition of the Cabela’s brand.
We recognize revenue as gift certificates and gift cards (“gift instruments”) are redeemed for merchandise or services. We record gift instrument breakage as merchandise revenue when the probability of redemption is remote. Gift instrument breakage recognized was $11 million and $10 million for 2016 and 2015, respectively. Our gift instrument liability at the end of 2016 and 2015 was $195 million and $184 million, respectively.
40
Financial Services Revenue – The following table sets forth the components of our Financial Services revenue for the years ended:
Increase (Decrease) | % Change | |||||||||||||
2016 | 2015 | |||||||||||||
(Dollars in Thousands) | ||||||||||||||
Interest and fee income | $ | 597,709 | $ | 481,731 | $ | 115,978 | 24.1 | % | ||||||
Interest expense | (88,177 | ) | (68,827 | ) | 19,350 | 28.1 | ||||||||
Provision for loan losses | (147,661 | ) | (85,120 | ) | 62,541 | 73.5 | ||||||||
Net interest income, net of provision for loan losses | 361,871 | 327,784 | 34,087 | 10.4 | ||||||||||
Non-interest income: | ||||||||||||||
Interchange income | 410,718 | 394,037 | 16,681 | 4.2 | ||||||||||
Other non-interest income | 3,333 | 2,990 | 343 | 11.5 | ||||||||||
Total non-interest income | 414,051 | 397,027 | 17,024 | 4.3 | ||||||||||
Less: Customer rewards costs | (232,861 | ) | (222,268 | ) | 10,593 | 4.8 | ||||||||
Financial Services revenue | $ | 543,061 | $ | 502,543 | $ | 40,518 | 8.1 | |||||||
Financial Services revenue increased $41 million, or 8.1%, in 2016 compared to 2015. The increase in interest and fee income of $116 million was due to increases in credit card loans and the revolving rate. The increase in interest expense was due to increases to debt as a result of financing the growth of receivables and liquidity needs. The increase in the provision for loan losses of $63 million was due to increases in loan delinquencies and, to a lesser extent, growth in the average outstanding balance of credit card loans. The increase in interchange income of $17 million was primarily due to increases in credit card purchases.
The following table sets forth the components of Financial Services revenue as a percentage of average total credit card loans, including any accrued interest and fees, for the years ended:
2016 | 2015 | ||||
Interest and fee income | 11.6 | % | 10.8 | % | |
Interest expense | (1.7 | ) | (1.5 | ) | |
Provision for loan losses | (2.9 | ) | (1.9 | ) | |
Interchange income | 8.0 | 8.8 | |||
Other non-interest income | 0.1 | 0.1 | |||
Customer rewards costs | (4.5 | ) | (5.0 | ) | |
Financial Services revenue | 10.6 | % | 11.3 | % | |
Our Cabela’s CLUB Visa credit card loyalty program allows customers to earn points whenever and wherever they use their credit card, and then redeem earned points for products and services at our retail stores or through our Internet and catalog business. The percentage of our merchandise sold to customers using the Cabela’s CLUB Visa credit card was 30% for both 2016 and 2015. The dollar amount related to points is accrued as earned by the cardholder and recorded as a reduction in Financial Services revenue. The dollar amount of unredeemed credit card points and loyalty points was $193 million at the end of 2016 compared to $181 million at the end of 2015.
41
Key statistics reflecting the performance of Cabela’s CLUB are shown in the following table for the years ended:
Increase (Decrease) | % Change | |||||||||||||
2016 | 2015 | |||||||||||||
(Dollars in Thousands Except Average Balance per Active Account) | ||||||||||||||
Average balance of credit card loans (1) | $ | 5,120,592 | $ | 4,465,058 | $ | 655,534 | 14.7 | % | ||||||
Average number of active credit card accounts | 2,064,517 | 1,940,534 | 123,983 | 6.4 | ||||||||||
Average balance per active credit card account (1) | $ | 2,480 | $ | 2,301 | $ | 179 | 7.8 | |||||||
Purchases on credit card accounts, net | 21,266,315 | 20,213,403 | 1,052,912 | 5.2 | ||||||||||
Net charge-offs on credit card loans (1) | 120,497 | 75,846 | 44,651 | 58.9 | ||||||||||
Net charge-offs as a percentage of average credit card loans (1) | 2.35 | % | 1.70 | % | 0.65 | % | ||||||||
(1) | Includes accrued interest and fees. |
The average balance of credit card loans increased to $5.1 billion, or 14.7%, for 2016 compared to 2015 due to increases in the number of active accounts and the average balance per account. We define an active credit card account as any account with an outstanding debit or credit balance at the end of any respective month. The average number of active accounts increased to 2.1 million, or 6.4%, compared to 2015 due to our successful marketing efforts in new account acquisitions. Net charge-offs as a percentage of average credit card loans increased to 2.35% for 2016, up 65 basis points compared to 2015, primarily due to increases in loan delinquencies and decreases in payment and recovery rates. Recovery rates were positively impacted in 2015 due to a bulk sale of bankruptcy loans and acceleration of the timing of a sale of charged-off loans, which resulted in an 11 basis point reduction in the charge-off rate in 2015.
See “Asset Quality of Cabela’s CLUB” in this report for additional information on trends in delinquencies and non-accrual loans and analysis of our allowance for loan losses.
Other Revenue
Other revenue was $28 million in 2016 compared to $14 million in 2015 with the increase primarily due to increases in real estate sales revenues, which was partially offset by a decrease related to our exit from certain non-core businesses in 2015.
Merchandise Gross Profit
Merchandise gross profit is defined as merchandise sales, including shipping fees charged to customers, less the costs of related merchandise sold and shipping costs. Comparisons of merchandise gross profit and merchandise gross profit as a percentage of merchandise sales for our operations, year over year, and to the retail industry in general, are impacted by:
• | retail store, distribution, and warehousing costs (including depreciation and amortization), which we exclude from our cost of revenue; |
• | customer service related revenue we include in merchandise sales for which there are no costs of revenue; and |
• | shipping costs we include in cost of revenue. |
Comparisons and analysis of our merchandise gross profit on merchandise sales are presented below for the years ended:
Increase (Decrease) | % Change | |||||||||||||
2016 | 2015 | |||||||||||||
(Dollars in Thousands) | ||||||||||||||
Merchandise sales | $ | 3,558,019 | $ | 3,481,375 | $ | 76,644 | 2.2 | % | ||||||
Merchandise gross profit | 1,144,169 | 1,194,821 | (50,652 | ) | (4.2 | ) | ||||||||
Merchandise gross profit as a percentage of merchandise sales | 32.2 | % | 34.3 | % | (2.1 | )% | ||||||||
42
Our merchandise gross profit decreased $51 million, or 4.2%, to $1.1 billion in 2016 compared to 2015 primarily due to an aggressive pricing, promotion, and markdown strategy. Our merchandise gross profit as a percentage of merchandise sales decreased 210 basis points to 32.2% in 2016 from 34.3% in 2015 primarily due to an aggressive pricing, promotion, and markdown strategy, as well as an effort to right size inventory levels, which had an impact of approximately 140 basis points, and increased sales of lower margin firearms, ammunition, and powersports products combined with lower sales in our higher margin soft goods and apparel categories, which had an impact of approximately 70 basis points.
Selling, Distribution, and Administrative Expenses
SD&A expenses include all operating expenses related to our retail stores, website, distribution centers, product procurement, Cabela’s CLUB credit card operations, and overhead costs, including: advertising and marketing, catalog costs, employee compensation and benefits, occupancy costs, information systems processing, and depreciation and amortization.
Comparisons and analysis of our SD&A expenses are presented below for the years ended:
Increase (Decrease) | % Change | |||||||||||||
2016 | 2015 | |||||||||||||
(Dollars in Thousands) | ||||||||||||||
SD&A expenses | $ | 1,414,312 | $ | 1,387,647 | $ | 26,665 | 1.9 | % | ||||||
SD&A expenses as a percentage of total revenue | 34.3 | % | 34.7 | % | (0.4 | )% | ||||||||
Retail store pre-opening costs | $ | 6,741 | $ | 22,751 | $ | (16,010 | ) | (70.4 | ) | |||||
Non-GAAP amounts: | ||||||||||||||
SD&A expenses on a non-GAAP basis | $ | 1,380,262 | $ | 1,379,021 | $ | 1,241 | 0.1 | % | ||||||
SD&A expenses as a percentage of total revenue on a non-GAAP basis | 33.5 | % | 34.5 | % | (1.0 | )% | ||||||||
SD&A expenses increased $27 million, or 1.9%, in 2016 (52 weeks) compared to 2015 (53 weeks). SD&A expenses increased primarily due to an increase in costs totaling $28 million related primarily to corporate restructuring initiatives, the review of strategic alternatives, and a charge recognized on a lawsuit settlement in 2016, as well as additional costs from increases in the number of new stores and costs in related support areas.
On a non-GAAP basis, excluding the impact of certain costs, as reflected in the table in the Executive Overview section of this report entitled “Reconciliation of GAAP Reported to Non-GAAP Adjusted Financial Measures,” SD&A expenses increased $1 million comparing the respective years, and as a percentage of total revenue, decreased 100 basis points in 2016 compared to 2015.
In 2016 and 2015, we incurred charges totaling $4 million and $6 million, respectively, for severance and related benefits (which were included in impairment and restructuring charges in the consolidated statements of income) primarily attributable to our corporate restructuring and reduction in the number of personnel. These charges for both years were recognized in the Merchandising segment.
In the second half of 2015, we launched a major multi-year corporate restructuring project that continued throughout 2016 aimed at lowering the Company’s operating expense base to increase our return on invested capital. We identified numerous meaningful savings opportunities across the Company that are expected to result in a reduction of operating expenses as a percentage of total revenue of up to 150 basis points over the next three years compared to the 2015 base year of 34.5% on a non-GAAP basis. We will continue to manage our operating costs accordingly into fiscal year 2017 and beyond.
43
The most significant changes in SD&A expenses in 2016 compared to 2015 related to specific business segments, included:
Merchandising Segment:
• | An increase of $28 million in building costs and depreciation primarily due to additional costs from increases in the number of new stores and the operations and maintenance of our existing retail stores and corporate offices. |
• | A decrease of $27 million in employee compensation, benefits, and contract labor primarily due to (i) our corporate restructuring initiatives aimed at lowering our operating expenses and (ii) a reduction in incentive compensation. |
• | An increase of $23 million in consulting fees and certain other expenses related to our corporate restructuring initiatives and the review of strategic alternatives. |
• | A decrease of $11 million in advertising and promotional costs. |
• | An increase of $4 million related to a charge recognized on a lawsuit settlement. |
Financial Services Segment:
• | An increase of $9 million in employee compensation and benefits primarily due to increases in third party call center and collection agency expenses and increases in internal call center wages to be competitive with other employers. |
Impairment and Restructuring Charges
In 2016 and 2015, we recognized impairment losses and incurred restructuring charges totaling $14 million and $15 million, respectively. Both the impairment losses and restructuring charges were recognized in the Merchandising segment. For more information see the table entitled “Reconciliation of GAAP Reported to Non-GAAP Adjusted Financial Measures” in “Management’s Discussion and Analysis of Financial Condition and Results of Operations – Fiscal 2016 Executive Overview” and Note 14 “Impairment and Restructuring Charges” of the Notes to the Consolidated Financial Statements.
44
Operating Income
Operating income is revenue less cost of revenue, SD&A expenses, and impairment and restructuring charges. Operating income for our Merchandise segment includes costs associated with operating expenses of distribution centers, procurement activities, and other corporate overhead costs.
Comparisons and analysis of operating income are presented below for the years ended:
Increase (Decrease) | % Change | |||||||||||||
2016 | 2015 | |||||||||||||
(Dollars in Thousands) | ||||||||||||||
Total operating income | $ | 273,940 | $ | 307,792 | $ | (33,852 | ) | (11.0 | )% | |||||
Total operating income as a percentage of total revenue | 6.6 | % | 7.7 | % | (1.1 | )% | ||||||||
Non-GAAP amounts: | ||||||||||||||
Operating income on a non-GAAP basis | $ | 317,750 | $ | 331,749 | $ | (13,999 | ) | (4.2 | )% | |||||
Operating income as a percentage of total revenue on a non-GAAP basis | 7.7 | % | 8.3 | % | (0.6 | )% | ||||||||
Operating income by business segment: | ||||||||||||||
Merchandising | $ | 73,494 | $ | 134,804 | $ | (61,310 | ) | (45.5 | ) | |||||
Financial Services | 200,446 | 172,988 | 27,458 | 15.9 | ||||||||||
Operating income as a percentage of segment revenue: | ||||||||||||||
Merchandising | 2.0 | % | 3.9 | % | (1.9 | )% | ||||||||
Financial Services | 38.4 | 35.9 | 2.5 | |||||||||||
Total operating income decreased $34 million, or 11.0%, in 2016 compared to 2015, and total operating income as a percentage of total revenue decreased 110 basis points to 6.6% for 2016. The net decrease in operating income was primarily attributable to decreases in our merchandise gross profit and increases in consolidated operating expenses. We are focusing on expense management throughout the Company and have implemented many expense reduction efforts that should continue to benefit operating income in upcoming periods. We plan to continue our retail growth, our omni-channel initiatives, and our Cabela’s branded product investments as we focus on expense management controls consistent with our multi-year corporate restructuring project.
On a non-GAAP basis, excluding the impact of certain costs and charges, as reflected in the table in the Executive Overview section of this report entitled “Reconciliation of GAAP Reported to Non-GAAP Adjusted Financial Measures,” operating income decreased $14 million, and total operating income as a percentage of total revenue decreased 60 basis points, comparing 2016 to 2015.
Under an Intercompany Agreement, described more fully in Note 23 “Segment Reporting” of the Notes to Consolidated Financial Statements, the Financial Services segment pays a license fee to the Merchandising segment and, among other items, reimburses the Merchandising segment for certain promotional costs. Total fees paid under the Intercompany Agreement by the Financial Services segment to the Merchandising segment increased $6 million in 2016 compared to 2015.
Interest (Expense) Income, Net
Interest expense, net of interest income, was $31 million and $23 million in 2016 and 2015, respectively. We incur interest expense on our revolving credit facilities, our long-term debt, and on the balance of unrecognized tax benefits. The increase in interest expense was primarily due to the issuances of the new unsecured notes for $250 million in August 2015 and $300 million in December 2015. The amount of interest capitalized decreased $7 million comparing the respective years due to a slowdown in new store activity and interest that was capitalized in 2015 for our new corporate facility and distribution center in Tooele, Utah.
45
Other Non-Operating Income, Net
Other non-operating income was $5 million in 2016 compared to $10 million in 2015. This income is primarily from interest earned on our economic development bonds (“EDBs”).
Provision for Income Taxes
Our effective tax rate was 40.7% in 2016 compared to 35.7% in 2015. Our effective tax rate increased comparing the respective years primarily due to increases in (i) nondeductible expenses primarily to facilitate the acquisition of the Company ($5 million net impact to the provision for income taxes), (ii) tax adjustments attributable to changes in the mix of taxable income between the United States and foreign tax jurisdictions, and (iii) state income taxes, as well as a decrease in research and development tax credits.
Results of Operations – 2015 Compared to 2014
Revenues
Comparisons and analysis of our revenues are presented below for the years ended:
Increase (Decrease) | % Change | |||||||||||||||||||
2015 | % | 2014 | % | |||||||||||||||||
(Dollars in Thousands) | ||||||||||||||||||||
Merchandise | $ | 3,481,375 | 87.1 | % | $ | 3,200,219 | 87.7 | % | $ | 281,156 | 8.8 | % | ||||||||
Financial Services | 502,543 | 12.6 | 430,385 | 11.8 | 72,158 | 16.8 | ||||||||||||||
Other | 13,784 | 0.3 | 17,046 | 0.5 | (3,262 | ) | (19.1 | ) | ||||||||||||
Total | $ | 3,997,702 | 100.0 | % | $ | 3,647,650 | 100.0 | % | $ | 350,052 | 9.6 | |||||||||
Merchandise Sales – Comparisons and analysis of our merchandise sales are presented below for the years ended:
2015 | 2014 | Increase (Decrease) | % Change | |||||||||||||||||
% | % | |||||||||||||||||||
(Dollars in Thousands) | ||||||||||||||||||||
Retail store sales | $ | 2,658,089 | 76.4 | % | $ | 2,348,481 | 73.4 | % | $ | 309,608 | 13.2 | % | ||||||||
Internet and catalog sales | 823,286 | 23.6 | 851,738 | 26.6 | $ | (28,452 | ) | (3.3 | )% | |||||||||||
Total merchandise sales | $ | 3,481,375 | 100.0 | % | $ | 3,200,219 | 100.0 | % | $ | 281,156 | 8.8 | |||||||||
Product Sales Mix – The following table sets forth the percentage of our merchandise sales contributed by major product categories for our Merchandising segment for the years ended:
2015 | 2014 | ||||
Hunting Equipment | 45.5 | % | 44.3 | % | |
General Outdoors | 31.2 | 30.3 | |||
Clothing and Footwear | 23.3 | 25.4 | |||
Total | 100.0 | % | 100.0 | % | |
Merchandise sales increased $281 million, or 8.8%, in 2015 compared to 2014. The 53rd week in 2015 increased merchandise sales by $83 million; therefore, adjusted for 52 weeks, merchandise sales increased $198 million in 2015 compared to 2014. This increase in 2015 was primarily due to an increase of $321 million in revenue from the addition of new retail stores, partially offset by decreases in comparable store sales of $75 million and in Internet and catalog sales of $45 million.
46
Comparable store sales and analysis are presented below for the years ended:
Increase (Decrease) | % Change | |||||||||||||
2015 (1) | 2014 | |||||||||||||
(Dollars in Thousands) | ||||||||||||||
Comparable stores sales on a consolidated basis | $ | 2,093,125 | $ | 2,167,854 | $ | (74,729 | ) | (3.4 | )% | |||||
Comparable stores sales - United States stores only | 1,984,362 | 2,028,605 | (44,243 | ) | (2.2 | ) | ||||||||
Comparable stores sales on a constant currency basis (2) | (2.5 | ) | ||||||||||||
(1) | Excludes the 53rd week in 2015 to present on a comparable 52-week basis. |
(2) | Reflects the elimination of fluctuations in foreign currency exchange rates. |
Comparable store sales results for only our stores in the United States decreased 2.2% compared to 2014 mostly due to overall decreases in the clothing and footwear product category. The decrease in the clothing and footwear product category was partially offset by an increase of approximately $11 million in the general outdoors and hunting equipment product categories with neither of these two categories disproportionately impacting the year over year change more than the other category. We saw continued softness in our apparel categories as our fall and winter assortments were met with unseasonably warm weather across most of our major markets. The decrease in comparable store sales comparing 2015 to 2014 was driven by a decrease in the number of transactions of 6.2% partially offset by an increase in the average sales per transaction of 4.4%. Average sales per square foot for stores that were open during the entire year were $344 for 2015 compared to $348 for 2014.
The 53rd week in 2015 increased Retail store sales by $66 million; therefore, adjusted for 52 weeks, Retail store sales increased $243 million in 2015 compared to 2014. The 53rd week in 2015 increased Internet and catalog sales by $17 million; therefore, adjusted for 52 weeks, Internet and catalog sales decreased $45 million in 2015 compared to 2014. The decrease in Internet and catalog sales was due to decreases in each of our three major product categories comparing the respective years attributable to decreases in the
•clothing and footwear product category of approximately 51%,
•hunting equipment product category of approximately 37%, and
•general outdoors product category of approximately 12%.
Financial Services Revenue – The following table sets forth the components of our Financial Services revenue for the years ended:
Increase (Decrease) | % Change | |||||||||||||
2015 | 2014 | |||||||||||||
(Dollars in Thousands) | ||||||||||||||
Interest and fee income | $ | 481,731 | $ | 400,948 | $ | 80,783 | 20.1 | % | ||||||
Interest expense | (68,827 | ) | (64,167 | ) | 4,660 | 7.3 | ||||||||
Provision for loan losses | (85,120 | ) | (61,922 | ) | 23,198 | 37.5 | ||||||||
Net interest income, net of provision for loan losses | 327,784 | 274,859 | 52,925 | 19.3 | ||||||||||
Non-interest income: | ||||||||||||||
Interchange income | 394,037 | 366,633 | 27,404 | 7.5 | ||||||||||
Other non-interest income | 2,990 | 3,338 | (348 | ) | (10.4 | ) | ||||||||
Total non-interest income | 397,027 | 369,971 | 27,056 | 7.3 | ||||||||||
Less: Customer rewards costs | (222,268 | ) | (214,445 | ) | 7,823 | 3.6 | ||||||||
Financial Services revenue | $ | 502,543 | $ | 430,385 | $ | 72,158 | 16.8 | |||||||
Financial Services revenue increased $72 million, or 16.8%, in 2015 compared to 2014. The increase in interest and fee income of $81 million was due to increases in credit card loans and the revolving rate. The increase in interchange income of $27 million was primarily due to increases in credit card purchases and the interchange rate. The increase in the provision for loan losses of $23 million was due to growth in the average outstanding balance of credit card loans and, to a lesser extent, increases in loan delinquencies.
47
The following table sets forth the components of our Financial Services revenue as a percentage of average total credit card loans, including any accrued interest and fees, for the years ended:
2015 | 2014 | ||||
Interest and fee income | 10.8 | % | 10.2 | % | |
Interest expense | (1.5 | ) | (1.6 | ) | |
Provision for loan losses | (1.9 | ) | (1.6 | ) | |
Interchange income | 8.8 | 9.3 | |||
Other non-interest income | 0.1 | 0.1 | |||
Customer rewards costs | (5.0 | ) | (5.5 | ) | |
Financial Services revenue | 11.3 | % | 10.9 | % | |
The percentage of our merchandise sold to customers using the Cabela’s CLUB Visa credit card was 30% for both 2015 and 2014. The dollar amount of unredeemed credit card points and loyalty points was $181 million at the end of 2015 compared to $165 million at the end of 2014.
Key statistics reflecting the performance of Cabela's CLUB are shown in the following table for the years ended:
Increase (Decrease) | % Change | |||||||||||||
2015 | 2014 | |||||||||||||
(Dollars in Thousands Except Average Balance per Active Account) | ||||||||||||||
Average balance of credit card loans (1) | $ | 4,465,058 | $ | 3,937,192 | $ | 527,866 | 13.4 | % | ||||||
Average number of active credit card accounts | 1,940,534 | 1,817,012 | 123,522 | 6.8 | ||||||||||
Average balance per active credit card account (1) | $ | 2,301 | $ | 2,167 | $ | 134 | 6.2 | |||||||
Purchases on credit card accounts, net | 20,213,403 | 19,066,829 | 1,146,574 | 6.0 | ||||||||||
Net charge-offs on credit card loans (1) | 75,846 | 66,553 | 9,293 | 14.0 | ||||||||||
Net charge-offs as a percentage of average credit card loans (1) | 1.70 | % | 1.69 | % | 0.01 | % | ||||||||
(1) | Includes accrued interest and fees. |
The average balance of credit card loans increased to $4.5 billion, or 13.4%, for 2015 compared to 2014 due to increases in the number of active accounts and the average balance per account. The average number of active accounts increased to 1.9 million, or 6.8%, compared to 2014 due to our successful marketing efforts in new account acquisitions. Net charge-offs as a percentage of average credit card loans increased to 1.70% for 2015, up one basis point compared to 2014, primarily due to increases in loan delinquencies and a decrease in payment rates, partially offset by improvements in recovery rates. Recovery rates were positively impacted in 2015 due to a bulk sale of bankruptcy loans and acceleration of the timing of a sale of charged-off loans, which resulted in an 11 basis point reduction in the charge-off rate.
Other Revenue
Other revenue decreased $3 million in 2015 to $14 million compared to 2014 primarily due to a decrease in real estate sales revenue in 2015 compared to 2014.
48
Merchandise Gross Profit
Comparisons and analysis of our gross profit on merchandising revenue are presented below for the years ended:
Increase (Decrease) | % Change | |||||||||||||
2015 | 2014 | |||||||||||||
(Dollars in Thousands) | ||||||||||||||
Merchandise sales | $ | 3,481,375 | $ | 3,200,219 | $ | 281,156 | 8.8 | % | ||||||
Merchandise gross profit | 1,194,821 | 1,141,328 | 53,493 | 4.7 | ||||||||||
Merchandise gross profit as a percentage of merchandise sales | 34.3 | % | 35.7 | % | (1.4 | )% | ||||||||
Our merchandise gross profit increased $53 million, or 4.7%, to $1.2 billion in 2015 compared to 2014 primarily due to new retail store growth. Our merchandise gross profit as a percentage of merchandise sales decreased 140 basis points to 34.3% in 2015 from 35.7% in 2014 due to our markdown and pricing strategy and, to a lesser extent, increased sales of lower margin firearms, ammunition, and powersports products combined with lower sales in our higher margin soft goods and apparel categories. The impact of the decrease due to markdown and pricing strategy was disproportionately higher than the change due to increased sales of lower margin firearms, ammunition, and powersports products combined with lower sales in our higher margin soft goods and apparel categories.
Selling, Distribution, and Administrative Expenses
Comparisons and analysis of our SD&A expenses were as follows for the years ended:
Increase (Decrease) | % Change | |||||||||||||
2015 | 2014 | |||||||||||||
(Dollars in Thousands) | ||||||||||||||
SD&A expenses | $ | 1,387,647 | $ | 1,251,325 | $ | 136,322 | 10.9 | % | ||||||
SD&A expenses as a percentage of total revenue | 34.7 | % | 34.3 | % | 0.4 | % | ||||||||
Retail store pre-opening costs | $ | 22,751 | $ | 24,338 | $ | (1,587 | ) | (6.5 | ) | |||||
SD&A expenses increased $136 million, or 10.9%, in 2015 (53 weeks) compared to 2014 (52 weeks). SD&A expenses increased primarily due to additional costs from increases in the number of new stores and costs in related support areas and a $14 million increase in incentive compensation in 2015. We did not incur any incentive compensation expense in 2014. In 2015, we incurred a $6 million charge for severance and related benefits (which was included in impairment and restructuring charges in the consolidated statements of income) due to a corporate office restructure and reduction in the number of personnel. We focused on expense management throughout the Company and implemented several expense reduction efforts that showed benefits in 2015 and should continue to benefit operating income in upcoming periods. The most significant changes in SD&A expenses in 2015 compared to 2014 included:
Merchandising Segment:
• | An increase of $85 million in employee compensation, benefits, and contract labor primarily due to increases in the number of new stores and costs in related support areas, which increase also included a $14 million increase in incentive compensation in 2015. |
• | An increase of $32 million in building costs and depreciation primarily due to additional costs from increases in the number of new stores and to the operations and maintenance of our existing retail stores as well as corporate offices. |
Financial Services Segment:
• | An increase of $9 million in employee compensation, benefits, and contract labor to support the growth of credit card operations. |
49
Impairment and Restructuring Charges
In 2015 and 2014, we recognized impairment losses and incurred restructuring charges totaling $15 million and $1 million, respectively. Both the impairment losses and restructuring charges were recognized in the Merchandising segment. For more information see the table entitled “Reconciliation of GAAP Reported to Non-GAAP Adjusted Financial Measures” in “Management’s Discussion and Analysis of Financial Condition and Results of Operations – Fiscal 2016 Executive Overview” and Note 14 “Impairment and Restructuring Charges” of the Notes to the Consolidated Financial Statements.
Operating Income
Comparisons and analysis of operating income are presented below for the years ended:
Increase (Decrease) | % Change | |||||||||||||
2015 | 2014 | |||||||||||||
(Dollars in Thousands) | ||||||||||||||
Total operating income | $ | 307,792 | $ | 335,395 | $ | (27,603 | ) | (8.2 | )% | |||||
Total operating income as a percentage of total revenue | 7.7 | % | 9.2 | % | (1.5 | )% | ||||||||
Operating income by business segment: | ||||||||||||||
Merchandising | $ | 134,804 | $ | 223,745 | $ | (88,941 | ) | (39.8 | ) | |||||
Financial Services | 172,988 | 111,650 | 61,338 | 54.9 | ||||||||||
Operating income as a percentage of segment revenue: | ||||||||||||||
Merchandising | 3.9 | % | 7.0 | % | (3.1 | )% | ||||||||
Financial Services | 35.9 | 26.9 | 9.0 | |||||||||||
Total operating income decreased $28 million, or 8.2%, in 2015 compared to 2014, and total operating income as a percentage of total revenue decreased 150 basis points to 7.7% for 2015. The decreases in total operating income and total operating income as a percentage of total revenue were primarily due to increases in consolidated operating expenses and impairment and restructuring charges and a decrease in Internet and catalog sales. These decreases to operating income were partially offset by increases in revenue from our Financial Services segment and an increase in Retail store sales. Operating expenses increased in 2015 compared to 2014 primarily due to additional costs from increases in the number of new stores and costs in related support areas, and due to an increase in incentive compensation in 2015 as we did not incur any incentive compensation expense in 2014.
Under an Intercompany Agreement the Financial Services segment pays a license fee to the Merchandising segment and, among other items, reimburses the Merchandising segment for certain promotional costs. At March 31, 2014, the total risk-based capital ratio of WFB exceeded 13% so an additional license fee of $11 million was paid in April 2014 by the Financial Services segment to the Merchandising segment and was classified in SD&A expenses. Total fees paid under the Intercompany Agreement by the Financial Services segment to the Merchandising segment, including the $11 million payment in 2014 triggered by the excess total risk-based capital ratio provision, increased $2 million in 2015 compared to 2014.
Interest (Expense) Income, Net
Interest expense, net of interest income, was $23 million and $22 million in 2015 and 2014, respectively. The amount of interest capitalized increased to $10 million in 2015 compared to $8 million in 2014 primarily due to our new corporate facility and the distribution center in Tooele, Utah. However, this increase in the amount of interest capitalized comparing the respective years was partially offset due to additional interest expense recognized in 2015 associated with our uncertain tax positions, the issuances of the new unsecured notes for $250 million in August 2015 and $300 million in December 2015, and higher outstanding balances on our revolving credit facility in 2015 compared to 2014.
Other Non-Operating Income, Net
Other non-operating income was $10 million in 2015 compared to $5 million in 2014 which consisted primarily of interest earned on our EDBs.
50
Provision for Income Taxes
Our effective tax rate was 35.7% in 2015 compared to 36.7% in 2014. The decrease in our effective tax rate comparing the respective years was primarily due to a decrease in our effective tax rate related to tax adjustments attributable to changes in the mix of taxable income between the United States and foreign tax jurisdictions and completion of a retroactive research and development tax credit study during 2015. These decreases in our effective tax rate were partially offset by increases in unrecognized tax benefits and a deferred tax asset valuation allowance related to Canada taxable net operating losses.
Asset Quality of Cabela’s CLUB
Delinquencies and Non-Accrual
We consider the entire balance of an account, including any accrued interest and fees, delinquent if the minimum payment is not received by the payment due date. Our aging method is based on the number of completed billing cycles during which a customer has failed to make a required payment. As part of collection efforts, a credit card loan may be closed and placed on non-accrual or restructured in a fixed payment plan prior to charge-off. Our fixed payment plans require payment of the loan within 60 months and consist of a lower interest rate, reduced minimum payment, and elimination of fees. Loans on fixed payment plans include loans in which the customer has engaged a consumer credit counseling agency to assist them in managing their debt. Customers who miss two consecutive payments once placed on a payment plan or non-accrual will resume accruing interest at the rate they had accrued at before they were placed on a plan. Interest and fees are accrued in accordance with the terms of the applicable cardholder agreements or payment plan on credit card loans until the date of charge-off unless placed on non-accrual. Payments received on non-accrual loans are applied to principal and reduce the amount of the loan.
The quality of our credit card loan portfolio at any time reflects, among other factors: (i) the creditworthiness of cardholders, (ii) general economic conditions, (iii) the success of our account management and collection activities, and (iv) the life-cycle stage of the portfolio. During periods of economic weakness, delinquencies and net charge-offs are more likely to increase. We have mitigated periods of economic weakness by selecting a customer base that is very creditworthy. We use the scores of Fair Isaac Corporation (“FICO”), a widely-used financial metric for assessing an individual’s credit rating, as the primary credit quality indicator. The median FICO score of our credit cardholders was 793 at the end of 2016 and 794 at the end of 2015.
The following table reports delinquencies, including any delinquent non-accrual and restructured credit card loans, as a percentage of our credit card loans, including any accrued interest and fees, in a manner consistent with our monthly external reporting for the years ended:
2016 | 2015 | 2014 | |||||||
Number of days delinquent: | |||||||||
Greater than 30 days | 1.05 | % | 0.82 | % | 0.68 | % | |||
Greater than 60 days | 0.66 | 0.51 | 0.41 | ||||||
Greater than 90 days | 0.36 | 0.26 | 0.22 | ||||||
Delinquencies increased in 2016 compared to 2015 due, in part, to generally challenging consumer conditions affecting payment rates. As delinquencies continued to rise, operational changes were made to collections procedures and processes throughout the year. We began to see stabilization in our delinquencies towards the end of 2016, and continue to manage delinquencies and charge-offs through active account management and improved collection practices.
51
The table below shows delinquent, non-accrual, and restructured loans as a percentage of our credit card loans, including any accrued interest and fees, at the years ended:
2016 | 2015 | 2014 | ||||||
Number of days delinquent and still accruing (excludes non-accrual and restructured loans which are presented below): | ||||||||
Greater than 30 days | 0.97 | % | 0.72 | % | 0.58 | % | ||
Greater than 60 days | 0.62 | 0.45 | 0.35 | |||||
Greater than 90 days | 0.33 | 0.23 | 0.19 | |||||
Non-accrual loans | 0.11 | 0.14 | 0.11 | |||||
Restructured loans | 0.54 | 0.57 | 0.69 | |||||
Allowance for Loan Losses and Charge-offs
The allowance for loan losses represents management’s estimate of probable losses inherent in the credit card loan portfolio. For information on the accounting policy, estimates, and assumptions relating to our allowance for loan losses on our credit card loan portfolio, refer to Note 1 “Nature of Business and Summary of Significant Accounting Policies” under the section titled “Allowance for Loan Losses” of the Notes to Consolidated Financial Statements included in Part II, Item 8 of this Form 10-K, which is incorporated herein by reference.
Charge-offs consist of the uncollectible principal, interest, and fees on a customer’s account. Recoveries are the amounts collected on previously charged-off accounts, including such accounts that are sold to a third party. Most bankcard issuers charge off accounts at 180 days. We charge off credit card loans on a daily basis after an account becomes at a minimum 130 days contractually delinquent to allow us to manage the collection process more efficiently. Accounts relating to cardholder bankruptcies, cardholder deaths, and fraudulent transactions are charged off earlier.
The following table shows the activity in our allowance for loan losses and charge-off activity for the years ended:
2016 | 2015 | 2014 | |||||||||
(Dollars in Thousands) | |||||||||||
Balance, beginning of year | $ | 75,911 | $ | 56,572 | $ | 53,110 | |||||
Provision for loan losses | 147,661 | 85,120 | 61,922 | ||||||||
Charge-offs | (130,550 | ) | (91,196 | ) | (76,868 | ) | |||||
Recoveries | 25,321 | 25,415 | 18,408 | ||||||||
Net charge-offs | (105,229 | ) | (65,781 | ) | (58,460 | ) | |||||
Balance, end of year | $ | 118,343 | $ | 75,911 | $ | 56,572 | |||||
Net charge-offs on credit card loans | $ | (105,229 | ) | $ | (65,781 | ) | $ | (58,460 | ) | ||
Charge-offs of accrued interest and fees (recorded as a reduction in interest and fee income) | (15,268 | ) | (10,065 | ) | (8,093 | ) | |||||
Total net charge-offs including accrued interest and fees | $ | (120,497 | ) | $ | (75,846 | ) | $ | (66,553 | ) | ||
Net charge-offs, including accrued interest and fees, as a percentage of average credit card loans, including accrued interest and fees | 2.35 | % | 1.70 | % | 1.69 | % | |||||
Net charge-offs as a percentage of average credit card loans increased to 2.35% for 2016, up 65 basis points compared to 2015, primarily due to increases in loan delinquencies and decreases in payment and recovery rates. Recovery rates were positively impacted in 2015 due to a bulk sale of bankruptcy loans and acceleration of the timing of a sale of charged-off loans, which resulted in an 11 basis point reduction in the charge-off rate in 2015.
52
Aging of Credit Cards Loans Outstanding
The following table shows our credit card loans outstanding at the end of 2016 and 2015 segregated by the number of months passed since the accounts were opened.
2016 | 2015 | ||||||||||||
Loans Outstanding | Percentage of Total | Loans Outstanding | Percentage of Total | ||||||||||
Months Since Account Opened | |||||||||||||
(Dollars in Thousands) | |||||||||||||
6 months or less | $ | 188,911 | 3.3 | % | $ | 207,079 | 4.1 | % | |||||
7 – 12 months | 208,761 | 3.7 | 189,040 | 3.7 | |||||||||
13 – 24 months | 447,540 | 7.9 | 428,820 | 8.4 | |||||||||
25 – 36 months | 471,041 | 8.3 | 464,060 | 9.1 | |||||||||
37 – 48 months | 498,433 | 8.8 | 397,484 | 7.8 | |||||||||
49 – 60 months | 424,320 | 7.4 | 363,506 | 7.1 | |||||||||
61 – 72 months | 379,930 | 6.7 | 297,274 | 5.8 | |||||||||
73 – 84 months | 307,990 | 5.4 | 308,502 | 6.0 | |||||||||
More than 84 months | 2,765,445 | 48.5 | 2,449,173 | 48.0 | |||||||||
Total | $ | 5,692,371 | 100.0 | % | $ | 5,104,938 | 100.0 | % | |||||
Liquidity and Capital Resources
Overview
Our Merchandising segment and our Financial Services segment have significantly differing liquidity and capital needs. We believe that we will have sufficient capital available from cash on hand, our revolving credit facility, and other borrowing sources to fund our cash requirements and near-term growth plans for at least the next 12 months. At the end of 2016 and 2015, cash on a consolidated basis totaled $264 million and $315 million, respectively, of which $150 million and $157 million, respectively, was cash at the Financial Services segment which is utilized to meet this segment’s liquidity requirements. We evaluate the credit markets for securitizations and certificates of deposit to determine the most cost effective source of funds for the Financial Services segment. During 2016, the Financial Services segment issued certificates of deposit, completed a term securitization, and increased its variable funding facilities. We believe that these liquidity sources are sufficient to fund the Financial Services segment’s cash requirements, including maturities and near-term growth plans.
As of December 31, 2016, cash and cash equivalents held by our foreign subsidiaries totaled $103 million. Our intent is to permanently reinvest these funds outside the United States for capital expansion. The Company has not provided United States income taxes and foreign withholding taxes on the portion of undistributed earnings of foreign subsidiaries that the Company considers to be indefinitely reinvested outside of the United States as of the end of year 2016. If these foreign earnings were to be repatriated in the future, the related United States tax liability may be reduced by any foreign income taxes previously paid on these earnings. As of the year ended 2016, the cumulative amount of earnings upon which United States income taxes have not been provided was approximately $194 million. If those earnings were not considered indefinitely reinvested, the Company estimates that an additional income tax expense of approximately $45 million would be recorded. Based on our current projected capital needs and the current amount of cash and cash equivalents held by our foreign subsidiaries, we do not anticipate incurring any material tax costs beyond our accrued tax position in connection with any repatriation, but we may be required to accrue for unanticipated additional tax costs in the future if our expectations or the amount of cash held by our foreign subsidiaries change.
Merchandising Segment – The primary cash requirements of our merchandising business relate to capital for new retail stores, purchases of inventory, investments in our management information systems and infrastructure, and general working capital needs. We historically have met these requirements with cash generated from our merchandising business operations, borrowings under revolving credit facilities, and by issuing debt and equity securities.
53
The cash flow we generate from our merchandising business is seasonal, with our peak cash requirements for inventory occurring from April through November. While we have consistently generated overall positive annual cash flow from our operating activities, other sources of liquidity are required by our merchandising business during these peak cash use periods. These sources historically have included short-term borrowings under our revolving credit facility and access to debt markets. While we generally have been able to manage our cash needs during peak periods, if any disruption occurred to our funding sources, or if we underestimated our cash needs, we would be unable to purchase inventory and otherwise conduct our merchandising business to its maximum effectiveness, which could result in reduced revenue and profits.
Our credit agreement provides for an unsecured $775 million revolving credit facility and permits the issuance of letters of credit up to $75 million and swing line loans up to $30 million. The credit facility may be increased to $800 million subject to certain terms and conditions. The term of the credit facility expires on June 18, 2019. Advances under the credit facility will be used for the Company’s general business purposes, including working capital support.
Our unsecured $775 million revolving credit facility and unsecured senior notes contain certain financial covenants, including the maintenance of minimum debt coverage, a fixed charge coverage ratio, a leverage ratio, and a minimum consolidated net worth standard. In the event that we failed to comply with these covenants, a default would trigger and all principal and outstanding interest would immediately be due and payable. At December 31, 2016, and January 2, 2016, we were in compliance with all financial covenants under our credit agreements and unsecured notes. We anticipate that we will continue to be in compliance with all financial covenants under our credit agreements and unsecured notes through at least the next 12 months.
We have an unsecured $20 million Canadian ("CAD") revolving credit facility for our operations in Canada. Borrowings are payable on demand with interest payable monthly. The credit facility permits the issuance of letters of credit up to $10 million CAD in the aggregate, which reduce the overall credit limit available under the credit facility.
On September 1, 2015, we announced that our Board of Directors approved a share repurchase program authorizing the Company to repurchase up to $500 million of its common stock over a two-year period. This authorization is in addition to the standing annual authorization to repurchase shares to offset dilution resulting from equity-based awards issued under the Company’s equity compensation plans. This share repurchase program does not obligate us to repurchase any outstanding shares of our common stock, and the program may be limited or terminated at any time. We did not engage in any stock repurchase activity in 2016. As of December 31, 2016, up to $426 million of authorization to repurchase our common stock remained under this program. Pursuant to the terms of the Merger Agreement, the Company generally may not repurchase shares of its common stock, except in connection with the exercise of outstanding stock options or the settlement of restricted stock unit awards. As a result, the Company does not anticipate repurchasing any further shares under this program.
Financial Services Segment – The primary cash requirements of the Financial Services segment relate to the financing of credit card loans. These cash requirements will increase if our credit card originations increase or if our cardholders’ balances or spending increase. The Financial Services segment sources operating funds in the ordinary course of business through various financing activities, which include funding obtained from securitization transactions, obtaining brokered and non-brokered certificates of deposit, borrowings under its federal funds purchase agreements, and cash generated from operations. We have been, and will continue to be, particularly reliant on funding from securitization transactions for the Financial Services segment. A failure to renew existing variable funding facilities or to add additional capacity on favorable terms as it becomes necessary could increase our financing costs and potentially limit our ability to grow the business of the Financial Services segment. Unfavorable conditions in the asset-backed securities markets generally, including the unavailability of commercial bank liquidity support or credit enhancements, could have a similar effect.
54
During 2016, the Financial Services segment issued $507 million in certificates of deposit and completed a term securitization totaling $1.0 billion. Additionally, the Financial Services segment increased the three variable funding facilities and extended the maturity dates as follows:
• | the Series 2008-III facility from $300 million due March 2018 to $500 million total capacity, with $200 million due October 2017 and $300 million due March 2018, |
• | the Series 2011-I facility from $300 million due March 2016 to $1.3 billion total capacity, with $800 million due March 2018 and $500 million due March 2019, and |
• | the Series 2011-III facility from $500 million due March 2017 to $1.2 billion total capacity, with $700 million due March 2018 and $500 million due September 2019. |
We believe that these liquidity sources are sufficient to fund the Financial Services segment’s foreseeable cash requirements, including maturities and near-term growth plans. The Trust has three term securitizations totaling $500 million, $300 million, and $500 million with expected principal payment due dates of February 2017, March 2017, and June 2017, respectively. The principal payments are expected to be funded from restricted cash generated from credit card operations of the Trust.
WFB is prohibited by regulations from lending money to Cabela’s or other affiliates. WFB is subject to capital requirements imposed by Nebraska banking law and the Visa U.S.A., Inc. membership rules, and its ability to pay dividends is also limited by Nebraska and Federal banking law. If there are any disruptions in the credit markets, the Financial Services segment, like many other financial institutions, may increase its funding from certificates of deposit which may result in increased competition in the deposits market with fewer funds available or at unattractive rates. Our ability to issue certificates of deposit is reliant on our current regulatory capital levels. WFB is classified as a “well-capitalized” bank, the highest category under the regulatory framework for prompt corrective action. If WFB were to be classified as an “adequately-capitalized” bank, which is the next level category down from “well-capitalized,” we would be required to obtain a waiver from the FDIC in order to continue to issue certificates of deposit. We will invest additional capital in the Financial Services segment, if necessary, in order for WFB to continue to meet the minimum requirements for the “well-capitalized” classification under the regulatory framework for prompt corrective action. In addition to the non-brokered certificates of deposit market to fund growth and maturing securitizations, we have access to the brokered certificates of deposit market through multiple financial institutions for liquidity and funding purposes.
Effective January 2015, WFB was subject to the interim final rules and the joint final rules adopted by the FDIC in July 2013 pertaining to the implementation of regulatory capital reforms recommended by the Basel Committee on Banking Supervision in December 2010, and capital reforms required by the Reform Act. These rules revised the agencies’ prompt corrective action framework by introducing a “common equity tier 1 capital” requirement and a higher “minimum tier 1 capital” requirement. The impact of the adoption of these rules was minimal to WFB.
For a discussion of other additional legislative and regulatory developments that pertain to the Financial Services segment, refer to “Management’s Discussion and Analysis of Financial Condition and Results of Operations – Current Business Environment – Developments in Legislation and Regulation.”
The Financial Services segment historically has funded most of its growth in credit card loans through an asset securitization program. The Financial Services segment utilizes the Trust for the purpose of routinely securitizing credit card loans and issuing beneficial interest to investors. The Trust issues variable funding facilities and long-term notes (collectively referred to herein as “secured obligations of the Trust”), each of which has an undivided interest in the assets of the Trust. The Financial Services segment must retain a minimum 20 day average of 5% of the loans in the securitization trust which ranks pari passu with the investors’ interests in the Trust. In addition, the Financial Services segment owns notes issued by the Trust from some of the securitizations, which in some cases may be subordinated to other notes issued. The Financial Services segment’s retained interests are eliminated upon consolidation of the Trust. The consolidated assets of the Trust are subject to credit, payment, and interest rate risks on the transferred credit card loans. The credit card loans of the Trust are restricted for the repayment of the secured obligations of the Trust.
55
To protect the holders of the secured obligations of the Trust (the “investors”), the securitization structures include certain features that could result in earlier-than-expected repayment of the securities, which could cause the Financial Services segment to sustain a loss of one or more of its retained interests and could prompt the need to seek alternative sources of funding. The primary investor protection feature relates to the availability and adequacy of cash flows in the securitized pool of loans to meet contractual requirements, the insufficiency of which triggers early repayment of the securities. The Financial Services segment refers to this as the early amortization feature. Investors are allocated cash flows derived from activities related to the accounts comprising the securitized pool of loans, the amounts of which reflect finance charges collected, certain fee assessments collected, allocations of interchange, and recoveries on charged off accounts. These cash flows are considered to be restricted under the governing documents to pay interest to investors, servicing fees, and to absorb the investor’s share of charge-offs occurring within the securitized pool of loans. Any cash flows remaining in excess of these requirements are reported to investors as excess spread. An excess spread of less than zero percent for a contractually specified period, generally a three-month average, would trigger an early amortization event. Such an event could result in the Financial Services segment incurring losses related to its retained interests. In addition, if the retained interest in the loans of the Financial Services segment falls below the 5% minimum 20 day average and the Financial Services segment fails to add new accounts to the securitized pool of loans, an early amortization event would be triggered.
Another feature, which is applicable to the secured obligations of the Trust, is one in which excess cash flows generated by the transferred loans are held at the Trust for the benefit of the investors. This cash reserve account funding is triggered when the three-month average excess spread rate of the Trust decreases to below 4.50% with increasing funding requirements as excess spread levels decline below preset levels or as contractually required by the governing documents. Similar to early amortization, this feature also is designed to protect the investors’ interests from loss, thus making the cash restricted. Upon scheduled maturity or early amortization of a securitization, the Financial Services segment is required to remit principal payments received on the securitized pool of loans to the Trust which are restricted for the repayment of the investors’ principal note. The investors have no recourse to the Financial Services segment’s other assets for failure of debtors to pay other than for breaches of certain customary representations, warranties, and covenants. These representations, warranties, covenants, and the related indemnities do not protect the Trust or third party investors against credit-related losses on the loans.
56
The total amounts and maturities for our credit card securitizations as of December 31, 2016, were as follows:
Total Available Capacity | Third Party Investor Available Capacity | Third Party Investor Outstanding | ||||||||||||||||
Interest Rate | Expected Maturity | |||||||||||||||||
Series | Type | |||||||||||||||||
(Dollars in Thousands) | ||||||||||||||||||
Series 2012-I (1) | Term | $ | 350,000 | $ | 275,000 | $ | 275,000 | Fixed | February 2017 | |||||||||
Series 2012-I (1) | Term | 150,000 | 150,000 | 150,000 | Floating | February 2017 | ||||||||||||
Series 2012-II | Term | 375,000 | 300,000 | 300,000 | Fixed | June 2017 | ||||||||||||
Series 2012-II | Term | 125,000 | 125,000 | 125,000 | Floating | June 2017 | ||||||||||||
Series 2013-I | Term | 385,000 | 327,250 | 327,250 | Fixed | February 2023 | ||||||||||||
Series 2013-II | Term | 152,500 | 100,000 | 100,000 | Fixed | August 2018 | ||||||||||||
Series 2013-II | Term | 197,500 | 197,500 | 197,500 | Floating | August 2018 | ||||||||||||
Series 2014-I | Term | 45,000 | — | — | Fixed | March 2017 | ||||||||||||
Series 2014-I | Term | 255,000 | 255,000 | 255,000 | Floating | March 2017 | ||||||||||||
Series 2014-II | Term | 60,000 | — | — | Fixed | July 2019 | ||||||||||||
Series 2014-II | Term | 340,000 | 340,000 | 340,000 | Floating | July 2019 | ||||||||||||
Series 2015-I | Term | 275,000 | 218,750 | 218,750 | Fixed | March 2020 | ||||||||||||
Series 2015-I | Term | 100,000 | 100,000 | 100,000 | Floating | March 2020 | ||||||||||||
Series 2015-II | Term | 300,000 | 240,000 | 240,000 | Fixed | July 2020 | ||||||||||||
Series 2015-II | Term | 100,000 | 100,000 | 100,000 | Floating | July 2020 | ||||||||||||
Series 2016-I | Term | 720,000 | 570,000 | 570,000 | Fixed | June 2019 | ||||||||||||
Series 2016-I | Term | 280,000 | 280,000 | 280,000 | Floating | June 2019 | ||||||||||||
Total term | 4,210,000 | 3,578,500 | 3,578,500 | |||||||||||||||
Series 2008-III | Variable Funding | 578,035 | 500,000 | — | Floating | March 2018 | ||||||||||||
Series 2011-I | Variable Funding | 1,529,412 | 1,300,000 | 300,000 | Floating | March 2019 | ||||||||||||
Series 2011-III | Variable Funding | 1,411,765 | 1,200,000 | 120,000 | Floating | September 2019 | ||||||||||||
Total variable | 3,519,212 | 3,000,000 | 420,000 | |||||||||||||||
Total available | $ | 7,729,212 | $ | 6,578,500 | $ | 3,998,500 | ||||||||||||
(1) | On February 15, 2017, the Series 2012-I notes totaling $425 million were repaid in full using restricted cash of the Trust. |
The securitized credit card loans of the Financial Services segment could experience poor performance, including increased delinquencies and credit losses, lower payment rates, or a decrease in excess spreads below certain thresholds. This could result in a downgrade or withdrawal of the ratings on the outstanding securities issued in the Financial Services segment’s securitization transactions, cause early amortization of these securities, or result in higher required credit enhancement levels. Credit card loans performed within established guidelines and no events which could trigger an early amortization occurred during the years ended December 31, 2016, and January 2, 2016.
The Financial Services segment utilizes brokered and non-brokered certificates of deposit to partially finance its operating activities. The Financial Services segment issues certificates of deposit in a minimum amount of one hundred thousand dollars in various maturities. At December 31, 2016, the Financial Services segment had $1.2 billion of certificates of deposit outstanding with maturities ranging from January 2017 to July 2023 and with a weighted average effective annual fixed rate of 1.89%. This outstanding balance compares to $880 million at January 2, 2016, with a weighted average effective annual fixed rate of 2.23%. For a summary schedule of the contractual maturities of our certificates of deposit for the last two years, refer to Note 10 “Time Deposits” of the Notes to Consolidated Financial Statements.
57
Operating, Investing and Financing Activities
The following table presents changes in our cash and cash equivalents for the years ended:
2016 | 2015 | 2014 | |||||||||
(In Thousands) | |||||||||||
Net cash provided by operating activities | $ | 465,400 | $ | 331,939 | $ | 260,730 | |||||
Net cash used in investing activities | (828,871 | ) | (778,663 | ) | (1,266,302 | ) | |||||
Net cash provided by financing activities | 311,178 | 629,462 | 954,024 | ||||||||
2016 versus 2015
Operating Activities – Net cash provided by operating activities was $465 million in 2016, a net increase of $133 million compared to 2015. Comparing the respective years, we had net increases of $32 million in net credit card loans originated at Cabela's through our merchandising business, $31 million in inventories due to the addition of new retail stores, $28 million in income taxes, and $22 million in other long-term liabilities. In addition, our net cash provided by operating activities was positively impacted by the non-cash adjustment of $63 million in provision for loan losses due to increases in loan delinquencies and, to a lesser extent, growth in the average outstanding balance of credit card loans.
Partially offsetting these increases to operating activities were net decreases of $38 million relating to accounts payable and accrued expenses and other liabilities primarily due to increases in inventories and in the number of retail stores and $5 million in gift instruments, credit card rewards, and loyalty rewards programs due to increased volume.
Investing Activities – Cash used in investing activities increased $50 million in 2016 compared to 2015 primarily due to a net change of $302 million in restricted cash of the Trust, which was used to repay $255 million of Series 2011-II and $255 million of Series 2011-IV notes in full in June 2016 and October 2016, respectively, and a decrease in cash of $25 million related to our credit card loan activity from outside sources. Cash paid for property and equipment totaled $151 million in 2016 compared to $413 million in 2015. At December 31, 2016, the Company estimated it had total cash commitments of approximately $95 million outstanding for projected expenditures related to the development, construction, and completion of new retail stores. We expect to fund these estimated capital expenditures over the next 12 months with funds from operations and borrowings.
Financing Activities – Cash provided by financing activities decreased $318 million in 2016 compared to 2015, primarily due to a decrease in net borrowings on secured obligations of the Trust by the Financial Services segment of $261 million, partially offset by an increase of $215 million in time deposits which the Financial Services segment utilizes as a source in funding its credit card operations. We also had net increases of $292 million in net borrowings on our revolving credit facilities and $33 million in unpresented checks comparing the respective years. We issued $550 million of senior secured notes in 2015 and repaid our existing unsecured notes for $215 million due February 27, 2016. In addition, we repurchased shares of our common stock at a cost of $174 million in 2015. We did not engage in any stock repurchase activity in 2016.
The following table presents the borrowing activities, net of repayments, of our Merchandising and Financial Services business segments for the years ended:
2016 | 2015 | ||||||
(In Thousands) | |||||||
Borrowings (repayments) on revolving credit facilities and inventory financing, net | $ | 119,523 | $ | (172,015 | ) | ||
Secured obligations of the Trust, net of repayments | 105,000 | 366,250 | |||||
Issuance (repayments) of long-term debt, net | (223,452 | ) | 541,566 | ||||
Borrowings, net of repayments | $ | 1,071 | $ | 735,801 | |||
58
The following table summarizes our availability under the Company’s debt and credit facilities, excluding the facilities of the Financial Services segment, at the years ended:
2016 | 2015 | ||||||
(In Thousands) | |||||||
Amounts available for borrowing under credit facilities (1) | $ | 775,000 | $ | 775,000 | |||
Principal amounts outstanding | (115,000 | ) | — | ||||
Outstanding letters of credit and standby letters of credit | (19,242 | ) | (20,246 | ) | |||
Remaining borrowing capacity, excluding the Financial Services segment facilities | $ | 640,758 | $ | 754,754 | |||
(1) | Consists of our revolving credit facility of $775 million which expires on June 18, 2019. |
Our $775 million unsecured credit agreement requires us to comply with certain financial and other customary covenants, including:
• | a fixed charge coverage ratio (as defined) of no less than 2.00 to 1 as of the last day of any fiscal quarter for the most recently ended four fiscal quarters (as defined); |
• | a leverage ratio (as defined) of no more than 3.00 to 1 as of the last day of any fiscal quarter; and |
• | a minimum consolidated net worth standard (as defined) as of the last day of each fiscal quarter. |
In addition, our unsecured senior notes contain various covenants and restrictions that are usual and customary for transactions of this type. Also, the debt agreements contain cross default provisions to other outstanding credit facilities. In the event that we failed to comply with these covenants, a default would trigger and all principal and outstanding interest would immediately be due and payable. At December 31, 2016, we were in compliance with all financial covenants under our credit agreements and unsecured notes. We anticipate that we will continue to be in compliance with all financial covenants under our credit agreements and unsecured notes through the next 12 months.
We also have an unsecured $20 million CAD credit facility with no outstanding balances at the end of 2016 or 2015. The Financial Services segment also has total borrowing availability of $100 million under its agreements to borrow federal funds. At December 31, 2016, the entire $100 million of borrowing capacity was available.
2015 versus 2014
Operating Activities – Net cash provided by operating activities was $332 million in 2015, a net increase of $69 million compared to 2014. Comparing the respective years, we had a net increase of $84 million related to income taxes, as we paid a deposit of $50 million in 2014 for federal taxes related to prior period uncertain tax positions, a net increase of $50 million in inventories, and an increase of $23 million in provision for loan losses. The increase in inventories in 2015 was primarily due to the addition of new retail stores as inventory levels totaled $819 million at the end of 2015 compared to $760 million at the end of 2014. Mostly offsetting these increases were net decreases of $32 million relating to accounts payable and accrued expenses and other liabilities primarily due to increases in inventories and in the number of retail stores; $25 million in other long-term liabilities due to changes related to prior period uncertain positions; $22 million in gift instruments, credit card rewards, and loyalty rewards programs due to increased volume; and $22 million in prepaid expenses and other assets.
Investing Activities – Cash used in investing activities increased $488 million in 2015 compared to 2014 primarily due to the use of $605 million in restricted cash of the Trust. Restricted cash of the Trust was used to repay $468 million of Series 2010-I and Series 2010-II notes in 2015 and totaled $41 million at January 2, 2016, compared to $335 million at December 27, 2014. Cash paid for property and equipment totaled $413 million in 2015 compared to $441 million in 2014. At January 2, 2016, the Company estimated it had total cash commitments of approximately $182 million outstanding for projected expenditures related to the development, construction, and completion of new retail stores. In addition, we had a net decrease in cash of $142 million related to our credit card loan activity from outside sources.
59
Financing Activities – Cash provided by financing activities decreased $322 million in 2015 compared to 2014. This net change in cash was primarily due to an decrease in net borrowings on secured obligations of the Trust by the Financial Services segment of $659 million. Our Series 2010-I and Series 2010-II notes totaling $468 million were repaid in 2015 using restricted cash of the Trust, secured variable funding obligations totaling $480 million of the Trust were repaid, and $45 million in variable funding facilities was borrowed in 2014. We also had net decreases comparing the respective years of $292 million in net borrowings on our revolving credit facilities and $31 million in unpresented checks. Lastly, in 2015, we repurchased shares of our common stock at a cost of $174 million. These decreases were partially offset by our issuance in 2015 of $550 million of senior unsecured notes and an increase of $337 million in time deposits compared to 2014, which the Financial Services segment utilized as a source in funding its credit card operations.
Economic Development Bonds and Grants
In the past, we have negotiated government economic development arrangements with many local and state governments relating to the construction of a number of our new retail stores, including free land, monetary grants, and the recapture of incremental sales, property, or other taxes through EDBs. Where appropriate, we intend to continue to utilize economic development arrangements with state and local governments to offset some of the construction costs and improve the return on investment of our new retail stores. At December 31, 2016, and January 2, 2016, EDBs totaled $70 million and $84 million, respectively. In the fourth quarter of 2016, we identified three EDBs where the actual tax revenues associated with these properties were lower than previously projected. Refer to Note 1 “Nature of Business and Summary of Significant Accounting Policies” of the Notes to Consolidated Financial Statements under the section entitled “Government Economic Assistance and Economic Development Bonds” for information on our procedures used to analyze the amounts and timing of projected cash flows to be received from our EDBs and to Note 14 “Impairment and Restructuring Charges” for details on the impairment loss incurred in 2016.
We have also received grant funding in exchange for commitments made by us to the state or local government providing the funding. The commitments, such as assurance of agreed employment and wage levels at our retail stores or that the retail store will remain open, typically phase out over approximately five to ten years. If we fail to maintain the commitments during the applicable period, the funds we received may have to be repaid or other adverse consequences may arise, which could affect our cash flows and profitability. At December 31, 2016, and January 2, 2016, the total amount of grant funding subject to a specific contractual remedy was $26 million and $43 million, respectively. At December 31, 2016, and January 2, 2016, we had recorded $1 million and $17 million, respectively, in the consolidated balance sheets relating to these grants. In October 2016, we paid $16 million to satisfy in full a liability judgment entered against the Company in February 2014 related to a radius restriction of a retail store and associated incentives and value of real property that had been recognized as a liability in the Company’s consolidated balance sheets.
Impact of Inflation
We do not believe that our operating results have been materially affected by inflation during the preceding three years. We cannot assure, however, that our operating results will not be adversely affected by inflation in the future.
60
Contractual Obligations and Other Commercial Commitments
The following tables provide summary information concerning our future contractual obligations at December 31, 2016.
2017 | 2018 | 2019 | 2020 | 2021 | Thereafter | Total | |||||||||||||||||||||
(In Thousands) | |||||||||||||||||||||||||||
Long-term debt (1) | $ | 79,687 | $ | 8,143 | $ | 115,000 | $ | 100,000 | $ | — | $ | 450,000 | $ | 752,830 | |||||||||||||
Interest payments on long-term debt (2) | 23,529 | 21,119 | 20,826 | 20,826 | 17,596 | 42,171 | 146,067 | ||||||||||||||||||||
Operating leases | 23,791 | 23,768 | 23,267 | 22,602 | 22,091 | 279,401 | 394,920 | ||||||||||||||||||||
Time deposits by maturity | 177,015 | 320,373 | 154,739 | 175,305 | 111,868 | 229,557 | 1,168,857 | ||||||||||||||||||||
Interest payments on time deposits | 21,177 | 17,844 | 13,934 | 10,676 | 7,147 | 8,742 | 79,520 | ||||||||||||||||||||
Secured obligations of the Trust | 1,525,000 | 297,500 | 1,190,000 | 658,750 | — | 327,250 | 3,998,500 | ||||||||||||||||||||
Interest payments on secured obligations of the Trust (2) | 49,736 | 43,479 | 31,367 | 14,367 | 8,869 | 10,347 | 158,165 | ||||||||||||||||||||
New store construction obligations and grant commitments (3) | 83,873 | 38,954 | 609 | 586 | 425 | 2,783 | 127,230 | ||||||||||||||||||||
Purchase obligations (4) | 574,773 | 24,003 | 11,692 | 2,271 | 9 | — | 612,748 | ||||||||||||||||||||
Unrecognized tax benefits (5) | — | — | — | — | — | 74,737 | 74,737 | ||||||||||||||||||||
Total | $ | 2,558,581 | $ | 795,183 | $ | 1,561,434 | $ | 1,005,383 | $ | 168,005 | $ | 1,424,988 | $ | 7,513,574 | |||||||||||||
(1) | Includes $12 million in capital lease obligations classified as current portion of long-term debt in our consolidated balance sheets. |
(2) | These amounts do not include estimated interest payments due under our revolving credit facilities or our secured variable funding obligations because the amount that will be borrowed under these facilities in future years is uncertain. |
(3) | Consists of $95 million for estimated contractual obligations and commitments related to the development, construction, and completion of new retail stores and $32 million in grant funding commitments. |
(4) | Our purchase obligations relate primarily to purchases of inventory, shipping, and other goods and services in the ordinary course of business under binding purchase orders or contracts. The amount of purchase obligations shown is based on assumptions regarding the legal enforceability against us of purchase orders or contracts we had outstanding at the end of 2016. Under different assumptions regarding our rights to cancel our purchase orders or contracts, or different assumptions regarding the enforceability of the purchase orders or contracts under applicable laws, the amount of purchase obligations shown in the preceding table would be less. |
(5) | Amounts for unrecognized tax benefits, including accrued interest, are not reflected in years 2017 through 2021 since the ultimate amount and timing of any future cash settlements cannot be predicted with reasonable certainty. |
61
The following table provides summary information concerning other commercial commitments at December 31, 2016:
(In Thousands) | |||
Letters of credit (1) | $ | 7,138 | |
Standby letters of credit (1) | 12,104 | ||
Revolving line of credit for boat and ATV inventory (2) | 22,425 | ||
Cabela’s issued letters of credit | 48,878 | ||
Bank – federal funds (3) | — | ||
Secured variable funding obligations of the Trust (4) | 420,000 | ||
Total | $ | 510,545 | |
(1) | Our credit agreement permits the issuance of letters of credit up to $75 million and swing line loans up to $30 million. |
(2) | The line of credit for boat and all-terrain vehicles financing is limited by the $775 million revolving line of credit to $75 million of secured collateral. |
(3) | The maximum amount that can be borrowed on the federal funds agreements is $100 million. |
(4) | The maximum amount that can be borrowed from third party investors on the variable funding facilities is $3 billion. |
Off-Balance Sheet Arrangement
Credit Card Limits – The Financial Services segment bears off-balance sheet risk in the normal course of its business. One form of this risk is through the Financial Services segment’s commitment to extend credit to cardholders up to the maximum amount of their credit limits. The aggregate of such potential funding requirements totaled $36 billion above existing balances at the end of December 31, 2016. These funding obligations are not included in our consolidated balance sheets. While the Financial Services segment has not experienced, and does not anticipate that it will experience, a significant draw down of unfunded credit lines by its cardholders, such an event would create a cash need at the Financial Services segment which likely could not be met by our available cash and funding sources. The Financial Services segment has the right to reduce or cancel these available lines of credit at any time.
Critical Accounting Policies and Use of Estimates
Our consolidated financial statements have been prepared in accordance with accounting principles generally accepted in the United States of America which requires management to make estimates and judgments that affect amounts reported in the consolidated financial statements and accompanying notes. Management has discussed the development, selection, and disclosure of critical accounting policies and estimates with the Audit Committee of Cabela’s Board of Directors. While our estimates and assumptions are based on our knowledge of current events and actions we may undertake in the future, actual results may ultimately differ from our estimates and assumptions. Our estimation processes contain uncertainties because they require management to make assumptions and apply judgment to make these estimates. Should actual results be different than our estimates, we could be exposed to gains or losses from differences that may be material.
For a summary of our significant accounting policies, refer to Note 1 “Nature of Business and Summary of Significant Accounting Policies” of the Notes to Consolidated Financial Statements. We believe the accounting policies discussed below represent accounting policies we apply that are the most critical to understanding our consolidated financial statements.
Merchandise Revenue Recognition – Revenue is recognized on our Internet and catalog sales when merchandise is delivered to the customer with the point of delivery based on our estimate of shipping time to the customer. We recognize reserves for estimated product returns based upon our historical return experience and expectations. Had our estimate of merchandise in-transit to customers and our estimate of product returns been different by 10% at the end of 2016, our operating income would have been higher or lower by approximately $1 million. Sales of gift instruments are recorded in merchandise revenue when the gift instruments are redeemed in exchange for merchandise or services and as a liability prior to redemption. We recognize breakage on gift instruments as revenue when the probability of redemption is remote. Had our estimate of breakage on our recorded liability for gift instruments been different by 10% of the recorded liability at the end of 2016, our merchandise revenue would have been higher or lower by approximately $1 million.
62
Inventories – Inventories are stated at the lower of average cost or market. All inventories are finished goods. We estimate the provision for inventory shrinkage based on our historical inventory accuracy rates as determined by periodic and annual cycle counts. The provision for damaged goods from returns is based upon our historical experience. We estimate provisions for obsolete or slow moving inventory based on historical loss, specific identification, product performance statistics, and future merchandising objectives. Had our estimated inventory reserves been different by 10% at the end of 2016, our cost of sales would have been higher or lower by approximately $3 million.
Allowance for Loan Losses on Credit Cards – The allowance for loan losses represents management’s estimate of probable losses inherent in the credit card loan portfolio. The allowance for loan losses is established through a charge to the provision for loan losses and is evaluated by management for adequacy. The measurement of the overall allowance is subject to estimation risk, and the amount of actual losses can vary significantly from the estimated amounts. For example, had management’s estimate of net losses over the next 12 months been different by 10% at the end of 2016, the Financial Services segment’s allowance for loan losses and provision for loan losses would have changed by approximately $12 million.
Long-Lived Assets – Long-lived assets other than goodwill and other intangible assets, which generally are tested separately for impairment on an annual basis, are evaluated for impairment whenever events or changes in circumstances indicate that the carrying amount may not be recoverable. The calculation for an impairment loss compares the carrying value of the asset to that asset’s estimated fair value, which may be based on estimated future discounted cash flows, observable market prices, or unobservable market prices. We recognize an impairment loss if the asset’s carrying value exceeds its estimated fair value. Frequently our impairment loss calculations contain multiple uncertainties because they require management to make assumptions and to apply judgment to estimate future cash flows and asset fair values, including forecasting cash flows under different scenarios. We have consistently applied our accounting methodologies that we use to assess impairment loss. However, if actual results are not consistent with our estimates and assumptions used in estimating future cash flows and asset fair values, we may be exposed to losses that could be material.
Economic Development Bonds – On a quarterly basis, we revalue our EDBs and evaluate the projected underlying cash flows to determine if the carrying amount of such EDB can be recovered. To the extent the expected cash flows are not sufficient to recover the carrying amount, the bonds are assessed for impairment. Deficiencies in projected discounted cash flows below the recorded carrying amount of the EDB evidences that we do not expect to recover the cost basis. Consequently, the valuation results in an other than temporary impairment. Had our fair value estimates been lower by 10% at the end of 2016, the value of EDBs would have been approximately $7 million less with the unrealized loss reflected in comprehensive income if the loss was deemed to be temporary. Any declines in the fair value of available-for-sale EDBs below cost that are deemed to be other than temporary are reflected in earnings as realized losses.
Income Taxes – Income taxes are estimated for each jurisdiction in which we operate and require significant judgment, the use of estimates, and the interpretation and application of complex tax laws. Significant judgment is required in determining the timing and amounts of deductible and taxable items, and in evaluating the ultimate resolution of tax matters in dispute with tax authorities. Deferred tax assets and liabilities are provided for based on these assessments. We record a liability for unrecognized tax benefits resulting from tax positions taken, or expected to be taken, in an income tax return. We periodically reassess these probabilities and record any changes in the consolidated financial statements based on an evaluation of new information. We have not provided United States income taxes on undistributed earnings of foreign subsidiaries that we consider to be indefinitely reinvested outside of the United States as of the end of 2016. If these foreign earnings were to be repatriated in the future, the related United States tax liability may be reduced by any foreign income taxes previously paid on these earnings. We have reserved for potential adjustments to the provision for income taxes that may result from examinations by tax authorities, and we believe that the final outcome of these examinations or agreements will not have a material effect on our financial condition, results of operations, or cash flows.
Recent Accounting Standards and Pronouncements
Refer to Note 25 “Accounting Pronouncements” of the Notes to Consolidated Financial Statements included in Part II, Item 8 of this Form 10-K, which is incorporated herein by reference.
ITEM 7A. QUANTITATIVE AND QUALITATIVE DISCLOSURES ABOUT MARKET RISK
We are exposed to interest rate risk through the operations of the Financial Services segment, and, to a lesser extent, through our merchandising operations. We also are exposed to foreign currency risk through our merchandising operations.
63
Financial Services Segment Interest Rate Risk – Interest rate risk refers to changes in earnings due to interest rate changes. To the extent that interest income collected on credit card loans and interest expense on certificates of deposit and secured obligations of the Trust do not respond equally to changes in interest rates, or that rates do not change uniformly, earnings could be affected. The variable rate credit card loans are indexed to the one-month London Interbank Offered Rate (“LIBOR”) and the credit card portfolio is segmented into risk-based pricing tiers each with a different interest margin. Variable rate secured obligations of the Trust are indexed to LIBOR-based rates of interest and are periodically repriced. Certificates of deposit and fixed rate secured obligations of the Trust are priced at the current prevailing market rate at the time of issuance. We manage and mitigate our interest rate sensitivity through several techniques, including managing the maturity, repricing, and mix of fixed and variable assets and liabilities by issuing fixed rate secured obligations of the Trust or certificates of deposit and by indexing the customer rates to the same index as our secured obligations of the Trust.
The table below shows the mix of our credit card account balances as a percentage of total balances outstanding at the years ended:
2016 | 2015 | 2014 | ||||||
Balances carrying an interest rate based upon various interest rate indices | 71.4 | % | 68.4 | % | 65.9 | % | ||
Balances carrying an interest rate of 7.99% or 9.99% | 4.2 | 4.6 | 4.6 | |||||
Balances carrying a promotional interest rate of 0.00% | 0.3 | — | — | |||||
Balances not carrying interest because the previous month balance was paid in full | 24.1 | 27.0 | 29.5 | |||||
100.0 | % | 100.0 | % | 100.0 | % | |||
Charges on the credit cards issued by the Financial Services segment were priced at a margin over various defined lending rates. No interest is charged if the account is paid in full within 25 days of the billing cycle, which represented 24.1% of total balances outstanding at the end of 2016.
Management has performed several interest rate risk analyses to measure the effects of the timing of the repricing of our interest sensitive assets and liabilities. Based on these analyses, at the end of 2016, we believe that an increase in LIBOR is more likely. Therefore, we believe that an immediate increase in LIBOR of 50 basis points would cause a pre-tax increase to projected earnings of approximately $9 million for the Financial Services segment over the next 12 months.
Merchandising Business Interest Rate Risk – The interest payable on our line of credit is based on variable interest rates and therefore affected by changes in market interest rates. If interest rates on existing variable rate debt increased 1.0%, our interest expense and results from operations and cash flows would not be materially affected.
Foreign Currency Risk – We purchase a significant amount of inventory from vendors outside of the United States in transactions that are primarily in U. S. dollars. Any currency risks related to our international purchase transactions in currencies other than the U. S. dollar are immaterial to us. A decline in the relative value of the U. S. dollar to other foreign currencies could, however, lead to increased merchandise costs. For our retail operations in Canada, we intend to fund all transactions in Canadian dollars and utilize cash held by our foreign subsidiaries as well as our unsecured revolving credit agreement of $20 million CAD to fund such operations. As our operations in Canada continue to expand, a sustained decline in the relative value of the Canadian dollar to the U.S. dollar could negatively impact our consolidated results of operations.
64
ITEM 8. FINANCIAL STATEMENTS AND SUPPLEMENTARY DATA
TABLE OF CONTENTS | |
Page | |
REPORT OF INDEPENDENT REGISTERED PUBLIC ACCOUNTING FIRM | |
CONSOLIDATED FINANCIAL STATEMENTS: | |
Consolidated Statements of Income | |
Consolidated Statements of Comprehensive Income | |
Consolidated Balance Sheets | |
Consolidated Statements of Cash Flows | |
Consolidated Statements of Stockholders’ Equity | |
Notes to Consolidated Financial Statements | |
65
REPORT OF INDEPENDENT REGISTERED PUBLIC ACCOUNTING FIRM
To the Board of Directors and Stockholders of
Cabela’s Incorporated and Subsidiaries
Sidney, Nebraska
We have audited the accompanying consolidated balance sheets of Cabela’s Incorporated and Subsidiaries (the “Company”) as of December 31, 2016 and January 2, 2016, and the related consolidated statements of income, comprehensive income, stockholders’ equity and cash flows for each of the three years in the period ended December 31, 2016. Our audits also included the financial statement schedule listed in the Index at Item 15. These financial statements and financial statement schedule are the responsibility of the Company’s management. Our responsibility is to express an opinion on the financial statements and financial statement schedule based on our audits.
We conducted our audits in accordance with the standards of the Public Company Accounting Oversight Board (United States). Those standards require that we plan and perform the audit to obtain reasonable assurance about whether the financial statements are free of material misstatement. An audit includes examining, on a test basis, evidence supporting the amounts and disclosures in the financial statements. An audit also includes assessing the accounting principles used and significant estimates made by management, as well as evaluating the overall financial statement presentation. We believe that our audits provide a reasonable basis for our opinion.
In our opinion, such consolidated financial statements present fairly, in all material respects, the financial position of Cabela’s Incorporated and Subsidiaries as of December 31, 2016 and January 2, 2016, and the results of their operations and their cash flows for each of the three years in the period ended December 31, 2016, in conformity with accounting principles generally accepted in the United States of America. Also, in our opinion, such financial statement schedule, when considered in relation to the basic consolidated financial statements taken as a whole, presents fairly, in all material respects, the information set forth therein.
We have also audited, in accordance with the standards of the Public Company Accounting Oversight Board (United States), the Company’s internal control over financial reporting as of December 31, 2016, based on the criteria established in Internal Control - Integrated Framework (2013) issued by the Committee of Sponsoring Organizations of the Treadway Commission and our report dated February 16, 2017, expressed an unqualified opinion on the Company’s internal control over financial reporting.
/s/ Deloitte & Touche LLP
DELOITTE & TOUCHE LLP
Omaha, Nebraska
February 16, 2017
66
CABELA’S INCORPORATED AND SUBSIDIARIES | |||||||||||
CONSOLIDATED STATEMENTS OF INCOME | |||||||||||
(Dollars in Thousands Except Earnings Per Share) | |||||||||||
Fiscal Years | |||||||||||
2016 | 2015 | 2014 | |||||||||
Revenue: | |||||||||||
Merchandise sales | $ | 3,558,019 | $ | 3,481,375 | $ | 3,200,219 | |||||
Financial Services revenue | 543,061 | 502,543 | 430,385 | ||||||||
Other revenue | 28,279 | 13,784 | 17,046 | ||||||||
Total revenue | 4,129,359 | 3,997,702 | 3,647,650 | ||||||||
Cost of revenue: | |||||||||||
Merchandise costs (exclusive of depreciation and amortization) | 2,413,850 | 2,286,554 | 2,058,891 | ||||||||
Cost of other revenue | 13,135 | 378 | 1,398 | ||||||||
Total cost of revenue (exclusive of depreciation and amortization) | 2,426,985 | 2,286,932 | 2,060,289 | ||||||||
Selling, distribution, and administrative expenses | 1,414,312 | 1,387,647 | 1,251,325 | ||||||||
Impairment and restructuring charges | 14,122 | 15,331 | 641 | ||||||||
Operating income | 273,940 | 307,792 | 335,395 | ||||||||
Interest expense, net | (31,481 | ) | (22,882 | ) | (21,842 | ) | |||||
Other non-operating income, net | 5,141 | 9,717 | 4,924 | ||||||||
Income before provision for income taxes | 247,600 | 294,627 | 318,477 | ||||||||
Provision for income taxes | 100,653 | 105,297 | 116,762 | ||||||||
Net income | $ | 146,947 | $ | 189,330 | $ | 201,715 | |||||
Earnings per basic share | $ | 2.15 | $ | 2.70 | $ | 2.84 | |||||
Earnings per diluted share | $ | 2.13 | $ | 2.67 | $ | 2.81 | |||||
Basic weighted average shares outstanding | 68,323,540 | 70,102,715 | 70,987,168 | ||||||||
Diluted weighted average shares outstanding | 68,996,664 | 70,968,913 | 71,877,856 | ||||||||
Refer to notes to consolidated financial statements.
67
CABELA’S INCORPORATED AND SUBSIDIARIES | |||||||||||
CONSOLIDATED STATEMENTS OF COMPREHENSIVE INCOME | |||||||||||
(In Thousands) | |||||||||||
Fiscal Years | |||||||||||
2016 | 2015 | 2014 | |||||||||
Net income | $ | 146,947 | $ | 189,330 | $ | 201,715 | |||||
Other comprehensive income (loss): | |||||||||||
Foreign currency translation adjustments | 6,986 | (39,784 | ) | (14,821 | ) | ||||||
Unrealized gain (loss) on economic development bonds, net of taxes of $(1,051), $500, and $2,938 | (1,994 | ) | 576 | 4,839 | |||||||
Total other comprehensive income (loss) | 4,992 | (39,208 | ) | (9,982 | ) | ||||||
Comprehensive income | $ | 151,939 | $ | 150,122 | $ | 191,733 | |||||
Refer to notes to consolidated financial statements.
68
CABELA’S INCORPORATED AND SUBSIDIARIES | |||||||
CONSOLIDATED BALANCE SHEETS | |||||||
(Dollars in Thousands Except Par Values) | |||||||
December 31, 2016 | January 2, 2016 | ||||||
ASSETS | |||||||
CURRENT | |||||||
Cash and cash equivalents | $ | 263,825 | $ | 315,066 | |||
Restricted cash of the Trust | 48,697 | 40,983 | |||||
Accounts receivable, net | 76,140 | 79,330 | |||||
Credit card loans (includes restricted credit card loans of the Trust of $5,661,101 and $5,066,660), net of allowance for loan losses of $118,343 and $75,911 | 5,579,575 | 5,035,267 | |||||
Inventories | 860,360 | 819,271 | |||||
Prepaid expenses and other current assets | 132,250 | 117,330 | |||||
Income taxes receivable | 75,731 | 77,698 | |||||
Total current assets | 7,036,578 | 6,484,945 | |||||
Property and equipment, net | 1,807,209 | 1,811,302 | |||||
Deferred income taxes | — | 28,042 | |||||
Other assets | 127,037 | 138,715 | |||||
Total assets | $ | 8,970,824 | $ | 8,463,004 | |||
LIABILITIES AND STOCKHOLDERS’ EQUITY | |||||||
CURRENT | |||||||
Accounts payable, including unpresented checks of $41,132 and $23,580 | $ | 347,784 | $ | 281,985 | |||
Gift instruments, credit card rewards, and loyalty rewards programs | 387,865 | 365,427 | |||||
Accrued expenses and other liabilities | 172,744 | 224,733 | |||||
Time deposits | 177,015 | 215,306 | |||||
Current maturities of secured variable funding obligations of the Trust | 420,000 | 655,000 | |||||
Current maturities of secured long-term obligations of the Trust, net | 1,104,685 | 509,673 | |||||
Current maturities of long-term debt, net | 79,677 | 223,452 | |||||
Total current liabilities | 2,689,770 | 2,475,576 | |||||
Long-term time deposits | 991,842 | 664,593 | |||||
Secured long-term obligations of the Trust, less current maturities, net | 2,466,576 | 2,721,259 | |||||
Long-term debt, less current maturities, net | 671,509 | 635,898 | |||||
Deferred income taxes | 7,288 | — | |||||
Other long-term liabilities | 132,240 | 137,035 | |||||
COMMITMENTS AND CONTINGENCIES | |||||||
STOCKHOLDERS’ EQUITY | |||||||
Preferred stock, $0.01 par value; Authorized – 10,000,000 shares; Issued – none | — | — | |||||
Common stock, $0.01 par value: | |||||||
Class A Voting, Authorized – 245,000,000 shares | |||||||
Issued – 71,595,020 and 71,595,020 shares | |||||||
Outstanding – 68,502,256 and 67,818,715 shares | 716 | 716 | |||||
Additional paid-in capital | 384,353 | 389,754 | |||||
Retained earnings | 1,798,809 | 1,651,862 | |||||
Accumulated other comprehensive loss | (45,922 | ) | (50,914 | ) | |||
Treasury stock, at cost – 3,092,764 and 3,776,305 shares | (126,357 | ) | (162,775 | ) | |||
Total stockholders’ equity | 2,011,599 | 1,828,643 | |||||
Total liabilities and stockholders’ equity | $ | 8,970,824 | $ | 8,463,004 | |||
Refer to notes to consolidated financial statements. | |||||||
69
CABELA’S INCORPORATED AND SUBSIDIARIES | |||||||||||
CONSOLIDATED STATEMENTS OF CASH FLOWS | |||||||||||
(In Thousands) | |||||||||||
Fiscal Years | |||||||||||
2016 | 2015 | 2014 | |||||||||
CASH FLOWS FROM OPERATING ACTIVITIES: | |||||||||||
Net income | $ | 146,947 | $ | 189,330 | $ | 201,715 | |||||
Adjustments to reconcile net income to net cash flows by operating activities: | |||||||||||
Depreciation and amortization | 150,163 | 132,696 | 113,097 | ||||||||
Impairment and restructuring charges | 15,878 | 12,532 | 641 | ||||||||
Stock-based compensation | 24,758 | 21,615 | 17,498 | ||||||||
Deferred income taxes | 36,381 | (20,188 | ) | (11,562 | ) | ||||||
Provision for loan losses | 147,661 | 85,120 | 61,922 | ||||||||
Other, net | (16,870 | ) | (1,517 | ) | 139 | ||||||
Changes in operating assets and liabilities, net: | |||||||||||
Accounts receivable | 2,420 | (18,065 | ) | (19,468 | ) | ||||||
Credit card loans originated from internal operations, net | (6,830 | ) | (39,292 | ) | (26,436 | ) | |||||
Inventories | (38,921 | ) | (70,207 | ) | (119,751 | ) | |||||
Prepaid expenses, other current assets, and other assets | (8,971 | ) | (21,778 | ) | (2,220 | ) | |||||
Accounts payable and accrued expenses and other liabilities | (8,687 | ) | 29,118 | 58,531 | |||||||
Gift instruments, credit card rewards, and loyalty rewards programs | 22,212 | 27,280 | 49,064 | ||||||||
Other long-term liabilities | (2,707 | ) | (24,944 | ) | 415 | ||||||
Income taxes receivable | 1,966 | 30,239 | (62,855 | ) | |||||||
Net cash provided by operating activities | 465,400 | 331,939 | 260,730 | ||||||||
CASH FLOWS FROM INVESTING ACTIVITIES: | |||||||||||
Property and equipment additions | (150,948 | ) | (412,716 | ) | (440,891 | ) | |||||
Proceeds from sale of other property | 10,000 | — | — | ||||||||
Change in credit card loans originated externally, net | (685,139 | ) | (659,910 | ) | (518,041 | ) | |||||
Change in restricted cash of the Trust, net | (7,714 | ) | 293,829 | (311,621 | ) | ||||||
Other investing changes, net | 4,930 | 134 | 4,251 | ||||||||
Net cash used in investing activities | (828,871 | ) | (778,663 | ) | (1,266,302 | ) | |||||
CASH FLOWS FROM FINANCING ACTIVITIES: | |||||||||||
Change in unpresented checks net of bank balance | 17,552 | (15,210 | ) | 16,073 | |||||||
Change in time deposits, net | 288,958 | 73,843 | (263,306 | ) | |||||||
Borrowings on secured obligations of the Trust | 4,005,000 | 3,098,750 | 1,380,000 | ||||||||
Repayments on secured obligations of the Trust | (3,900,000 | ) | (2,732,500 | ) | (355,000 | ) | |||||
Borrowings on revolving credit facilities and inventory financing | 1,346,865 | 1,517,068 | 1,616,189 | ||||||||
Repayments on revolving credit facilities and inventory financing | (1,227,342 | ) | (1,689,083 | ) | (1,431,332 | ) | |||||
Issuance of long-term debt | — | 550,000 | — | ||||||||
Payments on long-term debt | (223,452 | ) | (8,434 | ) | (8,418 | ) | |||||
Exercise of employee stock options and tax withholdings on share-based payment awards | 1,163 | (938 | ) | (4,982 | ) | ||||||
Excess tax benefits from exercise of employee stock options, net | 5,564 | 15,038 | 7,551 | ||||||||
Common stock repurchased | — | (174,124 | ) | — | |||||||
Debt issuance costs paid | (3,130 | ) | (4,948 | ) | (2,751 | ) | |||||
Net cash provided by financing activities | 311,178 | 629,462 | 954,024 | ||||||||
Effect of exchange rates on cash and cash equivalents | 1,052 | (10,430 | ) | (4,766 | ) | ||||||
Net change in cash and cash equivalents | (51,241 | ) | 172,308 | (56,314 | ) | ||||||
Cash and cash equivalents, at beginning of year | 315,066 | 142,758 | 199,072 | ||||||||
Cash and cash equivalents, at end of year | $ | 263,825 | $ | 315,066 | $ | 142,758 | |||||
Refer to notes to consolidated financial statements. | |||||||||||
70
CABELA’S INCORPORATED AND SUBSIDIARIES | ||||||||||||||||||||||||||
CONSOLIDATED STATEMENTS OF STOCKHOLDERS’ EQUITY | ||||||||||||||||||||||||||
(Dollars in Thousands) | ||||||||||||||||||||||||||
Accumulated Other Comprehensive Income (Loss) | ||||||||||||||||||||||||||
Common Stock Shares | Additional Paid-In Capital | |||||||||||||||||||||||||
Common Stock | Retained Earnings | Treasury Stock | Total | |||||||||||||||||||||||
BALANCE, beginning of 2014 | 70,630,866 | $ | 706 | $ | 346,535 | $ | 1,260,817 | $ | (1,724 | ) | $ | — | $ | 1,606,334 | ||||||||||||
Net income | — | — | — | 201,715 | — | — | 201,715 | |||||||||||||||||||
Other comprehensive loss | — | — | — | — | (9,982 | ) | — | (9,982 | ) | |||||||||||||||||
Stock-based compensation | — | — | 16,874 | — | — | — | 16,874 | |||||||||||||||||||
Exercise of employee stock options and tax withholdings on share-based payment awards | 462,350 | 5 | (4,987 | ) | — | — | — | (4,982 | ) | |||||||||||||||||
Excess tax benefit on employee stock option exercises | — | — | 7,551 | — | — | — | 7,551 | |||||||||||||||||||
BALANCE, end of 2014 | 71,093,216 | 711 | 365,973 | 1,462,532 | (11,706 | ) | — | 1,817,510 | ||||||||||||||||||
Net income | — | — | — | 189,330 | — | — | 189,330 | |||||||||||||||||||
Other comprehensive loss | — | — | — | — | (39,208 | ) | — | (39,208 | ) | |||||||||||||||||
Common stock repurchased | — | — | — | — | — | (174,124 | ) | (174,124 | ) | |||||||||||||||||
Stock-based compensation | — | — | 21,035 | — | — | — | 21,035 | |||||||||||||||||||
Exercise of employee stock options and tax withholdings on share-based payment awards | 501,804 | 5 | (12,292 | ) | — | — | 11,349 | (938 | ) | |||||||||||||||||
Excess tax benefit on employee stock option exercises, net of stock related income tax adjustments | — | — | 15,038 | — | — | — | 15,038 | |||||||||||||||||||
BALANCE, end of 2015 | 71,595,020 | 716 | 389,754 | 1,651,862 | (50,914 | ) | (162,775 | ) | 1,828,643 | |||||||||||||||||
Net income | — | — | — | 146,947 | — | — | 146,947 | |||||||||||||||||||
Other comprehensive income | — | — | — | — | 4,992 | — | 4,992 | |||||||||||||||||||
Stock-based compensation | — | — | 24,290 | — | — | — | 24,290 | |||||||||||||||||||
Exercise of employee stock options and tax withholdings on share-based payment awards | — | — | (35,255 | ) | — | — | 36,418 | 1,163 | ||||||||||||||||||
Excess tax benefit on employee stock option exercises, net of stock related income tax adjustments | — | — | 5,564 | — | — | — | 5,564 | |||||||||||||||||||
BALANCE, end of 2016 | 71,595,020 | $ | 716 | $ | 384,353 | $ | 1,798,809 | $ | (45,922 | ) | $ | (126,357 | ) | $ | 2,011,599 | |||||||||||
Refer to notes to consolidated financial statements.
71
CABELA’S INCORPORATED AND SUBSIDIARIES
NOTES TO CONSOLIDATED FINANCIAL STATEMENTS
(Dollars in Thousands Except Share and Per Share Amounts)
1. NATURE OF BUSINESS AND SUMMARY OF SIGNIFICANT ACCOUNTING POLICIES
Nature of Business – Cabela’s Incorporated is a retailer of hunting, fishing, and outdoor gear, offering products through its retail stores, websites in the United States and Canada, and regular and specialty catalog mailings. Cabela’s Incorporated operates 85 retail stores, 74 located in 36 states and 11 located in six Canadian provinces. World’s Foremost Bank (“WFB,” “Financial Services segment,” or “Cabela’s CLUB”), a Nebraska banking corporation and a wholly-owned bank subsidiary of Cabela’s Incorporated, is a limited purpose bank formed under the Competitive Equality Banking Act of 1987. The lending activities of WFB are limited to credit card lending and its deposit issuance is limited to time deposits of at least one hundred thousand dollars.
Principles of Consolidation – The consolidated financial statements include the accounts of Cabela’s Incorporated and its wholly-owned subsidiaries (“Cabela’s,” “Company,” “we,” or “our”). All intercompany accounts and transactions have been eliminated in consolidation. Certain reclassifications were made to the previously reported 2015 consolidated financial statements to conform to the 2016 presentation. WFB is the primary beneficiary of the Cabela’s Master Credit Card Trust and related entities (collectively referred to as the “Trust”) under the guidance of Accounting Standards Codification (“ASC”) Topics 810, Consolidations, and 860, Transfers and Servicing. Accordingly, the Trust was consolidated for all reporting periods of Cabela’s in this report. As the servicer and the holder of retained interests in the Trust, WFB has the powers to direct the activities that most significantly impact the Trust’s economic performance and the right to receive significant benefits or obligations to absorb significant losses of the Trust. The credit card loans of the Trust are recorded as restricted credit card loans and the liabilities of the Trust are recorded as secured obligations.
Reporting Year – The Company follows a 52/53 week fiscal year-end cycle. Unless otherwise stated, the fiscal years referred to in the notes to these consolidated financial statements are the 52 weeks ended December 31, 2016 (“2016” or “year ended 2016”), the 53 weeks ended January 2, 2016 (“2015” or “year ended 2015”), and the 52 weeks ended December 27, 2014 (“2014” or “year ended 2014”). WFB follows a calendar fiscal period so each fiscal year ends on December 31st. The effect of the extra week in 2015 on total revenue was an increase of $84 million.
Use of Estimates – The preparation of financial statements in conformity with accounting principles generally accepted in the United States of America (“GAAP”) requires management to make estimates and assumptions that affect the reported amounts of assets and liabilities and disclosure of contingent assets and liabilities at the date of the financial statements and the reported amounts of revenue and expenses during the reporting period. Actual results could differ from those estimates.
Segment Reporting – Effective the beginning of fiscal year 2016, the Company realigned its organizational structure and updated its reportable operating segments. The Company now accounts for its operations as two operating segments: Merchandising and Financial Services. For more information on this change in segments see Note 23 “Segment Reporting” of the Notes to Consolidated Financial Statements.
Revenue Recognition – Revenue is recognized for retail store sales at the time of the sale in the store and for Internet and catalog sales when the merchandise is delivered to the customer. The Company recognizes a reserve for estimated product returns based on its historical returns experience. Shipping fees charged to customers are included in merchandise sales and shipping costs are included in merchandise costs.
Revenue from the sale of gift certificates and gift cards (“gift instruments”) is recognized in revenue when the gift instruments are redeemed for merchandise or services. The Company records gift instrument breakage as revenue when the probability of redemption is remote. The Company recognizes breakage on gift instruments four years after issuance based on historical redemption rates. Total gift instrument breakage was $11 million, $10 million, and $9 million for 2016, 2015, and 2014, respectively. Cabela’s gift instrument liability at the end of 2016 and 2015 was $195 million and $184 million, respectively.
72
CABELA’S INCORPORATED AND SUBSIDIARIES
NOTES TO CONSOLIDATED FINANCIAL STATEMENTS
(Dollars in Tables are in Thousands Except Share and Per Share Amounts)
The dollar amount of related points associated with the Company’s loyalty rewards programs for Cabela’s CLUB issued credit cards are accrued as earned by the cardholder, principally from transactions with unrelated parties, and recorded as a reduction in Financial Services segment revenue. When these points are accrued as earned by the cardholder, the Company estimates the cost of such points with the difference between the value of the unredeemed points earned and the estimated cost of the points included in other revenue (recognized in the Merchandising segment). The net amount related to points in other revenue totaled $7 million, $8 million, and $8 million for 2016, 2015, and 2014, respectively. Redemption of these points was recognized as revenue in merchandise sales at fair value, along with the related cost of sales. Merchandise sales recognized from the redemption of points was $233 million, $219 million, and $201 million for 2016, 2015, and 2014, respectively. Costs incurred under our loyalty rewards programs recognized as a reduction in Financial Services segment revenue was $233 million, $222 million, and $210 million for 2016, 2015, and 2014, respectively.
Financial Services revenue includes credit card interest and fees relating to late payments and cash advance transactions. Interest and fees are accrued in accordance with the terms of the applicable cardholder agreements on credit card loans until the date of charge-off unless placed on non-accrual and fixed payment plans. Interchange income is earned when a charge is made to a customer’s account.
Cost of Revenue and Selling, Distribution, and Administrative Expenses – The Company’s cost of revenue primarily consists of merchandise acquisition costs, including freight-in costs, as well as shipping costs. Selling, distribution, and administrative (“SD&A”) expenses consist of the costs associated with selling, marketing, warehousing, retail store replenishment, and other operating expense activities. All depreciation and amortization expense is associated with selling, distribution, and administrative activities, and accordingly, is included in this category in the consolidated statements of operations.
Cash and Cash Equivalents – Cash equivalents include credit card and debit card receivables from other banks, which settle within one to four business days. Receivables from other banks totaled $23 million and $24 million at the end of 2016 and 2015, respectively. Unpresented checks, net of available cash bank balances, are classified as current liabilities. Cash and cash equivalents of the Financial Services segment were $150 million and $157 million at the end of 2016 and 2015, respectively. Due to regulatory restrictions on WFB, the Company cannot use WFB’s cash for non-banking operations.
Credit Card Loans – The Financial Services segment grants individual credit card loans to its customers and is diversified in its lending with borrowers throughout the United States. Credit card loans are reported at their principal amounts outstanding plus deferred credit card origination costs, less the allowance for loan losses. As part of collection efforts, a credit card loan may be closed and placed on non-accrual or restructured in a fixed payment plan prior to charge-off. The fixed payment plans require payment of the loan within 60 months and consist of a lower interest rate, reduced minimum payment, and elimination of fees. Loans on fixed payment plans include loans in which the customer has engaged a consumer credit counseling agency to assist them in managing their debt. Customers who miss two consecutive payments once placed on a payment plan or non-accrual will resume accruing interest at the rate they had accrued at before they were placed on a plan. Payments received on non-accrual loans are applied to principal. The Financial Services segment does not record any liabilities for off-balance sheet risk of unfunded commitments through the origination of unsecured credit card loans, as it has the right to refuse or cancel these available lines of credit at any time.
The direct credit card account origination costs associated with costs of successful credit card originations incurred in transactions with independent third parties, and certain other costs incurred in connection with credit card approvals, are deferred credit card origination costs included in credit card loans and are amortized on a straight-line basis over 12 months. Other account solicitation costs, including printing, list processing, and postage are expensed as solicitation occurs.
Allowance for Loan Losses – The allowance for loan losses represents management’s estimate of probable losses inherent in the credit card loan portfolio. The allowance for loan losses is established through a charge to the provision for loan losses and is evaluated by management for adequacy. Loans on a payment plan or non-accrual are segmented from the rest of the credit card loan portfolio into a restructured credit card loans segment before establishing an allowance for loan losses as these loans have a higher probability of loss.
73
CABELA’S INCORPORATED AND SUBSIDIARIES
NOTES TO CONSOLIDATED FINANCIAL STATEMENTS
(Dollars in Tables are in Thousands Except Share and Per Share Amounts)
Management estimates losses inherent in the credit card loans segment based on models which track historical loss experience on delinquent accounts, bankruptcies, death, and charge-offs, net of estimated recoveries. The Financial Services segment uses a migration analysis and historical bankruptcy and death rates to estimate the likelihood that a credit card loan in the credit card loan segment will progress through the various stages of delinquency and to charge-off. This analysis estimates the gross amount of principal that will be charged off over the next 12 months, net of recoveries.
Management estimates losses from the restructured credit card loans segment based on a discounted cash flow model, which uses remaining balances and projected charge-offs, recoveries, and payments to calculate future cash flows. The allowance for loan losses is determined as the difference between the balance of the restructured credit card loans segment and the related discounted present value of the future cash flows.
In addition to these methods of measurement, management also considers other factors such as general economic and business conditions affecting key lending areas, credit concentration, changes in origination and portfolio management, and credit quality trends. Since the evaluation of the inherent loss with respect to these factors is subject to a high degree of uncertainty, the measurement of the overall allowance is subject to estimation risk, and the amount of actual losses can vary significantly from the estimated amounts.
Credit card loans that have been modified through a fixed payment plan or placed on non-accrual are considered impaired and are collectively evaluated for impairment. The Financial Services segment charges off credit card loans and restructured credit card loans on a daily basis after an account becomes at a minimum 130 days contractually delinquent. Accounts relating to cardholder bankruptcies, cardholder deaths, and fraudulent transactions are charged off earlier. The Financial Services segment recognizes charged-off cardholder fees and accrued interest receivable in interest and fee income that is included in Financial Services revenue.
Inventories – Inventories are stated at the lower of average cost or market. All inventories are finished goods. The reserve for inventory shrinkage, estimated based on cycle and physical counts, was $20 million and $11 million at the end of 2016 and 2015, respectively. The reserves for returns of damaged goods, obsolescence, and slow-moving items, estimated based upon historical experience, inventory aging, and specific identification, were $12 million and $10 million at the end of 2016 and 2015, respectively.
Vendor Allowances – Vendor allowances include price allowances, volume rebates, store opening costs reimbursements, marketing participation, and advertising reimbursements received from vendors under vendor contracts. Vendor merchandise allowances are recognized as a reduction of the costs of merchandise as sold. Vendor reimbursements of costs are recorded as a reduction to expense in the period the related cost is incurred based on actual costs incurred. Any cost reimbursements exceeding expenses incurred are recognized as a reduction of the cost of merchandise sold. Volume allowances may be estimated based on historical purchases and estimates of projected purchases.
Advertising and Deferred Catalog Costs – Advertising production costs are expensed as the advertising occurs except for catalog costs which are amortized over the expected period of benefit estimated at three to 12 months after mailing. Advertising expense, including direct marketing costs (website marketing paid search fees and amortization of catalog costs), was $229 million, $235 million, and $236 million for 2016, 2015, and 2014, respectively. Advertising vendor reimbursements, netted in advertising expense, totaled $1 million, $4 million, and $4 million for 2016, 2015, and 2014, respectively. Unamortized catalog costs totaled $1 million and $2 million at the end of 2016 and 2015, respectively.
Store Pre-opening Expenses – Non-capital costs associated with the opening of new stores are expensed as incurred. Retail store pre-opening costs totaled $7 million, $23 million, and $24 million for 2016, 2015, and 2014, respectively.
Leases – The Company leases certain retail locations, distribution centers, office space, equipment, and land. Assets held under capital lease are included in property and equipment. Operating lease rentals are expensed on a straight-line basis over the life of the lease. At the inception of a lease, the Company determines the lease term by assuming the exercise of those renewal options that are reasonably assured because of the significant economic penalty that exists for not exercising those options. The exercise of lease renewal options is at the Company’s sole discretion. The expected lease term is used to determine whether a lease is capital or operating and is used to calculate straight-line rent expense. Additionally, the depreciable life of buildings and leasehold improvements is limited by the expected lease term.
74
CABELA’S INCORPORATED AND SUBSIDIARIES
NOTES TO CONSOLIDATED FINANCIAL STATEMENTS
(Dollars in Tables are in Thousands Except Share and Per Share Amounts)
Property and Equipment – Property and equipment are stated at cost. Depreciation and amortization are provided over the estimated useful lives of the assets, including assets held under capital leases, on a straight-line basis. Leasehold improvements are amortized over the lease term or, if shorter, the useful lives of the improvements. Assets held under capital lease agreements are amortized using the straight-line method over the shorter of the estimated useful lives of the assets or the lease term. When property is fully depreciated, retired, or otherwise disposed of, the cost and accumulated depreciation are removed from the accounts and any resulting gain or loss is reflected in the consolidated statements of income. The costs of major improvements that extend the useful life of an asset are capitalized. Long-lived assets are reviewed for impairment whenever events or changes in circumstances indicate that the carrying amount of an asset may not be recoverable. Capitalized interest on projects during the construction period totaled $3 million, $10 million, and $8 million for 2016, 2015, and 2014, respectively. Costs related to internally developed software are capitalized and amortized on a straight-line basis over their estimated useful lives.
Intangible Assets – The net unamortized balance of intangible assets consists primarily of goodwill and is recorded in other assets. At the end of both 2016 and 2015, goodwill and intangible assets totaled $3 million, net of accumulated amortization of $3 million and $2 million at the end of 2016 and 2015, respectively. During the fourth quarter of 2016, 2015, and 2014, we completed impairment analyses of our goodwill and other intangible assets. We did not recognize any impairments on intangible assets in 2016, 2015, or 2014.
Other Property – Other property primarily consists of unimproved land not used in our merchandising business and is recorded at the lower of cost or estimated fair value less estimated selling costs. Proceeds from the sale of other property are recognized in other revenue and the corresponding costs of other property sold are recognized in costs of other revenue. Other property with a carrying value of $23 million and $31 million at the end of 2016 and 2015, respectively, was included in other assets in the consolidated balance sheets. We intend to sell our other property as soon as any such sale could be economically feasible, and we continue to monitor such property for impairment.
Government Economic Assistance and Economic Development Bonds (“EDBs”) – When we construct a new retail store or retail development, we may receive economic assistance from local governments to fund a portion or all of the Company’s associated construction costs which helps to improve the return on investment of our new retail stores. This assistance typically comes in the form of cash grants, land grants, the recapture of incremental sales, property, or other taxes, and/or proceeds from the sale of EDBs funded by the local government. The Company has historically purchased the majority of the bonds associated with its developments. EDBs are typically repaid through sales and/or property taxes generated by the retail store and/or within a designated development area. Cash and land grants are made available to fund land, retail store construction, and/or development infrastructure costs and are recognized as deferred grant income as a reduction to the costs, or recognized fair value in the case of land grants, of the associated property and equipment. Property and equipment was reduced by deferred grant income of $301 million and $306 million at the end of 2016 and 2015, respectively. Deferred grant income is amortized to earnings, as a reduction of depreciation expense, over the average estimated useful life of the associated assets. Deferred grant income on land grants is recognized as a reduction to depreciation expense over the estimated life of the related assets of the developments. The Company did not receive any land grants in 2016, 2015, or 2014.
We have also received grant funding in exchange for commitments made by us to the state or local government providing the funding. The grant commitments contain covenants we are required to comply with regarding minimum employment levels, maintaining retail stores in certain locations, and maintaining office facilities in certain locations. For these grants we recognize grant revenue as the milestones associated with the grant are met. The commitments typically phase out over approximately five to 10 years. If we fail to maintain the commitments during the applicable period, the funds we received may have to be repaid or other adverse consequences may arise, which could affect our cash flows and profitability. No grant funding subject to contractual remedy was received in 2016, 2015, or 2014. For 2016, 2015, and 2014, the Company was in compliance with the requirements under these grants.
75
CABELA’S INCORPORATED AND SUBSIDIARIES
NOTES TO CONSOLIDATED FINANCIAL STATEMENTS
(Dollars in Tables are in Thousands Except Share and Per Share Amounts)
Deferred grant income estimates, and their associated present value, are updated whenever events or changes in circumstances indicate that their recorded amounts may not be recovered. These estimates are determined when estimation of the fair value of associated EDBs are performed if there are related bond investments. If it is determined that the Company will not receive the full amount remaining from the bonds, we will adjust the deferred grant income to appropriately reflect the change in estimate and, at that time, will record a cumulative additional depreciation charge that would be recognized to date as expense in the absence of the grant income. In the fourth quarter of 2016, we identified three EDBs where the actual tax revenues associated with these properties were lower than previously projected. Therefore, we determined that the fair value of these EDBs were below their respective carrying values, with the declines in fair value deemed to be other than temporary, which resulted in a fair value adjustment totaling $6 million. Accordingly, deferred grant income was reduced by $6 million due to other than temporary impairment loss of the same amount that was recognized on the EDBs. This reduction in deferred grant income resulted in increases in depreciation expense of $2 million which was included in impairment and restructuring charges in the consolidated statements of income. There were no other than temporary fair value adjustments of EDBs and no adjustments of deferred grant income related to EDBs in 2015 and 2014.
At December 31, 2016, and January 2, 2016, EDBs totaled $70 million and $84 million, respectively, and are included in other assets in our consolidated balance sheets. EDBs are related to our government economic assistance arrangements relating to the construction of new retail stores or retail development. EDBs issued by state and local municipalities are classified as available-for-sale and recorded at their fair value. The payments of principal and interest on the bonds are typically tied to sales, property, or lodging taxes generated from the store and, in some cases, from businesses in the surrounding area, over periods which range between 15 and 30 years. Declines in the fair value of EDBs below cost that are deemed to be other than temporary are reflected in earnings. The Company may agree to guarantee deficiencies in tax collections which fund the repayment of EDBs. We did not guarantee any EDBs that we owned at the end of 2016, 2015, or 2014.
On a quarterly basis, we perform various procedures to analyze the amounts and timing of projected cash flows to be received from its EDBs. We revalue each EDB using discounted cash flow models based on available market interest rates (Level 2 inputs) and management estimates, including the estimated amounts and timing of expected future tax payments (Level 3 inputs) to be received by the municipalities under tax increment financing districts. Projected cash flows are derived from sales and property taxes. Due to the seasonal nature of our business, fourth quarter sales are significant to projecting future cash flows under the EDBs. We evaluate the impact of bond payments that have been received since the most recent quarterly evaluation, including those subsequent to the end of the quarter. Typically, bond payments are received twice annually. The payments received around the end of the fourth quarter provide the Company with additional facts for its fourth quarter projections. We make inquiries of local governments and/or economic development authorities for information on any anticipated third-party development, specifically on land owned by the Company, but also on land not owned by the Company in the tax increment financing development district, and to assess any current and potential development where cash flows under the bonds may be impacted by additional development and the anticipated development is material to the estimated and recorded carrying value based on projected cash flows. We make revisions to the cash flow estimates of each bond based on the information obtained. In those instances where the expected cash flows are insufficient to recover the current carrying value of the bond, we adjust the carrying value of the individual bonds to their revised estimated fair value. The governmental entity from which we purchase the bonds is not liable for repayment of principal and interest on the bonds to the extent that the associated taxes are insufficient to fund principal and interest amounts under the bonds. Should sufficient tax revenue not be generated by the subject properties, we may not receive all anticipated payments and thus will be unable to realize the full carrying values of the EDBs carried on our consolidated balance sheet, which result in a corresponding decrease to deferred grant income.
Credit Card and Loyalty Rewards Programs – Cabela’s CLUB Visa cardholders receive Cabela’s points based on the dollar amounts of transactions through credit cards issued by Cabela’s CLUB which may be redeemed for Cabela’s products and services. Points may also be awarded for special promotions for the acquisition and retention of accounts. The dollar amount of related points are accrued as earned by the cardholder and recorded as a reduction in Financial Services revenue. In addition to the Cabela’s CLUB issued credit cards, customers receive points for purchases at Cabela’s from various loyalty programs. The dollar amount of unredeemed credit card points and loyalty points was $193 million and $181 million at the end of 2016 and 2015, respectively, and the Cabela’s CLUB points issued never expire.
76
CABELA’S INCORPORATED AND SUBSIDIARIES
NOTES TO CONSOLIDATED FINANCIAL STATEMENTS
(Dollars in Tables are in Thousands Except Share and Per Share Amounts)
Income Taxes – The Company files consolidated federal and state income tax returns with its wholly-owned subsidiaries. The consolidated group follows a policy of requiring each entity to provide for income taxes in an amount equal to the income taxes that would have been incurred if each were filing separately. We recognize deferred income tax assets and liabilities for the expected future tax consequences of temporary differences between the financial statement carrying amounts and the tax bases of our assets and liabilities. The Company establishes valuation allowances if we believe it is more likely than not that some or all of the Company’s deferred tax assets will not be realized.
Stock-Based Compensation – Compensation expense is estimated based on grant date fair value and amortized on a straight-line basis over the requisite service period. Costs associated with awards are included in compensation expense as a component of SD&A expenses.
Financial Instruments and Credit Risk Concentrations – Financial instruments which may subject the Company to concentrations of credit risk are primarily cash, cash equivalents, and accounts receivable. The Company invests primarily in money market accounts or tax-free municipal bonds, with short-term maturities, limiting the amount of credit exposure to any one entity. The Company had $29 million and $21 million invested in overnight funds at the end of 2016 and 2015, respectively. Concentrations of credit risk on accounts receivable are limited due to the nature of the Company’s receivables.
Fair Value of Financial Instruments – The carrying amount of cash and cash equivalents, accounts receivable, restricted cash, accounts payable, gift instruments (including credit card rewards and loyalty rewards programs), accrued expenses and other liabilities, short-term borrowings, and income taxes included in the consolidated balance sheets approximate fair value given the short-term nature of these financial instruments. Credit card loans (level 2) are originated with variable rates of interest that adjust with changing market interest rates so the carrying value of the credit card loans, including the carrying value of deferred credit card origination costs, less the allowance for loan losses, approximates fair value. Time deposits (level 2) are pooled in homogeneous groups, and the future cash flows of those groups are discounted using current market rates offered for similar products for purposes of estimating fair value. The fair value of the secured variable funding obligations of the Trust (level 2) approximates the carrying value since these obligations can fluctuate daily based on the short-term operational needs with advances and pay downs at par value. The estimated fair value of secured obligations of the Trust is based on future cash flows associated with each type of debt discounted using current borrowing rates for similar types of debt with comparable maturities. The estimated fair value of long-term debt (level 2) is based on future cash flows associated with each type of debt discounted using current borrowing rates for similar types of debt with comparable maturities.
Comprehensive Income – Comprehensive income consists of net income, foreign currency translation adjustments, and unrealized gains and losses on available-for-sale EDBs, net of related income taxes.
Foreign Currency Translation – Assets and liabilities of Cabela’s Canadian operations are translated into United States dollars at currency exchange rates in effect at the end of a reporting period. Gains and losses from translation into United States dollars are included in accumulated other comprehensive income (loss) in our consolidated balance sheets. Revenues and expenses are translated at average monthly currency exchange rates.
Earnings Per Share – Basic earnings per share is computed by dividing net income by the weighted average number of shares of common stock outstanding during the period. Diluted earnings per share is computed by dividing net income by the sum of the weighted average number of shares outstanding plus all additional common shares that would have been outstanding if potentially dilutive common share equivalents had been issued.
77
CABELA’S INCORPORATED AND SUBSIDIARIES
NOTES TO CONSOLIDATED FINANCIAL STATEMENTS
(Dollars in Tables are in Thousands Except Share and Per Share Amounts)
Adoption of New Accounting Principles – In the first quarter of 2016 we adopted the guidance of Accounting Standards Update (“ASU”) 2015-03, “Simplifying the Presentation of Debt Issuance Costs,” which required that debt issuance costs related to a recognized debt liability be presented in the balance sheet as a direct deduction from the carrying amount of that debt liability. The following table summarizes the effects of this new guidance on amounts previously reported in our consolidated balance sheet for the year ended 2015.
As Reported | Adjustment | As Adjusted | |||||||||
Other assets (including economic development bonds) | $ | 148,214 | $ | (9,499 | ) | $ | 138,715 | ||||
Total assets | 8,472,503 | (9,499 | ) | 8,463,004 | |||||||
Current maturities of secured long-term obligations of the Trust | 510,000 | (327 | ) | 509,673 | |||||||
Total current liabilities | 2,475,903 | (327 | ) | 2,475,576 | |||||||
Secured long-term obligations of the Trust, less current maturities | 2,728,500 | (7,241 | ) | 2,721,259 | |||||||
Long-term debt, less current maturities | 637,829 | (1,931 | ) | 635,898 | |||||||
Total liabilities and stockholders’ equity | 8,472,503 | (9,499 | ) | 8,463,004 | |||||||
2. MERGER AGREEMENT
On October 3, 2016, the Company entered into an Agreement and Plan of Merger (the “Merger Agreement”), by and among Bass Pro Group, LLC, a Delaware limited liability company (“Bass Pro Group”), Prairie Merger Sub, Inc., a Delaware corporation and a wholly owned subsidiary of Bass Pro Group (“Sub”) and the Company. The Merger Agreement and the consummation of the transactions contemplated by the Merger Agreement have been unanimously approved by the Company’s board of directors. The Merger Agreement provides for the merger of Sub with and into the Company, on the terms and subject to the conditions set forth in the Merger Agreement (the “Merger”), with the Company continuing as the surviving corporation in the Merger. As a result of the Merger, the Company would become a wholly owned subsidiary of Bass Pro Group.
Pursuant to the Merger Agreement, at the effective time of the Merger, each share of Class A common stock (as defined in the Merger Agreement), par value $0.01 per share, of the Company issued and outstanding immediately prior to the Effective Time will be cancelled and automatically converted into the right to receive $65.50 in cash, without interest thereon.
The consummation of the Merger is subject to the satisfaction or waiver of specified closing conditions, including (i) the affirmative vote in favor of the adoption of the Merger Agreement by the holders of a majority of the outstanding shares of Company Common Stock entitled to vote thereon, (ii) the consummation of the purchase and sale of the banking business of WFB, in accordance with the Bank Purchase Agreement (as defined below) or an alternative agreement in accordance with the Merger Agreement and merger of WFB into the Company or another subsidiary of the Company and termination of its bank charter, (iii) any applicable waiting periods (or extensions thereof) under the Hart-Scott-Rodino Antitrust Improvements Act of 1976 having expired or been terminated, (iv) the absence of any order by any governmental entity rendering the Merger illegal, or prohibiting, enjoining or otherwise preventing the Merger, and (v) other customary closing conditions.
Additionally, in connection with the Merger Agreement, the Company entered into a Sale and Purchase Agreement, dated as of October 3, 2016 (the “Bank Purchase Agreement”), by and among the Company, WFB, and Capital One, National Association (“Capital One”). The Bank Purchase Agreement provides for, in connection with the closing of the Merger, the sale to Capital One of the business of WFB, which includes the credit card program operated by the Company, using WFB as the issuer. Pursuant to the Bank Purchase Agreement, WFB has agreed to sell to Capital One, and Capital One has agreed to purchase from WFB, substantially all of the assets of WFB, including the Cabela’s Club credit card co-branded accounts and WFB’s equity interests in the securitization funding vehicles WFB Funding, LLC and WFB Funding Corporation. Pursuant to the Bank Purchase Agreement, Capital One has also agreed to assume certain liabilities of WFB. The consummation of the transaction contemplated by the Bank Purchase Agreement is subject to the satisfaction or waiver of various specified closing conditions.
78
CABELA’S INCORPORATED AND SUBSIDIARIES
NOTES TO CONSOLIDATED FINANCIAL STATEMENTS
(Dollars in Tables are in Thousands Except Share and Per Share Amounts)
The Merger Agreement also contains certain termination rights for both the Company and Bass Pro Group, and in certain specified circumstances upon termination of the Merger Agreement the Company would be required to pay Bass Pro Group a termination fee of $126 million. The Bank Purchase Agreement also contains certain termination rights for both the Company and Capital One, and in certain circumstances the Company would be required to pay Capital One a termination fee of $14 million.
There can be no assurance that the requisite closing conditions will be satisfied in a timely manner, or at all, or if the Merger will close.
3. CABELA’S MASTER CREDIT CARD TRUST
The Financial Services segment utilizes the Trust for the purpose of routinely securitizing credit card loans and issuing beneficial interest to investors. The Trust issues variable funding facilities and long-term notes (collectively referred to herein as “secured obligations of the Trust”), each of which has an undivided interest in the assets of the Trust. The Financial Services segment owns notes issued by the Trust from some of the securitizations, which in some cases may be subordinated to other notes issued.
The following table presents the components of the consolidated assets and liabilities of the Trust at the years ended:
2016 | 2015 | ||||||
Consolidated assets: | |||||||
Restricted credit card loans, net of allowance of $117,860 and $75,450 | $ | 5,543,241 | $ | 4,991,210 | |||
Restricted cash | 48,697 | 40,983 | |||||
Total | $ | 5,591,938 | $ | 5,032,193 | |||
Consolidated liabilities: | |||||||
Secured variable funding obligations | $ | 420,000 | $ | 655,000 | |||
Secured long-term obligations, net of unamortized debt issuance costs of $7,239 and $7,568 (1) | 3,571,261 | 3,230,932 | |||||
Interest due to third party investors | 3,826 | 2,682 | |||||
Total | $ | 3,995,087 | $ | 3,888,614 | |||
(1) | The 2015 balance was revised to reflect the effects of adopting the guidance of ASU 2015-03, “Simplifying the Presentation of Debt Issuance Costs” in 2016. |
4. CREDIT CARD LOANS AND ALLOWANCE FOR LOAN LOSSES
The following table reflects the composition of the credit card loans at the years ended:
2016 | 2015 | ||||||
Restricted credit card loans of the Trust (restricted for repayment of secured obligations of the Trust) | $ | 5,661,101 | $ | 5,066,660 | |||
Unrestricted credit card loans | 31,270 | 38,278 | |||||
Total credit card loans | 5,692,371 | 5,104,938 | |||||
Allowance for loan losses | (118,343 | ) | (75,911 | ) | |||
Deferred credit card origination costs | 5,547 | 6,240 | |||||
Credit card loans, net | $ | 5,579,575 | $ | 5,035,267 | |||
79
CABELA’S INCORPORATED AND SUBSIDIARIES
NOTES TO CONSOLIDATED FINANCIAL STATEMENTS
(Dollars in Tables are in Thousands Except Share and Per Share Amounts)
Allowance for Loan Losses:
The following table reflects the activity in the allowance for loan losses by credit card segment for the years ended:
2016 | 2015 | ||||||||||||||||||||||
Credit Card Loans | Restructured Credit Card Loans | Total Credit Card Loans | Credit Card Loans | Restructured Credit Card Loans | Total Credit Card Loans | ||||||||||||||||||
Balance, beginning of year | $ | 67,653 | $ | 8,258 | $ | 75,911 | $ | 48,832 | $ | 7,740 | $ | 56,572 | |||||||||||
Provision for loan losses | 140,829 | 6,832 | 147,661 | 76,622 | 8,498 | 85,120 | |||||||||||||||||
Charge-offs | (120,696 | ) | (9,854 | ) | (130,550 | ) | (78,313 | ) | (12,883 | ) | (91,196 | ) | |||||||||||
Recoveries | 22,117 | 3,204 | 25,321 | 20,512 | 4,903 | 25,415 | |||||||||||||||||
Net charge-offs | (98,579 | ) | (6,650 | ) | (105,229 | ) | (57,801 | ) | (7,980 | ) | (65,781 | ) | |||||||||||
Balance, end of year | $ | 109,903 | $ | 8,440 | $ | 118,343 | $ | 67,653 | $ | 8,258 | $ | 75,911 | |||||||||||
Credit Quality Indicators, Delinquent, and Non-Accrual Loans:
The loan portfolio is segregated into loans that have been restructured and other credit card loans in order to facilitate the estimation of the losses inherent in the portfolio as of the reporting date. The Financial Services segment uses the scores of Fair Isaac Corporation (“FICO”), a widely-used financial metric for assessing an individual’s credit rating, as the primary credit quality indicator for non-restructured loans, with the risk of loss increasing as an individual’s FICO score decreases.
80
CABELA’S INCORPORATED AND SUBSIDIARIES
NOTES TO CONSOLIDATED FINANCIAL STATEMENTS
(Dollars in Tables are in Thousands Except Share and Per Share Amounts)
The table below provides information on current, non-accrual, past due, and restructured credit card loans by class using the respective fourth quarter FICO score at the years ended:
FICO Score of Credit Card Loans Segment | Restructured Credit Card Loans Segment (1) | ||||||||||||||||||
December 31, 2016: | 691 and Below | 692-758 | 759 and Above | Total | |||||||||||||||
Credit card loan status: | |||||||||||||||||||
Current | $ | 945,494 | $ | 1,916,307 | $ | 2,665,307 | $ | 29,495 | $ | 5,556,603 | |||||||||
1 to 29 days past due | 39,394 | 21,520 | 16,731 | 2,940 | 80,585 | ||||||||||||||
30 to 59 days past due | 16,339 | 2,291 | 466 | 1,675 | 20,771 | ||||||||||||||
60 or more days past due | 31,315 | 391 | 92 | 2,614 | 34,412 | ||||||||||||||
Total past due | 87,048 | 24,202 | 17,289 | 7,229 | 135,768 | ||||||||||||||
Total credit card loans | $ | 1,032,542 | $ | 1,940,509 | $ | 2,682,596 | $ | 36,724 | $ | 5,692,371 | |||||||||
90 days or more past due and still accruing | $ | 16,730 | $ | 98 | $ | 43 | $ | 1,254 | $ | 18,125 | |||||||||
Non-accrual | — | — | — | 6,281 | 6,281 | ||||||||||||||
FICO Score of Credit Card Loans Segment | Restructured Credit Card Loans Segment (1) | ||||||||||||||||||
January 2, 2016: | 691 and Below | 692-758 | 759 and Above | Total | |||||||||||||||
Credit card loan status: | |||||||||||||||||||
Current | $ | 782,885 | $ | 1,676,541 | $ | 2,516,420 | $ | 28,322 | $ | 5,004,168 | |||||||||
1 to 29 days past due | 28,472 | 16,245 | 14,229 | 2,820 | 61,766 | ||||||||||||||
30 to 59 days past due | 10,931 | 1,713 | 506 | 1,716 | 14,866 | ||||||||||||||
60 or more days past due | 20,307 | 536 | 111 | 3,184 | 24,138 | ||||||||||||||
Total past due | 59,710 | 18,494 | 14,846 | 7,720 | 100,770 | ||||||||||||||
Total credit card loans | $ | 842,595 | $ | 1,695,035 | $ | 2,531,266 | $ | 36,042 | $ | 5,104,938 | |||||||||
90 days or more past due and still accruing | $ | 10,292 | $ | 111 | $ | 34 | $ | 1,217 | $ | 11,654 | |||||||||
Non-accrual | — | — | — | 7,059 | 7,059 | ||||||||||||||
(1) | Included in the allowance for loan losses were specific allowances for loan losses of $8 million at both December 31, 2016 and January 2, 2016. |
81
CABELA’S INCORPORATED AND SUBSIDIARIES
NOTES TO CONSOLIDATED FINANCIAL STATEMENTS
(Dollars in Tables are in Thousands Except Share and Per Share Amounts)
5. PROPERTY AND EQUIPMENT
Property and equipment consisted of the following at the years ended:
Depreciable Life in Years | |||||||||
2016 | 2015 | ||||||||
Land and improvements | Up to 20 | $ | 364,694 | $ | 325,576 | ||||
Buildings and improvements | 7 to 40 | 1,311,941 | 1,181,704 | ||||||
Furniture, fixtures, and equipment | 3 to 15 | 905,739 | 834,656 | ||||||
Assets held under capital lease | Up to 30 | 12,979 | 12,979 | ||||||
Property and equipment | 2,595,353 | 2,354,915 | |||||||
Less accumulated depreciation and amortization | (833,956 | ) | (707,183 | ) | |||||
1,761,397 | 1,647,732 | ||||||||
Construction in progress | 45,812 | 163,570 | |||||||
$ | 1,807,209 | $ | 1,811,302 | ||||||
6. SECURITIES
EDBs, which are classified as available-for-sale, are included in other assets in our consolidated balance sheets and consisted of the following at the years ended:
Gross Unrealized Gains | Gross Unrealized Losses | ||||||||||||||
Amortized Cost | Fair Value | ||||||||||||||
December 31, 2016 | $ | 56,695 | $ | 13,262 | $ | (21 | ) | $ | 69,936 | ||||||
January 2, 2016 | $ | 67,482 | $ | 16,285 | $ | — | $ | 83,767 | |||||||
Estimated maturities based on expected future cash flows for the EDBs at the end of 2016 were as follows:
Amortized Cost | Fair Value | ||||||
For the fiscal years ending: | |||||||
2017 | $ | 2,479 | $ | 3,237 | |||
2018 | 3,110 | 4,042 | |||||
2019 | 3,601 | 4,652 | |||||
2020 | 4,835 | 5,981 | |||||
2021 | 4,563 | 5,734 | |||||
2022 - 2026 | 23,082 | 29,616 | |||||
2027 and thereafter | 15,025 | 16,674 | |||||
$ | 56,695 | $ | 69,936 | ||||
Interest earned on the securities totaled $4 million for each of the years ended 2016, 2015, and 2014. There were no realized gains or losses on these securities in 2016, 2015, or 2014.
82
CABELA’S INCORPORATED AND SUBSIDIARIES
NOTES TO CONSOLIDATED FINANCIAL STATEMENTS
(Dollars in Tables are in Thousands Except Share and Per Share Amounts)
7. PREPAID EXPENSES AND OTHER ASSETS
Prepaid expenses and other assets (current and long-term) consisted of the following at the years ended:
2016 | 2015 | ||||||
Prepaid expenses and other current assets: | |||||||
Accrued interest and other receivables - Financial Services segment | $ | 72,994 | $ | 65,878 | |||
Other | 59,256 | 51,452 | |||||
$ | 132,250 | $ | 117,330 | ||||
Other assets: | |||||||
Economic development bonds | $ | 69,936 | $ | 83,767 | |||
Other property | 22,920 | 31,183 | |||||
Long-term receivables | 17,476 | 12,415 | |||||
Other | 16,705 | 11,350 | |||||
$ | 127,037 | $ | 138,715 | ||||
8. ACCRUED EXPENSES AND OTHER LIABILITIES
Accrued expenses and other liabilities consisted of the following at the years ended:
2016 | 2015 | ||||||
Accrued employee compensation and benefits | $ | 39,433 | $ | 55,368 | |||
Accrued property, sales, and other taxes | 45,188 | 47,219 | |||||
Deferred revenue and accrued sales returns | 34,100 | 41,122 | |||||
Accrued professional fees and legal judgment liability | 5,079 | 17,629 | |||||
Accrued interest | 12,038 | 15,212 | |||||
Other | 36,906 | 48,183 | |||||
$ | 172,744 | $ | 224,733 | ||||
9. OTHER LONG-TERM LIABILITIES
Other long-term liabilities consisted of the following at the years ended:
2016 | 2015 | ||||||
Unrecognized tax benefits and accrued interest | $ | 74,737 | $ | 80,153 | |||
Deferred rent expense and tenant allowances | 44,694 | 44,634 | |||||
Deferred revenue | 12,377 | 11,312 | |||||
Other long-term liabilities | 432 | 936 | |||||
$ | 132,240 | $ | 137,035 | ||||
83
CABELA’S INCORPORATED AND SUBSIDIARIES
NOTES TO CONSOLIDATED FINANCIAL STATEMENTS
(Dollars in Tables are in Thousands Except Share and Per Share Amounts)
10. TIME DEPOSITS
The Financial Services segment accepts time deposits only in amounts of at least one hundred thousand dollars. All time deposits are interest bearing. The aggregate amount of time deposits, net of brokered fees, by maturity was as follows at the years ended:
2016 | 2015 | ||||||
2016 | $ | — | $ | 215,306 | |||
2017 | 177,015 | 26,103 | |||||
2018 | 320,373 | 195,143 | |||||
2019 | 154,739 | 37,254 | |||||
2020 | 175,305 | 175,217 | |||||
2021 | 111,868 | — | |||||
Thereafter | 229,557 | 230,876 | |||||
1,168,857 | 879,899 | ||||||
Less current maturities | (177,015 | ) | (215,306 | ) | |||
Deposits classified as non-current liabilities | $ | 991,842 | $ | 664,593 | |||
Time deposits include only brokered institutional certificates of deposit, net of fees, at the end of 2016 and 2015.
11. BORROWINGS OF FINANCIAL SERVICES SEGMENT
The Trust issues fixed and floating (variable) rate term securitizations, which are considered secured obligations backed by restricted credit card loans. A summary of the secured fixed and variable rate obligations of the Trust by series, the expected maturity dates, and the respective weighted average interest rates are presented in the following tables at the years ended:
December 31, 2016: | |||||||||||||||||||||||
Series | Expected Maturity Date | Fixed Rate Obligations | Interest Rate | Variable Rate Obligations | Interest Rate | Total Obligations | Interest Rate | ||||||||||||||||
Series 2012-I (1) | February 2017 | $ | 275,000 | 1.63 | % | $ | 150,000 | 1.23 | % | $ | 425,000 | 1.49 | % | ||||||||||
Series 2012-II | June 2017 | 300,000 | 1.45 | 125,000 | 1.18 | 425,000 | 1.37 | ||||||||||||||||
Series 2013-I | February 2023 | 327,250 | 2.71 | — | — | 327,250 | 2.71 | ||||||||||||||||
Series 2013-II | August 2018 | 100,000 | 2.17 | 197,500 | 1.35 | 297,500 | 1.63 | ||||||||||||||||
Series 2014-I | March 2017 | — | — | 255,000 | 1.05 | 255,000 | 1.05 | ||||||||||||||||
Series 2014-II | July 2019 | — | — | 340,000 | 1.15 | 340,000 | 1.15 | ||||||||||||||||
Series 2015-I | March 2020 | 218,750 | 2.26 | 100,000 | 1.24 | 318,750 | 1.94 | ||||||||||||||||
Series 2015-II | July 2020 | 240,000 | 2.25 | 100,000 | 1.37 | 340,000 | 1.99 | ||||||||||||||||
Series 2016-I | June 2019 | 570,000 | 1.78 | 280,000 | 1.55 | 850,000 | 1.71 | ||||||||||||||||
Secured obligations of the Trust | 2,031,000 | 1,547,500 | 3,578,500 | ||||||||||||||||||||
Less unamortized debt issuance costs | (4,594 | ) | (2,645 | ) | (7,239 | ) | |||||||||||||||||
Secured obligations of the Trust, net | 2,026,406 | 1,544,855 | 3,571,261 | ||||||||||||||||||||
Less current maturities of secured long-term obligations of the Trust, net | (574,829 | ) | (529,856 | ) | (1,104,685 | ) | |||||||||||||||||
Secured long-term obligations of the Trust, less current maturities, net | $ | 1,451,577 | $ | 1,014,999 | $ | 2,466,576 | |||||||||||||||||
(1) | On February 15, 2017, the Series 2012-I notes totaling $425 million were repaid in full using restricted cash of the Trust. |
84
CABELA’S INCORPORATED AND SUBSIDIARIES
NOTES TO CONSOLIDATED FINANCIAL STATEMENTS
(Dollars in Tables are in Thousands Except Share and Per Share Amounts)
January 2, 2016: | |||||||||||||||||||||||
Series | Expected Maturity Date | Fixed Rate Obligations | Interest Rate | Variable Rate Obligations | Interest Rate | Total Obligations | Interest Rate | ||||||||||||||||
Series 2011-II | June 2016 | $ | 155,000 | 2.39 | % | $ | 100,000 | 0.93 | % | $ | 255,000 | 1.82 | % | ||||||||||
Series 2011-IV | October 2016 | 165,000 | 1.90 | 90,000 | 0.88 | 255,000 | 1.54 | ||||||||||||||||
Series 2012-I | February 2017 | 275,000 | 1.63 | 150,000 | 0.86 | 425,000 | 1.36 | ||||||||||||||||
Series 2012-II | June 2017 | 300,000 | 1.45 | 125,000 | 0.81 | 425,000 | 1.26 | ||||||||||||||||
Series 2013-I | February 2023 | 327,250 | 2.71 | — | — | 327,250 | 2.71 | ||||||||||||||||
Series 2013-II | August 2018 | 100,000 | 2.17 | 197,500 | 0.98 | 297,500 | 1.38 | ||||||||||||||||
Series 2014-I | March 2017 | — | — | 255,000 | 0.68 | 255,000 | 0.68 | ||||||||||||||||
Series 2014-II | July 2019 | — | — | 340,000 | 0.78 | 340,000 | 0.78 | ||||||||||||||||
Series 2015-I | March 2020 | 218,750 | 2.26 | 100,000 | 0.87 | 318,750 | 1.82 | ||||||||||||||||
Series 2015-II | July 2020 | 240,000 | 2.25 | 100,000 | 1.00 | 340,000 | 1.88 | ||||||||||||||||
Secured obligations of the Trust | 1,781,000 | 1,457,500 | 3,238,500 | ||||||||||||||||||||
Less unamortized debt issuance costs | (4,317 | ) | (3,251 | ) | (7,568 | ) | |||||||||||||||||
Secured obligations of the Trust, net | 1,776,683 | 1,454,249 | 3,230,932 | ||||||||||||||||||||
Less current maturities of secured long-term obligations of the Trust, net | (319,793 | ) | (189,880 | ) | (509,673 | ) | |||||||||||||||||
Secured long-term obligations of the Trust, less current maturities, net | $ | 1,456,890 | $ | 1,264,369 | $ | 2,721,259 | |||||||||||||||||
The Trust sold asset-backed notes of $1 billion (“Series 2016-I”) on June 29, 2016. The Series 2016-I securitization transaction included the issuance of $570 million of Class A-1 notes, which accrue interest at a fixed rate of 1.78% per year, $280 million of Class A-2 notes, which accrue interest at a floating rate equal to the one-month London Interbank Offered Rate (“LIBOR”) plus 0.85% per year and three subordinated classes of notes in the aggregate principal amount of $150 million.
The Financial Services segment retained each of the subordinated classes of notes which were eliminated in the preparation of our consolidated financial statements. Each class of notes issued in the Series 2016-I securitization transaction has an expected life of approximately three years and a contractual maturity of approximately six years. In 2016, this securitization transaction funded the growth in credit card loans, maturities of time deposits, and maturities of securitizations. Series 2016-I notes and the variable funding facilities are expected to fund such growth and maturities in 2017 as well as future obligations of the Trust. In addition, the Series 2011-II and Series 2011-IV notes for $255 million each matured and were repaid in full using restricted cash of the Trust on June 15, 2016, and October 17, 2016, respectively.
The Trust also issues variable funding facilities which are considered secured obligations backed by restricted credit card loans. At December 31, 2016, and January 2, 2016, the Trust had three variable funding facilities with total capacity of $3 billion and $1 billion, respectively, and with outstanding balances of $420 million and $655 million, respectively. These outstanding balances were classified as current maturities of secured variable funding obligations of the Trust on the consolidated balance sheets since the Company’s intent is to repay these obligations in full within the next 12 months. During 2016, the Financial Services segment increased the three variable funding facilities and extended the maturity dates as follows:
• | the Series 2008-III facility from $300 million due March 2018 to $500 million total capacity, with $200 million due October 2017 and $300 million due March 2018, |
• | the Series 2011-I facility from $300 million due March 2016 to $1.3 billion total capacity, with $800 million due March 2018 and $500 million due March 2019, and |
• | the Series 2011-III facility from $500 million due March 2017 to $1.2 billion total capacity, with $700 million due March 2018 and $500 million due September 2019. |
85
CABELA’S INCORPORATED AND SUBSIDIARIES
NOTES TO CONSOLIDATED FINANCIAL STATEMENTS
(Dollars in Tables are in Thousands Except Share and Per Share Amounts)
Each of these variable funding facilities includes an option to renew subject to certain terms and conditions. Variable rate note interest is priced at a benchmark rate, LIBOR, or commercial paper rate, plus a spread, which ranges from 0.80% to 0.90%. The variable rate notes provide for a fee ranging from 0.45% to 0.50% on the unused portion of the facilities. During 2016 and 2015, the daily average balance outstanding on these notes was $205 million and $107 million, with a weighted average interest rate of 1.30% and 0.89%, respectively.
The Financial Services segment has unsecured federal funds purchase agreements with two financial institutions with $100 million the maximum amount that can be borrowed. There were no amounts outstanding on these agreements at December 31, 2016, or January 2, 2016.
12. REVOLVING CREDIT FACILITIES
The Company’s credit agreement provides for an unsecured $775 million revolving credit facility and permits the issuance of letters of credit up to $75 million and swing line loans up to $30 million. The credit facility may be increased to $800 million subject to certain terms and conditions. The term of the credit facility expires on June 18, 2019.
There was $115 million outstanding under our credit agreement at December 31, 2016, and no amount outstanding at January 2, 2016. During 2016 and 2015, the daily average principal balance outstanding on the line of credit was $266 million and $419 million, respectively, and the weighted average interest rate was 1.86% and 1.11%, respectively. Letters of credit and standby letters of credit totaling $19 million and $20 million, respectively, were outstanding at the end of 2016 and 2015. The daily average outstanding amount of total letters of credit during 2016 and 2015 was $13 million and $19 million, respectively.
During the term of the $775 million revolving credit facility, the Company is required to pay a quarterly commitment fee, which ranges from 0.15% to 0.25% of the average daily unused principal balance on the line of credit. Interest on each base rate advance is equal to the alternate base rate, as defined, plus the applicable margin; and interest on each Eurocurrency advance is equal to the Eurocurrency base rate, as defined, plus the applicable margin. The applicable margin for both base rate and Eurocurrency advances is the percentage rate that is applicable at such time with respect to advances as set forth in the pricing schedule, a stratified interest rate schedule based on the Company’s leverage ratio, as defined.
The credit agreement requires that we comply with certain financial and other customary covenants, including:
• | a fixed charge coverage ratio (as defined) of no less than 2.00 to 1 as of the last day of any fiscal quarter for the most recently ended four fiscal quarters (as defined); |
• | a leverage ratio (as defined) of no more than 3.00 to 1 as of the last day of any fiscal quarter; and |
• | a minimum consolidated net worth standard (as defined) as of the last day of each fiscal quarter. |
At December 31, 2016, the Company was in compliance with the financial covenant requirements of its $775 million credit agreement with a fixed charge coverage ratio of 7.62 to 1, a leverage ratio of 1.79 to 1, and a consolidated net worth that was $659 million in excess of the minimum.
The credit agreement includes a dividend provision limiting the amount that we could pay to stockholders, which at December 31, 2016, was not in excess of $215 million. The credit agreement also has a provision permitting acceleration by the lenders in the event there is a change in control, as defined. In addition, the credit agreement contains cross default provisions to other outstanding debt. In the event that the Company fails to comply with these covenants, a default is triggered. In the event of default, all outstanding letters of credit and all principal and outstanding interest would immediately become due and payable. The Company was in compliance with all financial covenants under its credit agreements at December 31, 2016, and January 2, 2016. We anticipate that we will continue to be in compliance with all financial covenants under our credit agreements through at least the next 12 months. On August 4, 2015, in connection with the $550 million note purchase agreement described in more detail in Note 13 “Long-Term Debt and Capital Leases” herein, the Company entered into a credit agreement amendment primarily to permit the issuance and sale of the unsecured notes, to place a floor of zero under LIBOR, and to revise certain definitions in the credit agreement.
Advances made pursuant to the $775 million credit agreement are classified as long-term debt. This agreement does not contain requirements regarding the pay down of revolving loans advanced; therefore, advances made prior to June 18, 2018, pursuant to this agreement are considered long-term in nature.
86
CABELA’S INCORPORATED AND SUBSIDIARIES
NOTES TO CONSOLIDATED FINANCIAL STATEMENTS
(Dollars in Tables are in Thousands Except Share and Per Share Amounts)
The Company also has an unsecured $20 million Canadian (“CAD”) revolving credit facility for its operations in Canada. Borrowings are payable on demand with interest payable monthly. This credit facility permits the issuance of letters of credit up to $10 million CAD in the aggregate, which reduces the overall available credit limit. There were no amounts outstanding at December 31, 2016, or January 2, 2016.
13. LONG-TERM DEBT AND CAPITAL LEASES
Long-term debt and capital leases consisted of the following at the years ended:
2016 | 2015 | ||||||
Unsecured $775 million revolving credit facility | $ | 115,000 | $ | — | |||
Unsecured notes due 2016 with interest at 5.99% | — | 215,000 | |||||
Unsecured senior notes due 2017 with interest at 6.08% | 60,000 | 60,000 | |||||
Unsecured senior notes due 2016-2018 with interest at 7.20% | 16,286 | 24,428 | |||||
Unsecured senior notes due 2020, 2022 and 2025; various interest rates | 550,000 | 550,000 | |||||
Capital lease obligation | 11,544 | 11,853 | |||||
Total debt | 752,830 | 861,281 | |||||
Less current portion of long-term debt, net of unamortized debt issuance costs | (79,677 | ) | (223,452 | ) | |||
Less long-term portion of unamortized debt issuance costs | (1,644 | ) | (1,931 | ) | |||
Long-term debt, less current maturities, net | $ | 671,509 | $ | 635,898 | |||
Long-term debt and capital leases, classified by maturity date as of December 31, 2016, and excluding the impact of unamortized debt issuance costs, are presented in the following table. Advances made under the $775 million credit agreement are classified as long-term debt. At December 31, 2016, we had a lease agreement, accounted for as a capital lease, for our distribution facility in Wheeling, West Virginia, with a lease term through June 2036. On January 31, 2017, this capital lease obligation was paid in full, so at December 31, 2016, the total balance outstanding was classified as current portion of long-term debt in our consolidated balance sheets.
Unsecured Revolving Credit Facility | Unsecured Senior Notes due 2017 | Unsecured Senior Notes, final maturity 2018 | Unsecured Senior Notes, final maturity 2025 | Capital Lease Obligation | Total Debt | |||||||||||||||||||
2017 | $ | — | $ | 60,000 | $ | 8,143 | $ | — | $ | 11,544 | $ | 79,687 | ||||||||||||
2018 | — | — | 8,143 | — | — | 8,143 | ||||||||||||||||||
2019 | 115,000 | — | — | — | — | 115,000 | ||||||||||||||||||
2020 | — | — | — | 100,000 | — | 100,000 | ||||||||||||||||||
2021 | — | — | — | — | — | — | ||||||||||||||||||
2022 and thereafter | — | — | — | 450,000 | — | 450,000 | ||||||||||||||||||
Total debt | $ | 115,000 | $ | 60,000 | $ | 16,286 | $ | 550,000 | $ | 11,544 | $ | 752,830 | ||||||||||||
87
CABELA’S INCORPORATED AND SUBSIDIARIES
NOTES TO CONSOLIDATED FINANCIAL STATEMENTS
(Dollars in Tables are in Thousands Except Share and Per Share Amounts)
During 2015, the Company entered into a note purchase agreement with various purchasers allowing the Company to issue and sell an aggregate of $550 million principal amount of senior unsecured notes in a private placement to certain accredited investors with aggregate principal amounts, interest rates, and maturity dates as follows:
Tranche | Principal | Interest Rate | Date Issued | Maturity Date | |||||||
A | $ | 100,000 | 3.23 | % | August 4, 2015 | August 4, 2020 | |||||
B | 122,000 | 3.70 | August 4, 2015 | August 4, 2022 | |||||||
C | 128,000 | 3.82 | December 3, 2015 | December 3, 2022 | |||||||
D | 28,000 | 4.01 | August 4, 2015 | August 4, 2025 | |||||||
E | 172,000 | 4.11 | December 3, 2015 | December 3, 2025 | |||||||
$ | 550,000 | ||||||||||
Interest on these notes is payable semi-annually. The Company used the proceeds from this sale for general corporate purposes and to repay its unsecured notes for $215 million on February 27, 2016. The note purchase agreement contains customary default provisions, as well as certain restrictive covenants, including limitations on indebtedness and financial covenants relating to debt ratios, net worth, and fixed charges. In connection with the note purchase agreement, on August 4, 2015, the Company also entered into a credit agreement amendment primarily to permit the issuance and sale of the unsecured notes, to place a floor of zero under LIBOR, and to revise certain definitions in the credit agreement.
Certain of the long-term debt agreements contain various covenants and restrictions such as the maintenance of minimum debt coverage, net worth, and financial ratios. The significant financial ratios and net worth requirements in the long-term debt agreements are (i) a limitation of funded debt to be less than 60% of consolidated total capitalization; (ii) cash flow fixed charge coverage ratio, as defined, of no less than 2.0 to 1 as of the last day of any quarter; and (iii) a minimum consolidated adjusted net worth, as defined.
In addition, the debt agreements contain cross default provisions to our outstanding credit facilities. In the event that the Company failed to comply with these covenants, a default would trigger and all principal and outstanding interest would immediately be due and payable. At December 31, 2016, and January 2, 2016, the Company was in compliance with all financial covenants under its unsecured notes. We anticipate that we will continue to be in compliance with all financial covenants under our unsecured notes through at least the next 12 months.
14. IMPAIRMENT AND RESTRUCTURING CHARGES
Impairment and restructuring charges consisted of the following for the years ended:
2016 | 2015 | 2014 | |||||||||
Impairment losses relating to: | |||||||||||
Property, equipment, and other assets | $ | 7,310 | $ | 3,874 | $ | — | |||||
Other property | 557 | 5,901 | — | ||||||||
Accumulated amortization of deferred grant income | 2,252 | — | — | ||||||||
10,119 | 9,775 | — | |||||||||
Restructuring charges for severance and related benefits | 4,003 | 5,556 | 641 | ||||||||
Total | $ | 14,122 | $ | 15,331 | $ | 641 | |||||
Impairment – Long-lived assets of the Company are evaluated for possible impairment (i) whenever events or changes in circumstances may indicate that the carrying value of an asset may not be recoverable and (ii) at least annually for recurring fair value measurements and for those assets not subject to amortization. In 2016, 2015, and 2014, we evaluated the recoverability of our EDBs, property (including existing store locations and future retail store sites), equipment, goodwill, other property, and other intangible assets. We intend to sell our other property as soon as any such sale could be economically feasible, and we continue to monitor such property for impairment.
88
CABELA’S INCORPORATED AND SUBSIDIARIES
NOTES TO CONSOLIDATED FINANCIAL STATEMENTS
(Dollars in Tables are in Thousands Except Share and Per Share Amounts)
The following impairment losses were recognized in 2016:
• | A loss of $1 million was recognized primarily relating to the write-off of costs pertaining to store sites we had previously identified as future retail store locations but in 2016 decided not to develop. |
• | A loss of $5 million was recognized on a property based on its fair value using discounted cash flow projection estimates (Level 3 inputs). After the impairment loss was recognized, the carrying value of this property was $4 million. |
• | Losses totaling $1 million were recognized on seven parcels of land based on sales contracts for six properties and an appraisal for one property where, after the impairment losses were recognized, the total carrying value of these seven properties approximated $15 million. |
• | In the fourth quarter of 2016, we received information on three EDBs that indicated the actual tax revenues associated with these properties would be lower than previously projected. For one bond, a significant retail development was no longer proceeding forward; for a second bond, the assessed tax values of properties had decreased; and for a third bond, actual tax revenues of the related properties were lower than estimated. Therefore, the related discounted cash flows (Level 3 inputs) indicated that the fair values of these three EDBs were below their respective carrying values, with the decline in fair values deemed to be other than temporary. This resulted in fair value adjustments totaling $6 million that reduced the carrying values of these EDBs. Accordingly, deferred grant income was also reduced by $6 million due to the other than temporary impairment losses recognized on these bonds. The reduction in deferred grant income resulted in an increase in depreciation expense of $2 million which was included in impairment and restructuring charges in the consolidated statements of income for 2016. |
The following impairment losses were recognized in 2015:
• | A loss of $4 million was recognized relating to the write-off of costs pertaining to store sites we had previously identified as future retail store locations but in 2015 decided not to develop based on the Company’s plans to scale back retail store growth for 2016 and 2017. |
• | A loss of $2 million was recognized on improved land for a housing development project based on its fair value using discounted cash flow projection estimates (Level 3 inputs). After the impairment loss was recognized, the carrying value of this property was $0.3 million. |
• | Losses totaling $3 million were recognized on two parcels of unimproved land based on appraisals. After the impairment losses were recognized, the carrying value of these two properties was $3 million. |
All impairment losses in 2016 and 2015 were recognized in the Merchandising segment. There were no impairment losses in 2014. Local economic trends, government regulations, and other restrictions where we own properties may impact management projections that could change undiscounted cash flows in future periods and which could trigger possible future write downs.
Restructuring Charges – In 2016 and 2015, we incurred charges totaling $4 million and $6 million, respectively, for severance and related benefits primarily attributable to our corporate restructure and reduction in the number of personnel. In 2014, we transitioned to a third-party logistics provider for our distribution needs in Canada and closed our distribution center in Winnipeg, Manitoba. Accordingly, we recognized a restructuring charge totaling $1 million in 2014 related to employee severance agreements and termination benefits. These restructuring charges for all three years were recognized in the Merchandising segment.
The activity relating to the liability for these severance benefits, which was included in accrued expenses and other liabilities in our consolidated balance sheets, is summarized in the following table for the years presented:
2016 | 2015 | 2014 | |||||||||
Balance, beginning of period | $ | 2,799 | $ | — | $ | — | |||||
Charges for severance and related benefits | 4,003 | 5,556 | 641 | ||||||||
Payments | (5,759 | ) | (2,757 | ) | (641 | ) | |||||
Balance, end of period | $ | 1,043 | $ | 2,799 | $ | — | |||||
89
CABELA’S INCORPORATED AND SUBSIDIARIES
NOTES TO CONSOLIDATED FINANCIAL STATEMENTS
(Dollars in Tables are in Thousands Except Share and Per Share Amounts)
15. INTEREST (EXPENSE) INCOME, NET
Interest expense, net of interest income, consisted of the following for the years ended:
2016 | 2015 | 2014 | |||||||||
Interest expense | $ | (34,627 | ) | $ | (33,390 | ) | $ | (29,648 | ) | ||
Capitalized interest | 3,132 | 10,499 | 7,788 | ||||||||
Interest expense, net | (31,495 | ) | (22,891 | ) | (21,860 | ) | |||||
Interest income | 14 | 9 | 18 | ||||||||
$ | (31,481 | ) | $ | (22,882 | ) | $ | (21,842 | ) | |||
16. INCOME TAXES
For financial reporting purposes, income before taxes includes the following components:
2016 | 2015 | 2014 | |||||||||
Federal | $ | 247,894 | $ | 276,650 | $ | 276,041 | |||||
Foreign | (294 | ) | 17,977 | 42,436 | |||||||
$ | 247,600 | $ | 294,627 | $ | 318,477 | ||||||
The provision for income taxes consisted of the following for the years ended:
2016 | 2015 | 2014 | |||||||||
Current: | |||||||||||
Federal | $ | 55,444 | $ | 100,501 | $ | 114,420 | |||||
State | 6,470 | 19,894 | 7,032 | ||||||||
Foreign | 2,358 | 5,090 | 6,872 | ||||||||
64,272 | 125,485 | 128,324 | |||||||||
Deferred: | |||||||||||
Federal | 30,224 | (12,589 | ) | (14,024 | ) | ||||||
State | 6,068 | (7,724 | ) | 2,477 | |||||||
Foreign | 89 | 125 | (15 | ) | |||||||
36,381 | (20,188 | ) | (11,562 | ) | |||||||
$ | 100,653 | $ | 105,297 | $ | 116,762 | ||||||
90
CABELA’S INCORPORATED AND SUBSIDIARIES
NOTES TO CONSOLIDATED FINANCIAL STATEMENTS
(Dollars in Tables are in Thousands Except Share and Per Share Amounts)
A reconciliation of the statutory federal income tax rate to the effective income tax rate follows for the years ended:
2016 | 2015 | 2014 | ||||||
Statutory federal rate | 35.0 | % | 35.0 | % | 35.0 | % | ||
State income taxes, net of federal tax benefit | 2.7 | 2.4 | 2.2 | |||||
Foreign tax rate differential | 0.2 | (1.1 | ) | 1.0 | ||||
Nondeductible/nontaxable items | 2.1 | (0.5 | ) | (0.7 | ) | |||
Change in unrecognized tax benefits | (0.1 | ) | 1.1 | (1.7 | ) | |||
Net operating loss valuation allowance | 1.3 | 1.4 | 0.5 | |||||
Tax credits | (0.4 | ) | (1.0 | ) | (0.2 | ) | ||
Other, net | (0.1 | ) | (1.6 | ) | 0.6 | |||
Effective income tax rate | 40.7 | % | 35.7 | % | 36.7 | % | ||
Deferred tax assets and liabilities consisted of the following for the years ended:
2016 | 2015 | ||||||
Deferred tax assets: | |||||||
Deferred compensation | $ | 17,931 | $ | 16,612 | |||
Deferred revenue | 6,231 | 4,452 | |||||
Reserve for returns | 6,396 | 8,412 | |||||
Accrued expenses and other liabilities | 7,932 | 18,575 | |||||
Gift certificates liability | 13,283 | 11,775 | |||||
Allowance for loans losses and doubtful accounts | 46,378 | 29,078 | |||||
Loyalty rewards programs | 71,477 | 68,608 | |||||
Economic development bonds | 26,069 | 25,769 | |||||
Inventories | 2,899 | — | |||||
Other | 21,437 | 19,382 | |||||
Total deferred tax assets | 220,033 | 202,663 | |||||
Valuation allowance | (8,465 | ) | (5,165 | ) | |||
Deferred tax assets, net of valuation allowance | 211,568 | 197,498 | |||||
Deferred tax liabilities: | |||||||
Prepaid expenses | 15,983 | 14,498 | |||||
Property and equipment | 149,318 | 106,435 | |||||
Inventories | — | 3,080 | |||||
Credit card loan fee deferral | 53,555 | 45,443 | |||||
Total deferred tax liabilities | 218,856 | 169,456 | |||||
Long-term deferred income tax liability (asset) | $ | 7,288 | $ | (28,042 | ) | ||
The Company has not provided United States income taxes and foreign withholding taxes on all of the undistributed earnings of foreign subsidiaries that the Company considers to be indefinitely reinvested outside of the United States as of the end of 2016. If these foreign earnings were to be repatriated in the future, the related United States tax liability may be reduced by any foreign income taxes previously paid on these earnings. As of the year ended 2016, the cumulative amount of earnings upon which United States income taxes have not been provided was approximately $194 million. If those earnings were not considered indefinitely reinvested, the Company estimates that an additional income tax expense of approximately $45 million would be recorded.
91
CABELA’S INCORPORATED AND SUBSIDIARIES
NOTES TO CONSOLIDATED FINANCIAL STATEMENTS
(Dollars in Tables are in Thousands Except Share and Per Share Amounts)
As of December 31, 2016, cash and cash equivalents held by our foreign subsidiaries totaled $103 million. Our intent is to permanently reinvest these funds outside the United States for capital expansion. Based on the Company’s current projected capital needs and the current amount of cash and cash equivalents held by our foreign subsidiaries, we do not anticipate incurring any material tax costs beyond our accrued tax position in connection with any repatriation, but we may be required to accrue for unanticipated additional tax costs in the future if our expectations or the amount of cash held by our foreign subsidiaries change.
At December 31, 2016, our foreign subsidiary in Canada had a net operating loss carry forward of $34 million with a related tax benefit of $9 million that expires between 2033 and 2035. Due to the uncertainty of the ultimate realization of this net operating loss, the subsidiary’s benefits and associated deferred tax liabilities of $8 million have been fully offset by a valuation allowance of $8 million.
At December 31, 2016, the balance in deposits paid for federal taxes related to prior period uncertain tax positions totaled $66 million and was classified as a current asset included in income taxes receivable in the consolidated balance sheets. At January 2, 2016, this balance totaled $103 million. The change in the deposit balance comparing the respective years was attributed to the payment in 2016 of the taxes associated with the settlement of the 2007 and 2008 Internal Revenue Service (“IRS”) examinations.
The reconciliation of unrecognized tax benefits was as follows for the years ended:
2016 | 2015 | 2014 | |||||||||
Unrecognized tax benefits, beginning of year | $ | 73,122 | $ | 101,879 | $ | 64,800 | |||||
Gross decreases related to prior period tax positions | (11,468 | ) | (2,301 | ) | (4,686 | ) | |||||
Gross increases related to prior period tax positions | 2,709 | 20,507 | 29,281 | ||||||||
Gross increases related to current period tax positions | 3,486 | 6,268 | 12,501 | ||||||||
Gross decreases related to current period tax positions | — | — | (17 | ) | |||||||
Gross decreases related to settlements with taxing authorities | — | (53,231 | ) | — | |||||||
Unrecognized tax benefits, end of year | $ | 67,849 | $ | 73,122 | $ | 101,879 | |||||
The Company’s policy is to accrue interest expense, and penalties as appropriate, on estimated unrecognized tax benefits as a charge to interest expense in the consolidated statements of income. We recorded net interest expense of $2 million and $5 million in 2015 and 2014, respectively, and no adjustment in 2016. No penalties were accrued. The liability for estimated interest on unrecognized tax benefits included in other long-term liabilities totaled $7 million at the end of both 2016 and 2015. The total amount of unrecognized tax benefits that, if recognized, would affect the effective tax rate was $26 million.
At December 31, 2016, unrecognized tax benefits totaling $68 million were included in other long-term liabilities in our consolidated balance sheets compared to $73 million at January 2, 2016. The year over year change in unrecognized tax benefits was due primarily to our assessments of uncertain tax positions related to prior period tax positions and settlement of our 2007 and 2008 IRS examinations. Since the Company is routinely under audit by various taxing authorities, it is reasonably possible that the amount of unrecognized tax benefits will change during the next 12 months. However, we do not expect the change, if any, to have a material effect on the Company’s consolidated financial condition or results of operations within the next 12 months.
The Company’s tax years 2009 through 2011 are under examination by the IRS. We do not expect the examination and possible related appeal for these tax years to be completed within the next 12 months. We have reserved for potential adjustments for income taxes that may result from examinations by the tax authorities, and we believe that the final outcome of these examinations or agreements will not have a material effect on the Company’s financial condition, results of operations, or cash flows.
The Company files income tax returns in the United States, Canada, Hong Kong, and various states. The tax years 2009 through 2016 remain open to examination by major taxing jurisdictions to which Cabela’s is subject.
92
CABELA’S INCORPORATED AND SUBSIDIARIES
NOTES TO CONSOLIDATED FINANCIAL STATEMENTS
(Dollars in Tables are in Thousands Except Share and Per Share Amounts)
17. COMMITMENTS AND CONTINGENCIES
The Company leases various buildings, computer and other equipment, and storage space under operating leases which expire on various dates through January 2041. Rent expense on these leases, as well as other month to month rentals, was $22 million, $24 million, and $20 million for 2016, 2015, and 2014, respectively.
The following is a schedule of future minimum rental payments under operating leases at December 31, 2016:
For the fiscal years ending: | |||
2017 | $ | 23,791 | |
2018 | 23,768 | ||
2019 | 23,267 | ||
2020 | 22,602 | ||
2021 | 22,091 | ||
Thereafter | 279,401 | ||
Total | $ | 394,920 | |
The Company leases seven retail stores and owns 24 stores subject to ground leases. Certain of these leases include tenant allowances that are amortized over the life of the lease. No tenant allowances were received in 2016 or 2015. Certain leases require the Company to pay contingent rental amounts based on a percentage of sales, in addition to real estate taxes, insurance, maintenance, and other operating expenses associated with the leased premises. These leases have terms which include renewal options ranging from 10 to 70 years.
We have entered into real estate purchase, construction, and/or economic incentive agreements for various new retail store site locations. At December 31, 2016, we estimated we had total cash commitments of approximately $95 million outstanding for projected expenditures related to the development, construction, and completion of new retail stores. This amount excludes any estimated costs associated with new stores where the Company does not have a commitment as of December 31, 2016. We expect to fund these estimated capital expenditures over the next 12 months with funds from operations and borrowings.
Under various grant programs, state or local governments provide funding for certain costs associated with developing and opening a new retail store. In the past, we have received grant funding in exchange for commitments, such as assurance of agreed employment and wage levels at the retail store or that the retail store will remain open, made by us to the state or local government providing the funding. If we failed to maintain the commitments during the applicable period, the funds received may have to be repaid or other adverse consequences may arise, which could affect the Company’s cash flows and profitability. The commitments typically phase out over approximately five to 10 years. No grant funding subject to contractual remedy was received in 2016 or 2015. The total amount of grant funding subject to a specific contractual remedy was $26 million and $43 million at December 31, 2016, and January 2, 2016, respectively. We had recorded $1 million (classified as long-term liabilities in the consolidated balance sheets) at December 31, 2016, and $17 million ($16 million in current liabilities and $1 million in long-term liabilities) at January 2, 2016, relating to these grants. In October 2016, we paid $16 million to satisfy in full a liability judgment entered against the Company in February 2014 related to a radius restriction of a retail store and associated incentives and value of real property that had been recognized as a liability in the Company’s consolidated balance sheets.
The Company operates an open account document instructions program, which provides for Cabela’s-issued letters of credit. We had obligations to pay participating vendors $49 million and $34 million at December 31, 2016, and January 2, 2016, respectively.
The Financial Services segment enters into financial instruments with off-balance sheet risk in the normal course of business through the origination of unsecured credit card loans. Unsecured credit card accounts are commitments to extend credit and totaled $36 billion and $35 billion at December 31, 2016, and January 2, 2016, respectively. These commitments are in addition to any current outstanding balances of a cardholder. Unsecured credit card loans involve, to varying degrees, elements of credit risk in excess of the amount recognized in the consolidated balance sheets. The principal amounts of these instruments reflect the Financial Services segment’s maximum related exposure. The Financial Services segment has the right to reduce or cancel the available lines of credit at any time, and has not experienced, and does not anticipate, that all customers will exercise the entire available line of credit at any given point in time.
93
CABELA’S INCORPORATED AND SUBSIDIARIES
NOTES TO CONSOLIDATED FINANCIAL STATEMENTS
(Dollars in Tables are in Thousands Except Share and Per Share Amounts)
Litigation and Claims – The Company is party to various legal proceedings arising in the ordinary course of business. These actions include commercial, intellectual property, employment, regulatory, and product liability claims. Some of these actions involve complex factual and legal issues and are subject to uncertainties. The activities of WFB are subject to complex federal and state laws and regulations. WFB’s regulators are authorized to conduct compliance examinations and impose penalties for violations of these laws and regulations and, in some cases, to order WFB to pay restitution. The Company cannot predict with assurance the outcome of the actions brought against it. Accordingly, adverse developments, settlements, or resolutions may occur and have a material effect on the Company’s results of operations for the period in which such development, settlement, or resolution occurs. However, the Company does not believe that the outcome of any current legal proceedings will have a material effect on its results of operations, cash flows, or financial position taken as a whole.
In April 2016, the Securities and Exchange Commission (“SEC”) announced a settlement with the Company and its Executive Vice President and Chief Financial Officer, Mr. Ralph Castner, that resolves the previously disclosed SEC investigation into certain disclosures, reserves, and accruals from fiscal year 2012. As part of the settlement, the SEC entered an administrative cease-and-desist order that directs the Company and Mr. Castner to comply with the disclosure, books and records, and internal control provisions of the federal securities laws going forward. The Company and Mr. Castner neither admitted nor denied the allegations related to the settlement. The penalty of $1 million associated with the Company’s settlement was recognized as a liability that was accrued for and expensed by the Company in the third quarter of 2015. This $1 million charge was included in SD&A expenses in the consolidated statements of income and was recognized in the Merchandising segment in 2015.
The Company is party to a lawsuit in California state court alleging that the Company violated the California Invasion of Privacy Act by recording various telephone calls from California consumers without their consent. The Company reached a settlement in this lawsuit and recognized a liability of $3.85 million in the three months ended April 2, 2016. On February 8, 2017, the court granted final approval of the settlement and entered judgment accordingly.
The Company is party to a putative class action lawsuit in the United States District Court for the Western District of Kentucky alleging that the Company violated the Telephone Consumer Protection Act by placing calls using an automatic telephone dialing system to cellular telephones without first obtaining consent due to reassignment of the number or revocation of prior consent. At the present time, the Company cannot reasonably estimate any loss or range of loss that may arise from this matter. Accordingly, the Company has not accrued a liability related to this matter.
Self-Insurance – The Company is self-insured for health claims and workers’ compensation claims up to a certain stop loss amount per individual. We recognized a liability for health claims incurred prior to year end but not yet reported totaling $4 million at the end of 2016 and 2015, respectively. We also recognized a liability for workers’ compensation claims incurred prior to year end but not yet reported totaling $4 million at the end of 2016 and 2015, respectively. These reserves are included in accrued expenses and other liabilities in the consolidated balance sheets.
The liabilities for health and workers’ compensation claims incurred but not reported are based upon internally developed calculations. These estimates are regularly evaluated for adequacy based on the most current information available, including historical claim payments, expected trends, and industry factors.
18. REGULATORY CAPITAL REQUIREMENTS
WFB is subject to various regulatory capital requirements administered by the Federal Deposit Insurance Corporation (“FDIC”) and the Nebraska State Department of Banking and Finance to ensure capital adequacy. Under capital adequacy guidelines and the regulatory framework for prompt corrective action, WFB must meet specific capital guidelines that involve quantitative measures of WFB’s assets, liabilities, and certain off-balance sheet items as calculated under regulatory accounting practices. WFB’s capital amounts and classification are also subject to qualitative judgment by the regulators with respect to components, risk weightings, and other factors.
94
CABELA’S INCORPORATED AND SUBSIDIARIES
NOTES TO CONSOLIDATED FINANCIAL STATEMENTS
(Dollars in Tables are in Thousands Except Share and Per Share Amounts)
As of December 31, 2016 and 2015, the most recent notification from the FDIC categorized WFB as “well-capitalized” under the regulatory framework for prompt corrective action. To be categorized as “well-capitalized” WFB must maintain certain amounts and ratios (defined in the regulations) as set forth in the following table. There are no conditions or events since that notification that management believes have changed WFB’s category.
In addition, effective January 2015, WFB was subject to the interim final rules and the joint final rules adopted by the FDIC in July 2013 pertaining to the implementation of regulatory capital reforms recommended by the Basel Committee on Banking Supervision in December 2010 (referred to as “Basel III”), and capital reforms required by the Dodd-Frank Wall Street Reform and Consumer Protection Act. Accordingly, these interim final rules and the joint final rules revise the agencies’ prompt corrective action framework by introducing a “common equity tier 1 capital” requirement and a higher “minimum tier 1 capital” requirement, both of which are presented in the table below.
Actual | Capital Requirements to be Classified Adequately-Capitalized | Capital Requirements to be Classified Well-Capitalized | ||||||||||||||||||
Amount | Ratio | Amount | Ratio | Amount | Ratio | |||||||||||||||
2016: | ||||||||||||||||||||
Common Equity Tier 1 Capital | $ | 620,209 | 10.7 | % | $ | 261,941 | 4.5 | % | $ | 378,359 | 6.5 | % | ||||||||
Total Capital to Risk-Weighted Assets | 693,533 | 11.9 | 465,673 | 8.0 | 582,091 | 10.0 | ||||||||||||||
Tier I Capital to Risk-Weighted Assets | 620,209 | 10.7 | 349,255 | 6.0 | 465,673 | 8.0 | ||||||||||||||
Tier I Capital to Average Assets | 620,209 | 11.0 | 226,154 | 4.0 | 282,693 | 5.0 | ||||||||||||||
2015: | ||||||||||||||||||||
Common Equity Tier 1 Capital | $ | 532,110 | 10.0 | % | $ | 238,282 | 4.5 | % | $ | 344,185 | 6.5 | % | ||||||||
Total Capital to Risk-Weighted Assets | 598,419 | 11.3 | 423,612 | 8.0 | 529,515 | 10.0 | ||||||||||||||
Tier I Capital to Risk-Weighted Assets | 532,110 | 10.0 | 317,709 | 6.0 | 423,612 | 8.0 | ||||||||||||||
Tier I Capital to Average Assets | 532,110 | 10.6 | 200,755 | 4.0 | 250,944 | 5.0 | ||||||||||||||
19. STOCK BASED COMPENSATION PLANS AND EMPLOYEE BENEFIT PLANS
Stock-Based Compensation – The Company recognized total stock-based compensation expense of $25 million, $22 million, and $17 million in 2016, 2015, and 2014, respectively. Compensation expense related to the Company’s stock-based payment awards is recognized in SD&A expenses in the consolidated statements of income. Compensation cost for awards is recognized using a straight-line amortization method over the vesting period. At December 31, 2016, the total unrecognized deferred stock-based compensation balance for all equity awards issued, net of expected forfeitures, was $27 million, net of tax, which is expected to be amortized over a weighted average period of 2.4 years.
The fair value of options granted was estimated on the date of the grant using the Black-Scholes option pricing model. The expected volatility for 2016, 2015, and 2014 was based on the historical volatility of the Company's common stock. The fair value of options in the years presented was estimated using the Black-Scholes model with the following weighted average assumptions:
2016 | 2015 | 2014 | |||||||||
Risk-free interest rate based on the U.S. Treasury yield curve | 1.33 | % | 1.55 | % | 1.52 | % | |||||
Dividend yield | — | — | — | ||||||||
Expected volatility | 44 | % | 45 | % | 46 | % | |||||
Weighted average expected life (in years) | 5.1 | 5.5 | 5.9 | ||||||||
Weighted average grant date fair value of options granted | $ | 18.81 | $ | 22.53 | $ | 27.83 | |||||
95
CABELA’S INCORPORATED AND SUBSIDIARIES
NOTES TO CONSOLIDATED FINANCIAL STATEMENTS
(Dollars in Tables are in Thousands Except Share and Per Share Amounts)
Employee Stock Plans – The Cabela’s Incorporated 2013 Stock Plan (the “2013 Stock Plan”), which replaced the Company’s 2004 Stock Plan, provides for the grant of incentive stock options, non-statutory stock options (“NSOs”), stock appreciation rights, performance stock, performance units, restricted stock, and restricted stock units to employees and consultants. Non-employee directors are eligible to receive any type of award offered under the 2013 Stock Plan except incentive stock options. Awards granted under the 2013 Stock Plan have a term of no greater than 10 years from the grant date and become exercisable under the vesting schedule determined at the time of grant. As of December 31, 2016, the maximum number of shares available for awards under the 2013 Stock Plan was 2,016,182. As of December 31, 2016, there were 1,710,676 awards outstanding under the 2013 Stock Plan and 1,077,049 awards outstanding under the 2004 Stock Plan. To the extent available, we will issue treasury shares for the exercise of stock options before issuing new shares. Pursuant to the terms of the Merger Agreement, without the prior written consent of Bass Pro Group, no option awards or stock unit awards may be granted under the 2013 Stock Plan beginning on or after October 3, 2016.
Awards Granted – The following awards were granted in 2016:
•163,000 NSOs granted to employees at an exercise price of $48.40 per share;
•25,112 NSOs granted to non-employee directors at an exercise price of $50.45 per share;
•64,000 premium-priced NSOs to the Chief Executive Officer at an exercise price of $55.66 per share, which was equal
to 115% of the closing price of the Company’s common stock on the New York Stock Exchange on March 2, 2016;
•425,962 units of nonvested stock issued to employees at a weighted average fair value of $47.35 per unit;
•12,885 units of nonvested stock issued to non-employee directors at a fair value of $50.45 per unit; and
•92,500 units of performance-based restricted stock units to certain executives at a fair value of $48.40 per unit.
The options have an eight-year term and vest over four years for employees and over one year for non-employee directors. The premium-priced NSOs vest in three equal annual installments beginning on March 2, 2017, and expire on March 2, 2024. The nonvested stock awards vest evenly over four years on the grant date anniversary based on the passage of time for employees and over one year for non-employee directors. The performance-based restricted stock units will begin vesting in four equal annual installments on March 2, 2017, since the performance criterion was achieved.
The following table summarizes award activity during 2016 for the Company’s two stock plans:
All Awards | Non-Vested Awards | |||||||||||||||
Awards Available for Grant | Weighted Average Exercise Price | Weighted Average Grant Date Fair Value | ||||||||||||||
Number of Awards | Number of Awards | |||||||||||||||
Outstanding, beginning of year | 2,705,252 | 2,938,166 | $ | 25.87 | 1,582,054 | $ | 54.44 | |||||||||
Granted | (783,459 | ) | 783,459 | 16.23 | 783,459 | 38.34 | ||||||||||
Vested | — | (333,718 | ) | (545,873 | ) | 51.22 | ||||||||||
Exercised | — | (488,519 | ) | 16.38 | ||||||||||||
Forfeited (1) | 90,445 | (100,053 | ) | 3.47 | (100,125 | ) | 51.67 | |||||||||
Expired/Cancelled | 3,944 | (11,610 | ) | 40.35 | ||||||||||||
Outstanding, end of year (2) | 2,016,182 | 2,787,725 | 28.65 | 1,719,515 | 38.16 | |||||||||||
(1) | Options forfeited under the 2013 Stock Plan are immediately available for grant. |
(2)At the end of 2016, total awards outstanding were comprised of the following under the Company’s two stock plans:
Type of Award | Number of Awards | ||
Non-statutory stock options | 1,848,964 | ||
Nonvested stock units | 777,190 | ||
Performance based restricted stock units | 161,571 | ||
Total | 2,787,725 | ||
96
CABELA’S INCORPORATED AND SUBSIDIARIES
NOTES TO CONSOLIDATED FINANCIAL STATEMENTS
(Dollars in Tables are in Thousands Except Share and Per Share Amounts)
The following table provides information relating to the Company’s equity share-based payment awards at December 31, 2016:
Weighted Average Remaining Contractual Life (in Years) | ||||||||||||||||
Weighted Average Exercise Price | Weighted Average Fair Value | Aggregate Intrinsic Value | ||||||||||||||
Number of Awards | ||||||||||||||||
Vested and exercisable | 1,068,210 | $ | 33.72 | $ | 14.66 | $ | 27,573 | 3.76 | ||||||||
Non-vested | 1,719,515 | 25.50 | 38.16 | 58,944 | 6.40 | |||||||||||
Total outstanding | 2,787,725 | 28.65 | 29.16 | $ | 86,517 | 5.64 | ||||||||||
Vested and expected to vest, December 31, 2016 | 2,722,630 | 29.25 | $ | 82,951 | 5.34 | |||||||||||
The aggregate intrinsic value of awards exercised was $17 million, $39 million, and $41 million during 2016, 2015, and 2014, respectively. The total fair value of shares vested was $17 million, $14 million, and $16 million in 2016, 2015, and 2014, respectively. Based on the Company’s closing stock price of $58.55 as of December 31, 2016, the total number of in-the-money awards exercisable as of December 31, 2016, was 913,432.
The equity share-based payment awards outstanding and exercisable as of December 31, 2016, were in the following exercise price ranges:
Awards Outstanding | Awards Exercisable | |||||||||||||||
Weighted Average Remaining Contractual Life (in Years) | ||||||||||||||||
Weighted Average Exercise Price | Weighted Average Exercise Price | |||||||||||||||
Exercise Price | Number | Number | ||||||||||||||
$0.00 (1) | 938,761 | $ | — | 8.23 | — | $ | — | |||||||||
$7.16 to $8.01 | 153,855 | 8.01 | 0.17 | 153,855 | 8.01 | |||||||||||
$11.49 to $15.25 | 11,500 | 12.31 | 0.36 | 11,500 | 12.31 | |||||||||||
$16.18 to $19.47 | 204,850 | 16.48 | 1.18 | 204,850 | 16.48 | |||||||||||
$22.32 to $40.45 | 403,844 | 32.60 | 2.76 | 339,844 | 31.13 | |||||||||||
$44.70 to $58.55 | 708,349 | 52.69 | 6.59 | 203,383 | 52.02 | |||||||||||
$61.23 to $76.27 | 366,566 | 67.20 | 5.30 | 154,778 | 65.35 | |||||||||||
2,787,725 | 28.65 | 5.64 | 1,068,210 | 33.72 | ||||||||||||
(1) | Represents nonvested stock units and performance based restricted stock units granted under the Company’s two stock plans. All other amounts in their respective exercise price ranges are for non-statutory stock options. |
Employee Stock Purchase Plan – During 2016, there were 74,069 shares issued under the Cabela’s Incorporated 2013 Employee Stock Purchase Plan with 1,738,226 shares of common stock authorized and available for issuance at December 31, 2016. Pursuant to the terms of the Merger Agreement, no shares may be purchased under the Employee Stock Purchase Plan with respect to offering periods beginning on or after October 3, 2016.
401(k) Savings Plan – All employees are eligible to defer up to 80% of their wages in Cabela’s 401(k) savings plan, subject to certain limitations. The Company matches 100% of eligible employee deferrals up to 4% of eligible wages. Total expense for employer contributions was $9 million, $10 million, and $8 million in 2016, 2015, and 2014, respectively.
97
CABELA’S INCORPORATED AND SUBSIDIARIES
NOTES TO CONSOLIDATED FINANCIAL STATEMENTS
(Dollars in Tables are in Thousands Except Share and Per Share Amounts)
20. STOCKHOLDERS’ EQUITY AND DIVIDEND RESTRICTIONS
Preferred Stock – The Company is authorized to issue 10,000,000 shares of preferred stock having a par value of $0.01 per share. None of the shares of the authorized preferred stock have been issued. The board of directors is authorized to issue these shares of preferred stock without stockholder approval in different classes and series and, with respect to each class or series, to determine the dividend rate, the redemption provisions, conversion provisions, liquidation preference, and other rights, privileges, and restrictions. The issuance of any preferred stock could have the effect of diluting the voting power of the holders of common stock, restricting dividends on the common stock, impairing the liquidation rights of the common stock, or delaying or preventing a change in control without further action by the stockholders.
Class A Voting Common Stock – The holders of Cabela’s Class A common stock are entitled to receive ratably dividends, if any, the board of directors may declare from time to time from funds legally available therefore, subject to the preferential rights of the holders of any shares of preferred stock that the Company may issue in the future. The holders of Cabela’s Class A common stock are entitled to one vote per share on any matter to be voted upon by stockholders.
Upon any voluntary or involuntary liquidation, dissolution, or winding up of company affairs, the holders of Cabela’s Class A common stock are entitled to all assets remaining after payment to creditors and subject to prior distribution rights of any shares of preferred stock that the Company may issue in the future. All of the outstanding shares of Class A common stock are fully paid and non-assessable.
Retained Earnings – The most significant restrictions on the payment of dividends by the Company to stockholders are contained within the covenants under its revolving credit and unsecured senior notes purchase agreements. Also, Nebraska banking laws govern the amount of dividends that WFB can pay to Cabela’s. In 2016 and 2015, WFB paid dividends to Cabela’s of $40 million and $50 million, respectively. At December 31, 2016, the Company had unrestricted retained earnings of $215 million available for dividends. However, the Company has never declared or paid any cash dividends on its common stock.
Pursuant to the terms of the Merger Agreement, the Company is also prohibited from declaring or paying any dividends or other distributions on its common stock. The Company does not anticipate paying any dividends or other distributions on its common stock in the foreseeable future.
Accumulated Other Comprehensive Loss – The components of accumulated other comprehensive loss, net of related taxes, are as follows for the years ended:
2016 | 2015 | ||||||
Accumulated net unrealized holding gains on economic development bonds | $ | 8,103 | $ | 10,097 | |||
Cumulative foreign currency translation adjustments | (54,025 | ) | (61,011 | ) | |||
Total accumulated other comprehensive loss | $ | (45,922 | ) | $ | (50,914 | ) | |
Treasury Stock – The Company’s Board of Directors authorized a share repurchase program on August 23, 2011, that provides for share repurchases on an ongoing basis to offset dilution resulting from equity awards under the Company’s current or future equity compensation plans. These shares can be repurchased from time to time in open market transactions or privately negotiated transactions at the Company’s discretion, subject to market conditions, customary blackout periods, and other factors. The share repurchase program does not obligate the Company to repurchase any outstanding shares of its common stock, and the program may be limited or terminated at any time.
Pursuant to the terms of the Merger Agreement, the Company generally may not repurchase shares of its common stock, except in connection with the exercise of outstanding stock options or the settlement of restricted stock unit awards. As a result, the Company does not anticipate repurchasing any further shares under this program.
98
CABELA’S INCORPORATED AND SUBSIDIARIES
NOTES TO CONSOLIDATED FINANCIAL STATEMENTS
(Dollars in Tables are in Thousands Except Share and Per Share Amounts)
On September 1, 2015, we announced that our Board of Directors approved a share repurchase program authorizing the Company to repurchase up to $500 million of its common stock over a two-year period. This authorization was in addition to the standing annual authorization to repurchase shares to offset dilution resulting from equity-based awards issued under the Company’s equity compensation plans. The total amount of share repurchases that the Company can make in a year is limited to 75% of its prior year consolidated earnings before interest, taxes, depreciation and amortization, as defined, pursuant to a covenant requirement of its credit agreement. We did not engage in any stock repurchase activity in 2016. As of December 31, 2016, up to $426 million of authorization to repurchase our common stock remained under this program. Under this authorization, we repurchased 1,989,305 shares of our common stock at a total cost of $74 million in 2015. In 2015, we also repurchased 2,000,000 shares of our common stock in open market transactions at a cost of $100 million under the share repurchase program to offset dilution resulting from equity awards granted under the Company’s equity compensation plans.
The following table reconciles the Company’s treasury stock activity for the years ended:
2016 | 2015 | ||||
Balance, beginning of year | 3,776,305 | — | |||
Total common stock repurchased at a total cost of $174,124 for 2015 | — | 3,989,305 | |||
Treasury shares issued on exercise of stock options and share-based payment awards | (683,541 | ) | (213,000 | ) | |
Balance, end of year | 3,092,764 | 3,776,305 | |||
21. EARNINGS PER SHARE
The following table reconciles the weighted average number of shares utilized in the earnings per share calculations for the years ended:
2016 | 2015 | 2014 | ||||||
Common shares – basic | 68,323,540 | 70,102,715 | 70,987,168 | |||||
Effect of incremental dilutive securities: | ||||||||
Stock options and nonvested stock units | 673,124 | 866,198 | 890,688 | |||||
Common shares – diluted | 68,996,664 | 70,968,913 | 71,877,856 | |||||
Stock options outstanding considered anti-dilutive excluded from calculation | 1,108,446 | 1,283,148 | 389,080 | |||||
99
CABELA’S INCORPORATED AND SUBSIDIARIES
NOTES TO CONSOLIDATED FINANCIAL STATEMENTS
(Dollars in Tables are in Thousands Except Share and Per Share Amounts)
22. SUPPLEMENTAL CASH FLOW INFORMATION
The following table sets forth non-cash financing and investing activities and other cash flow information for the years ended:
2016 | 2015 | 2014 | |||||||||
Non-cash financing and investing activities: | |||||||||||
Accrued property and equipment additions (1) | $ | 7,188 | $ | 13,538 | $ | 40,255 | |||||
Depreciation adjustment reducing deferred grant income | (2,252 | ) | — | (831 | ) | ||||||
Other cash flow information: | |||||||||||
Interest paid (2) | $ | 129,103 | $ | 86,194 | $ | 80,311 | |||||
Capitalized interest | (3,132 | ) | (10,499 | ) | (7,788 | ) | |||||
Interest paid, net of capitalized interest | $ | 125,971 | $ | 75,695 | $ | 72,523 | |||||
Income taxes, net of refunds | $ | 60,810 | $ | 107,792 | $ | 145,196 | |||||
(1) | Accrued property and equipment additions are recognized in the consolidated statements of cash flows in the year they are paid. |
(2) | Includes interest paid by the Financial Services segment totaling $84 million, $68 million, and $64 million for 2016, 2015, and 2014, respectively. |
23. SEGMENT REPORTING
Guidance under ASC Topic 280, “Segment Reporting,” requires companies to evaluate their reportable operating segments periodically and when certain events occur. Changes in the first quarter of 2016 in our executive management structure and responsibilities resulted in a change in the Company’s chief operating decision maker function. As a result of these changes, as well as the finalization and implementation of our Vision 2020 strategic plan at the beginning of fiscal year 2016, and operational changes in our organizational structure, the Company updated its reportable segments effective the beginning of fiscal year 2016. The Company now accounts for its operations as two reportable segments: Merchandising and Financial Services. Prior to the beginning of fiscal year 2016, we had four reportable segments: Retail, Direct, Financial Services, and Corporate Overhead and Other.
The Merchandising segment sells products and services through the Company’s retail stores, our e-commerce websites (Cabelas.com and Cabelas.ca), and our catalogs. The United States merchandising and Canada merchandising operating segments have been aggregated into our reportable Merchandising segment. We are an omni-channel retailer with capabilities that allow a customer to use more than one channel when making a purchase, including retail stores, online, and mobile channels, and have it fulfilled, in most cases, either through in-store customer pickup or by direct shipment to the customer from one of our distribution centers, retail stores, or vendor drop-ship. Other non-merchandise revenue included in our Merchandising segment primarily includes the value of unredeemed points earned that are associated with the Company’s loyalty rewards programs for Cabela’s CLUB issued credit cards, net of the estimated costs of the points; real estate rental income; and real estate land sales.
The Financial Services segment issues co-branded credit cards which are available through all of our channels. Our Cabela’s CLUB cardholders also earn points from our loyalty rewards programs that can be redeemed through all of our customer shopping channels.
Results for years ended 2015 and 2014, presented in the tables below and in “Management’s Discussion and Analysis of Financial Condition and Results of Operations” – “2016 Compared to 2015” and “2015 Compared to 2014,” presented herein, have been recast to reflect these new segments.
100
CABELA’S INCORPORATED AND SUBSIDIARIES
NOTES TO CONSOLIDATED FINANCIAL STATEMENTS
(Dollars in Tables are in Thousands Except Share and Per Share Amounts)
Primary operating costs by segment are summarized below.
Merchandising Segment:
• | Employee compensation and benefits, advertising and marketing costs, depreciation, and retail store related occupancy costs. |
• | Costs relating to receiving, distribution, and storage of inventory; and merchandising, order processing, and quality assurance costs. |
• | Corporate headquarters occupancy costs, other general and administrative costs, and costs relating to operations of various ancillary subsidiaries such as real estate. |
• | Consulting fees and other expenses associated with the Company’s corporate restructuring initiatives incurred in 2016 and 2015 and the review of strategic alternatives incurred in 2016. |
Financial Services Segment:
• | Advertising and promotion, license fees, third party services for processing credit card transactions, employee compensation and benefits, and other general and administrative costs. |
Segment assets are those directly used in each operating segment’s operations. Depreciation, amortization, and property and equipment expenditures are recognized as directly expensed and used in each respective segment. Major assets by segment are summarized below.
Merchandising Segment:
• | Land, buildings, fixtures, and leasehold improvements, including corporate headquarters and facilities. |
• | In-store inventory, receivables, and prepaid expenses. |
• | Merchandise distribution inventory, technology infrastructure and related information technology systems, corporate cash and cash equivalents, EDBs, deferred income taxes, and other corporate long-lived assets. |
Financial Services Segment:
• | Cash, credit card loans, restricted cash, receivables, property and equipment, and other assets. |
Under an Intercompany Agreement, the Financial Services segment pays to the Merchandising segment a fixed license fee that includes 70 basis points on all originated charge volume of the Cabela’s CLUB Visa credit card portfolio. Among other items, the agreement also requires the Financial Services segment to reimburse the Merchandising segment for certain promotional costs, which are recorded as a reduction to Financial Services segment revenue and as a reduction to merchandise costs associated with the Merchandising segment. In addition, if the total risk-based capital ratio of WFB is greater than 13% at any quarter end, the Financial Services segment must pay an additional license fee to the Merchandising segment equal to 50% of the amount that the total risk-based capital ratio exceeds 13%. The total risk-based capital ratio of WFB exceeded this 13% threshold at March 31, 2014, so an additional license fee of $11 million was paid in April 2014 by the Financial Services segment to the Merchandising segment and was classified in SD&A expenses. No additional license fee was paid in the remainder of 2014, and none in 2015 or 2016.
101
CABELA’S INCORPORATED AND SUBSIDIARIES
NOTES TO CONSOLIDATED FINANCIAL STATEMENTS
(Dollars in Tables are in Thousands Except Share and Per Share Amounts)
Financial information by segment is presented in the following table for the years presented:
Financial Services | |||||||||||
Fiscal Year 2016: | Merchandising | Total | |||||||||
Merchandise sales | $ | 3,558,019 | $ | — | $ | 3,558,019 | |||||
Non-merchandise revenue: | |||||||||||
Financial Services | — | 521,795 | 521,795 | ||||||||
Other | 28,279 | — | 28,279 | ||||||||
Total revenue before intersegment eliminations | 3,586,298 | 521,795 | 4,108,093 | ||||||||
Intersegment revenue eliminated in consolidation | — | 21,266 | 21,266 | ||||||||
Total revenue as reported | $ | 3,586,298 | $ | 543,061 | $ | 4,129,359 | |||||
Operating income | $ | 73,494 | $ | 200,446 | $ | 273,940 | |||||
Operating income as a percentage of revenue | 2.0 | % | 38.4 | % | 6.6 | % | |||||
Depreciation and amortization | $ | 144,553 | $ | 5,610 | $ | 150,163 | |||||
Assets | 3,075,258 | 5,895,566 | 8,970,824 | ||||||||
Property and equipment additions including accrued amounts | 150,885 | 1,238 | 152,123 | ||||||||
Fiscal Year 2015: | |||||||||||
Merchandise sales | $ | 3,481,375 | $ | — | $ | 3,481,375 | |||||
Non-merchandise revenue: | |||||||||||
Financial Services | — | 482,329 | 482,329 | ||||||||
Other | 13,784 | — | 13,784 | ||||||||
Total revenue before intersegment eliminations | 3,495,159 | 482,329 | 3,977,488 | ||||||||
Intersegment revenue eliminated in consolidation | — | 20,214 | 20,214 | ||||||||
Total revenue as reported | $ | 3,495,159 | $ | 502,543 | $ | 3,997,702 | |||||
Operating income | $ | 134,804 | $ | 172,988 | $ | 307,792 | |||||
Operating income as a percentage of revenue | 3.9 | % | 35.9 | % | 7.7 | % | |||||
Depreciation and amortization | $ | 130,856 | $ | 1,716 | $ | 132,572 | |||||
Assets | 3,090,825 | 5,372,179 | 8,463,004 | ||||||||
Property and equipment additions including accrued amounts | 358,953 | 2,233 | 361,186 | ||||||||
Fiscal Year 2014: | |||||||||||
Merchandise sales | $ | 3,200,219 | $ | — | $ | 3,200,219 | |||||
Non-merchandise revenue: | |||||||||||
Financial Services | — | 415,574 | 415,574 | ||||||||
Other | 17,046 | — | 17,046 | ||||||||
Total revenue before intersegment eliminations | 3,217,265 | 415,574 | 3,632,839 | ||||||||
Intersegment revenue eliminated in consolidation | — | 14,811 | 14,811 | ||||||||
Total revenue as reported | $ | 3,217,265 | $ | 430,385 | $ | 3,647,650 | |||||
Operating income | $ | 223,745 | $ | 111,650 | $ | 335,395 | |||||
Operating income as a percentage of revenue | 7.0 | % | 26.9 | % | 9.2 | % | |||||
Depreciation and amortization | $ | 111,543 | $ | 1,554 | $ | 113,097 | |||||
Assets | 2,762,826 | 4,912,491 | 7,675,317 | ||||||||
Property and equipment additions including accrued amounts | 433,672 | 1,964 | 435,636 | ||||||||
102
CABELA’S INCORPORATED AND SUBSIDIARIES
NOTES TO CONSOLIDATED FINANCIAL STATEMENTS
(Dollars in Tables are in Thousands Except Share and Per Share Amounts)
The components and amounts of total revenue for the Financial Services segment were as follows for the years ended:
2016 | 2015 | 2014 | |||||||||
Interest and fee income | $ | 597,709 | $ | 481,731 | $ | 400,948 | |||||
Interest expense | (88,177 | ) | (68,827 | ) | (64,167 | ) | |||||
Provision for loan losses | (147,661 | ) | (85,120 | ) | (61,922 | ) | |||||
Net interest income, net of provision for loan losses | 361,871 | 327,784 | 274,859 | ||||||||
Non-interest income: | |||||||||||
Interchange income | 410,718 | 394,037 | 366,633 | ||||||||
Other non-interest income | 3,333 | 2,990 | 3,338 | ||||||||
Total non-interest income | 414,051 | 397,027 | 369,971 | ||||||||
Less: Customer rewards costs | (232,861 | ) | (222,268 | ) | (214,445 | ) | |||||
Financial Services revenue | $ | 543,061 | $ | 502,543 | $ | 430,385 | |||||
Our products are principally marketed to individuals within the United States. Net sales generated in other geographic markets, primarily Canada, have collectively been less than 5% of consolidated net merchandise sales in each year. No single customer accounted for 10% or more of consolidated net sales. No single product or service accounted for a significant percentage of the Company’s consolidated revenue.
The following table sets forth the percentage of our merchandise revenue contributed by major product categories for our Merchandising segment for the last three years.
2016 | 2015 | 2014 | ||||||
Hunting Equipment | 48.1 | % | 45.5 | % | 44.3 | % | ||
General Outdoors | 30.9 | 31.2 | 30.3 | |||||
Clothing and Footwear | 21.0 | 23.3 | 25.4 | |||||
Total | 100.0 | % | 100.0 | % | 100.0 | % | ||
24. FAIR VALUE MEASUREMENTS
Fair value represents the estimated price to sell an asset or transfer a liability in an orderly transaction between market participants at the measurement date under current market conditions. In determining fair value of financial instruments, the Company uses various methods, including discounted cash flow projections based on available market interest rates and data, and management estimates of future cash payments. Judgment is required in interpreting certain market data to develop the estimates of fair value and, accordingly, any changes in assumptions or methods may affect the fair value estimates. Financial instrument assets and liabilities measured and reported at fair value are classified and disclosed in one of the following categories:
• | Level 1 – Quoted market prices in active markets for identical assets or liabilities. |
• | Level 2 – Observable inputs other than quoted market prices. |
• | Level 3 – Unobservable inputs corroborated by little, if any, market data. |
Level 3 is comprised of financial instruments whose fair value is estimated based on internally developed models or methodologies utilizing significant inputs that are primarily unobservable from objective sources. At December 31, 2016, the financial instruments carried on our consolidated balance sheets subject to fair value measurements consisted of EDBs (included in other assets) and were classified as Level 3 for valuation purposes. There were no transfers in or out of Levels 1, 2, or 3 for 2016, 2015, or 2014.
103
CABELA’S INCORPORATED AND SUBSIDIARIES
NOTES TO CONSOLIDATED FINANCIAL STATEMENTS
(Dollars in Tables are in Thousands Except Share and Per Share Amounts)
The table below presents changes in fair value of the EDBs measured at fair value on a recurring basis using significant unobservable inputs (Level 3) for the years ended:
2016 | 2015 | 2014 | |||||||||
Balance, beginning of year | $ | 83,767 | $ | 82,074 | $ | 78,504 | |||||
Total gains or losses: | |||||||||||
Included in earnings - realized | — | — | — | ||||||||
Included in accumulated other comprehensive income (loss) - unrealized | (3,045 | ) | 1,076 | 7,777 | |||||||
Valuation adjustments | (6,395 | ) | — | — | |||||||
Purchases, issuances, and settlements: | |||||||||||
Purchases | — | 4,780 | 558 | ||||||||
Issuances | — | — | — | ||||||||
Settlements | (4,391 | ) | (4,163 | ) | (4,765 | ) | |||||
Total | (4,391 | ) | 617 | (4,207 | ) | ||||||
Balance, end of year | $ | 69,936 | $ | 83,767 | $ | 82,074 | |||||
Fair values of our EDBs were estimated using discounted cash flow projection estimates. These estimates are based on available market interest rates and the estimated amounts and timing of expected future payments to be received from municipalities under tax development zones, which we consider to be unobservable inputs (Level 3). In the fourth quarter of 2016, we determined that the fair value of three bonds were below their carrying value which resulted in a fair value adjustment totaling $6 million. Accordingly, deferred grant income was reduced by $6 million due to the other than temporary impairment loss that was recognized on the EDBs. The reduction in deferred grant income resulted in an increase in depreciation expense of $2 million which was included in impairment and restructuring charges in the consolidated statements of income. There were no other than temporary fair value adjustments of EDBs and no adjustments of deferred grant income related to EDBs in 2015 or 2014.
On a quarterly basis, we perform various procedures to analyze the amounts and timing of projected cash flows to be received from our EDBs. Refer to Note 1 “Nature of Business and Summary of Significant Accounting Policies” of the Notes to Consolidated Financial Statements under the section entitled “Government Economic Assistance and Economic Development Bonds” for information on our procedures used to analyze the amounts and timing of projected cash flows to be received from our EDBs.
We evaluate the recoverability of property and equipment, goodwill, other property, and other intangibles whenever indicators of impairment exist using significant unobservable inputs. This evaluation included existing store locations and future retail store sites. Impairment losses consisted of the following for the years ended:
2016 | 2015 | 2014 | |||||||||
Carrying value of property and equipment, other property, and other assets | $ | 27,364 | $ | 25,541 | $ | — | |||||
Less: Fair value of related assets | 19,497 | 15,766 | — | ||||||||
Impairment losses | $ | 7,867 | $ | 9,775 | $ | — | |||||
The impairment losses we incurred in 2016 and 2015 were recognized in the Merchandising segment. Refer to Note 14 “Impairment and Restructuring Charges” of the Notes to Consolidated Financial Statements under the section entitled “Impairment” for additional information on these impairment losses. Local economic trends, government regulations, and other restrictions where we own properties may impact management projections that could change undiscounted cash flows in future periods which could trigger possible future write downs.
104
CABELA’S INCORPORATED AND SUBSIDIARIES
NOTES TO CONSOLIDATED FINANCIAL STATEMENTS
(Dollars in Tables are in Thousands Except Share and Per Share Amounts)
The carrying amounts of cash and cash equivalents, accounts receivable, restricted cash, accounts payable, gift instruments (including credit card and loyalty rewards programs), accrued expenses and other liabilities, and income taxes receivable and payable included in the consolidated balance sheets approximate fair value given the short-term nature of these financial instruments.
The table below presents the estimated fair values of the Company’s financial instruments that are not carried at fair value on our consolidated balance sheets for the years indicated. The fair values of all financial instruments listed below were estimated based on internally developed models or methodologies utilizing observable inputs (Level 2).
2016 | 2015 | ||||||||||||||
Carrying Value | Estimated Fair Value | Carrying Value | Estimated Fair Value | ||||||||||||
Financial Assets: | |||||||||||||||
Credit card loans, net | $ | 5,579,575 | $ | 5,579,575 | $ | 5,035,267 | $ | 5,035,267 | |||||||
Financial Liabilities: | |||||||||||||||
Time deposits | 1,168,857 | 1,171,001 | 879,899 | 879,197 | |||||||||||
Secured variable funding obligations of the Trust | 420,000 | 420,000 | 655,000 | 655,000 | |||||||||||
Secured obligations of the Trust (1) | 3,578,500 | 3,559,438 | 3,238,500 | 3,178,028 | |||||||||||
Long-term debt (1) | 752,830 | 772,311 | 861,281 | 892,425 | |||||||||||
(1) | Balances do not include related debt issuance costs as a direct deduction from such balances. |
Credit Card Loans – Credit card loans are originated with variable rates of interest that adjust with changing market interest rates, so the carrying value of the credit card loans, including the carrying value of deferred credit card origination costs, less the allowance for loan losses, approximates fair value. This valuation does not include the value that relates to estimated cash flows generated from new loans over the life of the cardholder relationship. Accordingly, the aggregate fair value of the credit card loans does not represent the underlying value of the established cardholder relationship.
Time Deposits – Time deposits are pooled in homogeneous groups, and the future cash flows of those groups are discounted using current market rates offered for similar products for purposes of estimating fair value. For both years presented, we have consistently applied our discounting methodologies to estimated future cash flows in determining estimated fair value for time deposits.
Obligations of the Trust – The secured variable funding obligations of the Trust, which include variable rates of interest that adjust daily, can fluctuate daily based on the short-term operational needs of the Financial Services segment with advances and pay downs at par value. Therefore, the carrying value of the secured variable funding obligations of the Trust approximates fair value.
The estimated fair value of secured obligations of the Trust is based on future cash flows associated with each type of debt discounted using current borrowing rates for similar types of debt of comparable maturity. For both years presented, we have consistently applied our discounting methodologies to estimated future cash flows in determining estimated fair value for secured obligations of the Trust.
Long-Term Debt – The estimated fair value of long-term debt is based on future cash flows associated with each type of debt discounted using current borrowing rates for similar types of debt of comparable maturity. For both years presented, we have consistently applied our discounting methodologies to estimated future cash flows in determining estimated fair value for long-term debt.
25. ACCOUNTING PRONOUNCEMENTS
The following accounting standards are grouped by their effective date applicable to the Company:
105
CABELA’S INCORPORATED AND SUBSIDIARIES
NOTES TO CONSOLIDATED FINANCIAL STATEMENTS
(Dollars in Tables are in Thousands Except Share and Per Share Amounts)
Effective the first quarter of fiscal year 2017:
In July 2015, the Financial Accounting Standards Board (“FASB”) issued ASU 2015-11, “Inventory (Topic 330): Simplifying the Measurement of Inventory” (“ASU 2015-11”). Under this standard, inventory will be measured at the “lower of cost and net realizable value” and options that currently exist for “market value” will be eliminated. ASU 2015-11 defines net realizable value as the “estimated selling prices in the ordinary course of business, less reasonably predictable costs of completion, disposal, and transportation.”
In March 2016, the FASB issued ASU 2016-09, “Compensation - Stock Compensation (Topic 718): Improvements to Employee Share-Based Payment Accounting” (“ASU 2016-09”). This standard is intended to simplify several aspects of the accounting for share-based payment award transactions, including the income tax consequences, classification of awards as either equity or liabilities, an option to recognize gross stock compensation expense with actual forfeitures recognized as they occur, and classifications in the statement of cash flows.
We have evaluated the provisions of these two statements and do not believe that the adoption of either statement will have a material effect on the Company’s consolidated financial position or results of operations.
Effective the first quarter of fiscal year 2018:
In May 2014, the FASB issued ASU 2014-09 “Revenue from Contracts with Customers (Topic 606)” (“ASU 2014-09”), which has been further clarified and amended in 2015 and 2016. ASU 2014-09 is a comprehensive new revenue recognition model requiring a company to recognize revenue to depict the transfer of goods or services to a customer at an amount reflecting the consideration it expects to receive in exchange for those goods or services. The guidance also requires disclosures regarding the nature, amount, timing, and uncertainty of revenue and cash flows arising from contracts with customers. In adopting ASU 2014-09, companies may use either a full retrospective or a modified retrospective approach. Early adoption is permitted. We are evaluating the provisions of this statement, which we do not intend to early adopt, and have not determined what impact such adoption will have on the Company’s consolidated financial position or results of operations.
In November 2016, the FASB issued ASU 2016-18 “Statement of Cash Flows - Restricted Cash” (“ASU 2016-18”). This standard requires entities to show the changes in the total of cash, cash equivalents, restricted cash, and restricted cash equivalents in the statement of cash flows. Early adoption is permitted and must be adopted retrospectively. We do not intend to early adopt the provisions of this statement and do not believe that adoption will have a material effect on the Company’s consolidated financial position or results of operations since the provisions of this statement are only of a disclosure nature.
Effective the first quarter of fiscal year 2019:
In February 2016, the FASB issued ASU 2016-02, “Leases (Topic 842)” (“ASU 2016-02”). Under this standard, operating and finance leases with a lease term of more than 12 months will be recorded in the balance sheet as right-of-use assets with offsetting lease liabilities based on the present value of future lease payments. The standard also requires qualitative and quantitative disclosures designed to assess the amount, timing, and uncertainty of cash flows arising from leases. Early adoption is permitted and requires the use of a modified retrospective transition approach, which includes a number of optional practical expedients that entities may elect to apply. We are evaluating the provisions of this statement, including which period to adopt, and have not determined what impact the adoption of ASU 2016-02 will have on the Company’s consolidated results of operations or financial position except that leased assets (as defined), total assets, related lease liabilities, and total liabilities will significantly increase.
Effective the first quarter of fiscal year 2020:
In June 2016, the FASB issued ASU 2016-13, “Measurement of Credit Losses on Financial Instruments” (“ASU 2016-13”). ASU 2016-13 will change the accounting for credit impairment by adding an impairment model that is based on expected losses rather than incurred losses. Under this standard, an entity recognizes as an allowance its estimate of expected credit losses, which the FASB believes will result in more timely recognition of such losses. Early adoption is permitted beginning January 1, 2019. We are evaluating the provisions of this statement, including which period to adopt, and have not determined what impact the adoption of ASU 2016-13 will have on the Company’s consolidated financial position or results of operations.
106
CABELA’S INCORPORATED AND SUBSIDIARIES
NOTES TO CONSOLIDATED FINANCIAL STATEMENTS
(Dollars in Tables are in Thousands Except Share and Per Share Amounts)
26. QUARTERLY FINANCIAL INFORMATION (Unaudited)
The following table sets forth unaudited financial and operating data in each quarter for years 2016 and 2015:
2016 by Quarter | 2015 by Quarter | ||||||||||||||||||||||||||||||
First | Second | Third | Fourth | First | Second | Third | Fourth | ||||||||||||||||||||||||
Total revenue | $ | 864,662 | $ | 929,897 | $ | 996,495 | $ | 1,338,305 | $ | 827,076 | $ | 836,276 | $ | 926,523 | $ | 1,407,827 | |||||||||||||||
Operating income (1) | 44,356 | 67,709 | 49,231 | 112,644 | 44,533 | 63,390 | 72,945 | 126,924 | |||||||||||||||||||||||
Net income | 22,889 | 37,759 | 28,240 | 58,059 | 26,774 | 40,057 | 43,708 | 78,791 | |||||||||||||||||||||||
Earnings per share: | |||||||||||||||||||||||||||||||
Basic (2) | 0.34 | 0.55 | 0.41 | 0.85 | 0.38 | 0.56 | 0.63 | 1.15 | |||||||||||||||||||||||
Diluted (2) | 0.33 | 0.55 | 0.41 | 0.84 | 0.37 | 0.56 | 0.62 | 1.14 | |||||||||||||||||||||||
(1) Includes impairment and restructuring charges recognized by quarter as follows: | $ | 2,972 | $ | 959 | $ | 1,454 | $ | 8,737 | $ | — | $ | — | $ | 5,587 | $ | 9,744 | |||||||||||||||
(2) Basic and diluted earnings per share are computed independently for each of the quarters presented and, therefore, may not sum to the totals for the year. | |||||||||||||||||||||||||||||||
Revenue is typically higher in the Company’s third and fourth quarters than in the first and second quarters due to holiday buying patterns and the opening of hunting seasons across the United States. The Company’s quarterly operating results may fluctuate significantly as a result of these events and a variety of other factors, and operating results for any quarter are not necessarily indicative of results for a full year.
27. SUBSEQUENT EVENT
On February 15, 2017, the Series 2012-I notes of the Trust totaling $425 million were repaid in full using restricted cash of the Trust.
107
CABELA’S INCORPORATED AND SUBSIDIARIES
SCHEDULE II
VALUATION AND QUALIFYING ACCOUNTS
(In Thousands)
Beginning of Year Balance | Charged to Costs and Expenses | Charged to Other Accounts | Deductions | End of Year Balance | |||||||||||||||
Year Ended December 31, 2016: | |||||||||||||||||||
Allowance for doubtful accounts on accounts receivable balances | $ | 1,265 | $ | 648 | $ | — | $ | (856 | ) | $ | 1,057 | ||||||||
Reserve for sales returns (1) | 39,887 | — | 205,017 | (221,464 | ) | 23,440 | |||||||||||||
Reserve on notes receivable | 4,263 | — | — | (2,204 | ) | 2,059 | |||||||||||||
Allowance for credit card loan losses | 75,911 | 147,661 | — | (105,229 | ) | 118,343 | |||||||||||||
Year Ended January 2, 2016: | |||||||||||||||||||
Allowance for doubtful accounts on accounts receivable balances | $ | 969 | $ | 418 | $ | — | $ | (122 | ) | $ | 1,265 | ||||||||
Reserve for sales returns (1) | 26,440 | — | 251,289 | (237,842 | ) | 39,887 | |||||||||||||
Reserve on notes receivable | 4,263 | — | — | — | 4,263 | ||||||||||||||
Allowance for credit card loan losses | 56,572 | 85,120 | — | (65,781 | ) | 75,911 | |||||||||||||
Year Ended December 27, 2014: | |||||||||||||||||||
Allowance for doubtful accounts on accounts receivable balances | $ | 1,208 | $ | 2,476 | $ | — | $ | (2,715 | ) | $ | 969 | ||||||||
Reserve for sales returns (1) | 24,617 | — | 233,192 | (231,369 | ) | 26,440 | |||||||||||||
Reserve on notes receivable | 4,263 | — | — | — | 4,263 | ||||||||||||||
Allowance for credit card loan losses | 53,110 | 61,922 | — | (58,460 | ) | 56,572 | |||||||||||||
(1) | Represents the allowance for sales returns estimated at the time merchandise sales are recognized based upon the Company’s evaluation of anticipated merchandise sales returns. These adjustments were recognized as a reduction in merchandise sales in the Company’s consolidated statements of income. |
108
ITEM 9. CHANGES IN AND DISAGREEMENTS WITH ACCOUNTANTS ON ACCOUNTING AND FINANCIAL DISCLOSURE
None.
ITEM 9A. CONTROLS AND PROCEDURES
We maintain disclosure controls and procedures (as defined in Rule 13a-15(e) under the Securities Exchange Act of 1934, as amended (the “Exchange Act”)), designed to ensure that information required to be disclosed in reports filed under the Exchange Act is recorded, processed, summarized, and reported within specified time periods. Disclosure controls and procedures include, without limitation, controls and procedures designed to ensure that information required to be disclosed by us in the reports that we file or submit under the Exchange Act is accumulated and communicated to management, including our Chief Executive Officer and Chief Financial Officer, or persons performing similar functions, as appropriate to allow timely decisions regarding required disclosure.
In connection with this Annual Report on Form 10-K, our Chief Executive Officer and Chief Financial Officer evaluated, with the participation of our management, the effectiveness of our disclosure controls and procedures as of the end of the period covered by this report. Based on management’s evaluation, our Chief Executive Officer and Chief Financial Officer each concluded that our disclosure controls and procedures were effective as of December 31, 2016.
Management’s Report on Internal Control Over Financial Reporting
Our management is responsible for establishing and maintaining adequate internal control over financial reporting for the Company. Internal control over financial reporting is a process to provide reasonable assurance regarding the reliability of our financial reporting for external purposes in accordance with accounting principles generally accepted in the United States of America.
With the participation of our Chief Executive Officer and our Chief Financial Officer, management evaluated the effectiveness of our internal control over financial reporting as of December 31, 2016, based on the criteria established in Internal Control – Integrated Framework (2013) issued by the Committee of Sponsoring Organizations of the Treadway Commission. Management concluded that our internal control over financial reporting was effective as of December 31, 2016, based on this evaluation.
The independent registered public accounting firm of Deloitte & Touche LLP, as auditors of our consolidated financial statements included in this Annual Report on Form 10-K, has issued an attestation report on the effectiveness of our internal control over financial reporting based on the criteria established in Internal Control—Integrated Framework (2013) issued by the Committee of Sponsoring Organizations of the Treadway Commission. Their report is included in this Item 9A.
Changes in Internal Control Over Financial Reporting
There were no changes in our internal control over financial reporting that occurred during the quarter ended December 31, 2016, that materially affected, or are reasonably likely to materially affect, our internal control over financial reporting.
109
REPORT OF INDEPENDENT REGISTERED PUBLIC ACCOUNTING FIRM
To the Board of Directors and Stockholders of
Cabela’s Incorporated and Subsidiaries
Sidney, Nebraska
We have audited the internal control over financial reporting of Cabela’s Incorporated and Subsidiaries (the “Company”) as of December 31, 2016, based on criteria established in Internal Control - Integrated Framework (2013) issued by the Committee of Sponsoring Organizations of the Treadway Commission. The Company’s management is responsible for maintaining effective internal control over financial reporting and for its assessment of the effectiveness of internal control over financial reporting, included in the accompanying Management’s Report on Internal Control over Financial Reporting. Our responsibility is to express an opinion on the Company’s internal control over financial reporting based on our audit.
We conducted our audit in accordance with the standards of the Public Company Accounting Oversight Board (United States). Those standards require that we plan and perform the audit to obtain reasonable assurance about whether effective internal control over financial reporting was maintained in all material respects. Our audit included obtaining an understanding of internal control over financial reporting, assessing the risk that a material weakness exists, testing and evaluating the design and operating effectiveness of internal control based on the assessed risk, and performing such other procedures as we considered necessary in the circumstances. We believe that our audit provides a reasonable basis for our opinion.
A company’s internal control over financial reporting is a process designed by, or under the supervision of, the company’s principal executive and principal financial officers, or persons performing similar functions, and effected by the company’s board of directors, management, and other personnel to provide reasonable assurance regarding the reliability of financial reporting and the preparation of financial statements for external purposes in accordance with generally accepted accounting principles. A company’s internal control over financial reporting includes those policies and procedures that (1) pertain to the maintenance of records that, in reasonable detail, accurately and fairly reflect the transactions and dispositions of the assets of the company; (2) provide reasonable assurance that transactions are recorded as necessary to permit preparation of financial statements in accordance with generally accepted accounting principles, and that receipts and expenditures of the company are being made only in accordance with authorizations of management and directors of the company; and (3) provide reasonable assurance regarding prevention or timely detection of unauthorized acquisition, use, or disposition of the company’s assets that could have a material effect on the financial statements.
Because of the inherent limitations of internal control over financial reporting, including the possibility of collusion or improper management override of controls, material misstatements due to error or fraud may not be prevented or detected on a timely basis. Also, projections of any evaluation of the effectiveness of the internal control over financial reporting to future periods are subject to the risk that the controls may become inadequate because of changes in conditions, or that the degree of compliance with the policies or procedures may deteriorate.
In our opinion, the Company maintained, in all material respects, effective internal control over financial reporting as of December 31, 2016, based on the criteria established in Internal Control - Integrated Framework (2013) issued by the Committee of Sponsoring Organizations of the Treadway Commission.
We have also audited, in accordance with the standards of the Public Company Accounting Oversight Board (United States), the consolidated financial statements and financial statement schedule as of and for the year ended December 31, 2016, of the Company and our report dated February 16, 2017, expressed an unqualified opinion on those financial statements and financial statement schedule.
/s/ Deloitte & Touche LLP
DELOITTE & TOUCHE LLP
Omaha, Nebraska
February 16, 2017
110
ITEM 9B. OTHER INFORMATION
None.
PART III
ITEM 10. DIRECTORS, EXECUTIVE OFFICERS AND CORPORATE GOVERNANCE
Information required by this item will be provided by an amendment to this Annual Report on Form 10-K containing the applicable disclosures within 120 days after the end of the fiscal year covered by this report.
The policies comprising our code of ethics are set forth in our Business Code of Conduct and Ethics. These policies satisfy the SEC’s requirements for a “code of ethics,” and apply to all of our directors, officers, and employees. Our Business Code of Conduct and Ethics is posted on our website at www.cabelas.com. We intend to satisfy the disclosure requirements under Item 5.05 of Form 8-K regarding certain amendments to, or waivers from, the provisions of our Business Code of Conduct and Ethics by posting such information on our website at the address specified above. Information contained on our website, whether currently posted or posted in the future, is not part of this document or the documents incorporated by reference in this document.
ITEM 11. EXECUTIVE COMPENSATION
Information required by this item will be provided by an amendment to this Annual Report on Form 10-K containing the applicable disclosures within 120 days after the end of the fiscal year covered by this report.
ITEM 12. SECURITY OWNERSHIP OF CERTAIN BENEFICIAL OWNERS AND MANAGEMENT AND RELATED STOCKHOLDER MATTERS
Information required by this item will be provided by an amendment to this Annual Report on Form 10-K containing the applicable disclosures within 120 days after the end of the fiscal year covered by this report.
ITEM 13. CERTAIN RELATIONSHIPS AND RELATED TRANSACTIONS, AND DIRECTOR INDEPENDENCE
Information required by this item will be provided by an amendment to this Annual Report on Form 10-K containing the applicable disclosures within 120 days after the end of the fiscal year covered by this report.
ITEM 14. PRINCIPAL ACCOUNTING FEES AND SERVICES
Information required by this item will be provided by an amendment to this Annual Report on Form 10-K containing the applicable disclosures within 120 days after the end of the fiscal year covered by this report.
111
PART IV
ITEM 15. EXHIBITS, FINANCIAL STATEMENT SCHEDULES
(a) The following documents are filed as part of this report:
1. | Financial Statements: |
• | Report of Independent Registered Public Accounting Firm |
• | Consolidated Statements of Income – Years ended December 31, 2016, January 2, 2016, and December 27, 2014 |
• | Consolidated Statements of Comprehensive Income – Years ended December 31, 2016, January 2, 2016, and December 27, 2014 |
• | Consolidated Balance Sheets – December 31, 2016, and January 2, 2016 |
• | Consolidated Statements of Cash Flows – Years ended December 31, 2016, January 2, 2016, and December 27, 2014 |
• | Consolidated Statements of Stockholders’ Equity – Years ended December 31, 2016, January 2, 2016, and December 27, 2014 |
• | Notes to Consolidated Financial Statements |
2. | Financial Statement Schedules: |
• | Schedule II – Valuation and Qualifying Accounts |
All other schedules for which provision is made in the applicable accounting regulations of the SEC are not required under the related instructions or are inapplicable and, therefore, have been omitted.
3. | Exhibits: See Item 15(b) below. |
(b) Exhibits
Exhibit | |||
Number | Exhibit Description | ||
2.1 | Agreement and Plan of Merger, dated as of October 3, 2016, by and among Bass Pro Group, LLC, Prairie Merger Sub, Inc. and Cabela’s Incorporated (incorporated by reference from Exhibit 2.1 of our Current Report on Form 8-K, filed on October 7, 2016, File No. 001-32227) | ||
2.2 | Sale and Purchase Agreement, dated as of October 3, 2016, by and among Cabela’s Incorporated, World’s Foremost Bank and Capital One, National Association (incorporated by reference from Exhibit 2.2 of our Current Report on Form 8-K, filed on October 7, 2016, File No. 001-32227) | ||
3.1 | Amended and Restated Certificate of Incorporation of Cabela’s Incorporated (incorporated by reference from Exhibit 3.1 of our Current Report on Form 8-K, filed on June 14, 2011, File No. 001-32227) | ||
3.2 | Amended and Restated Bylaws of Cabela’s Incorporated (incorporated by reference from Exhibit 3 of our Current Report on Form 8-K, filed on January 5, 2016, File No. 001-32227) | ||
3.3 | Amendment to the Amended and Restated Bylaws of Cabela’s Incorporated (incorporated by reference from Exhibit 3.1 of our Current Report on Form 8-K, filed on October 7, 2016, File No. 001-32227) | ||
4.1 | Specimen Stock Certificate (incorporated by reference from Exhibit 4.1 of our Registration Statement on Form S-1, filed on March 23, 2004, Registration No. 333-113835) | ||
4.2 | Registration Rights Agreement dated as of September 23, 2003, among Cabela’s Incorporated and the security holders named therein (incorporated by reference from Exhibit 4.2 of our Registration Statement on Form S-1, filed on March 23, 2004, Registration No. 333-113835) | ||
10.1 | Form of 7.2% Senior Note, Series 2008-A, due January 16, 2018 (incorporated by reference from Exhibit 4.1 of our Current Report on Form 8-K, filed on January 22, 2008, File No. 001-32227) | ||
10.2 | Form of 6.08% Senior Note, Series 2007-A, due June 15, 2017 (incorporated by reference from Exhibit 4.2 of our Current Report on Form 8-K, filed on June 20, 2007, File No. 001-32227) | ||
112
10.3 | Form of 5.99% Senior Note, Series 2006-A, due February 27, 2016 (incorporated by reference from Exhibit 4.7 of our Current Report on Form 8-K, filed on June 20, 2007, File No. 001-32227) | ||
10.4 | Note Purchase Agreements dated as of February 27, 2006, among Cabela’s Incorporated and various purchasers party thereto (incorporated by reference from Exhibit 4.6 of our Annual Report on Form 10-K, filed on March 1, 2010, File No. 001-32227) | ||
10.5 | First Supplement to Note Purchase Agreements dated as of February 27, 2006, among Cabela’s Incorporated and various purchasers party thereto (incorporated by reference from Exhibit 4.7 of our Annual Report on Form 10-K, filed on March 1, 2010, File No. 001-32227) | ||
10.6 | Second Supplement to Note Purchase Agreements dated as February 27, 2006, among Cabela’s Incorporated and various purchasers party thereto (incorporated by reference from Exhibit 4.8 of our Annual Report on Form 10-K, filed on March 1, 2010, File No. 001-32227) | ||
10.7 | Amendment No. 1 to Note Purchase Agreements dated as of February 27, 2006, among Cabela’s Incorporated and various purchasers party thereto (incorporated by reference from Exhibit 4.9 of our Annual Report on Form 10-K, filed on March 1, 2010, File No. 001-32227) | ||
10.8 | Executive Employment Agreement dated as of January 4, 2004, between Cabela’s Incorporated and James W. Cabela (incorporated by reference from Exhibit 10.2 of our Registration Statement on Form S-1, filed on March 23, 2004, Registration No. 333-113835)* | ||
10.9 | Addendum to Executive Employment Agreement dated as of January 4, 2004, between Cabela’s Incorporated and James W. Cabela (incorporated by reference from Exhibit 10.2 of our Quarterly Report on Form 10-Q, filed on May 12, 2005, File No. 001-32227)* | ||
10.10 | Cabela’s Incorporated 2004 Stock Plan (incorporated by reference from Exhibit 10.13 of our Annual Report on Form 10-K, filed on February 20, 2013, File No. 001-32227)* | ||
10.11 | Form of 2004 Stock Plan Employee Stock Option Agreement (incorporated by reference from Exhibit 10.13 of our Registration Statement on Form S-1, filed on March 23, 2004, Registration No. 333-113835)* | ||
10.12 | Form of 2004 Stock Plan Employee Stock Option Agreement (2006) (incorporated by reference from Exhibit 10.1 of our Current Report on Form 8-K, filed on May 15, 2006, File No. 001-32227)* | ||
10.13 | Form of 2004 Stock Plan Employee Stock Option Agreement (2008) (incorporated by reference from Exhibit 10.3 of our Current Report on Form 8-K, filed on June 4, 2008, File No. 001-32227)* | ||
10.14 | Form of 2004 Stock Plan Employee Stock Option Agreement (2009) (incorporated by reference from Exhibit 10.2 of our Current Report on Form 8-K, filed on March 6, 2009, File No. 001-32227)* | ||
10.15 | Form of 2004 Stock Plan Restricted Stock Unit Agreement (incorporated by reference from Exhibit 10.1 of our Current Report on Form 8-K, filed on March 6, 2009, File No. 001-32227)* | ||
10.16 | Form of 2004 Stock Plan Restricted Stock Unit Agreement (Performance-Based) (incorporated by reference from Exhibit 10.3 of our Current Report on Form 8-K, filed on March 5, 2010, File No. 001-32227)* | ||
10.17 | Form of 2004 Stock Plan Non-Employee Director Stock Option Agreement (2006) (incorporated by reference from Exhibit 10.2 of our Current Report on Form 8-K, filed on May 15, 2006, File No. 001-32227)* | ||
10.18 | Form of 2004 Stock Plan Non-Employee Director Stock Option Agreement (2010) (incorporated by reference from Exhibit 10.1 of our Quarterly Report on Form 10-Q, filed on July 30, 2010, File No. 001-32227)* | ||
10.19 | Form of Indemnification Agreement (incorporated by reference from Exhibit 10.18 of our Registration Statement on Form S-1, filed on March 23, 2004, Registration No. 333-113835)* | ||
10.20 | Summary of Non-Employee Director Compensation (incorporated by reference from the section titled “Director Compensation” in our Proxy Statement for the 2016 Annual Meeting of Shareholders)* | ||
10.21 | Summary of Named Executive Officer Compensation (incorporated by reference from the section titled “Executive Compensation” in our Proxy Statement for the 2016 Annual Meeting of Shareholders)* | ||
113
10.22 | Amended and Restated Lease Agreement with Option to Purchase dated April 26, 2005, between Ohio County Development Authority and Cabela’s Wholesale, Inc. (incorporated by reference from Exhibit 10.29 of our Annual Report on Form 10-K, filed on March 1, 2006, File No. 001-32227) | ||
10.23 | Cabela’s Incorporated Performance Bonus Plan (incorporated by reference from Exhibit 10 of our Current Report on Form 8-K, filed on February 19, 2008, File No. 001-32227)* | ||
10.24 | Form of Proprietary Matters Agreement (incorporated by reference from Exhibit 10.4 of our Current Report on Form 8-K, filed on March 6, 2014, File No. 001-32227)* | ||
10.25 | Form of Proprietary Matters Agreement - World’s Foremost Bank (incorporated by reference from Exhibit 10.5 of our Current Report on Form 8-K, filed on March 6, 2014, File No. 001-32227)* | ||
10.26 | Stock Option Agreement dated March 13, 2009, between Cabela’s Incorporated and Thomas L. Millner (incorporated by reference from Exhibit 10.3 of our Current Report on Form 8-K, filed on March 19, 2009, File No. 001-32227)* | ||
10.27 | Form of 2009 Amended and Restated Management Change of Control Severance Agreement (incorporated by reference from Exhibit 10.2 of our Current Report on Form 8-K, filed on December 17, 2009, File No. 001-32227)* | ||
10.28 | Form of 2009 Amended and Restated Management Change of Control Severance Agreement (World’s Foremost Bank) (incorporated by reference from Exhibit 10.3 of our Current Report on Form 8-K, filed on December 17, 2009, File No. 001-32227)* | ||
10.29 | Credit Agreement dated as of November 2, 2011, among Cabela’s Incorporated, various lenders party thereto, and U. S. Bank National Association, as Administrative Agent (incorporated by reference from Exhibit 10.1 of our Current Report on Form 8-K, filed on November 8, 2011, File No. 001-32227) | ||
10.30 | Omnibus Amendment to Loan Documents dated as of June 18, 2014, among Cabela’s Incorporated, various lenders party thereto, and U.S. Bank National Association, as Administrative Agent (incorporated by reference from Exhibit 10.1 of our Current Report on Form 8-K, filed on June 24, 2014, File No. 001-32227) | ||
10.31 | Guaranty dated as of November 2, 2011, among certain subsidiaries of Cabela’s Incorporated and U.S. Bank National Association, as Administrative Agent (incorporated by reference from Exhibit 10.2 of our Current Report on Form 8-K, filed on November 8, 2011, File No. 001-32227) | ||
10.32 | Cabela’s Incorporated 2013 Stock Plan (incorporated by reference to Appendix C to our Proxy Statement on Schedule 14A, filed on April 23, 2013, File No. 001-32227)* | ||
10.33 | Cabela’s Incorporated 2013 Performance Bonus Plan (incorporated by reference to Appendix E to our Proxy Statement on Schedule 14A, filed on April 23, 2013, File No. 001-32227)* | ||
10.34 | Form of 2013 Stock Plan Restricted Stock Unit Agreement (incorporated by reference from Exhibit 10.1 of our Current Report on Form 8-K, filed on March 6, 2014, File No. 001-32227)* | ||
10.35 | Form of 2013 Stock Plan Employee Stock Option Agreement (incorporated by reference from Exhibit 10.2 of our Current Report on Form 8-K, filed on March 6, 2014, File No. 001-32227)* | ||
10.36 | Form of 2013 Stock Plan Restricted Stock Unit Agreement (Performance-Based) (incorporated by reference from Exhibit 10.3 of our Current Report on Form 8-K, filed on March 6, 2014, File No. 001-32227)* | ||
10.37 | Note Purchase Agreement dated as of August 4, 2015, among Cabela’s Incorporated and various purchasers party thereto (incorporated by reference from Exhibit 10.1 of our Current Report on Form 8-K, filed on August 7, 2015, File No. 001-32227) | ||
10.38 | Form of Tranche A Note, 3.23%, due August 4, 2020 (incorporated by reference from Exhibit 10.2 of our Current Report on Form 8-K, filed on August 7, 2015, File No. 001-32227) | ||
10.39 | Form of Tranche B Note, 3.70%, due August 4, 2022 (incorporated by reference from Exhibit 10.3 of our Current Report on Form 8-K, filed on August 7, 2015, File No. 001-32227) | ||
10.40 | Form of Tranche C Note, 3.82%, due December 3, 2022 (incorporated by reference from Exhibit 10.4 of our Current Report on Form 8-K, filed on August 7, 2015, File No. 001-32227) | ||
114
10.41 | Form of Tranche D Note, 4.01%, due August 4, 2025 (incorporated by reference from Exhibit 10.5 of our Current Report on Form 8-K, filed on August 7, 2015, File No. 001-32227) | ||
10.42 | Form of Tranche E Note, 4.11%, due December 3, 2025 (incorporated by reference from Exhibit 10.6 of our Current Report on Form 8-K, filed on August 7, 2015, File No. 001-32227) | ||
10.43 | Subsidiary Guaranty dated August 4, 2015, provided by certain subsidiaries of Cabela’s Incorporated party thereto to the holders of the Notes (incorporated by reference from Exhibit 10.7 of our Current Report on Form 8-K, filed on August 7, 2015, File No. 001-32227) | ||
10.44 | Second Amendment to Amended and Restated Credit Agreement dated August 4, 2015, among Cabela’s Incorporated and various lenders party thereto (incorporated by reference from Exhibit 10.8 of our Current Report on Form 8-K, filed on August 7, 2015, File No. 001-32227) | ||
10.45 | Amendment No. 2 to Note Purchase Agreements dated August 4, 2015, among Cabela’s Incorporated, certain subsidiaries of Cabela’s Incorporated party thereto, and certain purchasers party thereto (incorporated by reference from Exhibit 10.9 of our Current Report on Form 8-K, filed on August 7, 2015, File No. 001-32227) | ||
10.46 | Executive Employment Agreement dated August 14, 2015, between Cabela’s Incorporated and Brian J. Linneman (incorporated by reference from Exhibit 10.10 to our Quarterly Report on Form 10-Q, filed on October 22, 2015, File No. 001-32227)* | ||
10.47 | Executive Employment Agreement dated February 17, 2016, between Cabela’s Incorporated and Michael Copeland (incorporated by reference from Exhibit 10.48 to our Annual Report on Form 10-K, filed on February 19, 2016, File No. 001-32227)* | ||
21.1 | Subsidiaries of Cabela’s Incorporated | ||
23.1 | Consent of Deloitte & Touche LLP | ||
24.1 | Powers of Attorney | ||
31.1 | Certification of CEO Pursuant to Rule 13a-14(a) under the Exchange Act | ||
31.2 | Certification of CFO Pursuant to Rule 13a-14(a) under the Exchange Act | ||
32.1 | Certifications Pursuant to 18 U.S.C. Section 1350 | ||
101.INS | XBRL Instance Document | Filed with this report. | |
101.SCH | XBRL Taxonomy Extension Schema Document | Submitted electronically with this report. | |
101.CAL | XBRL Taxonomy Calculation Linkbase Document | Submitted electronically with this report. | |
101.LAB | XBRL Taxonomy Label Linkbase Document | Submitted electronically with this report. | |
101.PRE | XBRL Taxonomy Extension Presentation Linkbase Document | Submitted electronically with this report. | |
101.DEF | XBRL Taxonomy Extension Definition Linkbase Document | Submitted electronically with this report. | |
* | Indicates management contract or compensatory plan or arrangement required to be filed as exhibits pursuant to Item 15(b) of this report. |
(c) | Financial Statement Schedules. See Item 15(a) above. |
115
SIGNATURES
Pursuant to the requirements of Section 13 or 15(d) of the Securities Exchange Act of 1934, the registrant has duly caused this report to be signed on its behalf by the undersigned, thereunto duly authorized.
CABELA’S INCORPORATED | |||
Dated: | February 16, 2017 | By: | /s/ Thomas L. Millner |
Thomas L. Millner | |||
Chief Executive Officer | |||
Pursuant to the requirements of the Securities Exchange Act of 1934, this report has been signed below by the following persons on behalf of the registrant and in the capacities and on the dates indicated.
Signature | Title | Date | |
/s/ Thomas L. Millner | Chief Executive Officer and Director (Principal Executive Officer) | February 16, 2017 | |
Thomas L. Millner | |||
/s/ Ralph W. Castner | Executive Vice President and Chief Financial Officer (Principal Financial Officer and Principal Accounting Officer) | February 16, 2017 | |
Ralph W. Castner | |||
* | Chairman of the Board and Director | February 16, 2017 | |
James W. Cabela | |||
* | Director | February 16, 2017 | |
Dennis Highby | |||
* | Director | February 16, 2017 | |
Theodore M. Armstrong | |||
* | Director | February 16, 2017 | |
John H. Edmondson | |||
* | Director | February 16, 2017 | |
Michael R. McCarthy | |||
* | Director | February 16, 2017 | |
Donna M. Milrod | |||
* | Director | February 16, 2017 | |
Beth M. Pritchard | |||
* | Director | February 16, 2017 | |
Peter S. Swinburn | |||
* | Director | February 16, 2017 | |
James F. Wright | |||
* By: | /s/ Thomas L. Millner | Attorney-in-Fact | February 16, 2017 | |
Thomas L. Millner | ||||
116