Attached files
| file | filename |
|---|---|
| 8-K - 8-K - WABASH NATIONAL Corp | v459316_8k.htm |
Exhibit 99.1

WABASH NATIONAL CORPORATION Investor Update February 2017
2 This presentation contains certain forward - looking statements, as defined by the Private Securities Litigation Reform Act of 1995. All statements other than historical facts are forward - looking statements, including without limit, those regarding shipment outlook, Operating EBITDA, backlog, demand level expectations, profitability and earnings capacity, adjusted earnings per share guidance, margin opportunities, and potential benefits of any recent acquisitions. Any forward - looking statements are subject to certain risks and uncertainties that could cause actual results to differ materially from those implied by the forward - looking statements. Without limit, these risks and uncertainties include economic conditions, increased competition, dependence on new management, reliance on certain customers and corporate partnerships, shortages and costs of raw materials, manufacturing capacity and cost containment risks, dependence on industry trends, access to capital, acceptance of products, and government regulation. You should review and consider the various disclosures made by the Company in this presentation and in its reports to its stockholders and periodic reports on Forms 10 - K and 10 - Q. We cannot give assurance that the expectations reflected in our forward - looking statements will prove to be correct. Our actual results could differ materially from those anticipated in these forward - looking statements. All written and oral forward - looking statements attributable to us are expressly qualified in their entirety by the factors we disclose that could cause our actual results to differ materially from our expectations. S AFE H ARBOR S TATEMENT © 2017 Wabash National, L.P. All rights reserved. Wabash®, Wabash National®, DuraPlate®, DuraPlate AeroSkirt®, Walker, Brenner® and Beall® are marks owned by Wabash National, L. P. Transcraft® and Benson® are marks owned by Transcraft Corporation.
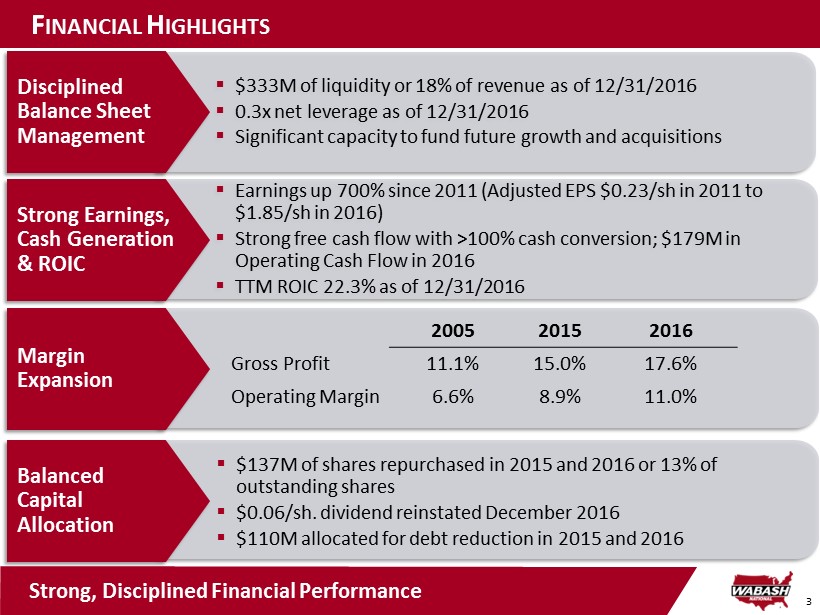
3 ▪ Earnings up 700% since 2011 (Adjusted EPS $0.23/ sh in 2011 to $ 1.85/ sh in 2016) ▪ Strong free cash flow with >100% cash conversion; $179M in Operating Cash Flow in 2016 ▪ TTM ROIC 22.3% as of 12/31/2016 ▪ $ 333M of liquidity or 18% of revenue as of 12/31/2016 ▪ 0.3x net leverage as of 12/31/2016 ▪ Significant capacity to fund future growth and acquisitions F INANCIAL H IGHLIGHTS Disciplined Balance Sheet Management Margin Expansion Strong Earnings, Cash Generation & ROIC Balanced Capital Allocation ▪ $137M of shares repurchased in 2015 and 2016 or 13% of outstanding shares ▪ $0.06/sh. dividend reinstated December 2016 ▪ $110M allocated for debt reduction in 2015 and 2016 Strong, Disciplined Financial Performance 2005 2015 2016 Gross Profit 11.1% 15.0% 17.6% Operating Margin 6.6% 8.9% 11.0%
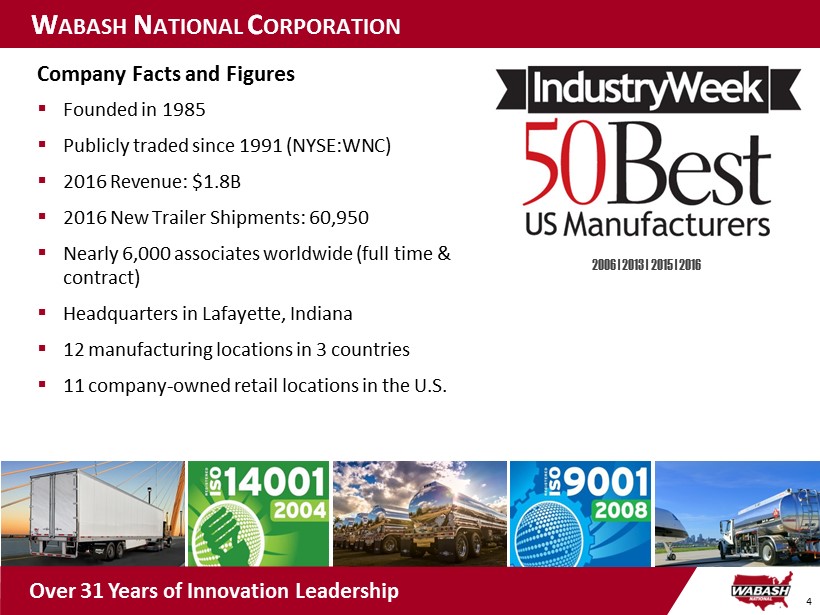
4 2006 | 2013 | 2015 | 2016 Company Facts and Figures ▪ Founded in 1985 ▪ Publicly traded s ince 1991 (NYSE:WNC) ▪ 2016 Revenue: $1.8B ▪ 2016 New Trailer Shipments: 60,950 ▪ Nearly 6,000 associates worldwide (full time & contract) ▪ Headquarters in Lafayette, Indiana ▪ 12 manufacturing l ocations in 3 countries ▪ 11 company - owned r etail l ocations in the U.S . Over 31 Years of Innovation Leadership W ABASH N ATIONAL C ORPORATION
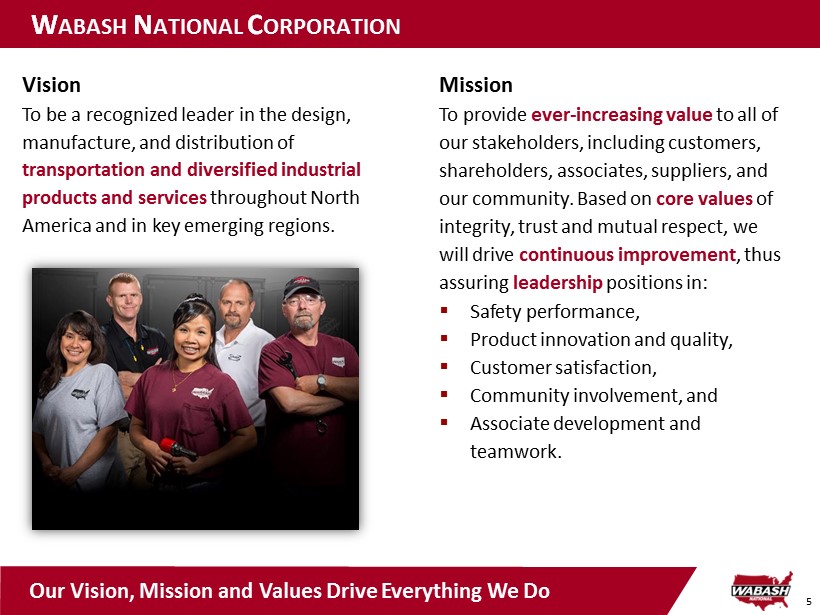
5 Mission To provide ever - increasing value to all of our stakeholders, including customers, shareholders, associates, suppliers, and our community. Based on core values of integrity, trust and mutual respect, we will drive continuous improvement , thus assuring leadership positions in: ▪ S afety performance, ▪ P roduct innovation and quality, ▪ C ustomer satisfaction, ▪ C ommunity involvement, and ▪ A ssociate development and teamwork. W ABASH N ATIONAL C ORPORATION Our Vision, Mission and Values Drive Everything We Do Vision To be a recognized leader in the design, manufacture, and distribution of transportation and diversified industrial products and services throughout North America and in key emerging regions.
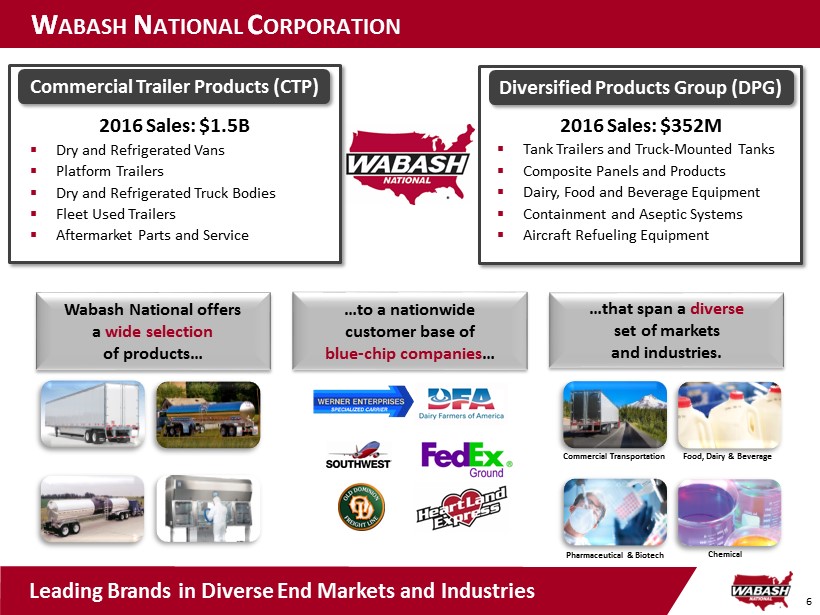
6 W ABASH N ATIONAL C ORPORATION Wabash National offers a wide selection of products … …that span a diverse set of markets and industries. …to a nationwide customer base of blue - chip companies … Commercial Transportation Food, Dairy & Beverage Pharmaceutical & Biotech 2016 Sales: $ 1.5B ▪ Dry and Refrigerated Vans ▪ Platform Trailers ▪ Dry and Refrigerated Truck Bodies ▪ Fleet Used Trailers ▪ Aftermarket Parts and Service Commercial Trailer Products (CTP) 2016 Sales: $352M ▪ Tank Trailers and Truck - Mounted Tanks ▪ Composite Panels and Products ▪ Dairy, Food and Beverage Equipment ▪ Containment and Aseptic Systems ▪ Aircraft Refueling Equipment Diversified Products Group (DPG) Chemical Leading Brands in Diverse End Markets and Industries
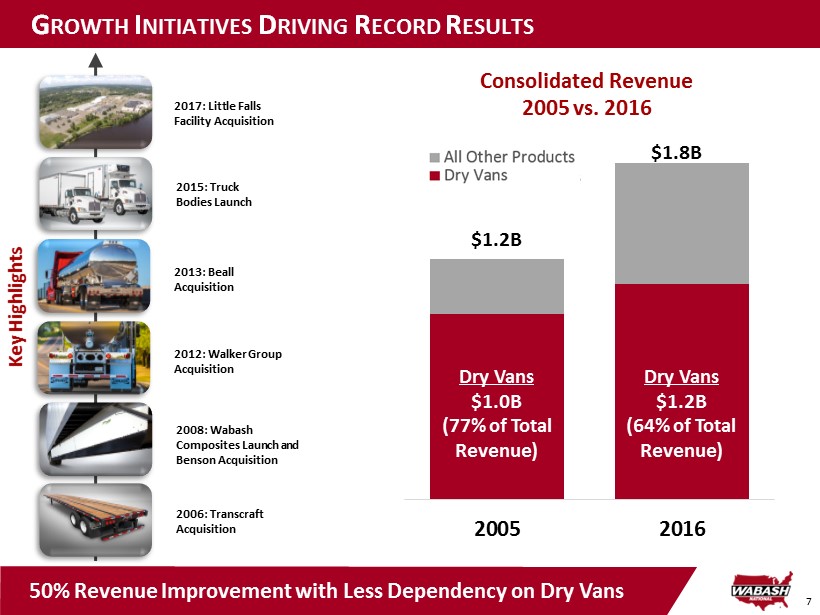
7 G ROWTH I NITIATIVES D RIVING R ECORD R ESULTS 2005 2016 Consolidated Revenue 2005 vs. 2016 Dry Vans All Other Products $1.8B $ 1.2B Dry Vans $1.0B (77% of Total Revenue) Dry Vans $1.2B (64% of Total Revenue) 50% Revenue Improvement with Less Dependency on Dry Vans 2013: Beall Acquisition 2006: Transcraft Acquisition 2012: Walker Group Acquisition 2008: Wabash Composites Launch and Benson Acquisition 2015: Truck Bodies Launch Key Highlights 2017: Little Falls Facility Acquisition
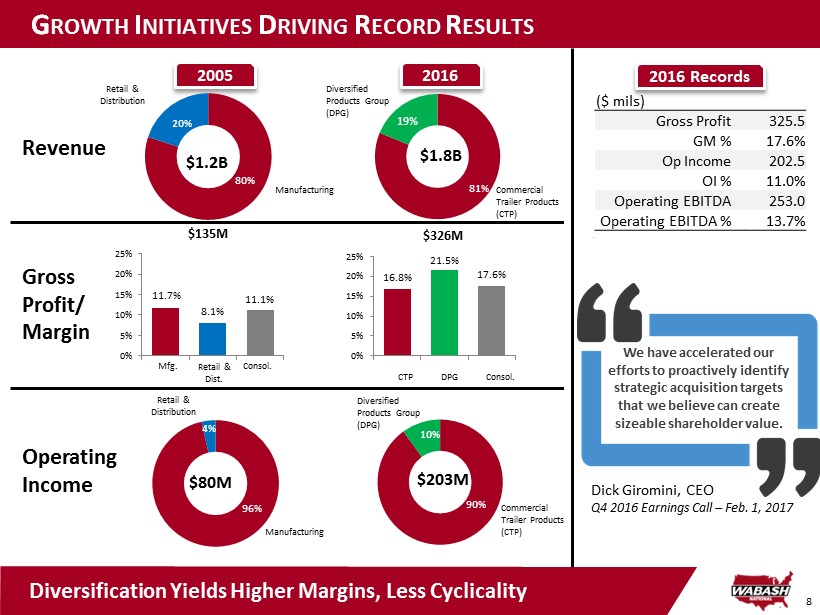
8 G ROWTH I NITIATIVES D RIVING R ECORD R ESULTS 2005 2016 Revenue Manufacturing Retail & Distribution 19% Commercial Trailer Products (CTP) Diversified Products Group (DPG) Operating Income Manufacturing Gross Profit/ Margin 16.8% 21.5% 17.6% 0% 5% 10% 15% 20% 25% CTP Consol. DPG 11.7% 8.1% 11.1% 0% 5% 10% 15% 20% 25% Mfg. Retail & Dist. Consol. $135M $ 326M 96% $80M Retail & Distribution $203M $1.2B $1.8B 81% 20% 80% 10% 90% 4% Diversified Products Group (DPG) Commercial Trailer Products (CTP) Diversification Yields Higher Margins, Less Cyclicality We have accelerated our efforts to proactively identify strategic acquisition targets that we believe can create sizeable shareholder value. Dick Giromini, CEO Q4 2016 Earnings Call – Feb. 1, 2017 2016 Records ($ mils) Gross Profit 325.5 GM % 17.6% Op Income 202.5 OI % 11.0% Operating EBITDA 253.0 Operating EBITDA % 13.7%
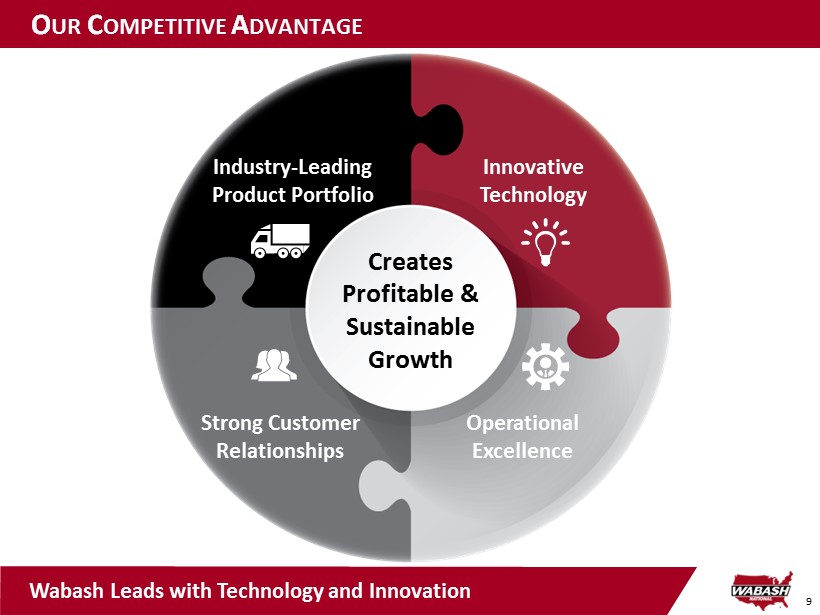
9 O UR C OMPETITIVE A DVANTAGE Wabash Leads with Technology and Innovation Industry - Leading Product Portfolio Strong Customer Relationships Innovative Technology Operational Excellence Creates Profitable & Sustainable Growth
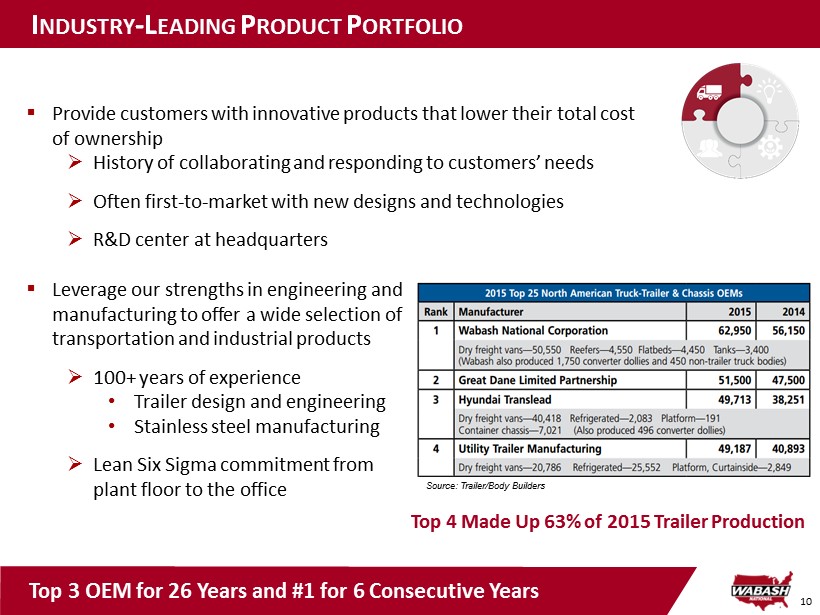
10 I NDUSTRY - L EADING P RODUCT P ORTFOLIO ▪ Leverage our strengths in engineering and manufacturing to offer a wide selection of transportation and industrial products » 100+ years of experience • Trailer design and engineering • Stainless steel manufacturing » Lean Six Sigma commitment from plant floor to the office Top 3 OEM for 26 Years and #1 for 6 Consecutive Years Source: Trailer/Body Builders Top 4 Made Up 63% of 2015 Trailer Production ▪ Provide customers with innovative products that lower their total cost of ownership » History of collaborating and responding to customers’ needs » Often first - to - market with new designs and technologies » R&D center at headquarters

11 General Freight - Truckload , 71% Refrigerated Freight , 10% Less Than Truckload Freight , 8% Platform Freight , 8% Other , 3% I NDUSTRY - L EADING P RODUCT P ORTFOLIO : CTP E ND M ARKETS Innovative Product Growth ▪ 2015: Introduced Final Mile and Cold Chain Series Truck Bodies ▪ 2017 and Beyond: Developing and producing molded structural composite trailers and truck bodies at our newly acquired Little Falls facility North America Market Positions* * Based on industry estimates Note: All information based on 2015 revenues Sources for market positions: TTMA, ACT, Polk, Trailer/Body Builders #1 Dry van trailers #2 Platform trailers #3 Refrigerated van trailers Leadership Positions Drive Growth Potential for New Products Key Markets Market Position & Growth
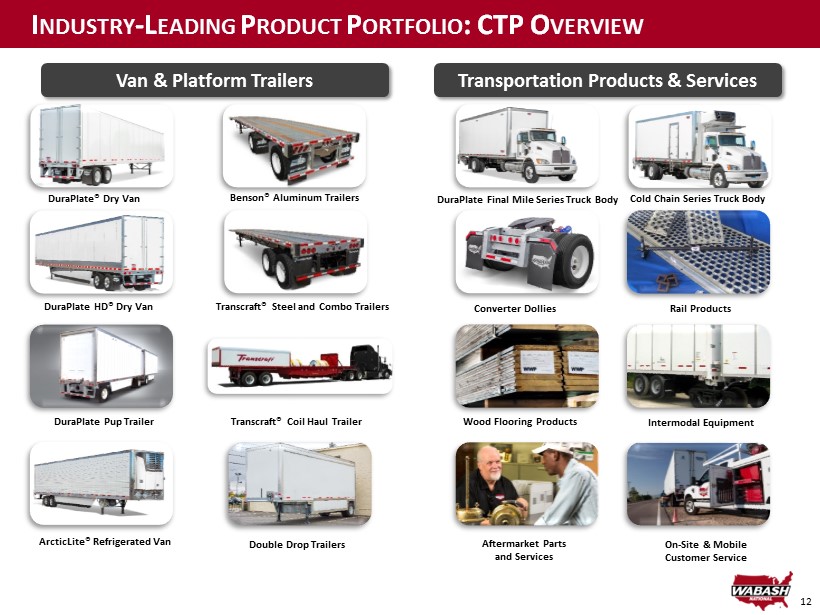
12 I NDUSTRY - L EADING P RODUCT P ORTFOLIO : CTP O VERVIEW Van & Platform Trailers Transportation Products & Services DuraPlate® Dry Van DuraPlate HD® Dry V an ArcticLite® Refrigerated V an DuraPlate Pup Trailer Benson® Aluminum T railers Transcraft® Steel and Combo Trailers Transcraft® Coil H aul Trailer DuraPlate Final Mile Series Truck Body Cold Chain Series Truck Body Aftermarket Parts and Services On - Site & Mobile Customer Service Converter Dollies Intermodal Equipment Rail Products Wood Flooring Products Double Drop Trailers
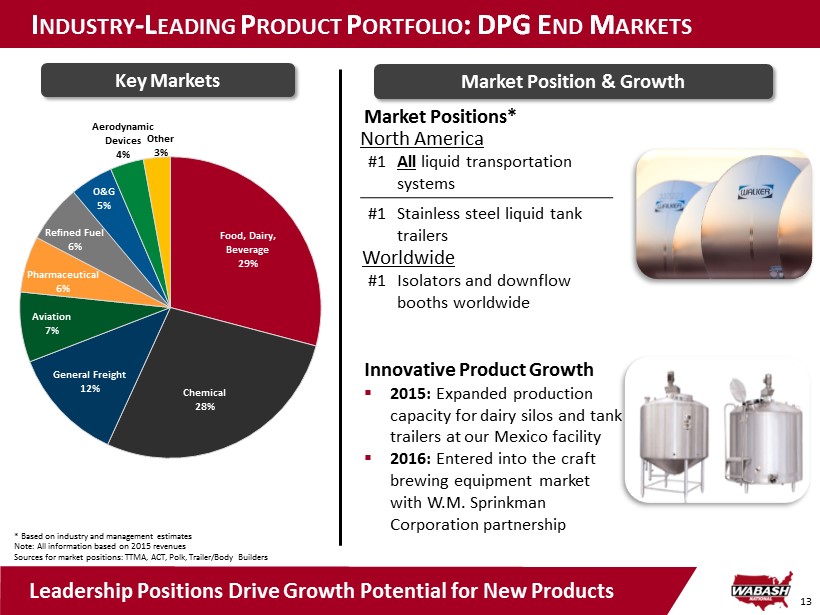
13 Food, Dairy, Beverage 29% Chemical 28% General Freight 12% Aviation 7% Pharmaceutical 6% Refined Fuel 6% O&G 5% Aerodynamic Devices 4% Other 3% I NDUSTRY - L EADING P RODUCT P ORTFOLIO : DPG E ND M ARKETS Innovative Product Growth ▪ 2015: Expanded production capacity for dairy silos and tank trailers at our Mexico facility ▪ 2016: Entered into the craft brewing equipment market with W.M. Sprinkman Corporation partnership Market Positions* Key Markets Market Position & Growth Leadership Positions Drive Growth Potential for New Products * Based on industry and management estimates Note: All information based on 2015 revenues Sources for market positions: TTMA, ACT, Polk, Trailer/Body Builders #1 All liquid transportation systems #1 Stainless steel liquid tank trailers #1 Isolators and downflow booths worldwide North America Worldwide
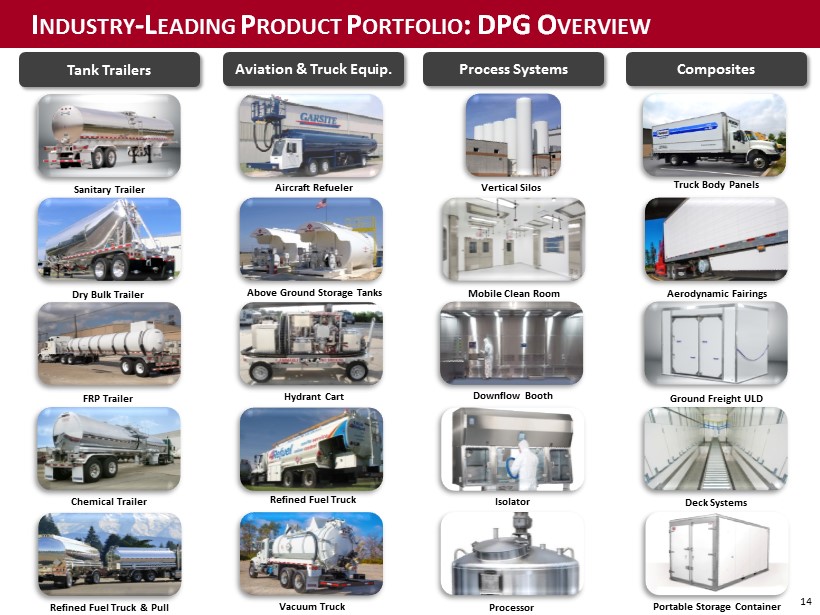
14 Sanitary Trailer Refined Fuel Truck Processor Downflow Booth Isolator Aircraft Refueler Dry Bulk Trailer Vertical Silos Above Ground Storage Tanks Mobile Clean Room Hydrant Cart FRP Trailer Vacuum Truck Refined Fuel Truck & Pull Chemical Trailer Truck Body Panels Aerodynamic Fairings Ground Freight ULD Deck Systems Portable Storage Container I NDUSTRY - L EADING P RODUCT P ORTFOLIO : DPG O VERVIEW Tank Trailers Aviation & Truck Equip. Process Systems Composites
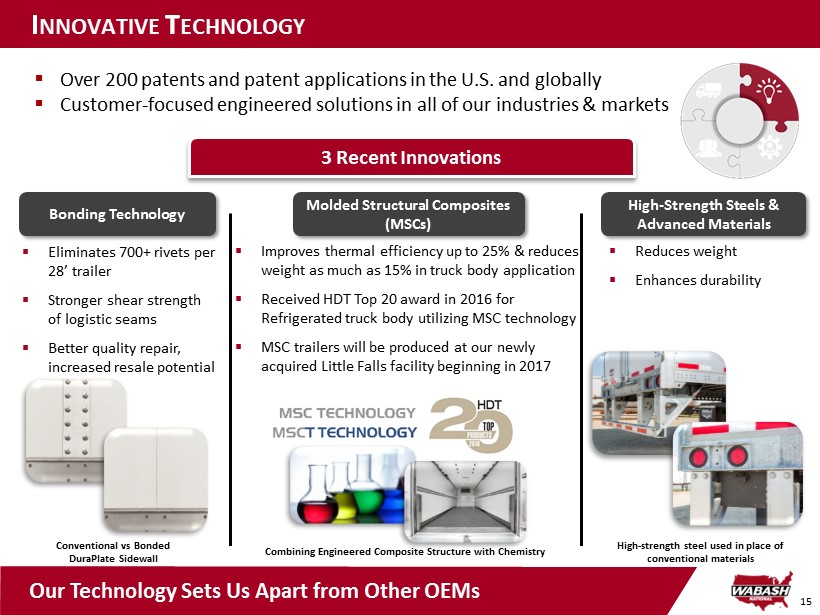
15 I NNOVATIVE T ECHNOLOGY ▪ Over 200 patents and patent applications in the U.S. and globally ▪ Customer - focused engineered solutions in all of our industries & markets Our Technology Sets Us Apart from Other OEMs 3 Recent Innovations Conventional vs Bonded DuraPlate Sidewall Bonding Technology ▪ Eliminates 700+ rivets per 28’ trailer ▪ Stronger shear strength of logistic seams ▪ Better quality repair, increased resale potential Molded Structural Composites (MSCs) Combining Engineered Composite Structure with Chemistry ▪ Improves thermal efficiency up to 25% & reduces weight as much as 15% in truck body application ▪ Received HDT Top 20 award in 2016 for Refrigerated truck body utilizing MSC technology ▪ MSC trailers will be produced at our newly acquired Little Falls facility beginning in 2017 High - Strength Steels & Advanced Materials ▪ Reduces weight ▪ Enhances durability High - strength steel used in place of conventional materials
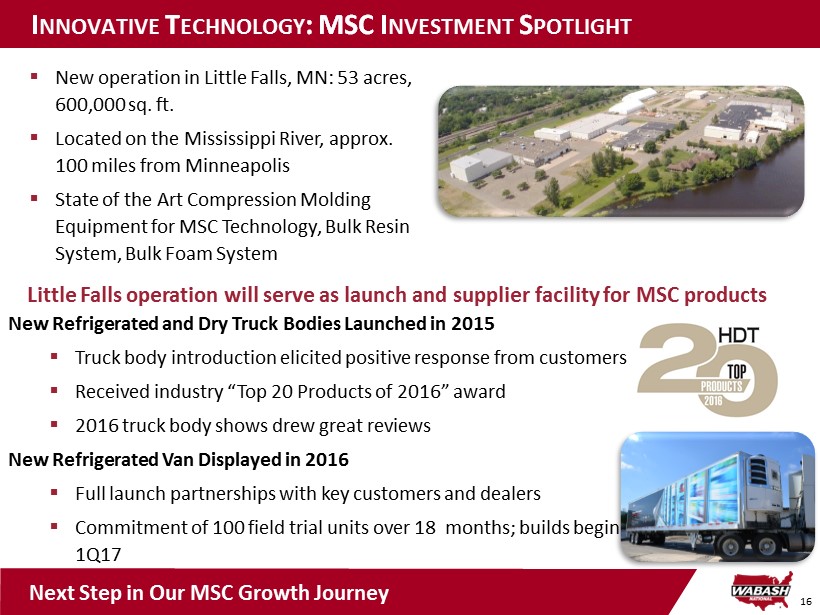
16 I NNOVATIVE T ECHNOLOGY : MSC I NVESTMENT S POTLIGHT ▪ New operation in Little Falls, MN: 53 acres, 600,000 sq. ft. ▪ Located on the Mississippi River, approx. 100 miles from Minneapolis ▪ State of the Art Compression Molding Equipment for MSC Technology, Bulk Resin System, Bulk Foam System Next Step in Our MSC Growth Journey New Refrigerated and Dry Truck Bodies Launched in 2015 ▪ Truck body introduction elicited positive response from customers ▪ Received industry “Top 20 Products of 2016” award ▪ 2016 truck body shows drew great reviews New Refrigerated Van Displayed in 2016 ▪ Full launch partnerships with key customers and dealers ▪ Commitment of 100 field trial units over 18 months; builds begin 1Q17 Little Falls operation will serve as launch and supplier facility for MSC products
17 O PERATIONAL E XCELLENCE ▪ Continuous improvement philosophy emphasizing manufacturing velocity and business process optimization ▪ Lean Six Sigma manufacturing approach for 13+ years Operational Excellence Enables Continuous Improvement Continuous improvement in all aspects of our business must be at the core of our very being. We must strive to be better today than we were yesterday and better tomorrow than we are today. Dick Giromini, CEO Wabash Manufacturing System
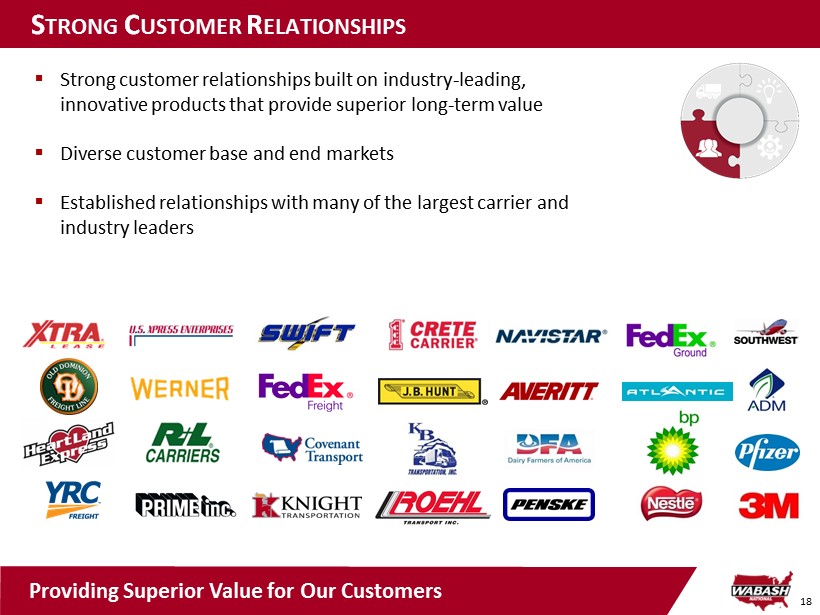
18 S TRONG C USTOMER R ELATIONSHIPS ▪ Strong customer relationships built on industry - leading, innovative products that provide superior long - term value ▪ Diverse customer base and end markets ▪ Established relationships with many of the largest carrier and industry leaders Providing Superior Value for Our Customers

WABASH NATIONAL CORPORATION Our Future Outlook
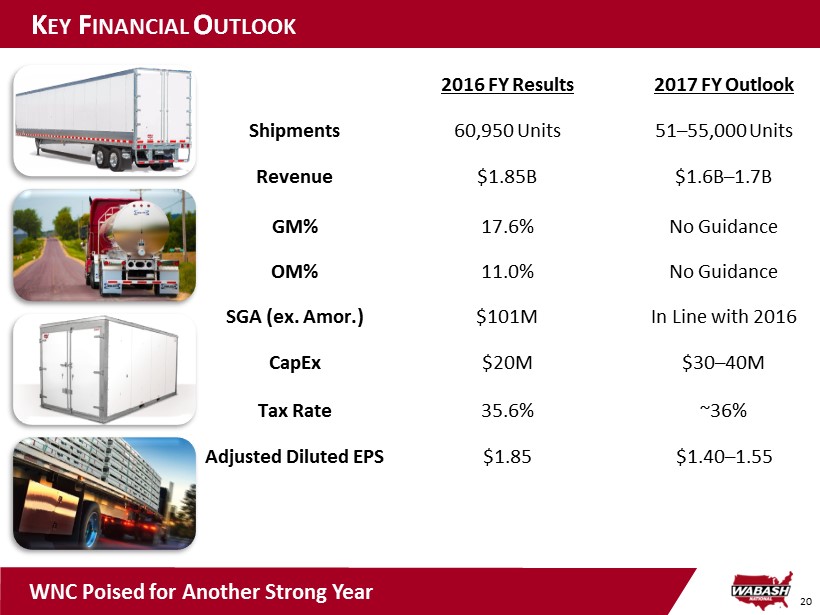
20 K EY F INANCIAL O UTLOOK 2016 FY Results 2017 FY Outlook Shipments 60,950 Units 51 – 55,000 Units Revenue $1.85B $1.6B – 1.7B GM% 17.6% No Guidance OM% 11.0% No Guidance SGA (ex. Amor.) $101M In Line with 2016 CapEx $20M $30 – 40M Tax Rate 35.6% ~36% Adjusted Diluted EPS $1.85 $1.40 – 1.55 WNC Poised for Another Strong Year
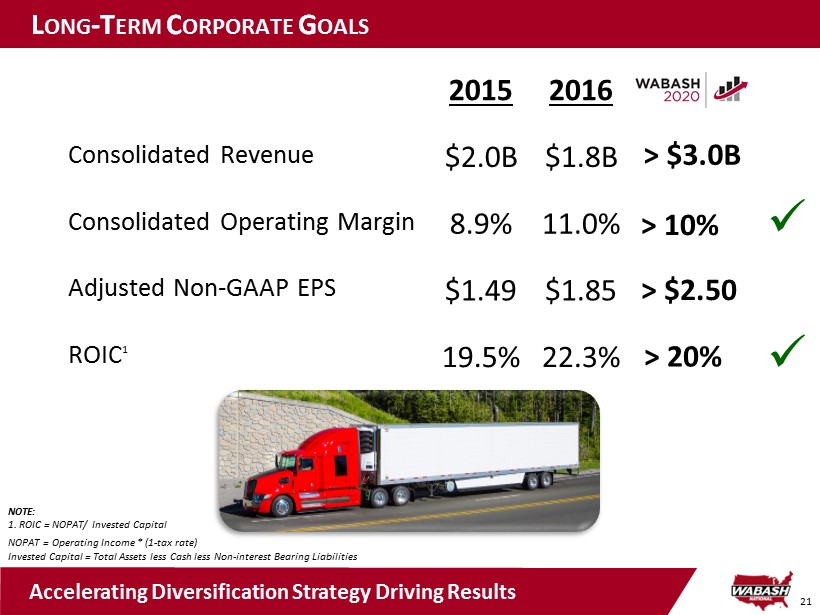
21 L ONG - T ERM C ORPORATE G OALS 2015 2016 Consolidated Revenue $2.0B $1.8B Consolidated Operating Margin 8.9% 11.0% Adjusted Non - GAAP EPS $1.49 $1.85 ROIC 1 19.5% 22.3% > $3.0B > 10% > 20% > $2.50 NOTE: 1. ROIC = NOPAT/ Invested Capital NOPAT = Operating Income * (1 - tax rate) Invested Capital = Total Assets less Cash less Non - interest Bearing Liabilities Accelerating Diversification Strategy Driving Results x x
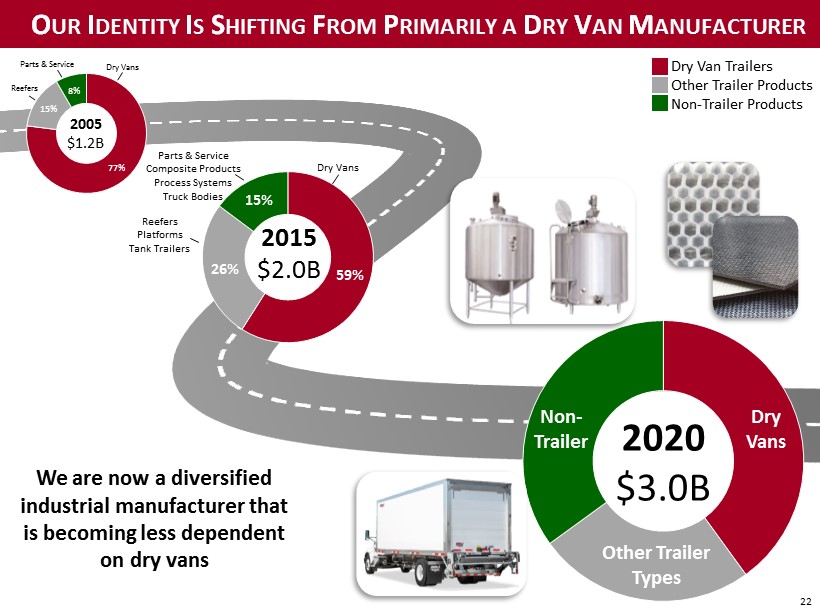
22 O UR I DENTITY I S S HIFTING F ROM P RIMARILY A D RY V AN M ANUFACTURER We are now a diversified industrial manufacturer that is becoming less dependent on dry vans 2005 $1.2B Reefers 77% 15% 8% Parts & Service Dry Vans Dry Van Trailers Other Trailer Products Non - Trailer Products 2020 $3.0B Dry Vans Non - Trailer Other Trailer Types 2015 $2.0B 59% 26% 15% Reefers Platforms Tank Trailers Parts & Service Composite Products Process Systems Truck Bodies Dry Vans
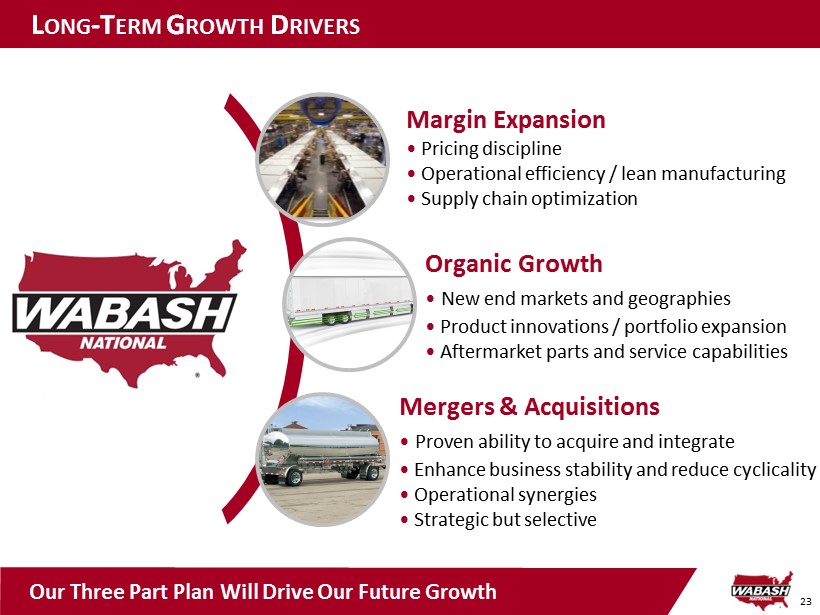
23 L ONG - T ERM G ROWTH D RIVERS Margin Expansion • Pricing discipline • Operational efficiency / lean manufacturing • Supply chain optimization Organic Growth • New end markets and geographies • Product innovations / portfolio expansion • Aftermarket parts and service capabilities Mergers & Acquisitions • Proven ability to acquire and integrate • Enhance business stability and reduce cyclicality • Operational synergies • Strategic but selective Our Three Part Plan Will Drive Our Future Growth
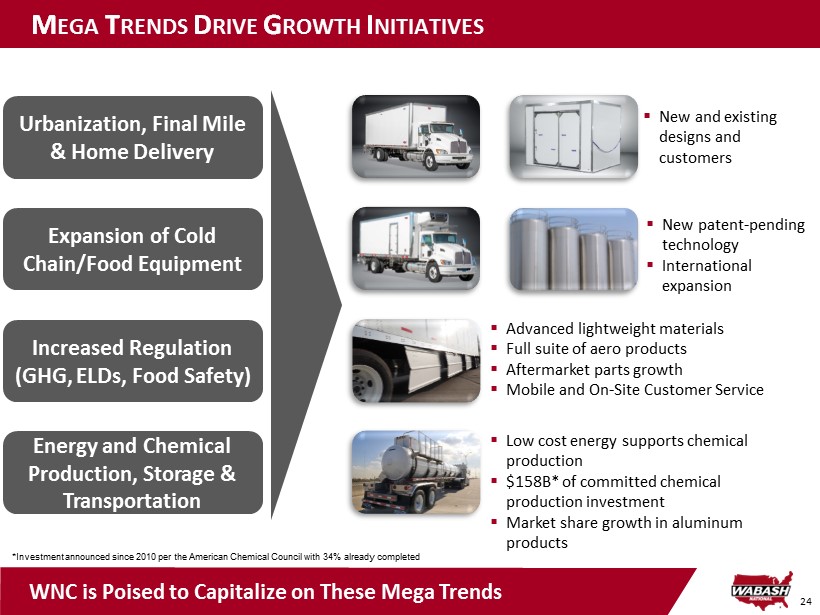
24 M EGA T RENDS D RIVE G ROWTH I NITIATIVES ▪ Advanced lightweight materials ▪ Full suite of aero products ▪ Aftermarket parts growth ▪ Mobile and On - Site Customer Service ▪ Low cost energy supports chemical production ▪ $158B* of committed chemical production investment ▪ Market share growth in aluminum products ▪ New and existing designs and customers ▪ New patent - pending technology ▪ International expansion *Investment announced since 2010 per the American Chemical Council with 34% already completed Urbanization, Final Mile & Home Delivery Expansion of Cold Chain/Food Equipment Increased Regulation (GHG, ELDs, Food Safety) Energy and Chemical Production, Storage & Transportation WNC is Poised to Capitalize on These Mega Trends

25 O RGANIC G ROWTH I NITIATIVES : T RUCK B ODY S POTLIGHT ▪ Target Market for Dry Truck Body > 50,000 units annually ▪ Target Market for Refrigerated Truck Body > 10,000 units annually ▪ Objective is to grow Truck Body business to > $100M revenue by 2020 ▪ Utilizes industry - leading DuraPlate® panels ▪ Robust heavy - duty design ▪ Widely available parts ▪ ~200 presently in service; sold into existing fleet customers for 2 years ▪ Available with weight - saving floor using molded structural composite (MSC) technology ▪ Applicable to Class 5 - 8 chassis Truck Body Sales Poised for Growth ▪ Utilizes legacy sheet & post trailer design technology; or ▪ Available with molded structural composite thermal (MSCT) technology : » 15% lighter » 25% improved thermal performance » Up to 2x improvement in puncture resistance ▪ Heavy - duty design ▪ Applicable to Class 5 - 8 chassis Final Mile Series Dry Truck Body Cold Chain Series Refrigerated Truck Body

26 M ERGERS & A CQUISITIONS ▪ Tank Trailers ▪ Process Systems ▪ Aviation & Truck Equipment Transformative Acquisition (2012) Platform Expanding Acquisition (2013) ▪ Aluminum 406/Refined Fuel Tank ▪ Dry Bulk Tanks ▪ Geographic Expansion Past Acquisitions Strategic M&A Criteria Growth Through Acquisition Remains a Strategic Component Value - added, engineered products and services manufactured at scale where we can provide customer solutions Operating Margin levels > 10% Strong management teams that are a cultural fit Aligned with core competencies in purchasing, operations, distribution and product development Diversified growth markets (end markets or geographies) and less cyclical industries 1 2 3 4 5 Growth Through Acquisition Remains a Strategic Component
WABASH NATIONAL CORPORATION Market Dynamics
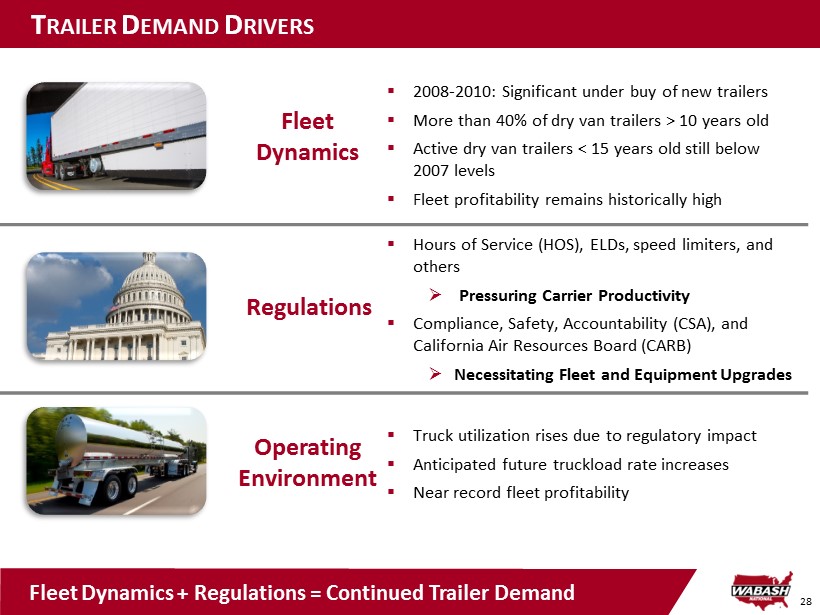
28 T RAILER D EMAND D RIVERS ▪ 2008 - 2010: Significant under buy of new trailers ▪ More than 40% of dry van trailers > 10 years old ▪ Active dry van trailers < 15 years old still below 2007 levels ▪ Fleet profitability remains historically high ▪ Hours of Service (HOS), ELDs, speed limiters, and others » Pressuring Carrier Productivity ▪ Compliance, Safety, Accountability (CSA), and California Air Resources Board (CARB) » Necessitating Fleet and Equipment Upgrades ▪ Truck utilization rises due to regulatory impact ▪ Anticipated future truckload rate increases ▪ Near record fleet profitability Fleet Dynamics + Regulations = Continued Trailer Demand Fleet Dynamics Regulations Operating Environment
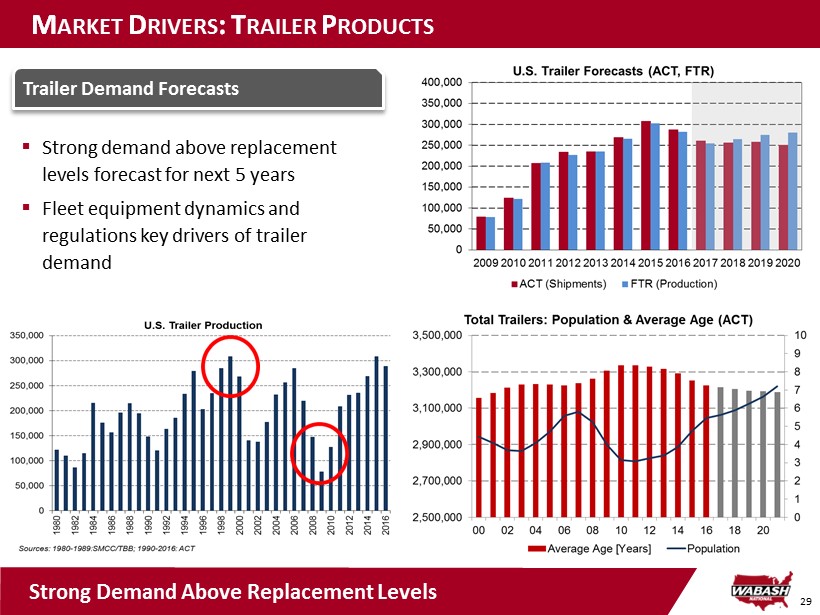
29 M ARKET D RIVERS : T RAILER P RODUCTS ▪ Strong demand above replacement levels forecast for next 5 years ▪ Fleet equipment dynamics and regulations key drivers of trailer demand Trailer Demand Forecasts Strong Demand Above Replacement Levels
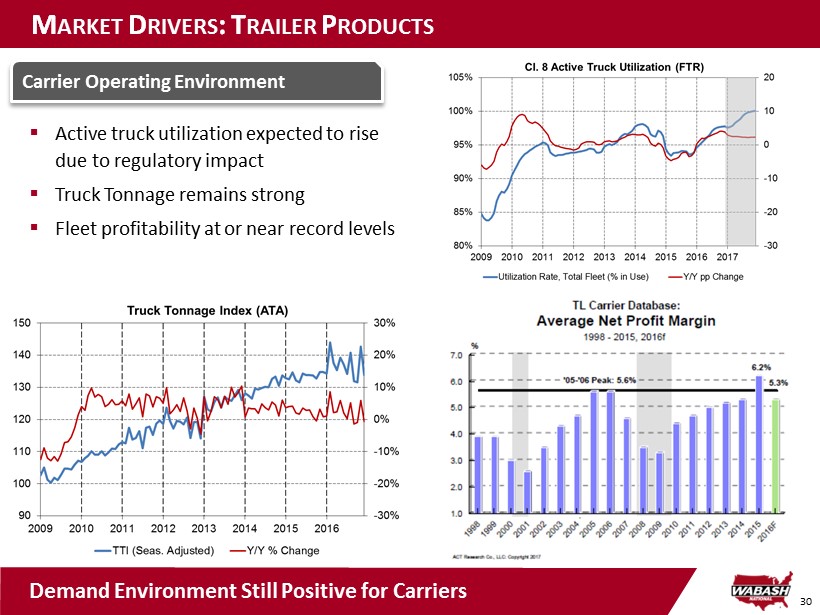
30 M ARKET D RIVERS : T RAILER P RODUCTS ▪ Active truck utilization expected to rise due to regulatory impact ▪ Truck Tonnage remains strong ▪ Fleet profitability at or near record levels Carrier Operating Environment Demand Environment Still Positive for Carriers
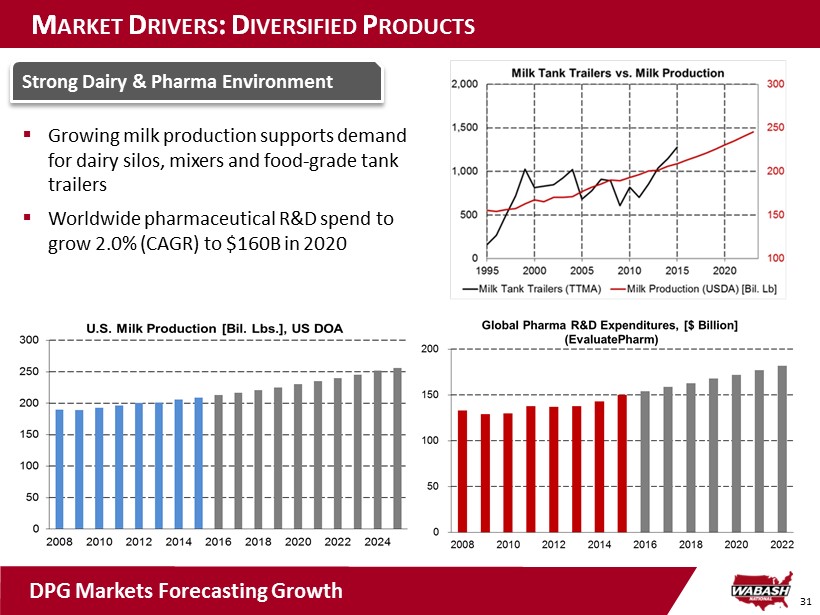
31 M ARKET D RIVERS : D IVERSIFIED P RODUCTS ▪ Growing milk production supports demand for dairy silos, mixers and food - grade tank trailers ▪ Worldwide pharmaceutical R&D spend to grow 2.0% (CAGR) to $160B in 2020 Strong Dairy & Pharma Environment DPG Markets Forecasting Growth

32 M ARKET D RIVERS : D IVERSIFIED P RODUCTS ▪ Lower cost access to natural gas driving increased domestic chemical industry output; $158B of committed chemical production investment ▪ As the chemical and oil industries have continued to expand, so has production of tank trailers Growing Chemical & Oil Markets Positive Chemical and Oil Tank Marketplace Indicators

WABASH NATIONAL CORPORATION Financial Overview
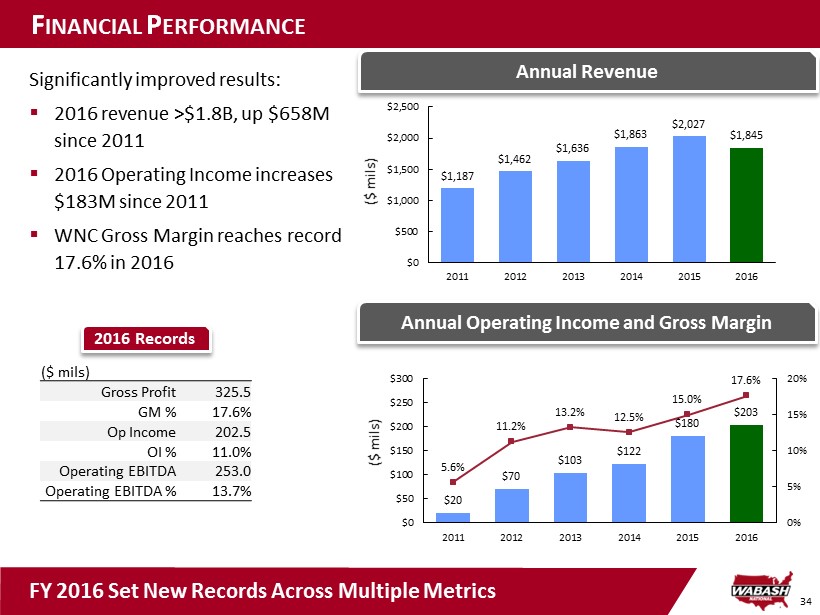
34 F INANCIAL P ERFORMANCE Annual Revenue Significantly improved results: ▪ 2016 revenue >$1.8B , up $658M since 2011 ▪ 2016 Operating Income increases $ 183M since 2011 ▪ WNC Gross Margin reaches record 17.6% in 2016 Annual Operating Income and Gross Margin $1,187 $1,462 $1,636 $1,863 $2,027 $1,845 $0 $500 $1,000 $1,500 $2,000 $2,500 2011 2012 2013 2014 2015 2016 ($ mils) $20 $70 $103 $122 $180 $203 5.6% 11.2% 13.2% 12.5% 15.0% 17.6% 0% 5% 10% 15% 20% $0 $50 $100 $150 $200 $250 $300 2011 2012 2013 2014 2015 2016 ($ mils) 2016 Records FY 2016 Set New Records Across Multiple Metrics ($ mils) Gross Profit 325.5 GM % 17.6% Op Income 202.5 OI % 11.0% Operating EBITDA 253.0 Operating EBITDA % 13.7%
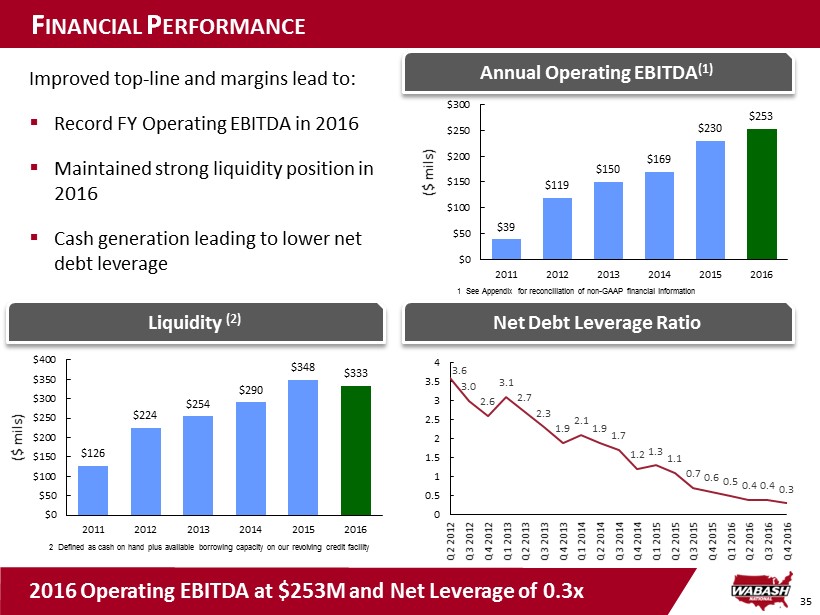
35 $39 $119 $150 $169 $230 $253 $0 $50 $100 $150 $200 $250 $300 2011 2012 2013 2014 2015 2016 ($ mils) F INANCIAL P ERFORMANCE Net Debt Leverage Ratio Improved top - line and margins lead to: ▪ Record FY Operating EBITDA in 2016 ▪ Maintained strong liquidity position in 2016 ▪ Cash generation leading to lower net debt leverage Annual Operating EBITDA (1) Liquidity (2) 2 Defined as cash on hand plus available borrowing capacity on our revolving credit facility 1 See Appendix for reconciliation of non - GAAP financial information $126 $224 $254 $290 $348 $333 $0 $50 $100 $150 $200 $250 $300 $350 $400 2011 2012 2013 2014 2015 2016 ($ mils) 2016 Operating EBITDA at $ 253M and Net Leverage of 0.3x 3.6 3.0 2.6 3.1 2.7 2.3 1.9 2.1 1.9 1.7 1.2 1.3 1.1 0.7 0.6 0.5 0.4 0.4 0.3 0 0.5 1 1.5 2 2.5 3 3.5 4 Q2 2012 Q3 2012 Q4 2012 Q1 2013 Q2 2013 Q3 2013 Q4 2013 Q1 2014 Q2 2014 Q3 2014 Q4 2014 Q1 2015 Q2 2015 Q3 2015 Q4 2015 Q1 2016 Q2 2016 Q3 2016 Q4 2016
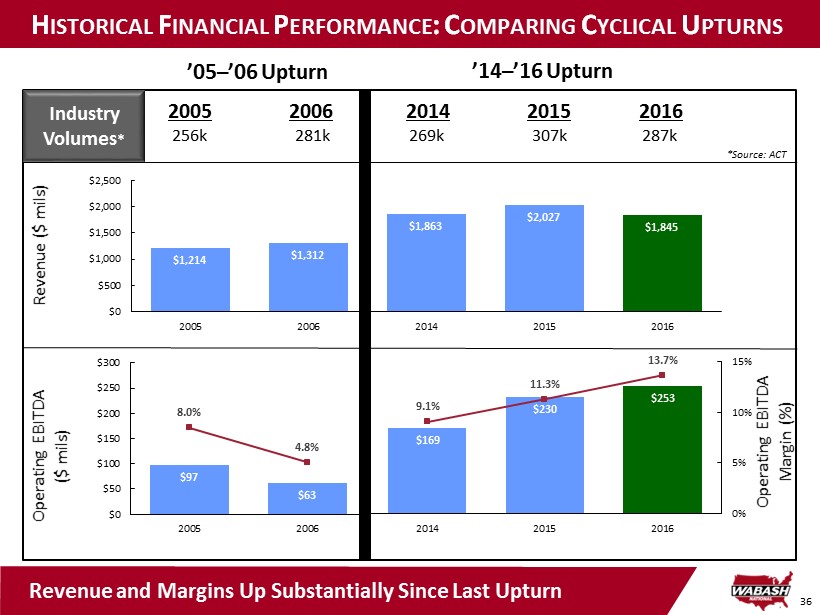
36 H ISTORICAL F INANCIAL P ERFORMANCE : C OMPARING C YCLICAL U PTURNS ’05 – ’06 Upturn $97 $63 8.0% 4.8% $0 $50 $100 $150 $200 $250 $300 2005 2006 Operating EBITDA ($ mils) Industry Volumes * ’14 – ’16 Upturn $1,214 $1,312 $1,863 $2,027 $1,845 $0 $500 $1,000 $1,500 $2,000 $2,500 2005 2006 2014 2015 2016 Revenue ($ mils) 2005 2006 2014 2015 2016 256k 281k 269k 307k 287k *Source: ACT Revenue and Margins Up Substantially Since Last Upturn $169 $230 $253 9.1% 11.3% 13.7% 0% 5% 10% 15% 2014 2015 2016 Operating EBITDA Margin (%)
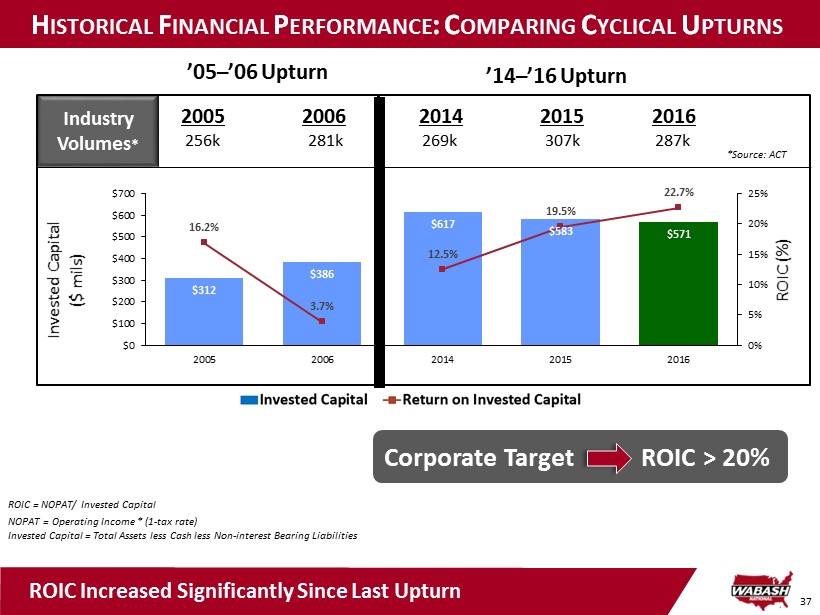
37 H ISTORICAL F INANCIAL P ERFORMANCE : C OMPARING C YCLICAL U PTURNS ’05 – ’06 Upturn *Source: ACT $312 $386 16.2% 3.7% $0 $100 $200 $300 $400 $500 $600 $700 2005 2006 Invested Capital ($ mils) Industry Volumes * ’14 – ’16 Upturn 2005 2006 2014 2015 2016 256k 281k 269k 307k 287k $617 $583 $571 12.5% 19.5% 22.7% 0% 5% 10% 15% 20% 25% 2014 2015 2016 ROIC (%) ROIC = NOPAT/ Invested Capital NOPAT = Operating Income * (1 - tax rate) Invested Capital = Total Assets less Cash less Non - interest Bearing Liabilities Corporate Target ROIC > 20% ROIC Increased Significantly Since Last Upturn
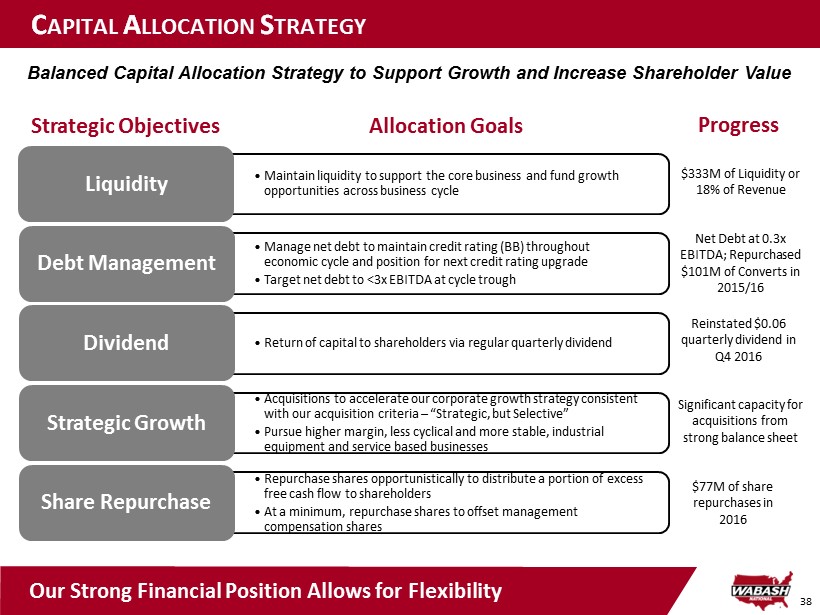
38 C APITAL A LLOCATION S TRATEGY • Maintain liquidity to support the core business and fund growth opportunities across business cycle Liquidity • Manage net debt to maintain credit rating (BB) throughout economic cycle and position for next credit rating upgrade • Target net debt to <3x EBITDA at cycle trough Debt Management • Return of capital to shareholders via regular quarterly dividend Dividend • Acquisitions to accelerate our corporate growth strategy consistent with our acquisition criteria – “Strategic, but Selective” • Pursue higher margin, less cyclical and more stable, industrial equipment and service based businesses Strategic Growth • Repurchase shares opportunistically to distribute a portion of excess free cash flow to shareholders • At a minimum, repurchase shares to offset management compensation shares Share Repurchase Balanced Capital Allocation Strategy to Support Growth and Increase Shareholder Value Strategic Objectives Allocation Goals Progress $ 333M of Liquidity or 18% of Revenue Net Debt at 0.3x EBITDA; Repurchased $101M of Converts in 2015/16 Significant capacity for acquisitions from strong balance sheet $77M of share repurchases in 2016 Reinstated $0.06 quarterly dividend in Q4 2016 Our Strong Financial Position Allows for Flexibility
WABASH NATIONAL CORPORATION Appendix

40 C ONSOLIDATED I NCOME S TATEMENT ($ in thousands, except per share amounts) 2011 2012 2013 2014 2015 2016 Net sales 1,187,244$ 1,461,854$ 1,635,686$ 1,863,315$ 2,027,489$ 1,845,444$ Cost of sales 1,120,524 1,298,031 1,420,563 1,630,681 1,724,046 1,519,910 Gross profit 66,720$ 163,823$ 215,123$ 232,634$ 303,443$ 325,534$ % of sales 5.6% 11.2% 13.2% 12.5% 15.0% 17.6% General and administrative expenses 30,994 44,751 58,666 61,694 73,495 74,129 % of sales 2.6% 3.1% 3.6% 3.3% 3.6% 4.0% Selling expenses 12,981 23,589 30,597 26,676 27,233 27,270 % of sales 1.1% 1.6% 1.9% 1.4% 1.3% 1.5% Amortization of intangibles 2,955 10,590 21,786 21,878 21,259 19,940 % of sales 0.2% 0.7% 1.3% 1.2% 1.0% 1.1% Other operating expenses - 14,409 883 - 1,087 1,663 % of sales 0.0% 1.0% 0.1% 0.0% 0.1% 0.1% - - - - Income from operations 19,790$ 70,484$ 103,191$ 122,386$ 180,369$ 202,532$ % of sales 1.7% 4.8% 6.3% 6.6% 8.9% 11.0% Other income (expense) Interest expense (4,136) (21,724) (26,308) (22,165) (19,548) (15,663) Other, net (441) (97) 740 (1,759) 2,490 (1,452) Income before income taxes 15,213$ 48,663$ 77,623$ 98,462$ 163,311$ 185,417$ Income tax expense (benefit) 171 (56,968) 31,094 37,532 59,022 65,984 Net income 15,042$ 105,631$ 46,529$ 60,930$ 104,289$ 119,433$ Diluted net income per share 0.22$ 1.53$ 0.67$ 0.85$ 1.50$ 1.82$
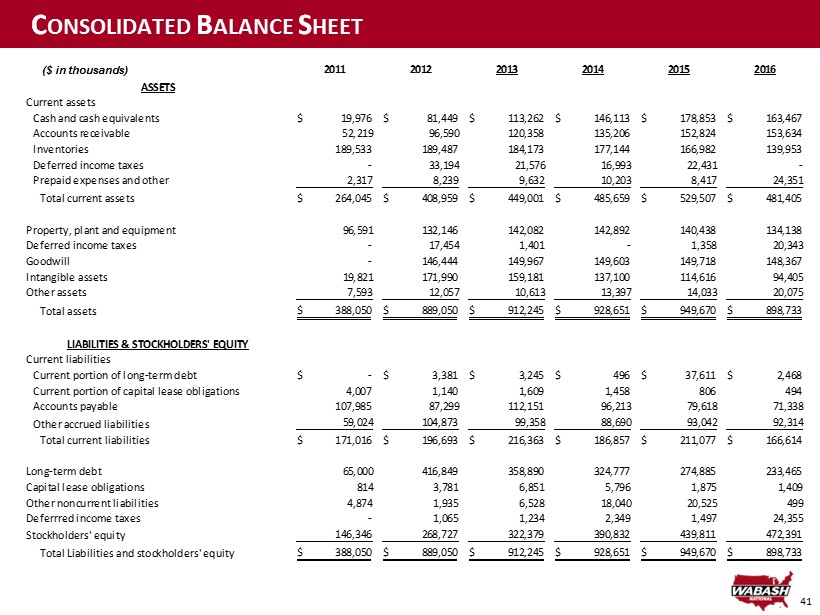
41 C ONSOLIDATED B ALANCE S HEET ($ in thousands) 2011 2012 2013 2014 2015 2016 ASSETS Current assets Cash and cash equivalents 19,976$ 81,449$ 113,262$ 146,113$ 178,853$ 163,467$ Accounts receivable 52,219 96,590 120,358 135,206 152,824 153,634 Inventories 189,533 189,487 184,173 177,144 166,982 139,953 Deferred income taxes - 33,194 21,576 16,993 22,431 - Prepaid expenses and other 2,317 8,239 9,632 10,203 8,417 24,351 Total current assets 264,045$ 408,959$ 449,001$ 485,659$ 529,507$ 481,405$ Property, plant and equipment 96,591 132,146 142,082 142,892 140,438 134,138 Deferred income taxes - 17,454 1,401 - 1,358 20,343 Goodwill - 146,444 149,967 149,603 149,718 148,367 Intangible assets 19,821 171,990 159,181 137,100 114,616 94,405 Other assets 7,593 12,057 10,613 13,397 14,033 20,075 Total assets 388,050$ 889,050$ 912,245$ 928,651$ 949,670$ 898,733$ LIABILITIES & STOCKHOLDERS' EQUITY Current liabilities Current portion of long-term debt -$ 3,381$ 3,245$ 496$ 37,611$ 2,468$ Current portion of capital lease obligations 4,007 1,140 1,609 1,458 806 494 Accounts payable 107,985 87,299 112,151 96,213 79,618 71,338 Other accrued liabilities 59,024 104,873 99,358 88,690 93,042 92,314 Total current liabilities 171,016$ 196,693$ 216,363$ 186,857$ 211,077$ 166,614$ Long-term debt 65,000 416,849 358,890 324,777 274,885 233,465 Capital lease obligations 814 3,781 6,851 5,796 1,875 1,409 Other noncurrent liabilities 4,874 1,935 6,528 18,040 20,525 499 Deferrred income taxes - 1,065 1,234 2,349 1,497 24,355 Stockholders' equity 146,346 268,727 322,379 390,832 439,811 472,391 Total Liabilities and stockholders' equity 388,050$ 889,050$ 912,245$ 928,651$ 949,670$ 898,733$

42 C ONSOLIDATED C ASH F LOWS ($ in thousands) 2011 2012 2013 2014 2015 2016 Cash flows from operating activities Net income 15,042$ 105,631$ 46,529$ 60,930$ 104,289$ 119,433$ Adjustments to reconcile net income to net cash (used in) provided by operating activities Depreciation 12,636 14,975 16,550 16,951 16,739 16,830 Amortization of intangibles 2,955 10,590 21,786 21,878 21,259 19,940 Net (gain) loss on the sale of assets (9) 203 140 13 (8,299) 101 Loss on debt extinguishment 668 - 1,889 1,042 5,808 1,895 Deferred income taxes - (55,292) 30,089 16,573 (7,749) 2,448 Stock-based compensation 3,398 5,149 7,480 7,833 10,010 12,038 Non-cash interest expense - 2,972 4,643 4,840 5,222 3,475 Impairment of goodwill and other intangibles - - - - 1,087 1,663 Changes in operating assets and liabilities Accounts receivable (14,366) 1,180 (23,691) (14,848) (17,618) (809) Inventories (78,683) 41,696 6,260 3,116 10,162 24,969 Prepaid expenses and other (162) 736 (3,893) (571) 1,786 (10,147) Accounts payable and accrued liabilities 56,968 (48,777) 18,082 (26,787) (12,243) (13,002) Other, net 386 (3,046) 2,805 1,665 1,342 (84) Net cash (used in) provided by operating activities (1,167)$ 76,017$ 128,669$ 92,635$ 131,795$ 178,750$ Cash flows from investing activities Capital expenditures (7,264) (14,916) (18,352) (19,957) (20,847) (20,342) Acquisition, net of cash acquired - (364,012) (15,985) - - - Proceeds from the sale of property, plant and equipment 17 607 305 87 13,203 19 Other - (2,500) 2,500 4,113 - 3,014 Net cash used in investing activities (7,247)$ (380,821)$ (31,532)$ (15,757)$ (7,644)$ (17,309)$ Cash flows from financing activities Proceeds from issuance of common stock, net of expenses (155) - - - - - Proceeds from exercise of stock options 538 354 600 1,921 2,012 4,831 Borrowings under revolving credit facilities 848,705 206,015 1,166 806 1,134 618 Payments under revolving credit facilities (838,705) (271,015) (1,166) (806) (1,134) (618) Principal payments under capital lease obligations (671) (1,629) (1,700) (1,898) (4,201) (779) Principal payments under term loan credit facility - (2,250) (62,827) (42,078) (194,291) (1,928) Principal payments under industrial revenue bond - - (381) (475) (496) (473) Stock repurchase (533) (564) (35) (1,497) (61,757) (79,556) Proceeds from issuance of convertible senior notes - 145,500 - - - - Proceeds from issuance of term loan credit facility, net of issuance costs - 292,500 - - 192,845 - Convertible notes repurchase - - - - (22,936) (98,922) (1,989) (5,134) (981) - (2,587) - - 2,500 - - - - Net cash provided by (used in) financing activities 7,190$ 366,277$ (65,324)$ (44,027)$ (91,411)$ (176,827)$ Net (decrease) increase in cash and cash equivalents (1,224)$ 61,473$ 31,813$ 32,851$ 32,740$ (15,386)$ Cash and cash equivalents at beginning of period (118,285) 19,976 81,449 113,262 146,113 178,853 Cash and cash equivalents at end of period 19,976$ 81,449$ 113,262$ 146,113$ 178,853$ 163,467$ Debt amendment and issuance costs paid Proceeds from issuance of industrial revenue bond
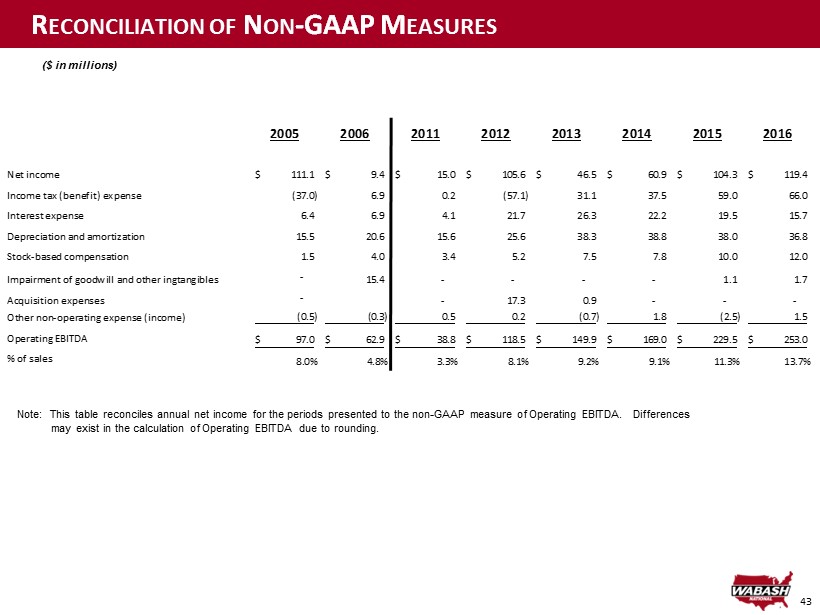
43 R ECONCILIATION OF N ON - GAAP M EASURES ($ in millions) Note: This table reconciles annual net income for the periods presented to the non - GAAP measure of Operating EBITDA. Differenc es may exist in the calculation of Operating EBITDA due to rounding. 2005 2006 2011 2012 2013 2014 2015 2016 Net income 111.1$ 9.4$ 15.0$ 105.6$ 46.5$ 60.9$ 104.3$ 119.4$ Income tax (benefit) expense (37.0) 6.9 0.2 (57.1) 31.1 37.5 59.0 66.0 Interest expense 6.4 6.9 4.1 21.7 26.3 22.2 19.5 15.7 Depreciation and amortization 15.5 20.6 15.6 25.6 38.3 38.8 38.0 36.8 Stock-based compensation 1.5 4.0 3.4 5.2 7.5 7.8 10.0 12.0 Impairment of goodwill and other ingtangibles - 15.4 - - - - 1.1 1.7 Acquisition expenses - - 17.3 0.9 - - - Other non-operating expense (income) (0.5) (0.3) 0.5 0.2 (0.7) 1.8 (2.5) 1.5 Operating EBITDA 97.0$ 62.9$ 38.8$ 118.5$ 149.9$ 169.0$ 229.5$ 253.0$ % of sales 8.0% 4.8% 3.3% 8.1% 9.2% 9.1% 11.3% 13.7%
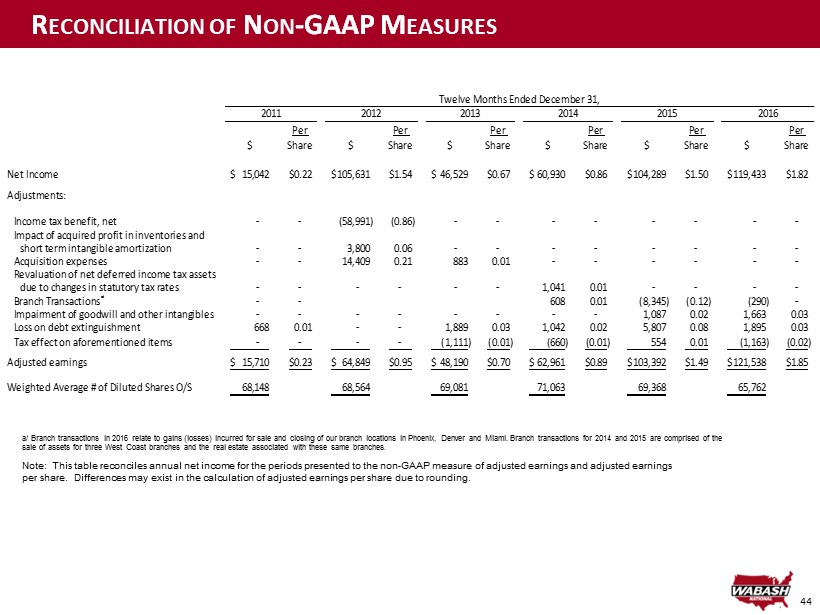
44 R ECONCILIATION OF N ON - GAAP M EASURES a/ Branch transactions in 2016 relate to gains (losses) incurred for sale and closing of our branch locations in Phoenix, Den ver and Miami. Branch transactions for 2014 and 2015 are comprised of the sale of assets for three West Coast branches and the real estate associated with these same branches. Note: This table reconciles annual net income for the periods presented to the non - GAAP measure of adjusted earnings and adjust ed earnings per share. Differences may exist in the calculation of adjusted earnings per share due to rounding. $ Per Share $ Per Share $ Per Share $ Per Share $ Per Share $ Per Share Net Income 15,042$ 0.22$ 105,631$ 1.54$ 46,529$ 0.67$ 60,930$ 0.86$ 104,289$ 1.50$ 119,433$ 1.82$ Adjustments: Income tax benefit, net - - (58,991) (0.86) - - - - - - - - Impact of acquired profit in inventories and short term intangible amortization - - 3,800 0.06 - - - - - - - - Acquisition expenses - - 14,409 0.21 883 0.01 - - - - - - Revaluation of net deferred income tax assets due to changes in statutory tax rates - - - - - - 1,041 0.01 - - - - Branch Transactions a - - 608 0.01 (8,345) (0.12) (290) - Impairment of goodwill and other intangibles - - - - - - - - 1,087 0.02 1,663 0.03 Loss on debt extinguishment 668 0.01 - - 1,889 0.03 1,042 0.02 5,807 0.08 1,895 0.03 Tax effect on aforementioned items - - - - (1,111) (0.01) (660) (0.01) 554 0.01 (1,163) (0.02) Adjusted earnings 15,710$ 0.23$ 64,849$ 0.95$ 48,190$ 0.70$ 62,961$ 0.89$ 103,392$ 1.49$ 121,538$ 1.85$ Weighted Average # of Diluted Shares O/S 68,148 68,564 69,081 71,063 69,368 65,762 Twelve Months Ended December 31, 20162014 20152011 2012 2013

45 P OTENTIAL D ILUTIVE I MPACT OF S ENIOR C ONVERTIBLE N OTES (UNAUDITED) Table below illustrates the potential dilutive shares that would be included in the calculation of the Company’s reported ear nin gs per share in a future period assuming various hypothetical quarterly average market prices for the Company’s stock (NYSE: WNC). T he table should only be considered for illustrative purposes and does not represent the Company’s estimates for future stock performan ces . Notes: 1. The share prices listed in this table are for illustrative purposes only. Dilution will continue beyond $30.00 per share. 2. This represents the number of shares to be used for calculating diluted earnings per share in accordance with generally accepted accounting principals. Background Information ▪ In April 2012, the Company issued Convertible Senior Notes due 2018 with a principal amount of $150 million principal and bear interest at a rate of 3.375% annually ▪ As of the end of the Q4 2016, there is approximately $49 million principal outstanding ▪ Initial conversion rate of 85.4372 shares of common stock per $1,000 in principal amount which is equal to a conversion price of approximately $11.70 per share ▪ The Senior Notes will have a dilutive effect on earnings per share to extent average quarterly share price exceeds the conversion price ▪ The Company’s intent is to settle conversions through a net share settlement which involves repayment of cash for the principal amount and delivery of shares of common stock for any excess of conversion value over principal amount Hypothetical Quarterly Average Share Price (NYSE: WNC) (1) Potential Incremental Shares for Diluted EPS (in 000s shares) (2) 11.00$ - 12.00$ 103 13.00$ 417 14.00$ 686 15.00$ 919 16.00$ 1,123 17.00$ 1,303 18.00$ 1,463 19.00$ 1,606 20.00$ 1,735 21.00$ 1,851 22.00$ 1,957 23.00$ 2,054 24.00$ 2,143 25.00$ 2,224 26.00$ 2,300 27.00$ 2,369 28.00$ 2,434 29.00$ 2,494 30.00$ 2,551